replacement of old wind turbines assessed from energy
TRANSCRIPT

I
Replacement of Old Wind Turbines
Assessed from Energy, Environmental and Economic Perspectives
Draft report 21 May 2003
Carl Johan Rydh, Maria Jonsson and Pia Lindahl
Department of Technology
University of Kalmar
SE- 391 82 Kalmar
European Union project: Wind Energy in the Baltic Sea Region, Interreg III B project, WP 4: 3
Final report 29 June 2004

Replacement of Old Wind Turbines Assessed from Energy, Environmental and Economic Perspectives Rydh et al., Dept. Technology, University of Kalmar, SE-391 82 Kalmar, SWEDEN, [email protected] 29 June 2004
II

Replacement of Old Wind Turbines Assessed from Energy, Environmental and Economic Perspectives Rydh et al., Dept. Technology, University of Kalmar, SE-391 82 Kalmar, SWEDEN, [email protected] 29 June 2004
III
Replacement of Old Wind Turbines Assessed from Energy, Environmental and Economic Perspectives Carl Johan Rydh*, Maria Jonsson, Pia Lindahl
Department of Technology, University of Kalmar, SE-391 82 Kalmar, Sweden
*Corresponding author: [email protected]
Abstract
Different operating conditions and alternatives for treatment and replacement of old 225 kW wind turbines (WTs) were evaluated from a life cycle perspective from cradle to grave. Indicators were calculated for primary fossil energy requirements (MJpf/kWhel), CO2 emission (CO2/kWhel) and economy (€2004/kWhel).
Extending the service life ten years by renovation results in 32% lower primary energy requirements than if the WT is recycled after 20 years at the end of the technical service life. The primary fossil energy requirement for electricity production is 2.5 - 4.6 times higher for fossil based electricity production than for WTs. The energy payback time was calculated to 3.9 months for 225 kW WTs and to 2.7 months for 2 MW WTs. This means that after 3.9 months electricity production, the WT starts to generate net electricity.
The CO2 emission for WTs was calculated to 7.2-11 g CO2/kWh, which is 4.6 lower than the average Swedish electricity mix and 122 times lower than for a coal condensing plant. The highest CO2 emission for electricity generation from WTs was found in the phase of materials production (60-64% of the total emission) followed by production of WTs (32%). The phases of transportation/disassembly and renovation/maintenance have relatively low influence, contributing 2-3% and 2-6%.
The monetary costs for electricity production were calculated to be in the range 2.9-5.4 € cents/kWh (excluding VAT and subsidies). The lowest cost was found for 2 MW WTs and the highest cost for renovation of 225 kW WTs.
The relative importance of different parameters influence on energy requirements and CO2 emissions were found to be as follows: (1) service life, wind conditions/conversion efficiency and material requirement, (2) recycling rate and, (3) transportation distance.
To utilise areas suitable for wind turbines efficiently, it is important to use the most efficient technologies with highest possible electricity yield. A comparison of the indicators for the different cases shows that they are pointing in different directions, which makes it possible to optimise WTs in different ways depending on subjective values. Physical flows of energy, materials and CO2 emission decrease per unit produced electricity when the service life is extended by renovation. On the contrary, when the considering a monetary perspective, the costs increase when extending the service life by renovation since labour costs is highly valued.
The Excel computer model developed in this project can be easily updated in order to evaluate technological development and different operating conditions of WTs.
Keywords: energy analysis, energy payback time, life cycle assessment, efficiency, recycling, renewable energy, renovation, upgrading, replacement, CO2

Replacement of Old Wind Turbines Assessed from Energy, Environmental and Economic Perspectives Rydh et al., Dept. Technology, University of Kalmar, SE-391 82 Kalmar, SWEDEN, [email protected] 29 June 2004
IV

Replacement of Old Wind Turbines Assessed from Energy, Environmental and Economic Perspectives Rydh et al., Dept. Technology, University of Kalmar, SE-391 82 Kalmar, SWEDEN, [email protected] 29 June 2004
V
Ersättning av gamla vindkraftverk bedömt ur energi, miljö och ekonomiskt perspektiv Carl Johan Rydh, Maria Jonsson, Pia Lindahl
Institutionen för teknik, Högskolan i Kalmar, 391 82 Kalmar
Sammanfattning
Olika driftförhållanden och alternativ för hantering och ersättning av gamla 225 kW vindkraftverk utvärderades ur livscykelperspektiv från vaggan till graven. Indikatorer beräknandes för primär energianvändning (MJpf/kWhel), CO2 emissioner (CO2/kWhel) och monetär produktionskostnad (€2004/kWhel).
Förlängning av vindkraftverkets livslängd tio år genom renovering ger 32% lägre primär energianvändning än om vindkraftverket återvinns efter 20 år då det uppnått sin tekniska livslängd. Behovet av fossila bränslen för elproduktion är 2.5 - 4.6 gånger högre för fossilbaserad elproduktion än för vindkraftverk. Energiåterbetalningstiden beräknades till 3.9 månader för 225 kW och till 2.7 månader för 2 MW vindkraftverk. Detta betyder att efter 3.9 månader i drift, börjar ett 225 kW kraftverk att generera mer energi än vad som krävts för att bygga det.
Koldioxidutsläppen för el producerad från vindkraftverk beräknades till 7.2-11 g CO2/kWh, vilket är 4.6 lägre än svensk medelel och 122 gånger lägre än för el producerad i ett kolkraftverk. De högsta koldioxidutsläppen uppstår i fasen av materialproduktion (60-64%) följt av produktionen av vindkraftverket (32%). Faserna transport/demontering och renovering/underhåll bidrar relativt lite till de totala koldioxidutsläppen, 2-3% respektive 2-6%.
Kostnaderna för elproduktion beräknades till 2.9-5.4 € cents/kWh (exklusive skatter och subventioner). Den lägsta elproduktionskostnaden var för 2 MW och den högsta för renovering av 225 kW vindkraftverk.
Den relativa betydelsen av olika parametrars påverkan på energibehov och koldioxidutsläpp var enligt följande: (1) livslängd, vindförhållanden/verkningsgrad, materialbehov, (2) återvinningsgrad, och (3) transportavstånd.
För att så effektivt som möjligt utnyttja markområden som är lämpliga för vindkraftverk är det viktigt att använda teknologier med största möjliga elproduktion. Jämförelser av de olika indikatorerna för de olika fallen visar att de pekar åt olika håll, vilket gör det möjligt att optimera vindkraftverk på olika sätt beroende på subjektiva värden. Fysiska flöden av energi, material och CO2 emissioner minskar per producerad mängd elektricitet då vindkraftverkens livslängd förlängs genom renovering. Ur ett monetärt perspektiv ökar kostnaderna då livslängden förlängs genom renovering eftersom arbetskostnaden värderas högt.
Datormodellen i Excel som utvecklats inom detta projekt kan uppdateras för att analysera konsekvenserna av teknisk utveckling och olika driftsförhållanden för vindkraftverk.
Nyckelord: energianals, energi återbetalningstid, livscykelanalys, verkningsgrad, återvinning förnybar energi, renovering, uppgradering, CO2

Replacement of Old Wind Turbines Assessed from Energy, Environmental and Economic Perspectives Rydh et al., Dept. Technology, University of Kalmar, SE-391 82 Kalmar, SWEDEN, [email protected] 29 June 2004
VI
Nomenclature
CHP combined heat and power
€ Euro, currency year 2004
LCA life cycle assessment
MJel mega joule electrical energy
MJpf mega joule primary fossil fuel
ton metric ton
WT wind turbine
Replacement of Old Wind Turbines Assessed from Energy, Environmental and Economic Perspectives Rydh et al., Dept. Technology, University of Kalmar, SE-391 82 Kalmar, SWEDEN, [email protected] 29 June 2004
VII
Table of contents
1. INTRODUCTION......................................................................................................................................................... 1
2. GOAL AND SCOPE..................................................................................................................................................... 1
3. METHOD........................................................................................................................................................................ 4
4. PERFORMANCE AND PRODUCTION OF WIND TURBINES .................................................................. 6
4.1. PERFORMANCE OF DIFFERENT WIND TURBINE ARRANGEMENTS AT GRÖNHÖGEN WIND FARM...................6 4.2. MATERIAL REQUIREMENTS FOR PRODUCTION OF WIND TURBINES..................................................................8 4.3. ENERGY REQUIREMENTS AND CO2 EMISSIONS FOR PRODUCTION OF WIND TURBINES ...............................10
5. DIFFERENT ALTERNATIVES FOR TREATMENT OF OLD WIND TURBINES .............................11
5.1. SUMMARY OF INVENTORY DATA END-OF-LIFE TREATMENT...........................................................................11 5.2. UPGRADING AND RENOVAT ION OF OLD WIND TURBINES ................................................................................12 5.3. RELOCATION OF OLD WIND TURBINES TO ANOTHER SITE................................................................................12 5.4. RECYCLING ............................................................................................................................................................13 5.5. REPLACEMENT OF OLD WIND TURBINE WITH OTHER TECHNOLOGY ..............................................................15
6. RESULTS AND DISCUSSION...............................................................................................................................16
6.1. SUMMARY RESULTS OF DIFFERENT INDICATORS..............................................................................................16 6.2. ENERGY REQUIREMENTS FOR ELECTRICITY PRODUCTION...............................................................................17 6.3. ENERGY PAYBACK TIMES AND ENERGY RETURN FACTORS.............................................................................17 6.4. CO2 EMISSIONS OF WIND TURBINES FOR THE DIFFERENT CASES....................................................................18 6.5. MONETARY COSTS OF WIND TURBINES FOR DIFFERENT ALTERNATIVES.......................................................20 6.6. SENSITIVITY ANALYSIS.........................................................................................................................................21
7. CONCLUSIONS ..........................................................................................................................................................22
8. ACKNOWLEDGEMENTS ......................................................................................................................................22
9. REFERENCES ............................................................................................................................................................23
APPENDIX 1

Replacement of Old Wind Turbines Assessed from Energy, Environmental and Economic Perspectives Rydh et al., Dept. Technology, University of Kalmar, SE-391 82 Kalmar, SWEDEN, [email protected] 29 June 2004
1
1. Introduction As some wind turbine (WT) installations are getting older and are approaching their end of service life they may be replaced with new technologies and power ratings. At a certain time, it may be more efficient to replace an old wind turbine with a new wind turbine technology. Current wind turbines have much higher power rating (1-2 MW) compared with old technologies (150-600 kW), which means that one new wind turbine may replace the electricity production of several old turbines.
The optimum time for replacement depends on the wind conditions of the site and the evaluation criteria used. Economic, technical and environmental aspects on the use of the potential of a wind farm therefore have to be assessed from a life cycle perspective. Different alternatives for end-of-life treatment of old wind turbines have to be considered. Alternatives for end-of-life treatment include renovation, relocation to another site, materials recycling or replacement with another technology. Consequences of producing and operating new wind turbines have to be related to the decommissioning of old wind turbines. Strategies and evaluation criteria have to be developed to assess the optimum use of a specific wind farm area. Comparisons of the performance of old and new wind turbines have to be conducted.
No studies have been found describing alternative consequences of replacement of wind turbines in wind farms. From an energy perspective, energy payback time for wind turbines has been determined to be 2-3 months for an average modern turbine at an average site (Vindmølleindustrien 1997). At the best wind sites, the energy output/input ratio is 80 times (Gagnon et al 2002). However, it has not been determined when it is more energy efficient to replace an old wind turbine with a more efficient one. Life cycle inventories of wind turbines have shown that the production of the wind turbine is the phase of the life cycle causing the greatest environmental impact (Chataignere and Boulch 2003). The importance of extending the service life of wind turbine has, however, not been quantified.
The purpose of this study is to compare different alternatives of end-of-life treatment of old wind turbines and alternative electricity production, based on indicators for energy, CO2 emissions and monetary costs. Identification of important parameters can be used to direct research and product improvements as well as to set up management strategies of old wind turbines. By developing a computer model, the effects of changes in performance can be easily updated and evaluated. The results of this study are of interest for European research in the field of wind turbines (LOWEC 2003) as well as for the development of wind power generation in Europe.
2. Goal and scope The overall objectives of this study were to:
• review different alternatives for treatment of old wind turbines
• identify parameters, which are important for economic, technical and environmental evaluation of wind turbines
• develop a computer model to be used for evaluation of replacement of wind turbines.
The study was based on a case study of Grönhögen wind farm on the island, Öland, Sweden. Wind turbines on land were considered only.
Different operating conditions and treatment of old wind turbines and alternatives for electricity production were evaluated (Fig. 1). The results were presented for indicators for energy (MJpf/kWhel), environment (CO2/kWhel) and economy (€2004/kWhel). Inventories of wind turbines were compiled from cradle to grave. The wind turbine system included production of materials and wind turbine, transformer. Data were based on knowledge and technical level of 1995-2004. To make the different alternatives comparable the results were normalised to fulfil a functional unit. The functional unit (FU) was defined as”1 kWh electricity supplied to the power grid”.

Replacement of Old Wind Turbines Assessed from Energy, Environmental and Economic Perspectives Rydh et al., Dept. Technology, University of Kalmar, SE-391 82 Kalmar, SWEDEN, [email protected] 29 June 2004
2
Fig. 1. Different alternatives for electricity production and treatment of old wind turbines. Symbols: r= recycled fraction, t= service life, text= extended service life, tf= full load hours, ?g= grid transmission efficiency, Q= energy requirement for production.
Electricity production P, tf
UseEuse 1
Wind energy
Production & transport WT system, QP,WT
1. Upgrading and renovation
Renovation & upgradingQRen
Electricity production P, tf
UseEuse 2
Wind energytext , ?g
t , ?g
Electricity production P, tf
UseEuse 1
Wind energy
Production & transport WT system, QP,WT
2. Relocation
Disassembly & transportQRel
Electricity production P, tf
UseEuse 2
Wind energytext , ?g
t , ?g
Scrapping & materialsrecovery QRec
Scrapping & materials recovery QRec
Landfill Recycled materials
r 1-r
Landfill Recycled materials
r 1-r
Electricity productionplant
UseEuse
Fossil fuel
Production & transport plant, QP,i
t , ?g
4 b. Replacement with other electricity production3. Recycling
4 a. Replacement with new wind turbine technology
Electricity production P, t f
UseEuse
Wind energy
Production & transport WT system, QP,WT
t , ?g
Scrapping & materials recovery, QRec
Landfill Recycled materials
r 1-r

Replacement of Old Wind Turbines Assessed from Energy, Environmental and Economic Perspectives Rydh et al., Dept. Technology, University of Kalmar, SE-391 82 Kalmar, SWEDEN, [email protected] 29 June 2004
3
The different alternatives in Fig. 1 were combined to evaluate the different cases. Table 1 describes the studied systems in detail.
Table 1. Description of energy systems for the different cases.
Case System Service life, t (yr)
Extended service life, text
(yr)
Total power, P tot
(MW)
Description
1 Upgrading and renovation (excluding activities 9 and 11)
20 10 a 1,8 Grönhögen wind farm: Extraction and refining of raw materials for WT production, manufacturing, transportation 500 km to the site, on-site assembly and maintenance. Operation with capacity factor 26% (t f= 2250 h/yr). Transmission efficiency from generation to user is 95%.Renovation after 15 years and continued operation for 10 years. Scrapping and 74% materials recovery at the end-of-life.
2 Relocation of old WT to another site a
10 10 a 1,8 Grönhögen wind farm: Extraction and refining of raw materials for WT production, manufacturing, transportation 500 km to the site, on-site assembly and maintenance. Operation with capacity factor 26% (t f= 2250 h/yr). Transmission efficiency from generation to user is 95%. Disassembly and transportation 500 km to another site after 10 years and continued operation for 10 years. Scrapping and 74% materials recovery at the end-of-life.
3 Recycling (excluding activities 9-15)
20 Grönhögen wind farm: Extraction and refining of raw materials for WT production, manufacturing, transportation 500 km to the site, on-site assembly and maintenance. Transmission efficiency from generation to user is 95%. Scrapping and 74% materials recovery after 20 years.
4a Replacement with new WT technology
20 b 8,0 Grönhögen wind farm: Replacement of old WTs after 10 years. Extraction and refining of raw materials for WT production, manufacturing, transportation 500 km to the site, on-site assembly and maintenance. Operation with capacity factor 35% (t f= 3 090 h/yr). Scrapping and 74% materials recovery after 20 years.
4b Replacement with other electricity production
Coal condensing plant: Mining and transport of coal. Electricity generation with overall 40% efficiency (incl. coal mining and transportation). Transmission efficiency from generation to user is 93%. Construction of plant not included.
4c Replacement with other electricity production
European average electricity mix: Electricity generation with 41% efficiency. Transmission efficiency from generation to user is 93%. Construction of plant not included.
4d Replacement with other electricity production
Swedish average electricity mix: Electricity generation with 50% efficiency. Transmission efficiency from generation to user is 93%. Construction of plant not included.
a 8 x 225 kW= 1.8 MW. 8 760 h/yr x 0.26= 2 250 h/yr a 4 x 2.0 MW= 8.0 MW. 8 760 h/yr x 0.35= 3 090 h/yr

Replacement of Old Wind Turbines Assessed from Energy, Environmental and Economic Perspectives Rydh et al., Dept. Technology, University of Kalmar, SE-391 82 Kalmar, SWEDEN, [email protected] 29 June 2004
4
3. Method The consequences of different alternatives of wind turbine end-of-life treatment and electricity production were evaluated by compiling inventories for energy, CO2 emissions and costs.
The study included the following steps:
1. Description of technical differences between old and new wind turbine technologies and inventory of production of wind turbines.
2. Description and inventory of different alternatives of end-of-life treatment of wind turbines and alternative electricity production.
3. Quantification and modelling of the life cycle energy, CO2 emissions and costs of wind turbines for different alternatives of energy production.
4. Comparison of the different cases in Table 1 for electricity production depending on technical, environmental and economic performance.
Energy analysis was performed from cradle to grave based on life cycle assessment (LCA) methodology (ISO 1997). To allow direct comparison of energy data, energy of different forms was converted to the same energy quality. Since the major share of the global energy system and electricity generation is based on combustion of fossil fuels, energy was converted to primary energy equivalents, expressed as primary fossil fuel (MJpf).
Energy requirements for production of wind turbines were based on LCA studies, material content and the energy requirement to produce materials from cradle to gate and manufacturing processes. Recycled materials were assumed to replace the need for virgin materials. Closed loop recycling was assumed in order to avoid allocation problems when materials are recycled indefinitely.
The primary fossil energy requirement was used to calculate the energy return factor and the energy payback time. The energy return factor, f, is then the ratio between the replaced fossil energy (coal condensing plant) and the fossil energy required to produce the PV-battery system
pfI
GG
EE
QtE
f,
00 =⋅
= (1)
where t (yr) is the service life of the PV-battery system, Q (MJpf) the primary fossil energy required to build and transport it and EI,,pf (MJpf/yr) the average annual energy required for production and transport.
The average annual gross primary fossil energy use of the coal condensing plant EG0 (MJpf/yr) is calculated from
∗=
00 η
useG
EE (2)
where, η*0, is the overall efficiency of the plant.
A similar measure that is commonly used to describe the energy balance of a wind turbine (or any other energy flow conversion technology) is the energy payback time, t*1. After a certain time in operation, the energy payback time, the energy that was used to produce the PV-battery system is paid back by not using the coal condensing plant.
ft
EQ
tG
==∗
0
(3)
1 The net energy (output) is defined in some studies as EO-EI, in relation to the indirect energy requirement (EO-EI)/EI = f-1 or to the energy output (EO-EI)/EO = 1-1/f. The indirect energy requirements can also be expressed as fraction of the energy output, EI/EO = 1/f.
Replacement of Old Wind Turbines Assessed from Energy, Environmental and Economic Perspectives Rydh et al., Dept. Technology, University of Kalmar, SE-391 82 Kalmar, SWEDEN, [email protected] 29 June 2004
5
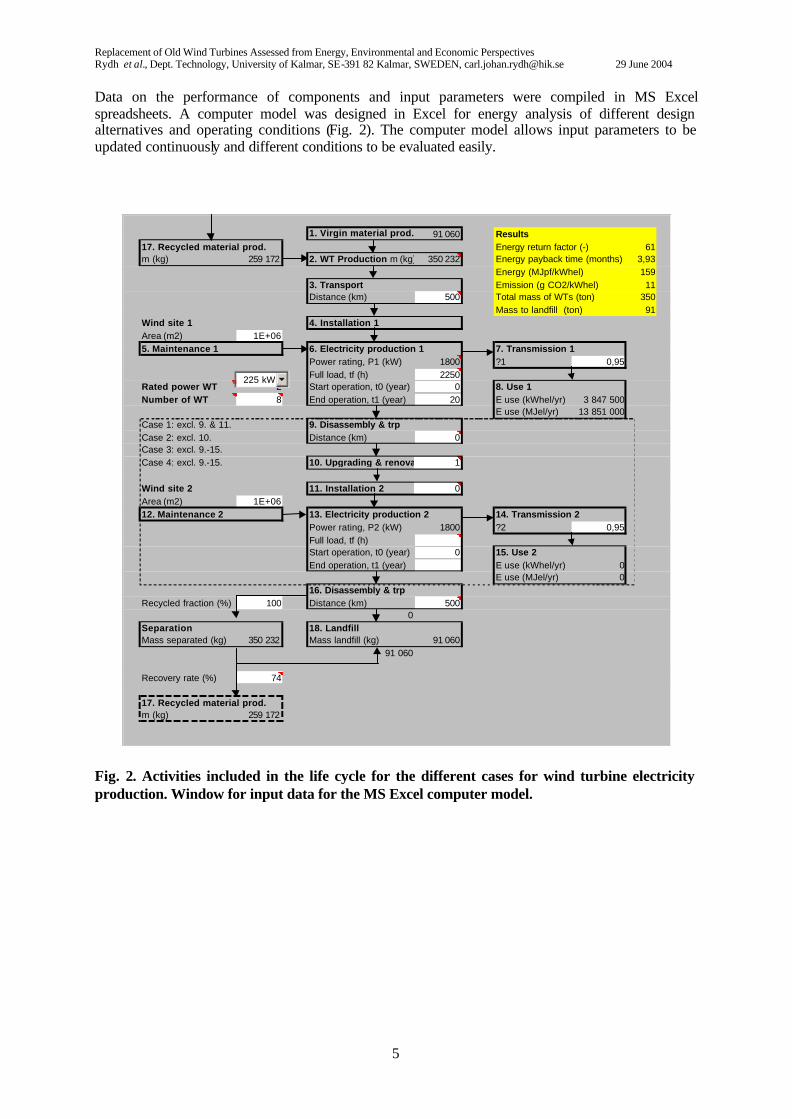
Data on the performance of components and input parameters were compiled in MS Excel spreadsheets. A computer model was designed in Excel for energy analysis of different design alternatives and operating conditions (Fig. 2). The computer model allows input parameters to be updated continuously and different conditions to be evaluated easily.
1. Virgin material prod. 91 060 Results17. Recycled material prod. Energy return factor (-) 61m (kg) 259 172 2. WT Production m (kg) 350 232 Energy payback time (months) 3,93
Energy (MJpf/kWhel) 1593. Transport Emission (g CO2/kWhel) 11Distance (km) 500 Total mass of WTs (ton) 350
Mass to landfill (ton) 91Wind site 1 4. Installation 1Area (m2) 1E+065. Maintenance 1 6. Electricity production 1 7. Transmission 1
Power rating, P1 (kW) 1800 ?1 0,95Full load, tf (h) 2250
Rated power WT 2 Start operation, t0 (year) 0 8. Use 1Number of WT 8 End operation, t1 (year) 20 E use (kWhel/yr) 3 847 500
E use (MJel/yr) 13 851 000Case 1: excl. 9. & 11. 9. Disassembly & trpCase 2: excl. 10. Distance (km) 0Case 3: excl. 9.-15.Case 4: excl. 9.-15. 10. Upgrading & renovation 1
Wind site 2 11. Installation 2 0Area (m2) 1E+0612. Maintenance 2 13. Electricity production 2 14. Transmission 2
Power rating, P2 (kW) 1800 ?2 0,95Full load, tf (h)Start operation, t0 (year) 0 15. Use 2End operation, t1 (year) E use (kWhel/yr) 0
E use (MJel/yr) 016. Disassembly & trp
Recycled fraction (%) 100 Distance (km) 5000
Separation 18. LandfillMass separated (kg) 350 232 Mass landfill (kg) 91 060
91 060
Recovery rate (%) 74
17. Recycled material prod.m (kg) 259 172
225 kW
Fig. 2. Activities included in the life cycle for the different cases for wind turbine electricity production. Window for input data for the MS Excel computer model.

Replacement of Old Wind Turbines Assessed from Energy, Environmental and Economic Perspectives Rydh et al., Dept. Technology, University of Kalmar, SE-391 82 Kalmar, SWEDEN, [email protected] 29 June 2004
6
4. Performance and production of wind turbines In the following sections, differences between old and new wind turbine technologies are discussed and quantified. The performance of the current wind turbines located at Grönhögen wind farm is described and compared with the performance of an assumed replacement with new wind turbine technology. The different technologies are described regarding characteristics influencing their operation and material and energy requirements for production.
Ten years ago the large wind towers were very expensive to build. The development of the wind power industry has made it possible for the producers to build many towers and in that way cut the costs and the weight of the towers (Wizelius 2003).
The benefits of WTs with high power ratings compared with smaller WTs are their higher energy yield, low cut off wind speed and the costs for building higher towers has decreased during the last years. In gearless WTs there are 80% less moving parts and no gear oil has to be exchanged. This gives a reduction in service costs and insurance costs (Hedblom 2004).
4.1. Performance of different wind turbine arrangements at Grönhögen wind farm
The first Vestas V27 wind turbines at Grönhögen wind farm were erected in 1991. In Case 4a, it is assumed that the V27 and V29 wind turbines are replaced with four gearless 2,0 MW wind turbines Enercon E-66. It has a clockwise rotating upwind rotor with three blades and an active pitch control. This model was assumed since it is the most widely installed wind turbine of this size in Sweden 2003 (Elforsk 2004).
When the height of the tower is considered there are several aspects to consider. A higher tower is more expensive to build than a lower one, a higher tower will reach wind with a higher velocity so the power to extract from the wind is higher, but it is also so that a higher tower is visible on a further distance which can make more people in the surroundings will be affected.
The electricity that can be extracted from a wind turbine depends on the energy in the wind, the sweep area of the blades and the conversion efficiency of the wind turbine. The average wind speed at 85 meters is 17% higher than at 30 meters due to lower friction caused by the land surface (Table 2). Higher wind speed, lower turbulence and higher conversion efficiency assumed for the larger WTs resulting in 3 091 full load hours.
When WTs are located close to each other, the efficiency may decrease due to turbulence. The most efficient way to locate WTs is to place them on a row fronting the head wind direction with at least five rotor diameters between each WT and seven diameters between each row. WTs in a wind farm have approximately 95% of the energy yield of a single WT. The performance of the single WTs in Table 2 is calculated based on wind farm data.
If six WTs are placed in a straight row the area requirement for them is 700 m2 for 225 kW WTs and 1700 m2 for 2 MW WTs (0,6 and 1,1 m2/kW, respectively). If the WTs are placed in a group, the area requirement is between 16-22 m2/kW (SOU 1999:75).
Table 2. Specifications for electricity production with different wind turbine models.
WT model Rated power (kW)
Tower height
(m)
Average wind
velocity (m/s)
Energy (kWh/m2
yr)
Diameter rotor (m)
Sweep area (m2)
Ekinetic (Mwhkin/yr)
Efficiency kinetic to electricity
Electricity prod
(MWh/yr)
Vestas v27
225 30 6 1183 27 573 677 0.75 506
Enercon e66
2000 85 7 1890 70 3848 7272 0.85 6181
Table 3 shows that the load factor is 35% higher for 2 MW than for 225 kW WTs since the wind speed is higher at 85 meters.
Replacement of Old Wind Turbines Assessed from Energy, Environmental and Economic Perspectives Rydh et al., Dept. Technology, University of Kalmar, SE-391 82 Kalmar, SWEDEN, [email protected] 29 June 2004
7
Table 3. Wind turbine performance in Case 1-4.
Wind turbine
Power (kW)
Full load time (h)
Electricity production (GWh/yr)
Load factor
Production efficiency (MWh/yr
kW)
Cut-in wind speed (m/s)
Rated wind speed (m/s)
Cut-off wind speed (m/s)
Vestas V27
225 2200 0.51 0.26 2.25 3.5 14 25
Wind farm with 8 x V27
1 800 2200 4.05 0.26 2.25
Enercon E-66
2 000 3091 6.2 0.35 3.09 2.5 12 28-34
Wind farm with 4 x E-66
8 000 3091 24.8 0.35 3.09
4.1.1. Total power1,8 MW with eight Vestas 225 kW (Models V27 and V29)
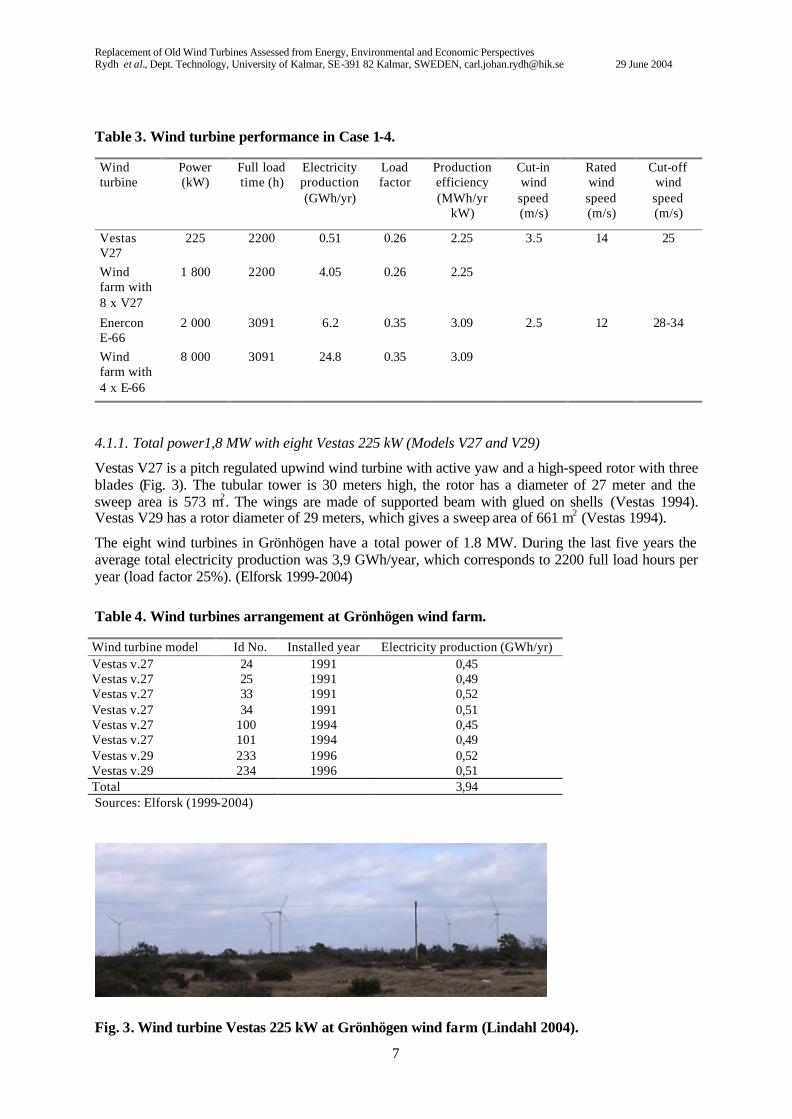
Vestas V27 is a pitch regulated upwind wind turbine with active yaw and a high-speed rotor with three blades (Fig. 3). The tubular tower is 30 meters high, the rotor has a diameter of 27 meter and the sweep area is 573 m2. The wings are made of supported beam with glued on shells (Vestas 1994). Vestas V29 has a rotor diameter of 29 meters, which gives a sweep area of 661 m2 (Vestas 1994).
The eight wind turbines in Grönhögen have a total power of 1.8 MW. During the last five years the average total electricity production was 3,9 GWh/year, which corresponds to 2200 full load hours per year (load factor 25%). (Elforsk 1999-2004)
Table 4. Wind turbines arrangement at Grönhögen wind farm.
Wind turbine model Id No. Installed year Electricity production (GWh/yr) Vestas v.27 24 1991 0,45 Vestas v.27 25 1991 0,49 Vestas v.27 33 1991 0,52 Vestas v.27 34 1991 0,51 Vestas v.27 100 1994 0,45 Vestas v.27 101 1994 0,49 Vestas v.29 233 1996 0,52 Vestas v.29 234 1996 0,51 Total 3,94 Sources: Elforsk (1999-2004)
Fig. 3. Wind turbine Vestas 225 kW at Grönhögen wind farm (Lindahl 2004).

Replacement of Old Wind Turbines Assessed from Energy, Environmental and Economic Perspectives Rydh et al., Dept. Technology, University of Kalmar, SE-391 82 Kalmar, SWEDEN, [email protected] 29 June 2004
8
4.2. Material requirements for production of wind turbines
A wind turbine consists of a tower, a nacelle and a rotor placed on a foundation of concrete. The tower is often made of steel but can for very large wind turbines be made of steel and concrete (McCulloch et al. 2000). The nacelle is built of HDPE, copper, aluminium, fibreglass and steel and the rotor is made of aluminium, fibreglass and steel (McCulloch et al. 2000).
The foundation is a large part of the total mass of the WT but its size depends on the type of wind turbine. The foundation is made of concrete and steel and the size of the foundation depends on the height of the tower, the groundwater level and the character of the ground. As an assumption the foundations for a 600 kW wind turbine can be assumed to be 8 x 8 x 1.5 meters with a mass of 220 ton and a foundation for a 2.0 MW wind turbine can be assumed to be 15 x 15 x 1.5 meter with a mass of 776 ton. The foundation is placed 1.5 to 2 m under ground and covered with soil (Salomonsson 2004, Betongindustri 2004).
Table 5. Mass of different parts of wind turbines.
Wind Turbine Power (kW)
Height of tower (m) Tower (ton)
Nacelle (ton) Rotor (ton)
Total mass excl.
foundation
Mass per meter tower
(kg/m) Vestas v27 225 30 12 7,9 2,9 23 760 Vestas v29 225 30 12 9 5 26 867 Vestas v44 600 35 37 22,5 5,2 65 1849 Vestas 600 35 37 19,8 12 69 1966 Vestas v52 850 44 41 22 10 73 1659 Vestas v52 850 49 48 22 10 80 1633 Vestas v52 850 55 56 22 10 88 1600 Vestas v52 850 60 64 22 10 96 1600 Vestas v52 850 65 71 22 10 103 1585 Enercon e66 1500 67 153 92 32 277 4134 Vestas v66 1750 60 100 57 23 180 3000 Vestas v66 1750 67 117 57 23 197 2940 Vestas v66 1750 78 159 57 23 239 3064 Enercon e66 2000 85 205 92 51 348 4094 Vestas v80 2000 60 110 61 34 205 3417 Vestas v80 2000 67 130 61 34 225 3358 Vestas v80 2000 78 170 61 34 265 3397 Vestas v80 2000 100 220 61 34 315 3150
Sources: Vestas (1994), McCulloch et al. (2000), Chataignere (2003), Vestas (2004), Enercon (2004)
The tower contributes 46-70 % of the weight of the total wind turbine if it is made of steel (Fig. 4 and Fig. 5). If it is made of concrete and steel as it can be for very large wind turbines the tower will contribute to an even greater part of the turbines weight. The height of the tower is there fore essential to the material requirements for wind turbines in total (Ljungberg 2004).

Replacement of Old Wind Turbines Assessed from Energy, Environmental and Economic Perspectives Rydh et al., Dept. Technology, University of Kalmar, SE-391 82 Kalmar, SWEDEN, [email protected] 29 June 2004
9
0
50000
100000
150000
200000
250000
300000
350000
400000
0 500 1000 1500 2000 2500
Power (kW)
Mas
s (k
g)Tower (kg)
Nacelle (kg)
Rotor (kg)
Total mass
Fig. 4. Relationship between rated power of wind turbines and mass of different parts (the total mass excl. foundation). Based on data from Vestas (1994), Vestas (2004) and Chataignere (2003).
0
500
1000
1500
2000
2500
3000
3500
4000
4500
0 20 40 60 80 100 120
Tower hight (m)
Mas
s p
er m
eter
to
wer
(kg
/m)
Fig. 5. Relationship between mass per meter tower (excl. the foundation) and the height of the tower. Based on data from Vestas (1994), Vestas (2004) and Chataignere (2003).
Replacement of Old Wind Turbines Assessed from Energy, Environmental and Economic Perspectives Rydh et al., Dept. Technology, University of Kalmar, SE-391 82 Kalmar, SWEDEN, [email protected] 29 June 2004
10
020406080
100120140160180200
0 500 1000 1500 2000 2500
Power (kW)
To
tal m
ass
(exc
l. fo
un
dat
ion
) p
er
kW (
kg/k
W)
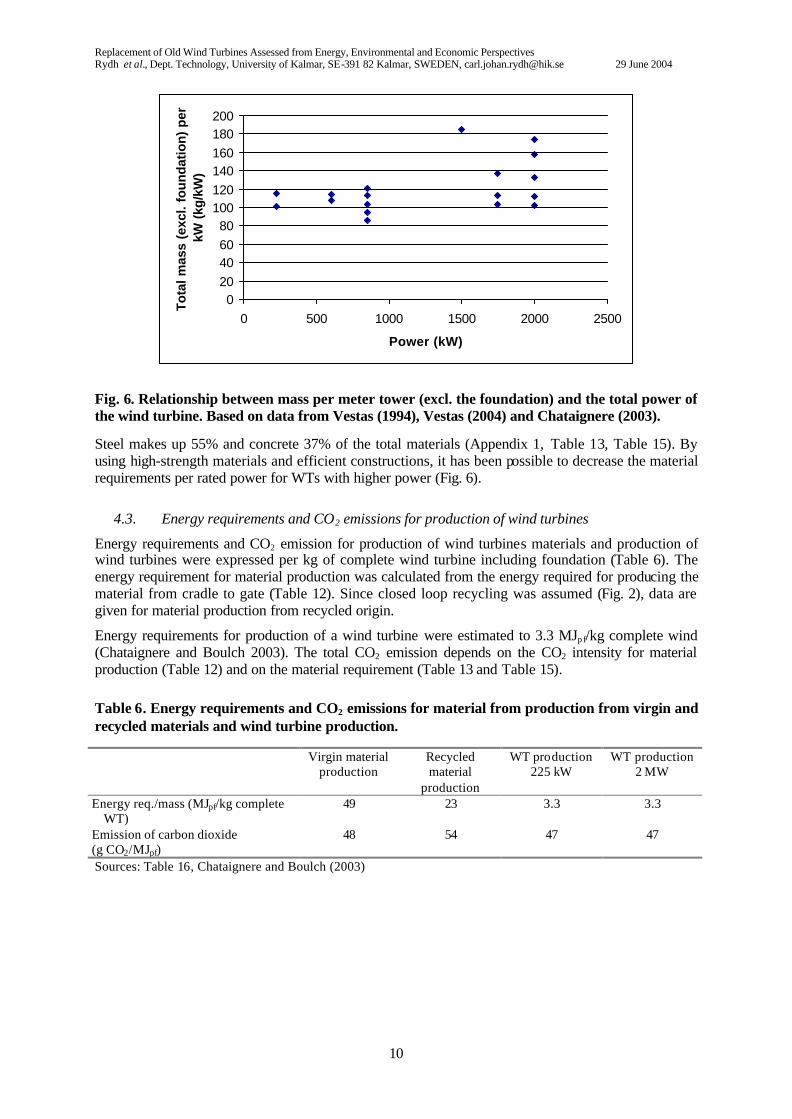
Fig. 6. Relationship between mass per meter tower (excl. the foundation) and the total power of the wind turbine. Based on data from Vestas (1994), Vestas (2004) and Chataignere (2003).
Steel makes up 55% and concrete 37% of the total materials (Appendix 1, Table 13, Table 15). By using high-strength materials and efficient constructions, it has been possible to decrease the material requirements per rated power for WTs with higher power (Fig. 6).
4.3. Energy requirements and CO2 emissions for production of wind turbines
Energy requirements and CO2 emission for production of wind turbines materials and production of wind turbines were expressed per kg of complete wind turbine including foundation (Table 6). The energy requirement for material production was calculated from the energy required for producing the material from cradle to gate (Table 12). Since closed loop recycling was assumed (Fig. 2), data are given for material production from recycled origin.
Energy requirements for production of a wind turbine were estimated to 3.3 MJp f/kg complete wind (Chataignere and Boulch 2003). The total CO2 emission depends on the CO2 intensity for material production (Table 12) and on the material requirement (Table 13 and Table 15).
Table 6. Energy requirements and CO2 emissions for material from production from virgin and recycled materials and wind turbine production.
Virgin material production
Recycled material
production
WT production 225 kW
WT production 2 MW
Energy req./mass (MJpf/kg complete WT)
49 23 3.3 3.3
Emission of carbon dioxide (g CO2/MJpf)
48 54 47 47
Sources: Table 16, Chataignere and Boulch (2003)

Replacement of Old Wind Turbines Assessed from Energy, Environmental and Economic Perspectives Rydh et al., Dept. Technology, University of Kalmar, SE-391 82 Kalmar, SWEDEN, [email protected] 29 June 2004
11
5. Different alternatives for treatment of old wind turbines This chapter summarises inventory data for modelling different alternatives for maintenance and end-of-life treatment. Different examples of treatment and replacement of old wind turbines are reviewed, including (1) upgrading and renovation, (2) relocation to another site, (3) recycling, and (4) replacement with other technologies.
5.1. Summary of inventory data end-of-life treatment
Table summarizes the inventory data for end-of-life treatment, which are described in detail in the following sections.
The distance of transportation for upgrading and renovation process was assumed to 500 km and the use of a mobile crane for three days. Transportation was assumed by heavy truck. The energy requirement for transportation was estimated at 0,72 MJpf/ton km and emission of CO2 was 52,5 g CO2/ton km (NTM 2004).
Table 6. Energy, CO2 and monetary cost inventory data for maintenance and end-of-life treatment of wind turbines with different power ratings.
Parameters 4. & 11. Installation 1
& 2
5. & 12. Maintenance 1
& 2
9. Disassembly and transport
10. Upgrading & renovation
16. Disassembly and transport
17. Recovery materials
18. Landfill
Transportation distance (km)
- 100 500 500 500
Energy requirement, PWT 225 kW (MJ/kg)
a0,22 c0,606 a0,22 a0,33 a0,22 - -
Energy requirement, PWT 2 MW (MJ/kg)
a0,015
c0,17 a0,015
a0,023 a0,015
- -
Energy requirement, PWT 225 kW (MJ/kW)
a24 c66 a24 d4 a24 - -
Energy requirement, PWT 2 MW (MJ/kW)
a3 c30 a3 d108 a3 - -
Emission factor for energy (g CO2/MJpf)
a 70 a 70 a 70 a 70 a 70 - b 55
Cost, PWT<1,0 MW (Euro/kW)
97 210 97 348 97 e-7,2 5
Cost, PWT>1,0 MW (Euro/kW)
- - - - - e-10,2 -
Note. Numbers refer to activities in Fig. 2 a Assumed: use of a crane for 16 h and 10 L diesel oil/ h, 0,8 kg/L. 42 MJ/kg, 2,35 kg CO2/L (NTM 2004). b 2,34 kg CO2/ 42 MJ oil (NTM 2004). c Assumed: use of a crane for 8 h and 10 L diesel oil/h, 0,8 kg/L. 42 MJ/kg (NTM2004). Gearbox oil: assumed to 65 L for a 225 kW and 320 L for a 2 MW, both totally changed 4 times/20 years (Larsson P 2004). Lubricants: assumed to 4 kg/year for a 225 kW. Lubricants for a 2 MW, 16 kg/year (Larsson 2004). d Assumed: use of a crane for 24 h same for both a 75 kW, 225 kW and for a 2 MW, 10 L diesel oil/h and 0,8 kg/L. 42 MJ/kg (NTM 2004)
e HDPE: assumed 100 % landfill, €108,93/tonne. Copper: assumed 95 % recycling, €1,42/kg. Aluminium: assumed 95 % recycling, €0,65/kg. Glass fibre: assumed 100 % incineration, €87,15/ton. Steel: assumed 90 % recycling, €54,5/ton, assumed: remaining material to landfill, €119,8/ton (Juteberg 2004).
Replacement of Old Wind Turbines Assessed from Energy, Environmental and Economic Perspectives Rydh et al., Dept. Technology, University of Kalmar, SE-391 82 Kalmar, SWEDEN, [email protected] 29 June 2004
12
5.2. Upgrading and renovation of old wind turbines
In Sweden, it is uncommon that any extensive renovation or upgrading are done on WTs. Instead, continuous maintenance is carried out. In Denmark, there are examples where older turbine models have been renovated. The age of these turbines have been around 12-15 years with a power of 55-150 kW and the renovation process has been similar on all machines. The whole nacelle has then been replaced with a used one, complete with blades and control system. Only the foundation and tower were reused. After the upgrading and renovation the turbine can produce electricity for another ten years. A renovated turbine of 75 kW can be bought and installed for €26,127 (Skriver 2004). Usually most of the old machine parts were scrapped although some of the components have been stored for use in the future (Skriver 2004).
For operation and maintenance of wind turbines with an output of up to 2 MW, visual inspections are carried out by the owner once every six months. The manufacturer also performs maintenance work twice a year (Larsson 2004). Usually the manufacturer test and change oil, add lubricants and does some cleaning. The amount of gearbox oil varies a lot depending on the size of the turbine and which gearbox model that is installed. For example, a 225 kW WT contains 55-75 litres of oil and a 2 MW WT 320 litres (Larsson 2004). The oil has to be totally replaced every 5-7 years (Larsson 2004). The parts needing lubricants are the blade bearings, rotor locking pins and main bearings. Approximately 16 kg of different lubricants is used per year for a V80 at these two maintenance occasions (Larsson 2004). The cleaning is limited to wiping up oil spill and/or leakage found in the machinery, so new leakage can be easier detected. Usually there are no extensive changes of components at these maintenance occasions. Although one thing mentioned by the manufacturer is that the contactors need to be changed every 5 years and an occasional cable every now and then (Larsson 2004). If discovered that a component, for example a cable, has to be replaced, the same component will be replaced on all other machines of same model. These changes are being made by the manufacturer as a preventive measure so that the guaranteed life span of 20 years can be met. The owner can be offered to install new and/or more efficient parts that have reached the market recently, for example an extra oil filter. These installations are optional since the owner has to provide the funding (Larsson 2004).
New technology is continuously being introduced. The work with upgrading the software in Swedish wind turbines is an ongoing process. Whenever new technology is available, an assessment is being made to se if there is an economical benefit with upgrading the turbine. If so, the computer chip are removed and sent to the manufacturer for upgrading. This means that the computer chip can be reused over again. The upgrading is planned to coincide with regular maintenance work, to prevent production stop and so that the guaranteed life span can be met (Hansson 2004).
Depending on how and where the wind turbine is located transports by either car and/or boat has to be made to be able to perform the maintenance work. If a major part such as the gearbox or the generator needs to be replaced, a mobile crane has to be set up and used. The environmental impacts that occur by these inspections and maintenance work are a certain amount of waste and pollution to air and water. The waste is represented mainly of absorbents for oil spill, used components and gearbox oil that have been replaced.
For inspections and maintenance, estimated distance for transportation is 50 km (one-way) and assumed time needed for replacing a major component during the machines lifetime is one day using a mobile crane.
5.3. Relocation of old wind turbines to another site
The market for used wind turbines in Sweden is small compared to Denmark were the second hand turbine industry is more extensive. The reason for this might be that Denmark has had wind energy for a longer time and in Sweden, the investment funding has been allowed for investment in new technology only.
Other leading European countries in wind energy, such as Germany and the Netherlands, also have a substantial industry for used wind turbines. Here companies have discovered the potential in selling used turbines. Except for customers in the own country, some of the turbines end up in developing countries. This fact has divided the opinion, where those arguing against claim that it is wrong selling outdated and insufficient technology to developing countries. On the other hand, the side that argues

Replacement of Old Wind Turbines Assessed from Energy, Environmental and Economic Perspectives Rydh et al., Dept. Technology, University of Kalmar, SE-391 82 Kalmar, SWEDEN, [email protected] 29 June 2004
13
for considers this to be an excellent opportunity for these countries to explore the technique at a low cost (Windpower Monthly 2004).
Current prices on used turbines vary according to size, model and what year it was manufactured. As an example a Vestas V27, 225 kW, built in 1991 with a 30 m lattice tower costs around €40 000-45 000 (Green-Ener-Tech 2004). This can be compared to the price this type of turbine had when it was new. The price then was €109,000, not including costs for installation and foundation work (A Larsson 2004).
An assumption that the replaced components were scrapped has been made. Estimated distance for transportation is 500 km and assumed time needed for the dismantling and assembling processes is totally four days using a mobile crane, two days for each process.
The two following examples describe wind turbines that have been relocated to another site.
5.3.1. Uppsala, Sweden
In 1993 a wind turbine was installed at Näsudden, on the Swedish island of Gotland. The model, Vestas V27, had a rated output of 225 kW. After ten years the turbine was sold to a number of company owners in Uppsala, Sweden. The reason for the relocation was to give place for a more powerful turbine at the site of Näsudden and that they wanted a greater turbine in Uppsala (Lindahl 2004, Holst 2004). In the dismantling and assembling processes of the wind turbine, both a crane and a truck were used for 1-3 days each (Holst 2004). The means of transportation was by boat and truck. The energy used in the relocation process was in form of diesel.
At the new location in Uppsala, a new foundation and connecting grid had to be built. In addition, a reinforcement of the way leading to the site had to be done. The land area needed for the foundation was 8 x 8 meters (Holst 2004). Since the machine was thoroughly reconditioned before leaving Näsudden, only a few smaller components had to be changed before it was taken in production in Uppsala. The replaced components were taken care of by the manufacturer (Holst 2004, Lindahl 2004).
The electricity produced after the relocation to Uppsala has decreased with approximately 35% compared to its old location. At Näsudden the wind turbine produced 650 000 kWh per year by comparison to Uppsala that today only produces 230 000 kWh per year (Holst 2004) (Lindahl 2004). The price for the used V27 in this case is not public, but a common price for this model to date is in the range of €40-50,000 (Green-Ener-Tech 2004). The costs for the relocation ended up to almost €43,600, including transportations, crane operation, a new foundation, grid connection and man-hours (Holst 2004).
5.3.2. Näsudden, Gotland, Sweden
In 1993 a wind turbine was relocated at Näsudden, on the Swedish island of Gotland. The reason for the relocation, only about 300 meters away in the same area, was to give place for a more powerful turbine (Lindahl 2004). The model of the wind turbine that was relocated was a Vestas V27 which had a rated output of 225 kW (Lindahl 2004). Except for a new foundation and a cast iron ring, no other modifications on the turbine had to be done. The land area needed for the foundation was 5 x 5 meters (Lindahl 2004). The relocation of the V27 resulted in a slightly lower electricity production, it was lowered from 600 MWh/yr to 500 MWh/yr (Lindahl 2004). The disassembly, transportation and assembling processes required use of a smaller crane and a truck for four days.
When estimating the cost in current value, it would be €16,300 for a new foundation and €10,900 for machines and man-hours, the total sum for the relocation ends up at €27,200 (Niklasson 2004). This does not include the cost of the grid connection, that today in Sweden is around €130 per kW (Lindahl 2004).
5.4. Recycling
When a wind turbine, that usually has a lifespan of 20-25 years, is worn out one alternative is to dismantle and scrap the unit. Usually the wind turbines have rotor blades made of glass fibre reinforced polyester or epoxy, the tower is made of steel and the foundations of steel reinforced armed

Replacement of Old Wind Turbines Assessed from Energy, Environmental and Economic Perspectives Rydh et al., Dept. Technology, University of Kalmar, SE-391 82 Kalmar, SWEDEN, [email protected] 29 June 2004
14
concrete and gravel. The foundation also consists of a cast iron ring. Most parts, except for the rotor blades, can be recycled as metal scrap. The foundation can either be left in place or dug up and reused as filling material (Wizelius 2003). For wind turbines with low efficiency and outdated electrical equipment, it is often deemed more economically effective to scrap the wind turbine. The scrapping requires energy though.
Since Denmark has scrapped a lot of wind turbines lately the country is once again used as an example. During 2002 and 2003 more than 1 600 wind turbines were scrapped in Denmark, mainly because the Danish government introduced new regulations that made it advantageous to change to new technology and more powerful machines. This regulation only applied to 31st of December 2003 though (Skriver 2004).
For the scrapping process, estimated end-of-life transport is 500 km and estimated time needed for using a crane is two days. The waste treatment was assumed as following:
o steel and cast iron, 90 % recovery (Tech-wise 1999)
o copper, 95 % recovery (Tech-wise 1999)
o aluminium, 95 % recovery (Juteberg 2004) (Tech-wise 1999)
o glass fibre, rubber, oil and remaining plastic, 100% incineration (Juteberg 2004) (Tech-wise 1999)
o PVC-plastic and HDPE, 100% landfill (Juteberg 2004) (Tech-wise 1999).
o concrete landfilling 50% (left in the ground and covered with soil (Salomonsen 2004)) and re-use 50%
Based on the material composition of WTs, the overall recovery rate was calculated to 74%.
The recycling process with these assumptions gives an income of €7,2/kW for 225 kW WTs and €10,2/kW for 2 MW WTs (Juteberg 2004). Material prices may vary a lot from day to day. For example, copper and aluminium the prices are updated twice a day (Juteberg 2004).
The following example describes a Swedish prototype turbine that was scrapped for over ten years ago. It is not the most representative one, but when no other particular cases have been found it should although be mentioned.
5.4.1. Maglarp, Sweden
Since 1975 the Swedish government has been funding a wind turbine program. The purpose with this programme has been to investigate the financial, technological and environmental conditions of wind energy use in Sweden. One step in the programme was to build a prototype turbine, located outside of Trelleborg, at Maglarp, in the southern part of Sweden (Magnusson 1990).
The turbine, that was double bladed, was built by Karlskronaverket AB in Sweden and had a maximum power of 3 MW. It was located 6 km outside of Trelleborg on the plains near the Swedish south coast, on a site with good wind conditions. The wind turbine was connected to the electrical grid in August of 1982, and after a time of testing and inspections it was taken in normal production in September 1983 (Magnusson 1990).
The turbine in Maglarp was part of a research programme funded by the Swedish government and owned by State Energy authority. When the testing period ended in 1989 the ownership was taken over by the research department at the Swedish energy company Sydkraft AB. In May 1993, the wind turbine was taken out of production and the dismounting process started. The total production of electricity was 36,7 GWh (Nilsson 2004). This means an annual production of almost 3 670 MWh, counted that the machine was in normal production for nearly ten years. The reason for the termination was that no profit could be done and that the different type of construction, compared to a modern turbine, meant a great deal of noise disturbance for people living close to the site (Sjunnesson 2004).
The turbine, the generator and other electrical equipments in the nacelle were taken down using a crane. It was sold together with the transformer and electrical equipment on the ground. The rest of the

Replacement of Old Wind Turbines Assessed from Energy, Environmental and Economic Perspectives Rydh et al., Dept. Technology, University of Kalmar, SE-391 82 Kalmar, SWEDEN, [email protected] 29 June 2004
15
material was scrapped and reused, except for the glass fibre reinforced turbine blades. The concrete foundation was dug up and the ground was re-set to soil. The control building was left standing and the grid connection was not taken away (Nilsson 2004).
5.5. Replacement of old wind turbine with other technology
Turbines of today are efficient and relatively reliable and the cost per produced kWh has decreased. New turbines also have relatively low weight and large rotor diameter. The turbines in use today often have a rated output of 500-600 kW. This can be compared with new technologies with a power rating n 1,5 to 3 MW. Not only the turbines themselves are developing, progress is also being made in adjacent areas. For example, the Swedish company Nordic Windpower AB has developed a new type of foundation. This new type of construction method has the advantage that less impact on the nature will occur. The new foundation consists of a cast iron ring that is held in place with a number of rods that has been drilled down and anchored in the bedrock. With this method no concrete base has to be made and the costs can be reduced (Nordic Windpower 2004).
In Sweden, investment funding is needed to stimulate the wind energy market. Since the investment funding disappeared a new type of market-based means of control, called electricity certificate has been introduced. The purpose with this system is to promote the electricity production with renewable energy. By forcing electricity consumers to buy a number of certificates, the income from these sales can cover the higher costs the production with renewable energy give. Replacing subvention with electricity certificates is considered a step in the right direction although the time perspective must be specified (Nordreportern 2004).
The following example describes a site where an old wind turbine was replaced by a newer and a more powerful one.
5.5.1. Näsudden, Gotland, Sweden
In 2003 one of the sites at Näsudden, on the Swedish island of Gotland, was exchanged from one Vestas 225 kW V27 to one 2 MW V80. The new wind turbine was transported from Falkenberg, Sweden, by trucks and by boat. To assemble the turbine also a crane for approximately three days was required (Lindahl 2004). The use of diesel resulted in pollution of air and water.
The cost for the complete V80 including foundation, fees of grid connection and a 5 year service agreement was about €2,5 million (Lindahl 2004). With the V80, the annually production has increased about ten times to 6 500 MWh/year (Lindahl 2004). The land area needed for the foundation was 18 x 18 meters (Lindahl 2004).

Replacement of Old Wind Turbines Assessed from Energy, Environmental and Economic Perspectives Rydh et al., Dept. Technology, University of Kalmar, SE-391 82 Kalmar, SWEDEN, [email protected] 29 June 2004
16
6. Results and discussion
6.1. Summary results of different indicators
The results for the different cases (Fig. 1 and Table 1) are summarised in Table 7 and further described in the following sections. A comparison of the indicators for the different cases shows that they are pointing in different directions, which makes it possible to optimise WTs in different ways depending on subjective values.
Table 7. Indicators for the different cases of wind turbines at Grönhögen wind farm.
1. Renovation
2. Relocation
3. Recycling
4a. Replace new
WT
4 b. Replace coal condensing
4 c. Replace
Euro. ave.
4 d. Replace Swe
ave.
Energy (MJp f/Whel) 106 155 155 108 484 472 387 Emission (g CO2/kWhel) 7.2 11 11 7.3 875 500 49 Energy return factor (-) 92 62 62 90 Energy payback time (months) 3.93 3.85 3.85 2.67 Electricity cost (Euro ents/kWh) 5.4 4.7 3.9 2.9
Fig. 7 shows that renovation has the lowest CO2 emission, but also the highest cost. The annual electricity production per kW is 37% higher for a 2 MW turbine than for a 225 kW WT, which results in lower electricity cost for the larger turbine.
The CO2 emissions for relocation and recycling are similar but the monetary cost is 21% higher for relocation.
0
1
2
3
4
5
6
0 2 4 6 8 10 12
Emission (g CO2/ kWhe l)
Cos
t (E
uro
cent
/ kW
hel
)
1. Renovation
4a. Replacement
3. Recycling
2. Relocation
Fig. 7. Relation between monetary costs and CO2 emissions for the different cases.
In order to evaluate the efficiency of land use, the average electricity production was calculated for a period of 30 years for a specific area (Table 8). In cases when the operation time is less than 30 years, it is assumed that no electricity production occurs on the land area.
The highest electricity production and efficient use of land is found in the case with continuous operation with 10 years of 8 x 225 kW WTs which are replaced by with 4 x 2 MW WTs which are in operation for 20 years. The example shows the importance of using efficient technologies with highest possible electricity yield on land areas, which are suitable for wind turbines.
Replacement of Old Wind Turbines Assessed from Energy, Environmental and Economic Perspectives Rydh et al., Dept. Technology, University of Kalmar, SE-391 82 Kalmar, SWEDEN, [email protected] 29 June 2004
17
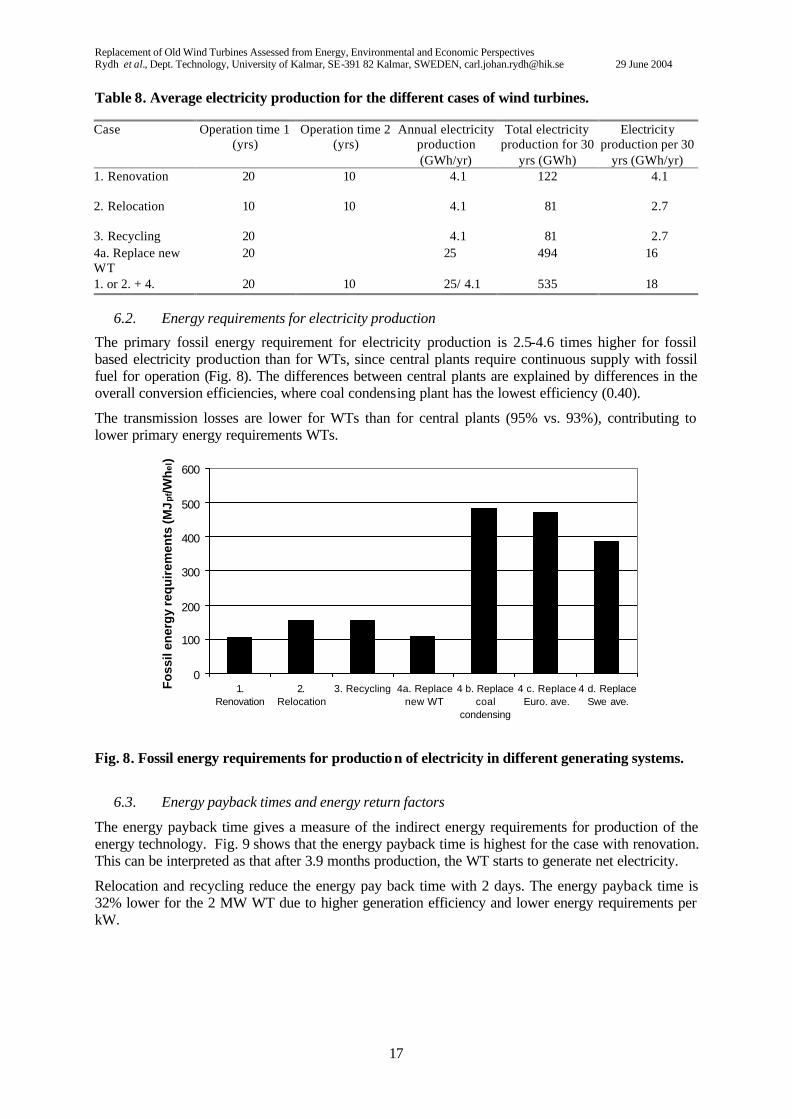
Table 8. Average electricity production for the different cases of wind turbines.
Case Operation time 1 (yrs)
Operation time 2 (yrs)
Annual electricity production (GWh/yr)
Total electricity production for 30
yrs (GWh)
Electricity production per 30
yrs (GWh/yr) 1. Renovation 20 10 4.1 122 4.1
2. Relocation 10 10 4.1 81 2.7
3. Recycling 20 4.1 81 2.7 4a. Replace new WT
20 25 494 16
1. or 2. + 4. 20 10 25/ 4.1 535 18
6.2. Energy requirements for electricity production
The primary fossil energy requirement for electricity production is 2.5-4.6 times higher for fossil based electricity production than for WTs, since central plants require continuous supply with fossil fuel for operation (Fig. 8). The differences between central plants are explained by differences in the overall conversion efficiencies, where coal condensing plant has the lowest efficiency (0.40).
The transmission losses are lower for WTs than for central plants (95% vs. 93%), contributing to lower primary energy requirements WTs.
0
100
200
300
400
500
600
1.Renovation
2.Relocation
3. Recycling 4a. Replacenew WT
4 b. Replacecoal
condensing
4 c. ReplaceEuro. ave.
4 d. ReplaceSwe ave.
Fo
ssil
ener
gy
req
uir
emen
ts (M
Jpf
/Wh
el)
Fig. 8. Fossil energy requirements for production of electricity in different generating systems.
6.3. Energy payback times and energy return factors
The energy payback time gives a measure of the indirect energy requirements for production of the energy technology. Fig. 9 shows that the energy payback time is highest for the case with renovation. This can be interpreted as that after 3.9 months production, the WT starts to generate net electricity.
Relocation and recycling reduce the energy pay back time with 2 days. The energy payback time is 32% lower for the 2 MW WT due to higher generation efficiency and lower energy requirements per kW.

Replacement of Old Wind Turbines Assessed from Energy, Environmental and Economic Perspectives Rydh et al., Dept. Technology, University of Kalmar, SE-391 82 Kalmar, SWEDEN, [email protected] 29 June 2004
18
0.0
0.5
1.0
1.5
2.0
2.5
3.0
3.5
4.0
4.5
1. Renovation 2. Relocation 3. Recycling 4a. Replace new WT
En
erg
y p
ayb
ack
tim
e, t*
(mon
ths)
Fig. 9. Energy payback time for different treatments of old wind turbines.
The energy return factor can be interpreted as how many times the indirect energy input is converted to output energy. Fig. 10 shows that renovation which extends the service life by ten years, results in the energy return factor 92. For relocation and recycling, the energy return factor is 62.
0
10
20
30
40
50
60
70
80
90
100
1. Renovation 2. Relocation 3. Recycling 4a. Replace new WT
En
erg
y re
turn
fact
or,
f (-
)
Fig. 10. Energy return factors for different treatments of old wind turbines. It is assumed that the wind turbines replace electricity production from a coal condensing plant.
6.4. CO2 emissions of wind turbines for the different cases
The highest CO2 emission for electricity generation from WTs is found in the phase of materials production, corresponding to 60-64% of the total emission (Fig. 11). The second highest emission comes from production of WTs (32%). The phases of transportation/disassembly and renovation/maintenance have relatively low influence, contributing 2-3% and 2-6% of the total CO2 emissions.

Replacement of Old Wind Turbines Assessed from Energy, Environmental and Economic Perspectives Rydh et al., Dept. Technology, University of Kalmar, SE-391 82 Kalmar, SWEDEN, [email protected] 29 June 2004
19
The results found in this study (7.2-11 g CO2/kWh) are similar to other studies, eg. 8 g CO2/kWh (Alsema 2002). Chataignere and Boulch (2003) reported CO2 emissions of 6.1-13 g CO2/kWh based on LCIs of 600-4 500 kW wind turbines with a service life of 20 years (3 000 full load hours/year.
0
2
4
6
8
10
12
1. Ren
ovatio
n
2. Relo
cation
3. Rec
ycling
4a. R
eplac
e new
WT
Em
issi
on
(g C
O2/
kWh
el)
Renovation &maintenance
Transportation& disassembly
Production
Materialproduction
Fig. 11. Emissions of CO2 for electricity production from different treatments of wind turbines.
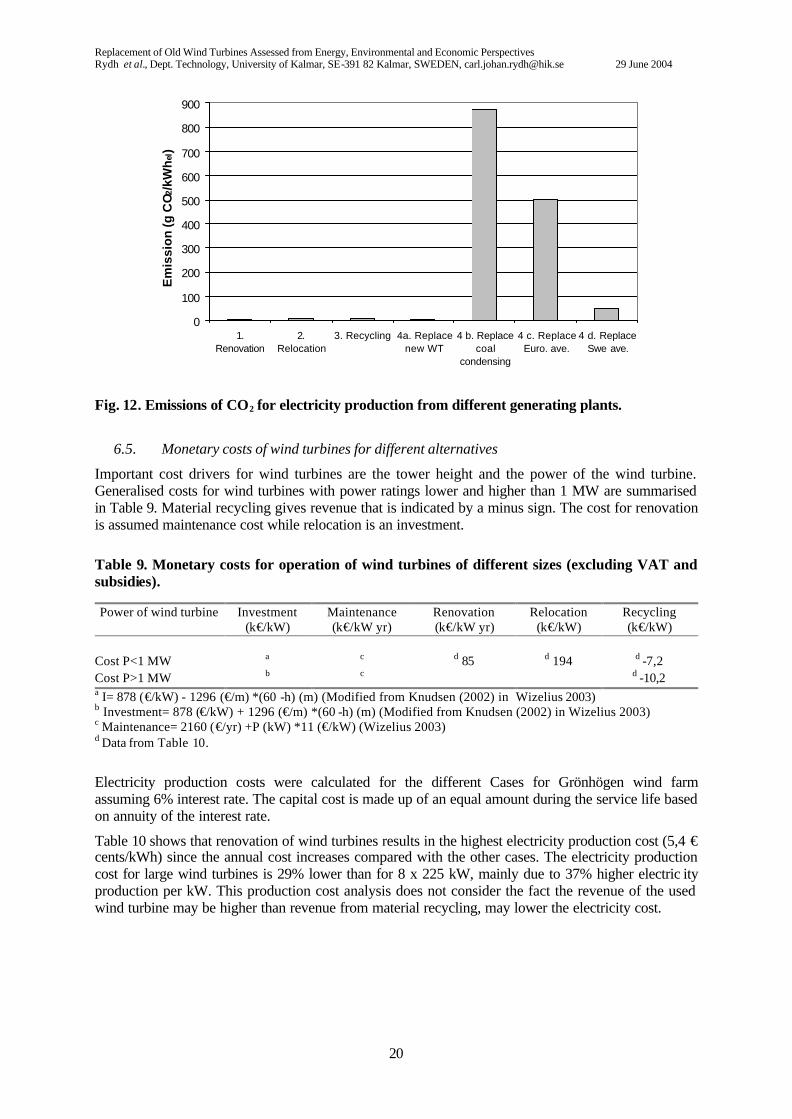
CO2 emissions for electricity generation with different technologies were compared in order to present the relative performance of WTs. The results in Fig. 8 differ significantly compared with Fig. 12, since renewable energy technologies do not require continuous supply with fossil fuel for operation. Depending on the source of energy, the carbon intensity per unit primary energy differs.
Fig. 12 shows that electricity production in a coal condensing plant has 83-122 times higher CO2 emissions than electricity generation from WTs. With lower conversion efficiency in coal condensing plants than estimated in this study, the CO2 emission has been estimated to 1 000 g CO2/kWh (Alsema 2002).
Global warming potential for different sizes of wind turbines and combinations was calculated to 7.5-12.1 g CO2 eq/kWh (Chataignere and Boulch 2003). This can be compared with 600 g CO2 eq/kWh for electricity production in a (fossil) gas fired plant (Chataignere and Boulch 2003).
Replacement of Old Wind Turbines Assessed from Energy, Environmental and Economic Perspectives Rydh et al., Dept. Technology, University of Kalmar, SE-391 82 Kalmar, SWEDEN, [email protected] 29 June 2004
20
0
100
200
300
400
500
600
700
800
900
1.Renovation
2.Relocation
3. Recycling 4a. Replacenew WT
4 b. Replacecoal
condensing
4 c. ReplaceEuro. ave.
4 d. ReplaceSwe ave.
Em
issi
on
(g C
O2/
kWh
el)
Fig. 12. Emissions of CO2 for electricity production from different generating plants.
6.5. Monetary costs of wind turbines for different alternatives
Important cost drivers for wind turbines are the tower height and the power of the wind turbine. Generalised costs for wind turbines with power ratings lower and higher than 1 MW are summarised in Table 9. Material recycling gives revenue that is indicated by a minus sign. The cost for renovation is assumed maintenance cost while relocation is an investment.
Table 9. Monetary costs for operation of wind turbines of different sizes (excluding VAT and subsidies).
Power of wind turbine Investment (k€/kW)
Maintenance (k€/kW yr)
Renovation (k€/kW yr)
Relocation (k€/kW)
Recycling (k€/kW)
Cost P<1 MW a c d 85 d 194 d -7,2 Cost P>1 MW b c d -10,2 a I= 878 (€/kW) - 1296 (€/m) *(60 -h) (m) (Modified from Knudsen (2002) in Wizelius 2003) b Investment= 878 (€/kW) + 1296 (€/m) *(60 -h) (m) (Modified from Knudsen (2002) in Wizelius 2003) c Maintenance= 2160 (€/yr) +P (kW) *11 (€/kW) (Wizelius 2003) d Data from Table 10.
Electricity production costs were calculated for the different Cases for Grönhögen wind farm assuming 6% interest rate. The capital cost is made up of an equal amount during the service life based on annuity of the interest rate.
Table 10 shows that renovation of wind turbines results in the highest electricity production cost (5,4 € cents/kWh) since the annual cost increases compared with the other cases. The electricity production cost for large wind turbines is 29% lower than for 8 x 225 kW, mainly due to 37% higher electric ity production per kW. This production cost analysis does not consider the fact the revenue of the used wind turbine may be higher than revenue from material recycling, may lower the electricity cost.

Replacement of Old Wind Turbines Assessed from Energy, Environmental and Economic Perspectives Rydh et al., Dept. Technology, University of Kalmar, SE-391 82 Kalmar, SWEDEN, [email protected] 29 June 2004
21
Table 10. Monetary costs for electricity production for the different cases (excluding VAT and subsidies).
Case Investment (k€)
Maintenance (k€/yr)
Renovation (k€)
Relocation (k€)
Recycling (k€)
Capital cost (k€/yr)
Annual cost a (k€/yr)
Electricity cost (€
cents/kWh)1. Renovation 1542 22 85 - -13 112 219 5.4 2. Relocation 1542 22 - 349 -13 167 189 4.7 3. Recycling 1542 22 - - -13 134 156 3.9 4a. Replacement with new WT
7056 92 - - -58 612 705 2.9
a Interest rate= 6%. Annuity, a= r(1+r)t/((1+r)t+1 )
6.6. Sensitivity analysis
If the WTs are not recycled after their end-of-life, the energy payback time increase by 35% and the CO2 emissions increase by 85% (Table 11).
Assuming that the distance increase ten times for transporting WTs from production to the wind site, the energy payback time increase 9% while the CO2 emissions increase 20%.
The annual electricity production depends on the wind conditions, which are site specific and may vary over the year. When the electricity production is increased by 20%, the fossil energy requirement per produced kWh and the energy payback time decrease by approximately by 17%.
The service life (as well as material requirement) has highest relative influence on energy requirements.
Table 11. Different parameters relative influence on the results.
Case 3, reference
Recycling 0 % Transportation 5000 km from production to
site
Full load +20%= 2700
h/yr
Service life +50%
Energy return factor, f (-) 62 46 57 75 93 Energy payback time, t* (months) 3.85 5.19 4.22 3.21 3.85 Energy, E (MJpf/kWhel) 155 209 170 129 104 Emission, eCO2 (g CO2/kWhel) 11 19 13 9 7 Relative change of f 1.0 0.74 0.91 1.20 1.5 Relative change of E and t* 1.0 1.35 1.09 0.83 1.0 Relative change of eCO2 1.0 1.85 1.20 0.83 0.67

Replacement of Old Wind Turbines Assessed from Energy, Environmental and Economic Perspectives Rydh et al., Dept. Technology, University of Kalmar, SE-391 82 Kalmar, SWEDEN, [email protected] 29 June 2004
22
7. Conclusions • By extending the service life ten years by renovation results in 32% lower primary energy
requirements than if the WT is recycled after 20 years at the end of the technical service life. The primary fossil energy requirement for electricity production is 2.5-4.6 times higher for fossil based electricity production than for WTs, since central plants require continuous supply with fossil fuel for operation. The transmission losses are lower for WTs than for central plants (95% vs. 93%), contributing to lower primary energy requirements WTs.
• The energy payback time was calculated to 3.9 months for 225 kW WT and to 2.7 months for a 2 MW WT. This means that after 3.9 months production, the WT starts to generate net electricity. By extending the service life, ten years by renovation, the energy return factor increases from 62 to 92 which is similar to a 2 MW WT.
• The CO2 emission for WTs was calculated to 7.2-11 g CO2/kWh, which is 4.6 lower than the average Swedish electricity mix and 122 times lower than for a coal condensing plant. The highest CO2 emission for electricity generation from WTs was found in the phase of materials production (60-64% of the total emission) followed by production of WTs (32%). The phases of transportation/disassembly and renovation/maintenance have relatively low influence, contributing 2-3% and 2-6%.
• A few parameters were studied in a sensitivity analysis to identify their relative influence on energy requirements and CO2 emissions. Most important parameters arranged in decreasing order were: (1) service life, wind conditions/conversion efficiency and material requirement, (2) recycling rate and (3) transportation distance.
• The monetary costs for electricity production were calculated to be in the range 2.9-5.4 € cents/kWh (excluding VAT and subsidies). The lowest cost was found for 2 MW WTs and the highest cost for renovation of 225 kW WTs.
• The average electricity production for a specific area was calculated for different examples of WTs arrangements. The results show the importance of using the most efficient technologies with highest possible electricity yield on land areas, which are suitable for wind turbines.
• A comparison of the indicators for the different cases shows that they are pointing in different directions, which makes it possible to optimise WTs in different ways depending on subjective values. Physical flows of energy, materials and CO2 emission decrease per unit produced electricity when the service life is extended by renovation. On the contrary, when the considering a monetary perspective, the costs increase when extending the service life by renovation since labour costs is highly valued.
• The Excel computer model developed in this project can be easily updated with data in order to evaluate the technological development and different operating conditions.
8. Acknowledgements This project has been financially supported from the European Union project: Wind in the Baltic Sea Region, Interregional III B project, WP 4.

Replacement of Old Wind Turbines Assessed from Energy, Environmental and Economic Perspectives Rydh et al., Dept. Technology, University of Kalmar, SE-391 82 Kalmar, SWEDEN, [email protected] 29 June 2004
23
9. References AB Nordreportern (2004) Miljö & Utveckling, Vol. 20, No 2 2004.
Alsema EA.(2000) Energy Pay-Back Time and CO2 Emissions of PV systems, Progress in Photovoltaics: Research and Applications, 2000;8:17-25.
Betongindustri 2004, “Vad är betong?” www.betongindustri.se, 23 June 2004
Chataignere A, Boulch DLE (2003) Wind turbine (WT) systems, Final Report November, EDF R&D, Eclipse: Environmental and ecological life cycle inventories for present and future power Systems in Europe, www.eclipse-eu.org/index.html, Download: March 2004.
Elforsk (1999-2004) Driftuppföljning av vindkraftverk over 50 kW årsrapport 1998, 1999, 2000, 2001, 2003, www.elforsk.se, Download: March 2004
Enercon 2004, Product sheet on e-66, www.enercon.se, Downloaded May 2004 ESS (2003), Energy Agency for Southeast Sweden Energikontor Sydost, www.energikontor-so.com
Expedia (2004) www.expedia.com, May 2004. Gagnon L, Bélanger C, Uchiyama Y. (2002) Life-cycle assessment of electricity generation options: The status
of research in year 2001, Energy Policy, Vol 30, No 14, pp. 1267-1278
Green-Ener-Tech Aps (2004) www.green-ener-tech.dk, May 2004. Hansson J. Enercon, Energy Converter AB, Pers.com, 29 April 2004 Hedblom Ö. Svensk Vindkraftsförening, Pers. com, 1 June 2004.
Holst G-O. (2004) Triventus Consulting AB, E-mail, 10 May 2004, 18 May 2004 ISO (1997) 14 040 Environmental Assessment, Life Cycle Assessment- Principles and framework, International
Organisation for Standardisation, Brussels
Knudsen J. (2002) The economy of wind power (in Swedish), University College Visby. Larsson A. (2004) Vestasvind Svenska AB, Pers.com, 13 May 2004. Larsson P. (2004) Vestasvind Svenska AB, Pers.com, 17 May 2004, E-mail, 25 May 2004.
Lindahl C-O. (2004) Slitevind AB, Pers.com 29 April 2004, 19 May 2004, Phnr. +46 40 96 18 67. Magnusson L. (1990) Vad vi lärt oss om vindkraft i Maglarp och Näsudden, Statens Energiverk, Svenska
Tryckcentralen AB, Stockholm 1990.
McCulloch M. Raynolds M. Luarie M. (2000) Life -Cycle Value Assessment of a wind turbine, Report, Pembina Institute, Drayton Valley, AB,
NEG MICON (2004) Product information www.neg-micon.se, May 2004
Niklasson S. (2004) Vindkompaniet AB, Pers.com, 27 February 2004, 13 May 2004. Nilsson K. (2004) Carl Bro Energikonsult AB, Pers.com, E-mail, 3 May 2004. Nordic Windpower (2004) www.nwp.se, 10 May 2004 Rydh CJ, Sandén BA. (2004) Energy analysis of batteries in photovoltaic systems: Part II. Energy return factors
and overall battery efficiencies, Energy Conversion and Management, (Submitted for publication 28 May). Rydh CJ. Sun M. (2004) Life cycle inventory data for materia ls grouped according to environmental and
mechanical properties, J. Cleaner Production, Accepted for publication.
Salomonsson S. (2004) Vestas Vind, Pers. com, 23 June 2004 Sjunnesson L. (2004) Sydkraft AB, Pers.com, 17 May 2004. Skriver (2004) Danmarks Vindmolleforening, E-mail, 16 and 28 May 2004.
SOU 1999:75 Rätt plats för vindkraften del 1, Slutbetänkande av vindkraftutredningen 1999. Tech-wise A/S (2001) Livscyklusvurdering af vindmoller, Report PSO 1999, July 2001, Fredericia Denmark. Vestas (1994) General specification Vestas v27-225 kW, 50 Hz wind turbine with tubular/lattice tower ITEM
no.: 941 129 Vestas (1994) Allmänna specifikationer, Vestas v29-225 kW EDB nr 941520.R4 Vestas (2004) Produktinformation www.vestasvind.se, juni 2004
Vindmølleindustrien (1997) The energy balance of modern wind turbines, Wind power note, No 16, December 1997 (www.windpower.org/publ/enbal.pdf).
WBSR (2003) Wind in the Baltic Sea Region, Interregional III B project, www.windenergyBSR.net
Windpower Monthly News Magazine A/S (2004) Vol 20, No 5, May 2004.

Replacement of Old Wind Turbines Assessed from Energy, Environmental and Economic Perspectives Rydh et al., Dept. Technology, University of Kalmar, SE-391 82 Kalmar, SWEDEN, [email protected] 29 June 2004
24
Wizelius T. (2003) Vindkraft i teori och praktik, Studentlitteratur, Lund, Sweden.

Replacement of Old Wind Turbines Assessed from Energy, Environmental and Economic Perspectives Rydh et al., Dept. Technology, University of Kalmar, SE-391 82 Kalmar, SWEDEN, [email protected] 29 June 2004
25
Appendix 1
Table 12. Energy requirements and CO2 emissions for virgin and recycled material production.
Steel Concrete Fibreglass Aluminium Copper HDPE Paint
Energy virgin production (MJpf/kg) 30 19 200 190 90 80 80
Energy recycled production (MJpf/kg) 10 19 180 18 20 55 80
Emission CO2 virgin (kg CO2/kg) 1.3 0.88 12 4.7 10 3.3 3.3
Emission CO2 recycled (kg CO2/kg) 0.4 0.88 10.8 0.4 2.2 2.3 3.3
Source: Rydh and Sun (2002)
Table 13. Material requirements for one Vestas V27, 225 kW (tower height 30 m).
Component Steel Concrete Fibreglass Aluminiu m Copper HDPE Paint Total Share (wt.%)
Nacelle (kg) 6 131 0 281 600 375 19 0 7 406 17
Blades and hub (kg) 938 0 2 156 94 0 0 0 3 188 7.3
Tower and paint (kg) 13 875 0 0 0 0 0 94 13 969 32
Foundation (kg) 1 776 16 211 0 0 0 0 0 17 987 41
Transformer kg) 1 230 0 0 0 0 0 0 1 230 2.8
Total (kg) 23 949 16 211 2 438 694 375 19 94 43 779 100
Share (wt.%) 55 37 5.6 1.6 0.86 0.043 0.21 100
Sources: Vestas (1994), McCullen et al. (2000)
Table 14. Energy requirements and CO2 emissions for material production for one 225 kW wind turbine.
Steel Concrete Fibreglass Aluminium Copper HDPE Paint Total
Energy virgin production (GJpf) 718 308 488 132 34 2 8 1 689
Energy recycled production (GJpf) 239 308 439 12 8 1 8 1 015
Emission CO2 virgin (ton CO2) 31 14 29 3 4 0 0 82
Emission CO2 recycled (ton CO2) 10 14 26 0 1 0 0 52
Sources: Table 12 and Table 13

Replacement of Old Wind Turbines Assessed from Energy, Environmental and Economic Perspectives Rydh et al., Dept. Technology, University of Kalmar, SE-391 82 Kalmar, SWEDEN, [email protected] 29 June 2004
26
Table 15. Material requirements for one Enercon E66, 2 MW. Tower height 85 m.
Component Steel Concrete Fibreglass Aluminium Copper HDPE Paint Total Share (wt.%)
Nacelle (kg) 54 500 0 2 500 5 333 3 333 167 0 65 833 17
Blades and hub (kg) 8 333 0 19 167 833 0 0 0 28 333 7.3
Tower and paint (kg) 123 333 0 0 0 0 0 833 124 167 32
Foundation (kg) 15 783 144 100 0 0 0 0 0 159 883 41
Transformer kg) 10 930 0 0 0 0 0 0 10 930 2.8
Total (kg) 212 880 144 100 21 667 6 167 3 333 167 833 389 147 100
Share (wt.%) 55 37 5.6 1.6 0.86 0.043 0.21 100
Source: Based on McCullen et al. (2000)
Table 16. Energy requirements and CO2 emissions for material production for one Enercon E66, 2 MW.
Steel Concrete Fibreglass Aluminium Copper HDPE Paint Total
Energy virgin production (GJpf) 6 386 2 738 4 333 1 172 300 13 67 15 009
Energy recycled production (GJpf) 2 129 2 738 3 900 111 67 9 67 9 020
Emission CO2 virgin (ton CO2) 277 127 260 29 33 1 3 729
Emission CO2 recycled (ton CO2) 92 127 234 3 7 0 3 466
Source: Table 12 and Table 15