reply to comments rc1 - bg.copernicus.org
TRANSCRIPT
Reply to comments RC1:
1. The monthly monitoring data from 86 stations (Figure 1) are public
available. What’s the rationale of selecting the 3 stations in the southern
water of Hong Kong? Are you choosing the stations that are affected most
by the nutrient-rich Pearl River plume? If so, the station on the west of
SM17 and stations in the northwest of Hong Kong water (west of Lantau
Island) might be more representative. Or are these stations the most
productive one (based on the nutrient and chlorophyll data that are also
included in this monitoring program)? Or did you find these stations
experience most severe low-DO or hypoxic conditions?
Reply 1: The reasons for selecting the 3 stations in the southern water
of Hong Kong are as follows.
Our main objective is to focus on wind effects on hypoxia and hence,
we need to select stations are open to winds. Tolo Harbour where hypoxia
occurs often is sheltered. The Pearl River estuary within the line of lands
between Lantau Island and Macau is shallow in most areas except for deep
channel and hypoxia is a rare event. Port Shelter is also sheltered. Other
parts of Hong Kong waters are shallow and hypoxia hardly occurs. We
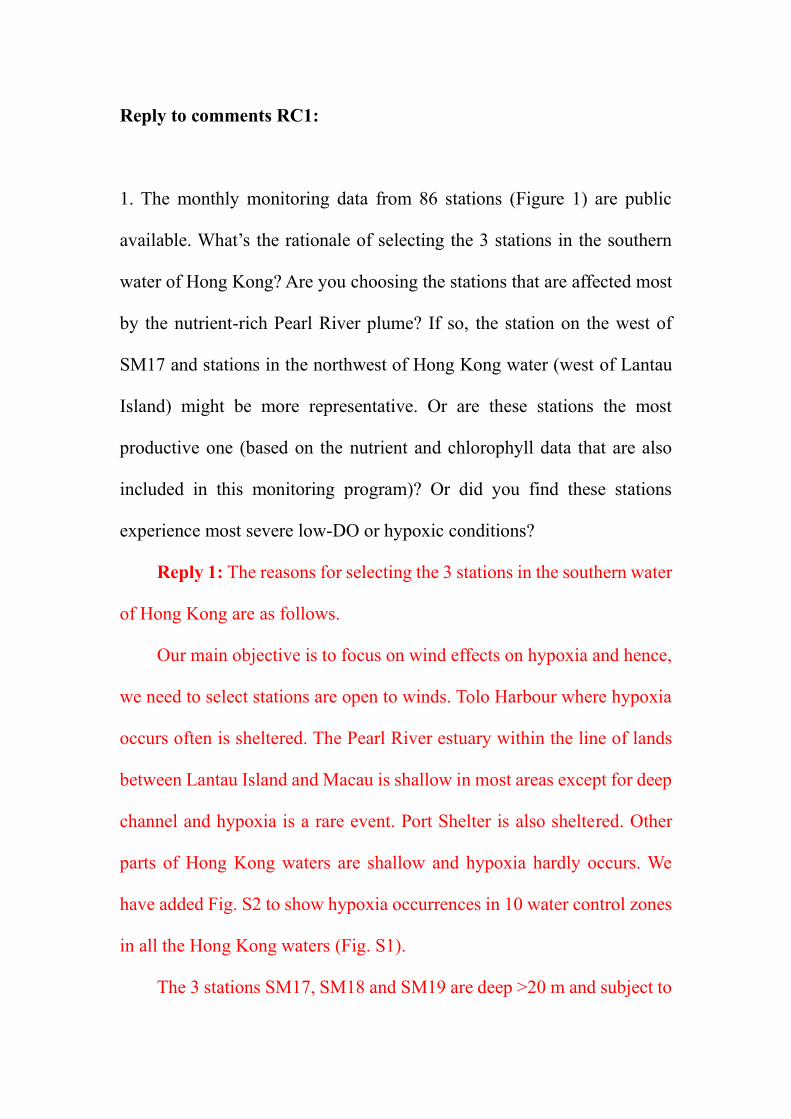
have added Fig. S2 to show hypoxia occurrences in 10 water control zones
in all the Hong Kong waters (Fig. S1).
The 3 stations SM17, SM18 and SM19 are deep >20 m and subject to

the Pearl River estuarine plume, most vulnearable to the formation of
hypoxia as they have the stronger stratification in summer.
Fig. S1 The ten water control zones in the Hong Kong waters (EPD report, 2017). The
number 1-10 denotes water control zones as follows: 1-Tolo Harbour and Channel WCZ
(TM), 2-Southern WCZ (SM), 3-Port Shelter WCZ (PM), 4-Junk Bay WCZ (JM), 5-
Deep Bay WCZ (DM), 6-Mirs Bay WCZ (MM), 7-North Western WCZ (NM), 8-
Western Buffer WCZ (WM), 9-Eastern Buffer WCZ (EM), 10-Victoria Harbour WCZ
(VM).

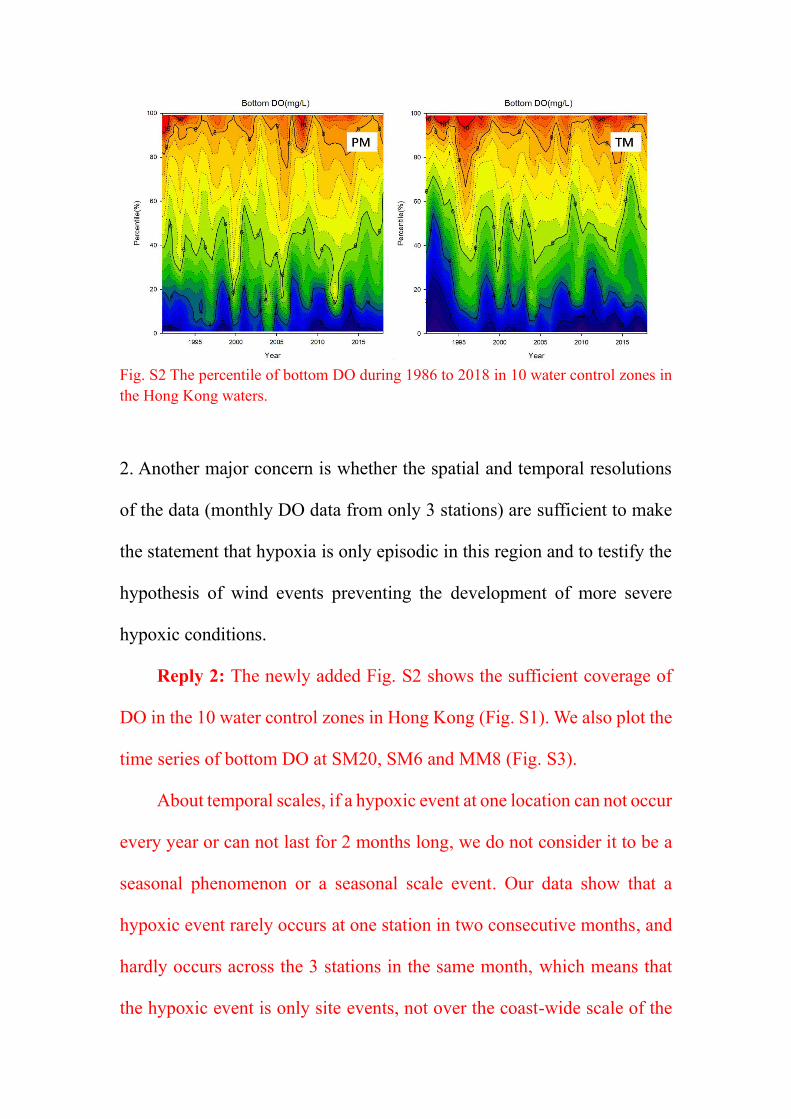
Fig. S2 The percentile of bottom DO during 1986 to 2018 in 10 water control zones in
the Hong Kong waters.
2. Another major concern is whether the spatial and temporal resolutions
of the data (monthly DO data from only 3 stations) are sufficient to make
the statement that hypoxia is only episodic in this region and to testify the
hypothesis of wind events preventing the development of more severe
hypoxic conditions.
Reply 2: The newly added Fig. S2 shows the sufficient coverage of
DO in the 10 water control zones in Hong Kong (Fig. S1). We also plot the
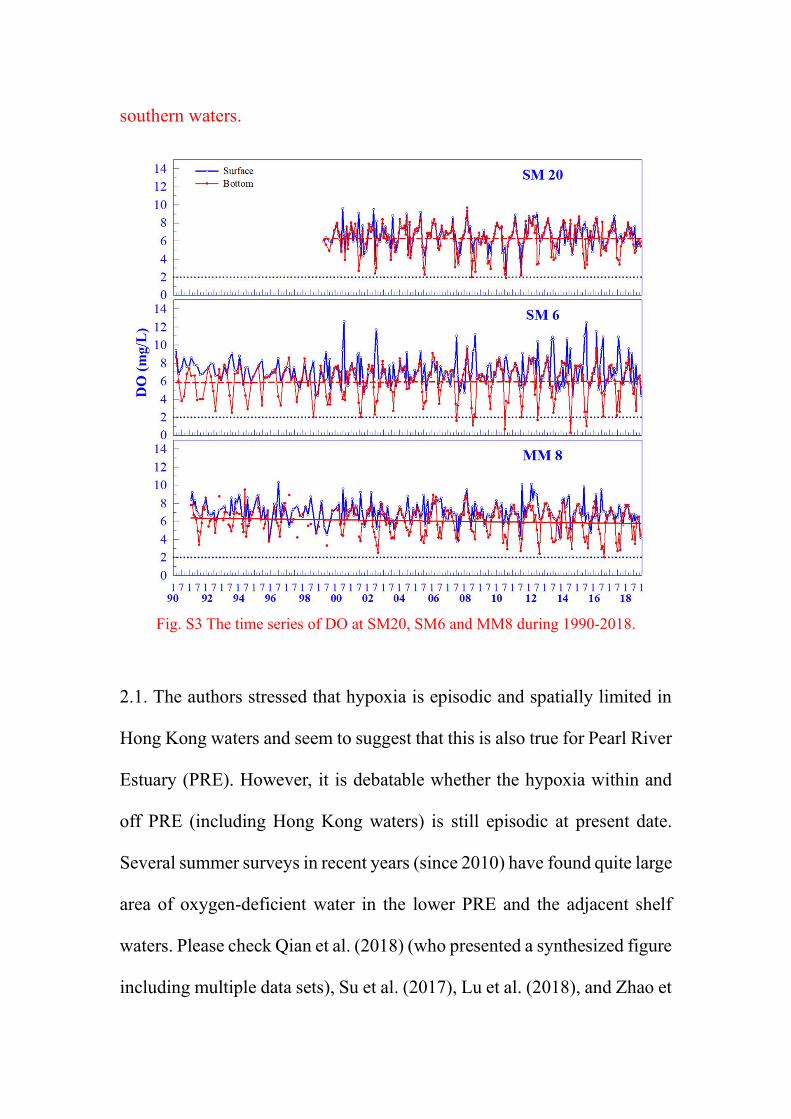
time series of bottom DO at SM20, SM6 and MM8 (Fig. S3).
About temporal scales, if a hypoxic event at one location can not occur
every year or can not last for 2 months long, we do not consider it to be a
seasonal phenomenon or a seasonal scale event. Our data show that a
hypoxic event rarely occurs at one station in two consecutive months, and
hardly occurs across the 3 stations in the same month, which means that
the hypoxic event is only site events, not over the coast-wide scale of the
southern waters.
Fig. S3 The time series of DO at SM20, SM6 and MM8 during 1990-2018.
2.1. The authors stressed that hypoxia is episodic and spatially limited in
Hong Kong waters and seem to suggest that this is also true for Pearl River
Estuary (PRE). However, it is debatable whether the hypoxia within and
off PRE (including Hong Kong waters) is still episodic at present date.
Several summer surveys in recent years (since 2010) have found quite large
area of oxygen-deficient water in the lower PRE and the adjacent shelf
waters. Please check Qian et al. (2018) (who presented a synthesized figure
including multiple data sets), Su et al. (2017), Lu et al. (2018), and Zhao et

al. (2020). I noticed that authors have cited some of these references but
described them as “hypoxia in the coastal waters south of Macau”. This is
a bit misleading as the newly reported low-DO and hypoxic zones from
different years in these papers actually extend to include the southern
waters off Hong Kong.
Reply 3: These papers have the following observations.
Su et al. (2017, Biogeoscience) show that in Fig. 3, bottom water
hypoxia during Leg 1 was located more centrally in the study area. This
area is only represented by one station.
Fig. 3 Bottom water distribution of DO during Leg 1.
Qian et al. (2018, ECSS) used 90 umol/kg in Fig. 4, which is 2.88
mg/L as the hypoxia criterion. We used 2 mg/L, 62.5 umol/kg.
Fig. 4. The dashed line is 90 umol/kg.
Similarly, the same hypoxia value of 90 umol/kg is used in Fig. 5,
where a large area of hypoxia south of Hong Kong was estimated during
August 2010. This area is only represented by one station A11 based on

their cruise map in Fig. 1. In addition, Fig. 3 shows that lower DO<3 mg/L
is only limited to the bottom 2 m, perhaps. The large area in Fig. 5 was
estimated, not observed.
Fig. 5 The estimated DO-deficient zone (<90 umol/kg) at the bottom of the PRE
during the August 2010 cruise.
Lu et al. (2018, JGR-Oceans) reported a relatively large area of
hypoxia in the Pearl River estuarine plume, but it is south of Macau (Fig.
6). Again if 2 mg/L of DO is used, the area is only one site.
Fig. 6 bottom DO in July 2015.

Zhao et al. (2020, L&O) show localized hypoxia (2 mg/L) in Fig. 3
and Fig. 4.
Fig. 3. DO along the estuary transect in July 2017.
Fig. 4. Bottom DO distribution in July 2017.
Li et al. (2020, JGR-Oceans) used 10 cruises during 2014-2018 to
simulate the DO spatial distribution based on the model. The model result
dose not show any large area of hypoxia in the southern waters of Hong
Kong (Fig. 6). In addition, frequency of hypoxic occurrences was 30% in
the eastern center, which is only 3 times of 10 cruises and their locations
varied.

Fig. 6 h) Minimum bottom dissolved oxygen (DO) (mg/L) from model results
averaged over a spring‐neap tidal cycle from 2014 to 2018.
Findings in these papers are not in conflict with ours and rather
strengthen our findings that hypoxia occurrences vary in time and space,
but hypoxia has not been developed into a seasonal phenomenon over
coastal scale in Hong Kong.
2.2. Qian et al. (2018) has presented the same oxygen dataset from station
SM18 as in this study and they revealed a significantly declining trend in
the bottom DO annual minimum values from 1990 to 2014. I’m not sure
why in this study the “bottom DO does not show a significantly decreasing
trend” (Line 29-30). Have you conducted trend analysis of the bottom
minimum DO for the 3 stations to support your statement?
Reply 4: We conducted the trend analysis of monthly bottom DO
during 29 years and found the decreasing trend was not significant. Qian

et al. used annual minimum bottom DO saturation% and the time series is
only up to 2014, 4 years shorter than ours. This could cause the difference
you brought up as we used the entire monthly time series during 1990-2018.
Fig. 6 The trend from 1990 to 2014 of annual minimum DO saturation in the
bottom layer at Station SM18.
2.3. If the authors aimed to apply the hypothesis tested here to the entire
Hong Kong waters and further to the PRE, I think the analysis based on 3
stations is not sufficient and analyzing the time-series bottom DO at more
monitoring stations (which are all available) is required. Otherwise, please
state explicitly that the conclusions only apply to a limited water area on
the south off Hong Kong. But this will apparently reduce the significance
and implications of this study.
Reply 5: We have added Fig. S2 to show that hypoxia in other areas
of Hong Kong does not occur frequently except for Tolo Harbour.
We will consider to analyse time series of bottom DO at more
monitoring stations in Hong Kong waters (Fig. S3).
2.4. The validity of the analysis based on 3 stations is further limited by the
fact that the time series of DO is monthly. The hypoxia could be transient
in this very dynamic estuarine system that monthly survey data at three
stations may have missed the hypoxic events.
Reply 6: Our data show that a hypoxic event rarely occurs at one
station in two consecutive months, and hardly occurs across the 3 stations
in the same month. That is why we stated that hypoxic events in the region
are episodic since monthly monitoring can not miss them if an event lasts
for longer than 1 month.
3. This manuscript suggests that frequency of strong-wind events can be
used to explain: i) why hypoxia events only occasionally occurred at the 3
stations; ii) why August has comparably higher occurrences of hypoxia
events; and iii) why hypoxia events increased in recent years. Can wind
speed explain all? I think contribution of other factors to the observed
hypoxia characteristics in this region could not be excluded and to what
extent they affect your “wind-centering” hypothesis should be discussed.
Reply 7: Other factors such as tides and freshwater discharge also
contributed to the observed hypoxia in this region. However, the objective
of this study was to testify the wind hypothesis and figure out whether it
played a role in preventing the formation of hypoxia. To simplify the
discussion, we focused on wind interruptive effects in this study instead of

discussing the relative importance of these factors versus wind effects. The
interruptive effects of wind events on the hypoxic water masses have been
demonstrated in quite a few studies in great details, which strengthens our
finding that the wind events play a dominant role when they occur.
3.1. Regarding i): Earlier studies have suggested that PRE is not prone to
develop seasonal hypoxia despite of high riverine nutrient input (e.g.,
review by Harrison et al. 2008). An important reason attributed to is the
shallow water depth of PRE (5~20m), which enables the wind mixing an
effective way to replenish the bottom water. This point has rarely been
stressed in the manuscript but very important to distinguish PRE from other
hypoxic systems such as Northern Gulf of Mexico and Baltic Sea that
authors cited.
Reply 8: Agreed. In line 270-271, we stressed that the shallow water
depth of PRE, such as 12 m at SM17, enabled the wind mixing an effective
way to raise the bottom DO. This point should be further stressed when
comparing the hypoxia characteristics between PRE and other hypoxic
systems.
3.2. Regarding i): Apart from wind, tide is another important agent to
induce strong mixing in PRE. There are modelling studies that showed
tides greatly enhance vertical mixing and the replenishment of bottom DO

(e.g., Huang et al. 2019). I noticed that authors have mentioned impact of
tide on hypoxia. But the descriptions are in a general sense and not
specifically linking to the PRE or discuss in the context of how it will affect
your hypothesis.
Reply 9: The objective of this study was to testify the wind hypothesis
and to simplify the discussion, we focused on wind interruptive effects in
this study instead of discussing the relative importance of tides versus wind
effects. Nevertheless, we added the study by Li et al. (2020), which shows
the tidal effects in their modeling study in the discussion.
3.3. Regarding ii): The statement is based on the finding that hypoxic
events occurred more often in August (4 times) than June and July (2 times)
in 29 years, coincide with the less frequent strong-wind events (> 6m/s) in
August than June and July. First, I would ask if this is also true for other
stations in Hong Kong waters. Second, I wonder if factors other than wind
also play a role in making August more prone to develop hypoxia, such as
water temperature, river discharge and wind direction. E.g., August is
warmer than June and July and thus enhance water column stratification,
reduce oxygen solubility, and/or accelerate the remineralization rate of
organic matter in bottom water. River discharge has high temporal
variability. Does the region receive more riverine inputs in August than
other months? Wind direction can affect the eastward plume extension. Is

it possible that August has higher frequency of southwesterly (upwelling-
favorable) wind that enables more eastward-directed plume propagation to
affect the southern water of Hong Kong? These factors have to be
considered before attributing wind speed as the cause of the different
occurrences of hypoxia events between August and other months.
Reply 10: Yes, we agree with you. August is most prone to the
formation of hypoxia since all other factors such as water temperature and
river discharge as well as wind direction are all in favour. It is the wind
events that interrupts the formation of hypoxia, which is our point.
3.4. Regarding iii): Again, the increased hypoxic events in recent years
could be attributed to factors other than wind speed and they should be
discussed. These factors include riverine nutrients (which have been
continuously increasing in the past decades), river discharge, warming etc.
Please check Niu et al. (2020) on the trend of anthropogenic forcing. In
addition, the monitoring program consists of the long time series data of
nutrients and chl data that could also help to look into the contribution of
these factors.
Reply 11: The background of our study is based on the fact that
hypoxia should have been formed as a seasonal phenomenon over the
coastal wide scale considering all the favourable conditions including
anthropogenic forcings by Niu et al. (2020), but it has not. We emphasized

the wind events.
4. The Discussion section needs improvement. It currently lacks a clear
clue and often jumps from one focus to the other. E.g., Line 199-201 the
concept of “ecosystem buffering capacity” comes a bit awkward in this
first paragraph discussing the results/analysis of wind impact on hypoxia.
Lines 206-230 provides very general descriptions on physical and
biogeochemical processes affecting hypoxia formation that read like a
textbook. Such information should have been given in the Introduction
already. In a section under the name “The interruptive role of wind events
on hypoxia formation”, you have mixed descriptions on the impact of
freshwater, tide, wind, freshwater again, and wind.
Reply 12: Thanks for your advice. We have made revisions based on
your comments and improved the discussion section.
Minor comments
Title: depends on how you are going to address the comments above, I’m
not sure whether you can broadly say “coastal hypoxia”. Currently it’s only
the 3 stations in the southern waters of Hong Kong.
Reply 13: The context of coastal hypoxia used here is a general term,
not specific. Now we have added Fig. S2 and we can say Hong Kong
coastal waters.

L25: should explicitly state that the time series of DO is monthly data.
Reply 14: Yes, the statement should be revised as follows. We used
29 years time series data of monthly dissolved oxygen (DO) and daily
winds in the Hong Kong coastal waters to test the hypothesis.
L28-30: “Episodic hypoxia events appear to occur more frequently in
recent years” – is this statement based on the recent papers reporting larger
low-DO or hypoxic zones? “but bottom DO does not show a significantly
decreasing trend” – See my earlier comment. Did you conduct trend
analysis? I’m asking as this sentence is not clear in terms what is based on
others’ observations or views and what is based on the analysis in this work.
Reply 15: “Episodic hypoxia events appear to occur more frequently
in recent years”-this statement is based on the time series data which show
more hypoxic events since 2008. “but bottom DO does not show a
significantly decreasing trend” is based on the trend analysis of monthly
DO in this study.
L30: the applicability of the wind speed threshold ‘6 m/s’ should be
discussed in the manuscript as this value is based on the analysis at 3
stations in Hong Kong waters that are relatively shallow and have strong
tidal mixing. In other system with different water depths and/or strength of

tidal forcing, this value might not fit.
Reply 16: As these 3 stations are wide open, the wind effects are
probably the strongest among other sheltered or semi-enclosed bays. This
threshold of 6 m/s may not necessarily be applied to other sheltered waters,
but it should be generally applicable to other open waters as the wind-
induced mixing is subject to the relevant physical laws.
L46: a bit redundant to say ‘20% in dry season’ and ‘80% in wet season’.
Suggest deleting the former and add the months you referred to as ‘wet
season’ in bracket.
Reply 17: The statement should be modified as follows. The annual
average river discharge is 10,524 m3s-1 with 80% occurring during the wet
season (June, July, August and September).
L49-50: tide should not be neglected.
Reply 18: Yes, tide is one of the factors determining the dynamics of
the Pearl River estuarine coastal waters.
L51-57: Be careful of the difference of PRE from other river-dominated
hypoxic systems. PRE is shallower that is naturally less prone to hypoxia
formation.
Reply 19: Yes, compared to other river-dominated hypoxic systems,
the shallower water depth of PRE makes the vertical mixing of wind more
effective and thus improving the bottom oxygen condition. We should
further stress this point in discussion section.
L57-61: See my earlier comment. This statement is not accurate.
Reply 20: Please see my early reply 3.
L70: Want et al. 2015 is not about PRE.
Reply 21: Thanks for your correction. Wang et al. 2015 is not about
PRE but Merrimack River mouth. This sentence should be revised as
follows. Previous studies found that wind-driven vertical mixing
accelerates the ventilation of water column and increases oxygen
replenishment in the bottom layer in the Pearl River estuarine coastal
waters (Zhou et al. 2012) and other regions (Wang et al. 2015; Wilson et al.
2008; Scully 2010, 2013).
L85-86: See my earlier comment. You might be able to come up with a
wind speed threshold that works for the 3 stations. But I’m not sure its
applicability for other regions.
Reply 22: As these 3 stations are wide open, the wind effects are
probably the strongest among other sheltered or semi-enclosed bays. This
threshold of 6 m/s may not necessarily be applied to other sheltered waters,
but it should be generally applicable to other open waters as the wind-
induced mixing effects are from the relevant physical laws.
L99-101: Do you have evidence or reference to show that SM18 can be
affected by the sewage effluents from Stonecutter Island Works in the north
during summer? Under the prevailing southeasterly wind in summer, the
current direction in Lamma Channel is most likely northward directed.
Reply 23: We have added a reference by EPD 2017 as their summary
table shows higher concentrations of total inorganic nitrogen at SM6-SM7-
SM9 in the Lamma Channel than SM18. Li et al. (2020) simulated
horizontal distribution of depth-averaged velocity in the PRE and northern
South China Sea. The figure shows the current direction in Lamma
Channel is dominated by southward flow which means SM18 could be
affected by the sewage effluents from the north during summer.

Table S1 Summary of water quality statistics for the Southern WCZ in 2017
(EPD report, 2017).
L127: insert ‘in bottom layer’ after AOU.
Reply 24: Thanks for your advice.
L148-150: Not true. V7 does not have significant correlation with the
surface-bottom density difference in Table 2. Interestingly, among the 4
variables (DO, AOU, delta DO, density difference), density difference has
the least significant correlations with wind speeds (Table 2). Shouldn’t the
impact of wind speed be most directly reflected in density difference?
Reply 25: Yes, we should revise the statement. The correlation
between surface-bottom density difference and V7 is not significant mainly
because water column stratification is synthetically determined by many
physical factors such as tides and river discharge, not just wind speed. In
addition, V7 may not necessarily be the best forceful period.
L154: ‘density difference is close to 0’ – this statement doesn’t seem true.
None is close to 0 in June, and only 2/3 in July and 1/4 in August are close
to 0 (Figure 5).
Reply 26: This statement should be revised as follows. When the
wind speed is higher than 8 m/s, △σ is relatively low and 2/3 in July, 1/4
in August and 7/10 in September are close to 0.
L255-256: Can you give a bit more explanations on why it takes longer for
oxygen depletion to hypoxia in bottled bottom water?
Reply 27: The main reason is that the organic matter concentration is
lower in the bottom than in surface waters. We conducted dark incubation
experiments on board the ship in August 2016 and found the DO
concentration in bottled bottom waters just decreased slightly during 7-day
incubation and rarely dropped to hypoxic level (Yao, thesis).
L264: Insert ‘from Pearl River’ after large nutrient inputs?

Reply 28: Thanks for your correction.
L269: See my earlier comment. Please provide evidence that the sewage
effluent could affect SM18.
Reply 29: Please see reply 23.
L271-272: The two factors you stated have contrasting impact on hypoxia
formation. “least influenced by estuarine plume and sewage effluent”
means it’s less prone to develop hypoxia, while “deepest depth” means
wind mixing is less effective and thus favors hypoxia formation.
Reply 30: SM19 is least influenced by the estuarine plume and
sewage effluent, which means hypoxia events would be less frequent. On
the other hand, its deeper water depth makes wind mixing less interruptive
to the hypoxia formation. However, as the stratification at SM19 is weaker
than SM17 and SM18 with less estuarine plume, the same wind speed may
exert more wind mixing at SM19 than at SM18. This can cause the low
occurrence of hypoxia at SM19.
L299-300: Any reference to support this statement?
Reply 31: We should cite more papers to support this statement as
follows. Climate change can induce alterations in wind patterns and storm
regimes such as the timing, frequency and intensity of winds, thus
modifying hypoxic conditions by affecting the water column stratification,
especially in lower latitudes where hurricanes and typhoons are common
(Altieri et al., 2014; Conley et al., 2007; Meier et al., 2011; Rabalais et al.,
2009).
L316-321: These sentences all belong to Introduction rather than
“Conclusions”.
Reply 32: Thanks for your advice. We should further improve the
statement in conclusion section.