report 2014 - groupe sni · sni group - financial report 2014 2 group overview stability of owned...
TRANSCRIPT
FINANCIAL REPORT 2014
GROUP OVERVIEW CONSOLIDATED DIVISION ESH DIVISION
2SNI GROUP - FINANCIAL REPORT 2014
GROUP OVERVIEW
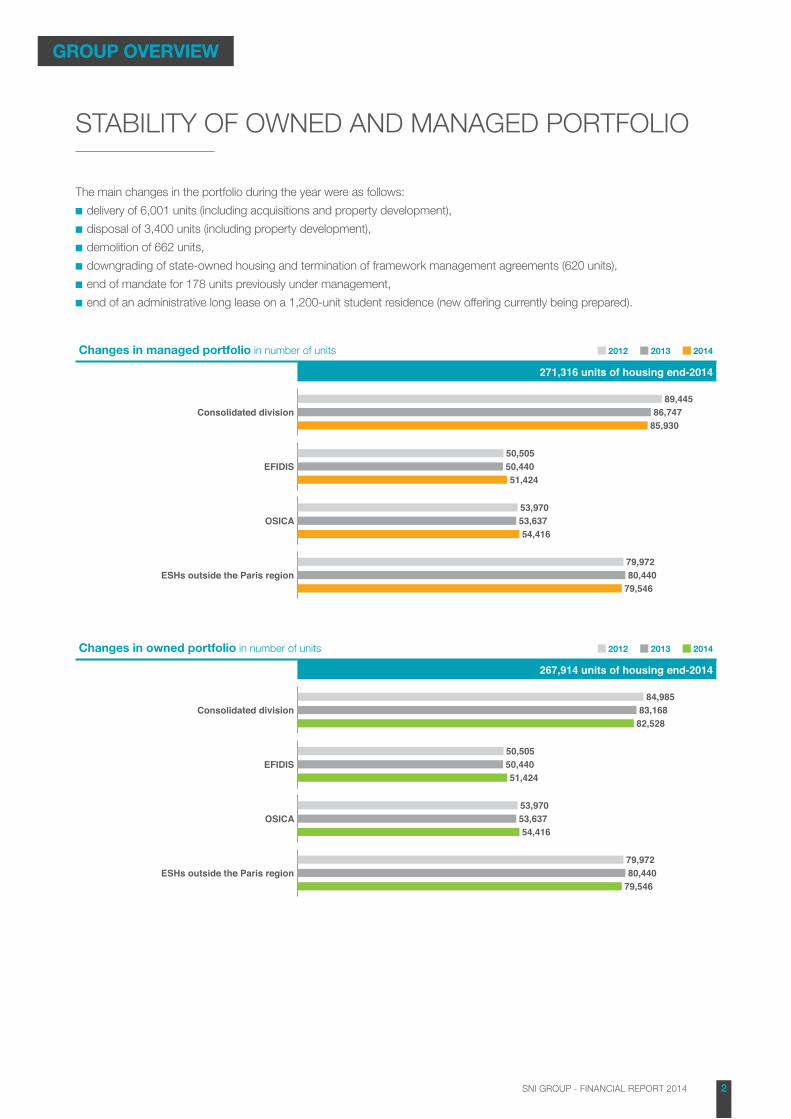
STABILITY OF OWNED AND MANAGED PORTFOLIO
The main changes in the portfolio during the year were as follows:
■■ delivery of 6,001 units (including acquisitions and property development),
■■ disposal of 3,400 units (including property development),
■■ demolition of 662 units,
■■ downgrading of state-owned housing and termination of framework management agreements (620 units),
■■ end of mandate for 178 units previously under management,
■■ end of an administrative long lease on a 1,200-unit student residence (new offering currently being prepared).
Changes in managed portfolio in number of units 2012 2013 2014
271,316 units of housing end-2014
Consolidated division■89,445
■86,747■85,930
EFIDIS■50,505■50,440■51,424
OSICA■53,970■53,637■54,416
ESHs outside the Paris region■79,972■80,440■79,546
Changes in owned portfolio in number of units 2012 2013 2014
267,914 units of housing end-2014
Consolidated division■84,985
■83,168■82,528
EFIDIS■50,505■50,440■51,424
OSICA■53,970■53,637■54,416
ESHs outside the Paris region■79,972■80,440■79,546
3SNI GROUP - FINANCIAL REPORT 2014
GROUP OVERVIEW
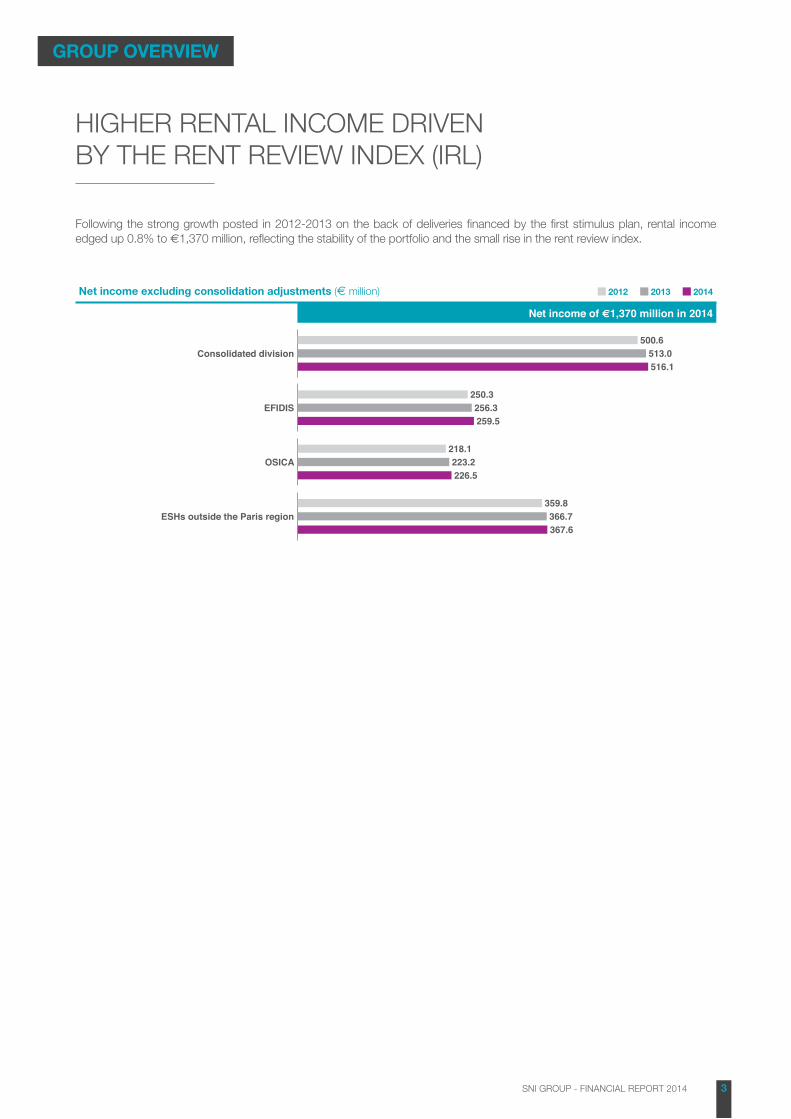
HIGHER RENTAL INCOME DRIVEN BY THE RENT REVIEW INDEX (IRL)
Following the strong growth posted in 2012-2013 on the back of deliveries financed by the first stimulus plan, rental income edged up 0.8% to €1,370 million, reflecting the stability of the portfolio and the small rise in the rent review index.
Net income excluding consolidation adjustments (€ million) 2012 2013 2014
Net income of €1,370 million in 2014
Consolidated division■500.6■513.0■516.1
EFIDIS■250.3■256.3■259.5
OSICA■218.1■223.2■226.5
ESHs outside the Paris region■359.8■366.7■367.6
4SNI GROUP - FINANCIAL REPORT 2014
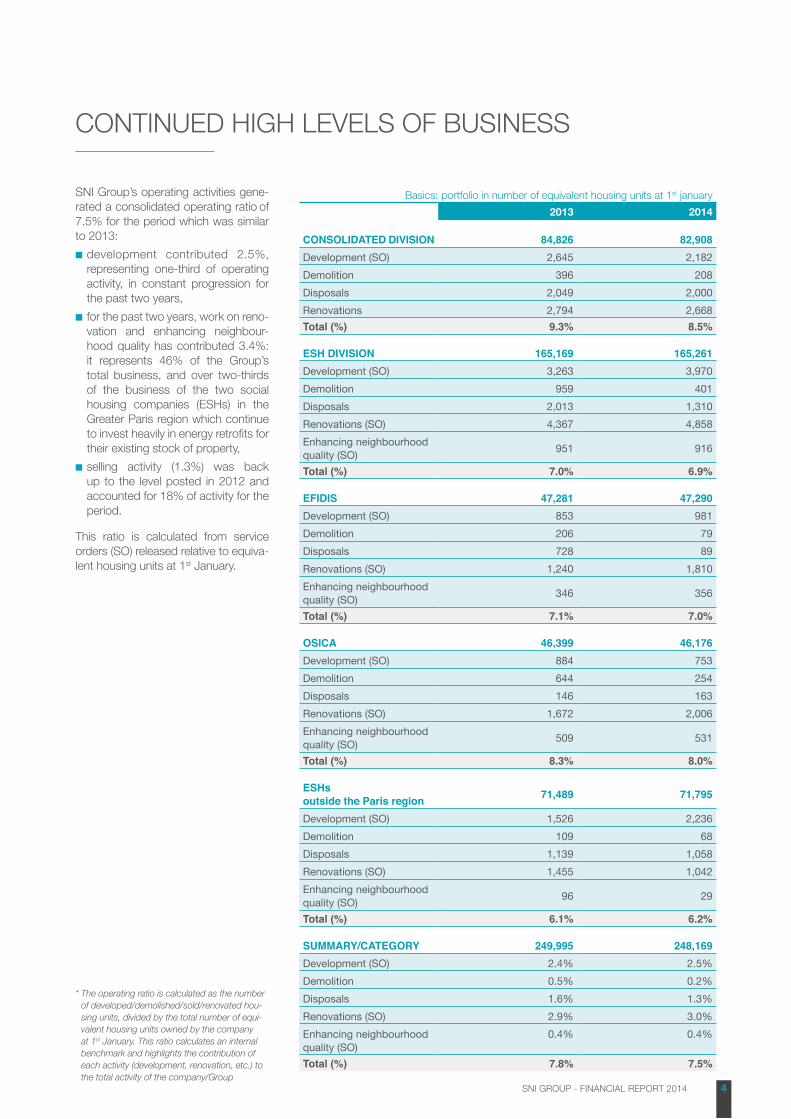
CONTINUED HIGH LEVELS OF BUSINESS
SNI Group’s operating activities gene-rated a consolidated operating ratio of 7.5% for the period which was similar to 2013:
■■ development contributed 2.5%, representing one-third of operating activity, in constant progression for the past two years,
■■ for the past two years, work on reno-vation and enhancing neighbour-hood quality has contributed 3.4%: it represents 46% of the Group’s total business, and over two-thirds of the business of the two social housing companies (ESHs) in the Greater Paris region which continue to invest heavily in energy retrofits for their existing stock of property,
■■ selling activity (1.3%) was back up to the level posted in 2012 and accounted for 18% of activity for the period.
This ratio is calculated from service orders (SO) released relative to equiva-lent housing units at 1st January.
Basics: portfolio in number of equivalent housing units at 1st january
2013 2014
CONSOLIDATED DIVISION 84,826 82,908Development (SO) 2,645 2,182Demolition 396 208Disposals 2,049 2,000Renovations 2,794 2,668Total (%) 9.3% 8.5%
ESH DIVISION 165,169 165,261Development (SO) 3,263 3,970Demolition 959 401Disposals 2,013 1,310Renovations (SO) 4,367 4,858Enhancing neighbourhood quality (SO) 951 916
Total (%) 7.0% 6.9%
EFIDIS 47,281 47,290Development (SO) 853 981Demolition 206 79Disposals 728 89Renovations (SO) 1,240 1,810Enhancing neighbourhood quality (SO) 346 356
Total (%) 7.1% 7.0%
OSICA 46,399 46,176Development (SO) 884 753Demolition 644 254Disposals 146 163Renovations (SO) 1,672 2,006Enhancing neighbourhood quality (SO) 509 531
Total (%) 8.3% 8.0%
ESHs outside the Paris region 71,489 71,795
Development (SO) 1,526 2,236Demolition 109 68Disposals 1,139 1,058Renovations (SO) 1,455 1,042Enhancing neighbourhood quality (SO) 96 29
Total (%) 6.1% 6.2%
SUMMARY/CATEGORY 249,995 248,169Development (SO) 2.4% 2.5%Demolition 0.5% 0.2%Disposals 1.6% 1.3%Renovations (SO) 2.9% 3.0%Enhancing neighbourhood quality (SO)
0.4% 0.4%
Total (%) 7.8% 7.5%
* The operating ratio is calculated as the number of developed/demolished/sold/renovated hou-sing units, divided by the total number of equi-valent housing units owned by the company at 1st January. This ratio calculates an internal benchmark and highlights the contribution of each activity (development, renovation, etc.) to the total activity of the company/Group
5SNI GROUP - FINANCIAL REPORT 2014
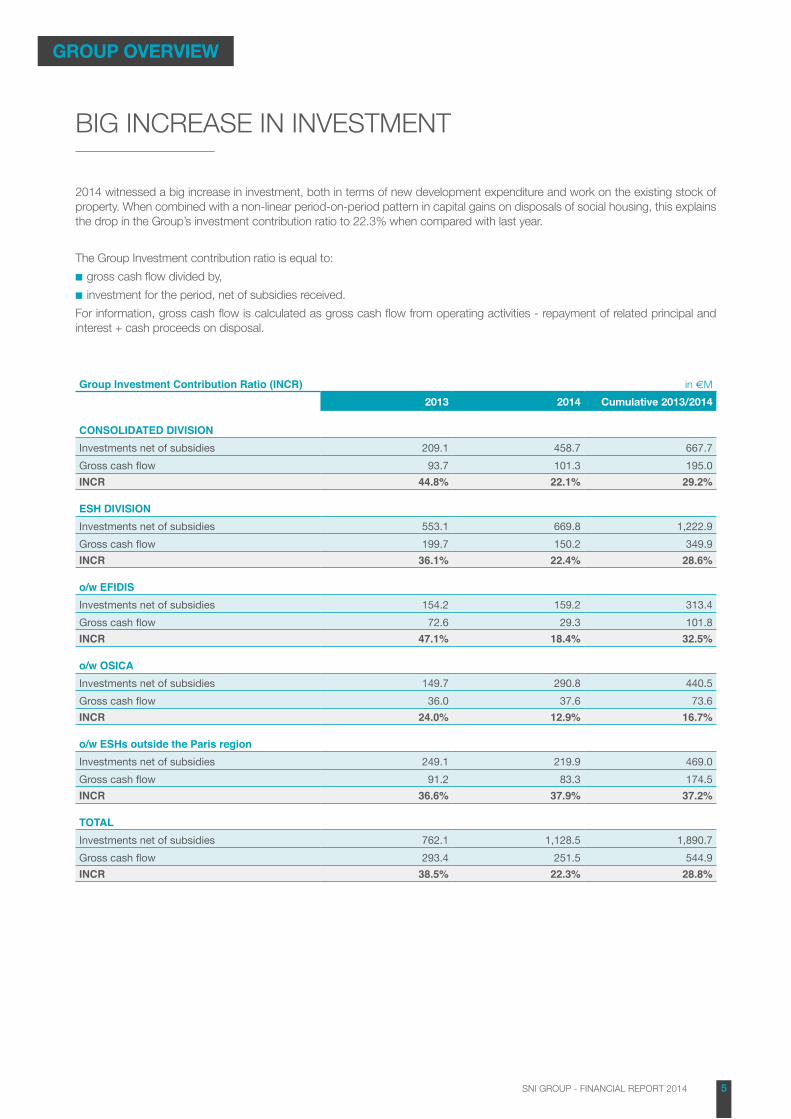
BIG INCREASE IN INVESTMENT
2014 witnessed a big increase in investment, both in terms of new development expenditure and work on the existing stock of property. When combined with a non-linear period-on-period pattern in capital gains on disposals of social housing, this explains the drop in the Group’s investment contribution ratio to 22.3% when compared with last year.
The Group Investment contribution ratio is equal to:
■■ gross cash flow divided by,
■■ investment for the period, net of subsidies received.
For information, gross cash flow is calculated as gross cash flow from operating activities - repayment of related principal and interest + cash proceeds on disposal.
Group Investment Contribution Ratio (INCR) in €M
2013 2014 Cumulative 2013/2014
CONSOLIDATED DIVISIONInvestments net of subsidies 209.1 458.7 667.7Gross cash flow 93.7 101.3 195.0INCR 44.8% 22.1% 29.2%
ESH DIVISIONInvestments net of subsidies 553.1 669.8 1,222.9Gross cash flow 199.7 150.2 349.9INCR 36.1% 22.4% 28.6%
o/w EFIDISInvestments net of subsidies 154.2 159.2 313.4Gross cash flow 72.6 29.3 101.8INCR 47.1% 18.4% 32.5%
o/w OSICAInvestments net of subsidies 149.7 290.8 440.5Gross cash flow 36.0 37.6 73.6INCR 24.0% 12.9% 16.7%
o/w ESHs outside the Paris regionInvestments net of subsidies 249.1 219.9 469.0Gross cash flow 91.2 83.3 174.5INCR 36.6% 37.9% 37.2%
TOTALInvestments net of subsidies 762.1 1,128.5 1,890.7Gross cash flow 293.4 251.5 544.9INCR 38.5% 22.3% 28.8%
GROUP OVERVIEW
6SNI GROUP - FINANCIAL REPORT 2014
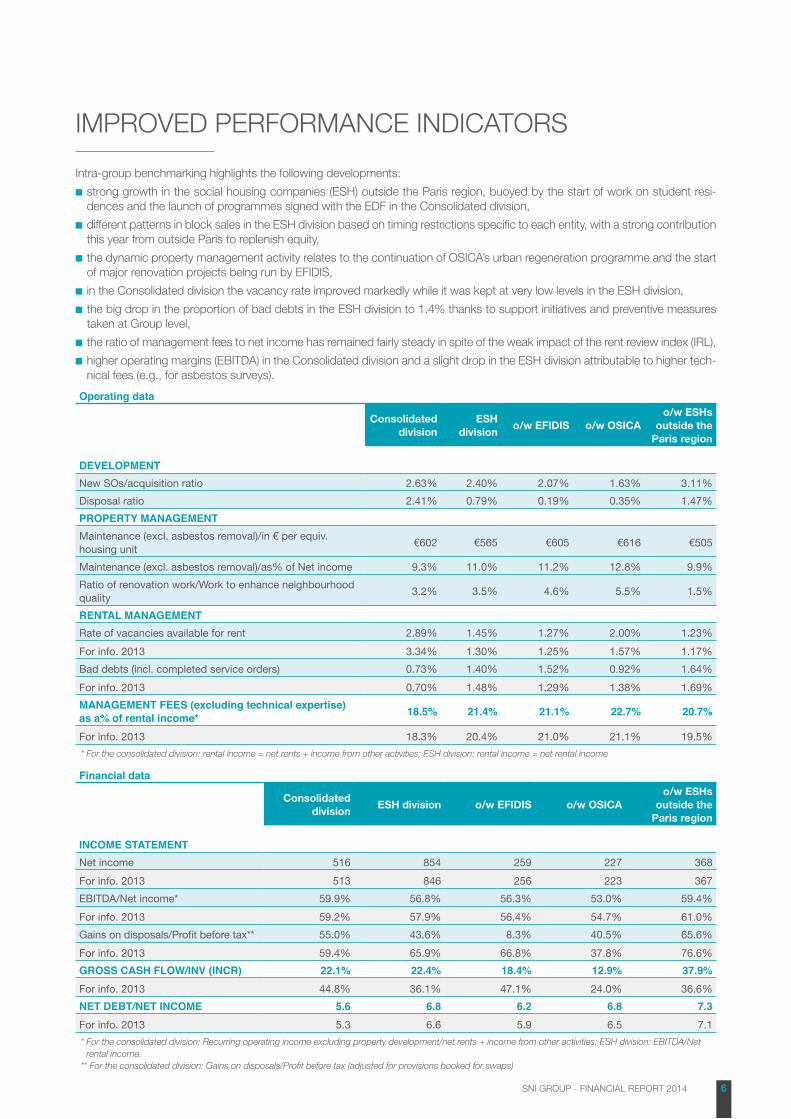
IMPROVED PERFORMANCE INDICATORS
Intra-group benchmarking highlights the following developments:
■■ strong growth in the social housing companies (ESH) outside the Paris region, buoyed by the start of work on student resi-dences and the launch of programmes signed with the EDF in the Consolidated division,
■■ different patterns in block sales in the ESH division based on timing restrictions specific to each entity, with a strong contribution this year from outside Paris to replenish equity,
■■ the dynamic property management activity relates to the continuation of OSICA’s urban regeneration programme and the start of major renovation projects being run by EFIDIS,
■■ in the Consolidated division the vacancy rate improved markedly while it was kept at very low levels in the ESH division,
■■ the big drop in the proportion of bad debts in the ESH division to 1.4% thanks to support initiatives and preventive measures taken at Group level,
■■ the ratio of management fees to net income has remained fairly steady in spite of the weak impact of the rent review index (IRL),
■■ higher operating margins (EBITDA) in the Consolidated division and a slight drop in the ESH division attributable to higher tech-nical fees (e.g., for asbestos surveys).
Operating data
Consolidated division
ESH division
o/w EFIDIS o/w OSICAo/w ESHs
outside the Paris region
DEVELOPMENTNew SOs/acquisition ratio 2.63% 2.40% 2.07% 1.63% 3.11%Disposal ratio 2.41% 0.79% 0.19% 0.35% 1.47%PROPERTY MANAGEMENTMaintenance (excl. asbestos removal)/in € per equiv. housing unit €602 €565 €605 €616 €505
Maintenance (excl. asbestos removal)/as% of Net income 9.3% 11.0% 11.2% 12.8% 9.9%Ratio of renovation work/Work to enhance neighbourhood quality 3.2% 3.5% 4.6% 5.5% 1.5%
RENTAL MANAGEMENTRate of vacancies available for rent 2.89% 1.45% 1.27% 2.00% 1.23%For info. 2013 3.34% 1.30% 1.25% 1.57% 1.17%Bad debts (incl. completed service orders) 0.73% 1.40% 1.52% 0.92% 1.64%For info. 2013 0.70% 1.48% 1.29% 1.38% 1.69%MANAGEMENT FEES (excluding technical expertise) as a% of rental income* 18.5% 21.4% 21.1% 22.7% 20.7%
For info. 2013 18.3% 20.4% 21.0% 21.1% 19.5%* For the consolidated division: rental income = net rents + income from other activities; ESH division: rental income = net rental income
Financial data
Consolidated division
ESH division o/w EFIDIS o/w OSICAo/w ESHs
outside the Paris region
INCOME STATEMENTNet income 516 854 259 227 368For info. 2013 513 846 256 223 367EBITDA/Net income* 59.9% 56.8% 56.3% 53.0% 59.4%For info. 2013 59.2% 57.9% 56.4% 54.7% 61.0%Gains on disposals/Profit before tax** 55.0% 43.6% 8.3% 40.5% 65.6%For info. 2013 59.4% 65.9% 66.8% 37.8% 76.6%GROSS CASH FLOW/INV (INCR) 22.1% 22.4% 18.4% 12.9% 37.9%For info. 2013 44.8% 36.1% 47.1% 24.0% 36.6%NET DEBT/NET INCOME 5.6 6.8 6.2 6.8 7.3For info. 2013 5.3 6.6 5.9 6.5 7.1* For the consolidated division: Recurring operating income excluding property development/net rents + income from other activities; ESH division: EBITDA/Net
rental income. ** For the consolidated division: Gains on disposals/Profit before tax (adjusted for provisions booked for swaps)
7SNI GROUP - FINANCIAL REPORT 2014
The highlight of 2014 was the creation of the intermediate housing investment fund, Fonds de Logement Intermédiaire (FLI), in which the SNI Group has a 33.29% stake, and AMPERE Gestion, a wholly-owned subsidiary of SNI created in March 2014. In July 2014, AMPERE Gestion obtained accreditation from the French financial market authority (AMF) to act as a portfolio management company and to manage the service agreement entrusted to it by FLI.
SNI also continued to pursue its disinvestment from the commercial property sector by selling the property concession agreement granted by the City of Paris to RIVP.
SNI’s scope of consolidation now includes the following entities:
■■ SNI, Sainte-Barbe, S2AI, Caserts and AMPERE Gestion, all of which are fully consolidated,
■■ Adoma (42.74% stake) and FLI (33.29% stake), consolidated using the equity method.
This scope of consolidation is itself consolidated in the books of Caisse des Dépôts. SNI’s Fitch rating applies to this same group of consolidated entities.
Consolidated profit for 2014 came in at €113.7 million, in line with a budge-ted figure of €112 million, compared to consolidated profit of €139.7 million for 2013.
If fair value adjustments to derivatives are excluded, profit was identical to last year at €130 million.
Selling off the property concession agreement granted by the City of Paris had a neutral impact on consolidated profit as the related earnings were transferred to the City, while the impact in the balance sheet was a €48.5 million reduction in real property and the transfer of borrowings totalling €41 million.
Net income (rental income + income from other activities) was stable at €503 million in spite of the €4.3 million drop in rental income following the Group’s withdrawal from its activities with the City of Paris, while operating expense fell by €3 million to €202 million. Management cost and maintenance ratios held up well, reflecting the tight rein kept on most items of expenditure.
The property development margin came in at €4.6 million following two years of major developments.
Recurring operating income was €306 million. Excluding property development, the recurring operating income margin was up to 59.9% in 2014 on the back of a fine operating performance.
Disposal gains accounted for 55% of pre-tax profit (€104 million).
In spite of its healthy statutory earnings, Adoma’s contribution to consolidated Group earnings fell from €16.4 million in 2013 to €8.7 million this year due to fair value adjustments taken on derivatives.
The creation of Fonds de Logement Intermédiaire (FLI) which is accounted for by the equity method in line with the Group’s 33% interest, generated set-up costs of €1 million for the period.
Net depreciation of property and equipment rose to €132 million due to major deli-veries of new housing (framework agreement with EDF) and impacted EBIT which fell back to €285 million for the year.
Cost of gross debt was 6% lower in 2014 thanks to savings generated by cuts in interest rates during the year and renegotiation of the margin on certain loans. Income from cash and cash equivalents was stable year on year, however fair value adjustments to derivatives as a result of the collapse in long-term interest rates knocked €12.6 million off earnings (€8.1 million after tax).
CONSOLIDATED INCOME STATEMENT
CONSOLIDATED DIVISION
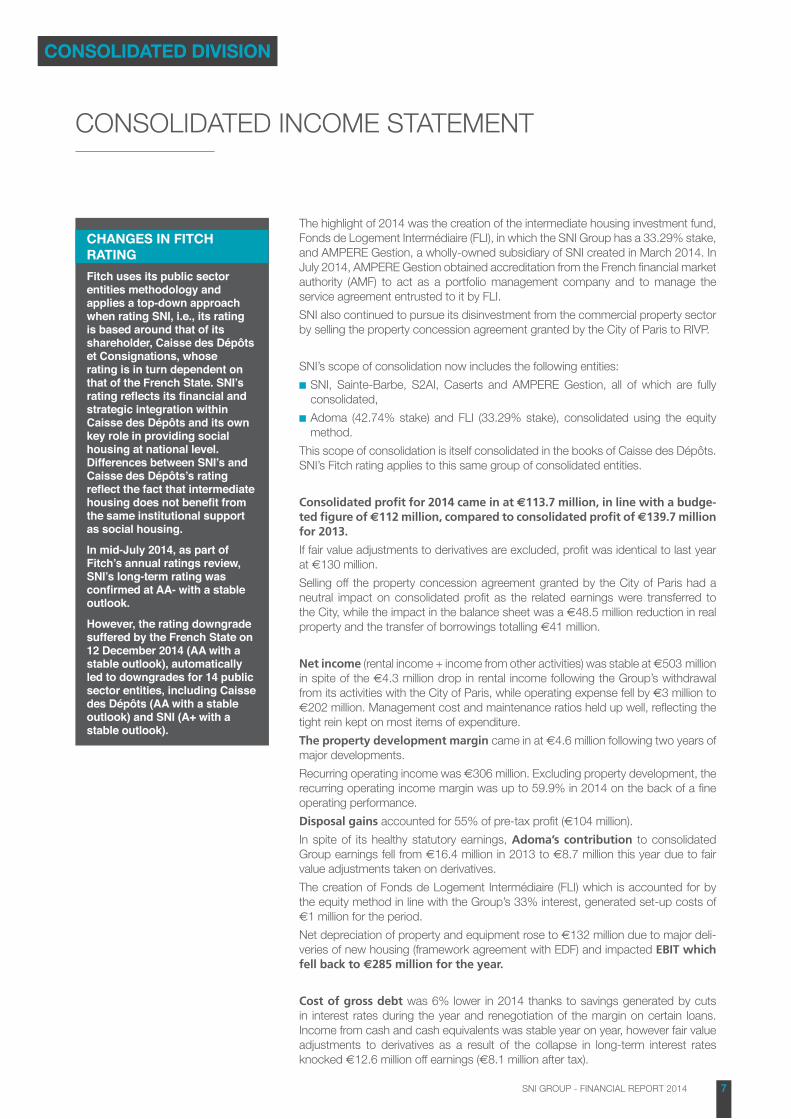
CHANGES IN FITCHRATING
Fitch uses its public sector entities methodology and applies a top-down approach when rating SNI, i.e., its rating is based around that of its shareholder, Caisse des Dépôts et Consignations, whose rating is in turn dependent on that of the French State. SNI’s rating reflects its financial and strategic integration within Caisse des Dépôts and its own key role in providing social housing at national level. Differences between SNI’s and Caisse des Dépôts’s rating reflect the fact that intermediate housing does not benefit from the same institutional support as social housing.
In mid-July 2014, as part of Fitch’s annual ratings review, SNI’s long-term rating was confirmed at AA- with a stable outlook.
However, the rating downgrade suffered by the French State on 12 December 2014 (AA with a stable outlook), automatically led to downgrades for 14 public sector entities, including Caisse des Dépôts (AA with a stable outlook) and SNI (A+ with a stable outlook).
8SNI GROUP - FINANCIAL REPORT 2014
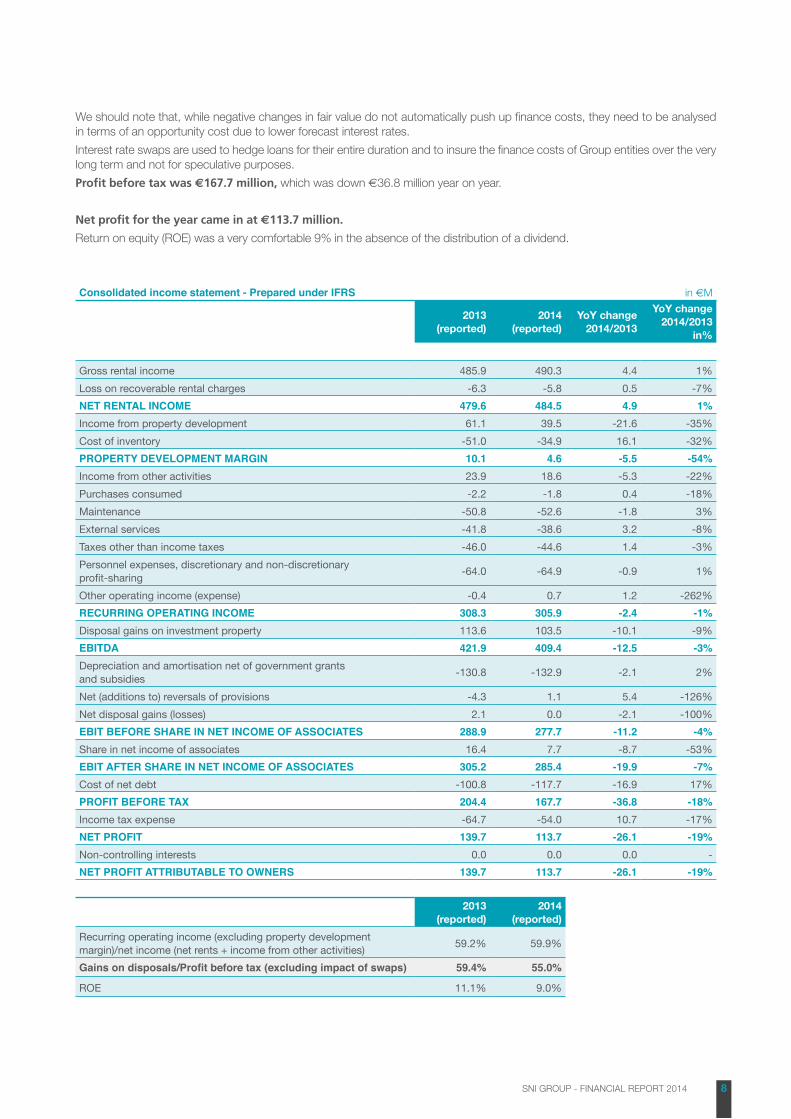
We should note that, while negative changes in fair value do not automatically push up finance costs, they need to be analysed in terms of an opportunity cost due to lower forecast interest rates.
Interest rate swaps are used to hedge loans for their entire duration and to insure the finance costs of Group entities over the very long term and not for speculative purposes.
Profit before tax was €167.7 million, which was down €36.8 million year on year.
Net profit for the year came in at €113.7 million.
Return on equity (ROE) was a very comfortable 9% in the absence of the distribution of a dividend.
Consolidated income statement - Prepared under IFRS in €M
2013(reported)
2014(reported)
YoY change 2014/2013
YoY change 2014/2013
in%
Gross rental income 485.9 490.3 4.4 1%Loss on recoverable rental charges -6.3 -5.8 0.5 -7%NET RENTAL INCOME 479.6 484.5 4.9 1%Income from property development 61.1 39.5 -21.6 -35%Cost of inventory -51.0 -34.9 16.1 -32%PROPERTY DEVELOPMENT MARGIN 10.1 4.6 -5.5 -54%Income from other activities 23.9 18.6 -5.3 -22%Purchases consumed -2.2 -1.8 0.4 -18%Maintenance -50.8 -52.6 -1.8 3%External services -41.8 -38.6 3.2 -8%Taxes other than income taxes -46.0 -44.6 1.4 -3%Personnel expenses, discretionary and non-discretionary profit-sharing -64.0 -64.9 -0.9 1%
Other operating income (expense) -0.4 0.7 1.2 -262%RECURRING OPERATING INCOME 308.3 305.9 -2.4 -1%Disposal gains on investment property 113.6 103.5 -10.1 -9%EBITDA 421.9 409.4 -12.5 -3%Depreciation and amortisation net of government grants and subsidies -130.8 -132.9 -2.1 2%
Net (additions to) reversals of provisions -4.3 1.1 5.4 -126%Net disposal gains (losses) 2.1 0.0 -2.1 -100%EBIT BEFORE SHARE IN NET INCOME OF ASSOCIATES 288.9 277.7 -11.2 -4%Share in net income of associates 16.4 7.7 -8.7 -53%EBIT AFTER SHARE IN NET INCOME OF ASSOCIATES 305.2 285.4 -19.9 -7%Cost of net debt -100.8 -117.7 -16.9 17%PROFIT BEFORE TAX 204.4 167.7 -36.8 -18%Income tax expense -64.7 -54.0 10.7 -17%NET PROFIT 139.7 113.7 -26.1 -19%Non-controlling interests 0.0 0.0 0.0 -NET PROFIT ATTRIBUTABLE TO OWNERS 139.7 113.7 -26.1 -19%
2013(reported)
2014(reported)
Recurring operating income (excluding property development margin)/net income (net rents + income from other activities) 59.2% 59.9%
Gains on disposals/Profit before tax (excluding impact of swaps) 59.4% 55.0%
ROE 11.1% 9.0%
9SNI GROUP - FINANCIAL REPORT 2014
In assetsNon-current assets grew by €562 million (11%) mainly due to:
■■ a €276 million increase in investment property. The value of new buildings placed in service exceeded disposals and depreciation expense for the period,
■■ the €5 million decrease in available-for-sale financial assets following the dis-posal of Exterimmo shares,
■■ the €5 million increase in investments in associates, reflecting the share in net assets of Adoma and FLI,
■■ the €236 million increase in other non-current financial assets with matching amounts in other financial liabilities, correspond mainly to fair value adjustments to derivatives in assets.
■■ a deferred tax asset has been recognised for an amount of €50 million.
Current assets dropped €34 million year on year, mainly reflecting €40 million that was taken out of the cash pooling arrangement for the social housing companies (ESHs) and invested directly.
In liabilities and equityEquity was €17 million (or 1%) lower at the end of 2014, reflecting the combined impact of profit for the year (positive €114 million), fair value adjustments to deriva-tives (negative €128 million) and actuarial losses on retirement benefits (negative €3 million).
Non current liabilities increased by 16% or €647 million in 2014, attributable to:
■■ the €225 million increase in non-current borrowings, reflecting new loans contracted in 2014,
■■ the €444 million increase in other non-current financial liabilities, of which €459 million comprised derivatives with negative fair values.
Current liabilities were €102 million or 13% lower year on year:
■■ current borrowings fell by €73 million (including subsidiary current account balances),
■■ other payables were also lower by an amount of €27 million.
CONSOLIDATED ASSETS GREW BY NEARLY E530 MILLION
OVERVIEW OF THEGROUP’S BORROWINGS
In 2014, SNI continued to seek out institutional investors and €390 million in new borrowings with an average maturity of 15 years were raised by means of private placements. The financing is secured once building operations begin. However, the actual increase in net borrowings was restricted to €193 million as high cash balances offset project pre-financing costs.
The gearing ratio (net debt/equity) remained relatively stable at 2.1: it edged down to 1.7 before fair value adjustments to derivatives.
The Loan to Value (LTV) ratio was also kept at 44% in spite of the sluggish property market.
CONSOLIDATED DIVISION
10SNI GROUP - FINANCIAL REPORT 2014
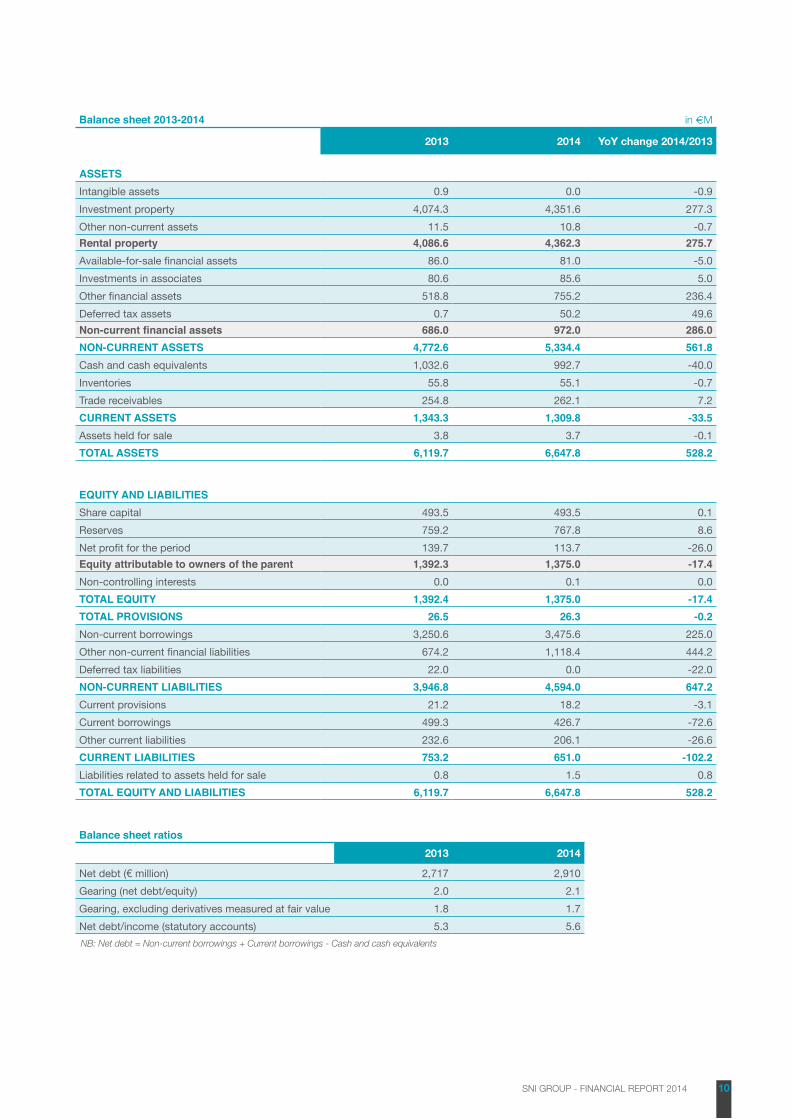
Balance sheet 2013-2014 in €M
2013 2014 YoY change 2014/2013
ASSETSIntangible assets 0.9 0.0 -0.9Investment property 4,074.3 4,351.6 277.3Other non-current assets 11.5 10.8 -0.7Rental property 4,086.6 4,362.3 275.7Available-for-sale financial assets 86.0 81.0 -5.0Investments in associates 80.6 85.6 5.0Other financial assets 518.8 755.2 236.4Deferred tax assets 0.7 50.2 49.6Non-current financial assets 686.0 972.0 286.0NON-CURRENT ASSETS 4,772.6 5,334.4 561.8Cash and cash equivalents 1,032.6 992.7 -40.0Inventories 55.8 55.1 -0.7Trade receivables 254.8 262.1 7.2CURRENT ASSETS 1,343.3 1,309.8 -33.5Assets held for sale 3.8 3.7 -0.1TOTAL ASSETS 6,119.7 6,647.8 528.2
EQUITY AND LIABILITIESShare capital 493.5 493.5 0.1Reserves 759.2 767.8 8.6Net profit for the period 139.7 113.7 -26.0Equity attributable to owners of the parent 1,392.3 1,375.0 -17.4Non-controlling interests 0.0 0.1 0.0TOTAL EQUITY 1,392.4 1,375.0 -17.4TOTAL PROVISIONS 26.5 26.3 -0.2Non-current borrowings 3,250.6 3,475.6 225.0Other non-current financial liabilities 674.2 1,118.4 444.2Deferred tax liabilities 22.0 0.0 -22.0NON-CURRENT LIABILITIES 3,946.8 4,594.0 647.2Current provisions 21.2 18.2 -3.1Current borrowings 499.3 426.7 -72.6Other current liabilities 232.6 206.1 -26.6CURRENT LIABILITIES 753.2 651.0 -102.2Liabilities related to assets held for sale 0.8 1.5 0.8TOTAL EQUITY AND LIABILITIES 6,119.7 6,647.8 528.2
Balance sheet ratios2013 2014
Net debt (€ million) 2,717 2,910Gearing (net debt/equity) 2.0 2.1Gearing, excluding derivatives measured at fair value 1.8 1.7Net debt/income (statutory accounts) 5.3 5.6NB: Net debt = Non-current borrowings + Current borrowings - Cash and cash equivalents
11SNI GROUP - FINANCIAL REPORT 2014
FINANCING THE ACTIVITY
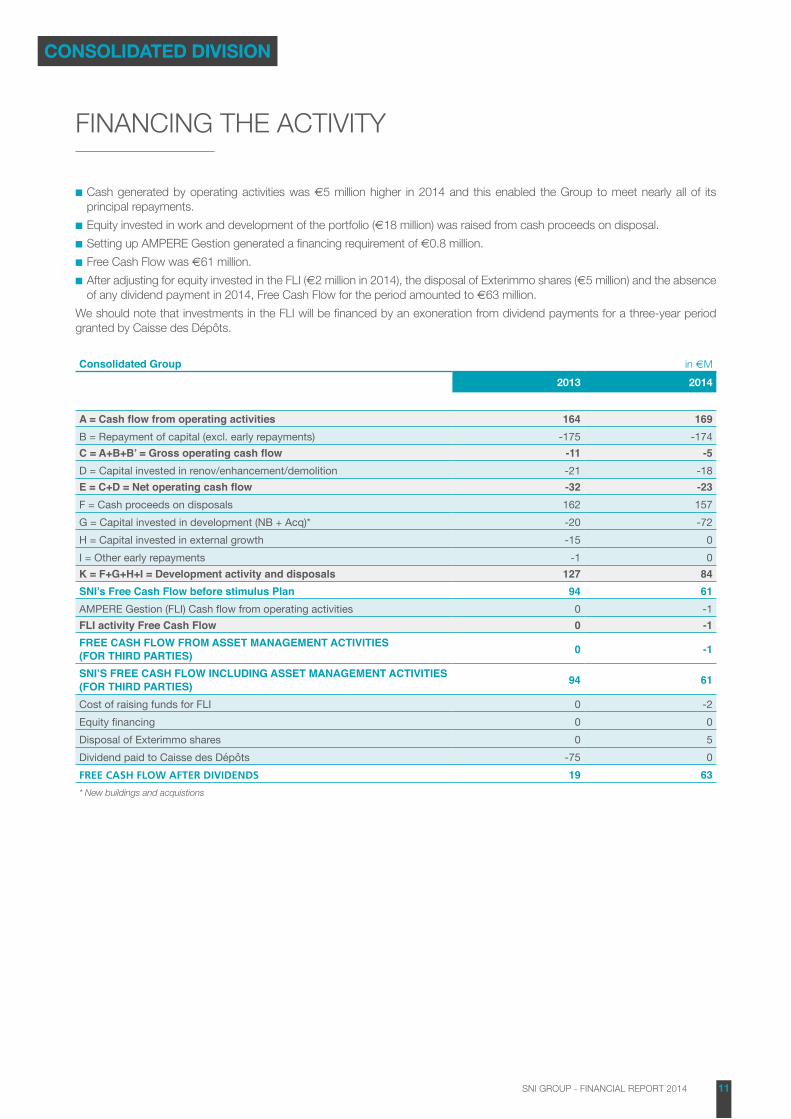
■■ Cash generated by operating activities was €5 million higher in 2014 and this enabled the Group to meet nearly all of its principal repayments.
■■ Equity invested in work and development of the portfolio (€18 million) was raised from cash proceeds on disposal.
■■ Setting up AMPERE Gestion generated a financing requirement of €0.8 million.
■■ Free Cash Flow was €61 million.
■■ After adjusting for equity invested in the FLI (€2 million in 2014), the disposal of Exterimmo shares (€5 million) and the absence of any dividend payment in 2014, Free Cash Flow for the period amounted to €63 million.
We should note that investments in the FLI will be financed by an exoneration from dividend payments for a three-year period granted by Caisse des Dépôts.
Consolidated Group in €M
2013 2014
A = Cash flow from operating activities 164 169B = Repayment of capital (excl. early repayments) -175 -174C = A+B+B’ = Gross operating cash flow -11 -5D = Capital invested in renov/enhancement/demolition -21 -18E = C+D = Net operating cash flow -32 -23F = Cash proceeds on disposals 162 157G = Capital invested in development (NB + Acq)* -20 -72H = Capital invested in external growth -15 0I = Other early repayments -1 0K = F+G+H+I = Development activity and disposals 127 84SNI’s Free Cash Flow before stimulus Plan 94 61AMPERE Gestion (FLI) Cash flow from operating activities 0 -1FLI activity Free Cash Flow 0 -1FREE CASH FLOW FROM ASSET MANAGEMENT ACTIVITIES (FOR THIRD PARTIES) 0 -1
SNI’S FREE CASH FLOW INCLUDING ASSET MANAGEMENT ACTIVITIES (FOR THIRD PARTIES) 94 61
Cost of raising funds for FLI 0 -2Equity financing 0 0Disposal of Exterimmo shares 0 5Dividend paid to Caisse des Dépôts -75 0FREE CASH FLOW AFTER DIVIDENDS 19 63* New buildings and acquistions
CONSOLIDATED DIVISION

12SNI GROUP - FINANCIAL REPORT 2014
ESHS OUTSIDE THE PARIS REGION
This division comprises all social housing companies (ESHs) in which SNI is the strategic shareholder as well as its non-controlling interests in ESHs. In view of restrictions on the shareholder base, voting rights, the disposal of shares and dividend entitlements under current regulations, this division is not consolidated either by SNI or Caisse des Dépôts. These entities are subject to very specific tax treatment (exemption from income and property tax and VAT at a reduced rate).
INCOME STATEMENTIncrease in net profit
Rents increased in line with the rent review index (i.e., 0.6% for 2014), generating a small increase in rental income for the year of 0.2% once bad debts were factored in.
Operating expenses (maintenance and payroll mostly) grew by more than rental income which put a squeeze on mar-gins. EBITDA dropped 2.4% year on year to €218 million, and represented 59% of net rental income.
EBIT was also hit by big increases in depreciation charges related to new buildings placed in service and renovation work carried out.
Thanks to cuts in interest rates paid on Livret A passbook savings accounts, both the division’s finance costs and its financial loss were €12 million lower than last year and profit from ordinary activities grew by €5 million.
Disposal gains amounted to €55 million. Split sales to exis-ting tenants proceeded very smoothly while block sales exhi-bited an uneven pattern year on year.
Non-recurring income for the period was virtually nil thanks to property tax rebates generated by energy retrofits on the existing stock of property. Due to a change in accounting method, the use of special tax depreciation was discontinued by the division.
Net profit came in at €84 million, up 8% on 2013.
Income statement in €M
2013 2014YoY change
2014/2013YoY change
2014/2013 in%
NET RENTAL INCOME 366.7 367.6 0.8 0.2%Fees paid -1.7 -1.3 0.4 -22.0%Maintenance -35.4 -36.3 -1.0 2.7%Local non-recoverable payroll -5.7 -5.4 0.2 -3.7%Property tax on developed property -32.9 -33.8 -0.9 2.7%Other direct costs -6.7 -7.3 -0.7 9.8%CONTRIBUTION MARGIN 284.4 283.4 -1.1 -0.4%Administrative staff payroll -37.5 -40.0 -2.5 6.6%Other indirect costs -13.1 -13.2 -0.1 0.6%Services -10.9 -12.8 -1.9 17.3%Own work capitalised 0.6 0.8 0.1 19.7%GENERAL EXPENSES -60.9 -65.2 -4.3 7.1%EBITDA 223.6 218.2 -5.4 -2.4%Depreciation and amortisation net of government grants and subsidies -102.1 -105.7 -3.6 3.5%
Variance MR/PMRs* -0.3 2.1 2.4 -929.4%EBIT 121.2 114.6 -6.6 -5.4%Financial expense -99.5 -86.4 13.1 -13.2%Financial income 5.4 4.4 -1.0 -18.2%NET FINANCIAL INCOME (EXPENSE) -94.1 -82.0 12.1 -12.9%PROFIT FROM ORDINARY ACTIVITIES 27.1 32.5 5.5 20.2%Profit from selling activity 60.3 54.5 -5.8 -9.6%Non-recurring profit (loss) -6.5 -0.1 6.3 -98.0%Profit sharing -2.2 -1.9 0.2 -11.4%Income and other taxes -0.7 -0.6 0.1 -8.4%NET PROFIT 78.0 84.3 6.3 8.1%* Major repairs/Provision for major repairs
ESH DIVISION
13SNI GROUP - FINANCIAL REPORT 2014
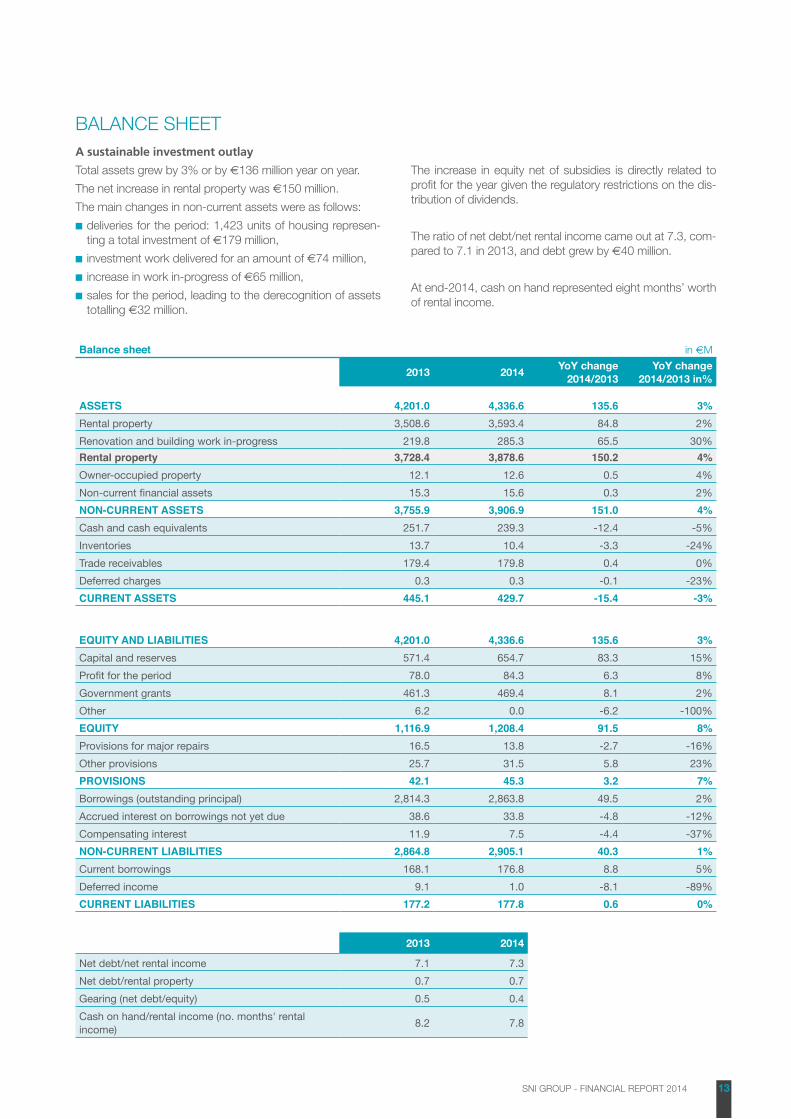
BALANCE SHEETA sustainable investment outlay
Total assets grew by 3% or by €136 million year on year.
The net increase in rental property was €150 million.
The main changes in non-current assets were as follows:
■■ deliveries for the period: 1,423 units of housing represen-ting a total investment of €179 million,
■■ investment work delivered for an amount of €74 million,
■■ increase in work in-progress of €65 million,
■■ sales for the period, leading to the derecognition of assets totalling €32 million.
The increase in equity net of subsidies is directly related to profit for the year given the regulatory restrictions on the dis-tribution of dividends.
The ratio of net debt/net rental income came out at 7.3, com-pared to 7.1 in 2013, and debt grew by €40 million.
At end-2014, cash on hand represented eight months’ worth of rental income.
Balance sheet in €M
2013 2014YoY change
2014/2013YoY change
2014/2013 in%
ASSETS 4,201.0 4,336.6 135.6 3%Rental property 3,508.6 3,593.4 84.8 2%Renovation and building work in-progress 219.8 285.3 65.5 30%Rental property 3,728.4 3,878.6 150.2 4%Owner-occupied property 12.1 12.6 0.5 4%Non-current financial assets 15.3 15.6 0.3 2%NON-CURRENT ASSETS 3,755.9 3,906.9 151.0 4%Cash and cash equivalents 251.7 239.3 -12.4 -5%Inventories 13.7 10.4 -3.3 -24%Trade receivables 179.4 179.8 0.4 0%Deferred charges 0.3 0.3 -0.1 -23%CURRENT ASSETS 445.1 429.7 -15.4 -3%
EQUITY AND LIABILITIES 4,201.0 4,336.6 135.6 3%Capital and reserves 571.4 654.7 83.3 15%Profit for the period 78.0 84.3 6.3 8%Government grants 461.3 469.4 8.1 2%Other 6.2 0.0 -6.2 -100%EQUITY 1,116.9 1,208.4 91.5 8%Provisions for major repairs 16.5 13.8 -2.7 -16%Other provisions 25.7 31.5 5.8 23%PROVISIONS 42.1 45.3 3.2 7%Borrowings (outstanding principal) 2,814.3 2,863.8 49.5 2%Accrued interest on borrowings not yet due 38.6 33.8 -4.8 -12%Compensating interest 11.9 7.5 -4.4 -37%NON-CURRENT LIABILITIES 2,864.8 2,905.1 40.3 1%Current borrowings 168.1 176.8 8.8 5%Deferred income 9.1 1.0 -8.1 -89%CURRENT LIABILITIES 177.2 177.8 0.6 0%
2013 2014
Net debt/net rental income 7.1 7.3Net debt/rental property 0.7 0.7Gearing (net debt/equity) 0.5 0.4Cash on hand/rental income (no. months' rental income) 8.2 7.8
14SNI GROUP - FINANCIAL REPORT 2014
FREE CASH FLOW
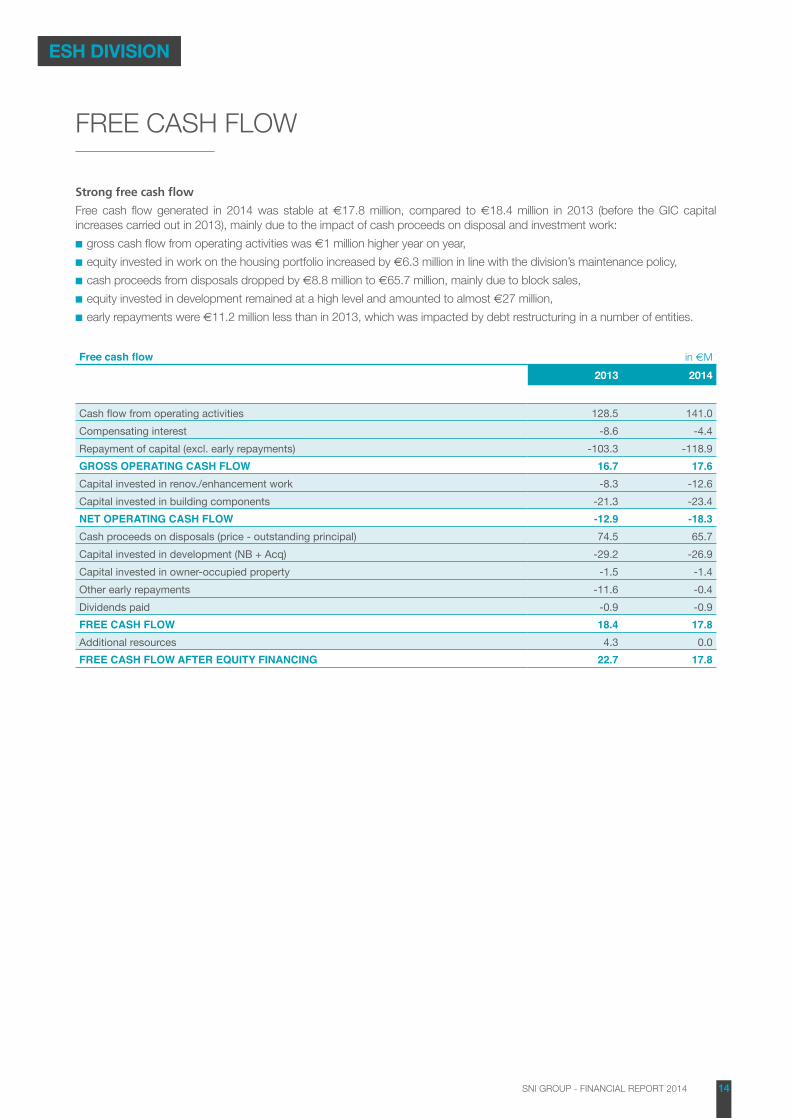
Strong free cash flow
Free cash flow generated in 2014 was stable at €17.8 million, compared to €18.4 million in 2013 (before the GIC capital increases carried out in 2013), mainly due to the impact of cash proceeds on disposal and investment work:
■■ gross cash flow from operating activities was €1 million higher year on year,
■■ equity invested in work on the housing portfolio increased by €6.3 million in line with the division’s maintenance policy,
■■ cash proceeds from disposals dropped by €8.8 million to €65.7 million, mainly due to block sales,
■■ equity invested in development remained at a high level and amounted to almost €27 million,
■■ early repayments were €11.2 million less than in 2013, which was impacted by debt restructuring in a number of entities.
Free cash flow in €M
2013 2014
Cash flow from operating activities 128.5 141.0Compensating interest -8.6 -4.4Repayment of capital (excl. early repayments) -103.3 -118.9GROSS OPERATING CASH FLOW 16.7 17.6Capital invested in renov./enhancement work -8.3 -12.6Capital invested in building components -21.3 -23.4NET OPERATING CASH FLOW -12.9 -18.3Cash proceeds on disposals (price - outstanding principal) 74.5 65.7Capital invested in development (NB + Acq) -29.2 -26.9Capital invested in owner-occupied property -1.5 -1.4Other early repayments -11.6 -0.4Dividends paid -0.9 -0.9FREE CASH FLOW 18.4 17.8Additional resources 4.3 0.0FREE CASH FLOW AFTER EQUITY FINANCING 22.7 17.8
ESH DIVISION
15SNI GROUP - FINANCIAL REPORT 2014
EFIDIS
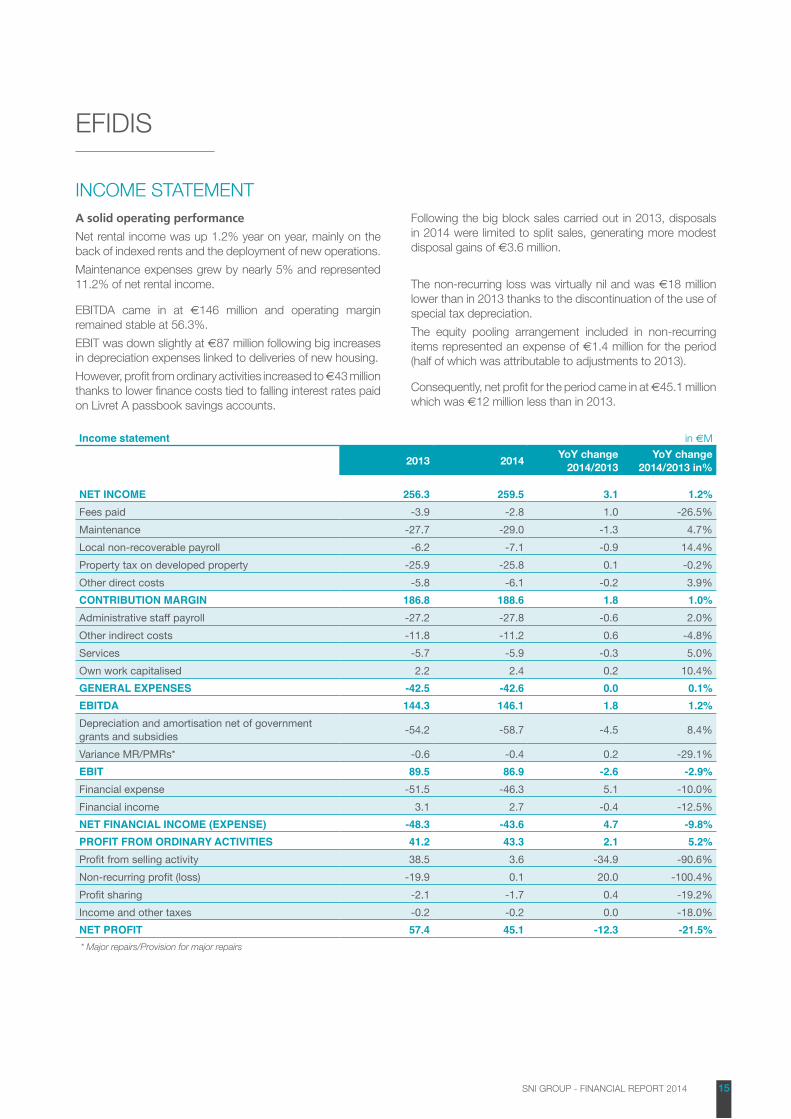
INCOME STATEMENTA solid operating performance
Net rental income was up 1.2% year on year, mainly on the back of indexed rents and the deployment of new operations.
Maintenance expenses grew by nearly 5% and represented 11.2% of net rental income.
EBITDA came in at €146 million and operating margin remained stable at 56.3%.
EBIT was down slightly at €87 million following big increases in depreciation expenses linked to deliveries of new housing.
However, profit from ordinary activities increased to €43 million thanks to lower finance costs tied to falling interest rates paid on Livret A passbook savings accounts.
Following the big block sales carried out in 2013, disposals in 2014 were limited to split sales, generating more modest disposal gains of €3.6 million.
The non-recurring loss was virtually nil and was €18 million lower than in 2013 thanks to the discontinuation of the use of special tax depreciation.
The equity pooling arrangement included in non-recurring items represented an expense of €1.4 million for the period (half of which was attributable to adjustments to 2013).
Consequently, net profit for the period came in at €45.1 million which was €12 million less than in 2013.
Income statement in €M
2013 2014YoY change
2014/2013YoY change
2014/2013 in%
NET INCOME 256.3 259.5 3.1 1.2%Fees paid -3.9 -2.8 1.0 -26.5%Maintenance -27.7 -29.0 -1.3 4.7%Local non-recoverable payroll -6.2 -7.1 -0.9 14.4%Property tax on developed property -25.9 -25.8 0.1 -0.2%Other direct costs -5.8 -6.1 -0.2 3.9%CONTRIBUTION MARGIN 186.8 188.6 1.8 1.0%Administrative staff payroll -27.2 -27.8 -0.6 2.0%Other indirect costs -11.8 -11.2 0.6 -4.8%Services -5.7 -5.9 -0.3 5.0%Own work capitalised 2.2 2.4 0.2 10.4%GENERAL EXPENSES -42.5 -42.6 0.0 0.1%EBITDA 144.3 146.1 1.8 1.2%Depreciation and amortisation net of government grants and subsidies -54.2 -58.7 -4.5 8.4%
Variance MR/PMRs* -0.6 -0.4 0.2 -29.1%EBIT 89.5 86.9 -2.6 -2.9%Financial expense -51.5 -46.3 5.1 -10.0%Financial income 3.1 2.7 -0.4 -12.5%NET FINANCIAL INCOME (EXPENSE) -48.3 -43.6 4.7 -9.8%PROFIT FROM ORDINARY ACTIVITIES 41.2 43.3 2.1 5.2%Profit from selling activity 38.5 3.6 -34.9 -90.6%Non-recurring profit (loss) -19.9 0.1 20.0 -100.4%Profit sharing -2.1 -1.7 0.4 -19.2%Income and other taxes -0.2 -0.2 0.0 -18.0%NET PROFIT 57.4 45.1 -12.3 -21.5%* Major repairs/Provision for major repairs
16SNI GROUP - FINANCIAL REPORT 2014
ESH DIVISION
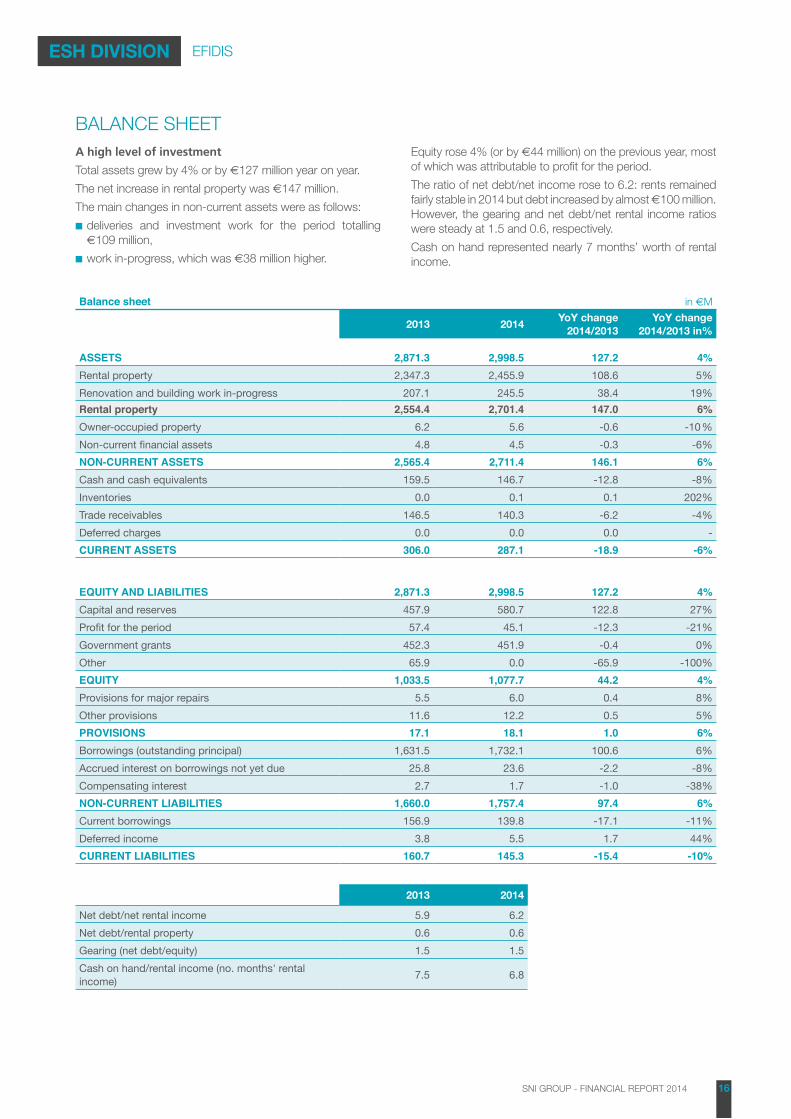
BALANCE SHEETA high level of investment
Total assets grew by 4% or by €127 million year on year.
The net increase in rental property was €147 million.
The main changes in non-current assets were as follows:
■■ deliveries and investment work for the period totalling €109 million,
■■ work in-progress, which was €38 million higher.
Equity rose 4% (or by €44 million) on the previous year, most of which was attributable to profit for the period.
The ratio of net debt/net income rose to 6.2: rents remained fairly stable in 2014 but debt increased by almost €100 million. However, the gearing and net debt/net rental income ratios were steady at 1.5 and 0.6, respectively.
Cash on hand represented nearly 7 months’ worth of rental income.
Balance sheet in €M
2013 2014YoY change
2014/2013YoY change
2014/2013 in%
ASSETS 2,871.3 2,998.5 127.2 4%Rental property 2,347.3 2,455.9 108.6 5%Renovation and building work in-progress 207.1 245.5 38.4 19%Rental property 2,554.4 2,701.4 147.0 6%Owner-occupied property 6.2 5.6 -0.6 -10 %Non-current financial assets 4.8 4.5 -0.3 -6%NON-CURRENT ASSETS 2,565.4 2,711.4 146.1 6%Cash and cash equivalents 159.5 146.7 -12.8 -8%Inventories 0.0 0.1 0.1 202%Trade receivables 146.5 140.3 -6.2 -4%Deferred charges 0.0 0.0 0.0 -CURRENT ASSETS 306.0 287.1 -18.9 -6%
EQUITY AND LIABILITIES 2,871.3 2,998.5 127.2 4%Capital and reserves 457.9 580.7 122.8 27%Profit for the period 57.4 45.1 -12.3 -21%Government grants 452.3 451.9 -0.4 0%Other 65.9 0.0 -65.9 -100%EQUITY 1,033.5 1,077.7 44.2 4%Provisions for major repairs 5.5 6.0 0.4 8%Other provisions 11.6 12.2 0.5 5%PROVISIONS 17.1 18.1 1.0 6%Borrowings (outstanding principal) 1,631.5 1,732.1 100.6 6%Accrued interest on borrowings not yet due 25.8 23.6 -2.2 -8%Compensating interest 2.7 1.7 -1.0 -38%NON-CURRENT LIABILITIES 1,660.0 1,757.4 97.4 6%Current borrowings 156.9 139.8 -17.1 -11%Deferred income 3.8 5.5 1.7 44%CURRENT LIABILITIES 160.7 145.3 -15.4 -10%
2013 2014
Net debt/net rental income 5.9 6.2Net debt/rental property 0.6 0.6Gearing (net debt/equity) 1.5 1.5Cash on hand/rental income (no. months' rental income) 7.5 6.8
EFIDIS
17SNI GROUP - FINANCIAL REPORT 2014
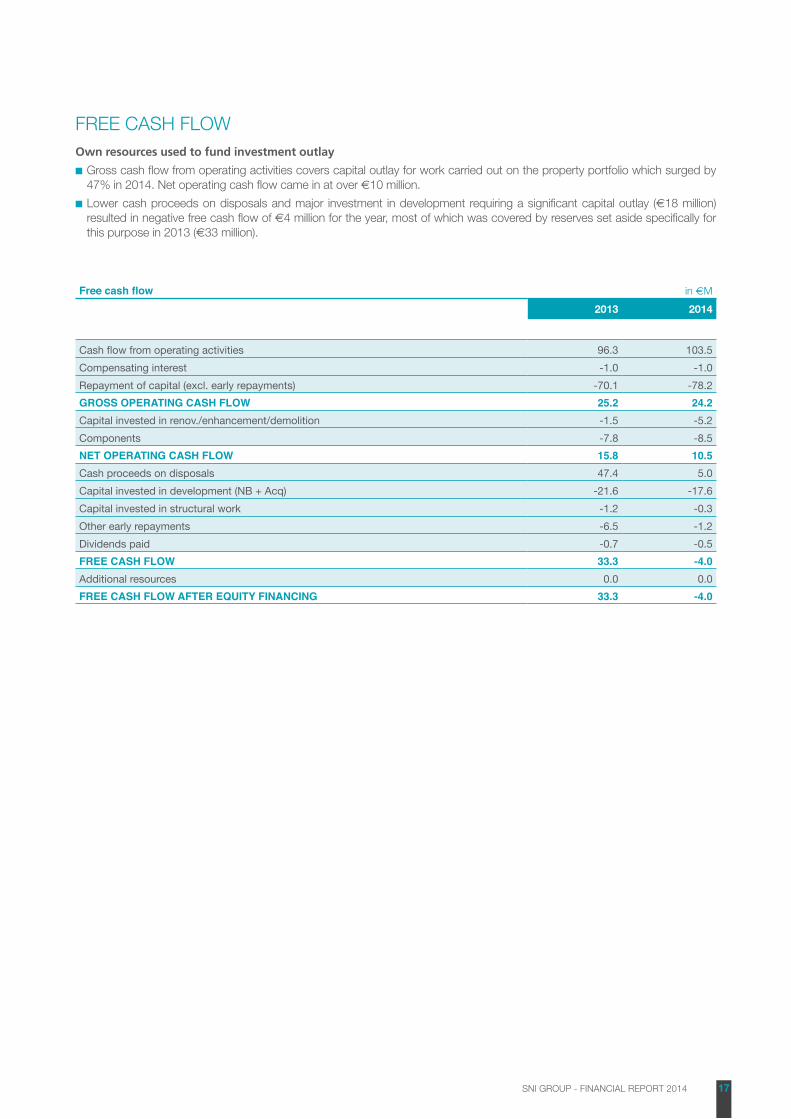
FREE CASH FLOW Own resources used to fund investment outlay
■■ Gross cash flow from operating activities covers capital outlay for work carried out on the property portfolio which surged by 47% in 2014. Net operating cash flow came in at over €10 million.
■■ Lower cash proceeds on disposals and major investment in development requiring a significant capital outlay (€18 million) resulted in negative free cash flow of €4 million for the year, most of which was covered by reserves set aside specifically for this purpose in 2013 (€33 million).
Free cash flow in €M
2013 2014
Cash flow from operating activities 96.3 103.5Compensating interest -1.0 -1.0Repayment of capital (excl. early repayments) -70.1 -78.2GROSS OPERATING CASH FLOW 25.2 24.2Capital invested in renov./enhancement/demolition -1.5 -5.2Components -7.8 -8.5NET OPERATING CASH FLOW 15.8 10.5Cash proceeds on disposals 47.4 5.0Capital invested in development (NB + Acq) -21.6 -17.6Capital invested in structural work -1.2 -0.3Other early repayments -6.5 -1.2Dividends paid -0.7 -0.5FREE CASH FLOW 33.3 -4.0Additional resources 0.0 0.0FREE CASH FLOW AFTER EQUITY FINANCING 33.3 -4.0
18SNI GROUP - FINANCIAL REPORT 2014
ESH DIVISION
OSICA
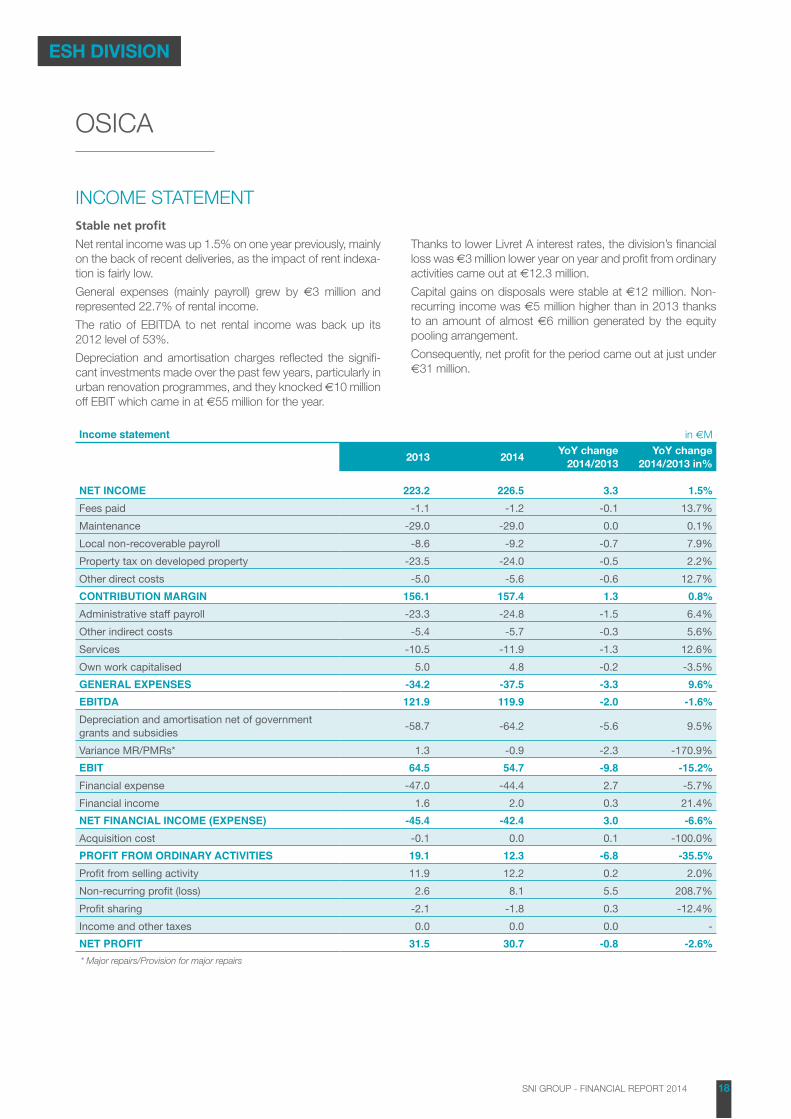
INCOME STATEMENTStable net profit
Net rental income was up 1.5% on one year previously, mainly on the back of recent deliveries, as the impact of rent indexa-tion is fairly low.
General expenses (mainly payroll) grew by €3 million and represented 22.7% of rental income.
The ratio of EBITDA to net rental income was back up its 2012 level of 53%.
Depreciation and amortisation charges reflected the signifi-cant investments made over the past few years, particularly in urban renovation programmes, and they knocked €10 million off EBIT which came in at €55 million for the year.
Thanks to lower Livret A interest rates, the division’s financial loss was €3 million lower year on year and profit from ordinary activities came out at €12.3 million.
Capital gains on disposals were stable at €12 million. Non-recurring income was €5 million higher than in 2013 thanks to an amount of almost €6 million generated by the equity pooling arrangement.
Consequently, net profit for the period came out at just under €31 million.
Income statement in €M
2013 2014YoY change 2014/2013
YoY change 2014/2013 in%
NET INCOME 223.2 226.5 3.3 1.5%Fees paid -1.1 -1.2 -0.1 13.7%Maintenance -29.0 -29.0 0.0 0.1%Local non-recoverable payroll -8.6 -9.2 -0.7 7.9%Property tax on developed property -23.5 -24.0 -0.5 2.2%Other direct costs -5.0 -5.6 -0.6 12.7%CONTRIBUTION MARGIN 156.1 157.4 1.3 0.8%Administrative staff payroll -23.3 -24.8 -1.5 6.4%Other indirect costs -5.4 -5.7 -0.3 5.6%Services -10.5 -11.9 -1.3 12.6%Own work capitalised 5.0 4.8 -0.2 -3.5%GENERAL EXPENSES -34.2 -37.5 -3.3 9.6%EBITDA 121.9 119.9 -2.0 -1.6%Depreciation and amortisation net of government grants and subsidies -58.7 -64.2 -5.6 9.5%
Variance MR/PMRs* 1.3 -0.9 -2.3 -170.9%EBIT 64.5 54.7 -9.8 -15.2%Financial expense -47.0 -44.4 2.7 -5.7%Financial income 1.6 2.0 0.3 21.4%NET FINANCIAL INCOME (EXPENSE) -45.4 -42.4 3.0 -6.6%Acquisition cost -0.1 0.0 0.1 -100.0%PROFIT FROM ORDINARY ACTIVITIES 19.1 12.3 -6.8 -35.5%Profit from selling activity 11.9 12.2 0.2 2.0%Non-recurring profit (loss) 2.6 8.1 5.5 208.7%Profit sharing -2.1 -1.8 0.3 -12.4%Income and other taxes 0.0 0.0 0.0 -NET PROFIT 31.5 30.7 -0.8 -2.6%* Major repairs/Provision for major repairs
19SNI GROUP - FINANCIAL REPORT 2014
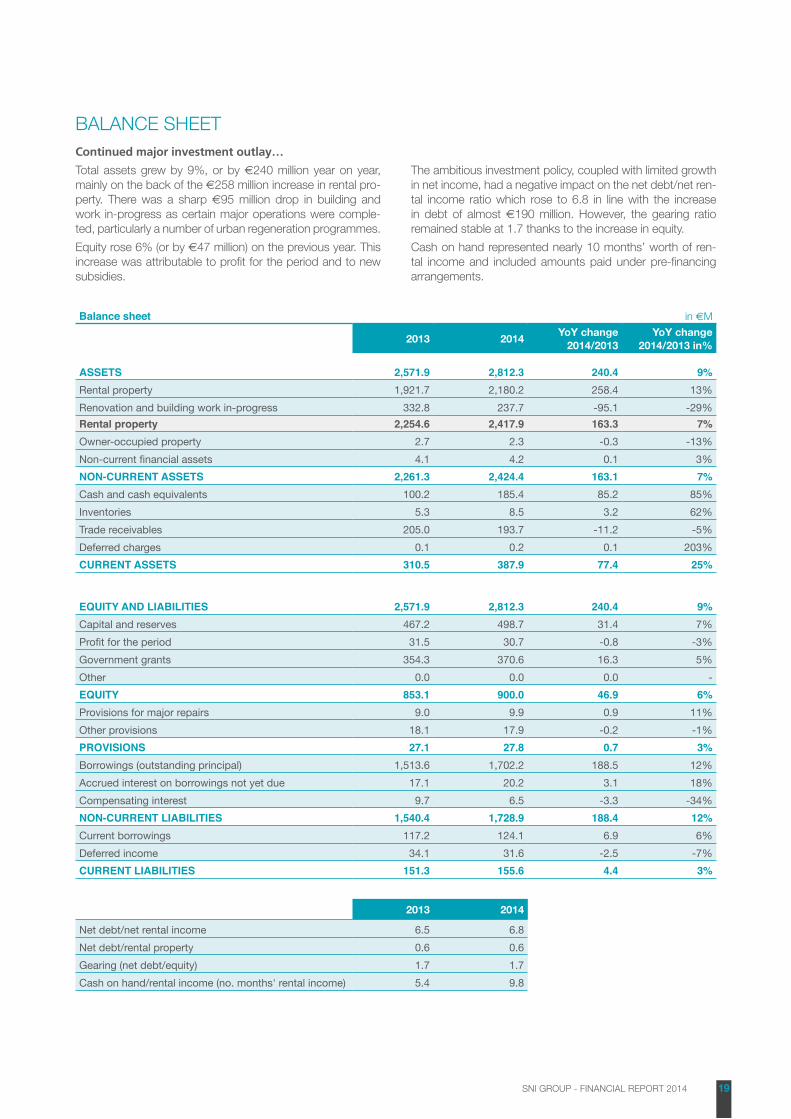
BALANCE SHEETContinued major investment outlay…
Total assets grew by 9%, or by €240 million year on year, mainly on the back of the €258 million increase in rental pro-perty. There was a sharp €95 million drop in building and work in-progress as certain major operations were comple-ted, particularly a number of urban regeneration programmes.
Equity rose 6% (or by €47 million) on the previous year. This increase was attributable to profit for the period and to new subsidies.
The ambitious investment policy, coupled with limited growth in net income, had a negative impact on the net debt/net ren-tal income ratio which rose to 6.8 in line with the increase in debt of almost €190 million. However, the gearing ratio remained stable at 1.7 thanks to the increase in equity.
Cash on hand represented nearly 10 months’ worth of ren-tal income and included amounts paid under pre-financing arrangements.
Balance sheet in €M
2013 2014YoY change
2014/2013YoY change
2014/2013 in%
ASSETS 2,571.9 2,812.3 240.4 9%Rental property 1,921.7 2,180.2 258.4 13%Renovation and building work in-progress 332.8 237.7 -95.1 -29%Rental property 2,254.6 2,417.9 163.3 7%Owner-occupied property 2.7 2.3 -0.3 -13%Non-current financial assets 4.1 4.2 0.1 3%NON-CURRENT ASSETS 2,261.3 2,424.4 163.1 7%Cash and cash equivalents 100.2 185.4 85.2 85%Inventories 5.3 8.5 3.2 62%Trade receivables 205.0 193.7 -11.2 -5%Deferred charges 0.1 0.2 0.1 203%CURRENT ASSETS 310.5 387.9 77.4 25%
EQUITY AND LIABILITIES 2,571.9 2,812.3 240.4 9%Capital and reserves 467.2 498.7 31.4 7%Profit for the period 31.5 30.7 -0.8 -3%Government grants 354.3 370.6 16.3 5%Other 0.0 0.0 0.0 -EQUITY 853.1 900.0 46.9 6%Provisions for major repairs 9.0 9.9 0.9 11%Other provisions 18.1 17.9 -0.2 -1%PROVISIONS 27.1 27.8 0.7 3%Borrowings (outstanding principal) 1,513.6 1,702.2 188.5 12%Accrued interest on borrowings not yet due 17.1 20.2 3.1 18%Compensating interest 9.7 6.5 -3.3 -34%NON-CURRENT LIABILITIES 1,540.4 1,728.9 188.4 12%Current borrowings 117.2 124.1 6.9 6%Deferred income 34.1 31.6 -2.5 -7%CURRENT LIABILITIES 151.3 155.6 4.4 3%
2013 2014
Net debt/net rental income 6.5 6.8Net debt/rental property 0.6 0.6Gearing (net debt/equity) 1.7 1.7Cash on hand/rental income (no. months' rental income) 5.4 9.8
20SNI GROUP - FINANCIAL REPORT 2014
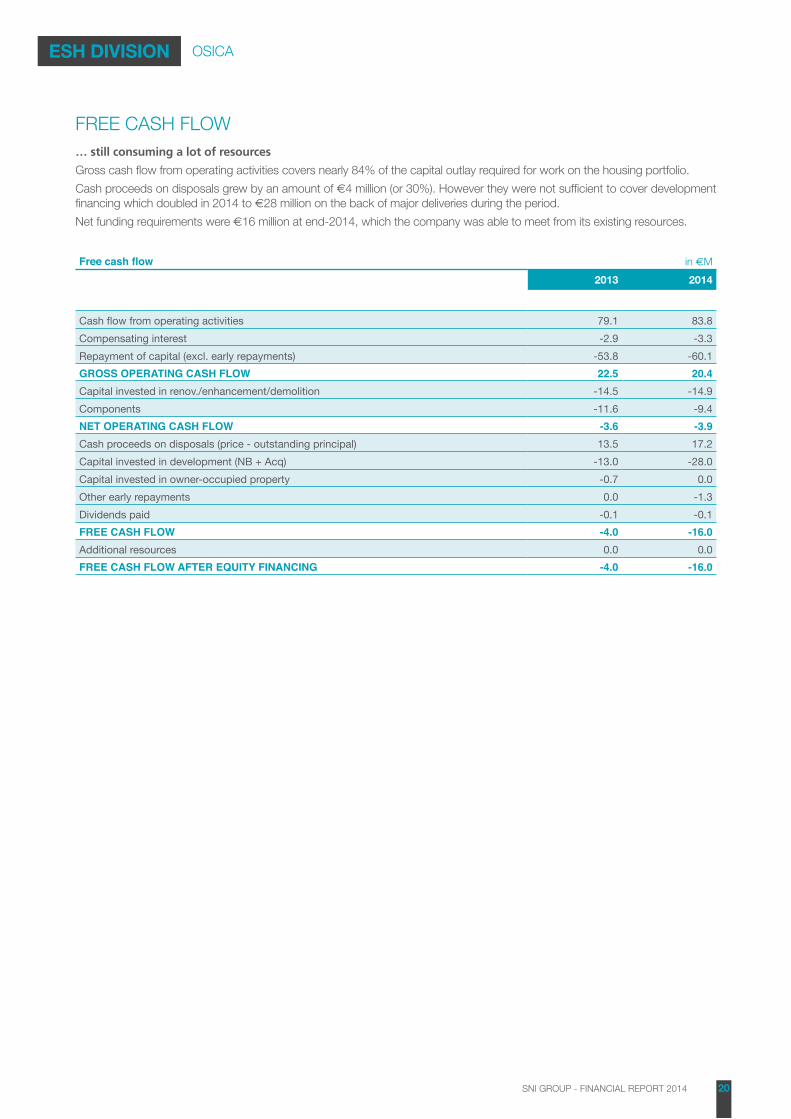
FREE CASH FLOW… still consuming a lot of resources
Gross cash flow from operating activities covers nearly 84% of the capital outlay required for work on the housing portfolio.
Cash proceeds on disposals grew by an amount of €4 million (or 30%). However they were not sufficient to cover development financing which doubled in 2014 to €28 million on the back of major deliveries during the period.
Net funding requirements were €16 million at end-2014, which the company was able to meet from its existing resources.
Free cash flow in €M
2013 2014
Cash flow from operating activities 79.1 83.8Compensating interest -2.9 -3.3Repayment of capital (excl. early repayments) -53.8 -60.1GROSS OPERATING CASH FLOW 22.5 20.4Capital invested in renov./enhancement/demolition -14.5 -14.9Components -11.6 -9.4NET OPERATING CASH FLOW -3.6 -3.9Cash proceeds on disposals (price - outstanding principal) 13.5 17.2Capital invested in development (NB + Acq) -13.0 -28.0Capital invested in owner-occupied property -0.7 0.0Other early repayments 0.0 -1.3Dividends paid -0.1 -0.1FREE CASH FLOW -4.0 -16.0Additional resources 0.0 0.0FREE CASH FLOW AFTER EQUITY FINANCING -4.0 -16.0
ESH DIVISION OSICA
100-104 avenue de France - 75013 PARIS
Tél. : 01 55 03 33 18
www.groupesni.fr
Sep
tem
ber
2015
– D
esig
n an
d pr
oduc
tion:
age
nce
Pas
telle
– P
hoto
cre
dit:
Ulf
And
erse
n