report - qtxasset.com · 2018-05-25 · for shareholder value. as the pool of willing buyers...
TRANSCRIPT

Plant and PruneHow M&A Can Grow Portfolio Value
Report

The Boston Consulting Group (BCG) is a global management consulting firm and the world’s leading advisor on business strategy. We partner with clients from the private, public, and not-for-profit sectors in all regions to identify their highest-value opportunities, address their most critical challenges, and transform their enterprises. Our customized approach combines deep in sight into the dynamics of companies and markets with close collaboration at all levels of the client organization. This ensures that our clients achieve sustainable compet itive advantage, build more capable organizations, and secure lasting results. Founded in 1963, BCG is a private company with 77 offices in 42 countries. For more information, please visit bcg.com.

Plant and Prune
How M&A CAn Grow Portfolio VAlue
Jens KenGelBACH
DOminiC C. Klemmer
AlexAnDer rOOs
September 2012 | The Boston Consulting Group
2 | Plant and Prune
Contents
3 ExEcutivE Summary
6 volatility and uncErtainty Put a Big chill on dEal activity
Different Industries, Different Motives Private Equity Has Taken Its Lumps but Is Coming Back Not the Nicest CAR Ride for ShareholdersPerformance at Each ExtremeWhy Investors Are Still Skeptical
14 looking anEw at thE valuE of divEStingSelloffs: A Smart Way to Sharpen Operations Overall Selloffs Produce a Bounce in CARWhen Both Sides BenefitSeven Principles for Successful Divestiture
24 AsiA AsseRts itself—especiAlly with OutbOund dEalS
Hunger for Established-Market TargetsIndia’s Acquisition AppetiteThe Strategic Rationale Behind China’s Moves
28 PrEParing for tomorrow’S dEalS
30 chAnce fAvORs the well-pRepARed AcquiReR
32 aPPEndix i: mEthodology
34 aPPEndix ii: rEfErEncES
36 for furthEr rEading
37 notE to thE rEadEr

The Boston Consulting Group | 3
These days, we don’t see many business leaders breaking open cases of champagne to toast their dealmaking successes. Equity markets are too
volatile for that, and the global economy is still too fragile. Yet nobody is reaching for the headache pills either. The Boston Consulting Group’s latest analyses of mergers and acquisitions (M&A) worldwide show that for all that currently dampens the business of dealmaking, there’s plenty to be hopeful about.
This year’s M&A report—BCG’s eighth annual report spotlighting the most surprising aspects of M&A activity—reveals insights that matter to deal-makers everywhere.
In particular, there are fresh and urgent reasons to take an ongoing strate-gic approach to the ways in which M&A can elevate the value of a portfo-lio of assets, whether these are discrete business units or entire companies. This report underscores the ways in which the companies that BCG calls the “portfolio masters” prepare for better times: they continually explore ac-quisition opportunities and study how active divesting initiatives can add economic value, too. This year’s report also shows why business leaders must keep an eye on Asia as the region’s dealmaking significance gathers even more momentum.
There are good reasons to plan constructively for M&A activity worldwide, though economic conditions remain difficult in much of the world—even in emerging markets.
deal returns were surprisingly good in selected industries such as •manufacturing and among targets based in asia.
although the number of m&a deals in 2011 was down 1 percent •from the previous year, overall deal value rose by 19 percent during that year. that said, M&A is still very much a “fits and starts” business: both deal volume and value dived in the first half of 2012.
exeCutive summary

4 | Plant and Prune
the private-equity sector has taken its lumps, yet the number of •pe deals is growing again, and pe firms have no shortage of ready cash. the number of PE deals rose by 12 percent in 2011, and their value surged by 38 percent.
europe’s financial crises continue to cast dark shadows over many •cEos worldwide, but Bcg’s survey of European cEos shows them to be more upbeat about m&a activity than might be expected.
data show that divesting has much more potential than acquiring •to boost operating performance—and, of course, free up cash.
Although these still are not the best of times for shareholders, there has been some bounce in short-term returns.
it’s not a secret that m&a activity typically destroys shareholder •value. bcG’s research confirms that about two-thirds of all public takeovers wreck value for the acquirer in the long run. over the past 22 years, cumulative abnormal return (car) averaged –0.8 percent in public-to-public transactions. (car is a commonly accepted measure of how capital markets see a deal upon an-nouncement; it is a good proxy for the long-term success of a given transaction.)
m&a returns for publicly listed companies acquiring other public •companies dropped far below the two-decade average in 2011. yet the returns for target companies were astonishingly healthy.
in contrast to public-to-public deals, acquisitions of private compa- •nies or subsidiaries in 2011 produced positive returns of 0.4 percent and 0.6 percent, respectively, though these were also below the long-term average for each category.
Business leaders need to look anew at what divesting can do for shareholder value. As the pool of willing buyers expands, di-vestitures are quickly becoming more important to global M&A activity.
there are definitely opportunities for creating value through •divestitures. the pool of willing buyers is expanding (notably, PE firms have built up impressive war chests, and more and more asian acquirers are on the prowl), and it is very likely that busi-nesses have unrealized value locked up in a business unit or division that might be more valuable to another owner.
Some leading companies—the portfolio masters—create enor- •mous value this way. our data reveal that Philips leads the elite pack of those actively divesting; it has created the most shareholder value, on average, for each of its 23 recent large divestitures.
Bcg’s analyses reveal growing momentum in divestitures: in 2011, •divestitures made up 45 percent of all deals, up 5 percentage points from the 1990s.

The Boston Consulting Group | 5
all indications are that investors view divestitures positively •because such moves clearly make the case for change on both sides of the deal. there’s hard quantitative evidence for this in Bcg’s analysis of divesture returns.
Cross-border deals are driving the next wave in M&A, with Asian buyers assertively pushing both inbound and outbound deals.
asia is steadily growing in importance as a center for dealmaking. •cross-border deals, many involving asia, are becoming a far more important part of the global m&a picture.
as asian challengers have grown cash rich and more sophisticated, •they have started hunting aggressively for blue-chip opportunities in Europe and the u.S. they are moving up the value chain to acquire technology, natural resources, brands, and other valuable assets. in the past decade, the value of purchases of established-market assets by asian acquirers rose at an 11 percent compound annual growth rate.
Business leaders need to be aware that many potential acquirers •in china are going after global market share—and have govern-ment backing to help them.
india and china are assertive outbound players. from 2006 •through 2011, indian companies accounted for 39 percent of all asia-to-established-market deals, up from 33 percent from 2001 through 2005. china’s share of that subsegment was 15 percent from 2006 through 2011, up from 11 percent from 2001 through 2005.
m&a in asia works in both directions. Bcg’s recent survey of the •chief executives of large European companies shows that asian inbound deals remain high on their agendas. roughly 28 percent of respondents view emerging-market deals as the most relevant in 2012, compared with just 16 percent the previous year.

6 | Plant and Prune
volatility and unCertainty Put a Big Chill on deal aCtivity
If you’re considering making a deal, you have to hate two of the hallmarks of
business conditions today: heart-stopping volatility in equity markets and on-again, off-again uncertainty in the global economy as a whole. Even emerging markets—until recently the darlings of investors—are losing some of their fast-growth luster. no matter how well your company is doing, these ominous financial and economic indicators are keeping investors on the sidelines—and preventing many would-be buyers from pushing forward with deals.
the net effect: a big chill in dealmaking everywhere. nobody knows exactly when the thaw will start; many are apprehensive about how short-lived a thaw might be. But this should not be an excuse for inaction or inde-cision. the good news is that there is plenty that can be done to prepare for more energet-ic dealmaking in the days ahead.
leading organizations are already strategically prepared for that future. they are constantly on alert for potential acquisition targets and continually assessing the value of the assets in their portfolios, asking whether assets could provide more value under different ownership. those companies are what the Boston con-sulting group calls “portfolio masters”—com-panies that are systematically reevaluating their portfolios of business units and divisions with a clear eye on shareholder value.
now is the time for other companies to fol-low suit—not only in terms of acquisitions but also in terms of divestitures. Bcg’s analy-sis of recent dealmaking activity will help in-form smart moves in the years ahead. let’s take a closer look at what’s happening.
in 2011, we saw the continuation of two trends whose momentum has been carrying over strongly into 2012: the rise of divesti-tures that allow the parent to better focus on its core business or to raise funds for oth-er acquisitions, and asia’s effervescent deal-making activity, both inbound and out-bound.
ominous financial and eco-nomic indicators are keeping investors on the sidelines.
the past 18 months have seen only fits and starts on the global m&a front. analysis of more than 26,000 global transactions—Bcg’s eighth annual assessment of crucial m&a trends—clearly shows that 2011 began with a promising surge of m&a activity. hopefulness extended far into the first half of 2011, but activity dropped sharply in the third and fourth quarters, which, historically, have been the more active periods of the dealmaking

The Boston Consulting Group | 7
year. (See Exhibit 1.) So far, 2012 has not lift-ed dealmakers’ spirits. the first quarter saw a disappointing dive in both deal volume and value.
as 2012 dawned, the previous year’s trend lines showed up clearly. although the number of m&a deals in 2011 was down 1 percent from the previous year, overall deal value rose by 19 percent. Simple arithmetic shows that larger deals, on average, were much more prominent relative to 2010. many com-panies accumulated huge stores of cash be-cause they took advantage of the recent fi-nancial crisis to get back to “housekeeping basics”—tightening up on expenditures and promoting operating efficiencies across the organization. then, as valuations of targets declined, some companies that had been waiting on the sidelines decided the time was ripe to pounce on large-scale opportunities. a case in point: french drug maker Sanofi-aventis clinched its long-sought purchase of u.S. biotechnology company genzyme for $20.1 billion, aiming to secure a new platform in rare diseases.
there would have been even more large deals if not for the macroeconomic malaise that was afflicting most regions of the world.
the headlines trumpeting European fiscal woes aren’t likely to go quiet this year, and country bond ratings have been downgraded steadily in almost every nation of the euro zone as investors remain skeptical of govern-ments’ ability to address their nations’ fiscal problems. Elsewhere, public debt and deficit levels have continued to climb in most coun-tries, including the u.S. and the u.k.
Some companies decided the time was ripe to pounce on large-scale opportunities.
other crises also contributed to the econom-ic turmoil in 2011. witness the violent strug-gles that continue to roil the middle East and the earthquake and tsunami that hit Japan in march 2011, causing massive loss of life and property damage and disrupting supply chains the world over. more than halfway through 2012, expectations of global growth are suppressed, and there’s not much hope that capital market volatility will ease—meaning continued dampening of dealmaking.
5,000
2,500
0
10,000
7,500
1,200
1,000
800
600
400
200
0
Value of dealsNumber of deals
$billions Number of deals
20112009200720052003200119991997199519931991
Number: 1%Value: +19%
Q12012
Number and value of deals, 1990–Q1 2012
2010–2011
44%
Sources: BCG m&A research Center; Thomson One Banker.Note: enterprise values include the net debt of the target; the total of 428,186 completed m&A transactions with no transaction-size threshold excludes repurchases, exchange offers, recapitalizations, and spinoffs.
Exhibit 1 | M&A Activity Fizzled in the Second Half of 2011, and 2012 Has Not Lifted Dealmakers’ Spirits
8 | Plant and Prune
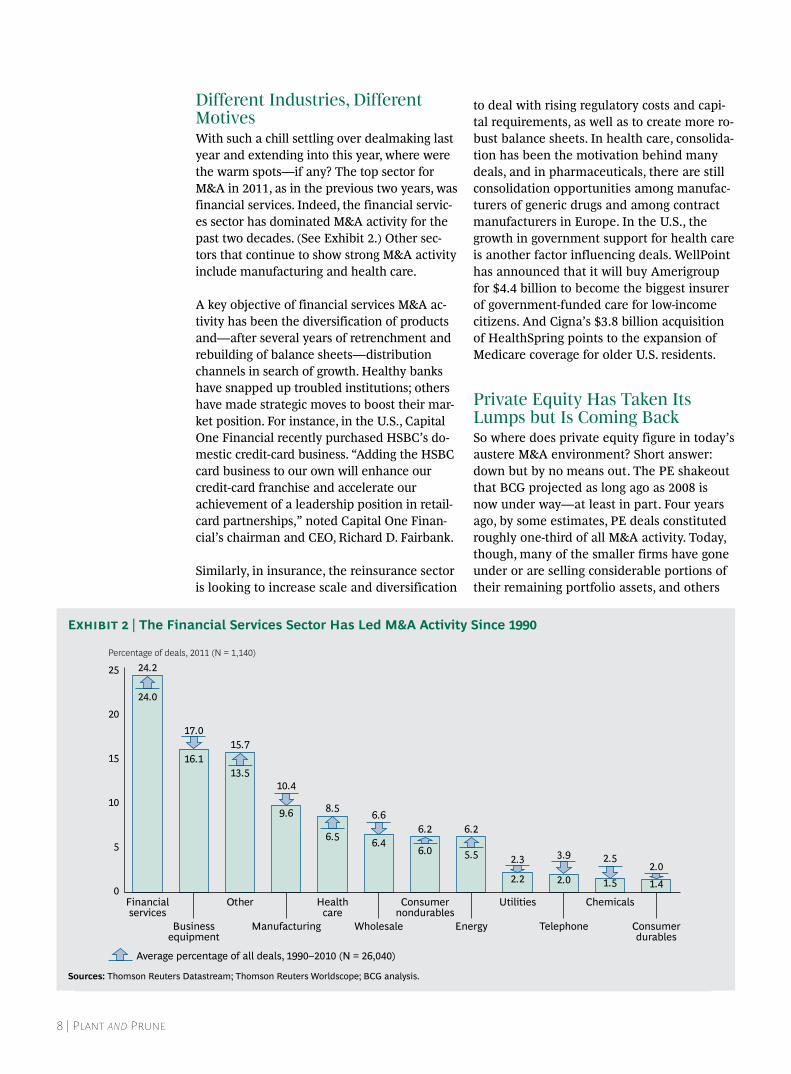
different industries, different motiveswith such a chill settling over dealmaking last year and extending into this year, where were the warm spots—if any? the top sector for m&a in 2011, as in the previous two years, was financial services. indeed, the financial servic-es sector has dominated m&a activity for the past two decades. (See Exhibit 2.) other sec-tors that continue to show strong m&a activity include manufacturing and health care.
a key objective of financial services m&a ac-tivity has been the diversification of products and—after several years of retrenchment and rebuilding of balance sheets—distribution channels in search of growth. healthy banks have snapped up troubled institutions; others have made strategic moves to boost their mar-ket position. for instance, in the u.S., capital one financial recently purchased hSBc’s do-mestic credit-card business. “adding the hSBc card business to our own will enhance our credit-card franchise and accelerate our achievement of a leadership position in retail-card partnerships,” noted capital one finan-cial’s chairman and cEo, richard d. fairbank.
Similarly, in insurance, the reinsurance sector is looking to increase scale and diversification
to deal with rising regulatory costs and capi-tal requirements, as well as to create more ro-bust balance sheets. in health care, consolida-tion has been the motivation behind many deals, and in pharmaceuticals, there are still consolidation opportunities among manufac-turers of generic drugs and among contract manufacturers in Europe. in the u.S., the growth in government support for health care is another factor influencing deals. wellPoint has announced that it will buy amerigroup for $4.4 billion to become the biggest insurer of government-funded care for low-income citizens. and cigna’s $3.8 billion acquisition of healthSpring points to the expansion of medicare coverage for older u.S. residents.
Private equity has taken its lumps but is Coming Back So where does private equity figure in today’s austere m&a environment? Short answer: down but by no means out. the PE shakeout that Bcg projected as long ago as 2008 is now under way—at least in part. four years ago, by some estimates, PE deals constituted roughly one-third of all m&a activity. today, though, many of the smaller firms have gone under or are selling considerable portions of their remaining portfolio assets, and others
Percentage of deals, 2011 (N = 1,140)
25
20
15
10
5
0
Consumerdurables
Chemicals
Telephone
Utilities
2.3
Energy
6.2
Consumernondurables
6.2
Wholesale
Healthcare
8.5
Manufacturing
Other
15.7
Businessequipment
Financialservices
24.2
24.0
16.1
17.0
13.5
9.6
10.4
6.5 6.4
6.6
6.0 5.5
2.2 2.0
3.9
1.5
2.5
1.42.0
Average percentage of all deals, 1990–2010 (N = 26,040)
Sources: Thomson reuters Datastream; Thomson reuters Worldscope; BCG analysis.
Exhibit 2 | The Financial Services Sector Has Led M&A Activity Since 1990

The Boston Consulting Group | 9
are struggling to cover their operating costs. in the wake of the global financial crisis, un-certainty about economic growth and the lackluster corporate outlook have made it far harder for many PE firms to get new financ-ing. that said, most of the strong PE players have actually gained strength: they continue to draw investors and secure attractive com-panies for their portfolios.
A bigger challenge for Pe firms is finding enough good deals.
for all of the negatives, however, 2011 was not bad for the PE sector overall. firms con-tinued the dealmaking recovery that started in 2010 after two years of decline. from 2010 through 2011, the number of PE deals rose by 12 percent, achieving levels last seen in 2006, and their value increased by 38 percent, com-ing close to 2008 numbers for the first time. (See Exhibit 3.) large deals included the $6.3 billion buyout of kinetic concepts, a medical-therapy company, by a consortium led by apax Partners, and the $2.25 billion
acquisition of go daddy, a company that reg-isters internet domain names and provides other online services, by a consortium led by kkr.
there are definite signs that the sector’s mo-mentum will continue. funds are not an is-sue: PE firms can draw on a collective war chest that was worth $375 billion as of may 2012. although that’s down from the $435 bil-lion at the end of 2010 and well below the $497 billion peak at year-end 2009, when most firms were sitting on their capital rather than using it for m&a, it’s still, in absolute terms, potent dealmaking fuel.
a bigger challenge for PE firms is finding enough good deals. the relentless focus on cutting costs since the recession means that there are fewer quick wins available for bot-tom-line improvement. and the days when PE firms could create value primarily through leverage are long past.
in the future, then, generating value will de-pend more on a PE firm’s ability to make op-erating improvements in each portfolio com-pany and to develop and grow its business. given the meager expectations for economic growth, that’s a tough challenge.
Value of dealsNumber of deals
145
1999
10592
Number of deals5,000
4,000
3,000
2,000
1,000
0
1,000
800
600
400
200
0
Average 284
2011
368
267
2009
128
360
2007
966
555
2005
440
232
2003
131100
2001
89
May 2012
375
500
400
300
200
100
0Dec2011
371
Dec2010
435
Dec2009
497
Dec2008
497
Dec2007
447
Dec2006
380
Dec2005
259
Dec2004
177
Dec2003
186
PostcrisisPrecrisis
$billions $billionsDevelopment of PE activity1 Cash war chest
+12%
+38%
Sources: BCG m&A research Center; Thomson reuters sDC Platinum; Preqin; BCG analysis.Note: Analysis is based on completed deals, including buyouts or financial-sponsor involvement with at least 75 percent of shares acquired.1Buyout and balanced funds only.
Exhibit 3 | Private Equity Has Been Recovering Quickly, Amassing a War Chest of More Than $370 Billion
10 | Plant and Prune
as a result, PE firms have been experiment-ing with a range of models for delivering op-erational value—to the point where there is a growing standardization throughout the sec-tor—to practices for improving portfolio com-panies’ operations. So far, standardization has been limited mainly to initiatives that im-prove these businesses’ bottom line—initia-tives such as promoting lean manufacturing and improving pricing capabilities.
not the nicest Car ride for shareholdersfor those who have invested heavily in m&a, 2011 was not the prettiest of years. overall, the shareholders of both acquirers and target companies have been doing more wishing and hoping than celebrating.
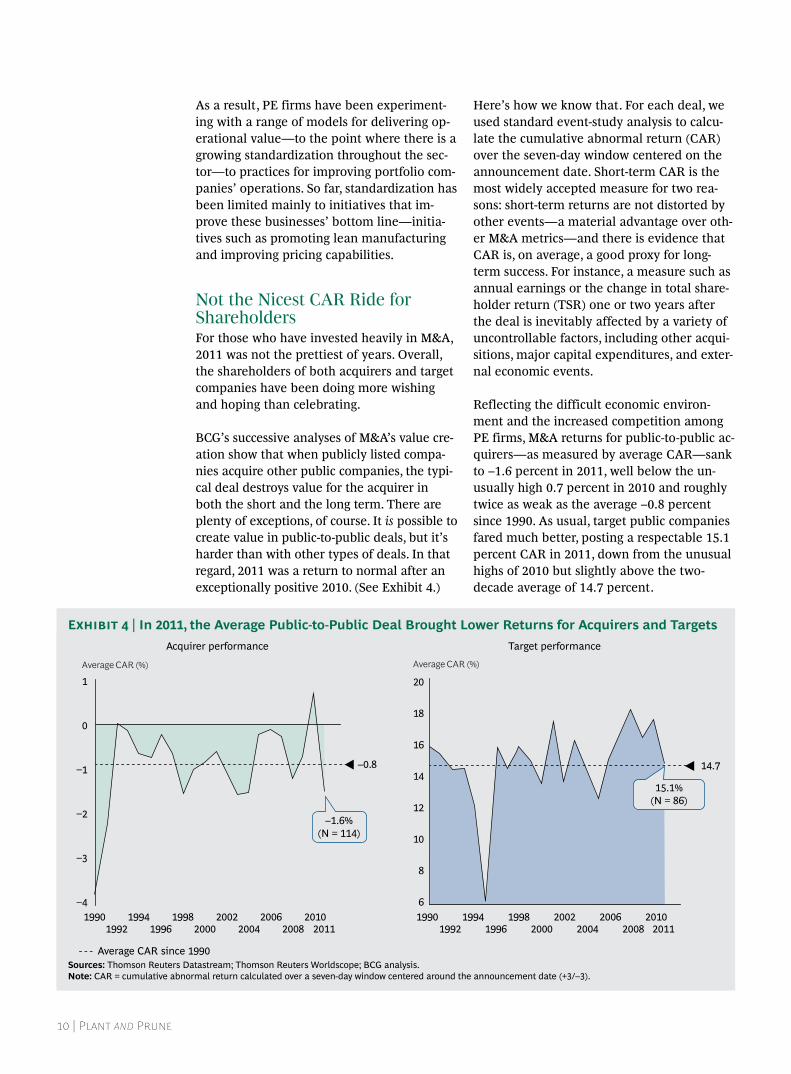
Bcg’s successive analyses of m&a’s value cre-ation show that when publicly listed compa-nies acquire other public companies, the typi-cal deal destroys value for the acquirer in both the short and the long term. there are plenty of exceptions, of course. it is possible to create value in public-to-public deals, but it’s harder than with other types of deals. in that regard, 2011 was a return to normal after an exceptionally positive 2010. (See Exhibit 4.)
here’s how we know that. for each deal, we used standard event-study analysis to calcu-late the cumulative abnormal return (car) over the seven-day window centered on the announcement date. Short-term car is the most widely accepted measure for two rea-sons: short-term returns are not distorted by other events—a material advantage over oth-er m&a metrics—and there is evidence that car is, on average, a good proxy for long-term success. for instance, a measure such as annual earnings or the change in total share-holder return (tSr) one or two years after the deal is inevitably affected by a variety of uncontrollable factors, including other acqui-sitions, major capital expenditures, and exter-nal economic events.
reflecting the difficult economic environ-ment and the increased competition among PE firms, m&a returns for public-to-public ac-quirers—as measured by average car—sank to –1.6 percent in 2011, well below the un-usually high 0.7 percent in 2010 and roughly twice as weak as the average –0.8 percent since 1990. as usual, target public companies fared much better, posting a respectable 15.1 percent car in 2011, down from the unusual highs of 2010 but slightly above the two- decade average of 14.7 percent.
Average CAR (%)
1
0
1
2
3
4
–0.8 14.7
Average CAR (%)
20
18
16
14
12
10
8
61990 1994
1992 19961998
2000 2004 2008 201120102002 2006 1990 1994
1992 19961998
2000 2004 2008 201120102002 2006
–1.6%(N = 114)
Acquirer performance Target performance
15.1%(N = 86)
Average CAR since 1990Sources: Thomson reuters Datastream; Thomson reuters Worldscope; BCG analysis.Note: CAr = cumulative abnormal return calculated over a seven-day window centered around the announcement date (+3/–3).
Exhibit 4 | In 2011, the Average Public-to-Public Deal Brought Lower Returns for Acquirers and Targets

The Boston Consulting Group | 11
the picture is different for public-to-private m&a—that is, public companies’ acquisitions of private companies or subsidiaries. in 2011, that subcategory produced positive short-term shareholder returns—as they usually do. however, the figures for both categories—ac-quisitions of private companies and private-company subsidiaries—were below their long-term averages. Public-to-private compa-ny deals earned a 0.4 percent car for the year, well below the 1.4 percent average since 1990. (See Exhibit 5.) Public companies buy-ing subsidiaries fared only slightly better in 2011, with a car of 0.6 percent, again well below the long-term average of 1.8 percent for that category.
there have been bright spots, or course. Several sectors showed positive CAr for the average acquirer.
there have been bright spots, of course. Sever-al sectors showed positive car for the average acquirer: manufacturing at 1.9 percent, con-sumer nondurables at 1.7 percent, and utilities at 0.6 percent. certain examples were eye-catching: catalyst health Solutions’ $525 mil-lion purchase of walgreens health initiatives in march 2011 produced a car of close to 24
percent. the following month, the $366 million acquisition of Permian Basin oil properties by w&t offshore showed a car of more than 13 percent. Such exceptional returns highlight the importance of identifying the factors that cre-ate both short- and long-term value.
acquisitions in financial services—the indus-try with the highest volume of deals—aver-aged a car of just 0.4 percent. Some big banks are still digging out from problems asso-ciated with the megadeals of 2008 or are deal-ing with piles of bad assets. the industries whose performance was worst were telecom-munications, with a car of –2.2 percent, and consumer durables, at –1.5 percent. investors remain ambivalent about the telecom sector for several reasons: quite a few operators, whose revenue performance has been hurt by relatively high unemployment rates in many mature economies, have had to invest massive amounts of capital to pave the way for growth.
Performance at each extremewhat accounts for the relatively poor short-term shareholder performance in 2011? one common explanation—the general propensi-ty to overpay—does not apply here. the aver-age bid premium (the amount by which the target’s offer price exceeds its closing stock price one week before the original announce-ment date) fell to 29 percent. that’s roughly 25 percent lower than in 2010 and significant-
Public-to-public deals Public-to-private deals Public-to-subsidiary dealsAverage CAR (%)4
3
2
1
0
–1
–2
–3
–4 –4
Average CAR (%)4
3
2
1
0
–1
–2
–3
–4
–1
–2
–3
Average CAR (%)4
3
2
1
0
–1.6%(N = 114)
0.4%(N = 517)
0.6%(N = 510)
19901994
19982002
20062010
2011 19901994
19982002
2006 20112010
19901994
19982002
2006 20112010
–0.8%
1.4%1.8%
Average CAR since 1990Sources: Thomson reuters Datastream; Thomson reuters Worldscope; BCG analysis.Note: CAr = cumulative abnormal return calculated over a seven-day window centered around the announcement date (+3/–3).
Exhibit 5 | Performance Has Been Below Average for All Types of Targets

12 | Plant and Prune
ly below the two-decade average of 34 per-cent. (See Exhibit 6.)
a more thorough investigation of the anato-my of low returns reveals that they were pri-marily the result of what occurred at the ex-tremes—that is, among deals with the largest losses (cars less than –10 percent) and the largest gains (cars higher than 10 percent).
fully 14 percent of public-to-public deals in 2011 suffered large losses: considerably more large-loss deals than the two-decade average of 9.9 percent. moreover, in 2011, there were relatively few large-gain deals to offset the large-loss deals. and because the volume of public-to-public deals surged in 2011 to mod-erately outweigh the volume of the other cat-egories, the large-loss deals had a big effect.
looking at deals whose targets were private companies or subsidiaries, we see that re-turns were also driven down by the behavior of extreme-performance deals—among the upside deals. for both categories (private com-panies and subsidiaries), a sharp degradation of large-gain deals caused average perfor-mance to decline. Experience suggests that
such declines are the result of capital market skepticism spilling over into m&a markets: initial judgments of transactions that are widely expected to succeed are reshaped by concerns about factors such as complex post-merger integration, meaning that the deal is subject to a hefty discount.
Why investors are still skeptical Bcg sees two significant reasons for investors’ skepticism—a characteristic that was very much in evidence in 2011. to begin with, in-vestors may be suspicious of companies that have plenty of cash on hand, reasoning that these companies may well be subject to less scrutiny from creditors and more inclined to “gut driven” decision making. the deeper the corporate cash pile, the more likely the share-holders will be to pressure management to do something with it. under such conditions, m&a holds many more attractions than divi-dend disbursements and investments in or-ganic growth—attractions that include “em-pire building.”
the proof is in Bcg’s numbers. cash-poor ac-quirers—those with cash-to-total-assets ratios
Acquisition premium over timeAverage one-week deal premium¹ (%)50
45
40
35
30
25
201991
34%
2011200920072005200320011999199719951993
–25%
Average since 1990Sources: Thomson reuters Datastream; Thomson reuters Worldscope; BCG analysis.Note: n = 4,085.1The acquisition premium is the amount by which the target’s offer price exceeds its closing stock price one week before the original announcement date; the top 2.5 percent of deals were excluded to reduce distortion by outliers.
Exhibit 6 | Deal Premiums Dropped by 25 Percent from 2010 Through 2011
The Boston Consulting Group | 13
in the lowest quartile of all companies (the average cash-poor company’s ratio is about 1 percent)—have slightly outperformed the cash rich (those in the top quartile, with an average ratio of about 34 percent) by 0.1 per-centage points of car, short term. this differ-ence materialized in 2011, when acquirers, with significantly more cash, had a ratio of 17.1 percent—4.6 percentage points higher than the long-term average. at that level, which could signal wasteful behavior, the cash requirements were usually too high for investors’ tastes.
the language of debt cov-enants often limits M&A transactions.
the second reason for investors’ wariness is their understanding that low debt leverage implies lighter monitoring by lenders. the converse is true: companies carrying signifi-cant debt are generally accountable to their lenders; the language of debt covenants often limits m&a transactions without the banks’ explicit say-so.
again, the numbers bear this out. acquirers with high debt leverage—defined as compa-
nies with debt-to-total-assets ratios in the top quartile of all companies (the average is 53 percent)—outperform those with low debt (the lowest quartile, with debt-to-total-assets averaging 3.4 percent) by 0.7 percentage points of car. high leverage indicates more monitoring by external lenders, bringing an added measure of confidence. in 2011, acquir-ers’ average debt-to-total-assets ratio of 21.4 percent—fully 4.9 percentage points lower than the long-term average—indicated to in-vestors that the quality of external monitor-ing was comparatively low.1
So do acquirers’ stunted returns and the lack of investor enthusiasm mean that m&a is doomed to fail? not at all. as noted earlier, strategically prepared m&a exemplars use these dog days to reconsider the value of each component of their portfolio of assets—wheth-er they are business units, divisions, or stand-alone companies. one area in which they excel: divesting assets that others consider more valu-able. indeed, Bcg’s most recent analysis con-firms that divestiture has much more potential to add value than is commonly believed.
note1. See ronald w. masulis, cong wang, and fei xie, “corporate governance and acquirer returns,” Journal of Finance 62, 2007.

14 | Plant and Prune
looking aneW at the value of divesting
Now is not the time to keep an iron grip on every corporate asset. it is the time to
consider which business units (or entire companies) could conceivably be assets in play. the fundamental question is this: might those assets be more valuable to another company’s shareholders than they are to yours? that’s a truly strategic question.
the economic tea leaves indicate that the di-vestiture pipeline will remain healthy for at least the next few years. the pool of willing
buyers has expanded now that valuation lev-els are relatively low, asian companies are on the prowl, companies are flush with cash, and the PE sector remains very much in the game.
the fact is that divestitures—sales of corpo-rate subsidiaries to publicly listed compa-nies—have steadily gained importance in overall m&a activity worldwide. in 2011, di-vestitures accounted for 45 percent of all deals, up 5 percentage points from the 1990s. (See Exhibit 7.) one-quarter of the European
2000–2005 (N = 8,267)
4520
10
0
45
41 41
Divestitures (public to subsidiaries)
4339
1990–1999(N = 9,437)
16
40
25
35
Public to public
100
Public to private
80
2011 (N = 1,141)
60
2006–2010 (N = 7,376)
40
21
Role of divestitures over timeDeals (%)Deals (%)100
80
60
40
Downturns(N = 10,123)
20
Upturns (N = 16,098)
0
43
22
35
39
20
41
+10 percentagepoints
–15 percentage points
+5 percentage points
1990–1999 versus 2011 Role of divestitures in turbulent times
Sources: Thomson reuters Datastream; Thomson reuters Worldscope; BCG analysis.Note: All investigations are based on a sample of 26,221 global m&A transactions; because of rounding, not all percentages add up to 100.
Exhibit 7 | Divestitures Are Gaining More and More Importance

The Boston Consulting Group | 15
cEos who responded to Bcg’s survey expect to make divestitures in 2012, up 4 percentage points since the 2010 survey.
leading companies have active, ongoing programs of divestitures and acquisitions.
companies divest assets, divisions, or entire businesses for a host of reasons. they may be disposing of noncore operations in order to narrow the business focus, raise funds so that they can make other acquisitions, or let go of underperforming operations that fit better with another owner.
however, many leading companies continual-ly transform themselves with active, ongoing programs of divestitures and acquisitions. a number of companies, including Siemens, Philips, unilever, BP, and invensys, have each undertaken more than ten sizable divesti-tures (valued at more $25 million apiece) since 1990 and have acquired, on average,
about eight companies during the same peri-od. (See Exhibit 8.)
the true standouts, or portfolio masters, are the conglomerates that have the ability to create value through material divestments. (See Exhibit 9.) Philips stands out for hav- ing created the most shareholder value, on average, for each of its 23 divestitures. (See the sidebar “masters of reinvention through m&a.”)
a few other snapshots: Samsung Electronics has shown an average annual tSr of 23 per-cent since 1990. in January 2011, it acquired a display technology firm, liquavista. on July 1, 2011, the South korean electronics giant sold its solar-cell business. and in april 2012, it merged with Samsung’s light-emitting-diode company and spun off its own liquid-crystal-display business. in the u.S., Stryker, a medi-cal-technology company, was busy, acquiring four businesses and selling one product line. its tSr has averaged 17 percent over the last dozen years. and global software giant SaP, with recent acquisitions and divestments un-der its belt, recorded a tSr of 20 percent from 1990 through 2011.
Divestment activity of individual companies
4
92
3
196
2
390
1
1,639
59
5
58
1,700
300
200
100
0
Number of sizable (>$25 million) divestments, 1990–2011
Number of companies
>10
37
10
18
9
11
8
25
7
23
6
Average numberof acquisitions,1990–2011
2.3 3.4 4.0 5.2 5.3 6.7 6.0 9.1 4.7 4.6 8.1
Selected companies: Siemens, Philips, Unilever, BP, and
Invensys
Sources: Thomson reuters Datastream; Thomson reuters Worldscope; BCG analysis.Note: For each divestment, we required sufficient data, including the availability of the parent company’s short-term performance.
Exhibit 8 | Many Leading Companies Buy and Sell Continually to Optimize the Value and Composition of Their Portfolios

16 | Plant and Prune
Sources: Thomson reuters Datastream; Thomson reuters Worldscope; BCG analysis.Note: industry classifications are based on the Fama-French 12-industry scheme; CAr = cumulative abnormal return calculated over a seven-day window centered around the announcement date of all material divestments (+3/–3); wealth creation is calculated as the sum of both firms’ market-capital changes divided by the sum of both market capitalizations before the deal; only deals >$25 million are included.
Exhibit 9 | The Top Ten Value Creators in Terms of Number of Divestments
Rank Company Location IndustryNumber of
divestmentsAverageCAR (%)
Average wealth creation (%)
Number of acquisitions
1 invensys United Kingdom Business equipment 27 1.1 0.9 18
2 BP United Kingdom energy 26 1.1 1.3 3
3 Philips netherlands Consumer durables 23 2.2 2.2 14
4 exxon United states energy 22 0.2 0.2 1
5 el Paso United states Utilities 22 1.5 1.8 6
6 Unilever United Kingdom Consumer nondurables 20 1.7 1.8 5
7 siemens Germany Business equipment 17 0.9 1.0 14
8 Hitachi Japan Manufacturing 13 1.5 1.6 3
9 AXA France Financial services 13 1.0 1.3 6
10 e.On Germany Utilities 13 0.7 0.5 3
Siemens is one of the most active deal-makers. An accounting of its M&A since 1990 shows that the electronics and electrical-engineering conglomerate has divested more than 250 businesses or divisions worth a total of $30.7 billion, while making more than 400 acquisitions valued collectively at $43 billion. That’s an average of almost three deals every month.
The logic behind Siemens’ M&A engine: guide the portfolio toward growth markets and market leadership, and divest units that don’t consistently meet profitability targets.
In 2007, for example, Siemens sold its automotive-electronics unit to Continental for $15.6 billion not long after it acquired Bayer Diagnostics and Diagnostic Prod-ucts for $5.3 billion.
Active portfolio optimization is one factor that has helped Siemens outperform the broad stock indexes since the late 1990s. Since 1996, Siemens has clocked up an annual TSR of 8.6 percent, which com-pares favorably with 6.5 percent for the S&P 500.
IBM, although not one of the top ten value creators in terms of divestitures, is among the most striking examples of reinvention through divestitures and acquisitions. Since 1992, the company has transformed itself from a company known largely for its computer hardware to a provider of integrated hardware-and-software services.
IBM divested a large part of its hardware business through five major deals totaling $15.8 billion, including the bold sale of the PC business to China’s Lenovo for $1.8 billion. At the same time, it was making four major acquisitions, totaling $36.4 billion, in software and consulting companies, including Cognos, a developer of business intelligence and performance-planning software, for $5.3 billion.
The strategy paid off and then some: IBM expanded both its revenues and profit margins over the course of its transforma-tion. Its average annual TSR since 1992 has been 12.7 percent. The comparable figure for the S&P 500 is 7.9 percent.
MASTERS Of REINvENTION THROugH M&A

The Boston Consulting Group | 17
selloffs: a smart Way to sharpen operations overall for sellers, divestitures can be an effective means for improving overall operating per-formance. Bcg’s research shows that over the past two decades, the parent company’s earn-ings before interest and taxes (EBit) in-creased by almost 7 percentage points from one year before a deal announcement to one year after. (See Exhibit 10.)
one caveat: the size of the deal matters. a company with operating problems would be advised to undertake a large divestiture, be-cause small divestitures don’t make much of a difference.1 this is true in terms of stock market reactions as well as internal margin changes. the average car of a parent com-pany’s large divestiture (4.5 percent) is 3.9 percentage points higher than that of a small divestiture (0.7 percent). for financially dis-tressed companies—those with interest cover-age ratios below 1—the deal size factor is even more critical: those organizations’ large divestments yield a car 4.9 percentage points higher than the car of very small di-vestitures.
consider the case of invensys, a u.k. soft-ware and process-control company that man-aged to dodge bankruptcy by rigorously exe-
cuting a $10 billion asset-disposal program. from 1994 through 2004, invensys divested almost half of its assets through six major deals. the company then restructured its debt to cut costs. this combined program im-proved EBit margin by roughly 10 percent-age points from 2002 through 2007, and lia-bilities declined from $10 billion in 1998 to $3 billion in 2008. Proof positive: invensys has ranked among the top ten value creators through material divestments over the past two decades.
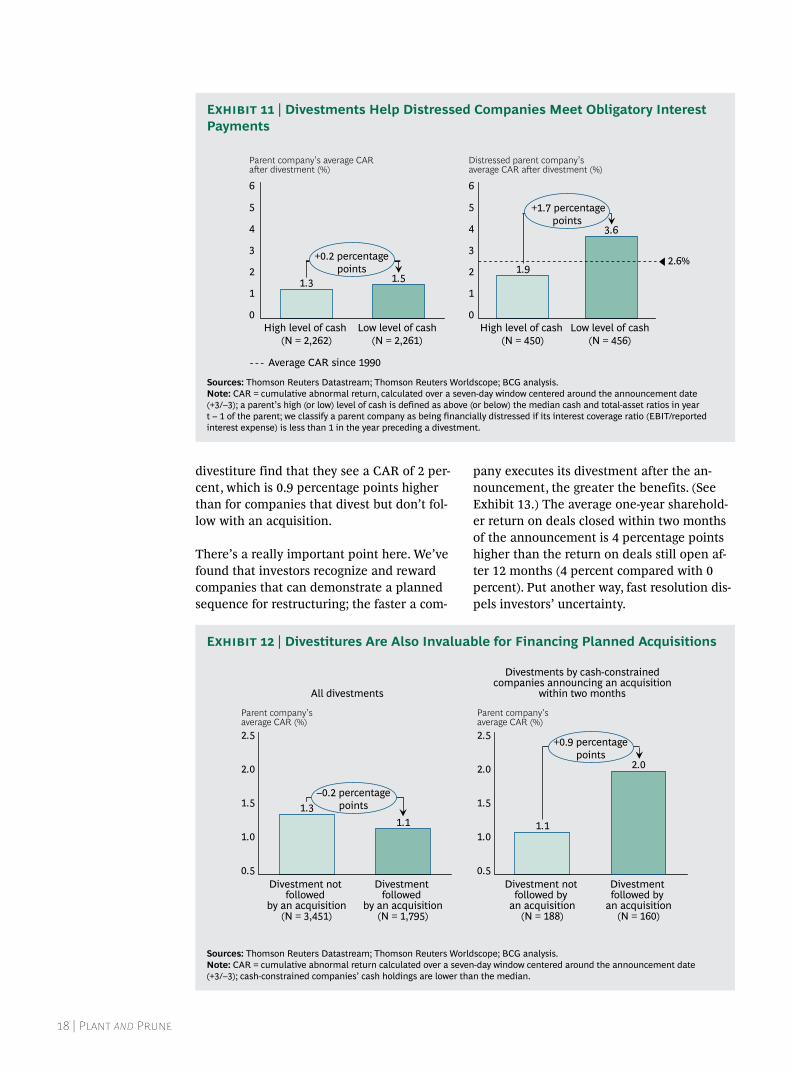
selloffs Produce a Bounce in Car divestments can help companies meet their financial obligations. (See Exhibit 11.) com-panies that are financially distressed (with an interest coverage ratio below 1 in the year preceding divestment) and that have low levels of cash (with a cash-to-total-assets ratio that is lower than the median) can divest their assets to generate an average car of 3.6 percent—1.7 percentage points higher than companies that aren’t under cash constraints.
divestments can also help free up cash for ac-quisitions planned earlier. (See Exhibit 12.) cash-constrained companies that announce an acquisition in the two months following a
Development of a parent’s operating performance
Parent company’s average EBIT margin (%)12
9
6
3
0
–6.3 percentagepoints
t + 1
10.6
t
9.0
t – 1
2.2
t – 2
8.5
Announcement of divestment (years)
+6.8 percentagepoints
Sources: Thomson reuters Datastream; Thomson reuters Worldscope; BCG analysis.Note: n = 4,887.
Exhibit 10 | Divestments Markedly Improve a Company’s Operating Performance
18 | Plant and Prune
divestiture find that they see a car of 2 per-cent, which is 0.9 percentage points higher than for companies that divest but don’t fol-low with an acquisition.
there’s a really important point here. we’ve found that investors recognize and reward companies that can demonstrate a planned sequence for restructuring; the faster a com-
pany executes its divestment after the an-nouncement, the greater the benefits. (See Exhibit 13.) the average one-year sharehold-er return on deals closed within two months of the announcement is 4 percentage points higher than the return on deals still open af-ter 12 months (4 percent compared with 0 percent). Put another way, fast resolution dis-pels investors’ uncertainty.
Distressed parent company’s average CAR aer divestment (%)
6
5
4
3
2
1
0High level of cash
(N = 450)
1.9
+1.7 percentagepoints
Low level of cash (N = 456)
3.6
Parent company’s average CARaer divestment (%)
6
5
4
3
2
1
0Low level of cash
(N = 2,261) High level of cash
(N = 2,262)
1.3 1.5
2.6%+0.2 percentagepoints
Average CAR since 1990
Sources: Thomson reuters Datastream; Thomson reuters Worldscope; BCG analysis.Note: CAr = cumulative abnormal return, calculated over a seven-day window centered around the announcement date (+3/–3); a parent’s high (or low) level of cash is defined as above (or below) the median cash and total-asset ratios in year t – 1 of the parent; we classify a parent company as being financially distressed if its interest coverage ratio (eBiT/reported interest expense) is less than 1 in the year preceding a divestment.
Exhibit 11 | Divestments Help Distressed Companies Meet Obligatory Interest Payments
All divestments
Divestments by cash-constrainedcompanies announcing an acquisition
within two months
Parent company’s average CAR (%)2.5
2.0
1.5
1.0
0.5Divestment
followed by an acquisition
(N = 1,795)
1.1
Divestment not followed
by an acquisition(N = 3,451)
1.3 1.5
1.0
0.5Divestment followed by
an acquisition(N = 160)
2.0
Divestment not followed by
an acquisition(N = 188)
1.1
Parent company’s average CAR (%)2.5
2.0
–0.2 percentagepoints
+0.9 percentagepoints
Sources: Thomson reuters Datastream; Thomson reuters Worldscope; BCG analysis.Note: CAr = cumulative abnormal return calculated over a seven-day window centered around the announcement date (+3/–3); cash-constrained companies’ cash holdings are lower than the median.
Exhibit 12 | Divestitures Are Also Invaluable for Financing Planned Acquisitions

The Boston Consulting Group | 19
When Both sides Benefitall the indications are that investors view divestitures positively because such moves clearly make the case for change on both sides of the deal. investors also appreciate the willingness of some divesting companies to downsize if necessary.
there is strong evidence of this stance in our analysis of divestiture returns. the average short-term car for acquirers of divested as-sets over the past two decades is 2.1 percent, and 58 percent of such deals have created positive value for the new shareholders. (See Exhibit 14.) that’s far higher than the 0.7 per-cent car for nondivestment deals. for parent company sellers, the short-term car average is lower but still significant, at 1.3 percent; some 54 percent of divestment deals have created value for the seller.
there is a similar pattern for relative total shareholder return (rtSr) one and two years after the deal announcement date. (See ap-pendix i for a discussion of this concept.) rtSr has averaged 6.6 percent and 7.7 percent, re-spectively, for acquirers. for the divesting firm, the returns have averaged 3.2 percent over one year and 5.1 percent over two years.
seven Principles for successful divestiturewhat does a successful divestiture look like? we have identified seven core principles at work in the companies that make their dives-titures perform well, regardless of their moti-vations for selling.
Tamp down the emotion: decide 1. objectively and make sure the decision is in sync with the company’s strategy. ideally, a divestiture should be a strategic opportunity rather than a desperate attempt to generate cash or stem losses. with that in mind, it’s important to review the portfolio, asking the following ques-tions about each business unit:
what is the unit’s fundamental ǟstrategic potential?
what is the business’s potential return ǟon investment?
what is our ownership advantage? can ǟwe realize the unit’s inherent value?
One effective way to clarify whether and when the company should systematically
RTSR gauged by time between announcement and closing
Parent’s average 1-year RTSR (%) 5
4
3
2
1
>12 months(N = 71)
0.0
6–12 months(N = 403)
0.5
3–4 months(N = 1,130)
2.0
0–2 months(N = 3,304)
4.0
Time from announcement to closing
0
–4.0 percentagepoints
Sources: Thomson reuters Datastream; Thomson reuters Worldscope; BCG analysis.Note: The number of observations in this investigation (n = 4,908) is slightly lower than that in the overall divestment sample owing to data limitations; rTsr = relative total shareholder return after the announcement date.
Exhibit 13 | Quickly Closing Deals Dispels Uncertainty and Unlocks the Benefits of Divestments

20 | Plant and Prune
pursue divestitures is to refer to the c-curve concept, which Bcg developed in the 1990s. using this concept, a company can assess the merits of shrinking the investment base by divesting poorly performing assets before returning to the acquisition trail.
Know the value of the business that is 2. for sale: be clear about the factors that will really drive value for the divest-ment candidate’s acquirers. once you have determined that a particular business is a good candidate for divesti-ture, the central concern is how to position the unit so that it appears ready to generate value for the new owners, thus becoming an attractive candidate for acquisition.
let’s consider the equity carve-out, in which the divested business becomes a publicly held entity with new sharehold-ers. to ensure that the business can stand on its own, the current owner should carefully review the proposed new entity along several dimensions, including financial and legal concerns, the transfer
of functions, the relationship, if any, with the parent, and possible resource needs. Employees, contracts, customer informa-tion, and it systems will have to be part of the transaction. capabilities across the value chain will need to be assessed, and where deficiencies or gaps are identified, there must be a formal plan to bridge those gaps.
to determine the divested entity’s future relationship with the divesting company or other business units, it’s necessary to start with a map of current interentity relationships—for example, another business unit’s supply of a particular input that is valued at a certain amount. then it’s time to design the contractual relationship that will exist with the unit after divestiture through service-level or transition-level agreements. internal revenues must be translated into external revenues, transfer pricing must be adjust-ed to arm’s length pricing, and shared-service contracts must be rewritten.
the next step is to develop a process flow for the newly carved-out entity, including
Short-term CAR Medium-term (one-year) RTSR Long-term (two-year) RTSR
40
30
20
10
0
58.0Positive
deals (%)
60
50
Average CAR(%)
3
2
1
0Divesting company (N = 5,246)
1.3
54.0
Acquiring company
(N = 5,246)
2.1 10
8
6
4
2
Positivedeals (%)
60
50
40
30
20
10
0
Average 1-year RTSR (%)
12
0Divesting company
(N = 4,908)
3.2
49.8
Acquiring company
(N = 4,711)
6.6
46.750
40
30
20
10
Positivedeals (%)
60
0
Average 2-year RTSR (%)
12
10
8
5.1
47.9
Acquiring company
(N = 4,536)
7.7
45.3
6
4
2
0Divesting company
(N = 4,730)
0.7 2.33.5
Average acquirer CAR for all nondivestment (subsidiary) deals since 1990
Sources: Thomson reuters Datastream; Thomson reuters Worldscope; BCG analysis. Note: CAr = cumulative abnormal return calculated over a seven-day window centered around the announcement date (+3/–3); rTsr = relative total shareholder return.
Exhibit 14 | Divestitures Are Wins for Both New and Former Owners in the Short Term

The Boston Consulting Group | 21
arrangements for overhead functions and internal services such as legal, finance, and it. then comes development of a fully loaded p&l as a standalone profit center. all of these considerations came into play when thyssenkrupp, a german steelmaker and engineering company, recently decided to sell inoxum, its stainless-steel division. (See the sidebar “the benefits of a dual-track Approach to divestiture.”)
Time the deal right: figure out what 3. drives the industry’s cycle and then jump in. as with all other types of deals, the timing of a divestiture is crucial. optimal timing calls for a deep under-standing of what drives economic cycles in the relevant industry. one attractive option when markets are healthy is an initial public offering for the potential spinoff. the best approach is not to wait for iPo conditions to improve but to get ready now. iPo opportunities can all too easily slam shut without warning, which is what happened in the summer of 2011. companies that were still preparing for
their public debuts after the markets had picked up in 2010 were forced to postpone their plans when market turmoil returned.
it generally takes from 9 to 12 months to prepare for an iPo. ambitious companies should do most if not all of the prepara-tory work before the market begins to recover. the success of an iPo may depend on being ready to seize the opportunities as soon as they materialize.2
Practice “serial dating”: ensure that 4. you are always working with a sizable pool of potential buyers. companies should exploit their industry expertise and knowledge of the asset in question to attract not just any buyer but the best set of potential buyers. it pays to look beyond traditional competitors and the usual financial investors by defining a broader universe of potential buyers, getting to know their investment preferences, and assessing potentially good fits with the portfolio company. Essentially, dealmakers have to balance the complexity of evaluat-ing a range of businesses with the need to
When ThyssenKrupp decided to sell Inoxum, it took care to clarify the factors that would drive value for the divestment candidate’s acquirers, building a detailed plan for creating a cohesive spinoff busi-ness. It also opted for a dual-track process to significantly improve the chances of success.
Essentially, the dual-track route balances the best of a conventional M&A approach with the best of a public offering. The dual-track route adds significant complexity to the deal, but it also offers important process flexibility and the potential for valuation upside.
Inoxum had been a highly cyclical under-performer, but it was judged to have appeal to buyers looking to consolidate the stainless-steel industry. To make the deal
work, ThyssenKrupp needed to design a viable business plan with new long-term manufacturing contracts. And because there were concerns about a weakening market for initial public offerings, it had to conclude the deal within 12 to 18 months.
A carefully designed carve-out, an efficient IPO process, and close monitoring all contributed to the successful sale to finland’s Outokumpu. With the European Commission’s approval of the transaction, the acquisition will make Outokumpu the world’s largest stainless-steel producer. On January 31, 2012, the day the deal was announced, ThyssenKrupp’s share price rose by 2.5 percent, and it gained another 2.7 percent the following day.
THE BENEfITS Of A DuAL-TRACK APPROACH TO DIvESTITuRE

22 | Plant and Prune
have enough companies in the mix to keep the bidding competitive.
questions to ask include the following: what companies are looking to enter the industry or a new region? which of them share the same customers? what compa-nies could best leverage the particular set of assets and liabilities that are up for sale? what is the chance that, in divesting this business, we might inadvertently create a strong new competitor to our other businesses?
looking beyond the usual suspects will likely increase the number of legitimate buyers that make it to the final stage of the bidding process. that, in turn, will help the seller capture the asset’s maxi-mum value.
Tell a great story: the facts are crucial, 5. but a compelling, customized narrative is what gets buyers excited. you must not assume that all investors and poten-tial buyers will know the rationale for the sale or that they will share your perspec-tive on the market. a compelling equity story will explain in detail how a buyer can generate sustainable value from the business and, therefore, why buyers should be willing to pay a high premium to acquire the asset.
the facts are crucial, but a compelling, customized narrative is what gets buyers excited.
An effective story is grounded in a clear understanding of the industry context—including profit pools, product life cycles, and competitive trends. if the business being divested is performing poorly, the equity story should include a turnaround plan that shows the valuation upside. and in times of high uncertainty, it’s essential to proactively address any limitations to the business plan. dealmakers often find that their external partners can help with
this. Because they work with investment banks, strategy consultants are positioned to tell the dealmaker’s story objectively in the context of its market dynamics and in ways that can make it appealing to potential acquirers.
as the sales process proceeds, the story will need to be fine-tuned to the needs of specific potential buyers. for each pros-pect, the trick is to demonstrate that there is untapped value that can be unlocked through synergies with the buyer’s strategy. it is also important to identify and confront potential deal breakers before entering into serious negotiations. and it is sensible to review the business plan, ensuring that it will stand up to the scrutiny of the fiercest interrogation during the due-diligence phase.
Set up a “command center”: run 6. divestitures systematically through a dedicated divestiture project office. for the typical executive, the natural inclina-tion is to close the deal quickly—no matter the price. But that approach almost always leaves money on the table. the best approach is for the selling company to have a dedicated divestiture project office that does not distract senior management from the day-to-day running of the business. such an office should sit outside the core organization structure and be staffed with business development specialists who coordinate responses to the many concerns—about, for example, tax, pension, and antitrust issues—that can surface during a sale. many leading companies do already have dedicated offices to manage M&A activities, but many of those offices are underrated and underutilized and, therefore, fall far short of their potential. furthermore, even the most effective M&A offices tend to focus on acquisitions rather than divestitures.
A dedicated office is especially relevant when a company is selling numerous businesses simultaneously or when the business to be sold is strongly embedded in the parent. in most cases, the office should start with the smallest and sim-plest businesses to be sold. once its

The Boston Consulting Group | 23
staffers have refined their processes, they can turn to the sale of more complex businesses. for embedded businesses, the office should develop a clear carve-out plan and related transition service agreements.
Communicate clearly, promptly, and 7. frequently: investors have a need to know (and they’ll reward you for satisfying that need). investors require clear and active communication. they place a premium on solid information presented in a convincing business case. But investors and potential buyers are rarely the only parties that influence a deal’s success. customers, employees, suppliers, local governments, regulators, and unions can be just as important, depending on the situation. So it’s crucial to have a unified message, to stay on that message, and to keep ahead of undesired information leaks by getting the story out promptly and regularly. the goal is to minimize rumors and defang potential criticism.
thyssenKrupp can point to the benefits of proactive communication. in may 2011, the conglomerate successfully communi-cated the restructuring plans for its noncore businesses. it focused on three
elements of communication: linking divestments to its overall corporate strategy and showing how the plan was a key element of a refocused portfolio; explaining the motivation (to seize opportunities in faster-growing, higher-margin business units and to reduce debt); and listing the businesses to be divested, totaling approximately €10 billion and 35,000 employees.
when thyssenkrupp announced the divestment program in may 2011, the seven-day car hit an astonishing 8.1 percent, and the share price exceeded its benchmark index by 22 percent over a 30-day window. as one credit Suisse analyst put it, “the restructuring is more revolution than the slow evolution we expected, and it will unlock significant shareholder value.”
notes1. “large” refers to top-quartile transactions whose value averages 82 percent of the acquirer’s market capitalization before the deal; “small” means deals in the lowest quartile whose transaction-value percentage is just 0.3 percent.2. See No Time Like the Present to Plan an IPO: Prepared Companies Will Be First in the Queue When Markets Recover, Bcg report, october 2011.

24 | Plant and Prune The Boston Consulting Group | 24
AsiA Asserts itself— esPeCially With out-Bound deals
Divestitures aside, there is still a need to sharpen the pencil and do a better job
of preparing to make acquisitions. there’s plenty of pencil sharpening going on in asia these days. the two-decade growth in the number of acquisitions worldwide by compa-nies from the Asia-pacific region did not gear down much in 2011. although m&a growth
in the region was sharpest from 1999 through 2003, it remains robust—for a host of reasons. (See Exhibit 15.)
But first, let’s consider the context. overall, m&a activity in 2011 was still dominated by western companies; asian buyers were in-volved in about 14 percent of the deals, just
Number of M&A transactions, 1990–2011 Value of M&A transactions, 1990–2011
CAGR, 1990–2011
CAGR, 1990–2011
CAGR,2000–2011
90
80
0201120071991
Global deal volume (%)1
100
200319991995
Asian acquisitions in other markets All other dealsAsian acquisitions in established markets
90
1995 1999 201120031991 2007
100
Global deal value (%)2
0
8086.1
12.6
1.3
85.3
0.5
7.1
93.2
0.4
6.13.7
95.8
0.7
12.8
1.5
86.5
13.2
0.7+7% +6%
+13% +4%
+5% –1%92.5
12.8
2.3
96.6
3.03.7
0.6
7.8
0.5
94.8
0.8
7.0
1.6
4.9
91.6
0.3
91.584.9
95.5
+9% +11%
+13% +4%
+8% –6%
CAGR, 2000–2011
Sources: BCG m&A research Center; Thomson One Banker.Note: Because of rounding, not all percentages add up to 100. 1Total of 422,384 completed m&A transactions with no transaction-size threshold; excludes repurchases, exchange offers, recapitalizations, and spinoffs. 2enterprise value includes net debt of target.3established markets are defined as north America and europe.
Exhibit 15 | Asia’s Share of the Global M&A Market Has Increased Significantly

The Boston Consulting Group | 25
slightly less than in 2010. the value of asian deals was about 15 percent of the global total.
hunger for established-market targetson the basis of their sound economic funda-mentals, dynamic asian companies with growing appetites for m&a are no longer snapping up targets in emerging markets only. while asian challengers grow rich with cash and more sophisticated, they have been look-ing at the established u.S. and European mar-kets. they are moving up the value chain to acquire technology, natural resources, brands, and other valuable assets. Established mar-kets still account for a minority of deals by asian acquirers and a very small share of all deals globally, but that is changing. in the past decade, the number of asia-to-estab-lished-market deals rose by a cagr of 6 per-cent, while the deal value rose even fast-er—11 percent per year. for comparison, both the number and the value of asia-to-non-established-market deals grew at just 4 per-cent annually.
But within the region, there are huge differ-ences in the nature of the deals being pur-sued. developed markets such as Japan are still in the m&a game, but because of the na-tion’s lost economic decade, Japanese acquisi-tion activity merits far less attention than it did during the 1980s and 1990s, when Sony and matsushita bought hollywood movie stu-dios and tire maker Bridgestone bought fire-stone. there are differences, too, in estab-lished-market acquisitions. companies based in Singapore, hong kong, and other asian countries lost share in the asian outbound- acquisition category over the course of 2011—and continue to lag in that respect—while india and china were and continue to be very strong outbound players.
india’s acquisition appetiteindian companies have been expanding their share of asia-to-established-market deals over the past ten years. indian acquirers ac-counted for 39 percent of that subcategory of asian deals from 2006 through 2011, up from 33 percent from 2001 through 2005. many of these buyers are looking for access to custom-
ers and superior technologies, and they have had a particular appetite for British targets. for instance, in 2007, indian cable maker Par-amount communications purchased aEi ca-bles, a 170-year-old maker of cables in the u.k., and in 2009 Samvardhana motherson group acquired visiocorp, a British automo-tive-mirror company. But perhaps the most telling example is tata motors, which in 2008 paid ford $2.3 billion to buy car brands Jag-uar and land rover. this marked the first major appearance of an indian automaker in the western world.
if india has been Asia’s out-bound-acquisitions tiger, Chi-na has been, yes, its dragon.
at first, investors deemed the deal a strategic failure, resulting in a car of –8.8 percent. tata motors shares underperformed the broader automotive index for a year, as tata experienced a loss caused by a slump in land rover sales, which drained cash flow. howev-er, the acquisition proved ingenious once sales of luxury vehicles rebounded. Jaguar land rover accounted for 95 percent of tata motors’ 2011 profits, and 63 percent of tata motors’ sales were from outside india, up sharply from 18 percent in 2008. tata motors generated an impressive 15 percent operat-ing-profit margin, compared with 2011 mar-gins of 12 percent for Bmw’s automotive business and 9 percent for mercedes-Benz’s car division.
the strategic rationale Behind China’s movesif india has been asia’s outbound-acquisi-tions tiger, china has been, yes, its dragon. chinese companies have been very aggres-sively pursuing outbound transactions in north america and Europe since 2007. chi-na’s share of asia-to-established-market deals was 15 percent from 2006 through 2011, up from 11 percent from 2001 through 2005.
Behind china’s assertive moves lie crucial fac-tors that business leaders in the rest of the

26 | Plant and Prune
world must not ignore. china’s twelfth five-year Plan—the national government’s official economic policy—calls for the development of seven strategic industries: energy savings and environmental protection, new informa-tion technology, biotechnology, high-end equipment manufacturing, new and renew-able energy, new materials, and new-energy vehicles. the government claims that the val-ue-added output of these industries will in-crease to 15 percent of china’s gdP by 2020.1
technology executives worldwide have no doubts about the seriousness of china’s in-tentions. according to a recent survey, they believe that china’s investments in innova-tion put the nation in pole position to deliver disruptive technologies very soon.2 the up-shot for m&a: in many cases, chinese compa-nies whose outbound-acquisition activity sup-ports the nation’s strategic objectives are less concerned about return-on-equity numbers than about the long-term strategic signifi-
cance of what they’re bidding on. for many potential sellers in the developed world, that perspective can seem quite alien. But it is crucial to acknowledge it.
there are plenty of examples of this strategic quest in action. Both Sinochem group and china Petroleum & chemical, for instance, have made major oil acquisitions in latin america. china aviation industry general aircraft has expanded its technical capabili-ties by buying u.S.-based cirrus aircraft, and dicastal wheel manufacturing, a maker of aluminum alloy wheels, followed a similar logic with its acquisition of germany’s kSm castings. and early in 2012, Sany heavy in-dustry announced an agreement to buy, in partnership with a chinese PE firm, germa-ny’s Putzmeister holding, a world leader in high-technology concrete pumps. china is the world’s largest market for such pumps. (See the sidebar “china climbs the value ladder.”)
One of the best examples of China’s strategic approach to acquisitions is the recent purchase of Putzmeister Holding by Sany Heavy Industry, one of China’s leading construction-equipment makers. It is not the first acquisition of an advanced-engineering company by a Chinese con-cern, and it is not likely to be the last.
Together with CITIC PE Advisors, a Chinese PE firm, Sany is purchasing 100 percent of Putzmeister. The german company’s hometown will become Sany’s new head-quarters for concrete machinery. Sany is reported to have already invested more than $160 million in factories in germany and the u.S.
Sany’s move is just the latest in a string of acquisitions of storied german engineering companies by Chinese companies. gold-wind, a Chinese wind-turbine manufacturer, bought vensys in 2008 in order to develop bigger turbines for its domestic market. Kiekert, a maker of automotive door-lock systems, has been sold to Lingyun Indus-
trial group, a subsidiary of China North Industrial group, which is a government-owned conglomerate that manufactures motorcycles, cars, trucks, machinery, and military weaponry. Chinese solar-panel maker LDK Solar plans to buy germany’s Sunways.
“The Chinese are no longer just buying up nearly bankrupt consumer-electronics manufacturers or second-class solar companies, as has been the case in recent years,” noted a recent article in Der Spiegel. “Instead, they are now setting their sights on the ‘hidden champions,’ the low-profile global market leaders that are typical of german industry.”1
Note1. “Buying germany’s Hidden Champions: Takeover Could Signal New Strategy for China,” february 9, 2012, Spiegel Online International.
CHINA CLIMBS THE vALuE LADDER

The Boston Consulting Group | 27
if today’s economic fundamentals are any guide, asian companies’ shopping tour is all set to roll onward. there’s a strong correla-tion between gdP growth and deal value growth, and the forecast for economic growth over the next five years in the asia-Pacific re-gion is much more positive than for growth in Europe or north america. (See Exhibit 16.)
notes1. See “china Sets growth target for new Strategic industries by 2015,” xinhua news agency, march 2011.2. See “china Projected to Be on Par with uS as a future tech innovation leader; cloud, mobile to drive Breakthroughs in coming years,” kPmg press release, June 27, 2012.
Growth (%)
10
8
6
4
2
0
2
4
62016
6.6
1.62.3
2012200820042000
Asia-PacificEuropeNorth AmericaAsia-PacificEuropeNorth America
ForecastMainly20002011
Historic relationship between economic and M&A growth Real GDP
All years,19902011
Mainly19901999
’00
’98
’97’96’95
’94
’92
’91
’90
’11’10
’08
’06
’04
’03
’02
’01
’00
’98’97
’95
’93’90
Deal value¹8
7
6
5
4
3
210.09.89.69.49.29.08.88.68.4
’11’10
’09
’08’09
’08
’07
’06
’05’04
’03’02
’00
’97 ’96
’95
’94’93
’05
’03
’01
’92’91
’90
’11’07
Nominal GDP¹
Sources: BCG m&A research Center; Thomson One Banker; eiU; international monetary Fund, World economic Outlook.1natural logarithm of deal value and nominal GDP.
Exhibit 16 | Asia’s Shopping Trips Are Set to Continue While Western Markets Grow More Cautious

28 | Plant and Prune
We’re not yet seeing the return of 2008’s happy glow. yes, there will continue to be
a steady undercurrent of opportunistic deals, but 2012 will hardly go down in the history books as a great year for dealmaking. volatility will be the defining characteristic of the economic landscape for some time to come.
however, despite continuing uncertainty about a good resolution to the euro crisis
and serious doubts about the pace of economic growth worldwide, there were squeaks of genuine optimism during the third quarter of 2012; in 2011, 16 percent of European cEos said that they were likely or very likely to execute a large-scale acquisition, up from 15 percent one year earlier. (See Exhibit 17.) and among large corporations—those with sales of more than €15 billion—fully one-third are likely
PreParing for tomorroW’s deals
Companies likely to conduct large-scale acquisitions in the next year
114
1
2009
5910
33
33
14
Very unlikely
1
2008
37
58
25
33
20
72
100
50
0
Respondents (%)
Don’t knowDefinitely won’t
Unlikely
Likely
Very likelyDefinitely will
2011
31
124 4
2010
69
6
32
37
Optimistic
Pessimistic
Source: UBs and BCG CeO/senior management m&A survey 2008, 2009, 2010, and 2011.Note: large-scale acquisitions are defined as those involving a target with sales of more than €500 million: because of rounding, not all percentages add up to 100.
Exhibit 17 | Europe’s CEOs Remain Enthusiastic About Doing Deals

The Boston Consulting Group | 29
to make large acquisitions before the end of 2012.1
But uncertainty about the likelihood of an im-minent rebound in dealmaking should in no way deflect business leaders’ attention from m&a as a truly strategic tool for buoying shareholder value. Essentially, what’s needed now is an m&a perspective that supports the continual optimization of a portfolio of assets. these are the days for coolly reevaluating the value of every asset in the corporate portfolio, assessing each for its long-term value to your shareholders in light of its value to other inves-tors. and these are the best times to be look-ing for acquisition opportunities that, when properly integrated, will add significant value to your company over the long haul.
furthermore, quieter times like these are the very best times to fine-tune and lubricate the organization’s dealmaking machinery—to en-sure that key executives know their roles, to underscore unanimity in the top-manage-ment suite about the influence of acquisitions and divestitures on value, and to make sure that the financial mechanisms are free enough to enable prompt responses when op-portunities open up.
note1. See M&A: Using Uncertainty to Your Advantage: A Survey of European Companies’ Merger and Acquisition Plans for 2012, Bcg and uBS investment Bank report, december 2011.

30 | Plant and Prune
ChanCe favors the Well-PrePAred Acquirer
What specific moves should business leaders be making to ready their
organizations for tomorrow’s deals? time and again, across all kinds of industries and geographies, bcG has identified the following imperatives.
Prepare thoroughly before a deal materializes. Early preparation is essential. it’s hard to predict when an opportunity will surface. Being able to seize a favorable position depends on identifying and screening targets in advance so that the company can be ready to pounce when prices for attractive targets start falling. deal-savvy companies ensure that they have explicit breakdowns of the relative contributions of inorganic and organic growth to their long-term business objectives. they are clear about the value of pursuing acquisi-tion targets in adjacent industries as well as targets in their own industries. they have very clear roles and responsibilities for dealmaking, and the responsibility for identifying potential targets is shared widely throughout the c-suite. Some of the best-prepared companies even hold mock board meetings where hypothetical deals are discussed.
strike when the time is right. timing is crucial. indeed, it is more of a factor than ever before. today, windows of opportunity are narrower, financing conditions change faster, due diligence is accelerated by the intensity of the competition, and dealmaking
processes are becoming more and more professionalized. a good time to pursue acquisitions is just at the start of a recovery in the global economy. of course, it is extremely difficult to forecast economic turning points, but there will be signs—for example, a reduction in order backlogs—in one’s own industry. companies can also create superior value at the start of an m&a wave in their industry. in both instances, first-mover advantage stems from there being less competition from other bidders. furthermore, valuations will not yet have been bid up.
Companies can also create superior value at the start of an M&A wave.
Actively target private companies or subsid-iaries. it is important for business leaders to get regular updates and valuations on poten-tial opportunities—private companies or subsidiaries as well as publicly owned targets. Public companies that buy private companies or subsidiaries fare better—by 2.3 percentage points of car—than those that acquire other public companies. in many cases, private targets are more attractive because their typical lack of liquidity means that they usually sell at a discount.

The Boston Consulting Group | 31
Be clear about what distinguishes foreign deals from domestic deals. investors tend to prefer cross-border deals if the target is publicly held and domestic deals if the target is private. why? Bcg’s experience indicates that investors believe that they can more easily assess the value of a foreign target if it is listed—a clear plus since they already view cross-border deals as more complex than domestic transactions. when the target is a private company or a subsidiary of a listed company, domestic deals produce marginally higher short-term returns than acquisitions abroad. the value of a private company or a divested subsidiary in another country is much harder for investors to gauge. what investors are looking for is the growth poten-tial in foreign acquisitions, especially when companies expand into robust emerging markets. But because of the cultural and logistical complexities of running a new foreign operation, cross-border deals can be riskier.
Understand which deals call for cash and which call for stock. for public targets, paying with cash is preferable because it reduces management’s discretionary funds and signals strong belief in the deal. howev-er, in acquisitions of private companies, stock is often the better choice: the former owner becomes a major shareholder that may be highly motivated to monitor the investment closely and hold management to high standards.
companies that prepare well today for the next surge in global m&a activity will be able to act when the time is right—for them. they will have the knowledge, the resources, and the dealmaking processes in place to move promptly, intelligently, and forcefully. that’s a recipe for delivering value under any market conditions.

32 | Plant and Prune
aPPendix iMetHodoloGy
the research that underpins this report was conducted by the Bcg m&a research center during the first half of 2012. the results are based on analyses of two different data sets that total more than 430,000 m&a transactions.
General Market Trends. • we analyzed all reported m&a transactions from 1981 through the beginning of 2012. for the analysis of deal values and volumes, we excluded those marked as repurchases, exchange offers, recapitalizations, and spinoffs.1
Shareholder Value Created and Destroyed by •M&A. we analyzed more than 26,000 deals with available data involving publicly listed acquirers and all kinds of targets (public companies, private compa-nies, and subsidiaries of listed companies) from 1988 through 2011, focusing on the largest transactions.2 to ensure that sufficient explanatory data would be available, we set the minimum transaction size at $25 million.
short-term value Creationalthough distinct samples were required in order to analyze different issues, all valu-ation analyses employed the same econo-metric methodology. for any given company i and day t, the abnormal (that is, unexpect-ed) returns (ari,t) were calculated as the de-
viation of the observed returns (ri,t) from the expected returns E(ri,t). (See Equa-tion 1.)
Equation 1
ARi,t = Ri,t – E(Ri,t)
E(Ri,t) = αi + βi Rm,t + εi,t
ARi,t = Ri,t – (αi + βi Rm,t )
Pstart = average [Pt–60’ Pt–30]P1yr = average [Pt+350’ Pt+380]P2yr = average [Pt+715’ Pt+745]
TSRacq. = P1yr ,acq. / Pstart ,acq. –1
TSRindex = P1yr ,index / Pstart ,index –1
RTSRacq = (TSRacq / TSRindex) –1
CARi = (Ri,t – E(Ri,t))Σt=–3
+3
following the most commonly used approach, we employed a market model estimation to calculate expected returns.3 (See Equation 2.)
Equation 2ARi,t = Ri,t – E(Ri,t)
E(Ri,t) = αi + βi Rm,t + εi,t
ARi,t = Ri,t – (αi + βi Rm,t )
Pstart = average [Pt–60’ Pt–30]P1yr = average [Pt+350’ Pt+380]P2yr = average [Pt+715’ Pt+745]
TSRacq. = P1yr ,acq. / Pstart ,acq. –1
TSRindex = P1yr ,index / Pstart ,index –1
RTSRacq = (TSRacq / TSRindex) –1
CARi = (Ri,t – E(Ri,t))Σt=–3
+3
the derived alpha (αi) and beta (βi) factors are then combined with the observed market returns (rm,t). (See Equation 3.)
Equation 3
ARi,t = Ri,t – E(Ri,t)
E(Ri,t) = αi + βi Rm,t + εi,t
ARi,t = Ri,t – (αi + βi Rm,t )
Pstart = average [Pt–60’ Pt–30]P1yr = average [Pt+350’ Pt+380]P2yr = average [Pt+715’ Pt+745]
TSRacq. = P1yr ,acq. / Pstart ,acq. –1
TSRindex = P1yr ,index / Pstart ,index –1
RTSRacq = (TSRacq / TSRindex) –1
CARi = (Ri,t – E(Ri,t))Σt=–3
+3
See the exhibit “Event Study Setup” for a graphical representation.4 we derive the cumulative abnormal return, or car, by aggregating the abnormal returns (that is, the difference between actual stock returns and those predicted by the market model) day by day throughout the event period extending from three days before to three days after the announcement date. (See Equation 4.)

The Boston Consulting Group | 33
Equation 4
long-term value Creationthe long-term value-creation study uses the data sample applied in the event study analy-sis as a starting point. we then track the stock market performance of the acquirers over a two-year period following the acquisition an-nouncement. note that we cannot track the targets owing to their delisting from the pub-lic-equity markets in most cases.
first, we measure absolute total shareholder return (atSr) generated by the acquirer from the starting price (Pstart) over a 365-day (one-year return) period (P1yr), as well as over a 730-day (two-year return) holding period (P2yr). (See Equation 5.) to avoid short-term distortions, we use the same time periods and averages as for the market performance of the acquirers.
Equation 5
ARi,t = Ri,t – E(Ri,t)
E(Ri,t) = αi + βi Rm,t + εi,t
ARi,t = Ri,t – (αi + βi Rm,t )
Pstart = average [Pt–60’ Pt–30]P1yr = average [Pt+350’ Pt+380]P2yr = average [Pt+715’ Pt+745]
TSRacq. = P1yr ,acq. / Pstart ,acq. –1
TSRindex = P1yr ,index / Pstart ,index –1
RTSRacq = (TSRacq / TSRindex) –1
CARi = (Ri,t – E(Ri,t))Σt=–3
+3
Second, we subtract from the atSr the return made by a benchmark index over the same period to find the relative total shareholder return (rtSr) generated by the acquirer―in other words, the return in ex-
cess of the benchmark return.5 (See Equa-tion 6.)
Equation 6
ARi,t = Ri,t – E(Ri,t)
E(Ri,t) = αi + βi Rm,t + εi,t
ARi,t = Ri,t – (αi + βi Rm,t )
Pstart = average [Pt–60’ Pt–30]P1yr = average [Pt+350’ Pt+380]P2yr = average [Pt+715’ Pt+745]
TSRacq. = P1yr ,acq. / Pstart ,acq. –1
TSRindex = P1yr ,index / Pstart ,index –1
RTSRacq = (TSRacq / TSRindex) –1
CARi = (Ri,t – E(Ri,t))Σt=–3
+3
note that we cannot include deals undertak-en in 2010 and 2011 because the time elapsed since the announcement is too short to calculate the long-term relative returns.
notes1. these are transactions that do not result in a change in ownership. Exchange offers seek to exchange consideration for equity or securities convertible into equity.2. announcement dates include the years 1988 through 2011, and closing dates extend from 1990 through 2011.3. See Eugene f. fama, lawrence fisher, michael c. Jensen, and richard roll, “the adjustment of Stock Prices to new information,” International Economic Review 10, february 1969; and Stephen J. Brown and Jerold B. warner, “using daily Stock returns: the case of Event Studies,” Journal of Financial Economics 14, 1985.4. as proxies for the market portfolio, we apply thomson reuters sector indexes, thus controlling for industry idiosyncrasies.5. the benchmark indexes we apply are the relevant worldwide thomson reuters sector indexes.
–200 –3
0
Announcement date
+3Days
Estimationperiod
(180 days)
Event period(7 days)
Grace period(17 days)
–21
Source: BCG analysis.
Event Study Setup
ARi,t = Ri,t – E(Ri,t)
E(Ri,t) = αi + βi Rm,t + εi,t
ARi,t = Ri,t – (αi + βi Rm,t )
Pstart = average [Pt–60’ Pt–30]P1yr = average [Pt+350’ Pt+380]P2yr = average [Pt+715’ Pt+745]
TSRacq. = P1yr ,acq. / Pstart ,acq. –1
TSRindex = P1yr ,index / Pstart ,index –1
RTSRacq = (TSRacq / TSRindex) –1
CARi = (Ri,t – E(Ri,t))Σt=–3
+3

34 | Plant and Prune
Appendix iiRefeRences
2010 2010 2010 2010 2011 2011
2011 2011 2011 2011 2011 2011
2011 2011 2011 2011
2011 2011
US OTC Assets
2011 2011 2011 2011 2011 2011
2011 2011 2011 2011
New Zealand Franchise
2011 2011
2011 2011 2011 2011 2011 2011
2012 2012 2012 2012
2009 2009 2010 2011
2011 2011 201120112011
2010
Moncure facility
2009
Strategic advisorto the buyer
€220M
Strategic advisorto the buyer
€921M
Strategic advisorto the buyer
€106M
Strategic advisorto the buyer
$335M
Strategic advisorto the buyer
Not disclosed
Strategic advisorto the buyer
€280M
Strategic advisorto the buyer
€900M
Strategic advisorto the buyer
€156M
Strategic advisorto the buyer
€498M
Strategic advisorto the buyer
Not disclosed
Strategic advisorto the buyer
$200M
Strategic advisorto the buyer
$100M
Strategic advisorto the buyer
€220M
Strategic advisorto the buyer
$530M
Strategic advisorto the buyer
€997M
Strategic advisorto the buyer
Not disclosed
Strategic advisorto the buyer
€418M
Strategic advisorto the buyer
Not disclosed
Strategic advisorto the buyer
€162M
Strategic advisorto the buyer
$78M
Strategic advisorto the buyer
$170M
Strategic advisorto the buyer
$27M
Strategic advisorto the buyer
$661M
Strategic advisorto the buyer
$854M
Strategic advisorto the buyer
Not disclosed
Strategic advisorto the buyer
Not disclosed
Strategic advisorto the buyer
€150M
Strategic advisorto the buyer
$87M
Strategic advisorto the buyer
€700M
Strategic advisorto the buyer
$34M
Strategic advisorto the seller
€810M
Strategic advisorto the seller
€752M
Strategic advisorto the seller
$520M
Strategic advisorto the seller
€188M
Strategic advisorto the seller
€1,140M
Strategic advisorto the buyer
$160M
Strategic advisorto the buyer
€202M
Strategic advisorto the seller
Not disclosed
Strategic advisorto the buyer
Not disclosed
Strategic advisorto the buyer
€1,800M
Strategic advisorto the buyer
$4,306M
Strategic advisorto the buyer
$4,000M
Strategic advisorto the seller
$1,985M
Strategic advisorto the buyer
Not disclosed
Strategic advisorto the buyer$19,479M
Strategic advisorto the buyer
$474M
Strategic advisorto the buyer
$1,600M
Strategic advisorto the buyer
Not disclosed
Strategic advisorto the buyer
$2,075M
Strategic advisorto the seller
$56M
Strategic advisorto the seller
Not disclosed
Private-Equity Transactions
The Boston Consulting Group | 35
2010 2010 2010 2010 2011 2011
2011 2011 2011 2011 2011 2011
2011 2011 2011 2011
2011 2011
US OTC Assets
2011 2011 2011 2011 2011 2011
2011 2011 2011 2011
New Zealand Franchise
2011 2011
2011 2011 2011 2011 2011 2011
2012 2012 2012 2012
2009 2009 2010 2011
2011 2011 201120112011
2010
Moncure facility
2009
Strategic advisorto the buyer
€220M
Strategic advisorto the buyer
€921M
Strategic advisorto the buyer
€106M
Strategic advisorto the buyer
$335M
Strategic advisorto the buyer
Not disclosed
Strategic advisorto the buyer
€280M
Strategic advisorto the buyer
€900M
Strategic advisorto the buyer
€156M
Strategic advisorto the buyer
€498M
Strategic advisorto the buyer
Not disclosed
Strategic advisorto the buyer
$200M
Strategic advisorto the buyer
$100M
Strategic advisorto the buyer
€220M
Strategic advisorto the buyer
$530M
Strategic advisorto the buyer
€997M
Strategic advisorto the buyer
Not disclosed
Strategic advisorto the buyer
€418M
Strategic advisorto the buyer
Not disclosed
Strategic advisorto the buyer
€162M
Strategic advisorto the buyer
$78M
Strategic advisorto the buyer
$170M
Strategic advisorto the buyer
$27M
Strategic advisorto the buyer
$661M
Strategic advisorto the buyer
$854M
Strategic advisorto the buyer
Not disclosed
Strategic advisorto the buyer
Not disclosed
Strategic advisorto the buyer
€150M
Strategic advisorto the buyer
$87M
Strategic advisorto the buyer
€700M
Strategic advisorto the buyer
$34M
Strategic advisorto the seller
€810M
Strategic advisorto the seller
€752M
Strategic advisorto the seller
$520M
Strategic advisorto the seller
€188M
Strategic advisorto the seller
€1,140M
Strategic advisorto the buyer
$160M
Strategic advisorto the buyer
€202M
Strategic advisorto the seller
Not disclosed
Strategic advisorto the buyer
Not disclosed
Strategic advisorto the buyer
€1,800M
Strategic advisorto the buyer
$4,306M
Strategic advisorto the buyer
$4,000M
Strategic advisorto the seller
$1,985M
Strategic advisorto the buyer
Not disclosed
Strategic advisorto the buyer$19,479M
Strategic advisorto the buyer
$474M
Strategic advisorto the buyer
$1,600M
Strategic advisorto the buyer
Not disclosed
Strategic advisorto the buyer
$2,075M
Strategic advisorto the seller
$56M
Strategic advisorto the seller
Not disclosed
Corporate Transactions

36 | Plant and Prune
for further reading
The Boston Consulting Group publish-es other reports and articles on the topic of m&A that may be of interest to senior executives. recent examples include:
Maintaining M&A Momentum in Chemicals: A Perspective for 2012 and Beyond A report by The Boston Consulting Group, may 2012
The BCG 2012 Investor Survey: Back to the FutureAn article by The Boston Consulting Group, April 2012
Collateral Damage: Succeeding in Uncertain TimesA White Paper by The Boston Consulting Group, April 2012
How to Be a Good Corporate Parent: First, Do No HarmA report by The Boston Consulting Group, march 2012
The Power of Diversified Companies During CrisesA report by The Boston Consulting Group and HHl—leipzig Graduate school of management, January 2012
M&A: Using Uncertainty to Your Advantage; A Survey of European Companies’ Merger and Acquisition Plans for 2012A report by The Boston Consulting Group and UBs investment Bank, December 2011
Pharmaceuticals: Using M&A as a Cure; A Perspective for 2012 and BeyondAn article by The Boston Consulting Group, December 2011
No Time Like the Present to Plan an IPO: Prepared Companies Will Be First in the Queue When Markets RecoverA report by The Boston Consulting Group, October 2011
Riding the Next Wave in M&A: Where Are the Opportunities to Create Value?A report by The Boston Consulting Group, June 2011
Does Practice Make Perfect? How the Top Serial Acquirers Create ValueA report by The Boston Consulting Group and HHl—leipzig Graduate school of management, April 2011
Best of Times or Worst of Times? A report by The Boston Consulting Group and rBs, February 2011
Accelerating Out of the Great Recession: Seize the Opportunities in M&AA report by The Boston Consulting Group, June 2010

The Boston Consulting Group | 37
note to the reader
About the AuthorsJens Kengelbach is a partner and managing director in the munich of-fice of The Boston Consulting Group and a member of the firm’s global m&A team. You may contact him by e-mail at [email protected]. Dominic C. Klemmer is a consultant in the firm’s Cologne office and a member of the european Corporate Finance Task Force. You may contact him by e-mail at [email protected]. Alexander Roos is a senior partner and managing director in BCG’s Berlin office and the global leader of the Corporate Development practice area. You may contact him by e-mail at [email protected].
AcknowledgmentsThis report is a product of The Boston Consulting Group’s Corporate Devel-opment practice. The authors would like to acknowledge the contributions of their colleagues Pedro esquivias, Daniel Friedman, Tawfik Hammoud, Gerry Hansell, Jérôme Hervé, Dinesh Khanna, Peter nowotnik, and Daniel stelter.
The authors would also like to thank Blas Bracamonte and Kerstin Hobels-berger of the BCG m&A research Cen-ter, as well as eva Klement and Anke Göhler for their extensive support.
Finally, the authors would like to ac-knowledge John Kerr for his editorial guidance and support during the prep-aration of this report, and Katherine Andrews, Gary Callahan, Angela DiBattista, elyse Friedman, and sara strassenreiter for their contributions to its editing, design, and production.
For Further ContactBCG’s Corporate Development prac-tice is a global network of experts helping clients design, implement, and maintain superior strategies for long-term value creation. The practice works in close cooperation with the firm’s industry experts and employs a variety of state-of-the-art methodolo-gies in portfolio management, value management, mergers and acquisi-tions, and postmerger integration. For more information, please contact one of the following leaders of the practice.
The AmericasDaniel FriedmanSenior Partner and Managing Director BCG los Angeles+1 213 621 [email protected]
Jeff GellSenior Partner and Managing Director BCG Chicago +1 312 993 [email protected]
Jose GuevaraPartner and Managing Director BCG Dallas+1 214 849 [email protected]
Tawfik HammoudPartner and Managing Director BCG Toronto+1 416 955 [email protected]
Gerry HansellSenior Partner and Managing Director BCG Chicago+1 312 993 [email protected]
Joel JandaPartner and Managing Director BCG seattle +1 206 538 [email protected]
Jeffrey KotzenSenior Partner and Managing Director BCG new York+1 212 446 [email protected]
Tom LutzSenior Partner and Managing Director BCG Dallas+1 214 849 [email protected]
John RoseSenior Partner and Managing Director BCG new York+1 212 446 [email protected]
Phillip ShinallPartner and Managing Director BCG Chicago +1 312 993 [email protected]
Eric WickPartner and Managing Director BCG Chicago+ 312 993 [email protected]

38 | Plant and Prune
Europe and the Middle EastVassilis AntoniadesPartner and Managing Director BCG Athens+30 210 7260 [email protected]
Guido CrespiSenior Partner and Managing Director BCG Milan+39 02 65 59 [email protected]
Peter DamischPartner and Managing Director BCG Zurich+41 44 388 86 [email protected]
Eric EllulSenior Partner and Managing Director BCG london+44 207 753 [email protected]
Pedro EsquiviasPartner and Managing Director BCG madrid+34 91 520 61 [email protected]
Lars FæsteSenior Partner and Managing Director BCG Copenhagen+45 7732 [email protected]
Ketil GjerstadPartner and Managing Director BCG Oslo+47 21 04 68 [email protected]
Jérôme HervéSenior Partner and Managing Director BCG Paris+33 1 40 17 10 [email protected]
Jens KengelbachPartner and Managing Director BCG Munich+49 89 231 [email protected]
Markus MassiPartner and Managing Director BCG Dubai+971 4 4480 [email protected]
Peter NowotnikPartner and Managing Director BCG Düsseldorf+49 2 11 30 11 [email protected]
Alexander RoosSenior Partner and Managing Director BCG Berlin+49 30 28 87 [email protected]
Daniel StelterSenior Partner and Managing Director BCG Berlin+49 30 28 87 [email protected]
Rob WolleswinkelPartner and Managing Director BCG Amsterdam+31 20 548 [email protected]
Paul ZwillenbergPartner and Managing Director BCG london+44 207 753 [email protected]
Asia-PacificSoon AhnPartner and Managing Director BCG seoul+82 2 399 [email protected]
Ted ChanPartner and Managing Director BCG Hong Kong+852 2506 [email protected]
Nicholas GlenningSenior Partner and Managing Director BCG Melbourne+61 3 9656 [email protected]
Carl HarrisPartner and Managing Director BCG singapore+65 6429 [email protected]
Junichi IwagamiPartner and Managing Director BCG Tokyo+81 3 5211 [email protected]
Dinesh KhannaPartner and Managing Director BCG singapore+65 6429 2500 [email protected]

The Boston Consulting Group | C
© The Boston Consulting Group, inc. 2012. All rights reserved.
For information or permission to reprint, please contact BCG at:e-mail: [email protected]: +1 617 850 3901, attention BCG/Permissionsmail: BCG/Permissions The Boston Consulting Group, inc. One Beacon street Boston, mA 02108 UsA
To find the latest BCG content and register to receive e-alerts on this topic or others, please visit bcgperspectives.com.
Follow bcg.perspectives on Facebook and Twitter.
9/12

abu dhabiamsterdamathensatlantaaucklandBangkokBarcelonaBeijingBerlinBostonBrusselsBudapestBuenos airescanberracasablancachennai
chicagocolognecopenhagendallasdetroitdubaidüsseldorffrankfurtgenevahamburghelsinkihong konghoustonistanbulJakartaJohannesburg
kievkuala lumpurlisbonlondonlos angelesmadridmelbournemexico citymiamimilanminneapolismonterreymontréalmoscowmumbaimunich
nagoyanew delhinew Jerseynew yorkosloParisPerthPhiladelphiaPraguerio de JaneiroromeSan franciscoSantiagoSão PauloSeattleSeoul
ShanghaiSingaporeStockholmStuttgartSydneytaipeitel avivtokyotorontoviennawarsawwashingtonZurich
bcg.com