report 63 - sgi · report 63 settlements and shear strength increase below embankments –...
TRANSCRIPT

LINKÖPING 2003
STATENS GEOTEKNISKA INSTITUTSWEDISH GEOTECHNICAL INSTITUTE
Repor
t 63
Settlements and shear strengthincrease below embankments– long-term observations and measurement of shearstrength increase by seismic cross-hole tomography
ROLF LARSSON
HÅKAN MATTSSON


STATENS GEOTEKNISKA INSTITUTSWEDISH GEOTECHNICAL INSTITUTE
RapportReport No 63
LINKÖPING 2003
Settlements and shear strengthincrease below embankments– long-term observations and measurement ofshear strength increase by seismic cross-holetomography
ROLF LARSSON, SGIHÅKAN MATTSSON, GeoVista AB

SGI Report No 632
Swedish Geotechnical InstituteSE–581 93 Linköping
SGI Literature serviceTel: +46 13 20 18 04Fax: +46 13 20 19 09E-mail: [email protected]: http://www.swedgeo.se
0348-0755SGI-R--03/63--SE
111551-0103-0168
Swedish Geotechnical Institute
Rapport/Report
Order
ISSNISRN
Project number SGIDnr SGI
©

Seismic cross-hole tomography 3
Preface
This report deals with the long-term settlements of embankments and theaccompanying increase in shear strength. The long-term settlements of embankmentsare important for the required maintenance during their service life and theaccompanying increase in shear strength can be utilised both in the construction ofthe embankment and if it is to be raised or widened at a later stage and/or if the trafficload is to be increased.
Methods for prediction of long-term settlements are being developed all the time.This work requires that reference data are available in terms of long-term settlementrecords and other observations of constructions in areas with thoroughly investigatedsoil conditions. Two such areas are the geotechnical test fields at Lilla Mellösa andSkå-Edeby, where a number of test embankments were constructed 40 – 55 yearsago. The test fields have been supervised by SGI since then and the long-termbehaviour has been monitored regularly. A thorough investigation of the currentstate of the soil below the three embankments that were constructed without anykind of soil improvement or artificial drainage has been made in this project.
If the shear strength increase below an embankment is to be utilised in constructionor to allow increasing loads or speeds, it has to be verified. In this project, a newmethod of assessing the increase in undrained shear strength below embankmentsusing seismic cross-hole tomography has been tested. This method has theadvantage of not requiring access to the embankment itself and provides acontinuous mapping of the properties in the entire soil volume in the investigatedsection, not only in selected test points.
The report is intended for geotechnical engineers who deal with the constructionand maintenance of embankments,who design and carry out field investigationsand who develop methods for prediction of consolidation processes resulting insignificant settlements and shear strength increases.

SGI Report No 634
The part of the project concerning testing of the method of seismic cross-holetomography for assessment of shear strength increase has been performed in co-operation between the Swedish Rail Administration, GeoVista AB and SGI, andthe detailed investigation of the current state of the properties below the embankmentshas been financed by internal funds at SGI.
The authors wish to express their gratitude to colleagues at the Royal Institute ofTechnology for kind assistance with equipment and to Kjell Hidsjö at FM-Geo ABfor well performed field work.
Linköping and Luleå, May 2003
The Authors

Seismic cross-hole tomography 5
Contents
Preface
Summary ............................................................................................. 7
Notations and symbols ................................................................................ 9
1. Purpose and scope of the project ................................................ 10
2. Introduction ........................................................................................ 132.1 Settlements and shear strength increase....................................... 132.2 The test embankments .................................................................. 142.3 Verification of shear strength increase ........................................ 15
3. The test fields ..................................................................................... 163.1 Lilla Mellösa, Upplands Väsby ................................................... 16
3.1.1 History and soil conditions ................................................ 163.1.2 Construction and instrumentation of
the undrained test fill ......................................................... 213.1.3 Measured settlements, settlement distributions,
excess pore pressures and changes in shear strength,preconsolidation pressure and other properties ................. 21
3.2 Skå-Edeby .................................................................................... 283.2.1 History and soil conditions ................................................ 283.2.2 Construction and instrumentation of the undrained
circular test fill ................................................................... 363.2.3 Measured settlements, settlement distributions,
excess pore pressures and changes in shear strength,preconsolidation pressure and other properties ................. 36

SGI Report No 636
3.3 The test embankment ................................................................... 463.3.1 Construction and instrumentation
of the test embankment ...................................................... 463.3.2 Soil conditions ................................................................... 483.3.3 Measured settlements, settlement distributions,
excess pore pressures and changes in shear strength,preconsolidation pressure and other properties ................. 48
4. Measurements with cross-hole tomography ............................. 604.1 Background and hypothesis ......................................................... 604.2 The method .................................................................................. 61
Seismic waves .............................................................................. 61Seismic tomography .................................................................... 62Software for tomography inversion ............................................. 65Field equipment and procedure.................................................... 65
4.3 Results .......................................................................................... 66Data analysis ................................................................................ 66Tomography inversion ................................................................. 70Skå-Edeby .................................................................................... 70Lilla Mellösa ................................................................................ 72
4.4 Discussion of the results .............................................................. 73
5. Correlations between the evaluated results and measuredincrease in shear strength .............................................................. 75
6. Demand for development ................................................................ 84
References ........................................................................................... 85

Seismic cross-hole tomography 7
This report contains updated records of the measurements performed below threetest embankments constructed on soft soil between 40 and 55 years ago. Theseembankments are of particular interest since significant consolidation settlementsare still in progress and significant excess pore pressures still remain below them.Since they have been constructed on natural soil without any soil improvement orinstallation of vertical drains, they have also been considered as best suited for thepilot tests concerning the use of seismic cross-hole tomography for estimation ofshear strength below old embankments.
The report starts with a review of all measurements and observations that have beendone since construction up to the present day. All data that are considered to berelevant for a description of the consolidation processes are included. These datainclude settlements, settlement distributions with depth and across the loadedareas, excess pore pressures, changes in water content, preconsolidation pressure,permeability and undrained shear strength, and in one case also horizontalmovements in the soil.
No new settlement calculations or other predictions of the consolidation processesare presented herein. This was done in SGI Report No. 29 (Larsson 1986) and alllater measurements are close to the courses that were predicted at that time.Detailed information about the compression characteristics of the soils can also befound in that report.
The method of seismic cross-hole tomography has been tried to estimate theincrease in shear strength due to consolidation below the embankments. This studyhas been a pilot project in order to assess if the method can be used in practicalapplications and to what accuracy the shear strength increase can be estimated.
The measurements have been made with readily available commercial equipmentand the evaluation of the shear wave arrival has been made with a built-in functionin the recording instrument. The further evaluations have been made with existing
Summary
SGI Report No 638
methods and programs as they are without any attempts of development withconsideration to the new type of application.
The evaluation in terms of distribution of shear wave velocity is straightforwardand the translation to distribution of undrained shear strength is fairly simple.However, certain aspects have to be observed and a procedure for this is presentedin the report.
The results have provided good overall views of the shear strength increases andtheir distributions and the estimated values are also of the right sizes. They can alsobe considered reliable enough to be used in design if normal caution is taken for thespread in the results of shear strength estimations.
Since the application is new, there is no equipment that is designed for thisparticular purpose. Owing mainly to the source of the seismic waves, the installationof the measuring equipment was relatively laborious, costly and time demanding.The tests were also performed in homogeneous soil profiles in which the pickingof arrival times was straightforward and did not require any filtering of the signals.The geometries of the measured sections were also favourable for this type ofmeasurement.
The evaluation program employed is well tried and can be obtained free of chargefrom the Internet. It worked well in general, but certain anomalies could not beavoided in parts of the profiles with poor ray coverage being located close toborders between materials with very different stiffnesses.
Although the method has been shown to be useful, there is thus room for furtherdevelopment to make it a rational tool for routine investigations of the shearstrength below old embankments.

Seismic cross-hole tomography 9
cu Undrained shear strength
CPT Cone penetration test
CRS Constant rate of strain
f Frequency
G0 Initial shear modulus at small strains
H Inclinometer tube
P Piezometer
S Settlement marker
St Sensitivity
SGI Swedish Geotechnical Institute
Vs Shear wave velocity
wL Liquid limit
wN Water content
wP Plastic limit
ρ Density
σ´0 In situ vertical stress
σ´c Preconsolidation pressure
∆σ Increase in vertical stress
Notations and Symbols

SGI Report No 6310
The purpose of the project was twofold. The first purpose was to test the methodof seismic cross-hole tomography and investigate if and to what accuracy it can beused to determine the shear strength below existing embankments. The origin ofthis part of the project is the current upgrading of the Swedish railway lines forfaster and heavier trains. In this context it will be of great benefit if the shear strengthbelow old embankments on soft soils, which were constructed up to a hundred yearsago, can be utilised. However, this requires that the shear strength increase inrelation to the soil outside the embankment can be verified. Traditional geotechnicalinvestigations require access to the ground at the investigation point and, since nointerruption in the railway traffic can normally be accepted, these investigations areconfined to the area outside the embankment. On the other hand, previousinvestigations have shown that there is a clear relation between the undrained shearstrength in the soil and the shear wave velocity (e.g. Larsson and Mulabdic 1991).Measurement of shear wave velocity below an embankment of limited width canbe made from one side of the embankment to the other by the cross-hole method.Consequently, the measurements do not require access to the embankment itself.However, the shear wave velocities in a soil mass below an embankment and in theembankment itself vary, and to estimate the shear strength variation in the soil, themore elaborate method of seismic cross-hole tomography has to be used. Equipmentand evaluation software for this method is already at hand. The purpose of this partof the project was therefore to investigate whether the shear strength below existingembankments can be estimated accurately enough to provide verification of anyincreased shear strength and to be used in stability assessments.
The second purpose was to obtain a new detailed check of the ongoing consolidationprocesses below three old test embankments constructed on natural ground withoutany vertical drains. The ordinary monitoring of the embankments is today limitedto regular levelling of various settlement markers. During the first years afterconstruction, the monitoring of settlements and pore pressures, and in one casehorizontal displacements was very frequent and a number of sampling operationswere performed to check changes in water content and density as well. However,
Chapter 1.
Purpose and scope of the project
Seismic cross-hole tomography 11
with time the pore pressure gauges and the inclinometer tubes ceased to functionand the rate of settlement and other changes decreased. The readings therebybecame fewer and their spacing in time increased. More thorough investigationswith measurement of pore pressure, undrained shear strength and other soilproperties have then been performed in a few separate research projects. However,the latest such project in any of the embankments was performed 20 years ago. Inconnection with the first part of this project, the shear strength increase below theembankments under which the seismic cross-hole tomography was performed hadto be investigated also by ordinary geotechnical test methods. It was then decidedto make a full investigation to check the current state of the soil below theseembankments also in terms of remaining excess pore pressures, changes in watercontents and densities, developed preconsolidation pressures and any othersignificant parameters. In this way, the determinations of the shear strengthincrease in the field could be supplemented by laboratory tests too. However, themain purpose of this part of the investigation was to provide new relevant data tocheck existing methods of prediction of settlements and shear strength belowembankments and to provide extended references for new ones.
The investigations have comprised seismic cross-hole tomography below the threetest embankments without vertical drains in Lilla Mellösa and Skå-Edeby and in thenatural ground outside the embankments. The embankments are different in shape;one is circular, one is square and one is long and narrow like an ordinaryembankment. Their central parts are instrumented with various iron rods and pipespenetrating the soil mass and, even if they are coated in order not to interact withthe soil mass, they would most probably influence seismic measurements. Thelatter have therefore been performed in parts below the embankments well clear ofany possible influence of these objects. The measurements have been performedwith equipment that was readily available. The only such vibration source was ascrew plate by which vertically polarised shear waves can be created. The receivinggeophones were lowered in special plastic tubes and fixed at predetermined depths.It was apprehended that even slender straight-walled plastic tubes would be too stiffin their axial (i.e. vertical) direction to enable a proper measurement of the arrivalof vertically polarised shear waves to the different levels, and therefore axiallyflexible bellows hoses were used. The bellows hoses were installed about onemonth before the actual measurements to let them become firmly fixed in the soil.
Ordinary soil investigations have been performed below the central parts of theembankments, below the outer parts of the embankments or directly outside and innatural soil well outside the embankments. The natural soil outside the embankmentshas been thoroughly investigated before and here only supplementary CPT tests

SGI Report No 6312
were performed. At the other points field vane tests, CPT tests and undisturbedsampling were performed at every metre depth. Ten pore pressure tips were alsoinstalled at equally spaced depths below the central parts of each embankment.These were monitored continuously until it could be verified that they hadstabilised and were then withdrawn. The samples have been investigated concerningclassification and routine testing of density, water content, liquid limit, fall-coneshear strength and sensitivity. CRS-oedometer tests have also been performed onall samples from all sampling points and levels to determine preconsolidationpressure and permeability. Furthermore, a number of direct simple shear tests havebeen performed to supplement the field vane tests and the CPT tests and a fewtriaxial tests have been performed to check the validity of empirical relationsbetween the “active” shear strength and the preconsolidation pressure.
Seismic cross-hole tomography 13
2.1 SETTLEMENTS AND SHEAR STRENGTH INCREASE
Construction of embankments on soft fine-grained soil deposits often entails bothlarge settlements due to consolidation of the soil and stability problems due toinsufficient shear strength of the soil in its natural state. However, when the soilconsolidates the shear strength increases too. Much of the consolidation occursfairly rapidly after the load application if the consolidation process is speeded upby use of vertical drains or facilitated by natural short drainage paths to coarsepermeable layers. On the other hand, the process takes a considerable time in thickhomogeneous clays layers. Also in a more long-term perspective, there is usuallya slow but steady growth in shear strength with time because of creep deformationsand load increases when the level of the embankment is adjusted to compensate forthe settlements.
It has been shown that there is a direct relation between the preconsolidationpressure in the soil and the undrained shear strength (e.g. Ladd and Foott 1974).This relation is valid independent of whether the preconsolidation pressure hasbeen created directly by an acting effective stress or as an indirect quasipreconsolidation pressure by creep effects. All types of consolidation that meanthat the preconsolidation pressure increases thereby also mean that the undrainedshear strength increases. An increase in the effective stress due to consolidation inoverconsolidated soils also means that the undrained shear strength increases evenif the preconsolidation pressure is not exceeded. This increase, however, isrelatively small.
The increase in shear strength in soft fine-grained soils due to the consolidationunder applied loads is often utilised in stage-construction, whereby the load isapplied in steps with sufficient time intervals in between to let the soil consolidatefor each applied load. In this way, embankments can often be constructed withoutsupporting structures or soil improvement which would be required if theembankment was constructed in a single stage. However, installation of vertical
Chapter 2.
Introduction

SGI Report No 6314
drains is often required to speed up the process. The increase in shear strength canalso be used when old embankments are to be raised and widened, when the trafficload is to be increased, when the traffic speed is to be increased and at anycombination of these factors.
2.2 THE TEST EMBANKMENTS
Calculation methods that take into account both so-called primary consolidationand creep effects have to be used in order to accurately predict the consolidationprocess in terms of both settlements and shear strength increase. Such methods, inwhich the compressive parameters of the soil are functions of time (or rather strainrate), have been successively developed for the last about fifty years. In order tocalibrate these methods, a number of well-documented reference objects have to beavailable with full-scale constructions in the field which have been monitored indetail over a long time. Such reference objects are available at the test fields at LillaMellösa and Skå-Edeby, Fig. 1, where altogether eight test embankments havebeen constructed on soft clay. Most of the embankments were constructed 40–55years ago and vertical drains of different types and spacing were installed belowfive of them. The remaining three embankments were constructed directly on thenatural ground and for these the consolidation process still continues with excesspore pressures created by the applied load still remaining. The results from thesetest fields are fairly unique and they have been used for calibration of calculationmethods all over the world. In fact, the latest results obtained in this investigation
were used in one thesisconcerning calculation ofsettlements even before theywere published (Claesson2003).
Fig.1Location of the test fields atLilla Mellösa and Skå-Edeby.
Mälaren
Stockholm
Skå-Edeby
Lilla Mellösa
VallentunaUpplandsVäsby

Seismic cross-hole tomography 15
2.3 VERIFICATION OF SHEAR STRENGTH INCREASE
If the shear strength increase below an embankment is to be utilised in constructionor to allow increasing loads or speeds, it has to be verified. In stage construction,this is normally done by a control programme with traditional geotechnicalinvestigations of the soil below the construction. Special inspection wells are theninstalled through the embankment during construction, and the tests can beperformed from the bottom of these. Verification of shear strength increase belowold road and railway embankments that are in use constitutes a more difficult task.Normal geotechnical investigations require that holes be taken through theembankment, which is laborious and often entails that part of the soil below isdisturbed. They also require that the traffic be interrupted during the time for thefield tests and sampling operations. Particularly for heavily trafficked railwayembankments, this can seldom be accepted.
In recent years, various geophysical non-intrusive methods of soil investigationshave been tried and implemented in geotechnical investigations. Some of thesemethods, such as seismic refraction and reflection investigations and measurementsof shear wave and compression wave velocities, are well-established whereasmethods such as resistivity measurements and surface wave analyses are still in atrial state. In this project, a new method of assessing the increase in undrained shearstrength below embankments using seismic cross-hole tomography has beentested. This method has the advantage of not requiring access to the embankmentitself and also provides a continuous mapping of the properties in the entire soilvolume in the investigated section, not only in selected test points. The methoditself is not new but has previously among other things been used for location ofburied objects in the ground. However, the application of trying to map the shearstrength in a soil mass has to the authors’ knowledge not been reported before.

SGI Report No 6316
3.1 LILLA MELLÖSA, UPPLANDS VÄSBY
3.1.1 History and soil conditions
History
The test fills at the farm of Lilla Mellösa near Upplands Väsby were constructedby SGI shortly after the institute was founded. They were constructed in connectionwith the search for a suitable site for a new airfield outside Stockholm. At LillaMellösa there was a large, almost flat, area with only scattered farms. The subsoilconditions, however, were less ideal with ten to fifteen metres of soft highlycompressible soils.
Three test fills were constructed in 1945 – 1947, first one with vertical drainsinstalled below it and one on natural ground and later a low fill consisting of theremoved surcharge material from the drained fill. Only the first fill without drainswill be considered in this report, Fig. 2. The fills were instrumented and measurementswere made periodically, but after new test fills had been constructed at Skå-Edebywith improved vertical drains and instrumentation, the interest in the fills at LillaMellösa waned for some time.
In 1966, the test field at Lilla Mellösa came into focus again as Chang (1969)compiled the available earlier data and started new investigations regarding soilcompressibility, pore pressures and settlements using newer and more accurateequipment. This investigation was completed ten years later when Chang (1981)was invited as a guest researcher to SGI. The report from 1969 was then updatedwith the accumulated measurements, new pore pressure measurements and furtherlaboratory investigations. From these investigations, Chang concluded that theobservations in terms of settlements, decrease in water content, pore pressures andundrained shear strength were incompatible with each other on the basis of thencurrent concepts of the process of consolidation.
Chapter 3.
The test fields

Seismic cross-hole tomography 17
The investigations continued with new sampling techniques and oedometer testmethods to accurately determine the compressibility and permeability characteristicsof the soil, and the results from the test field were used in the development of a newcalculation method of consolidation below embankments including creep effects(Larsson 1986).
The measurements at Mellösa have continued, even if much of the originalinstrumentation has ceased to function and the regular measurements are thereforeconfined to total settlements and those settlement markers at various depths thatstill appear to function.
The investigation in this project was performed in May – June 2002 and comprisedlevelling of all markers, sampling, field vane tests and CPT tests at the outer crestof the fill and at its central part and a CPT test well outside the area influenced bythe fill. The pore pressures were measured in a series of piezometers that weremonitored continuously for more than a week in order to verify that stabilised porepressures were read off. The piezometers were then left in place for two moremonths before a final reading was taken and the systems were retracted, Fig. 3. The
Fig. 2. The undrained test fill at Lilla Mellösa in 2002.

SGI Report No 6318
system for pore pressure measurements was selected to obtain a check of a newautomatic data acquisition system for long term observations in the field. Theatmospheric pressure was monitored along with the pore pressure readings and themeasured values were corrected accordingly. When estimating small excess porepressures, there are many factors that are important, such as the accuracy of themeasuring system, the atmospheric pressure, any zero drift in the transducers, theexact levels of the filter tips and the reference pore pressures in the natural ground.Taking all these factors into account, the accuracy of the measurements is estimatedto be within ±2 kPa.
The test field has also been used for a number of other investigations concerningproperties of soft clays. It was thus one of the sites where the new field vaneapparatus was tried out (Cadling and Odenstad 1950). Later research concerningthe vane shear test (Wiesel 1975), undrained shear strength and creep (Larsson1977), quality of undisturbed samples (Larsson 1981), permeability of clay(Carlsten and Eskilsson 1984), dilatometer tests (Larsson and Eskilsson 1988),shear wave velocity and seismic cone tests (Larsson and Mulabdic 1990), CPT testsin clay (Larsson and Mulabdic 1991) and properties of lime and cement columns(Åhnberg et al. 1995) has been carried out at the Lilla Mellösa test field. Samplesfrom Lilla Mellösa were also included in e.g. a study on the permeability of naturalclays performed at Laval University (Tavenas et al. 1983).
Fig. 3. Decommissioning of the pore pressure systems in August 2002.

Seismic cross-hole tomography 19
Soil conditions
A generalised soil profile in natural ground at Lilla Mellösa is shown in Fig. 4.
At the top, there is a layer of about 0.3 metres of organic topsoil which was scrapedoff at the areas for the fills before they were constructed. The dry crust is unusuallythin and consists of organic soil. The desiccated dry crust is limited to 0.5 metresand is underlain with soft clay. The clay has an organic content of about 5 % justunder the crust which decreases with depth and is less than 2 % from 6 – 7 metres’depth and downwards. The colour changes from green to black and becomes greywith depth. The black colour is the result of presence of iron-sulphides whichbetween 2.5 and 6.5 metres depth amount to about 0.5 % of the dry weight of thesoil. The natural water content is about equal to the liquid limit and decreases froma maximum of about 130 % to about 70 % in the bottom layers. The bulk densityincreases from about 1.3 t/m3 to about 1.8 t/m3 at the bottom. The undrained shearstrength has a minimum of about 8 kPa at 3 metres’ depth and increases thereafterwith depth.
The shear strength values in the natural ground were determined by field vane testsin 1964 and 1967 (the present test method was not developed until long after theconstruction of the embankment). The measured values have been correctedaccording to the present SGI recommendation (Larsson et al. 1984).
The clay becomes varved below 10 metres’ depth. The varves are first diffuse butbecome more and more pronounced with depth. At 14 metres’ depth, there is a thinlayer of sand on top of the bedrock.
The pore water pressure in the ground outside the fill is hydrostatic with a groundwater level about 0.8 metres below the ground surface. Very little seasonalvariation has been measured throughout the years.
The soil in the upper two metres is overconsolidated due to dry crust effects. Therest of the soil profile is only slightly overconsolidated with an overconsolidationratio of about 1.15. Further details of the compressibility characteristics are givenin SGI Report No. 29 (Larsson 1986).

SGI Report No 6320
Fig
. 4.
So
il p
rofil
e at
Lill
a M
ellö
sa.

Seismic cross-hole tomography 21
3.1.2 Construction and instrumentation of the undrained test fill
Before the fill was placed, the 0.3 metres of loose organic topsoil were removed.A 2.5 metre high fill of gravel with a density of 1.7 t/m3 was then constructed. Thefill had bottom dimensions of 30 x 30 metres and slopes of 1:1.5. Time forconstruction was 25 days and no change in load other than natural variations hasbeen made after that. The net increase in vertical stress was calculated to 40.6 kPa.
A number of settlement markers and piezometers were installed at various depthsbefore the fill was placed. The piezometers readings proved to be unreliable. Alsothe original settlement markers installed at various depths ceased to function withtime and were replaced with newer models, which in turn have in some casesceased to function with time. The settlement distribution with depth has thereforebeen checked by settlement distributions calculated from the measured changes inwater content. This has been done for the changes estimated in 1967, 22 years afterconstruction, and 2002, 57 years after construction.
New piezometers were installed were installed in 1968. Also these ceased tofunction after a certain period of time and the pore pressures have then beenmeasured by retractable piezometers in 1979 and 2002.
3.1.3 Measured settlements, settlement distributions,excess pore pressures and changes in shear strength,preconsolidation pressure and other properties
The initial settlement during the time of construction amounted to 0.065 metres.The computed “final” settlement when creep effects were disregarded was justbelow 1.4 metres. This amount of settlement was reached in 1966, Fig. 5. At thattime, there were still remaining excess pore pressures in the order of 30 kPa,indicating that almost no increase in effective stress had occurred in large parts ofthe profile, Fig. 6. In 1979, the total settlement was 1.65 metres and the remainingexcess pore pressures were over 20 kPa. The settlements have then continued andwere just over 2.0 metres at the investigation in 2002. The maximum remainingexcess pore pressure at that time is estimated at 12 kPa. The scatter in the latterreadings reflects the inaccuracy of the estimations. The settlements continue, butat a continuously decreasing rate. The current rate of settlement is about 10 mm/year, Fig. 7.
The measured and calculated settlement distributions indicate that the consolidationduring the first years after construction mainly occurred in the uppermost layersand in the layer close to the draining bottom layer, Figs 5 and 8. Due to the large

SGI Report No 6322
Fig. 5. Measured settlements below the undrained test fill at Lilla Mellösa,time in logarithmic scale.
Fig. 6. Excess pore pressures below the undrained test fill at Lilla Mellösa atvarious times.
0
500
1000
1500
2000
2500
10 100 1000 10000 100000
Time, daysSe
ttlem
ent,
mm
0 m
2.5 m
5 m
7.5 m
Depth of marker
0
2
4
6
8
10
12
14
16
0 5 10 15 20 25 30 35
Excess pore pressure, kPa
Orig
inal
dep
th, m
196819792002- " -- " -

Seismic cross-hole tomography 23
compressions in the top layers, the soil here has become overconsolidated andbecause of the reduction in effective stress when large parts of the crust and fillbecome submerged below the groundwater table, the upper layers have for sometime been in a state of unloading. The compression of the upper 5 metres or so hastherefore ceased and the more recent settlements are all related to compression ofthe central and lower layers in the profile. This is also reflected in the shear strengthsmeasured by field vane tests, Fig. 9. The results scatter somewhat but they stillclearly show that the shear strength during the first period increased only in theupper part of the profile and possibly somewhat in the lowest part and that theincrease in shear strength that has occurred during the last period of time is solelylocated in the central parts of the profile.
The settlements and shear strength increases vary across the embankment. However,the settlements are fairly uniform below the central parts of the fill, and it is onlyat the outer 2 metres or so of the once flat upper surface that they are noticeablysmaller. The maximum difference in settlement below the central part and the crestof the slope is just below 0.4 metres. The settlements at the crest are thus about1.6 metres compared to 2.0 at the centre or 80 % of the maximum settlements. Theincrease in shear strength should thereby be expected to be somewhat lower just
Fig. 7. Measured settlements below the undrained test fill at Lilla Mellösa,time in linear scale.
0
500
1000
1500
2000
2500
1945 1959 1972 1986 2000 2013
Point of timeSe
ttlem
ent,
mm
Depth of marker, m
7.5
5
2.5
0

SGI Report No 6324
Fig. 9. Measured undrained shear strength below the undrained test fill atLilla Mellösa at various times.
Fig. 8. Settlement distribution with depth below the undrained test fill atLilla Mellösa at various times.
0
2
4
6
8
10
12
14
16
0 0.5 1 1.5 2 2.5
Settlement, mO
rigin
al d
epth
, m
Measured 2002
Measured 1977
Measured 1968
Calculated from change in water content 2002
Calculated from change in water content 1967
0
2
4
6
8
10
12
14
16
0 5 10 15 20 25 30 35
Undrained shear strength measured by field vane tests, kPa
Orig
inal
dep
th, m 1945
1967
1979
2002

Seismic cross-hole tomography 25
below the crest, which can also be observed in the results from the field vane tests,Fig. 10. Approximately the same relation can be observed in the results from theCPT tests. However, the evaluation of these tests involves the effect of theoverburden pressure, which is more difficult to estimate at the border of the loadedarea, and thereby becomes more uncertain.
The new investigations in the laboratory showed that the liquid limits wereapproximately the same as before the loading whereas the water contents haddecreased significantly throughout the profile, Fig. 11. There was no significantdifference between the samples taken at the centre of the fill and those taken at thecrest.
The pre-drilling through the 2.5 metre thick embankment of gravel appears to havedisturbed the soil below, particularly at the crest. This may have resulted in sometoo low values of the determined preconsolidation pressures. Nevertheless, it isobvious that the preconsolidation pressures have increased and in the upper layerseven more than the maximum increase in effective stress, Fig. 12. It also appearsthat the increase is similar below the crest and below the central part of the fillexcept for the uppermost layers, where it appears to be lower below the crest. It can
Fig 10. Distribution of undrained shear strength below different parts of thearea measured by field vane tests.
0
2
4
6
8
10
12
14
0 5 10 15 20 25 30 35
Undrained shear strength measured by field vane tests, kPa
Orig
inal
dep
th, m
In natural groundBelow crest of slopeBelow central part of fill

SGI Report No 6326
Fig. 12. Evaluated preconsolidation pressures below the fill at Lilla Mellösa.
Fig. 11. Water contents in natural ground and below the fill in 2002.
0
2
4
6
8
10
12
14
16
0 20 40 60 80 100 120 140
Water content, %O
rigin
al d
epth
, m
In natural groundBelow crest of slopeBelow central part of fill
0
2
4
6
8
10
12
14
16
0 20 40 60 80 100 120
Preconsolidation pressure, kPa
Orig
inal
dep
th, m
In natural groundBelow crest of slope 2002Close to centre 2002Close to centre 1979
Seismic cross-hole tomography 27
also be observed that the quasi preconsolidation pressures below the centre arepractically the same as those measured here in 1979, indicating that no significantfurther compression has occurred in these layers since then. A further indication ofthat some of the preconsolidation pressures evaluated from the oedometer tests aretoo low can be obtained from the results of the field vane tests and the CPT tests.The empirical correlations for evaluation of preconsolidation pressures from thesetests in general give very good and consistent results in this soil, and the comparisonclearly indicates that some of the lowest preconsolidation pressures from the CRStest are too low, particularly in the upper part of the profile.
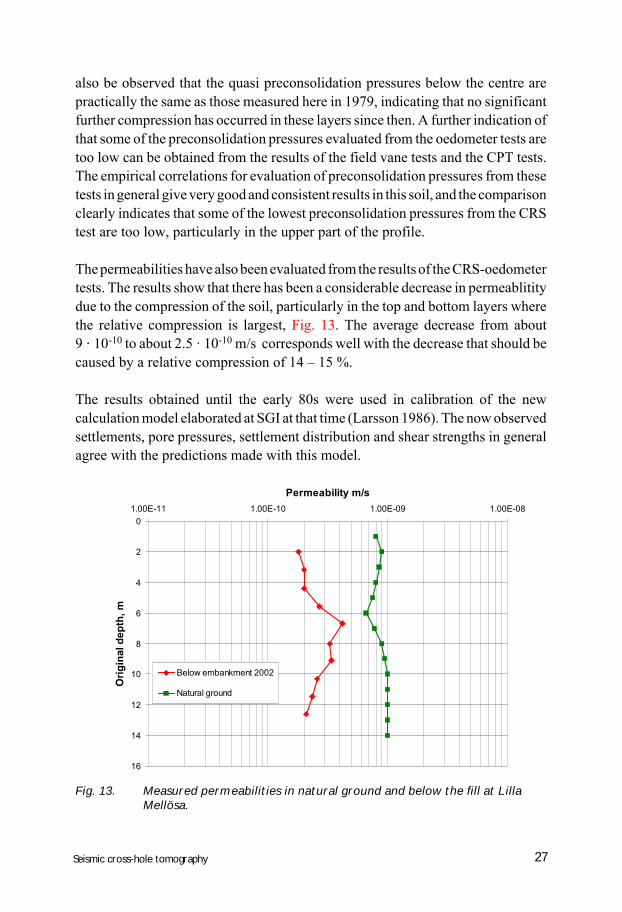
The permeabilities have also been evaluated from the results of the CRS-oedometertests. The results show that there has been a considerable decrease in permeablititydue to the compression of the soil, particularly in the top and bottom layers wherethe relative compression is largest, Fig. 13. The average decrease from about9 · 10-10 to about 2.5 · 10-10 m/s corresponds well with the decrease that should becaused by a relative compression of 14 – 15 %.
The results obtained until the early 80s were used in calibration of the newcalculation model elaborated at SGI at that time (Larsson 1986). The now observedsettlements, pore pressures, settlement distribution and shear strengths in generalagree with the predictions made with this model.
Fig. 13. Measured permeabilities in natural ground and below the fill at LillaMellösa.
0
2
4
6
8
10
12
14
16
1.00E-11 1.00E-10 1.00E-09 1.00E-08
Permeability m/s
Orig
inal
dep
th, m
Below embankment 2002
Natural ground

SGI Report No 6328
3.2 SKÅ-EDEBY
3.2.1 History and soil conditions
History
After the initial results from the test embankments at Mellösa were available, thissite was disregarded for the new airfield. Construction was instead started at a placecalled Halmsjön (today Arlanda) in 1946. However, this construction was haltedafter a while as the new airfield was postponed.
In 1956 Scandinavian Airlines System placed an order for new Douglas DC8 jetplanes. The runways at the old airfield at Bromma could not be extended and theconstruction of a new airfield became urgent. At that time, however, it was thoughtthat Halmsjön, which is situated about 40 kilometres north of Stockholm, was toofar away. Skå-Edeby, situated on an island about 25 kilometres west of Stockholm,was a possible alternative. While the conditions at Halmsjön were well known, toolittle was known about the soil conditions at Skå-Edeby to make a decision.
In spring 1957, the Swedish Geotechnical Institute was therefore commissioned bythe Government to carry out field tests to investigate the possibilities for constructionof an airfield at Skå-Edeby. The construction time had to be short and as the soilconsisted of up to 15 metres of soft clay the only practical solution would have beento use vertical drains and preloading.
The investigations thus became a close study of consolidation of soft clay and theeffect of vertical drains. For this purpose, four circular test fills with diameters from70 to 35 metres were constructed. One test fill was undrained (i.e. without verticaldrains) while vertical sand drains with varying spacings were installed under theother fills. The surcharges for the drained fills were also varied.
Work was started immediately with field investigations, sampling, installation ofmeasuring devices, installation of drains and construction of the fills. This workwas completed three months later at the end of July 1957. In these operations, theexperience from Lilla Mellösa was very valuable. New types of settlement markersand piezometers (Kallstenius and Wallgren 1956) were constructed and installedfor the first time and an attempt was made to measure the horizontal movements bymeasurement of the change in inclination of flexible pipes installed vertically at thetoes of the slopes.
Seismic cross-hole tomography 29
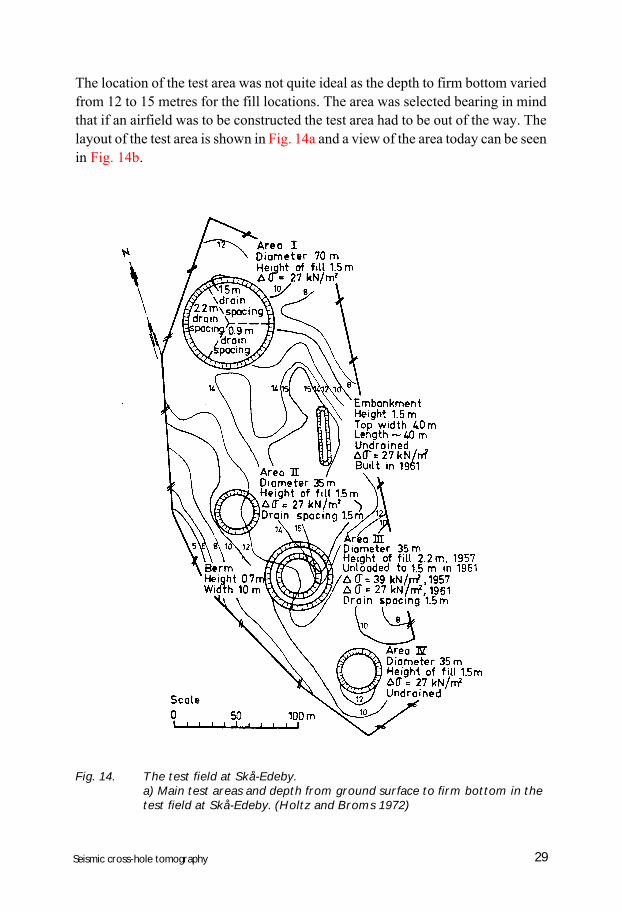
The location of the test area was not quite ideal as the depth to firm bottom variedfrom 12 to 15 metres for the fill locations. The area was selected bearing in mindthat if an airfield was to be constructed the test area had to be out of the way. Thelayout of the test area is shown in Fig. 14a and a view of the area today can be seenin Fig. 14b.
Fig. 14. The test field at Skå-Edeby.a) Main test areas and depth from ground surface to firm bottom in thetest field at Skå-Edeby. (Holtz and Broms 1972)

SGI Report No 6330
Fig
. 14.
Th
e te
st f
ield
at
Skå
-Ed
eby.
b)
Vie
w o
f th
e ar
ea f
rom
th
e w
est
in 2
002.
Th
e fil
l in
th
e fr
on
t w
ith
a c
ar p
arke
d o
nit
is T
est
area
II
Th
e o
ther
fill
s ca
n o
nly
be
surm
ised
sin
ce t
hey
are
no
w a
lmo
st le
vel
wit
h t
he
gro
un
d a
nd
hid
den
beh
ind
th
e gr
ass.

Seismic cross-hole tomography 31
Parallel to the following field observations, supplementary field investigations andan extensive laboratory investigation were carried out.
The first results were published in September 1957 (Utlåtande angående Stockholmsstorflygplats 1957) but were too preliminary to form a basis for a definiteconclusion. Later, however, the Skå-Edeby alternative had to be abandoned foreconomic reasons. In spite of this, the investigations were continued as the resultswere important for future similar projects and particularly for road construction.
A full report on the results of the investigations at Skå-Edeby including the firstyears’ measurements and a revised theory for consolidation of clays with verticaldrains was presented by Hansbo in 1960.
In 1961, the most heavily loaded test fill was partially unloaded. The surplus gravelwas used to construct an additional test fill which was given the shape of anembankment. The test embankment was instrumented with the usual settlementmarkers and piezometers. New flexible inclinometer tubes were also installed to beused together with a new inclinometer specially designed for measurement in softclays (Kallstenius and Bergau 1961).
Preliminary results from this test fill were reported by Osterman and Lindskog in1963. Readings of the instrumentation in all the test fills were then taken periodically.A new thorough investigation, including measurements of changes in propertiesunder the fills and measurements of pore pressures with more modern piezometers,was started by Holtz in 1970. The results were reported at the Purdue Conferencein 1972 (Holtz and Lindskog 1972, Holtz and Broms 1972). Further measurementshave been made regularly since then, but at longer time intervals. The porepressures under the undrained fill were measured in 1982 in connection with testingof a new measuring system. New samples were taken outside and under this fill in1984 and 1985 in connection with the development of a new calculation method ofsettlements (Larsson 1986).
A large number of other research activities have been carried out at the test field atSkå-Edeby. This was one of the sites where the effects of various factors on thequality of clay samples were studied in connection with the standardization ofpiston sampling in Sweden (Kallstenius 1963). A new test fill has been constructedto compare the effects of sand drains and prefabricated drains (Torstensson 1976).Other test fills have been constructed to evaluate the effect of lime columns. Thestabilizing effect of lime columns at excavations has also been tested (Boman andBroms 1975). At one of the old drained fills, a part of the fill has been removed and

SGI Report No 6332
the sand drains partly excavated. The condition of the drains, the distribution ofwater content and zones affected by the installation of the drains were studied(Holtz and Holm 1972). A large study of the effect of size of piston samplers on thequality of the samples was performed at Skå-Edeby after Norwegian and Canadiantests had shown large size effects. No significant practical differences between theSwedish standard piston sampler and piston samplers with larger diameters werefound, however (Holm and Holtz 1977).
The test field has also been used in research concerning the vane shear test(Wiesel 1975) and in testing various piezometers and the piezometer soundingmethod. It has also been used in projects concerning CPT tests, seismic CPT testsand initial shear modulus as well as dilatometer tests in soft clays (Larsson andMulabdic 1991, Larsson and Eskilsson 1988).
Soil conditions
The soil under the test fills consists of soft clay with a thickness of 12 to 15 metreson top of till or rock. Also in other respects the conditions are not quite uniformsince most of the soil profile is significantly varved. The water contents and liquidlimits in the upper two metres vary between the different test locations, as does thelevel of a high-plastic clay layer in the upper clay profile. These variations are,however, not much larger than the scatter of results within the separate test areaswhen different investigations for the test fields are collated. A large part of thescatter is probably related to the varved nature of the clay and that the determinationsof various properties are made on small specimens of soil with very limitedvolumes. The same observation is valid also for strength and deformationcharacteristics, so that a general soil profile is probably most representative for theentire area. A geological profile and grain size distribution determined at the largesttest fill is shown in Fig. 15.
The desiccated dry crust is only about half a metre thick. Below the crust, there isa layer of grey-green organic clay which in spite of the relatively low clay contentis very high-plastic due to the organic content. This layer is affected by thecloseness to the ground surface and is thus overconsolidated with a relatively highshear strength and water contents lower than the liquid limits.
The underlying postglacial clay is slightly organic and high-plastic. The postglacialclay, as well as the glacial clay beneath it, is coloured by or banded by ironsulphides. The contents of iron sulphide may be assumed to be of the same orderas at Lilla Mellösa.

Seismic cross-hole tomography 33
The glacial clay is varved. The varves are thin at the top but become thicker withdepth. Near the bottom, occasional seams of silt and sand are found. Bedrock ordense till is found below the clay. Both can be considered as free draining. Thegeology of the site has been discussed in detail by Pusch (1970), who investigatedthe microstructure and chemistry of the clay. Some leaching of salts has occurredin the profile. The general soil properties are shown in Fig. 16.
The water contents in the clay are well above the liquid limit except for the uppertwo metres which are affected by dry crust effects. The water contents decreasefrom about 100 % at the top to about 60 % in the lower layers. The bulk density ofthe clay increases from 1.3 t/m3 at the top to about 1.7 t/m3 at 12 metres’ depth.
The shear strength has been determined by field vane tests, fall cone tests andunconfined compression tests. Field vane tests and fall cone tests normally yieldcompatible results at depths down to 10 – 15 metres. The averages of the results arein good agreement but the scatter in the results is unusually high for this type of clay.In the original stability calculations a cautious value of 5 kPa was used. Thecompiled shear strength measurements show, however, that a minimum shear
Fig. 15. Geological profile and average grain size distributionin a core taken in Test Area No. 1. (Hansbo 1960)

SGI Report No 6334
Fig
. 16.
Gen
eral
so
il p
rop
erti
es a
t th
e S
kå-E
deb
y te
st f
ield
. (L
arss
on
198
6)

Seismic cross-hole tomography 35
strength of 6 kPa at a depth of 3.5 metres and an increase with depth of 1.2 kPa permetre thereafter is a more realistic value. Still, the clay is very soft even for Swedishconditions.
The sensitivity was found to vary from about 5 in the upper layers to about 15 atthe bottom in the early investigations. In the investigations in 1971, the sensitivityin the ground outside the fills was found to be about twice as high as in the earlyinvestigations, or about 10 – 30. Both sets of values are compatible with normalvalues for clays of this type and no obvious explanation for the discrepancy hasbeen found as all other parameters from the different testing times agree quiteclosely. Experience has shown that factors such as the time and temperature atstorage before testing can affect the measured sensitivity, and this may be anexplanation.
The groundwater level and pore pressure in the ground have been found to varyseasonally. The maximum measured variation is ±0.5 metres. The pore pressure innatural ground can generally be assumed to be approximately hydrostatic for agroundwater level which can vary from the ground surface to 1 metre below.
The preconsolidation pressures have been measured in incremental oedometertests; originally by Hansbo (1961) then in 1971 by Holtz and Broms and again ina large number of tests by Holm and Holtz (1977). Finally, the preconsolidationpressures were measured in CRS tests in 1984 in connection with the study ofconsolidation processes including creep effects (Larsson 1986). The results areunanimous in showing overconsolidation effects in and just under the dry crust,after which the soil becomes only slightly overconsolidated for a groundwater levellocated one metre below the ground surface and hydrostatic pore pressures below.The overconsolidation ratio at average pore pressure conditions is at least 1.15.
The permeability of the clay has been determined in a comprehensive series of testswith varying gradients and degrees of compression by Hansbo (1960). Somedeviations from Darcy’s law were observed in this investigation. Supplementarydeterminations of the permeability were made by CRS tests in the study in 1984.The results are in good agreement, but the CRS tests comprise more levels.
A detailed description of the compressibility and permeability characteristics of thesoil in the Skå-Edeby test field is given in SGI Report No. 29 (Larsson 1986).

SGI Report No 6336
3.2.2 Construction and instrumentation of theundrained circular test fill
The undrained test fill was constructed in June-July 1957. It was made up of graveland given a bottom diameter of 35 metres and slopes 1:1.5. The density of the gravelfill was checked continuously and was 1.79 t/m3 on average. The total height of thefill was 1.5 metres and the imposed load intensity thus 27 kPa. No changes of loadexcept for natural variations have been made after that.
Before construction, newly constructed settlement markers were placed on and atvarious depths below the ground surface. Most of them were placed at the centreof the fill, but some were also placed at various distances towards the perimeter toenable measurement of the settlement distribution across the fill. Piezometers forpore pressure measurements were placed in a similar pattern. The instrumentationalso included vertical pipes at the perimeter of the loaded area for measurement ofhorizontal movements by inclinometers and some surface settlement markersoutside the area for measurement of possible heave. No relevant or significantmeasurements appear to have been obtained from these last two sets ofinstrumentation.
The settlement markers below the test fill appear to be still functioning, but thepiezometers stopped working after the first years of frequent measurements andmaintenance. The pore pressures have later been measured by retractable piezometersat a few instances, the last being in the investigation in 2002. Sampling and fieldvane tests below the fill were performed in 1971 and 2002 whereas only samplingwas performed in 1985. In the investigation in 2002, CPT tests were alsoperformed.
3.2.3 Measured settlements, settlement distributions, excesspore pressures and changes in shear strength,preconsolidation pressure and other properties
The settlements during the construction period were measured and found to beabout 0.06 metres. The computed “final” settlements disregarding creep effects areabout 0.75 metres. This amount of settlement was obtained in 1972. At that time,there were still excess pore pressures in the order of 20 kPa. This means that fifteenyears after load application there was practically no increase in effective verticalstress in large parts of the clay profile. Twenty-five years after the load application,the settlements amounted to 0.95 metres and there were still excess pore pressuresin the order of 12 kPa in the middle of the clay profile. Because of the settlements,the dry crust and parts of the fill had become submerged and the initially applied
Seismic cross-hole tomography 37
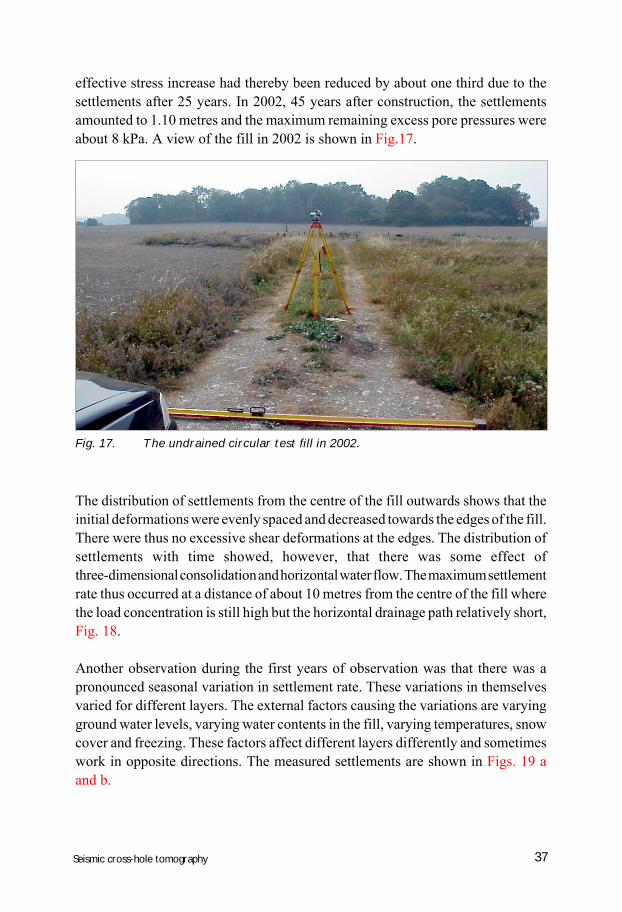
effective stress increase had thereby been reduced by about one third due to thesettlements after 25 years. In 2002, 45 years after construction, the settlementsamounted to 1.10 metres and the maximum remaining excess pore pressures wereabout 8 kPa. A view of the fill in 2002 is shown in Fig.17.
Fig. 17. The undrained circular test fill in 2002.
The distribution of settlements from the centre of the fill outwards shows that theinitial deformations were evenly spaced and decreased towards the edges of the fill.There were thus no excessive shear deformations at the edges. The distribution ofsettlements with time showed, however, that there was some effect ofthree-dimensional consolidation and horizontal water flow. The maximum settlementrate thus occurred at a distance of about 10 metres from the centre of the fill wherethe load concentration is still high but the horizontal drainage path relatively short,Fig. 18.
Another observation during the first years of observation was that there was apronounced seasonal variation in settlement rate. These variations in themselvesvaried for different layers. The external factors causing the variations are varyingground water levels, varying water contents in the fill, varying temperatures, snowcover and freezing. These factors affect different layers differently and sometimeswork in opposite directions. The measured settlements are shown in Figs. 19 aand b.

SGI Report No 6338
Fig. 18. Distribution of settlements in the undrained circular fill. (Larsson 1986).

Seismic cross-hole tomography 39
Fig. 19. Measured settlements under the undrained circular fill at Skå-Edeby.a) time in log scaleb) time in linear scale
0
200
400
600
800
1000
1200
1 10 100 1000 10000 100000
Time, days
7.5
5
2.5
1.5
0
Depth of marker, m
0
200
400
600
800
1000
1200
1955 1960 1965 1970 1975 1980 1985 1990 1995 2000 2005
Point of time
7.5
5
2.5
1.5
0
Depth of marker, m
a)
b)
SGI Report No 6340
The settlements continue although at a continuously decreasing rate. The settlementrate in 2002 was 5 – 6 mm/year. The distribution of settlements across the loadedarea is still very uniform except for the outermost parts. The difference between thesettlements below the central part and below the outer crest of the fill is about0.25 metres, which means that the settlements below the crest are about 80 % ofthose below the centre. The distribution is thus similar to that at the fill in LillaMellösa, which had similar dimensions and depths to firm bottom.
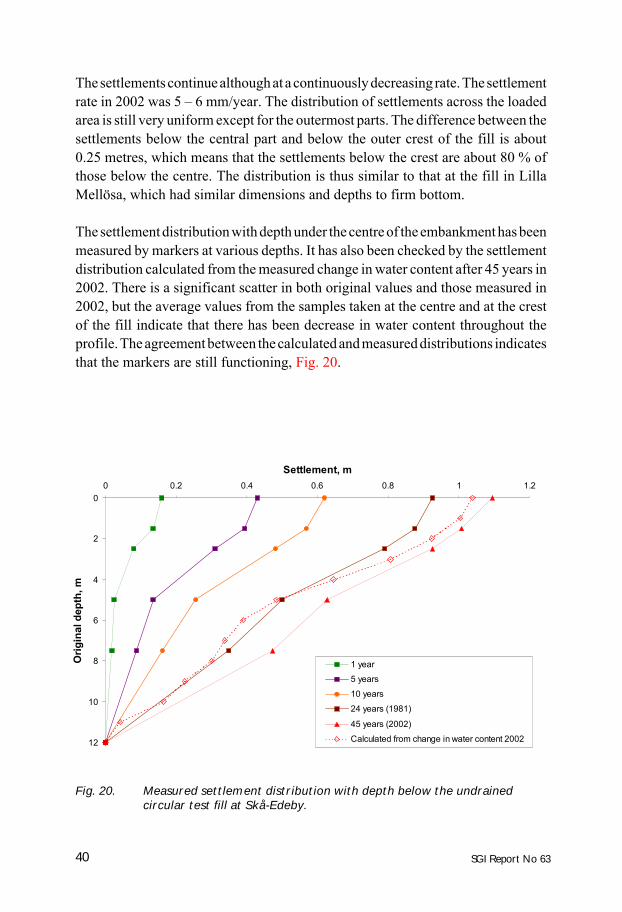
The settlement distribution with depth under the centre of the embankment has beenmeasured by markers at various depths. It has also been checked by the settlementdistribution calculated from the measured change in water content after 45 years in2002. There is a significant scatter in both original values and those measured in2002, but the average values from the samples taken at the centre and at the crestof the fill indicate that there has been decrease in water content throughout theprofile. The agreement between the calculated and measured distributions indicatesthat the markers are still functioning, Fig. 20.
Fig. 20. Measured settlement distribution with depth below the undrainedcircular test fill at Skå-Edeby.
0
2
4
6
8
10
12
0 0.2 0.4 0.6 0.8 1 1.2
Settlement, m
Orig
inal
dep
th, m
1 year
5 years
10 years
24 years (1981)
45 years (2002)
Calculated from change in water content 2002

Seismic cross-hole tomography 41
The observations show that the settlements in the early stages mainly consisted incompression of the upper layers whereas the settlements later on have mainlyturned into compression of the bottom layers. The settlements have thereby becomefairly evenly distributed in the profile with time. As in Lilla Mellösa, the effectiveload has decreased due to the submerging of the crust and part of the fill below thegroundwater table and parts of the profile are thereby in a state of unloading. Thesettlements in large parts of the upper soil layers can also be observed to havevirtually stopped. The exact distribution of the ongoing compression in the lowerlayers cannot be discerned since there are no settlement markers below 7.5 metres’depth.
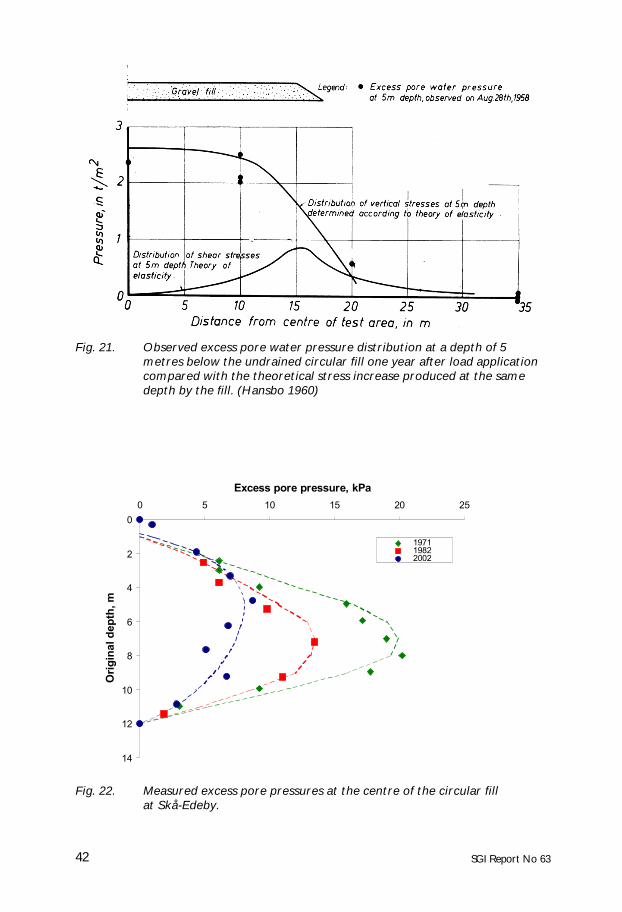
The excess pore pressures after load application were reported by Hansbo (1960).They show that the pore pressure response to the load was only slightly lower thanthe increase in vertical stress, which confirms that the soil was almost normallyconsolidated, Fig. 21.
The pore pressures at the centre of the fill as well as in natural ground were carefullymeasured in 1971, 1982 and in 2002. The excess pore pressures at those times areshown in Fig. 22. It should be observed that about 10 kPa of the decrease inmaximum excess pore pressure from around 25 kPa to the present 7 – 8 kPa is dueto load reduction because of the settlements.
Samples were taken under the fill in 1985 and 2002 and oedometer tests wereperformed. The preconsolidation pressures are shown in Fig. 23. The results showthat a considerable increase in preconsolidation pressure has occurred throughoutthe profile. The measured preconsolidation pressures are also significantly higherthan the maximum effective vertical stresses that have acted, which indicates thatcreep processes have created significant quasi preconsolidation effects. Thepreconsolidation pressures below the crest are also significantly increased butgenerally lower than those below the central parts, which should be expected sincethe compression of the soil is less here. The measured preconsolidation pressuresbelow the central parts of the fill in 2002 are about equal to or somewhat less thanthose measured in 1985. A slight increase would have been expected with regardto the settlements that have occurred between the sampling events although they arerelatively small. However, the pre-drilling of the gravel fill can cause disturbanceof the clay below. There is also always a risk of getting too close to an oldinvestigation point when making new investigations below old tests fills, where aconsiderable number of investigations in terms of sampling operations, porepressure measurements and in situ shear strength tests have been performedthroughout the years. Unless such points are clearly marked or can be located
SGI Report No 6342
Fig. 22. Measured excess pore pressures at the centre of the circular fillat Skå-Edeby.
0
2
4
6
8
10
12
14
0 5 10 15 20 25
Excess pore pressure, kPa
Orig
inal
dep
th, m
197119822002
Fig. 21. Observed excess pore water pressure distribution at a depth of 5metres below the undrained circular fill one year after load applicationcompared with the theoretical stress increase produced at the samedepth by the fill. (Hansbo 1960)

Seismic cross-hole tomography 43
otherwise, which is not the case here, all traces of them vanish with time. Newinvestigations are likely to be located with the same idea of finding an areaapparently untouched and uninfluenced by previous installations and operations.However, large parts of the most interesting areas are already occupied bypermanent instrumentation and the risk of encountering an old investigation pointin remaining seemingly suitable locations is thereby enhanced. The preconsolidationpressures measured in 1985 are therefore considered to be most relevant and thepreconsolidation pressures in the lower part of the profile may even be somewhathigher today due to the compression that has occurred since then.
The permeability of the clay was also measured in the CRS tests. The results showthat there has been a considerable reduction in permeability due to the compressionof the soil, Fig. 24. They also indicate that there has been a significant reduction inthe lower part of the profile between 1985 and 2002 which corresponds to thesettlement observations. The permeability had decreased below the crest of the filltoo but not as much as below the centre. This is also in general agreement with theobserved settlements. The measured permeabilities are relatively insensitive to apossible disturbance. On the other hand, they are highly sensitive to variations inwater content (or rather void ratio) and a certain scatter is to be expected in thisvarved soil.
Fig. 23. Measured preconsolidation pressures below the undrained circular fillat Skå-Edeby.
0
2
4
6
8
10
12
14
0 20 40 60 80 100 120
Preconsolidation pressure, kPaO
rigin
al d
epth
, m
In natural ground
Below crest of slope 2002
About midway between crest and centre 2002
Below centre 1985

SGI Report No 6344
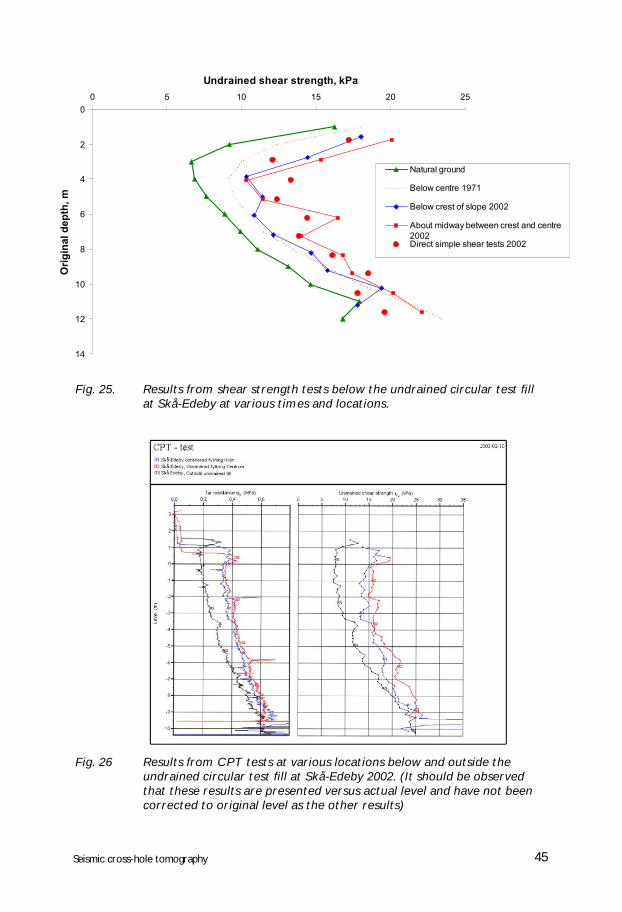
The increase in undrained shear strength under the fill was checked by field vanetests and fall-cone tests by Holtz and Broms in 1971. As in the initial investigationsthere was a certain scatter in the results. The averaged shear strength profile withspecial reference to the results from field vane tests corrected according to SGI1984 is shown in Fig. 25, together with the strength profile from 1957 and the resultsfrom the field vane tests in 2002. It can be observed that a considerable increase inshear strength has occurred between the different testing events and that the shearstrength below the crest is similar but generally lower than below the centre of thefill. The relevance of the shear strength determined by the field vane tests has alsobeen checked by direct simple shear tests and the results are similar.
Approximately the same relation between the shear strength in natural ground,below the crest and below the centre of the fill is obtained by the CPT tests, Fig. 26.However, the shear strengths evaluated by the CPT tests are generally somewhathigher, which may be related to the varved nature of the soil and the accompanyingdifficulty of selecting a relevant value of the liquid limit to be used in the evaluation.Also the relation between the shear strength below the crest and the other locationsdiffers somewhat from the rest, which may be related to the aforementionedproblem of selecting a relevant overburden pressure at this point.
Fig. 24. Measured permeability below the undrained circular fill at Skå-Edeby.
0
2
4
6
8
10
12
14
1.00E-11 1.00E-10 1.00E-09 1.00E-08
Permeability m/s
Orig
inal
dep
th, m
Natural groundBelow embankment 2002Below embankment 1985Below crest of slope 2002
Seismic cross-hole tomography 45
Fig. 25. Results from shear strength tests below the undrained circular test fillat Skå-Edeby at various times and locations.
Fig. 26 Results from CPT tests at various locations below and outside theundrained circular test fill at Skå-Edeby 2002. (It should be observedthat these results are presented versus actual level and have not beencorrected to original level as the other results)
0
2
4
6
8
10
12
14
0 5 10 15 20 25
Undrained shear strength, kPaO
rigin
al d
epth
, m
Natural ground
Below centre 1971
Below crest of slope 2002
About midway between crest and centre2002Direct simple shear tests 2002

SGI Report No 6346
3.3 THE TEST EMBANKMENT
The test embankment was constructed in May 1961. At that time, the idea oflocating an airfield at Skå-Edeby had been abandoned but the results of the testswere considered very important, especially for road construction. The testembankment was therefore constructed to study the influence of geometry andlateral deformations. It was sponsored by the Swedish Road Administration and theBuilding Research Council.
3.3.1 Construction and instrumentation of the test embankment
The embankment was constructed with the surplus gravel from the partial unloadingof the most heavily loaded circular fill. It is a rather narrow embankment with a crestwidth of 4 metres and slopes 1:1.5. The height of the embankment was 1.5 metresand the total length 40 metres. The density of the fill material is 1.8 t/m3 and themaximum load increase 27 kPa. The safety factor against failure was estimated tobe about 1.5. The fill was instrumented with settlement markers and piezometersat different locations and depths under and outside the fill.
Flexible pipes for a newly constructed inclinometer measuring system were alsoinstalled at the toes of the embankment slopes, one on each side, and one pipe wasinstalled further out from the embankment. Location of the instrumentation isshown in Figs. 27 and 28. The construction of the fill was made in stages during22 days and thereafter no changes have been made.
The piezometers functioned fairly well during the first years with frequent readingsand maintenance. However, with time most of them ceased to function altogetheror started to show odd trends and values. In 1971, 10 years after construction onlytwo of the piezometers below or near the embankment showed apparently reliablevalues and thereafter they have not been read off anymore.
The settlement markers at depth were of a new type using detachable dial gaugesand measuring the movement of the settlement marker relative to a levelledsettlement marker on the ground surface or below the embankment. These systemsrequired maintenance in that way that the length of the measuring rods had to beadjusted along with the settlements. They worked well as long as fairly frequentreadings were taken but when the reading intervals became longer there wereproblems with exceeding the travel lengths of the dial gauges and keeping recordsof the adjusted rod lengths. The recording of the settlement markers at depththerefore stopped in 1981, 20 years after construction. At about the same time, themovements in the inclinometers tubes had become so large that it was no longer

Seismic cross-hole tomography 47
Fig. 27. Mid section of the test embankment at Skå-Edeby showing location ofinstrumentation. (Holtz and Lindskog 1972)
Fig. 28. The test embankment at Skå-Edeby in 2002. The permanent instru-mentation at the midsection can be seen with the strongly inclined topsof the inclinometer tubes sticking up just outside the embankment. Thelength of the levelling rod is 4 metres.

SGI Report No 6348
possible to insert the instrument. Also these measurements were therefore stoppedin 1981 and only registration of the surface settlements has continued.
In the present project, sampling and field vane tests have been performed below thecentre of the embankment and at the toe of the slope on one side. CPT tests wereperformed at the same points and also in natural ground well outside the embankment.All these operations as well as the seismic investigations were located in thenorthern part of the embankment well clear of any influence from the permanentinstrumentation.
3.3.2 Soil conditions
The soil conditions at the test embankment were practically identical to theconditions at the undrained circular test fill, except that the depth to firm bottom was15 metres instead of 12.
3.3.3 Measured settlements, settlement distributions, excesspore pressures and changes in shear strength,preconsolidation pressure and other properties
The total settlements during the construction period were measured to be about0.06 metres. The first stage of construction involved about half of the final load andthe settlements were 0.01 – 0.02 metres. The horizontal movements after this firstload step were small. The next inclinometer readings were taken two weeks afterthe completion of the embankment. Thereafter, frequent readings were taken andthe horizontal movements were recalculated into a corresponding vertical movementof the embankment.
An extrapolation of the calculated vertical settlements due to lateral displacementsindicates that about 0.05 metres of settlement is due to “initial” shear deformationsdirectly after full load application.
The consolidation process has been associated with continuing horizontaldeformations. As the horizontal deformations have been measured, the verticaldeformations corresponding to them can be estimated and separated.
Some horizontal movements were still in progress 20 years after construction butthey were then barely detectable and the relative importance for the total settlementshas been steadily decreasing. The “final” consolidation settlement calculated in theordinary way and disregarding creep effects is about 0.60 metres (0.80 metres ifunloading due to settlements is disregarded). Figures of 1.2 and 1.5 metres

Seismic cross-hole tomography 49
respectively referred to by Holtz and Lindskog (1972) must have been based on amore pessimistic assumption of the preconsolidation than further studies haveshown, combined with a neglect of the load distribution with depth that occurs dueto the narrow embankment and great depth to firm bottom. Even when correctionfor limited depth to firm bottom is applied, the load intensity as an average for theprofile will still only be about half of the stress applied at the surface.
The calculated “final” settlements disregarding creep effects were reached in 1974when corrections for the lateral deformations are made. The settlements arecontinuing but at a continuously decreasing rate. The settlements in 2002 amountedto 1.07 metres and the settlement rate was then 5 – 6 mm/year. The settlements ofthis narrow embankment are thus today approximately the same as for the widecircular fill with the same load intensity. However, this should be seen in the lightof the fact that about 0.2 metres of settlement here depend on horizontal displacementsof the soil and that the compressible soil layers are about 25 % thicker. The loadfrom the test embankment has been applied for a somewhat shorter time but thisshould be more than compensated by the two-dimensional water flow and therebyfaster pore pressure dissipation below this narrow construction.
As for the undrained circular fill, a seasonal variation of the settlement rate wasobserved right from the beginning. Later slowdowns in the settlement rate havebeen observed for longer periods of a couple of years in 1968 – 1969 and in1973 – 1974. Apart from these irregularities, which cannot be readily explainedexcept possibly by a steady increase in groundwater level and pore pressures in theground recorded during 1968 – 69 , the consolidation process has followed asmooth course. No pore pressure observations were made during 1973 – 1974.
The measured settlements are shown in Fig. 29. These settlements include theeffects of the horizontal displacements.
Measurements at various depths as well as measurements of changes in watercontent show that the bulk of the deformations have occurred within the upper partof the profile. The embankment is very narrow and the increase in effective stressdecreases fairly rapidly with depth due to the load distribution. The slightoverconsolidation is thereby sufficient to prevent any settlements developingbelow a certain depth except for relatively small creep deformations and horizontalmovements. The measured and estimated settlement distributions are shown inFig. 30. The exact distribution of the settlements calculated from the water contentsis uncertain because of a significant scatter, which has been smoothed out in thecalculations. For the same reason, the exact depth of the breaking point below

SGI Report No 6350
Fig. 29. Measured settlements below the test embankment at Skå-Edeby.a) settlements at different depths up to 1981 (Larsson 1986)b) total settlements up to 2002 with time in linear scale
0
0,2
0,4
0,6
0,8
1
1,2
1960 1965 1971 1976 1982 1987 1993 1998 2004 2009
Point of time
Settl
emen
t, m
a)
b)

Seismic cross-hole tomography 51
Fig. 30. Settlement distribution with depth below the test embankmentat Skå-Edeby.
Fig. 29. Measured settlements below the test embankment at Skå-Edeby.c) total settlements up to 2002 with time in logarithmic scale
0
0,2
0,4
0,6
0,8
1
1,2
1 10 100 1000 10000 100000
Time, days
Settl
emen
t, m
0
2
4
6
8
10
12
14
16
0 0,2 0,4 0,6 0,8 1 1,2
Settlement, m
Orig
inal
dep
th, m
Estimated settlement due to horizontal movements 2002
Measured 1981
Calculated from change in water content 2002
Estimated total settlements in 2002

SGI Report No 6352
which the settlements are very small is also somewhat uncertain.
The horizontal movements at the toes of the slopes and also some 4 m outside theembankment are shown in Fig. 31.
The maximum horizontal movements have occurred at a depth of 2 metres andamount to about 0.12 metres in each direction. The relative maximum of theongoing horizontal movements has been located further down with time. In 1981,the movements at 2 metres depth seemed to have stopped and the maximummovements that occurred then were located at a depth of 4 to 5 metres. Thehorizontal movements have also shown seasonal variations and, at the slowdownof settlements in 1968 – 1969, the inclinometer tubes seemed to move inwards inthe upper 3 – 4 metres. This effect vanished though and, apart from theseirregularities and variations associated with measuring accuracy, there has been asmooth decrease in the rate of horizontal deformations. The influence of thehorizontal movement on the vertical settlements has steadily decreased andamounts at present to about 0.2 metres or 20 % of the total settlements, Fig. 32. Theinfluence of horizontal movements in this case is unusually large due to the narrowembankment and the low factor of safety against undrained failure.
In 1981, the rate of horizontal movements was so small that the correspondingvertical deformations only amounted to about 5 % of the total rate of verticaldeformations. The rate of horizontal movements can be assumed to be muchsmaller today both in absolute and relative terms and can for practical reasons beassumed to have stopped altogether.
The initial pore pressure response to the applied load was measured by piezometerslocated at the centre of the embankment at depths of 2.5, 5 and 10 metres. The porepressure response to the applied surface load of 27 kPa was about 20, 18 and 13 kParespectively. The calculated stress increase at the same levels was 25, 20 and13 kPa. This confirms the general picture of an only slightly overconsolidated soilprofile with depth and a somewhat higher overconsolidation in the uppermostlayers. It should be noted, though, that there were large and sudden variations in thereadings of all piezometers during the first years and the pressure in the referencepiezometer located outside the loaded area and probably in contact with thedraining bottom layers rose about 5 kPa during the loading phase. Part of thisvariation may have affected the readings further up in the profile. The long-termvariations in the readings of the piezometers have all clearly shown a trend similarto the readings of this reference piezometer, Fig. 33.

Seismic cross-hole tomography 53
Fig
. 31.
Ho
rizo
nta
l mo
vem
ents
at
the
test
em
ban
kmen
t at
Skå
-Ed
eby.
In
clin
om
eter
tu
bes
H2
and
H3
are
loca
ted
at
the
toes
of
the
emb
ankm
ent
slo
pes
; on
e at
eac
h s
ide
at t
he
mid
dle
sec
tio
n. T
ub
e H
1 is
loca
ted
in t
he
sam
e se
ctio
n b
ut
abo
ut
4 m
etre
s o
uts
ide
the
emb
ankm
ent.
(L
arss
on
198
6)

SGI Report No 6354
Fig. 32. Settlements corresponding to horizontal deformations versus totalsettlements at centre of the test embankment at Skå-Edeby.(Larsson 1986)

Seismic cross-hole tomography 55
Fig. 33. Applied surface load and pore pressure readings at thetest embankment. (From Holtz and Lindskog 1972)

SGI Report No 6356
Only two piezometers below the embankment were still in apparent function in1971. The excess pore pressures measured then are shown in Fig. 34 together withthe maximum excess pore pressures measured after load application in 1961 andthose measured in the present investigation in 2002. As for the circular test fill,much of the pore pressure dissipation can be expected to be related to the decreasein effective load because of the settlements and the accompanying submersion ofthe crust and part of the fill below the groundwater table.
The preconsolidation pressures have been measured on samples taken in 2002 atthe centre of the section across the embankment and at the toe of the slope at oneside. The results show that significant increases of the preconsolidation pressurehave only occurred within the 6–7 upper metres below the centre of the embankment,Fig. 35. Some increase has also occurred in the upper 4 metres at the toe of the slope,but this is more limited.
The change in permeability is a further indication of the compression of the soil.The permeability has been evaluated from CRS tests on samples from the centre andthe toe of the slope of the embankment, Fig. 36. Also these values show that themajor part of the compressions has occurred within the upper 6 metres or so of thesoil profile and that the compression is somewhat larger at the centre than at the toeof the slope.
The results from the field vane tests scatter but show that there has been an increasein strength roughly in the 8 upper metres of soil below the embankment, Fig. 37.Also the soil below the toe has increased in strength but the scatter is too large toestimate whether there is any significant difference in strength to that below thecentre. There is an anomaly with very low values around 4 metres original depth.At this depth, the liquid limt of the soil both at the centre and at the toe of the fillwas considerably higher than in the general profile, and thereby in most of thedeterminations at this depth in the test field. It thus appears that the soil below thetest embankment in the investigated section is somewhat different from thereference soil at this depth.
Approximately the same relation between the shear strength in natural ground,below the crest and below the centre of the fill is obtained by the CPT tests, Fig. 38.However, as for the circular fill the shear strengths evaluated by the CPT tests aregenerally somewhat higher, which may be related to the varved nature of the soiland the accompanying difficulty of selecting a relevant value of the liquid limit tobe used in the evaluation. Also the relation between the shear strength at the toe andthe other locations differs somewhat from the rest, which may be related to theproblem of selecting a relevant overburden pressure at this point.

Seismic cross-hole tomography 57
Fig. 35. Evaluated preconsolidation pressures at the test embankmentat Skå-Edeby in 2002.
Fig. 34. Measured excess pore pressure profiles below the test embankmentat Skå-Edeby.
0
2
4
6
8
10
12
14
16
0 5 10 15 20 25
Excess pore pressure, kPa
Ori
gin
al d
epth
, m
196119712002
0
2
4
6
8
10
12
14
16
0 20 40 60 80 100 120
Preconsolidation pressure, kPa
Ori
gin
al d
epth
, m
Natural ground
Toe of slope
Centre of fill

SGI Report No 6358
Fig. 36. Evaluated permeability at the test embankment at Skå-Edeby.
Fig. 37. Shear strength measured by field vane tests at the test embankmentat Skå-Edeby.
0
2
4
6
8
10
12
14
16
1,00E-11 1,00E-10 1,00E-09 1,00E-08
Permeability m/sO
rigin
al d
epth
, m
Natural ground
Below centre of embankment 2002
Below toe of embankment slope 2002
0
2
4
6
8
10
12
14
16
0 5 10 15 20 25
Undrained shear strength, kPa
Orig
inal
dep
th, m
Natural groundToe of slopeCentre of fillDirect simple shear test

Seismic cross-hole tomography 59
Fig. 38. Results from CPT tests at various locations below and outside the testembankment at Skå-Edeby 2002. (It should be observed that theseresults are presented versus actual level and have not been corrected tooriginal level as the other results)

SGI Report No 6360
4.1 BACKGROUND AND HYPOTHESIS
Measurement of the shear wave velocity in the field is often used to estimate thein-situ initial shear modulus G0. This parameter is essential for prediction ofvibrations and movements in connection with earthquakes, traffic vibrations andother sources of vibrations such as construction work. The most common methodsof measuring the shear wave velocity in the ground are cross-hole measurementsand down-hole measurements and nowadays also the seismic CPT test, which is arational way of performing down-hole measurements. Also spectral analyses ofsurface waves have recently been tried for this purpose(e.g. Dahlin et al. 2001).
It has been shown that the shear modulus in cohesive soils can be expressed as afunction of the undrained shear strength (e.g. Andréasson 1979, Larsson andMulabdic 1991). In principle, it should therefore be possible to estimate also theundrained shear strength from the measured shear wave velocity. However, boththe shear modulus and the undrained shear strengths are functions of the square ofthe shear wave velocity and accurate estimations of the shear strength therebyrequire very accurate measurements of the shear wave velocity.
Furthermore, the relation between the undrained shear strength and the shearmodulus, and thereby also the shear wave velocity, is also a function of theoverconsolidation ratio (Andersen et al. 1988, Atkinsson 2000). This also limits thepossibility to estimate the undrained shear strength from the shear wave velocity.However, a prerequisite for considerable consolidation settlements and shearstrength increases below embankments is that they have been built on normallyconsolidated or only slightly overconsolidated soft ground. The soil below theembankment will then remain in a normally consolidated or only slightlyoverconsolidated state also after the load application throughout the consolidationprocess and afterwards, unless a significant unloading is made. There should thusstill be a possibility to estimate the undrained shear strength below such embankmentsfrom the shear wave velocity provided that this can be measured accurately enough.
Chapter 4.
Measurements with cross-hole tomography

Seismic cross-hole tomography 61
This way of estimating the undrained shear strength has therefore been tried belowthe undrained test fills and embankment at Lilla Mellösa and Skå-Edeby. Theprimary aim of the investigations was to find out if the method is suitable forestimating the shear strength below railway embankments, where any testsinvolving intrusion on the embankment itself and interruption of the traffic shouldbe avoided.
4.2 THE METHOD
Seismic waves
Seismic investigations are based on the propagation of elastic waves in the ground(soil and bedrock). An elastic wave is generated e.g. during an earthquake, anexplosion or when the ground is hit with a hammer. The propagation velocities ofelastic waves are governed by the elastic properties of the ground, such ascompressions modulus, shear modulus, density and Young's modulus (e.g. Kulhánek,1993). Elastic waves in the ground are usually separated into compression waves,shear waves and surface waves, and looking at the motion of rock particles showsthe distinction between the different wave types. Shear waves have a particlemotion that is perpendicular to the direction of propagation while compressionwaves have a particle motion that is parallel to the direction of propagation, Fig. 39.
Fig. 39. Particle motions of compression waves and shear waves with respect tothe direction of propagation.
Particle motion Particle motion Propagation directioncompression wave shear wave
The shear wave velocity, Vs, can be expressed in the following way:
ρGVs =
where G = shear modulus and ρ = density

SGI Report No 6362
If the shear wave velocity and the density are known it is possible to calculate theshear modulus according to:
ρ= 2sVG
Shear waves cannot propagate in fluid materials since the shear modulus of fluidsequals zero.
The shear modulus that is measured in most seismic tests is the initial shear modulusat very small strains, G0. The relation between the initial shear modulus and theundrained shear strength, cu, in Swedish normally consolidated or only slightlyoverconsolidated clays has been found to be (Larsson and Mulabdic 1991)
L
u
wcG 504
0 ≈
which yields
504ρ
≈2
Lsu
wVc
where wL is the liquid limit.
This relation mainly refers to the velocity of horizontally polarised shear wavestravelling in the vertical direction, but also waves with other polarisation and traveldirections have been included in the basis for the correlation. The differences areassumed to be small in homogeneous normally consolidated and only slightlyoverconsolidated soils, (Butcher and Powell 1997). The undrained shear strengthin the correlation refers to values obtained in corrected field vane tests and directsimple shear tests.
Seismic tomography
Tomography is a well-known techique in many branches of science to createimages of projections (tomograms) of hidden objects by the use of X-rays,ultrasound or electromagnetic waves (tomo = slice, graph = picture). During thepast few decades the use of tomography has become more common in the earthsciences, mainly in prospecting after oil and gas.

Seismic cross-hole tomography 63
There are different kinds of tomographic measurement techniques and what wasused in this project is termed seismic crosswell direct wave traveltime tomography.However, it is commonly called cross-hole tomography and will generally becalled seismic tomography or just tomography in this report. The basic principle ofthe technique is to estimate a velocity model of the ground by measuring the timeit takes for elastic waves to propagate from a source to a receiver. To performseismic crosswell tomography measurements it is necessary to have two (or more)boreholes, Fig. 40. An array of geophones is inserted in one hole and in the otheran elastic wave is generated. A seismograph measures the time it takes for the waveto propagate from the source point to the geophones. The source is then moved toanother position in the hole and the procedure is repeated. The measurements willproduce a number of arrival times of waves that have crossed the investigated area.The geophone distance and the wave frequency mainly govern the data resolution,:the shorter distance and the higher frequency, the better the resolution. Thegeometry of the investigated area, meaning the spatial relation between the depthof, and distance to, the boreholes is also an important parameter since shallowboreholes and a large distance will lead to poor ray coverage, Fig. 41.
geophones
sourceray path
seismograph
borehole
velocitycell
Fig. 40. Schematic picture of instrument setup and ray paths during aseismic tomography measurement.

SGI Report No 6364
The following paragraph presents a simplified explanation of the calculationprocedure producing velocity models, or tomograms. For a detailed explanationsee e.g. Nolet (1987). The measured first arrival times and the co-ordinates of thegeophones and the source points are stored in a simple ascii data file. The areabetween the boreholes is divided into a grid of velocity cells, see Fig. 40. The sizeof the cells can be varied in any particular way, but it is seldom relevant to use asmaller size than the geophone distance. Each cell is assigned an initial start value.The model program then calculates the time it takes for different rays to traveltrough the area between the boreholes. The calculated times are compared to themeasured travel times, and the errors in the calculations are the differences betweenthese two parameters. Different rays intersect each cell and the best-fit velocity isestimated by the least squares method. The procedure is repeated for a predeterminednumber of iterations or until a chosen limit is reached, the so-called RMS-residual.A residual is defined as the difference between the measured travel time and thecorresponding value calculated by the model. The RMS (Root Mean Square)residual is the square root of the mean of the squared residuals and indicates howwell the model corresponds to the measured data. The calculated velocity modeldoes not provide a unique solution to the inversion problem, but with informationabout the geological conditions at the site it is possible to determine if theestablished model is physically reasonable.
Fig. 41. Schematic picture of the coverage of the wave paths. It should beobserved that the coverage is relatively poor within vertical strips closeto the boreholes and in zones midway between the boreholes at theupper and lower boundaries of the investigated section.

Seismic cross-hole tomography 65
The fit of the model is thus indicated by the RMS value. The size of an acceptableRMS-value depends mainly on the measuring accuracy of the travel times for theshear waves. In this particular case, an RMS-value of up to 25 – 30 ms is consideredto indicate a good model fit.
Software for tomography inversion
The software used in this project is called 3DTOM: Three-Dimensional GeophysicalTomography (Jackson and Tweeton 1996). 3DTOM is a DOS program developedfor three-dimensional modelling in mines, but the program also performs two-dimensional calculations. It can be downloaded free of charge at the web site ofUSGS on http://www.usgs.org/. It makes no difference if one works with seismiccompression, shear or with electromagnetic waves. For inversion of travel timedata 3DTOM uses the SIRT method (Simultaneous Iterative ReconstructionTechnique; Peterson et al. 1985). It is possible to model straight rays, crooked raysor combinations of these (hybrid modelling). The data analyses are performed withvelocity histograms and by the use of stereographic projection plots that show theray coverage. The start model can be varied between a homogenous, a horizontallylayered or a chequerboard model. The calculated models are presented as contourplots in colour or in grey scale and there are functions that allow a comparisonbetween different models (such as difference or quotient). Some simple filteringcan also be performed.
Field equipment and procedure
The equipment for collecting the data consisted of a TERRALOC MARK 3(ABEM) seismograph and three 5-component 28 Hz sensor geophones (BG-K5)with pneumatic clamping devices. The vibration source was an ordinary screwplate attached to a hollow drilling pipe. A free-running inner rod system wasinserted into the pipes and was used to generate vertically polarised shear waves.The rods were then lifted and allowed to fall onto the top of the screw plate Thetriggering of the seismograph was carried out by a standard geophone (PE-3)attached to the drill pipe at the upper end. The geophones were set up to detectvertically polarised shear waves and were mounted at a distance of 1.0 metre fromeach other.
The geophones were lowered in a vertical bore hole with a plastic casing andattached by inflating the pneumatic clamping devices. The casing consisted of aplastic bellows hose that is vertically elastic, which ensures good transmission ofthe signal from the clay to the geophones. In the first measurement position theuppermost geophone was put as close as possible to the ground surface, the second

SGI Report No 6366
and third geophones were then positioned at about 1 and 2 metres depth respectively.The screw plate was screwed 0.1 – 0.2 metres down into the ground. The triggergeophone was attached to the pipe and a measurement was performed. The set ofgeophones were then lowered 3 metres and a new measurement was performed.When the geophone array reached the bottom of the borehole, the screw plate wasadvanced down to one metre depth and the procedure was repeated with thegeophones instead being lifted in 3-metre stages. This was repeated with the screwplate being advanced in 1-metre steps until it reached firm ground, which generallyoccurred at the same depth as the bottom level in the geophone hole.
Since the trigger geophone was mounted at the top of the drill pipe a time delay wasintroduced because the wave had to travel up along the pipe before it reached thegeophone. The delay increases linearly with depth of the source point. A calculationshows that the maximum size of the delay is 2.4 ms. Each data set was correctedfor the delay before the tomographic modelling started.
4.3 RESULTS
Three tomography measurements were performed at the test site in Skå-Edeby andtwo at the site in Lilla Mellösa. In Skå-Edeby one measurement was performedbeneath the circular fill, with one borehole positioned in the central part but welloutside the permanent instrumentation and the other at the perimeter of the fill. Thesecond measurement was performed in the natural soil outside the fill and the thirdmeasurement was performed across the road-like embankment, Fig. 42 a and b. InLilla Mellösa one measurement was performed beneath the square fill, from theouter border to the central part, and one in the natural soil outside the embankment,Fig. 42c.
The distance between the boreholes varied between 9 and 15 metres and the depthto solid ground varied in approximately the same way, which resulted in fairlysquare geometries and a ray-coverage of about 0° – 45°.
Data analysis
Picking the first arriving shear wave was performed continuously during themeasurements with an inbuilt function in the seismograph. The data quality wasgenerally high and most often it was easy to identify both direct compression andshear waves. Problems with noisy data occasionally occurred when the geophoneswere positioned near the ground surface, most likely caused by bad couplingbetween the geophones and the dry crust. The velocity of the direct compression

Seismic cross-hole tomography 67
Fig. 42. Schematic layout of the tomography measurements.(Red lines show the locations of the boreholes for the screw plate)a) At the circular test fill at Skå-Edebyb) At the test embankment at Skå-Edeby
-20
-15
-10
-5
0
5
10
0 5 10 15 20 25 30 35
Length, m
Dep
th, m
Geophones Screw plate
-16
-14
-12
-10
-8
-6
-4
-2
0
2
4
6
-12 -10 -8 -6 -4 -2 0 2 4 6 8 10 12
Length, m
Dep
th, m
Geophones Screw plate

SGI Report No 6368
wave is estimated at 1400-1500 m/s (straight ray approximation). The averagevelocity of the shear waves in the clay is about 80-100 m/s and the frequencies rangefrom 40 Hz to 85 Hz, which corresponds to wavelengths of 0.9 – 2.5 metres.
Velocity histograms (straight ray approximation) and time-distance graphs help toindicate the scatter in the data and to identify obvious outliers. An example is shownin Fig. 43 with data from the circular fill at Skå-Edeby. The histogram in Fig. 43ashows an approximately log-normal distribution, slightly skewed towards highervelocities, and a few anomalous values of higher velocities. The time-distance plotin Fig. 43b indicates a continuous increase in time with increasing distance betweensource and geophone. The scatter in the data is fairly high at short distances anddecreases with increasing distance. Three outliers fall close together in the upperleft part of the diagram. The data from the other measurements look very much thesame as in Fig. 43. The anomalous velocities may be caused by badly picked arrivaltimes, but may also originate from true velocity differences.
Fig. 42. Schematic layout of the tomography measurements.(Red lines show the locations of the boreholes for the screw plate)c) At the square test fill at Lilla Mellösa
-20
-15
-10
-5
0
5
10
0 5 10 15 20 25 30 35
Length, m
Dep
th, m
Geophones Screw plate

Seismic cross-hole tomography 69
Figure 43. Tomography data from the Skå-Edeby circular test fill.a) Histogram showing the shear wave velocity distribution.b) First arrival times plotted against the distance between the sourceand the geophones.
50 100 150 200 250 300 350 400 450Velocity (m/s)
0
20
40
60
80
12 13 14 15 16 17 18Source - geophone distance (m)
0
50
100
150
200
250
300Time (ms)
a)
b)

SGI Report No 6370
Tomography inversion
The first step in the data processing was to use straight ray inversion, which is thesimplest and fastest technique. This gives a good overview of velocity contrasts,data resolution capacity and it indicates unreasonable velocity anomalies. Eachdataset was then modelled using crooked ray paths, which is the most time-consuming technique but also the most accurate. The working principle was to useraw data and not to clean the data sets from “erroneous” time readings. Differencesare very small between models based on raw and on “cleaned” data. Since the soilsat both sites have distinct layering, horizontally layered starting models were used.If a homogenous starting model is used instead, the velocity anomalies will be morevertically elongated, but the general velocity distribution is not significantlyaffected.
Each data set was modelled separately, which resulted in five different tomograms.The measurements of undisturbed soil were carried out in direct connection to, andalong the same line as, the measurements beneath the circular test fill at Skå-Edebyand the square test fill at Lilla Mellösa. The models from undisturbed and disturbedsoil were therefore put together and are presented as one single contour plot of eacharea. The model of the undisturbed soil at Skå-Edeby has also been added on eachside to the test embankment model to provide comparison possibilities.
Skå-Edeby
In Fig. 44, the tomograms from beneath the circular fill and of the natural soiloutside are presented. The hatched area indicates the present position of the fill.Note the subsidence of about 1 metre. There is a large velocity contrast between thegravel fill and the clay soil. Velocities of 40 – 60 m/s dominate in the uppermost2 metres of the natural soil whereas the subsided part of the fill shows velocitiesranging from 100 m/s to 250 m/s. Below 2 metres and down to about 5 metres' depththere are still considerably higher velocities under the test fill than in the undisturbedsoil, with about 20 – 30 m/s higher velocities below the fill. At 6 – 7 metres' depththere is a horizontal high-velocity sub-layer that cuts across the entire soil section.Below this layer, from 7 to 9 metres' depth, the shear wave velocity is still higherbeneath the test fill than in the natural soil outside. When the bottom of the claylayer is reached (at about 11 metres' depth according to the CPT tests) the velocityrapidly increases from 60 – 90 m/s to 120 – 180 m/s, which indicates that a stiffermaterial underlies the clay. The dome-shape of this layer is most likely an artefactcreated during the model inversion, which is caused by a combination of a fastvelocity increase and a lack of data related to the bad ray coverage close to theboundary. The same effect can be seen below the fill material and at the lower

Seismic cross-hole tomography 71
Fig. 44. Contour plot of the tomograms from the circular embankment andnatural soil at the Skå-Edeby site.
boundary of the section in natural soil. The circular anomalies appearing along avertical line at the 13 m distance are also caused by the lack of coverage and truedata, but are here due to the borehole being situated in this position. The RMS valueof the test fill model is 21ms and for the undisturbed soil it is 25ms.
The cross-section below the road-like test embankment at Skå-Edeby was measuredwith a distance between the boreholes of 9.45 metres and a depth of 13.5 metres,which gives a favourable geometry. In Fig. 45 the model of undisturbed soil isattached on each side of the embankment model. The high-velocity layer in the topmetre (Vs = 120 – 180 m/s) under the embankment is caused by the subsidedembankment. Between 1 and 1.5 metres' depth there is a rather sharp transition andthe velocity decreases down to 50 – 60 m/s. At about 4 metres' depth there is a thinhigh velocity layer (Vs = 90 – 100 m/s), which is followed by a low velocity layer.These layered variations, which are indicated in the natural soil as well, are repeatedtwice before the bottom of the soft soil is reached at 12 – 13 metres depth. The RMSvalue of 39 ms is fairly high and it indicates some problems in fitting the model datato the measured travel times.

SGI Report No 6372
Lilla Mellösa
The results of the measurements at Lilla Mellösa are shown in Fig. 46. They greatlyresemble those from the circular embankment at Skå-Edeby. The RMS values arelow, for the embankment model it is 16 ms and for the natural soil it is 10 ms, whichindicates that the models fit statistically well to the measured data. At Lilla Mellösathe test fill has subsided about 2 metres down into the soft soil. This is clearly seenas a high-velocity layer (Vs = 150 – 230 m/s) in the uppermost 2 metres beneaththe ground surface. In the natural soil outside the embankment the velocities aresignificantly lower, 60 – 80 m/s in the upper layers. In the upper part of the soilprofile beneath the surface the shear wave velocity is significantly higher under theembankment than in the natural soil. The average velocity contrast is about40 m/s. In the lower part of the prafile the soil below the embankment and thenatural soil show similar velocity variations, but the layers are displaced downwardsbelow the embankment all the way down to the firm bottom at about 13 metres'depth. The boundary between the soft soil and the bottom is not as well-defined atthe Lilla Mellösa site as it is at the Skå-Edeby site. At Lilla Mellösa the clay layersare underlain by sand whereas those at Skå Edeby rest on rock or till. The circularanomalies appearing along a vertical line at 10 – 12 metres' distance are caused bythe lack of coverage and true data due to the borehole being situated in that position.
Fig. 45. Contour plot of the tomogram from the road-like test embankmentand natural soil at the Skå-Edeby site.

Seismic cross-hole tomography 73
Fig. 46. Contour plot of the tomograms from the square test fill and natural soilat Lilla Mellösa.
4.4 DISCUSSION OF THE RESULTS
All measurements are connected with some uncertainty and in the case of cross-hole tomography this is enhanced by the lack of coverage in parts of the sections.A specific figure for the uncertainty in the velocity determination is difficult topresent, but the standard deviations of the mean velocities in the natural soils areone way of obtaining estimates. At Skå-Edeby the standard deviation in unloadedsoil is 19 m/s and at Lilla Mellösa it is 15 m/s. Below the test fills it is ofapproximately the same sizes. The data from the road-like embankment at Skå-Edeby differ from the other datasets and the large RMS value of 39 ms makes theinterpretation of these data more uncertain.
A reliability control of the tomography models was performed by comparing theestimated velocities in natural soil to velocities from these sites based obtainedfrom seismic cone measurements by Larsson and Mulabdic' (1991). The comparisonindicates that similar values are obtained by the two techniques, although theaverage model velocities are slightly higher, Fig. 47. The scatter in the model datais high, but both examples indicate linearly increasing velocities with depth and themodelled and calculated velocities are roughly of the same size. Much of the scatterand the difference may be explained by the anomalies in the parts of the sectionswith poor coverage in the cross-hole tomography.

SGI Report No 6374
20 40 60 80 100 120Shear wave velocity (m/s)
16
12
8
4
0Depth (m)
40 80 120 160Shear wave velocity (m/s)
12
8
4
0Tomography dataCurve fittomography dataGeotechnical measurements
Depth (m)
Lilla Mellösa
Skå-Edeby
Fig. 47. Comparison between shear wave velocity in natural soil fromtomography data and estimated from seismic CPT tests.

Seismic cross-hole tomography 75
From a first glance at the tomograms in Figs 44 – 46 it is obvious that a considerableincrease in shear wave velocity and undrained strength has occurred below thecircular and square test fills in Skå-Edeby and Lilla Mellösa. It also tells that anysuch increase below the road-like test embankment at Skå-Edeby is considerablysmaller and limited to the upper layers below the embankment.
When making a more detailed evaluation, certain aspects have to be taken intoaccount. These are
• All values close to the boreholes are more or less faulty because of poor wavepath coverage and thereby misleading.
• All values at the upper and lower boundaries of the section in a part midwaybetween the boreholes are more or less faulty if the soft soil is over and underlainby considerably stiffer material. Even when this is not the case, the values areuncertain because of poor coverage in these parts.
• The relation between undrained shear strength and shear wave velocity issensitive to the liquid limit of the soil. This has to be taken into account inprofiles where this property varies, i.e. in almost every case.
Before evaluation, the data in the vertical strips with poor coverage close to theboreholes should be excluded. The width of these strips can be estimated by a sketchof the wave paths for the actual distances between the boreholes and depthsbetween the measuring points, see Fig. 41. A similar estimate of uncertain zonesat the upper and lower boundaries should also be performed together with ajudgement of how much of any dome-shaped bulbs below the fills and at the firmbottoms are caused by the waves taking crooked paths through these stiffer layers.
Chapter 5.
Correlation between the evaluated results andmeasured increases in shear strength

SGI Report No 6376
Since no information on distribution of liquid limit below the loaded area at thepresent conditions is normally available, this has to be estimated from the data inthe natural soil outside or investigations performed before the application of theload together with an estimate of the distribution of settlements with depth. Theestimation of the total settlements below the fills and the embankment is fairlystraightforward since the border between the fill material and the underlying clayis rather distinct. The estimation of the distribution with depth is more crude andhas to be made with consideration for how the levels of different layers and stiffnessborders below and outside the embankments are located in relation to each other.From the visual inspection of the tomograms below the large fills at Skå-Edeby andparticularly at Lilla Mellösa it is quite obvious that downward movements haveoccurred throughout the clay profiles below the fills. A more detailed distributionis difficult to interpret but an assumption of an even distribution of the compressionwith depth appears to be reasonable and will have to suffice. The estimation of thesettlement distribution with depth below the road-like embankment is moredifficult. However, the tomogram clearly indicates that the embankment has settledabout 1 metre and that there should not be any significant settlements below 6-7metres' depth. A rough estimation is that the settlements are evenly distributeddown to this depth.
The next step is to draw enlarged and more detailed tomograms with clear and fairlyclosely spaced contour lines for the shear wave velocities. For the tomograms of thenatural soil, horizontal lines are drawn at selected evenly spaced depths. The zoneswith estimated erroneous data are excluded and the average velocity at these depthswithin the remaining zone is estimated. Some consideration may have to be takenalso for the geometry of the loading when selecting relevant data in the upper layers,but this is not important at geometries and borehole locations such as those used inthis investigation. The zones below the slopes and just outside these have herealready been excluded because of poor coverage at the boreholes at the toes.
The same procedure is used for the tomograms below the loaded areas, but here thehorizontal lines are adjusted with consideration for the estimated settlements ateach level in such way that lines corresponding to the original depths are produced.The estimated average velocities at the “original” depths can then be compared witha certain confidence that it is the same type of material that is involved and that thecomparison thereby is relevant.
There are then two ways of estimating the undrained shear strength below theloaded areas. The first is to use the empirical relation between shear wave velocity,

Seismic cross-hole tomography 77
density and liquid limit and the undrained shear strength. The estimated shear wavevelocity below the fill is then used together with density and liquid limit at theoriginal depth. At large settlements there is also a certain increase in density butthis is of limited importance.
However, this calculation presumes that the particular soil follows the empiricalrelations and there is always a certain spread in such relations. A more direct wayis to use the undrained shear strength measured in the natural ground outside theloaded area. The shear wave velocities at each depth are then compared to velocitiescorresponding to the same original depths below the loaded area. The undrainedshear strength below the loaded area is then calculated as the undrained shearstrength in the natural soil multiplied by the square of the quotient between the shearwave velocities
2
1
212
=
s
suu V
Vcc
where cu2 = undrained shear strength below loaded areacu1 = undrained shear strength in natural groundVs2 = shear wave velocity below loaded areaVs1 = shear wave velocity in natural ground
Both methods have been applied to the measured data.
The evaluated shear wave velocities in natural ground and below the loaded areasare shown in Fig. 48 a-c. The results scatter but the patterns suggest that an increasein shear wave velocity has probably occurred throughout the profiles below thelarge fills. This increase is large at the top but decreases with depth to becomealmost zero at the bottom. At the fill in Skå-Edeby the increase in the bottom layerscan be considered to be verified whereas it is only hinted at below the fill in LillaMellösa. Below the narrow road embankment at Skå-Edeby, there is a significantincrease in velocity down to 4 metres' depth. The effect probably reaches down to6 – 7 metres' depth, but the anomaly found in the shear strength determinations bythe field vane tests at 4 metres' depth is found also in the shear wave velocities.Below 6 – 7 metres' depth no increase in shear wave velocity is even hinted at.
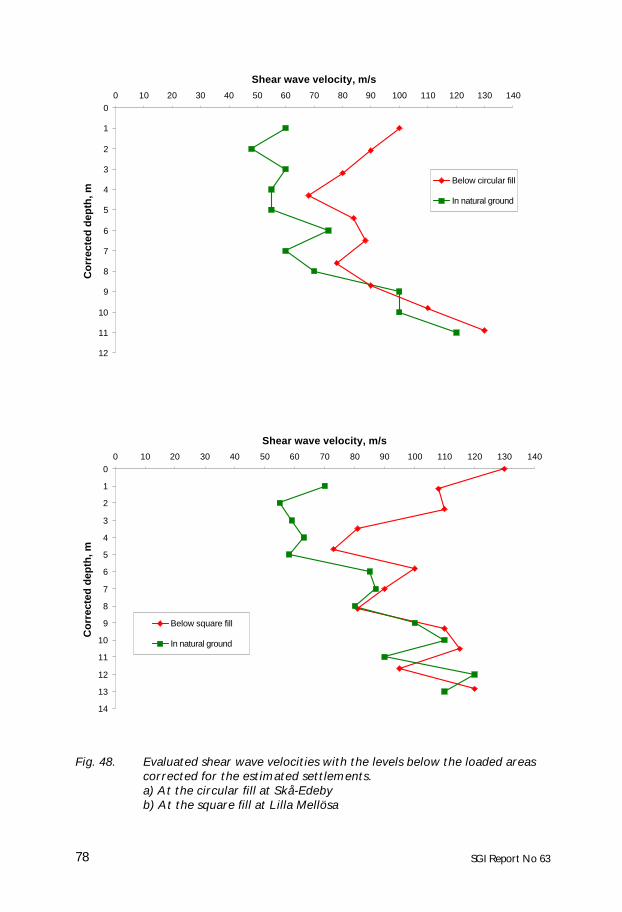
SGI Report No 6378
Fig. 48. Evaluated shear wave velocities with the levels below the loaded areascorrected for the estimated settlements.a) At the circular fill at Skå-Edebyb) At the square fill at Lilla Mellösa
0
1
2
3
4
5
6
7
8
9
10
11
12
0 10 20 30 40 50 60 70 80 90 100 110 120 130 140
Shear wave velocity, m/sC
orr
ecte
d d
epth
, m
Below circular fill
In natural ground
0
1
2
3
4
5
6
7
8
9
10
11
12
13
14
0 10 20 30 40 50 60 70 80 90 100 110 120 130 140
Shear wave velocity, m/s
Co
rrec
ted
dep
th, m
Below square fill
In natural ground

Seismic cross-hole tomography 79
The corresponding undrained shear strengths calculated by the empirical relationcu =Vs
2 · ρ · wL / 504 are shown in Fig. 49 together with the undrained shearstrengths evaluated from the field vane tests. The results show that although theundrained shear strength calculated thus are of roughly the right size, the estimationis often too coarse to be used to accurately evaluate the absolute shear strengthvalues that are sought.
The undrained shear strength calculated from the measured shear strengths in thefield and the amplification (Vs2 / Vs1)
2 estimated from the measured shear wavevelocities are shown in Fig. 50. This method provides a better estimate of the realshear strength. The amplification is the same but the base values are more relevantprovided that a good estimate of the undrained shear strength in the natural groundhas been obtained by the field vane tests.
Fig. 48. Evaluated shear wave velocities with the levels below the loaded areascorrected for the estimated settlements.c) At the test embankment at Skå-Edeby.
0
1
2
3
4
5
6
7
8
9
10
11
12
13
14
15
0 10 20 30 40 50 60 70 80 90 100 110 120 130
Sher wave velocity, m/sC
orre
cted
dep
th, m
Below embankment
In natural ground

SGI Report No 6380
Fig. 49. Evaluated undrained shear strength using the empirical correlation.Thelevels below the loaded areas corrected for the estimated settlements.a) At the circular fill at Skå-Edebyb) At the square fill at Lilla Mellösa
0
2
4
6
8
10
12
14
0 5 10 15 20 25 30 35
Undrained shear strength, kPa
Cor
rect
ed d
epth
, m Field vane test in natural groundField vane test below centre of fillCalculated in natural groundCalculated below fill
0
2
4
6
8
10
12
14
0 10 20 30 40 50 60
Undrained Shear strength, kPa
Cor
rect
ed d
epth
, m
Field vane test in natural groundField vane test below centre of fillCalculated in natural groundCalculated below fill
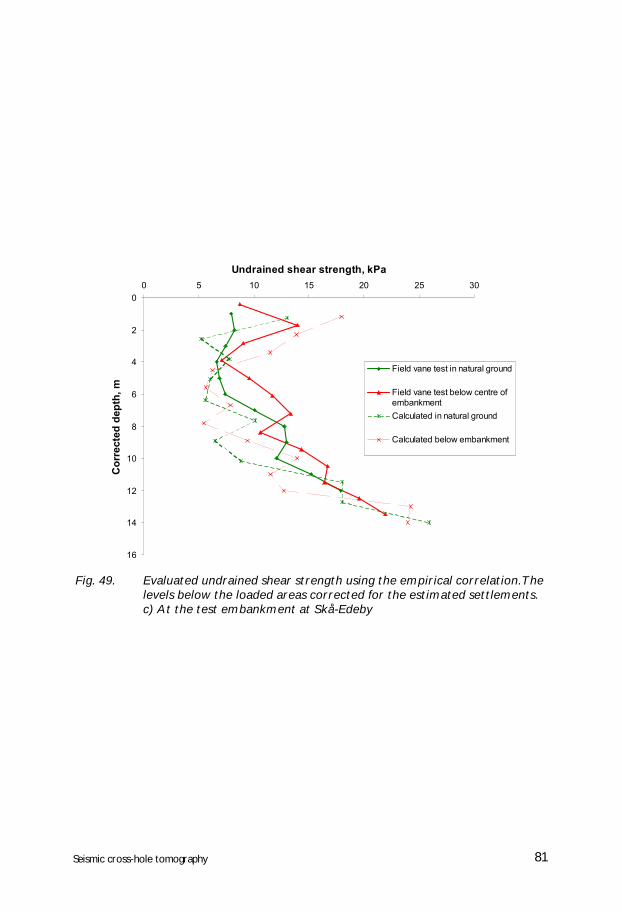
Seismic cross-hole tomography 81
Fig. 49. Evaluated undrained shear strength using the empirical correlation.Thelevels below the loaded areas corrected for the estimated settlements.c) At the test embankment at Skå-Edeby
0
2
4
6
8
10
12
14
16
0 5 10 15 20 25 30
Undrained shear strength, kPa
Cor
rect
ed d
epth
, m
Field vane test in natural ground
Field vane test below centre ofembankmentCalculated in natural ground
Calculated below embankment

SGI Report No 6382
Fig. 50. Evaluated undrained shear strength using the undrained shear strengthin natural ground and the amplification estimated from the measuredshear wave velocities. The levels below the loaded areas corrected forthe estimated settlements.a) At the circular fill at Skå-Edebyb) At the square fill at Lilla Mellösa
0
2
4
6
8
10
12
14
0 5 10 15 20 25 30 35 40 45 50
Undrained shear strength, kPa
Cor
rect
ed d
epth
, m Field vane test in natural groundCalculated from seismic amplification Field vane test below centre of fill
0
2
4
6
8
10
12
14
0 5 10 15 20 25 30 35 40
Undrained Shear strength, kPa
Cor
rect
ed d
epth
, m Field vane test in natural groundCalculated from seismic amplificationField vane test below centre of fill

Seismic cross-hole tomography 83
The results of the seismic cross-hole tomography have thereby been shown toprovide a good general picture of the shear strength below the embankments andalso fairly good estimates of the actual sizes of the shear strengths. The resultsscatter somewhat, but the general pattern of the shear strength variation is obtainedand an estimate of the operative strength on the basis of the tomographs would comeout fairly close to the actually measured values.
The comparison has been made versus shear strength in the direct shear mode. Thisis the shear strength that is normally considered to be most relevant for embankmentstability, (e.g. Zdrakovic et al. 2002). It may be advocated that the active shearstrength is more relevant for most of the part of a potential slip surface in a stabilitycalculation that runs below the embankment. However, the shear strengths in activeshear and direct shear are proportional to each other. The amplification factorwould therefore be the same and the active shear strength can be estimated in thesame way as the direct shear strength provided that the active shear strength in thenatural ground is known.
Fig. 50. Evaluated undrained shear strength using the undrained shear strengthin natural ground and the amplification estimated from the measuredshear wave velocities. The levels below the loaded areas corrected forthe estimated settlements.c) At the test embankment at Skå-Edeby
0
2
4
6
8
10
12
14
16
0 5 10 15 20 25
Undrained shear strength, kPa
Cor
rect
ed d
epth
, m
Field vane test in natural ground
Calculated from seismic amplification
Field vane test below centre ofembankment

SGI Report No 6384
The method of cross-hole tomography has been shown to be a useful tool forestimation of shear strength below embankments in principle. However, in orderto make the method a more rational tool, there are some things that should beimproved.
In this project, only readily available equipment was used. The original intentionhad been to use slender plastic tubes in the boreholes for the geophones. Such tubesare fairly cheap and easy to install. However, the measurements should thenpreferably be made with horizontally orientated shear waves. No source for suchwaves that could be inserted to different depths in the ground was found andvertically orientated waves were therefore used. This meant that vertically flexiblebellows hoses had to be used for the geophones. Such hoses are both expensive andlaborious to install and also require a certain time to become firmly fixed in thesurrounding soil. A prerequisite for the method to become rational is therefore thata suitable source for horizontally polarised shear waves is found that can also belowered into slender plastic pipes.
In the evaluations, certain problems have been encountered in connection withlarge differencies in stiffness between the fill material and the soft ground belowas well as between the soft soil and underlying till or bedrock. In order to betteraccount for sharp velocity contrasts within the investigated media, more sophisticatedcommercial computer software for tomography inversion should be evaluated.
Chapter 6.
Demand for development

Seismic cross-hole tomography 85
Åhnberg, H., Johansson, S.-E., Retelius, A., Ljungkrantz, C., Holmquist, L.and Holm, G. (1995). Cement och kalk för djupstabilisering av jord.(Cement and lime for deep stabilisation of soil.) Swedish Geotechnical Institute,Report No. 48, Linköping. (In Swedish)
Andersen, K.H., Kleven, A. and Heien, D. (1988). Cyclic Soil Data for Designof Gravity Structures. Norwegian Geotechnical Institute, Publication No. 175,Oslo.
Andréasson, B. (1979). Deformation characteristics of soft, high-plastic claysunder dynamic loading conditions. Thesis, Chalmers University of Technology,Department of Geotechnical Engineering, Gothenburg.
Atkinsson, J.H. (2000). Non-linear soil stiffness in routine design. Geotechnique,Vol. 50, No. 5, pp. 487-508.
Boman, P. and Broms, B. (1975). Stabilisering av kohesionsjord med kalkpelare.(Stabilisation of cohesive soil with lime columns.) Nordic Geotechnical Meetingin Copenhagen 1975. (In Swedish)
Butcher, A.P. and Powell, J.J.M. (1997). Determining the modulus of the groundfrom in-situ geophysical testing. Proceedings, 14th International Conference onSoil Mechanics and Foundation Engineering, Hamburg, Vol. 1, pp. 499-452.
Cadling, L. and Odenstad, S. (1950). The Vane Borer. Royal Swedish GeotechnicalInstitute. Proceedings No. 2. Stockholm.
Carlsten, P. and Eskilsson, S. (1984). In situ bestämning av lerors permeabilitet.(Determination of permeability of clay in situ.) Nordic Geotechnical Meetingin Linköping 1984. Vol. 2. (In Swedish)
Chang, Y.C.E. (1969). Long-term consolidation beneath the test fills at Väsby,Sweden. Diss. University of Illinois, Urbana, Illinois.
Chang, Y.C.E. (1981). Long-term consolidation beneath the test fills at Väsby,Sweden. Swedish Geotechnical Institute, Report No. 13, Linköping.
References

SGI Report No 6386
Claesson, P. (2003). Long term settlements in soft clays. Thesis, ChalmersUniversity of Technology, Department of Geotechnical Engineering,Gothenburg.
Dahlin, T., Larsson, R., Leroux, V., Svensson, M. and Wirsén, R. (2001).Geofysik i släntstabilitetsutredningar. (Use of geophysical methods in slopestability investigations.) Swedish Geotechnical Insititute, Report No. 62,Linköping. (In Swedish)
Hansbo, S. (1960). Consolidation of Clay with Special Reference to Influence ofVertical Sand Drains. Swedish Geotechnical Institute, Proceedings No. 18,Stockholm.
Holm, G. and Holtz, R.D. (1977). A study of large diameter piston samplers.International Symposium on Soft Clay, Bangkok 1977.
Holtz, R.D. and Broms, B. (1972). Long-Term Loading Tests at Skå-Edeby,Sweden. Proceedings of the Specialty Conference on Performance of Earth andEarth-supported Structures, Vol. 3, Purdue University, Lafayette, Indiana 1972.
Holtz, R.D. and Holm, G. (1972). Excavation and Sampling around some SandDrains at Skå-Edeby, Sweden. 6th Nordic Geotechnical Meeting, Trondheim1972.
Holtz, R.D. and Lindskog, G. (1972). Soil Movements below a Test Embankment..Proceedings of the Specialty Conference on Performance of Earth and Earth-supported Structures, Vol. 1:1, Purdue University, Lafayette, Indiana 1972.
Jacksson, M.J. and Tweeton, D.R. (1996). 3DTOM: Three-dimensionalgeophysical tomography. Instruction manual. U.S. Geological Survey, Reportof investigation 9617.
Kallstenius, T. (1963). Studies on Clay samples Taken with Standard PistonSampler. Swedish Geotechnical Institute. Proceedings No. 21, Stockholm.
Kallstenius, T. and Bergau, U. (1961). In situ determination of horizontal groundmovements. Proceedings, Fifth International Conference on Soil Mechanicsand Foundation Engineering, Paris 1961, Vol. 1, p. 481-485.
Kallstenius, T. and Wallgren, A. (1956). Pore Water Pressure Measurements inField Investigations. Swedish Geotechnical Institute, Proceedings No. 13,Stockholm.
Kulhánek, O. (1993). Propagation of seismic waves. Lecture Notes. SeismologicalDepartment, University of Uppsala.

Seismic cross-hole tomography 87
Ladd, C.C. and Foott, R. (1974). New design procedure for stability of soft clays.ASCE, Journal of the Geotechnical Engineering Division, Vol. 100, No. GT 17.pp. 763–786.
Larsson, R. (1977). Basic Behaviour of Scandinavian Soft Clays. SwedishGeotechnical Institute, Report No. 4, Linköping.
Larsson, R. (1981). Drained Behaviour of Swedish Clays. Swedish GeotechnicalInstitute, Report No. 12, Linköping.
Larsson, R. (1981). Får vi några ostörda prover med standardkolvborren? (Do weobtain undisturbed samples at standard piston sampling ?) Swedish GeotechnicalInstitute, Varia No. 60, Linköping. (In Swedish)
Larsson, R. (1986). Consolidation of soft soils. Swedish Geotechnical Institute,Report No 29, Linköping.
Larsson, R., Bergdahl, U., and Eriksson, L. (1984). Evaluation of shear strengthin cohesive soils with special reference to Swedish practice and experience.Swedish Geotechnical Institute, Information No. 3, Linköping.
Larsson, R. and Eskilsson, S. (1989). Dilatometerförsök i lera. (Dilatometer testsin clay.) Swedish Geotechnical Institute, Varia No. 243, Linköping. (In Swedish)
Larsson, R. and Mulabdic’, M. (1991). Shear moduli in Scandinavian clays –Measurements of initial shear modulus with seismic cones – Empiricalcorrelation for the initial shear modulus in clay. Swedish Geotechnical Institute,Report No. 40, Linköping.
Larsson, R. and Mulabdic’, M. (1991). Piezocone tests in clay. SwedishGeotechnical Institute, Report No. 42, Linköping.
Nolet, G. (1987). Seismic tomography – with applications in global seismologyand exploration geophysics. D. Riedel Publishing Company, Dordrecht, Holland.
Osterman, J. and Lindskog, G. (1963). Influence of Lateral Movement in ClayUpon Settlements in some Test Areas. Proccedings, 3rd European Conferenceon Soil Mechanics and Foundation Engineering, Wiesbaden, P. 137–142.
Peterson, J.E., Paulson, B.N.P. and McEvilly, T.V. (1985). Applications ofalgebraic reconstruction techniques to cross-hole seismic data. Geophysics 50,p 1566-1580.
Pusch, R. (1970). Clay Microstructure. The Swedish Council of Building Research,Document D8:1970, Stockholm.

SGI Report No 6388
Tavenas, F., Leblond, J.P. and Leroueil, S. (1983). The permeability of naturalsoft clays. Canadian Geotechnical Journal, Vol. 20, No. 4, Nov. 1983.
Torstensson, B.-A. (1976). Vertikaldränering av finkorniga jordar med en ny drän.(Vertical drainage of fine-grained soils by a new drain.) Styrelsen för TekniskUtveckling, STI-rapport nr. 72-535/U448, Stockholm. (In Swedish)
Utlåtande angående Stockholms storflygplats (1957). Alternativen vid Halmsjönrespektive Skå-Edeby, avgivet den 4 september 1957. (Report on the alternativelocations Halmsjön and Skå-Edeby for a new airport in Stockholm.)(In Swedish)
Wiesel, C.-E. (1975). Bestämning av skjuvhållfastheten med fältvingborr.(Determination of the shear strength by field vane tests.) Swedish GeotechnicalInstitute, Varia No. 25, Linköping. (In Swedish)
Zdrakovic, L., Potts, D.M. and Hight, D.W. (2002). The effect of strengthanisotropy on the behaviour of embankments on soft ground. Geotechnique,Vol. 52, No. 6, pp. 447-457.

Seismic cross-hole tomography 89
STATENS GEOTEKNISKA INSTITUTSWEDISH GEOTECHNICAL INSTITUTE
Serien ”Rapport” ersätter våra tidigare serier: ”Proceedings” (27 nr), ”Särtryckoch Preliminära rapporter” (60 nr) samt ”Meddelanden” (10 nr).
The series ”Report” supersides the previous series: ”Proceedings” (27 Nos),”Reprints and Preliminary Reports” (60 Nos) and ”Meddelanden” (10 Nos).
RAPPORT/REPORTNo År/Year
1. Grundvattensänkning till följd av tunnelsprängning 1977P. Ahlberg & T. Lundgren
2. Påhängskrafter på långa betongpålar 1977L. Bjerin
3. Methods for reducing undrained shear strength of soft clay 1977K.V. Helenelund
4. Basic behaviour of Scandinavian soft clays 1977R. Larsson
5. Snabba ödometerförsök 1978R. Karlsson & L. Viberg
6. Skredriskbedömningar med hjälp av elektromagnetisk 1978fältstyrkemätning - provning av ny metod.J. Inganäs
7. Förebyggande av sättningar i ledningsgravar -en förstudie 1979U. Bergdahl, R. Fogelström, K.-G. Larsson & P. Liljekvist
8. Grundläggningskostnadernas fördelning 1979B. Carlsson
9. Horisontalarmerade fyllningar på lös jord 1981J. Belfrage
10. Tuveskredet 1977-11-30. Inlägg om skredets orsaker 1981

SGI Report No 6390
RAPPORT/REPORTNo År/Year
11a. Tuveskredet - geoteknik 1984
11b. Tuveskredet - geologi 1981
11c. Tuveskredet - hydrogeologi 1981
12. Drained behaviour of Swedish clays 1981R. Larsson
13. Long term consolidation beneath the test fillsat 1981Väsby, SwedenY.C.E Chang
14. Bentonittätning mot lakvatten 1982T. Lundgren, L. Karlqvist & U. Qvarfort
15. Kartering och klassificering av lerområdens 1982stabilitetsförutsättningarL. Viberg
16. Geotekniska fältundersökningar 1982Metoder - Erfarenheter - FoU-behov.E. Ottosson (red.)
17. Symposium on Slopes on Soft Clays 1983
18. The Landslide at Tuve November 30 1977 1982R. Larsson & M. Jansson
19. Släntstabilitetsberäkningar i lera 1983Skall man använda totalspänningsanalys,effektivspänningsanalys eller kombinerad analys?R. Larsson
20. Portrycksvariationer i leror i Göteborgsregionen 1983J. Berntson
21. Tekniska egenskaper hos restprodukter från 1983kolförbränning - en laboratoriestudieB. Möller, G. Nilson

Seismic cross-hole tomography 91
RAPPORT/REPORTNo År/Year
22. Bestämning av jordegenskaper med sondering - 1983en litteraturstudieU. Bergdahl & U. Eriksson
23. Geobildtolkning av grova moräner 1984L. Viberg
24. Radon i jord 1984- Exhalation - vattenkvot- Årstidsvariationer- PermeabilitetA. Lindmark & B. Rosén
25. Geoteknisk terrängklassificering för fysisk planering 1984L. Viberg
26. Large diameter bored piles in non-cohesive soils 1984Determination of the bearing capacity and settlementfrom results of static penetration tests (CPT) andstandard penetration test (SPT).K. Gwizdala
27. Bestämning av organisk halt, karbonathalt 1985och sulfidhalt i jordR. Larsson, G. Nilson & J. Rogbeck
27E. Determination of organic content, carbonate content 1987and sulphur content in soilR. Larsson, G. Nilson & J. Rogbeck
28. Deponering av avfall från kol- och torveldning 1986T. Lundgren & P. Elander
28E. Environmental control in disposal and utilization of 1987combustion residuesT. Lundgren & P. Elander
29. Consolidation of soft soils 1986R. Larsson

SGI Report No 6392
RAPPORT/REPORTNo År/Year
30. Kalkpelare med gips som tillsatsmedel 1987G. Holm, R. Tränk & A. Ekström
Användning av kalk-flygaska vid djupstabilisering av jordG. Holm & H. Åhnberg
Om inverkan av härdningstemperaturen på skjuvhållfasthetenhos kalk- och cementstabiliserad jordH. Åhnberg & G. Holm
31. Kalkpelarmetoden 1986Resultat av 10 års forskning och praktisk användningsamt framtida utveckling.H. Åhnberg & G. Holm
32. Two Stage-Constructed Embankments on Organic Soils 1988• Field and laboratory investigations• Instrumentation• Prediction and observation of behaviourW. Wolski, R. Larsson et al.
33. Dynamic and Static Behaviour of Driven Piles 1987(Doctoral thesis)Nguyen Truong Tien
34. Kalksten som fyllningsmaterial 1988J. Hartlén & B. Åkesson
35. Thermal Properties of Soils and Rocks 1988(Doctoral thesis)J. Sundberg
36. Full-Scale Failure Test on a Stage-Constructed 1989Test Fill on Organic SoilW. Wolski, R. Larsson et al.
37. Pore Pressure Measurement - 1989Reliability of Different SystemsM. Tremblay
38. Behaviour of Organic Clay and Gyttja 1990R. Larsson

Seismic cross-hole tomography 93
RAPPORT/REPORTNo År/Year
39. Gruvavfall i Dalälvens avrinningsområde - 1990Metallutsläpp och åtgärdsmöjligheterRAPPORT TILL DALÄLVSDELEGATIONEN
T. Lundgren & J. Hartlén
40. Shear Moduli in Scandinavian Clays 1991- Measurement of initial shear modulus with seismic cones- Empirical correlations for the initial shear modulus in clayR. Larsson & M. Mulabdic´
41. Övervakningssystem - Släntbeteende - Skredinitiering 1992Resultat från ett fullskaleförsök i NorrköpingB. Möller & H. Åhnberg
42. Piezocone Tests in Clay 1991R. Larsson & M. Mulabdic´
43. Footings with Settlement-Reducing Piles 1993in Non-Cohesive SoilPhung Duc Long
44. Agnesbergsskredet 1994R. Larsson, E. Ottosson & G. Sällfors
45. Agnesbergsskredet - Skredförebyggande åtgärder 1994H. Sandebring & E. Ottosson
46. R&D for Roads and Bridges 1995International Seminar on Soil Mechanicsand Foundation EngineeringB. Rydell (Editor)
47. Geotechnical Properties of Clay at Elevated Temperatures 1995L. Moritz
48. Cement och kalk för djupstabilisering - 1995En kemisk - fysikalisk studie av stabiliseringseffekterH. Åhnberg, S-E. Johansson, A. Retelius, C. Ljungkrantz,L. Holmqvist & G. Holm
49. Jormaterialet silt - 1995geotekniska egenskaper och deras bestämningR. Larsson

SGI Report No 6394
50. Modelling of Groundwater Conditions in Silt and Fine Sands. 1996A study of induced groundwater changes based on laboratoryand full-scale field tests(Doctoral thesis)M. Tremblay
51. Parameter Study of Solar Heating Systems with 1995Seasonal Ground Storage in MoraineM. Lehtmets
52. Solvärmesystem med säsongslager. 1997En simulerings- och kostnadsstudieA. Gabrielsson
53. Heat storage in soft clay. 1997Field tests with heating (70 oC) and freezing of the soilA. Gabrielsson, M. Lehtmets, L. Moritz & U. Bergdahl
54. Investigations and load tests in silty soils. 1997Results from a series of investigations in silty soils in Sweden.R. Larsson
55. Radon i bostäder. 1997Markradonhaltens betydelse för riskklassificering.B. Rosén, B-M. Ek, J. Ek & H. Mattson
56. Skredet i Vagnhärad. 1998Teknisk/vetenskaplig utredning om skredets orsaker.H. Andersson, P.-E. Bengtsson, C. Berglund, R. LarssonG. Sällfors & A.-L. Högberg–Högsta
57. Skredet i Ballabo, Västerlanda 1999H. Andersson, E. Ottosson & G. Sällfors
58. Skredriskanalys i Göta älvdalen – Metodbeskrivning 2000C. Alén, P-E. Bengtsson, B. Berggren, L. Johansson.& Å. Johansson
59. Investigations and Load Tests in Clay Till. Results from 2001a series of investigations and load tests in the test fieldat Tornhill outside Lund in southern Sweden.R. Larsson
RAPPORT/REPORTNo År/Year

Seismic cross-hole tomography 95
60. Kolloiders betydelse för hållfasthet och hållfasthet och 2001föroreningstransport i jord.A-M. Fällman, O. Holby & K. Lundberg
61. Long-term effects of excavations at crests of slopes 2003Pore pressure distribution – Shear strength properties– Stability – EnvironmentRolf Larsson & Helen Åhnberg
61S Effekter av avschaktningar av släntkrön 2003Portryckssituation – Hållfasthetsegenskaper – Stabilitet – MiljöRolf Larsson & Helen Åhnberg
62. Geofysik i släntstabilitetsutredningar. 2001T. Dahlin, R. Larsson, V. Leroux, M. Svensson & R. Visén
63. Settlements and shear strength increase below embankments 2003– long-term observations and measurement of shear strengthincrease by seismic cross-hole tomographyRolf Larsson & Håkan Mattsson
RAPPORT/REPORTNo År/Year

Statens geotekniska institutSwedish Geotechnical Institute
SE-581 93 Linköping, SwedenTel 013–20 18 00, Int + 46 13 201800Fax 013–20 19 14, Int + 46 13 201914
E-mail: [email protected] Internet: www.swedgeo.se