report and consolidated accounts - conduril and consolidated... · report and opinion of the...
TRANSCRIPT


REPORT AND CONSOLIDATED ACCOUNTS

TABLE OF CONTENTS
2015

CHAPTER
01CHAPTER
02CHAPTER
03CHAPTER
04CHAPTER
05CHAPTER
06
04Conduril
10Corporate Information
14Consolidated Management Report
54Report and Opinion of the Statutory Audit Board
22Consolidated Financial Statements and Notes
58Legal Certification of Consolidated Accounts

4 Titulo
Report and Consolidated Accounts 2015
01

Título 5
Report and Consolidated Accounts 2015Faro, Portugal
CONDURILREPORT AND CONSOLIDATEDACCOUNTS 2015

6 A Conduril
Report and Consolidated Accounts 2015
“THERE ARE NO FAVOURABLE WINDS FOR THOSE WHO DO NOT KNOW WHERE THEY ARE GOING”Séneca
Commercial Registry Office of Valongo
Share Capital: 10,000,000 euros
Tax ID Number: 500 070 210
Building Permit No. 568

Conduril 7
Report and Consolidated Accounts 2015
VisionConduril develops its activity in the field of Civil
Engineering and its main objective, in both technical
and economic terms, is to become one of the best
Portuguese engineering companies (and to be
recognised by the market as such), and, at the same
time, to possess the following characteristics:
• To be a great company at a national scale, both
in technical and economic terms, capable of
responding to any work of civil engineering both in
the domestic market and abroad.
• To be, in terms of the total number of active people,
at a national level, a medium sized company,
flexible and capable to respond to different market
demands, with a great technical ability able to,
above all else, become a solid base of support for its
activities abroad.
MissionOur mission is to create lasting wealth for our
shareholders and the sustainability of the best working
conditions for our employees, as well as their satisfaction,
as the first vector of our social responsibility.
ValuesWe believe that we can only create value and wealth,
that is, win, acting the right way. In order words: with
honesty, trust and accountability based on a culture of
Integrity, which means: Honesty, Transparency, Justice
and a strict adherence to the rules and regulations;
these are our values.

8 Conduril
Report and Consolidated Accounts 2015
PORTUGAL
SENEGAL
ANGOLA
GABON
SPAIN
CAPE VERDE
BOTSWANA
CONDURIL
AROUND THE WORLD

Conduril 9
Report and Consolidated Accounts 2015
MOZAMBIQUE
ZAMBIAMALAWI
BOTSWANA
CONDURIL
AROUND THE WORLD

10 Titulo
Report and Consolidated Accounts 2015
02
Título 11
Report and Consolidated Accounts 2015Cabinda, Angola
CORPORATE INFORMATIONREPORT AND CONSOLIDATEDACCOUNTS 2015

12 Corporate Information
Porto, Portugal
Report and Consolidated Accounts 2015
CONDURIL – ENGENHARIA, S.A. IS A COMPANY LIMITED BY
SHARES, MANAGED BY AN EXECUTIVE COMMITTEE ELECTED IN
ACCORDANCE WITH THE LAW, WHOSE MANAGEMENT BODIES
PRESENT THE FOLLOWING STRUCTURE:
Board of the General MeetingJoão Baqueiro Oliveira (President)
Amadeu Augusto Vinhas
Filipa Bastos Pinto Ferreira Lemos
Board of DirectorsAntónio Luís Amorim Martins (Chairman)
Maria Benedita Andrade de Amorim Martins
Maria Luísa Andrade Amorim Martins Mendes
Álvaro Duarte Neves Vaz
António Baraças Andrade Miragaia
António Emanuel Lemos Catarino
Carlos António Soares de Noronha Dias
Ricardo Nuno Araújo Abreu Vaz Guimarães
Executive Committee Maria Benedita Andrade de Amorim Martins (CEO)
Maria Luísa Andrade Amorim Martins Mendes
(Vice-President)
Álvaro Duarte Neves Vaz
António Baraças Andrade Miragaia
António Emanuel Lemos Catarino
Carlos António Soares de Noronha Dias
Ricardo Nuno Araújo Abreu Vaz Guimarães
Statutory Audit BoardCrisóstomo Aquino de Barros (President)
Daniela Brás Vigário Silva
José Tiago Sapage Meireles de Amorim
José Álvaro Fonseca Moura (Alternate)
Statutory AuditorHorwath & Associados, SROC, Lda.
Represented by Ana Raquel B. L. Esperança Sismeiro
João Miguel Neiva de Oliveira Coelho Pires (Alternate)
Corporate Information 13
Report and Consolidated Accounts 2015
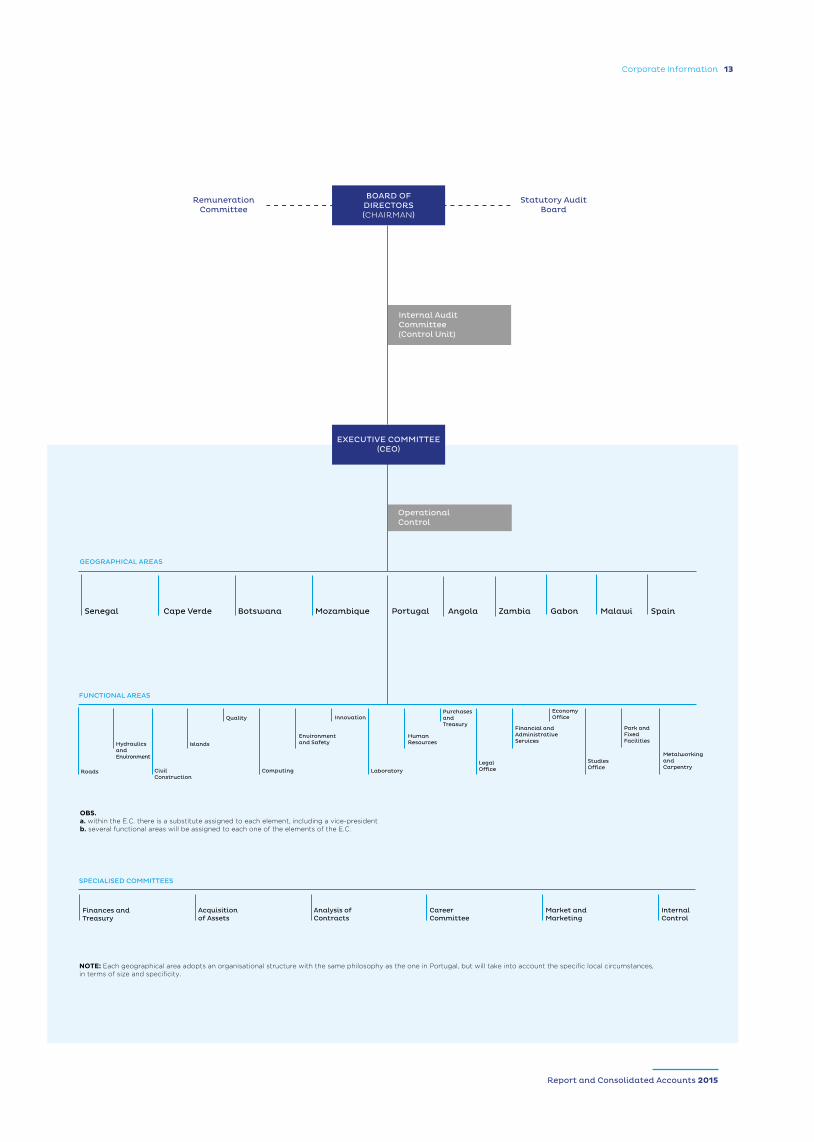
BOARD OF DIRECTORS (CHAIRMAN)
Operational Control
GEOGRAPHICAL AREAS
MalawiSenegal Botswana AngolaPortugalMozambique Cape Verde SpainZambia Gabon
FUNCTIONAL AREAS
SPECIALISED COMMITTEES
Finances andTreasury
Acquisitionof Assets
Analysis ofContracts
CareerCommittee
Market andMarketing
InternalControl
Roads Civil Construction
Islands
Quality
Computing
Environment and Safety
Financial and Administrative Services
Economy OfficeInnovation
Studies Office
Park and Fixed Facilities
Metalworking and Carpentry
Laboratory
Human Resources
Purchases and Treasury
Legal Office
Internal Audit Committee (Control Unit)
Remuneration Committee
Statutory Audit Board
OBS.a. within the E.C. there is a substitute assigned to each element, including a vice-presidentb. several functional areas will be assigned to each one of the elements of the E.C.
NOTE: Each geographical area adopts an organisational structure with the same philosophy as the one in Portugal, but will take into account the specific local circumstances, in terms of size and specificity.
EXECUTIVE COMMITTEE (CEO)
Hydraulics and Environment

14 Titulo
Report and Consolidated Accounts 2015
03

Título 15
Report and Consolidated Accounts 2015Nyimba, Zambia
CONSOLIDATEDMANAGEMENTREPORTREPORT AND CONSOLIDATEDACCOUNTS 2015

16 Consolidated Management Report
01. After a favourable performance of the world
economy in 2014, in 2015 we saw a deceleration on the
rate of growth of the real output in emerging economies,
especially in African economies.
There is a perception that, in developed countries, the
economic development had maintained its growth trend.
However, in Portugal, the economic recovery has been
strongly affected by the measures of budgetary restrictions
implemented under the programme of financial assistance.
Following this adjustment process, the market of civil
construction and public works has been seriously afflicted
by the decrease in investment. 2015 has been defined by
the sector associations as “the worst year in the area of
public investment in Portugal”, with a reduction, up to
November, of 25% in the amount of tenders and 33% in
the contracts established, compared to the previous year.
Due to its importance in the scope of this report, the
developments of the growth of the real output, the
exchange rate and the inflation rate are presented in the
table below, for the countries where Conduril operates at
the moment:
THE BOARD OF DIRECTORS OF CONDURIL - ENGENHARIA,
S.A., IN COMPLIANCE WITH THE ARTICLES OF ASSOCIATION
AND APPLICABLE LEGAL PROVISIONS, IN ACCORDANCE WITH
ARTICLES 65 AND 66 OF THE PORTUGUESE COMPANIES ACT,
PRESENTS AND SUBMITS TO THE GENERAL MEETING OF
SHAREHOLDERS, THE CONSOLIDATED MANAGEMENT REPORT,
THE CONSOLIDATED ACCOUNTS FOR THE PERIOD AND OTHER
FINANCIAL STATEMENTS, FOR THE FINANCIAL YEAR ENDING
ON 31 DECEMBER 2015.
Faro, Portugal
Report and Consolidated Accounts 2015
COUNTRIES
REAL OUTPUT GROWTH EXCHANGE RATE
INFLATION RATE2015
2014 2015 CURRENCIES 31.12.2015YEAR-ON-YEARDEVELOPMENT
Portugal 0.9% 1.5% 0.4%
Angola 4.8% 3.5% EUR-AKZ 150.07 ↓ -19% 14.3%
Mozambique 7.4% 7.0% EUR-MZN 49.01 ↓ -28% 10.6%
Botswana 4.4% 2.5% EUR-BWP 17.01 ↓ -47% 3.1%
Zambia 5.6% 4.3% EUR-ZMW 11.95 ↓ -54% 21.1%
Malawi 5.7% 4.0% EUR-MWK 726.35 ↓ -27% 24.9%
Gabon 4.3% 3.5% EUR-F.CFA 655.96 − 0% -0.1%a)
Source: IMF, World Economic Outlook, National Banks and National Statistical Institutesa) values of August 2015

Relatório de Gestão 17
02. Despite the continuity of the
internationalisation strategy of Conduril, with the
expansion to the Gabonese market in the 2nd semester
of the year, the evolution of the foreign market
generated a decrease in the weight of the turnover
outside Portugal, being this, in 2015, 77% of the 196
million euros registered.
In Portugal, the resumption of the works in the sub-
-concessions of Baixo Alentejo and Algarve Litoral, and
the start of the construction of the new Águas Santas
tunnel, helped in boosting the company’s activity; while
in Angola, the award of the work for the rehabilitation of
the pier of Malongo by the Cabinda Gulf Oil Company,
in the amount of 142 million USD, reduced the adverse
effects of the decrease of the activity in this country.
In Mozambique, the construction of the road between
Macomia and Oasse, as well as the building of the fish
market in Maputo, were completed in 2015, with the
client portfolio in this market also being extended.
In Zambia, the rehabilitation of the road between
Nyimba and Sinda is running at a good pace, at the
same time that Conduril’s activity is being solidified in
this market. The same situation is visible in Malawi, with
the progression of the works in the Kamuzu dam.
In 2015, Conduril started its activity in Gabon, with the
award of a hydraulic work between Nzeng and Ayong;
its consolidation is expected during 2016.
The expansion of the company’s activity to new
markets was not forgotten, and despite being focused
in markets in which it already operates, the company
is alert to possible opportunities abroad, particularly in
Latin America.
03. In a sector increasingly marked by the
distinction and the productive efficiency, investments
were made throughout 2015, in an amount exceeding
39 million euros, namely to acquire new equipment and
machinery, and in the renewal of infrastructures.
The majority of the non-financial investment was
directed to the operations outside of Portugal. However,
pursuing the goal of improvement of the organisational
processes that are being developed in the recent years,
conditions were created for the implementation of a
document management system transverse to all the
business units of the Group, which is expected to be
completed during 2016.
The investment in a continuous modernisation and
improvement of the working conditions are part of
Conduril’s culture and conduct, combining technical
competences and operational flexibility for an effective
answer to the market demands.
Libreville, Gabon
Report and Consolidated Accounts 2015

18 Consolidated Management Report
04. Despite the strong negative impact of the macroeconomic factors, Conduril ends 2015 with a positive global
performance reflected in the following indicators:
EBITDATurnover250
200
150
100
50
0
2013 2014 2015
M¤
internal market external market
Net Income for the Period
50
40
30
20
10
0
2013 2014 2015
M¤
Investment in Assets
40
32
24
16
8
0
2013 2014 2015
M¤
100
80
60
40
20
0
2013 2014 2015
M¤
Equity250
200
150
100
50
0
2013 2014 2015
M¤
Financial Autonomy75%
60%
45%
30%
15%
0%
2013 2014 2015
General Liquidity200%
190%
180%
170%
160%
150%
2013 2014 2015
Net Debt8
0
-8
-15
-23
-30
M¤
2013 2014 2015
93% 93% 77%
7% 7%23%
Report and Consolidated Accounts 2015

Consolidated Management Report 19
In operational terms, a decrease of 6% in turnover
was verified. However, the company’s soundness is
expressed in the evolution of its liquidity and in the
values of financial autonomy, with the variation of the
net debt being directly related to the increase of the
investment in assets.
Nevertheless, the performance of Conduril, was, once
again, recognised by external entities, namely by the
Exame magazine, with the attribution of the awards of
Best Company in the Sector, for the third consecutive
year, and the 2nd Happiest Company in the study
Happiness Works 2015.
05. During 2015, in average 2700 employees
integrated the human capital of Conduril, 90% of them
in the African continent.
Despite the slowdown of the activity in Angola, the
evolution of the works in Zambia, Malawi and Gabon
allowed the reallocation of some resources, keeping the
number of employees at the levels of the previous year.
The investment in the development of competences
of its employees is the cornerstone of its strategy and
it was translated, in 2015, in more than 14,000 hours
of training, in a global investment exceeding 500,000
euros, completely supported by Conduril.
In Angola, the activity of the Conduril Academy has
an essential importance, contributing to the reduction
of the illiteracy rate of the Group’s employees in this
country, from 24% in 2011 to 5% in 2015, with a volume
of training exceeding 100,000 hours and with more
than 1400 certificates issued since 2010.
The social responsibility of Conduril and the
maintenance of the sustainability of better working
conditions for its employees are complemented with its
pension fund, in the amount of 8.2 million euros at the
end of 2015, and with the attribution of an award to the
workers who complete 25 years of service.
Huíla, Angola
Report and Consolidated Accounts 2015

20 Consolidated Management Report
06. The Integrated Management System is
also a key element of the Conduril’s corporative culture
and it is highly disseminated and implemented, being
an anchor in the execution of the goals of continuous
improvement of the production process and the
decrease of the environmental impact of its activity.
This system is duly recognised by external entities, namely:
• in the revalidation of the certifications of the quality
management system in Portugal, in the Angola
branch, in Métis, in the Mozambique Delegation,
in ENOP and in Urano, according to the standard
NP EN ISO 9001:2008, by APCER (Portuguese
Association of Certification);
• in the renewal of the certifications in the scope of
safety in Portugal, in the Angola branch, in Métis
and in Urano, according to the standards OHSAS
18001:2007 and NP 4397:2008, by APCER;
• in the revalidation of the certification of the
environmental management system in Portugal,
according to the standard NP EN ISO 14001:2012, by
APCER;
• in the renewal of the accreditation, by IPAC
(Portuguese Institute for Accreditation), for the
Portuguese Central Laboratory, according to the
standard NP EN ISO/IEC 17025:2005; and
• in the follow-up and maintenance of the certification
obtained in the scope of the EC Marking for the
metal structures produced in our Portuguese
industrial facilities, according to the standard EN
1090+1:2009+A1:2011.
07. The instability of the main macroeconomic
variables in Portugal and in the six countries where
Conduril operates in 2016, and especially in the
investment in infrastructures, with strong relation to
the construction sector, creates several difficulties and
uncertainties. However, its knowledge of these markets,
associated to the acceptance received from them,
conveys confidence for the following year: the amount
of construction works is around 340 million euros and
their development and performance are progressing
according to schedule.
08. Other information enclosed:
a. Conduril has branches in Angola, Mozambique,
Botswana, Cape Verde, Senegal, Zambia, Malawi,
Gabon and Morocco.
b. There are no overdue debts to the State or any other
public entity, including the Social Security.
c. The share capital, fully subscribed and paid-in, is
composed of 2,000,000 ordinary shares with a nominal
value of 5 euros each. The own shares held, which
Beja, Portugal Zaire, Angola
Report and Consolidated Accounts 2015

Consolidated Management Report 21
amount to 200,000, were not object of any transaction
during the year.
d. The securities issued by CONDURIL - Engenharia,
S.A. held by members of the management bodies were
maintained in relation to the previous financial year,
except for the number of shares of the shareholder
Maria Luísa Andrade Amorim Martins Mendes, who
acquired on the 08 May 2015, 5 shares for the unit value
of 66.01 euros and for the number of shares of the
shareholder António Baraças Andrade Miragaia, who
disposed, on the 30 December 2015, of 102 shares, in
an off-exchange transaction, for the unit value of 67.00
euros.
e. Conduril is not aware of any shareholders that have
sold the qualified holdings mentioned previously in
other reports.
09. In compliance with the legal and statutory
provisions and in continuation of the policy of fair
return of the capital invested, the individual reports and
accounts presents the following distribution of the net
income for the period, in the amount of 6,171,538 euros:
• Dividends: 900,000 euros, corresponding to 0.50
euros per share;
• Retained Profit: 568,425 euros;
• Free Reserves: 4,703,113 euros.
10. The Board of Directors could not finish its
consolidated management report without leaving
words of appreciation to all those who participated in
the company’s activity throughout 2015.
The Board of Directors would like to thank the
collaboration, commitment and dedication
demonstrated by all clients, suppliers, financial
institutions and all other business partners of the
company and, especially, by the employees and the
members of the management bodies.
Ermesinde, 18 February 2016
The Board of Directors
Zaire, Angola Maputo, Mozambique
Report and Consolidated Accounts 2015

22 Titulo
Report and Consolidated Accounts 2015
04

Título 23
Report and Consolidated Accounts 2015Liwonde, Malawi
CONSOLIDATEDFINANCIAL STATEMENTS AND NOTESREPORT AND CONSOLIDATEDACCOUNTS2015
24 Consolidated Financial Statements
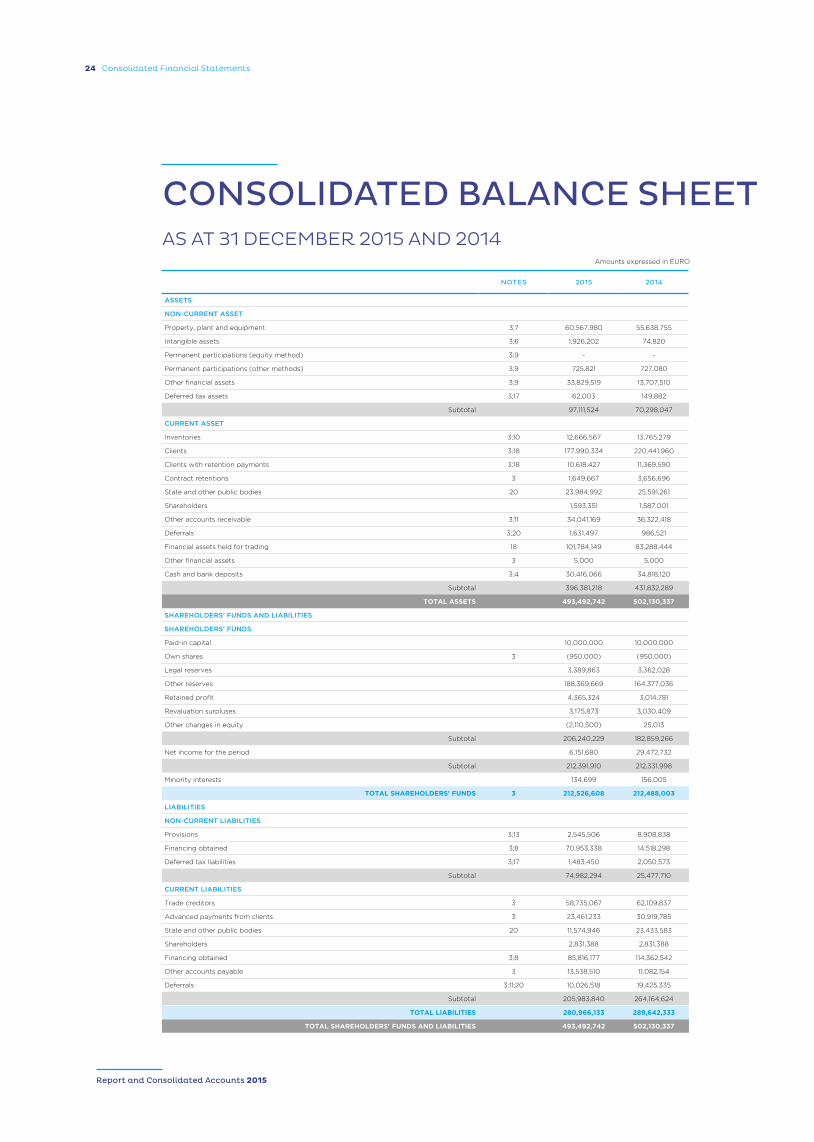
CONSOLIDATED BALANCE SHEETAS AT 31 DECEMBER 2015 AND 2014
NOTES 2015 2014
ASSETS
NON-CURRENT ASSET
Property, plant and equipment 3;7 60,567,980 55,638,755
Intangible assets 3;6 1,926,202 74,820
Permanent participations (equity method) 3;9 - -
Permanent participations (other methods) 3;9 725,821 727,080
Other financial assets 3;9 33,829,519 13,707,510
Deferred tax assets 3;17 62,003 149,882
Subtotal 97,111,524 70,298,047
CURRENT ASSET
Inventories 3;10 12,666,567 13,765,279
Clients 3;18 177,990,334 220,441,960
Clients with retention payments 3;18 10,618,427 11,369,590
Contract retentions 3 1,649,667 3,656,696
State and other public bodies 20 23,984,992 25,591,261
Shareholders 1,593,351 1,587,001
Other accounts receivable 3;11 34,041,169 36,322,418
Deferrals 3;20 1,631,497 986,521
Financial assets held for trading 18 101,784,149 83,288,444
Other financial assets 3 5,000 5,000
Cash and bank deposits 3;4 30,416,066 34,818,120
Subtotal 396,381,218 431,832,289
TOTAL ASSETS 493,492,742 502,130,337
SHAREHOLDERS' FUNDS AND LIABILITIES
SHAREHOLDERS' FUNDS
Paid-in capital 10,000,000 10,000,000
Own shares 3 (950,000) (950,000)
Legal reserves 3,389,863 3,362,028
Other reserves 188,369,669 164,377,036
Retained profit 4,365,324 3,014,781
Revaluation surpluses 3,175,873 3,030,409
Other changes in equity (2,110,500) 25,013
Subtotal 206,240,229 182,859,266
Net income for the period 6,151,680 29,472,732
Subtotal 212,391,910 212,331,998
Minority interests 134,699 156,005
TOTAL SHAREHOLDERS' FUNDS 3 212,526,608 212,488,003
LIABILITIES
NON-CURRENT LIABILITIES
Provisions 3;13 2,545,506 8,908,838
Financing obtained 3;8 70,953,338 14,518,298
Deferred tax liabilities 3;17 1,483,450 2,050,573
Subtotal 74,982,294 25,477,710
CURRENT LIABILITIES
Trade creditors 3 58,735,067 62,109,837
Advanced payments from clients 3 23,461,233 30,919,785
State and other public bodies 20 11,574,946 23,433,583
Shareholders 2,831,388 2,831,388
Financing obtained 3;8 85,816,177 114,362,542
Other accounts payable 3 13,538,510 11,082,154
Deferrals 3;11;20 10,026,518 19,425,335
Subtotal 205,983,840 264,164,624
TOTAL LIABILITIES 280,966,133 289,642,333
TOTAL SHAREHOLDERS' FUNDS AND LIABILITIES 493,492,742 502,130,337
Amounts expressed in EURO
Report and Consolidated Accounts 2015

Consolidated Financial Statements 25
CONSOLIDATED PROFIT AND LOSS ACCOUNT BY NATUREAS AT 31 DECEMBER 2015 AND 2014
INCOME AND EXPENSES NOTES 2015 2014
Sales and services provided 3;12;20 196,172,660 208,815,402
Grants received as compensation for expenses - -
Gains/losses allocated to subsidiaries, associated companies and joint ventures 3 - -
Variation of inventories in production 3;10 136,205 (362,907)
Own work capitalised 3 3,853,446 2,781,693
Cost of goods sold and materials consumed 10 (48,772,771) (50,714,596)
External supplies and services (83,824,369) (63,858,368)
Personnel expenses 3;19;20 (44,660,972) (46,664,204)
Impairment of inventories (losses/reversals) 3;10 (38,555) 543,981
Impairment of doubtful debts (losses/reversals) 3;18 (271,091) (1,530,815)
Provisions (increases/reductions) 3;13 5,620,429 (4,539,579)
Impairment of non-depreciable/amortisable assets (losses/reversals) - -
Increases/reductions of fair value 3;18 - 49,093
Other income 14;20 37,546,799 37,281,658
Other expenses 14;20 (30,207,052) (18,260,918)
Operating income before depreciations, financing costs and taxes 35,554,730 63,540,440
Depreciation and amortisation expenses/reversals 3;6;7 (11,524,177) (9,850,122)
Impairment of depreciable/amortisable assets (losses/reversals) - -
Net operating income (before financing costs and taxes) 24,030,553 53,690,318
Interests and similar income obtained - -
Interests and similar expenses supported 3;20 (14,222,512) (8,159,153)
Income before taxation 9,808,041 45,531,165
Income taxes 3;17 (3,652,655) (16,024,024)
NET INCOME FOR THE PERIOD 6,155,387 29,507,141
Income of discontinued operations (net of tax) inc. in the net incomefor the period
- -
NET INCOME FOR THE PERIOD ATTRIBUTABLE:
Holders of equity of the parent entity 6,151,680 29,472,732
Minority interests 3,707 34,409
Subtotal 6,155,387 29,507,141
EARNINGS PER SHARE (BASIC) 3.42 16.39
Amounts expressed in EURO
Report and Consolidated Accounts 2015

26 Consolidated Financial Statements
CONSOLIDATED CASH FLOW STATEMENTAS AT 31 DECEMBER 2015 AND 2014
ITEMS NOTES 2015 2014
Operating activities flow
Cash receipts from clients 169,096,819 121,679,512
Payments to suppliers (121,179,887) (120,983,048)
Payments to employees (35,422,278) (40,276,238)
Revenues generated by operations 12,494,654 (39,579,774)
Payment/receipt of income taxes (7,191,962) (23,801,539)
Other cash receipts/payments relating to operating activities (1,193,821) (14,049,752)
OPERATING ACTIVITIES FLOW (1) 4,108,872 (77,431,064)
INVESTMENT ACTIVITIES FLOW
CASH PAYMENTS ARISING FROM:
Property, plant and equipment (9,808,485) (11,825,914)
Intangible assets (5,342) (27,691)
Financial investments (20,122,508) (6,074,597)
Other assets - (1,218)
CASH RECEIPTS ARISING FROM:
Property, plant and equipment - 426
Other assets - 1,128
Interest and similar income 4,339,476 4,719,674
Dividends 60,340 56,705
INVESTMENT ACTIVITIES FLOW (2) (25,536,520) (13,151,487)
FINANCING ACTIVITIES FLOW
CASH RECEIPTS ARISING FROM:
Financing obtained 198,161,409 141,517,512
Other financing operations 469 272,560
CASH PAYMENTS ARISING FROM:
Financing obtained (159,839,417) (42,908,287)
Leasing financing (925,728) (1,029,274)
Interests and similar expenses (13,681,478) (7,065,626)
Dividends (3,600,000) (5,400,000)
Capital decreases and other equity instruments 7,417 -
Other financing operations (183,011) (20,601)
FINANCING ACTIVITIES FLOW (3) 19,939,661 85,366,285
Net increase/decrease in cash and cash equivalents (1 + 2 + 3) (1,487,986) (5,216,267)
Effects of foreign exchange rate (2,914,068) 3,088,645
Cash and cash equivalents at the beginning of the period 34,818,120 36,945,742
CASH AND CASH EQUIVALENTS AT THE END OF THE PERIOD 4 30,416,066 34,818,120
Amounts expressed in EURO
Report and Consolidated Accounts 2015

Consolidated Financial Statements 27
CO
NS
OL
IDA
TE
D S
TAT
EM
EN
T O
F C
HA
NG
ES
IN
EQ
UIT
Y F
OR
TH
E P
ER
IOD
OF
20
15S
HA
RE
HO
LD
ER
S’
FU
ND
S A
TT
RIB
UT
ED
TO
HO
LD
ER
S O
F E
QU
ITY
OF
TH
E P
AR
EN
T E
NT
ITY
NO
TE
SP
AID
-IN
C
AP
ITA
LO
WN
SH
AR
ES
LE
GA
L
RE
SE
RV
ES
OT
HE
R
RE
SE
RV
ES
RE
TAIN
ED
P
RO
FIT
RE
VA
LUA
TIO
N
SU
RP
LUS
ES
OT
HE
R
CH
AN
GE
S IN
E
QU
ITY
NE
T IN
CO
ME
F
OR
TH
E
PE
RIO
DT
OTA
LM
INO
RIT
Y
INT
ER
ES
TS
TO
TAL
S
HA
RE
HO
LD
ER
S’
FU
ND
S
Po
siti
on
as
at
01
Jan
uary
20
1510
,00
0,0
00
(9
50
,00
0)
3,3
62,0
28
16
4,3
77,0
36
3
,014
,78
1 3
,03
0,4
09
25
,013
29
,472,7
32
212
,33
1,9
98
15
6,0
05
212
,48
8,0
03
Ap
plic
ati
on
of
the in
co
me f
or
the p
eri
od
28
,117
27,5
58
,224
1,8
86
,39
1 (2
9,4
72,7
32)
- -
Po
siti
on
as
at
01
Jan
uary
20
15 a
fter
ap
plic
ati
on
of
inco
me
10,0
00
,00
0
(95
0,0
00
)3
,39
0,14
5
191,9
35
,26
0
4,9
01,17
2
3,0
30
,40
9
25
,013
-
212
,33
1,9
98
15
6,0
05
212
,48
8,0
03
CH
AN
GE
S I
N T
HE
PE
RIO
D:
Fir
st a
do
pti
on
of
the n
ew
acco
un
tin
g f
ram
ew
ork
- -
Ch
an
ges
in a
cco
un
tin
g p
olic
ies
- -
Diff
ere
nce
s in
the tra
nsl
atio
n o
f finan
cial
sta
tem
ents
(2,14
7,2
08
)(2
,14
7,2
08
)(7
,58
5)
(2,15
4,7
93
)
Realis
ab
ility
of
the r
evalu
ati
on
su
rplu
s o
f ta
ng
ible
an
d in
tan
gib
le fi
xed
ass
ets
39
,96
3
(39
,96
3)
- -
Vari
ati
on
s o
f th
e r
evalu
ati
on
su
rplu
ses
of
tan
gib
le a
nd
in
tan
gib
le fi
xed
ass
ets
- -
Ad
just
men
ts b
y d
efe
rred
taxes
(110
,970
)18
5,4
28
74
,45
8
74
,45
8
Ap
plic
ati
on
of
the e
qu
ity m
eth
od
- -
Oth
er
reco
gn
ised
ch
an
ges
in e
qu
ity
(28
1)3
4,4
09
(4
64
,84
1)11
,69
4
(419
,019
)(1
0,0
14)
(429
,03
3)
- -
(28
1)3
4,4
09
(5
35
,84
8)
145
,46
5
(2,13
5,5
13)
- (2
,49
1,76
9)
(17,6
00
)(2
,50
9,3
68
)
NE
T I
NC
OM
E F
OR
TH
E P
ER
IOD
6,15
1,6
80
6
,15
1,6
80
(3
,70
7)
6,14
7,9
74
Overa
ll re
sult
6,15
1,6
80
6
,15
1,6
80
(3
,70
7)
6,14
7,9
74
OP
ER
AT
ION
S W
ITH
EQ
UIT
Y H
OL
DE
RS
IN
TH
E P
ER
IOD
Cap
ital in
cre
ase
s-
-
Paym
en
t o
f sh
are
iss
uan
ce p
rem
ium
s-
-
Dis
trib
uti
on
s(3
,60
0,0
00
)(3
,60
0,0
00
)(3
,60
0,0
00
)
Co
ntr
ibu
tio
ns
to c
over
loss
es
- -
Oth
er
op
era
tio
ns
- -
- (3
,60
0,0
00
)-
- -
- (3
,60
0,0
00
)-
(3,6
00
,00
0)
Po
siti
on
at
the
en
d o
f D
ece
mb
er
20
153
10,0
00
,00
0
(95
0,0
00
)3
,38
9,8
63
18
8,3
69
,66
9
4,3
65
,32
4
3,1
75
,87
3
(2,1
10,5
00
)6
,15
1,6
80
2
12,3
91,
910
13
4,6
99
2
12,5
26
,60
9
Am
ou
nts
exp
ress
ed
in
EU
RO
Report and Consolidated Accounts 2015

28 Notes to the Consolidated Financial Statements
1. Introductory noteCONDURIL – Engenharia, S.A. (“CONDURIL” or
“Company”), is a company founded in 1959 and
transformed in a company limited by shares in 1976,
with registered office at Av. Eng.º Duarte Pacheco, 1835
– 4445-416 Ermesinde – Valongo, Portugal, and the
participated companies (“Group”), whose main activity
is public construction works and all other works related
to the exercise of this activity.
We believe that these consolidated financial statements
are a true and proper representation of the operations
of the companies belonging to the Group, as well as
their financial position and performance and cash
flows.
All amounts expressed in these notes are presented in
euros, rounded to the nearest unit.
2. Accounting framework for the preparation of the financial statements2.1. These financial statements have been prepared
bearing in mind the continuation of the Group's
operations, from the accounting records of the Group
and in accordance with the rules of the Accounting
Standardisation System, governed by the following
legislation:
• Decree-law no. 158/2009, of 13 July (Accounting
Standardisation System);
• Decree Order no. 986/2009, of 7 September
(Financial Statements Models);
• Notice no. 15652/2009, of 7 September (Framework);
• Notice no. 15655/2009, of 7 September (Accounting
Standards and Financial Reporting);
• Decree Order no. 1011/2009, of 9 September (Code
of Accounts).
2.2. Indication and comment on the balance sheet
and the income statement whose contents are not
comparable with those of the previous financial year:
The amounts presented for comparative purposes are
comparable and are presented in accordance with the
model resulting from the amendments introduced by
the legislation mentioned in the previous paragraph.
3. Significant accounting policiesThe significant accounting policies adopted in the
preparation of the attached financial statements are the
following:
3.1. Measurement bases used in the preparation of
the financial statements
The attached financial statements have been prepared
bearing in mind the continuation of the Group's
operations, from the accounting books and records of
the companies belonging to the Group, maintained in
accordance with the accounting principles generally
accepted in Portugal (NCRF).
a. CONSOLIDATED PRINCIPLES
The consolidated principles adopted by the Group in the
preparation of the consolidated financial statements are
the following:
i. Investments in subsidiaries
Investments in companies in which the Group owns,
directly or indirectly, more than 50% of the voting rights
at General Meeting of Shareholders or is able to establish
financial and operational policies (definition of control
used by the Group), are included in the consolidated
financial statements using the integral consolidation
method. Equity and net income of these companies
corresponding to the shareholding of third parties in
the subsidiary companies is shown separately in the
consolidated balance sheet and in the consolidated
profit and loss account in the item “Minority interests”.
When losses attributable to minorities are greater than
the minority interest in a subsidiary's equity, then the
Group absorbs this excess and any additional losses,
except when the minorities have an obligation and are
able to cover said losses. If the subsidiary subsequently
reports profits, then the Group appropriates all profits
until the minority's share of losses absorbed has been
recovered.
The results of subsidiaries acquired or sold during the
period are included in the income statement from the
effective date of acquisition or up to the effective date
of sale, as appropriate.
Adjustments to the financial statements of subsidiary
companies are made whenever necessary to adjust
NOTES TO THE CONSOLIDATED FINANCIAL STATEMENTS AS AT 31 DECEMBER 2015
Report and Consolidated Accounts 2015
Notes to the Consolidated Financial Statements 29
them to the accounting policies used by the Group.
Transactions, balances and dividends distributed between
the Group's subsidiaries are eliminated on consolidation.
Whenever the Group has, in substance, control over other
entities created for a specific purpose (“Special Purpose
Entities”), even if no share capital interest is directly or
indirectly held in those entities, these are consolidated by
the integral consolidation method.
ii. Investments in associates
Investments in associated companies (companies where
the Group exercises significant influence but does not
have control or joint control through the participation in
financial and operational policies - usually corresponding
to holdings between 20% and 50% in a company's share
capital) are registered by the equity method.
Under the equity method, investments in associated
companies are initially recorded at acquisition cost,
which is adjusted proportionally to the Group's interest
in the corresponding equity of those companies, at
the acquisition date or at the date of the first adoption
of the equity method. Permanent participations are
adjusted annually by the amount corresponding to the
participation in the net profit/loss of the associated
companies as opposed to gains or losses in the period.
Furthermore, the dividends of these companies are
registered as a decrease in investments, and the Group's
proportion in the changes occurred in the associated
company's equity are registered as a change in the
Group's equity.
The differences between the acquisition cost and fair
value of the assets and liabilities attributable to the
associate on acquisition date, if positive, are recognised
as goodwill. If that difference is negative, after
reconfirmation of the fair value attributed, it is registered
as a gain for the period in the item “Other income”.
An assessment of the investments in associated
companies is made whenever there are indications
that the asset may be impaired, with the impairment
losses that are shown to exist being registered as costs.
Impairment losses recognised in previous periods that
are no longer justifiable are reversed.
When the Group's share of losses of the associated
company exceeds the investment's book value, the
investment is reported at null value, except to the extent
of the Group's commitments to the associate.
The Group's share in unrealised gains arising from
transactions with associated companies is eliminated
in proportion to the Group's interest, against the
investment in that associated company. Unrealised
losses are eliminated, but only to the extent that there
is no evidence of impairment of the asset transferred.
iii. Jointly controlled entities
The financial interests in jointly controlled companies/
entities were consolidated in the attached income
statement by the proportionate consolidation method,
from the date in which the control is shared. According
to this method, the assets, liabilities, losses and gains of
these companies have been included in the consolidated
financial statements, on a line-by-line basis, in proportion
to the Group's participation in the companies.
The classification of the financial interests held in jointly
controlled companies/entities is determined based on:
• shareholder agreements that regulate the joint control;
• effective percentage held;
• voting rights held.
Any change of consolidation generated by the
acquisition of a jointly controlled company/entity is
registered according to the accounting policies defined
for subsidiaries. Transactions, balances and dividends
distributed between the jointly controlled companies are
eliminated in proportion to the Group's participation.
iv. Goodwill
At the balance sheet date, an evaluation of the
recoverable amount of the net value of the goodwill is
made, and the respective impairment losses recognised
whenever the accounting value of goodwill exceeds
its recoverable amount. The goodwill value is not
amortised. The gain or loss on disposal of an entity
includes the accounting value of goodwill related to the
entity sold, unless the business to which that goodwill
is related is maintained generating benefits to the
Group. Impairment losses related to goodwill cannot be
reversed and are registered in the income statement for
the period, in the item “Impairment of non-depreciable/
amortisable investments (losses/reversals)”.
The differences between the acquisition cost of
investments in subsidiaries and associates, and the fair
value of the identifiable assets and liabilities (including
contingent liabilities) of these companies at the date of
their acquisition, if negative, are recognised as income
at the date of acquisition, after reassessment of the fair
value of the identifiable assets and liabilities.
The gain or loss on disposal of an entity includes the
accounting value of goodwill related to the entity sold,
unless the business to which that goodwill is related is
maintained generating benefits to the Group.
v. Translation of financial statements of foreign
subsidiaries
Assets and liabilities of foreign entities financial
statements included on the consolidation are translated
into euros using the exchange rates at the balance sheet
date and gains and losses using the average exchange
rates. The amount related to the exchange rate difference
is registered in the equity item “Other changes in equity”.
The goodwill value and fair value adjustments resulting
from the acquisition of foreign entities are treated as
assets and liabilities of that entity and converted to
euros according to the exchange rate in force at the
end of the period. Whenever a foreign company is sold,
accumulated exchange rate differences are recognised
in the income statement as a gain or loss on the disposal.
Report and Consolidated Accounts 2015

30 Notes to the Consolidated Financial Statements
b. INTANGIBLE ASSETS
The intangible assets, which essentially comprise
development rights and computer programmes, are
registered at acquisition cost, net of eventual impairment
losses and accumulated amortisation. These assets are
written down from the moment in which the underlying
assets are completed or in use, by the straight-line
method, for a period of 60 and 3 years, respectively.
The intangible assets are only recognised when it is
probable that they derive future economic benefits for
the Group, are controllable by the Group and that they
can be measured reliably.
The development costs for which the Group
demonstrates ability to complete their development
and start their marketing and/or use, and for which it
is probable that their created asset will generate future
economic benefits, are capitalised. The development
costs that do not meet these criteria are registered as
expense in the period in which they are incurred.
The gains or losses arising from the sale or write-off of
these assets are determined as the difference between
the sale price and the accounting net value at the date
of sale/write-off, and are registered by the net value
in the income statement, as “Other income” or “Other
expenses”.
c. PROPERTY, PLANT AND EQUIPMENT
The property, plant and equipment acquired up to
01 January 2009, are registered at their considered
cost, which corresponds to the acquisition cost or the
revaluated acquisition cost in accordance with the
generally accepted principles in Portugal until that date,
net of accumulated depreciation and impairment losses.
The property, plant and equipment acquired after
that date, are registered at acquisition cost, net of the
corresponding depreciation and accumulated impairment
losses.
Depreciations are calculated, after the beginning of use of
the goods, by the straight-line method, on an annual basis,
according to the following estimated useful lives:
Maintenance and repair costs, which do not increase the
useful life of these fixed assets are registered as expenses
in the period in which they occur. The cost of major repairs
and renovations are included in the accounting value of
the asset whenever it is expected that this would involve
additional future economic benefits.
Property, plant and equipment in progress represent
assets still in the construction phase or in transit, and are
registered at acquisition cost net of eventual impairment
losses. These assets are depreciated from the moment
they are in a state of use.
The gains or losses arising from the sale or write-off of
these assets are determined as the difference between the
sale price and the accounting net value at the date of sale/
write-off, and are registered by the net value in the income
statement, as “Other income” or “Other expenses”.
d. LEASES
Classification of leases as financial or operating is made
based on the substance and not on the form of the
contract. The lease agreements in which the Group acts
as lessee are classified as finance leases, if the risks and
rewards incident to ownership lie with the lessee, and
as operating leases, if the risks and rewards incident to
ownership do not lie with the lessee.
In accordance with the financial method, the cost of
the asset is registered as an asset, the corresponding
responsibility is registered as a liability, in the item
“Financing obtained”, and the interests included in
the value of rentals and the assets reintegration are
registered as costs in the financial statement for the
concerning period.
Operating lease instalments are recognised as expenses
on a straight-line basis over the rental period.
e. INTEGRATION OF BRANCHES
The accounting information of the branches where the
Group develops its activity, namely Angola, Mozambique,
Morocco, Botswana, Cape Verde, Senegal, Zambia,
Malawi and Gabon, is monthly integrated in accounting.
The balances and transactions occurred in the period
between the registered office and the branches are
eliminated.
When the functional currency of the branch is different
from the reporting currency of the Group, the process
of integration is performed through the translation
of the variations of assets and liabilities, income and
expenses at the exchange rate in force on the date of
each monthly integration. On the reporting date, the
exchange differences resulting from monetary assets
and liabilities are calculated, being registered as gains or
losses in the income statement.
In the accounting information of the branches are
mainly used accounting policies in force in Portugal.
To guarantee the uniformity of the accounting policies,
whenever the local legislation is different from the laws
in force in Portugal, the proper adjustments are made.
f. IMPAIRMENT OF NON-CURRENT ASSETS (EXCEPT
GOODWILL)
Whenever an event or change in circumstances are
identified that would indicate that the amount by
which the asset is registered cannot be recovered, an
assessment of impairment is performed with reference
at the end of each period.
Whenever the amount by which the asset is registered
is higher than its recoverable amount, an impairment
YEARS
Buildings and other constructions 10 – 25
Machinery and other equipment 3 – 16
Transport equipment 3 – 8
Office equipment 3 – 12
Other property, plant and equipment 3 – 10
Report and Consolidated Accounts 2015

Notes to the Consolidated Financial Statements 31
loss is recognised, registered as an expense in the item
“Impairment of depreciable assets”. The recoverable
amount is the highest between the assets' net selling
price and the use value. The net selling price is the
amount that would have been achieved with the disposal
of the asset in a transaction between independent
and knowledgeable entities, net of the costs directly
attributable to the disposal. The use value is the present
value of estimated future cash flows expected to arise
from the continuing use of the asset and from its disposal
at the end of its useful life. Recoverable amounts are
estimated for individual assets or, if this is not possible,
for the cash-generating unit to which the asset belongs.
After the recognition of an impairment loss, the expense
with the amortisation/depreciation of an asset is
adjusted in future periods to allocate the asset's revised
carrying amount, less its residual value (if any), on a
systematic basis over its remaining useful life.
The reversal of impairment loss recognised in previous
periods is registered when it is concluded that the
recognised impairment losses no longer exist or have
decreased. This assessment is made whenever it is
believed that impairment losses previously recognised
have been reversed. The reversal of impairment losses
is recognised as income in the income statement.
However, the reversal of the impairment loss is
performed up to the limit of the amount that would be
recognised (net of amortisation or depreciation), if the
impairment loss had not been registered in previous
periods.
g. COSTS OF FINANCING OBTAINED
Costs related to financing are recognised as an expense
on an accrual basis, even in cases where these costs are
directly attributable to the acquisition, construction or
production of an asset whose period of time to get ready
for its intended use is substantial, in which case it could
be capitalised until the moment in which all the activities
necessary to prepare the asset eligible for its use or sale
are complete.
h. INVENTORIES
Merchandise and raw, subsidiary and consumable
materials are stated at acquisition cost or at market
price, whichever is lower (using the average cost as a
costing method). Market price means the net realisable
value or the replacement cost.
Finished or semi-finished products, by-products and
products and works in progress are valued at production
cost (which includes the cost of raw materials, labour and
manufacturing overheads) or at the market price in case
this is lower. Market price means the net realisable value.
In cases where the market price is lower than the
acquisition cost, impairment losses are recognised.
i. FINANCIAL INSTRUMENTS
i. Investments
The investments on other companies are registered at
the acquisition cost or, in the case of loans granted, at
the nominal value. An assessment of these investments is
made whenever there are indications that the asset may
be impaired, with the impairment losses that are shown
to exist being registered as costs. Income obtained from
financial investments (dividends or profit distributed)
are registered in the income statement for the period in
which distribution is decided and announced.
ii. Debtors
Debtors are registered at their nominal value and
presented at the balance sheet net of eventual
impairment losses, recognised in the item “Impairment
of doubtful debts (losses/reversals)”, in order to reflect
their net realisable value.
Impairment losses are registered in the sequence of
events occurred, which objectively and quantifiably
indicate that the total or part of the outstanding
amount will not be received. For that, the Group takes
into consideration market information showing that the
client is insolvent along with historical data of overdue
and not paid amounts.
Recognised impairment losses correspond to the
difference between the carrying amount and the
present value of the estimated cash flows, discounted
at the original effective interest rate, which is null
whenever payment is expected to occur within less
than one year.
iii. Financing
Financing is registered as liabilities at their nominal
value net of transaction costs directly related to the
issuance of those liabilities. Financial expenses are
calculated based on the effective interest rate and are
registered in the income statement for the period on an
accruals basis.
iv. Trade creditors
Trade creditors and other creditors are registered at
their nominal value, as they do not bear interests.
v. Financial liabilities and equity instruments
Financial liabilities and equity instruments are classified
based upon their contractual substance, regardless of
the legal form they assume.
An instrument is classified as a financial liability when
there is a contractual obligation for its settlement to
be effected through the delivery of cash or another
financial asset, regardless of its legal form. Financial
liabilities are recognised initially at fair value net of
transaction costs incurred, and subsequently at written
off cost, using the effective interest rate method.
An instrument is classified as a equity instrument when
there is no contractual obligation for its settlement to
be effected through the delivery of cash or another
financial asset, regardless of its legal form, which
evidence a residual interest in the assets of an entity
after deducting all of its liabilities.
The costs directly attributable to the issuance of equity
instruments are recognised in equity as a deduction to
Report and Consolidated Accounts 2015

32 Notes to the Consolidated Financial Statements
the amount issued. Amounts paid or received related to
purchases or sales of equity instruments are registered
in equity, net of transaction costs.
The distributions made of an equity instrument are
deducted to equity as dividends, when declared.
vi. Own shares
Own shares are accounted at the acquisition cost as
an allowance to equity. Gains or losses arising from
disposal of own shares are registered in the item “Other
reserves”, not affecting the profit/loss of the period.
vii. Discounted bills and accounts receivable in
factoring
The Group derecognises financial assets in its financial
statements, only when the contractual rights to the cash
flows inherent to those assets have already expired, or
when the Group substantially transfers all the risks and
benefits inherent to the ownership of those assets to a
third entity. If the Group substantially retains the risks
and benefits inherent to the ownership of those assets, it
continues to recognise them in its financial statements,
by registering in liabilities, in the item “Financing
obtained”, the monetary consideration for the assets
transferred.
Consequently, clients' balances represented by
discounted bills that have not yet reached their maturity
date and accounts receivable in factoring as at the
balance sheet date, with the exception of operations
of “Factoring without resource”, are recognised in the
financial statements, in liabilities, until they are collected.
viii. Cash and cash equivalents
The amounts included in the item “Cash and cash
equivalents” correspond to cash flow, bank deposits,
term deposits and other treasury applications, which
mature in less than three months and are subject to
insignificant risk of change in value.
j. PROVISIONS, CONTINGENT LIABILITIES AND
CONTINGENT ASSETS
Provisions are recognised only when the Group has a
present obligation (legal or constructive) as result of
a past event, it is probable that a outflow of resources
will be required to settle the obligation, and a reliable
estimate can be made of that obligation. Provisions are
reviewed at each balance sheet date and are adjusted
to reflect the best estimate at that date. Provisions for
restructuring costs are recognised whenever a formal
and detailed restructuring plan exists and that plan has
been communicated to the parties involved.
Contingent liabilities are defined by the Group as:
(i) possible obligations arising from past events and whose
existence will only be confirmed by the occurrence, or
not, of one or more uncertain future events not under full
control of the Group, or
(ii) present obligations arising from past events, but
which are not recognised because it is unlikely that an
outflow of resources embodying economic benefits will
be required to settle the obligation or the amount of the
obligation cannot be measured with sufficient reliability.
Contingent assets usually arise from unplanned or other
unexpected events that give rise to the possibility of an
inflow of economic benefits to the Group. The Group
does not recognise the contingent assets in its financial
statements, but it only proceeds to its disclosure if it
considers that the economic benefits, which may result
from there to the Group, are likely. When the realisation
of income is virtually certain, then the related asset is
not a contingent asset and its recognition is appropriate.
k. ECONOMIC PERIODS
Income and expenses are registered in the period to
which they relate, regardless of the corresponding
payment or receipt, on an accruals basis. Differences
between the amounts received or paid and the
corresponding income and expenses are registered in
the items “Other accounts payable and receivable” or
“Deferrals”.
l. INCOME TAXES
The taxation registered in profit/loss include the effects
of current taxes and deferred taxes. The current tax is
determined in accordance with the tax rules in force of
each company included on consolidation, considering
the taxable profit.
Deferred taxes refer to the temporary differences
between the amounts of the assets and liabilities for
the purposes of accounting records and the respective
amounts for the purposes of taxation, as well as
those arising from the tax benefits obtained and the
temporary differences between the tax and accounting
results. The tax is recognised in the income statement,
except when related with items which are moved in
equity, a fact which implies their recognition in equity.
Deferred tax assets and liabilities are calculated and
periodically evaluated using the taxation rates, which
are expected to be in force on the date of reversal of
temporary differences.
Deferred taxes refer to temporary differences between
the accounting values of the assets and liabilities
and their tax base, using the tax rates approved or
substantially approved, at the balance sheet date, in
each jurisdiction and which are expected to be applied
when the temporary differences are reversed.
Deferred tax liabilities are recognised for all taxable
temporary differences (except for goodwill not
deductible for tax purposes), differences arising on
initial recognition of assets and liabilities that affect
neither accounting nor taxable profit and differences
relating to investments in subsidiaries to the extent that
they will probably not reverse in the foreseeable future.
Deferred taxes assets are recognised to the extent
when it is probable that future taxable profits will be
available to absorb deductible temporary differences
for tax purposes.
Deferred tax assets are registered only when there are
reasonable expectations of sufficient taxable profits
Report and Consolidated Accounts 2015

Notes to the Consolidated Financial Statements 33
for them to be used. Every year, a revaluation of the
temporary differences underlying to the deferred tax
assets is made, with the purpose of recognising or
adjust them according to the present expectation of
their future recovery.
m. NON-CURRENT ASSETS HELD FOR SALE
Non-current assets are classified as held for sale if
the balance sheet value is realisable through a sales
transaction, rather than through its continuing use. This
situation is only verified when: (i) the sale is probable
and the assets are available for immediate sale in the
present conditions; (ii) the management is committed
with a sales plan; and, (iii) it is expectable the sale
occurs within twelve months.
Non-current assets classified as held for sale are
measured at the lower value between the carrying
amount and fair value net of expectable expenses with
its sale.
n. GOVERNMENT AND OTHER PUBLIC ENTITIES
SUBSIDIES
Subsidies for personnel training programmes or
exploration subsidies are registered in the item “Grants
received as compensation for expenses” of the income
statement for the period in which these programmes
are carried out, independently of when they are
received, unless it becomes receivable in a later period,
in which it will be income for the period when it was
received.
Non-reimbursable subsidies related to the assets are
registered in the balance sheet as “Other changes
in equity” and recognised in the income statement
proportionally to the reintegrations of the subsidised
assets, in each period.
o. RETIREMENT COMPLEMENTS
CONDURIL – Engenharia, S.A. has assumed the
commitment of attributing a number of pecuniary
benefits to its employees at complementary title of
retirement pensions for old age or disability. To cover
those responsibilities, CONDURIL – Engenharia, S.A.
created a defined benefit Pension Fund in 1989, exclusive
to its employees, whose annual charges, determined
according to actuarial calculations, are registered in
accordance with the NCRF 28 - “Employee benefits”.
The actuarial responsibilities are calculated according to
the “Projected Unit Credit Method”, by using the actuarial
and financial assumptions considered appropriate.
p. REVENUE
The Group recognises the income of works, contract
by contract, in accordance with the NCRF 19 –
“Construction contracts” under the percentage of
completion method, which is understood as the relation
between costs incurred in each work until a certain date
and the sum of those costs with the costs estimated
for the work completion. The differences between the
values resulting from the application of the level of
completion to the estimated income and the invoiced
values are included in the items “Other accounts
receivable” and “Deferrals”.
Variations in works in the amount of revenue agreed in
the contract are recognised in the income for the period
when it is highly possible that the client will approve the
amount of revenue arising from the variation, and that
this can be reliably measured.
Claims for reimbursement of costs not included in the
contract price are included in contract revenue when
negotiations are at an advanced stage and it is probable
that the client will accept the claim, and that it will be
reliably measurable.
To meet the costs incurred during the warranty period
of the works, every year the Group recognises liabilities
to fulfil this legal obligation, which is calculated taking
into account the annual production volume and the
costs incurred in the past with works in warranty period.
When it is probable that total costs foreseen in the
construction contract will exceed its defined income,
the expected loss shall be immediately recognised in
the income statement for the period.
Dividends are recognised as gains in the income statement
for the period in which its attribution is decided.
q. EXPENSES WITH THE PREPARATION OF
PROPOSALS
The expenses made with the preparation of proposals for
several tenders are recognised in the income statement
for the period in which they are incurred.
r. OWN WORK CAPITALISED
Own work capitalised corresponds to construction and
improvement works carried out by any company of
the Group, as well as the major repairs of equipment
and include expenses with materials, direct labour and
general expenses.
Those expenses are object of capitalisation only when
fulfilled the following requirements:
• The assets developed are identifiable;
• There is a strong probability of the assets generating
future economic benefits; and
• They can be reliably measured.
s. SUBSEQUENT EVENTS
Events that occur after the balance sheet date
that provide evidence or additional information on
conditions existing at the balance sheet date (“adjusting
events”), are reflected in the consolidated financial
statements. Events after the balance sheet date that
provide information on conditions arising after the
balance sheet date (“non-adjusting events”), when
material, are disclosed in the notes to the consolidated
financial statements.
t. JUDGEMENTS AND ESTIMATES
For the preparation of the financial statements, the
Board of Directors of each company included on
consolidation has been based on best knowledge of
past and/or present events, considering assumptions
related to future events.
Report and Consolidated Accounts 2015

34 Notes to the Consolidated Financial Statements
Report and Consolidated Accounts 2015
The most significant accounting estimates reflected in the consolidated financial statements for the periods ending
on 31 December 2015 and 2014 include:
• Useful lives of tangible assets;
• Record of provisions and impairment losses;
• Recognition of revenue in works in progress;
• Recognition of the present value of responsibilities with retirement benefits; and
• Calculation of fair value of the financial instruments.
The estimates were determined based on the best information available at the preparation date of the financial
statements. However, situations may occur in subsequent periods that, being not foreseeable at the date, have no
impact on the estimates. Changes to the estimates that may occur after the date of the financial statements, will be
corrected in the income, using a prospective method, in accordance with NCRF 4.
3.2. Other relevant accounting policies
a. EARNINGS PER SHARE
Basic earnings per share are calculated by dividing the net profit attributable to the shareholders of the Company
by the weighted average number of ordinary shares in circulation during the period, excluding the number of own
shares held.
b. FOREIGN CURRENCY
All assets and liabilities expressed in foreign currency have been converted into the functional presentation currency,
using the exchange rates in force at the reporting date. Exchange gains and losses resulting from differences
between the exchange rates in force on the date of the transactions and those in force on the dates of collection,
payments or the balance sheet date are recognised as gains or losses in the income statement for the period.
Exchange differences related to accounts receivable/payable whose maturity is not defined, are registered in the
income statement for the period when those accounts receivable/payable are depreciated/disposed/liquidated.
Financial statements of participated companies and branches expressed in foreign currency are translated to
euros.
The exchange rates used to convert to euros were as follows:
3.3. Judgements on the application process of the accounting policies and which had greater impact in the
amounts recognised in the financial statements
In preparation of the consolidated financial statements according with NCRF (equivalent to GAAP), the Board of
Directors of each company included on consolidation uses estimates and assumptions that affect the application of
the policies and amounts referred. Estimates and judgements are continually evaluated and are based on historical
experience and other factors, including expectations of future events that are believed to be reasonable under the
circumstances on which the estimate was based, or as a result of new information or more experience.
3.4. Main assumptions concerning the future
The attached consolidated financial statements have been prepared bearing in mind the continuation of the Group's
operations, from the accounting books and records of the Group, maintained in accordance with the accounting
principles generally accepted in Portugal.
CURRENCYTRANSACTION
CURRENCY
2015 2014
31 DECEMBER
EXCHANGE RATE
31 DECEMBER
EXCHANGE RATE
American Dollar Euro 0.91853 n/a 0.8237 n/a
Moroccan Dirham Euro 0.09277 0.09245 0.0912 0.0897
Botswana Pulas Euro 0.08140 0.08871 0.0865 0.0843
Mozambican Metical Euro 0.02041 0.02335 0.0260 0.0246
Cape Verdean Escudo Euro 0.00907 0.00907 0.0091 0.0091
CFA Franc Euro 0.00152 0.00152 0.0015 0.0015
Zambian Kwacha Euro 0.08366 0.10314 0.1289 0.1223
Malawi Kwacha Euro 0.00138 0.00178 0.0017 0.0018
Angolan Kwanza Euro 0.00666 0.00738 0.0079 0.0076
South African Rand Euro 0.05880 n/a n/a n/a
Namibian Dollar Euro 0.05901 n/a n/a n/a

Notes to the Consolidated Financial Statements 35
Report and Consolidated Accounts 2015
Events that occur after the balance sheet date that affect the value of the existing assets and liabilities at the balance
sheet date are considered when preparing the financial statements for the period. Those events are disclosed in the
notes to the consolidated financial statements, if material.
3.5. Major sources of uncertainty
The present note makes reference to the major assumptions for the future adopted in the preparation of the attached
financial statements, which may involve a significant risk of material adjustments to the valuation of assets and liabilities
in the following financial period.
a. IMPAIRMENT OF ASSETS
The determination of the impairment of assets requires an estimate of the present value of the future cash flows
associated to those assets. In this calculation, the assumptions are adopted based on the historical experience of each
company included on consolidation, as well as on future expectations. The Group considers that there is a controlled
risk of these assumptions not taking place.
4. CASH FLOWS
4.1. Management's comment about the amount of significant balances of cash and cash equivalents, which are
not available for use
The balance amount of “Cash and cash equivalents” is fully available.
4.2. Breakdown of the amounts registered in “Cash and bank deposits”
The cash and bank deposits balance is the following:
31.12.2015 31.12.2014
Cash 103,587 74,148
Demand deposits 22,264,994 14,450,258
Term deposits 8,047,484 20,293,714
TOTAL CASH AND BANK DEPOSITS 30,416,066 34,818,120

36 Notes to the Consolidated Financial Statements
COUNTRY DIRECT % TOTAL %
BRANCHES:
Angola - - -
Mozambique - - -
Morocco - - -
Botswana - - -
Cape Verde - - -
Senegal - - -
Zambia - - -
Malawi - - -
Gabon - - -
SUBSIDIARIES:
Conduril – Gestão de Concessões de Infraestruturas, S.A. Portugal 100.00 100.00
Edirio – Construções, S.A. Portugal 100.00 100.00
Métis Engenharia, Lda. Angola 99.00 99.00
ENOP – Engenharia e Obras Públicas, Lda. Mozambique 85.47 85.47
Mabalane – Inertes, Lda. Mozambique 85.00 97.82
4M Properties, S.A. Mozambique 98.00 98.00
Urano, Lda. Angola 99.00 99.00
Conduril Engenharia – Açores, S.A. Portugal 100.00 100.00
JOINTLY CONTROLLED ENTITIES:
Edifer / RRC / Conduril, ACE Portugal 33.33 33.33
Groupement Adriano, Jaime Ribeiro, Conduril – Construção, ACE Morocco 33.33 33.33
Groupement CJA / Lot 3 – Construção ACE Morocco 33.33 33.33
Groupement Túnel de Nador, Construção ACE Morocco 50.00 50.00
Edifer, Dragados, Tecnovia, Conduril – Rodovias do Algarve Litoral, ACE Portugal 17.86 17.86
Edifer, Dragados, Tecnovia, Conduril – Rodovias do Baixo Alentejo, ACE Portugal 17.86 17.86
UTE Alcántara – Garrovillas Spain 15.00 15.00
OTHER PARTICIPATIONS:
Rotas do Algarve Litoral, S.A. Portugal 11.00 13.00
SPER – Sociedade Portuguesa para a Construção e Exploração Rodoviária, S.A. Portugal 11.26 11.26
Planestrada – Operação e Manutenção Rodoviária, S.A. Portugal 10.00 10.00
Marestrada – Operação e Manutenção Rodoviária, S.A. Portugal 10.00 10.00
KEY MANAGEMENT PERSONNEL:
Board of Directors:
António Luís Amorim Martins (President) - Chairman
Maria Benedita Andrade de Amorim Martins (President of the Executive Committee) – CEO
Maria Luísa Andrade Amorim Martins Mendes (Vice-President of the Executive Committee)
Álvaro Duarte Neves Vaz
António Baraças Andrade Miragaia
António Emanuel Lemos Catarino
Carlos António Soares de Noronha Dias
Ricardo Nuno Araújo Abreu Vaz Guimarães
OTHER RELATED PARTIES:
Geonorte – Geotecnia e Fundações Especiais, Lda. Portugal - -
Sociedade Agrícola da Quinta do Javali, Lda. Portugal - -
5. RELATED PARTIES5.1. Remunerations of the key management personnel
a. Total remunerations: 1,324,083 euros (2014: 1,201,588 euros).
5.2. Transactions between related parties
a. Nature of the related party relationship:
Report and Consolidated Accounts 2015

Notes to the Consolidated Financial Statements 37
b. Transactions and outstanding balances:
In the course of the present period, the Group presented the following transactions and balances in what concerns the
related entities:
As at 31 December 2015:
RELATED PARTIESOUTSTANDING
BALANCES ASSETS
OUTSTANDING BALANCES LIABILITIES
PROVISIONS
ENTITIES WITH JOINT CONTROL OR SIGNIFICANT INFLUENCE:
Groupement CJA / Lot 3 – Construção ACE 808,096 - -
808,096 - -
OTHER PARTICIPATIONS:
Rotas do Algarve Litoral, S.A. 11,396,123 - -
SPER – Soc. Portuguesa para a Construção e Exploração Rodoviária, S.A. 17,408,514 - -
28,804,637 - -
OTHER RELATED PARTIES:
Geonorte – Geotecnia e Fundações Especiais, Lda. 973,938 53,122 -
973,938 53,122 -
RELATED PARTIES RECOGNISED EXPENSES
OTHER RELATED PARTIES:
Geonorte – Geotecnia e Fundações Especiais, Lda. 22,383 105,937
Geonorte – Geotecnia e Fundações Especiais, Lda. – Sucursal Angola 271,388 32,461
293,770 138,398
As at 31 December 2014:
RELATED PARTIESOUTSTANDING
BALANCESASSETS
OUTSTANDING BALANCES LIABILITIES
PROVISIONS
ENTITIES WITH JOINT CONTROL OR SIGNIFICANT INFLUENCE:
Groupement CJA / Lot 3 - Construção ACE 811,429 - -
811,429 - -
OTHER PARTICIPATIONS:
Rotas do Algarve Litoral, S.A. 7,501,936 - -
SPER – Soc. Portuguesa para a Construção e Exploração Rodoviária, S.A. 6,181,775 - -
13,683,711 - -
OTHER RELATED PARTIES:
Geonorte – Geotecnia e Fundações Especiais, Lda. 477,385 221,892 -
477,385 221,892 -
RELATED PARTIES RECOGNISED EXPENSES
OTHER RELATED PARTIES:
Geonorte – Geotecnia e Fundações Especiais, Lda. 475,032 1,545,014
475,032 1,545,014
6. INTANGIBLE ASSETS6.1. Disclosure for each class of intangible assets, distinguishing between internally generated intangible
assets and other intangible assets
a. Depreciations for the period are calculated taking into account the following average useful lives and amortisation
rate:
INTANGIBLE ASSETS – OTHERS USEFUL LIFE AMORTISATION RATE
Computer programmes 3 33.33%
Development rights 60 1.66%
Other intangible assets 3 33.33%
Report and Consolidated Accounts 2015

38 Notes to the Consolidated Financial Statements
b. Elements of intangible assets are depreciated by straight-line method, based on the amortisation rates in
accordance with the Implementing Decree (Decreto Regulamentar) no. 25/2009, of 14 September.
c. The intangible assets are the following:
INTANGIBLE ASSETS – OTHERS
31.12.2015 31.12.2014
GROSS ASSETSAMORTISATIONS AND IMPAIRMENT LOSSES
GROSS ASSETSAMORTISATIONS AND IMPAIRMENT LOSSES
Computer programmes 96,357 68,728 85,741 58,322
Industrial property 48,446 1,325 47,827 706
Development rights 2,368,775 517,603 - -
Other intangible assets 2,007 1,727 2,007 1,727
TOTAL 2,515,585 589,383 135,575 60,755
d. The value of amortisations related to intangible assets included in the item “Depreciation and amortisation
expenses/reversals” of the income statement is the following:
AMORTISATIONS FOR THE PERIOD – OTHERS 31.12.2015 31.12.2014
Computer programmes 9,136 6,961
Industrial property 64 -
Development rights 39,518 -
Other intangible assets - 178
TOTAL 48,718 7,139
e. The movements in the item “Intangible assets” during 2015 and 2014 are the following:
2015
GOODWILLDEVELOPMENT
RIGHTSSOFTWARE
INDUSTRIALPROPERTY
OTHER INTANGIBLE
ASSETSTOTAL
GROSS ASSETS:
Balance as at 31.12.2014 - - 85,742 47,827 2,007 135,576
Change of % held - - 1,197 555 - 1,752
Additions - - 9,382 64 - 9,446
Transfers and write-offs - 2,368,775 - - - 2,368,775
Balance as at 31.12.2015 - 2,368,775 96,321 48,446 2,007 2,515,549
ACCUMULATED AMORTISATION:
Balance as at 31.12.2014 - - 58,322 706 1,728 60,756
Change of % held - - 1,234 555 - 1,789
Additions - 39,518 9,136 64 - 48,718
Transfers and write-offs - 478,084 - - - 478,084
Balance as at 31.12.2015 - 517,602 68,692 1,325 1,728 589,347
NET VALUE - 1,851,173 27,629 47,121 279 1,926,202
2014
GOODWILLDEVELOPMENT
PROJECTSSOFTWARE
INDUSTRIALPROPERTY
OTHER INTANGIBLE
ASSETSTOTAL
GROSS ASSETS:
Balance as at 31.12.2013 - - 59,711 47,827 2,007 109,545
Additions - - 28,593 - - 28,593
Transfers and write-offs - - (2,562) - - (2,562)
Balance as at 31.12.2014 - - 85,742 47,827 2,007 135,576
ACCUMULATED AMORTISATION:
Balance as at 31.12.2013 - - 53,699 706 1,550 55,955
Additions - - 6,961 - 178 7,139
Transfers and write-offs - - (2,338) - - (2,338)
Balance as at 31.12.2014 - - 58,322 706 1,728 60,756
NET VALUE - - 27,420 47,121 279 74,820
Report and Consolidated Accounts 2015

Notes to the Consolidated Financial Statements 39
7. TANGIBLE ASSETS7.1. Disclosure on property, plant and equipment
a. Measurement bases:
Tangible assets are valued according to the cost model, to which an item of property, plant and equipment shall be
carried at its cost less any accumulated depreciation and any accumulated impairment losses.
b. Depreciation method used:
The Group amortises its property, plant and equipment goods according to the straight-line method. In accordance
to this method, depreciation is constant during the useful life of the assets if its residual value does not change.
c. Useful lives and depreciation rates used:
Depreciations for the period are calculated taking into account the following average useful lives and amortisation rate:
TANGIBLE ASSETS USEFUL LIFE AMORTISATION RATE
Land and natural resources - -
Buildings and other constructions 10 – 25 4% – 10%
Machinery and other equipment 3 – 16 6.25% – 33.33%
Transport equipment 3 – 8 12.50% – 33.33%
Office equipment 3 – 12 8.33% – 33.33%
Other property, plant and equipment 3 – 10 10% – 33.33%
2015
LAND AND NATURAL
RESOURCES
BUILDINGS AND OTHER
CONSTRUCTIONS
MACHINERY AND OTHER EQUIPMENT
TRANSPORT EQUIPMENT
OFFICE EQUIPMENT
OTHER PROPERTY, PLANT AND EQUIPMENT
INVESTMENTS IN PROGRESS
TOTAL
GROSS ASSETS:
Balance as at 31.12.2014 8,859,001 29,825,130 74,987,102 31,447,577 2,216,172 1,387,625 3,402,362 152,124,969
Change of % held - 4,408 4,049 - 7,202 1,464 - 17,123
Additions - 243,918 5,030,565 2,907,959 116,480 657,107 13,117,593 22,073,622
Disposals - - (734,413) (729,267) (29,326) (7,543) - (1,500,549)
Other variations (24,185) (1,160,722) (1,423,252) (276,637) (70,816) (27,260) (19,841) (3,002,713)
Transfers and write-offs (2,368,776) - 4,041,004 (3,145,089) (3,784) - (4,109,566) (5,586,211)
Balance as at 31.12.2015 6,466,040 28,912,734 81,905,055 30,204,543 2,235,928 2,011,393 12,390,548 164,126,241
ACCUMULATED DEPRECIATION:
Balance as at 31.12.2014 - 16,636,311 57,894,892 19,898,121 1,654,485 402,405 - 96,486,214
Change of % held - 2,261 2,608 - 6,386 1,166 - 12,421
Additions - 1,199,175 6,025,384 3,808,555 136,457 305,887 - 11,475,458
Disposals - - (225,877) (577,763) (7,478) (1,320) - (812,438)
Other variations - (453,544) (1,284,796) (279,656) (52,141) (23,181) - (2,093,319)
Transfers and write-offs - 2,186 153,751 (1,666,012) - - - (1,510,075)
Balance as at 31.12.2015 - 17,386,389 62,565,962 21,183,245 1,737,709 684,956 - 103,558,261
NET VALUE 6,466,040 11,526,345 19,339,093 9,021,298 498,219 1,326,437 12,390,548 60,567,980
d. / e. Reconciliation of the carrying amount at the beginning and end of the period
2014
LAND AND NATURAL
RESOURCES
BUILDINGS AND OTHER
CONSTRUCTIONS
MACHINERY AND OTHER EQUIPMENT
TRANSPORT EQUIPMENT
OFFICE EQUIPMENT
OTHER PROPERTY, PLANT AND EQUIPMENT
INVESTMENTS IN PROGRESS
TOTAL
GROSS ASSETS:
Balance as at 31.12.2013 8,849,851 27,347,639 62,753,899 25,285,111 1,975,642 550,521 5,188,237 131,950,900
Additions 304,746 1,584,220 4,777,538 6,877,699 331,660 858,852 6,910,277 21,644,992
Disposals (306,820) - (873,171) (521,544) (1,174) (26,565) - (1,729,274)
Other variations 11,224 378,776 501,661 91,648 19,603 7,271 9,803 1,019,986
Transfers and write-offs - 514,495 7,827,175 (285,337) (109,559) (2,454) (8,705,955) (761,635)
Balance as at 31.12.2014 8,859,001 29,825,130 74,987,102 31,447,577 2,216,172 1,387,625 3,402,362 152,124,969
ACCUMULATED DEPRECIATION:
Balance as at 31.12.2013 - 15,611,768 52,145,453 16,737,485 1,501,583 216,765 - 86,213,054
Additions - 1,063,938 4,897,457 3,652,012 130,323 99,254 - 9,842,984
Disposals - - (599,450) (223,667) (1,174) (4,507) - (828,798)
Other variations - 170,838 486,020 88,516 15,501 6,610 - 767,485
Transfers and write-offs - (210,233) 965,412 (356,225) 8,252 84,283 - 491,490
Balance as at 31.12.2014 - 16,636,311 57,894,892 19,898,121 1,654,485 402,405 - 96,486,214
NET VALUE 8,859,001 13,188,819 17,092,210 11,549,456 561,687 985,220 3,402,362 55,638,755
Report and Consolidated Accounts 2015

40 Notes to the Consolidated Financial Statements
TANGIBLE ASSETSEXPENDITURES RECOGNISEDDURING CONSTRUCTION 2015
EXPENDITURES RECOGNISEDDURING CONSTRUCTION 2014
Land and natural resources - -
Buildings and other constructions 3,388,061 630,117
Machinery and other equipment 9,729,532 6,280,160
Transport equipment - -
Other property, plant and equipment - -
TOTAL 13,117,593 6,910,277
7.2. Amount of expenditures recognised in the carrying amount of fixed assets during its construction
7.3. Depreciation recognised in the profit/loss or as part of other assets costs during the period
TANGIBLE ASSETSDEPRECIATION RECOGNISED
IN PROFIT/LOSSDEPRECIATION RECOGNISED AS PART OF OTHER ASSETS COSTS
TOTAL
Land and natural resources - - -
Buildings and other constructions 1,199,175 - 1,199,175
Machinery and other equipment 6,025,384 - 6,025,384
Transport equipment 3,808,555 - 3,808,555
Office equipment 136,457 - 136,457
Other property, plant and equipment 305,887 - 305,887
TOTAL 11,475,458 - 11,475,458
7.4. Accumulated depreciation at the end of the period
ACCUMULATEDDEPRECIATION
31.12.2015 31.12.2014
Land and natural resources - -
Buildings and other constructions 17,386,389 16,636,311
Machinery and other equipment 62,565,962 57,894,892
Transport equipment 21,183,245 19,898,121
Office equipment 1,737,709 1,654,485
Other property, plant and equipment 684,956 402,405
TOTAL 103,558,261 96,486,214
7.5. Items of fixed assets in progress
The most significant values included in the item
“Investments in progress”, as at 31 December 2015 and
31 December 2014, refer to the following projects:
31.12.2015 31.12.2014
Buildings and other constructions 5,296,759 1,562,568
Equipment 7,005,880 1,839,794
Other assets 87,909 -
TOTAL 12,390,548 3,402,362
8. LEASES8.1. Finance leases - Lessees:
a. Net carrying amount for each asset category at 31 December 2015 and 31 December 2014:
31.12.2015 31.12.2014
Machinery and other equipment 2,098,493 3,779,093
Transport equipment 1,537,071 1,400,087
TOTAL 3,635,564 5,179,179
b. Reconciliation between the total of the future lease minimum payments at 31 December 2015 and 31 December
2014 and its present value:
31.12.2015 31.12.2014
Minimum payments up to 1 year 1,193,861 2,601,724
Minimum payments for more than 1 year and no more than 5 years 76,058 1,270,274
Minimum payments for more than 5 years - -
TOTAL MINIMUM PAYMENTS 1,269,919 3,871,997
Future interest payments 53,826 434,545
PRESENT VALUE OF RESPONSIBILITIES 1,216,093 3,437,452
Report and Consolidated Accounts 2015

Notes to the Consolidated Financial Statements 41
c. Total of the future lease minimum payments at the balance sheet date and its present value:
MINIMUM PAYMENTS PRESENT VALUE
31.12.2015 31.12.2014 31.12.2015 31.12.2014
No more than 1 year 1,193,861 2,601,724 1,140,973 2,235,581
More than 1 year and no more than 5 years 76,058 1,270,274 75,120 1,201,871
More than 5 years - - - -
TOTAL 1,269,919 3,871,997 1,216,093 3,437,452
9. INTERESTS IN JOINT VENTURES AND INVESTMENTS IN SUBSIDIARIES9.1. Joint ventures
a. List and description of the interests in significant joint ventures:
DESCRIPTION TYPE OF PROJECT OTHER PARTICIPANTS
Edifer / RRC / Conduril, ACE Jointly controlled entity Edifer and RRC
Groupement Adriano, Jaime Ribeiro, Conduril – Construção, ACE Jointly controlled entity MonteAdriano and Jaime Ribeiro e Filhos
Groupement CJA / Lot 3 – Construção ACE Jointly controlled entity MonteAdriano and Jaime Ribeiro e Filhos
Groupement Túnel de Nador, Construção ACE Jointly controlled entity Jaime Ribeiro e Filhos
Rodovias do Algarve Litoral, ACE Jointly controlled entity Edifer, Dragados and Tecnovia
Rodovias do Baixo Alentejo, ACE Jointly controlled entity Edifer, Dragados and Tecnovia
b. Proportion of ownership interest held and data about the entities:
COMPANY PROPORTION OF THE INTEREST HELD CONSOLIDATION METHOD
Edifer / RRC / Conduril, ACE 33.33% Proportionate method
Groupement Adriano, Jaime Ribeiro, Conduril Construção – ACE 33.33% Proportionate method
Groupement CJA / Lot 3 – Construção ACE 33.33% Cost
Groupement Túnel de Nador, Construção ACE 50% Proportionate method
Rodovias do Algarve Litoral, ACE 10% Proportionate method
Rodovias do Baixo Alentejo, ACE 10% Proportionate method
At the preparation date of the financial statements, the financial statements of the group Groupement CJA / Lot
3 – Construção ACE were not available.
c. Method used in the recognition of interests in joint ventures:
The interests in jointly controlled companies were recognised in the consolidated financial statements by the
proportionate consolidation method, from the date in which the control is shared until the date it effectively ends.
According to this method, the assets, liabilities, losses and gains of these companies have been included in the
consolidated financial statements, on a line-by-line basis, in proportion to the Group's participation in the companies.
9.2. Subsidiaries
a. List and description of the subsidiaries:
DESCRIPTION CONSOLIDATION METHOD
Conduril – Gestão de Concessões de Infraestruturas, S.A. Full consolidation
Edirio – Construções, S.A. Full consolidation
Métis Engenharia, Lda. Full consolidation
ENOP – Engenharia e Obras Públicas, Lda. Full consolidation
Mabalane – Inertes, Lda. Full consolidation
4M Properties, S.A. Full consolidation
Urano, Lda. Full consolidation
Conduril Engenharia – Açores, S.A. Full consolidation
Report and Consolidated Accounts 2015

42 Notes to the Consolidated Financial Statements
9.3. Details of other financial investments
OTHER PARTICIPATIONS REGISTERED AT THE COST 31.12.2015 31.12.2014
Rotas do Algarve Litoral, S.A. 130,000 130,000
SPER, S.A. 149,500 149,500
Planestrada - Op. Manut. Rod., S.A. 5,000 5,000
Marestrada - Op. Man. Rod., S.A. 5,000 5,000
Norgarante 10,000 10,000
BAI - Banco Africano Investimento 341,375 341,375
Lusitânia Seguros 76,815 76,815
SDMH - Soc. Desenvolvimento Mini-Hídricas 1,400 1,400
Other 6,731 7,990
TOTAL 725,821 727,080
Related to these participations, in the item “Other financial assets” are registered the following amounts concerned
to financing granted:
COMPANYLOANS GRANTED
2015 2014
UTE Alcántara-Garrovillas - -
SPER, S.A. 20,332,371 6,181,775
Rotas do Algarve Litoral, S.A. 13,473,348 7,501,935
SDMH - Soc. Desenvolvimento Mini-Hídricas 23,800 23,800
TOTAL 33,829,519 13,707,510
10. INVENTORIES10.1. Accounting policies adopted in the measurement of inventories and cost formula used
Inventories are valued by cost or net realisable value, if this is lower. Cost includes purchase costs, conversion expenses
and other expenses incurred in bringing the inventories to their present condition. The purchase costs comprise the
purchase price, import duties and other taxes, transport expenses, handling, trade discounts, rebates and other similar
items. The conversion costs include expenses directly related to units of production, such as direct labour. They also
include a systematic allocation of fixed and variable production overheads that are incurred in finished goods. The
allocation of fixed production overheads is based on the normal capacity of the production facilities.
The Group values its inventories by the weighted average cost formula, which assumes that the cost of each item is
determined from the weighted average of the cost of similar items at the beginning of a period and the cost of similar
items purchased or produced during the period.
10.2. Total carrying amount of inventories and carrying amount in appropriate classifications
The carrying amount of inventories is the following:
INVENTORIES 31.12.2015 31.12.2014
Raw, subsidiary and consumable materials 12,935,571 14,258,430
Goods 13,642 90,806
Finished and semi-finished products 650,224 513,310
Products and work in progress 439,883 439,883
14,039,320 15,302,429
Impairment losses (1,372,753) (1,537,150)
TOTAL 12,666,567 13,765,279
10.3. Amount of inventories recognised as an expense during the period
The amount of inventories recognised as an expense during the period was the following:
Report and Consolidated Accounts 2015

Notes to the Consolidated Financial Statements 43
GOODSRAW, SUBSIDIARY AND
CONSUMABLE MATERIALS
31.12.2015 31.12.2014 31.12.2015 31.12.2014
Initial inventory 90,806 110,507 12,721,280 10,838,307
Impairment losses in stocks - - 164,397 428,395
Purchases - - 48,838,473 51,520,313
Inventories adjustments and reclassification (77,164) (19,701) (1,116,956) 648,861
Ending inventory (13,642) (90,806) (11,834,423) (12,721,280)
EXPENSES IN THE PERIOD - - 48,772,771 50,714,596
FINISHED AND SEMI-FINISHED PRODUCTS PRODUCTS AND WORK IN PROGRESS
31.12.2015 31.12.2014 31.12.2015 31.12.2014
Initial inventory (513,310) (718,886) (439,883) (589,207)
Inventories adjustments and reclassification (26,734) (157,331) - 149,324
Accumulated impairment losses - - - -
Ending inventory 676,249 513,310 439,883 439,883
VARIATION OF INVENTORIES IN PRODUCTION 136,205 (362,907) - -
10.4. Amount of impairment losses in inventories recognised in the result of the period
The value of impairment losses recognised in the result of the period was the following:
IMPAIRMENT LOSSES IN INVENTORIES 31.12.2015 31.12.2014
Goods - -
Raw, subsidiary and consumable materials (87,606) (10,243)
Finished and semi-finished products - -
Products and work in progress - -
TOTAL (87,606) (10,243)
10.5. Movement during the period of impairment losses in inventories
RAW, SUBSIDIARY AND CONSUMABLE MATERIALS
Accumulated impairment losses on 31.12.2014 1,537,150
Increases 87,606
Reversal (49,051)
Utilisations -
Exchange variations (202,952)
ACCUMULATED IMPAIRMENT LOSSES ON 31.12.2015 1,372,753
REVERSAL OF IMPAIRMENT IN INVENTORIES 31.12.2015 31.12.2014
Goods - -
Raw, subsidiary and consumable materials 49,051 554,224
Finished and semi-finished products - -
Products and work in progress - -
TOTAL 49,051 554,224
IMPACT IN THE PERIOD (38,555) 543,981
RAW, SUBSIDIARY AND CONSUMABLE MATERIALS
Accumulated impairment losses on 31.12.2013 1,965,545
Increases 10,243
Reversal (554,223)
Utilisations (309)
Exchange variations 115,894
ACCUMULATED IMPAIRMENT LOSSES ON 31.12.2014 1,537,150
Report and Consolidated Accounts 2015

44 Notes to the Consolidated Financial Statements
11. CONSTRUCTION CONTRACTS11.1. Amount of contract revenue recognised as revenue in the period
The revenue of each construction contract includes the initial amount of revenue agreed, as well as variations in works,
claims and incentive payments to the extent that it is probable that will result in revenue and are capable of being
reliably measured. As at 31 December 2015 and 2014, the amount of revenue recognised as revenue in the period was
the following:
WORK/CONTRACT REVENUE IN THE PERIOD 2015 REVENUE IN THE PERIOD 2014
Construction contracts 194,185,618 203,656,151
TOTAL 194,185,618 203,656,151
11.2. Methods used to determine the contract revenue recognised in the period
The recognition of revenue in the period is made according to the percentage of completion method. Under this
method, revenue is matched with the contract costs incurred when reaching the stage of completion. Contract
revenue is recognised as revenue in the income statement in the accounting periods in which the work is performed.
In the cases the outcome of the contracts cannot be estimated reliably, revenue shall be recognised only to the
extent of contract costs incurred that it is probable will be recoverable.
11.3. Methods used to determine the stage of completion of ongoing contracts
In order to determine the stage of completion of a contract, it is used the method that most reliably measures the
work performed. Depending on the nature of the contract, the method used to determine the stage of completion
can vary as follows:
• The proportion that contract costs incurred for work performed to date bear to the estimated total contract
costs;
• Survey of the work performed;
• Completion of a physical proportion of the work performed.
11.4. Information related to the ongoing construction contracts
2015 EXPENSES INCURRED RECOGNISED INCOMEADVANCESRECEIVED
RETENTION
Ongoing contracts 478,256,207 582,159,677 17,529,042 6,180,367
TOTAL 478,256,207 582,159,677 17,529,042 6,180,367
2014 EXPENSES INCURRED RECOGNISED INCOMEADVANCESRECEIVED
RETENTION
Ongoing contracts 462,566,446 622,496,450 22,472,890 7,257,816
TOTAL 462,566,446 622,496,450 22,472,890 7,257,816
12. REVENUE12.1. Accounting policies adopted for the recognition of revenue, including the methods adopted to
determine the stage of completion of transactions involving the provision of services
The Group recognises revenue according to the following criteria:
a. Sales – are recognised in the income statement when the risks and benefits inherent to the ownership have been
transferred to the buyer, when there is not a continued management involvement to a degree usually associated
with ownership, when the amount of revenue can be reasonably measured, when it is probable that the economic
benefits associated with the transaction will flow to the entity, and when the expenses incurred or to be incurred
with the transaction can be reliably measured.
b. Provision of services – are recognised in the income statement with reference to the stage of completion of the
provision of services at the balance sheet date.
c. Interest – is recognised using the effective interest method.
Report and Consolidated Accounts 2015

Notes to the Consolidated Financial Statements 45
d. Dividends – are recognised from the moment in which is established the shareholder's right of receiving the
payment.
12.2. Amount of each significant category of revenue recognised during the period, including the revenue
from:
31.12.2015 31.12.2014
Sales of goods 2,293,347 5,670,202
Provision of services 193,879,312 203,145,200
Interest 5,111,917 3,925,251
Royalties - 4,372
Dividends 60,340 56,705
TOTAL 201,344,916 212,801,730
13. PROVISIONS, CONTINGENT LIABILITIES AND CONTINGENT ASSETS13.1. Provisions
The Group recognises a provision when, cumulatively, there is a present obligation as a result of a past event; it is
likely that an outflow of resources embodying economic benefits will be required to settle the obligation; and a
reliable estimate can be made of the amount of the obligation.
During the period ending on 31 December 2015, the movements relating to provisions occurred were the following:
PROVISIONSOPENING BALANCE
INCREASES RECLASSIFICATIONEXCHANGE VARIATION
REVERSALCLOSING BALANCE
Guarantees to clients 1,159,296 667,040 70,550 - (42,574) 1,854,312
Ongoing court proceedings 166,650 - - - - 166,650
Other provisions 7,582,892 843,443 (777,603) (35,850) (7,088,338) 524,544
TOTAL 8,908,838 1,510,483 (707,053) (35,850) (7,130,912) 2,545,506
14. THE EFFECTS OF CHANGES IN FOREIGN EXCHANGE RATES14.1. Exchange differences recognised in profit/loss
31.12.2015 31.12.2014
EXCHANGE LOSSES
Other expenses 21,478,020 11,968,879
TOTAL 21,478,020 11,968,879
EXCHANGE GAINS
Other income 28,872,511 28,173,611
TOTAL 28,872,511 28,173,611
PROVISIONSOPENING BALANCE
INCREASES RECLASSIFICATIONEXCHANGE VARIATION
REVERSALCLOSING BALANCE
Guarantees to clients 1,093,835 264,465 (19,786) - (179,217) 1,159,296
Ongoing court proceedings 166,650 - - - - 166,650
Other provisions 2,196,652 6,020,095 913,958 17,951 (1,565,764) 7,582,892
TOTAL 3,457,137 6,284,560 894,171 17,951 (1,744,981) 8,908,838
During the period ending on 31 December 2014, the movements relating to provisions occurred were the following:
Report and Consolidated Accounts 2015

46 Notes to the Consolidated Financial Statements
15. EVENTS AFTER THE BALANCE SHEET DATE15.1. Disclosure updating about the conditions at the balance sheet date
Between the balance sheet date and the issuance of the consolidated financial statements, no information on
the conditions that existed at the balance sheet date were received, so no adjustments in amounts recognised
in the present financial statements were made.
These consolidated financial statements were approved by the Board of Directors, in the meeting of 18 February
2016. The Board of Directors believes that these financial statements are a true and proper representation of
the operations of the companies belonging to the Group, as well as their financial position and performance
and cash flows.
16. ENVIRONMENTAL ISSUES16.1. Description of the measurement bases adopted, as well as the methods used in the calculation of value
adjustments
From its activity, the Group has a legal or contractual responsibility to prevent, reduce or repair environmental
damage. To fulfil this obligation, the Group incurred in expenses that amounted to 36,000 euros (in 2014, they
amounted to 52,000 euros) for the period ended on 31 December 2015.
To measure the environmental expenses incurred, the Group recognises the expenses effectively made in the
period.
16.2. Environmental expenses allocated to profit/loss
All environmental expenses should be considered in profit/loss if they were expenses incurred in that period, i.e.,
if they do not aim to prevent future damage or provide future benefits.
Therefore, environmental expenses allocated to profit/loss refer to past or present activities, or restoration of
environmental conditions in the state in which they were before contamination.
AMOUNT ALLOCATED TO PROFIT/LOSS
Waste treatment 36,000
Wastewater treatment -
TOTAL 36,000
14.2. Net exchange differences classified in a separate component of equity
EXCHANGE DIFFERENCES IN EQUITY
Balance as at 31.12.2014 1,930,826
Increases 632,625
Adjustments (20,074)
Write-offs (4,949,797)
BALANCE AS AT 31.12.2015 (2,406,420)
EXCHANGE DIFFERENCES IN EQUITY
Balance as at 31.12.2013 822,236
Increases 1,389,304
Write-offs (280,714)
BALANCE AS AT 31.12.2014 1,930,826
Report and Consolidated Accounts 2015

Notes to the Consolidated Financial Statements 47
17. INCOME TAXES17.1. Main components of tax expense and income
31.12.2015 31.12.2014
CURRENT TAX AND ADJUSTMENTS:
Current tax for the period 3,724,569 15,853,512
3,724,569 15,853,512
DEFERRED TAXES:
Deferred taxes related to temporary differences (71,914) 170,512
(71,914) 170,512
INCOME TAXES EXPENSE 3,652,655 16,024,024
Current tax and deferred tax shall be charged or credited directly to equity if the tax relates to items that are
credited or charged, in the same or a different period, directly to equity.
During the period ended on 31 December 2015 and 31 December 2014, no debits/credits were made directly to
equity related to the deferred taxes.
17.2. Relation between tax expense/income and accounting profit
RECONCILIATION OF THE EFFECTIVE TAX RATE 31.12.2015 31.12.2014
Income before taxation 9,808,041 45,531,165
Income taxes expense 3,652,655 16,024,024
Effective tax rate 37.24% 35.19%
Nominal tax rate (21% in Portugal and 30% in Angola, in 2015, 23% in Portugal and 30%in Angola, in 2014)
3,346,684 10,472,168
ADJUSTMENTS:
Differentiated rates of taxation 207,739 612,356
Expenses not accepted as tax cost 409,106 102,171
Provisions not accepted as expense 370,077 1,278,834
Reversal of untaxed provisions (1,242,748) -
Tax refund (1,686,555) -
Other untaxed income (79,731) -
Tax losses for the period 1,959,224 123,751
Autonomous taxation 487,604 556,989
Derrama (municipal tax) - 2,845,796
Deferred taxes from previous financial years (71,914) 170,512
Others (46,831) (138,553)
305,971 5,551,856
INCOME TAXES EXPENSE 3,652,655 16,024,024
The amount related to “Differentiated rates of taxation” results, essentially, from the Gabon branch (2015) and the
Angola branch (2014) being subject to taxation at a rate of 30%.
With reference to the period ending on 31 December 2015, in accordance with article 54-A of the Portuguese IRC
Code, the Company opted for the non-inclusion of the taxable profit allocated to the Angola branch.
17.3. Deferred taxes
As at 31 December 2015, deferred tax assets and liabilities are the following:
DEFERRED TAX ASSETSOPENING BALANCE
OTHER VARIATIONS INCREASES REVERSALCLOSING BALANCE
Warranty of works 20,197 14,907 13,385 - 48,489
Application of percentage of completion 80,238 63,957 - (143,306) 889
Tax losses 49,447 - - (49,447) -
Others - 77 12,548 - 12,625
TOTAL 149,882 78,941 25,933 (192,753) 62,003
Report and Consolidated Accounts 2015

48 Notes to the Consolidated Financial Statements
18. FINANCIAL INSTRUMENTS18.1. Measurement bases
It is the Group's policy to recognise an asset, a financial liability and an equity instrument only when it becomes a
part of the contractual provisions of the instrument.
The Group measures, at cost or written off cost less impairment loss, the financial instruments that have a defined
maturity, which the returns have a fixed amount, with a fixed interest rate during the instrument's life or of variable
rate which is a typical market indexing for financing operations (for example, Euribor), or that includes a spread
on that indexing, which does not contain a contractual clause that can result to its holder in a loss of nominal value
and accrued interest (excluding the cases of credit risk).
The contracts to grant or take a loan in a net basis and the equity instruments that are not publicly negotiated and
whose fair value cannot be obtained reliably, as well as contracts connected to those instruments that, if executed,
result in the delivery of those instruments, are also measured at cost or written off cost less impairment loss.
All financial instruments which are not measure at cost or written off cost less any impairment loss are measured
at fair value.
The Group does not include the transaction costs in the initial measurement of financial asset or liability, which is
measured at the fair value as part of profit/loss.
As long as the Group holds a financial instrument, the measurement policy will not be affected.
18.2. Financial assets and liabilities
Financial assets with recognition of impairment
31.12.2015 31.12.2014
CARRYING AMOUNTACCUMULATED
IMPAIRMENTCARRYING AMOUNT
ACCUMULATED IMPAIRMENT
Trade accounts receivable 179,344,203 (1,353,869) 220,702,038 (260,078)
Clients with guarantees 10,618,427 - 11,369,590 -
Doubtful debtors 3,135,584 (3,135,584) 3,229,682 (3,229,682)
TOTAL 193,098,214 (4,489,453) 235,301,310 (3,489,760)
DEFERRED TAXLIABILITIES
OPENING BALANCE
RATE CHANGEOTHER
VARIATIONSINCREASES REVERSAL
CLOSING BALANCE
Revaluation surpluses 1,286,297 (74,458) (2,405) 10,234 (110,970) 1,108,698
Taxable income 179,630 - (122,686) - (56,944) -
Depreciation not accepted 584,646 - (126,961) - (82,933) 374,752
TOTAL 2,050,573 (74,458) (252,052) 10,234 (250,847) 1,483,450
As at 31 December 2014, deferred tax assets and liabilities are the following:
DEFERRED TAX ASSETS OPENING BALANCE OTHER VARIATIONS INCREASES REVERSAL CLOSING BALANCE
Warranty of works 18,478 524 1,195 - 20,197
Application of percentage of completion 53,335 (424) 27,327 - 80,238
Financial instruments 12,781 (100) - (12,681) -
Tax losses 257,116 - - (207,669) 49,447
TOTAL 341,710 - 28,522 (220,350) 149,882
DEFERRED TAX LIABILITIES OPENING BALANCE OTHER VARIATIONS INCREASES REVERSAL CLOSING BALANCE
Revaluation surpluses 1,280,257 (46,774) 52,815 - 1,286,297
Taxable income 375,084 14,876 149,092 (359,422) 179,630
Depreciation not accepted 144,800 256,872 302,972 (119,997) 584,646
TOTAL 1,800,140 224,974 504,878 (479,419) 2,050,573
Report and Consolidated Accounts 2015

Notes to the Consolidated Financial Statements 49
18.3. Financial assets held for trading
This item includes the public debt securities of the Angolan State (treasury bonds), received as result of the debt
settlement agreements overdue from the client - Angola's National Roads Institute.
18.4. Total of interest income and expense for financial assets and liabilities
To calculate the written off cost of a financial asset or financial liability and allocate the interest income or interest
expense during the period, the effective interest method was used. According to this method, the total of interest
income for financial assets and the total of interest expenses for financial liabilities are the following:
a. Interest income for financial assets:
FINANCIAL ASSETS 31.12.2015 31.12.2014
Bank deposits 5,193,061 3,924,646
Others 1,833 604
TOTAL 5,194,894 3,925,250
FINANCING LIABILITIES 31.12.2015 31.12.2014
Financing 11,083,772 5,209,267
Finance leases 375,362 560,217
Others 80,693 44,783
TOTAL 11,539,827 5,814,267
b. Interest expenses for financial liabilities:
18.5. Impairment losses in financial assets
For financial assets, which are not measured at fair value through the profit/loss and regarding which impairment
is verified, the Group evaluated the respective impairment. From this evaluation, the Group was able to acquire
objective evidence that the financial assets, shown in the following table, present impairment losses for the period:
FINANCIAL ASSETS31.12.2015
IMPAIRMENT LOSSES REVERSALS
Clients 271,091 -
Other accounts receivable - -
Other financial assets - -
TOTAL 271,091 -
FINANCIAL ASSETS31.12.2014
IMPAIRMENT LOSSES REVERSALS
Clients 1,530,815 -
Other accounts receivable - -
Other financial assets - -
TOTAL 1,530,815 -
18.6. Amount of share capital
As at 31 December 2015, the Company had a share capital of 10,000,000 euros, fully subscribed and paid-in.
18.7. Shares representing share capital
As at 31 December 2015, the share capital was composed of 2,000,000 shares, with a nominal value of 5 euros
each.
Report and Consolidated Accounts 2015

50 Notes to the Consolidated Financial Statements
31.12.2015 31.12.2014
Mortality table TV 88/90 TV 88/90
Normal retirement age 66 years old 66 years old
Number of pensions in the year 13 13
Rate of return of assets 4% 4%
Rate of growth of wages 2% 2%
Discount rate 4% 4%
The excess of responsibility covered as at 31 December 2015, in the amount of 140,942 euros, is registered in the
item “Deferrals”. The amount of 541,672 euros regarding to actuarial gains in 2015 was also considered in the item
“Income to be recognised”.
Assumptions used in the actuarial study:
20. OTHER INFORMATION20.1. State and other public bodies
The item “State and other public bodies” as at 31 December 2015 and 31 December 2014 is the following:
ASSETS 31.12.2015 31.12.2014
Personal Income Tax 5,999 4,039,895
Value Added Tax 9,749,208 10,025,375
Social Security Contributions - -
Other taxation 5,051,336 42,778
Business Income Tax 9,178,449 11,483,213
TOTAL 23,984,992 25,591,261
LIABILITIES 31.12.2015 31.12.2014
Personal Income Tax 482,842 669,912
Value Added Tax 6,943,974 6,411,781
Social Security Contributions 507,152 516,550
Business Income Tax 2,824,634 15,565,160
Other taxation 816,345 270,180
TOTAL 11,574,946 23,433,583
19. EMPLOYEE BENEFITS19.1. Post-employment benefits
As at 31 December 2015, there were 89 employees enjoying post-employment benefits regarding benefit plans
defined. On 31 December 2015, the operations related to the period are the following:
PENSION COSTS 31.12.2015 31.12.2014
Cost of current services 239,350 360,491
Interest cost 274,402 294,967
Actuarial gains and losses (53,487) (245,228)
Return on assets (132,730) (330,497)
TOTAL 327,535 79,733
Report and Consolidated Accounts 2015
20.2. Guarantees provided
As at 31 December 2015, the Group had assumed responsibilities for the guarantees provided in the amount of
91,369,727 euros (as at 31 December 2014, the amount was 99,438,407 euros).
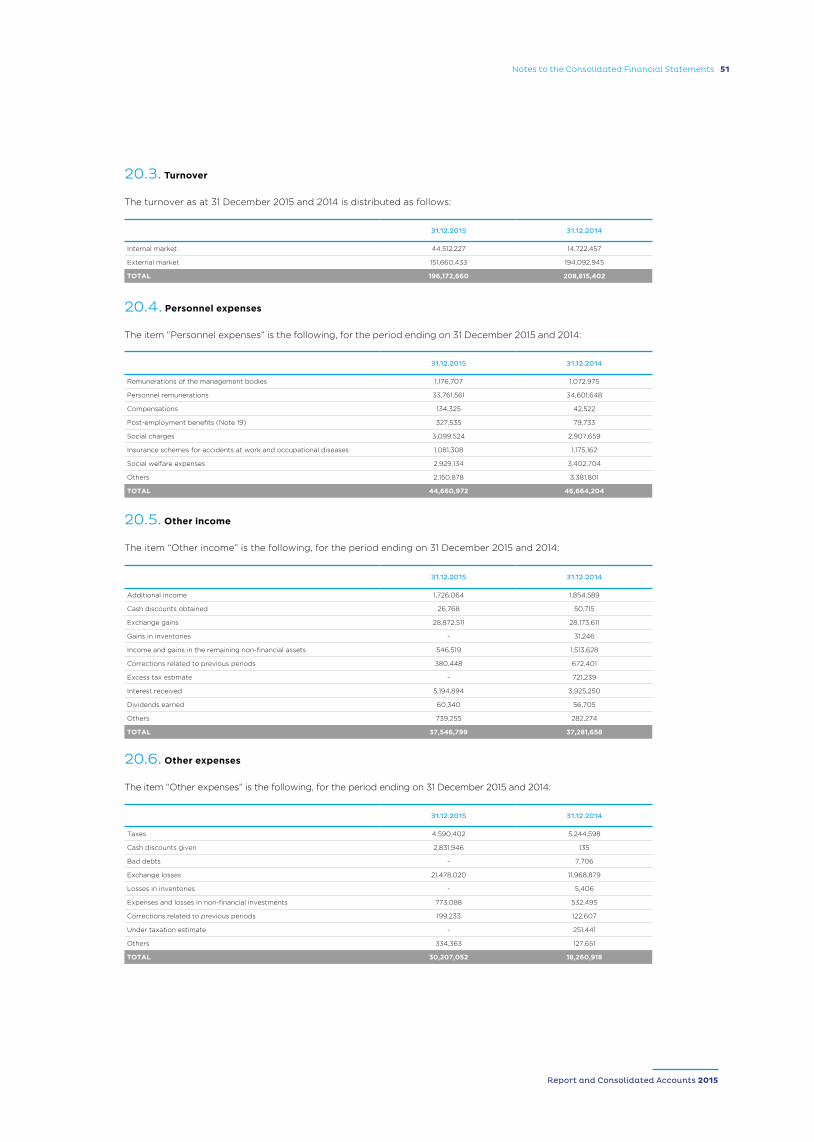
Notes to the Consolidated Financial Statements 51
20.3. Turnover
The turnover as at 31 December 2015 and 2014 is distributed as follows:
31.12.2015 31.12.2014
Internal market 44,512,227 14,722,457
External market 151,660,433 194,092,945
TOTAL 196,172,660 208,815,402
20.4. Personnel expenses
The item “Personnel expenses” is the following, for the period ending on 31 December 2015 and 2014:
31.12.2015 31.12.2014
Remunerations of the management bodies 1,176,707 1,072,975
Personnel remunerations 33,761,561 34,601,648
Compensations 134,325 42,522
Post-employment benefits (Note 19) 327,535 79,733
Social charges 3,099,524 2,907,659
Insurance schemes for accidents at work and occupational diseases 1,081,308 1,175,162
Social welfare expenses 2,929,134 3,402,704
Others 2,150,878 3,381,801
TOTAL 44,660,972 46,664,204
20.5. Other income
The item “Other income” is the following, for the period ending on 31 December 2015 and 2014:
31.12.2015 31.12.2014
Additional income 1,726,064 1,854,589
Cash discounts obtained 26,768 50,715
Exchange gains 28,872,511 28,173,611
Gains in inventories - 31,246
Income and gains in the remaining non-financial assets 546,519 1,513,628
Corrections related to previous periods 380,448 672,401
Excess tax estimate - 721,239
Interest received 5,194,894 3,925,250
Dividends earned 60,340 56,705
Others 739,255 282,274
TOTAL 37,546,799 37,281,658
20.6. Other expenses
The item “Other expenses” is the following, for the period ending on 31 December 2015 and 2014:
31.12.2015 31.12.2014
Taxes 4,590,402 5,244,598
Cash discounts given 2,831,946 135
Bad debts - 7,706
Exchange losses 21,478,020 11,968,879
Losses in inventories - 5,406
Expenses and losses in non-financial investments 773,088 532,495
Corrections related to previous periods 199,233 122,607
Under taxation estimate - 251,441
Others 334,363 127,651
TOTAL 30,207,052 18,260,918
Report and Consolidated Accounts 2015

52 Notes to the Consolidated Financial Statements
20.8. Deferrals
Deferred costs and deferred liabilities are the following:
DEFERRED COSTS 31.12.2015 31.12.2014
Expenses to be recognised - insurances 516,105 416,466
Expenses to be recognised - other 85,899 64,089
Pension fund - surplus (Note 19) 140,943 461,680
Other deferrals 888,550 44,286
TOTAL 1,631,496 986,521
DEFERRED LIABILITIES 31.12.2015 31.12.2014
Income to be recognised - NCRF 19 8,539,115 17,144,944
Pension fund (Note 19) 541,672 534,875
Billing to be recognised 945,731 1,745,516
TOTAL 10,026,518 19,425,335
20.7. Financial profit and loss account
The financial profit and loss are the following:
FINANCING EXPENSES AND LOSSES 31.12.2015 31.12.2014
Interest paid 11,459,133 5,758,936
Other financing expenses and losses 2,763,379 2,400,217
TOTAL 14,222,512 8,159,153
Report and Consolidated Accounts 2015

Notes to the Consolidated Financial Statements 53
Report and Consolidated Accounts 2015

54 Titulo
Report and Consolidated Accounts 2015
05

Título 55
Report and Consolidated Accounts 2015
REPORT ANDOPINION OF THE STATUTORY AUDIT BOARDREPORT AND CONSOLIDATEDACCOUNTS2015
Extremadura, Spain

56 Report and Opinion of the Statutory Audit Board
Report and Consolidated Accounts 2015
Financial year of 2015 Consolidated accountsDear Shareholders:
In compliance with the legal provisions, the Statutory
Audit Board submits its report and issues its opinion
on the consolidated management report, consolidated
balance sheet, consolidated accounts and proposal of
application of net income, which were presented by the
Board of Directors of CONDURIL – Engenharia, S.A.,
regarding the financial year ended on 31 December
2015.
ReportIn the performance of its duties, the Statutory Audit
Board had regular meetings accompanying the social
activity and the evolution of CONDURIL – Engenharia,
S.A. business, watched and ensured the fulfilment of the
law and the articles of association, and it was informed
of the acts carried out by the Board of Directors, which
has always clarified any situation when requested.
Also in the performance of its duties, the Board carried
out a careful analysis of the consolidated management
report presented by the Board of Directors, the
consolidated balance sheet, the consolidated income
statement, the consolidated cash flows and the changes
in consolidated equity for the financial year ended on
31 December 2015, and its annexe with the explanatory
notes. These documents were considered to be correct
and that as a whole offer a clear picture of the activity
developed and the financial position.
Within the framework of its competence, the Board was
informed of the works developed during the year by
the Audit Firm, obtained information and clarifications
provided by its representative, required to the control
of the official audit to the other financial statements,
was informed of the conclusions and recommendations
of the audit report sent to the Board of Directors, and
proceeded to the analysis of the legal certification of
consolidated accounts, documents that should have
the agreement of the Board in what concerns their
contents.
The Board, still in the framework of its competence,
expresses its agreement regarding the accounting
policies and the valuation criteria adopted.
As a result of the above, the Board considers that
the consolidated management report, consolidated
balance sheet, consolidated income statement,
consolidated cash flows and changes in consolidated
equity allow, in the whole, for a correct understanding
STATUTORY AUDIT BOARD
of the consolidated financial situation of CONDURIL –
Engenharia, S.A., on 31 December 2015, and the income
statement for the financial year ended in that date, and
it also considers that the legal and statutory provisions
were respected.
As a conclusion, the Board also thanks, along with the
Board of Directors, the Employees for their commitment
and dedication.
Therefore, the Statutory Audit Board issues the
Opinion1. that the consolidated management report,
consolidated balance sheet, consolidated accounts and
its notes for the financial year ended on 31 December
2015 are approved;
2. that the proposal of application of net income
included in the consolidated management report, in the
terms presented by the Board of Directors is approved.
Ermesinde, 14 March 2016
The Statutory Audit BoardCrisóstomo Aquino de Barros, President
Daniela Brás Vigário Silva
José Tiago Sapage Meireles de Amorim

Report and Opinion of the Statutory Audit Board 57
Report and Consolidated Accounts 2015

58 Titulo
Report and Consolidated Accounts 2015
06

Título 59
Report and Consolidated Accounts 2015
LEGALCERTIFICATIONOF CONSOLIDATED ACCOUNTSREPORT AND CONSOLIDATEDACCOUNTS2015
Saint Louis, Senegal

60 Legal Certification of Consolidated Accounts
Report and Consolidated Accounts 2015
Introduction1. We have examined the consolidated financial
statements of Conduril – Engenharia, S.A. (“Company”),
which comprise the Consolidated balance sheet
on 31 December 2015 (which reflect total assets of
493,492,742 euros and total equity of 212,526,608
euros, including a net income of 6,151,680 euros),
Consolidated profit and loss account by nature, the
Consolidated statement of changes in equity and the
Consolidated cash flow statement for the period ended
in that date, and its Notes.
Responsibilities2. The preparation of consolidated financial statements
that present a true and proper representation of the
financial position of the group of companies included
on consolidation, the consolidated net income of their
operations, the changes in consolidated equity and
the consolidated cash flows, as well as the adoption of
adequate accounting principles and the maintenance
of an appropriate system of internal control is the
responsibility of the Company’s Board of Directors.
3. Our responsibility is to issue a professional and
independent opinion on these financial statements,
based on our examination.
Scope4. Our examination was performed in accordance with
the auditing standards (“Normas Técnicas e as Diretrizes
de Revisão/Auditoria”) issued by the Portuguese
Institute of Statutory Auditors (“Ordem dos Revisores
Oficiais de Contas”), which require that the examination
be planned and performed with the objective of
obtaining reasonable assurance about whether the
consolidated financial statements are free of material
misstatement. This examination includes:
• verifying that the financial statements of the
companies included on consolidation have been
properly audited and, for the significant cases
where they have not been, verifying, on a test basis,
evidence supporting the amounts and disclosures
contained therein, and assessing the significant
estimates, based on assumptions and criteria defined
by the Company’s Board of Directors, used in their
preparation;
• verifying the consolidation practices;
LEGAL CERTIFICATION OF CONSOLIDATED ACCOUNTS
• assessing the adequacy of the accounting principles
used and their disclosure, taking into consideration
the circumstances;
• verifying the applicability of the going concern
concept; and
• the adequacy of the overall presentation of the
consolidated financial statements.
5. Our examination has also verified that the financial
information contained in the consolidated management
report is consistent with that of the remaining
documents in the consolidated financial statements.
6. We believe that our examination provides a
reasonable basis for expressing our opinion.
Opinion
7. In our opinion, the consolidated financial statements
referred present fairly, in all material aspects, the financial
position of Conduril – Engenharia, S.A. on 31 December
2015 and the consolidated results of its operations, the
changes in equity and the consolidated cash flows for the
period ended in that date, in conformity with the generally
accepted accounting principles in Portugal.
Report on other legal requirements8. We are also of the opinion that the information in
the consolidated management report is consistent with
the consolidated financial statements.
Porto, 14 March 2016
HORWATH & ASSOCIADOS, SROC, LDA.
Represented by Ana Raquel Borges L. Esperança Sismeiro (ROC
1126)


CONDURIL - ENGENHARIA, S.A.
CONDURIL ANGOLA
CONDURIL MOÇAMBIQUE,
ENOP, MABALANE
CONDURIL BOTSWANA
CONDURIL ZÂMBIA
CONDURIL MALAWI
CONDURILGABÃO
CONDURILAÇORES
MÉTISENGENHARIA, LDA
URANO, LDA
Avenida Eng. Duarte Pacheco, n.º 1835
4445-416 Ermesinde - Portugal
T. +351 229 773 920
F. +351 229 748 668
Rua 2 IL (ao Largo do Ambiente)
Município de Ingombota - Luanda - Angola
T. +244 222 310 153
F. +244 222 310 713
Rua 1393 (Transversal da Av. José Craveirinha), n.º 120
Maputo - Moçambique
T. +258 214 831 20
F. +258 214 874 80
Tribal Lot 86 Portion 955 Isis Village
Tlokweng - Gaborone - Botswana
T. +267 319 02 53
F. +267 393 03 25
Plot 3817 Martin Mwamba Road
Lusaka - Zambia
PO Box 473 P/Bag E891 Manda Hill Lusaka Zambia
T. +260 211 291 441
PO Box 40 Liwonde Malawi
Liwonde - Malawi
T. +265 994 956 884
Quartier Oloumi, IMM. Xanadou - Bât Gauche, lot D3,
3ème Étage, Port 301, BP 203
Libreville - Gabon
T. +241 01 76 39 53
Rua Padre João Baptista Valles, N.º 3, 1.º, SU/NA
9500-791 – Ponta Delgada
T. +351 296 653 468
Parque Industrial – B.º – Capalanga
Município de Viana – Luanda – Angola
T. +244 939 212 517
Polo Industrial de Viana, Zona do Km25
Município de Viana – Comuna de Zango –
Luanda – Angola
T. +244 939 133 245