report and recommendation of the ska site advisory ... · ska site advisory committee (ssac) 16...
TRANSCRIPT

Report and Recommendation
of the
SKA Site Advisory Committee (SSAC)
16 February 2012
James M. Moran, Chair Subramaniam Ananthakrishnan Jacob W.M. Baars Jocelyn Bell Burnell Willem N. Brouw Ian Corbett James Crocker Thomas Garvin Stefan Michalowski Ernest R. Seaquist Peter Tindemans Jacqueline van Gorkom Roger J. Brissenden, Executive Secretary

2
Table of Contents
1. Executive Summary ............................................................................................................. 3
2. Introduction ........................................................................................................................... 5
3. SSAC Processes, Time Line, and Materials .................................................................. 7 3.1 Evaluation Process ...................................................................................................................... 7 3.2 Decision-Making Process .......................................................................................................... 9 3.3 Scoring Process ............................................................................................................................ 9 3.4 Time Line of All Discussions and Meetings ..................................................................... 11 3.5 Information Received and Considered ............................................................................. 13
4. Findings and Conclusions ............................................................................................... 14 4.1 Science and Technical Factors: 1–7 .................................................................................... 14 4.2 Other Selection Factors: 8–13 .............................................................................................. 19 4.3 Implementation Plans and Costs Factors: 14–17 .......................................................... 23 4.4 Voting Results ............................................................................................................................ 26 4.5 Robustness Summary.............................................................................................................. 29
5. Site Recommendation ...................................................................................................... 31
Abbreviations, Acronyms, and Symbols ........................................................................ 32
Attachment 1. SSAC Biographies ...................................................................................... 37
Attachment 2. SSAC ToR ...................................................................................................... 42
Attachment 3. SKA SSAC Evaluation Plan ...................................................................... 58
Attachment 4. Factor Reports ........................................................................................... 71
Attachment 5. Robustness Analysis .............................................................................. 144

1. Executive Summary
3
1. Executive Summary The SKA Site Advisory Committee (SSAC), acting in accordance with its Terms of Reference and Evaluation Plan, and having examined the materials that were provided, unanimously adopted the following consensus statement: “The SSAC has determined that the SKA could be sited in either Australia/New Zealand or in southern Africa. The SSAC analyzed, evaluated, and scored the 13 Technical, Science, and Other Selection Factors using the Factor weights given. The outcome was in favor of southern Africa. The SSAC also evaluated the strengths and weaknesses of the four Implementation Plans and Costs Factors. This outcome was also in favor of southern Africa. Consequently, the SSAC recommends southern Africa as the preferred site.” The SSAC, with 12 members and 1 nonvoting executive secretary, was constituted and approved by the SKA Founding Board and its supporting committees in mid-2011 to evaluate the relative merits of the sites proposed by the ANZ and RSA consortia. The SSAC was given 17 Factors to consider, which were grouped into three categories: Technical and Scientific Factors (A), Other Selection Factors (B, which generally dealt with socioeconomic and political considerations), and Implementation Plans and Costs Factors (C). The SSAC considered the SKA to be a single instrument. In particular, no separate evaluations were made of the low-frequency aperture array, the mid-frequency aperture array, and the dish array, with its component parts including a central region of antennas within 180 km surrounded by 25 stations between 180 and 3000 km. In addition, the SSAC did not make any judgments about the established scientific priorities for the SKA and considered all parts of the array as necessary in meeting these priorities. The SSAC did not consider any alternative solutions for the SKA project such as separate locations for the low- and mid-frequency arrays. It evaluated only the materials provided in response to the official Request for Information (RfI). Thus, no attempt was made to suggest improvements in the proposed arrays, e.g., array configuration. For the same reason, the “motivated alternative configuration” in the ANZ submission was not considered. Two critical factors largely determined the recommendation in favor of southern Africa. First, the layout of remote stations, an important consideration in Factor 5 (Array Science Performance), was constrained by the geographic and other site-specific factors in both Australia and southern Africa. The resulting array configuration was judged to be significantly better in the RSA submission. This conclusion is based on the superior layout of the remote stations in the RSA configuration, which gave it both higher resolution in the North–South direction and

1. Executive Summary
4
better dynamic range for short observations (less than four hours) as predicted by the UVGAP parameter. Second, the provision and cost of electrical power (Factor 16) strongly favored the RSA proposal. The continuous power consumption of the SKA is estimated to be 110 MW. It seems unlikely that this requirement can be reduced because of the inevitable expansion of the power requirement for signal processing. The advantage to RSA derives from its existing power grid and lower generation and delivery costs. Five of the seven Technical and Scientific Factors were judged to favor RSA. In addition to array configuration, these were: the tropospheric turbulence (because of the higher elevations of the RSA stations), current and long-term radio frequency interference (RFI) environments (based largely on the remote stations), and physical characteristics of the sites. The ANZ site was judged to have an advantage in the Radio Quiet Zone protection Factor. With respect to ionospheric turbulence (Factor 1), which preferentially affects observations at lower frequencies, the SSAC was unable to find any significant difference between the sites, based on the data provided. All six of the Other Selection Factors favored ANZ. For the RSA bid, much of the concern in these Factors derived from the difficulties of coordinating the laws and procedures among the six partner countries in southern Africa, as well as the security and political challenges in the region. The SSAC vote for the Category A and B Factors favored RSA with scores of 9.60 ± 0.09 for ANZ and 10.40 ± 0.09 for RSA, on a scale where 10–10 represented no significant difference and 20–0 represented very serious differences. The robustness of the vote among members of the SSAC was subjected to various statistical tests. The combined Factor votes, after each Factor vote was normalized by its mean and standard deviation, had a nearly Gaussian distribution. Five votes among the 156 cast possessed a 2-σ or greater deviation, which is not statistically significant for the size of the data set. Nevertheless, when extreme votes were eliminated, changes in the outcome were less than ± 0.1. Other censoring exercises were conducted with similar (no change) final outcomes. It should be noted that an evaluation of the vote significance is difficult to calculate with scientific precision because of the unquantifiable correlations among Factors and SSAC members. Nonetheless, we consider the result of the vote to be significant and robust. The four Factors in Category C were evaluated for strengths and weaknesses: cost and implementation of infrastructure; data transport; power; and consolidated cost of capital and operational expenditures. All favored the RSA site with the following levels of advantage: low, medium, high, and high, respectively. It is emphasized that the final Factor in this category was a combination of the other three. The combination of the result of the vote on Categories A and B Factors, and of the strengths and weaknesses analysis of the Category C Factors, led to the recommendation of southern Africa as the preferred site.

2. Introduction
5
2. Introduction The SKA Founding Board (FB), with the agreement of the SKA Science and Engineering Committee (SSEC), established the SSAC and appointed the committee members. The SSAC was tasked with (a) reviewing the data and information obtained on the candidate sites; (b) assessing reports by expert panels, consultants and the SKA Program Development Office (SPDO), (c) carrying out an evaluation of the strengths and weaknesses of the sites, and (d) formulating a recommendation on a preferred site for the SKA. A visit to the candidate sites was not included as part of the SSAC activities. The present report and recommendation is submitted to the SKA Siting Group (SSG) for that group to conduct a validation of adherence to the agreed process. The SSG will then transmit the report and recommendation to the SKA Board of Directors who will make the site decision. The membership of the SSAC is a diverse group consisting of scientists, business executives, and experts on international science policy. The SSAC consists of the following members:* James Moran; Chair Harvard-Smithsonian Center for Astrophysics USA
James Crocker Lockheed Martin Space Systems Company USA
Subramaniam Ananthakrishnan Pune University India
Thomas Garvin Thomas F. R. Garvin P.C. USA
Jacob Baars Retired, formerly Max-Planck-Institute for Radioastronomy Germany
Stefan Michalowski OECD Global Science Forum France
Jocelyn Bell Burnell Oxford University United Kingdom
Ernest Seaquist Retired, University of Toronto Canada
Wim Brouw Retired, formerly Groningen University, CSIRO, and ASTRON The Netherlands
Peter Tindemans Formerly Netherlands Ministry of Education and Science and OECD Megascience Forum The Netherlands
Ian Corbett International Astronomical Union United Kingdom
Jacqueline van Gorkom Columbia University USA
Executive Secretary: Roger Brissenden Harvard Smithsonian Center for Astrophysics USA
*Paul Gilbert was originally a member of the SSAC, but he withdrew for personal reasons. The SSG replaced him with James Crocker, with the approval of the FB.
2. Introduction
6
A summary biography for each of the members of the SSAC is provided in Attachment 1. The SSAC was established under the “Terms of Reference (ToR) and Rules of Procedure,” which is provided as Attachment 2 to this report. The document includes the prescribed SKA site selection Factors and their weights, the expected site selection time line, materials to be provided to the SSAC and schedule, and consideration of methods of evaluation. As required by the ToR, the SSAC before reviewing or assessing any data, first discussed and prepared a plan (see Attachment 3, SSAC Evaluation Plan) by which the data and information and reports from the candidate sites, expert panels, and consultants were to be evaluated. In addition to documenting the method of evaluation, the plan included a description of the processes necessary for the SSAC to conduct its work. The SSAC identified a number of items related to the ToR as working assumptions, interpretations, and clarifications (see Appendix 1 of Attachment 3). The SSAC Evaluation Plan was approved by the FB on 16 November 2011. In order to ensure that the SSAC functioned free of conflict of interest and bias, each committee member signed the “Code of Conduct Regarding Conflicts-of-Interest; Bias; Confidentiality; and Non-Disclosure for Members of the SKA Site Advisory Committee (SSAC).” The signed form for each member of the SSAC was provided to the chair of the SSG. In addition, at no time during the SSAC’s work that resulted in the site recommendation did any member receive a solicitation intended to influence the SSAC from a person outside of the committee. Further discussion of the SSAC processes documented in the Evaluation Plan is provided in Section 3.

3. SSAC Processes
7
3. SSAC Processes, Time Line, and Materials
3.1 Evaluation Process The evaluation, decision-making and other processes adopted by the SSAC are documented in the SSAC Evaluation Plan as approved by the Founding Board on 30 November 2011. Below we summarize the key components of the Evaluation Plan. The Plan is included in full as Attachment 3 of this report. Material, Factors, and Weights Material for review consisted of (a) the RfI responses from the two candidate sites; (b) reports from consultants, experts and the SKA Program Development Office (SPDO); (c) external references and reports; and (d) responses to questions posed to the two candidate sites both in writing and during interviews with representatives from the candidate sites. Any material referenced with respect to an individual Factor obtained from external sources is noted in the Factor reports (Attachment 4). The SSAC considered material for each of the Factors given in Table 3-1 below, consistent with the Factors provided in Attachment 3 of the SSAC ToR (see Attachment 2 of this report). The Factors fall into the following categories: Science and Technical Factors (A), Other Selection Factors (B), and Implementation Plans and Costs (C). The Science and Technical Factors and Other Selection Factors are, by their nature, amenable to a quantitative evaluation whereas the Implementation Plans and Costs Factors, by virtue of the relatively greater uncertainty in the information, are better evaluated in terms of a strengths and weaknesses analysis (see SSAC ToR Attachment 5 included in Attachment 2 of this report). The selection Factors and weights were established by the SSG and approved by the FB, with the agreement of the SSEC. The SSAC used the following weights for the Factor categories as instructed by the SSG consistent with Table 1, Attachment 5, of the SSAC ToR (17 July 2011):
A Science and Technical Factors: 75% B Other Selection Factors: 25% C Implementation Plans and Costs: No weight assigned
The weights of each of the individual Factors in Categories A and B are shown in Table 3-1 and are consistent with Tables 2 and 3, Attachment 5 of the SSAC ToR (see Attachment 2 of this report).

3. SSAC Processes
8
Table 3-1. Factors and Weights, as Set by the SSG Factor # Factor Name Weight
(%)
A
1 Ionospheric turbulence 21 2 RFI measurements 27 3 Radio Quiet Zone protection 4 Long-term RFI environment 5 Array science performance 17 6 Physical characteristics of the sites 5 7 Tropospheric turbulence 5
B
8 Political, socioeconomic, and financial 2 9 Customs and excise 6
10 Legal 3 11 Security 3 12 Employment 6 13 Working and support environment 5
C
14 Provision and cost of infrastructure components based on the Model of the SKA
N/A
15 Provision and cost of internal and external data transport based on the Model of the SKA
N/A
16 Provision and cost of electrical power based on the Model of the SKA
N/A
17 Consolidated costs of capital and operations expenditures N/A Evaluation of Data. The SSAC process of reviewing the material provided for the 17 Factors listed in Table 3-1 was as follows:
(a) All members read all material as practical. (b) A lead and one or more secondary reviewers were assigned to each Factor. (c) The lead coordinated with the members of his working group in an in-depth
review of the assigned Factor and developed a synopsis of key points, with a suggested preliminary score or a strengths and weaknesses analysis that was discussed by the entire SSAC.
(d) A scoring system was used for those Factors amenable to quantitative assessment (the Factors in Categories A and B of Table 3-1). A strengths and weaknesses approach was used for the Factors in Category C of Table 3-1.
(e) The SSAC based its recommendation only on the material referenced in this report and on no other material. The members of the SSAC also submitted questions to the SSG for transmittal to the SPDO, one or more experts, consultants, and/or one or both of the candidate sites, and used any material that was provided in response. Material from the site interviews and in response to questions posed prior to and during the site interviews was also

3. SSAC Processes
9
used. Additional information provided by the sites after the London 2011 meeting was also considered by the SSAC. The SSAC determined the material that is in or out of scope for use in its assessment and evaluation as noted in Section 3.3 below.
The SSAC considered the allocation of the 27% weight given by the SSG to the combination of the RFI Measurements, Radio Quiet Zone Protection, and Long-term RFI Environment Factors (Factors 2, 3 and 4) and agreed to (a) consider each of the three Factors separately, and (b) allocate a weighting of 9% to each of the three Factors. The testing of the robustness of the conclusion (Section 4.5 and the full analysis in Attachment 5) demonstrated that the final result was not sensitive to this allocation.
3.2 Decision-Making Process The SSAC adopted the following decision-making process:
(a) A quorum of 50% of the SSAC plus one was required in order for a SSAC meeting to be valid;
(b) To participate, an SSAC member had to be physically present, on a video call, or on the telephone;
(c) Decisions were only made by participating SSAC members; (d) Every effort was made to reach consensus. If no consensus was reached a
vote was taken; (e) All decisions other than the final site recommendation required a simple
majority subject to quorum; (f) Abstentions were permitted unless otherwise agreed, and were not
considered to be a vote; (g) In the event of a tied vote, it was the responsibility of the Chair to steer the
SSAC to a conclusion; (h) If put to a vote, the final site recommendation required a positive vote of at
least seven SSAC members; In addition, it was agreed to document any dissenting opinions concerning the site recommendation. The above processes were adopted prior to the start of the review of any data and deliberations. In the actual course of events, the SSAC’s work was characterized by openness and collegiality, with all differences settled amiably and to everyone’s satisfaction.
3.3 Scoring Process The SSAC used a straightforward quantitative comparison method for the Factors set forth in Categories A and B of Table 3-1 using the following procedure:

3. SSAC Processes
10
(a) A scale of 1–19 was adopted to indicate the relative strength of each candidate site, with 1 being the lowest score.
(b) A total of 20 points was allocated between the two alternatives. A discussion of the relationship between the numerical scores and the perceived impact of a particular Factor on the effectiveness of the array is provided in Appendix 4 of Attachment 3 (see Table A4.1).
(c) For each Factor, each SSAC voting member gave a score for each site. (d) Scores were known to the SSAC, but individual votes and scores were not
recorded or disclosed. Aggregate scores are discussed in Section 4.4. (e) The average and variance was recorded for each Factor. (f) Scores for each Factor were weighted according to the values provided by
the SSG to the SSAC in Table 3-1. A summation of weighted scores was made for each site, resulting in a combined ranking of the two sites for the Factors in Categories A and B of Table 3-1. The SSAC discussed the importance of the variance in the vote for each Factor when it formulated its final recommendation.
It is important to note, as mentioned above, that the discussion of each Factor was led by a subgroup of the SSAC, each of which had a Factor lead. Eight SSAC members served as Factor leads. However, the vote was conducted in secret to maintain voter independence to the extent possible. The SSAC gave the Factors listed in Category C of Table 3-1 serious consideration in the final site recommendation. In considering these Factors, the SSAC reviewed the materials listed above (see “Materials, Factors and Weights”) for implementation, feasibility and cost, assessed the strengths and weaknesses for each site, and took these Factors into account in developing the overall comparison of the two sites. The following procedure was used in conducting the strengths and weaknesses assessment:
(a) For each Factor listed in Category C of Table 3-1, a list of strengths and weakness was developed for each candidate site.
(b) Each strength and weakness for both candidate sites was assigned a “low,” “medium,” or “high” level of importance based on the judgment of the SSAC. The SSAC also assessed the risk associated with each Factor.
(c) The SSAC determined based on comparison which site is favored (if any). The SSAC has not noted any disqualifying disabling characteristics of either site.
The quantitative results for Category A and B of Table 3-1 were considered by the SSAC together with the results of the strengths and weaknesses assessment for Category C to determine the final recommendation.

3. SSAC Processes
11
3.4 Time Line of All Discussions and Meetings The SSAC met three times and held four teleconferences during the SSAC process as listed below. Meetings and discussions were held in accordance with the Evaluation Plan (see Attachment 3). In addition, SSAC members appointed to work together on Factor assessment held various other small group meetings, discussions via email and teleconferences in conducting their evaluation. September 8–9, 2011 SSAC Meeting, AUI, Washington DC The SSAC made significant progress on the content of the Evaluation Plan and agreed the processes for conducting the business of the SSAC. In addition, the SSAC was given an overview by the SPDO Director (Richard Schilizzi) of the materials to be provided to the SSAC grouped by selection category – Science and Technical, Other Selection Factors, and Implementation Plans and Costs. Present: Subramaniam Ananthakrishnan, Jaap Baars, Roger Brissenden, Wim Brouw; Ian Corbett, Thomas Garvin, Stefan Michalowski, James Moran, Vernon Pankonin (SSG Observer), Richard Schilizzi (SPDO), Ernest Seaquist, Russ Taylor (SSG Observer), Peter Tindemans, Jacqueline van Gorkom (by phone). Absent: Jocelyn Bell Burnell, Paul Gilbert. November 11, 2011 Telecon: 15–17 UT The majority of the review material was provided to the SSAC by November 11, 2011 and the in-depth reviews for each Factor were well under way. During the call the SSAC heard a status report from the SPDO Director on the remaining outstanding documentation, and from each of the Factor leads on the status of their working group’s review, and any preliminary impressions, strengths and weaknesses based on the material received and reviewed to date. Present: Subramaniam Ananthakrishnan, Jaap Baars, Jocelyn Bell Burnell, Simon Berry (SSG Observer), Roger Brissenden; Wim Brouw; Ian Corbett, Jim Crocker, Thomas Garvin, Stefan Michalowski, James Moran, Richard Schilizzi (SPDO; for agenda items 1–4), Ernest Seaquist, Peter Tindemans, Jacqueline van Gorkom. November 28, 2011 Telecon: 15–17 UT The telecon was held to discuss the progress of the review of the material and finalize the written list of questions for the site teams in advance of the December 6–9 meetings in London. Questions were submitted to SSG for forwarding to the site teams as planned, seven days before the December meetings. Present: Subramaniam Ananthakrishnan, Jaap Baars, Jocelyn Bell Burnell, Roger Brissenden, Wim Brouw, Ian Corbett, Jim Crocker, Thomas Garvin, James Moran,

3. SSAC Processes
12
Ernest Seaquist, Yervant Terzian (SSG Observer), Peter Tindemans, Jacqueline van Gorkom, Patricia Vogel (SSG Observer). Absent: Stefan Michalowski. December 6–9, 2011 SSAC Meeting, Institute of Physics, London The SSAC met to discuss the status of the review of the various Factors and review and formulate any additional questions of clarification for the sites, received site candidate presentations and conducted half-day interviews with both Site Delegations, conducted voting on all Factors in Categories A and B, and determined the strengths and weaknesses of all Category C Factors. Present: Subramaniam Ananthakrishnan, Jaap Baars, Jocelyn Bell Burnell, Simon Berry (SSG Observer; Dec 7–8) Roger Brissenden, Wim Brouw, Ian Corbett, Jim Crocker (via video conference), Thomas Garvin, Stefan Michalowski, James Moran, Vern Pankonin (SSG Observer), Ernest Seaquist, Russell Taylor (SSG Observer), Peter Tindemans, Jacqueline van Gorkom. January 11, 2012 Telecon: 15–18 UT The SSAC reviewed the additional responses to questions received from the ANZ delegation and final reports on RFI impact at remote site stations for RSA, reviewed all Factors in light of the new material, and discussed the ongoing review of the various Factors, and made plans for report writing. Present: Subramaniam Ananthakrishnan, Jaap Baars, Jocelyn Bell Burnell, Roger Brissenden, Wim Brouw, Ian Corbett, Jim Crocker, Thomas Garvin, Stefan Michalowski, James Moran, Vern Pankonin (SSG Observer), Ernest Seaquist, Russell Taylor (SSG Observer; joined ~16 UT), Peter Tindemans, Jacqueline van Gorkom. January 26–27, 2012 SSAC Meeting, L’Institut d’Astrophysique de Paris The SSAC conducted a detailed review of the various Factors in Categories A and B and the Category C Factors, discussed the issues presented and reviewed the first rough draft report and reached agreement on all outstanding issues and open items. Agreement was reached on the final recommendation and plans set for the final edits and final reviews to the final version of the report leading to submission of the Final report to the SSG in February 2012. Present: Subramaniam Ananthakrishnan, Jaap Baars, Jocelyn Bell Burnell, Roger Brissenden, Wim Brouw, Ian Corbett, Jim Crocker, Thomas Garvin, Stefan Michalowski, James Moran, Vern Pankonin (SSG Observer), Ernest Seaquist (via conference call), Russell Taylor (SSG Observer), Peter Tindemans, Jacqueline van Gorkom.

3. SSAC Processes
13
February 11, 2012 Telecon: 15–17 UT The SSAC reviewed the draft of the report and concurred with its submission to the SSG for validation of the SSAC process. Present: Subramaniam Ananthakrishnan, Jaap Baars, Jocelyn Bell Burnell, Roger Brissenden, Ian Corbett, Jim Crocker, Thomas Garvin, Stefan Michalowski, James Moran, Vern Pankonin (SSG Observer), Ernest Seaquist, Peter Tindemans, Jacqueline van Gorkom. Absent: Wim Brouw.
3.5 Information Received and Considered The following information was received and reviewed by the SSAC during its deliberations. Information Provided to SSAC # Files # Pages RfI, Terms of Reference (SSG, SSAC) and related documents 20 230 Australian and New Zealand response to the RfI 1 1,134 South African response to the RfI* 1,090 21,328 SPDO and Expert reports, and reference material** 2,134 6,346 SKA Siting documentation from the 2004 RfP and subsequent proposals
15 867
Interview presentations and responses to questions from ANZ and RSA
17 496
Responses to questions posed to the SSG as part of the present work of the SSAC following the process defined in the SSAC Evaluation Plan
11 27
Total 3,288 30,428 * The main bodies of both responses to the RfI from ANZ and RAS were 141 and 145 pages, respectively. The larger volume of appendices in the RSA response related, in part, to the provision of comparable documentation for the six partner countries. **A table of all the SPDO, Expert Panel, and consultant reports for each Factor can be found in Attachment 3, SSAC Evaluation Plan, Appendix 2. The following information was excluded from consideration by the SSAC:
1. The “motivated alternative configuration” submitted as part of the ANZ RfI response. The SSAC considered this material as outside the scope of the RfI.
2. Annexure C.10.1 of the RSA RfI response, “Acquisition Differential Cost Report 2010.” The SSAC considered this material as outside the scope of the RfI.

4. Findings and Conclusions
14
4. Findings and Conclusions This section of the report presents the main findings of the SKA Site Advisory Committee (SSAC) and the conclusions about the relative merits of the two sites based upon those findings. It includes details of the voting on each Factor (Section 4.4) and a summary of tests carried out to check the robustness of the conclusion (Section 4.5). A summary of the findings and conclusions, Factor by Factor, is presented below. The full reports of each Factor are given in Attachment 4. Included in each summary is the mean score given by the SSAC. The full details of the scoring used are given in Section 4 of Attachment 3 (Evaluation Plan), but essentially each SSAC member had 20 points to distribute on each Factor between the two sites (more points indicating an advantage); the reported figure is the arithmetic mean of the individual scores. More details of the voting (including the spread) are given in Section 4.4. The Factors, their weights, and their numbering are as defined in Section 3.1. In two of the 17 Factors, the SSAC, using its own expertise, could improve upon some of the findings or conclusions of some of the expert reports provided. These are Factor 2, RFI Measurements (where we carried out an extended desktop study), and Factor 7, Tropospheric Turbulence (where we found an error in the calculations). For Factor 11, Security, the SSAC disagreed with the experts’ judgment in a number of areas, including their assignment to ANZ of an overall security threat level of “moderate.” The details are given in the full Factor reports in Attachment 4. Note also that the full Factor reports include paragraphs on any future monitoring etc., that the SSAC recommends.
4.1 Science and Technical Factors: 1–7 Factor 1: Ionospheric Turbulence The ionosphere is the solar-excited plasma layer that peaks about 300 km above the surface of the Earth. The turbulence in this layer of ionized gas causes time-dependent variations in the index of refraction that affect the amplitude and phase of the radio signals traversing it. The large-scale variations in the total electron content (TEC) mainly affect the signal phase, and the small-scale variations cause scintillation or amplitude variations, both of which are deleterious to high-dynamic-range imaging. These effects generally scale as the inverse square of the frequency and hence will influence the SKA more at lower frequencies. Both candidate sites lie at relatively benign mid-geomagnetic latitudes, away from the regions of strong effects seen at equatorial and auroral zones. However, both sites will affected by ionospheric turbulence, which will require careful calibration techniques to mitigate.

4. Findings and Conclusions
15
The SPDO report carefully analyzed the available data relevant for both sites. These data are more sparse for the remote stations at each proposed site, but this is probably not a serious problem since only the central zone of the SKA will be used at low frequencies. We have reviewed the SPDO report and its sources, as well as some of the open literature. There are small differences between the sites at the level of about 5% significance, which can be further quantified only with intensive local measurement campaigns. The most readily measured quantity is the TEC. The long-term average TEC appears to be about 10% less for RSA compared with ANZ. Many ionospheric effects can be expected to scale with the TEC, but its average effect can be modeled and removed. However, studies of scintillation at sites near the proposed array cores show that the effects of scintillation may be 10% less at ANZ compared with RSA. Other variability phenomena, such as spread F and traveling wave disturbances, may be also be slightly less for ANZ (5%). At the longitude of Australia, low-elevation observations toward the south may be affected more than similar observations in southern Africa because of the ionospheric behavior in the auroral zone. On the other hand, low-elevation observations toward the west may be affected more in RSA due to the South Atlantic Anomaly. Considering the aggregate effects of the phenomena described above, we can say that the sites are comparable at the 5% level with currently available data. The SSAC vote on this Factor was 10.0 for ANZ and 10.0 for RSA. Factor 2: RFI Measurements The SPDO, in collaboration with the site proponents, performed measurements of radio frequency interference (RFI) levels at the core sites and four remote stations each in RSA and ANZ. In addition, expected interference levels have been computed for all remote stations from a list of terrestrial transmitters in the 300–2000 MHz region within 150 km from any of the remote sites. The reported RFI measurements and computations were visually inspected and analyzed and the following conclusions drawn:
• Both core sites are well suited to host the SKA. The measurements do not show a discernible difference in RFI levels between the two sites.
• RFI levels, computed from a desktop study of transmitter sites, and corroborated by measurements at four sites each in ANZ and RSA, indicate a median interference level of 40 dB for RSA and 70 dB for ANZ above the threshold level, which is a significant difference. The remote sites in the RSA proposal show a clear advantage over those in ANZ.
4. Findings and Conclusions
16
Overall, RSA has a somewhat better advantage for this Factor. The SSAC vote on this Factor was 7.2 for ANZ and 12.8 for RSA. Factor 3: Radio Quiet Zone Protection The SSAC evaluated several issues related to Radio Quiet Zone (RQZ) protection: existing laws and new legislation in both sites, current RQZ specifications, and assessment of what can practicably be achieved and legally enforced. Some SSAC members noted, especially, the legal difficulties of coordinating and legally enforcing RQZ protection in the RSA proposal, which is a multinational project with neighboring countries. Others remarked on the varying existing laws and courts, the different specifications set by each candidate, the consequences of limiting RFI, the local and regional radio spectrum management organizations, and effectiveness of enforcement. The SSAC believes the RQZ protection laws and regulations adopted by Australia and South Africa for the central area of the SKA would each provide a suitable level of RQZ protection there. However, it is the SSAC’s conclusion that RQZ legal protection for remote stations is superior in the ANZ proposal. Given the spread in scoring based on different perspectives of its members, the SSAC concludes that the two sites are comparable on this Factor, with ANZ having a slight advantage. The SSAC vote on this Factor was 10.3 for ANZ and 9.7 for RSA. Factor 4: Long-Term RFI Environment We examined the long-term future of the radio frequency interference (RFI) environment in both ANZ and RSA, using the responses to the RfI, the expert reports, and information from the interviews with site delegates. We note first that both candidates selected acceptably quiet sites. In both countries, the most significant long-term trend is nationwide increases in RFI levels due to the likely very strong worldwide growth of broadband mobile cellular services. Cooperation between the SKA and service providers will be essential. We consider the potential impacts of (1) problems of legal enforcement of RFI regulation, (2) RFI and electromagnetic interference (EMI) risks due to the long-term evolution of population and population density, (3) mining and gas extraction activity, and (4) the effectiveness of Radio Quiet Zone (RQZ) protection measures. We find that legal enforcement may be a more severe problem for remote sites in the RSA partner countries, mitigated, however, by the higher tolerance of RFI for signals from the remote sites. Farm population density is declining at both sites due to increasing urbanization. While there are assurances that mining and gas extraction are not current issues, this situation could change quickly at either site. The SSAC considers the Astronomy Geographical Advantage (AGA) Act in RSA to be a novel and
4. Findings and Conclusions
17
potentially effective approach to RQZ protection, but both countries have essentially equivalent legal RQZ regulation.
In conclusion, the long-term RFI environment is comparable and acceptable in both ANZ and RSA.
The SSAC vote on this Factor was 9.3 for ANZ and 10.7 for RSA. Factor 5: Array Science Performance We examined the array configurations as proposed by RSA and ANZ, and the comparative analysis done by the SPDO. The SPDO defined several Figures of Merit (FoMs), which quantify the effect of nonperfect distribution of points in the UV-plane. The risk for electromagnetic interference (EMI) was also considered. For the central area, the layout of the arrays is close to identical for both sites. Differences between the UV-plane FoMs are minimal. The RSA site has a nonzero EMI risk due to the presence of farmsteads in the central area that could cause a very small increase in system temperature of individual antennas. However, the effect is so small (<0.5% in survey speed) that the possible impact on the science performance is negligible. Considering the full array, the remote stations have a much more regular distribution over azimuth and radius in the RSA configuration, resulting in better UV-plane FoMs (of up to 60%). The ANZ configuration is elongated in the East-West direction. This results in poorer UV coverage for observations less than 12 hours, and higher side-lobes, which will limit imaging quality due to calibration and difficulties with deconvolution. The elongated beam will limit resolutions at declinations less than ± 30°, a considerable portion of the sky. This makes the RSA configuration significantly better than the ANZ configuration for science that benefits from good instantaneous UV coverage and/or high level of calibration accuracy. In conclusion, for programs needing only the central area, the two sites are nearly equal, with RSA slightly better with respect to simultaneous mutual visibility with telescopes in other parts of the EM spectrum. RSA is significantly better for all high dynamic range and high-resolution observations, and observations where good, short (less than four hours) observations are important. In summary, RSA has a significant advantage. The SSAC vote on this Factor was 6.0 for ANZ and 14.0 for RSA. Factor 6: Physical Characteristics of the Sites Information was provided on environmental aspects (climate; cloud cover, solar radiation, airborne particles; wildlife and land use restrictions; wildfires, seismic hazards), geotechnical aspects, and severe weather. The main area (core plus skirt zones, i.e., < 13 km), the variation along the spiral arms (< 180 km), and the remote sites have been dealt with.

4. Findings and Conclusions
18
For the core and skirt areas, environmental conditions for ANZ and RSA are harsh but acceptable. ANZ records higher temperatures and higher average wind speeds, although still well below critical levels. Maximum wind speeds at the two sites are comparable. Solar radiation is higher in ANZ. No significant problems have been reported with airborne particles, land use restrictions, wildlife, seismic, and wildfire events. Geotechnical conditions (i.e., soil conditions relevant to foundations, water availability; corrosive minerals, soil conductivity, and subsurface temperatures relevant to electrical grounding and data and power cables) are adequate and not different for the two sites. Severe weather events are rare, with occasional flash flooding, for both sites. Both ANZ and RSA make reasonable cases that environmental conditions do not vary significantly between the core and skirt areas and the spiral arms out to 180 km. Geotechnical conditions vary but without consequences for dish foundations or bunkers. Seismic and severe weather events are rare. Conditions at remote stations are less known and more variable than in the central area. However, no discernible differences between the candidate sites exist in this regard, and solutions to overcome adverse conditions, especially flooding and wildfires, can be found at reasonable cost. The SSAC is satisfied with the responses to the concerns raised in a 2006 expert report about conditions in partner countries outside South Africa, some of a geotechnical nature, others having to do with hurricanes. Environmental, geotechnical, and severe weather conditions are acceptable, and the SSAC considers the two candidate sites to be comparable. The SSAC vote on this Factor was 9.7 for ANZ and 10.3 for RSA. Factor 7: Tropospheric Turbulence Propagation path length fluctuations caused by the turbulent structure of the troposphere have been measured at both prospective core SKA sites. Data were acquired with small interferometers, receiving signals near 11 GHz from geostationary communication satellites. Time-overlapping measurements were obtained for June–October 2011. The data indicate that the fluctuations at the ANZ site are 38% stronger than at the RSA site. This result is in good agreement with a ratio of 1.4 expected from the different altitudes of the sites (1080 m in RSA, 372 m in ANZ) for a tropospheric model having a scale height of 2 km. We consider this a significant difference between the sites, the RSA site being clearly advantageous for high dynamic range mapping, particularly at frequencies above 3 GHz. The remote stations are located at an average altitude of about 1000 m for RSA and 350 m for ANZ. Thus, the advantage of the RSA core site for this Factor will extend to the full SKA array. In summary, RSA has a significant advantage for this Factor. The SSAC vote on this Factor was 6.1 for ANZ and 13.9 for RSA.

4. Findings and Conclusions
19
4.2 Other Selection Factors: 8–13 Factor 8: Political, Socioeconomic, and Financial The SSAC concluded that both sites responded appropriately to the RfI, each making a strong case backed by supporting information from third parties. Based solely on the responses, there appears to be very little difference between the two sites on any of the major political, socioeconomic, and financial issues of importance to the SKA, although the SSAC expressed reservations about some of the partner countries in the South African bid. When the SSAC reviewed publicly available data, it became clear that Australia and New Zealand are fully developed countries comparable in all respects to Europe and North America, whereas South Africa is still developing and, although far ahead of most African nations, is generally significantly lower than ANZ in international rankings in political and socioeconomic indicators. South Africa’s partner countries are well behind it in most key metrics. Each site makes its own impressive case for hosting the SKA, and the SSAC agrees that both sites can provide a suitable environment for the SKA on the understanding that the African project would be headquartered, managed, and funded in and through South Africa, as proposed. However, a range of readily available comparative socioeconomic factors plus the proximity of Geraldton’s facilities in Australia to the proposed core provides a significant advantage to Australia/New Zealand over the South Africa consortium in this Factor. The SSAC vote on this Factor was 14.5 for ANZ and 5.5 for RSA. Factor 9: Customs and Excise The SSAC reviewed the various customs systems and duty rates, the excise tax regimes and tax rates, and related issues such as import and export processes that will impact the SKA over its lifetime. A wide range of issues was considered since the SKA involves a large multinational investment of funds, materials, and services, including the provision of scientific and technical equipment, and personnel in various remote locations. The SSAC reviewed the issues presented by the two candidates, including details related to the six diverse RSA member countries; cross-border coordination and logistical issues presented by the RSA proposal; and the diverse customs, excise, and regulatory structures in the two candidate sites. The SSAC also considered the long-standing Australia–New Zealand Closer Economic Relationship Trade Agreement (ANZCERTA) free-trade and economic cooperation agreement (allowing for the free flow of goods, services, and people between the two countries) and the absence of overall free-trade agreements among the six members of the RSA consortium. The

4. Findings and Conclusions
20
SSAC also reviewed the customs, free-trade, economic, and business environments in Australia and New Zealand and considered the written confirmation from the Australian government that there will be no Goods and Services Tax (GST) payable by the SKA in Australia. The SSAC believed the ANZ proposal presented a better customs, excise, tax, and regulatory structure for the construction and operation of the SKA and that siting the SKA in ANZ would be simpler and less costly. We concluded that ANZ has a somewhat better advantage over RSA for this Factor. The SSAC vote on this Factor was 13.3 for ANZ and 6.7 for RSA. Factor 10: Legal The SSAC reviewed the legal issues presented by the two candidate sites with respect to the planned preconstruction, property acquisition, permitting and land entitlement, hiring and employment laws, construction, and operation of the SKA. The SSAC examined the legal and regulatory environments in each site, including the cross-border legal issues. We also considered any relevant treaties and legal agreements in place among members of the RSA and ANZ consortia as well as the potential extent and availability of intellectual property rights (IPR) laws and enforcement. The SSAC concluded that the legal environment for the SKA described in the ANZ proposal was more integrated and established, with fewer cross-border legal issues, and that it presented fewer legal risks for the SKA. Thus, the ANZ site was considered somewhat better than the RSA site for this Factor. The SSAC vote on this Factor was 12.9 for ANZ and 7.1 for RSA. Factor 11: Security
The SSAC examined and assessed security issues and their potential impacts on achieving the scientific goals of the SKA. A broad range of potential impacts was considered: loss of scientific results due to direct disruption during the construction and observational phases of the program, financial losses, and the difficulty of recruiting high-quality staff because of a negative perception of safety in the host country(ies).
The SSAC finds that adequate levels of security can be achieved at both proposed sites if appropriate measures are taken. At both sites, security of buildings at central locations could be achieved using standard practices and equipment. However, significant differences between the two sites exist in regard to security of personnel and security at the remote sites. The SSAC is satisfied that the levels of threats to personnel and to physical infrastructures in Australia are low and that adequate

4. Findings and Conclusions
21
protection measures can be implemented with reasonable efforts and costs. The security environments in South Africa and the partner countries are significantly worse than those of Australia and New Zealand, necessitating additional efforts and costs to the project. Crimes against persons are a significant problem, especially in certain areas. Arranging travel between isolated locations would require special care, given the weaknesses of local law enforcement and other emergency response services. The SSAC is particularly concerned about security in Zambia, Mozambique, and Madagascar. In Mozambique, Madagascar, and Namibia, the situation is aggravated by political instability. If the RSA bid is selected, it is likely that it would be more difficult, but not impossible, to recruit high-quality nonlocal staff.
In conclusion, the SSAC finds that the ANZ site would be characterized by significantly better security than the RSA site and that ensuring adequate security in Australia would be simpler and less costly. It would also most likely be easier to recruit high-quality nonlocal staff for the ANZ site.
The SSAC vote on this Factor was 14.8 for ANZ and 5.2 for RSA. Factor 12: Employment The SSAC agreed that South Africa’s partners in the RSA consortium will have a small effect on this Factor, and so the SSAC concentrated on the situation in South Africa. The SSEC Subcommittee’s report covered most of the ground and raised several questions that were answered in additional candidate replies and in the candidate interviews. The actual employment regimes appear comparable, and salaries appear to be in line with relative costs of living. The pool of skilled labor from which SKA would draw its staff is smaller in RSA. General unemployment in RSA is ~25%, in contrast with ~5% in Australia and New Zealand. The visa and work permit regimes are broadly similar. The SSAC was assured that the staff (and their spouses, partners, and dependents) the SKA would want to bring to either South Africa or Australia would have very little trouble getting visas and work permits. Australia does have quite strict rules on the recognition of professional qualifications, and potential SKA staff would have to study them carefully to understand the impact on their personal circumstances. The income tax regimes are similar, and their detailed impact will depend on individual circumstances. Both ANZ and RSA have double taxation agreements with most countries. Like taxation, pensions are a complex issue whose detailed impact will depend on individual circumstances, and SKA will have to address the pension issues with care. The possibility that the SKA entity could be given a range of rights, privileges, and immunities as an “international organization” by either host country emerged as a real possibility and could be very advantageous in several areas, such as visas and residence permits.

4. Findings and Conclusions
22
The conclusion is that differences related to employment between ANZ and RSA are probably small, but a range of options remains to be explored in detail before the SKA structure is negotiated and established. There is no obvious reason why this should be more difficult in one or the other country, and none of this should pose a real risk to the SKA project. We note that South Africa has social legislation that could influence both staff employment and that of spouses, partners, and dependents, but organizations have seemed to work successfully within this legislation, and so it is seen as having a relatively minor impact on the SKA. Taken overall, ANZ is judged to be somewhat better than RSA because of the larger pool of potential employees, very low unemployment, sustained economic growth, and better opportunities for partners and dependents. The SSAC vote on this Factor was 12.5 for ANZ and 7.5 for RSA. Factor 13: Working and Support Environment Both submissions provided the requested information. For the purposes of this report the SSAC considered, as stated in the RSA response, that non-African personnel would be based in or near Cape Town, South Africa. Perth, Australia, and Cape Town are large modern cities offering a complete range of modern educational, cultural, and financial facilities. They are very comparable as places to live and work, with good international communications. Of the towns closest to the proposed array cores, Geraldton, Australia, is larger and better resourced than Carnarvon, South Africa. A wide range of housing is available to rent or to buy in either major city. Rents in these cities appear to be similar but vary considerably according to location. SKA staff would be expected to use private healthcare, which seems to cost about the same in the two countries. Private healthcare is of an international standard. It is likely that SKA staff will in many cases opt for private schools, where there is a wide range of choice. Both Cape Town and Perth have international schools with multilingual teaching. The SSAC concluded that the two sites are comparable in many respects, although the nearby presence of Geraldton is a benefit in several important ways, allowing staff to live nearer the SKA central site and potentially making it easier to recruit and retain skilled local staff. Important issues such as the cost and availability of housing, access to private healthcare and education, and cultural and social activities seem similar, although poorer in the RSA consortium partners. However, it is not expected that international SKA staff will base themselves for long periods in the remote stations at either site. Taken overall, ANZ is judged as somewhat better than RSA in this Factor. The SSAC vote on this Factor was 12.1 for ANZ and 7.9 for RSA.

4. Findings and Conclusions
23
4.3 Implementation Plans and Costs Factors: 14–17 Factor 14: Infrastructure Despite the wealth of detail in the submissions by the site candidates, the SSAC had to raise supplementary questions answered in, and after, the discussion on 7 December. These were essential in enabling the SSAC to reach its conclusion. The SSAC agrees with the conclusions in the report by Parsons Brinckerhoff. The SSAC was concerned that some aspects of the ANZ proposal would cost more than might have been expected. In response to points raised in the discussion on 8 December, very detailed information was provided by the ANZ delegation that confirms that the temporary and permanent accommodation was specified to an extremely high standard to attract high-quality staff and a more “economical” approach could have been adopted. The SSAC found the comparative cost review carried out by the SKA Project Office invaluable but in the end had to accept that it could not always understand the differences in costs between sections of the two submissions. Apart from the very much higher power costs in ANZ (dealt with under Factor 16), the estimated costs for annual operation and maintenance are virtually the same. Both sites should meet the needs of the SKA, and there are no disabling features. The risk to the project at either site is low. The RSA response has strengths in lower labor and materials costs and the (presumed) availability of accommodation and other facilities in Carnarvon. The weakness is the assumption that Carnarvon can supply the necessary accommodation and infrastructure at very low cost to the SKA. The risk is that this accommodation cannot be delivered and will have to be provided by SKA. The higher specification for the ANZ buildings can be seen as either a strength, in that they would attract high-quality staff, or a weakness, in that they would be significant cost drivers. RSA therefore has a somewhat stronger response and a low level of advantage over ANZ in this Factor. Factor 15: Data Transport Both site candidates have demonstrated the basic capabilities to provide solutions for the transport of data from receivers (central area and remote sites) to the data processor (DP), then to the supercomputer (SC), and on to the worldwide scientific community. But the complexity and size of the central data network (aka, reticulation) are quite likely beyond the experience and competence of current National Research and Education Networks, and capabilities need considerable strengthening.

4. Findings and Conclusions
24
Replacing many components several times during SKA’s lifetime will be necessary. Accessibility thus should guide design and implementation. Total costs of the data system, passive plus active components, may well surpass €1 billion, necessitating serious inquiry of how to save lifetime costs, an example being the RSA proposal to colocate or integrate DP and SC. The SSAC looked at total costs; site candidates either included costs of some active components or were able to provide estimates. Cost estimates for three of the four parts of the data transportation system are quite comparable if the full costs of the DP–SC link to Cape Town and the costs of active components for the MRO–Perth connection are included. RSA costs for connectivity at the remote sites are relatively high, perhaps because of not-yet-mature competitive telecom markets. The SSAC identifies some strengths and weaknesses: • Providing data transport solutions (both capabilities and the legal framework)
from partner countries outside South Africa represents a low to medium potential weakness for RSA.
• The higher costs of connectivity to non-RSA sites are a low to medium level of weakness for RSA.
• If collocation or integration of the DP and the SC is feasible and affordable in RSA and not in ANZ, this will be a medium to high level of weakness for ANZ.
The SSAC concludes that in both ANZ and RSA, the basic capabilities exist to provide solutions for the data transport. But the complexity and size of the central network require additional capability building. The SSAC concludes that, based on the analysis of strengths and weaknesses, RSA has a medium level of advantage over ANZ. Factor 16: Power The candidate sites were asked to provide the general system set-up and basic parameters of the power system to allow assessment and comparison of the power supply arrangements for the candidate sites in terms of technical feasibility and suitability, availability and reliability, capital and operational costs, operational requirements, construction issues, and the impact on RFI. This Factor is a major issue for the SKA because of the high level of power consumption, ~110 MW, specified in the RfI. The risk to the SKA is that providing power system needs of the project will be difficult and/or excessively costly in installation and/or operations. Our conclusion is that both submissions are compliant and will meet the needs of the SKA, but that RSA has two significant strengths. The first is the lower capital investment required to power the array, due to more ready access to grid power. The second is the lower cost for power in South Africa during the operational era.
4. Findings and Conclusions
25
Given the fundamental difference in the ability to provide power from the grid, the SSAC concludes that RSA has a high level of advantage over ANZ. Factor 17: Consolidated Costs This Factor is essentially a composite of Factors 14–16 and should not be considered as an independent Factor. The higher infrastructure costs given by ANZ are largely due to higher building specifications to attract high-quality staff and inherent labor costs and could, in principle, be reduced. The data transport costs are still somewhat uncertain, but the RSA response with the data processor (DP) and supercomputer (SC) collocated gives a medium strength advantage over ANZ. A particular strength of RSA is in the provision of power, because RSA has access to grid-based power distribution whereas ANZ must rely on longer transmission lines and more off-grid generation supply. This advantage is potentially very substantial over the projected lifetime of the SKA. The submissions show that both candidates could successfully host the SKA and that there are no disabling features for either candidate. The principal strengths of the RSA response are lower infrastructure costs, the collocation of the DP and the SC, and the ability to take power from the national grid. The RSA weaknesses are in the connectivity to non-RSA sites and the assumptions that low-cost infrastructure and existing accommodation will be adequate for the SKA’s needs. The SSAC believes that RSA has a high level of advantage over ANZ in the consolidated costs.

4. Findings and Conclusions
26
4.4 Voting Results The SSG defined 17 Factors for the evaluation of the SKA sites. It specified that a vote would be taken for the first 13 Factors, and it further specified the relative weights to be applied to combine the votes to derive the final score. The SSAC decided upon the actual voting scheme in its September meeting and in subsequent discussions in October. It decided to establish a scale that highlighted the relative merits of the two sites. Each Factor received a vote from 1 to 19 for each site. The sum of the two votes in a Factor was required to sum to 20. For example (writing the scores ANZ/RSA), extreme favoring of RSA is 1/19, equal (no discernible difference) is 10/10, and extreme favoring of ANZ is 19/1. The details of this scale are discussed in the Site Evaluation Plan in Attachment 3. There was considerable discussion at the December meeting to establish a common understanding among SSAC members of the meaning of the different levels in the scale. The distribution of votes for each Factor is shown in Figures 4.4-1 and 4.4-2. Note that the bar charts are mirror images of each other because of the sum rule applied. The vote on Factors 1–13 was held at the end of the December meeting after the presentations were heard from the site delegations and discussion of each Factor completed. Additional information in answer to questions was received from site representatives after the December meeting. Additional information was also received from the SPDO on the desktop study of transmitters in the vicinity of remote stations in southern Africa. The SSAC decided by majority vote at the January meeting that the added information was not deemed to significantly change the previous evaluation so as to warrant a revote The mean vote for each Factor is shown in Figure 4.4-3, and the data are tabulated in Table 4.4-1. The final score derived from the Factor-weighted vote is 9.60/10.40 ± 0.09 (in favor of RSA). The robustness and significance of the vote is discussed in detail in Attachment 5.

4. Findings and Conclusions
27
Figures 4.4-1 and 2. Distribution of votes of 12 SSAC members for the RSA and ANZ sites. A score of 10 means no discernible difference between sites. Data shown are mirror images for ANZ and RSA because each Factor voting score sums to 20. For Factor 1 (not shown) all SSAC members voted 10/10.

4. Findings and Conclusions
28
Figure 4.4-3. Bar graph of the ANZ scores (see Figures 4.4-1 and 2) for each of the 13 Factors in Categories A and B. The height of each bar is the weight. The data, with standard errors, are tabulated in Table 4.4-1.

4. Findings and Conclusions
29
4.5 Robustness Summary The robustness of the result of scoring on the Factors in Categories A and B was tested by determining its sensitivity to a variety of tests. These consisted of a number of “what if” alterations to see whether the conclusions could be changed by an alternative set of conditions. The final numerical outcome of the voting was calculated by first calculating the score for each Factor. The weighted average of the Factor votes were then combined to give a final score in favor of RSA: 9.60 ± 0.09 to ANZ and 10.40 ± 0.09 to RSA. The uncertainty quoted is a formal estimate of the standard error of the mean. Its true significance is established by the robustness tests described below. Note that the votes can also be averaged over the Factors to give the weighted vote for each SSAC member. This distribution of votes is shown in Figure 4.5-1. The statistical behavior of voting patterns was examined by combining all individual scores after normalizing for the means and standard deviations of the Factor votes, yielding the results in Figure A4.5-2. The results are consistent with a Gaussian distribution. The robustness tests applied to individual data points included (1) censorship of data outliers; (2) a bootstrap or resampling analysis of all data; and (3) deletion of voting members, one at a time. In all of these tests, there was no significant variation in the result, with ANZ scores* varying from 9.51 to 9.69 overall, with uncertainties similar to that for the unaltered data. The individual weights of RFI Factors 2, 3, and 4 were constrained by the ToR to have a sum of 0.27, so that the SSAC was free to vary this from the adopted value of 0.09 for each. Cycling through permutations of 0.03/0.12/0.12 produced 9.47, 9.56, and 9.76, i.e., no significant change. Although a variation in the specified ratio of 0.75/0.25 for Factor groups A/B was not under the control of the SSAC, the ratio was varied to show its importance in the overall outcome any imbalance. A hypothetical change of the weight to 0.66/0.34 would make the vote a tie. The broad conclusion was that the final result obtained from the scores is significant and robust and not the consequence of some peculiarity of the voting procedure or voting body.
* Hereinafter, a single score refers to the ANZ scale. The scale for RSA is given by: RSA (scale) = 20 – ANZ (scale).
4. Findings and Conclusions
30
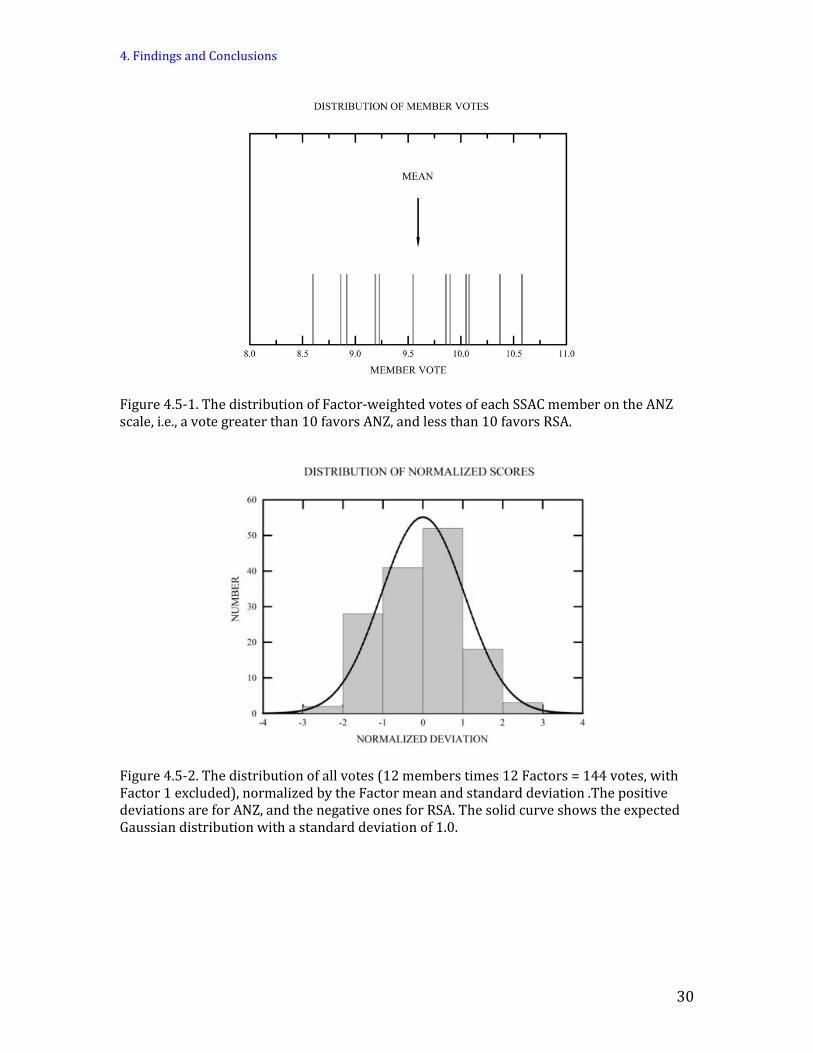
Figure 4.5-1. The distribution of Factor-weighted votes of each SSAC member on the ANZ scale, i.e., a vote greater than 10 favors ANZ, and less than 10 favors RSA.
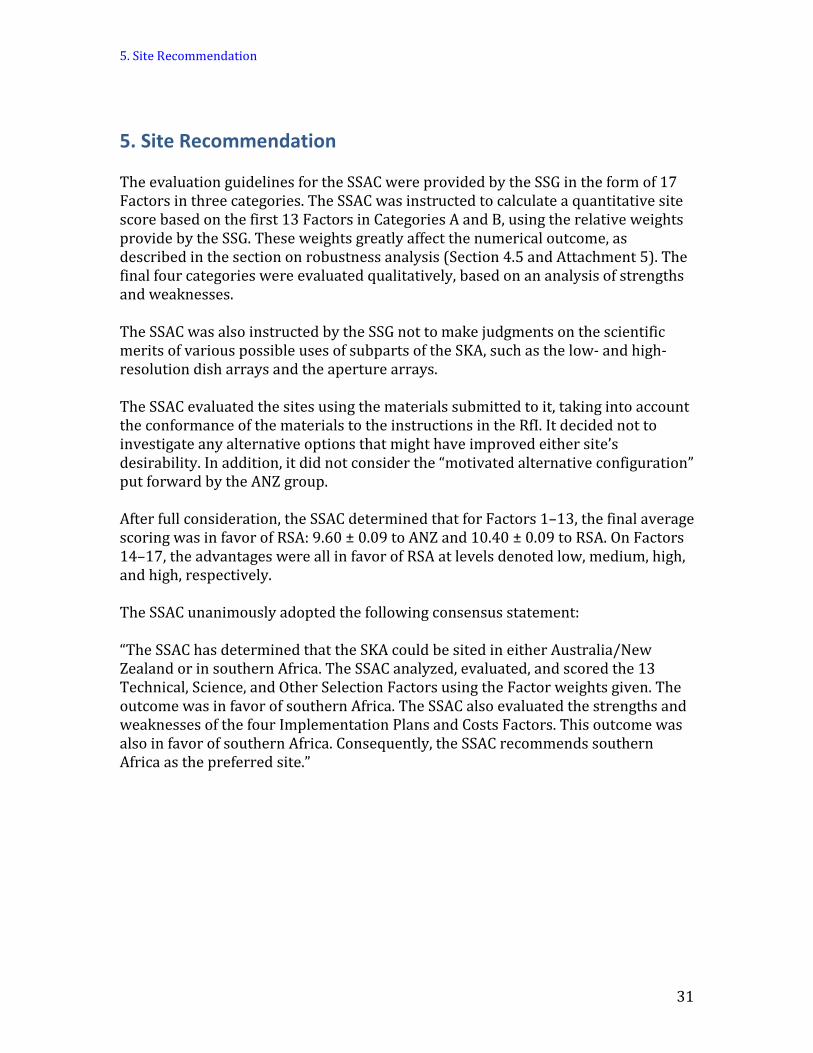
Figure 4.5-2. The distribution of all votes (12 members times 12 Factors = 144 votes, with Factor 1 excluded), normalized by the Factor mean and standard deviation .The positive deviations are for ANZ, and the negative ones for RSA. The solid curve shows the expected Gaussian distribution with a standard deviation of 1.0.
5. Site Recommendation
31
5. Site Recommendation The evaluation guidelines for the SSAC were provided by the SSG in the form of 17 Factors in three categories. The SSAC was instructed to calculate a quantitative site score based on the first 13 Factors in Categories A and B, using the relative weights provide by the SSG. These weights greatly affect the numerical outcome, as described in the section on robustness analysis (Section 4.5 and Attachment 5). The final four categories were evaluated qualitatively, based on an analysis of strengths and weaknesses. The SSAC was also instructed by the SSG not to make judgments on the scientific merits of various possible uses of subparts of the SKA, such as the low- and high-resolution dish arrays and the aperture arrays. The SSAC evaluated the sites using the materials submitted to it, taking into account the conformance of the materials to the instructions in the RfI. It decided not to investigate any alternative options that might have improved either site’s desirability. In addition, it did not consider the “motivated alternative configuration” put forward by the ANZ group. After full consideration, the SSAC determined that for Factors 1–13, the final average scoring was in favor of RSA: 9.60 ± 0.09 to ANZ and 10.40 ± 0.09 to RSA. On Factors 14–17, the advantages were all in favor of RSA at levels denoted low, medium, high, and high, respectively. The SSAC unanimously adopted the following consensus statement: “The SSAC has determined that the SKA could be sited in either Australia/New Zealand or in southern Africa. The SSAC analyzed, evaluated, and scored the 13 Technical, Science, and Other Selection Factors using the Factor weights given. The outcome was in favor of southern Africa. The SSAC also evaluated the strengths and weaknesses of the four Implementation Plans and Costs Factors. This outcome was also in favor of southern Africa. Consequently, the SSAC recommends southern Africa as the preferred site.”

Abbreviations and Acronyms
32
Abbreviations, Acronyms, and Symbols AA aperture array AAA Astronomy Advantage Area (RSA) AAlow Aperture Array – low frequency (nominally 70–500 MHz) – aka AA2 AAmid Aperture Array – mid frequencies (nominally 0.5–10 GHz) – aka AA1 AARNet Australia Academic and Research and Education Network
(a nonprofit company with limited shares; the shareholders are 37 Australian universities and CSIRO)
AGA Act Astronomy Geographic Advantage Act (RSA) ALMA Atacama Large Millimeter/submillimeter Array (Chile) AM (report) Analysys Mason report ANZ Australia–New Zealand (response to RfI) ANZCERTA Australia–New Zealand Closer Economic Relationship Trade
Agreement ASKAP Australian SKA Pathfinder ASTRON ASTRonomisch Onderzoek in Nederland (Dutch) (English:
Netherlands Institute for Radio Astronomy) ATA Allen Telescope Array ATCA Australia Telescope Compact Array Auger large international cosmic ray detector array (Argentina and USA) AUI Associated Universities Inc. (USA) central area the portion of the generic SKA configuration within a 180-km
radius, as defined in the Request for Information CERN LHC Large Hadron Collider, European Organization for Nuclear
Research (Switzerland) core the portion of the generic SKA configuration within 500 m of the
center, as defined in the Request for Information CSIRO Commonwealth Scientific and Industrial Research Organisation
(Australia) D baseline length D243 dish array of 243 stations (25 remote stations of 24 dishes each
and 218 groups of 11 dishes each in the central stations) D2400 dish array within 180 km, consisting of 2400 dishes dB decibel (ten times the logarithm to the base 10 of two power
quantities) dBW/Hz watts per hertz in logarithmic units. Note that the ITU threshold
recommendation for interference to VLBI is –230 dBW/Hz. DOE Department Of Energy DP data processor DR dynamic range

Abbreviations and Acronyms
33
E elevation angle EEJ Equatorial ElectroJet EIA Environmental Impact Assessment ELTs extremely large telescopes: the next generation of optical telescopes EMI electromagnetic interference (broadband interference):
interference inadvertently emitted by machinery and appliances EoR epoch of reionization ESO European Southern Observatory EUREKA a Europe-wide network for market-oriented industrial R&D and
innovation EVN European VLBI network f frequency of radio emission (Hz) FAST Five-hundred-meter Aperture Spherical Telescope (China) FB (SKA) Founding Board (now superseded by GB) FM frequency modulation FoM figure of merit GB (SKA) Governing Board generic SKA the distribution of collecting area for the SKA by distance from the configuration array center (see figure below from the RfI)
Generic SKA configuration. The numbers in the rings are the percentage of dishes in each region in the dish array. In addition to the regions marked, there is also the skirt region (the inner part of the mid region between 2.5 and 13 km) and the central region (core, inner, and mid regions, but excluding the remote region).

Abbreviations and Acronyms
34
GMRT Giant Metrewave Radio Telescope (India) GPS global positioning system GSF Global Science Forum GSM global system for mobile communications GST Goods and Services Tax h vertical height h0 atmospheric scale height H-component horizontal component of a vector quantity, for example, of a
geomagnetic field HDI Human Development Index HEP high-energy physics HMO Hermanus Magnetic Observatory (RSA) inner the portion of the generic SKA configuration between 500 and
2500 m, as defined in the Request for Information IPR Intellectual Property Right IRAM Institut de Radioastronomie Millimétrique (France) IRI International Reference Ionosphere ISIR Ionospheric Scintillation Impact Reports ISSAC International SKA Site-selection Advisory Committee (2006) ITU International Telecommunication Union KAT Karoo Array Telescope (RSA) KCAAA Karoo Central Astronomy Advantage areas KPMG KPMG LLP, audit, tax and advisory firm KSG Kroll Security Group (performed security analysis for SPDO) LOFAR LOw Frequency ARray (The Netherlands) LMT Large Millimeter Telescope (Mexico and USA) Madrigal Worldwide Web–based database of ionospheric data MeerKAT “More” Karoo Array Telescope (RSA) mid the portion of the generic SKA configuration between 2.5 and
180 km, as defined in the Request for Information mJ millijoule MRO Murchison Radio-astronomy Observatory (Australia) MWA Murchison Widefield Array (Australia) NASA National Aeronautics and Space Administration (USA) NRAO National Radio Astronomy Observatory (USA) NREN National Research and Education Network (Internet service provider) NSF National Science Foundation (USA) NWRA North West Research Associates Inc. (USA)

Abbreviations and Acronyms
35
OECD Organisation for Economic Cooperation and Development (France)
PAPER Precision Array to Probe the Epoch of Reionization (USA) PSF point-spread function remote the portion of the generic SKA configuration between 180 and
3000 km, as defined in the Request for Information RFI radio frequency interference (usually from narrowband transmitters) RfI Request for Information RfP (SKA) Request for Proposals 2004 RQZ Radio Quiet Zone RSA Southern Africa (response to RfI) SAA South Atlantic Anomaly SANReN South African National Research Network, operated by TENET,
the Tertiary Education and Research Network, of South Africa SC supercomputer SEA Southern Equatorial Anomaly SETI Search for Extraterrestrial Intelligence SKA Square Kilometre Array skirt the portion of the generic SKA configuration between 2.5 and
13 km, as defined in the Request for Information SPDO SKA Program Development Office SPO SKA Project Office (successor to the SPDO) spread F specific layer in the Earth’s ionosphere SSAC SKA Site Advisory Committee SSEC SKA Science and Engineering Committee SSG SKA Siting Group TEC total electron content (of ionosphere) TECU total electron content unit = 1016 electrons/m2 TID traveling ionospheric disturbance ToR terms of reference TTCPREA Trans-Tasman Court Proceedings and Regulatory Enforcement
Agreement UHF ultra-high frequency UV baseline coordinates in the plane perpendicular to the source
direction; relevant to mapping with interferometers UVGAP fractional gap in the UV-plane spacing of an array, denoted by
∆U/U; a critical Figure of Merit VHF very high frequency VLA Very Large Array (USA) VLBI Very Long Baseline Interferometry

Abbreviations and Acronyms
36
VLT Very Large Telescope (Chile) VTEC Vertical total electron content WA Western Australia WBMOD wideband ionospheric scintillation model developed by NWRA WSRT Westerbork Synthesis Radio Telescope (The Netherlands) Z-component vertical component of a vector quantity

Attachment 1. SSAC Biographies
37
Attachment 1. SSAC Biographies Subramaniam Ananthakrishnan, MTech (radio physics and electronics), PhD (physics–radio astronomy), Bombay University, India, 1976. Worked for more than 40 years with the radio astronomy group of the Tata Institute of Fundamental Research (TIFR), which set up the Ooty and GMRT telescopes. He retired as Observatory director (2004) and senior professor (2007). He was also involved in the SKA project in its engineering evaluation and site evaluation committees until 2006. Presently an adjunct professor of electronic science at the University of Pune. His interests include antennas, electromagnetics, and communication systems, and he is involved in many major national projects in India, such as ASTROSAT (X-ray and UV payloads), a 3.6-m optical telescope, a 2-m National Large Solar telescope, and a 21-m gamma-ray telescope. He is currently one of the vice presidents of URSI; he received the International INSA Vainu-Bappu Memorial Award in 2010 for his outstanding contributions in the setting up of the Ooty and GMRT instruments. Email: [email protected] Jacob (Jaap) W.M. Baars obtained the Ir and Dr.Ir degrees in physics at Technical University Delft, the Netherlands in 1963 and 1970, respectively. His career has been devoted to radio astronomy, in particular to the creation of advanced radio telescopes. He participated in the construction and operation of the Westerbork telescope, acting as station manager for several years. In 1975, he joined the Max-Planck-Institute for Radio Astronomy (MPIfR) in Bonn, Germany, to head the Division of Millimeter Technology, where he acted as project manager for the IRAM millimeter telescope in Spain and the submillimeter telescope in Arizona. On leave from the MPIfR, he participated in the early phase of the Mexican–USA Large Millimeter Telescope (LMT) before joining the ALMA group at ESO, where he acted as system engineer and member of the executive management team. In retirement, he is emeritus scientist at MPIfR, member of the LMT Supervisory Committee and the SKA International Engineering Advisory Committee, and consultant to ESO for ALMA. Email: [email protected] Jocelyn Bell Burnell, PhD (radio astronomy), Cambridge, UK (pulsars), followed by gamma-ray, X-ray, IR, and mm-wave astrophysics. Built 81.5-MHz radio telescope, gamma-ray instrumentation, and at Royal Observatory Edinburgh managed early JCMT instrumentation program. Fellow of the Royal Society and Foreign Associate of the (U.S.) National Academy of Sciences. Received the Royal Society Faraday Medal for science communication in 2010. Served as chair of department (Open University) and dean of science (University of Bath). Now officially “retired” and a visiting professor at University of Oxford, Astrophysics. Email: [email protected]

Attachment 1. SSAC Biographies
38
Willem N. Brouw obtained his astronomy degrees from Leiden University. After a few years as scientist at Leiden Observatory, he was director of the Netherlands Foundation for Radio Astronomy (forerunner of ASTRON) for many years, then spent 13 years at CSIRO Australia Telescope National Facility before returning to a chair at Groningen University. He is now in active retirement working at Groningen University and ASTRON. His science has concentrated on data processing for interferometry, and he wrote the software for WSRT and Fleurs and was involved in CASA. He has been on council/board for ESO, FAST(ESA), JCMT, ING, EVN, and others; and on review/advisory boards for FAST(CN), ATCA, ALMA, MeerKAT, LOFAR, NOW, and others. He has a longtime connection with the SKA, as a member of the SKA ISSAC from its inception, and its secretary in 2004–2007. He was a member of the first SKA site selection committee. Email: [email protected] Ian Corbett, D.Phil., experimental particle physics, Oxford University, 1965, research fellow at Oxford until 1970, followed by research in particle physics at CERN and Rutherford Appleton Laboratory until 1984. Head of Applied Science Division at Rutherford Appleton Laboratory until 1989, then director of astronomy and particle physics for the UK Science and Engineering Research Council until 1994, then deputy chief executive and director of science for the Particle Physics and Astronomy Research Council until 2001. Moved to European Southern Observatory (ESO) as head of administration and then deputy director general until retirement at end of 2006. Active in many international astronomy projects in 1985–2007. Chaired two OECD Global Science Forum Working Groups 1998–2004. Assistant general secretary of the International Astronomical Union in 2006–2009 and now general secretary 2009–2012. Email: [email protected] James Crocker is vice president and general manager of Sensing and Explorations Systems at Lockheed Martin Space Systems Company. He has the following degrees: bachelor of electrical engineering (EE), Georgia Institute of Technology; MS EE, University of Alabama, Huntsville. Masters Management, Johns Hopkins University. While head of programs at the European Southern Observatory (ESO), he directed planning and development of the Paranal Observatory. He was the program manager for the development of the Sloan Digital Sky Survey. At the Space Telescope Science Institute, he was the head of the Programs Office, leading the Institute’s efforts to prepare for launch and operations of the Hubble Space Telescope. He has 40 years’ experience in development and management of large complex installations and systems for scientific missions world wide. Email: [email protected] Thomas Garvin, Thomas F. R. Garvin P.C., received his juris doctor degree from the University of California, Hastings College of the Law and has practiced international business law since 1979, initially at a large international law firm in Los Angeles before forming Thomas F.R. Garvin, A Professional Law Corporation, in 1997. He has

Attachment 1. SSAC Biographies
39
experience in a variety of international transactions and projects and the interrelationship of the diverse issues that may be involved in a project or transaction (for example, relevant legal issues, financial requirements and restrictions, customs and tax matters, visa and employment law issues, land use and other project entitlement issues, intellectual property and technology law issues, securing governmental and other consents, the provisions for infrastructure and logistics support, regulatory issues, construction and preconstruction issues, etc.). He has since 1979 worked on numerous international transactions, including projects in the following industries: real estate, technology, intellectual property rights, financial services, film and television. He is the past chair of the Intellectual Property and Law Committee of the International Bar Association, past chair of the Taxation Section of the State Bar of California, and past chair of the International Law Section of the Los Angeles County Bar Association. Email: [email protected] Stefan Michalowski is head of the secretariat of the Global Science Forum (GSF) at the Organisation for Economic Cooperation and Development in Paris, an intergovernmental committee that addresses science policy issues (www.oecd.org/sti/gsf). He has an undergraduate degree in astronomy from Carleton College and a PhD in elementary particle physics from Cornell University. As executive secretary of the GSF, Michalowski has provided administrative support and substantive input for the Forum’s activities in the areas of astronomy, nuclear physics, neutron and synchrotron sources, high-energy physics, neutrino physics, astroparticle physics, radio spectrum management, grid computing, industrial mathematics, high-intensity lasers, and many others. He is the author of the recent GSF report, “Establishing Large International Research Infrastructures: Issues and Options” (www.oecd.org/dataoecd/17/22/47027330.pdf ). In recent years, he has been a member of site assessment panels for the International Neuroinformatics Coordinating Facility, the Global Earthquake Model, and the Scientific Collections consortium, chairing the last two panels. Email: [email protected] James M. Moran is the Donald H. Menzel Professor of Astrophysics, Harvard University, and senior radio astronomer, Smithsonian Astrophysical Observatory. He has been an active radio astronomer for more than 40 years. With A. Richard Thompson and George W. Swenson, he coauthored Interferometry and Synthesis in Radio Astronomy (1st and 2nd eds.). From 1984 to 2005, he was heavily involved in the site selection, design, and construction of the Submillimeter Array on Mauna Kea and was the project director from 1995 to 2005. He was a member of the International SKA Site-selection Advisory Committee in 2006. In 2006–2011, he was chair of the Department of Astronomy, Harvard University. He is a member of the boards of trustees of the Northeast Radio Observatory Corporation (chair, 2009–), Associated Universities Inc. (ALMA oversight committee, 2008–; executive committee, 2010–; NRAO director search committee, 2011–2012), and the Murchison Widefield Array Project (chair, 2009). He is a member of the (U.S.)

Attachment 1. SSAC Biographies
40
National Academy of Sciences and the American Academy of Arts and Sciences (AAAS). He was awarded the Rumford Prize of the AAAS in 1971 for his role in the development of very long baseline interferometry. Email: [email protected] Ernest R. Seaquist is professor emeritus in the department of astronomy and astrophysics at the University of Toronto. His research career in radio astronomy spans more than 45 years, with specialties in stellar radio emission and starburst galaxies. He served as department chair for 11 years, as president of the Canadian Astronomical Society, and on many national and international committees, including the International SKA Site-selection Advisory Committee in 2006. He served as a panel member for both the current and previous decadal plans for Canadian astronomy and chaired the midterm review of the 2000 decadal survey in 2005. He is currently executive director designate of the Association of Canadian Universities for Research in Astronomy, which promotes the interests of Canadian universities in astronomy. Email: [email protected] Peter Tindemans, PhD, theoretical physics, Leiden University, 1975, works largely in science, technology and innovation policy, beginning as program coordinator for the first comprehensive Dutch Innovation Policy in 1979. From 1991 until 1998, he was responsible for overall research and science policy in the Netherlands. He was involved in key European initiatives such as EUREKA (member, High Level Group), COSINE for establishing the first pan-European data networking backbone (chair, Policy Group, 1987–1991) and global efforts such as the OECD Megascience Forum (chair, 1992–1999). Since 1999, he has worked independently with, for example, the World Bank, UNESCO, and (regional) governments in Africa, Latin and Central America, Europe, and Asia on science, technology, and innovation policies. From 2000 to 2010, he was chair of the successive European steering bodies for the European Spallation Source (ESS), a 1.4 billion € neutron facility, and a member of the 2008 Site Review Group for the ESS. Email: [email protected] Jacqueline van Gorkom received her PhD from the Kapteyn Institute (Groningen) using the WSRT. She was a member of the scientific staff at the National Radio Astronomy Observatory in Socorro from 1980 to 1988. Since then she has been Professor of Astronomy at Columbia University, where she was department chair for 7 years. Her main scientific interest is in gas and galaxy evolution and she has been active in radio astronomy for more than 35 years. She has served on numerous advisory committees, most recently the ASTRON Board. Currently she is a member of the scientific advisory committees of ASTRON and the EVLA. She was also a member of the SKA site selection committee in 2006. Email: [email protected]

Attachment 1. SSAC Biographies
41
Roger Brissenden earned a BSc (First Class Honors) in physics from the University of Adelaide, Australia (1985), and a PhD in astronomy from the Australian National University (1990). He is deputy director of the Harvard-Smithsonian Center for Astrophysics. He also serves as the manager of the Chandra X-Ray Center and oversees the operation of the Chandra X-Ray Observatory mission. Brissenden’s scientific interests include broadband spectral energy distributions of extragalactic X-ray sources and developing the foundations for the National Virtual Observatory, a “seamless digital sky.” He has been a member and chair of the NRAO visiting committee as well numerous committees for NASA, NSF, and DOE, with a focus on the operations of present and future space- and ground-based astronomy telescopes Email: [email protected]

Attachment 2. SSAC ToR
42
Attachment 2. SSAC ToR
Terms of Reference
and Rules of Procedure
for the SKA Site Advisory Committee (SSAC)
Terms of Reference The SKA Founding Board (FB), with the agreement of the SKA Science and Engineering Committee (SSEC), has established the SKA Site Advisory Committee (SSAC). The SSAC is tasked with reviewing the data and information obtained on the candidate sites, assessing reports by expert panels and consultants, carrying out an evaluation of the strengths and weaknesses of the sites, and formulating a recommendation on a preferred site for the SKA. The report and recommendation from the SSAC will be submitted to the SKA Siting Group (SSG). Following validation of adherence to the agreed process by the SSG, the report and recommendation will be transmitted to the SKA Governing Board which will make the site decision. The time line to the decision on the SKA site is given in Attachment 1. In chronological order, the SSAC shall:
1. Prepare a plan by which the data/information and reports from the candidate sites, expert panels and consultants will be evaluated. Submit the evaluation plan to the SSG for approval, which will in turn obtain concurrence with the plan from the Founding Board/Governing Board.
2. Assess the available data/information and reports from the candidate sites, expert panels and consultants.
3. Evaluate the strengths and weaknesses of the data/information on the selection factors, including the implementation plans and the infrastructure and operations related costs.
4. Based on the evaluation, prepare a report that provides the basis for the recommendation on a preferred site.
5. Recommend a preferred site for SKA. 6. Transmit the report and recommendation to the SSG, which will validate that the
agreed process has been followed and transmit the report/recommendation to the SKA Governing Board.
The site recommendation from the SSAC must be based on the material with which it is provided on the Science and Technical Selection Factors, the Other Selection Factors, and on the Implementation Plans and Costs. This material is supported by reports of expert panels, consultants, the SKA Program Development Office (SPDO), and a Subset of the SSEC.

Attachment 2. SSAC ToR
43
Contained in the Terms of Reference for the SSG is the statement: “The analysis and evaluation should be open to a variety of site selection solutions, if the data and information support them.” This statement should be a working premise for the SSAC, but with emphasis on the dictum that however the recommendation is formulated it must be based on the data and information in the material with which the SSAC is provided.
Rules of Procedure The SKA Founding Board/Governing Board is the final authority over the SSAC. It has delegated to SSG the role of managing and overseeing the SSAC’s assessment and evaluation process to facilitate the work of the SSAC and to ensure compliance with the process that has been agreed by the Founding Board and the SSEC. Structure and Membership Members of the SSAC are appointed by the SKA Founding Board (FB) with the concurrence of the SKA Science and Engineering Committee (SSEC). The Chair is appointed by the FB with the concurrence of the SSEC. The members are selected to ensure appropriate expert coverage of the site selection factors. The members are listed in Attachment 2. Conflicts of Interest Members are required to sign a conflict-of-interest form prior to serving on the Committee. It is not anticipated that any member of the SSAC holds any financial or other material interest in the decision on a preferred site for SKA. Should evidence of a conflict arise, the member will notify the SSG for resolution. Functioning
1. The SKA Siting Group (SSG) will have an oversight and monitoring role with respect to the functioning of the SSAC. At least one SSG full member will attend all SSAC meetings and telecon/videocons as observer(s).
2. An Executive Secretary will be available to facilitate the work of the Committee. The Executive Secretary will assist with preparing the evaluation plan, managing documents, preparing meeting agendas, noting and tracking action items, and preparing the report. Meetings may be face-to-face, telecon, and videocon.
3. The Director of the SPDO and other SPDO staff may attend SSAC meetings at the invitation of the Chair.
4. The SPDO will provide the technical secretariat to support the work of the SSAC, and will provide consultation on technical issues and act as the communication channel between the SSAC and the candidate sites.
5. SSAC meetings, telecons, and videocons will be minuted, under the charge of the Executive Secretary. Minutes will be considered confidential to the extent practicable.
6. Deliberations of the SSAC will be confidential to the extent practicable. 7. Before beginning the assessment and evaluation phases, the SSAC will prepare a
plan for evaluation of the material it is to consider. It will submit the plan to the SSG for approval, and the SSG will in turn obtain the concurrence of the Founding Board. The material that is expected to be provided to the SSAC is listed in Attachment 3.

Attachment 2. SSAC ToR
44
8. The SSAC will determine the methods and internal organization by which it will evaluate the materials. These methods will be described in the evaluation plan. The SSAC should consider a multiple criterion decision method for evaluating those factors that lend themselves to numerical scoring. Possible evaluation methods with numerical scoring for the various selection factors are described in Attachment 4.
9. The weights that have been assigned by the SSG, and adopted by the Founding Board and SSEC, to the categories of selection factors and to the individual factors in each category are indicators of the absolute importance of that factor in identifying a preferred site. They are given in Attachment 5. These weights should be used by the SSAC in the evaluation, unless the SSAC justifies doing otherwise with SSG concurrence.
10. If the SSAC performs a numerical comparison of selection factors, it must describe in the report what it considers to be a significant difference in the comparison of the candidate sites.
11. The SSAC should identify any disabling characteristics pertaining to the selection factors relative to any particular site and clearly indicate how these factor into the final recommendation.
12. At this time only one face-to-face meeting of the SSAC is scheduled, but at least one additional meeting is being considered. Telecon/videocons will be scheduled as needed. A detailed schedule for the conduct of business is given in Attachment 6.
Materials to be Considered The SSAC will be provided with information/reports from the Candidate Sites and reports from expert panels, consultants, SPDO, and SSEC. The list of material and the schedule is given in Attachment 3. Interactions with candidate site proponents, governments/government agencies, and others
• The SSAC reports to the SSG. • Proponents of each candidate site will be interviewed by the SSAC at a face-to-face
meeting. This will be the only direct interaction between the SSAC and the candidate site proponents. The site proponent teams for the interviews are expected to be led by the site Resource Liaisons to the SSG. Other communications with the site proponents will be handled through the SKA Program Development Office (SPDO), with the Director of the SPDO as the point of contact, and with copies to SSG.
• There will be no interactions between the SSAC and representatives of governments and/or government agencies on site-related issues for the SKA.
• The SSAC will route any desired communications with the expert panels, consultants, SPDO, and SSEC via the Executive Secretary through the SPDO, with copies to SSG.
• At least one SSG full member will attend SSAC meetings and participate in SSAC telecons as observer(s).
• All material provided to the SSAC is confidential, unless mutually agreed otherwise.
Attachment 2. SSAC ToR
45
Resources
• The SPDO will provide general logistical support and the technical secretariat for SSAC meetings, telecons, and videocons.
• An Executive Secretary will be available to facilitate the work of the SSAC. • The Founding Board/Governing Board will provide travel funds and an honorarium
for the SSAC members and the Executive Secretary to attend meetings and carry out the work of the Committee.
• The SSG will oversee and monitor the work of the SSAC, providing guidance and advice when appropriate.
Time Line The top level time line for the SSAC to conduct its business shows a begin date on 1 September 2011 and an end date on 31 December 2011 with the following components.
1. 1–15 September 2011: Prepare the plan for evaluation. 2. 1 October–15 November 2011: Receipt of material to be evaluated. 3. 1 October–30 November 2011: Assessment and Evaluation of the material. 4. 6–8 December 2011: Meeting of the SSAC (face-to-face). 5. 9–31 December 2011: Write report and recommendation and submit to SSG.
A more detailed schedule for the SSAC is given in Attachment 6. Attachments: 1. SKA Site Selection Time Line 2. SSAC Members 3. Material to be Provided to SSAC and Schedule
4. Consideration of Methods of Evaluation 5. SKA Site Selection Factors and Weights
6. Detailed Time Line for SSAC
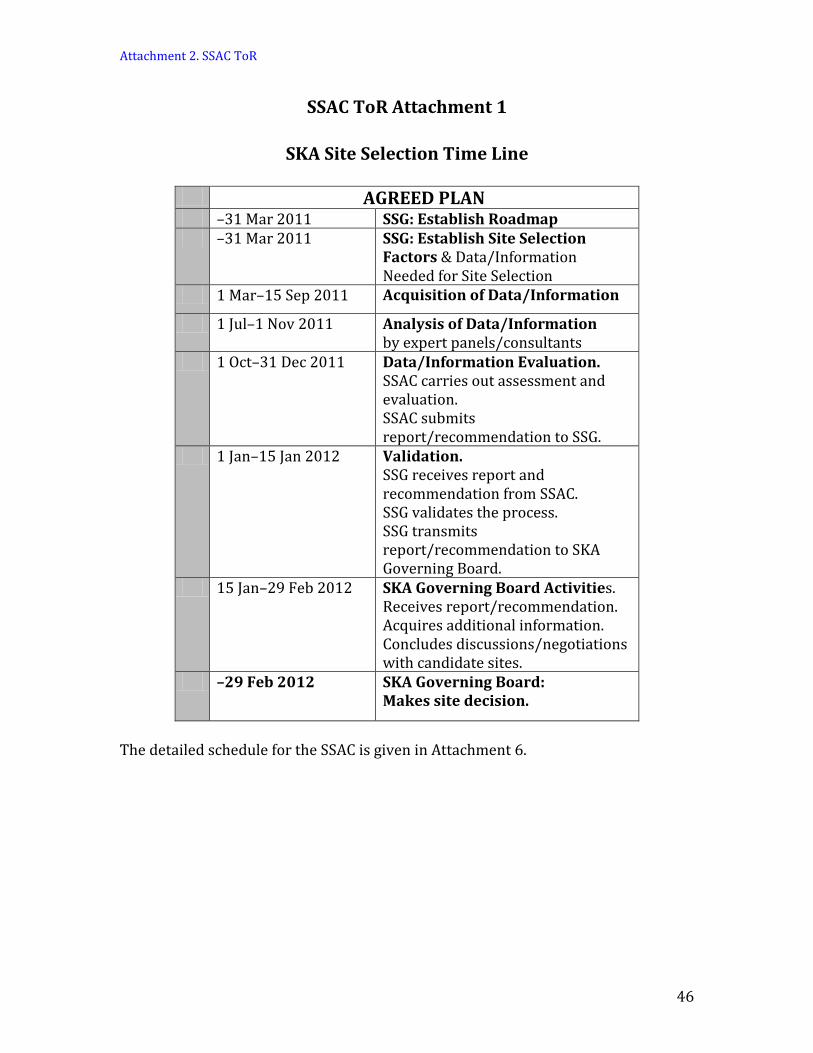
Attachment 2. SSAC ToR
46
SSAC ToR Attachment 1
SKA Site Selection Time Line
AGREED PLAN –31 Mar 2011 SSG: Establish Roadmap –31 Mar 2011 SSG: Establish Site Selection
Factors & Data/Information Needed for Site Selection
1 Mar–15 Sep 2011 Acquisition of Data/Information
1 Jul–1 Nov 2011 Analysis of Data/Information by expert panels/consultants
1 Oct–31 Dec 2011 Data/Information Evaluation. SSAC carries out assessment and evaluation. SSAC submits report/recommendation to SSG.
1 Jan–15 Jan 2012 Validation. SSG receives report and recommendation from SSAC. SSG validates the process. SSG transmits report/recommendation to SKA Governing Board.
15 Jan–29 Feb 2012 SKA Governing Board Activities. Receives report/recommendation. Acquires additional information. Concludes discussions/negotiations with candidate sites.
–29 Feb 2012 SKA Governing Board: Makes site decision.
The detailed schedule for the SSAC is given in Attachment 6.

Attachment 2. SSAC ToR
47
SSAC ToR Attachment 2
SSAC Members James Moran, chair Harvard-Smithsonian Center for Astrophysics USA
Thomas Garvin Thomas Garvin Associates USA
Subramaniam Ananthakrishnan Pune University India
Paul Gilbert* Retired, formerly Parsons Brinckerhoff USA
Jaap Baars Retired, formerly Max-Planck-Institute for Radioastronomy Germany
Stefan Michalowski OECD Global Science Forum France
Jocelyn Bell Burnell Oxford University UK
Ernest Seaquist Retired, University of Toronto Canada
Wim Brouw Retired, formerly Groningen University and ASTRON The Netherlands
Peter Tindemans Formerly Netherlands Ministry of Education and Science and OECD Megascience Forum The Netherlands
Ian Corbett International Astronomical Union UK
Jacqueline van Gorkom Columbia University USA
Executive Secretary: Roger Brissenden Harvard-Smithsonian Center for Astrophysics USA
*Note added on Feb. 10, 2012. Due to personal circumstances, Paul Gilbert had to withdraw from the SSAC before its first meeting and was replaced by James Crocker.

Attachment 2. SSAC ToR
48
SSAC ToR Attachment 3 (2011-09-04; Rev 1)
Material to be provided to SSAC prior to September 8–9, 2011 meeting
SSAC Terms of Reference Approved by FB and SSEC July 2011 SSAC Member CVs SSG Terms of Reference Approved by FB and SSEC October 2010 SSG – Revised Plan for SKA Site Selection Approved by FB and SSEC May 2011 SSG - Request for Information (RfI) from the Candidate Sites
Draft distributed to sites 18 March 2011; Final version to sites 26 June 2011; Rev. 1, 03 September 2011.
SKA Short List Site Selection Materials (2004–2006)
Request for Proposals for Siting the SKA (1 Sep 2004) SKA Siting Evaluation Guidelines (derived from RfP) Proposal for Siting the SKA in Australia (5 Dec 2005) South African Bid to Host the SKA SKA Site Selection Process (5 July 2006) Pair-wise Comparison Spreadsheet Template
Protocols for Site Selection Short List (8 documents; Jan–Feb 2006) ISSC Decision on Short List of Acceptable Sites for the SKA (30 Aug 2006) Report of the International SKA Site selection Advisory Committee, ISSAC (30
Sep 2006)
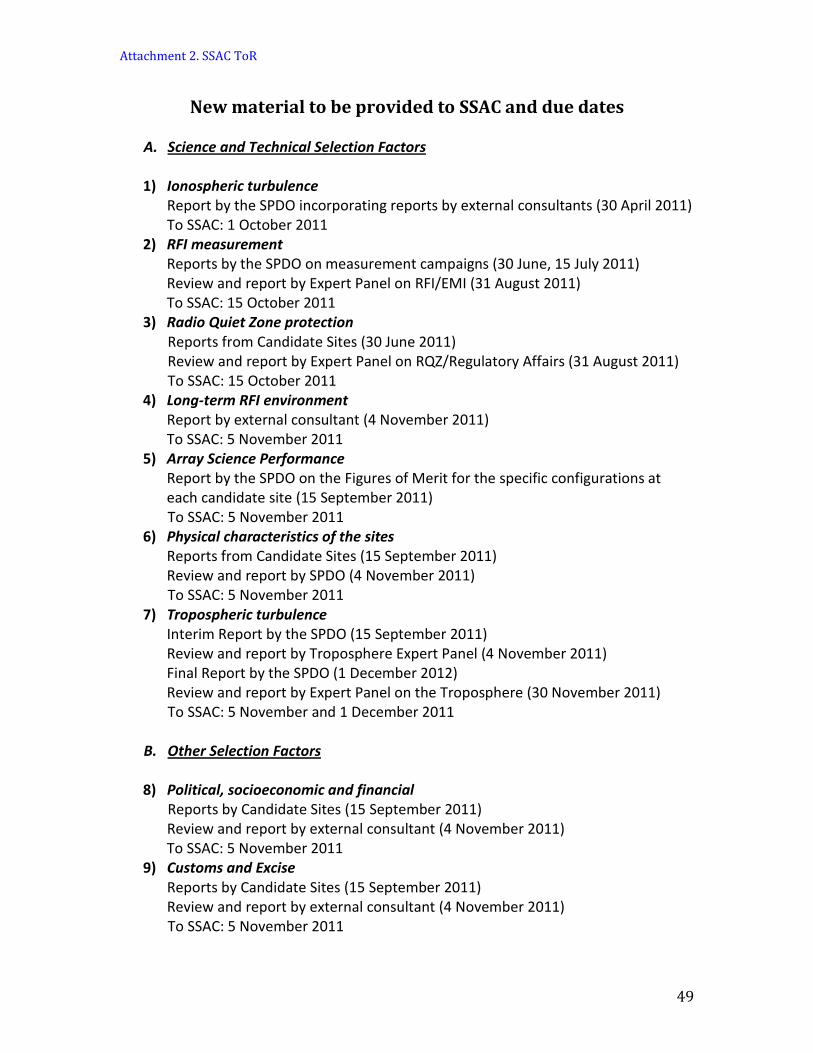
Attachment 2. SSAC ToR
49
New material to be provided to SSAC and due dates
A. Science and Technical Selection Factors
1) Ionospheric turbulence Report by the SPDO incorporating reports by external consultants (30 April 2011) To SSAC: 1 October 2011
2) RFI measurement Reports by the SPDO on measurement campaigns (30 June, 15 July 2011) Review and report by Expert Panel on RFI/EMI (31 August 2011) To SSAC: 15 October 2011
3) Radio Quiet Zone protection Reports from Candidate Sites (30 June 2011) Review and report by Expert Panel on RQZ/Regulatory Affairs (31 August 2011) To SSAC: 15 October 2011
4) Long-term RFI environment Report by external consultant (4 November 2011) To SSAC: 5 November 2011
5) Array Science Performance Report by the SPDO on the Figures of Merit for the specific configurations at each candidate site (15 September 2011) To SSAC: 5 November 2011
6) Physical characteristics of the sites Reports from Candidate Sites (15 September 2011) Review and report by SPDO (4 November 2011) To SSAC: 5 November 2011
7) Tropospheric turbulence Interim Report by the SPDO (15 September 2011) Review and report by Troposphere Expert Panel (4 November 2011) Final Report by the SPDO (1 December 2012) Review and report by Expert Panel on the Troposphere (30 November 2011)
To SSAC: 5 November and 1 December 2011
B. Other Selection Factors
8) Political, socioeconomic and financial Reports by Candidate Sites (15 September 2011)
Review and report by external consultant (4 November 2011) To SSAC: 5 November 2011
9) Customs and Excise Reports by Candidate Sites (15 September 2011) Review and report by external consultant (4 November 2011)
To SSAC: 5 November 2011

Attachment 2. SSAC ToR
50
10) Legal Reports by Candidate Sites (15 September 2011) Review and report by external consultant (4 November 2011) To SSAC: 5 November 2011
11) Security Reports by Candidate Sites (15 September 2011) Review and report by external consultant (4 November 2011) To SSAC: 5 November 2011
12) Employment Reports by Candidate Sites (15 September 2011) Review and report by SSEC Subset (4 November 2011) To SSAC: 5 November 2011
13) Working and Support Environment Reports by Candidate Sites (15 September 2011) Review and report by SSEC Subset (4 November 2011)
To SSAC: 5 November 2011
C. Implementation Plans and Costs
14) Provision and cost of infrastructure components based on the Model SKA Reports from Candidate Sites (15 September 2011) Review and report by external consultant (4 November 2011) To SSAC: 5 November 2011
15) Provision and cost of data transport based on the Model SKA Reports from Candidate Sites (15 September 2011) Review and report by external consultant (4 November 2011) To SSAC: 5 November 2011
16) Provision and cost of electrical power based on the Model SKA Reports from Candidate Sites (15 September 2011) Review and report by external consultant (4 November 2011) To SSAC: 5 November 2011
17) Consolidated costs of capital and operations expenditures Report by the SPDO (18 November 2011) Review by SSAC To SSAC: 18 November 2011
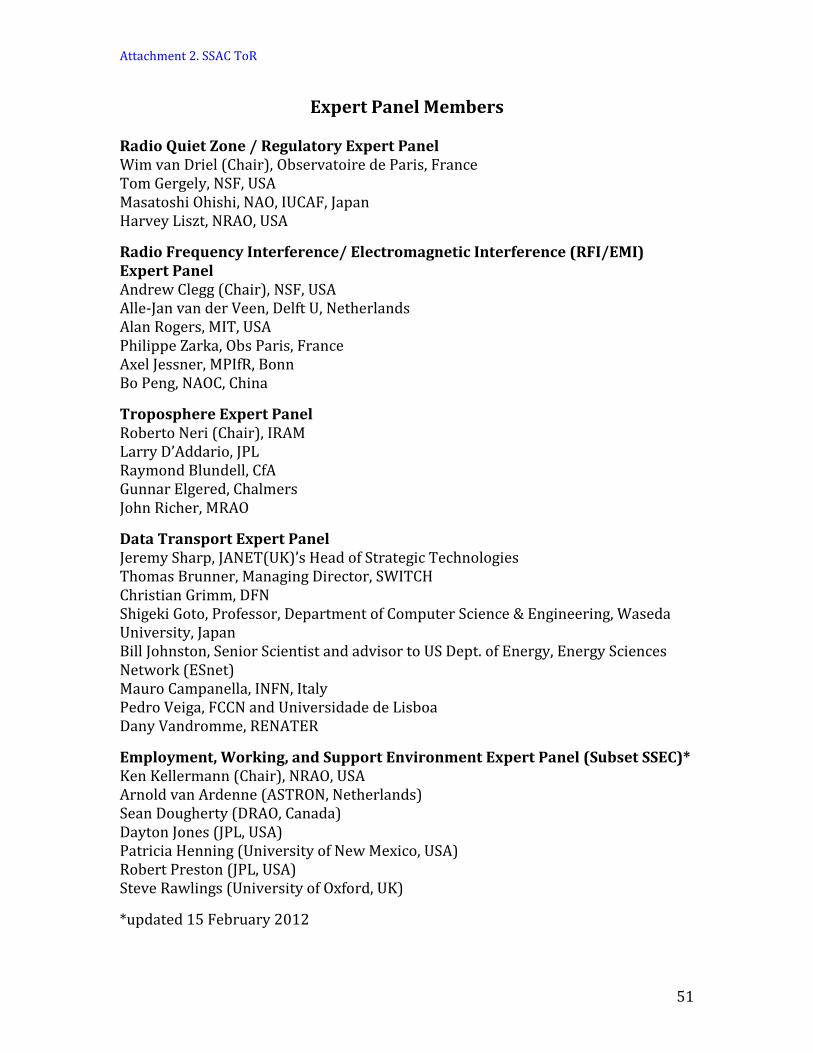
Attachment 2. SSAC ToR
51
Expert Panel Members Radio Quiet Zone / Regulatory Expert Panel Wim van Driel (Chair), Observatoire de Paris, France Tom Gergely, NSF, USA Masatoshi Ohishi, NAO, IUCAF, Japan Harvey Liszt, NRAO, USA Radio Frequency Interference/ Electromagnetic Interference (RFI/EMI) Expert Panel Andrew Clegg (Chair), NSF, USA Alle-Jan van der Veen, Delft U, Netherlands Alan Rogers, MIT, USA Philippe Zarka, Obs Paris, France Axel Jessner, MPIfR, Bonn Bo Peng, NAOC, China Troposphere Expert Panel Roberto Neri (Chair), IRAM Larry D’Addario, JPL Raymond Blundell, CfA Gunnar Elgered, Chalmers John Richer, MRAO Data Transport Expert Panel Jeremy Sharp, JANET(UK)’s Head of Strategic Technologies Thomas Brunner, Managing Director, SWITCH Christian Grimm, DFN Shigeki Goto, Professor, Department of Computer Science & Engineering, Waseda University, Japan Bill Johnston, Senior Scientist and advisor to US Dept. of Energy, Energy Sciences Network (ESnet) Mauro Campanella, INFN, Italy Pedro Veiga, FCCN and Universidade de Lisboa Dany Vandromme, RENATER Employment, Working, and Support Environment Expert Panel (Subset SSEC)* Ken Kellermann (Chair), NRAO, USA Arnold van Ardenne (ASTRON, Netherlands) Sean Dougherty (DRAO, Canada) Dayton Jones (JPL, USA) Patricia Henning (University of New Mexico, USA) Robert Preston (JPL, USA) Steve Rawlings (University of Oxford, UK) *updated 15 February 2012

Attachment 2. SSAC ToR
52
SSAC ToR Attachment 4
Considerations of Methods of Evaluation 1) Pairwise Comparison of the Candidate Sites for S&T and Other Selection
Factors
The Analytic Hierarchy Process (AHP) is a tool to provide as objective a comparison between the Candidate Sites as possible. It is a multicriterion decision support tool that allows a group knowledgeable about the subject to convert its well-informed qualitative judgments into a quantitative structure. It is well suited to a site selection process where many factors are relevant to each site criterion and judgments on complex comparisons need to be quantified. The AHP technique makes pair-wise comparisons of the Candidate Sites with respect to each of the criteria. The method uses the comparison scale given in Table 1 to quantify the relative strengths of the Candidate Sites for the individual Scientific & Technical Selection Factors, and Other Selection Factors. The relative strength of the comparison for a particular selection factor is normalized to unity for each site, then multiplied by the weight for the factor, and the results for all factors are summed. Finally, the results of each set of independent pair-wise comparisons by the individual group members are summed and normalized to unity. The SSAC is encouraged to test the robustness of any analytic comparison by varying the parameters and observing the impact on the result.
Table 1: Relative scoring scale for AHP pair-wise comparison. Reciprocal scores are used for the other site in each comparison.
Comparison Value Equal 1 Somewhat better 3 Definitely better 5 Very much better 7 Overwhelmingly better 9 Even numbers used when cannot decide between adjacent assessments
2, 4, 6, 8
2) Evaluation of the Implementation Plans and Costs
The relatively greater uncertainties in the information on plans and costs compared to S&T and Other selection factors make it inappropriate to apply numerical comparison techniques like AHP based on weights to the plans and costs. In addition, the costs of the implementation plans to the project are likely to be the

Attachment 2. SSAC ToR
53
subject of discussions and negotiations in another forum concerning host country premium. The analysis of the implementation plans and costs for the provision of power and basic infrastructure components will be undertaken by External Consultants (selected in a competitive process). The analysis of the data transport plan will be carried out by an Expert Panel. These analyses will determine the strengths and weaknesses of the particular implementation plan in relation to the Request for Information (RfI) and, for each functional subsystem specified in the RfI, the Consultant/Expert Panel will be required to give their informed opinion on the quality of the response in terms of: • Feasibility of the solution within the context of the site – is the proposed solution
a logically possible proposition? • Credibility of the solution – has the information presented come from a reliable
source with sufficient expertise? • Costs – are they reasonable / comparable with the consultant’s experience of
such implementations in similar environments (percentage over or under estimate, ± %)
• Fit for Purpose – does the proposed implementation deliver the capability that is outlined in the Model of the SKA
• Gaps in the responses to the RfI (or deviation from specification) • Sequencing of the implementation – does the plan facilitate a smooth rollout Risks are to be identified for each of the above areas by the Consultants or Expert Panel using their own judgment and information provided by the Candidate Sites, as well as any additionally identified areas of risk (e.g. assumptions which generate risks, missing factors / considerations, dangers not identified by the site proponents). These risks are to be assessed using a standard five point probability and impact matrix. The SSAC will consider the conclusions of the analyses by the External Consultants and Expert Panel (for Data Transport) in its evaluation of the strengths and weaknesses, feasibility, and achievability of the plans.

Attachment 2. SSAC ToR
54
SSAC ToR Attachment 5
SKA Site Selection Factors and Weights
1. The Request for Information from the Candidate Sites (RfI), reports on the measurement campaigns organised by the SPDO, and other reports generated by the SPDO will provide information on factors affecting the science performance of the SKA, the environment in which the SKA and its staff will operate (political, legal, customs, security etc), and the implementation plans and costs for the basic infrastructure, power provision and data transport. All are important aspects in the site decision. This is a selection between two candidates in terms of site characteristics for the best science, and the capability and cost of supporting a very large infrastructure, taking the political and working environment into account.
2. As noted in Attachment 4, the Science & Technical and Other Selection
Factors lend themselves to analysis by a multiple criterion comparison method based on numerical scoring, whereas the implementation plans and costs, by virtue of the relatively greater uncertainty in the information, are better evaluated in terms of a strengths and weaknesses analysis. Table 2 shows the weights proposed for the main selection categories.
Table 1: Weights for the Three Main Selection Factor Categories
Category Weight % 1. Science and Technical factors 75 2. Other Selection factors 25 3. Implementation Plans and Costs No weight assigned
3. The weights for the individual factors within Science and Technical Factors are shown in Table 2.
Table 2: Weights for the Science and Technical Selection Factors (sum=75%) Factor Weight %
1. Short-term and long-term radio frequency and protection issues
27
2. Array configuration and science performance 17 3. Ionospheric scintillation 21 4. Tropospheric turbulence 5 5. Physical characteristics 5
4. The weights for the individual factors within Other Selection Factors are shown in Table 3.

Attachment 2. SSAC ToR
55
Table 3: Weights for the Other Selection Factors (sum=25%) Factor Weight %
1. Political, socioeconomic, and financial 2 2. Customs and Excise 6 3. Legal 3 4. Security 3 5. Employment 6 6. Working and support environment 5

Attachment 2. SSAC ToR
56
SSAC ToR Attachment 6
Detailed SSAC Schedule The work of the Committee is planned to take place from 1 September to 31 December 2011 in the process outlined below. 1) 1–15 September 2011: Prepare Evaluation Plan The SSAC will prepare its evaluation plan and submit it to the SSG, which will obtain the concurrence of the Founding Board/Governing Board before giving approval to proceed. 2) 1 October–15 November 2011: Receives material to be evaluated The analyses and reports from the Candidate Sites, Expert Panels, external consultants, SPDO, and SSEC will be submitted to the SSG, which will in turn transmit them to the SSAC. 3) 1 October–30 November 2011: Assessment and Evaluation of the material The SSAC will review the responses by the Candidate Sites to the Request for Information together with the reports by Expert Panels, External Consultants and the SPDO containing the expert analyses of the information for the selection factors and the implementation plans and costs (see list of reports in Attachment 3). The SSAC will use these analyses to evaluate each Candidate Site in terms of its strengths and weaknesses before reaching a conclusion on the site recommendation.
As part of its work in this period, the SSAC will determine whether there are questions of clarification to be posed to the individual Candidate Sites in time for the face to face meeting. A deadline of 1 December is set for transmission of the questions to the Candidate Sites. At the end of the analysis stage, in preparation for the formal evaluation process to take place on 7 and 8 December, members of the SSAC may, if they choose, carry out a pair-wise comparison of the two Candidate Sites for the Science and Technical Selection Factors and Other Selection Factors using a system like the Analytic Hierarchy Process (AHP) described in Attachment 5. As also discussed in Attachments 4 and 5, the SSAC evaluation of the implementation plans and costs for the basic infrastructure components, power provision, and data transport will be handled differently from the S&T and Other selection factors. The implementation plans and costs will be analyzed by External Consultants for basic infrastructure and power and an Expert Panel in the case of data transport, following the guidelines described in Attachment 4. These analyses will be in terms of feasibility, achievability, and risk. The SSAC will consider the

Attachment 2. SSAC ToR
57
results of the analyses by the External Consultants and Expert Panel in its evaluation of the plans. 4) 6–8 December 2011: Meeting of the SSAC (face-to-face) A three-day face-to-face meeting of the SSAC is planned on 6, 7 and 8 December to interview the site proponents, complete the evaluation phase, and come to a recommendation on the preferred site. Representatives of the SSG will be in attendance during the meeting, and support will be provided by SPO/SPDO staff. A five-step procedure for the meeting is suggested:
6 December 1) Initial SSAC discussion comprising
i) An overview by the SPDO Director of the materials provided to the SSAC grouped by selection category – Science and Technical, Other, and Implementation Plans and Costs
ii) In the event AHP is utilized, a report by the SSAC Chair on the outcome of the pair-wise comparison process for S&T and Other factors undertaken by members acting collectively.
iii) Discussion on the merits, strengths and weaknesses of the candidate sites for all three selection categories.
6–7 December
2) Half-day interviews with each of the Candidate Sites. Each Candidate Site will make a short presentation which will be followed by discussion of the questions of clarification posed earlier to each site by the SSAC.
7–8 December
3) Comparison of the Candidate Sites against the selection factors and identification of any disabling characteristics.
4) Summarize the strengths and weaknesses for each site in order to provide the motivation for the recommendation on the preferred site.
5) Recommend a preferred site. 5) 9–31 December: Write report and recommendation on the preferred site and
submit to the SSG Following the three-day meeting, the SSAC will write a report containing its recommendation on the preferred site and an analysis of the merits of the two candidate sites. The report will also include supporting documents containing the results of a pair-wise comparison analysis, and a summary of the conclusions of the reports by the expert panels and external consultants. The report and recommendation will be submitted to the SSG by 31 December 2011.

Attachment 3. SSAC Evaluation Plan
58
Attachment 3. SKA SSAC Evaluation Plan1 1. INTRODUCTION The SKA Founding Board (FB), with the agreement of the SKA Science and Engineering Committee (SSEC), has established the SKA Site Advisory Committee (SSAC). The SSAC is tasked with reviewing the material obtained on the Candidate Sites, assessing reports by expert panels and consultants, carrying out an evaluation of the strengths and weaknesses of the sites, and formulating a recommendation on a preferred site for the SKA, or if it is not possible, the SSAC may recommend an alternative solution for study. The Report with recommendation from the SSAC will be submitted to the SKA Siting Group (SSG) for transmission to the FB or its successor, the Governing Board (GB). The SSAC operates under the SSAC Terms of Reference (ToR) (Appendix 5: dated 17 July 2011, with 3 September 2011 update of Attachment 3) and as interpreted and clarified in Appendix 1. This Evaluation Plan describes how the material on and reports from the two Candidate Sites, expert panels and consultants will be evaluated. 2. MATERIAL, FACTORS AND WEIGHTS Material for review consists of RfI responses, expert and SKA Program Development Office (SPDO) or its successor SKA Project Office (SPO) reports, and responses to Candidate Site questions and interviews. The SSAC will consider material for each of the factors given in Table 1 consistent with the factors provided in Attachment 3 of the SSAC ToR (3 September 2011). The factors fall into the following categories: Science and Technical Factors (A), Other Selection Factors (B), and Implementation Plans and Costs (C).
The Science and Technical factors, and Other Selection factors are by their nature amenable to a quantitative evaluation whereas the Implementation Plans and Costs factors by virtue of the relatively greater uncertainty in the information are better evaluated in terms of a strengths and weaknesses analysis (see Appendix 5, Attachment 4). The SSAC will adopt the following weights for the factor categories consistent with Table 1, Attachment 5 of the SSAC ToR (17 July 2011):
1 Approved by SSG on 4 Nov 11; Approved by FB and SSEC on 30 Nov 2011.
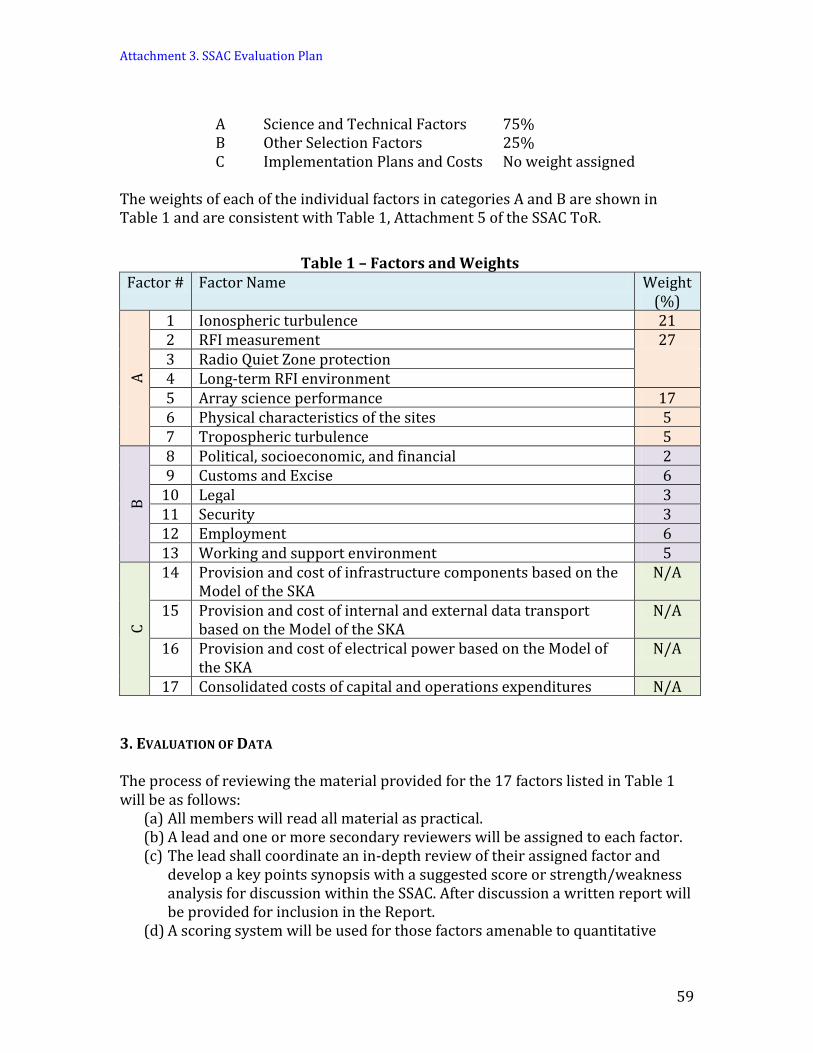
Attachment 3. SSAC Evaluation Plan
59
A Science and Technical Factors 75% B Other Selection Factors 25% C Implementation Plans and Costs No weight assigned
The weights of each of the individual factors in categories A and B are shown in Table 1 and are consistent with Table 1, Attachment 5 of the SSAC ToR.
Table 1 – Factors and Weights Factor # Factor Name Weight
(%)
A
1 Ionospheric turbulence 21 2 RFI measurement 27 3 Radio Quiet Zone protection 4 Long-term RFI environment 5 Array science performance 17 6 Physical characteristics of the sites 5 7 Tropospheric turbulence 5
B
8 Political, socioeconomic, and financial 2 9 Customs and Excise 6
10 Legal 3 11 Security 3 12 Employment 6 13 Working and support environment 5
C
14 Provision and cost of infrastructure components based on the Model of the SKA
N/A
15 Provision and cost of internal and external data transport based on the Model of the SKA
N/A
16 Provision and cost of electrical power based on the Model of the SKA
N/A
17 Consolidated costs of capital and operations expenditures N/A 3. EVALUATION OF DATA The process of reviewing the material provided for the 17 factors listed in Table 1 will be as follows:
(a) All members will read all material as practical. (b) A lead and one or more secondary reviewers will be assigned to each factor. (c) The lead shall coordinate an in-depth review of their assigned factor and
develop a key points synopsis with a suggested score or strength/weakness analysis for discussion within the SSAC. After discussion a written report will be provided for inclusion in the Report.
(d) A scoring system will be used for those factors amenable to quantitative

Attachment 3. SSAC Evaluation Plan
60
assessment (consisting of the items listed as topics/factors in Sections A and B of Table 1). A strengths and weaknesses approach will be used for the factors and issues set forth in Section C of Table 1.
(e) The SSAC will base its recommendation only on the material provided and will not introduce new material. However, the members of the SSAC may submit questions to the SSG, using the process outlined in Section 4 for passing questions to the SPDO, one or more experts, consultants and/or one or both of the Candidate Sites, and may use any material that is provided in response. Material from the site interviews and in response to questions posed during the site interviews may also be used. Appendix 1, 6(d) discusses restrictions on material provided by the Candidate Sites in response to SSAC questions. The SSAC will determine the material that is in or out of scope for use in its assessment and evaluation, and will so note in the Report.
4. SCORING AND OTHER PROCESSES The committee has discussed in detail Decision Making, Communication to SSG and sites, Scoring (i.e., quantitative judgments), Reporting and the nature of the final recommendation in order to achieve an assessment process as clear and transparent as possible. The outcomes, as reported below, need no further explanation, except as regards scoring. The committee felt that the Analytic Hierarchy Process method was well suited to a complex hierarchy of factors applied to a range (>2) of alternatives as was the case in the prior SKA site selection process in 2004–06. With only two candidate sites a straightforward direct comparative scoring system for the factors the factors set forth in Sections A and B of Table 1, is more appropriate. Decision Making. Decisions will be made using the following process:
(i) A quorum of 50% of the committee plus one must participate in an SSAC meeting in order for it to hold a valid meeting;
(j) To participate a committee member must be physically present, on a video call, or on the telephone;
(k) Decisions are made only by participating committee members; (l) Every effort will be made to reach consensus. If no consensus is reached a
vote will be taken; (m) All decisions other than the final site recommendation require a
simple majority subject to quorum; (n) Abstentions are permitted and are not considered to be a vote; (o) In the event of a tied vote it is the responsibility of the chair to steer the
committee to a conclusion; (p) If put to a vote, the final site recommendation requires a positive vote of at
least seven committee members; The Report will document dissenting opinions on the site recommendation.

Attachment 3. SSAC Evaluation Plan
61
Communications. (a) All questions from SSAC members will be sent to the SSG chair (with copy to
the Executive Secretary) who will pass them to the relevant recipient. SSG chair will pass responses to the SSAC members involved (with copy to the Executive Secretary for posting to the SSAC website).
(b) Questions about material on a given factor will only be asked after the SSAC has received the corresponding assessment report[s].
Scoring. The SSAC proposes to apply a straightforward quantitative comparison method to the factors set forth in Sections A and B of Table 1 using the following procedure:
(a) A scale of 1–19 will be adopted to indicate relative strength of each candidate site, with 1 being the lowest score.
(b) A total of 20 points will be allocated between the two alternatives. A discussion of the correspondence between the numerical scores and the perceived impact of a particular factor on the effectiveness of the array is provided in Appendix 4.
(c) For each factor, each SSAC voting member will give a score for each site. (d) Scores will be known by the SSAC committee but individual votes and scores
will not be recorded or disclosed. Aggregate scores will be recorded in the Report.
(e) The average and variance will be recorded for each factor. (f) Scores for each factor will be weighted according to the values provided in
Table 1. A summation of weighted scores will be made for each site, resulting in a combined ranking of the two sites for the factors in Sections A and B of Table 1. The SSAC will provide variances for each factor and will discuss qualitatively their importance when formulating the final recommendation.
The SSAC has agreed that factors listed in Section C of Table 1 will be given serious consideration by the SSAC in the final site recommendation, and that the SSAC will review material from the sites, SPDO, consultants and experts, for implementation, feasibility and cost, assess the strengths and weaknesses for each site, and take these factors into account in development of an overall comparison of the two sites. The following procedure will be used in conducting the strengths and weaknesses assessment:
(a) For each factor listed in Section C of Table 1, a list of strengths and weakness will be developed for each candidate site.
(b) Each strength and weakness for both candidate sites will be assigned a “low,” “medium,” or “high” level of importance based on the judgment of the SSAC. The SSAC will also assess the risk associated with each factor.
(c) Determine based on comparison which site is favored (if any). The SSAC will note any disabling characteristics that may be subject to mitigation.

Attachment 3. SSAC Evaluation Plan
62
The quantitative results for Sections A and B of Table 1 will be considered with the results of the strengths and weaknesses assessment for Section C to determine the final result. Report and Decision
(a) The SSAC will provide a documented report to the SSG on the preferred site. (b) In order to make an optimal, well-grounded recommendation based on the
material provided, the SSAC may possibly need to provide a qualified recommendation of a site. For example, a qualified recommendation may be made if site A is preferred provided a given factor’s shortfall can be mitigated; otherwise site B is preferred.
(c) The SSAC may reach the conclusion that it is not possible to discriminate between the two sites based on the information given.
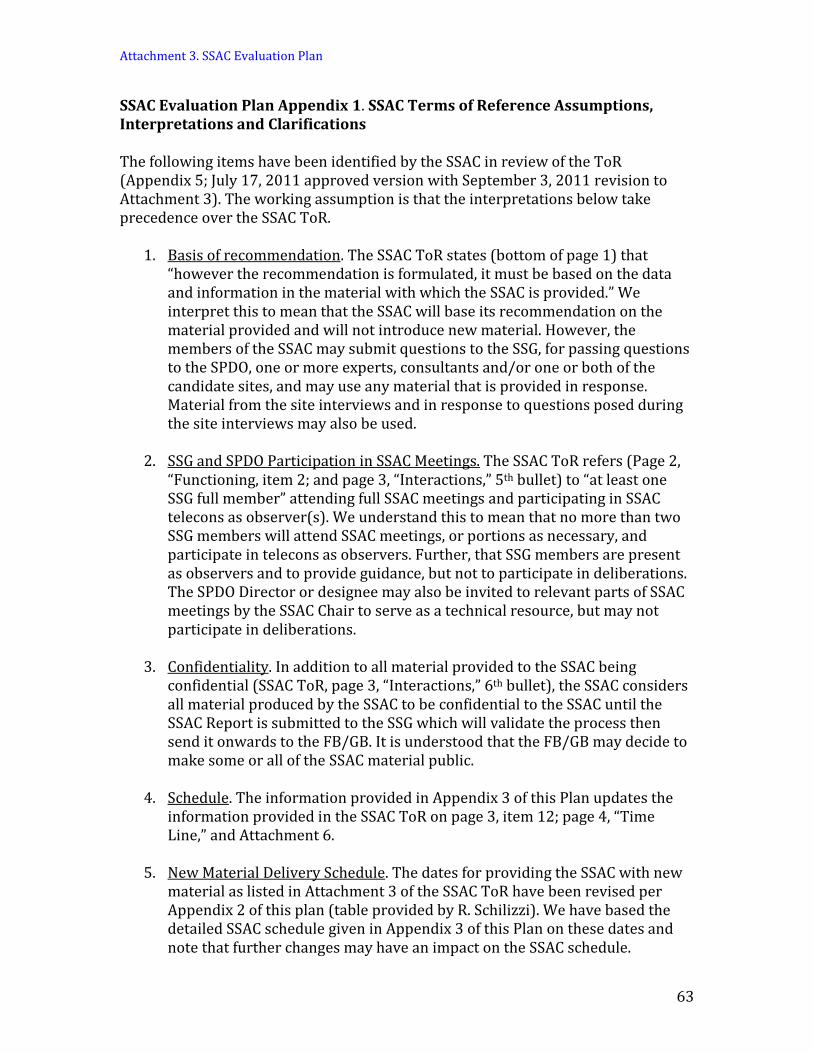
Attachment 3. SSAC Evaluation Plan
63
SSAC Evaluation Plan Appendix 1. SSAC Terms of Reference Assumptions, Interpretations and Clarifications The following items have been identified by the SSAC in review of the ToR (Appendix 5; July 17, 2011 approved version with September 3, 2011 revision to Attachment 3). The working assumption is that the interpretations below take precedence over the SSAC ToR.
1. Basis of recommendation. The SSAC ToR states (bottom of page 1) that “however the recommendation is formulated, it must be based on the data and information in the material with which the SSAC is provided.” We interpret this to mean that the SSAC will base its recommendation on the material provided and will not introduce new material. However, the members of the SSAC may submit questions to the SSG, for passing questions to the SPDO, one or more experts, consultants and/or one or both of the candidate sites, and may use any material that is provided in response. Material from the site interviews and in response to questions posed during the site interviews may also be used.
2. SSG and SPDO Participation in SSAC Meetings. The SSAC ToR refers (Page 2, “Functioning, item 2; and page 3, “Interactions,” 5th bullet) to “at least one SSG full member” attending full SSAC meetings and participating in SSAC telecons as observer(s). We understand this to mean that no more than two SSG members will attend SSAC meetings, or portions as necessary, and participate in telecons as observers. Further, that SSG members are present as observers and to provide guidance, but not to participate in deliberations. The SPDO Director or designee may also be invited to relevant parts of SSAC meetings by the SSAC Chair to serve as a technical resource, but may not participate in deliberations.
3. Confidentiality. In addition to all material provided to the SSAC being confidential (SSAC ToR, page 3, “Interactions,” 6th bullet), the SSAC considers all material produced by the SSAC to be confidential to the SSAC until the SSAC Report is submitted to the SSG which will validate the process then send it onwards to the FB/GB. It is understood that the FB/GB may decide to make some or all of the SSAC material public.
4. Schedule. The information provided in Appendix 3 of this Plan updates the information provided in the SSAC ToR on page 3, item 12; page 4, “Time Line,” and Attachment 6.
5. New Material Delivery Schedule. The dates for providing the SSAC with new material as listed in Attachment 3 of the SSAC ToR have been revised per Appendix 2 of this plan (table provided by R. Schilizzi). We have based the detailed SSAC schedule given in Appendix 3 of this Plan on these dates and note that further changes may have an impact on the SSAC schedule.

Attachment 3. SSAC Evaluation Plan
64
6. Site Delegations and Communications. a. The primary purpose of the interviews with proponents for each site
(SSAC ToR, page 3, Interactions, 2nd bullet) is to provide clarification on material directly related to the 17 factors given in Attachment 3 of the SSAC ToR;
b. The SSAC expects appropriate site delegations to consist of up to four people able to answer questions about all of the material submitted for that site.
c. Other communications between the SSAC and the sites will be facilitated by the SSG.
d. Any questions for the candidate sites may be asked via the SSG prior to the interviews. The SSAC may ask questions about the RfI response as well as closely related topics. These questions will be provided via the SSG to the candidate sites as far as possible seven days prior to the interviews. Additional questions may be asked of the site delegations during the interviews and, if not answerable during the interview, a due date will be provided for responses. No further questions will be asked of the candidate sites after the interview. All material provided in response to SSAC questions should be strictly relevant to the questions asked. Any material deemed not relevant by the SSAC will not be considered.
7. SSAC Members. The following revisions are noted to Attachment 2 of the SSAC ToR. (a) Executive Secretary: Roger Brissenden, Harvard-Smithsonian Center for Astrophysics, Cambridge, USA; (b) the withdrawal of Paul Gilbert from the Committee; (c) the addition of Jim Crocker as a replacement member for Paul Gilbert.
8. Quantitative Assessment Approach. The committee felt that the Analytic Hierarchy Process method discussed in the SSAC ToR was well suited to a complex hierarchy of factors applied to a range (>2) of alternatives. For example, the method was used effectively in the prior SKA site selection process in 2004–06. In the present case of only two candidate sites and a set of 13 weighted factors in 2 categories (i.e., Sections A and B of Attachment 3 of the SSAC ToR) and the additional unweighted factors listed in Section C of Attachment 3 of the SSAC ToR, a straightforward direct scoring system is more appropriate. The SSAC has agreed to apply a straightforward quantitative comparison method to the factors set forth in Sections A and B in Attachment 3 of the SSAC ToR. The method is described in section 3 of this Plan.
9. Other Interpretations and Clarifications
a. Page 3, item 11 of the SSAC ToR. We interpret “disabling characteristics” to mean a nonfatal characteristic of the site that may be mitigated given sufficient resources and time. Any such characteristic will be documented in the Report.

Attachment 3. SSAC Evaluation Plan
65
SSAC Evaluation Plan Appendix 2. SKA Siting Reports Tracking, 2011.10.22 – v.1.4 The due dates provided in this Appendix for the delivery of material for each factor update the dates given in Attachment 3 of the SSAC ToR. SPDO Expert Panel Consultant SSAC
Item In Out In Out In Out In 1 Ionospheric
Turbulence Due 30apr11 16sep11
Actual 30apr11 2 RFI
Measurement Due 15jul11 15ju11 31aug11 5nov11
Actual 15jul11 –
31aug11
15jul11 – 31aug11
24oct11 expected
3 Radio Quiet
Zone Protection
Due 30jun11 30jun11 30jun11 31aug11 5nov11
Actual 30jun11 30jun11 30jun11 15oct11 20oct11 4 Long-Term RFI
Environment Due 1sep11
(RQZ E-P report
16oct11; RFI E-P report
24oct11 expected)
04nov11 5nov11
Actual 5 Array Science
Performance Due 4nov11 5nov11
Actual 6 Physical
Characteristics of Site
Due 15sep11 04nov11 5nov11
Actual 7 Tropospheric
Turbulence Due 31oct11 1nov11 30nov11 30nov11
Actual
8 Political; Socioeconomic;
Financial
Due 15sep11 16sep11 16sep11
Actual
9 Customs and Excise
Due 15sep11 16sep11 16sep11 04nov11 5nov11
Actual
10 Legal Due 15sep11 16sep11 16sep11 04nov11 5nov11 Actual
11 Security Due 15sep11 16sep11 16sep11 04nov11 5nov11 Actual
12 Employment Due 15sep11 16sep11 16sep11 04nov11 5nov11

Attachment 3. SSAC Evaluation Plan
66
SPDO Expert Panel Consultant SSAC Item In Out In Out In Out In
13 Working & Support
Environment
Due 15sep11 16sep11 16sep11 04nov11 5nov11
Actual
14 Provision & cost of
infrastructure components
based on Model SKA
Due 15sep11 16sep11 16sep11 04nov11 5nov11
Actual
15 Provision & cost of data transport based on
Model SKA
Due 15sep11 16sep11 16sep11 04nov11 5nov11
Actual
16 Provision & cost of
electrical power based on Model SKA
Due 15sep11 16sep11 16sep11 04nov11 5nov11
Actual
17 Consolidated costs of capital & operations expenditures
Due 15sep11 (RfI) +
4nov11 (consultants)
18nov11 18nov11
Actual

Attachment 3. SSAC Evaluation Plan
67
SSAC Evaluation Plan Appendix 3. Detailed SSAC Schedule The information provided in this Appendix updates the information provided on page 4, “Time Line” and Attachment 6 of the SSAC ToR. The work of the SSAC is planned to take place from 1 September 2011 to 7 February 2012 as summarized in the table below and discussed in the sections A3.1–A3.5 described below.
8–9 September 2011 SSAC Meeting (face-to-face; Washington DC) 8–30 September 2011 Prepare Evaluation Plan 15 September–30 November 2011 Receive material to be evaluated 15 September–15 December 2011 Assessment and evaluation of material 11 November 2011 (15–17 UT) SSAC Meeting (telecon) 28 November 2011 (15–17 UT) SSAC Meeting (telecon) 6–9 December 2011 SSAC Meeting (face-to-face; London) 26–27 January 2012 SSAC Meeting (face-to-face; Paris) 7 February 2012 Target for submission of Report to SSG
A3.1 Prepare Evaluation Plan (1–30 Sep. 2011) The SSAC will prepare its evaluation plan and submit it to the SSG, which will obtain the concurrence of the Founding Board/Governing Board before giving approval to proceed. A3.2 Receive Material to be Evaluated (15 Sep.–30 Nov. 2011) The responses by each candidate site to the SSG RFI, and analyses and reports from the candidate sites, external consultants, SPDO, and SSEC will be provided to the SSAC. A3.3 Assessment and Evaluation of Material (15 Sep.–15 Dec. 2011) All SSAC members will evaluate all material as practical. A lead and one or more secondary reviewers have been assigned to each factor so as to prepare and guide discussions of the SSAC as a whole. The lead and secondary reviewers will be responsible for preparing first drafts of the opinions of the SSAC. Preliminary reviews will be at the basis of the interviews with the sites on 7 and 8 December 2011.

Attachment 3. SSAC Evaluation Plan
68
A3.4 Meetings Meeting, September 8–9 (Washington, DC) The meeting was held as planned. The focus of the meeting was to make significant progress on the content of this Evaluation Plan and to agree to and establish the processes for conducting the business of the SSAC. Both of these items were achieved. In addition, the SSAC was given an overview by the SPDO Director of the materials to be provided to the SSAC grouped by selection category – Science and Technical, Other, and Implementation Plans and Costs. Telecon, November 11, 2011 (15–17 UT) The majority of the review material should have been provided to the SSAC by November 11, 2011 and the in-depth reviews for each factor are expected to be underway. The purpose of this call is to hear status from the SPDO Director (Richard Schilizzi) on any outstanding documentation, and from each Lead/seconds team on the status of their review, and any preliminary impressions, strengths and weaknesses based on the material. Telecon, November 28, 2011 (15–17 UT) This telecon will be held to discuss the progress of the review of material and finalize questions for the site teams in advance of the December 6–9 meeting. Questions will be submitted to SSG for forwarding to the site teams no later than seven days before the December meeting. Meeting, December 6–9, 2011 (London) The meeting format will be as follows:
Dec 6: SSAC meets to discuss the status of the review of the various factors and review and formulate any additional questions of clarification for the sites. Dec 7: Half-day (morning) interview with the first candidate site. The candidate site will make a short presentation to be followed by discussion of the questions of clarification submitted by the SSAC. SSAC Discussions (afternoon). Dec 8: Half-day (morning) interview with the second candidate site following the same format as for the first site. SSAC Discussions (afternoon). Dec 9: The SSAC will:
a) Compare candidate sites against the selection factors and identify any disabling characteristics;

Attachment 3. SSAC Evaluation Plan
69
b) Score the quantitative factors and summarize the strengths and weaknesses of the nonquantitative factors for each candidate site;
c) Evaluate the scores, strengths and weaknesses for each candidate site in order to provide the motivation for the recommendation of the preferred site or other site recommendation;
d) Reach agreement on the outline and content of the Report and make writing assignments.
Meeting, January 26–27, 2012 (Paris) During this meeting the SSAC will conduct a detailed review of the Report and reach agreement on any outstanding issues or open items. If required, the meeting may extend to January 28, 2012. Following the meeting the Report will undergo final edits and proofing prior to submission to the SSG by the target date of 7 February 2012 for validation of process and transmission to the FB or its successor. A3.5 Report (target for submission 7 February 2012) The SSAC Report will be submitted to the SSG by the target date of 7 February 2012.

Attachment 3. SSAC Evaluation Plan
70
SSAC Evaluation Plan Appendix 4. Scoring Interpretation Table A4.1 offers a guide to the correspondence between the numerical scores and the perceived impact of a particular factor on the effectiveness of the array. The term “effectiveness” is used here in a broad sense to refer not only to array performance but also to the attractiveness of the site to high level scientists and engineers and as conditioned by (for example) legal and security factors. Effectiveness translates ultimately into success in achieving the scientific goals of the SKA, either selectively or more broadly. When used with the relative scores in the table, the term is to be interpreted in a relative sense. Table A4.1 shows six progressively higher ratios with an interpretation in terms of the severity of their impact. Individual committee members will interpolate these scores to cover the discernible range of potential impacts. Ratio Interpretation 10:10 Signifies a minor impact on effectiveness having little or no impact on the
achievement in any of the scientific goals. 13:7 Reflects a more significant but modest effect on effectiveness with
potential to have a modest impact on one or more of the science goals. 15:5 Reflects a serious impact on effectiveness with a measurably reduced
capacity for achieving one or more of the scientific goals. 17:3 Signifies the identification of a very serious impact on effectiveness and
potential for failure to achieve several of the SKA scientific goals. 19:1 Signifies a perception that the loss in effectiveness would lead to a
significant and qualitative loss in capacity to achieve many of the scientific goals.
Table A4.1 – Scoring Interpretation SSAC Evaluation Plan Appendix 5: SSAC Terms of Reference See Attachment 2 of this report.

Attachment 4. Factor Reports
71
Attachment 4. Factor Reports A4.1 Factor 1: Ionospheric Turbulence Abstract The ionosphere is the solar-excited plasma layer that peaks about 300 km above the surface of the Earth. The turbulence in this layer of ionized gas causes time-dependent variations in the index of refraction that affect the amplitude and phase of the radio signals traversing it. The large-scale variations in the total electron content (TEC) mainly affect the signal phase, and the small-scale variations cause scintillation or amplitude variations, both of which are deleterious to high-dynamic-range imaging. These effects generally scale as the inverse square of the frequency and hence will influence the SKA more at lower frequencies. Both candidate sites lie at relatively benign mid-geomagnetic latitudes, away from the regions of strong effects seen at equatorial and auroral zones. However, both sites will affected by ionospheric turbulence, which will require careful calibration techniques to mitigate. The SPDO report carefully analyzed the available data relevant for both sites. These data are more sparse for the remote stations at each proposed site, but this is probably not a serious problem since only the central zone of the SKA will be used at low frequencies. We have reviewed the SPDO report and its sources, as well as some of the open literature. There are small differences between the sites at the level of about 5% significance, which can be further quantified only with intensive local measurement campaigns. The most readily measured quantity is the TEC. The long-term average TEC appears to be about 10% less for RSA compared with ANZ. Many ionospheric effects can be expected to scale with the TEC, but its average effect can be modeled and removed. However, studies of scintillation at sites near the proposed array cores show that the effects of scintillation may be 10% less at ANZ compared with RSA. Other variability phenomena, such as spread F and traveling wave disturbances, may be also be slightly less for ANZ (5%). At the longitude of Australia, low-elevation observations toward the south may be affected more than similar observations in southern Africa because of the ionospheric behavior in the auroral zone. On the other hand, low-elevation observations toward the west may be affected more in RSA due to the South Atlantic Anomaly. Considering the aggregate effects of the phenomena described above, we can say that the sites are comparable at the 5% level with currently available data. The SSAC vote on this Factor was 10.0 for ANZ and 10.0 for RSA.

Attachment 4. Factor Reports
72
Introduction The ultraviolet radiation from the sun ionizes the upper region of the Earth’s atmosphere and creates the ionosphere. Its most fundamental parameter is the total electron content (TEC), the integrated density of electrons along a particular line of sight (1016 electrons/m2 = 1 TECU). TEC is readily measured by ground-based GPS receivers, which are often found in dense arrays in populated areas. Since the ionosphere is a plasma, most of its effects, such as excess propagation delay, vary as f–2, where f is the frequency. Large-scale variations of TEC cause refractive effects such as wavefront tilts, which appear as changes in the arrival direction of radio astronomical signals. Small-scale fluctuations, often most severe at night, can cause strong scintillation, or signal amplitude fluctuations, due to diffractive propagation effects. Effects of the ionosphere are generally less at mid-geomagnetic latitudes (e.g., the geomagnetic latitudes of ANZ and RSA are S 27° and S 31°, respectively) than at the equator or poles. The ionosphere extends 300 km above the Earth’s surface. Hence, signals arriving at low-elevation angles pass through the ionosphere at large distances from the site (e.g., about 500 km at 30° elevation angle). The F2 layer of the ionosphere provides most of the contribution to the TEC. Complete ionospheric height profile models have been derived over the years and can be used to generate average global profiles as shown in Figure A4.1-1 (Lean et al. 2011). It is clear that the TEC shows large variations annually, seasonally, and diurnally as well as over the solar cycle. There is a general dependence on geomagnetic latitude, but there are also regional anomalies. Hence, often global models of TEC variations do not agree well with measurements in specific regions. The highest TEC values are seen in the equatorial regions, with a maximum around ±15° from the magnetic equator called the Equatorial Anomaly (EA) regions (Figure A4.1-2). The standard deviation from monthly mean behaviour is ~20–25%.
Figure A4.1-1. GPS-derived daily averaged global TEC over the years 1995–2010. One TEC unit (TECU) is equal to 1016 electrons/m2. There are annual, semiannual, monthly, and daily variations as well as over the 11-year solar cycle. Note that a TEC of 10 TECU will cause a time-of-arrival variation compared to free-space propagation of about 1 µsec, or an equivalent path length of 300 m, at a frequency of 100 MHz. (Lean et al., 2011)

Attachment 4. Factor Reports
73
Figure A4.1-2. The double-humped structure of the equatorial anomaly indicates that VTEC values are enhanced on either side of the 0° magnetic latitude. (Oliveira and Walter, 2005) While the daily variation of TEC within a month is significant, shorter-term variability of TEC is difficult to predict or model. However, this is important for radio astronomical data, which become corrupted because interferometric array phases are sensitive to differential fluctuations in the density. Perley and Bust (2002) estimate that in practical cases (nominally at 100 MHz) with a 10° phase stability, one can detect 0.2% of 1 TECU. Further, as pointed out by Erickson et al. (2001), one would need a large grid of GPS receivers around an SKA site to characterize small-scale irregularities that contribute to short-term phase shifts. As an example of daily variation, we show two plots on the same day in Figure A4.1-3, one for each site.
Figure A4.1-3. Values of vertical TEC derived from GPS measurements from the Madrigal data base for locations near the RSA (left) and ANZ (right) sites. The vertical scale is TEC for 0–25 TECU, and the horizontal scale is local time of day from 0–24 hrs.

Attachment 4. Factor Reports
74
It should also be noted that at sites such as the VLA or Giant Metrewave Radio Telescope (GMRT), at low frequencies (e.g., 80 MHz), even a few percent scintillation can contribute to degradation in the radio images. The quality of a radio image can be judged by its dynamic range (DR) which is defined as the ratio of the peak intensity to the rms noise floor in the image. A rough estimate of DR for an array of N antennas with fractional visibility amplitude error a and phase error p in radians, is given by DR ~ N (a2 + p2)-1/2 (Perley 1999, Datta et al. 2009). For phase error and amplitude errors of 0.1 and N ~ 1,000, the DR is reduced significantly to about 10,000. Analysis and Assessment The SSAC was provided with a detailed report by the SPDO entitled “Report on Ionospheric Turbulence over the Candidate SKA Sites in South Africa and Australia,” by R.P. Millenaar (2011, hereinafter, the SPDO Report) along with a number of reviews by the external experts via the candidate sites. Because of the lack of direct measurements at the sites, the SSAC also looked at published literature in standard journals to gain insights. During the oral interaction with the site proponents, various issues were raised and the answers given by them are also considered in this report. We discuss the core site areas and remote sites separately. Core site areas The SPDO review of the ionospheric conditions is based on either older measurements during low solar activity or on modeling and concentrates on ionospheric scintillation. Other factors such as TIDs and anomalies also contribute, albeit to a lesser extent, but there is a dearth of long-term data on these, and only general statements can be made. The measurements were taken near the cores of the two proposed sites. No direct measurements at the sites were available, and nearby locations have been used, and models such as the International Reference Ionosphere (IRI) and WBMOD models have been used, or models derived from GPS based measurements. Both cores are situated at mid-geomagnetic latitudes. Figure A4.1-4 shows the Equatorial ElectroJet (EEJ) and Equatorial Anomaly (EA) regions. While the EEJ is confined to a small band of magnetic latitude (<~3o), it results in an increased TEC value over roughly ±15o magnetic latitude on either side of the equator. The resulting variations in the horizontal (ΔH) and vertical (ΔZ) components of the geomagnetic field are shown in Figure A4.1-4. The core sites are free from the effects of EEJ and hence of Southern Equatorial Anomaly (SEA). The South Atlantic Anomaly (SAA; also known as the South Atlantic Magnetic Anomaly: not seen in Figure 4.1-4) may have a small effect on the core RSA site.
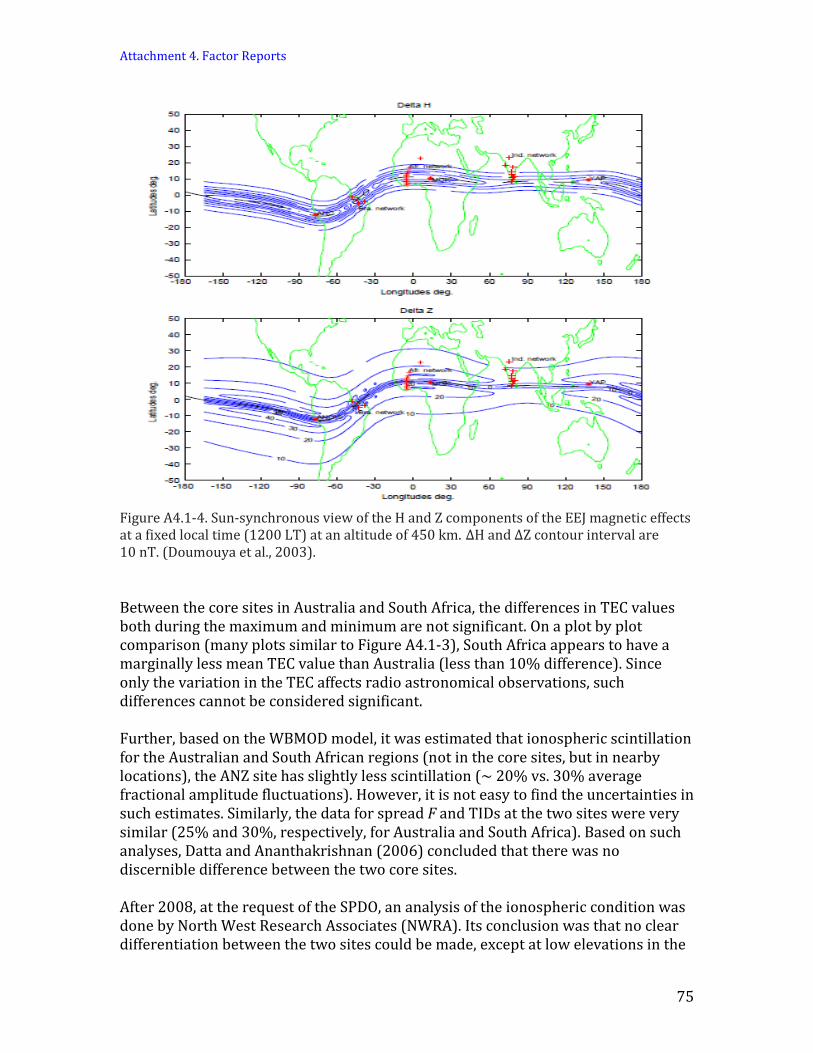
Attachment 4. Factor Reports
75
Figure A4.1-4. Sun-synchronous view of the H and Z components of the EEJ magnetic effects at a fixed local time (1200 LT) at an altitude of 450 km. ∆H and ∆Z contour interval are 10 nT. (Doumouya et al., 2003). Between the core sites in Australia and South Africa, the differences in TEC values both during the maximum and minimum are not significant. On a plot by plot comparison (many plots similar to Figure A4.1-3), South Africa appears to have a marginally less mean TEC value than Australia (less than 10% difference). Since only the variation in the TEC affects radio astronomical observations, such differences cannot be considered significant. Further, based on the WBMOD model, it was estimated that ionospheric scintillation for the Australian and South African regions (not in the core sites, but in nearby locations), the ANZ site has slightly less scintillation (~ 20% vs. 30% average fractional amplitude fluctuations). However, it is not easy to find the uncertainties in such estimates. Similarly, the data for spread F and TIDs at the two sites were very similar (25% and 30%, respectively, for Australia and South Africa). Based on such analyses, Datta and Ananthakrishnan (2006) concluded that there was no discernible difference between the two core sites. After 2008, at the request of the SPDO, an analysis of the ionospheric condition was done by North West Research Associates (NWRA). Its conclusion was that no clear differentiation between the two sites could be made, except at low elevations in the

Attachment 4. Factor Reports
76
southwest direction in Australia, which are adversely affected by the southern auroral zone. The NWRA report was primarily based on new Ionospheric Scintillation Impact Reports (ISIRs) produced by Hermanus Magnetic Observatory (HMO). The conclusion was that both sites will be relatively free from significant scintillation. However, at the geographic longitude of the ANZ site, the SEA extends to higher southern latitudes and the auroral zone comes further north. Both circumstances may cause a narrowing of the band of low scintillation, which would affect observations at low elevations, to the north and south. However, no quantitative estimates were made. The ISIRs conclude in both cases that there will be “little scintillation experienced from the very strong scintillation that is observed in the SEA, except for low frequencies and very low elevation angles.” The most likely incursion of scintillation-causing irregularities is likely to be on the southern horizon when irregularities generated during strong geomagnetic activity enter the viewing area as the auroral region expands equator-ward with increasing activity levels. In these circumstances the ANZ core site may be affected more than the RSA core site. As mentioned above, the older data gave varying indications of preference, e.g., the TEC seems to be marginally lower in RSA than in ANZ, which could lead to lower variations as well. The situation with respect to scintillation and TIDs could be marginally better in ANZ. But both conclusions are inconclusive. Hence, the SSAC is of the view that, within the available data, the core sites are very similar at the level of < ~5%. Remote stations No new analysis was done by the SPDO for the remote stations. However, in the SKA model for the site evaluation, no low frequencies (<500 MHz) will be observed outside the central region out to 180 km, but the northern stations of the RSA may be affected by the proximity to the SEA. Furthermore, the design for higher frequencies has limited the maximum baselines of 3000 km. The impact of the SEA on putative northern stations (e.g., Ghana), not considered here, may be worse. Conclusion The available data and their interpretation gave no definite difference between the ANZ and RSA core sites. While the older TEC data gave a marginal advantage to RSA, the scintillation models gave a similar marginal advantage to ANZ; more data, especially on the occurrence of travelling ionospheric disturbances (TIDs), would have helped to better differentiate the sites. For the remote stations, more data (especially over a longer period) should have been taken to allow for a more nuanced conclusion. The above statements do not mean that either of the sites will be free from scintillation, but it can be clearly stated that they will be much less affected by

Attachment 4. Factor Reports
77
scintillation than sites in the equatorial belt (say, geomagnetic latitudes < 20°). In view of the absence of long-term measurements from the specific sites, it is also difficult to state when they will be affected and to what extent. Considering the aggregate effects of the phenomena described above, we can say that the sites are comparable at the 5% level with currently available data. The SSAC vote on this Factor was 10.0 for ANZ and 10.0 for RSA. Future Monitoring The SSAC strongly suggests that monitoring of the ionospheric properties, such as TEC, scintillation, TIDs, etc., begin immediately at the selected site and its remote stations. Monitoring TEC and its variations in a number of positions around the central area will enable better calibration in the future. Such measurements are relatively easy to obtain with GPS technology. References Datta, A., and Ananthakrishnan, S. 2006, Report in support of the ISSAC report Datta, A. Bhatnagar, S., and Carilli, C.L. 2009, Ap.J., 703, 1851 Doumouya, V., et al. 2003, J. Atmos. and Solar-Terr. Phys., 65, 1265 Erickson, W.C., et al. 2001, A&A, 366, 1071 Lean, J.L., et al. 2011, J.G.R., 116, A10318 Millenaar, R.P. 2011, “Report on Ionospheric Turbulence over the Candidate SKA
Sites in South Africa and Australia,” SKA Document no. WP3-030.020.010-TR-001, revision C (SPDO Report)
Oliveira, A.B.V. and Walter, F. 2005, Proc. URSI GA, New Delhi Perley, R.A. 1999, ASP Conf. Series, 180, 275 Perley, R.A., and Bust, G. 2002, URSI GA, presentation

Attachment 4. Factor Reports
78
A4.2 Factor 2: RFI Measurements Abstract The SPDO, in collaboration with the site proponents, performed measurements of radio frequency interference (RFI) levels at the core sites and four remote stations each in RSA and ANZ. In addition, expected interference levels have been computed for all remote stations from a list of terrestrial transmitters in the 300–2000 MHz region within 150 km from any of the remote sites. The reported RFI measurements and computations were visually inspected and analyzed and the following conclusions drawn:
• Both core sites are well suited to host the SKA. The measurements do not show a discernible difference in RFI levels between the two sites.
• RFI levels, computed from a desktop study of transmitter sites, and corroborated by measurements at four sites each in ANZ and RSA, indicate a median interference level of 40 dB for RSA and 70 dB for ANZ above the threshold level, which is a significant difference. The remote sites in the RSA proposal show a clear advantage over those in ANZ.
Overall, RSA has a somewhat better advantage for this Factor. The SSAC vote on this Factor was 7.2 for ANZ and 12.8 for RSA. Introduction RFI measurements were performed by the SPDO at both core sites and at four remote stations each in Australia (ANZ) and southern Africa (RSA). In addition, a desktop study has been performed for all remote stations, whereby the expected interference level is estimated from as complete a list of existing transmitters as possible within a radius of 150 km from the site, using a propagation model and considering the topography of the propagation paths. The results have been reported by the SPDO in several reports and form the basis for our investigation. The SPDO reports have also been submitted to an Expert Panel, with a request to quantitatively evaluate the results and draw conclusions about the absolute and relative suitability of the respective sites for the SKA. The report of the Panel contains exhaustive analyses and an extensive statistical study of the measurements at the core sites. The Panel concludes there is no discernible difference in RFI levels between the two core sites. In addition, in an Addendum about the remote sites, the Panel states that the SPDO desktop study of transmitter sites contains many uncertainties, and no conclusion is presented. In studying the data and the Panel’s report, we believe no convincing

Attachment 4. Factor Reports
79
evidence was presented that the desktop study is unreliable. More effort could have been spent in inspecting the data and making relative comparisons between the sites. The results of such an inspection are presented here, and they allow, in our opinion, a stronger conclusion with respect to the relative qualities of the remote sites than can be found in the Expert Panel report. RFI Levels at the Core Sites In addition to the analysis made by the Expert Panel, we have used the SPDO report “Annotated-overview-of-rfi-at-candidate-ska-core-sites” of 27.11.2011, which contains measured spectra in high sensitivity mode from 70–2000 MHz in vertical and horizontal polarization and in four directions N–E–S–W. We have left satellite signals out of consideration on the assumption that these will be quite similar at both sites. We have counted as well as possible the number of “spikes” of more than 20 dB above the threshold level; the strongest signals were about 60 dB above threshold. The threshold level is the recommendation of the International Telecommunication Union (ITU) for VLBI of –230 dBW/Hz. In our discussion, we give the values with respect to this threshold in dB. It should be noted that because of the crowding in the plots, our counts represent a lower limit to the number of transmitters detected. Because the spread between the compass directions and between horizontal and vertical polarization is relatively small, we have taken the average of all eight plots for each site. These are presented in Table A4.2-1, where the spectrum is divided into eight bands according to their licensing assignments.
Table A4.2-1. Number of Transmitters Detected in the 8 Bands for ANZ and RSA
These data suggest that RSA is somewhat less affected by aeronautical radio traffic and receives more transmitters in the FM and VHF TV band, while the occupation of TV in the UHF band is comparable for both sites. We note the almost complete

Attachment 4. Factor Reports
80
absence of GSM in ANZ. However, RSA has arranged with GSM providers to use directional antennas with a level suppressed by 40 dB in the direction of the core (Vodafone antenna development). We agree with the conclusion of the Expert Panel that there is no significant difference in the RFI levels between the two core sites during the period of these measurements. From the submissions by the candidate sites, we note the following:
i) in RSA, the FM band will be restricted to 88–100 MHZ, freeing up the spectrum above 100 MHz;
ii) in RSA, the entire VHF band and the UHF band, apart from two 8-MHz slots, will be free of TV transmitters;
iii) in ANZ, the UHF TV band will be restricted on the upper boundary to 800 MHZ;
iv) in both ANZ and RSA, complete transfer of TV to digital technology is under way.
Other measures are being planned in both regions to further minimize RFI. These are discussed in the sections on Factors F3 and F4. Expected RFI Levels at Remote Stations from Terrestrial Transmitters The SPDO Report on the expected RFI levels at the SKA remote stations is based on a computation of the expected level from all transmitters within 150 km from the site of the station. It covers the frequency range 300–2000 MHz. For the 12 stations outside South Africa, the transmitter data were limited to the broadcast bands (FM, VHF, and UHF, essentially 300–900 MHz). The reason given was that these SKA stations are located in extremely thinly populated areas, and no transmitters could be expected outside this frequency band. Four sites in RSA did not show any signal in the 300–1000 MHz band (one each in Namibia and Mozambique and two in Madagascar). A visual inspection of all plots was undertaken. As a useful criterion, we chose the maximum computed level above the International Telecommunication Union (ITU) threshold, in the frequency range 300–1000 MHz. A histogram of these data is presented in Figure A4.2-1 as the number of remote stations that fall in a 10 dB wide bin. Most of the stations have a level between 30 and 80 dB. In RSA, two have no interference at all, and one peaks at 90 dB. In ANZ, the majority of the stations lie between 50 and 80 dB, with one at 30 and two at 80 dB. The median values are 40 and 70 dB, the means 44.4 and 63.2 dB, for RSA and ANZ, respectively. Note: For RSA station 7, four points are predicted in the UHF band at a level 140–150 dB at a distance of more than 100 km. These have not shown up in the actual measurements at this site. We have ignored these points in the histogram.

Attachment 4. Factor Reports
81
Inspecting the sites with the aid of Google Earth shows that, in general, the RSA sites are located in “hilly” terrain, while the terrain of Australia is remarkably flat in the far surroundings of most stations. This suggests that natural shielding contributes to the lower levels predicted for RSA.
Figure A4.2-1. Distribution of the number of remote stations over the expected maximum RFI level. Comparison of Computed and Measured RFI Levels for Remote Sites Measurements of the RFI levels were performed at four of the remote stations for each region. These results can be compared with the expected levels from the desktop study. In the frequency range 400–2000 MHz, the measured levels are, in general, comparable to or about 10 dB lower than the calculated ones. As noted above, RSA site 7 (X2 in the measurement report) expects several spikes of up to 140 dB in the 500–700 MHz range, which do not appear in the measurements. For the rest, the picture in all eight sites is quite similar, with a tendency for the measurements to be somewhat lower than the calculated values. The two sites in Namibia (RSA 21-X3 and 22-X4) show features about 60 dB strong near 950 MHz that do not appear in the calculations. As noted above, this frequency band was not sampled for transmitters for the stations outside South Africa. According to the report by the Expert Panel, these signals are from GSM 920–960 MHz stations. Table A4.2-2 contains a summary of the results of the comparison.

Attachment 4. Factor Reports
82
Table A4.2-2. Comparison of Computed and Measured RFI Levels in dB at Four Remote Sites in Y (ANZ) and X (RSA)
Conclusion Our conclusions can be summarized as follows:
• Both core sites are well suited to host the SKA. The measurements do not show a discernible difference in RFI levels between the two sites.
• RFI levels, computed from a desktop study of transmitter sites, and corroborated by measurements at four sites each in ANZ and RSA, indicate a median interference level of 40 dB for RSA and 70 dB for ANZ above the threshold level, which is a significant difference. The remote sites in the RSA proposal show a clear advantage over those in ANZ.
Overall, RSA has a somewhat better advantage for this Factor. The SSAC vote on this Factor was 7.2 for ANZ and 12.8 for RSA.
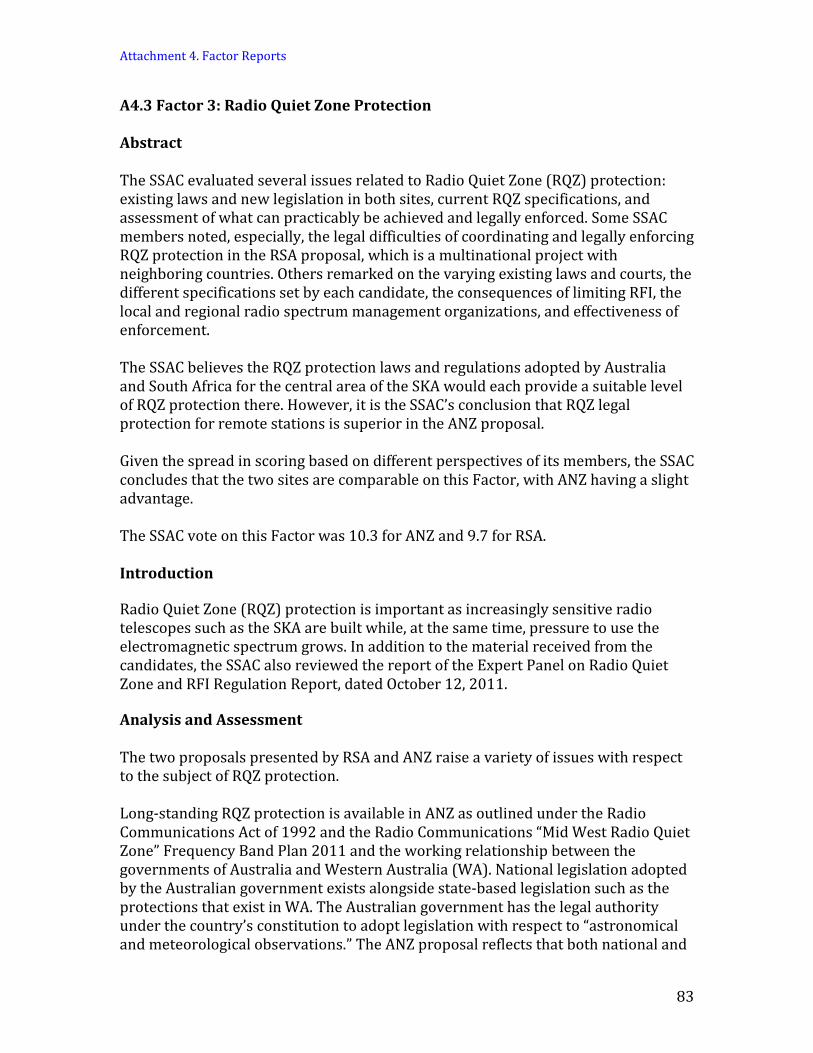
Attachment 4. Factor Reports
83
A4.3 Factor 3: Radio Quiet Zone Protection Abstract The SSAC evaluated several issues related to Radio Quiet Zone (RQZ) protection: existing laws and new legislation in both sites, current RQZ specifications, and assessment of what can practicably be achieved and legally enforced. Some SSAC members noted, especially, the legal difficulties of coordinating and legally enforcing RQZ protection in the RSA proposal, which is a multinational project with neighboring countries. Others remarked on the varying existing laws and courts, the different specifications set by each candidate, the consequences of limiting RFI, the local and regional radio spectrum management organizations, and effectiveness of enforcement. The SSAC believes the RQZ protection laws and regulations adopted by Australia and South Africa for the central area of the SKA would each provide a suitable level of RQZ protection there. However, it is the SSAC’s conclusion that RQZ legal protection for remote stations is superior in the ANZ proposal. Given the spread in scoring based on different perspectives of its members, the SSAC concludes that the two sites are comparable on this Factor, with ANZ having a slight advantage. The SSAC vote on this Factor was 10.3 for ANZ and 9.7 for RSA. Introduction Radio Quiet Zone (RQZ) protection is important as increasingly sensitive radio telescopes such as the SKA are built while, at the same time, pressure to use the electromagnetic spectrum grows. In addition to the material received from the candidates, the SSAC also reviewed the report of the Expert Panel on Radio Quiet Zone and RFI Regulation Report, dated October 12, 2011. Analysis and Assessment The two proposals presented by RSA and ANZ raise a variety of issues with respect to the subject of RQZ protection. Long-standing RQZ protection is available in ANZ as outlined under the Radio Communications Act of 1992 and the Radio Communications “Mid West Radio Quiet Zone” Frequency Band Plan 2011 and the working relationship between the governments of Australia and Western Australia (WA). National legislation adopted by the Australian government exists alongside state-based legislation such as the protections that exist in WA. The Australian government has the legal authority under the country’s constitution to adopt legislation with respect to “astronomical and meteorological observations.” The ANZ proposal reflects that both national and

Attachment 4. Factor Reports
84
state-based legislation will be used to protect the radio quietness of remote sites located in the other Australian states where sites are located. The adoption by South Africa of the Astronomy Geographic Advantage Act of 2007 (AGA Act) is evidence of that country’s commitment to providing RQZ legal protection. Within South Africa, the Karoo Central Astronomy Advantage areas (KCAAA) are covered under the AGA Act. The RQZ protection of the remote stations in other parts of South Africa outside the Northern Cape Province may also be provided pursuant to the terms of the AGA Act if future legal designations of such areas are implemented by South Africa. Separate RQZ protection will need to be implemented and enforced in the five partner countries outside South Africa where several remote stations would be based. The RSA central site has currently set a threshold specification 15dB lower than ANZ. At the moment, this is probably below the threshold of existing telescopes but may be relevant for the SKA. The levels stated by each site refer, in principle, to the entire protected zones (central and mid regions) and not only the central core (despite the assumption in the Expert Panel report on RQZ). As such, the RSA level follows the recommendation in SKA Memo 73 (see reference below) for the core but is more stringent than that (by 15 dB) for the level needed for the intermediate region. The present ANZ level is appropriate for the mid region but may not be sufficiently stringent for the core. RSA has conducted a highly successful program of reducing and managing RFI within the central area, and RSA has stricter control on airborne, mobile, and unlicensed transmitters. Both ANZ and RSA have effective RQZ legislation laws in place. RSA’s is more recent, stemming from its more recent development of radio astronomy and its decision to protect astronomy research through the AGA Act. The ANZ proposal involves only the government of Australia, and the RSA proposal involves six countries (the RSA consortium) that are geographically separated, with neighboring countries that are not members of the consortium. Several of these neighboring countries have problematic issues related to governance, the ability to obtain legal protections, and the enforcement of relevant laws including RQZ protections (e.g., Zimbabwe is located between the proposed remote station in Zambia and the core SKA facility proposed to be based in South Africa). But the remote sites appear to be more than 100 km from any border, so the absence of any legal RFI protection may be less or not relevant. The six countries of the RSA consortium have not yet adopted or sought to formalize current or future RQZ protections, relying to date on letters of intent to participate in the SKA project and a March 10, 2010, Joint Declaration of Support for the South African Ministry and the Department of Science and Technology in South Africa. In the ANZ proposal, only Australia is involved, so there is no need for RQZ protection in another country
Attachment 4. Factor Reports
85
The legal system for protecting an RQZ environment is important in maintaining such an environment and enforcing restrictions and prohibitions under RQZ legislation so as to enable the SKA to effectively operate. The ANZ proposal by virtue of the practical ability to coordinate RQZ protection in Australia, which has as its base the English system of common law, with English as the official language, provides an advantage over the RSA proposal. The RSA proposal involves six separate countries with widely divergent legal systems, differing legislative systems, varied administrative and regulatory entities, different court systems and judicial bodies, etc. By way of example, the legal system in South Africa is a mix of Dutch and English law; Mozambique’s legal system is derived from German, Roman, and Portuguese legal influences; Botswana’s legal system is derived from Roman, Dutch, and English legal concepts; and Madagascar’s legal system is based substantively on concepts in French civil law. Accordingly, the implementation of a cohesive system of legal protection for RQZ protection is certain to be substantially more difficult and problematic to adopt, maintain, coordinate, and enforce in RSA. The RSA candidate advised the SSAC that it will “coordinate” with the other five countries but did not clarify how it would practically and carefully provide such coordination. While the SSAC has considered that South Africa may be able to use its influence in the region to obtain RQZ protection in all six countries involved in the RSA proposal and attempt to provide protection against RFI coming from adjacent or intervening countries such as Zimbabwe, the SSAC is uncertain whether such RQZ protection can be adopted, maintained, and enforced over the 50-year useful life of the SKA. Conclusion The SSAC believes the RQZ protection laws and regulations adopted by Australia and South Africa for the central area of the SKA would each provide a suitable level of RQZ protection there. However, it is the SSAC’s conclusion that RQZ legal protection for remote stations is superior in the ANZ proposal. Given the spread in scoring based on different perspectives of its members, the SSAC concludes that the two sites are comparable on this Factor, with ANZ having a slight advantage. The SSAC vote on this Factor was 10.3 for ANZ and 9.7 for RSA. Future Monitoring Should RSA be selected as the site, the SSAC endorses and agrees with the Expert Panel about the need for the coordination and establishment of a unified central body to coordinate and enforce RQZ protections and cohesive integrated regulations and legal enforcement across the six countries in the RSA consortium. Reference SKA Task Force on Regulatory Issues. “Spectrum Protection Criteria for the Square Kilometre Array.” Memo 73, Nov. 2005.

Attachment 4. Factor Reports
86
A4.4 Factor 4: Long-Term RFI Environment Abstract We examined the long-term future of the radio frequency interference (RFI) environment in both ANZ and RSA, using the responses to the RfI, the expert reports, and information from the interviews with site delegates. We note first that both candidates selected acceptably quiet sites. In both countries, the most significant long-term trend is nationwide increases in RFI levels due to the likely very strong worldwide growth of broadband mobile cellular services. Cooperation between the SKA and service providers will be essential. We consider the potential impacts of (1) problems of legal enforcement of RFI regulation, (2) RFI and electromagnetic interference (EMI) risks due to the long-term evolution of population and population density, (3) mining and gas extraction activity, and (4) the effectiveness of Radio Quiet Zone (RQZ) protection measures. We find that legal enforcement may be a more severe problem for remote sites in the RSA partner countries, mitigated, however, by the higher tolerance of RFI for signals from the remote sites. Farm population density is declining at both sites due to increasing urbanization. While there are assurances that mining and gas extraction are not current issues, this situation could change quickly at either site. The SSAC considers the Astronomy Geographical Advantage (AGA) Act in RSA to be a novel and potentially effective approach to RQZ protection, but both countries have essentially equivalent legal RQZ regulation.
In conclusion, the long-term RFI environment is comparable and acceptable in both ANZ and RSA.
The SSAC vote on this Factor was 9.3 for ANZ and 10.7 for RSA. Introduction
The long-term future of the RFI environment is a key factor in determining the viability of a site for radio astronomy, but it is also very difficult to predict the future RFI environment in a reliable way. In this report we examine the issues surrounding the long-term RFI environment, globally and at the ANZ and RSA sites by using material provided to the SSAC. The material consulted in preparing this report includes the “Study on the Long-Term RFI Environment for the SKA Radio Telescope” by expert consultant Analysys Mason (AM Report); the South African and Australia-New Zealand responses to the RfI on RQZ Protection; the Expert Panel Report on RQZ and RFI Regulation, and results of the discussions with ANZ and RAS delegates at the candidate interview on 7–8 December 2011.

Attachment 4. Factor Reports
87
Analysis and Assessment
Global Trends
The AM Report examined primarily the long-term global trends identified in spectrum usage and did not discern a clear difference between the sites, since the trends are worldwide. South Africa is not quite as developed as Australia, but the trends are in the same direction in both countries. The primary factor is the exponential growth in cellular mobile communications, soon to be dominated by broadband mobile driven by the use of smartphones and tablet devices. Spectrum licensing bodies at both sites are making reassignments to meet the increasing demand (e.g., space opening up from digital dividend). The global demand for spectrum space will be at 700 MHz, 800 MHz, 1800 MHz, and 2.5 GHz and up to 3.6 GHz as bandwidth demand continues to increase.
Site-Specific Issues
Legal enforcement of RFI regulations
The AM Report notes that legal enforcement of RFI regulations may be a concern and should be investigated by experts familiar with the legal systems in each of the sites. While relevant to both sites, this may be more of a concern for the RSA because of the numerous partner countries with the legal systems different from the RSA. However, this concern is relevant only to the remote site stations located outside the RSA. The remote site antennas will not be operating at low or mid frequencies and, in addition, will be more tolerant of local sources of RFI and EMI because of decorrelation between stations at the longer baselines. Thus, while legal enforcement is an important issue for the RSA site, we expect the scientific impact of any problems with regulatory control of RFI for the partner countries will be mitigated.
Population and population density
As population and usage of smartphones grow, both countries will experience increased RFI produced by cellular devices. Cooperation with service providers can benefit both the SKA and mobile users by appropriate technological innovation. For example, RSA has developed a good plan to protect the core area by arrangements with the local service provider. GSM Mobile Cellular Communications (880–915 MHz, 925–960 MHz) will use base stations within the Karoo Central Astronomy Advantage areas (KCAAA) that minimize their radiation toward the Karoo Core by using phased antenna systems. One can expect similar arrangements in ANZ.
The Expert Panel on Array Science Performance (Factor 5) noted that there is a higher density of farms within a 180-km radius of the array core in RSA than in the corresponding area in ANZ. It was accordingly not always possible to place stations in conformity with the EMI mask, which specifies a minimum distance of 10 km from farm sites. The Factor 5 report describes the EMI risk associated with the

Attachment 4. Factor Reports
88
higher farm density, and the conclusion after considering a variety of factors is that the impact would likely be minimal. Information provided during the interview with RSA delegates further gave reassuring evidence that the farm population density is declining and that the type of agriculture is grazing only, rather than intensive mechanized farming. Such activity is unlikely to pose a significant risk in the future. This type of risk is a less-pressing issue in ANZ because of significantly lower farm population density.
Mining activity
Mining activity is of little concern in RSA since there is none in the Karoo region, and there are no minerals of importance there. An exception may be gas reserves in the area; currently, a moratorium on gas exploration exists in the Karoo region, but it may expire in 2012, and pressure for exploration may arise in the future. The situation is different in ANZ. There are no active mines within the central 70 km of the ANZ core site, but there are 13 active mines within 180 km. The discussion and agreement between the Federal and Western Australia governments have involved the mining stakeholders, which is reassuring. However, pressure from mining companies may arise in the future. There are no currently known petroleum or gas resources in the protected region of Australia, so there is no expected petroleum or gas extraction activity. Despite uncertainty over future mining and gas exploration, it seems that the RQZ protection in both countries provides for the prevention of such activity if it cannot be developed in a compliant manner.
Regardless of assurances offered about the unlikelihood of future mining and gas extraction activity at the two sites, the SSAC advises that the situation could change quickly and bears close monitoring.
RQZ considerations
Current RFI measurements conducted at both sites by the SPDO, and discussed by the Expert Panel on RQZ and RFI Regulation, show that both sites are acceptably radio quiet at the present time. As noted in the Factor 3 report, both countries have also developed effective RQZ legislation offering protection against both RFI (narrow band interference) and EMI (broadband noise interference).
There is, in general, a good indication that the future RFI environment at both sites is as secure as possible and that the two sites are about equal in this respect. Both ANZ and RSA have invested heavily and successfully in legislation and in the establishment of links with other stakeholders to ensure a radio quiet environment within about 200 km of the core sites. We note here the point made in the Factor 2 report that on the basis of future spectrum allocations, the RSA site might possess a small but measurable advantage over the ANZ site.
The RSA have implemented the Astronomy Geographic Advantage (AGA) Act, which provides broad protection to an area considerably larger than the central 200-km radius, and represents a novel approach to RQZ protection. It appears to be a very

Attachment 4. Factor Reports
89
flexible instrument, offering the prospect of help in declaring remote sites (currently unprotected in either country) as radio quiet zones. It should be noted, however, that the benefits would not be applicable to remote sites in the neighboring partner countries where the Act is not applicable. In balance, both sites have developed comparably rigorous legal regulatory protection and have consulted extensively with stakeholders in their respective constituencies.
Conclusion
In conclusion, the long-term RFI environment is comparable and acceptable in both ANZ and RSA.
The SSAC vote on this Factor is 9.3 for ANZ and 10.7 for RSA.
Future Monitoring
The SSAC advises that activity in exploration and extraction of mineral resources at the selected SKA site be closely monitored. In addition, given the inevitability of rapid growth in the use of broadband cellular devices, the SSAC urges that vigilance be proactively sustained and that constant interaction with providers be maintained to provide early technological solutions to oncoming RFI problems.

Attachment 4. Factor Reports
90
A4.5 Factor 5: Array Science Performance Abstract We examined the array configurations as proposed by RSA and ANZ, and the comparative analysis done by the SPDO. The SPDO defined several Figures of Merit (FoMs), which quantify the effect of nonperfect distribution of points in the UV-plane. The risk for electromagnetic interference (EMI) was also considered. For the central area, the layout of the arrays is close to identical for both sites. Differences between the UV-plane FoMs are minimal. The RSA site has a nonzero EMI risk due to the presence of farmsteads in the central area that could cause a very small increase in system temperature of individual antennas. However, the effect is so small (<0.5% in survey speed) that the possible impact on the science performance is negligible. Considering the full array, the remote stations have a much more regular distribution over azimuth and radius in the RSA configuration, resulting in better UV-plane FoMs (of up to 60%). The ANZ configuration is elongated in the East-West direction. This results in poorer UV coverage for observations less than 12 hours, and higher side-lobes, which will limit imaging quality due to calibration and difficulties with deconvolution. The elongated beam will limit resolutions at declinations less than ± 30°, a considerable portion of the sky. This makes the RSA configuration significantly better than the ANZ configuration for science that benefits from good instantaneous UV coverage and/or high level of calibration accuracy. In conclusion, for programs needing only the central area, the two sites are nearly equal, with RSA slightly better with respect to simultaneous mutual visibility with telescopes in other parts of the EM spectrum. RSA is significantly better for all high dynamic range and high-resolution observations, and observations where good, short (less than four hours) observations are important. In summary, RSA has a significant advantage. The SSAC vote on this Factor was 6.0 for ANZ and 14.0 for RSA. Introduction This analysis is based largely on the SPDO report entitled “Array Configuration for Candidate SKA Sites: Design and Analysis,” by Millenaar, Bolton, and Lazio (2011, hereinafter, the SPDO Report), and SKA Memo 107, “Array Configuration Studies for the SKA: Implementation of Figures of Merit Based on Spatial Dynamic Range,” by Lal, Lobanov, and Jiménez-Monferrer (2009, hereinafter, SKA 107). The array configuration of the SKA will be a deciding factor on its ability to fulfill its full range of scientific goals. Unlike most arrays built in the past, it will not be practical to move stations to optimize the configuration for different science. The SKA science goals require a balance between a centrally condensed and a distributed collecting area, a sensitivity to low surface brightness emission,
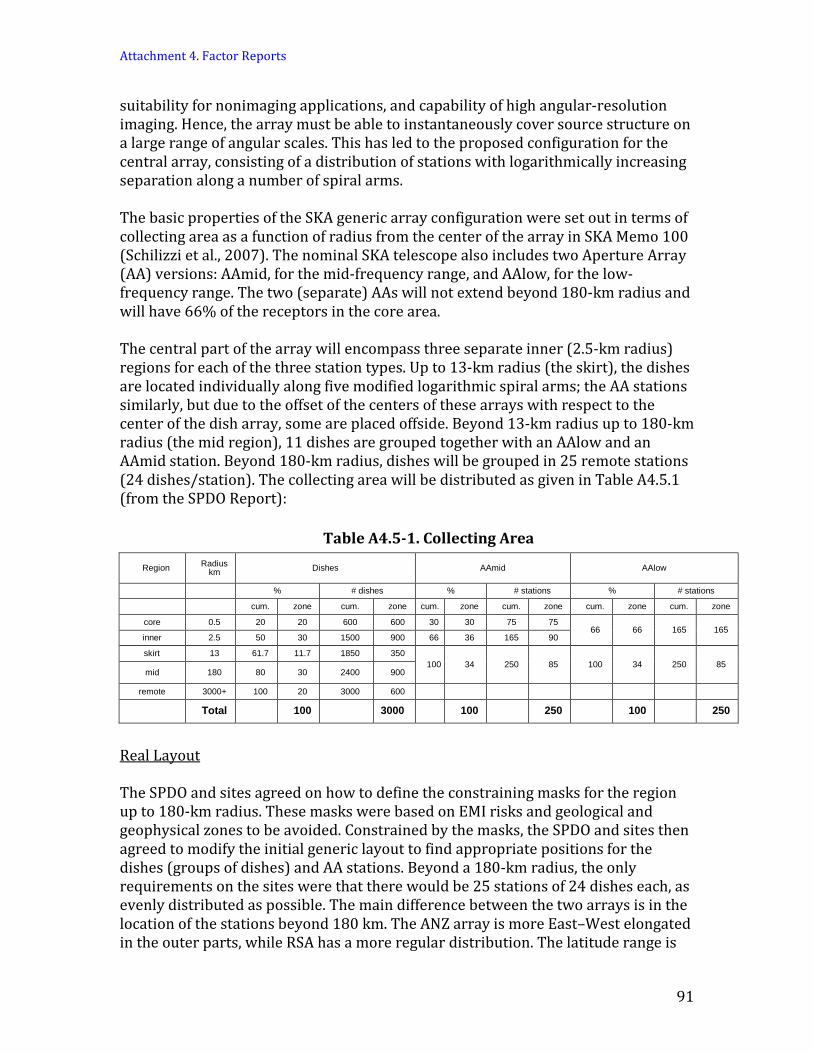
Attachment 4. Factor Reports
91
suitability for nonimaging applications, and capability of high angular-resolution imaging. Hence, the array must be able to instantaneously cover source structure on a large range of angular scales. This has led to the proposed configuration for the central array, consisting of a distribution of stations with logarithmically increasing separation along a number of spiral arms. The basic properties of the SKA generic array configuration were set out in terms of collecting area as a function of radius from the center of the array in SKA Memo 100 (Schilizzi et al., 2007). The nominal SKA telescope also includes two Aperture Array (AA) versions: AAmid, for the mid-frequency range, and AAlow, for the low-frequency range. The two (separate) AAs will not extend beyond 180-km radius and will have 66% of the receptors in the core area. The central part of the array will encompass three separate inner (2.5-km radius) regions for each of the three station types. Up to 13-km radius (the skirt), the dishes are located individually along five modified logarithmic spiral arms; the AA stations similarly, but due to the offset of the centers of these arrays with respect to the center of the dish array, some are placed offside. Beyond 13-km radius up to 180-km radius (the mid region), 11 dishes are grouped together with an AAlow and an AAmid station. Beyond 180-km radius, dishes will be grouped in 25 remote stations (24 dishes/station). The collecting area will be distributed as given in Table A4.5.1 (from the SPDO Report):
Table A4.5-1. Collecting Area
Region Radius km Dishes AAmid AAlow
% # dishes % # stations % # stations cum. zone cum. zone cum. zone cum. zone cum. zone cum. zone
core 0.5 20 20 600 600 30 30 75 75 66 66 165 165
inner 2.5 50 30 1500 900 66 36 165 90 skirt 13 61.7 11.7 1850 350
100 34 250 85 100 34 250 85 mid 180 80 30 2400 900
remote 3000+ 100 20 3000 600
Total 100 3000 100 250 100 250
Real Layout The SPDO and sites agreed on how to define the constraining masks for the region up to 180-km radius. These masks were based on EMI risks and geological and geophysical zones to be avoided. Constrained by the masks, the SPDO and sites then agreed to modify the initial generic layout to find appropriate positions for the dishes (groups of dishes) and AA stations. Beyond a 180-km radius, the only requirements on the sites were that there would be 25 stations of 24 dishes each, as evenly distributed as possible. The main difference between the two arrays is in the location of the stations beyond 180 km. The ANZ array is more East–West elongated in the outer parts, while RSA has a more regular distribution. The latitude range is

Attachment 4. Factor Reports
92
14° for ANZ (S 18.7° to 32.3°) and 20° for RSA (S 13.1° to 33.0°). The final layouts can be found in the replies to the Request for Information (RfI) by the sites and in the SPDO Report. Analysis and Assessment The key parameters to judge the performance of an array are 1) the angular resolution, set by the longest baselines, and the roundness of the beam, 2) the dynamic range that can be achieved, i.e., the ratio between the peak brightness and the rms noise, and 3) the spatial dynamic range, quantifying the range of scales that can be reconstructed from the data. The third parameter is of particular importance for the SKA because the beam will typically be entirely filled with sources at the μJy levels. This puts an additional constraint on the SKA. The scale free design, where the relative increase in baseline length is constant over the entire array, ensures uniform sensitivity on all angular scales probed. It is the size of these relative increases (the UVGAP parameter, defined as ∆U/U) that can ultimately limit the array performance. This is quantified in SKA 107, where it is shown that for UVGAP values larger than 0.03, the achievable dynamic range will be limited by the smoothness of UV coverage. The dynamic range decreases linearly as UVGAP increases above 0.03, as shown in Figure A4.5-1.
Figure A4.5-1. Relative change of different FoMs obtained from the dirty (left panel) and CLEANed (right panel) maps as a function of the UVGAP parameter (SKA 107). Another important factor determining the dynamic range is how well the data can be calibrated. Experience with LOFAR shows that in the circumstances described above, a global high-precision sky map is essential to be able to calibrate an observation with high precision, even with lower resolution, as is the case, e.g., for epoch of reionization (EoR) observations.

Attachment 4. Factor Reports
93
To analyze the properties of the sites, the SPDO defined a set of Figures of Merit (FoMs). These FoMs were calculated for the central 180-km radius dish layout of 2,400 elements (D2400); the two AA arrays; and for the full array, modelled for the sake of computation as 25 remote and 218 central stations, for a total of 243 stations (D243). The FoMs were calculated for the 4 configurations and a set of 18 representative measurements at 3 declinations (0, –30, –60°) each for 3 durations (0, 2, 4h) and 2 bandwidths (narrow and broadband). Note that the effect of the broad bandwidth is to smear the UV-tracks in the radial direction, which helps to fill in gaps in the UV-plane. The primary UV-plane related FoMs are:
• UVGAP parameter: measures how smoothly the UV-points are distributed. A way to achieve low values of UVGAP is to distribute the stations logarithmically in radius along multiple spirals to achieve good azimuth average. The UVGAP should be low at all values of projected baseline length to ensure good array performance across a broad range of angular scales.
• Beam eccentricity: measures departure from equal angular resolution in orthogonal directions.
In addition, there are two other considerations:
• EMI risk: risk of locally generated radiation from buffer zones from appliances and equipment associated with farms, roads, and other human activity.
• Sky visibility. D2400, AAlow, AAmid For the 180-km radius area, the FoMs are essentially identical for the two sites. This is expected, since the layouts were forced to be close to identical. Between 10 and 100 km, the UVGAP is up to 30% better for ANZ; from 150–300 km, RSA is better by 20%. However, the UVGAP values are, for all but the shortest observations, below 0.03 for both arrays, so the difference will not have a significant impact on array performance (see Figure A4.5-1). We summarize below the percent difference between the sites as a function of baseline length for each of the UV factors (where + = better):
• UVGAP D2400 30–100 km, ANZ +30% 150–300 km, RSA +20% AAmid 10–40 km, RSA +15% 50–100 km, ANZ +5% >100 km, RSA +10% AAlow 40–100 km, ANZ +12% 200–300 km, RSA +15%

Attachment 4. Factor Reports
94
• Eccentricity/circularity: variation of up to 5–10%; varying between sites depending on observational setting and definitions.
EMI Risk In designing the layout of the configurations, constraining masks were defined to place stations sufficiently far from sources of electromagnetic interference (EMI), such as farms, towns, mines, roads, power lines, etc. For ANZ, it was possible to place all stations outside the masked areas. For RSA farms, masked areas could not entirely be avoided. Any station placed closer than 10.5 km from a farm was defined as having a nonzero EMI risk. The EMI risk as calculated by the SPDO is zero for ANZ. For RSA, the risk is zero within the core, but 72% of the dishes within the 2.5-km to 180-km region have a nonzero EMI risk (27% of the total central region). The average risk for those was estimated to be 0.07, the equivalent of having a farm at 4.4 km from an affected station. EMI was not measured explicitly, or noticed incidentally, during the RFI campaigns. Nor were measurements made with MWA, PAPER, KAT-7, or any other instrument, or requested by the SPDO. It would, however, according to the SPDO, be premature to conclude that there will be no risk from farmstead EMI. On the other hand, we find it impossible to quantify differences between sites based on non-measured entities. According to SPDO, a risk of unity would raise the Tsys by 10%; thus, the estimated risk of 0.07 would lead to an increase by 0.7% for the 27% of affected stations. There are many reasons to expect that the real risk is even less. Taking the demographic development over the last ten years (fewer farms) the uncorrelated signals per interferometer, type of farming (extensive sheep grazing), non-optimal layout solutions, and options to solve by law any real problem, we feel the expected EMI influence from farms is negligible. According to the radiometer equation, a fractional change in Tsys implies a survey-speed reduction of twice that amount. Thus, the reduction in survey speed can be expected to be less than 0.5% over the entire 180-km central region and zero in the core. In conclusion, for the central 180-km radius instrument, the difference between the two sites is minimal as far as UVGAP and EMI are concerned. D243 (Model of the Full Dish Array) The positions of the remote stations for each site were based on complex considerations involving geography, accessibility, RFI, and political and other considerations. Hence, for baselines involving the remote stations, a large difference exists between the RSA and ANZ layouts, as shown in Figure A4.5-2. RSA has up to 50% better UV filling, 50% less UVGAP, and up to 100% less eccentricity. These results are not unexpected with the more regular azimuth coverage and distance distribution of the RSA site. A drastic change in ANZ layout (in essence, more North–South baselines over a range of longitudes) would be required to create similar regularities.

Attachment 4. Factor Reports
95
Figure A4.5-2. The distribution of baselines achieved with station distribution in ANZ (left) and RSA (right). The scales run from –3500 to +3500 km. Note that each baseline is plotted twice (e.g., station A to station B and vice versa). The plots are distributions as seen from a direction perpendicular to the reference plane of the array, i.e., the instantaneous (snapshot) projected baselines with no effects of Earth rotation. Note that the clusters of points (mini five-armed spirals) show where the remote stations connect with the central stations of the array. Both arrays have about the same overall UV distribution in the East–West direction and, therefore, the same angular resolution in the East–West direction. In the North–South direction, the ANZ UV distribution is much more compressed, which leads to an elliptical (i.e., eccentric) beam with corresponding lower North–South resolution. Large holes and uneven coverage in the UV distribution lead to large sidelobes in the beam and can ultimately limit the dynamic range, even in the CLEANed image. This effect can be seen in Figure A4.5-1, where it is shown that for UVGAP values smaller than 0.03, the UV coverage does not have a strong effect on the image quality. Above 0.03, the dynamic range decreases with increasing UVGAP such that a fractional change in UVGAP of 60% corresponds to a decrease in dynamic range of about 30% for UVGAP ~ 0.15. The conclusion is that for UVGAP values larger than 0.03, the UV coverage will limit the imaging and calibration capability of an array with present-day convolution and imaging capabilities. As can be seen in the SPDO report, both configurations exceed 0.03 for the shortest observations; however, at the longest baselines, the situation is significantly worse for ANZ (see Figure A4.5-3). Similar conclusions can be drawn about the rms noise in an image. The UV FoMs are summarized in Table A4.5-2 (averaged over the declinations and observing times specified in the set of 18 simulations).

Attachment 4. Factor Reports
96
Figure A4.5-3.The distribution of percentage difference in the UVGAP parameter (positive favors RSA, negative favors ANZ) vs. baseline length. The +’s indicate the UVGAP differences among the 18 sets of observations, and the solid line is the average value. RSA has a clear advantage for all baselines greater than 400 km.
Table A4.5-2. Average Values over Declination and Observing Time Duration of UV-Plane Figures of Merit
(For % differences , positive values mean that the RSA FoM is better; negative values mean that the ANZ FoM is better.)
FoM D2400 AAmid AAlow D243 UVGAP % difference
–3.3 ± 3.4 5.3 ± 1.7 –0.6 ± 1.7 39.1 ± 1.0
Eccentricity % difference
–2.0 ± 0.6 0.6 ± 0.9 –0.1 ± 0.7 28.9 ± 1.0
Mean absolute eccentricity value
ANZ 1.089 ± 0.002 RSA 1.113 ± 0.004
ANZ 1.119 ± 0.003 RSA 1.113 ±0.004
ANZ 1.115 ± 0.003 RSA 1.112 ±0.004
ANZ 1.77 ± 0.03 RSA 1.28 ± 0.01
Filling factor 0.7 ± 0.6 –0.3 ± 0.4 –0.4 ± 0.5 19 ± 6 Visible Sky Since both core sites are at about the same latitude, the visible sky is comparable for both sites; in particular, some key objects mentioned in the 2006 site selection procedure are very visible. Simultaneously, visible sky with instruments at other wavelengths (valuable for new phenomena and for [quasi-]varying events), is better

Attachment 4. Factor Reports
97
for RSA (90° from Chile/Argentina with Auger, ALMA, VLT, ELTs; 10° from EVN) than for ANZ (180° from Chile; 90° from RSA, EU; and 10° from China). Note that in either case, the circumpolar regions are always visible if observing down to the horizon or to very low elevations is not excluded. Conclusion The FoMs are very similar for the central (180-km radius) regions of the two configurations. For the full array, the ANZ configuration is elongated in the East–West direction. This results in poorer UV coverage for observations of less than 12 hours, and higher sidelobes, which will limit imaging quality due to calibration and difficulties with deconvolution. The elongated beam will limit resolutions at declinations less than ± 30°, a significant portion of sky. In conclusion, for programs needing only the central area, the two sites are nearly equal, with RSA slightly better with respect to simultaneous mutual visibility with telescopes in other parts of the EM spectrum. RSA is significantly better for all high dynamic range and high-resolution observations, and observations where good, short (less than four hours) observations are important. In summary, RSA has a significant advantage. The SSAC vote on this Factor was 6.0 for ANZ and 14.0 for RSA. Future Monitoring Monitoring external and self-generated EMI at the central area and the remote sites should be carried out, together with RFI monitoring, to ensure a continuing clean spectral environment. References Lal, D.V., Lobanov, A.P., and Jiménez-Monferrer, S. 2009, “Array Configuration
Studies for the SKA: Implementation of Figures of Merit Based on Spatial Dynamic Range” (SKA Memo 107).
Millenaar, R.P., Bolton, E.C., and Lazio, J. 2011, “Array Configurations for Candidate SKA Sites: Design and Analysis,” SKA Document no. WP3-050.020.010-TR-001, revision C (SPDO Report).
Schilizzi, R.T. 2007, “Preliminary Specifications for the SKA,” SKA memo 100.
Attachment 4. Factor Reports
98
A4.6 Factor 6: Physical Characteristics of the Sites Abstract Information was provided on environmental aspects (climate; cloud cover, solar radiation, airborne particles; wildlife and land use restrictions; wildfires, seismic hazards), geotechnical aspects, and severe weather. The main area (core plus skirt zones, i.e., < 13 km), the variation along the spiral arms (< 180 km), and the remote sites have been dealt with. For the core and skirt areas, environmental conditions for ANZ and RSA are harsh but acceptable. ANZ records higher temperatures and higher average wind speeds, although still well below critical levels. Maximum wind speeds at the two sites are comparable. Solar radiation is higher in ANZ. No significant problems have been reported with airborne particles, land use restrictions, wildlife, seismic, and wildfire events. Geotechnical conditions (i.e., soil conditions relevant to foundations, water availability; corrosive minerals, soil conductivity, and subsurface temperatures relevant to electrical grounding and data and power cables) are adequate and not different for the two sites. Severe weather events are rare, with occasional flash flooding, for both sites. Both ANZ and RSA make reasonable cases that environmental conditions do not vary significantly between the core and skirt areas and the spiral arms out to 180 km. Geotechnical conditions vary but without consequences for dish foundations or bunkers. Seismic and severe weather events are rare. Conditions at remote stations are less known and more variable than in the central area. However, no discernible differences between the candidate sites exist in this regard, and solutions to overcome adverse conditions, especially flooding and wildfires, can be found at reasonable cost. The SSAC is satisfied with the responses to the concerns raised in a 2006 expert report about conditions in partner countries outside South Africa, some of a geotechnical nature, others having to do with hurricanes. Environmental, geotechnical, and severe weather conditions are acceptable, and the SSAC considers the two candidate sites to be comparable. The SSAC vote on this Factor was 9.7 for ANZ and 10.3 for RSA. Introduction The RfI requested that candidate sites provide information on three key issues: environmental aspects (climate; cloud cover, solar radiation, airborne particles; wildlife and land restrictions; wildfires, seismic), geotechnical aspects, and severe weather. ANZ and RSA were also requested to provide information for the central
Attachment 4. Factor Reports
99
area (core plus skirt zones, i.e., < 13 km) and to discuss the variation of conditions along the spiral arms (< 180 km) and at the remote sites. The SSAC used supplementary information from a 2006 expert report on geotechnical conditions at the RSA remote sites and the responses from RSA. Analysis and Assessment For the core and skirt areas, environmental conditions for ANZ and RSA do not pose very big problems, although conditions are harsh. Temperatures for ANZ are somewhat more of a problem. Wind speeds are mostly below critical levels at both sites, but averages are quite a bit higher in ANZ (average mean speed of 15 km/hr vs. 9 km/hr for RSA), although maximum wind speeds, requiring dishes to be secured, are comparable. There is some risk of flooding, and this may have been somewhat underestimated in both cases. One can find in the various documents references to individual sites being inaccessible for substantial periods of time. Cloud cover is not very different; solar radiation is higher in ANZ (average between 12 and 30 mJ/m2/day and between 12 and 20 mJ/m2/day for RSA), but solar power solutions will be dependent on overall power-generation policies; airborne particles are at low levels for both, although ANZ has not provided optical thickness measurements. Land use restrictions (by aboriginal nations), to the extent existing, can probably be dealt with. Seismic and wildfire events are rare. Wildlife is limited and can be dealt with by relatively simple precautionary measures for people and equipment. As to geotechnical aspects, there is no significant difference between the sites. Soil conditions pose no serious problems for foundations (there are more measurements for RSA); water availability is adequate; corrosive minerals are virtually absent on both sites. Soil conductivity and subsurface temperatures pose no serious problems for electrical grounding and data and power cables. Severe weather events (lightning, hurricanes and cyclones, hail) are rare for both sites; flash flooding does pose some problems for both sites. With regard to variation in conditions along the spiral arms, much less information is available in both submissions. However, both ANZ and RSA make reasonable cases that variations are limited as far as the environmental conditions are concerned. Geotechnical conditions do vary but do not seem to pose serious problems for the foundations for dishes or the construction of bunkers. Seismic events are rare in both cases. Severe weather events remain rare along the spiral arms up to 180 km. There is even less detailed information on the remote sites. Relatively more information is available in the ANZ case about the site(s) in New Zealand than in the RSA case about non-RSA sites. A few issues exist for the RSA remote sites. The SSAC has discussed with the RSA delegation its observation that in a 2005 geotechnical study, half of the remote sites, including all Botswana and Namibian sites, posed

Attachment 4. Factor Reports
100
considerable difficulties (deep sand or steep slopes). The SSAC was satisfied with the information provided: Some station sites have been moved, and the costs of foundations for all sites have been included in the cost estimates. Water quality varies and makes water treatment mandatory in several cases. Madagascar poses a higher risk for hurricanes and cyclones, but the SSAC understands that the proposed site is sufficiently far inland to avoid severe impact. Torrential rains provide a challenge in the near equatorial RSA remote sites, as do wildfires in the southeastern Australian regions. Additional precautionary measures must be considered. Conclusion Environmental, geotechnical, and severe weather conditions are acceptable, and the SSAC considers the two candidate sites to be roughly equal. The SSAC vote on this Factor was 9.7 for ANZ and 10.3 for RSA. Future Monitoring Climatic information should be collected to obtain the number of days per year when observations would be difficult, e.g., with rain or thunderstorms.
Attachment 4. Factor Reports
101
4.7 Factor 7: Tropospheric Turbulence Abstract Propagation path length fluctuations caused by the turbulent structure of the troposphere have been measured at both prospective core SKA sites. Data were acquired with small interferometers, receiving signals near 11 GHz from geostationary communication satellites. Time-overlapping measurements were obtained for June–October 2011. The data indicate that the fluctuations at the ANZ site are 38% stronger than at the RSA site. This result is in good agreement with a ratio of 1.4 expected from the different altitudes of the sites (1080 m in RSA, 372 m in ANZ) for a tropospheric model having a scale height of 2 km. We consider this a significant difference between the sites, the RSA site being clearly advantageous for high dynamic range mapping, particularly at frequencies above 3 GHz. The remote stations are located at an average altitude of about 1000 m for RSA and 350 m for ANZ. Thus, the advantage of the RSA core site for this Factor will extend to the full SKA array. In summary, RSA has a significant advantage for this Factor. The SSAC vote on this Factor was 6.1 for ANZ and 13.9 for RSA. Introduction On their way to Earth, the radio waves pass through the terrestrial atmosphere. The troposphere up to a height of some 10 km from the ground exerts a noticeable influence on the propagation of the astronomical signals. For the interferometric mode of operation of the SKA, the effective excess propagation length (or delay) through the atmosphere, caused by the index of refraction, is of prime importance. Variations in the refractive index cause variations in excess propagation path length, which result in phase variations in the interferometer output signal. These translate to fluctuations in the “viewing direction” of the telescope. The delay through the troposphere is independent of frequency f, hence, the phase shift, being proportional to the path length divided by the wavelength, varies as f. The tropospheric delay is caused by two atmospheric components. The delay through the dry atmosphere, with a scale height, based on hydrostatic equilibrium, of about 8 km, has a negligible influence on the propagation at frequencies of interest for the SKA. The wet component (due to water vapor) is confined to the lower troposphere, with an average scale height of about 2 km. It is here that the bulk of the tropospheric turbulence occurs, and hence this component is responsible for most of the tropospheric phase fluctuations. A demonstration that the phase fluctuations have, on average, a scale height of about 2 km is shown in Figure A4.7-1, where we plot the natural log of the mean squared path fluctuation levels for eight radio observatories during winter conditions. The best-fit straight-line dependence corresponds to the expected relation of σp2 = a e –h/h0 , (1)

Attachment 4. Factor Reports
102
where h is the site elevation, h0 the scale height, and a a proportionality constant. The slope of the data gives a scale height of 1950 m, in very good agreement with the expected scale height of 2 km. This result is in sharp contrast with the situation at optical wavelengths, where dry air turbulence, which is much closer to the ground, dominates the “seeing.” The character of the turbulence is well described by the Kolmogorov theory of turbulent mixing and is characterized by a “structure function” describing the correlation between fluctuations as a function of the distance between two points. If a source is observed through the troposphere on a baseline of D meters perpendicular to the source direction at an elevation angle E, then the Kolmogorov turbulence theory gives the result for the rms path fluctuation level as: σp = b D5/6 (sin E)-1/2 , (2) where b is a site-dependent proportionality factor. This formula holds out to about D = 1 km, which is the outer scale of turbulence, beyond which σp remains independent of distance and is influenced only by the overall conditions in the troposphere.
Figure A4.7-1. Tropospheric path length fluctuations versus site altitude. The line is a fit to the red dots; MRO-Mullard Radio Observatory, GB-Green Bank, HC-Hat Creek, NRO-Nobeyama Radio Observatory, VLA-Very Large Array, PdB-Plateau de Bure, MK- Mauna Kea, ALMA-ALMA on Chajnantor, Chile. Blue points are the measured values at ANZ and RSA core sites, which were not used in the fit to determine the exponential scale height in Eq. (1). (Adapted from data in Table 13.3, Interferometry and Synthesis in Radio Astronomy, Thompson, Moran, and Swenson [2001].)

Attachment 4. Factor Reports
103
Because of the relatively small-scale height of 2 km for water vapor, the phase fluctuations, on average, will decrease noticeably with increasing altitude of the site. Thus, the amount of water vapor above the South African core site at 1080 m altitude is expected to be 70% of that above the Western Australian site at 372 m. This would mean an expected level of tropospheric fluctuations at the ANZ site about 1.4 times that at the RSA site. Analysis and Assessment of Data from the SPDO (Millenaar, 2011) Measurement Campaign Simultaneous measurements at each site were performed during five months of winter and spring (June–October 2011) with a two-element interferometer of 1.5 m diameter reflector antennas equipped with a receiver for the 11 GHz satellite TV-communication band. (Results from an earlier five-month period were also obtained for the RSA site.) At both sites, the interferometer elements were positioned a nominal distance of 200 m apart and were directed at a geostationary satellite. Because of local restrictions, the baseline lengths and orientations with respect to the satellite were slightly different. Moreover, different satellites at significantly different elevation angles (37˚ for ANZ and 51˚ for RSA) were used as signal sources. For comparison, the data have been normalized to a standard baseline of 200 m and zenith, according to Eq. (2). SPDO has produced a report with plots of the data and a short description of the analysis method. The data are summarized in graphs of cumulative phase error distribution for daytime and nighttime periods on a basis of monthly averages. In our view, an incorrect formula (Eq. 3 in the SPDO report) was used in adjusting for the elevation angle; the sine term must be placed under a square root sign. In the report of the Expert Panel for Factor 7, this issue is addressed with the wording “the elevation correction is somewhere between sin E and sqrt(sin E)” without further explanation. We use the square root, as in Eq. (2). In the table below, we present the normalized tropospheric rms fluctuation level from the SPDO report in picoseconds (1 ps = 0.3 mm propagation delay) referred to a 200-m baseline and the zenith. To the values from the SPDO report (raw total), we add our own results, corrected according to Eq. (2) above, for total (all day), daytime and nighttime during the winter–spring period, June–October 2011.
Tropospheric rms fluctuation level, in picoseconds
ANZ RSA Ratio (ANZ/RSA) Raw total (SPDO report) 1.16 0.99 1.17 Corrected total 1.33 0.97 1.38 Corrected daytime 2.36 1.57 1.50 Corrected night time 0.92 0.75 1.23
For this data set, average conditions at ANZ are a factor 1.38 worse than at RSA (the SPDO raw ratio is 1.17). The rms fluctuations are 1.33 and 0.97 picoseconds for ANZ and RSA, respectively, for the zenith direction on a 200-m baseline, corresponding to 0.40 and 0.29 mm in path fluctuation. At a baseline of 1 km, where the phase rms function flattens, this is equivalent to a phase noise at the highest SKA frequency of

Attachment 4. Factor Reports
104
10 GHz of about 20 degrees at the ANZ and 14 degrees at the RSA site, respectively. The additional measurements in RSA indicate that summer conditions are about a factor of two worse than winter conditions. The same can be expected for Australia. Discussion and Conclusion The rms fluctuation values for ANZ and RSA are plotted in Figure A4.7- 1. The fact that they conform so closely to the expected model with 2 km scale height supports the contention that the one season of data in the SPDO report has delivered a representative data set on the basis of which a reasonable comparison between the two sites can be made. The Expert Panel, using the ANZ/RSA-ratio of 1.17 from the SPDO report, considers the difference between the sites insignificant. No conclusion is drawn by the Panel for the corrected case of a ratio of 1.38. We note that the average altitude of the 25 Remote Stations of the SKA is 1050 m for RSA and 340 m for ANZ. These are very close to the altitude of the respective core sites (1080 m and 372 m, respectively). Thus, the advantage of the RSA core site for this Factor will extend to the full SKA array. This is fortunate, because the remote sites, being equipped with dishes only, will be used at the higher frequencies, where the influence of the troposphere increases. In conclusion, both sites will exhibit noticeable tropospheric phase fluctuations at observing frequencies above a few GHz. The data at hand indicate these will be close to 40% higher at the Australian site than in South Africa. We consider this a significant difference between the sites for this Factor, the RSA site being clearly advantageous for high dynamic range mapping, particularly at frequencies above 3 GHz. The SSAC vote on this Factor was 6.1 for ANZ and 13.9 for RSA. Future Monitoring The database for the evaluation of the tropospheric factor is very small. Multiyear data is essential to obtain an idea of annual variations. Because there exists a reasonably good correlation between the surface water vapor content and the fluctuation intensity, the study should at least be extended with such data over several years to more accurately evaluate the variation and its long-term trend. Evaluation of archival surface meteorological data would also be valuable. Climatic information should also be collected to obtain the number of days per year when observations would be difficult, e.g., with rain or thunderstorms. References Millenaar, R.P. 2011, “Tropospheric Stability at Candidate SKA Sites,” SPDO Report, WP3-040.020.001-TR-001, revision A. Thompson, A.R., Moran, J.M., and Swenson, G.W. 2001, Interferometry and Synthesis in Radio Astronomy (Wiley–Interscience, New York), second ed.

Attachment 4. Factor Reports
105
A4.8 Factor 8: Political, Socioeconomic, and Financial Abstract
The SSAC concluded that both sites responded appropriately to the RfI, each making a strong case backed by supporting information from third parties. Based solely on the responses, there appears to be very little difference between the two sites on any of the major political, socioeconomic, and financial issues of importance to the SKA, although the SSAC expressed reservations about some of the partner countries in the South African bid. When the SSAC reviewed publicly available data, it became clear that Australia and New Zealand are fully developed countries comparable in all respects to Europe and North America, whereas South Africa is still developing and, although far ahead of most African nations, is generally significantly lower than ANZ in international rankings in political and socioeconomic indicators. South Africa’s partner countries are well behind it in most key metrics. Each site makes its own impressive case for hosting the SKA, and the SSAC agrees that both sites can provide a suitable environment for the SKA on the understanding that the African project would be headquartered, managed, and funded in and through South Africa, as proposed. However, a range of readily available comparative socioeconomic factors plus the proximity of Geraldton’s facilities in Australia to the proposed core provides a significant advantage to Australia/New Zealand over the South Africa consortium in this Factor. The SSAC vote on this Factor was 14.5 for ANZ and 5.5 for RSA. Introduction
The RfI states that the chosen site country requires a stable, mature, and transparent socioeconomic and financial environment if the SKA project is to be built, operated, and maintained to deliver the best possible science with minimal risk. The candidate sites were asked to provide outlines of the political, socioeconomic, and financial situations of their respective countries and also of other countries that have agreed to host remote stations as part of the SKA, referring, as appropriate, “to internationally available data, metrics, and tools.” A project of the scale of the SKA requires the investment of an enormous amount of human and financial capital, the majority expected from outside the site country(ies). A stable political environment is essential if agreements on land use, construction, exploitation, and protection from interference are to be honored over the long lifetime of the project. Large sums of money will be transferred from the international partners, and major contracts will be placed with enterprises within and without the site country(ies). The financial systems must be capable of handling these transfers and disbursements in a transparent and accountable manner, free of

Attachment 4. Factor Reports
106
corruption and criminal actions. Finally, the socioeconomic infrastructure has to be such that the personnel from many countries required for SKA will be able to live and work in an internationally acceptable environment. Failure to meet these requirements will put the project at risk of interruption and delay, diversion of funds, and a serious deficit in skilled personnel. Any one poses a serious risk to the delivery of science. The SSAC sought additional information relevant to this Factor from data internationally and publicly available from sources such as the United Nations and the Organisation for Economic Cooperation and Development (OECD), as requested in the RfI and cited in the responses from the two sites. Analysis and Assessment
The SSAC concluded that both sites responded appropriately to the RfI, each making a strong case backed by supporting information from third parties. Based solely on the responses, there appears to be very little difference between the two sites on any of the major political, socioeconomic, and financial issues of importance to the SKA, although the SSAC expressed reservations about some of the partner countries in the South African bid. However, the SSAC probed the data and metrics publicly available to get a better overview of the relative strengths and weaknesses of the two sites. It became clear that they are at different stages in their development. Australia and New Zealand are fully developed countries, comparable in all respects to Europe and North America. South Africa is developing and, although far ahead of most African nations, is generally significantly lower than ANZ in many international rankings. Its partner countries are well behind South Africa in most key metrics. A broad summary of the state of development of Australia and South Africa is indicated in the table below:
Population (millions)
% population in higher education
GDP/capita (purchasing
power parity) – USD
thousands
GDP/capita (nominal) –
USD thousands
Human Development
Index*
Gini Coefficient**
Australia 23 65% 41 67 0.929 0.27 South Africa 51 15% 11 9 0.619 0.63
* The Human Development Index (HDI) is a comparative measure of life expectancy, literacy, education, and standards of living for countries worldwide. It is a standard means of measuring well-being. G20 countries typically have HDI above 0.85. The RSA partner countries have HDI below that of South Africa. ** The Gini coefficient is a measure of the inequality of the distribution of wealth, a value of 0 expressing perfect equality and a value of 1 expressing maximal inequality. G20 countries typically have Gini coefficients between 0.25 and 0.35.

Attachment 4. Factor Reports
107
Other indicators give a similar picture. Australia, New Zealand, and South Africa can be regarded as stable democracies. Crime of all types is a major concern in the countries in the RSA consortium, and there have been persistent accusations of corruption and violence, which could affect certain aspects of SKA. Finally, the existence of the developed urban area around Geraldton (as an alternative to Perth) was seen as an advantage for Australia/New Zealand. Conclusion Each site makes its own impressive case for hosting the SKA, and the SSAC agrees that both sites can provide a suitable environment for the SKA on the understanding that the African project would be headquartered, managed, and funded in and through South Africa, as proposed. However, a range of readily available comparative socioeconomic factors plus the proximity of Geraldton’s facilities in Australia to the proposed core provides a significant advantage to Australia/New Zealand over the South Africa consortium in this Factor. The SSAC vote on this Factor was 14.5 for ANZ and 5.5 for RSA.
Attachment 4. Factor Reports
108
A4.9 Factor 9: Customs and Excise Abstract The SSAC reviewed the various customs systems and duty rates, the excise tax regimes and tax rates, and related issues such as import and export processes that will impact the SKA over its lifetime. A wide range of issues was considered since the SKA involves a large multinational investment of funds, materials, and services, including the provision of scientific and technical equipment, and personnel in various remote locations. The SSAC reviewed the issues presented by the two candidates, including details related to the six diverse RSA member countries; cross-border coordination and logistical issues presented by the RSA proposal; and the diverse customs, excise, and regulatory structures in the two candidate sites. The SSAC also considered the long-standing Australia–New Zealand Closer Economic Relationship Trade Agreement (ANZCERTA) free-trade and economic cooperation agreement (allowing for the free flow of goods, services, and people between the two countries) and the absence of overall free-trade agreements among the six members of the RSA consortium. The SSAC also reviewed the customs, free-trade, economic, and business environments in Australia and New Zealand and considered the written confirmation from the Australian government that there will be no Goods and Services Tax (GST) payable by the SKA in Australia. The SSAC believed the ANZ proposal presented a better customs, excise, tax, and regulatory structure for the construction and operation of the SKA and that siting the SKA in ANZ would be simpler and less costly. We concluded that ANZ has a somewhat better advantage over RSA for this Factor. The SSAC vote on this Factor was 13.3 for ANZ and 6.7 for RSA. Introduction In addition to the materials referenced above that the SSAC reviewed, this analysis is also based in part upon Expert Reports prepared by the accounting firm of KPMG LLP in the United Kingdom. These reports examined various tax considerations in the RSA and ANZ proposals, including a review of VAT, Goods and Services Taxes (GST), import duties and processes, customs, duties and tariff rates, excise duties and taxes, import and export restrictions, and the status of governmental agreements and regulatory environments in both candidate sites. As noted in the RfI, the SKA will involve scientific institutes, governments, and industry from many countries and will be funded primarily by sources outside the host country(ies). Thus, it is important that there be prompt, efficient free movement of goods, products, and personnel in and out of any sites and countries hosting the SKA. The RfI also notes that this review should extend to the

Attachment 4. Factor Reports
109
construction, operational useful life of approximately 50 years, and the decommissioning of the SKA. There is an obvious need to minimize the impact of any type of taxes, customs duties, administrative and shipping costs, GST, VAT, and other taxes so that all funding can be directly applied to SKA project costs. Analysis and Assessment The RSA consortium involves six different countries with varying systems for dealing with customs, duties, excise taxes, and other taxes including differing import processes and requirements; differing customs duties; varying duty rates, excise taxes, and other taxes; as well as import and export restriction issues. The siting in the ANZ proposal will feature one country (Australia) or two (Australia and New Zealand). The inherent complexity of involving six countries as opposed to one or two will likely substantially complicate or increase the costs involved in the flow of goods, property, and personnel among various sites. For example, shipping goods from South Africa to one or more of the five other countries in the RSA consortium will involve transit, export, import, customs, and logistical procedures; valuation issues; and related issues. Additionally, shipments from South Africa to another country or among the countries in the consortium may be adversely affected by the rules, fees and requirements of intervening countries through which the goods or personnel may flow (e.g., Zimbabwe in the case of land shipments from South Africa to Zambia). The KPMG Expert Report examining issues in the RSA proposal noted that the multiple jurisdictions create the problem that “the complexity of the indirect tax considerations has increased with each [additional] jurisdiction.” The report also noted that “the considerations and potential impact of this appear to be limited to the movement of goods directly between South Africa and relevant satellite countries rather than third countries, and [the RSA proposal] does not consider the other complexities that this raises.”1 The six countries in the RSA consortium have no formal uniform free-trade agreements similar to the existing business free-trade agreements between Australia and New Zealand, although South Africa has a customs union with limited scope with Namibia and Botswana. For example, the Australia-New Zealand Closer Economic Relationship Trade Agreement (ANZCERTA) allows for the free flow of goods, services, and people between Australia and New Zealand, and if the SKA is sited only in Australia, the project will be governed by only one country’s laws and regulations. The KPMG Expert Report examining issues in the ANZ proposal notes, “Australia’s trade policy framework continues to be characterized by an unusually high degree of transparency”2 and references the World Trade Organization’s April 2011 Trade Policy Review: Australia, which states that Australia is “one of the most open economies in the world.”3 It also observed, “Rates of customs duty have fallen
Attachment 4. Factor Reports
110
steadily in Australia, with most imported goods attracting a rate of between zero percent and five percent.”4 The KPMG Expert Report considering the RSA proposal states that the South Africa “duty rates on the majority of products range from 0% and 20%”5 and also notes, “It is unclear at this time if prompt customs clearance is available across the geographical reach of the [RSA] candidate jurisdictions.”6 One of the most commonly cited international reference works that surveys the ease of operating a legal entity and conducting operations in countries around the world is the World Bank ‘s compendium “Doing Business 2012: Doing Business in a More Transparent World.” This annual review is often referred to as the “doing business” analysis of countries worldwide, and it ranks Australia as number 10, New Zealand as 15, and South Africa as 35 for providing a business, legal, and commercial environment in which operations may be conducted. The ANZ representatives confirmed in writing in December 2011 that there will be no GST in relation to any funding, contributions, or sums used to pay any SKA costs or arising from any other operations of the SKA within Australia if Australia is the chosen site. The Australian delegation confirmed that the Australian Tax Office will provide guidance and assistance in establishing the optimal no-tax or low-tax financial structure for SKA operations if Australia is selected. To date, there is no written governmental confirmation from the RSA consortium that no VAT or GST will be charged on the SKA in South Africa or the partner countries if RSA is the selected site, although the RSA delegation said at the candidate interview in December that it was approaching the tax authorities in South Africa about a possible VAT exemption. Conclusion The SSAC believes the ANZ proposal presents a better customs, excise, tax, and regulatory structure for the construction and operation of the SKA and that siting the SKA in ANZ would be simpler and less costly. We conclude that ANZ has a somewhat better advantage over RSA for this Factor. The SSAC vote on this Factor is 13.3 for ANZ and 6.7 for RSA. Future Monitoring As noted in the two KPMG Expert Reports, the SSAC believes that a careful review of all of the issues and topics mentioned above and in the Expert Reports will be required to ensure that the SKA possesses or procures enforceable agreements and understandings related to such concerns as taxes, duties, fees, import and export costs or restrictions, tax exemptions and preferential rates, VAT and GST exemptions, etc.

Attachment 4. Factor Reports
111
References 1 November 2011 SKA Project Indirect Tax RfI Review South Africa, page 9. 2 November 2011 SKA Project Indirect Tax RfI Review Australia, page 7. 3 World Trade Organization, Trade Policy Review April 2011: Australia, page vii. 4 November 2011 SKA Project Indirect Tax RfI Review, Australia, page 7. 5 November 2011 SKA Project Indirect Tax RfI Review, South Africa, page 7. 6 Ibid., page 15.
Attachment 4. Factor Reports
112
A4.10 Factor 10: Legal Abstract The SSAC reviewed the legal issues presented by the two candidate sites with respect to the planned preconstruction, property acquisition, permitting and land entitlement, hiring and employment laws, construction, and operation of the SKA. The SSAC examined the legal and regulatory environments in each site, including the cross-border legal issues. We also considered any relevant treaties and legal agreements in place among members of the RSA and ANZ consortia as well as the potential extent and availability of intellectual property rights (IPR) laws and enforcement. The SSAC concluded that the legal environment for the SKA described in the ANZ proposal was more integrated and established, with fewer cross-border legal issues, and that it presented fewer legal risks for the SKA. Thus, the ANZ site was considered somewhat better than the RSA site for this Factor. The SSAC vote on this Factor was 12.9 for ANZ and 7.1 for RSA. Introduction The construction and operation of the SKA involves many legal issues, including the application of contractual laws and legal protections, real property and land entitlement laws, land use and environmental restrictions, intellectual property rights (IPR) laws, and laws affecting personal property and SKA equipment. This Factor analysis is also based in part upon the Expert Report prepared by the firm of Pinset Masons solicitors in the United Kingdom. Analysis and Assessment The two proposals presented by RSA and ANZ present a variety of significant legal issues with respect to the construction, operation, and decommissioning of the SKA. The RfI requested information on the legal processes, administrative procedures, rule of law, enforcement of regulations, dispute resolution mechanisms as well as a discussion of the options whereby the SKA organization could acquire legal capacity and most effectively operate in the candidate sites. The RfI also requested details on the formal arrangements between the primary host country and the countries where remote sites will be located in order to secure a long-term commitment to the SKA, as well as requesting detailed information on the status and enforceability of ownership and rights in IPR in each of the partner countries. The RfI further requested information about entitlement and ownership of land, rights of access, property rights issues, licensing and permitting issues for construction and operation of the SKA together with a summary of how environmental law issues would affect SKA construction and operation, including details on any
Attachment 4. Factor Reports
113
Environmental Impact Assessments (EIA) that will be needed in each of the partner countries. The RSA proposal encompasses many variables since the RSA consortium is comprised of six countries, each with different legal systems, varying court systems, different administrative bodies, varied regulatory entities, and legal environments. As noted in the analysis on Factor 3, the legal systems of the six countries in the RSA proposal have developed from a mixture of various Dutch, German, Portuguese, and French civil law (although Roman and Napoleonic concepts provide a common basis) and common law concepts. The Pinset Masons report notes that the reality of operating the SKA in more than one country and the resulting interplay of different legal systems and laws “adds to complexity during construction and operation and may complicate funding and property ownership structures.”1 The ANZ proposal involves Australia or, at most, Australia and New Zealand, two countries with long-established, extremely similar legal systems grounded in English common law. The SSAC considered that the impact on the SKA of legal considerations, laws, administrative procedures, regulations, and dispute resolution procedures is inherently more predictable and stable in the ANZ site since only one or two countries would be involved; they have common legal systems and laws; and the legal, regulatory, and business environments between Australia and New Zealand (as discussed above in Factor 9 and below) are substantially integrated. If only Australia is involved in the ANZ site, there would be only one legal system and set of laws. If New Zealand is involved, the Trans-Tasman Court Proceedings and Regulatory Enforcement Agreement (TTCPREA) between Australia and New Zealand enacted in 2010 provides coordination and mutual recognition and enforcement of court proceedings between Australia and New Zealand. There are presently no comparable bilateral governmental treaties and agreements between South Africa and the five other RSA consortium countries. Accordingly, it will be potentially highly problematic and certainly more complicated (and almost certainly more costly) to try to establish the SKA legal entities; obtain land entitlements and property; engage personnel; and construct, operate, and maintain the SKA. The SSAC was advised by the RSA delegation that a legal requirement in South Africa under the Broad-Based Black Economic Empowerment Act requires a specified minimum percentage of black South African ownership in any legal entity and a certain level of black South African employment unless a special discretionary advance exemption and permission is granted by the relevant South African authorities. This law may have an adverse impact on the SKA, either by requiring a creative legal ownership structure or (as was mentioned by the RSA delegation in the candidate interview) the imposition of a requirement that the SKA enter into a contractual obligation to separately fund and operate an approved training or other program(s) for black South Africans. (Such a program could possibly be used in lieu of and as an “equity equivalent” for the requirement of the legally required levels of black South African ownership and may also facilitate compliance with separate

Attachment 4. Factor Reports
114
local black South African mandatory employment requirements to employ black South Africans.) The Pinset Masons report additionally notes that the ability to coordinate the SKA under the RSA proposal was explained by South Africa with the statement that it will ensure that optimal administrative and legal processes are available in the countries outside South Africa. The report notes that “South Africa does not provide details as to how this will be achieved so as to enable a seamless interface for SKA with the southern African countries, and clarification should be sought in relation to South Africa’s role.”2 The response from South Africa’s delegation at the candidate interview was that it would undertake the efforts necessary to secure such cooperation with the consortium members; however, there currently are no intergovernmental treaties or governmental agreements for reciprocal enforcement of legal processes and court decisions entered into by South Africa with the five other RSA countries. With respect to the protection and enforcement of IPR in South Africa, the Pinset Masons report mentions a legal statute requiring, apparently, that IPR, if it is partially or wholly funded by the government of South Africa, be “commercialized for the benefit of South Africa,” and notes, “It is not clear how the SKA IPR can be commercialized for the benefit of South Africa” and that this issue will require further investigation.3 The report notes, “Systems for enforcement of IPR in Africa will vary from the norms in Europe and may vary from country to country within the continent.”4 The report additionally notes that the “ownership, scope and enforcement of IP[R] is likely to vary between jurisdictions.”5 However, the SSAC does not believe there will likely be any significant IPR generated in South Africa’s partner countries and that this issue is not likely to affect the SKA. If the SKA is sited only in Australia, there will be one set of IPR laws and court enforcement procedures. The annual 2011 international survey and report of corruption issued by the German-based nonprofit international organization Transparency International e. V. (funded by the European Commission, numerous major national governments, and international nonprofit foundations) entitled “2011 Annual Corruption Perceptions Index” ranked in descending order with New Zealand as number 1, Australia 8, Botswana 32, Namibia 57, South Africa 64, Zambia 91, Madagascar 100, and Mozambique 120. The World Bank publication “Doing Business 2012: Doing Business in a More Transparent World,” in its quantitative measure of factors that affect business operations, noted, “A fundamental premise of Doing Business is that economic activity requires good rules—rules that establish and clarify property rights and reduce the cost of resolving disputes; rules that increase the predictability of economic interactions and provide contractual partners with certainty and protection against abuse.”6 These 2012 World Bank rankings thus classify the legal

Attachment 4. Factor Reports
115
environment in Australia (ranked 15), New Zealand (3), South Africa (35), and the other RSA consortium members. With respect to environmental laws and related issues, particularly the requirement to provide EIA reviews, the RSA delegation confirmed at the candidate interview that EIA reviews will need to be done for each site in the six countries. The ANZ consortium advised at the interview that the SKA could likely be designated by Australia as a project of “national significance” and referenced the time lines for environmental approvals (page 76 of the ANZ supplemental submission). In the candidate interview, the Australian officials stated that the Australian government would be prepared to pursue designation of the SKA operational entity in Australia (whether organized in Australia or elsewhere) as an entity entitled to special privileges and immunities protection under relevant Australian legislation. The ANZ delegation also advised that if New Zealand is involved, the SKA could also be declared an “organization” under the New Zealand Diplomatic Privileges and Immunities Act 1968, with similar benefits. The South African delegation indicated that it was exploring whether the South African government could grant an exemption and status as an “international organization,” with various resulting privileges and benefits. Conclusion The SSAC concluded that the legal environment for the SKA described in the ANZ proposal was more integrated and established, with fewer cross-border legal issues, and that it presented fewer legal risks for the SKA. Thus, the ANZ site was considered somewhat better than the RSA site for this Factor. The SSAC vote on this Factor is 12.9 for ANZ and 7.1 for RSA. Future Monitoring In addition to the issues mentioned above, the Pinset Masons report notes that a careful legal review of the topics mentioned in the report will be required. There will also need to be a careful legal review and negotiation and entry into legal agreements between the SKA and the selected site to obtain for SKA the most favorable privileges, immunities, exemptions; secure the most favorable legal entity structure(s) (and tax structure(s)); and minimize the adverse effect of any laws, regulatory or administrative rules, ownership requirements, employment obligations, etc., on the SKA. The Pinset Masons report and the SSAC both note that a substantial amount of information needs to be obtained on the legal issues that may impact the SKA and that such data will need to be analyzed.
Attachment 4. Factor Reports
116
Additionally, if the RSA bid is chosen, the SKA will also need to be involved in careful legal consultation, review, negotiation, and entry into appropriate enforceable agreements; the possible formation of cross-border coordination entities; and the subsequent monitoring, enforcement, and implementation of the needed cross-border treaties, laws, regulations, and enforcement mechanisms to obtain enforceable agreements and thereafter secure and coordinate cross-border legal protections in the RSA partner countries. References 1 Pinset Masons Solicitors SKA Project Review of Candidates’ Responses to Section 10 of the Request for Information, November 8, 2011, page 3. 2 Ibid., page 10. 3 Ibid., page 11. 4 Ibid., page 12. 5 Ibid.

Attachment 4. Factor Reports
117
A4.11 Factor 11: Security Abstract
The SSAC examined and assessed security issues and their potential impacts on achieving the scientific goals of the SKA. A broad range of potential impacts was considered: loss of scientific results due to direct disruption during the construction and observational phases of the program, financial losses, and the difficulty of recruiting high-quality staff because of a negative perception of safety in the host country(ies).
The SSAC finds that adequate levels of security can be achieved at both proposed sites if appropriate measures are taken. At both sites, security of buildings at central locations could be achieved using standard practices and equipment. However, significant differences between the two sites exist in regard to security of personnel and security at the remote sites. The SSAC is satisfied that the levels of threats to personnel and to physical infrastructures in Australia are low and that adequate protection measures can be implemented with reasonable efforts and costs. The security environments in South Africa and the partner countries are significantly worse than those of Australia and New Zealand, necessitating additional efforts and costs to the project. Crimes against persons are a significant problem, especially in certain areas. Arranging travel between isolated locations would require special care, given the weaknesses of local law enforcement and other emergency response services. The SSAC is particularly concerned about security in Zambia, Mozambique, and Madagascar. In Mozambique, Madagascar, and Namibia, the situation is aggravated by political instability. If the RSA bid is selected, it is likely that it would be more difficult, but not impossible, to recruit high-quality nonlocal staff.
In conclusion, the SSAC finds that the ANZ site would be characterized by significantly better security than the RSA site and that ensuring adequate security in Australia would be simpler and less costly. It would also most likely be easier to recruit high-quality nonlocal staff for the ANZ site.
The SSAC vote on this Factor was 14.8 for ANZ and 5.2 for RSA.
Introduction
The SSAC examined and assessed security issues and their potential impacts on achieving the scientific goals of the SKA. A broad interpretation of these impacts was adopted: The SSAC considered the potential for loss of scientific results due to the direct disruption during the construction and observational phases of the program, financial losses, and the difficulty of recruiting high-quality staff because of a negative perception of safety in the host country(ies). Two aspects of security were considered.
Personal security has to be ensured in response to threats to all staff, spouses, partners, dependents, and visitors (e.g., assault, robbery, rape) and their property

Attachment 4. Factor Reports
118
(e.g., housebreaking, carjacking). All persons associated with SKA have a right to live and work in a safe environment.
Physical infrastructure security has to be ensured in response to threats of theft and vandalism to scientific and administrative buildings and their contents, to the remote antenna stations, to the data and power connections, and to other SKA assets such as vehicles and goods in transit across borders.
The SSAC made use of data and analyses contained in the report commissioned by SPDO from the Kroll Security Group (KSG). In some cases, as described below, the SSAC did not concur with that report’s conclusions.
Analysis and Assessment
General considerations, applicable to both bids
• The SSAC believes that adequate levels of security can be achieved at both proposed sites, if appropriate measures are taken. However, significant differences between the two bids were found, as described below.
• The security of buildings at central sites is relatively easy to achieve by use of standard equipment and practices such as exit and entrance monitoring by staff and automated equipment, video surveillance, and close collaboration with local authorities.
• Given the physical configuration of the SKA, security at the numerous remote antenna sites is especially important. The ANZ and RSA bids, as well as the KSG report, claim that remoteness itself can significantly enhance security, necessitating only modest physical measures (simple fencing, video cameras). The SSAC was not fully persuaded by this argument, since existing low crime levels may no longer continue once the SKA equipment is installed. Nor did the SSAC fully accept the argument (which somewhat contradicts the first) that residual local populations would effectively deter the activities of criminals from outside the community, whose presence would be conspicuous. This argument would not apply, for instance, to well-organized thieves or vandals who could systematically target multiple SKA sites.
• A full appreciation of the threats to security, and designing corresponding protective measures at central and remote locations requires a systematic vulnerability analysis, including a detailed assessment of items that could be a target for theft (for example, metals, batteries, generators). This argument can be generalized: The SSAC recommends that, no matter which site is chosen, a complete security analysis and implementation plan be prepared in cooperation with recognized, experienced experts.
Attachment 4. Factor Reports
119
Comparative assessment of the ANZ and RSA bids
The SSAC was satisfied that the levels of threats to personnel and to physical infrastructures in Australia are low and that adequate protection measures can be implemented with reasonable efforts and costs. In essence, the threat environment in Australia is comparable (or superior) to that in the developed countries that will fund the project and/or from which many SKA staff and users will originate (e.g., Europe, Eastern Asia, North America). In this assessment, the SSAC did not fully agree with the KSG assessment of its own data. The KSG report cites threats in Australia from “crime, natural disasters, and diseases as well as an increasing risk of terrorism.” While these hazards exist, their magnitude does not justify KSG’s designation of the overall threat level as “moderate” (one level higher than “low”).
The security environments in South Africa and in the countries that would host remote antennas (Botswana, Madagascar, Mozambique, Namibia, Zambia) were judged to be significantly worse than that of Australia, requiring additional efforts and costs to the project. Crimes against persons are a significant problem, especially in certain areas. It is acknowledged (as argued at the candidate interview by the RSA representatives) that longtime residents adopt practices that can significantly reduce exposure (e.g., avoiding unsafe locations or travel routes, equipping homes with protective fencing and monitoring equipment and alarms), but these may take time and experience to be comfortable with. Thus, it is likely that it would be more difficult, but not impossible, to recruit high-quality nonlocal staff if the RSA bid is selected.
In the case of the RSA bid, security in remote areas is also problematic, especially regarding travel between isolated locations and given the weaknesses in the effectiveness of local law enforcement and other emergency response services. The SSAC is particularly concerned about security in Zambia, Mozambique, and Madagascar. In Mozambique, Madagascar, and Namibia, the situation is aggravated by political instability. Thus, in the case of Zambia and for the risk category “Crime,” the KSG report enumerates: “Criminals have demonstrated a propensity for violence and frequently possess weapons. … Incidents [of] carjacking, mugging and commercial invasions are common throughout the country. … Weak police force (underpaid, poorly trained, and ill equipped) along with reports of widespread corruption within the ranks. … Police stations often lack adequate communication and transportation equipment.” Only a small number of SKA antennas would be located in these countries, but they are critical to the performance of the array. Accordingly, special procedures will need to be adopted to ensure adequate security for operations in the remote areas in southern Africa.
The SSAC found it difficult to make a comparison of insurance rates because to do so would require very detailed information about the details of SKA implementation at the two sites and the involvement of local insurance providers. Based on the limited information in the bids, the rates for property damage insurance and workers’ compensation were comparable for ANZ and RSA.
Attachment 4. Factor Reports
120
Conclusion
In conclusion, the SSAC finds that the ANZ site would be characterized by significantly better security than the RSA site and that ensuring adequate security in Australia would be simpler and less costly. It would also most likely be easier to recruit high-quality nonlocal staff for the ANZ site.
The SSAC vote on this Factor was 14.8 for ANZ and 5.2 for RSA.
Future Monitoring
No matter which site is chosen, the SSAC recommends that a complete security analysis and implementation plan be prepared in cooperation with recognized, experienced experts.
Attachment 4. Factor Reports
121
A4.12 Factor 12: Employment Abstract The SSAC agreed that South Africa’s partners in the RSA consortium will have a small effect on this Factor, and so the SSAC concentrated on the situation in South Africa. The SSEC Subcommittee’s report covered most of the ground and raised several questions that were answered in additional candidate replies and in the candidate interviews. The actual employment regimes appear comparable, and salaries appear to be in line with relative costs of living. The pool of skilled labor from which SKA would draw its staff is smaller in RSA. General unemployment in RSA is ~25%, in contrast with ~5% in Australia and New Zealand. The visa and work permit regimes are broadly similar. The SSAC was assured that the staff (and their spouses, partners, and dependents) the SKA would want to bring to either South Africa or Australia would have very little trouble getting visas and work permits. Australia does have quite strict rules on the recognition of professional qualifications, and potential SKA staff would have to study them carefully to understand the impact on their personal circumstances. The income tax regimes are similar, and their detailed impact will depend on individual circumstances. Both ANZ and RSA have double taxation agreements with most countries. Like taxation, pensions are a complex issue whose detailed impact will depend on individual circumstances, and SKA will have to address the pension issues with care. The possibility that the SKA entity could be given a range of rights, privileges, and immunities as an “international organization” by either host country emerged as a real possibility and could be very advantageous in several areas, such as visas and residence permits. The conclusion is that differences related to employment between ANZ and RSA are probably small, but a range of options remains to be explored in detail before the SKA structure is negotiated and established. There is no obvious reason why this should be more difficult in one or the other country, and none of this should pose a real risk to the SKA project. We note that South Africa has social legislation that could influence both staff employment and that of spouses, partners, and dependents, but organizations have seemed to work successfully within this legislation, and so it is seen as having a relatively minor impact on the SKA. Taken overall, ANZ is judged to be somewhat better than RSA because of the larger pool of potential employees, very low unemployment, sustained economic growth, and better opportunities for partners and dependents. The SSAC vote on this Factor was 12.5 for ANZ and 7.5 for RSA.

Attachment 4. Factor Reports
122
Introduction The RfI invited candidate sites to provide information relevant to the employment of international and domestic staff and on any potential impact on the construction and operation of SKA. The site candidates were asked for a summary of any legislation, proposed or existing, concerning employment and retention of a skilled workforce and were specifically asked to outline the requirements for and access to work permits, visas, time to acquire permits and visas, and appropriate immigration status for international SKA staff members and their dependents and for visitors to the SKA facilities. They were asked to also give a summary of the availability and the average cost of skilled labor in various key categories and to assess the opportunities for employment of spouses, partners, and dependents of SKA staff. The risk to the SKA is that employment legislation and immigration regulations impede the recruitment and retention of skilled staff, partners, or dependents, leading ultimately to delays in construction and compromises and inefficiencies in maintenance and operations. The SSAC’s assessment was informed by the Report of the SSEC Subcommittee on Employment and Working and Support Environment and the materials used by that subcommittee. The SSAC also made reference to information on the websites cited in the responses and related material. Analysis and Assessment The SSAC agreed that the regulations in force should allow all SKA employees to be on comparable terms and conditions, taking into account salaries and benefits, independent of where they come from and whether they are seconded or permanent employees. Not achieving this is very divisive and has impacts on staff morale, motivation, and commitment. The SSAC agreed that South Africa’s partners in the RSA consortium will have a small effect on this Factor, and so the SSAC concentrated on the situation in South Africa. The SSEC Subcommittee’s report covered most of the ground and raised several questions that were answered in additional candidate replies and in the candidate interviews. The actual employment regimes appear comparable, and salaries appear to be in line with relative costs of living. The pool of skilled labor from which SKA would draw its staff is smaller in RSA. General unemployment in RSA is ~25%, in contrast with ~5% in Australia and New Zealand. The visa and work permit regimes are also broadly similar. In RSA, SKA would have to apply for a corporate permit, which would allow it to bring in non-RSA staff. In addition, RSA has the Broad-Based Black Economic Empowerment Act, which could have a major impact on the direct recruitment of midlevel staff and on opportunities for partners and dependents.

Attachment 4. Factor Reports
123
ANZ does not seem to have the exact equivalent of a corporate visa, but the “employer nomination scheme” looks very similar. Failing that, non-Australian SKA staff would be required to apply for temporary business visas, which are valid for a maximum of four years and do not give access to all government services. Both types of visas permit partners and dependents, and the ANZ submission says they “can work without restriction.” It would appear that SKA would have to be an Australian company for these visa arrangements to work, but it could be an Australian subsidiary of a UK SKA company. The temporary visa should only be used for true short-term visits of less than four years. The situation in RSA does not appear to be much different, with rules being tight and nonautomatic procedures a potential cause for interpretation and delays. The SSAC was assured that the staff (and their spouses, partners, and dependents) the SKA would want to bring into Australia would have very little trouble getting Australian visas and work permits. Australia does have quite strict rules on the recognition of professional qualifications, and these could cause delays in some spouses, partners, or dependents obtaining work. These rules were explained to the SSAC is detail, and potential SKA staff would have to study them carefully to understand their impact on their personal circumstances. The income tax regimes are similar, and their detailed impact will also depend on individual circumstances. Note that income tax is levied on foreign income as well as income in both ANZ and RSA, but RSA states that expatriate employees who are present in South Africa for five years or less will be subject to income tax only on their South African income. This could be significant for some people. Both ANZ and RSA have double taxation agreements with most countries. Like taxation, pensions are a complex issue whose detailed impacts will depend on individual circumstances. There appear to be no major problems about continuing with offshore pension funds, but SKA will have to address pension issues with care. There are no problems in either country if someone with a resident visa wishes to purchase property. The possibility that the SKA entity could be given a range of rights, privileges, and immunities as an “international organization” by either host country emerged as a real possibility and could be very advantageous in several areas, such as visas and residence permits. Conclusion The differences related to employment between ANZ and RSA are probably small, but a range of options remains to be explored in detail before the SKA structure is negotiated and established. There is no obvious reason why this should be more difficult in one or the other country, and none of this should pose a real risk to the SKA project. We note that South Africa has social legislation that could influence

Attachment 4. Factor Reports
124
both staff employment and that of spouses, partners, and dependents, but organizations have seemed to work successfully within this legislation, and so it is seen as having a relatively minor impact on the SKA. Taken overall, ANZ is judged to be somewhat better than RSA because of the larger pool of potential employees, very low unemployment, sustained economic growth, and better opportunities for partners and dependents.
The SSAC vote on this Factor was 12.5 for ANZ and 7.5 for RSA.

Attachment 4. Factor Reports
125
A4.13 Factor 13: Working and Support Environment Abstract Both submissions provided the requested information. For the purposes of this report the SSAC considered, as stated in the RSA response, that non-African personnel would be based in or near Cape Town, South Africa. Perth, Australia, and Cape Town are large modern cities offering a complete range of modern educational, cultural, and financial facilities. They are very comparable as places to live and work, with good international communications. Of the towns closest to the proposed array cores, Geraldton, Australia, is larger and better resourced than Carnarvon, South Africa. A wide range of housing is available to rent or to buy in either major city. Rents in these cities appear to be similar but vary considerably according to location. SKA staff would be expected to use private healthcare, which seems to cost about the same in the two countries. Private healthcare is of an international standard. It is likely that SKA staff will in many cases opt for private schools, where there is a wide range of choice. Both Cape Town and Perth have international schools with multilingual teaching. The SSAC concluded that the two sites are comparable in many respects, although the nearby presence of Geraldton is a benefit in several important ways, allowing staff to live nearer the SKA central site and potentially making it easier to recruit and retain skilled local staff. Important issues such as the cost and availability of housing, access to private healthcare and education, and cultural and social activities seem similar, although poorer in the RSA consortium partners. However, it is not expected that international SKA staff will base themselves for long periods in the remote stations at either site. Taken overall, ANZ is judged as somewhat better than RSA in this Factor. The SSAC vote on this Factor was 12.1 for ANZ and 7.9 for RSA. Introduction The candidate sites were asked to provide information relevant to the attractiveness of the working and living environment for an international and well-educated staff, including spouses, partners, and dependents, and the availability of a skilled local workforce. They were asked to comment on the availability of secure, good-quality housing and healthcare, provisions for schooling, and transport and communications links to the rest of the world. Significant deficiencies in the working and support environment would impede the recruitment and retention of skilled staff and their spouses, partners, or

Attachment 4. Factor Reports
126
dependents, leading ultimately to delays in construction and compromises and inefficiencies in maintenance and operations, which in the end would have an impact on the delivery of science. Factor 13 is somewhat linked to Factor 8 and Factor 12. The SSAC’s assessment was informed by the Report of the SSEC Subcommittee on Employment and Working and Support Environment and the materials used by the subcommittee. The SSAC also made reference to information on the websites cited in the responses and additional provided materials. Analysis and Assessment Both submissions provided the requested information, and, as with Factor 12, it was clear that the RSA partner countries were much less important than South Africa itself. The SSAC therefore assumed, as stated in the RSA response, that non-African personnel would be based in or near Cape Town, South Africa, and so the assessment is based on this assumption. It was clear to the SSAC that Perth, Australia, and Cape Town are large modern cities offering a complete range of modern educational, cultural, and financial facilities. They are very comparable as places to live and work, with good international communications. Cape Town is in the same time zone as most of Europe, and Perth is in the same time zone as much of Asia. Cape Town is a well-established and internationally recognized tourist location, with a great deal to offer the visitor in the city itself and in the hinterland, with easy access to notable African visitor sites. In this respect, Perth, while an attractive city, has less to offer than Cape Town. Although Geraldton, Australia, is larger and better resourced than Carnarvon (South Africa), Kimberly (South Africa) is significantly larger than either but farther away from the core than Carnarvon. There appears to be a wide range of housing available to rent or to buy in either major city. Rents in these cities appear to be similar but vary considerably according to location: A cursory examination of real estate agents’ Internet sites shows plenty of properties available for rent in all categories. Geraldton offered much less choice but was somewhat cheaper than Perth. Foreign staff on temporary ANZ visas need to seek official approval, normally given without problems, to purchase property (as an alternative to renting over a long period). Security issues are dealt with under Factor 11, but it is worth remarking that private households in Cape Town seem to give security a higher priority than in Perth. SKA staff would be expected to use private healthcare, which seems to cost about the same in the two countries. SKA may wish to include this in the benefits package for staff. Private healthcare standards in both countries are to high international standards.

Attachment 4. Factor Reports
127
It is likely that SKA staff will in many cases opt for private schools, where there is a wide range of choice, including international schools offering teaching in languages other than English. The best private schools seem to charge about the same (there are quite large variations) and are generally selective and oversubscribed. Both Cape Town and Perth have international schools with multilingual teaching. Conclusion The discussions confirmed the SSAC’s general impressions and clarified remaining issues, such as cost of schools, etc. The SSAC concluded that the two sites are comparable in many respects, although the nearby presence of Geraldton is a benefit in several important ways, allowing staff to live nearer the SKA central site and potentially making it easier to recruit and retain skilled local staff. Important issues such as the cost and availability of housing, access to private healthcare and education, and cultural and social activities seem similar although poorer in the RSA consortium partners. However, it is not expected that international SKA staff will base themselves for long periods in the remote stations at either site. Taken overall, ANZ is judged as somewhat better than RSA in this Factor. The SSAC vote on this Factor was 12.1 for ANZ and 7.9 for RSA.

Attachment 4. Factor Reports
128
A4.14 Factor 14: Infrastructure Abstract Despite the wealth of detail in the submissions by the site candidates, the SSAC had to raise supplementary questions answered in, and after, the discussion on 7 December. These were essential in enabling the SSAC to reach its conclusion. The SSAC agrees with the conclusions in the report by Parsons Brinckerhoff. The SSAC was concerned that some aspects of the ANZ proposal would cost more than might have been expected. In response to points raised in the discussion on 8 December, very detailed information was provided by the ANZ delegation that confirms that the temporary and permanent accommodation was specified to an extremely high standard to attract high-quality staff and a more “economical” approach could have been adopted. The SSAC found the comparative cost review carried out by the SKA Project Office invaluable but in the end had to accept that it could not always understand the differences in costs between sections of the two submissions. Apart from the very much higher power costs in ANZ (dealt with under Factor 16), the estimated costs for annual operation and maintenance are virtually the same. Both sites should meet the needs of the SKA, and there are no disabling features. The risk to the project at either site is low. The RSA response has strengths in lower labor and materials costs and the (presumed) availability of accommodation and other facilities in Carnarvon. The weakness is the assumption that Carnarvon can supply the necessary accommodation and infrastructure at very low cost to the SKA. The risk is that this accommodation cannot be delivered and will have to be provided by SKA. The higher specification for the ANZ buildings can be seen as either a strength, in that they would attract high-quality staff, or a weakness, in that they would be significant cost drivers. RSA therefore has a somewhat stronger response and a low level of advantage over ANZ in this Factor. Introduction The candidate sites were asked to provide detailed site-specific plans for the model SKA including: roads, equipment and office buildings, construction camp or camps, airstrip, dish foundations, aperture array site preparation, bunkers, construction methods, and material sources (including proposals for usage of locally won materials and local techniques and labor/plant availability, etc.). They were asked to describe measures to be taken to ensure the security of the infrastructure components.

Attachment 4. Factor Reports
129
Excessive costs in providing the infrastructural needs of the project would directly affect the overall cost and could therefore affect scientific capability. The SSAC’s assessment was informed by the reports from Parsons Brinckerhoff and the comparative cost review carried out by the SKA Program Development Office (SPDO; Harris and Millenaar, 2011). These were supplemented by additional questions that were answered in advance of and during the discussions on 7–8 December, and subsequently enhanced by further answers to questions raised in the discussions. Analysis and Assessment Both site candidates provided the requested information. The RSA submission was prepared by Aurecon (formerly Africon), which had been engaged since 2005 in the development of cost models for infrastructure solutions to the SKA. Three separate infrastructure cost models have been developed prior to the 2011 exercise: the South African Infrastructure Cost Model of 2005; an Acquisition Differential Cost Report in 2010 that considers international differences in costs for infrastructure components; and a full Acquisition Cost Report in 2010 for the African SKA configuration. It is clear from the submission that Aurecon has a good understanding of the infrastructure requirements set out in the RfI. Despite the wealth of detail in the submissions, the SSAC could not reach a full understanding of the basis for some of the costings and had to raise supplementary questions and points that were answered in, and after, the discussion on 7 December, as a result of which it felt it had enough of an understanding to reach a conclusion. The SSAC agrees with the conclusions in the report by Parsons Brinckerhoff and notes that it says, “It is not possible to comment on the credibility of the overall summary costs,” a view shared by the SSAC. Its main concern is the assumption that a comparatively large fraction of the local staff can be housed in or near Carnarvon or in very basic constructed accommodations. The SSAC noted that “a 35% to 50% local labor component was assumed in calculating the accommodation requirements for the construction site. Considering the phasing of construction, a construction camp for approximately 195 people would be required for the first four years, and thereafter a camp for 300 people would be required for the remaining six years. The construction camp will be located in Carnarvon, and hence power, water, and sewer utilities would be supplied by the local municipality, resulting in cost savings of up to €10 million.” This is a significant imposition on a relatively small municipality, and there was no supporting statement on its feasibility from Carnarvon. The ANZ submission also provided a great deal of detail and relied on the assistance of experienced local companies and on recent experience in constructing the Murchison Radio-astronomy Observatory. The SSAC was concerned that some aspects of the ANZ proposal cost more than might have been expected, which could be because they were “overengineered” or “overspecified.” This proved hard to

Attachment 4. Factor Reports
130
verify from the submission, but in response to points raised in the discussion on 8 December, very detailed information was provided by the site candidates. These have to be accepted at face value but do confirm that the temporary and permanent accommodation is constructed to an extremely high standard in order to attract high-quality staff and a more “economical” approach could have been adopted. Similar comments apply to the dish foundations and bunkers. These issues should be explored further in future negotiations. The submission offers, in an appendix, an estimate of the confidence level that can be attached to the cost estimates. While a perfectly reasonable mathematical approach, this seems to give a higher level of confidence than would normally be assumed at this stage in a costing exercise. The SSAC agrees with the conclusions in the report by Parsons Brinckerhoff on the ANZ submission and notes that some of the concerns raised in that report about the cost estimates were (at least partially) answered by supplementary material provided after the Parsons Brinckerhoff review. The SSAC found the comparative cost review carried out by the SPO invaluable but in the end had to accept that it could not always understand the differences in costs between sections of the two submissions. A brief summary of capital costs for other than data and power is given in Table A4.14-1 below. Apart from the very much higher power costs in ANZ (dealt with under Factor 16), the estimated costs for annual operation and maintenance are virtually the same, at around €12 million.
Table A4.14-1. Capital Costs for Other than Data Transport and Power (These costs reflect the strengths and weaknesses of the two sites.)
ANZ (€M) RSA (€M) Comment
Roads 71 58 Labor and materials costs less in RSA
Equipment and Office Buildings 29 29 Same Accommodation – construction 30
5
RSA uses local accommodation plus
very low specification new build
Accommodation – operations and maintenance 17
Dish foundations, site preparation, and bunkers 371 179 Specifications differ,
RSA labor rates lower Airstrip 0 0.3

Attachment 4. Factor Reports
131
Conclusion Both sites should meet the needs of the SKA, and there are no disabling features. The risk to the project at either site is low. The RSA response has strengths in lower labor and materials costs and the (presumed) availability of accommodation and other facilities in Carnarvon. The weakness is the assumption that Carnarvon can supply the necessary accommodation and infrastructure at very low cost to the SKA. The risk is that this accommodation cannot be delivered and will have to be provided by SKA. The higher specification for the ANZ buildings can be seen as either a strength, in that they would attract high-quality staff, or a weakness, in that they would be significant cost drivers. RSA therefore has a somewhat stronger response and a low level of advantage over ANZ in this Factor. References Harris, G.D., and Millenaar, R.P. Nov. 2011, “Summary Report on Costs,” SKA
Document no. WP3-015.010.010-FR-001, revision A Parsons Brinkerhoff. Nov. 2011, “Infrastructure for the Square Kilometre Array:
Assessment of the South Africa Submission—Basic Infrastructure,” version 2 Parsons Brinkerhoff. Nov. 2011, “Infrastructure for the Square Kilometre Array:
Assessment of the Australia–New Zealand Submission—Basic Infrastructure,” version 2
Attachment 4. Factor Reports
132
A4.15 Factor 15: Data Transport Abstract Both site candidates have demonstrated the basic capabilities to provide solutions for the transport of data from receivers (central area and remote sites) to the data processor (DP), then to the supercomputer (SC), and on to the worldwide scientific community. But the complexity and size of the central data network (aka, reticulation) are quite likely beyond the experience and competence of current National Research and Education Networks, and capabilities need considerable strengthening. Replacing many components several times during SKA’s lifetime will be necessary. Accessibility thus should guide design and implementation. Total costs of the data system, passive plus active components, may well surpass €1 billion, necessitating serious inquiry of how to save lifetime costs, an example being the RSA proposal to colocate or integrate DP and SC. The SSAC looked at total costs; site candidates either included costs of some active components or were able to provide estimates. Cost estimates for three of the four parts of the data transportation system are quite comparable if the full costs of the DP–SC link to Cape Town and the costs of active components for the MRO–Perth connection are included. RSA costs for connectivity at the remote sites are relatively high, perhaps because of not-yet-mature competitive telecom markets. The SSAC identifies some strengths and weaknesses: • Providing data transport solutions (both capabilities and the legal framework)
from partner countries outside South Africa represents a low to medium potential weakness for RSA.
• The higher costs of connectivity to non-RSA sites are a low to medium level of weakness for RSA.
• If collocation or integration of the DP and the SC is feasible and affordable in RSA and not in ANZ, this will be a medium to high level of weakness for ANZ.
The SSAC concludes that in both ANZ and RSA, the basic capabilities exist to provide solutions for the data transport. But the complexity and size of the central network require additional capability building. The SSAC concludes that, based on the analysis of strengths and weaknesses, RSA has a medium level of advantage over ANZ.

Attachment 4. Factor Reports
133
Introduction The RfI requested the site candidates to provide solutions for the transport of data subdivided in four parts: the central network for transporting the data from the receivers in the central area (up to 180 km) to the data processor (DP); the transport from the remote sites to the DP; the transport from the DP to the supercomputer (SC) via a 400 Tbit/s link; and the connectivity to the worldwide scientific community. In addition to these unidirectional connections, a bidirectional 10 Gbit/s channel to all receivers is needed for operational monitoring and control. Timing and synchronization services must also be provided by a bidirectional optical link or via local clocks. The transport system should consist of the fiber network alone with termination points (including racks) at the receivers and at the DP. No active components are to be included. Analysis and Assessment The SSAC assessed whether strengths and weaknesses exposed in the submissions reflect significant advantages or disadvantages to building the SKA at either of the two candidate sites, or whether significant uncertainties exist that are not likely to be resolved before a site decision is made. Technical solutions proposed thus count less than capabilities of organizations or physical circumstances and potential costs: The best technical solution can most likely be implemented at both sites. But before analyzing and assessing the two submissions, the SSAC identified a few uncertainties and risks inherent to the long lifetime of the SKA and the size and complexity of the data transportation systems. Uncertainties and Risks Technological development in telecommunications occurs at a very fast rate. That may not greatly affect the basic layout of the data transport system when the SKA is projected to be built, but it implies that many of the components, including cables, will most likely have to be replaced several times during the lifetime of the SKA. Accessibility is therefore an important parameter for design, planning, and implementation. Technological development and competition will no doubt continue to drive down costs so that current cost estimates are highly uncertain. Nevertheless, the costs of the total data system, including the expensive active components (tailor-made solutions may not be much cheaper even if the data traffic structure is simple), are very considerable and might well surpass €1 billion at current prices, as indicated by the estimates of both site candidates. Assuming a full upfront investment of all capital costs, operational costs are rather low, all possibilities to save lifetime costs must therefore be carefully considered in the final design phase. One particular area for such consideration is the 400 Tbit/s link between the DP and the SC, which is going to be expensive. The preferred option of the RSA submission, namely to colocate or even integrate the DP and the SC at the operations center in order to

Attachment 4. Factor Reports
134
bypass the need for an optical link, therefore deserves serious consideration, whichever site is chosen. Incidentally, such an integral design for the DP and the SC may be squarely on the critical path for the SKA. In addition to the costs, other risks must be clearly identified and addressed in the early planning stages; the complexity and size of the central data network, for example, could be another item at or close to the critical path. The SSAC has seen estimates that it may take four years to build that part of the data transportation network. As well, the capabilities for its construction and operation need to be carefully assessed and probably will have to be built up since the complexity and size are quite likely beyond the experience and competence of current National Research and Education Networks (NRENs). Analysis and Assessment of Technical, Organizational, and Legal Aspects The SSAC believes that the solutions proposed by both ANZ and RSA demonstrate that the basic capabilities exist to provide the data transport infrastructure at each candidate site. ANZ relies on the research and education network AARNet to provide the solution for the central area. RSA proposes a dedicated organization, under the SKA, which may be linked to the RSA research and education network. The proviso is that the complexity and size of the central network and the challenge to manage the input of 3500 data sources into the DP center, which is uncharted territory, will require a considerable strengthening of these basic capabilities. For the remote sites, ANZ presents two options, connecting via a link to the nearest AARNet node or to the nearest commercial node. RSA has requested and received several propositions from commercial telecom providers. The current preference is for a managed bandwidth solution through one commercial provider for the stations within RSA, and another company, one of the new undersea cable providers, for the stations in other countries. If the complexity is managed correctly, both the ANZ and RSA solutions appear adequate, although all details for the transmission of data from sites located in RSA partner countries are not clear. Information provided on existing capabilities within these countries is limited, and there is no certainty on the capability of an operator to provide adequate data transmission services from these countries to the DP. In this respect, the RSA proposal is somewhat weaker than the ANZ one. Connections to astronomy sites around the world will not pose a problem; both ANZ and RSA have planned for an expansion of the international connectivity of their NRENs, and organizationally, the solution may well follow the CERN LHC model where a “democratic” configuration has been established of all interested networks and high-energy physics (HEP) sites. The solutions for monitoring and control, and for timing and synchronization, are not very elaborate. With regard to the latter, a solution through hydrogen masers is the preferred solution for RSA and an option for ANZ awaiting more advanced

Attachment 4. Factor Reports
135
options involving fiber. An eventual solution will also depend on an agreement within the international SKA community. The SSAC considers none of the proposals either a strength or a differentiating weakness. The SSAC noticed no problems with the legal context for providing data transport solutions in ANZ and RSA. There was, however, less information available for the legal situation in the partner countries outside of South Africa. This could pose a potential weakness for the RSA proposal. Analysis and Assessment of Costs The RSA submission gives detailed cost estimates based on explicit quotes from various companies for a variety of solutions, including managed bandwidth options for the remote sites. Costs for a managed bandwidth option for the DP–SC link, if needed, are also provided. The SSAC was assured by the RSA delegation that the managed bandwidth solutions include all the active components, such as transducers (the devices to transform electrical signals into optical ones and vice versa). Since the RfI requested costs only for passive components, the SSAC asked the ANZ delegation to provide a substantiation of the rough estimate given in the ANZ submission of the costs of the active components, in order to be able to make a comparison. The SSAC concluded that if the costs of a 400 Tbit/s DP–SC connection are also included for RSA, the cost estimates for three of the four parts of the data transportation system are quite comparable, which is not surprising since the active components that dominate the costs sell in the international market. The costs for the fourth part, data transport from the remote sites, are relatively high in the RSA proposal because of the sites located outside the RSA, and the SSAC suspects that the inclusion not only of active components but also the not-yet-mature competitive telecom markets is responsible for this. The SSAC notes the possibility of colocating or even integrating the DP and the SC. RSA has put the costs for the DP–SC link at zero for this very reason. ANZ maintains the SC in Perth but also indicates zero cost because the existing link of MRO to Perth would possess the required 400 Tbit/s capacity if the current operational best-of-class technologies is extrapolated to six years from now. The SSAC finds this quite reasonable, but that still leaves the high costs (the SSAC estimates these, based on the submitted data, to be several hundred millions of euros) of the active components. Colocating or integrating DP and SC therefore requires consideration, although such a scheme has a price. Concentrating more processing power near the array core will, of necessity, mean more electric power and some increase in the skilled labor available near the core site. Also, RFI protection is necessary, which in RSA is through a physical barrier. The SSAC is inclined to assume that collocation and integration (the crucial part is, of course, to be able to integrate data over frequency and time to compress the data output) are feasible in both cases, but if in the end this is available for RSA and not in ANZ, the resulting increase in costs represents a considerable weakness for ANZ.

Attachment 4. Factor Reports
136
Finally, the SSAC notes that in the definitive cost estimates, replacement of components several times during SKA’s lifetime must be taken into account. Strengths and Weaknesses • Not all details about the connectivity situation between the DP and the partner
countries outside South Africa are clear. The SSAC interprets this as a low level weakness, as the telecom situation is bound to improve.
• Neither of the proposals for monitoring and control and timing and synchronization are explained in detail, but the SSAC finds nothing at this stage either a strength or a differentiating weakness.
• Not much information is given on the legal situation for providing data transport solutions from the partner countries outside of South Africa. The SSAC believes this poses a potential weakness for the RSA proposal, qualified as low to medium.
• The SSAC sees the higher costs of the connectivity to non-RSA sites as a low to medium level of weakness for RSA.
• If collocation and integration of the DP and the SC are feasible and affordable in RSA and not in ANZ, we judge this to be a medium to high level weakness for ANZ.
Conclusion The SSAC concludes that in both ANZ and RSA, the basic capabilities exist to provide solutions for the data transport. But the complexity and size of the central network require additional capability building. The SSAC concludes that, based on the analysis of strengths and weaknesses, RSA has a medium level of advantage over ANZ.

Attachment 4. Factor Reports
137
A4.16 Factor 16: Power Abstract The candidate sites were asked to provide the general system set-up and basic parameters of the power system to allow assessment and comparison of the power supply arrangements for the candidate sites in terms of technical feasibility and suitability, availability and reliability, capital and operational costs, operational requirements, construction issues, and the impact on RFI. This Factor is a major issue for the SKA because of the high level of power consumption, ~110 MW, specified in the RfI. The risk to the SKA is that providing power system needs of the project will be difficult and/or excessively costly in installation and/or operations. Our conclusion is that both submissions are compliant and will meet the needs of the SKA, but that RSA has two significant strengths. The first is the lower capital investment required to power the array, due to more ready access to grid power. The second is the lower cost for power in South Africa during the operational era. Given the fundamental difference in the ability to provide power from the grid, the SSAC concludes that RSA has a high level of advantage over ANZ. Introduction The candidate sites were asked to provide the general system set-up and basic parameters of the power system to allow assessment and comparison of the power supply arrangements for the candidate sites in terms of technical feasibility and suitability, availability and reliability, capital and operational costs, operational requirements, construction issues, and the impact on RFI. The risk to the SKA is that providing power system needs of the project will be difficult and/or excessively costly in installation and/or operations. Analysis and Assessment The SSAC based its assessment on the material supplied in the responses from both candidate sites, informed by the reports from Parsons Brinckerhoff (“Power Supply for the Square Kilometre Array, Assessment of the South African Site Submission—Power” and the report “Assessment of the Australian Site Submission—Power”) and the comparative cost review carried out by the SKA Program Development Office (SPDO; Harris and Millenaar, 2011). These were supplemented by additional questions, which were answered in advance of the candidate interviews on 7–8 December and further addressed in those discussions.

Attachment 4. Factor Reports
138
Strengths and Weaknesses Both candidate submissions provided the requested information, and neither submission was deemed to have disabling characteristics. Both responses offer solutions that use proven methods that meet standards and common construction practices and resulted in medium strengths for both. Both responses appear to have been supported by competent civil engineering organizations. Many areas of both responses are developed to a high level of detail, with evidence that multiple options were explored at various levels of the design; this provided a medium strength for both. From a review of the responses, the consultant’s reports, and the responses to questions, it is clear that both sites can meet the requirement provided in the RfI. In both proposals, the cost of power dominates the operations cost. While both candidate sites can meet the requirements for power, RSA has a clear advantage, which results in a high strength. The basis of this advantage is that power for RSA is essentially supplied from the grid. The ANZ site, due to remoteness and lack of power infrastructure in this region of Australia, requires longer transmission lines and more off-grid generation supply, with significant use of diesel. This results in a corresponding weakness for ANZ. This on-grid advantage is also reflected in lower operations cost for RSA, resulting in a high strength for RSA. This advantage in operations cost comes from the economies of scale of being on the grid and the lower projected cost of power in RSA. RSA with lower capital and power cost has a significant cost advantage, as shown in Table A4.16-1. Table A4.16-1. Comparison of Capital Power Costs and Total Operations Costs
ANZ (€M) RSA (€M) Comment
Power-Capital Cost 331,478,500 131,968,000
Reflects RSA ability to utilize grid more readily
Power-Operation and Maintenance Cost per Year
124,000,000 49,798,000
Reflects lower power cost in RSA and grid access
A few areas could narrow the gap in capital cost. The RSA, for example, uses overhead lines within the array, whereas more expensive underground lines were required in the RfI to minimize RFI. This results in only a low weakness for RSA because its submission provides the cost estimates to provide the underground lines, and the cost increase was not significant. RSA also maintains that the topology of the site would provide the necessary RFI shielding in any event.

Attachment 4. Factor Reports
139
Although some quantities in each proposal are not fully backed up by detailed design, they seem reasonable based on similar European experience by our experts. While these and other differences may reduce the gap somewhat, the RSA proposal appears to have a very significant cost advantage in this Factor due to lower capital and annual operations cost for power. An additional medium strength in the RSA response is that in the long term, being on-grid is more likely to make the option of purchasing renewable energy easier and more affordable as economies of scale again come into play. Conclusion Our conclusion is that both submissions are compliant and will meet the needs of the SKA, but that RSA has two significant strengths. The first is the lower capital investment required to power the array, due to more ready access to grid power. The second is the lower cost for power in South Africa during the operational era. Given the fundamental difference in the ability to provide power from the grid, the SSAC concludes that RSA has a high level of advantage over ANZ. Future Monitoring While the cost for power is significantly lower in RSA that ANZ, it is projected to rise significantly in the future to fund new generating capacity to meet RSA’s growing needs. While current projections still result in a significant cost advantage for RSA, this area need to be closely monitored since it is by far the single largest component of the total operating budget of the SKA. Reference Harris, G.D., and Millenaar, R.P. Nov. 2011, “Summary Report on Costs,” SKA
Document no. WP3-015.010.010-FR-001, revision A

Attachment 4. Factor Reports
140
A4.17 Factor 17: Consolidated Costs Abstract This Factor is essentially a composite of Factors 14–16 and should not be considered as an independent Factor. The higher infrastructure costs given by ANZ are largely due to higher building specifications to attract high-quality staff and inherent labor costs and could, in principle, be reduced. The data transport costs are still somewhat uncertain, but the RSA response with the data processor (DP) and supercomputer (SC) collocated gives a medium strength advantage over ANZ. A particular strength of RSA is in the provision of power, because RSA has access to grid-based power distribution whereas ANZ must rely on longer transmission lines and more off-grid generation supply. This advantage is potentially very substantial over the projected lifetime of the SKA. The submissions show that both candidates could successfully host the SKA and that there are no disabling features for either candidate. The principal strengths of the RSA response are lower infrastructure costs, the collocation of the DP and the SC, and the ability to take power from the national grid. The RSA weaknesses are in the connectivity to non-RSA sites and the assumptions that low-cost infrastructure and existing accommodation will be adequate for the SKA’s needs. The SSAC believes that RSA has a high level of advantage over ANZ in the consolidated costs. Introduction The candidate sites were asked to provide detailed site-specific plans for the model SKA for infrastructure (Factor 14), data transport (Factor 15), and power (Factor 16). The SSAC was asked to provide a consolidated overview of these costs. The SSAC’s assessment used external expert reports and was considerably helped by the comparative cost review carried out by the SKA Project Development Office (SPDO; Harris and Millenaar, 2011). These reports and the review were supplemented by additional questions answered in advance of the candidate interviews on 7–8 December and further addressed in those discussions, and subsequently enhanced by answers to questions raised in the discussions. This consolidated report relies on the individual reports on Factors 14–16 and should not be considered as an independent Factor. Analysis and Assessment A detailed assessment of the three Factors 14–16 is given under their own headings. The relative costs collated in the SPDO Report show the distribution between main headings and are inserted below:

Attachment 4. Factor Reports
141
The SSAC suspects that the representation of the costs of data transport (both capital and operations) for the remote sites in the RSA submission is incorrect, in part because the RSA figures include active components. However, the SSAC agrees, as it mentions in its report on Factor 15, that even then, the costs for the RSA remote sites are higher, potentially compensated by an advantage in colocating the data processor (DP) and the supercomputer (SC). The SPDO report mentioned above raises several “noteworthy differences” that the SSAC has partially succeeded in resolving following the candidate interviews on 7–8 December and the answers received to supplementary questions. In particular, the higher ANZ infrastructure costs can be largely ascribed to higher specifications in order to attract high-quality staff and inherent labor costs and could, in principle, be reduced. Uncertainties remain in the data transport costs, but since power represents more than 80% (RSA) or even 90% (ANZ) of the operations costs, the significant power advantage for RSA is maintained. Developments in both IT connectivity and in power distribution should be monitored for both sites. Conclusion Both responses show that they could successfully host the SKA and that there are no disabling features. The principle strengths of the RSA response are: lower infrastructure costs, the collocation of the Data Processor and the Supercomputer, and the ability to take power from the National Grid. The RSA weaknesses are in the connectivity to non-RSA sites and the assumptions that low cost infrastructure and existing accommodation will be adequate for SKA’s needs. Risks to the project are slight and mainly concern the connectivity to the remote non-RSA sites and the RSA infrastructure. The SSAC believes that RSA has a high level of advantage over ANZ in the consolidated costs. Reference Harris, G.D., and Millenaar, R.P. Nov. 2011, “Summary Report on Costs,” SKA
Document no. WP3-015.010.010-FR-001, revision A
Capital (MEUR, rounded) Annual Operations and Maintenance (MEUR)
ANZ 1004 130.7 RSA 741 61.7

Attachment 4. Factor Reports
142
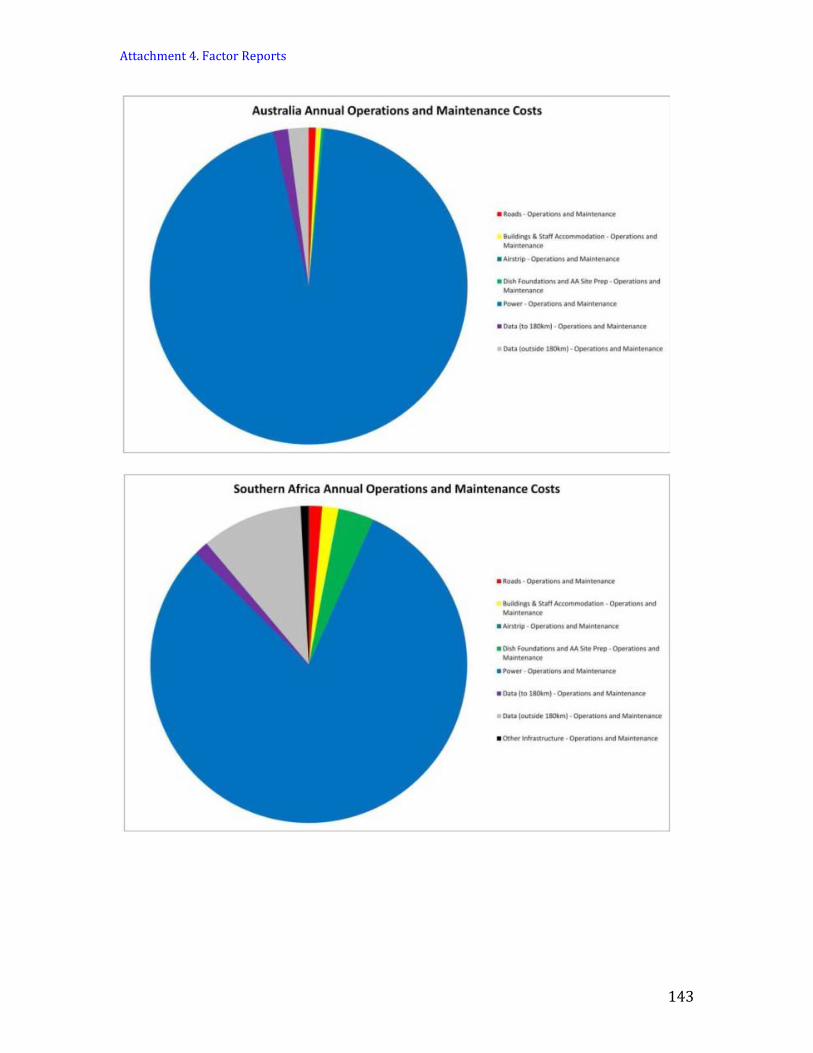
Attachment 4. Factor Reports
143

Attachment 5. Robustness Analysis
144
Attachment 5. Robustness Analysis A5.1 Abstract The robustness of the result of scoring on the Factors in Categories A and B was tested by determining its sensitivity to a variety of tests. These consisted of a number of “what if” alterations to see whether the conclusions could be altered by an alternative set of conditions. The final numerical outcome of the voting was calculated by first calculating the score for each Factor. The weighted average of the Factor votes were then combined to give a final score in favor of RSA: 9.60 ± 0.09 to ANZ and 10.40 ± 0.09 to RSA. The uncertainty quoted is a formal estimate of the standard error of the mean. Its true significance is established by the robustness tests described below. Note that the votes can also be averaged over the Factors to give the weighted vote for each SSAC member. This distribution of votes is shown in Figure A5-3 (see below). The statistical behavior of voting patterns was examined by combining all individual scores after normalizing for the means and standard deviations of the Factor votes, yielding the results in Figure A5-2 (see below). The results are consistent with a Gaussian distribution. The robustness tests applied to individual data points included (1) censorship of data outliers; (2) a bootstrap or resampling analysis of all data; and (3) deletion of voting members, one at a time. In all of these tests, there was no significant variation in the result, with ANZ scores* varying from 9.51 to 9.69 overall, with uncertainties similar to that for the unaltered data. The individual weights of RFI Factors 2, 3, and 4 were constrained by the ToR to have a sum of 0.27, so that the SSAC was free to vary this from the adopted value of 0.09 for each. Cycling through permutations of 0.03/0.12/0.12 produced 9.47, 9.56, and 9.76, i.e., no significant change. Although a variation in the specified ratio of 0.75/0.25 for Factor groups A/B was not under the control of the SSAC, the ratio was varied to show its importance in the overall outcome any imbalance. A hypothetical change of the weight to 0.66/0.34 would make the vote a tie. The broad conclusion was that the final result obtained from the scores is significant and robust and not the consequence of some peculiarity of the voting procedure or voting body. A5.2 Introduction The voting was conducted separately for each Factor, with each SSAC member anonymously providing a numerical score, a higher score being more favorable. The
* Hereinafter, a single score refers to the ANZ scale. The score for RSA is given by: RSA (scale) = 20 – ANZ (scale).

Attachment 5. Robustness Analysis
145
Factors are divided into two categories. The first category (1–7) comprised the technical Factors (Category A) and the second category (8–13) comprised the nontechnical Factors (Category B). Weights were assigned according to the SSAC Terms of Reference document. Twenty points were distributed over the two sites (ANZ and RSA). For this discussion, only the ANZ scores are given. The individual RSA scores are therefore given by (20 – ANZ score). The following terminology is used in this section: Vote: individual vote by each of 12 SSAC members on each of 13 Factors (156 votes) Member vote: vote averaged over Factors for each SSAC member (12) Factor vote: vote averaged over SSAC members for each Factor (13) Final Score: the final single number characterizing the outcome of the consideration
of all 13 Factors A5.3 The Result The data comprising 156 votes, cast on 9 December 2011 and confirmed at the January meeting, by the 12 members on each of 13 Factors were analyzed in the following way. The averaging was first done with respect to SSAC member for each Factor, to arrive at estimates of the mean and standard deviation of the mean for each Factor. The bar chart of all the Factor distributions is shown in Figure A5-1. The weighted average of the Factor votes was then calculated and the errors propagated, to derive the overall mean score and the standard deviation of the mean, of 9.60 ± 0.09, favoring RSA. Note that even though ANZ won 7 of 12 Factor votes, RSA won 5, and Factor 1 was a tie, the Factor-weighted vote favored RSA. A5.4 Data Overview To check the first-order statistics of the voting data, each vote was normalized by the mean value and rms deviation for the Factor it belonged to. Factor 1 could not be included in this particular analysis because its votes were all 10/10, giving it a standard error of zero. The distribution of these normalized votes is nearly a Gaussian distribution, as shown in Figure A5-2. Even though the distribution of votes was statistically consistent with a Gaussian distribution and no clear “outliers” could be identified, for the sake of due diligence, the data were censored (aka, culled) using certain criteria. The results are described below and shown in Table A5-1. We calculated all the median values and mean absolute deviations from the mean values. These calculations show that the rms deviations are very close to (π/2)1/2 times the mean absolute deviations, implying that the statistics are close to Gaussian. Hence, there is no need to consider mean absolute deviations to mitigate the effect of outliers.

Attachment 5. Robustness Analysis
146
Figure A5-1. The average of each Factor vote (plotted on ANZ scale). The height of each bar is the assigned weight for the Factor.
Figure A5-2. The distribution of all votes (12 members times 12 Factors = 144 votes, with Factor 1 excluded), normalized by the Factor mean and standard deviation. The positive deviations are for ANZ, and the negative ones for RSA. The solid curve represents the expected numbers for a Gaussian distribution with a standard deviation of 1.0.
Figure A5-3. The distribution of Factor-weighted votes of each SSAC member on the ANZ scale, i.e., a vote greater than 10 favors ANZ, and less than 10 favors RSA.

Attachment 5. Robustness Analysis
147
Table A5-1. Results of Censored Data Tests and Weight Change Analysis
No. of Std. Test Method Votes Score Error a no deletions 156 9.60 0.09 b delete max and min of member votes 132 9.60 0.08 c delete voter 1 144 9.69 0.09 delete voter 2 144 9.67 0.09 delete voter 3 144 9.66 0.09 delete voter 4 144 9.64 0.09 delete voter 5 144 9.63 0.09 delete voter 6 144 9.60 0.09 delete voter 7 144 9.58 0.09 delete voter 8 144 9.57 0.09 delete voter 9 144 9.56 0.09 delete voter 10 144 9.56 0.09 delete voter 11 144 9.53 0.10 delete voter 12 144 9.51 0.10 d delete max and min vote for each Factor 130 9.58 0.08 e remove max/min most deviant votes 154 9.55 0.08 remove 5 votes greater than 2σ deviation 151 9.56 0.08 f change weighting of Factors 2/3/4 to .03/.12/.12 156 9.76 0.09 change weighting of Factors 2/3/4 to .12/.03/.12 156 9.47 0.09 change weighting of Factors 2/3/4 to .12/.12/.03 156 9.56 0.09 g change weighting of Factors A/B to 0.66/0.34 156 10.00 0.09 change weighting of Factors A/B to 0.58/0.42 156 10.40 0.10 We have performed bootstrap analyses (i.e., creating a large number of new data sets by the “sample-with-replacement” method) on the full data set. The purpose was to test whether the direct calculations might reflect a peculiar sampling of the parent population. The scores and rms deviation estimates were nearly identical to those from direct calculations. There are five normalized votes greater than 2σ (see Figure A5-2), the largest one being 2.6σ. For 144 votes, the most likely number of votes greater than 2σ is between 6 and 7, and the probability of getting 5 or more votes greater than 2σ is 0.80. Hence, the vote distribution is statistically quite “normal,” i.e., there really are no “outliers” to deal with. Nevertheless, we report the effects of sequentially trimming the largest positive and negative votes and also trimming all five votes

Attachment 5. Robustness Analysis
148
above 2σ (see Summary Table A5-1). We note that two of the five outliers belonged to Factor leaders voting on their Factors. Deletion of one voter sequentially from the analysis changes the ANZ rating between 9.51 and 9.69 (9.60 for all 12 voters). The variation has little effect on the results. In the Factor averaging method, deletion of the maximum and minimum votes in each Factor average also changed the result very little, i.e., the score becomes 9.58 ± 0.08. Finally, we calculated the combined weight vote for each SSAC member, averaging over the Factors. The result is shown in Figure A5-3. The distribution is remarkably uniform, in a statistical sense, from 8.6 to 10.6. This result may be due to the breadth and diversity of the appointed committee. Results from a polarized committee would have resulted in a bimodal distribution, whereas results from a more homogeneous committee would have resulted in a Gaussian distribution. Conclusion: The voting “body” is remarkably statistically homogeneous. A5.5 Censoring the Data The following list shows the schemes that were used to test for the effects of censoring the score data and the summary of results (see Table A5-1 for complete results):
(a) no censoring: score = 9.60 ± 0.09 (b) remove max and min of the member voters: score = 9.60 ± 0.08 (c) remove each voter sequentially: score range = 9.51 to 9.69 (d) remove max and min votes in each Factor average: score = 9.58 ± 0.08 (e) remove 2 and then 5 most deviant votes overall: score range = 9.55 to 9.56
The formal uncertainties mostly reflect the change in sample size and do not have any other statistical significance. Note that use of the smaller standard error (e.g., from removing 5 points over 2σ) to claim increased accuracy would be totally inappropriate (i.e., non-statistical data culling) and is discussed here only for illustrative purposes. A5.6 Weighting Factor Analysis The only weighting factor issue determined by the SSAC was to divide the 0.27 allocated to Factors 2, 3, and 4 into equal weights of 0.09 each. Sequentially changing these relative factors among 0.03/0.12/0.12, 0.12/0.03/0.12, and 0.12/0.12/0.03 changes the rating to 9.76, 9.47, and 9.56, respectively. Discussion of other weighting factors is beyond the responsibility of the SSAC. However, as a test of the effect of varying these weights, they were varied as shown in Figure A5-4. As an example, varying the weight ratio from A/B of 0.75/0.50%

Attachment 5. Robustness Analysis
149
(with the outcome of 9.6) to 0.66/0.34 yields for ANZ a score of 10.0, and changing to 0.58/0.42 gives it a rating of 10.4 (reversing the outcome). The reason the final result depends so clearly on the relative weights of Factors A and B is because RSA won five of the six Factors in Category A and ANZ won six of six Factors in Category B. This is a critical “fault line” between the Technical and Scientific Factors and the Other Selection Factors.
Figure A5-4. The voting outcome on the Factors in Categories A and B, based on a hypothetical change in the relative weights of 0.75 and 0.25, respectively, assigned by the SSG. A Factor A weight greater than 0.66 favors RSA, and below 0.66 favors ANZ. A5.7 Conclusion A number of robustness tests were carried out by examining the nature of the statistical distribution of votes, the effect of discarding outliers and discarding voting members (one at a time). The Factor weights were varied systematically to examine the sensitivity of the final result to the predetermined weights, with the result that a considerable variation is required to reverse the final result. We have noted a split in the result between technical (A) and nontechnical (B) Factors. The broad conclusion was that the final result obtained from the scores is significant and robust and not the consequence of some peculiarity of the voting procedure or voting body.