report by the government actuary on: the draft social
TRANSCRIPT
Report by the Government Actuary on:The draft Social Security Benefits Up-rating Order 2021; andThe draft Social Security (Contributions) (Rates, Limits and Thresholds Amendments and National Insurance Funds Payments) Regulations 2021

Presented to Parliament pursuant to section 142(1) of the Social Security Administration Act 1992, as amended by the Social Security Contributions (Transfer of Functions, etc.) Act 1999 and sections 150(8), 150A(5) and 151A(6) of the Social Security Administration Act 1992.
Report by the Government Actuary on:The draft Social Security Benefits Up-rating Order 2021; andThe draft Social Security (Contributions) (Rates, Limits and Thresholds Amendments and National Insurance Funds Payments) Regulations 2021
© Crown copyright 2021
This publication is licensed under the terms of the Open Government Licence v3.0 except where otherwise stated. To view this licence, visit nationalarchives.gov.uk/doc/nationalarchives.gov.uk/doc/open-government-licence/version/3open-government-licence/version/3.
Where we have identified any third party copyright information you will need to obtain permission from the copyright holders concerned.
This publication is available at www.gov.uk/official-documentswww.gov.uk/official-documents.
Any enquiries regarding this publication should be sent to us at [email protected].
ISBN 978-1-5286-2365-0
CCS1220755574 01/21
Printed on paper containing 75% recycled fibre content minimum
Printed in the UK by the APS Group on behalf of the Controller of Her Majesty’s Stationery Office

To: The Right Hon. Thérèse Coffey MP, Secretary of State for Work and Pensions
The Right Hon. Jesse Norman MP, Financial Secretary to the Treasury
I am pleased to present my report on the potential effects on the National Insurance Fund of the draft Social Security Benefits Up-rating Order 2021 and the draft Social Security (Contributions) (Rates, Limits and Thresholds Amendments and National Insurance Funds Payments) Regulations 2021.
This report is made in accordance with section 142(1) of the Social Security Administration Act 1992, as amended by the Social Security Contributions (Transfer of Functions, etc.) Act 1999 and sections 150(8), 150A(5) and 151A(6) of the Social Security Administration Act 1992.
Martin Clarke Government Actuary January 2021
4 Report by the Government Actuary on: The draft Social Security Benefits Up-rating Order 2021; and The draft Social Security (Contributions) (Rates, Limits and Thresholds Amendments and National Insurance Funds Payments) Regulations 2021
Contents1 Executive summary 5
2 Principal estimates for receipts, payments and the Fund balance 11
3 Variant estimates for receipts, payments and the Fund balance 16
Appendix A: Revised 2020-2021 estimates 20
Appendix B: Main benefit rates 22
Appendix C: Main features of the contribution system 24
Appendix D: Key assumptions 26
Appendix E: Data, methodology and other assumptions 31
Appendix F: NICs split by NIF and NHS 43
Appendix G: Variant projections of the Fund to 2025-2026 44
At GAD, we seek to achieve a high standard in all our work. We are accredited under the Institute and Faculty of Actuaries’ Quality Assurance Scheme. Our website describes the the standardsstandards we apply.

1 Executive summary 5
1 Executive summary1.1 This report sets out my opinion of the effect on the Great Britain National Insurance Fund
(“the Fund”) of the proposed up-rating of contributory benefits announced in a written ministerial statement on 25 November 2020 and changes to the National Insurance Contributions (NICs) rates, limits and thresholds as set out in the:
• draft Social Security Benefits Up-rating Order 2021 (“the draft Order”)
• draft Social Security (Contributions) (Rates, Limits and Thresholds Amendments and National Insurance Funds Payments) Regulations 2021 (“the draft Regulations”).
1.2 The main results of this report show the:
• impact of the draft Order and the draft Regulations on the Fund in the financial year 2021-2022
• projected financial position of the Fund to 2025-2026
• balance of the Fund as a proportion of benefit payments
1.3 The outbreak of the coronavirus pandemic has had a bearing on the Fund because of the consequential effects on levels of employment, the average earnings growth used in the “Triple Lock” mechanism and on excess deaths. The main results of this report take into account the experience of the pandemic on the Fund so far this year. The assumptions I have used to project the Fund into the future make allowances for its continuing effects and are consistent with the OBR’s most recent economic forecast.
1.4 The projections in this report are more uncertain than would typically be the case because of the unprecedented situation that the coronavirus has created. For example, my projection of receipts over the financial year 2020-2021 is £5.4bn lower than was projected in my equivalent report last year. More details on how the pandemic has impacted on this report are detailed in the relevant sections (see paragraphs 3.6, 3.17 to 3.19, A.3, D.4 to D.5, D.9 to D.13, D.19 to D.23, E.11 and E.28 to E.32).
1.5 This report does not consider the Northern Ireland National Insurance Fund.
6 Report by the Government Actuary on: The draft Social Security Benefits Up-rating Order 2021; and The draft Social Security (Contributions) (Rates, Limits and Thresholds Amendments and National Insurance Funds Payments) Regulations 2021
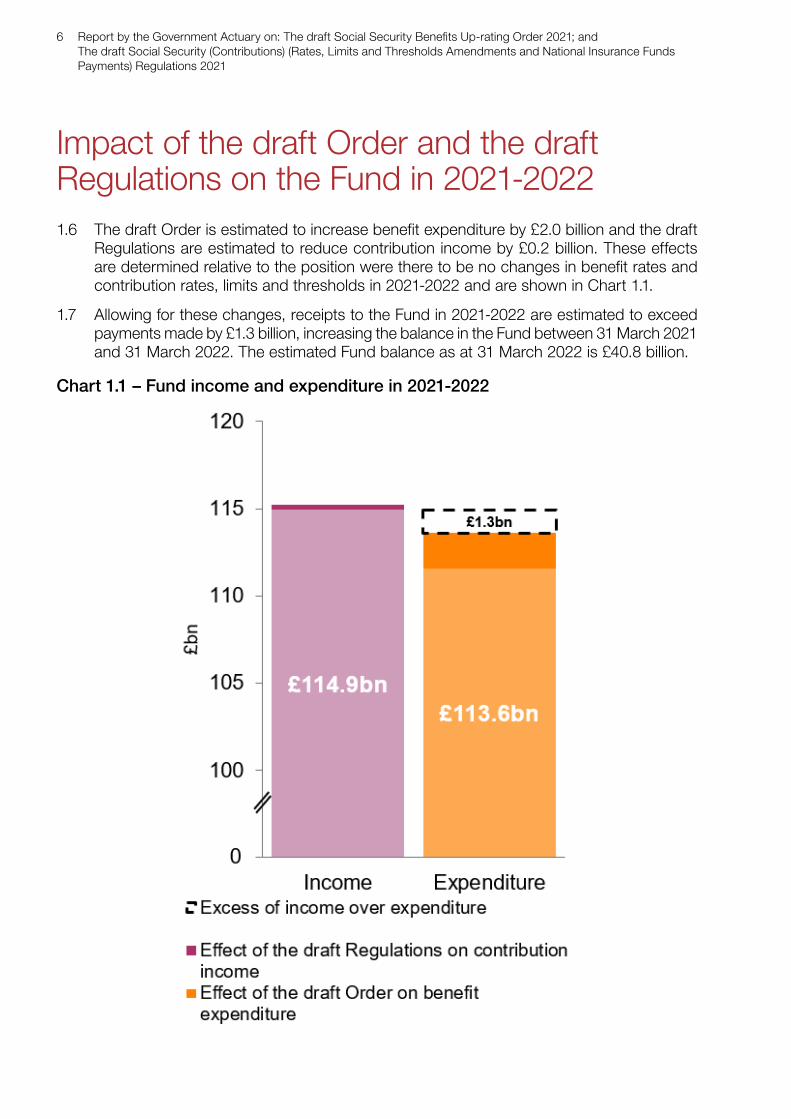
Impact of the draft Order and the draft Regulations on the Fund in 2021-20221.6 The draft Order is estimated to increase benefit expenditure by £2.0 billion and the draft
Regulations are estimated to reduce contribution income by £0.2 billion. These effects are determined relative to the position were there to be no changes in benefit rates and contribution rates, limits and thresholds in 2021-2022 and are shown in Chart 1.1.
1.7 Allowing for these changes, receipts to the Fund in 2021-2022 are estimated to exceed payments made by £1.3 billion, increasing the balance in the Fund between 31 March 2021 and 31 March 2022. The estimated Fund balance as at 31 March 2022 is £40.8 billion.
Chart 1.1 – Fund income and expenditure in 2021-2022
1 Executive summary 7
Projected financial position of the Fund to 2025-2026
1 https://www.gov.uk/government/publications/government-actuarys-quinquennial-review-of-the-national-https://www.gov.uk/government/publications/government-actuarys-quinquennial-review-of-the-national-insurance-fund-as-at-april-2015insurance-fund-as-at-april-2015
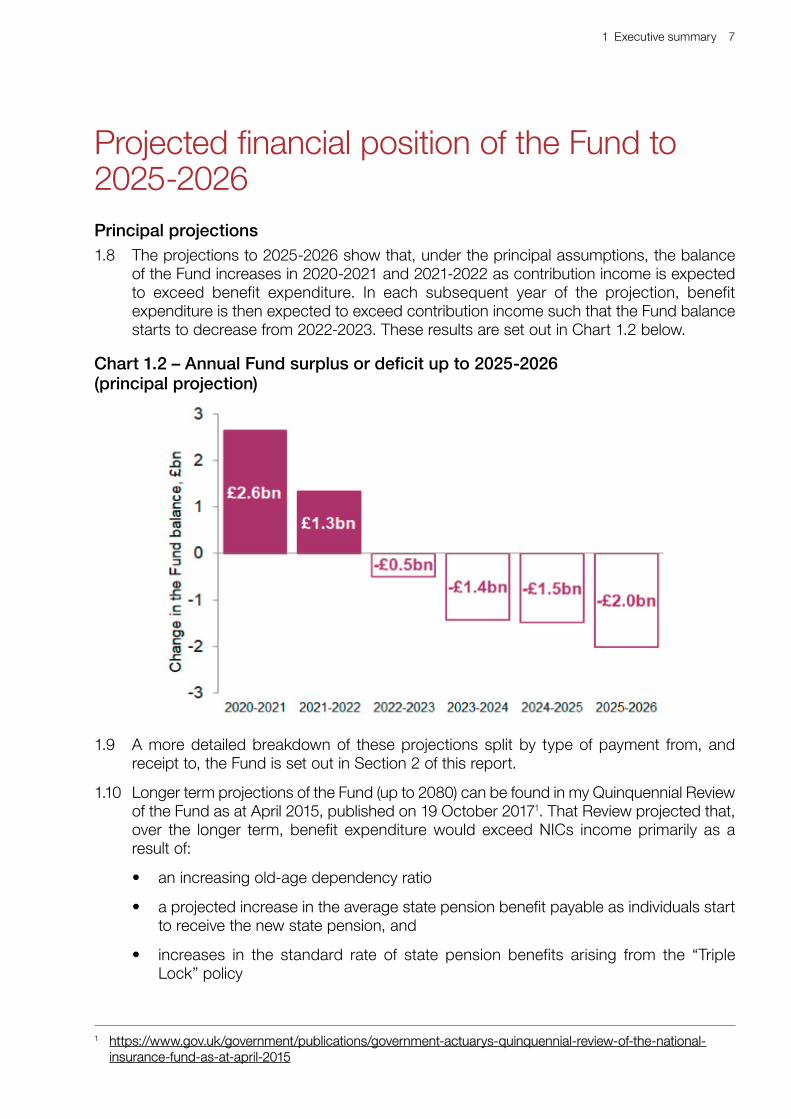
Principal projections1.8 The projections to 2025-2026 show that, under the principal assumptions, the balance
of the Fund increases in 2020-2021 and 2021-2022 as contribution income is expected to exceed benefit expenditure. In each subsequent year of the projection, benefit expenditure is then expected to exceed contribution income such that the Fund balance starts to decrease from 2022-2023. These results are set out in Chart 1.2 below.
Chart 1.2 – Annual Fund surplus or deficit up to 2025-2026 (principal projection)
1.9 A more detailed breakdown of these projections split by type of payment from, and receipt to, the Fund is set out in Section 2 of this report.
1.10 Longer term projections of the Fund (up to 2080) can be found in my Quinquennial Review of the Fund as at April 2015, published on 19 October 20171. That Review projected that, over the longer term, benefit expenditure would exceed NICs income primarily as a result of:
• an increasing old-age dependency ratio
• a projected increase in the average state pension benefit payable as individuals start to receive the new state pension, and
• increases in the standard rate of state pension benefits arising from the “Triple Lock” policy
8 Report by the Government Actuary on: The draft Social Security Benefits Up-rating Order 2021; and The draft Social Security (Contributions) (Rates, Limits and Thresholds Amendments and National Insurance Funds Payments) Regulations 2021
Balance of the Fund as a proportion of benefit payments
2 A ‘Treasury Grant’ is a payment into the Fund from money voted by Parliament as permitted under Section 2 of the Social Security Act 1993. HM Treasury may determine the size of such payments provided that they do not exceed a certain percentage (17%) of benefit payments for the financial year concerned as estimated by the Government Actuary or Deputy Government Actuary.
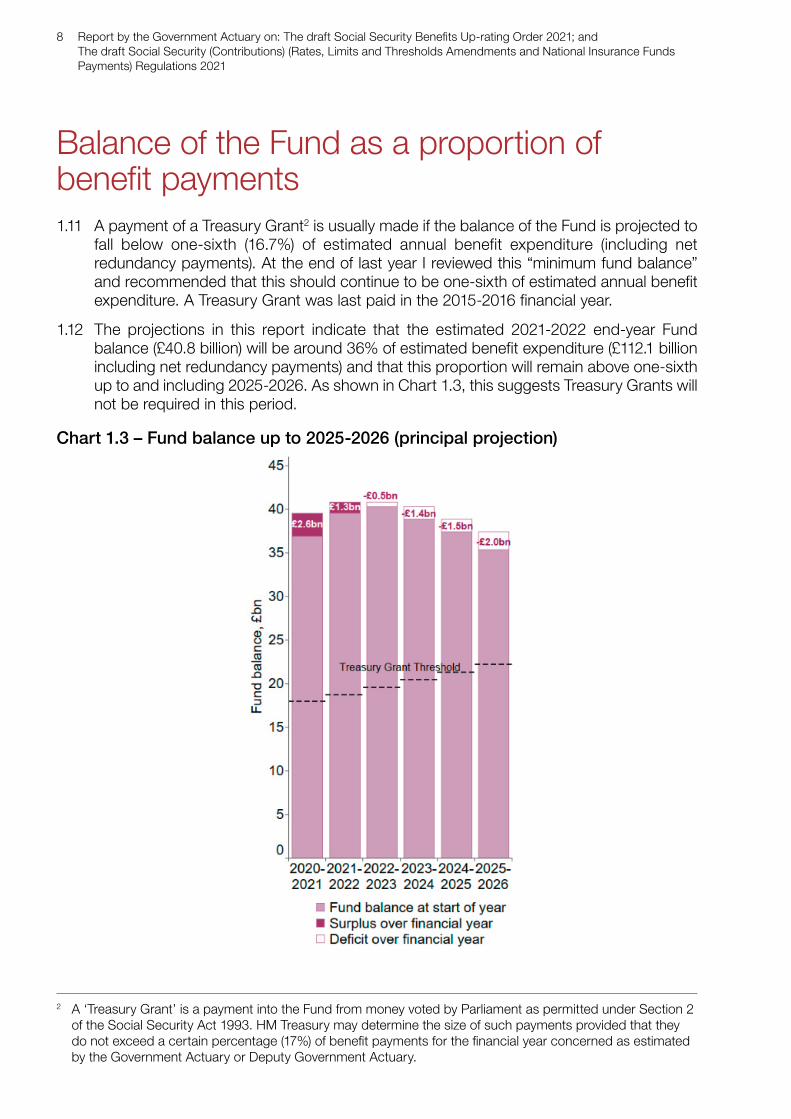
1.11 A payment of a Treasury Grant2 is usually made if the balance of the Fund is projected to fall below one-sixth (16.7%) of estimated annual benefit expenditure (including net redundancy payments). At the end of last year I reviewed this “minimum fund balance” and recommended that this should continue to be one-sixth of estimated annual benefit expenditure. A Treasury Grant was last paid in the 2015-2016 financial year.
1.12 The projections in this report indicate that the estimated 2021-2022 end-year Fund balance (£40.8 billion) will be around 36% of estimated benefit expenditure (£112.1 billion including net redundancy payments) and that this proportion will remain above one-sixth up to and including 2025-2026. As shown in Chart 1.3, this suggests Treasury Grants will not be required in this period.
Chart 1.3 – Fund balance up to 2025-2026 (principal projection)
1 Executive summary 9
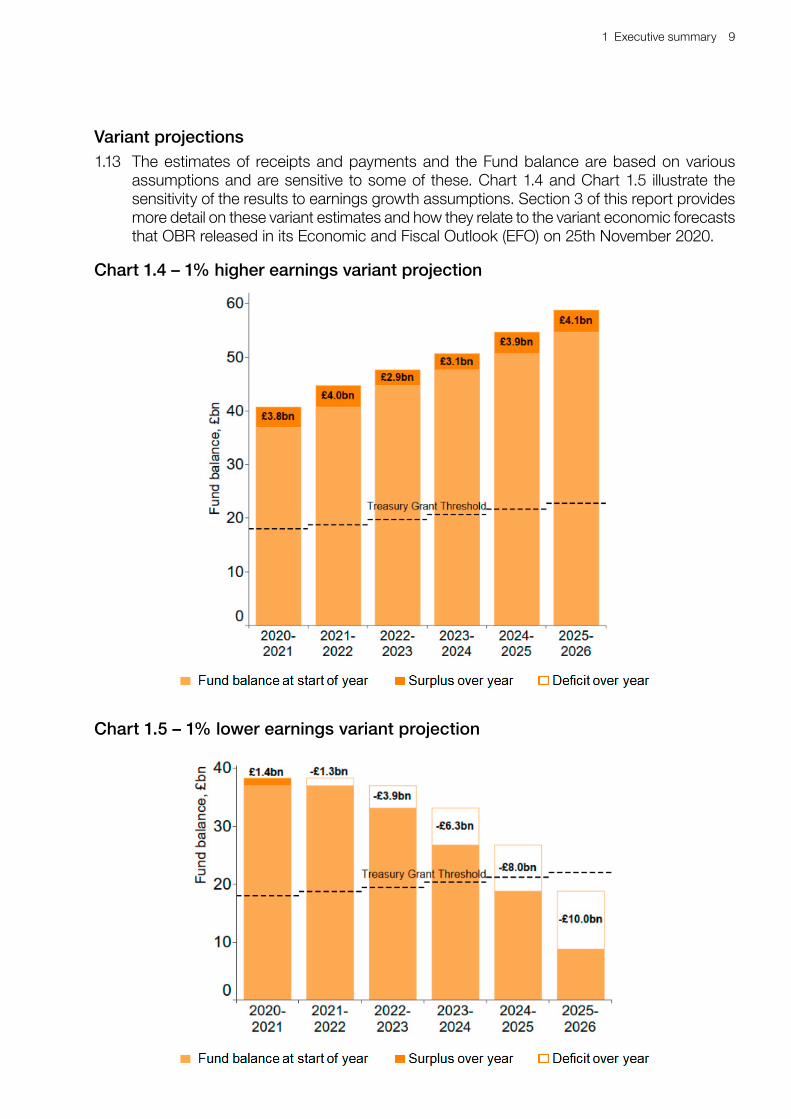
Variant projections1.13 The estimates of receipts and payments and the Fund balance are based on various
assumptions and are sensitive to some of these. Chart 1.4 and Chart 1.5 illustrate the sensitivity of the results to earnings growth assumptions. Section 3 of this report provides more detail on these variant estimates and how they relate to the variant economic forecasts that OBR released in its Economic and Fiscal Outlook (EFO) on 25th November 2020.
Chart 1.4 – 1% higher earnings variant projection
Chart 1.5 – 1% lower earnings variant projection
10 Report by the Government Actuary on: The draft Social Security Benefits Up-rating Order 2021; and The draft Social Security (Contributions) (Rates, Limits and Thresholds Amendments and National Insurance Funds Payments) Regulations 2021
Professional standards and limitations1.14 This work has been carried out in accordance with the relevant actuarial professional
standards TAS 100 and ASORP1 issued by the Financial Reporting Council (FRC). The FRC sets standards for actuarial work in the UK.
1.15 This report has been prepared for Parliament in accordance with the Social Security Administration Act 1992. It is not appropriate for any other purpose. No other person or third party is entitled to place any reliance on the contents of this report and GAD has no liability to any other person or third party for any act or omission taken, either in whole or in part, on the basis of this report.
2 Principal estimates for receipts, payments and the Fund balance 11
2 Principal estimates for receipts, payments and the Fund balance
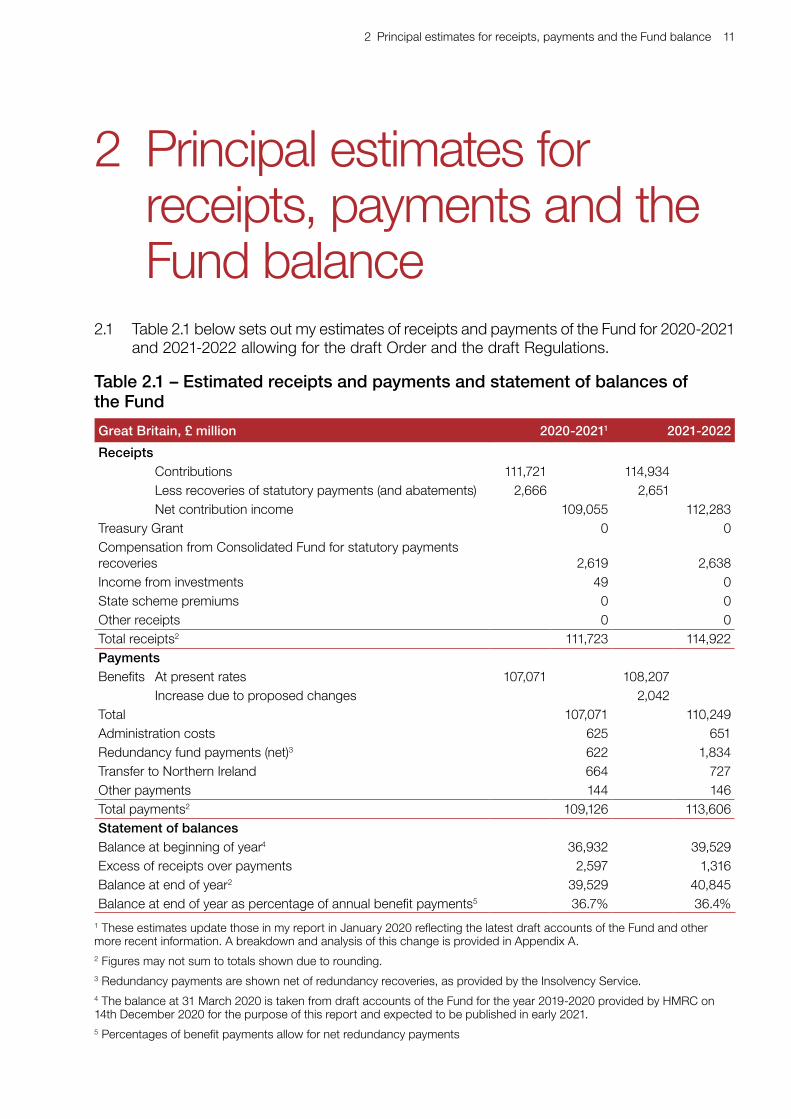
2.1 Table 2.1 below sets out my estimates of receipts and payments of the Fund for 2020-2021 and 2021-2022 allowing for the draft Order and the draft Regulations.
Table 2.1 – Estimated receipts and payments and statement of balances of the Fund
Great Britain, £ million 2020-20211 2021-2022
Receipts Contributions 111,721 114,934 Less recoveries of statutory payments (and abatements) 2,666 2,651 Net contribution income 109,055 112,283Treasury Grant 0 0Compensation from Consolidated Fund for statutory payments recoveries 2,619 2,638Income from investments 49 0State scheme premiums 0 0Other receipts 0 0Total receipts2 111,723 114,922PaymentsBenefits At present rates 107,071 108,207 Increase due to proposed changes 2,042Total 107,071 110,249Administration costs 625 651Redundancy fund payments (net)3 622 1,834Transfer to Northern Ireland 664 727Other payments 144 146Total payments2 109,126 113,606Statement of balancesBalance at beginning of year4 36,932 39,529Excess of receipts over payments 2,597 1,316Balance at end of year2 39,529 40,845Balance at end of year as percentage of annual benefit payments5 36.7% 36.4%
1 These estimates update those in my report in January 2020 reflecting the latest draft accounts of the Fund and other more recent information. A breakdown and analysis of this change is provided in Appendix A.2 Figures may not sum to totals shown due to rounding.3 Redundancy payments are shown net of redundancy recoveries, as provided by the Insolvency Service.4 The balance at 31 March 2020 is taken from draft accounts of the Fund for the year 2019-2020 provided by HMRC on 14th December 2020 for the purpose of this report and expected to be published in early 2021.5 Percentages of benefit payments allow for net redundancy payments

12 Report by the Government Actuary on: The draft Social Security Benefits Up-rating Order 2021; and The draft Social Security (Contributions) (Rates, Limits and Thresholds Amendments and National Insurance Funds Payments) Regulations 2021
Estimates for 2021-2022Benefit expenditure2.2 The proposed measures in the draft Order increase the rates of social security benefits
paid from the Fund from April 2021. The basic state pension increases from £134.25 per week to £137.60 per week and the full amount of the new state pension increases from £175.20 per week to £179.60 per week. Appendix B sets out fuller details of all the main rates of the benefits paid from the Fund before and after the proposed measures.
2.3 I estimate that the increase in benefit expenditure in 2021-2022 as a result of the proposed measures in the draft Order will be £2.0 billion, taking estimated expenditure on the relevant benefits from £108.1 billion to £110.1 billion. Table 2.2 overleaf shows this estimate, and the effect of the draft Order, split by benefit type. These estimates have been calculated using the data, methodology and assumptions set out in Appendices D and E. Chart 2.1 below provides a breakdown of the main types of benefit expenditure.
Chart 2.1 – Breakdown of benefit expenditure

2 Principal estimates for receipts, payments and the Fund balance 13
Table 2.2 – Benefit expenditure and the effect of the draft Order in 2021-2022
Great Britain £ million
Estimated total benefit
payments in 2020-2021
Estimated total benefit
payments in 2021-2022 before the
draft Order
Estimated extra benefit payments in
2021-2022 as a result of the draft Order
Estimated total benefit
payments in 2021-2022
after the draft Order
New state pension1 14,414 19,695 446 20,141Basic state pension2 68,564 65,266 1,456 66,722Additional pension 17,982 17,359 114 17,473Incapacity benefit 0 (0) (0) (0)Widows’/bereavement benefits3 226 187 1 188Contributory employment and support allowance 4,595 4,619 22 4,641Contribution-based jobseeker’s allowance 548 327 1 329Maternity allowance4 398 413 2 415Bereavement support payment3 213 211 0 211Total of benefits covered by the draft Order5 106,943 108,077 2,042 110,119Guardian’s allowance6 2 2 0 2Christmas bonus 126 127 0 127Total of benefits not covered by the draft Order5 128 130 0 130Total benefits5 107,071 108,207 2,042 110,249
1 Includes amounts of protected payments. The figure for the estimated extra payment in 2021-2022 includes around £3m in respect of (a) the cost of up-rating of protected payments in payment as at April 2021, effected by the draft Order, and (b) the cost of revaluing protected payments which will come into payment during 2021-2022, effected by the State Pension Revaluation for Transitional Pensions (No. 2) Order 2020. This latter Order does not strictly need to be reported on and it is immaterial relative to the total cost of up-rating.2 Includes expenditure on graduated retirement benefit, existing increments and deferral lump sums (which capture lump sums in respect of both deferred basic state pension and deferred additional pension).3 The projections provided by DWP did not split expenditure on bereavement benefits between Bereavement Support Payment and other benefits. Therefore, for this table, an approximate split has been applied.4 The rate of Maternity Allowance is not covered by the draft Order but it is linked to the prescribed rate of statutory maternity pay which is covered by the draft Order.5 Figures may not sum to totals due to rounding.6 The functions of the Secretary of State under Part 10 of the Social Security Administration Act 1992 (review and alterations of benefits: Great Britain) so far as relating to guardian’s allowance were transferred to the Treasury by section 49(3) of the Tax Credits Act 2002. Guardian’s allowance will be up-rated by a separate Statutory Instrument made by the Treasury
Contribution income2.4 The proposed measures in the draft Regulations increase some of the thresholds used
to determine the amount of earnings or profits that NICs are payable on. The primary threshold increases from £183 per week to £184 per week and the secondary threshold increases from £169 per week to £170 per week. Similar changes apply to the small profits threshold and lower profits limit. Appendix C sets out fuller details of the main features of the Fund’s contribution system.
14 Report by the Government Actuary on: The draft Social Security Benefits Up-rating Order 2021; and The draft Social Security (Contributions) (Rates, Limits and Thresholds Amendments and National Insurance Funds Payments) Regulations 2021
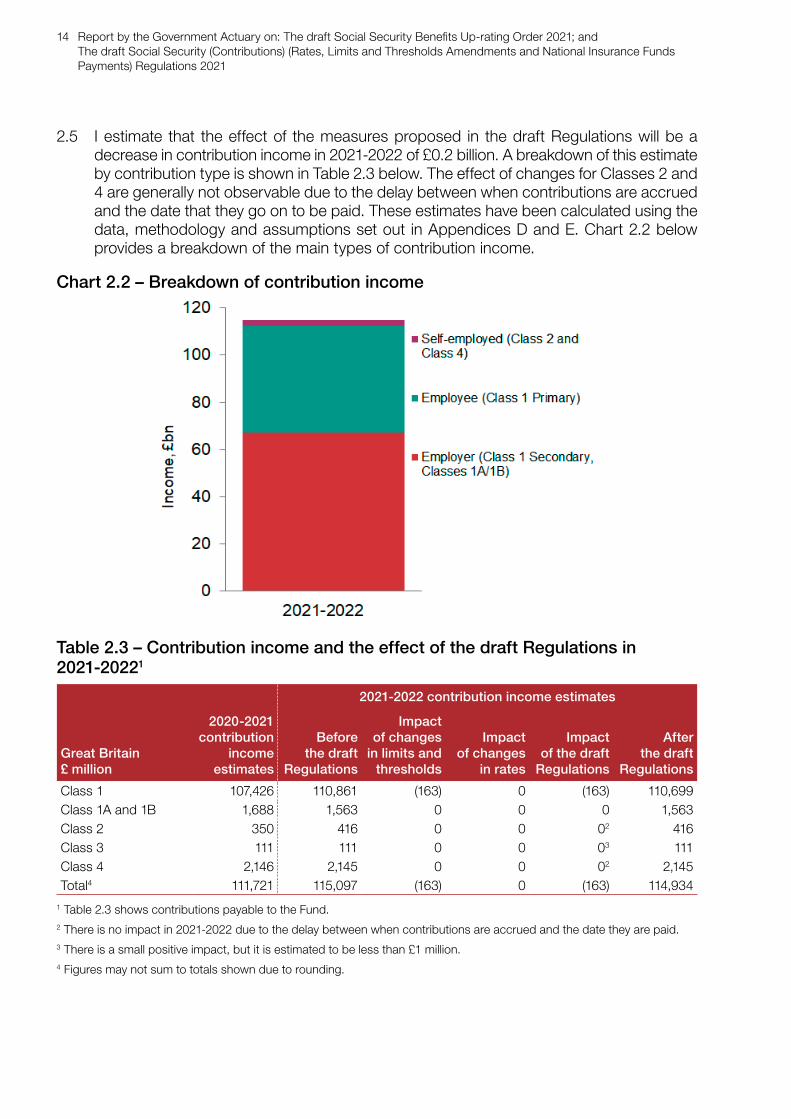
2.5 I estimate that the effect of the measures proposed in the draft Regulations will be a decrease in contribution income in 2021-2022 of £0.2 billion. A breakdown of this estimate by contribution type is shown in Table 2.3 below. The effect of changes for Classes 2 and 4 are generally not observable due to the delay between when contributions are accrued and the date that they go on to be paid. These estimates have been calculated using the data, methodology and assumptions set out in Appendices D and E. Chart 2.2 below provides a breakdown of the main types of contribution income.
Chart 2.2 – Breakdown of contribution income
Table 2.3 – Contribution income and the effect of the draft Regulations in 2021-20221
Great Britain£ million
2020-2021 contribution
income estimates
2021-2022 contribution income estimates
Before the draft
Regulations
Impact of changes
in limits and thresholds
Impact of changes
in rates
Impact of the draft
Regulations
After the draft
Regulations
Class 1 107,426 110,861 (163) 0 (163) 110,699Class 1A and 1B 1,688 1,563 0 0 0 1,563Class 2 350 416 0 0 02 416Class 3 111 111 0 0 03 111Class 4 2,146 2,145 0 0 02 2,145Total4 111,721 115,097 (163) 0 (163) 114,934
1 Table 2.3 shows contributions payable to the Fund.2 There is no impact in 2021-2022 due to the delay between when contributions are accrued and the date they are paid.3 There is a small positive impact, but it is estimated to be less than £1 million.4 Figures may not sum to totals shown due to rounding.
2 Principal estimates for receipts, payments and the Fund balance 15
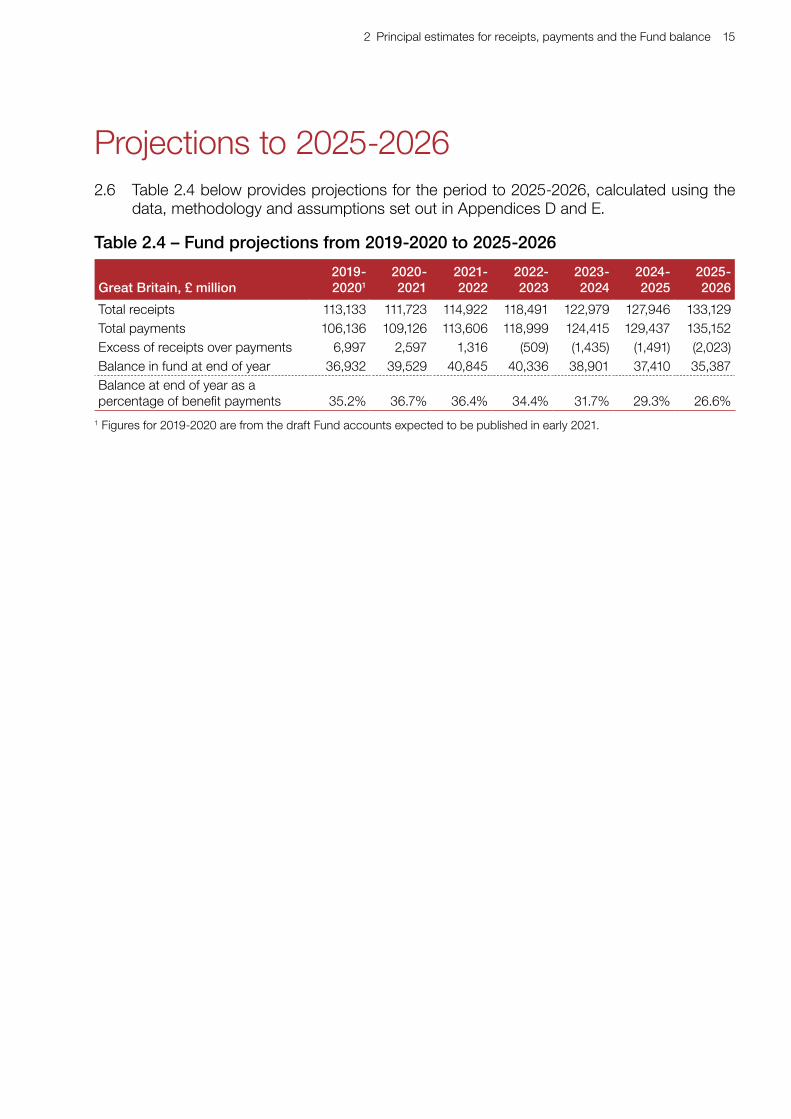
Projections to 2025-20262.6 Table 2.4 below provides projections for the period to 2025-2026, calculated using the
data, methodology and assumptions set out in Appendices D and E.
Table 2.4 – Fund projections from 2019-2020 to 2025-2026
Great Britain, £ million2019-20201
2020-2021
2021-2022
2022-2023
2023-2024
2024-2025
2025-2026
Total receipts 113,133 111,723 114,922 118,491 122,979 127,946 133,129Total payments 106,136 109,126 113,606 118,999 124,415 129,437 135,152Excess of receipts over payments 6,997 2,597 1,316 (509) (1,435) (1,491) (2,023)Balance in fund at end of year 36,932 39,529 40,845 40,336 38,901 37,410 35,387Balance at end of year as a percentage of benefit payments 35.2% 36.7% 36.4% 34.4% 31.7% 29.3% 26.6%
1 Figures for 2019-2020 are from the draft Fund accounts expected to be published in early 2021.
16 Report by the Government Actuary on: The draft Social Security Benefits Up-rating Order 2021; and The draft Social Security (Contributions) (Rates, Limits and Thresholds Amendments and National Insurance Funds Payments) Regulations 2021
3 Variant estimates for receipts, payments and the Fund balance
3.1 The estimates provided in this report depend on assumptions made about the future. In particular the Fund balance in the short-term is sensitive to:
• the level of earnings increases
• employment levels
3.2 It is also possible that actual payments and receipts will differ from the estimates provided due to limitations in the models used to calculate the estimates.
3.3 This section provides projections based on variant assumptions to demonstrate how different experience could affect the Fund balance.
Risks to the Fund balance at 31 March 20223.4 Future contribution income could vary significantly in the short-term as a result of changes
in employment numbers and general earnings increases. Benefit expenditure over the same timescale tends to be more predictable compared to employment numbers and general earnings increases, as the number of beneficiaries is more closely linked to population numbers, which tend to be less volatile than the numbers in employment.
3.5 Chart 3.1 and Table 3.1 show the effects of changes in earnings increases and employment levels on contribution income for the Fund for the years 2020-2021 and 2021-2022. Varying these assumptions would not be expected to affect benefit expenditure significantly for these years as the rates at which benefits are payable in these years are now known.
3.6 Given the potential for the pandemic to affect future mortality experience, Chart 3.1 and Table 3.1 also include two scenarios where the numbers of pensioners in 2021-2022 differ from that under the principal projection.
3.7 The effect of multiple variant assumptions can broadly be estimated by combining together the effects of the relevant scenarios.

3 Variant estimates for receipts, payments and the Fund balance 17
Chart 3.1 – Effect of variant scenarios on the Fund balance as at 31 March 2022
Table 3.1 – Effect on net income and Fund balance of variant assumptions (£ million)
Variant assumption
Effect on net income in
2020-2021
Effect on net income in
2021-2022
Approximate effect on the
31 March 2022 Fund balance
1% lower employee earnings increases (1,228) (2,686) (3,914)1% higher employee earnings increases 1,226 2,687 3,914Lower number of employees by 500,000 in 2021-2022 only 0 (1,861) (1,861)Higher number of employees by 500,000 in 2021-2022 only 0 1,861 1,861Fewer deaths resulting in higher number of state pension recipients by 10,000 0 (89) (89)More deaths resulting in lower number of state pension recipients by 50,000 0 446 446
18 Report by the Government Actuary on: The draft Social Security Benefits Up-rating Order 2021; and The draft Social Security (Contributions) (Rates, Limits and Thresholds Amendments and National Insurance Funds Payments) Regulations 2021
Variant 5-year projections
1 Paragraphs D.17 and D.18 explain how the Triple Lock mechanism operates.
3.8 I have also prepared variant estimates for the projected cash flow and balance of the Fund for the 5-year projections to illustrate the sensitivity of the estimates to economic assumptions.
3.9 These variant projections are shown in the charts in the executive summary. Details of the figures underlying these charts are provided in Appendix G.
3.10 The variant scenarios considered assume that:
• earnings increases are one percentage point higher than the principal assumption each year (“1% higher earnings increases”)
• earnings increases are one percentage point lower than the principal assumption each year (“1% lower earnings increases”)
3.11 The Fund is sensitive to earnings growth. Greater earnings growth leads to higher contribution income which increases the Fund balance. However, greater earnings growth also increases benefit expenditure when it is the highest component of Triple Lock1 and this then reduces the Fund balance. In the 1% higher earnings increases variant, Triple Lock increases are higher as a result of higher earnings but the overall effect is a larger Fund balance than in the principal projection.
3.12 Lower earnings growth leads to lower contribution income and therefore a decrease in the Fund balance. However, in the 1% lower earnings increases variant, the reduction in earnings has a relatively small effect on Triple Lock increases, because these cannot be less than 2.5%. The overall effect is a lower Fund balance, relative to the principal projection. The impact on the Fund balance in the 1% lower earnings increases variant is more pronounced than in the 1% higher earnings increases variant.
3.13 Under the principal projection, the level of the Fund does not fall below the Treasury Grant threshold, however, under the 1% lower earnings variant, the Fund is expected to fall below the Treasury Grant threshold in 2024-2025.
Other areas of uncertainty3.14 New state pensions have only been payable for a few years and so the estimates of
expenditure on these (including protected payments) are based on more limited data than other expenditure. If the estimates of new state pension expenditure were increased or lowered by around 2% then cumulative expenditure over the 5 year projection period could be around £3.5 billion higher or lower than expected.
3.15 The variant projections are purely illustrations of the sensitivity of the results to economic and mortality assumptions. They are not intended to show extremes. A material change in conditions such as, for example, a significant reduction in employment rates causing a reduction in contribution income, could result in future experience being materially different from any of the variant projections shown.
3 Variant estimates for receipts, payments and the Fund balance 19
Comparison with OBR’s variant economic projections3.16 As set out in more detail in Appendix D, the principal projection uses assumptions based
on the central scenario in OBR’s Economic and Fiscal Outlook (EFO) published 25 November 2020.
3.17 The EFO also sets out variant economic forecasts based on more or less severe ongoing impacts of the pandemic and different impacts of the United Kingdom exiting the European Union.
3.18 The EFO does not specify exactly what earnings, inflation and employment assumptions underlie these variant economic forecasts and so it is not possible to reconcile the principal and variant projections against those variant economic scenarios.
3.19 However I consider that the downside variant produced by OBR broadly reflects a situation not dissimilar to combining the variant scenarios with 500,000 fewer employees and 1% lower earnings growth each year.

20 Report by the Government Actuary on: The draft Social Security Benefits Up-rating Order 2021; and The draft Social Security (Contributions) (Rates, Limits and Thresholds Amendments and National Insurance Funds Payments) Regulations 2021
Appendix A: Revised 2020-2021 estimatesA.1 The 2020-2021 estimates shown in Table 2.1 differ from the estimates for the same period
included in my report of January 2020.
A.2 In particular the estimated balance of the Fund as at 31 March 2021 of £39.5 billion differs from that estimated in my report from January 2020 of £44.9 billion. Chart A.1 below sets out a broad reconciliation between these results.
Chart A.1 – Reconciliation of Fund balance at 31 March 2021 with 2020 Uprating Report
A.3 The change is primarily due to the updated estimates providing for:
• the actual Fund balance as at 31 March 2020 of £36.9 billion being £0.3 billion higher than that estimated in my report last year (£36.6 billion)
• a decrease in 2020-2021 receipts of £5.4 billion, primarily due to reduced earnings and higher levels of unemployment following the outbreak of the coronavirus pandemic
• an increase in 2020-2021 payments of £0.3 billion, due to higher levels of working age benefits (+£0.6 billion) and a lower level of pensioner benefits (-£0.3 billion), and
• the estimate of the 2020-2021 transfer to the Northern Ireland National Insurance Fund decreasing to £664 million in this year’s report from £725 million in last year’s report. This is partly due to lower than previously projected balances in the two funds, meaning a lower balancing amount is required.
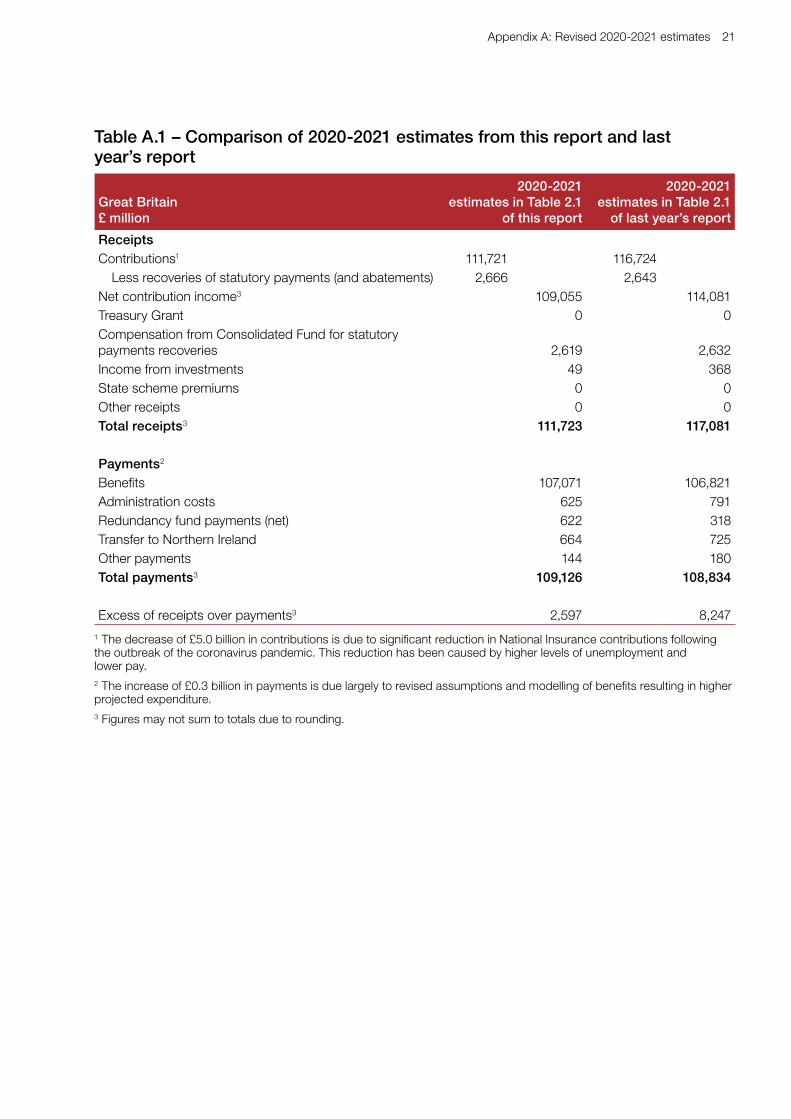
A.4 Table A.1 overleaf sets out a detailed breakdown of the 2020-2021 estimates in Table 2.1 of this report with those provided in Table 2.1 of last year’s report.
Appendix A: Revised 2020-2021 estimates 21
Table A.1 – Comparison of 2020-2021 estimates from this report and last year’s report
Great Britain£ million
2020-2021 estimates in Table 2.1
of this report
2020-2021 estimates in Table 2.1
of last year’s report
ReceiptsContributions1 111,721 116,724 Less recoveries of statutory payments (and abatements) 2,666 2,643Net contribution income3 109,055 114,081Treasury Grant 0 0Compensation from Consolidated Fund for statutory payments recoveries 2,619 2,632Income from investments 49 368State scheme premiums 0 0Other receipts 0 0Total receipts3 111,723 117,081
Payments2
Benefits 107,071 106,821Administration costs 625 791Redundancy fund payments (net) 622 318Transfer to Northern Ireland 664 725Other payments 144 180Total payments3 109,126 108,834
Excess of receipts over payments3 2,597 8,247
1 The decrease of £5.0 billion in contributions is due to significant reduction in National Insurance contributions following the outbreak of the coronavirus pandemic. This reduction has been caused by higher levels of unemployment and lower pay.2 The increase of £0.3 billion in payments is due largely to revised assumptions and modelling of benefits resulting in higher projected expenditure.3 Figures may not sum to totals due to rounding.

22 Report by the Government Actuary on: The draft Social Security Benefits Up-rating Order 2021; and The draft Social Security (Contributions) (Rates, Limits and Thresholds Amendments and National Insurance Funds Payments) Regulations 2021
Appendix B: Main benefit ratesProposed changes to benefits
1 The Social Security Administration Act 1992 does not allow the Secretary of State to bring forward an annual up-rating order if earnings show no growth. AWE for the quarter ending July 2020 showed a decline of 1.0% and would have precluded the Secretary of State from up-rating earnings-linked benefits. The Social Security (Up-rating of Benefits) Act 2020 provides a power for the up-rating of these benefits for one year only. Up-rating under the new power in section 150A(2A) will apply only for the tax year 2021-2022.
B.1 The draft Order proposes increasing the rates of some social security benefits paid from the Fund from April 2021. The most significant benefit paid from the Fund is state pension. The proposed up-rating of these is described below.
Impact of draft Order on state pension amountsB.2 Under current legislation both the basic state pension (for those reaching State Pension
age (SPa) prior to 6 April 2016) and amounts up to the full rate of the new state pension (for those reaching SPa on or after 6 April 2016) must be up-rated by at least the growth in earnings.
B.3 However the government has committed to up-rating the basic state pension and the full rate of the new state pension annually by the highest of growth in average weekly earnings (AWE), prices (CPI) or 2.5%, referred to as “Triple Lock”1.
B.4 The annual increase in the level of CPI to September 2020 was 0.5% and AWE increase over the year to May-July 2020 was -1.0%. Therefore, the result of the Triple Lock is that the proposal is to up-rate the basic state pension and the full rate of the new state pension from April 2021 by 2.5%, subject to the appropriate rounding conventions.
B.5 The draft Order also proposes increasing other components of the pre-April 2016 state pension, including earnings-related additional pensions (under the state earnings-related pension scheme (SERPS), the state second pension (S2P) and graduated retirement benefit) by 0.5%, in line with the September 2020 CPI increase. The draft Order also proposes increasing amounts in excess of the full rate of the new state pension (protected payments) and expenditure on state pension deferral (increments) in line with the CPI increase.
B.6 The financial effects of the up-rating of benefits provided for in the draft Order are shown in Section 2.
B.7 Full details of the rates of benefits provided from the Fund are shown in the table overleaf.

Appendix B: Main benefit rates 23
Table B.1 – Comparison of benefits paid from the Fund before and after April 2021 up-rating
All figures in £sWeekly rate in 2020-2021
Weekly rate proposed
from April 2021
State pensionNew state pension1 175.20 179.60Category A or B (paid to individuals over SPa as at 5 April 2016 based on their own contributions or those made by a deceased spouse or civil partner)2 134.25 137.60Category BL (paid to an individual over SPa as at 5 April 2016 based on their spouse or civil partner’s contributions while the spouse/civil partner is alive)3 80.45 82.45
Graduated retirement benefit (unit) 0.1440 0.1447Bereavement benefits4
Bereavement Support Payment (lump sum standard rate) 2,500.00 2,500.00Bereavement Support Payment (lump sum higher rate) 3,500.00 3,500.00Bereavement Support Payment (monthly payments standard rate) 100.00 100.00Bereavement Support Payment (monthly payments higher rate) 350.00 350.00Widowed parent’s allowance (maximum rate) 121.95 122.55Employment and Support Allowance (contributory)5
Personal allowance (age 25 or over) 74.35 74.70Work-related activity component 29.55 29.70Support component 39.20 39.40Jobseeker’s Allowance (contribution-based)6
Personal benefit for those aged 18 to 24 58.90 59.20Personal benefit for those aged 25 and over 74.35 74.70Maternity Allowance7 151.20 151.97Statutory Maternity Pay, Statutory Paternity Pay, Statutory Adoption Pay, Statutory Shared Parental Pay and Statutory Parental Bereavement PayStandard rate7 151.20 151.97Guardian’s allowanceFirst child/other children8 17.90 18.00Increases for the children of widows, widowers, retirement pensioners and those on long-term rate and higher short-term rate of incapacity benefit and recipients of Incapacity Benefit over pension ageFirst child 11.35 11.35Other children 8.00 8.00Christmas bonusChristmas bonus to pensioners (lump sum)8 10.00 10.00
1 Under transitional arrangements not everyone receives this rate; awards are based on an individual’s National Insurance record. A de minimis of 10 years of contributions applies in respect of post-April 2016 awards.
2 Proportionate rates are paid to those with proportionate contribution records. Pensioners in receipt of Category A or B basic state pensions receive an increase of 25p per week on reaching age 80 (the Age Addition).
3 Pensioners in receipt of Category BL basic state pensions receive an increase of 25p per week on reaching age 80 (the Age Addition).
4 Bereavement Support Payment (lump sums and monthly payments) is available to persons whose spouse or civil partner died on or after 6 April 2017. The higher rate is payable if the surviving spouse or civil partner has children under age 20 in full-time education. Widowed Parent’s Allowance is available to persons whose spouse or civil partner died before 6 April 2017 for as long as they receive Child Benefit in respect of a child of that spouse/civil partner.
5 Employment and Support Allowance (ESA) replaced Incapacity Benefit for new claims from 27 October 2008. The benefit contains some extra additions dependent on the circumstances of the recipients. Everyone who satisfies the Work Capability Assessment will receive a personal allowance and either the work-related activity component or the support component. However, from April 2017 the Welfare Reform and Work Act 2016 provides that new ESA claimants placed in the work–related activity group will no longer receive the work-related activity component. The process to review Incapacity Benefit claims to assess if they can be transferred to ESA is now largely complete.
6 Unemployed people who meet certain conditions, primarily relating to the payment of NICs in the period recently before they become unemployed, can claim contribution-based Jobseeker’s Allowance. Other unemployed people who either exhaust or have no entitlement to the contributory benefit may receive income-based Jobseeker’s Allowance/Universal Credit. Income-based Jobseeker’s Allowance/Universal Credit may also be paid to recipients of contribution-based Jobseeker’s Allowance if their income-based benefit requirements exceed the rate of contributory Jobseeker’s Allowance.
7 The first 6 weeks of Statutory Maternity Pay and Statutory Adoption Pay are paid at 90% of the recipient’s average weekly earnings with no upper limit. Thereafter the remaining weeks (maximum 33) are paid at the standard rate or, if lower, 90% of the recipient’s average weekly earnings. Maternity Allowance is paid to employed women for up to 39 weeks at the amount shown or 90% of the woman’s average weekly earnings if this calculation results in a figure which is less. The amount of Maternity Allowance a self-employed woman may receive depends on how many Class 2 NICs they have paid in the 66 weeks immediately preceding the week their baby is due. Statutory Paternity Pay, Statutory Shared Parental Pay and Statutory Parental Bereavement Pay are paid at the standard rate or 90% of average weekly earnings if lower.
8 This benefit is not increased by the draft Order.
24 Report by the Government Actuary on: The draft Social Security Benefits Up-rating Order 2021; and The draft Social Security (Contributions) (Rates, Limits and Thresholds Amendments and National Insurance Funds Payments) Regulations 2021
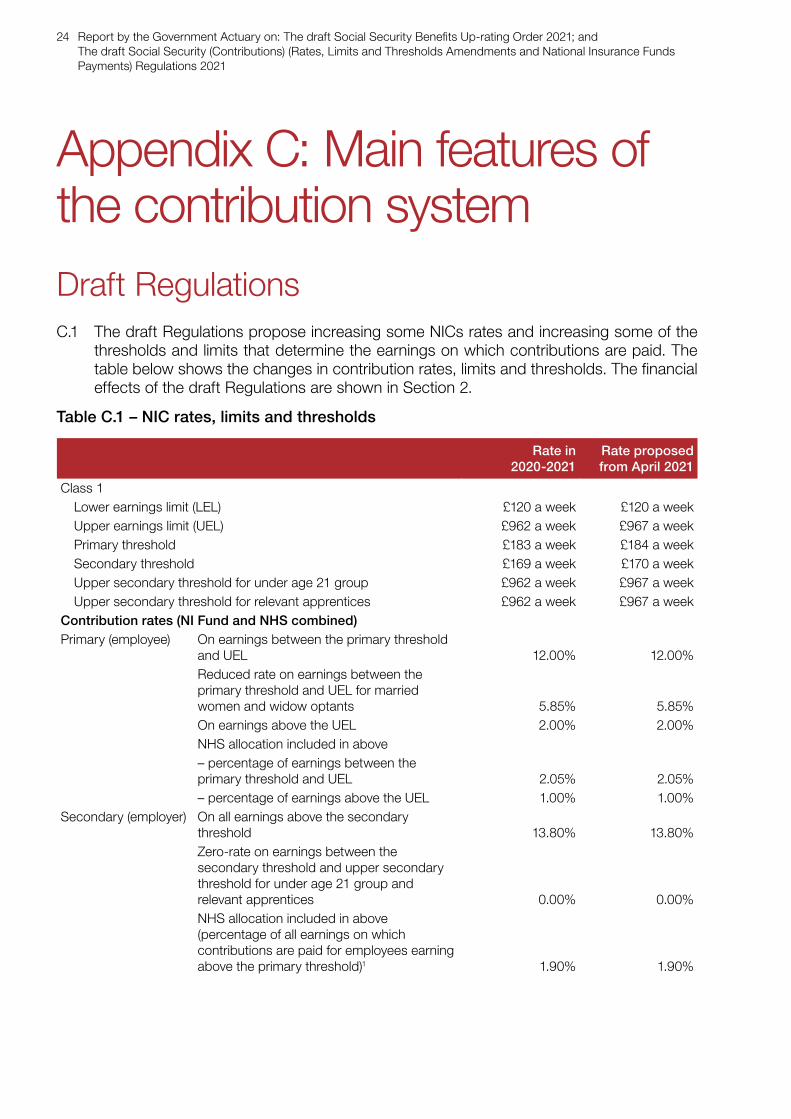
Appendix C: Main features of the contribution systemDraft RegulationsC.1 The draft Regulations propose increasing some NICs rates and increasing some of the
thresholds and limits that determine the earnings on which contributions are paid. The table below shows the changes in contribution rates, limits and thresholds. The financial effects of the draft Regulations are shown in Section 2.
Table C.1 – NIC rates, limits and thresholds
Rate in 2020-2021
Rate proposed from April 2021
Class 1 Lower earnings limit (LEL) £120 a week £120 a week Upper earnings limit (UEL) £962 a week £967 a week Primary threshold £183 a week £184 a week Secondary threshold £169 a week £170 a week Upper secondary threshold for under age 21 group £962 a week £967 a week Upper secondary threshold for relevant apprentices £962 a week £967 a weekContribution rates (NI Fund and NHS combined)Primary (employee) On earnings between the primary threshold
and UEL 12.00% 12.00% Reduced rate on earnings between the
primary threshold and UEL for married women and widow optants 5.85% 5.85%
On earnings above the UEL 2.00% 2.00% NHS allocation included in above – percentage of earnings between the
primary threshold and UEL 2.05% 2.05% – percentage of earnings above the UEL 1.00% 1.00%Secondary (employer) On all earnings above the secondary
threshold 13.80% 13.80% Zero-rate on earnings between the
secondary threshold and upper secondary threshold for under age 21 group and relevant apprentices 0.00% 0.00%
NHS allocation included in above (percentage of all earnings on which contributions are paid for employees earning above the primary threshold)1 1.90% 1.90%

Appendix C: Main features of the contribution system 25
Rate in 2020-2021
Rate proposed from April 2021
Class 1A and Class 1B Contribution rate (employer only) 13.80% 13.80% NHS allocation included in above 1.90% 1.90%
Class 2 Flat-rate contribution £3.05 a week £3.05 a week Small profits threshold £6,475.00 a year £6,515.00 a year NHS allocation included in above (percentage of contribution) 15.50%
Class 3 Flat-rate contribution £15.30 a week £15.40 a week NHS allocation included in above (percentage of contribution) 15.50% 15.50%
Class 4 Lower Profits Limit (LPL) £9,500 a year £9,568 a year Upper Profits Limit (UPL) £50,000 a year £50,270 a year
Contribution rate On profits between the LPL and UPL 9.00% 9.00% On profits above the UPL 2.00% 2.00%NHS allocation included in above Percentage of profits between the LPL and UPL 2.15% 2.15% Percentage of profits above the UPL 1.00% 1.00%
1 The amount of the secondary Class 1 NICs apportioned to the NHS is calculated as the relevant percentage (currently 1.9%) of the total earnings of those employees who earn above the primary threshold. This is in line with the interpretation of subsections (5) and (5A) of section 162 of the Social Security Administration Act 1992 provided to GAD by HMRC.
26 Report by the Government Actuary on: The draft Social Security Benefits Up-rating Order 2021; and The draft Social Security (Contributions) (Rates, Limits and Thresholds Amendments and National Insurance Funds Payments) Regulations 2021
Appendix D: Key assumptionsD.1 The key assumptions underlying the estimates in this report are the population projections
and economic assumptions that determine future employment levels and the rate of increase in earnings and CPI. These assumptions are set out in this appendix alongside the variant assumptions used to show the potential impact of using different assumptions on the projections.
D.2 The population assumptions used in this report are based on the Office for National Statistics (ONS) 2018-based 0% future EU migration population projection for Great Britain, published in October 2019, updated for known 2019 population figures. The economic assumptions used in this report are consistent with the central assumptions used by the OBR in its EFO report published on 25 November 2020.
D.3 My understanding is that both ONS and OBR have determined these assumptions with the intention that there is no allowance for prudence or optimism. In my view, these assumptions are reasonable for the purposes of estimating the financial position of the Fund over the relatively short period considered in this report and I have therefore decided to adopt them as the principal assumptions.
D.4 The ONS population data does not include any allowance for the emergence of the coronavirus pandemic - either observed excess deaths or any changes to future mortality. As described in paragraphs E.28 to E.32 the projections are adjusted so that the assumed impact of the coronavirus pandemic on mortality is aligned to the approach adopted by OBR in its EFO. This approach results in an allowance for 90,000 (actual or expected) excess pensioner deaths in 2020-2021 and an assumption that around two-thirds of those deaths would otherwise have occurred over the projection period to 31 March 2026.
D.5 There are two areas of uncertainty of particular relevance to this report. The first is the ongoing coronavirus pandemic and the second relates to the nature of the UK’s long-term relationship with the European Union. The economic assumptions underlying the EFO incorporate broad based assumptions about the evolution of the coronavirus pandemic and the UK’s long-term relationship with the European Union, as described in Section 2 of the EFO. My report includes variant projections to show the impact on the Fund if other economic or pensioner number assumptions were adopted.
D.6 My previous report was finalised in January 2020. The estimates in that report were also based on the most recent population projections and EFO at the time. These were ONS’s 2018-based principal population projection for Great Britain (published in October 2019) and the OBR’s EFO published on 13 March 2019. Those assumptions are the “UR 2020” assumptions shown in the tables in this appendix.
Appendix D: Key assumptions 27
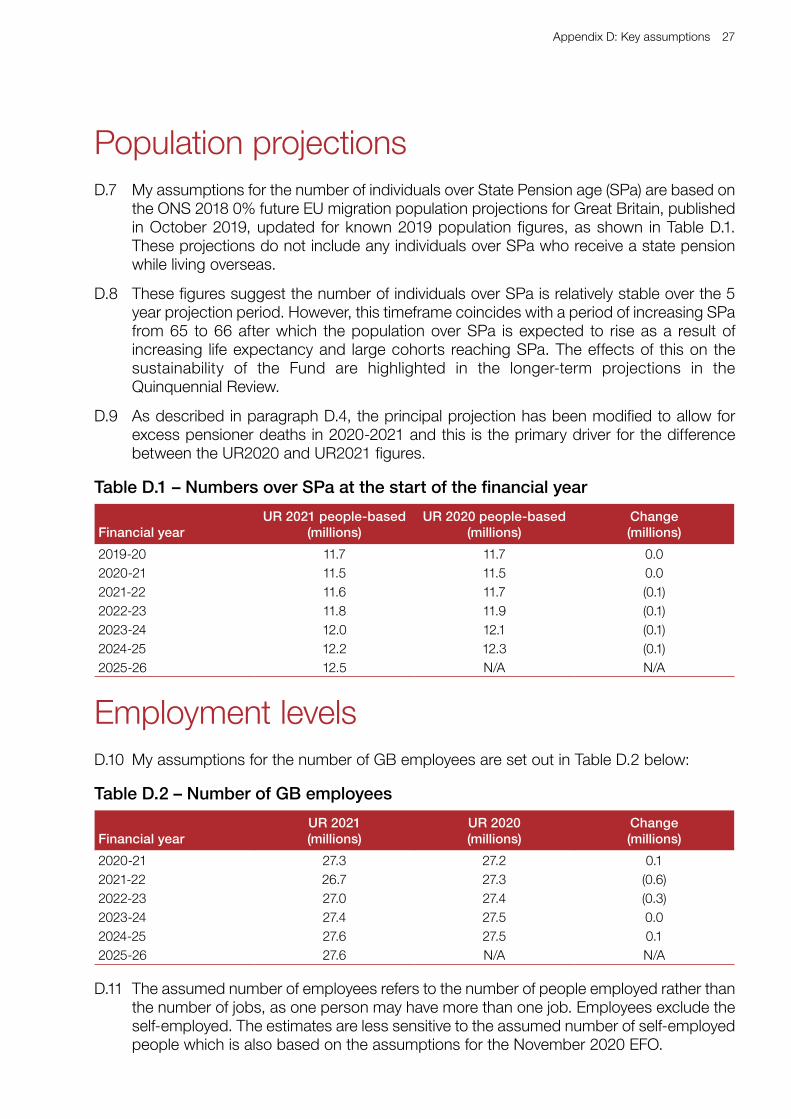
Population projectionsD.7 My assumptions for the number of individuals over State Pension age (SPa) are based on
the ONS 2018 0% future EU migration population projections for Great Britain, published in October 2019, updated for known 2019 population figures, as shown in Table D.1. These projections do not include any individuals over SPa who receive a state pension while living overseas.
D.8 These figures suggest the number of individuals over SPa is relatively stable over the 5 year projection period. However, this timeframe coincides with a period of increasing SPa from 65 to 66 after which the population over SPa is expected to rise as a result of increasing life expectancy and large cohorts reaching SPa. The effects of this on the sustainability of the Fund are highlighted in the longer-term projections in the Quinquennial Review.
D.9 As described in paragraph D.4, the principal projection has been modified to allow for excess pensioner deaths in 2020-2021 and this is the primary driver for the difference between the UR2020 and UR2021 figures.
Table D.1 – Numbers over SPa at the start of the financial year
Financial yearUR 2021 people-based
(millions)UR 2020 people-based
(millions)Change(millions)
2019-20 11.7 11.7 0.02020-21 11.5 11.5 0.02021-22 11.6 11.7 (0.1)2022-23 11.8 11.9 (0.1)2023-24 12.0 12.1 (0.1)2024-25 12.2 12.3 (0.1)2025-26 12.5 N/A N/A
Employment levelsD.10 My assumptions for the number of GB employees are set out in Table D.2 below:
Table D.2 – Number of GB employees
Financial yearUR 2021(millions)
UR 2020(millions)
Change(millions)
2020-21 27.3 27.2 0.12021-22 26.7 27.3 (0.6)2022-23 27.0 27.4 (0.3)2023-24 27.4 27.5 0.02024-25 27.6 27.5 0.12025-26 27.6 N/A N/A
D.11 The assumed number of employees refers to the number of people employed rather than the number of jobs, as one person may have more than one job. Employees exclude the self-employed. The estimates are less sensitive to the assumed number of self-employed people which is also based on the assumptions for the November 2020 EFO.

28 Report by the Government Actuary on: The draft Social Security Benefits Up-rating Order 2021; and The draft Social Security (Contributions) (Rates, Limits and Thresholds Amendments and National Insurance Funds Payments) Regulations 2021
D.12 The assumptions in Table D.2 have been derived by:
• taking the number of UK employees from Table 1.6 of the supplementary economy tables published alongside the OBR’s November 2020 EFO
• adjusting these figures to exclude Northern Ireland employees
D.13 The significant drop in employees in 2021-22 followed by a slower recovery reflects the allowance for the pandemic included in OBR’s central economic forecast.
Increase in earnings and CPID.14 My assumptions for increases in earnings and CPI are set out in Table D.3 below. These
figures are the Q2 earnings and Q3 CPI assumptions (taken from tables 1.6 and 1.7 of the EFO supplementary economy tables) as up-rating each April is generally based on Q2 earnings and Q3 CPI out-turn from the previous financial year.
Table D.3 – Annual increase in earnings and CPI
Year of April
up-rating
CPI Increase in earnings
UR 2021 UR 2020 Change UR 2021 UR 2020 Change
2020 1.71 1.71 0.0 3.91 3.91 0.02021 0.51 1.9 (1.4) (1.0)1 2.9 (3.9)2022 1.4 2.0 (0.6) 4.1 3.1 1.02023 1.6 2.0 (0.4) 2.0 3.1 (1.1)2024 1.8 2.0 (0.2) 2.4 3.2 (0.8)2025 1.9 N/A N/A 2.8 N/A N/A
1 The increases to be applied in April 2020 and April 2021 are now determined. Last year the April 2020 increases were determined.
D.15 When projecting earnings for the purpose of estimating contribution income, my assumption on earnings growth is taken from Table 2.9 of the EFO which shows the average growth across the 4 quarters of the financial year. These differ from, but are related to, the Q2 assumptions.
Assumptions for variant projectionsD.16 The “high/low earnings” variants assume that the increase in earnings assumptions are
one percentage point higher/lower each year from and including 2020-2021, except that the known up-rating in April 2021 is unaffected.
Triple LockD.17 “Triple lock” increases are determined as the highest of the annual growth in average
May-July earnings (AWE), September prices (CPI) and 2.5%. I have applied this Triple Lock rule to the increase in earnings and CPI assumptions for each individual year in the projections. For example, under the central projection in April 2023 AWE is 2.0% and CPI is 1.6% and so the Triple Lock assumption is 2.5% as the minimum increase of 2.5% is higher than both 2.0% and 1.6%.
Appendix D: Key assumptions 29
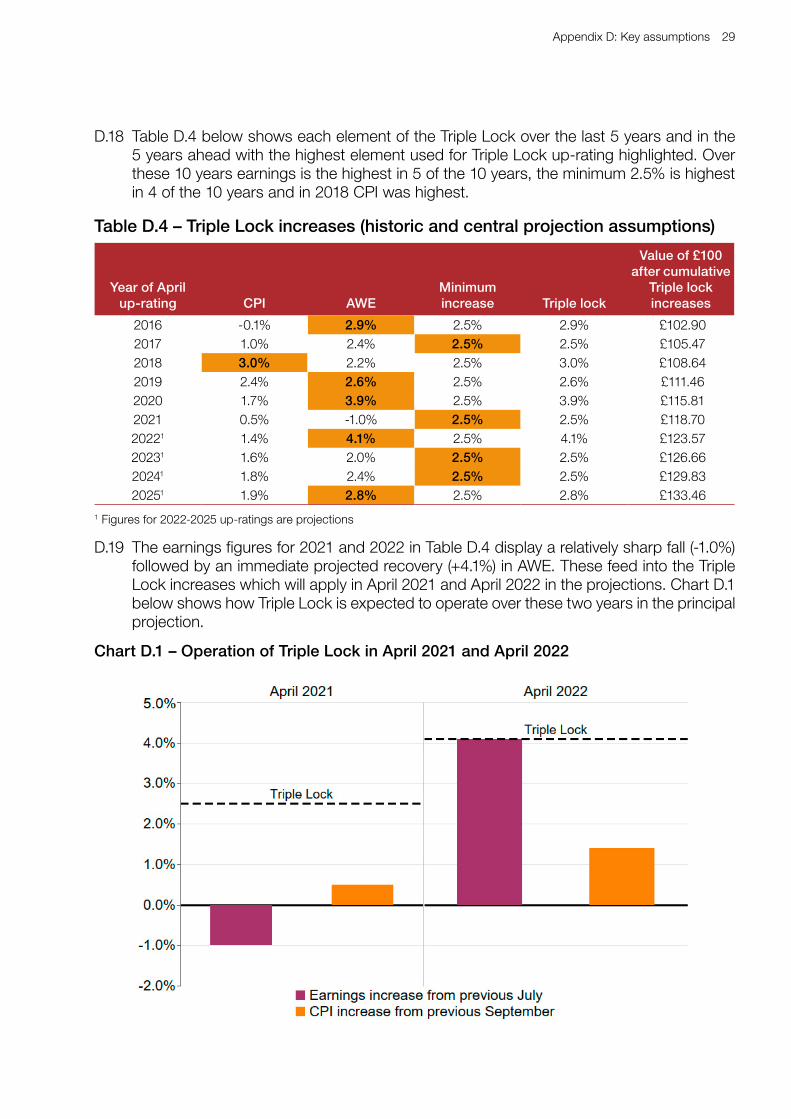
D.18 Table D.4 below shows each element of the Triple Lock over the last 5 years and in the 5 years ahead with the highest element used for Triple Lock up-rating highlighted. Over these 10 years earnings is the highest in 5 of the 10 years, the minimum 2.5% is highest in 4 of the 10 years and in 2018 CPI was highest.
Table D.4 – Triple Lock increases (historic and central projection assumptions)
Year of April up-rating CPI AWE
Minimum increase Triple lock
Value of £100 after cumulative
Triple lock increases
2016 -0.1% 2.9% 2.5% 2.9% £102.902017 1.0% 2.4% 2.5% 2.5% £105.472018 3.0% 2.2% 2.5% 3.0% £108.642019 2.4% 2.6% 2.5% 2.6% £111.462020 1.7% 3.9% 2.5% 3.9% £115.812021 0.5% -1.0% 2.5% 2.5% £118.7020221 1.4% 4.1% 2.5% 4.1% £123.5720231 1.6% 2.0% 2.5% 2.5% £126.6620241 1.8% 2.4% 2.5% 2.5% £129.8320251 1.9% 2.8% 2.5% 2.8% £133.46
1 Figures for 2022-2025 up-ratings are projections
D.19 The earnings figures for 2021 and 2022 in Table D.4 display a relatively sharp fall (-1.0%) followed by an immediate projected recovery (+4.1%) in AWE. These feed into the Triple Lock increases which will apply in April 2021 and April 2022 in the projections. Chart D.1 below shows how Triple Lock is expected to operate over these two years in the principal projection.
Chart D.1 – Operation of Triple Lock in April 2021 and April 2022
30 Report by the Government Actuary on: The draft Social Security Benefits Up-rating Order 2021; and The draft Social Security (Contributions) (Rates, Limits and Thresholds Amendments and National Insurance Funds Payments) Regulations 2021
D.20 Under the central projection, the triple lock increase for April 2021 is 2.5%, which is higher than CPI (0.5%) or earnings increases (-1.0%). In April 2022, the highest parameter is earnings (4.1%) and so the triple lock increase is 4.1%.
D.21 This sharp fall and assumed recovery in the earnings index used to determine triple lock increases is an unusual feature of this index which has arisen as a result of the pandemic. It results in a projection of larger overall increase in benefits through the triple lock mechanism than would be the case were a more even pattern of earnings growth to be experienced and has an enduring effect on the projected balance of the Fund.
D.22 If the same overall Q2 earnings growth occurred over the two years of the sharp fall and recovery but in a smoother manner than under the principal projection then the earnings component feeding into triple lock increases for April 2022 would be lower. In particular, if the Q2 earnings growth index were smoother such that the 2021 figure was higher (between 0.6% and 2.5% rather than -1.0%) and the 2022 figure was lower between (2.5% and 0.6% rather than 4.1%) then the triple lock mechanism would produce 2.5% increases in both April 2021 and April 2022.
D.23 In these hypothetical scenarios the lower increase from April 2022 would mean that pension benefits would be lower in 2022-2023 and all subsequent years. By April 2023 these scenarios would result in the Fund balance being projected to be around £1.2bn higher. Compared to my principal projection, the Fund balance would then continue to diverge as benefit expenditure would be lower in all future years. By the end of the projection period (31 March 2026) this single lower increase in April 2022 would be projected to leave the Fund balance over £5bn higher1.
1 The Fund balance figures in this paragraph ignore any change in NICs receipts in this smoother earnings scenario since the average growth across the 4 quarters of the financial year earnings series used to project NICs does not show the same sharp fall and recovery as the Q2 earnings pattern (see paragraph D.15).
Appendix E: Data, methodology and other assumptions 31
Appendix E: Data, methodology and other assumptionsContributions modelling
1 ONS and HMRC have no responsibility for the distributions adopted beyond the data that they originally supplied to GAD.
Earnings projectionE.1 Contributions are estimated separately for each class of NICs.
E.2 Estimates of Class 1 NICs are made by first making a projection of workforce earnings based on:
• assumed levels of UK employment in each year, together with an assumed profile of workers by age and gender derived from OBR’s employment projection model used for its Fiscal Sustainability Report published in July 2020; employment numbers are broken down between Great Britain and Northern Ireland using ONS labour force data (updated to include 2019-2020 data) with an allowance for expected future population changes
• average earnings distributions, by age and gender; these were derived using the 2015 Annual Survey of Hours and Earnings (ASHE) produced by ONS and the Survey of Personal Incomes published by HMRC1
• assumptions on the rate of earnings growth from year to year
Total NICs incomeE.3 The projection of earnings is then used to estimate the expected NICs due in each year.
E.4 Other classes of NICs, which generate substantially lower revenues than Class 1, are estimated using simplified models.
E.5 Class 1A and Class 1B contributions are estimated using data and projections provided by HMRC. These are UK figures and the amount attributable to Great Britain is taken as a percentage of the UK figure.
E.6 Class 2 and Class 4 contributions made by the self-employed are estimated in a similar way to Class 1, but using assumptions on employment, earnings growth and earnings distributions specifically for the self-employed. These earnings distributions are derived solely from HMRC’s Survey of Personal Incomes.
E.7 Class 3 contributions are a very small part of total NICs and have been estimated approximately by assuming that the contributions received each year are unchanged from the average amount received in the years 2017-2018 to 2019-2020.
32 Report by the Government Actuary on: The draft Social Security Benefits Up-rating Order 2021; and The draft Social Security (Contributions) (Rates, Limits and Thresholds Amendments and National Insurance Funds Payments) Regulations 2021
E.8 I have assumed that future increases in contribution limits and thresholds will be in line with CPI increases in each year.
E.9 Modelled estimates of NICs for future years are aligned with data provided by HMRC on actual NIC receipts up to and including 2019-2020.
E.10 Adjustments are also made to allow for HMRC estimates of the effect of certain measures announced in successive fiscal events that it is not possible to include directly in the calculation models. These adjustments represent less than 0.5% of projected NIC income.
E.11 The economic assumptions include an allowance for the pandemic. In addition, I have applied further adjustments, provided by HMRC, to reflect pandemic effects that are not fully captured by the economic assumptions. The adjustments apply to Class 1 NICs and reflect three factors:
• data on receipts in the first part of 2020-21 which indicate a lower than expected effective rate of NICs is being paid
• the impact of the Coronavirus Job Retention Scheme which is concentrated on lower paid workers
• the expectation of lower bonuses in 2020-21
E.12 I consider that it is reasonable to apply adjustments in these areas. However, I have not analysed how the adjustments have been derived from the detailed data held by HMRC.
NICs allocation between the Fund and the NHSE.13 The above calculations focus on making a projection of total NICs. It is then necessary
to divide these NICs between those allocated to the Fund and those allocated to the NHS.
E.14 Class 1 contributions are split between primary Fund and NHS and secondary Fund and NHS contributions based on data derived from end of year returns from the National Insurance PAYE System (NPS) database and provided in the Earnings Limits Scan supplied by HMRC. The latest Earnings Limits Scan provides information up to and including 2018-2019. I have therefore used this information to split the total Class 1 NICs received in 2018-2019, as produced by the calculation model, between the different components. The split of NICs in future years was then derived from the model adjusted so that it is consistent with the split shown by the Earnings Limits Scan information.
E.15 For Classes 1A, 1B, 2 and 3, the NHS allocations are defined in legislation as a fixed proportion of the total NICs payable, as set out in Appendix C.
E.16 The NHS allocation for Class 4 contributions is different for contributions paid on profits above and below the Upper Profits Limit. This means there is not a constant ratio between contributions allocated to the Fund and NHS for this class. Therefore, I have used the calculation model to determine the split between the Fund and the NHS shares of the contributions based on the assumed self-employed earnings distribution.
Appendix E: Data, methodology and other assumptions 33
Reclaimed NICs for statutory paymentsE.17 Employers can reclaim a proportion of the statutory payments made to employees, plus
an element of “compensation” for small employers, from the amounts of Class 1 NICs they pay. Statutory payments include:
• Statutory Maternity Pay (SMP)
• Statutory Paternity Pay (SPP)
• Statutory Shared Parental Pay (ShPP)
• Statutory Adoption Pay (SAP), and
• Statutory Parental Bereavement Pay (SPBP).
E.18 In broad terms, amounts reclaimed by employers are estimated by adjusting data on amounts reclaimed in the latest complete year (2019-2020) in line with changes in numbers of employees, the numbers of births (or children, in respect of adoption), rates of benefit, and (where relevant) the average earnings of potential recipients.
E.19 The Fund receives payments from the Consolidated Fund to offset the amounts recovered by employers (apart from the compensation element). These payments are estimated in a similar way to the amounts recovered by employers.
Comparison with HMRC estimatesE.20 HMRC also make estimates of NICs using their own models. I have compared my
contribution estimates with those made by HMRC. My estimate of total NICs for 2020-2021 is about 0.4% lower than the figure produced by HMRC. I will continue to liaise with HMRC in relation to the consistency of the projections.
Other receipts modellingE.21 State scheme premiums are payable to the Fund. These premiums relate to individuals
who have been contracted-out of part of the state pension, which ceased to be possible from 6 April 2016. I have assumed that no more state scheme premiums will be received after April 2020.
E.22 The investment income has been estimated for future years by applying an assumed rate of investment return to the average balance in the Fund during each future year. The investment return on the Fund is expected to be close to the Official Bank of England Rate (Bank Rate) given that the assets of the Fund are deposited with the Commissioners for the Reduction of National Debt. The assumed rate of investment return is based on the OBR’s EFO report published in November 2020.

34 Report by the Government Actuary on: The draft Social Security Benefits Up-rating Order 2021; and The draft Social Security (Contributions) (Rates, Limits and Thresholds Amendments and National Insurance Funds Payments) Regulations 2021
Pension benefits modellingE.23 Estimates of expenditure on contributory benefits are projected separately for each of the
following 6 types of benefit;
• pre-2016 awards of the basic state pension
• lump sums payable to those who have deferred, and are not yet in receipt of, their basic state pension
• pre-2016 awards of earnings related additional pension (known as SERPS or S2P)
• graduated retirement benefit
• post-2016 awards of the new state pension
• protected payments (paid alongside new state pension)
E.24 The projection approaches adopted for each type of benefit are detailed in paragraphs E.35 to E.85. All the projections allow for the increases in SPa during 2020-2021.
E.25 The projections use the following data sets provided by DWP:
• the “quarterly statistical extract” of state pension payments (QSE) data set – this is a data set which sets out anonymised data for a 5% sample of all individuals in receipt of benefits and the amount of benefit in payment – the estimates in this report are based on the QSE relating to payments as at 31 March 2020 – QSE data sets also include past lump sums paid where the recipient is still in receipt of a benefit
• the “lifetime labour market database 2” (L2) data set – this is a data set which sets out anonymised data for a 1% sample of the population showing past earnings and contribution record history – the estimates in this report are based on the L2 data set as at 31 March 2018
• the “forecast data” – this is DWP management data forecasting aggregate amounts of benefit expenditure over the current financial year, revised monthly based on actual out-turn
E.26 The projections use the following data sets published by ONS:
• their 2018-based 0% future EU migration population projection for Great Britain
• their 2019-based population estimate for Great Britain
• their 2008-based marital status projections for England and Wales
E.27 During the preparation of this report I have relied on the data sets supplied to me at that time. In particular I have relied on the general completeness and accuracy of the information supplied without independent verification. I have not carried out an independent audit of the data supplied and cannot confirm or guarantee the overall quality or correctness of the data. Any issues with the data could impact on the projections in this report.
E.28 The three ONS data sets were all determined before the pandemic and consequently the initial benefit projections based solely on them would not include any allowance for current excess pensioner deaths caused by the pandemic or the possibility that fewer deaths might occur in future as a result.

Appendix E: Data, methodology and other assumptions 35
E.29 The 6 separate benefit projections were therefore adjusted so that the 2020-2021 estimates align with the DWP forecast data in 2020-2021. I understand that the “forecast data” used (November 2020) allows for actual and expected excess pensioner deaths due to the pandemic in the year 2020-2021 of around 90,000. This is consistent with the assumption for 2020-2021 excess pensioner deaths made in OBR’s EFO.
E.30 I then applied different adjustment factors in each future year so that my projections are consistent with OBR’s other assumption in their EFO that two-thirds of the excess pensioner deaths in the year 2020-2021 are deaths brought forward from years in the projection period to 2025-2026.
E.31 From the data provided I have not been able to identify what proportion of the difference between the individual benefit projections and DWP’s forecast data for 2020-2021 is due to excess pensioner deaths and what proportion is due to other factors. This impact of the pandemic therefore creates more uncertainty than usual around the benefit expenditure projections.
E.32 The adjustment factors used in the year 2020-2021 are as set out below and the adjustment factors in future years of the projections differ from these by less than 1% for all benefits for all future years:
• Basic state pension: 1.00
• Lump sums: 1.16
• Additional pension: 1.00
• Graduated retirement benefit: 0.94
• New state pension: 0.99
• Protected payments: 1.27
E.33 The majority of the adjustment factors are close to 1.00. Aside from excess pensioner deaths, there are various reasons why I would not expect them to equal 1.00. For example, the QSE data set is only a 5% sample size and is produced close to the extract date so does not allow for corrected payments made retrospectively where incorrect benefit payments have initially been made.
E.34 The discrepancy in protected payments between the projection for 2020-2021 and the forecast data (around a 27% difference) is large. To develop an understanding of the causes of this discrepancy would require more detailed analysis and comparison of the L2, forecast data and other relevant data sets.
Basic state pensionE.35 To project expenditure on pre-2016 awards of basic state pension, for each projection
year, I multiplied together:
• a projected number of people over SPa
• an assumed “proportion of the population entitled” (PEnt) to any basic state pension
• an assumed “mean proportion of the standard rate” (MPnSR) payable to those entitled to any basic state pension
• an annual standard benefit rate
36 Report by the Government Actuary on: The draft Social Security Benefits Up-rating Order 2021; and The draft Social Security (Contributions) (Rates, Limits and Thresholds Amendments and National Insurance Funds Payments) Regulations 2021
E.36 I have carried out the above calculations separately for each age and for 5 categories of people; men, single women, married women, divorced women and widows.
E.37 The number of men and women at each age over SPa is taken directly from the 2018-based 0% future EU migration population projection for Great Britain (updated for known 2019 population figures). I then split the numbers for women into single, married, divorced and widowed women using ONS’s England and Wales 2008-based marital status projections.
Proportions entitled (PEnt)E.38 For each age for each of the 5 categories of people I have determined a PEnt assumption
for the year 2020-2021 by comparing the number of people receiving basic state pension in the QSE data with the number of people in the population projection. For married women I have set PEnt assumptions separately depending on whether entitlement is to Category A pension, Category BL pension or both.
E.39 In 2019-2020 this comparison shows that for men and divorced and widowed women the proportion entitled is close to 100% at all ages old enough to qualify for basic state pension. For single and married women the proportion is age related matching recent demographic trends – for example that there were more female earners in younger generations. Based on these observations I have set PEnt assumptions as 98% for men, 96% for divorced women, 100% for widows and age related assumptions for single women and married women.
E.40 The same PEnt assumptions are then used in every future year of the projection but with the age related assumption applying to those aged one year older in each future projection year reflecting the ageing of those old enough to qualify for basic state pension.
Mean proportion of the standard rate (MPnSR)E.41 For each age for each of the 5 categories of people I have determined an MPnSR
assumption for the year 2020-2021. This is done by calculating the average amount of basic state pension received by those receiving some basic state pension in the QSE data and expressing this as a proportion of the standard benefit rate. For married women I have set MPnSR assumptions separately depending on whether entitlement is to Category A pension, Category BL pension or both.
E.42 In 2019-2020 this comparison shows that for men and single, divorced and widowed women the proportion entitled is between 90% and 100% at all ages old enough to qualify for basic state pension. For married women the proportion is age related matching recent demographic trends. Based on these observations I have set MPnSR assumptions as 97% for men, 91% for single women, 94% for divorced women, 98% for widows and age related assumptions for married women entitled to different categories of basic state pension.
E.43 The same MPnSR assumptions were then used in every future year of the projection but with the age related assumption applying to those aged one year older in each future projection year reflecting the ageing of those old enough to qualify for basic state pension.

Appendix E: Data, methodology and other assumptions 37
Adjustments for Category D pensions and incrementsE.44 Some pensioners in receipt of basic state pension are eligible for an increase in pension
up to a specified amount on reaching age 80 (the “Over 80 Pension”). This increase is not based on NICs and is not payable from the Fund but is included and not separately identified in the QSE data. The projection therefore includes an adjustment to the MPnSR assumptions described above to model the exclusion of Over 80 Pension payments from the expenditure projections for basic state pension. These adjustments range between a 0% and 4% reduction in the MPnSR assumption depending on the category of person being projected. In general larger reductions are made to those with lower MPnSR assumptions.
E.45 After calculating the MPnSR assumptions described above I have made an adjustment to those assumptions to reflect that some basic state pension relates to increments paid to those who have previously deferred their basic state pension and are now in receipt of it. These adjustments reflect the proportion of basic state pension that is made up of increments as shown in the QSE data and the different up-rating that increments attract (CPI rather than the triple lock that applies to basic state pension).
E.46 Apart from lump sums captured in the lump sums projections described below, new awards in relation to those who have deferred their basic state pension and are not yet in receipt of it are ignored.
E.47 Except for women with entitlement to Category BL pension (regardless of any entitlement to Category A), the standard benefit rate for projection year 2020-2021 is £134.25 per week. For women with entitlement to Category BL pension the standard benefit rate for projection year 2020-21 is £80.45 per week. The standard benefit rates used are up-rated in line with triple lock up-rating implied by the economic assumptions for future projection years.
Overseas pensioners receiving basic state pensionE.48 Pensioners residing overseas are not captured in the approach to projecting basic state
pension expenditure described above as the population projections used only cover those in GB.
E.49 The QSE data set shows that the net impact of immigration and emigration over SPa is immaterial to the total level of overseas state pension payable. I therefore model payment of basic state pension to overseas pensioners separately as though this group are a closed population. This separate projection is then added to the basic state pension projection described above.
E.50 Payments of basic state pension to pensioners overseas (including increments already in payment) are projected forward by running off the existing payments shown in the QSE data set. The run off uses mortality rates based on ONS’s 2018-based 0% future EU migration GB population projection (i.e. assuming mortality rates for overseas pensioners are in line with those experienced domestically). These projections do not uprate pensions for those living in countries where pensions are frozen.
38 Report by the Government Actuary on: The draft Social Security Benefits Up-rating Order 2021; and The draft Social Security (Contributions) (Rates, Limits and Thresholds Amendments and National Insurance Funds Payments) Regulations 2021
E.51 These projections allow for Category B coming into payment to widows at an average aggregate rate equal to 90% of the Category A pension that it derives from and ignore Category B coming into payment to widowers and bereaved civil partners. Apart from lump sums captured in the lump sum projections described below, new awards in relation to those living overseas who have deferred their basic state pension and are not yet in receipt of it are also ignored.
Lump sumsE.52 People reaching SPa before 6 April 2016 can defer payment of their basic state pension
and take a lump sum when they bring their basic state pension into payment. Projections are made of the amounts of lump sum payable in the future to those still deferring their basic state pension.
E.53 Data from the QSE data set (including previous QSE data sets back to 2011) is used to identify those who have reached SPa before 6 April 2016 and who have subsequently taken a lump sum after deferring their pension. The proportion of those reaching SPa in each year before 6 April 2016 who deferred their pension and took a lump sum is then calculated separately for different deferral periods. For each deferral period the average proportion of the maximum lump sum payable (allowing for up-rating of pension in deferment and payment of interest at 2% above the Bank of England base rate) is also calculated.
E.54 These proportions are then projected forward for each year to 2024-2025 and applied to all people who reached SPa in each year before 6 April 2016. This provides estimates of the numbers who are still deferring their pension, the length of time before they will cease deferring their pension and the proportion of the maximum lump sum payable they will receive when they cease deferring (allowing for up-rating of pension in deferment and interest). Any lump sums projected to be paid in each year up to 2024-2025 are then added up to produce the projections of lump sums payable in each of those years.
E.55 These lump sum projections are carried out separately for four groups: males and females with each split into residents of Great Britain or elsewhere.
Additional pension and graduated retirement benefitE.56 I have projected additional pension and graduated retirement benefit by running off the
existing payments shown in the QSE data set using mortality rates based on ONS’s 2018-based 0% future EU migration GB population projection (updated for known 2019 population figures).
E.57 The mortality rates used in these projections are lower than the mortality rates in ONS’s 2018-based 0% future EU migration GB population projection (updated for known 2019 population figures) as the QSE data set shows that people with additional pension exhibit lower mortality rates than in the population. The adjustments vary by age and gender but, on average for those receiving additional pensions, are equivalent to additional pensions being in payment for about half a year longer than if population mortality rates were used.
E.58 These projections allow for CPI up-rating of these benefits throughout the projection period with adjustments for additional pension for contracting-out deductions and their pre 1988 and post 1988 up-rating rules.
Appendix E: Data, methodology and other assumptions 39
E.59 These projections allow for the inheritance of benefits to widows, widowers and bereaved civil partners using the 2008-based marital status projections for England and Wales to determine the proportion of deaths that lead to inherited benefits becoming payable. For additional pension the rate of inheritance is assumed to lie between 50% and 100%. For graduated retirement benefit the rate of inheritance is assumed to be 50%.
E.60 As the QSE data set includes payment to overseas pensioners this projection approach automatically captures payments of additional pension and graduated retirement benefit to overseas pensioners.
E.61 This modelling approach involves various simplifications which I do not expect to be material. For example, I have ignored:
• the possibility of new awards in relation to current deferrals (new awards to current deferrers will be increasingly rare as the minimum period of deferral increases with the passage of time)
• circumstances that would lead to nil inheritance rates
New state pensionE.62 To project expenditure on post-2016 awards of new state pension, for each projection
year, I multiplied together:
• the projected number of people over SPa
• an assumed “mean proportion of the standard rate” (MPnSR) representing the average proportion payable to each person over SPa
• the annual standard benefit rate
E.63 I have carried out the above calculations separately for each age and for men and women. The number of men and women at each age over SPa was taken directly from the 2018-based 0% future EU migration population projection for Great Britain (updated for known 2019 population figures).
E.64 This approach differs a little to the basic state pension projection. This is because the two projections use different data to determine the average amount payable to each person over SPa. This derives from there being no new awards of basic state pension and relatively few current recipients of new state pension (compared to the number coming into payment over the projection period).
E.65 For each age for men and women I have determined an MPnSR assumption for the year 2020-2021 using the L2 dataset. For each individual in the L2 dataset I have assumed that their post 6 April 2018 contribution record extends such that when they reach SPa they have completed half of their remaining potential qualifying years.
E.66 The same MPnSR assumptions were then used in every future year of the projection but with the age-related assumption applying to those aged one year older in each future projection year reflecting the ageing of those young enough to qualify for new state pension.

40 Report by the Government Actuary on: The draft Social Security Benefits Up-rating Order 2021; and The draft Social Security (Contributions) (Rates, Limits and Thresholds Amendments and National Insurance Funds Payments) Regulations 2021
E.67 With the exception of those who reach SPa before 2022 this leads to an MPnSR assumption of 90% at all ages for men and 91% at all ages for women in all projection years. The MPnSR assumption for those who reach SPa before 2022 is between 89% and 90% for men and between 88% and 91% for women. These age dependant rates depend on how soon after 6 April 2016 they reach SPa. These lower MPnSR assumptions reflect the more limited opportunity for this group to build up their qualifying record to a full new state pension entitlement before reaching SPa.
E.68 The standard benefit rate for projection year 2020-2021 is £175.20 per week. This is up-rated in line with triple lock up-rating implied by the economic assumptions for future projection years.
E.69 These new state pension projections assume no-one chooses to defer new state pension.
Overseas pensioners receiving new state pensionE.70 Pensioners residing overseas are not captured in the approach to projecting new state
pension expenditure described above as the population projections used only cover those in GB.
E.71 The new state pension projections therefore include a separate projection for new state pension payable to individuals residing overseas. This separate projection is then added to the new state pension projection for those resident in Great Britain described above.
E.72 New state pensions already in payment to those residing overseas are captured in the QSE data set and are projected using the same run off approach and same assumptions as used to project overseas basic state pensions already in payment (see paragraphs E.48 to E.51 above) but with no inheritance.
E.73 New awards of new state pension arising from those reaching SPa in the future while resident overseas are then included in each starting and future projection year by multiplying together:
• the total projected number of new overseas pensioner awards each year
• an assumed average proportion of the standard rate of new state pension put into payment
• the standard benefit rate allowing for up-rating
E.74 These projections of new awards of new state pension overseas are carried out separately for four groups: men and women and whether pensions in the overseas country of residence are frozen or not.
E.75 The total number of new overseas pensioners reaching SPa in each projection year is projected by assuming that the rate of new awards to overseas pensioners between 2016 and 2020 (compared to the numbers of recent new awards in GB) continues at the same rate beyond 2020.
E.76 The assumed average proportion of the standard rate is derived from QSE data across all benefit types and are:
• 60% for males with frozen benefits
• 46% for males with non-frozen benefits
• 57% for females with frozen benefits

Appendix E: Data, methodology and other assumptions 41
• 49% for females with non-frozen benefits
E.77 As there are high deferral rates for overseas new awards the approach described above is adjusted to allow for deferrals assuming that 50% of those reaching SPa each year defer payment by up to five years. An allowance is also added for the increments such deferrers would receive.
Protected paymentsE.78 Those reaching SPa from 6 April 2016 onwards may be entitled to protected payments
in addition to new state pension. A person’s protected payment is their entitlement at the introduction of the new state pension based on the pre-Pensions Act 2014 system less the full rate of new state pension. If this calculation is less than zero a person has no protected payment.
E.79 I have identified individuals from the L2 dataset who would be affected by the new state pension transitional arrangements and calculate protected payment amounts for all in this group.
E.80 I then projected these protected payments by running off these amounts using the same mortality rates used to project additional pensions and graduated retirement benefit (see paragraph E.56 and E.57). These projections allow for CPI up-rating and mortality before and after coming into payment. Allowance is made for inheritance of protected payments using ONS’s 2008-based marital status projections for England and Wales and assuming a 50% inheritance rate.
E.81 As the L2 data set includes contribution records for those who have paid NICs and then emigrated overseas this projection approach automatically captures protected payments to overseas pensioners.
Working age benefits and other payments modellingE.82 The estimates of benefits for widows, bereavement, incapacity, employment and support,
jobseekers, maternity, and Christmas bonus are based on information provided by the DWP.
E.83 Estimates for Guardian’s Allowance are derived from recent data, adjusted in line with the projected number of children in the population.
E.84 The administration costs are based on those incurred in 2019-2020 as recorded in the draft Fund accounts, with future costs estimated as the 2019-2020 costs increased in line with earnings growth.
E.85 Redundancy payments estimates (net of redundancy receipts) are provided by the Insolvency Service.
E.86 Each year transfers between the Great Britain National Insurance Fund and the Northern Ireland National Insurance Fund are made in order to keep the balance in the Northern Ireland National Insurance Fund at a certain percentage of the combined balance in the 2 funds (the “parity ratio”). The projections in this report allow for estimated transfers between the two Funds.
42 Report by the Government Actuary on: The draft Social Security Benefits Up-rating Order 2021; and The draft Social Security (Contributions) (Rates, Limits and Thresholds Amendments and National Insurance Funds Payments) Regulations 2021
E.87 At the end of last year I reviewed the method used to determine parity payments. The recommendations of my review have now been accepted and the total payment made in 2020-2021 will be based on my recommendation of a parity ratio of 2.77%. This proportion is based on analysis of the populations aged 16 and over in Great Britain and Northern Ireland as provided in the latest ONS population estimates (2.77% is based on the mid-2019 population estimate published in summer 2020). Payments made after 2020-2021 are assumed to be based on the same parity ratio.
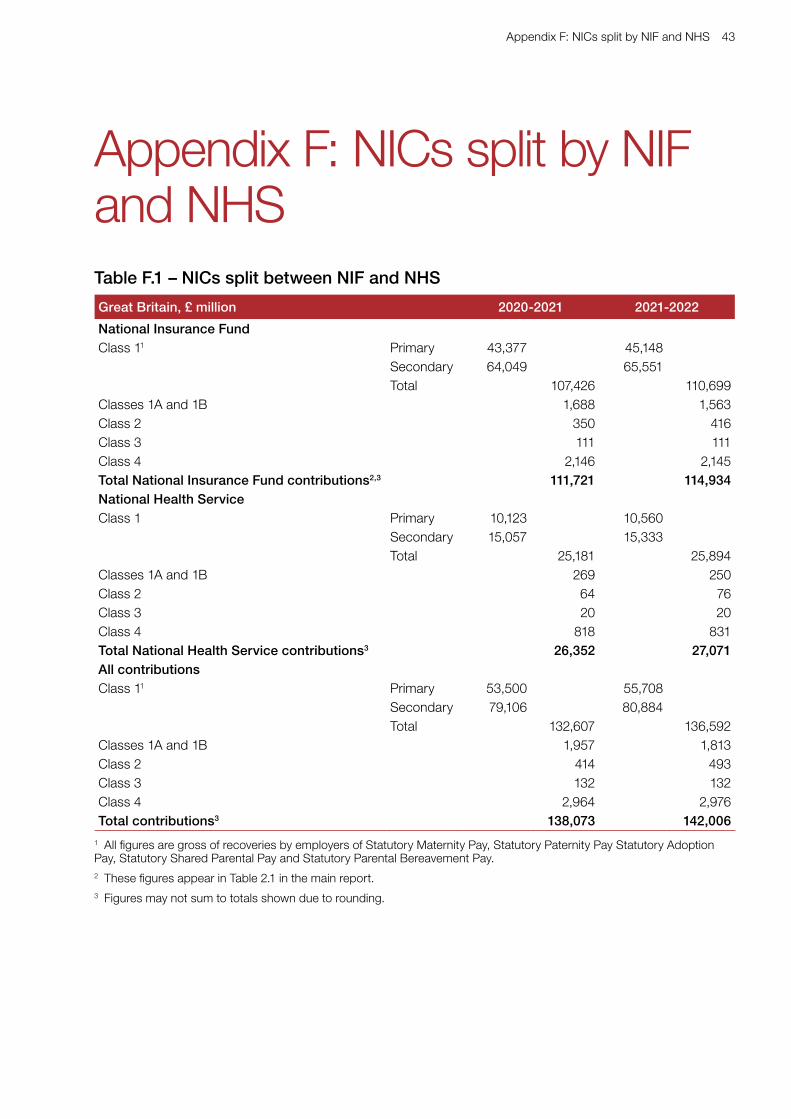
Appendix F: NICs split by NIF and NHS 43
Appendix F: NICs split by NIF and NHSTable F.1 – NICs split between NIF and NHS
Great Britain, £ million 2020-2021 2021-2022
National Insurance FundClass 11 Primary 43,377 45,148
Secondary 64,049 65,551Total 107,426 110,699
Classes 1A and 1B 1,688 1,563Class 2 350 416Class 3 111 111Class 4 2,146 2,145Total National Insurance Fund contributions2,3 111,721 114,934National Health ServiceClass 1 Primary 10,123 10,560
Secondary 15,057 15,333Total 25,181 25,894
Classes 1A and 1B 269 250Class 2 64 76Class 3 20 20Class 4 818 831Total National Health Service contributions3 26,352 27,071All contributionsClass 11 Primary 53,500 55,708
Secondary 79,106 80,884Total 132,607 136,592
Classes 1A and 1B 1,957 1,813Class 2 414 493Class 3 132 132Class 4 2,964 2,976Total contributions3 138,073 142,006
1 All figures are gross of recoveries by employers of Statutory Maternity Pay, Statutory Paternity Pay Statutory Adoption Pay, Statutory Shared Parental Pay and Statutory Parental Bereavement Pay.2 These figures appear in Table 2.1 in the main report.3 Figures may not sum to totals shown due to rounding.

44 Report by the Government Actuary on: The draft Social Security Benefits Up-rating Order 2021; and The draft Social Security (Contributions) (Rates, Limits and Thresholds Amendments and National Insurance Funds Payments) Regulations 2021
Appendix G: Variant projections of the Fund to 2025-2026G.1 This section provides details of the projected cash flow and balance of the Fund over the
period to 2025-2026 under the variant assumptions. Actual receipts and payments in 2019-2020 from the draft Fund accounts are included.
Table G.1 – Variant fund projections to 2025-2026 – 1% higher earnings
Great Britain, £ million2019-2020
2020-2021
2021-2022
2022-2023
2023-2024
2024-2025
2025-2026
Total receipts 113,133 112,939 117,609 122,718 128,903 135,685 142,773Total payments 106,136 109,135 113,631 119,810 125,772 131,737 138,640Excess of receipts over payments 6,997 3,804 3,977 2,908 3,130 3,949 4,133Balance in fund at end of year 36,932 40,737 44,714 47,622 50,752 54,701 58,834Balance at end of year as a percentage of benefit payments 35.2% 37.8% 39.9% 40.3% 40.9% 42.1% 43.0%
Table G.2 – Variant fund projections to 2025-2026 – 1% lower earnings
Great Britain, £ million2019-2020
2020-2021
2021-2022
2022-2023
2023-2024
2024-2025
2025-2026
Total receipts 113,133 110,505 112,236 114,291 117,171 120,441 123,814Total payments 106,136 109,117 113,580 118,168 123,461 128,425 133,787Excess of receipts over payments 6,997 1,388 (1,344) (3,877) (6,289) (7,984) (9,973)Balance in fund at end of year 36,932 38,320 36,976 33,098 26,809 18,825 8,852Balance at end of year as a percentage of benefit payments 35.2% 35.6% 33.0% 28.4% 22.0% 14.9% 6.7%

Government Actuary’s DepartmentFinlaison House, 15-17 Furnival Street, London, EC4A 1ABFax: +44 (0)20 7211 2650Switchboard: +44 (0)20 7211 2601Email: [email protected]@gad.gov.ukWeb: www.gov.uk/gadwww.gov.uk/gad
CCS1220755574978-1-5286-2365-0