report card on parks
TRANSCRIPT
The Report Cardon Parks 2007 An Independent Assessment of New York City’s Neighborhood Parks

Table of Contents
3 The Report Card on Parks
5 WhyanotherReport Card on Parks?
8 SummaryofMethodology
11 Findings
16 ConclusionsandRecommendations
19 DetailedMethodology
24 FindYourPark
30 NewYorkersforParks
The Report Card on ParksTheReportCardhasthreegoals:
1 Toprovidecommunitieswith
anassessmentofhowtheir
neighborhoodparkisperform-
ingincomparisontootherparks
inthecity.This easily accessible online information helps communi-ties advocate for improved services in their neighborhood parks.
2 Toprovideanindependent
assessmentofneighborhood
parkperformancefromyear
toyearagainstadefinedminimum
levelofservice.This creates account-ability for providing both this defined level of service as well as needed improve-ments for every park throughout the five boroughs – and the results show.
3 Tosparkdebateamong
communities,publicagen-
cies,andadvocatesabout
howbesttoimproveandmaintain
neighborhoodparksinneed.The Report Card provides a valuable service by identifying those parks in greatest
New Yorkers for Parks’ award-winning Report Card on Parks provides quantitative performance data on neighborhood parks throughout the five boroughs. In short, it tells New Yorkers how their parks are doing in key service areas, like bathrooms, playgrounds, and pathways. Unlike the larger, high-profile parks of New York City, neighborhood parks are often solely dependent on public funding and, as The Report Card has documented, receive inadequate maintenance attention.
need, but, more importantly, The Report Card indicates how we might begin to address that need. By highlighting both high- and low-performing parks, as well as systemic issues, best practices can be identified and implemented in select parks and incorporated citywide. The Report Card is used by non-profit parks groups, foundations, and public agen-cies, including the Parks Department.
Further, this analysis encourages a more efficient distribution of limited resources toward our parks and play-grounds that are most “in need” and assists in developing strategies for additional funding sources.
The Report Card on Parks was
honored in 2005 by the Brookings
Institution as an outstanding
community indicators project.
2007 Report Card on Parks 3
4 New Yorkers for Parks
The Report Cardvs.theParksInspectionProgram
The Department of Parks and Recreation (DPR) evaluates its properties using a nationally recognized comprehensive program, the Parks Inspection Program (PIP). While PIP rates sites from a park management perspective, the survey used in The Report Card was designed from the park user’s perspective. By listing grades park-by-park in alphabetical order, New Yorkers for Parks’ Report Card is intended to provide a comparative analysis of park conditions as an easy-to-use tool for communities. In addition, the two inspection pro-grams evaluate parks in different ways. For example, The Report Card rates and scores bathrooms and drinking foun-tains. Although the Parks Department tracks these features through PIP, they do not influence a park’s rating, nor are the results of these inspections made public, other than at the citywide level. Recently, the department began posting PIP ratings on its website, but improve-ments are needed to make the data more user-friendly (see sidebar).
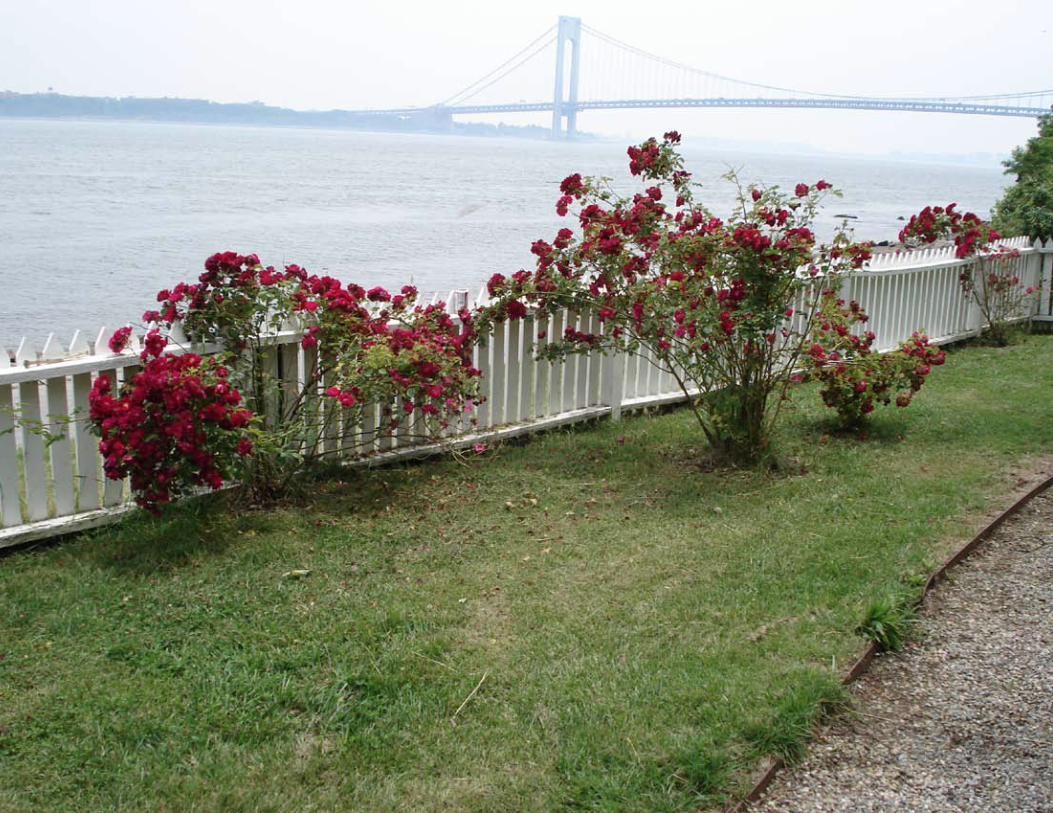
New Yorkers for Parks’ outreach efforts have shown that many communi-ties throughout the five boroughs are frustrated with the conditions of their neighborhood parks. New Yorkers rely on parks and playgrounds for recreation and relaxation, and the lack of maintenance and staffing can result in bare lawns, clogged and broken drinking fountains, and littered pathways. These neighbor-hood parks are the front and back yards of New Yorkers – and they deserve better.
In 2005, DPR began providing individual
park inspection data on its website due
to legislation passed by the New York City
Council. While the provision of this data
is an essential first step, the following
improvements would make PIP results
much more useful to communities:
n PIP results should be easy to find
online. A link to PIP results should be
made available on the front page of the
DPR website. Today, a park user must
search for information about a specific
park in order to see a link to inspection
results. Even those New Yorkers who are
aware that PIP results exist online still
find it difficult to locate information on
their neighborhood park because the
data is obscured within the DPR website.
n PIP results should be centrally located.
Currently, PIP data is presented in various
ways on multiple websites. A user search-
ing for inspection results for a specific
park can find them on the DPR website.
PIP results aggregated by Community
Board can be found on the Mayor’s Office
of Operations website. Citywide results
are available in the annual Mayor’s Manage-
ment Report (a publication evaluating the
performance of each city agency). These
various presentations of the data should
be centrally located and easy to access on
the Parks Department’s website to allow
for meaningful comparisons at the park,
Community Board, and borough levels.
n PIP evaluations should be explicitly
tied to resource deployment. Currently,
information on park spending is not
linked to PIP results. In order to make
effective budget decisions, council mem-
bers and constituents must be able to
determine how financial resources impact
park performance. For example, DPR
could provide the amount of capital and
maintenance dollars spent on playground
safety surfacing over time alongside the
percentage of safety surfacing rated
“acceptable,” so that the public can deter-
mine whether or not sufficient funding is
being provided. The Mayor’s Management
Report would be a good forum for this
type of information.
Reporting on Park Performance: The Parks Inspection Program (PIP)
The Report Card on P arks
2007 Report Card on Parks 5
Why another Report Card on Parks?
In 2006, New Yorkers for Parks updated the universe of sites inspected through The Report Card to correspond more exactly to the Parks Department’s Park Inspection Program (PIP) and so that our inspection sites would mirror the DPR’s own inspection categorizations. This new neighborhood park list is based on the PIP roster. New Yorkers for Parks used the same process as in previous years to determine the study universe, focusing on all “park” properties between 1–20 acres. Due to the use of this new, more accurate, park roster the 2007 Report Card universe is made up of 111 parks, fewer than previous reports.1
Along with refreshing our survey universe to correspond with the DPR’s PIP roster, we have made several needed changes to the methodology of The Report Card. Most significantly, evaluations of athletic fields and bathrooms have been revised and refined this year. An evaluation form was created to specifically measure the conditions of synthetic turf fields, and the “Bathroom” form was refined to include measures that the NYC De-partment of Health uses in evaluating bathrooms at public beaches, which are operated by DPR. These changes limit the ability to draw year-to-year com-parisons of park performance; however, this report provides general contextual comparisons of conditions over time. For more specific historical information on performance, please download the 2005 Report Card on Parks from www.ny4p.org.
In 2003, New Yorkers for Parks released its first Report Card on Parks. The Report Card is designed to track trends in park conditions, highlight successes, identify consistent challenges, and enhance the park policy discussion. Since 2003, The Report Card has been a catalyst for change in New York City’s park system. New Yorkers for Parks will continue to use The Report Card to measure conditions and strive for effective solutions to the challenges it documents.
Since its inception, The Report Card has been
a vehicle for new management strategies
resulting in measurable park improvements.
The creation of the Neighborhood Parks
Initiative (NPI) was one of the most notable
accomplishments of The Report Card.
Founded by New Yorkers for Parks and
the Parks Department, the program was
designed to address the lack of fixed staff
in city parks, which results in inadequate
maintenance, as detailed in the 2003 Report
Card on Parks. NPI was a partnership among
New Yorkers for Parks, DPR, Central Park
Conservancy, and City Parks Foundation
that leveraged public and private funding to
bring full-time gardeners and extra financial
support to needy parks across the city.
Participating parks were chosen based on
needs documented by The Report Card and
PIP. Gardeners were trained by the Central
Park Conservancy based on their suc-
cessful “zone management” model of park
maintenance. The program has significantly
improved conditions of participating parks,
and its success is evidenced by the Mayor’s
FY 2008 Preliminary Budget, which base-
lined $1.5 million to make these gardener
positions permanent.
The Report Card:Accomplishments
1 Of the neighborhood parks surveyed for the 2007 Report Card, 23% (26 parks) had never been surveyed before, while 77% (85 parks) had been surveyed at least once before in 2003, 2004, or 2005.

6 New Yorkers for Parks
The findings of The Report Card have historically reflected the concerns that many of New York City’s communities have regarding their parks. Some of these concerns are expressed below, in excerpts from the FY 2007 Community District Needs Statements, issued by the Depart-ment of City Planning and the Office of Management and Budget:
Bronx
“The re-seeding of grass, the pruning of trees and bushes, as well as the repair of park benches, in all of our parks, remains a major concern of this district. We continue to be distressed at progressive financial cuts suffered by this agency lim-iting both its capital and expense efforts.” – Community District 4
Manhattan
“Additional workers are needed to provide gardening/horticulture, pruning, erosion control, and graffiti removal. Without adequate staff, major capital investments and horticulture will be in jeopardy.”
– Community District 7
Why another Report Card on Parks?
Due to the success of The Report Card,
New Yorkers for Parks has expanded this
model in recent years to measure the con-
ditions of our neighborhood parks in new
ways and to measure the performance of
different types of park properties:
n 2005 Mini Report Card on Parks: Monthly
inspections of athletic fields, drinking
fountains, and bathrooms in June, July,
and August documented how conditions
change over the summer, a high-use
season.
n 2006 Progress Report on Neighborhood
Parks: This report provided new data on
the ten highest and ten lowest perform-
ing parks of the 2005 Report Card.
n 2007 Report Card on Beaches: This sum-
mer, New Yorkers for Parks will release
this new report measuring the conditions
of all seven municipal beaches, which are
managed by the Parks Department.
These publications, available at www.ny4p.
org, are tools for communities to assist
them in effectively advocating for change.
Queens
“Constant use of our parks necessitates daily clean-up and maintenance of the parks sites in Community Board 2. Overflowing trash baskets combined with piles of litter throughout the parks attract vermin and rats, which are detrimental to our residents and discourage use of our precious open spaces.” – Community District 2
Brooklyn
“Tree planting and pruning, landscap-ing, and erosion control are needed, as are rehabilitation of pavements, playing courts, and amenities, such as comfort stations and water fountains. Redesign of sufficient numbers of park pathways and facilities to make parks accessible to the disabled are crucial capital terms.” – Community District 2
StatenIsland
“Every year the number of workers for the Parks Department is reduced – enough is enough – we need more workers, not less. What good is all the money for capital projects if you can’t use the parks because they are not maintained?” – Community District 2
These statements show the importance that neighborhood parks play in every New Yorker’s life.
NewResearchTools

8 New Yorkers for Parks
Summary of MethodologyThis report is intended as a follow-up to the New Yorkers for Parks 2003, 2004, and 2005 Report Card on Parks. Below is a summary of the methodology con-structed for this report; a full discussion of the methodology can be found in the
“Detailed Methodology” section.
SurveyPopulation
As in years past, in constructing The Report Card, New Yorkers for Parks focused on DPR “park” proper-ties between one and 20 acres, as these properties represent New York City’s neighborhood parks. In 2007, New York-ers for Parks referred to the DPR’s Parks Inspection Program roster, which defined a survey population of 123 small to mid-size parks, fewer properties than in previ-ous years. Several of these parks were not included in the study. For example, we did not survey those parks that were closed for capital improvement. Further, certain park properties, like skating rinks, zoos, or forests with no user trails, have none of The Report Card’s Major Service Areas (MSAs) and were dropped from consideration in this report (the full list of MSAs can be found on the next page). The final survey universe in 2007 consisted of 111 park properties, 85 of which have been surveyed at least once in 2003, 2004, or 2005.
GradingtheParks
New Yorkers for Parks convened a focus group of park experts and community leaders to help define the eight MSAs, along with a scale of weights to reflect the relative importance of different indi-cators. MSAs were weighted on a scale of 1 to 5 (5 being the most important to a park user’s experience). These service areas were evaluated on maintenance, cleanliness, safety, and structural integrity. Thus, for each of the 111 parks included in the survey, every applicable MSA was assigned a numerical score. A park’s overall numerical score was calculated as a weighted average of these service area scores. The numerical scores were then converted to a final letter grade.
Each park was assigned a numerical score from 0 to 100 in each applicable MSA, based on the proportion of features in those service areas found to be in accept-able condition. This was done using an independently developed survey mecha-nism that is based on the DPR’s Parks Inspection Program (PIP). Next, MSA scores were averaged by weight to give an overall numerical park score. (Those parks lacking one or more of the MSAs were not penalized.) Letter grades correspond-ing to these numerical scores comprise the final park ratings in accordance with the following conversion table:
Raw Numerical Grade Letter Grade
97-100 A+
93-96 A
90-92 A-
87-89 B+
83-86 B
80-82 B-
77-79 C+
73-76 C
70-72 C-
60-69 D
59 and below F
Score / Grade associations developed by a focusgroup of park managers and open space experts.
The survey is designed to fairly rate all features that are or should be available to a user visiting a park. By way of example, if a park has a bathroom facility that is locked or closed without explanation, it receives a “0” for the bathroom rating. However, if the park does not have a bathroom, it does not receive a score for bathrooms, so that a park is never penal-ized for not having a particular Major Service Area.
SurveyMechanism
New Yorkers for Parks uses a compre-hensive survey mechanism developed specifically for The Report Card on Parks to determine a park’s rating. There are eight MSAs tracked through the survey mechanism that break down into 12 feature forms. Surveyors complete a survey feature form for each of the fea-tures found in a park. For example, if there are three drinking fountains in a park, a surveyor completes three
‘Drinking Fountain’ forms. Surveyors answer a series of questions on the maintenance, cleanliness, safety, and structural integrity of a feature. The total park score is based on the percentage of features evaluated that are found in acceptable condition.
SurveyWork 2
Finally, New Yorkers for Parks staff conducted the survey Tuesday through Friday between June and August 2006, a high-use season for public parks. Teams of trained surveyors used hand-held computers and digital cameras to complete the evaluations. For each MSA evaluated, digital photographs were taken; both survey forms and photos are stored as documentation of survey efforts and results.
2 All surveying for the 2007 Report Card on Parks took place during the summer of 2006. Any capital projects or other park improvements that were completed between the date of a given park’s evaluation and the publication of this report have no effect on the park’s grade. For example, Harlem River Drive Park’s grade is based solely on inspection data collected in June 2006 and is not impacted by the ballfield renovation that began in September 2006.

2007 Report Card on Parks 9
Major Service Area Description Weight
ActiveRecreation
This MSA evaluates all athletic fields and courts in a park. Athletic fields include natural grass, asphalt and synthetic soccer, football, and baseball fields, and courts include basketball, handball, bocce, and volleyball facilities.
3
Passive Greenspace
This MSA evaluates all green and passive features in a park. Features included in this service area are lawns, landscaped areas, and gardens; park trees; waterbodies; and natural areas. The trees included in the form are only those contained within tree pits in the park.
5
Playgrounds
This MSA evaluates all playground areasand playground equipment in a park. 5
ImmediateEnvironment
This MSA measures how well a park is insulated from potential negative impacts of its surroundings. Intrusive odors, emissions, exhaust and excessive noise are monitored.
3
Major Service Area Description Weight
Bathrooms
This MSA evaluates each discrete bathroom or comfort station in a park. 4
DrinkingFountains
This MSA evaluates each discrete drinking fountain in a park. 3
SittingAreas
This MSA evaluates each discrete sitting area in a park. 5
Pathways
This MSA evaluates each type of walkway in a park, including asphalt, dirt, turf, or concrete.
3
Why another Report Card on Parks?

2007 Report Card on Parks 11
Findings
ThequalityofneighborhoodparksvarieswidelythroughoutNewYorkCity.
Even among parks that rely solely on public funds, there is a disparity in park conditions. Hellgate Field in Queens (90%), one of the highest performing parks, and Crawford Fields in Brooklyn (33%), one of the low performers, offer similar features – baseball fields and drinking fountains – but vary widely in maintenance conditions.
Disparities also exist between parks that have access to private funding and those that do not. The two highest perform-ing parks this year were Bryant Park and Public Place3 (Battery Park City.) Bryant Park, privately funded and managed by the Bryant Park Restoration Corpora-tion, has been the highest scoring park in every year of Report Card surveys. Public Place has been a consistently high scoring
park and is cared for through dedicated funding by the Battery Park City Parks Conservancy. The two groups are able to devote significant resources to manage and maintain these sites. Unfortunately, the lowest scoring park citywide, Spuyten Duyvil Shorefront Park in the Bronx, received only a 32% (F). (This park was new to the survey universe this year.)
As five years of survey results have shown, individual park conditions often fluctuate from year to year depending on maintenance. Frequently, parks that rely solely on public funding do not receive consistent care and are subject to irregular maintenance levels. These disparities exist throughout neighborhood parks in New York City, and they must be addressed.
The Parks Department is currently managing the largest capital budget in its history,4 due in part to funding for Lower Manhattan after 9/11 and money that has
been directed to Bronx parks as mitiga-tion for the construction of the Croton Water Filtration plant in Van Cortlandt Park and the new Yankee Stadium in Macombs Dam Park. In addition, across the city, new parks like the High Line and Fresh Kills Park are being constructed. While capital funding can bring about impressive improvements in the short term, long-term success is dependent upon consistent maintenance. The Report Card shows that maintenance of existing parks continues to be a challenge.
The Report CarddocumentedalargepercentageofparksreceivingC’s,D’sandF’s.
Unfortunately, the “A”s and “B”s were few and far between in this year’s surveys. Less than one quarter of the parks sur-veyed received an “A” or “B”. “A” parks comprised 9% of the universe, while
“B” parks comprised 14%. The majority of parks – representing 39% of those surveyed – received “C” grades. 16% of parks received “D”s and 22% received
“F”s. This breakdown of grades differs sig-nificantly from past Report Cards, where the percentage of parks earning each grade was more evenly split.
The Report Card shows that although targeted management strategies are effective, inadequate care remains a challenge. The varying quality of maintenance results in too many parks receiving average and failing scores.
A: 9%
B: 14%
C: 39%
D: 16%
F: 22%
A Parks B Parks C Parks D Parks F Parks
10
16
43
18
24
Number of Parks by GradeBreakdown of Grades Citywide
3Public Place is one of several city parks in Battery Park City (BPC). At this time, it is the only BPC site listed in the Parks Department’s roster and therefore the only site in BPC that is evaluated by The Report Card. BPC’s 32 acres of parkland include all of The Report Card’s Major Service Areas, though only 1.25 are found at Public Place. 4Department of Parks & Recreation, “Biennial Report 2004-2005.” Available from www.nycgovparks.org.
12 New Yorkers for Parks
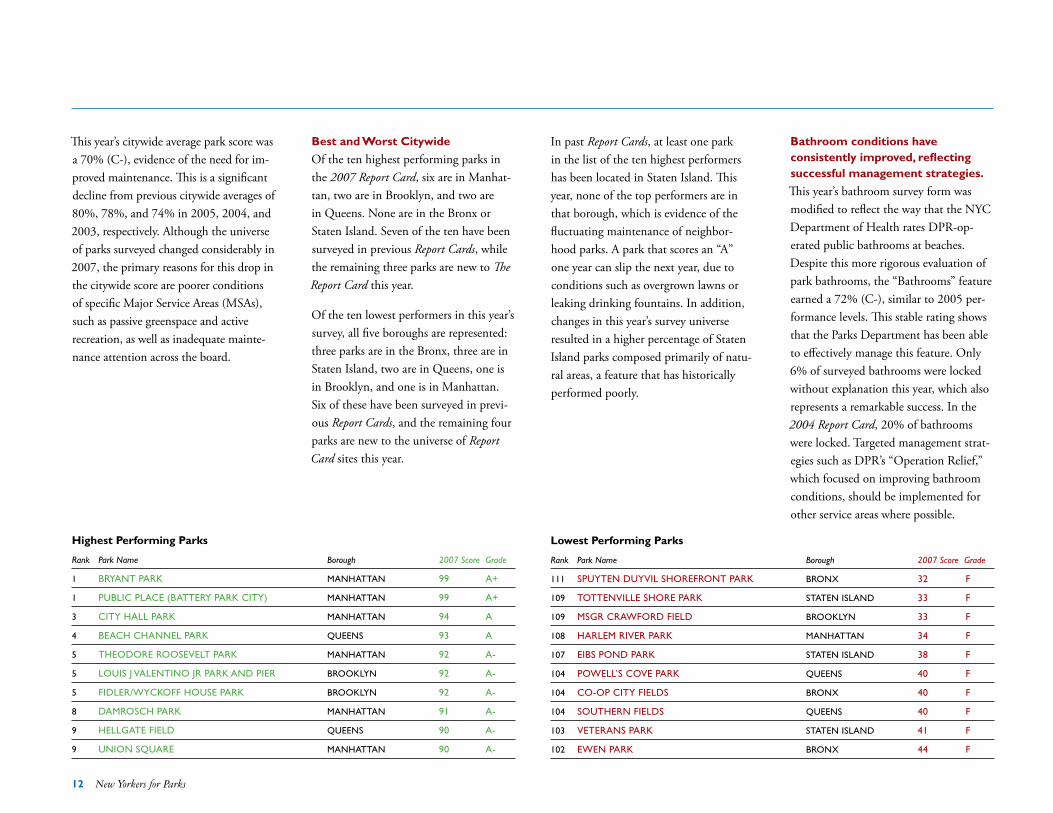
This year’s citywide average park score was a 70% (C-), evidence of the need for im-proved maintenance. This is a significant decline from previous citywide averages of 80%, 78%, and 74% in 2005, 2004, and 2003, respectively. Although the universe of parks surveyed changed considerably in 2007, the primary reasons for this drop in the citywide score are poorer conditions of specific Major Service Areas (MSAs), such as passive greenspace and active recreation, as well as inadequate mainte-nance attention across the board.
BestandWorstCitywide
Of the ten highest performing parks in the 2007 Report Card, six are in Manhat-tan, two are in Brooklyn, and two are in Queens. None are in the Bronx or Staten Island. Seven of the ten have been surveyed in previous Report Cards, while the remaining three parks are new to The Report Card this year.
Of the ten lowest performers in this year’s survey, all five boroughs are represented: three parks are in the Bronx, three are in Staten Island, two are in Queens, one is in Brooklyn, and one is in Manhattan. Six of these have been surveyed in previ-ous Report Cards, and the remaining four parks are new to the universe of Report Card sites this year.
In past Report Cards, at least one park in the list of the ten highest performers has been located in Staten Island. This year, none of the top performers are in that borough, which is evidence of the fluctuating maintenance of neighbor-hood parks. A park that scores an “A” one year can slip the next year, due to conditions such as overgrown lawns or leaking drinking fountains. In addition, changes in this year’s survey universe resulted in a higher percentage of Staten Island parks composed primarily of natu-ral areas, a feature that has historically performed poorly.
Bathroomconditionshaveconsistentlyimproved,reflectingsuccessfulmanagementstrategies.
This year’s bathroom survey form was modified to reflect the way that the NYC Department of Health rates DPR-op-erated public bathrooms at beaches. Despite this more rigorous evaluation of park bathrooms, the “Bathrooms” feature earned a 72% (C-), similar to 2005 per-formance levels. This stable rating shows that the Parks Department has been able to effectively manage this feature. Only 6% of surveyed bathrooms were locked without explanation this year, which also represents a remarkable success. In the 2004 Report Card, 20% of bathrooms were locked. Targeted management strat-egies such as DPR’s “Operation Relief,” which focused on improving bathroom conditions, should be implemented for other service areas where possible.
HighestPerformingParks
Rank Park Name Borough 2007 Score Grade
1 BRYANT PARK MANhATTAN 99 A+
1 PUBLIC PLACE (BATTERY PARK CITY) MANhATTAN 99 A+
3 CITY hALL PARK MANhATTAN 94 A
4 BEACh ChANNEL PARK QUEENS 93 A
5 ThEODORE ROOSEVELT PARK MANhATTAN 92 A-
5 LOUIS J VALENTINO JR PARK AND PIER BROOKLYN 92 A-
5 FIDLER/WYCKOFF hOUSE PARK BROOKLYN 92 A-
8 DAMROSCh PARK MANhATTAN 91 A-
9 hELLGATE FIELD QUEENS 90 A-
9 UNION SQUARE MANhATTAN 90 A-
LowestPerformingParks
Rank Park Name Borough 2007 Score Grade
111 SPUYTEN DUYVIL ShOREFRONT PARK BRONx 32 F
109 TOTTENVILLE ShORE PARK STATEN ISLAND 33 F
109 MSGR CRAWFORD FIELD BROOKLYN 33 F
108 hARLEM RIVER PARK MANhATTAN 34 F
107 EIBS POND PARK STATEN ISLAND 38 F
104 POWELL’S COVE PARK QUEENS 40 F
104 CO-OP CITY FIELDS BRONx 40 F
104 SOUThERN FIELDS QUEENS 40 F
103 VETERANS PARK STATEN ISLAND 41 F
102 EWEN PARK BRONx 44 F
Why another Report Card on Parks?

2007 Report Card on Parks 13
ImmediateEnvironment,Pathways,andSittingAreasperformsatisfactorily.
Historically, “Pathways,” “Sitting Areas,” and “Immediate Environment” have been among the higher scoring service areas, and although their scores slipped slightly this year, the 2007 results con-tinue that trend.
“Immediate Environment” has been the highest rated service area in every Report Card on Parks. The average score this year was 89% (B+). Immediate environment conditions are measured by assessing the accessibility of the park and the impact of its surroundings. The high score reflects the fact that New York City parks are typically safely acces-sible and are not markedly impacted by smog, noise, or traffic.
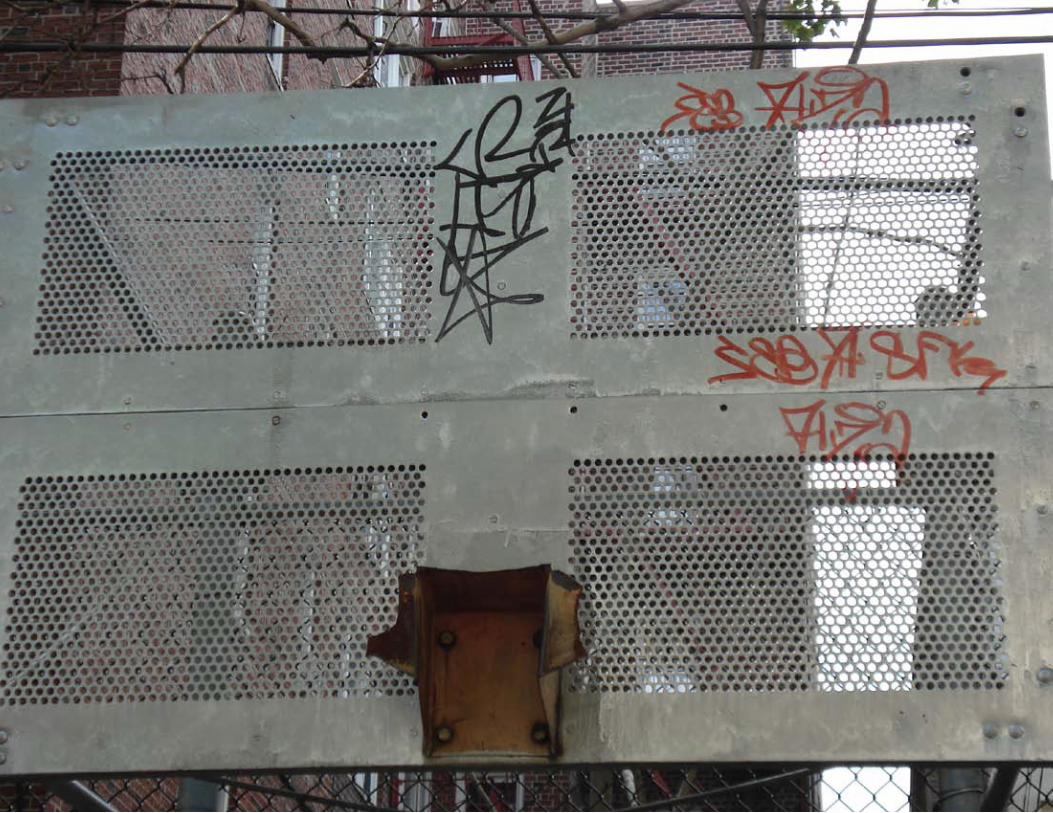
“Sitting Areas” received a 78% (C+) this year, similar to past results. Primary chal-lenges included litter, graffiti, and dam-aged benches. “Pathways” earned a rating of 77% (C+), with cracks and missing, raised, or sunken pavement providing the majority of unacceptable conditions. Pathways were also affected by excessive litter and debris.
“Green”serviceareasneedattention.
The “Passive Greenspace” MSA per-formed poorly this year, receiving only a 66% (D). Passive greenspace features were affected by horticultural issues, such as bare, discolored, or overgrown grass on lawns, and dead branches on trees and in lawns. Litter and broken glass were less frequently noted.
The“NaturalAreas”featurehas
historicallyperformedpoorlyon
The Report Card,andthisyearisno
different. Four of the ten lowest perform-ing parks this year are made up primarily of natural areas, such as woodlands. The average score for “Natural Areas” was a 46% (F) this year, due primarily to exces-sive litter, damaged fencing, and broken glass. Erosion and excessive natural debris were also frequently cited. Although basic maintenance attention is required to clean trash and broken glass, additional Forestry staff and services would address erosion and other similar issues.
Poortreeperformanceinthisyear’s
surveypresentsasimilarconcern. Trees in tree pits scored an average of 75% (C), representing a significant decline since the 2005 Report Card. Although litter and broken glass were found, poor tree health and damaged tree pits were the most common problems. The health of trees in lawns had a 36% “unacceptable” rating, resulting from dead branches,
erosion, and other signs of deterioration. Enhancements to the Forestry and Hor-ticultural staff are needed to sufficiently address these issues.
Recreationfeaturesrequireincreasedmaintenance.
“Playgrounds,”historicallyahighper-
formingfeature,arebeginningtoslip. Although this feature earned a 79% (C+) this year, performing higher than most other service areas, this represents a de-cline from previous years’ scores, typically in the “B” to “B+” range. “Playgrounds” in the 2007 survey were particularly af-fected by damaged or missing equipment, including missing swings and excessive rust, found at 27% of sites. Maintenance also presented a challenge in this service area, with sloppy paint jobs and needed or shoddy repairs frequently found. Safety surfacing was rated “unacceptable” at 12% of sites, resulting in unsafe condi-tions for children. Average Score of Each Major Service Area (MSA)
Active Recreation
Bathrooms DrinkingFountains
ImmediateEnvironment
PassiveGreenspace
Pathways SittingAreas
Playgrounds
60%
72%
40%
89%
66%
77% 78% 79%
Why another Report Card on Parks?

14 New Yorkers for Parks
“ActiveRecreation”featurescontinue
toperformpoorly.This feature received a 60% (D) this year. Courts received a disappointing score of 68% (D), while grass, asphalt, and synthetic athletic fields received a 52% (F) average. Nearly one-quarter (23%) of grass athletic fields that were evaluated were locked or had exces-sive broken glass, severely impacting the score for that feature. Considering the intense demand for play time in NYC, athletic fields should never be locked during high-use times.
DrinkingFountainscontinuetoperformpoorly.
As in years past, Drinking Fountains received a failing grade (40%). This feature is plagued by maintenance, safety, and structural challenges. Even when drinking fountains provide water with sufficient pressure, users frequently find trash, mold, and severe leaks. These unac-ceptable conditions must be addressed through the development of a program similar to “Operation Relief,” which improved bathrooms.
Why another Report Card on Parks?
SyntheticTurf
In recent years, the NYC Parks Department
has increasingly turned to synthetic turf
for field renovations due to the mainte-
nance challenges of natural grass as well as
the increased demand for field play time.
For the first time in 2007, The Report Card
specifically tracked the performance of
synthetic turf to baseline conditions. The
average score for the nine fields surveyed
was 74% (C). Although synthetic fields
earned a higher average score than grass
fields, which received an average of 59% (F),
most synthetic fields have been installed in
the past two to three years and have not
been subject to the same amount of wear
and tear as natural grass fields.
Generally, synthetic turf fields that were
installed in the past two years performed
in the “A” and “B” range. Fields installed
before 2004 did not fare as well, suffering
more frequently from loose seams and litter,
which raises concerns regarding how well
synthetic fields are being maintained and
how they will hold up into the future.
For more information on synthetic turf,
please visit ny4p.org and download the park
policy paper, “A New Turf War: Synthetic
Turf in NYC Parks.”
2007 Report Card on Parks 15
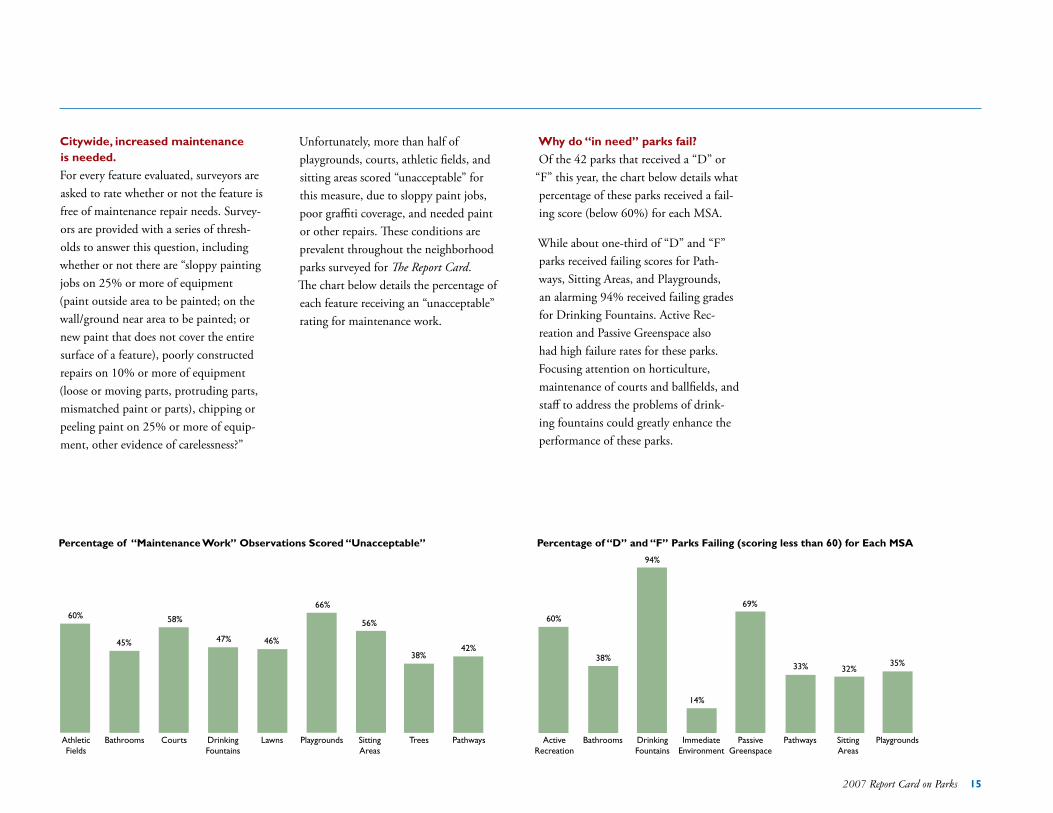
Unfortunately, more than half of playgrounds, courts, athletic fields, and sitting areas scored “unacceptable” for this measure, due to sloppy paint jobs, poor graffiti coverage, and needed paint or other repairs. These conditions are prevalent throughout the neighborhood parks surveyed for The Report Card. The chart below details the percentage of each feature receiving an “unacceptable” rating for maintenance work.
Citywide,increasedmaintenanceisneeded.
For every feature evaluated, surveyors are asked to rate whether or not the feature is free of maintenance repair needs. Survey-ors are provided with a series of thresh-olds to answer this question, including whether or not there are “sloppy painting jobs on 25% or more of equipment (paint outside area to be painted; on the wall/ground near area to be painted; or new paint that does not cover the entire surface of a feature), poorly constructed repairs on 10% or more of equipment (loose or moving parts, protruding parts, mismatched paint or parts), chipping or peeling paint on 25% or more of equip-ment, other evidence of carelessness?”
Why another Report Card on Parks? Whydo“inneed”parksfail?
Of the 42 parks that received a “D” or “F” this year, the chart below details what percentage of these parks received a fail-ing score (below 60%) for each MSA.
While about one-third of “D” and “F” parks received failing scores for Path-ways, Sitting Areas, and Playgrounds, an alarming 94% received failing grades for Drinking Fountains. Active Rec-reation and Passive Greenspace also had high failure rates for these parks. Focusing attention on horticulture, maintenance of courts and ballfields, and staff to address the problems of drink-ing fountains could greatly enhance the performance of these parks.
Percentage of “Maintenance Work” Observations Scored “Unacceptable”
AthleticFields
Bathrooms Courts DrinkingFountains
Lawns Playgrounds SittingAreas
Trees Pathways
60%
45%
58%
47% 46%
66%
56%
38%42%
Percentage of “D” and “F” Parks Failing (scoring less than 60) for Each MSA
ActiveRecreation
Bathrooms DrinkingFountains
ImmediateEnvironment
PassiveGreenspace
Pathways SittingAreas
Playgrounds
60%
38%
94%
14%
69%
33% 32%35%
16 New Yorkers for Parks
Conclusions and RecommendationsThe 2007 Report Card on Parks shows that targeted management strat-egies are effective, but too many of our neighborhood parks still suffer from insufficient maintenance. The Mayor and City Council have taken an important step to ensure green, safe, and clean parks by adding $25 million in new funding to the DPR’s FY 2008 budget. The City should continue its efforts towards sufficiently funding the Parks Department – an important step in improving park services.
The City is also investing in parks through the PlaNYC 2030 initiative to ensure New York’s sustainable growth. This project will outline how the city’s infrastructure – including its “green infrastructure” – will grow to accommodate one million new residents in the next 25 years. This important initiative sets broad, ambitious and needed targets for our park system, and to ensure their implementation, the City must support its agencies with sufficient financial and management resources.
The following recommendations address the needs documented by The Report Card while working to meet the goals of PlaNYC 2030:
1.Greening:nAugment the Forestry Team to
improve maintenance of natural areas and trees.
2.Recreation:nEnhance dedicated staffing and
funding for playgrounds.
nEnsure that athletic fields are unlocked during high-use times.
3.Maintenance:nExpand training for maintenance
workers and ensure efficient and consistent repairs.
1.GREENINGAugmenttheForestryTeamtoimprovemaintenanceoftreesandnaturalareas.
The Report Card on Parks clearly shows the need for additional care for trees and natural areas throughout the city. Natural areas are one of the lowest performing features on The Report Card and too frequently are affected by severe erosion and debris. PlaNYC 2030 calls for the preservation of natural areas as a way to mitigate pollution and open NYC’s waterways to recreation. However, the important environmental benefits of natural areas will not be fully realized unless staffing levels are augmented to provide for consistent care.

2007 Report Card on Parks 17
Trees are another integral aspect of PlaNYC 2030. The Parks Department has a commendable goal to increase the tree canopy from 24% to 30% to improve environmental conditions and overall quality of life. While street trees are regularly pruned every ten years, NYC’s two million park trees are pruned on an “emergency only” basis, resulting in trees with dead and hanging branches in desperate need of maintenance, as evidenced by The Report Card results. This troubling standard of care must be improved, especially when tree issues represent the majority of park-related calls to 311.5
Today, DPR employs only 14 Foresters and only 54 Climber/Pruners – less than one per Community District – to care for the two million trees in city parks.6 By increasing forestry resources, the City would ensure the health of natural areas and trees and improve their capacity to mitigate the effects of the urban environ-ment. Enhancing forestry staffing is a great first step towards implementing the goals of PlaNYC 2030.
2.RECREATIONEnhancededicatedstaffingandfundingforplaygrounds.
PlaNYC 2030 aims to ensure that every New Yorker lives within a ten minute walk of a park – an admirable goal. But even more importantly, it is the City’s responsibility to make sure that those parks are safe and sufficiently main-tained. The decline in the conditions of playgrounds in this year’s Report Card is disconcerting. Urban children depend on these play spaces as safe areas to recreate and exercise but too often are met with unsafe conditions.
In the late 1990s, the City successfully focused capital funding on refurbishing and rebuilding playgrounds across the city. Unfortunately, ten years later, a lack of sufficient maintenance has resulted in rusted or missing equipment and safety surfacing in disrepair in too many neighborhood parks. A new infusion of capital is needed to conduct minor im-provements at a variety of sites across the city. The Mayor’s FY 2008 Preliminary Budget includes funding for 40 new full-time workers responsible for maintaining playground equipment. These positions, as well as a concerted effort towards plac-ing dedicated staff in playgrounds, will help to ensure that unsafe conditions are addressed in a timely manner.
Ensurethatathleticfieldsare
unlockedduringhigh-usetimes.
The Parks Department must address the low performance of athletic fields. Ballfields must be adequately maintained and unlocked during high-use times. According to the agency, applications for permits for baseball and softball fields have doubled over the past six years.7
In a city that is struggling to meet the demands of sports field users, baseball and soccer fields in public parks should never be locked during high-use times. The City owes it to New Yorkers to open these fields so that all may enjoy them.
In addition, when natural grass fields are open for play, they are frequently found in poor condition. This ongoing issue must also be addressed. The instal-lation of synthetic turf is not the only way to tackle the maintenance challenges of grass. The Parks Department must develop a targeted management strategy to maintain natural grass facilities, which offer significant environmental benefits that should not be overlooked.
3.MAINTENANCEExpandtrainingformaintenanceworkersandensureefficientandconsistentrepairs.
Finally, the results of this year’s Report Card on Parks show a need not only for more frequent maintenance care but also for improved maintenance strategies. Pol-icies and practices including the response time for needed repairs, training of work-ers, and availability of supplies should be evaluated and enhanced. Maintenance must be completed in a timely and pro-fessional manner in every neighborhood park, so that clean, safe, and green parks are the standard throughout every New York City community.
Why another Report Card on Parks?
5Mayor’s Office of Operations, Preliminary Mayor’s Management Report, Fiscal Year 2007. 6Independent Budget Office analysis of Department of Parks and Recreation Active Positions, July 31, 2006. 7Williams, Timothy. “Fine Diamonds, Locked Away.” The New York Times, 26 Oct. 2005.

2007 Report Card on Parks 19
Detailed Methodology
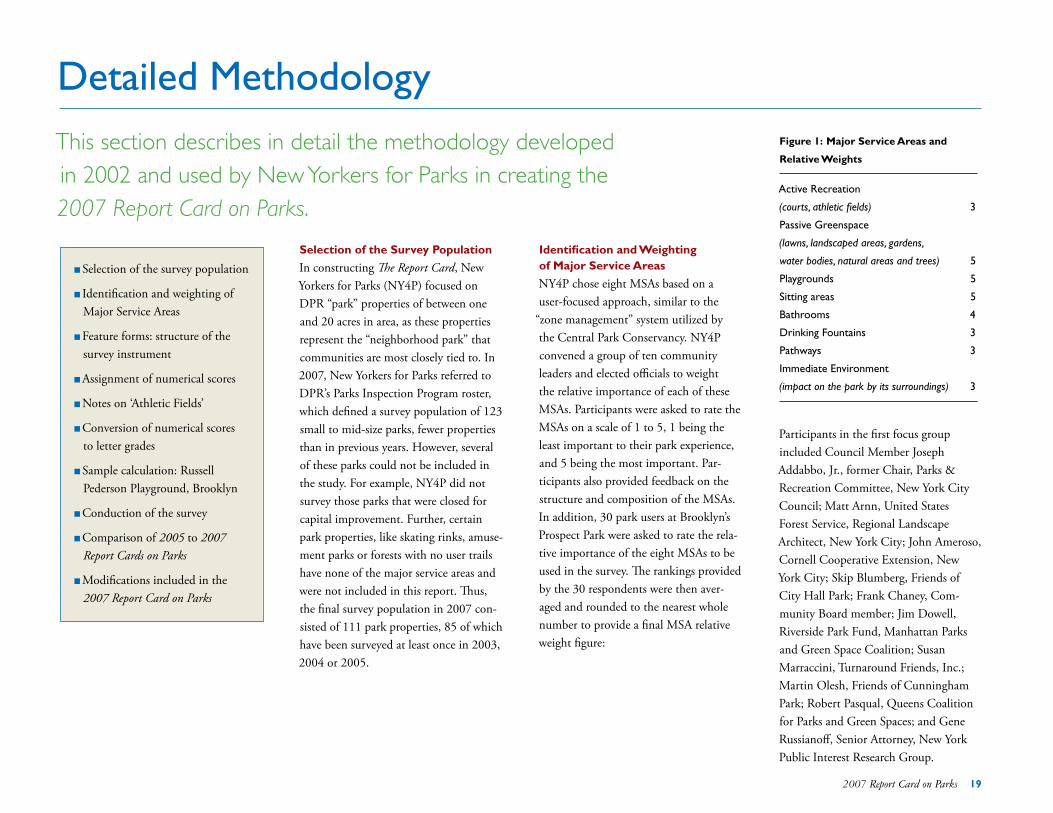
SelectionoftheSurveyPopulation
In constructing The Report Card, New Yorkers for Parks (NY4P) focused on DPR “park” properties of between one and 20 acres in area, as these properties represent the “neighborhood park” that communities are most closely tied to. In 2007, New Yorkers for Parks referred to DPR’s Parks Inspection Program roster, which defined a survey population of 123 small to mid-size parks, fewer properties than in previous years. However, several of these parks could not be included in the study. For example, NY4P did not survey those parks that were closed for capital improvement. Further, certain park properties, like skating rinks, amuse-ment parks or forests with no user trails have none of the major service areas and were not included in this report. Thus, the final survey population in 2007 con-sisted of 111 park properties, 85 of which have been surveyed at least once in 2003, 2004 or 2005.
IdentificationandWeightingofMajorServiceAreas
NY4P chose eight MSAs based on a user-focused approach, similar to the
“zone management” system utilized by the Central Park Conservancy. NY4P convened a group of ten community leaders and elected officials to weight the relative importance of each of these MSAs. Participants were asked to rate the MSAs on a scale of 1 to 5, 1 being the least important to their park experience, and 5 being the most important. Par-ticipants also provided feedback on the structure and composition of the MSAs. In addition, 30 park users at Brooklyn’s Prospect Park were asked to rate the rela-tive importance of the eight MSAs to be used in the survey. The rankings provided by the 30 respondents were then aver-aged and rounded to the nearest whole number to provide a final MSA relative weight figure:
Figure1: MajorServiceAreasand
RelativeWeights
Active Recreation
(courts, athletic fields) 3
Passive Greenspace
(lawns, landscaped areas, gardens,
water bodies, natural areas and trees) 5
Playgrounds 5
Sitting areas 5
Bathrooms 4
Drinking Fountains 3
Pathways 3
Immediate Environment
(impact on the park by its surroundings) 3
Participants in the first focus group included Council Member Joseph Addabbo, Jr., former Chair, Parks & Recreation Committee, New York City Council; Matt Arnn, United States Forest Service, Regional Landscape Architect, New York City; John Ameroso, Cornell Cooperative Extension, New York City; Skip Blumberg, Friends of City Hall Park; Frank Chaney, Com-munity Board member; Jim Dowell, Riverside Park Fund, Manhattan Parks and Green Space Coalition; Susan Marraccini, Turnaround Friends, Inc.; Martin Olesh, Friends of Cunningham Park; Robert Pasqual, Queens Coalition for Parks and Green Spaces; and Gene Russianoff, Senior Attorney, New York Public Interest Research Group.
This section describes in detail the methodology developed in 2002 and used by New Yorkers for Parks in creating the 2007 Report Card on Parks.
n Selection of the survey population
n Identification and weighting of Major Service Areas
n Feature forms: structure of the survey instrument
n Assignment of numerical scores
n Notes on ‘Athletic Fields’
n Conversion of numerical scores to letter grades
n Sample calculation: Russell Pederson Playground, Brooklyn
n Conduction of the survey
n Comparison of 2005 to 2007 Report Cards on Parks
n Modifications included in the 2007 Report Card on Parks

20 New Yorkers for Parks
FeatureForms:StructureofSurveyInstrument
NY4P staff, in cooperation with statisti-cal consultants from the firm of Ernst & Young, then developed question forms with which to evaluate the MSAs found in each park. Individual questions were designed to measure the performance of the MSAs in each of the following categories: n Maintenance; n Cleanliness; n Safety; and n Structural Integrity.
Whenever possible, the form questions were adapted from DPR’s own internal evaluation mechanism, the Parks Inspec-tion Program (PIP). A second focus group was then convened to provide rela-tive weights to individual feature forms on a scale of 1 to 5, 1 being the least important to their park experience, and 5 being the most important. Next, the fo-cus group was asked to designate each of the individual form questions as ‘priority’ or ‘routine.’ Priority ratings refer to those conditions of a park feature necessary for its safe use. Finally, the focus group rated questions tagged as routine on a scale
from 1 to 5. Participants in the second focus group included four park and advocacy experts: Mark Caserta, former Director, Waterfront Park Coali-tion, New York League of Conservation Voters; Susan Craine, former Consumer Advocate, New York Public Interest Research Group; Neysa Pranger, Director, Straphangers Campaign; and Paul Saw-yer, Executive Director, Friends of Van Cortlandt Park. A flowchart of relative weights of all MSAs and feature forms can be found on page 9.
AssignmentofNumericalScores
Each completed form was assigned a numerical grade between 0 and 100. Any park feature receiving an ‘unacceptable’ rating on any priority question was as-signed a form grade of 0. However, in the large majority of completed forms, park features received only ‘acceptable’ ratings to all priority questions. In these cases, the calculation appears as follows:
Let ‘A’ denote the sum of the relative weights of routine survey questions receiving ‘acceptable’ ratings. Let ‘B’ denote the sum of the relative weights of routine survey questions receiving either ‘acceptable’ or ‘unacceptable’ ratings. Each form’s final numerical score is then 100 times the quotient or ‘A’ divided by ‘B.’ No form score was
assigned a park that lacked any given feature; in this way no park was penal-ized for not having any of the survey’s 12 feature types.
Once each form is scored, MSA ratings were calculated. First, scored forms were grouped by MSA. Those MSAs with exactly one corresponding completed form were allotted the numerical score of that single form. Those MSAs with more than one completed form were scored according to a weighted average of the corresponding form scores, as follows:
Suppose C1, C2,. . .,Cn are the n-many form scores corresponding to a given MSA. Let D1, D2,. . .,Dn be those forms’ corresponding relative weights (see page 5). MSA numerical scores were then calculated as the fol-lowing quotient:
(C1 * D1 + C2 * D2 + . . .+ Cn * Dn) / (D1 + D2 + . . .Dn)
No MSA rating was assigned to a park that lacked any given major service area; in this way no park was penalized for not having any of the survey’s eight MSA types.
Each park’s raw score was calculated in a similar fashion. Suppose E1, E2,. . .,Em were a park’s MSA scores with corre-
sponding weights F1, F2,. . .,Fm. Final raw scores were then calculated as the following quotient:
(E1 * F1 + E2 * F2 + . . .+ Em * Fm) / (F1 + F2 + . . .Fm)
NotesonAthleticFields
NY4P hosted a third focus group on ‘Active Recreation Space.’ Participants in this focus group included Tom Brasuell, Vice President, Community Relations, Major League Baseball; Carlos Feliciano, President, Quebradilla Baseball Organi-zation; Rich Berlin, Executive Director, Harlem RBI; and John Oswald, Direc-tor, Beacon Program Pathways for Youth. This group provided commentary on ideal conditions for active recreational activities and provided general feedback on active play areas, including courts, turf ballfields and asphalt ballfields, which was then integrated into the survey questions and grading system.
Additional research was performed on the incidence of injury incurred on vari-ous active play surfaces. Based on focus group results and relevant research from the field, the athletic field form scores corresponding to any asphalt ballfield surveyed were reduced by 25%.
1One exception to this formula is explained in section E of this methodology, Notes on Asphalt Athletic Fields.
Why another Report Card on Parks?

2007 Report Card on Parks 21
ConversionofNumericalScorestoLetterGrades
A fourth focus group was convened to determine the assignment of letter grades to raw scores, consisting of park manag-ers and open space experts. Participants were brought to three parks in Manhat-tan and asked to provide a letter grade for the park based on a brief description of the MSAs and a tour of the park. These letter grades were consistent with the raw number scores for the parks and resulted in the raw score/grade assignment chart.
Figure2:Conversionfrom
RawScorestoLetterGrades
Raw Numerical Grade Letter Grade
97-100 A+
93-96 A
90-92 A-
87-89 B+
83-86 B
80-82 B-
77-79 C+
73-76 C
70-72 C-
60-69 D
59 and below F
Fourth focus group participants included Jerome Barth, Director of Operations, Bryant Park Restoration Corporation; Charles McKinney, con-sultant, former administrator, Riverside Park; and Andy Stone, Director, NYC Programs, Trust for Public Land.
SampleCalculation–RussellPedersonPlayground,Brooklyn
Figure 3 shows actual surveyor responses for Russell Pederson Playground in Bay Ridge, Brooklyn. Figures 3, 4 and 5 to the right include a summary of form data and the subsequent form, MSA and park score.
ConductionoftheSurvey
Survey work for The Report Card took place from June to August 2006 from the hours of 10 AM to dusk, Tues-day through Friday. NY4P trained 6 surveyors (all NY4P staff members) to complete the survey work. NY4P senior staff held a training session during spring 2006 to train surveyors in the following techniques: use of the handheld comput-ers and digital cameras, delineation of park features, and use of survey forms and standards manual and procedures for documenting features with digital camer-as. Each training session included the full review of a park, collection of data ac-cording to defined standards, proper pho-to documentation, safety procedures and methods for storing data in The Report Card database upon completion of survey.
Figure3:SummaryofRussellPedersonPlaygroundFormData
Form Form Scores Form Score Average Playgrounds 82, 68, 68 73 Immediate Environment 100 100 Lawns and Landscaped Areas 89 89 Trees 89 89 Sitting Areas 68 68 Bathrooms 74, 49 62 Drinking Fountains 86, 0 43 Courts 89, 88, 83 86
Figure4:SummaryofRussellPedersonPlaygroundMSAData
MSA Calculation MSA Score Playgrounds Average from figure 3 73 Immediate Environment Single form score 100 Passive Greenspace (Lawns, Landscaped Areas*2 + Park Trees*1) / 3 89 Sitting Areas Single form score 68 Bathrooms Average from figure 3 62 Drinking Fountains Average from figure 3 43 Active Recreation Average courts score from figure 3 (no athletic fields on site) 86
Russell Pederson Playground’s raw score was calculated by the weighted average of the seven MSA scores listed in figure 4.
Why another Report Card on P arks?
Figure5:CalculationofRawScoreandLetterGrade–RussellPedersonPlayground
MSA MSA Score times Weight Playgrounds 73 * 5 = 363 (with rounding) Immediate Environment 100 * 3 = 300 Passive Greenspace 89 * 5 = 444 (with rounding) Sitting Areas 68 * 5 = 342 (with rounding) Bathrooms 62 * 4 = 247 (with rounding) Drinking Fountains 43 * 3 = 129 Active Recreation 86 * 3 = 259 (with rounding) Total 2084This total, 2084, was then divided by the sum of the weights of the 7 MSAs. This sum is 28, so that Russell Pederson Playground’s raw park score is 2084/28 = 74.4 Applying this numerical score to the letter grades listed in Figure 2, it can be seen that a score of 74 corresponds to a grade of “C”.
22 New Yorkers for Parks
In the field, surveyors completed a form for each feature that was delineated for a given park. For example, for every drinking fountain in a park, a ‘Drinking Fountain’ form was completed so that in a park with three drinking fountains, a surveyor completed three ‘Drinking Fountain’ feature forms. Additionally, surveyors completed a form for every playground space within natural and/or constructed boundaries, for every pair of bathrooms, for every naturally bounded lawn or landscaped area, etc.
In addition to completing feature forms, surveyors took extensive digital photo-graphs to support and complement the survey results. All survey findings and feature forms receive an identification number and are correlated to a series of photographs documenting conditions for each park in the survey. Survey results and photo documentation are stored in a central database. When photo docu-mentation did not correlate with results or did not adequately illustrate park conditions, the park was revisited and reevaluated by surveyors.
Modificationsincludedinthe2007Report Card on Parks
Bathrooms
The NYC Department of Health and Mental Hygiene (DOHMH) is responsible for inspecting and measuring the conditions of bathrooms for Parks Department beach properties. In order to hold park bathrooms accountable to similar standards, the design team modi-fied The Report Card’s bathroom survey form to reflect the measures used by DOHMH. This included the modifica-tion and addition of several questions on the survey.
AthleticFields
In recent years the NYC Parks Department has increasingly turned to synthetic turf for field renovations. Due to the growing prevalence of such fields, the design team added a new form to the Active Recreation MSA, allow-ing surveyors to specifically evaluate the performance of synthetic turf. In previ-ous Report Card inspections, surveyors evaluated synthetic turf fields using the
“Natural Grass Athletic Field” form. The design of the new form results in more complete assessments of the performance of these fields.
Why another Report Card on Parks? Comparisonof2005to2007Report Cards on Parks
NY4P designed The Report Card on Parks methodology in 2003 to serve two functions. First, the report provided an instantaneous snapshot of the conditions of New York parks. This allows for (real-time) comparison among parks to iden-tify those that showcase best practices, as well as those in-need parks requiring attention. Second, the methodology was designed to be replicated annually, so that trends at the individual park level, as well as borough- and citywide, could be documented and addressed.
In constructing the methodology of the 2007 Report Card on Parks, the goal of the design team was three-fold: one, to fine tune the survey mechanism; two, to remain relevant by reflecting changes that have occurred in the park system in the past several years; and three, to build off of the current evaluation procedures used by the City. Due to these changes as well as significant changes in the survey universe, the comparability between 2007 results and those of the previous years is limited. The vast majority of survey instrument questions designed for the 2007 survey were left unchanged from previous years, but two significant modifications are noted at right.

24 New Yorkers for Parks
Find Your ParkHow did your neighborhood park fare on this year’s Report Card? The following section lists the results by borough and in alphabetical order by park.
The Report Card provides communities with comparative park grades in order to offer the fullest picture of results so that they may advocate for improved care of their open spaces. Neighborhood, Community Board, and City Council District information as well as park acreage are available for each park.
For a more in-depth look at your park’s results, please visit our website – www.ny4p.org – and download the “Park Profile” for your park. These profiles provide detailed scores for each MSA along with contextual Community District information on neighborhood health, land use, crime, edu-cation, and income. For historical results, download the 2005 Report Card on Parks.

2007 Report Card on Parks 25
BronxPark Name Score Grade Neighborhood CD CB Acres
1 AQUEDUCT WALK 68 D University Heights 14 105 9
2 BICENTENNIAL VETERANS MEMORIAL PARK 45 F Edgewater Park 13 110 9
3 CASTLE hILL PARK 82 B- Castle Hill 13 109 2
4 COONEY GRAUER FIELD 52 F Kingsbridge 14 108 1
5 CO-OP CITY FIELDS 40 F Co-Op City 12 110 3
6 EWEN PARK 44 F Kingsbridge 11 108 8
7 FRANZ SIGEL PARK 89 B+ Concourse Village 17 104 16
8 hAFFEN PARK 75 C Baychester 12 112 9
9 hARRIS PARK 75 C Norwood 11 107 15
10 hENRY hUDSON PARK 74 C Spuyten Duyvil 11 108 9
11 JOYCE KILMER PARK 81 B- Concourse Village 17 104 7
12 MACOMBS DAM PARK 61 D Concourse 17 104 12
13 MULLALY PARK1 71 C- Concourse 16 104 19
14 NOBLE PLAYGROUND 78 C+ Parkchester/West Farms 18 109 4
15 OLD FORT #4 PARK 68 D Kingsbridge Heights 11 108 5
16 OWEN DOLEN GOLDEN AGE CENTER 77 C+ Westchester Square 13 109 1
17 PELhAM BAY LITTLE LEAGUE PARK 54 F Westchester Square 13 111 1
18 RAINEY PARK 77 C+ Longwood 17 102 8
19 SETON PARK 76 C South Riverdale 11 108 12
20 SPUYTEN DUYVIL ShOREFRONT PARK 32 F Spuyten Duyvil 11 108 7
21 ST JAMES PARK 70 C- Fordham 14 107 11
22 TREMONT PARK 48 F East Tremont 15 103 15
23 WATSON GLEASON PLAYGROUND 89 B+ Parkchester/Soundview 18 109 3
24 WILLIAMSBRIDGE OVAL 66 D Norwood 11 107 20
Franz Sigel Park Score: 89% (B+)
3
1
2
4
7
9 58
6
1312
21
22
19
23
24
17
18
14
1520
11
10
16
Watson Gleason Playground Score: 89% (B+)
Spuyten Duyvil Shorefront Park Score: 32% (F)
*CD = City Council District; CB = Community Board 1Macombs Dam Park and a portion of Mullaly Park were officially alienated and destroyed shortly after these inspections for the construction of the new Yankee Stadium.

26 New Yorkers for Parks
Brooklyn
4
8
6
75
3
2
9
1
14
17
29
11
10
27
16 24
12
22
23
21
28
26
18
20
15
13
19
30 25
Park Name Score Grade Neighborhood CD CB Acres
1 AMERSFORT PARK 69 D Flatlands 45 218 4
2 BENSONhURST PARK 56 F Bath Beach 47 211 18
3 BETSY hEAD MEMORIAL PLGD 59 F Brownsville 42 216 11
4 BREUKELEN PARK 70 C- Broad Channel 42 218 16
5 BROWER PARK 71 C- Crown Heights 36 208 7
6 CADMAN PLAZA PARK 73 C Downtown Brooklyn 33 202 10
7 COFFEY PARK 72 C- Red Hook 38 206 8
8 COLUMBUS PARK 70 C- Downtown Brooklyn 33 202 1
9 COOPER PARK 53 F East Williamsburg 34 201 6
10 FIDLER/WYCKOFF hOUSE PARK 92 A- East Flatbush 45 217 1
11 FLOYD PATTERSON PARK 71 C- Brownsville 42 216 2
12 FRIENDS FIELD PARK 83 B Ocean Parkway 44 212 7
13 FULTON PARK 75 C Stuyvesant Heights 36 203 2
14 GRAND FERRY PARK 72 C- Williamsburg / Southside 33 201 2
15 GRAVESEND PARK 68 D Borough Park 44 212 6
16 GREEN CENTRAL KNOLL 46 F Bushwick 37 204 3
17 hARMONY PARK 58 F Weeksville 41 203 2
18 hERBERT VON KING PARK 85 B Bedford Stuyvesant 36 203 8
19 JOhN PAUL JONES PARK 72 C- Bay Ridge 50 210 5
20 LEIF ERICSON PARK & SQUARE 51 F Bay Ridge 43 210 17
21 LINDEN PLAYGROUND 62 D New Lots 42 205 9
22 LINDOWER PARK 67 D Mill Basin 46 218 7
23 LOUIS J VALENTINO JR PK & PIER 92 A- Red Hook 38 206 2
24 MARIA hERNANDEZ PARK 70 C- Bushwick 34 204 7
25 MCKINLEY PARK 68 D Bay Ridge 43 210 8
26 MSGR MCGOLRICK PARK 79 C+ Greenpoint 33 201 9
27 MSGR CRAWFORD FIELD 33 F Mill Basin 46 218 2
28 MT. PROSPECT PARK PLGD 63 D Prospect Heights 35 208 8
29 ROBERTO CLEMENTE BALLFIELD 59 F Williamsburg 33 201 1
30 RUSSELL PEDERSON PLGD 74 C Bay Ridge 43 210 1Fidler Wyckoff House Park Score: 92% (A-)
Louis J. Valentino Jr. Park and Pier Score: 92% (A-)
Msgr. Crawford Field Score: 33% (F)
2007 Report Card on Parks 27
Manhattan
2
6
1
9
7
5
3
4
8
10
17
11
18
14
16
13
12
15
*CD = City Council District; CB = Community Board
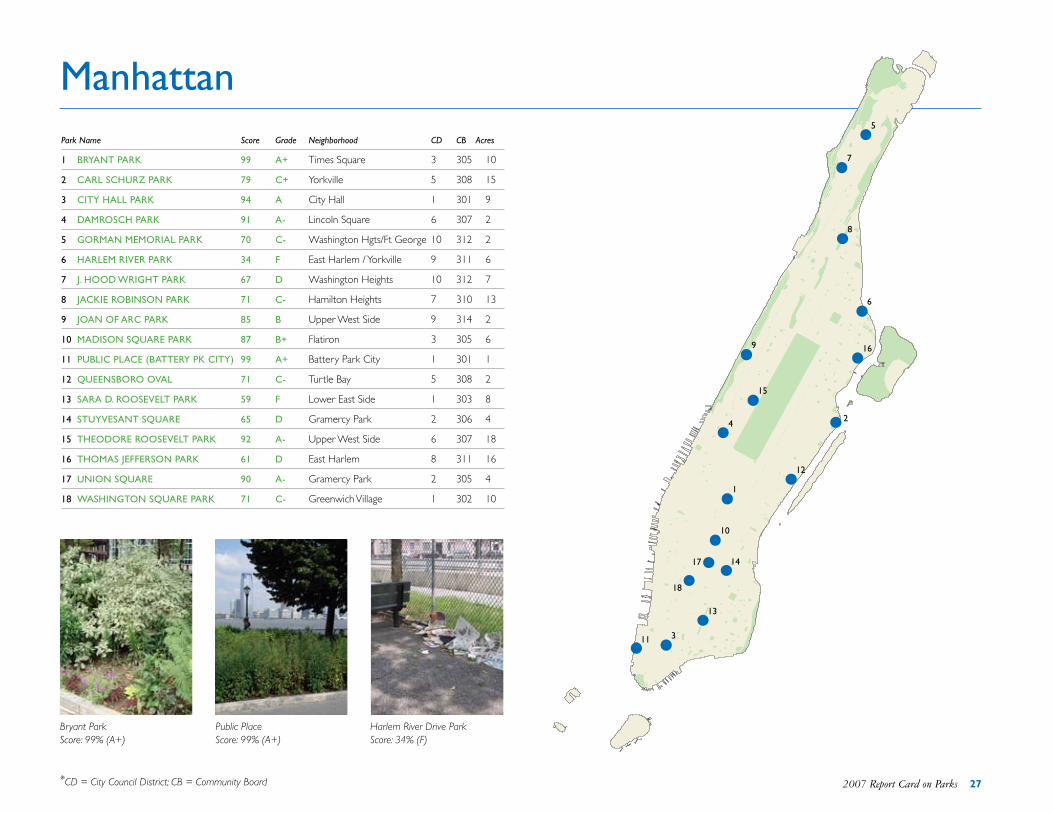
Park Name Score Grade Neighborhood CD CB Acres
1 BRYANT PARK 99 A+ Times Square 3 305 10
2 CARL SChURZ PARK 79 C+ Yorkville 5 308 15
3 CITY hALL PARK 94 A City Hall 1 301 9
4 DAMROSCh PARK 91 A- Lincoln Square 6 307 2
5 GORMAN MEMORIAL PARK 70 C- Washington Hgts/Ft George 10 312 2
6 hARLEM RIVER PARK 34 F East Harlem / Yorkville 9 311 6
7 J. hOOD WRIGhT PARK 67 D Washington Heights 10 312 7
8 JACKIE ROBINSON PARK 71 C- Hamilton Heights 7 310 13
9 JOAN OF ARC PARK 85 B Upper West Side 9 314 2
10 MADISON SQUARE PARK 87 B+ Flatiron 3 305 6
11 PUBLIC PLACE (BATTERY PK CITY) 99 A+ Battery Park City 1 301 1
12 QUEENSBORO OVAL 71 C- Turtle Bay 5 308 2
13 SARA D. ROOSEVELT PARK 59 F Lower East Side 1 303 8
14 STUYVESANT SQUARE 65 D Gramercy Park 2 306 4
15 ThEODORE ROOSEVELT PARK 92 A- Upper West Side 6 307 18
16 ThOMAS JEFFERSON PARK 61 D East Harlem 8 311 16
17 UNION SQUARE 90 A- Gramercy Park 2 305 4
18 WAShINGTON SQUARE PARK 71 C- Greenwich Village 1 302 10
Bryant Park Score: 99% (A+)
Public Place Score: 99% (A+)
Harlem River Drive Park Score: 34% (F)

28 New Yorkers for Parks
Queens
3
2
7
5
6
8
4
9
1
1913
20
11
10
24
12
25
15
17
22
18
23
26
21
14
16Park Name Score Grade Neighborhood CD CB Acres
1 BAYSIDE FIELDS 80 B- Auburndale 19 411 3
2 BEACh ChANNEL PARK 93 A Rockaway 32 414 12
3 BROAD ChANNEL PARK 61 D Broad Channel 32 414 17
4 CAPT TILLY MEMORIAL PARK 74 C Jamaica Hills 24 408 9
5 DETECTIVE KEITh L. WILLIAMS PK 77 C+ Hollis / Jamaica 27 412 8
6 DR ChARLES R DREW MEM PARK 70 C- South Jamaica 28 412 6
7 FLUShING FIELDS 71 C- Linden Hill / Whitestone 20 407 10
8 FRANCIS LEWIS PARK 66 D Whitestone 19 407 17
9 FRANK GOLDEN MEM PARK 72 C- College Point 19 407 11
10 FRANK PRINCIPE PARK (form. MAURICE) 75 C West Maspeth 26 405 9
11 hALLETS COVE PLAYGROUND 70 C- Astoria 22 401 6
12 hARVEY PARK 72 C- Whitestone 19 407 9
13 hELLGATE FIELD 90 A- Astoria 22 401 4
14 hINTON PARK 79 C+ East Elmhurst 21 403 4
15 JOhN GOLDEN PARK 70 C- Bayside 19 411 17
16 LINNAEUS PLAYGROUND 66 D Oakland Gardens 23 411 2
17 LORING PARK 82 B- Lindonwood 32 410 3
18 LOUIS SIMEONE PARK 76 C Corona 21 404 1
19 POWELL’S COVE PARK 40 F College Point 19 407 7
20 RAINEY PARK 58 F Astoria / Ravenswood 22 401 8
21 ROChDALE PARK 50 F Springfield Gardens 28 412 8
22 RUFUS KING PARK 86 B Jamaica 28 412 12
23 SOCRATES SCULPTURE PARK 86 B Astoria / Ravenswood 26 401 2
24 SOUThERN FIELDS 40 F South Ozone 31 410 11
25 ST ALBANS MEMORIAL PARK 72 C- Saint Albans 27 412 11
26 YELLOWSTONE MUNICIPAL PARK 89 B+ Forest Hills 29 406 2
Powell’s Cove Score: 40% (F)
Southern Fields Score: 40% (F)
Beach Channel Park Score: 93% (A)

2007 Report Card on Parks 29
Staten Island
*CD = City Council District; CB = Community Board
Park Name Score Grade Neighborhood CD CB Acres
1 ALICE AUSTEN hOUSE & PARK 88 B+ Rosebank 49 501 15
2 ALLISON PARK 61 D Randall Manor 49 501 9
3 ARThUR VON BRIESEN PARK 83 B Shore Acres 50 501 13
4 CPL. ThOMPSON PARK 71 C- Livingston 49 501 11
5 EIBS POND PARK 38 F Park Hill 49 501 17
6 FAThER MACRIS PARK 78 C+ Graniteville 49 502 12
7 hERO PARK 69 D Ward Hill 49 501 3
8 NORThERLEIGh PARK 76 C Elm Park 49 501 4
9 SChMUL PARK 75 C Travis 50 502 8
10 TAPPEN PARK 70 C- Stapleton 49 501 2
11 TOTTENVILLE ShORE PARK 33 F Tottenville 51 503 9
12 VETERANS PARK 41 F Port Richmond 49 501 1
13 WESTERLEIGh PARK 89 B+ Westerleigh 49 501 3
Tottenville Shore Park Score: 33% (F)
Westerleigh Park Score: 89% (B+)
15
8
6
4
9
3
2
7
10
11
13
12
30 New Yorkers for Parks
New Yorkers for Parks
Through our website and publications like the annual, award-winning Report Card on Parks, NY4P provides accurate, up-to-date information on conditions in New York City’s neighborhood parks. And through our policies, partnerships and planning, we work to effect change on a citywide level, to promote a higher level of park service in every community.
Our work is motivated by the belief that all New Yorkers should have access to quality parks and adequate recreational opportunities, because New York City’s neighborhood parks are the front and backyards for millions of New Yorkers.
Information on our research projects, publications and programs is available at www.ny4p.org.
TrackYourPark
In 2006, New Yorkers for Parks launched Track Your Park (TYP), a citizen-based park inspection program for small parks, playgrounds, gardens, and other open spaces. Based on The Report Card on Parks, TYP trains New Yorkers to survey their own parks and create inspection reports. Advocacy training equips groups with the tools needed to bring about park improvements. For more information, visit www.trackyourpark.org.
ParksAdvocacyDay
The largest event of its kind at City Hall, New Yorkers for Parks’ annual Parks Advocacy Day offers park users a chance to discuss citywide and neighborhood park concerns face-to-face with their City Council Members.
CommunityDesignProgram
The Community Design Program offers pro bono design assistance to groups working to create new parkland or improve existing open space in their communities. New Yorkers for Parks also provides strategic planning guidance and advocacy training to participating groups.
PositionPapers
These policy reports provide in-depth analyses of park issues. The first in the series, “A New Turf War,” is a compre-hensive study that identifies the issues surrounding the use of synthetic turf and offers a series of recommendations on how to determine when and where synthetic turf is appropriate in New York City’s parks and athletic fields.
DaffodilProject
The Daffodil Project, a living 9/11 me-morial, is the largest volunteer planting effort in the city. To commemorate the five-year anniversary of the September 11 terrorist attacks, every fall New Yorkers for Parks – along with the Parks Depart-ment and thousands more volunteers – plant nearly 500,000 daffodil bulbs as part of The Daffodil Project. The project not only raises the spirits of New Yorkers but also draws attention to the needs of neglected parks and open spaces citywide.
CityCouncilDistrictProfiles
The City Council District Profiles docu-ment parks and open space in all 51 City Council districts, enabling New Yorkers to find out how their district rates on measures of open space, health, income, education, and safety. They are an es-sential tool for advocating for increased green space and improved care for exist-ing parks and playgrounds.
New Yorkers for Parks (NY4P) is the only independent watchdog for all the city’s parks, beaches and playgrounds. The city’s oldest and leading independent expert on park conditions, efficiency and funding, NY4P has worked for nearly 100 years to ensure greener, safer, cleaner parks for all New Yorkers.

The Report Card on Parks is made possible through the generous support of the following foundations:AltmanFoundationJohnN.Blackman,Sr.FoundationTheConstansCulverFoundationTheGreenacreFoundationTheJ.M.KaplanFundHenryandLucyMosesFund,IncTheSchermanFoundationTheNormanandRositaWinstonFoundation
Report Staff:Christian DiPalermo, Executive DirectorMaura Lout, Director of OperationsCheryl huber, Project Director
Matt Glomski, Project Statistician
Rachel Berkson, Field Supervisor and SurveyorJoanna Reynolds, SurveyorJordan Smith, SurveyorKaity Tsui, Surveyor
Photos: Cover - Copyright © 2004. Maria Schriber for New Yorkers for Parks. All Rights Reserved. Page 2, 7, 9, 10, 18, 23, 25-29 - Copyright © 2006. New Yorkers for Parks. All Rights Reserved.
Design: Michael Bierman Graphic Design
Maps made possible by the ESRI Conservation Program.
Copyright © 2007. New Yorkers for Parks. All Rights Reserved.