report commissioned by the performance review … · performance review commission report...
TRANSCRIPT
PERFORMANCE REVIEW COMMISSION
Report Commissioned by the Performance Review Commission
Prepared by the University of Westminster
FINAL REPORT
EVALUATING THE TRUE COST TO AIRLINES OF ONE MINUTE OF
AIRBORNE OR GROUND DELAY
PERFORMANCE REVIEW UNIT
Published: May 2004
EUROCONTROL
DOCUMENT IDENTIFICATION SHEET
DOCUMENT DESCRIPTION Document Title
Evaluating the true cost to airlines of one minute of airborne or ground delay
PROGRAMME REFERENCE INDEX EDITION: EDITION DATE:
Final Report April 2004 SUMMARY
This report documents the results of a study that has evaluated the true cost to airlines of one minute of airborne and ground delay.
Keywords
CONTACT:
Performance Review Unit, EUROCONTROL, 96 Rue de la Fusée, B-1130 Brussels, Belgium. Tel: +32 2 729 3956, e-mail: [email protected]://www.eurocontrol.int/prc
DOCUMENT STATUS AND TYPE STATUS DISTRIBUTION
Draft General Public Proposed Issue EUROCONTROL Organisation Released Issue Restricted
INTERNAL REFERENCE NAME: UoW Report on Delays
COPYRIGHT NOTICE AND DISCLAIMER © European Organisation for the Safety of Air Navigation (EUROCONTROL)
EUROCONTROL
This document is published by the Performance Review Commission in the interest of the exchange of information. It may be copied in whole or in part providing that the copyright notice and disclaimer are included. The information contained in this document may not be modified without prior written permission from the Performance Review Commission. The views expressed herein do not necessarily reflect the official views or policy of EUROCONTROL, which makes no warranty, either implied or express, for the information contained in this document, neither does it assume any legal liability or responsibility for the accuracy, completeness or usefulness of this information. Printed by EUROCONTROL, 96, rue de la Fusée, B-1130 Brussels, Belgium. The PRC’s website address is http://www.eurocontrol.int/prc. The PRU’s e-mail address is [email protected].
Evaluating the true cost to airlines of
one minute of airborne or ground delay
Final Report
Edition 4
17 February 2004
Transport Studies Group University of Westminster London
Evaluating the true cost to airlines of one minute of airborne or ground delay
Transport Studies Group i University of Westminster
Acknowledgements
The authors would like to thank the following for data provision and advice generously offered during the course of this research. We would especially like to thank the airlines who made particular, and often extensive, efforts to provide the detailed financial and operational data required as inputs to this Study.
Air France
Airbus Industrie
Austrian (Airlines)
Aviation Industry Press
Boeing Commercial Aircraft
Britannia Airways
British Airways
Condor Flugdienst
Cranfield College of Aeronautics
CSA Czech Airlines
Deutsche Flugsicherung
EasyJet
Four (anonymous) aircraft lessors
Four anonymous handling agents
IATA (Geneva & London)
Iberia
KLM Royal Dutch Airlines
Lido GmbH
Lufthansa
The Airline Monitor
The Federal Aviation Authority
Various airport charges’ offices The authors are also heavily indebted to continuous technical support and advice from PRU at all stages of this Study, and to Mr Vittorio Pimpinelli for so ably chairing a valuable workshop held in Brussels to review Edition 2 of this Report.
Evaluating the true cost to airlines of one minute of airborne or ground delay
Transport Studies Group ii University of Westminster
Evaluating the true cost to airlines of one minute of airborne or ground delay
This Report has been prepared by: Dr Andrew Cook Graham Tanner Stephen Anderson Transport Studies Group University of Westminster 35 Marylebone Road London GREAT BRITAIN GB-NW1 5LS tel: +44 (0)20 7911 5801 fax: +44 (0)20 7911 5057 email: [email protected]
Document history
Edition 0 10 March 2003
Edition 1 29 August 2003
Edition 2 03 October 2003
Edition 3 19 December 2003
Edition 4 17 February 2004
© University of Westminster February 2004
Evaluating the true cost to airlines of one minute of airborne or ground delay
Transport Studies Group iii University of Westminster
Contents Executive Summary________________________________________________ vii
User Guide _______________________________________________________xiii
1 Introduction__________________________________________________ 1 1.1 Study context ........................................................................................... 1 1.2 Background.............................................................................................. 2 1.3 Airline costs ............................................................................................. 4 1.4 Overview of research methodology ....................................................... 4 1.4.1 Literature review ...................................................................................... 5 1.4.2 Selection of aircraft, airlines and airports ............................................. 5 1.4.3 Interviews and data collection................................................................ 6 1.4.4 Looking ahead to the calculations of delay costs ................................ 7 1.5 Delay, buffers and predictability............................................................. 7 1.5.1 Definition of delay.................................................................................... 7 1.5.2 Use of buffers........................................................................................... 7 1.5.3 Predictability ............................................................................................ 8
2 Calculations and results ______________________________________ 11 2.1 Introduction to calculations and results.............................................. 11 2.2 Preview of results .................................................................................. 11 2.3 Calculating the costs of delay .............................................................. 12 2.3.1 The calculation framework.................................................................... 13 2.3.1.1 Introducing a hierarchy of delay levels............................................................................ 13 2.3.1.2 Further exploring the hierarchy of delay levels ............................................................... 16 2.3.1.3 Using ‘long’ and ‘short’ delay types................................................................................. 21 2.3.1.4 Assigning low, base and high cost scenarios.................................................................. 21 2.3.1.5 Index table of tactical calculations................................................................................... 25 2.3.2 Tactical cost calculations in full ........................................................... 26 2.3.2.1 Introducing the gate-to-gate tactical calculation template table ...................................... 26 2.3.2.2 Gate-to-gate elements with zero cost assigned.............................................................. 28 2.3.2.2.1 Case where costs of delay are (approximately) zero: En-route and approach ATC charges ........ 28 2.3.2.2.2 Cases where no delays / costs have been assumed in the model ................................................ 28 2.3.2.2.3 General cases where tactical costs cannot be assigned at gate-to-gate level only....................... 29 2.3.2.2.4 Depreciation, rentals and leases of flight equipment ..................................................................... 31 2.3.2.2.4.1 Introduction to depreciation, rental and lease cost calculations .................................................... 31 2.3.2.2.4.2 Overview of current aircraft financing practice and aircraft valuation ............................................ 32 2.3.2.2.4.3 Current DRL accounting practice .................................................................................................. 36 2.3.2.2.4.4 Conclusions on DRL costs – how to calculate a true value ........................................................... 37 2.3.2.3 Calculating specific cost elements .................................................................................. 39 2.3.2.3.1 Calculating Block-Hour Direct Operating Costs (BHDOCs)........................................................... 39 2.3.2.3.2 Fuel burn costs plus commentary on airborne delay..................................................................... 42 2.3.2.3.3 Maintenance costs ........................................................................................................................ 45 2.3.2.3.4 Flight and cabin crew salaries and expenses................................................................................ 46 2.3.2.3.5 Handling agent penalties............................................................................................................... 48 2.3.2.3.6 Airport charges.............................................................................................................................. 48 2.3.2.3.7 Costs of passenger delay to airlines.............................................................................................. 49
Evaluating the true cost to airlines of one minute of airborne or ground delay
Transport Studies Group iv University of Westminster
2.4 Summary of tactical, gate-to-gate cost of delay calculations............ 52 2.5 Estimate and assessment of network reactionary costs ................... 56 2.5.1 Extending gate-to-gate calculations to network reactionary level .... 56 2.5.2 Focus on airborne and ground delay trade-offs ................................. 66 2.5.3 Summary of tactical costs of delay at network reactionary level ...... 72 2.5.3.1 Comparison of tactical costs of delay by generic aircraft type ........................................ 72 2.5.3.2 Comparison of tactical costs of delay with previous studies ........................................... 76 2.6 Estimate of strategic costs of delay..................................................... 79 2.6.1 Introduction to strategic cost calculations.......................................... 79 2.6.2 Strategic cost elements......................................................................... 82 2.6.2.1 Strategic fuel costs .......................................................................................................... 82 2.6.2.2 Strategic maintenance costs ........................................................................................... 82 2.6.2.3 Strategic crew costs ........................................................................................................ 84 2.6.2.4 Strategic DRL costs......................................................................................................... 85 2.6.2.5 Strategic minutes plus extra tactical minutes .................................................................. 85 2.6.3 Results of strategic cost of delay calculations ................................... 85 2.6.4 Comparison of strategic and tactical costs per minute ..................... 93 2.6.4.1 A minute of buffer: a balance against expected tactical costs ........................................ 93 2.6.4.2 Allocating buffer minutes to different phases of flight ..................................................... 93 2.6.4.3 Buffer minutes and predictability of expected tactical delays.......................................... 94 2.6.4.4 Adding minutes of buffer to the schedule: a broader context.......................................... 96 2.7 Higher-level calculations....................................................................... 97
3 Caveats, conclusions and recommendations ____________________ 101 3.1 Caveats ................................................................................................. 101 3.2 Conclusions ......................................................................................... 101 3.3 Recommendations for future research .............................................. 102
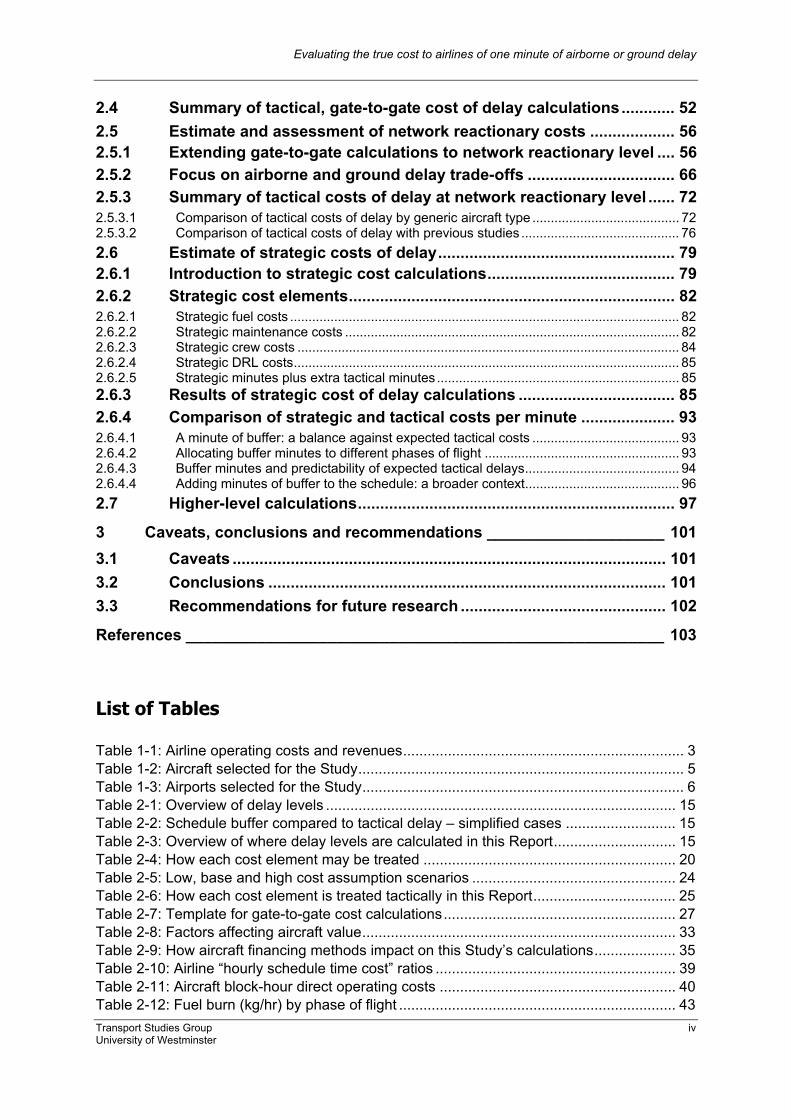
References ______________________________________________________ 103 List of Tables Table 1-1: Airline operating costs and revenues..................................................................... 3 Table 1-2: Aircraft selected for the Study................................................................................ 5 Table 1-3: Airports selected for the Study............................................................................... 6 Table 2-1: Overview of delay levels ...................................................................................... 15 Table 2-2: Schedule buffer compared to tactical delay – simplified cases ........................... 15 Table 2-3: Overview of where delay levels are calculated in this Report.............................. 15 Table 2-4: How each cost element may be treated .............................................................. 20 Table 2-5: Low, base and high cost assumption scenarios .................................................. 24 Table 2-6: How each cost element is treated tactically in this Report................................... 25 Table 2-7: Template for gate-to-gate cost calculations......................................................... 27 Table 2-8: Factors affecting aircraft value............................................................................. 33 Table 2-9: How aircraft financing methods impact on this Study’s calculations.................... 35 Table 2-10: Airline “hourly schedule time cost” ratios ........................................................... 39 Table 2-11: Aircraft block-hour direct operating costs .......................................................... 40 Table 2-12: Fuel burn (kg/hr) by phase of flight .................................................................... 43
Evaluating the true cost to airlines of one minute of airborne or ground delay
Transport Studies Group v University of Westminster
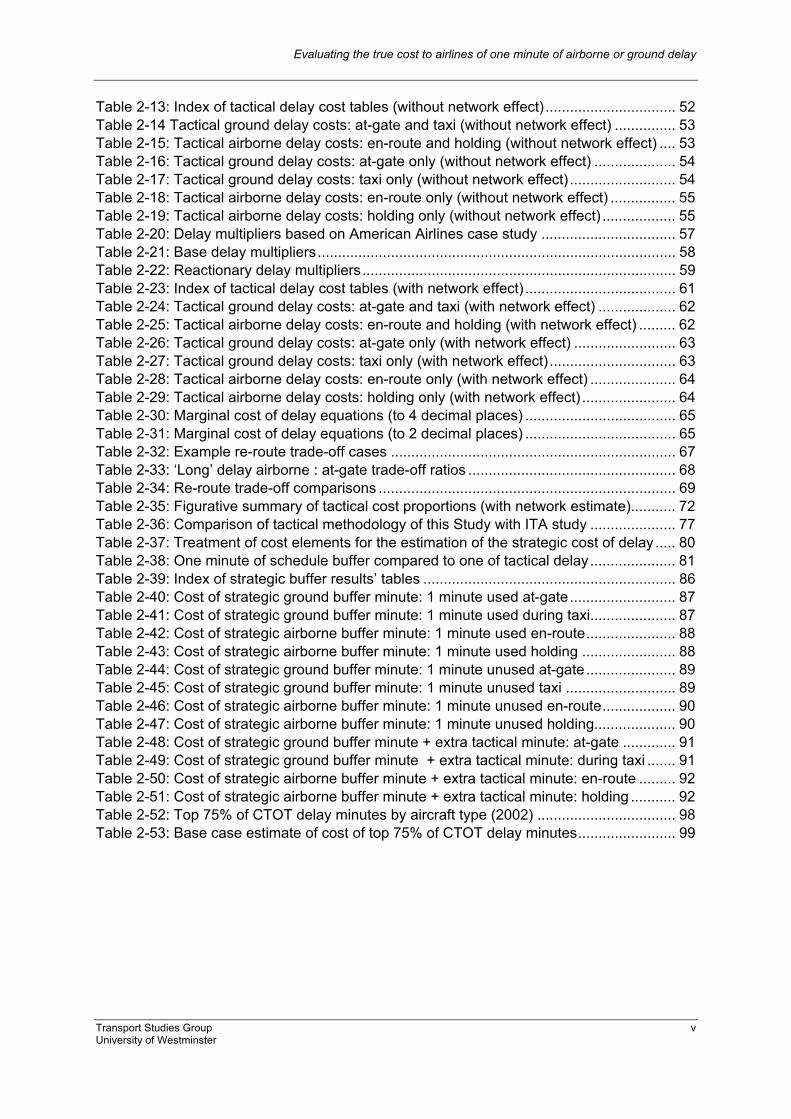
Table 2-13: Index of tactical delay cost tables (without network effect) ................................ 52 Table 2-14 Tactical ground delay costs: at-gate and taxi (without network effect) ............... 53 Table 2-15: Tactical airborne delay costs: en-route and holding (without network effect) .... 53 Table 2-16: Tactical ground delay costs: at-gate only (without network effect) .................... 54 Table 2-17: Tactical ground delay costs: taxi only (without network effect) .......................... 54 Table 2-18: Tactical airborne delay costs: en-route only (without network effect) ................ 55 Table 2-19: Tactical airborne delay costs: holding only (without network effect) .................. 55 Table 2-20: Delay multipliers based on American Airlines case study ................................. 57 Table 2-21: Base delay multipliers........................................................................................ 58 Table 2-22: Reactionary delay multipliers............................................................................. 59 Table 2-23: Index of tactical delay cost tables (with network effect) ..................................... 61 Table 2-24: Tactical ground delay costs: at-gate and taxi (with network effect) ................... 62 Table 2-25: Tactical airborne delay costs: en-route and holding (with network effect) ......... 62 Table 2-26: Tactical ground delay costs: at-gate only (with network effect) ......................... 63 Table 2-27: Tactical ground delay costs: taxi only (with network effect) ............................... 63 Table 2-28: Tactical airborne delay costs: en-route only (with network effect) ..................... 64 Table 2-29: Tactical airborne delay costs: holding only (with network effect) ....................... 64 Table 2-30: Marginal cost of delay equations (to 4 decimal places) ..................................... 65 Table 2-31: Marginal cost of delay equations (to 2 decimal places) ..................................... 65 Table 2-32: Example re-route trade-off cases ...................................................................... 67 Table 2-33: ‘Long’ delay airborne : at-gate trade-off ratios ................................................... 68 Table 2-34: Re-route trade-off comparisons ......................................................................... 69 Table 2-35: Figurative summary of tactical cost proportions (with network estimate)........... 72 Table 2-36: Comparison of tactical methodology of this Study with ITA study ..................... 77 Table 2-37: Treatment of cost elements for the estimation of the strategic cost of delay ..... 80 Table 2-38: One minute of schedule buffer compared to one of tactical delay..................... 81 Table 2-39: Index of strategic buffer results’ tables .............................................................. 86 Table 2-40: Cost of strategic ground buffer minute: 1 minute used at-gate.......................... 87 Table 2-41: Cost of strategic ground buffer minute: 1 minute used during taxi..................... 87 Table 2-42: Cost of strategic airborne buffer minute: 1 minute used en-route...................... 88 Table 2-43: Cost of strategic airborne buffer minute: 1 minute used holding ....................... 88 Table 2-44: Cost of strategic ground buffer minute: 1 minute unused at-gate...................... 89 Table 2-45: Cost of strategic ground buffer minute: 1 minute unused taxi ........................... 89 Table 2-46: Cost of strategic airborne buffer minute: 1 minute unused en-route.................. 90 Table 2-47: Cost of strategic airborne buffer minute: 1 minute unused holding.................... 90 Table 2-48: Cost of strategic ground buffer minute + extra tactical minute: at-gate ............. 91 Table 2-49: Cost of strategic ground buffer minute + extra tactical minute: during taxi ....... 91 Table 2-50: Cost of strategic airborne buffer minute + extra tactical minute: en-route ......... 92 Table 2-51: Cost of strategic airborne buffer minute + extra tactical minute: holding ........... 92 Table 2-52: Top 75% of CTOT delay minutes by aircraft type (2002) .................................. 98 Table 2-53: Base case estimate of cost of top 75% of CTOT delay minutes........................ 99
Evaluating the true cost to airlines of one minute of airborne or ground delay
Transport Studies Group vi University of Westminster
List of Figures Figure 2-1: Overview of the tactical cost of at-gate and airborne delays .............................. 11 Figure 2-2: Hierarchy of delay level costs............................................................................. 14 Figure 2-3: Gate-to-gate marginal costs of delay calculations for each cost element .......... 16 Figure 2-4: Primary delays, reactionary delays and network effects..................................... 17 Figure 2-5: Overview of the tactical calculation framework................................................... 22 Figure 2-6: Illustration of a compound function..................................................................... 22 Figure 2-7: Linear regression of at-gate and airborne delay costs as function of seats ....... 65 Figure 2-8: Average widebody marginal cost distributions (network estimate basis)............ 73 Figure 2-9: Average narrowbody marginal cost distributions (network estimate basis) ........ 74 Figure 2-10: Average turbo-prop marginal cost distributions (network estimate basis) ........ 75
List of Annexes Annex A Glossary…………………………………………………………………………………….. A - 1
Annex B Conversions and exchange rates………………………………………………….. A - 2
Annex C Aviation fuel: types and prices……………………………………………………… A - 3
Annex D AO questionnaire example…………………………………………………………… A - 7
Annex E Exploratory questionnaire based on ICAO Form EF………………………… A - 19
Annex F Aircraft weight data for Lido fuel burn table…………………………………… A - 22
Annex G ATC costs as a function of re-routes……………………………………………… A - 23
Annex H Allocation of maintenance burden by minute of delay…………………….. A - 28
Annex I Fuel burn penalties…………………………………………………..................... A - 32
Annex J Full tactical cost calculation results tables……………………………………… A - 33
Annex K Linear holding at FRA………………………………………………………………….. A - 108
Annex L Airport charges affected by time of day incurred………………………….… A - 109
Annex M Use of cost averages weighted by delay minutes…………………………… A - 111
Annex N Selection of aircraft variants and airlines……………………………………….. A - 113
Annex O Calculation of DRL costs and further background on aircraft financing and maintenance reserves..............................................................
A - 120
Annex P Calculation of strategic opportunity cost based on flight value........... A - 129 Note on references and footnotes Local footnotes are indicated by superscript letters, e.g. “a” Document references are indicated by a superscripted number, e.g. “(1)”
Evaluating the true cost to airlines of one minute of airborne or ground delay
Transport Studies Group vii University of Westminster
Executive Summary
A. Key objectives and intended users of this Study
1. This Report documents the results of a study that has evaluated the true cost to airlines of one minute of airborne and ground delay. The Study has been completed for the Performance Review Unit (PRU), at Eurocontrol (Brussels) by the Transport Studies Group at the University of Westminster (London).
2. The key objectives of the Study were:
• to establish transparent reference values, which are operationally meaningful, for the costs incurred by airlines as a result of airborne and ground delays
• to calculate higher-level statistics (e.g. total European-level costs of delay)
• to demonstrate the need to move away from a focus on fuel-only cost considerations
• to identify margins of error on results presented (achieved through the use of different costing scenarios throughout the calculations)
3. This Study is intended to be used by:
• aircraft operators - senior planning and operational managers, by allowing the reader to assess in detail the costs of incurring tactical delays, to assess re-route trade-offs, and to quantify the costs of adding buffers to schedules for specific aircraft and phases of flight
• airspace designers and flow managers, plus ATM planners, by allowing the strategic costs associated with network design (e.g. en-route extensions) to be calculated and compared with the tactical costs of incurred delay. These tactical costs are evaluated both for specific aircraft and by phase of flight, and also at the network level
B. Milestones of this Study This Study is the first research, as far as the authors are aware, which has: 1. Furnished an extensive public domain tabulation of specific fuel-burn data, for specific aircraft
variants and phases of flight, calibrated with operating data 2. Calculated block-hour direct operating costs (BHDOCs) for specific aircraft variants in the
European context, based on real operational data from airlines 3. Appropriately differentiated between the marginal costs of delay for ground and airborne phases
of flight, and by ‘long’ and ‘short’ delay types 4. Calculated marginal costs of tactical delay for specific aircraft variants 5. Calculated the strategic cost of adding one minute of buffer into the schedule, and the costs of:
• exactly using the minute of buffer (buffer just right on day of operations) • not using the minute (buffer not required on day of operations) • using the minute, and incurring an extra minute of tactical delay (buffer not enough)
Evaluating the true cost to airlines of one minute of airborne or ground delay
Transport Studies Group viii University of Westminster
C. Key concepts and definitions 1. Delay costs are often considered only at the tactical level (day of operations), where they are
encountered, and measured against planned activities. However, delay has to be anticipated by airlines at the strategic stage (months or days in advance of operations), when developing schedules which can absorb the unpredictability of day-to-day operations.
2. Airlines do this by adding buffers into their schedules, for example. These costs are ‘hidden’, in
the sense that airlines do not have a line in their accounts which shows the associated costs of all of these contingencies. They are nonetheless real costs which represent the opportunity of being able to use such resources in another way, or to save money by not having them.
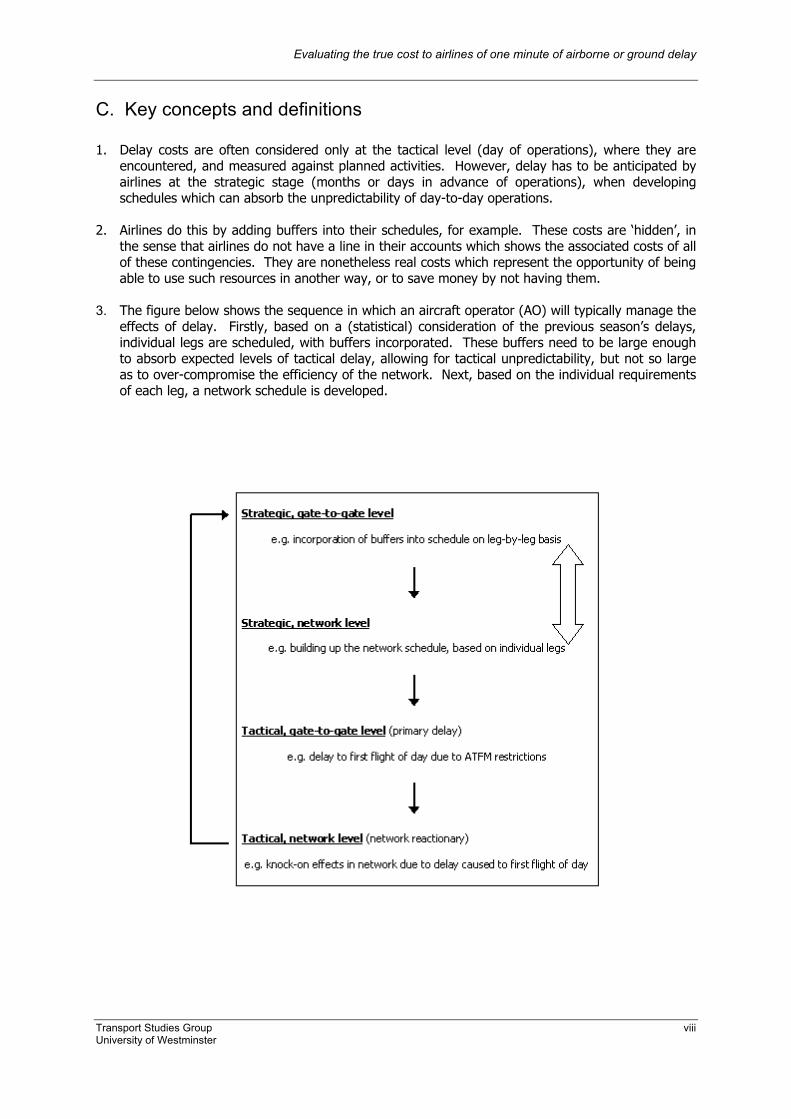
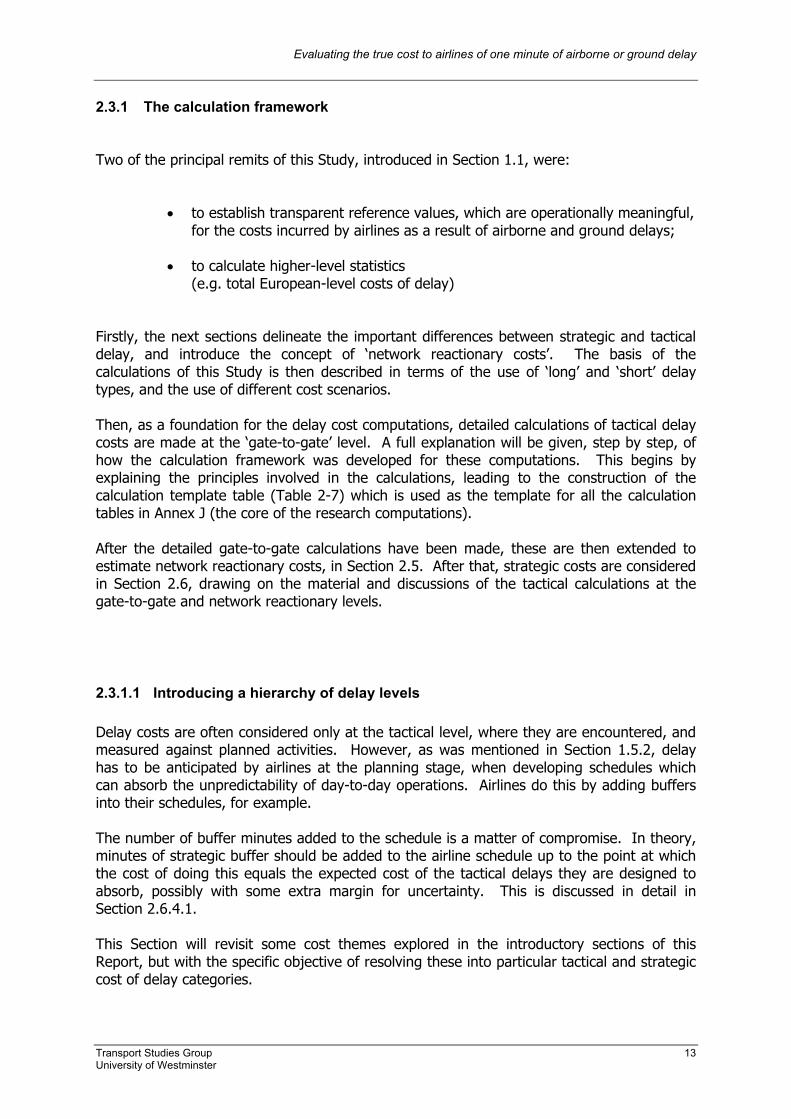
3. The figure below shows the sequence in which an aircraft operator (AO) will typically manage the
effects of delay. Firstly, based on a (statistical) consideration of the previous season’s delays, individual legs are scheduled, with buffers incorporated. These buffers need to be large enough to absorb expected levels of tactical delay, allowing for tactical unpredictability, but not so large as to over-compromise the efficiency of the network. Next, based on the individual requirements of each leg, a network schedule is developed.

Evaluating the true cost to airlines of one minute of airborne or ground delay
Transport Studies Group ix University of Westminster
4. On the day of operations, tactical delays are encountered. These may be caused by a number of
factors, such as ATFM measures, AO technical problems, or weather. ‘Primary’ tactical delays have ‘knock-on’ effects to other aircraft, known as ‘reactionary’ delays.
5. ‘Reactionary’ delays may be defined as all delays which may be directly attributed to an initial,
causal or primary delay, be they experienced by the causal aircraft, or by others. These may propagate throughout the network until the end of the same operational day. Either all, or part, of particular flight delay durations subsequent to the primary delay may be assigned as ‘reactionary’.
6. The table below shows the types of costs which may be incurred as a result of delay at the
different levels just introduced.
Delay level strategic delay tactical delay
gate-to-gate level e.g. cost of schedule buffers primary delay cost
network level complex set of opportunity and sunk costs reactionary delay cost
7. Since costs at the strategic level are incorporated into the AO’s schedule in advance, they will
tend to be associated with unit (average) costs. After these have been ‘sunk’ into the schedule, actual delays incurred on a day-to-day basis (tactical costs) will tend to be associated with marginal costs. This Study has calculated both types of cost of delay.
8. Block-hour direct operating costs (BHDOCs) have been calculated for twelve aircraft, under
different cost scenarios: low, base and high. These are unit costs, and are also strongly related to the strategic cost of adding one minute of buffer into the schedule.
9. Tactical costs have all been calculated as marginal costs. These usually have only a weak
connection, or no connection, with BHDOC values. These marginal costs have also been calculated under low, base and high cost scenarios.
10. Tactical marginal costs considered in this Study are: fuel; maintenance; crew; ground handling
(aircraft); (3rd-party) passenger handling; airport aeronautical charges; en-route ATC; plus passenger costs of delay to the airline – ‘hard’ costs (e.g. delay compensation) and ‘soft’ costs (e.g. future loss of market share due to lack of punctuality).
11. Aircraft depreciation, rentals and leases costs are only very weakly related to utilisation, such that
these have been allocated to the strategic level, at which stage these costs are almost entirely fixed.
Evaluating the true cost to airlines of one minute of airborne or ground delay
Transport Studies Group x University of Westminster
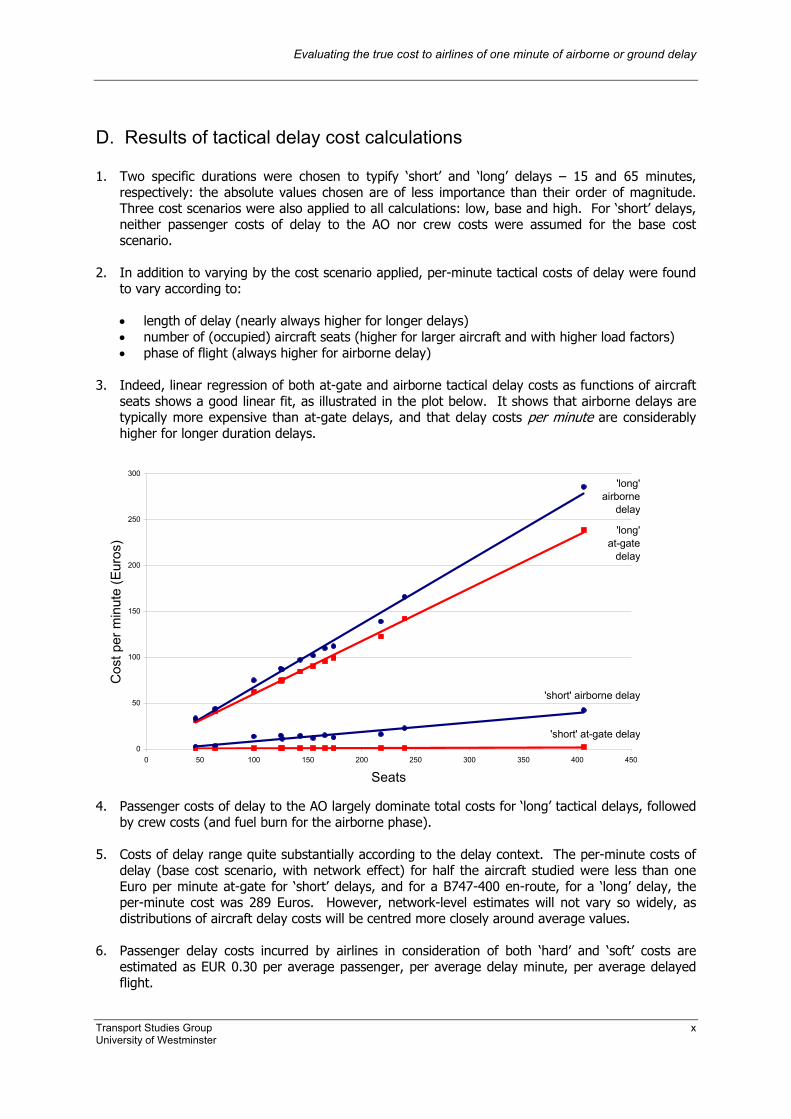
D. Results of tactical delay cost calculations 1. Two specific durations were chosen to typify ‘short’ and ‘long’ delays – 15 and 65 minutes,
respectively: the absolute values chosen are of less importance than their order of magnitude. Three cost scenarios were also applied to all calculations: low, base and high. For ‘short’ delays, neither passenger costs of delay to the AO nor crew costs were assumed for the base cost scenario.
2. In addition to varying by the cost scenario applied, per-minute tactical costs of delay were found
to vary according to:
• length of delay (nearly always higher for longer delays) • number of (occupied) aircraft seats (higher for larger aircraft and with higher load factors) • phase of flight (always higher for airborne delay)
3. Indeed, linear regression of both at-gate and airborne tactical delay costs as functions of aircraft
seats shows a good linear fit, as illustrated in the plot below. It shows that airborne delays are typically more expensive than at-gate delays, and that delay costs per minute are considerably higher for longer duration delays.
0
50
100
150
200
250
300
0 50 100 150 200 250 300 350 400 450
Seats
Cos
t per
min
ute
(Eur
os)
'long' airborne
delay
'long' at-gate
delay
'short' at-gate delay
'short' airborne delay
4. Passenger costs of delay to the AO largely dominate total costs for ‘long’ tactical delays, followed
by crew costs (and fuel burn for the airborne phase). 5. Costs of delay range quite substantially according to the delay context. The per-minute costs of
delay (base cost scenario, with network effect) for half the aircraft studied were less than one Euro per minute at-gate for ‘short’ delays, and for a B747-400 en-route, for a ‘long’ delay, the per-minute cost was 289 Euros. However, network-level estimates will not vary so widely, as distributions of aircraft delay costs will be centred more closely around average values.
6. Passenger delay costs incurred by airlines in consideration of both ‘hard’ and ‘soft’ costs are
estimated as EUR 0.30 per average passenger, per average delay minute, per average delayed flight.
Evaluating the true cost to airlines of one minute of airborne or ground delay
Transport Studies Group xi University of Westminster
E. Results of strategic delay cost calculations
1. The number of buffer minutes added to the schedule is a matter of compromise. In theory,
minutes of strategic buffer should be added to the airline schedule up to the point at which the cost of doing this equals the expected cost of the tactical delays they are designed to absorb, possibly with some extra margin for uncertainty. Buffers will incur costs to the AO, whether they are fully used tactically, or not.
2. The allocation of strategic buffers by AOs may be based on the statistical expectation of delay
(based on previous experience), together with an assessment of the associated uncertainty, or unpredictability, of such delays. Some AOs may take more buffering risks than others, e.g. by applying relatively small buffers, especially if they do not pay crew overtime and/or suffer costs due to passenger delay (although passenger compensation rules may soon change).
3. Adding buffer to the schedule impacts on all flights, whilst the saving made on tactical delays will
depend on the percentage of flights delayed. Based on a simplified example for B737-300, adding a number of buffer minutes to the schedule equal to the average tactical delay, is expected to be cost-effective if more than 22% of flights are expected to be delayed by more than 15 minutes.
4. A reduction in the number of rotations possible in the day may become a limiting factor to the
amount of buffer added, sooner than the apparent cost of the buffer minutes themselves suggest.
5. It is cheaper to allocate buffer at-gate, than to the airborne phase, although it may be advisable
to strategically allocate some buffer specifically to the airborne phase. Costs calculated in the Study for en-route buffer could be used to estimate the costs of route extensions at the ATM planning level, for example as determined by the Route Availability Document.
6. Predictability, or rather lack of it, is an underpinning cause of the financial losses suffered as a
consequence of delay. If all delays could be predicted with confidence to be exactly 10 minutes, then schedules could be re-adjusted accordingly.
7. Predictability of delay (especially at the city-pair level) is an important complementary metric to
average delay.
Evaluating the true cost to airlines of one minute of airborne or ground delay
Transport Studies Group xii University of Westminster
F. Results of higher-level delay cost calculations
1. A disaggregated calculation according to ‘long’ and ‘short’ delay types, gives a point estimate of
990 million Euros for the total cost of ATFM delay minutes (i.e. delays experienced at the gate, with engines off 90% of the time) in 2002, in Europe. Allocating a range from -15% to +20% either side of this point estimate, gives a working range of this total cost of:
840 – 1 200 million Euros
2. Based on these ATFM delays, a network average value of 72 Euros per minute may be
calculated for ‘long’ delays (of over 15 minutes) weighted by aircraft types and the known distribution of ATFM delay minutes. As with the network total range quoted above, this average value includes reactionary delay costs, but does not consider strategic costs associated with buffer minutes added to schedules. A different average may need to be calculated for different areas of airspace, e.g. a particular FIR/UIR.
3. Since ‘long’ delays (above 15 minutes) contribute the vast majority of the total cost, it would be
instructive to examine the distribution of these delay minutes by causal factors (e.g. by airport-generated ATFM delays due to weather).
G. Key recommendations for future research 1. Identify the causes of, and potential remedial actions for, long delays – with a particular
emphasis on which types of long primary delay cause most penalties in terms of reactionary delay 2. Improve the provision of delay predictability data at the city-pair level, to help airlines at the
strategic planning level 3. Further develop decision-making rules for airlines when trading off ground versus airborne delays.
Such rules could be developed as a tool, possibly incorporated into AO flight planning systems, for automatic acceptance or rejection of re-routes offered by CFMU
4. The cost of cancellations needs to be properly defined, and ATM conditions which are most likely
to cause cancellations should be identified
Evaluating the true cost to airlines of one minute of airborne or ground delay
Transport Studies Group xiii University of Westminster
User Guide The objectives of this User Guide are to offer the reader a concise point of reference to the Report, not a summary thereof, with links made to key sections which might be of interest to particular users. Among the key objectives of this Study, it was intended to provide quantified cost values to be used by: • aircraft operators - senior planning and operational managers, by allowing the reader to assess in
detail the costs of incurring tactical delays, to assess re-route trade-offs, and to quantify the costs of adding buffers to schedules for specific aircraft and phases of flight
• airspace designers and flow managers, plus ATM planners, by allowing the strategic costs
associated with network design (e.g. en-route extensions) to be calculated and compared with the tactical costs of incurred delay. These tactical costs are evaluated both for specific aircraft and by phase of flight, and also at the network level
The User Guide is based on a simple question and answer format, with anticipated key questions for each type of user, followed by a set of common FAQs. These are based on questions which have been put to the Authors, during the consultative phases of developing this Report. IMPORTANT NOTE: every time the word “Section” or “Table” or “Figure” is followed by a number, throughout this Report, the user may jump directly to the corresponding section, table or figure by clicking on the number which follows. The same applies to references, given by numbers in superscript, e.g. “(1)”, and page numbers in the index.
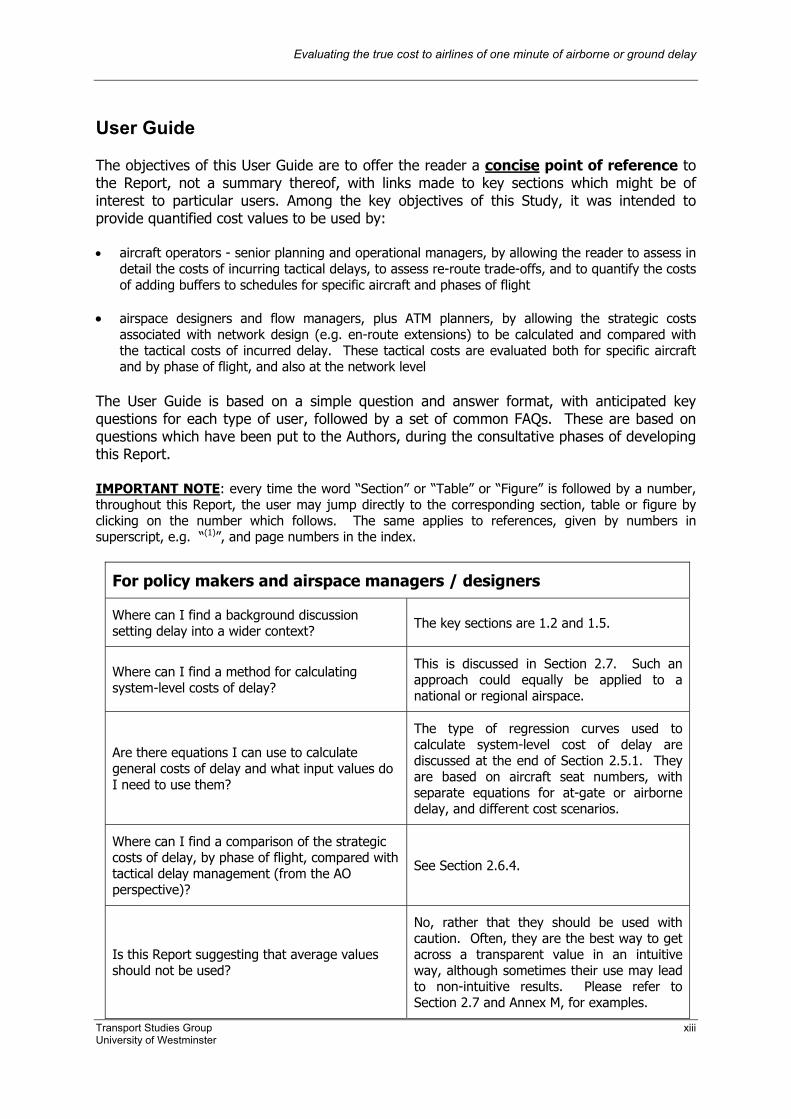
For policy makers and airspace managers / designers
Where can I find a background discussion setting delay into a wider context? The key sections are 1.2 and 1.5.
Where can I find a method for calculating system-level costs of delay?
This is discussed in Section 2.7. Such an approach could equally be applied to a national or regional airspace.
Are there equations I can use to calculate general costs of delay and what input values do I need to use them?
The type of regression curves used to calculate system-level cost of delay are discussed at the end of Section 2.5.1. They are based on aircraft seat numbers, with separate equations for at-gate or airborne delay, and different cost scenarios.
Where can I find a comparison of the strategic costs of delay, by phase of flight, compared with tactical delay management (from the AO perspective)?
See Section 2.6.4.
Is this Report suggesting that average values should not be used?
No, rather that they should be used with caution. Often, they are the best way to get across a transparent value in an intuitive way, although sometimes their use may lead to non-intuitive results. Please refer to Section 2.7 and Annex M, for examples.
Evaluating the true cost to airlines of one minute of airborne or ground delay
Transport Studies Group xiv University of Westminster
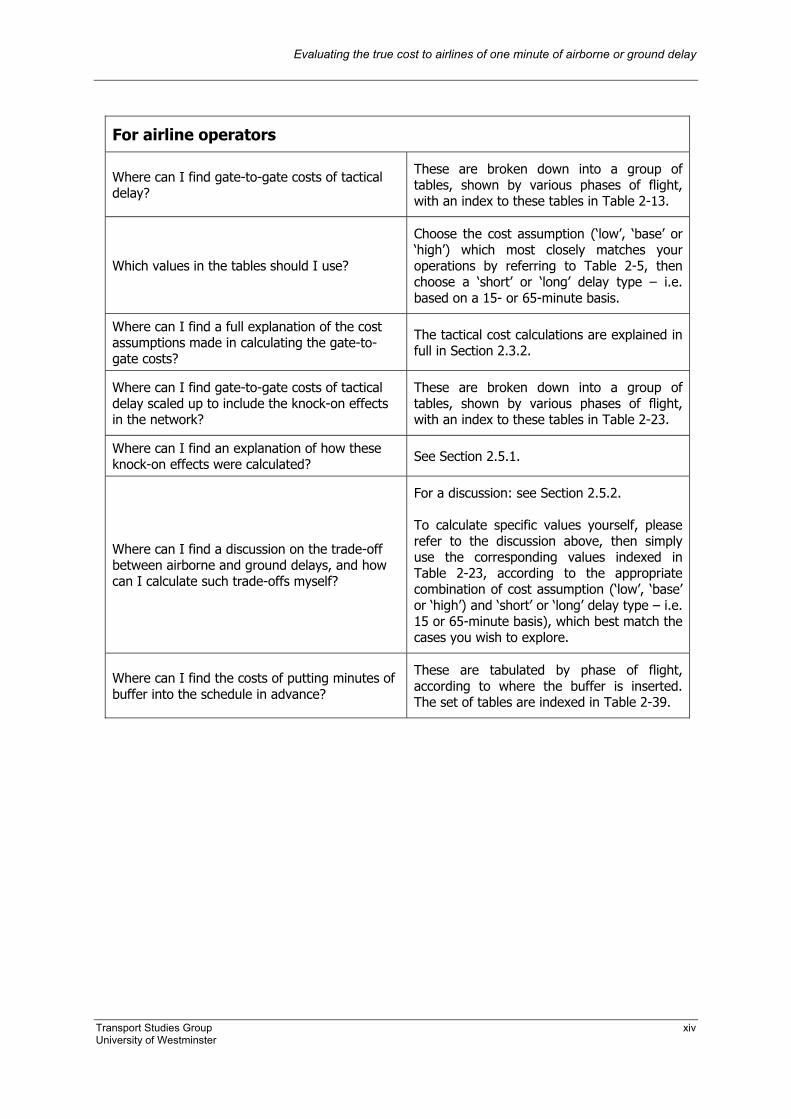
For airline operators
Where can I find gate-to-gate costs of tactical delay?
These are broken down into a group of tables, shown by various phases of flight, with an index to these tables in Table 2-13.
Which values in the tables should I use?
Choose the cost assumption (‘low’, ‘base’ or ‘high’) which most closely matches your operations by referring to Table 2-5, then choose a ‘short’ or ‘long’ delay type – i.e. based on a 15- or 65-minute basis.
Where can I find a full explanation of the cost assumptions made in calculating the gate-to-gate costs?
The tactical cost calculations are explained in full in Section 2.3.2.
Where can I find gate-to-gate costs of tactical delay scaled up to include the knock-on effects in the network?
These are broken down into a group of tables, shown by various phases of flight, with an index to these tables in Table 2-23.
Where can I find an explanation of how these knock-on effects were calculated? See Section 2.5.1.
Where can I find a discussion on the trade-off between airborne and ground delays, and how can I calculate such trade-offs myself?
For a discussion: see Section 2.5.2.
To calculate specific values yourself, please refer to the discussion above, then simply use the corresponding values indexed in Table 2-23, according to the appropriate combination of cost assumption (‘low’, ‘base’ or ‘high’) and ‘short’ or ‘long’ delay type – i.e. 15 or 65-minute basis), which best match the cases you wish to explore.
Where can I find the costs of putting minutes of buffer into the schedule in advance?
These are tabulated by phase of flight, according to where the buffer is inserted. The set of tables are indexed in Table 2-39.
Evaluating the true cost to airlines of one minute of airborne or ground delay
Transport Studies Group xv University of Westminster
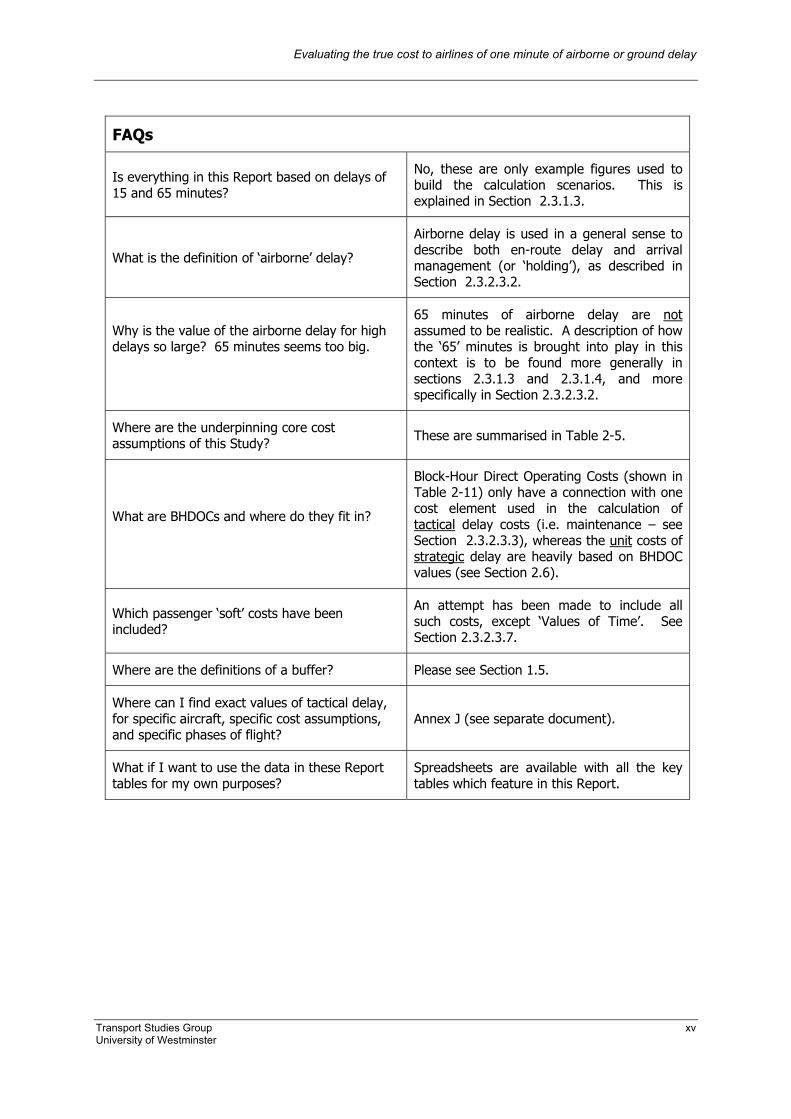
FAQs
Is everything in this Report based on delays of 15 and 65 minutes?
No, these are only example figures used to build the calculation scenarios. This is explained in Section 2.3.1.3.
What is the definition of ‘airborne’ delay?
Airborne delay is used in a general sense to describe both en-route delay and arrival management (or ‘holding’), as described in Section 2.3.2.3.2.
Why is the value of the airborne delay for high delays so large? 65 minutes seems too big.
65 minutes of airborne delay are not assumed to be realistic. A description of how the ‘65’ minutes is brought into play in this context is to be found more generally in sections 2.3.1.3 and 2.3.1.4, and more specifically in Section 2.3.2.3.2.
Where are the underpinning core cost assumptions of this Study? These are summarised in Table 2-5.
What are BHDOCs and where do they fit in?
Block-Hour Direct Operating Costs (shown in Table 2-11) only have a connection with one cost element used in the calculation of tactical delay costs (i.e. maintenance – see Section 2.3.2.3.3), whereas the unit costs of strategic delay are heavily based on BHDOC values (see Section 2.6).
Which passenger ‘soft’ costs have been included?
An attempt has been made to include all such costs, except ‘Values of Time’. See Section 2.3.2.3.7.
Where are the definitions of a buffer? Please see Section 1.5.
Where can I find exact values of tactical delay, for specific aircraft, specific cost assumptions, and specific phases of flight?
Annex J (see separate document).
What if I want to use the data in these Report tables for my own purposes?
Spreadsheets are available with all the key tables which feature in this Report.
Evaluating the true cost to airlines of one minute of airborne or ground delay
Transport Studies Group 1 University of Westminster
1 Introduction
1.1 Study context This Report documents the results of a study that has evaluated the true cost to airlines of one minute of airborne or ground delay. The Study has been completed for the Performance Review Unit (PRU), at Eurocontrol (Brussels) by the Transport Studies Group at the University of Westminster (London). The key objectives of the Study were: • to establish transparent reference values, which are operationally meaningful, for the
costs incurred by airlines as a result of airborne and ground delays; • to calculate higher-level statistics (e.g. total European-level costs of delay); • to demonstrate the need to move away from a focus on fuel-only models when
considering potential airline cost savings through reduction of delays; • to identify margins of error on results presented (achieved through the use of different
costing scenarios throughout the calculations) Although delay is “routinely monetized”, as Hansen et al point out (9), “... there is ample room for scepticism about the procedures. Virtually all delay cost calculations involve nothing more than the application of a cost factor based on reported values for the average direct aircraft operating cost per block hour”. Several reports have acknowledged the shortcomings of this approach, for example identifying the need to disaggregate these costs into phase of flight (1) and to extend the consideration beyond average costs, to the marginal costs of delay (2). (The findings of this Study will be compared with a selection of other reported results, after the tactical costs of delay have been computed – see Section 2.5.3.2). Hansen et al go on to declare that:
“These approaches to delay cost estimation are based on strong assumptions that are rarely scrutinised or even acknowledged. These include that the cost of delay is an additive function of the cost of individual delay events, and that the cost of each event is a linear function of the duration of the delay (perhaps taking into account the phase of flight in which it occurs). Such assumptions ignore the possibility that delay cost is non linearly related to duration, subject to combinatorial effects, and includes sizeable indirect components.”
The literature review completed as part of this Study has confirmed this declaration that delay cost calculations are indeed often non-transparent or simplistic, and many primary sources do not quote the origin of these costs. This situation does not help to promote the common culture of understanding and agreement which is needed as a basis for moving the industry further toward better management of delay. It is hoped that this Study is a step towards improving this situation.
Evaluating the true cost to airlines of one minute of airborne or ground delay
Transport Studies Group 2 University of Westminster
This Study has attempted throughout to attribute, where appropriate, marginal costs of delay minutes and not to simply assign unit operating costs as a function of tactical delay minutes, as is prevalent elsewhere in other literature and studies. As will be demonstrated, however, where strategic costs of delay are calculated, unit costs are often appropriate. Definitions of terms used, such as ‘strategic’ and ‘tactical’ delay cost, will be presented in Section 2.3.1. Furthermore, to ensure that the values are operationally meaningful (i.e. airlines may find them useful in actual decision making regarding delay) the Study focuses on specific aircraft types and a cross-section of specific European airports, within clearly defined model boundary conditions (such as fuel prices). The airlines interviewed during the course of this Study stressed their particular need for such specific values, rather than aggregate or average values.
1.2 Background The demand for air transport in Europe had, in the 10 years preceding 2001, been growing annually at a rate of between 5 and 7 per cent (3). After September 11th, 2001, demand declined somewhat, but forecasts in Eurocontrol’s 6th Performance Review Report suggest that from 2003 it is likely to resume upwards and continue for the foreseeable future, albeit at a lower level (4). However, even after this slowing of demand, air travel is forecast (5) to grow by around 30 per cent on 2003 values, by 2009, a rate which will have a significant impact for air traffic management and already busy airports. In 1999 a combination of factors (i.e. higher than forecast demand and Kosovo) caused air traffic to experience increased delays, which prompted the European Commission, Eurocontrol and national air traffic management (ATM) service providers to take further measures aimed at improving the efficiency of European air traffic movements and reduce delays. The action taken by the ATM service providers (e.g. ARN V3, enhanced operational flexibility, introduction of new sectors and RVSM) did lead to an improvement, although this progress has not kept pace with subsequent demand. In 2002, delays were reported by the Performance Review Commission still to be high, with 21% of departures being delayed more than 15 minutes (1). In terms of primary delays, 26% were attributed to air traffic flow management (ATFM), while around 43% were due to airline operational reasons. Clearly such delays, regardless of their cause, impose a cost on airlines and passengers alike. Obviously such incurred costs are not desirable and result in an extra financial burden to the airlines and their passengers. For the European aviation industry to lessen this burden it is necessary to have a better understanding of where the costs are generated and that they be transparent to both ATM service providers and AOs. This Study aims to provide an insight into these issues and to show that it is possible to identify and allocate both strategic and tactical delay costs to the various cost elements associated with airborne and ground operations.
Evaluating the true cost to airlines of one minute of airborne or ground delay
Transport Studies Group 3 University of Westminster
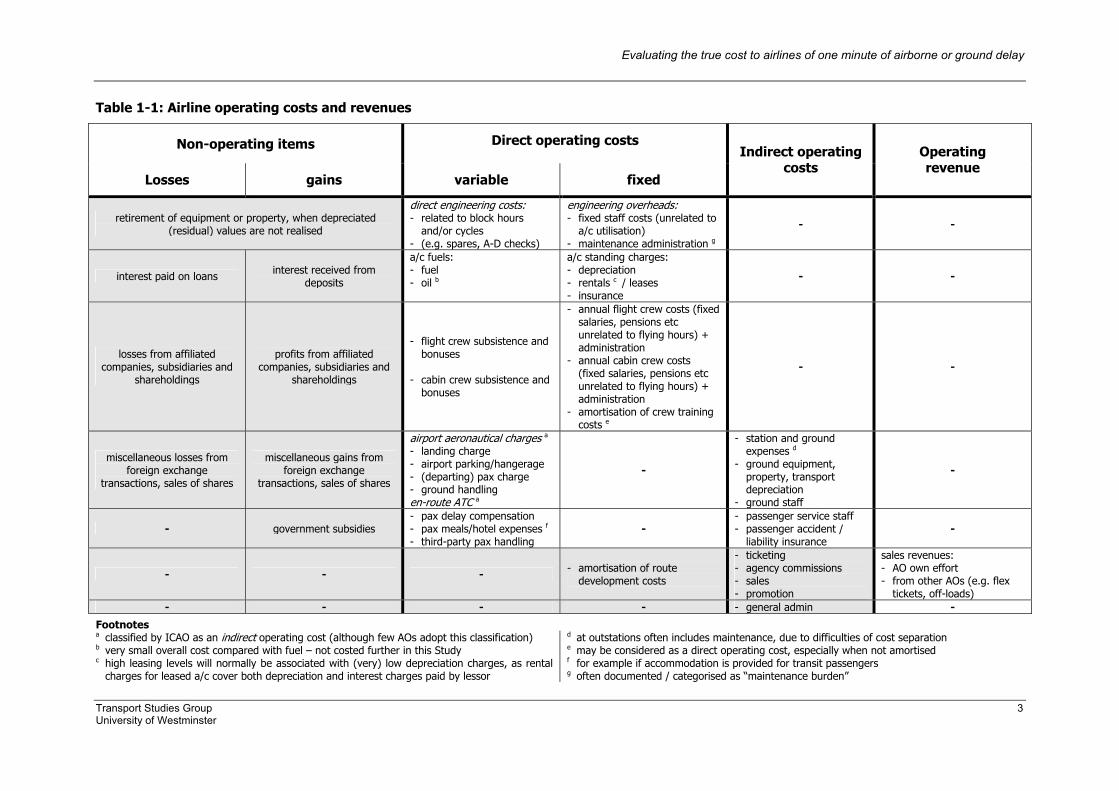
Table 1-1: Airline operating costs and revenues
Non-operating items Direct operating costs
Losses gains variable fixed
Indirect operating costs
Operating revenue
retirement of equipment or property, when depreciated (residual) values are not realised
direct engineering costs: - related to block hours
and/or cycles - (e.g. spares, A-D checks)
engineering overheads: - fixed staff costs (unrelated to
a/c utilisation) - maintenance administration g
- -
interest paid on loans interest received from deposits
a/c fuels: - fuel - oil b
a/c standing charges: - depreciation - rentals c / leases - insurance
- -
losses from affiliated companies, subsidiaries and
shareholdings
profits from affiliated companies, subsidiaries and
shareholdings
- flight crew subsistence and bonuses
- cabin crew subsistence and
bonuses
- annual flight crew costs (fixed salaries, pensions etc unrelated to flying hours) + administration
- annual cabin crew costs (fixed salaries, pensions etc unrelated to flying hours) + administration
- amortisation of crew training costs e
- -
miscellaneous losses from foreign exchange
transactions, sales of shares
miscellaneous gains from foreign exchange
transactions, sales of shares
airport aeronautical charges a - landing charge - airport parking/hangerage - (departing) pax charge - ground handling en-route ATC a
-
- station and ground expenses d
- ground equipment, property, transport depreciation
- ground staff
-
- government subsidies - pax delay compensation - pax meals/hotel expenses f - third-party pax handling
- - passenger service staff - passenger accident /
liability insurance -
- - - - amortisation of route development costs
- ticketing - agency commissions - sales - promotion
sales revenues: - AO own effort - from other AOs (e.g. flex
tickets, off-loads) - - - - - general admin -
Footnotes a classified by ICAO as an indirect operating cost (although few AOs adopt this classification) b very small overall cost compared with fuel – not costed further in this Study c high leasing levels will normally be associated with (very) low depreciation charges, as rental
charges for leased a/c cover both depreciation and interest charges paid by lessor
d at outstations often includes maintenance, due to difficulties of cost separation e may be considered as a direct operating cost, especially when not amortised f for example if accommodation is provided for transit passengers g often documented / categorised as “maintenance burden”
Evaluating the true cost to airlines of one minute of airborne or ground delay
Transport Studies Group 4 University of Westminster
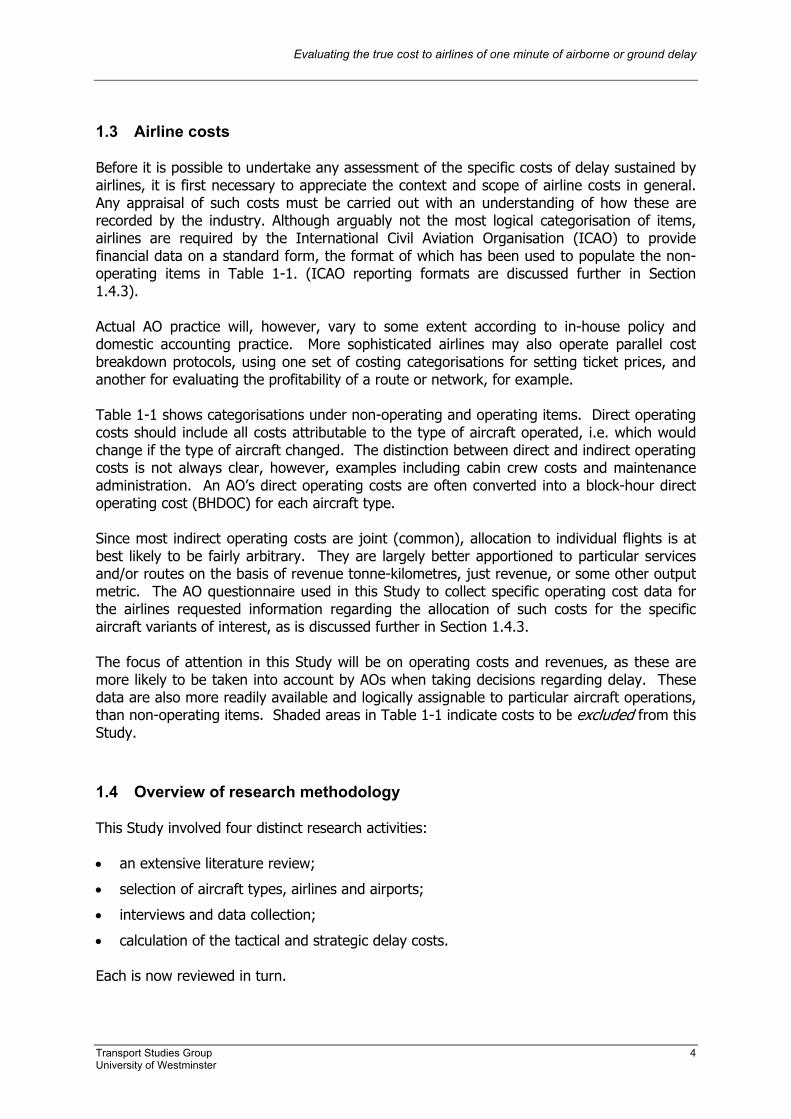
1.3 Airline costs Before it is possible to undertake any assessment of the specific costs of delay sustained by airlines, it is first necessary to appreciate the context and scope of airline costs in general. Any appraisal of such costs must be carried out with an understanding of how these are recorded by the industry. Although arguably not the most logical categorisation of items, airlines are required by the International Civil Aviation Organisation (ICAO) to provide financial data on a standard form, the format of which has been used to populate the non-operating items in Table 1-1. (ICAO reporting formats are discussed further in Section 1.4.3). Actual AO practice will, however, vary to some extent according to in-house policy and domestic accounting practice. More sophisticated airlines may also operate parallel cost breakdown protocols, using one set of costing categorisations for setting ticket prices, and another for evaluating the profitability of a route or network, for example. Table 1-1 shows categorisations under non-operating and operating items. Direct operating costs should include all costs attributable to the type of aircraft operated, i.e. which would change if the type of aircraft changed. The distinction between direct and indirect operating costs is not always clear, however, examples including cabin crew costs and maintenance administration. An AO’s direct operating costs are often converted into a block-hour direct operating cost (BHDOC) for each aircraft type. Since most indirect operating costs are joint (common), allocation to individual flights is at best likely to be fairly arbitrary. They are largely better apportioned to particular services and/or routes on the basis of revenue tonne-kilometres, just revenue, or some other output metric. The AO questionnaire used in this Study to collect specific operating cost data for the airlines requested information regarding the allocation of such costs for the specific aircraft variants of interest, as is discussed further in Section 1.4.3. The focus of attention in this Study will be on operating costs and revenues, as these are more likely to be taken into account by AOs when taking decisions regarding delay. These data are also more readily available and logically assignable to particular aircraft operations, than non-operating items. Shaded areas in Table 1-1 indicate costs to be excluded from this Study.
1.4 Overview of research methodology This Study involved four distinct research activities: • an extensive literature review;
• selection of aircraft types, airlines and airports;
• interviews and data collection;
• calculation of the tactical and strategic delay costs. Each is now reviewed in turn.
Evaluating the true cost to airlines of one minute of airborne or ground delay
Transport Studies Group 5 University of Westminster
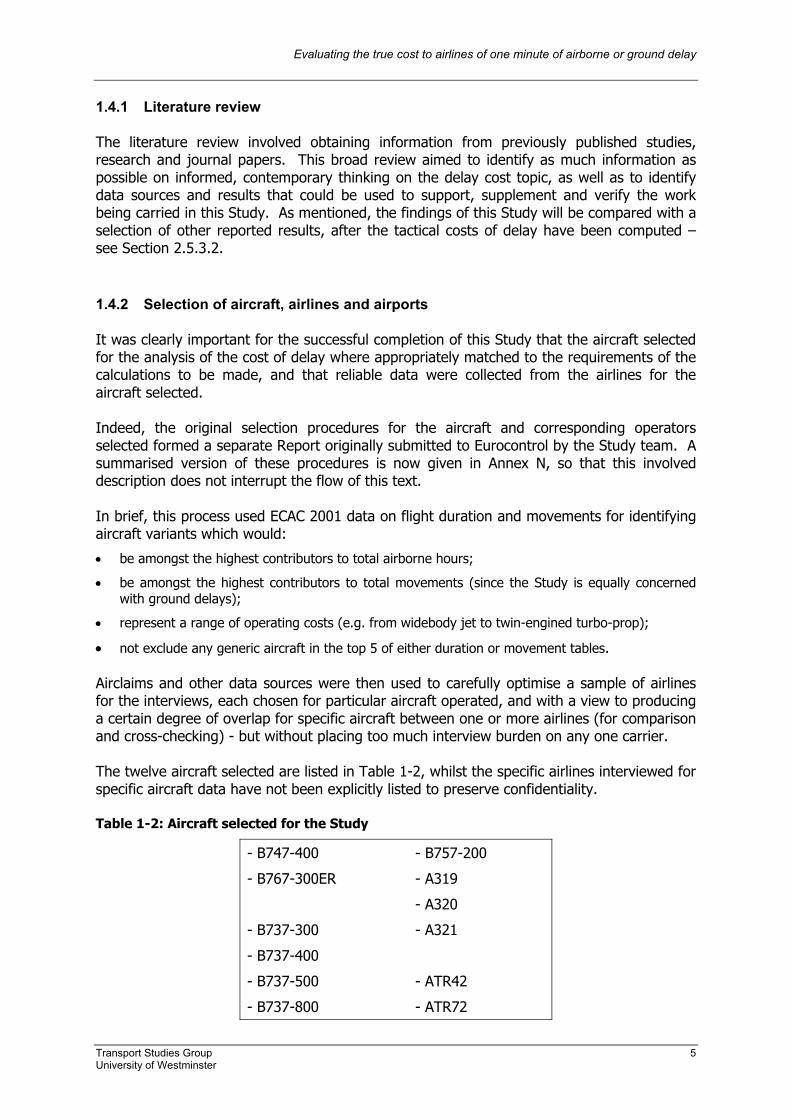
1.4.1 Literature review The literature review involved obtaining information from previously published studies, research and journal papers. This broad review aimed to identify as much information as possible on informed, contemporary thinking on the delay cost topic, as well as to identify data sources and results that could be used to support, supplement and verify the work being carried in this Study. As mentioned, the findings of this Study will be compared with a selection of other reported results, after the tactical costs of delay have been computed – see Section 2.5.3.2. 1.4.2 Selection of aircraft, airlines and airports It was clearly important for the successful completion of this Study that the aircraft selected for the analysis of the cost of delay where appropriately matched to the requirements of the calculations to be made, and that reliable data were collected from the airlines for the aircraft selected. Indeed, the original selection procedures for the aircraft and corresponding operators selected formed a separate Report originally submitted to Eurocontrol by the Study team. A summarised version of these procedures is now given in Annex N, so that this involved description does not interrupt the flow of this text. In brief, this process used ECAC 2001 data on flight duration and movements for identifying aircraft variants which would:
• be amongst the highest contributors to total airborne hours;
• be amongst the highest contributors to total movements (since the Study is equally concerned with ground delays);
• represent a range of operating costs (e.g. from widebody jet to twin-engined turbo-prop);
• not exclude any generic aircraft in the top 5 of either duration or movement tables. Airclaims and other data sources were then used to carefully optimise a sample of airlines for the interviews, each chosen for particular aircraft operated, and with a view to producing a certain degree of overlap for specific aircraft between one or more airlines (for comparison and cross-checking) - but without placing too much interview burden on any one carrier. The twelve aircraft selected are listed in Table 1-2, whilst the specific airlines interviewed for specific aircraft data have not been explicitly listed to preserve confidentiality. Table 1-2: Aircraft selected for the Study
- B747-400
- B767-300ER
- B737-300
- B737-400
- B737-500
- B737-800
- B757-200
- A319
- A320
- A321
- ATR42
- ATR72
Evaluating the true cost to airlines of one minute of airborne or ground delay
Transport Studies Group 6 University of Westminster
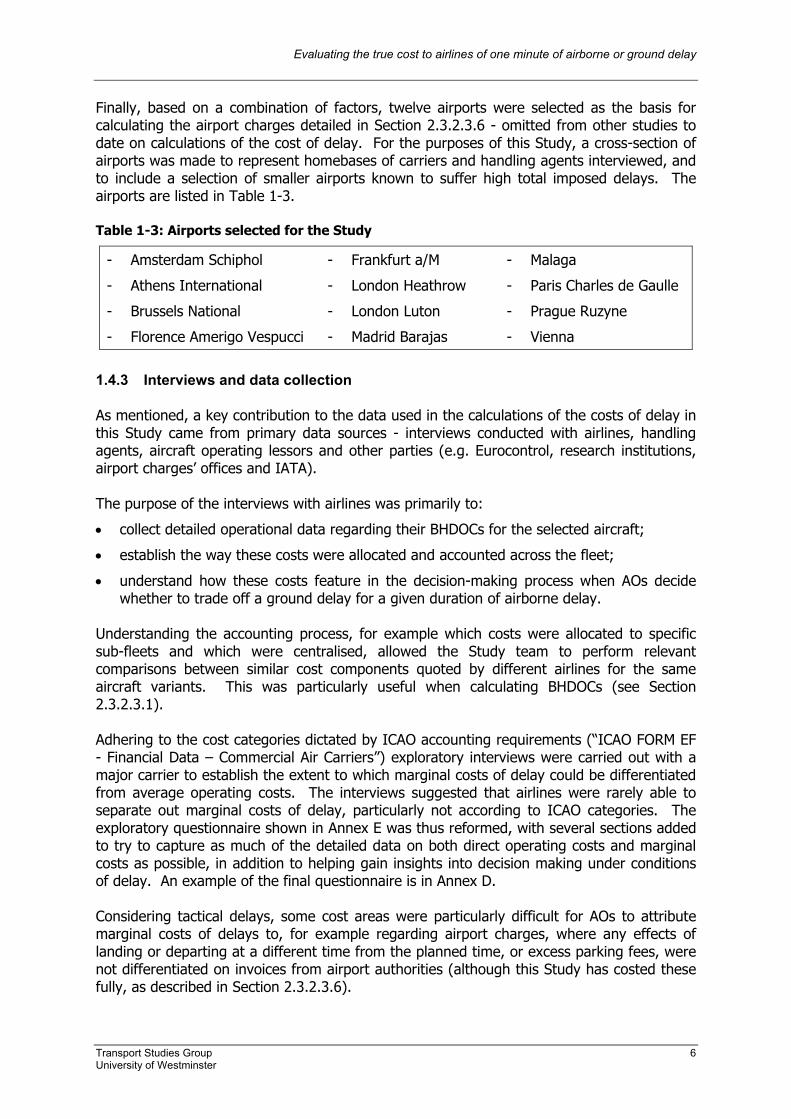
Finally, based on a combination of factors, twelve airports were selected as the basis for calculating the airport charges detailed in Section 2.3.2.3.6 - omitted from other studies to date on calculations of the cost of delay. For the purposes of this Study, a cross-section of airports was made to represent homebases of carriers and handling agents interviewed, and to include a selection of smaller airports known to suffer high total imposed delays. The airports are listed in Table 1-3. Table 1-3: Airports selected for the Study
- Amsterdam Schiphol
- Athens International
- Brussels National
- Florence Amerigo Vespucci
- Frankfurt a/M
- London Heathrow
- London Luton
- Madrid Barajas
- Malaga
- Paris Charles de Gaulle
- Prague Ruzyne
- Vienna 1.4.3 Interviews and data collection As mentioned, a key contribution to the data used in the calculations of the costs of delay in this Study came from primary data sources - interviews conducted with airlines, handling agents, aircraft operating lessors and other parties (e.g. Eurocontrol, research institutions, airport charges’ offices and IATA). The purpose of the interviews with airlines was primarily to:
• collect detailed operational data regarding their BHDOCs for the selected aircraft;
• establish the way these costs were allocated and accounted across the fleet;
• understand how these costs feature in the decision-making process when AOs decide whether to trade off a ground delay for a given duration of airborne delay.
Understanding the accounting process, for example which costs were allocated to specific sub-fleets and which were centralised, allowed the Study team to perform relevant comparisons between similar cost components quoted by different airlines for the same aircraft variants. This was particularly useful when calculating BHDOCs (see Section 2.3.2.3.1). Adhering to the cost categories dictated by ICAO accounting requirements (“ICAO FORM EF - Financial Data – Commercial Air Carriers”) exploratory interviews were carried out with a major carrier to establish the extent to which marginal costs of delay could be differentiated from average operating costs. The interviews suggested that airlines were rarely able to separate out marginal costs of delay, particularly not according to ICAO categories. The exploratory questionnaire shown in Annex E was thus reformed, with several sections added to try to capture as much of the detailed data on both direct operating costs and marginal costs as possible, in addition to helping gain insights into decision making under conditions of delay. An example of the final questionnaire is in Annex D. Considering tactical delays, some cost areas were particularly difficult for AOs to attribute marginal costs of delays to, for example regarding airport charges, where any effects of landing or departing at a different time from the planned time, or excess parking fees, were not differentiated on invoices from airport authorities (although this Study has costed these fully, as described in Section 2.3.2.3.6).
Evaluating the true cost to airlines of one minute of airborne or ground delay
Transport Studies Group 7 University of Westminster
Interviews with handling agents were also based on a questionnaire, which sought to collect data regarding penalties imposed for the late (not extended) handling of aircraft (as detailed in Section 2.3.2.3.5). Respondents from these two groups (AOs and handling agents) were interviewed on a face-to-face basis, while the interviews with other parties were carried out either by telephone or in person and were less formally structured. Strict confidentiality was assured to the airlines and handling agents, which were forthcoming in revealing highly sensitive operational data. 1.4.4 Looking ahead to the calculations of delay costs The detailed calculations of the ground and airborne delay costs based on the collected cost inputs described above, are presented in Section 2. After explaining the context and background of the computations, the calculation framework is described step by step, before the full calculations, and summaries thereof, are presented. Since few tactical costs had been calculated by the AOs as marginal costs of delay, this Study has computed them from first principles.
1.5 Delay, buffers and predictability 1.5.1 Definition of delay Various definitions may be used when considering aeronautical delays. For the purpose of this Study, the default definition adopted is that of the off-block/on-block time of an aircraft relative to the operator’s published schedule. The decision to consider delays relative to published schedule was primarily made because it is by far the easiest to quantify, and is the most commonly adopted metric in the industry. However, in Section 2.7, where network-level ATFM delays are considered, delay is measured relative to the last filed flight plan. 1.5.2 Use of buffers Buffers are commonly used in airline scheduling, both implicitly for on-block time, and usually more explicitly for off-block time. They are used to allow for recovery from delay, by ‘padding’ the schedule. For example, an operator may know that a particular flight often (historically) arrives late on its first outward leg, so the return leg is set at a ‘later’ time to accommodate this (as opposed to extending the outward scheduled arrival time) in order to allow some slack in the timetable. These type of scheduling considerations, which allow for delay recovery between the rotations of aircraft and may be described as ‘turnaround buffers’, are difficult to identify since they are decided during the development of schedules on a case-by-case basis, and are inextricably tied to other scheduling decisions, such as to keep an aircraft at a airport for a given ‘extra’ duration (beyond the typical turnaround time) in order to wait for inbound transfer passengers. Implicit ground buffers are often ignored or poorly modelled in delay models, as Caves and Wu describe (31).

Evaluating the true cost to airlines of one minute of airborne or ground delay
Transport Studies Group 8 University of Westminster
The off-block equivalent to these contingencies are what are more commonly referred to as ‘schedule buffers’, whereby a calculated block-time has added contingencies in the schedule, to allow for the unpredictability of day-to-day off-block delay factors, such as ATFM and weather. Airlines use buffers for two related reasons: • they help to improve the predictability of rotations by allowing for delay recovery • they help to improve punctuality performance vis-à-vis published schedules. The former helps to maintain operational efficiency, while the latter helps to promote market-share, especially with high-yield passengers, where punctuality and schedule very often dominate price in terms of carrier choice. However, these buffers also come at a price. For example, both types of buffer (on-block and off-block) may decrease aircraft utilisation, as the number of rotations which may be accommodated in any given day is reduced. Buffers also attract unit costs for each minute of buffer inserted into the schedule. These implicit costs are often overlooked in delay cost analysis. The schedule buffer also results in another cost, in that it forces the airlines to register higher gate-to-gate times on the computer reservation system (CRS), which in turn may lead to significant revenue loss. Wu and Caves (7) have carried out an interesting investigation into the relationship between the stochastic effects of aircraft turnaround efficiency and schedule punctuality (and therefore, implicitly, revenue). Whilst forming a well-considered basis for modelling the cost implications of turnaround buffers, linear functions were used for calculating aircraft and passenger delay costs, and the latter were based on wage rates: which is not advocated in this Study (see Section 2.3.2.3.7). After the gate-to-gate calculations have been made on the marginal cost of delay at the tactical level, these calculations will be extended to a network reactionary level, and then a strategic consideration of such costs will be made (in Section 2.6) drawing on the material and discussions of these tactical calculations. The strategic calculations will be based on the approach of allocating unit costs to the addition of one minute of buffer into the schedule. 1.5.3 Predictability Whilst this Study sets out to assign costs to airborne and ground delays, it should be remembered that predictability, or rather lack of it, is an underpinning cause of the financial losses suffered as a consequence of delay. If all delays could be predicted with confidence to be exactly 10 minutes, then schedules could be re-adjusted accordingly, and there would subsequently be no tactical ‘delay’ costs as such, apart from the opportunity costs of not using the 10 minutes. Of course, this is not a realistic scenario, but is used to illustrate the superiority of predictability as a measure of delay cost. A full review of ATS performance metrics (including a variety for ‘delay’ and ‘predictability’), which encompasses Eurocontrol measures, has recently been carried out by Boeing (8). An obvious metric for the predictability of delay, is delay variance, which is associated with the issues of delay distribution and disruption. Of equal, and often of greater, importance than the magnitudes or total minutes of delay in a given day, is the timing and distribution of these delays. Consider, for example, a hub-and-spoke network – here it would be better if all aircraft were to arrive and depart with the same (smaller) delay, rather than having just a few arrivals with a very long delay.
Evaluating the true cost to airlines of one minute of airborne or ground delay
Transport Studies Group 9 University of Westminster
In other instances, the opposite may be true. For a positioning flight at the end of the day’s rotations, for example, it may be least financially penalising to the airline to burden this flight with a very high delay, rather than incur several other smaller delays earlier in the day. The same could be true of a long-haul flight (e.g. from Europe to Africa) with no onward connections, which returns the next day: delays to this flight would have far fewer consequences than for many others in the AO’s network. Hansen et al (9) have taken this a step further. They have modelled, for ten US domestic airlines, various performance metrics with cost impacts. Their conclusions “challenge the prevailing assumption that delay prediction is the most important benefit” of AT(F)M enhancements, with ‘irregularity’ and ‘disruption’ factors having the strongest cost impacts. The seven performance metrics modelled by Hansen et al were highly intercorrelated, and for this reason, principal component analysis was used to identify a set of factors which were linear combinations of the original variables (such as delay magnitude). Two output variables were considered: • revenue-passenger miles; • “other” (this incorporated freight-tonne miles, mail-tonne miles and other miscellaneous
outputs). Although the paper models robust mathematical relationships from the observed co-variation between performance variables and (operating) cost, no market research is incorporated to understand the mechanisms involved in stakeholder decision-making. This, as the authors point out, on one hand entails a minimum number of assumptions but, on the other hand, will fail to reveal decision-based drivers. Nevertheless, the authors conclude that if forced to choose a single metric to track the cost-driving dimensions “irregularity” and “disruption”, it would be flight cancellation, rather than average delay per flight. In terms of investment in AT(F)M enhancement, therefore, Hansen et al conclude that measures preventing the serious disruptions which lead to cancellations would be better than those leading to incremental delay reductions. Wu and Caves (10) have also carried out an optimisation of schedule reliability for aircraft operations based on schedule and punctuality data from an (undisclosed) European airline. They too comment that whilst the mean delay can be easily produced in analyses, this index is of “little help when an airline is attempting to investigate the potential bottlenecks in aircraft rotations because it only reflects a part of operational characteristics”. They go on to make the valid observation that the (statistically) ‘expected’ delay of aircraft rotation has the advantage of considering stochastic effects from delay time and the probability of occurrence. Delay distributions, like all other data distributions, may be described by three essential metrics: • location of the distribution (such as measures of central tendency, e.g. the average) • dispersion (measures of variability or predictability, e.g. the variance) • shape (e.g. skewness, area of the tail or proportion of delays > x mins)
Evaluating the true cost to airlines of one minute of airborne or ground delay
Transport Studies Group 10 University of Westminster
This Study concurs with a number of other researchers that the average is a poor metric when used alone, and that the variance is an important complementary metric, of both air transport system performance in general, and also AT(F)M in particular. Whilst the average delay could decrease from one period to another, the variance (extremes) of delays might increase, and the latter is of great operational significance to the planning departments of the AOs. Clearly, the appropriate raw delay data need to be input into each calculation: • when producing metrics (e.g. variances) for measuring ‘air transport system’
performance, total departure delays and arrival delays need to be used; • when measuring AT(F)M performance, raw AT(F)M delay data need to be used. The first, more general measure, is of more use to the ultimate customer of the air transport system – the passenger. The second, based on AT(F)M data, is of particular interest to the service providers and the AOs. Ideally, both measures should be considered together, such that AT(F)M contributions to total delays may be better understood in their context. As was mentioned in Section 1.2, only 26% of delays in 2002 were attributed to ATFM, as reported by the Performance Review Commission. There is also a clear need to have an increasing focus in the industry on arrival delay, which is of paramount importance to the passenger. It would also be useful model the specific connection between departure delay, and arrival delay, i.e. to understand the functional relationship between the two. Such data currently appear to be missing, and remedying this deficiency forms one of the recommendations in Section 3.3. Future consideration also needs to be paid to the level at which such delay metrics are reported, in view of the target audience of such data. AOs would certainly not find the reporting of average delays at the European level very valuable, whereas the variance of delays at the city-pair level would be far more useful in terms of planning future schedules, particularly if disaggregated also by time of day and direction, with statements such as “80% of weekday morning peak delays LHR – FRA fell within the range of 5-35 minutes”. Developing such metrics is clearly a prime target for future research, and should be conducted in close coordination with a study of user-needs for such outputs.
• Predictability of delay (especially at the city-pair level) is an important complementary metric to average delay
• More attention needs to be paid to the connection between departure & arrival delay
• There is evidence to suggest that cancellations of flights should receive greater emphasis when reporting ‘delays’, and calculating their associated costs
Unpredictability and examples of the associated costs at the strategic level of schedule planning, are discussed in Section 2.6.4.
Evaluating the true cost to airlines of one minute of airborne or ground delay
Transport Studies Group 11 University of Westminster
2 Calculations and results
2.1 Introduction to calculations and results In this Section the cost of delay calculations, and their results, are presented. These calculations, based on information gained from the interviews that were carried out with the selected airlines, handling agents and aircraft operating lessors, with supporting data from the literature review and various direct sources, are presented in full after the calculation framework has first been explained. Costs of delay are calculated at the tactical and strategic levels for different aircraft types and different cost scenarios, then at the higher, European network level. Section 2.3 gives an overview of this structure, then fully defines the key concepts involved.
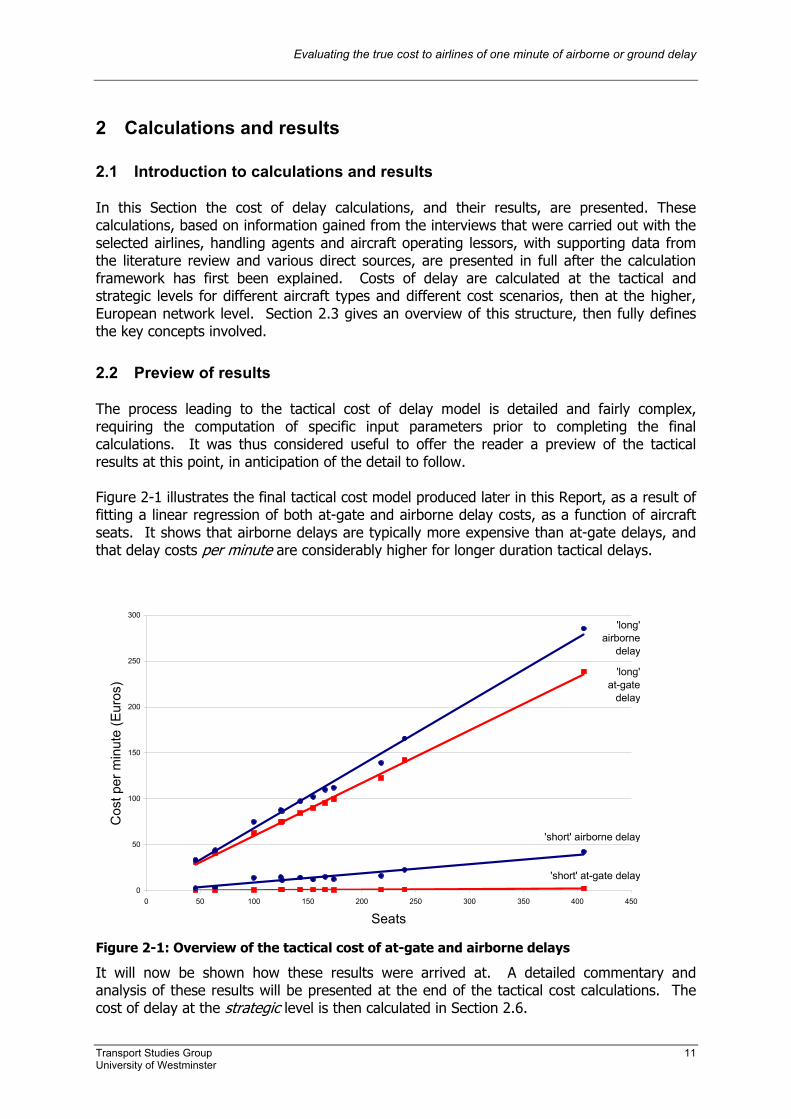
2.2 Preview of results The process leading to the tactical cost of delay model is detailed and fairly complex, requiring the computation of specific input parameters prior to completing the final calculations. It was thus considered useful to offer the reader a preview of the tactical results at this point, in anticipation of the detail to follow. Figure 2-1 illustrates the final tactical cost model produced later in this Report, as a result of fitting a linear regression of both at-gate and airborne delay costs, as a function of aircraft seats. It shows that airborne delays are typically more expensive than at-gate delays, and that delay costs per minute are considerably higher for longer duration tactical delays.
Figure 2-1: Overview of the tactical cost of at-gate and airborne delays
It will now be shown how these results were arrived at. A detailed commentary and analysis of these results will be presented at the end of the tactical cost calculations. The cost of delay at the strategic level is then calculated in Section 2.6.
0
50
100
150
200
250
300
0 50 100 150 200 250 300 350 400 450
Seats
Cos
t per
min
ute
(Eur
os)
'long' airborne
delay
'long' at-gate
delay
'short' at-gate delay
'short' airborne delay
Evaluating the true cost to airlines of one minute of airborne or ground delay
Transport Studies Group 12 University of Westminster
2.3 Calculating the costs of delay
The calculation framework
Introducing a hierarchy of delay levels Section 2.3.1.1
Further exploring the hierarchy of delay levels Section 2.3.1.2
Using ‘long’ and ‘short’ delay types Section 2.3.1.3
Assigning low, base and high cost scenarios Section 2.3.1.4
Index table of tactical calculations Table 2-6
Calculations in full
Introducing the gate-to-gate calculation template table Section 2.3.2.1
Gate-to-gate elements with zero cost assigned: • Case where costs of delay are (approximately) zero (En-route and
approach ATC charges • Cases where no delays / costs have been assumed in the model • General cases where tactical costs cannot be assigned at gate-to-gate
level only • Depreciation, rentals and leases of flight equipment
Section 2.3.2.2
Calculating specific cost elements: • Calculating block-hour direct operating costs (BHDOCs) • Fuel burn costs • Maintenance costs • Flight and cabin crew salaries and expenses • Depreciation, rentals and leases of flight equipment • Handling agent penalties • Airport charges • Costs of passenger delay to airlines
Section 2.3.2.3
Full tactical cost calculation results tables (1-72) Annex J
Summary of tactical, gate-to-gate cost of delay calculations Section 2.4
Estimate and assessment of network reactionary costs
Extending gate-to-gate calculations to network reactionary level Focus on airborne and ground delay trade-offs Summary of tactical costs of delay at network reactionary level
Section 2.5
Estimate of strategic costs of delay
Introduction to strategic cost calculations • Strategic fuel costs • Strategic maintenance costs • Strategic crew costs • Strategic DRL costs Results of strategic cost of delay calculations Comparison of strategic and tactical costs per minute
Section 2.6
Higher-level calculations
European-level costs of delay Section 2.7
Evaluating the true cost to airlines of one minute of airborne or ground delay
Transport Studies Group 13 University of Westminster
2.3.1 The calculation framework Two of the principal remits of this Study, introduced in Section 1.1, were:
• to establish transparent reference values, which are operationally meaningful, for the costs incurred by airlines as a result of airborne and ground delays;
• to calculate higher-level statistics (e.g. total European-level costs of delay)
Firstly, the next sections delineate the important differences between strategic and tactical delay, and introduce the concept of ‘network reactionary costs’. The basis of the calculations of this Study is then described in terms of the use of ‘long’ and ‘short’ delay types, and the use of different cost scenarios. Then, as a foundation for the delay cost computations, detailed calculations of tactical delay costs are made at the ‘gate-to-gate’ level. A full explanation will be given, step by step, of how the calculation framework was developed for these computations. This begins by explaining the principles involved in the calculations, leading to the construction of the calculation template table (Table 2-7) which is used as the template for all the calculation tables in Annex J (the core of the research computations). After the detailed gate-to-gate calculations have been made, these are then extended to estimate network reactionary costs, in Section 2.5. After that, strategic costs are considered in Section 2.6, drawing on the material and discussions of the tactical calculations at the gate-to-gate and network reactionary levels. 2.3.1.1 Introducing a hierarchy of delay levels Delay costs are often considered only at the tactical level, where they are encountered, and measured against planned activities. However, as was mentioned in Section 1.5.2, delay has to be anticipated by airlines at the planning stage, when developing schedules which can absorb the unpredictability of day-to-day operations. Airlines do this by adding buffers into their schedules, for example. The number of buffer minutes added to the schedule is a matter of compromise. In theory, minutes of strategic buffer should be added to the airline schedule up to the point at which the cost of doing this equals the expected cost of the tactical delays they are designed to absorb, possibly with some extra margin for uncertainty. This is discussed in detail in Section 2.6.4.1. This Section will revisit some cost themes explored in the introductory sections of this Report, but with the specific objective of resolving these into particular tactical and strategic cost of delay categories.
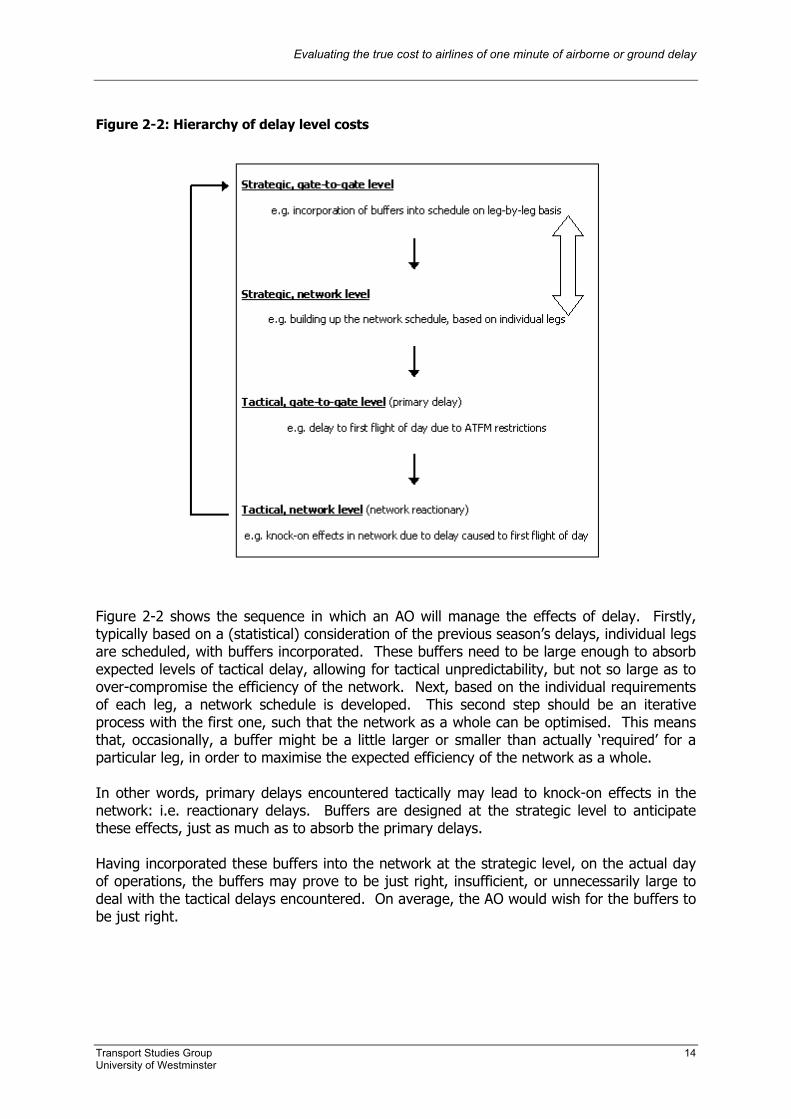
Evaluating the true cost to airlines of one minute of airborne or ground delay
Transport Studies Group 14 University of Westminster
Figure 2-2: Hierarchy of delay level costs
Figure 2-2 shows the sequence in which an AO will manage the effects of delay. Firstly, typically based on a (statistical) consideration of the previous season’s delays, individual legs are scheduled, with buffers incorporated. These buffers need to be large enough to absorb expected levels of tactical delay, allowing for tactical unpredictability, but not so large as to over-compromise the efficiency of the network. Next, based on the individual requirements of each leg, a network schedule is developed. This second step should be an iterative process with the first one, such that the network as a whole can be optimised. This means that, occasionally, a buffer might be a little larger or smaller than actually ‘required’ for a particular leg, in order to maximise the expected efficiency of the network as a whole. In other words, primary delays encountered tactically may lead to knock-on effects in the network: i.e. reactionary delays. Buffers are designed at the strategic level to anticipate these effects, just as much as to absorb the primary delays. Having incorporated these buffers into the network at the strategic level, on the actual day of operations, the buffers may prove to be just right, insufficient, or unnecessarily large to deal with the tactical delays encountered. On average, the AO would wish for the buffers to be just right.
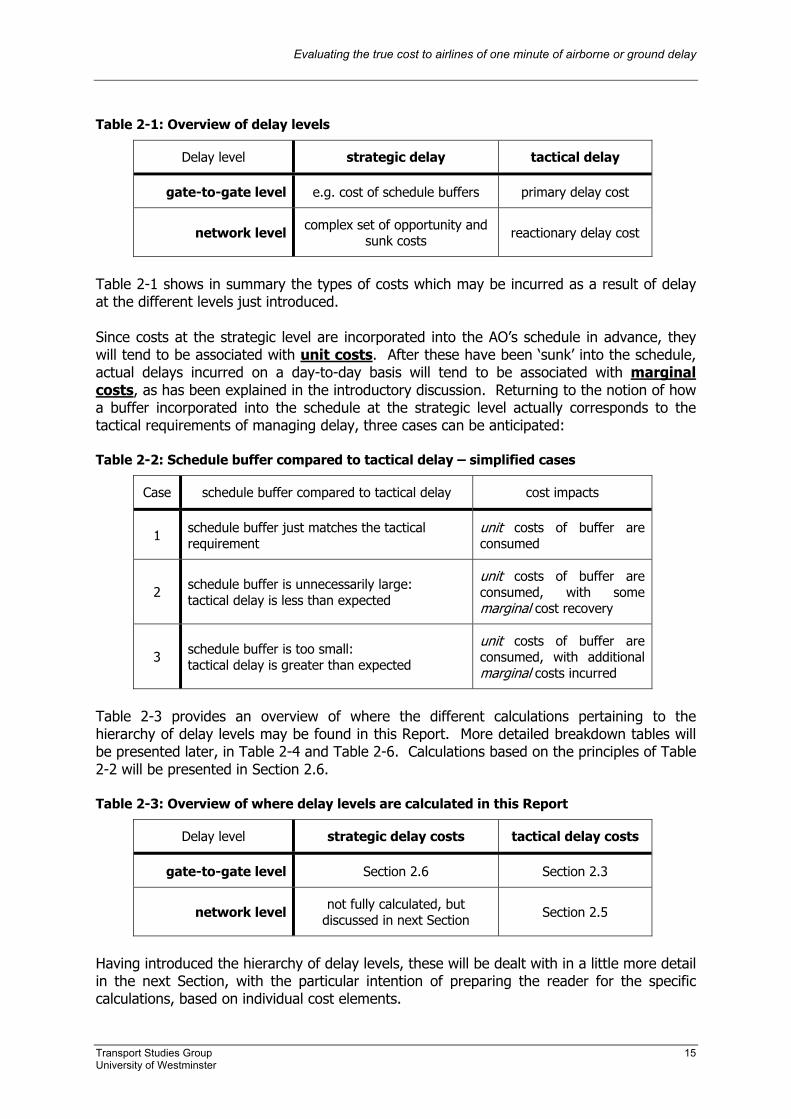
Evaluating the true cost to airlines of one minute of airborne or ground delay
Transport Studies Group 15 University of Westminster
Table 2-1: Overview of delay levels
Delay level strategic delay tactical delay
gate-to-gate level e.g. cost of schedule buffers primary delay cost
network level complex set of opportunity and sunk costs reactionary delay cost
Table 2-1 shows in summary the types of costs which may be incurred as a result of delay at the different levels just introduced. Since costs at the strategic level are incorporated into the AO’s schedule in advance, they will tend to be associated with unit costs. After these have been ‘sunk’ into the schedule, actual delays incurred on a day-to-day basis will tend to be associated with marginal costs, as has been explained in the introductory discussion. Returning to the notion of how a buffer incorporated into the schedule at the strategic level actually corresponds to the tactical requirements of managing delay, three cases can be anticipated: Table 2-2: Schedule buffer compared to tactical delay – simplified cases
Case schedule buffer compared to tactical delay cost impacts
1 schedule buffer just matches the tactical requirement
unit costs of buffer are consumed
2 schedule buffer is unnecessarily large: tactical delay is less than expected
unit costs of buffer are consumed, with some marginal cost recovery
3 schedule buffer is too small: tactical delay is greater than expected
unit costs of buffer are consumed, with additional marginal costs incurred
Table 2-3 provides an overview of where the different calculations pertaining to the hierarchy of delay levels may be found in this Report. More detailed breakdown tables will be presented later, in Table 2-4 and Table 2-6. Calculations based on the principles of Table 2-2 will be presented in Section 2.6. Table 2-3: Overview of where delay levels are calculated in this Report
Delay level strategic delay costs tactical delay costs
gate-to-gate level Section 2.6 Section 2.3
network level not fully calculated, but discussed in next Section Section 2.5
Having introduced the hierarchy of delay levels, these will be dealt with in a little more detail in the next Section, with the particular intention of preparing the reader for the specific calculations, based on individual cost elements.
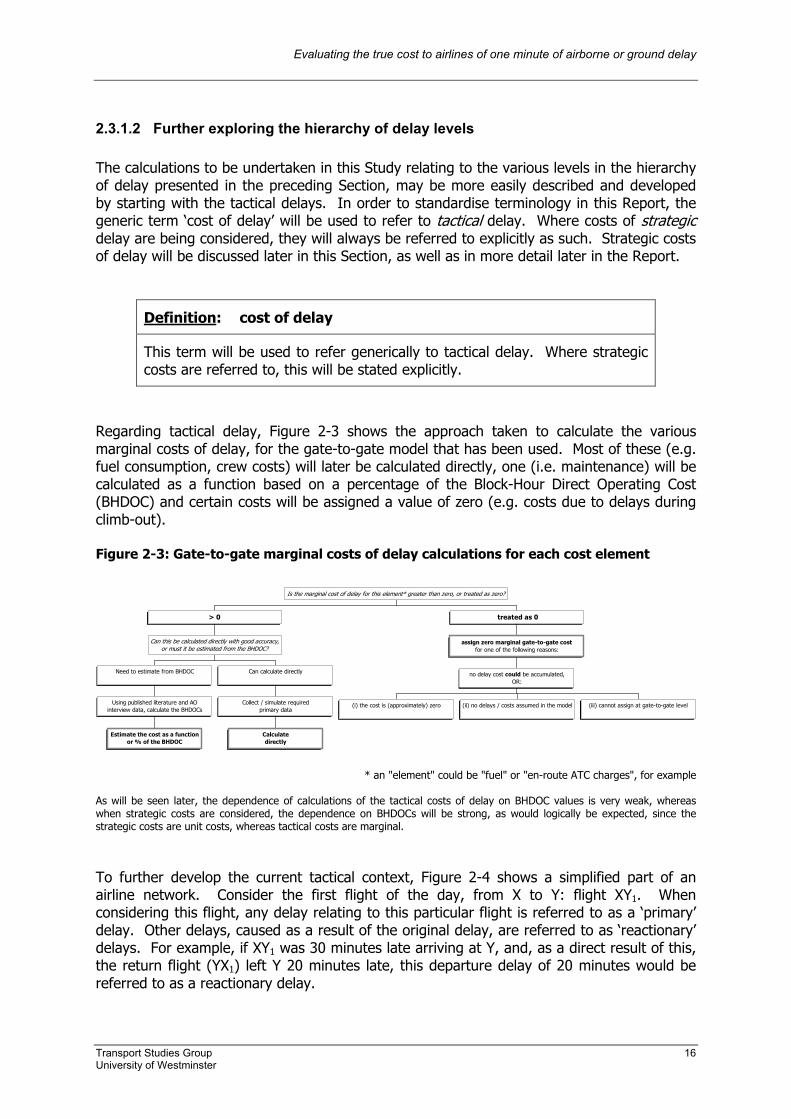
Evaluating the true cost to airlines of one minute of airborne or ground delay
Transport Studies Group 16 University of Westminster
2.3.1.2 Further exploring the hierarchy of delay levels The calculations to be undertaken in this Study relating to the various levels in the hierarchy of delay presented in the preceding Section, may be more easily described and developed by starting with the tactical delays. In order to standardise terminology in this Report, the generic term ‘cost of delay’ will be used to refer to tactical delay. Where costs of strategic delay are being considered, they will always be referred to explicitly as such. Strategic costs of delay will be discussed later in this Section, as well as in more detail later in the Report.
Definition: cost of delay
This term will be used to refer generically to tactical delay. Where strategic costs are referred to, this will be stated explicitly.
Regarding tactical delay, Figure 2-3 shows the approach taken to calculate the various marginal costs of delay, for the gate-to-gate model that has been used. Most of these (e.g. fuel consumption, crew costs) will later be calculated directly, one (i.e. maintenance) will be calculated as a function based on a percentage of the Block-Hour Direct Operating Cost (BHDOC) and certain costs will be assigned a value of zero (e.g. costs due to delays during climb-out). Figure 2-3: Gate-to-gate marginal costs of delay calculations for each cost element
Estimate the cost as a functionor % of the BHDOC
Using published literature and AOinterview data, calculate the BHDOCs
Need to estimate from BHDOC
Calculatedirectly
Collect / simulate requiredprimary data
Can calculate directly
Can this be calculated directly with good accuracy,or must it be estimated from the BHDOC?
> 0
(i) the cost is (approximately) zero (ii) no delays / costs assumed in the model (iii) cannot assign at gate-to-gate level
no delay cost could be accumulated,OR:
assign zero marginal gate-to-gate costfor one of the following reasons:
treated as 0
Is the marginal cost of delay for this element* greater than zero, or treated as zero?
* an "element" could be "fuel" or "en-route ATC charges", for example
As will be seen later, the dependence of calculations of the tactical costs of delay on BHDOC values is very weak, whereas when strategic costs are considered, the dependence on BHDOCs will be strong, as would logically be expected, since the strategic costs are unit costs, whereas tactical costs are marginal.
To further develop the current tactical context, Figure 2-4 shows a simplified part of an airline network. Consider the first flight of the day, from X to Y: flight XY1. When considering this flight, any delay relating to this particular flight is referred to as a ‘primary’ delay. Other delays, caused as a result of the original delay, are referred to as ‘reactionary’ delays. For example, if XY1 was 30 minutes late arriving at Y, and, as a direct result of this, the return flight (YX1) left Y 20 minutes late, this departure delay of 20 minutes would be referred to as a reactionary delay.
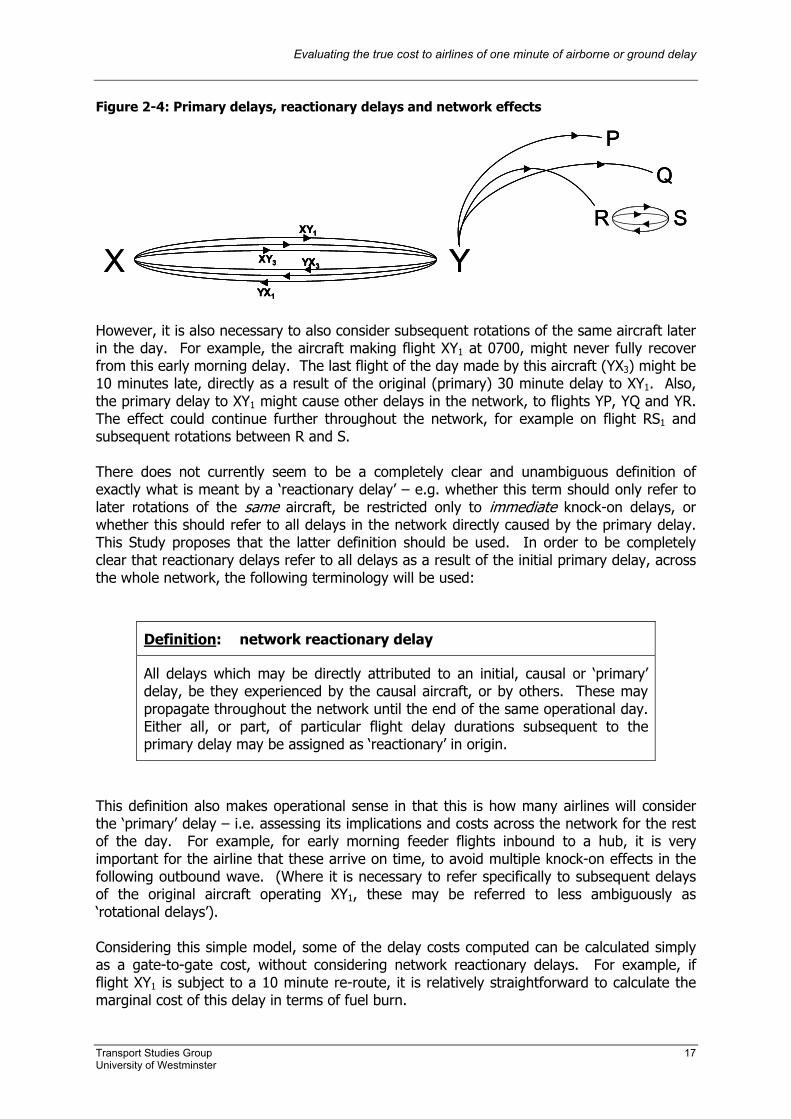
Evaluating the true cost to airlines of one minute of airborne or ground delay
Transport Studies Group 17 University of Westminster
Figure 2-4: Primary delays, reactionary delays and network effects
XYX1
XY1
XY3 YX3 Y
P
Q
R S
XYX1
XY1
XY3 YX3
YX1
XY1
XY3 YX3 Y
P
Q
R S
Y
P
Q
R S
However, it is also necessary to also consider subsequent rotations of the same aircraft later in the day. For example, the aircraft making flight XY1 at 0700, might never fully recover from this early morning delay. The last flight of the day made by this aircraft (YX3) might be 10 minutes late, directly as a result of the original (primary) 30 minute delay to XY1. Also, the primary delay to XY1 might cause other delays in the network, to flights YP, YQ and YR. The effect could continue further throughout the network, for example on flight RS1 and subsequent rotations between R and S. There does not currently seem to be a completely clear and unambiguous definition of exactly what is meant by a ‘reactionary delay’ – e.g. whether this term should only refer to later rotations of the same aircraft, be restricted only to immediate knock-on delays, or whether this should refer to all delays in the network directly caused by the primary delay. This Study proposes that the latter definition should be used. In order to be completely clear that reactionary delays refer to all delays as a result of the initial primary delay, across the whole network, the following terminology will be used:
Definition: network reactionary delay
All delays which may be directly attributed to an initial, causal or ‘primary’ delay, be they experienced by the causal aircraft, or by others. These may propagate throughout the network until the end of the same operational day. Either all, or part, of particular flight delay durations subsequent to the primary delay may be assigned as ‘reactionary’ in origin.
This definition also makes operational sense in that this is how many airlines will consider the ‘primary’ delay – i.e. assessing its implications and costs across the network for the rest of the day. For example, for early morning feeder flights inbound to a hub, it is very important for the airline that these arrive on time, to avoid multiple knock-on effects in the following outbound wave. (Where it is necessary to refer specifically to subsequent delays of the original aircraft operating XY1, these may be referred to less ambiguously as ‘rotational delays’). Considering this simple model, some of the delay costs computed can be calculated simply as a gate-to-gate cost, without considering network reactionary delays. For example, if flight XY1 is subject to a 10 minute re-route, it is relatively straightforward to calculate the marginal cost of this delay in terms of fuel burn.
Evaluating the true cost to airlines of one minute of airborne or ground delay
Transport Studies Group 18 University of Westminster
For the model used in this Study, fuel burn is considered as a gate-to-gate marginal cost, because the fuel burn of flight XY is independent of the fuel burn YX or YR
For some other delay cost elements, it is possible to make a reasonable estimate of the marginal cost of the delay at the gate-to-gate level (e.g. for extra cabin crew hours), although a more accurate estimate could be made by taking into full consideration the knock-on effect in the network of having brought in an extra crew shift - as the airline will attempt to make use of any additional hours available from the extra shift. (This is a simplified summary - crew shifts are discussed fully in Section 2.3.2.3.4). For certain cost elements, however, it only makes sense to calculate the marginal cost of delay as part of a network-level calculation, i.e. based at least on an assessment of network reactionary delays. A good example of this is the passenger cost. Many passengers will be making connecting flights, so the marginal cost of delay cannot be considered for these passengers as finishing when they arrive (late) at Y. Several passengers may be continuing to R, or S, as their final destination, for example.
Passenger costs cannot be considered simply as gate-to-gate marginal costs, because delays for flights YX or YR are not independent of XY
As discussed earlier, expectations of these delays are incorporated into the AO’s schedule when the next season’s timetable is being developed. Legs which suffer from particularly high levels of delays, and/or cause particularly high levels of disruption due to knock-on effects, will have extra contingencies built into them at the strategic level to better cope with such delays in the future. Some of these contingencies, such as schedule buffers added to a given leg, may be quite readily costed at the gate-to-gate level, based on assumptions of unit cost allocations made at the strategic level. Such calculations, based on a development of Table 2-2, will form the basis of Section 2.6. Other such contingencies, adopted at the strategic level, may be less readily assigned to the gate-to-gate level. They include, for example, general staffing levels (e.g. contingency staff at airports) and spare aircraft, and are difficult to assign to any given rotation. Although these costs are ‘hidden’, in the sense that airlines do not have a line in their accounts which shows the associated costs of all of these contingencies. They are nonetheless real costs which represent the opportunity of being able to use such resources in another way, or to save money by not having them. One way to partially calculate the opportunity costs at the network level is to assign a ‘value’ (e.g. through profit estimates) to flights, and calculate how many extra rotations may be made as a result of reducing buffers. Such calculations are presented in Annex P, and will be referred to again later, but it should be noted that these are fairly rudimentary estimates only, and incur particular problems when attempting to assign such ‘value’ to flights.
Evaluating the true cost to airlines of one minute of airborne or ground delay
Transport Studies Group 19 University of Westminster
However, these network level, strategic costs can only be properly revealed by re-optimising the whole network, under broader assumptions of reduced delays: i.e. not only by considering buffers, although buffer reduction would be a critical component of such estimates. For example, if buffers were reduced to a certain new, theoretical (but non-zero) level, it would be possible for an airline to re-optimise the network based on higher utilisation of aircraft, which would also affect general staffing levels (e.g. contingency staff at airports) and spare aircraft requirements, alike. This would be a very complex calculation to perform with rigour, and dependencies between different airline networks (particularly those involved in code-sharing and within alliances) would also have to be considered in order to arrive at a truly accurate value. A consideration of the strategic costs of delay at the gate-to-gate level is at least somewhat more straightforward, in that it is, by definition, more limited in scope. This Study will later make an estimate of these costs, by calculating the cost of adding an extra minute into the schedule, i.e. as schedule buffer adopted at the strategic level.
Definition: strategic delay costs
Costs which are fixed into the operational design of the network at the strategic level, based on contingencies for dealing with delays at the tactical level. Such contingencies (e.g. schedule buffers) represent an opportunity cost for the airline, as, if delays were known in advance to be reduced, these resources could be put to better use, or dispensed with to save capital.
Returning now to the broader context of delay, the purpose of the current discussion is to identify which costs can be meaningfully calculated at the tactical gate-to-gate level, and which need to be assessed in the wider context of the network: either at the level of network reactionary delays and/or at the strategic level. Table 2-4 shows the cost elements presented in the introduction to this Report (Table 1-1), and indicates how each cost element may be treated. It is clear that costs defined as “direct variable” are the group which may be calculated at the tactical gate-to-gate level (as would logically be expected). The partial exception to this is passenger delay and compensation costs, incurred by AOs, which are better treated at the ‘passenger trip’ level, i.e. network reactionary level, although they can then be allocated back as an averaged gate-to-gate cost (see Section 2.3.2.3.7). Costs defined as “direct fixed” need to be calculated at the strategic level. They may be considered as “fixed” into the structure of the existing network, and “fixed” on the basis of plans and contingencies made in advance to deal with delays – costs which are not readily escapable. Indirect operating costs are similarly bound into the network at the strategic level. Neither direct fixed costs, nor indirect costs are estimated in the calculations at the (tactical) gate-to-gate level. Under ‘operating revenue’, the calculations of this Study have included “sales revenues: AO own effort & 3rd-party”, since these are intimately bound up with the issues of passenger delay: e.g. loss of future revenue due to delay, and rebooking on other carriers as a result of missed connections (see Section 2.3.2.3.7).
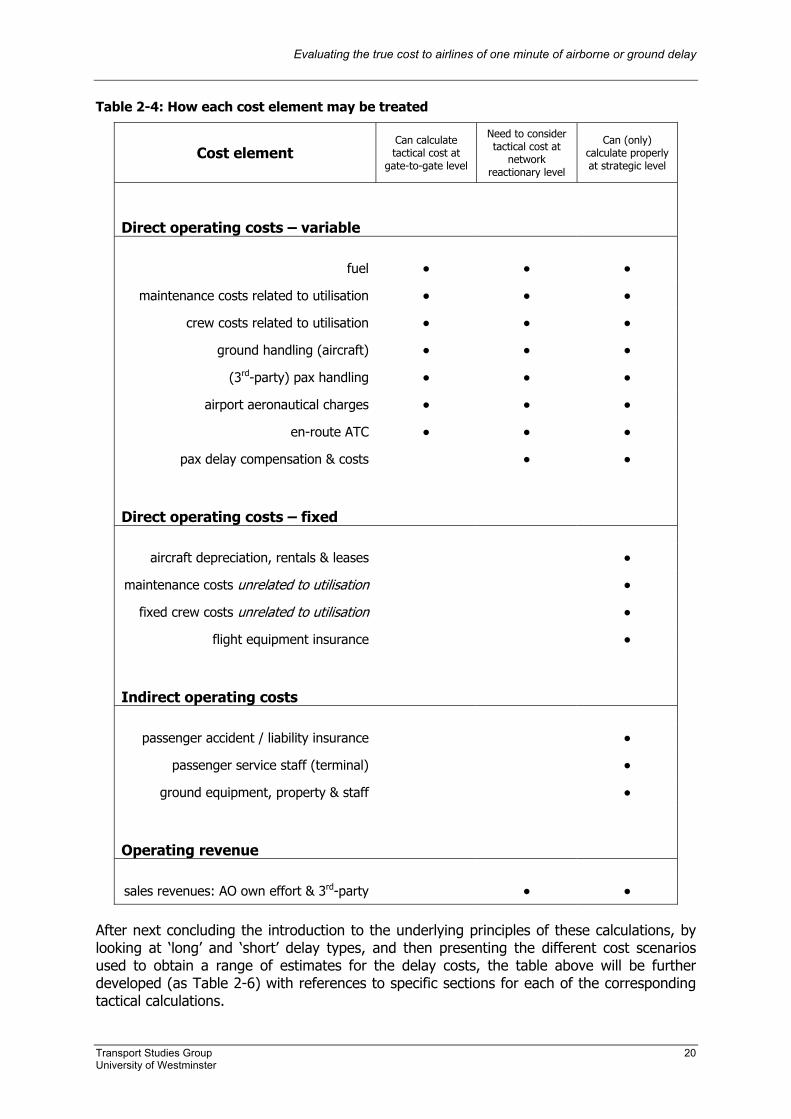
Evaluating the true cost to airlines of one minute of airborne or ground delay
Transport Studies Group 20 University of Westminster
Table 2-4: How each cost element may be treated
Cost element Can calculate tactical cost at
gate-to-gate level
Need to consider tactical cost at
network reactionary level
Can (only) calculate properly at strategic level
Direct operating costs – variable
fuel • • •
maintenance costs related to utilisation • • •
crew costs related to utilisation • • •
ground handling (aircraft) • • •
(3rd-party) pax handling • • •
airport aeronautical charges • • •
en-route ATC • • •
pax delay compensation & costs • •
Direct operating costs – fixed
aircraft depreciation, rentals & leases •
maintenance costs unrelated to utilisation •
fixed crew costs unrelated to utilisation •
flight equipment insurance • Indirect operating costs
passenger accident / liability insurance •
passenger service staff (terminal) •
ground equipment, property & staff • Operating revenue
sales revenues: AO own effort & 3rd-party • •
After next concluding the introduction to the underlying principles of these calculations, by looking at ‘long’ and ‘short’ delay types, and then presenting the different cost scenarios used to obtain a range of estimates for the delay costs, the table above will be further developed (as Table 2-6) with references to specific sections for each of the corresponding tactical calculations.
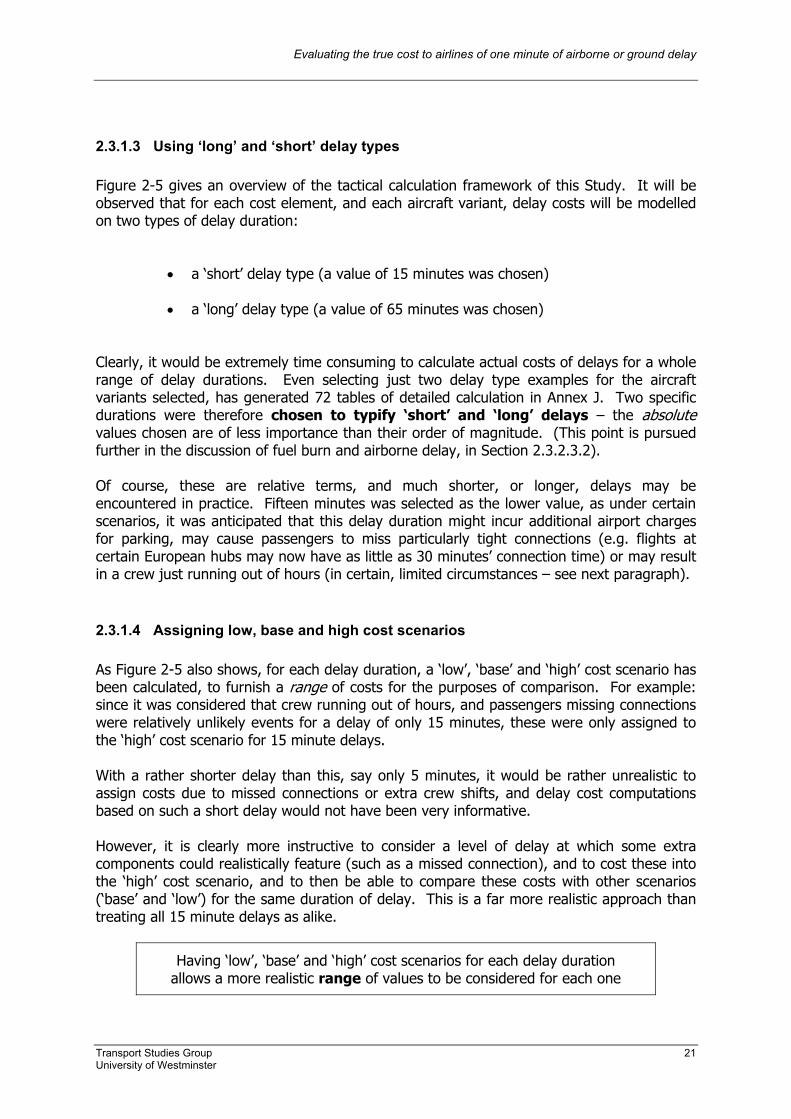
Evaluating the true cost to airlines of one minute of airborne or ground delay
Transport Studies Group 21 University of Westminster
2.3.1.3 Using ‘long’ and ‘short’ delay types Figure 2-5 gives an overview of the tactical calculation framework of this Study. It will be observed that for each cost element, and each aircraft variant, delay costs will be modelled on two types of delay duration:
• a ‘short’ delay type (a value of 15 minutes was chosen)
• a ‘long’ delay type (a value of 65 minutes was chosen) Clearly, it would be extremely time consuming to calculate actual costs of delays for a whole range of delay durations. Even selecting just two delay type examples for the aircraft variants selected, has generated 72 tables of detailed calculation in Annex J. Two specific durations were therefore chosen to typify ‘short’ and ‘long’ delays – the absolute values chosen are of less importance than their order of magnitude. (This point is pursued further in the discussion of fuel burn and airborne delay, in Section 2.3.2.3.2). Of course, these are relative terms, and much shorter, or longer, delays may be encountered in practice. Fifteen minutes was selected as the lower value, as under certain scenarios, it was anticipated that this delay duration might incur additional airport charges for parking, may cause passengers to miss particularly tight connections (e.g. flights at certain European hubs may now have as little as 30 minutes’ connection time) or may result in a crew just running out of hours (in certain, limited circumstances – see next paragraph). 2.3.1.4 Assigning low, base and high cost scenarios As Figure 2-5 also shows, for each delay duration, a ‘low’, ‘base’ and ‘high’ cost scenario has been calculated, to furnish a range of costs for the purposes of comparison. For example: since it was considered that crew running out of hours, and passengers missing connections were relatively unlikely events for a delay of only 15 minutes, these were only assigned to the ‘high’ cost scenario for 15 minute delays. With a rather shorter delay than this, say only 5 minutes, it would be rather unrealistic to assign costs due to missed connections or extra crew shifts, and delay cost computations based on such a short delay would not have been very informative. However, it is clearly more instructive to consider a level of delay at which some extra components could realistically feature (such as a missed connection), and to cost these into the ‘high’ cost scenario, and to then be able to compare these costs with other scenarios (‘base’ and ‘low’) for the same duration of delay. This is a far more realistic approach than treating all 15 minute delays as alike.
Having ‘low’, ‘base’ and ‘high’ cost scenarios for each delay duration allows a more realistic range of values to be considered for each one
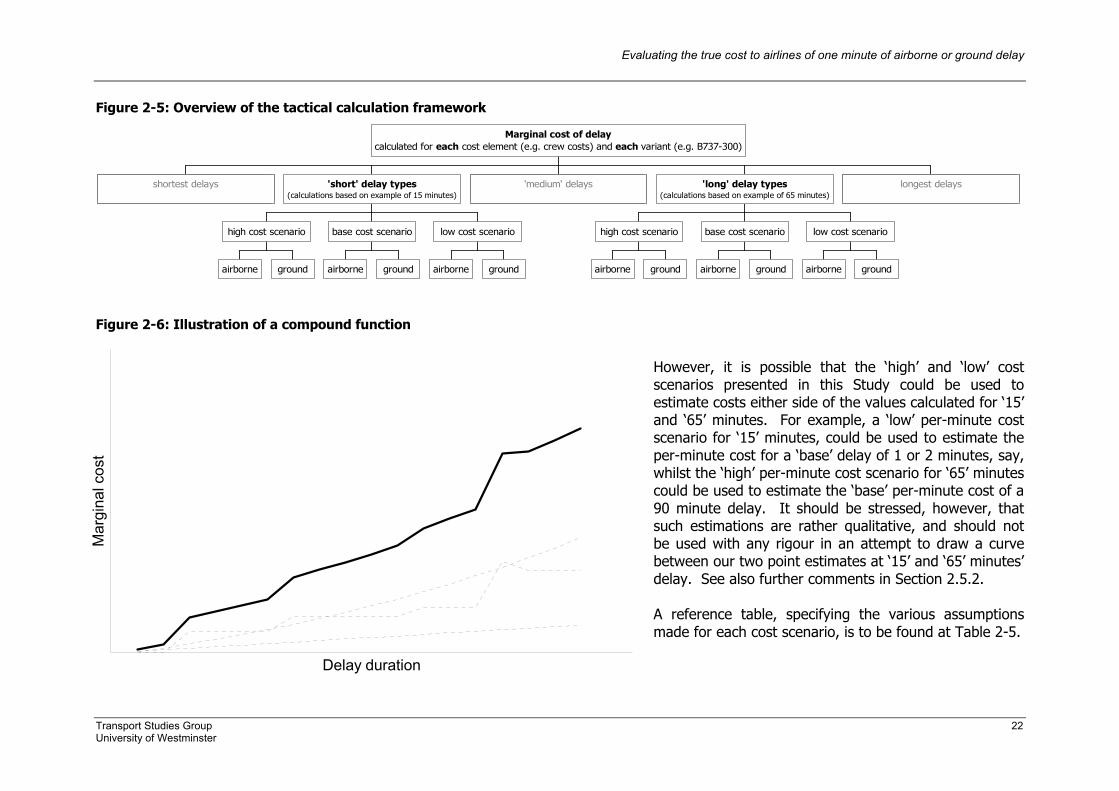
Evaluating the true cost to airlines of one minute of airborne or ground delay
Transport Studies Group 22 University of Westminster
Figure 2-5: Overview of the tactical calculation framework
shortest delays
airborne ground
high cost scenario
airborne ground
base cost scenario
airborne ground
low cost scenario
'short' delay types(calculations based on example of 15 minutes)
'medium' delays
airborne ground
high cost scenario
airborne ground
base cost scenario
airborne ground
low cost scenario
'long' delay types(calculations based on example of 65 minutes)
longest delays
Marginal cost of delaycalculated for each cost element (e.g. crew costs) and each variant (e.g. B737-300)
Figure 2-6: Illustration of a compound function
However, it is possible that the ‘high’ and ‘low’ cost scenarios presented in this Study could be used to estimate costs either side of the values calculated for ‘15’ and ‘65’ minutes. For example, a ‘low’ per-minute cost scenario for ‘15’ minutes, could be used to estimate the per-minute cost for a ‘base’ delay of 1 or 2 minutes, say, whilst the ‘high’ per-minute cost scenario for ‘65’ minutes could be used to estimate the ‘base’ per-minute cost of a 90 minute delay. It should be stressed, however, that such estimations are rather qualitative, and should not be used with any rigour in an attempt to draw a curve between our two point estimates at ‘15’ and ‘65’ minutes’ delay. See also further comments in Section 2.5.2. A reference table, specifying the various assumptions made for each cost scenario, is to be found at Table 2-5.
Delay duration
Mar
gina
l cos
t
Evaluating the true cost to airlines of one minute of airborne or ground delay
Transport Studies Group 23 University of Westminster
The higher level of delay was selected as 65 minutes. This captures similar cost effects as those for 15 minutes’ delay, such as crews running out of shift time. However, a crew out-of-hours situation is rather more likely with a 65 minute delay and has thus been included conservatively even under the ‘base’ cost scenario for a 65 minute delay, and with higher costs still under the ‘high’ cost scenario. Clearly, it is not a foregone conclusion that extra crew costs will be incurred as a result of a 65 minute delay (this is discussed in more detail in Section 2.3.2.3.4), and this is reflected in the ‘low’ cost scenario for a 65 minute delay, which does not include any additional crew costs. Furthermore, at the level of a 65 minute delay, other costs may start to appear for the first time (e.g. handling agent penalties), others may just increase as a result of the flight being more than 1 hour late (e.g. airport charges), whilst others may increase approximately in proportion to the 15 minute delay (e.g. airborne fuel burn). If, for example, a curve were to be drawn illustrating the cost between a 5 minute delay and a 90 minute delay, it would be expected to have an irregular shape, with some underlying costs (such as fuel burn) contributing relatively smoothly, but with others, added to this, appearing and changing only at given intervals, and increasing in steps. Figure 2-6 illustrates how a compound function (solid line) which is the sum of only three other simple functions (the dashed lines: a step-function, a linear relationship and an exponential function) may be a fairly complicated curve. Although these functions are illustrative only, the solid line is actually the true sum of the other three functions shown. Since far more than three cost elements are considered in the model presented in this Study, it is clear that the likely cost curve between 15 and 65 minutes’ delay is likely to be complex and irregular.
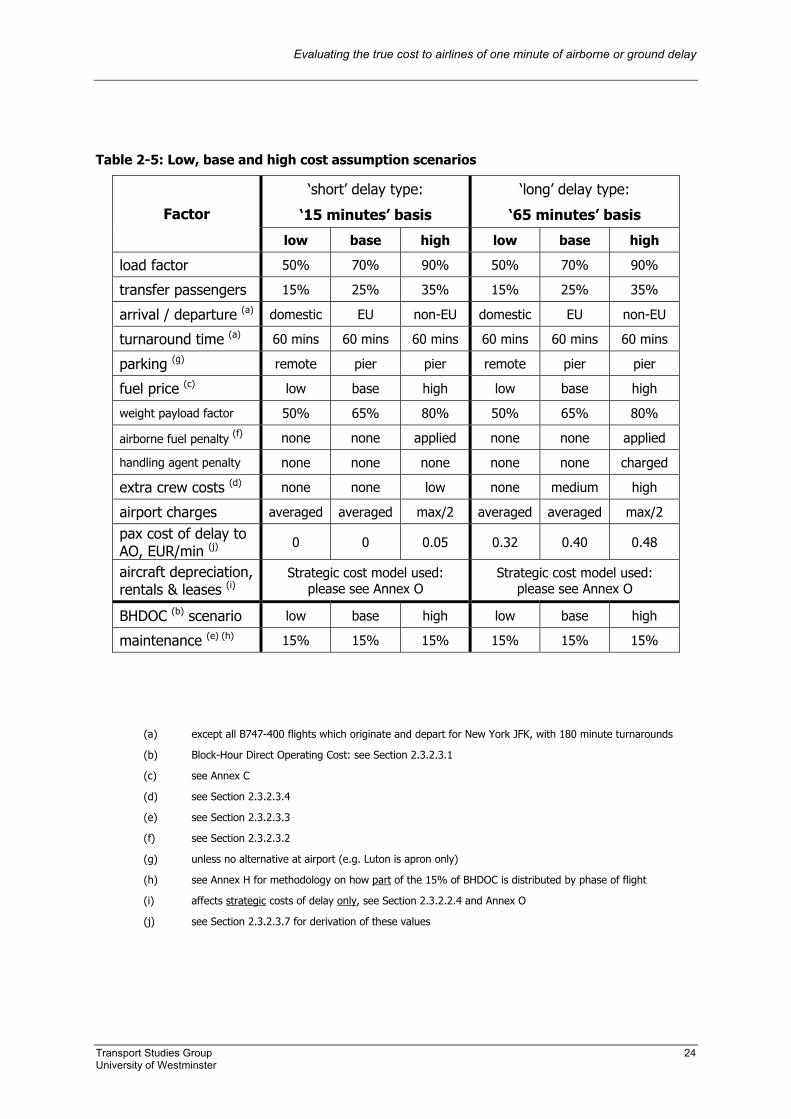
Evaluating the true cost to airlines of one minute of airborne or ground delay
Transport Studies Group 24 University of Westminster
Table 2-5: Low, base and high cost assumption scenarios
‘short’ delay type:
‘15 minutes’ basis
‘long’ delay type:
‘65 minutes’ basis Factor
low base high low base high
load factor 50% 70% 90% 50% 70% 90%
transfer passengers 15% 25% 35% 15% 25% 35%
arrival / departure (a) domestic EU non-EU domestic EU non-EU
turnaround time (a) 60 mins 60 mins 60 mins 60 mins 60 mins 60 mins
parking (g) remote pier pier remote pier pier
fuel price (c) low base high low base high
weight payload factor 50% 65% 80% 50% 65% 80%
airborne fuel penalty (f) none none applied none none applied
handling agent penalty none none none none none charged
extra crew costs (d) none none low none medium high
airport charges averaged averaged max/2 averaged averaged max/2
pax cost of delay to AO, EUR/min (j)
0 0 0.05 0.32 0.40 0.48
aircraft depreciation, rentals & leases (i)
Strategic cost model used: please see Annex O
Strategic cost model used: please see Annex O
BHDOC (b) scenario low base high low base high
maintenance (e) (h) 15% 15% 15% 15% 15% 15%
(a) except all B747-400 flights which originate and depart for New York JFK, with 180 minute turnarounds
(b) Block-Hour Direct Operating Cost: see Section 2.3.2.3.1
(c) see Annex C
(d) see Section 2.3.2.3.4
(e) see Section 2.3.2.3.3
(f) see Section 2.3.2.3.2
(g) unless no alternative at airport (e.g. Luton is apron only)
(h) see Annex H for methodology on how part of the 15% of BHDOC is distributed by phase of flight
(i) affects strategic costs of delay only, see Section 2.3.2.2.4 and Annex O
(j) see Section 2.3.2.3.7 for derivation of these values
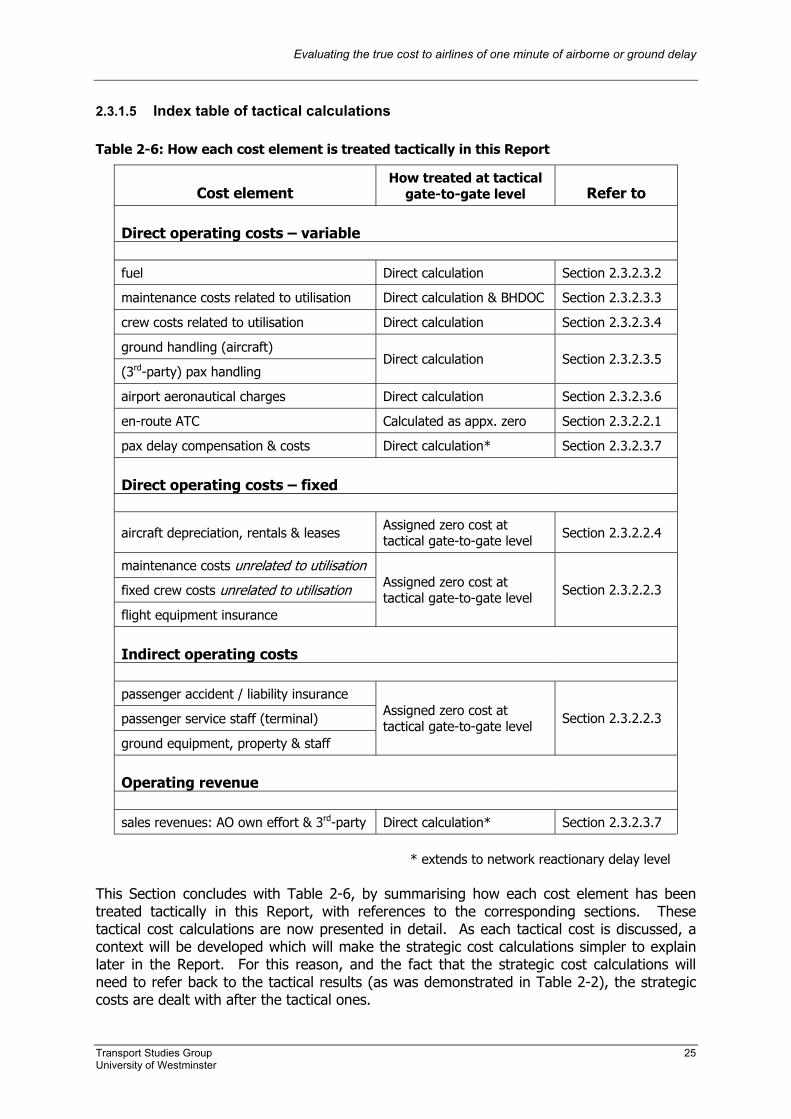
Evaluating the true cost to airlines of one minute of airborne or ground delay
Transport Studies Group 25 University of Westminster
2.3.1.5 Index table of tactical calculations Table 2-6: How each cost element is treated tactically in this Report
Cost element How treated at tactical
gate-to-gate level Refer to Direct operating costs – variable
fuel Direct calculation Section 2.3.2.3.2
maintenance costs related to utilisation Direct calculation & BHDOC Section 2.3.2.3.3
crew costs related to utilisation Direct calculation Section 2.3.2.3.4
ground handling (aircraft)
(3rd-party) pax handling Direct calculation Section 2.3.2.3.5
airport aeronautical charges Direct calculation Section 2.3.2.3.6
en-route ATC Calculated as appx. zero Section 2.3.2.2.1
pax delay compensation & costs Direct calculation* Section 2.3.2.3.7
Direct operating costs – fixed
aircraft depreciation, rentals & leases Assigned zero cost at tactical gate-to-gate level Section 2.3.2.2.4
maintenance costs unrelated to utilisation
fixed crew costs unrelated to utilisation
flight equipment insurance
Assigned zero cost at tactical gate-to-gate level Section 2.3.2.2.3
Indirect operating costs
passenger accident / liability insurance
passenger service staff (terminal)
ground equipment, property & staff
Assigned zero cost at tactical gate-to-gate level Section 2.3.2.2.3
Operating revenue
sales revenues: AO own effort & 3rd-party Direct calculation* Section 2.3.2.3.7
* extends to network reactionary delay level This Section concludes with Table 2-6, by summarising how each cost element has been treated tactically in this Report, with references to the corresponding sections. These tactical cost calculations are now presented in detail. As each tactical cost is discussed, a context will be developed which will make the strategic cost calculations simpler to explain later in the Report. For this reason, and the fact that the strategic cost calculations will need to refer back to the tactical results (as was demonstrated in Table 2-2), the strategic costs are dealt with after the tactical ones.
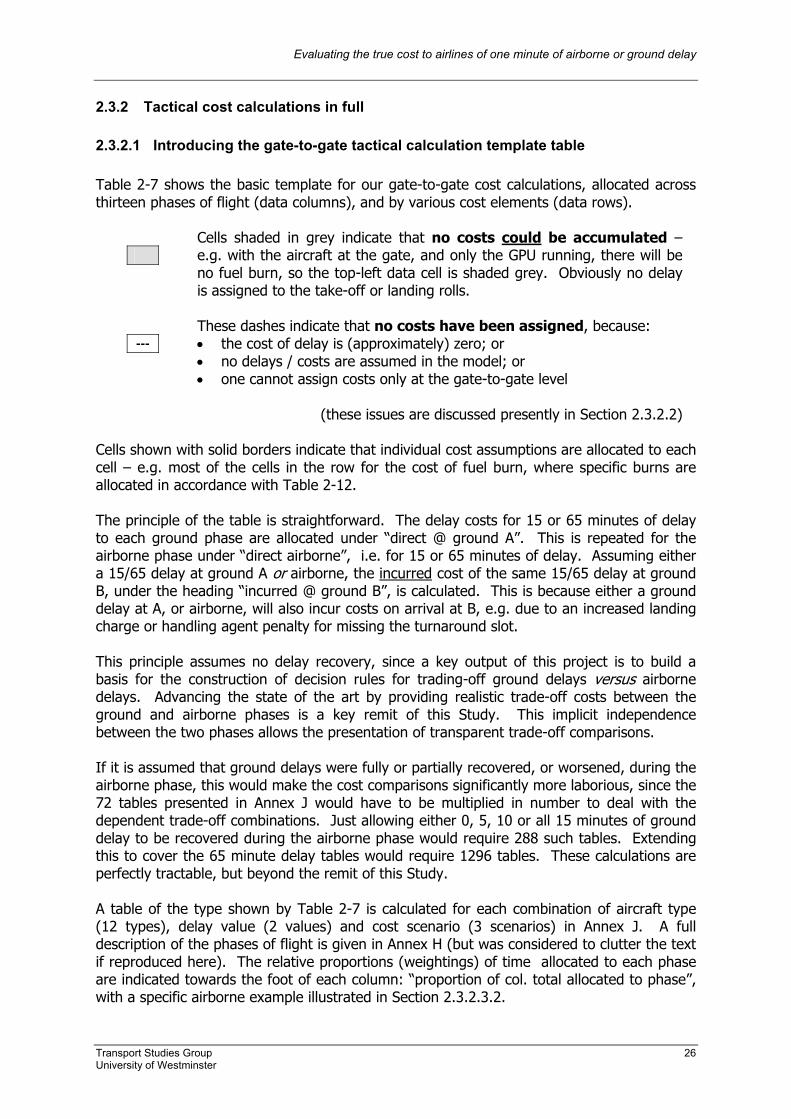
Evaluating the true cost to airlines of one minute of airborne or ground delay
Transport Studies Group 26 University of Westminster
2.3.2 Tactical cost calculations in full 2.3.2.1 Introducing the gate-to-gate tactical calculation template table Table 2-7 shows the basic template for our gate-to-gate cost calculations, allocated across thirteen phases of flight (data columns), and by various cost elements (data rows).
Cells shaded in grey indicate that no costs could be accumulated – e.g. with the aircraft at the gate, and only the GPU running, there will be no fuel burn, so the top-left data cell is shaded grey. Obviously no delay is assigned to the take-off or landing rolls.
---
These dashes indicate that no costs have been assigned, because: • the cost of delay is (approximately) zero; or • no delays / costs are assumed in the model; or • one cannot assign costs only at the gate-to-gate level
(these issues are discussed presently in Section 2.3.2.2) Cells shown with solid borders indicate that individual cost assumptions are allocated to each cell – e.g. most of the cells in the row for the cost of fuel burn, where specific burns are allocated in accordance with Table 2-12. The principle of the table is straightforward. The delay costs for 15 or 65 minutes of delay to each ground phase are allocated under “direct @ ground A”. This is repeated for the airborne phase under “direct airborne”, i.e. for 15 or 65 minutes of delay. Assuming either a 15/65 delay at ground A or airborne, the incurred cost of the same 15/65 delay at ground B, under the heading “incurred @ ground B”, is calculated. This is because either a ground delay at A, or airborne, will also incur costs on arrival at B, e.g. due to an increased landing charge or handling agent penalty for missing the turnaround slot. This principle assumes no delay recovery, since a key output of this project is to build a basis for the construction of decision rules for trading-off ground delays versus airborne delays. Advancing the state of the art by providing realistic trade-off costs between the ground and airborne phases is a key remit of this Study. This implicit independence between the two phases allows the presentation of transparent trade-off comparisons. If it is assumed that ground delays were fully or partially recovered, or worsened, during the airborne phase, this would make the cost comparisons significantly more laborious, since the 72 tables presented in Annex J would have to be multiplied in number to deal with the dependent trade-off combinations. Just allowing either 0, 5, 10 or all 15 minutes of ground delay to be recovered during the airborne phase would require 288 such tables. Extending this to cover the 65 minute delay tables would require 1296 tables. These calculations are perfectly tractable, but beyond the remit of this Study. A table of the type shown by Table 2-7 is calculated for each combination of aircraft type (12 types), delay value (2 values) and cost scenario (3 scenarios) in Annex J. A full description of the phases of flight is given in Annex H (but was considered to clutter the text if reproduced here). The relative proportions (weightings) of time allocated to each phase are indicated towards the foot of each column: “proportion of col. total allocated to phase”, with a specific airborne example illustrated in Section 2.3.2.3.2.
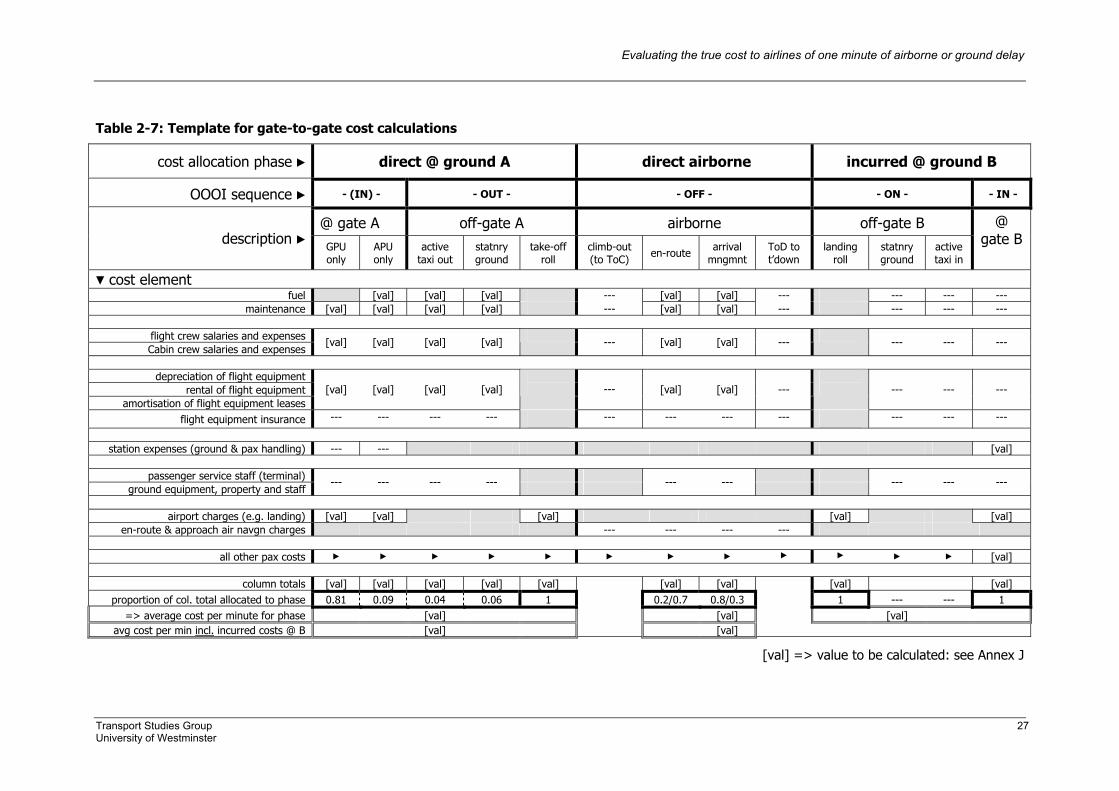
Evaluating the true cost to airlines of one minute of airborne or ground delay
Transport Studies Group 27 University of Westminster
Table 2-7: Template for gate-to-gate cost calculations
cost allocation phase ► direct @ ground A direct airborne incurred @ ground B
OOOI sequence ► - (IN) - - OUT - - OFF - - ON - - IN -
@ gate A off-gate A airborne off-gate B description ►
GPU only
APU only
active taxi out
statnry ground
take-off roll
climb-out (to ToC) en-route arrival
mngmnt ToD to t’down
landing roll
statnry ground
active taxi in
@ gate B
▼ cost element fuel [val] [val] [val] --- [val] [val] --- --- --- ---
maintenance [val] [val] [val] [val] --- [val] [val] --- --- --- ---
flight crew salaries and expenses Cabin crew salaries and expenses
[val] [val] [val] [val] --- [val] [val] --- --- --- ---
depreciation of flight equipment
rental of flight equipment amortisation of flight equipment leases
[val] [val] [val] [val]
--- [val] [val] ---
--- --- ---
flight equipment insurance --- --- --- --- --- --- --- --- --- --- ---
station expenses (ground & pax handling) --- --- [val]
passenger service staff (terminal)
ground equipment, property and staff --- --- --- ---
--- ---
--- --- ---
airport charges (e.g. landing) [val] [val] [val] [val] [val]
en-route & approach air navgn charges --- --- --- ---
all other pax costs ► ► ► ► ► ► ► ► ► ► ► ► [val]
column totals [val] [val] [val] [val] [val] [val] [val] [val] [val] proportion of col. total allocated to phase 0.81 0.09 0.04 0.06 1 0.2/0.7 0.8/0.3 1 --- --- 1
=> average cost per minute for phase [val] [val] [val] avg cost per min incl. incurred costs @ B [val] [val]
[val] => value to be calculated: see Annex J
Evaluating the true cost to airlines of one minute of airborne or ground delay
Transport Studies Group 28 University of Westminster
2.3.2.2 Gate-to-gate elements with zero cost assigned Where zero marginal delay costs have been assigned, this has been for one of the three reasons introduced in the previous Section, i.e:
• the cost of delay is (approximately) zero; or • no delays / costs are assumed in the model; or • one cannot assign costs only at the gate-to-gate level
Each of these is now explained in more detail, each in a separate section. 2.3.2.2.1 Case where costs of delay are (approximately) zero: En-route and approach
ATC charges En-route ATC charges in Europe are based on the product of the Great Circle Distances flown within the national territory (i.e. not the route actually flown) and the square-root of the MTOW. In order for delays to affect these ATC charges, either the national airspace entry and exit (or airport) points have to change, and/or a re-route has to be chosen involving different countries. Even with simulations carried out by Lido, which purposely selected large re-routes through different national airspaces, ATC charges were affected only slightly. The examples (sequences 1 through 4) presented in Annex G are for FRA-GVA, FRA-LHR, FRA-MAD and MUC-HEL, respectively. Calculating the ATC charge differences for each of the four sequences, and expressing these as a percentage of the cheaper fuel cost in each sequence (to express the ATC effect at its greatest), the ATC charge differences still only represent 1.0%, 0.5%, 5.7% and 3.5% of the total fuel costs. The implications of en-route ATC charge changes as a function of delay are therefore ignored. These calculations include approach charges. ICAO categorises “aerodrome air navigation charges” together with “en-route and approach” charges, but for this Study they are included in the “terminal navaid charges” under airport charges, as this is how they are invoiced. 2.3.2.2.2 Cases where no delays / costs have been assumed in the model • Only arrival delays experienced at the destination airport (“B”) as a direct result of
departure delays at Ground “A”, or due to airborne delays, are included in the model. For the sake of simplicity, no additional delays have been assumed at the destination.
• No delay is assigned to the climb-out phases, nor from Top of Descent to touchdown. The selection of STARs and SIDs is mostly a function of the origin and destination of the aircraft, and prevailing weather and runway usage, rather than being influenced by delay conditions per se. Although the climb-out might be stepped, or an aircraft may be descended early to avoid en-route congestion at higher altitudes (sometimes referred to as “tunnelling”) it has been assumed that these marginal effects are fairly negligible. If required, these costs could be computed using a Lido simulation model, but this was not undertaken as part of this Study.
• Since costs incurred in the form of additional handling charges resulting from late push-backs at Gate “A” (the origin airport) are relatively unlikely, these have also been assumed to be zero, particularly as such are already included in the ‘high’ cost scenario for Gate “B”. (See later commentary on handling agent penalties, Section 2.3.2.3.5).
Evaluating the true cost to airlines of one minute of airborne or ground delay
Transport Studies Group 29 University of Westminster
2.3.2.2.3 General cases where tactical costs cannot be assigned at gate-to-gate level only
As was introduced in Section 2.3.1.2, a number of delay costs can only be realistically assigned by considering them at the network level, and as a strategic level cost. This is because they do not vary as a result of tactical delays, and/or that attributing these variations to any particular tactical delay would at best be highly arbitrary. Such costs include fixed, direct operating costs such as maintenance costs unrelated to utilisation and crew costs unrelated to utilisation (including amortisation of crew training costs). Other such costs which need to be considered at the network level, are indirect operating costs such as passenger accident and liability insurance, which do not change tactically as a result of delay. Table 2-4 specifically identified strategic costs which can only be fully assessed as part of a network re-optimisation under the assumption of reduced (or increased) delays, which would allow a computation to be made of these types of cost burden at the network level - for example as a result of operating a more efficient network, with higher utilisation of aircraft. Such a re-optimised network could allow the airline to carry more passengers by getting better utilisation from its aircraft. Carrying more passengers and using aircraft more will inevitably increase the types of cost under consideration in this Section - such as maintenance costs unrelated to utilisation (as the fleet will require more attention in a shorter period of time, increasing general maintenance overheads) and carrying more passengers will increase passenger accident and liability insurance. These additional costs, should, of course, generally be off-set by increased revenues - for airlines operating in profit. The same line of reasoning may be extended to the other costs identified in Table 2-4, which also need to be considered as strategic costs. Consider, for example, the number of “passenger service staff (terminal)” an airline may use (this term is used here to describe such service staff generally in the terminal, not cabin crew or gate staff). A more efficient network (with reduced schedule buffers, for example) would be likely to carry more passengers, thus requiring higher such passenger service staff costs, but, again, with these hopefully off-set by increased revenues. Having re-determined the number of passenger service staff required to serve the re-optimised network, these costs become once again ‘sunk’ or ‘fixed’ into the new network at the strategic level. Of course, a number of these staff would still be (notionally) employed to deal with tactical delay situations, but it becomes again, after a re-optimisation, impractical to subsequently associate specific tactical delays with specific staff at this disaggregate level: few airlines, if any, could in any case identify that X% of all staff hours were as a result of the need to manage delays. (One area where these costs are more transparent is third-party handling agent costs imposed for dealing with delayed passengers – which is discussed in Section 2.3.2.3.5). Concluding our discussion of costs identified in Table 2-4, which need to be calculated as strategic costs, it is to be noted that costs associated with ground equipment, property and staff (including depreciation and amortisation of ground equipment; plus “special projects” – see definitions in annexes D and E) also fall into this category, as assigning these to particular tactical delays would be fairly meaningless.
Evaluating the true cost to airlines of one minute of airborne or ground delay
Transport Studies Group 30 University of Westminster
Equally, flight equipment insurance (which forms only a small proportion of BHDOCs) is underwritten on a flat hull rate, considering operational exposure (e.g. where the aircraft flies to) and past accident records of the operator, without regard to the airborne / ground proportions of operations, such that these costs cannot be realistically attributed to tactical delays, either. To all of these strategic costs, a value of zero has been assigned in the gate-to-gate calculations presented in this Study. As has been commented already, even after a network re-optimisation, such costs would once again be largely ‘sunk’ or ‘fixed’ into the new, optimised network cost and insensitive and/or very difficult to attribute to subsequent tactical delays. Of the costs discussed in this Section, the earlier ones (maintenance costs unrelated to utilisation, crew costs unrelated to utilisation and terminal-based passenger service staff) are probably the larger. Only one carrier interviewed was able to allocate costs “for ground equipment, property and staff” on a sub-fleet basis. This value was approximately 2% of the BHDOC used, and this value was confirmed as a reasonably typical value by reference to ICAO statistics (11). Flight equipment insurance also forms a relatively small proportion of direct operating costs (typically around 1% - 3%: interview data suggesting more often 1% for narrowbodies). So, taking these particular categories combined, a variation of up to 5% of the BHDOC value would be considered. Even if the re-optimised network cost caused a 10% variation in this value, this would still represent something of the order of only up to 0.5% of the BHDOC.
Evaluating the true cost to airlines of one minute of airborne or ground delay
Transport Studies Group 31 University of Westminster
2.3.2.2.4 Depreciation, rentals and leases of flight equipment 2.3.2.2.4.1 Introduction to depreciation, rental and lease cost calculations This cost element is one of the most difficult to calculate, and presents particular questions not only as to how it should be distributed properly between ground and airborne phases, but, more challenging still, between the tactical and strategic levels of flight operations and planning. Such difficulties arise due to: • great variations in the way AOs finance the requisition of aircraft • the complexity, variability and lack of transparency of AO accounting practices • complications in ICAO accounting formats which lead to further lack of transparency Depreciation, rental and lease (DRL) costs also form a high proportion of the operating costs for all types of aircraft, so it is particularly important to correctly assign such strategic and tactical delay costs. To properly present the case for the DRL computations method adopted in this Study, it will first be necessary to briefly look at the various methods available to AOs for financing aircraft, and then at ICAO reporting formats which represent the industry standard, in order to demonstrate why these are not well suited to the objectives of this Study. A methodology will then be presented for overcoming the problems explained: an approach which involves calculating such costs from first principles. The results of these calculations will then be compared with the data obtained from the AOs during the course of the interviews carried out as a part of this Study (see Section 1.4.3), and with the BHDOC values calculated. The objectives of this Section are to: • outline AO financing practice • explain the shortcomings of using ICAO-based accounts data • calculate true depreciation, rental and lease costs – costs which fully reflect AO practice • attribute these costs between the tactical and strategic phases of flight:
critically - how are these costs affected by utilisation? Depreciation, rental and lease costs have been combined in this Report into a common cost category. Some AOs which lease all (or most) of their fleet will have zero (or very low) depreciation costs. Conversely, AOs owning most of their fleet will have relatively low rental costs. Many AOs will have mixed methods of financing aircraft, some owned (with various degrees of debt), others on operating leases. Airlines interviewed for the purposes of this Study fell into various categories. For ease of logical reference, “DRL” will be used in the subsequent text to represent this combined cost category of “depreciation, rentals and leases of flight equipment”.
Definition: DRL
Combined cost category of “depreciation, rentals and leases of flight equipment”. The full cost of fleet financing.

Evaluating the true cost to airlines of one minute of airborne or ground delay
Transport Studies Group 32 University of Westminster
2.3.2.2.4.2 Overview of current aircraft financing practice and aircraft valuation In this Section, aircraft valuation, and the major methods of aircraft financing, will be examined. (A more detailed discussion of aircraft financing is to be found in Annex O). In the context of the calculations of strategic and tactical costs of delay, the key point of interest is how utilisation affects aircraft value and lease rates. First consider the major methods of financing aircraft, which are:
• ownership funded through:
• (straight) debt financing • finance leases • capital markets
• operating leases (also referred to as ‘rentals’, especially if short-term)
A fundamental test for describing the financing arrangement is to consider if the risks and rewards of aircraft ownership reside with the AO, or a third party. Where the AO is the owner of an aircraft (i.e. assuming the risk and reward), this is considered as an asset and is purchased either using cash, some form of financial loan or a finance lease (with a finance lease, for example, the lessee acquires title at the end of the lease), and accounted for on the company’s balance sheet. When the ownership risks and rewards are with a third party, this typically denotes an operating lease. After the events of 11 September 2001, and the subsequent market downturn, a number of factors have changed in the way aircraft are financed. Traditionally, operating leases were used more by airlines which could not access other forms of financing. However, this is no longer the case, as many major carriers are also now finding it more difficult to access other forms of financing. Simultaneously, many operators are trying to reposition a greater proportion of their costs into a form that renders them more readily escapable. Another contributory factor in the increase in number of operating leases has been the decline in lease rates over the last 5 years. This fall in rates has also allowed airlines which had previously been less able, or unable, to acquire new aircraft, to operate latest generation aircraft. Indeed, ‘second tier’ operators, already benefiting from unprecedentedly low lease rates for new aircraft by the end of 2001 (38) actually dominated the operating lease market by mid-2002 (42). Regarding aircraft ownership, the debt term and residual value assumed will depend on AO accounting preferences, the pros and cons of funding using different methods (and according to varying national accounting and taxation laws) and how long the AO plans to keep the aircraft. Aircraft may be used up to near the residual airframe lifetime, for example, then retired and used for parts just before a significant maintenance visit is due. For some older aircraft (nearly) all of the residual value is in fact attributable to the engines (e.g. 727s and DC-10-30s). However, AOs may overstate the values of aircraft, using base values on their balance sheets, instead of market values, since the latter may be considerably lower (e.g. estimated (39) to be 20-30% lower in mid-2003). AO practice may even change from one financial year to another, to suit their requirements (e.g. to improve the appearance of the bottom-line), which makes it very difficult to establish transparent values from AO accounts.

Evaluating the true cost to airlines of one minute of airborne or ground delay
Transport Studies Group 33 University of Westminster
Objectively, however, it is possible to define a list of factors which determine aircraft value: Table 2-8: Factors affecting aircraft value
Factor Comment
aircraft age described by Airclaims in the context of forecasting aircraft residual values (41) as “a proxy for utilisation”
economic cycles
for example: base values of 1992-build B767-300ERs were reported (38) to have fallen from USD 46-54 million before 11 September 2001, to market values of USD 38 million later the same year. During periods when few transactions are taking place, market values are more difficult to estimate
market penetration
market penetration and geographical spread are very important: for example the great popularity of the B737 helps to keep values relatively high
aircraft specification
later builds on an equivalent type tend to have better technology, e.g. higher thrust / MTOW. Family variant and noise compliance are also important
secondary market
potential
now less of an issue for ‘second tier’ operators, benefiting from unprecedentedly low lease rates. Freighter conversion is also important
market supply
aircraft types sold earlier onto the market usually achieve highest re-sale values. Older aircraft tend to be off-loaded first in recession, and thus suffer a higher percentage drop relative to younger types, and have less stable residual values. Order back-logs on variants may also increase value
Unlike vehicle asset valuation in other areas of transport, aircraft values are relatively unaffected by utilisation. This exception in the case of aircraft arises primarily as a result of the stringent requirements imposed on their maintenance and upkeep. Systematic, frequent and highly regulated checks and maintenance activities ensure that aircraft are always in a high condition of serviceability, despite varying utilisation rates. Aircraft valuations will typically assume that the aircraft is in average ‘half-life’ condition (41) (e.g. at the point to be expected, on average, in its heavy maintenance check cycle, and regarding landing gear and engine life, etc) and that all Service Bulletins and Airworthiness Directives have been complied with. Average annual utilisations and sector lengths for the aircraft variant in question are assumed. Cosmetic defects may be present, but these will affect value only to a small extent. An example cited (44) regarding half-life calculations is that if a landing gear costs USD 200 000 to overhaul with a specified time of 20 000 cycles between maintenance facility visits, a value adjustment of USD 10 per cycle either side of the 10 000 cycle mid-point might be applied. Similar calculations may be made for deviations from C and D check requirements. Engines can be more difficult, since modern engines are condition-monitored and not usually governed by a hard time to overhaul (44), although valuation adjustments might still be made relative to ‘expected’ condition, e.g. for a poor EGT margin. Aircraft inspectors typically work through set check-lists and review technical records, with inspections occurring just prior to a sale (or at set intervals during an operating lease, such intervals being basically determined by the relationship between the lessor and the AO). As with any other similar valuation process, appraisers may differ in the valuation arrived at based on the inspector’s report, which themselves may be subject to some variability.
Evaluating the true cost to airlines of one minute of airborne or ground delay
Transport Studies Group 34 University of Westminster
This practice could affect individual aircraft values in a way which is not helpful to the purposes of this Study, in that maintenance value ‘deficits’ (or ‘credits’) may be implicitly mixed up with aircraft value. On average, however, it would be expected that these effects cancel themselves out. Furthermore, the value appraiser must also consider the factors presented in Table 2-8 to arrive at a market value. Market conditions, for example, may completely overshadow corrections made for high or low utilisation. For aircraft with “renowned structural integrity” (such as the MD-80), even the effect of age may be weakening (41) relative to many others in Table 2-8. Although most aircraft hold their values well, and values are relatively predictable in the first 8 – 12 years (38), mostly because they are rarely competing against replacements with better technology that early, events such as 11 September 2001 can have pronounced effects. At any given time, the market value of an aircraft may differ from the (depreciated) book value, which in turn may differ from the base value (the value the aircraft would be expected to earn in the longer-term, e.g. after any cyclical / temporary market effects). In summary so far, market values of aircraft are determined by a number of factors. Utilisation per se contributes relatively little to the determination of this value. AO book values may not represent good estimates of such values, a point which will be developed further within the context of ICAO accounting formats, in the next Section. Having discussed some key issues associated with various forms of ownership, operating leases will next be examined. Here again, 11 September 2001 has had an effect on the market, in that airlines have been able to exert leverage on the lessors to keep rates low, as it is clearly not in the lessors’ long-term advantage to see operators go bankrupt and return aircraft to an increasingly difficult market. Debt terms for lessors are in the region of 10 – 12 years, just long enough to bring the debt repayments sufficiently below the monthly lease rental. Airlines will typically have an operating lease for around 5 – 7 years (42), since it otherwise becomes economically preferable for the carrier to service the debt itself, and lessors usually accrue the greatest tax benefits during the same period, after which the aircraft may be re-financed (35). Leaving to one side the issue of maintenance reserves (which are discussed in Annex O), there are three basic models for determining operating lease rates:
(a) fixed monthly rate, with no rental fee adjustment for utilisation*
(b) mostly fixed monthly rate, plus a variable amount based in utilisation*
(c) rate based very heavily on utilisation*, subject to a certain minimum: ‘power-by-the-hour’ Although the three structures presented above may be a simplification of some of the complicated hybrid contracts which may be agreed, easily the most common approach (variously estimated by lessors interviewed for this Study to be between 80% and 98% of the market, but mostly at the higher end of this range) is (a). Power-by-the-hour terms (c) are relatively rare, offered for example on a temporary basis, towards the very end of a lease, and/or in a very weak market (e.g. they were relatively more popular in the period just after 11 September 2001).
* Utilisation might be based on engine hours (e.g. metered in tenths of hours) or on block-hours or actual flown hours (e.g. taken from the aircraft’s log book).
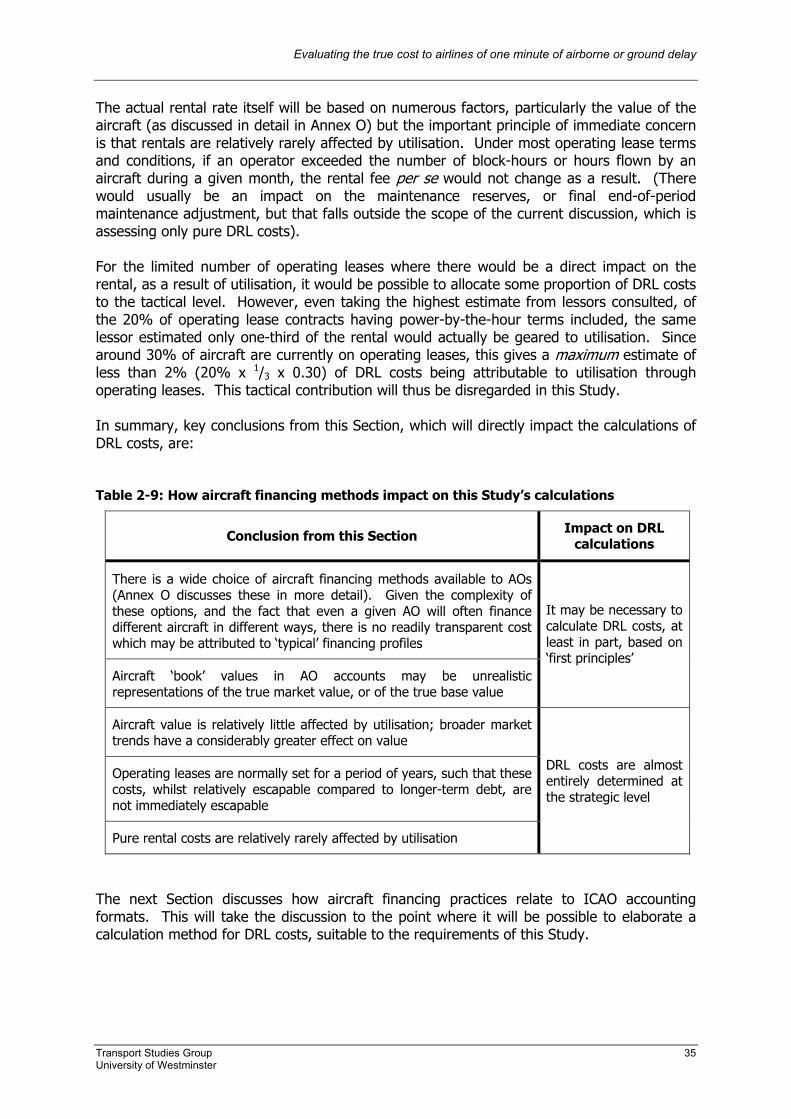
Evaluating the true cost to airlines of one minute of airborne or ground delay
Transport Studies Group 35 University of Westminster
The actual rental rate itself will be based on numerous factors, particularly the value of the aircraft (as discussed in detail in Annex O) but the important principle of immediate concern is that rentals are relatively rarely affected by utilisation. Under most operating lease terms and conditions, if an operator exceeded the number of block-hours or hours flown by an aircraft during a given month, the rental fee per se would not change as a result. (There would usually be an impact on the maintenance reserves, or final end-of-period maintenance adjustment, but that falls outside the scope of the current discussion, which is assessing only pure DRL costs). For the limited number of operating leases where there would be a direct impact on the rental, as a result of utilisation, it would be possible to allocate some proportion of DRL costs to the tactical level. However, even taking the highest estimate from lessors consulted, of the 20% of operating lease contracts having power-by-the-hour terms included, the same lessor estimated only one-third of the rental would actually be geared to utilisation. Since around 30% of aircraft are currently on operating leases, this gives a maximum estimate of less than 2% (20% x 1/3 x 0.30) of DRL costs being attributable to utilisation through operating leases. This tactical contribution will thus be disregarded in this Study. In summary, key conclusions from this Section, which will directly impact the calculations of DRL costs, are: Table 2-9: How aircraft financing methods impact on this Study’s calculations
Conclusion from this Section Impact on DRL calculations
There is a wide choice of aircraft financing methods available to AOs (Annex O discusses these in more detail). Given the complexity of these options, and the fact that even a given AO will often finance different aircraft in different ways, there is no readily transparent cost which may be attributed to ‘typical’ financing profiles
Aircraft ‘book’ values in AO accounts may be unrealistic representations of the true market value, or of the true base value
It may be necessary to calculate DRL costs, at least in part, based on ‘first principles’
Aircraft value is relatively little affected by utilisation; broader market trends have a considerably greater effect on value
Operating leases are normally set for a period of years, such that these costs, whilst relatively escapable compared to longer-term debt, are not immediately escapable
Pure rental costs are relatively rarely affected by utilisation
DRL costs are almost entirely determined at the strategic level
The next Section discusses how aircraft financing practices relate to ICAO accounting formats. This will take the discussion to the point where it will be possible to elaborate a calculation method for DRL costs, suitable to the requirements of this Study.
Evaluating the true cost to airlines of one minute of airborne or ground delay
Transport Studies Group 36 University of Westminster
2.3.2.2.4.3 Current DRL accounting practice With reference to ICAO accounting requirements (see annexes D and E for further details), DRL cost items are recorded as: • “Depreciation of flight equipment”
(applies to “outright” purchases) • “Rental of flight equipment”
(applies to operating and short-term lease agreements) • “Amortisation of capital leases – flight equipment”
(excludes short-term leases) The last category applies to leases for periods considered to be the whole or nearly the whole life of the aircraft, but the interest element paid each year on capital leases is (supposed to be) reported under non-operating revenues and expenses, along with: - “interest on debt”
(includes: “amortization of debt discount … & amortization of premium on debt”) - “capital gain (or loss) on retirement of equipment and other assets” - “payments from public funds” - “affiliated companies” - “other non-operating items” Thus, the ICAO requirement of assigning the interest element paid each year on capital leases and debt as a non-operating cost, may be expected to lead to an under-estimate of their true contribution to BHDOC values, by ‘hiding’ the interest in a different cost category. The logic of this accounting may be that AOs may consolidate multiple borrowing requirements (e.g. for flight equipment and buildings) into one, or a small number, of funding options, such that attributing specific repayments to individual aircraft could be difficult. ICAO also states that “gain or loss on retirement is defined as the difference between the depreciated book value of the equipment at the date of retirement and the value realized” which means that the associated risk of aircraft ownership, both benefits and disbenefits, are also reported as non-operating items, although it could be argued that these ownership risks are very much operating risks. In summary, ICAO accounting practice, on which basis the DRL primary costs were collected from AOs as part of this Study, may be not be transparent enough to form a reliable input on which to base calculations. This further suggests that some type of ‘first principles’ computation may be required. This is explored in the next Section.
Evaluating the true cost to airlines of one minute of airborne or ground delay
Transport Studies Group 37 University of Westminster
2.3.2.2.4.4 Conclusions on DRL costs – how to calculate a true value Having reviewed the numerous aircraft financing mechanisms available to AOs, and the shortcomings of taking various costs at face value, it is now possible to take this discussion forward with a particular example, and to propose a solution for evaluating a more realistic cost of ownership, or operating leasing. Take for example a higher-value aircraft, worth USD 50 000 000. What type of costs might be expected to be associated with the various type of financing, according to the different methods available, under simplified but realistic conditions? Borrowing 80% of this value (although it would ordinarily be difficult to obtain such a loan in the current economic climate, AOs could well be involved in similar, previous arrangements) and amortising to zero over 15 years, would give a monthly repayment of around USD 380 000 per month, at a fixed annual interest rate of 8%. An outright purchase, with a typical depreciation over 25 years to a residual value of 15%, would result in monthly depreciation values of approximately USD 140 000 for the same aircraft (a rate of 3.4% per annum). An operating lease at a fixed rate of 1% of market value per month, would result in rentals of USD 500 000 per month. The problem with trying to arrive at some ‘typical’ value amongst these costs, is that it is not valid to directly compare them. The monthly depreciation after outright purchase does not take into account the missed opportunity cost of investing the USD 50 000 000 over a 25 year term, nor the risk associated with the residual value, nor the taxation benefits. Neither this cost, nor the amortised debt, include the cost of replacing the aircraft after it is sold on, or retired. The operating lease cost is clearly the highest, since it includes the premium of permanent fleet renewal, the cost of forcing the lessor to assume all the residual value risk, and, of course, it includes the lessor’s profit margin. The true cost of financing is perhaps closest to the lessor’s costs, since these include fleet renewal. By subtracting some of the lessor profit margin, it could be argued that the remaining cost of this service rendered to the AO, i.e. retaining some of the costs involved in the residual risk value and the overheads of lessor operations, offers a very good model for the true cost of AO financing and replacing aircraft.
The operating lease business thus represents an extremely convenient model for the true DRL cost which this Study needs to estimate from the AO perspective, but which would otherwise be very difficult indeed to establish from AO accounts.
It is also worth considering this model from the perspective of the current market outlook. In terms of AO ownership, straight debt financing (becoming more of a risk) and finance leases (dwindling tax benefits on aircraft assets) are expected to decrease, whilst capital markets are expected to grow (33). It is arguable whether manufacturers will wish to remain longer term in the market of financing aircraft. Indeed, straight debt financing, finance leases and EETCs (Enhanced Equipment Trust Certificates) are all now in very tight supply, such that operating leasing is the only option for many carriers. Banker and appraiser confidence in residual values is at a low, debt terms very hard, and many debt providers have pulled out of the aerospace and aircraft financing sector altogether.
Evaluating the true cost to airlines of one minute of airborne or ground delay
Transport Studies Group 38 University of Westminster
Estimates for the proportions of operating leases put rates at as much as 40% of aircraft delivered by 2006 (33), and 30 - 40% overall by 2020 (42), with lessors actually accounting for the majority of aircraft deliveries scheduled for 2008 - 2010 (42). The lessor market has shifted over the years from ownership of used aircraft, to placing speculative orders with manufacturers. Indeed, the majority of lessors’ portfolios in 2002 (42) were new aircraft, particularly narrowbodies. Latest generation narrowbodies, particularly the A320 and 737NGs, are an attractive option for lessors, as they have high market demand and lower residual value risk than the ‘classic’ narrowbodies, or widebodies. This increase in operating leases, equally predicted during anticipated market recovery, may render the use of these as the basis of a first principles’ model for estimating true DRL costs more appropriate still. The details of the model are presented in Annex O, since the calculation is reasonably involved and may not be of specific interest to all readers. In Table O2 of Annex O, the modelled DRL costs per service-hour used in this Report are given. DRL costs have been distributed over aircraft service-hours, not just block-hours*, because otherwise such costs are incorrectly ‘zero’ for the at-gate phase.
Since utilisation has only a very small effect on DRL costs, these costs will be wholly allocated to the strategic cost of delay calculations, as will be presented in Section 2.6. Tactical delay costs of DRL are thus taken to be zero.
* However, where it is desirable to express DRL costs on a purely block-hour basis, it is shown in Annex O that using a value of 22% of the BHDOC values (calculated in the following Section) will give a good estimate. It should be noted, however, that using 22% of the BHDOC as representing ‘per block-hour’ DRL costs, i.e. a percentage value which is higher than the range of reported values from the AO interviews, implies than the BHDOC values themselves should be correspondingly increased if they are to include the cost of aircraft replacement. This means that all calculated values in the Report connected to BHDOCs are correct, except that the BHDOC values of Table 2-11 may not correctly include estimates for fleet renewal.
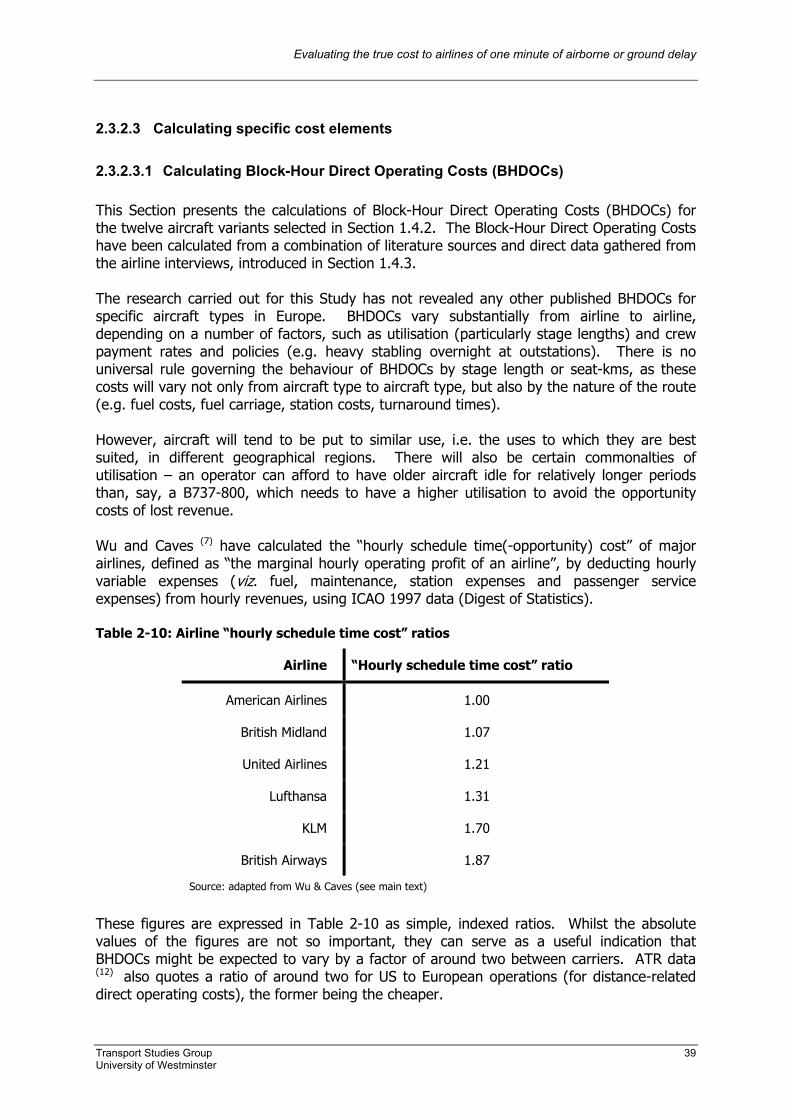
Evaluating the true cost to airlines of one minute of airborne or ground delay
Transport Studies Group 39 University of Westminster
2.3.2.3 Calculating specific cost elements 2.3.2.3.1 Calculating Block-Hour Direct Operating Costs (BHDOCs) This Section presents the calculations of Block-Hour Direct Operating Costs (BHDOCs) for the twelve aircraft variants selected in Section 1.4.2. The Block-Hour Direct Operating Costs have been calculated from a combination of literature sources and direct data gathered from the airline interviews, introduced in Section 1.4.3. The research carried out for this Study has not revealed any other published BHDOCs for specific aircraft types in Europe. BHDOCs vary substantially from airline to airline, depending on a number of factors, such as utilisation (particularly stage lengths) and crew payment rates and policies (e.g. heavy stabling overnight at outstations). There is no universal rule governing the behaviour of BHDOCs by stage length or seat-kms, as these costs will vary not only from aircraft type to aircraft type, but also by the nature of the route (e.g. fuel costs, fuel carriage, station costs, turnaround times). However, aircraft will tend to be put to similar use, i.e. the uses to which they are best suited, in different geographical regions. There will also be certain commonalties of utilisation – an operator can afford to have older aircraft idle for relatively longer periods than, say, a B737-800, which needs to have a higher utilisation to avoid the opportunity costs of lost revenue. Wu and Caves (7) have calculated the “hourly schedule time(-opportunity) cost” of major airlines, defined as “the marginal hourly operating profit of an airline”, by deducting hourly variable expenses (viz. fuel, maintenance, station expenses and passenger service expenses) from hourly revenues, using ICAO 1997 data (Digest of Statistics). Table 2-10: Airline “hourly schedule time cost” ratios
Airline “Hourly schedule time cost” ratio
American Airlines 1.00
British Midland 1.07
United Airlines 1.21
Lufthansa 1.31
KLM 1.70
British Airways 1.87
Source: adapted from Wu & Caves (see main text)
These figures are expressed in Table 2-10 as simple, indexed ratios. Whilst the absolute values of the figures are not so important, they can serve as a useful indication that BHDOCs might be expected to vary by a factor of around two between carriers. ATR data (12) also quotes a ratio of around two for US to European operations (for distance-related direct operating costs), the former being the cheaper.
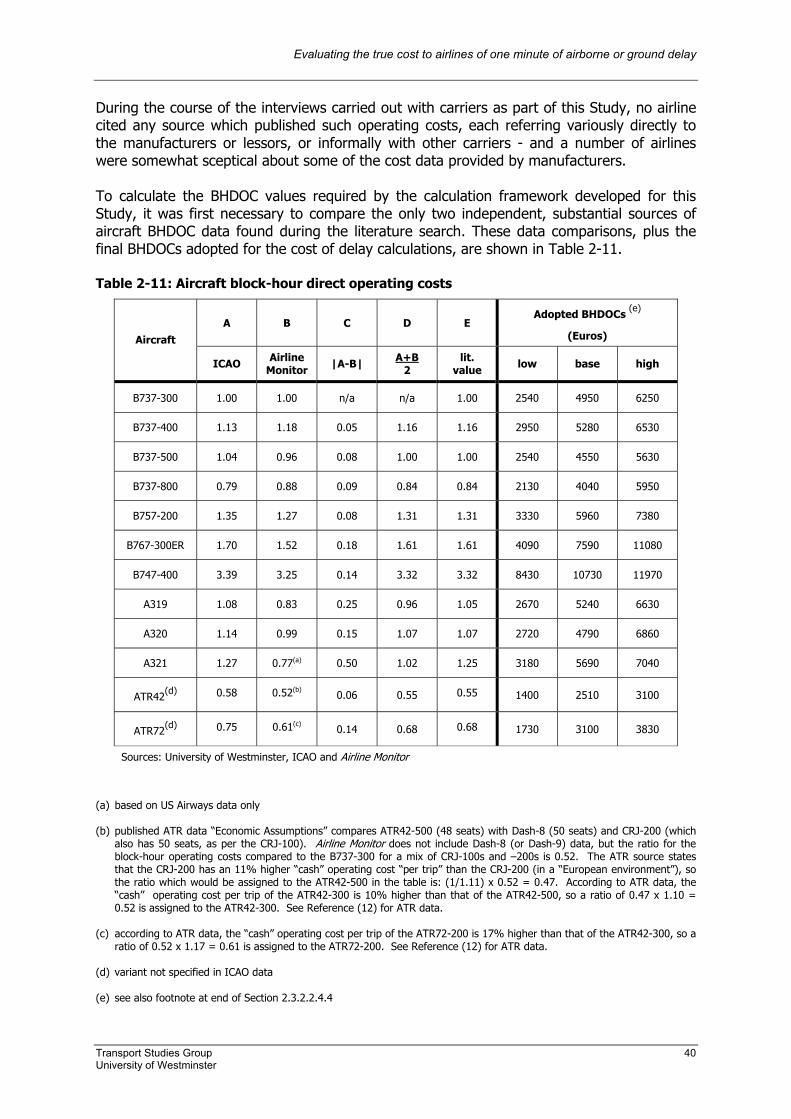
Evaluating the true cost to airlines of one minute of airborne or ground delay
Transport Studies Group 40 University of Westminster
During the course of the interviews carried out with carriers as part of this Study, no airline cited any source which published such operating costs, each referring variously directly to the manufacturers or lessors, or informally with other carriers - and a number of airlines were somewhat sceptical about some of the cost data provided by manufacturers. To calculate the BHDOC values required by the calculation framework developed for this Study, it was first necessary to compare the only two independent, substantial sources of aircraft BHDOC data found during the literature search. These data comparisons, plus the final BHDOCs adopted for the cost of delay calculations, are shown in Table 2-11. Table 2-11: Aircraft block-hour direct operating costs
A B C D E Adopted BHDOCs (e)
(Euros) Aircraft
ICAO Airline Monitor |A-B| A+B
2 lit.
value low base high
B737-300 1.00 1.00 n/a n/a 1.00 2540 4950 6250
B737-400 1.13 1.18 0.05 1.16 1.16 2950 5280 6530
B737-500 1.04 0.96 0.08 1.00 1.00 2540 4550 5630
B737-800 0.79 0.88 0.09 0.84 0.84 2130 4040 5950
B757-200 1.35 1.27 0.08 1.31 1.31 3330 5960 7380
B767-300ER 1.70 1.52 0.18 1.61 1.61 4090 7590 11080
B747-400 3.39 3.25 0.14 3.32 3.32 8430 10730 11970
A319 1.08 0.83 0.25 0.96 1.05 2670 5240 6630
A320 1.14 0.99 0.15 1.07 1.07 2720 4790 6860
A321 1.27 0.77(a) 0.50 1.02 1.25 3180 5690 7040
ATR42(d)
0.58 0.52(b) 0.06 0.55 0.55 1400 2510 3100
ATR72(d)
0.75 0.61(c) 0.14 0.68 0.68 1730 3100 3830
Sources: University of Westminster, ICAO and Airline Monitor (a) based on US Airways data only (b) published ATR data “Economic Assumptions” compares ATR42-500 (48 seats) with Dash-8 (50 seats) and CRJ-200 (which
also has 50 seats, as per the CRJ-100). Airline Monitor does not include Dash-8 (or Dash-9) data, but the ratio for the block-hour operating costs compared to the B737-300 for a mix of CRJ-100s and –200s is 0.52. The ATR source states that the CRJ-200 has an 11% higher “cash” operating cost “per trip” than the CRJ-200 (in a “European environment”), so the ratio which would be assigned to the ATR42-500 in the table is: (1/1.11) x 0.52 = 0.47. According to ATR data, the “cash” operating cost per trip of the ATR42-300 is 10% higher than that of the ATR42-500, so a ratio of 0.47 x 1.10 = 0.52 is assigned to the ATR42-300. See Reference (12) for ATR data.
(c) according to ATR data, the “cash” operating cost per trip of the ATR72-200 is 17% higher than that of the ATR42-300, so a
ratio of 0.52 x 1.17 = 0.61 is assigned to the ATR72-200. See Reference (12) for ATR data. (d) variant not specified in ICAO data (e) see also footnote at end of Section 2.3.2.2.4.4
Evaluating the true cost to airlines of one minute of airborne or ground delay
Transport Studies Group 41 University of Westminster
The two independent sources of data compared in Table 2-11 were from an ICAO study with data valid as of Summer 2000, and from Airline Monitor, August 2002. For the purposes of the comparison, the original data have been indexed, with the cost for the B737-300 arbitrarily being indexed as the reference value (1.00), and with other aircraft BHDOCs expressed as a ratio of this. Table 2-11 may be explained as follows. Column A shows costs taken from the ICAO study which involved surveys and consultation with “manufacturers, international organisations, aircraft operators, trade journals and other sources” (13). The assumed fuel price outside of the US for early 2000 was USD 0.85 per US gallon in January 2000 (which corresponds very closely to the base value used in this Study – see Annex C). Column B shows block-hour direct operating costs taken from Airline Monitor (14). These data cover US airlines, as reported to the US DoT on Form 41. Airline Monitor comments that there “can be legitimate questions about how they [airlines] allocate costs across different types” and that there are “numerous cases where certain cost or operating items are seriously misstated”. Attempts are made to correct these where possible, it is explained by this source. In a similar vein, the ICAO study states (13): “It is recognized that these [user] costs vary widely from State to State and user to user”. Notwithstanding these caveats, the block-hour cost ratios are reasonably consistent throughout the table, with all bar two of the absolute differences between the ratios (see Column C) being less than 0.20. The absolute values for the B737-300 (not shown) are also in reasonable agreement, with the ICAO source citing USD 1993 per block-hour, and Airline Monitor quoting an average value of USD 2508 per block-hour (with individual airline values ranging from USD 1809 for Southwest, to USD 3310 for United). Considering the two ratios, which differ by more than 0.20, the value quoted in Airline Monitor for the A321 is based on one operator only (US Airways). Precedence has therefore been given in Table 2-11 to the ICAO value, notionally rounding it down to 1.25 in respect of the Airline Monitor value, and assigning 1.25 to column E, which represents the consolidated ‘literature value’. With respect to the A319 data, three of the five airlines reported in Airline Monitor demonstrate higher values than the average quoted, and thus for this Study the higher ICAO value is used, with a notional rounding down to 1.05 in Column E. For other values in Column E, the ‘literature value’ presented is simply the mean of the ICAO and Airline Monitor ratios. The consolidated values in Column E are thus somewhat arbitrary compromises between the two sources, but notwithstanding the limitations of such data and their dependence on airline cost allocations and variant utilisation, the ratios in Column C do agree remarkably well, as has been observed. The next task was to integrate the operational data obtained through the airline interviews, with the literature values in Column E, to derive the range of BHDOCs for use in our cost of delay calculations. The actual values on specific aircraft variants for which the carriers contributed data cannot be shown for reasons of confidentiality. However, the AO data do cover a range of operators from high-cost base majors to low-cost carriers and charter operators. These costs were collected through Sections A and B of the questionnaire shown in Annex D.
Evaluating the true cost to airlines of one minute of airborne or ground delay
Transport Studies Group 42 University of Westminster
The interviews indeed confirmed that accounting practices varied considerably between carriers (see questionnaire Section B) - this variation going rather deeper than the “rather arbitrary depreciation rules used by airlines” cited by Hansen et al (9). In order to ascertain the key characteristics of the airline’s accounting and cost allocating practices, a dedicated section of the questionnaire asked questions regarding the allocation and disaggregation of costs. Whilst it was not possible to make any quantitative, definitive corrections to the cost data based on such information, this knowledge did enable more qualitative decisions to be made bear regarding the relative confidence with which some BHDOCs were treated. The BHDOC values were thus collected together and compared, with overall very good levels of agreement between data supplied by different airlines interviewed. Using a combination of imputation and smoothing, informed by a degree of judgement, the raw values obtained were adjusted to generate the ‘low’, ‘base’ and ‘high’ BHDOC values finally presented in Table 2-11, also with consideration given to the consolidated literature ratios previously arrived at in Column E. The ‘base’ values were taken as the 65th percentile of the range from the ‘low’ to the ‘high’ values, reflecting the fact that most operations in Europe are nearer the ‘major’ end of the cost scale than the ‘low-cost’ end. Exceptions to this were made for the three aircraft where the ‘high’ to ‘low’ ratios exceeded 2.5. For these aircraft (B737-800, B767-300ER and the A320), at least one operator had quoted a particularly high BHDOC value and, although the integrity of these values appeared sound, it was considered inappropriate to allow these particularly large ‘high’ scenario values to unduly inflate the ‘base’ values. Therefore, in these three cases, the ‘base’ value is the simple average of the ‘high’ and ‘low’ scenario values. The ratios of the final ‘base’ values thus presented in Table 2-11 differ by no more than approximately 0.1 from those given in Column E. The only exception to this is the B747-400, for which the literature sources suggested a BHDOC over three times more than the reference value of the B737-300, but multiple airline interview sources for this Study has led to a more conservative ratio being adopted, of just over two. The maximum variation in the table between ‘low’ and ‘high’ values is a factor of just under 2.8, for the B737-800. 2.3.2.3.2 Fuel burn costs plus commentary on airborne delay The fuel burn simulations carried out for this cost of delay calculation were performed by Lido, using a selection of city pairs befitting the aircraft variants. The results are shown in Table 2-12. The APU burn data were also provided by Lido, except for the ATR APU values, which were sourced directly from ATR (12). “Stationary ground” values refer to remote idling on the apron, or for pauses during taxiing, and both these values and “active taxi” assume the APU to be off. For the shorter airborne delays modelled (i.e. of 15 minutes), it has been assumed that most of the delay (80%) is encountered as part of ‘arrival management’. Where airborne holding is required, it is sometimes carried out through the use of stacks (standard ‘racetrack’ holding configurations), but more usually as a function of arrival management such as an “RNAV arrival route” or a “linear holding” procedure (an example is the ‘butcher’s hook’ configuration at FRA, which is designed to give variable approach times of between 8 and 30 minutes – see chart at Annex K).
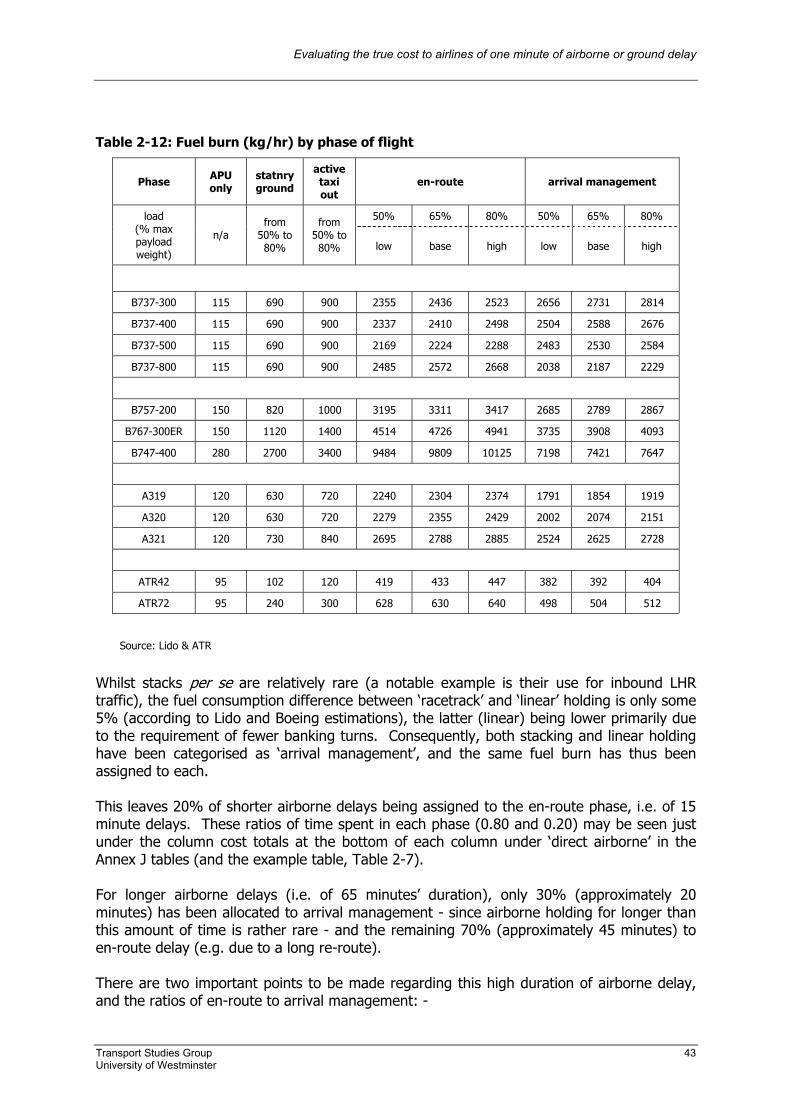
Evaluating the true cost to airlines of one minute of airborne or ground delay
Transport Studies Group 43 University of Westminster
Table 2-12: Fuel burn (kg/hr) by phase of flight
Phase APU only
statnry ground
active taxi out
en-route arrival management
50% 65% 80% 50% 65% 80% load (% max payload weight)
n/a from
50% to 80%
from 50% to 80% low base high low base high
B737-300 115 690 900 2355 2436 2523 2656 2731 2814
B737-400 115 690 900 2337 2410 2498 2504 2588 2676
B737-500 115 690 900 2169 2224 2288 2483 2530 2584
B737-800 115 690 900 2485 2572 2668 2038 2187 2229
B757-200 150 820 1000 3195 3311 3417 2685 2789 2867
B767-300ER 150 1120 1400 4514 4726 4941 3735 3908 4093
B747-400 280 2700 3400 9484 9809 10125 7198 7421 7647
A319 120 630 720 2240 2304 2374 1791 1854 1919
A320 120 630 720 2279 2355 2429 2002 2074 2151
A321 120 730 840 2695 2788 2885 2524 2625 2728
ATR42 95 102 120 419 433 447 382 392 404
ATR72 95 240 300 628 630 640 498 504 512
Source: Lido & ATR
Whilst stacks per se are relatively rare (a notable example is their use for inbound LHR traffic), the fuel consumption difference between ‘racetrack’ and ‘linear’ holding is only some 5% (according to Lido and Boeing estimations), the latter (linear) being lower primarily due to the requirement of fewer banking turns. Consequently, both stacking and linear holding have been categorised as ‘arrival management’, and the same fuel burn has thus been assigned to each. This leaves 20% of shorter airborne delays being assigned to the en-route phase, i.e. of 15 minute delays. These ratios of time spent in each phase (0.80 and 0.20) may be seen just under the column cost totals at the bottom of each column under ‘direct airborne’ in the Annex J tables (and the example table, Table 2-7). For longer airborne delays (i.e. of 65 minutes’ duration), only 30% (approximately 20 minutes) has been allocated to arrival management - since airborne holding for longer than this amount of time is rather rare - and the remaining 70% (approximately 45 minutes) to en-route delay (e.g. due to a long re-route). There are two important points to be made regarding this high duration of airborne delay, and the ratios of en-route to arrival management: -

Evaluating the true cost to airlines of one minute of airborne or ground delay
Transport Studies Group 44 University of Westminster
Firstly, the high duration of 65 minutes is accepted by the authors of this Study to be very rare in practical situations. However, at the core of this Study was the remit to produce trade-off values between high- and low-duration ground and airborne delays. It has thus been necessary to model a high-duration airborne delay in order to compare the costs directly with a similar ground-based delay. Clearly, if only short-duration airborne delays had been modelled (attracting none of the associated costs of arriving late at the destination), this would have generated a bias toward lower apparent costs for airborne delays. As was explained in sections 2.3.1.3 and 2.3.1.4, the absolute amount of the delay duration is less important than the order of magnitude of the duration. The most important thing about the 65 minute value is that it is large enough to attract some types of delay cost which would not be incurred for shorter delay durations, such as 15 minutes. In terms of practical trade-offs for AOs, it would be more common to be comparing values for various ground-based delays with airborne durations of rather less than 65 minutes. The final outputs of the calculations of this Study will later enable just such comparisons to be made, after the full calculations have been explained in detail. Secondly, regarding the relative ratios of arrival management to en-route delay, it should be noted that these assumptions were judgmental, since no data could be found for the distribution of airborne delays. However, the costs of the airborne delays are relatively insensitive to these ratios for two reasons:
• primarily: reference to Table 2-12 shows that the relative fuel burn differences between en-route delay and arrival management are not very large. The average difference across all the fuel burn data points is a 9% reduction in fuel burn during arrival management; the greatest difference is for the B747-400, which shows a 24% lower fuel burn during arrival management (calculations not shown).
• also: fuel burn is not the only consideration in the overall cost of airborne delay, particularly as delay duration increases, as can be seen by reference to the individual Annex J tables, and as is also reviewed later in Section 2.5.3.1, where the marginal costs of delay at the network reactionary level are summarised by generic aircraft type.
Finally in this discussion of fuel burn, it is noted that en-route delay is typically experienced as a horizontal re-route, or as a vertical re-route option, often with accelerated fuel. It is uncommon for the cruise phase to be associated with a slower speed within European airspace, as a method of delay management. In the ‘high’ cost scenarios (see Table 2-5) reduced flight-level penalties on fuel burn (see Annex I) have been assumed, which could also be considered as a proxy for accelerated fuel during delay recovery. When the ground speed is reduced, additional minutes of en-route delay should be costed.
Evaluating the true cost to airlines of one minute of airborne or ground delay
Transport Studies Group 45 University of Westminster
2.3.2.3.3 Maintenance costs ICAO accounting practice does not differentiate between maintenance costs related to utilisation and those unrelated to utilisation. For maintenance outsourced to third parties, and for AOs participating in the increasingly common power-by-the-hour (PBTH) options (half of those interviewed were using this to at least some extent), clearly these overheads are in any case inextricably built into the unit cost. Assuming, therefore, that the costs submitted by airlines during the course of these interviews thus included these general overhead costs, it is likely that the gate-to-gate estimate will slightly overestimate the true cost as related to utilisation only. However there is no practical way to resolve pure utilisation-based costs from the general maintenance costs, and this situation seems likely to become more common as outsourced maintenance arrangements become more widespread. PBTH effects on costs are discussed further in Section 2.6. The difficulty of having non-utilisation overheads included in the cost calculation is, however, to be viewed in consideration of two substantially mitigating factors:
• Firstly, a very sizeable proportion of the maintenance burden, incurred during the highest intensity phases of aircraft operation, has been discounted from the calculations for allocating the marginal maintenance cost burden, as described in Annex H. Such phases, such as take-offs and landings, are where a very high proportion of wear and tear on the airframe in general, and powerplants in particular, is experienced – yet no delays will be experienced during a take-off roll or landing.
• Secondly, the authors of this Study believe the approach of Annex H to be the most
detailed yet undertaken regarding a true allocation of marginal maintenance costs – although the scope for further refinement is considerable within the context of future research. Various airlines and major third-party maintenance service providers were consulted as part of this Study, but none was able to advise on a superior methodology for allocating such costs across flight phases.
The Study team feel that the approach adopted in Annex H is a more accurate allocation than those previously used, e.g. by the UK CAA and IATA in their calculations of maintenance delay costs, as summarised by the Eurocontrol Experimental Centre (1), whereby both allocate all such costs to the airborne phase. In Air Transport Association data quoted by Boeing (15) for delay costs ascribed to four phases of flight (gate, taxi-out, airborne, taxi-in) for 1993 and 1996, 86% of maintenance costs were allocated to the airborne phase for each case year. The ITA study (2) does not differentiate between these phases. The values obtained from the AO interviews for the percentage of BHDOC which may be attributed to maintenance costs were clustered around 15% for the aircraft variants under consideration. These values varied approximately in the range of 10%-20% (one carrier cited 25%), so an error margin of some 5% may be generally assumed around the adopted value of 15%, as shown in Table 2-5. This value conforms with ICAO (11) figures.
Evaluating the true cost to airlines of one minute of airborne or ground delay
Transport Studies Group 46 University of Westminster
To avoid multiplying the number of tables in Annex J still further, a common value of 15% has been used across all aircraft and all cost scenarios. There was no clear pattern in the data collected for the aircraft variants between the percentage value given and the type of aircraft (viz. turbo-prop, narrowbody or widebody). As discussed in the previous Section (2.3.2.3.2) regarding fuel burn and the proportions of airborne phases where delay may be encountered, since the maintenance costs for various ground phases are fairly similar to each other, and the same is true for the two airborne phases, the relative proportions of time allocated within these phases does not make very much difference to the total costs calculated for ground or airborne delay from the maintenance perspective (see Annex H for quantitative details). Austrian Airlines (now “Austrian”), through consultancy carried out by Roland Berger in 1999 (16), have calculated that the maintenance burden accounts for only 2% of their total cost per delay minute (17), with their network effect excluded. This figure is in overall very good agreement with the findings of this Study - see Section 2.5.3.1. 2.3.2.3.4 Flight and cabin crew salaries and expenses Crew costs are particularly difficult to assign to particular incidences of delay for two reasons:
• Firstly, crew payment schemes can be very complex, based on calculations taking into account total duty hours, flight duty hours, time spent at outstations (with corresponding allowances – which may make up a significant part of overall pay; relatively a very high proportion for KLM), overtime hours, experience and rating.
• Secondly, this is the most difficult cost component to allocate accurately to a
particular leg, because if a crew’s hours expire on one rotation due to a delay, and an extra crew is brought in, this extra crew may then be available to serve subsequent rotations, such that the cost of delay should not be allocated to only one rotation.
These problems are complicated by the fact that crew costs comprise such a relatively high proportion of total costs for many airlines, such that errors in these estimations are made more significant (e.g. have greater consequences on the final delay costs per minute calculated than would a proportional error in the fuel cost calculations). In addition, airline practice varies greatly regarding the allocation of crew payments, with payments being made on a sector-flown basis, in proportion to total hours worked, or only by actual off-block hours. Furthermore, operators who pay crew on a block-hour basis may also place a higher operational emphasis on minimising airborne hours, and may be inclined to tolerate higher ground delays as a consequence. Whilst this will be a legitimate consideration on a single-rotation basis, the ground delay will still consume total duty hours which will be limited by both varying national civil aviation standards (there is no European standard as yet), and industrial agreements (which will be typically more restrictive).
Evaluating the true cost to airlines of one minute of airborne or ground delay
Transport Studies Group 47 University of Westminster
Yet another level of complexity to be considered here, is that in certain circumstances a 15 minute delay could actually have worse consequences than a 65 minute delay, because in the latter case, provided there is adequate notice, crew may be advised not to report for duty until a later time, and thus their total duty hours may be better matched with the requirements of the rotation. However, such considerations are out of the scope of the estimations made in this Study. As cited by the Eurocontrol Experimental Centre (1), previous UK CAA calculations only allocate crew costs to ‘long delays’ (over 20 minutes) for airborne and ground delays, whereas the IATA methodology allocates unit costs at the aggregate level equally between phases, regardless of the length of delay. The cost scenarios for extra crew costs applied to this Study (introduced in Table 2-5) have considered both the length of delay, and the marginal cost. Since it is considered relatively unlikely that a 15 minute delay will typically incur extra crew costs, these only appear in Table 2-5 under the ‘high’ cost scenario, and have only been assigned a “low” value – i.e. 15 minutes’ proportional time, and at lower market rates of pay (which might, for example, reflect the crew costs to a low-cost carrier). Even a 65 minute delay could incur no extra crew costs (hence none are assigned under the corresponding ‘low’ cost scenario), although a “medium” value has been assigned to the ‘base’ cost scenario – whereby one hour’s extra pay at average market rates has been assigned. For the ‘high’ cost scenario of a 65 minute delay, two hours’ pay are assigned, and higher market rates are assumed. These costs were determined through confidential consultation with a large European airline, and were calculated specifically for each aircraft type. Exact details are not shown to preserve confidentiality, and it should be noted that costs incurred are full costs to the operator, not wages alone. In Section 2.3.1.4 the concept of stepped increases in costs was introduced. Whilst the cost of fuel is a good example of a marginal cost which typically increases smoothly as a function of time, crew costs are a good example of costs which are likely to increase as a step function. This is because crew payments are paid in discreet units (such as hours, or shifts) and subject, by regulation, to discreet limitations. As delays increase still further, the likelihood of encountering yet further costs increases. Such costs might include those of having to accommodate out-of-place crews (i.e. not at the point where they were expected to terminate their shift), or having to re-locate such crews, or buy in third-party services. These additional costs have not been allocated to 65 minute delay scenarios, although they would become rather more likely at substantially higher delay durations. As mentioned in the foregoing text, it is important that cost burdens on individual gate-to-gate legs are not over estimated, since these resources may be used on subsequent rotations. This becomes even more important in Section 2.5, where these primary delay costs are multiplied up to make estimates of the network costs:
If the gate-to-gate cost is overestimated, this will result in double-counting when such costs are scaled up to the network level
Evaluating the true cost to airlines of one minute of airborne or ground delay
Transport Studies Group 48 University of Westminster
2.3.2.3.5 Handling agent penalties During the research conducted in this Study, it was reported that handling penalties tend not to be generally incurred at airports for late arrival of aircraft, especially where handling competition is more intense, and/or with larger carriers who have stronger negotiating powers when it comes to handling agent contracts. In the minority of cases where penalties do apply for the late turnaround (i.e. not for an extended turnaround, but only for a shift in the time at which it takes place), these tend to be in the region of 10-15% of the total handling fee, for a delay of around one hour. Since such penalties are not usually imposed, they have only been included in the ‘high’ cost scenario, and for the 65 minute delay, indicated in Table 2-5. These costs may also be considered as a suitable estimate for those borne by AOs undertaking self-handling (the handling agent profit margin being off-set by the fact that the true costs of delay do not seem to be passed on to the carrier). These costs include an estimation of handling late passengers at the gate, and were based on (confidential) handling agent and AO data. Where penalties are not imposed by handling agents, the cost of re-organising shifts and of having spare staff capacity is borne partially as a sunk cost assumed by the handler, and partially passed on to (other) airlines in standard fees, although these costs have not been considered in this Study. As with crew costs, and much for the same reasons related to shift work, handling agent penalties could become significantly more severe for rather higher levels of delay (e.g. for two or three hours), especially for a smaller carrier arriving late at an airport where the agent has to get another shift of workers in to service the aircraft. 2.3.2.3.6 Airport charges Airport charges applied in this Study were calculated using a cost simulation model developed by the Study team, based on the twelve aircraft variants in question. The model was designed to calculate the airport charges’ costs of late push-backs and take-offs at ‘ground A’, and late arrivals at ‘ground B’. The source document used was the IATA Airport and Air Navigation Charges Manual (June 2002 CD version) (18), in direct consultation with various airport authorities to resolve ambiguities in definitions (particularly on some of the highly complex noise surcharge schemes). “User Costs at Airports in Europe, SE Asia and the USA (1997-98)”, obtained from Cranfield College of Aeronautics (19) and the TRL’s “Review of Airport Charges 2001” (20), were also consulted. The model developed includes every component of airport charges listed in the Charges Manual and is more advanced than any airline consideration of these delay costs which was encountered during the interviews. To calculate the costs of late arrival and departure at the twelve airports selected for inclusion (see Section 1.4.2) the twelve variants considered were ‘flown in’ to each airport, landing at 0700 on a Tuesday (01 October 2002), with the origin/destinations, load factors, transfer passenger percentages and parking scenarios given in Table 2-5.
Evaluating the true cost to airlines of one minute of airborne or ground delay
Transport Studies Group 49 University of Westminster
All aircraft were designated to be carrying out scheduled, European operations, and 60 minute turnarounds were assumed for all aircraft except the B747-400, where 180 minutes was assumed (and an origin / destination of New York JFK). The total airport charges were then calculated for each aircraft, and the process repeated for a landing at 0715. The difference between these values represents the cost of delay at ‘ground B’ of a 15 minute delay. This process was repeated for a 65 minutes delay, and both scenarios were then repeated for an arrival at 1700. This entire simulation procedure was then repeated for delayed push-backs relative to scheduled times of 0700 and 1700, to calculate the cost of departure delay at ‘ground A’. Fee differences, thus representing the marginal cost of delay, for all airport charges, are given in the gate columns (in the Annex J tables) for ‘ground A’ and ‘ground B’, except the differences for landing and take-off charges, which are shown separately in the corresponding columns (“take-off roll” and “landing roll”) and include lighting and noise surcharges. A summary of airport charges affected by the time of day at which they are incurred, and thus central to these calculations, is given in Annex L. 2.3.2.3.7 Costs of passenger delay to airlines Two carriers contacted during the course of this Study had carried out extensive modelling of the cost to airlines of passenger delays: Austrian (Airlines) (16), and one wishing to protect the confidentiality of their research – which will be designated hereinafter as ‘Airline Z’. Both modelled not only the direct (‘hard’) costs of passenger compensation and rebooking for missed connections, but also considered the ‘soft’ costs of potential loss of revenue due to future loss of market share as a result of lack of punctuality. ‘Soft’ costs are a very important consideration when calculating total delay costs, but when attempting to quantify loss of market share in terms of any given facet of airline lack of performance, it must be remembered that passengers will by no means always have one single reason for opting to change from one airline to another. When looking at a factor analysis of 1500 questionnaires, Mercer (21) identified punctuality as a relatively medium strength factor influencing customers’ intent to travel again with the same airline. As is correctly implied, however, the importance of various attributes of the airlines’ product will vary very strongly as a function of journey purpose. Schedule and punctuality will be more important for business trips, whereas ticket price dominates more strongly for non-business travel. Clearly, the translation of intention to repurchase with the same airline into actual travel (market share) will be governed strongly by schedule. If a passenger wishes to travel to a given destination, and has a strong repurchase desire for a particular airline, that will not be translated into market share unless the airline actually serves that destination. Mercer also state that they were able to quantify correlations between ‘intent-to-repurchase’ scores and market share by analysing different routes and periods of time (data not provided) and point out that these effects are also influenced by repurchase cycles (which are longer in the economy cabin).
Evaluating the true cost to airlines of one minute of airborne or ground delay
Transport Studies Group 50 University of Westminster
Nor are the more commonly considered ‘hard’ costs trivial to allocate, and will vary as a function both of the duration of the delay (e.g. with overnight accommodation being provided for passengers with missed connections and no onward alternative the same day) and the location (e.g. costs may well be lower at the carrier’s homebase where deeper discounts can be negotiated with hotels and payments are made in local currency). Rebooking onto other carriers can also represent a high proportion of these direct expenses. In a paper which looks at the relationship between on-time performance and airline market share, Suzuki (22) offers a list of previous papers which have modelled passenger demand (using market share or sales) as a function of on-time performance and other exogenous variables, and goes on (for the first time, it is stated) to build a model based on loss aversion theory, where passengers, inter alia, give heavier weights to losses (disutility) than to gains (see also Bates et al (23)). Although thorough in its treatment of passenger switching rates, the model adopts an aggregate methodology which does not make use of any market research data (using instead pseudo ‘attractiveness’ variables) and neglects attrition to other modes, or journey cancellation / postponement. As Suzuki states, the discrete choice (disaggregate) model is preferable, and the Study team strongly endorse the need for market research to fully understand the drivers of travel choice behaviour. The same need for market research to underpin a further investigation described by Suzuki et al may also be argued (24). One aspect of market research which must be treated with considerable caution, however, is the use to which passenger values of time (“VOT” or “PVT”) are used. Whilst they may be very useful in modelling behaviour as a result of discrete choice analyses, treating VOTs as having absolute monetary values is questionable. DRI – WEFA Inc, in “The National Economic Impact of Civil Aviation” (25) cite the FAA’s 1995 “Hourly Value of Air Passenger Travel Time” (PVT) as USD 26.70, while Citrenbaum and Juliano (26) cite “the hourly PVT, per the FAA APO Publication 97-1, June 1997” also as USD 26.70. Wage rates are often used as a proxy for VOTs where the latter are not available. Such economic impact calculations are valuable within their context, of course, but it must be remembered that different calculations of VOT will often produce (incorrectly) diverse values, as documented by ITA (2). Using VOTs or wage rate proxies is, arguably, only really meaningful in the context of this Report if they are actually used as a basis for payment to passengers. If a passenger’s VOT is EUR 1000 per hour, this remains only a theoretical economic cost unless an airline will actually pay this passenger according to their VOT. Bates et al have examined (23) the passenger valuation of reliability in some detail, where the widespread use of the standard deviation of the random component of travel time variability as the relevant component of the utility function is discussed. Passenger VOT may be estimated too highly by numerous study approaches, as “there is a suspicion that respondents are protesting about the unreliability of public transport services, and therefore manifesting excessive disutility from late arrival”. Such ‘policy effects’ may also be compounded by genuine misperception and shifting emphases on the importance of punctuality as a function of incurred delay, as pointed out in an exploratory case study undertaken by the Eurocontrol Experimental Centre (27), looking at the differences between actual flight-based performance indicators and passengers’ perceptions. Both sources stress the importance of trip-end constraints regarding punctuality, e.g. making an onward travel connection, where the disutility of delay increases markedly. Suzuki (22) allows for passengers with flight delay experience putting more weight (disutility) on on-time performance for subsequent flights.
Evaluating the true cost to airlines of one minute of airborne or ground delay
Transport Studies Group 51 University of Westminster
The calculations carried out by Austrian (Airlines) and Airline Z, referred to at the start of the Section, both have the advantage of not using any VOTs, and thus refer only to estimations of actual hard costs, and more realistic estimates of ‘actual’ soft costs. The reader should not be misled by the term ‘soft’, typically used in this context, however. Austrian estimate (17) that the loss of market share, or ‘passenger opportunity’ cost is typically 60% of the total cost of passenger delay to the airlines. Whilst it has not been possible for the Study team to carry out, and report upon, a comprehensive, analytical comparison of the Austrian and Airline Z computations (due to confidentiality issues and unavailability of original documentation), each was forthcoming in helping to resolve key methodological questions, supporting the basic soundness of each approach. Intentionally, neither included an estimate of expenses associated with the increased costs specifically of passenger handling as a result of delay (in their passenger cost calculations) such that the inclusion of this item in Section 2.3.2.3.5 of this Study does not mean that double-counting has taken place. The total passenger cost, to the airline, per delay minute, per delayed flight was estimated by Austrian to be EUR 26 (inflated from its 1999 value). Independently calculated, corresponding figures from Airline Z made the 2003 value EUR 44. In order to compare these values, however, it is necessary to convert them both into comparable units, as ‘per delayed flight’ obviously has different implications for these different carriers. Calculating the average number of passengers per flight for each carrier, using the Airclaims database and AEA (28) average load factors for 2001 (although in practice peak delay costs will tend to correspond with higher load factors), the value for Austrian has been converted to EUR 0.27 per passenger per minute and for Airline Z EUR 0.32 per passenger per minute (this makes the assumption that the distribution of delayed flights is in proportion to the number of actual flights). Taking an (unweighted) average of these remarkably similar values gives us a working value of:
EUR 0.30 per average passenger, per average delay minute, per average delayed flight
Both Airline Z and Austrian averaged these costs over all delay minutes. However, as will be seen in Table 2-5, the base cost scenario for a ‘short’ delay in this Study assumes no cost to the AO for passenger delay. This means the base value used in this Study for delays of over 15 minutes needs to be increased, so that the average value is still 0.30 Euros per passenger per delay minute. In the absence of any data on total delay distributions (i.e. ATFM and non-ATFM), reference to Table 2-52 shows that CTOT delays of over 15 minutes comprise 75% of the total minutes. The appropriate base value to use for delays of over 15 minutes is thus 0.40 Euros per passenger per delay minute, such that the average is (0.40 x 75%) + (0.00 x 25%) = 0.30. 20% has been judgementally added to / subtracted from this value of 0.40 to give low and high cost scenario estimates of 0.48 and 0.32, respectively, for ‘long’ delays. A value of 0.05 Euros per passenger per delay minute has been judgementally assigned to the high cost scenario for ‘short’ delays. The total cost (the Euro rate in Table 2-5 multiplied by the passenger numbers) is assigned to the “gate B” phase in the Annex J tables. The cost is added in full to both the “direct @ ground A” phase and “direct airborne” phase (as dictated by the logic described in Section 2.3.2.1), but recorded under “incurred @ ground B” since the bulk of the cost - rebooking fees, future passenger loss and post-flight compensation - is notionally incurred here.
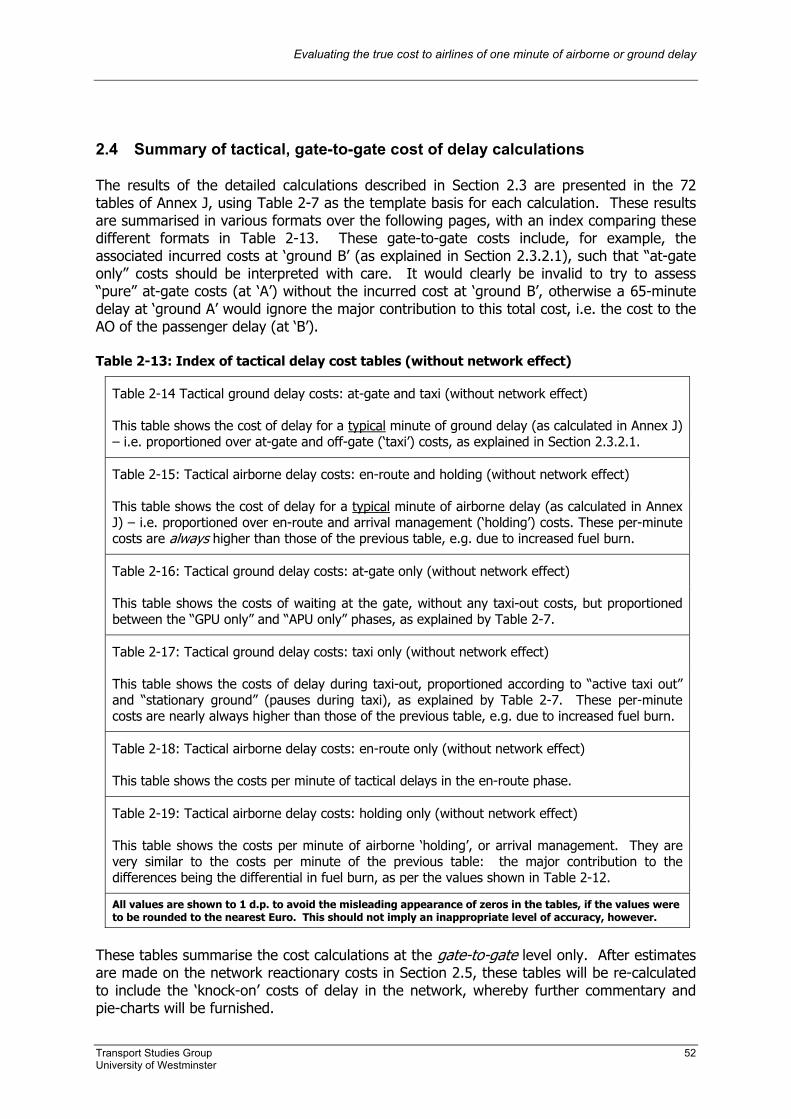
Evaluating the true cost to airlines of one minute of airborne or ground delay
Transport Studies Group 52 University of Westminster
2.4 Summary of tactical, gate-to-gate cost of delay calculations The results of the detailed calculations described in Section 2.3 are presented in the 72 tables of Annex J, using Table 2-7 as the template basis for each calculation. These results are summarised in various formats over the following pages, with an index comparing these different formats in Table 2-13. These gate-to-gate costs include, for example, the associated incurred costs at ‘ground B’ (as explained in Section 2.3.2.1), such that “at-gate only” costs should be interpreted with care. It would clearly be invalid to try to assess “pure” at-gate costs (at ‘A’) without the incurred cost at ‘ground B’, otherwise a 65-minute delay at ‘ground A’ would ignore the major contribution to this total cost, i.e. the cost to the AO of the passenger delay (at ‘B’). Table 2-13: Index of tactical delay cost tables (without network effect)
Table 2-14 Tactical ground delay costs: at-gate and taxi (without network effect)
This table shows the cost of delay for a typical minute of ground delay (as calculated in Annex J) – i.e. proportioned over at-gate and off-gate (‘taxi’) costs, as explained in Section 2.3.2.1.
Table 2-15: Tactical airborne delay costs: en-route and holding (without network effect)
This table shows the cost of delay for a typical minute of airborne delay (as calculated in Annex J) – i.e. proportioned over en-route and arrival management (‘holding’) costs. These per-minute costs are always higher than those of the previous table, e.g. due to increased fuel burn.
Table 2-16: Tactical ground delay costs: at-gate only (without network effect)
This table shows the costs of waiting at the gate, without any taxi-out costs, but proportioned between the “GPU only” and “APU only” phases, as explained by Table 2-7.
Table 2-17: Tactical ground delay costs: taxi only (without network effect)
This table shows the costs of delay during taxi-out, proportioned according to “active taxi out” and “stationary ground” (pauses during taxi), as explained by Table 2-7. These per-minute costs are nearly always higher than those of the previous table, e.g. due to increased fuel burn.
Table 2-18: Tactical airborne delay costs: en-route only (without network effect)
This table shows the costs per minute of tactical delays in the en-route phase.
Table 2-19: Tactical airborne delay costs: holding only (without network effect)
This table shows the costs per minute of airborne ‘holding’, or arrival management. They are very similar to the costs per minute of the previous table: the major contribution to the differences being the differential in fuel burn, as per the values shown in Table 2-12.
All values are shown to 1 d.p. to avoid the misleading appearance of zeros in the tables, if the values were to be rounded to the nearest Euro. This should not imply an inappropriate level of accuracy, however.
These tables summarise the cost calculations at the gate-to-gate level only. After estimates are made on the network reactionary costs in Section 2.5, these tables will be re-calculated to include the ‘knock-on’ costs of delay in the network, whereby further commentary and pie-charts will be furnished.
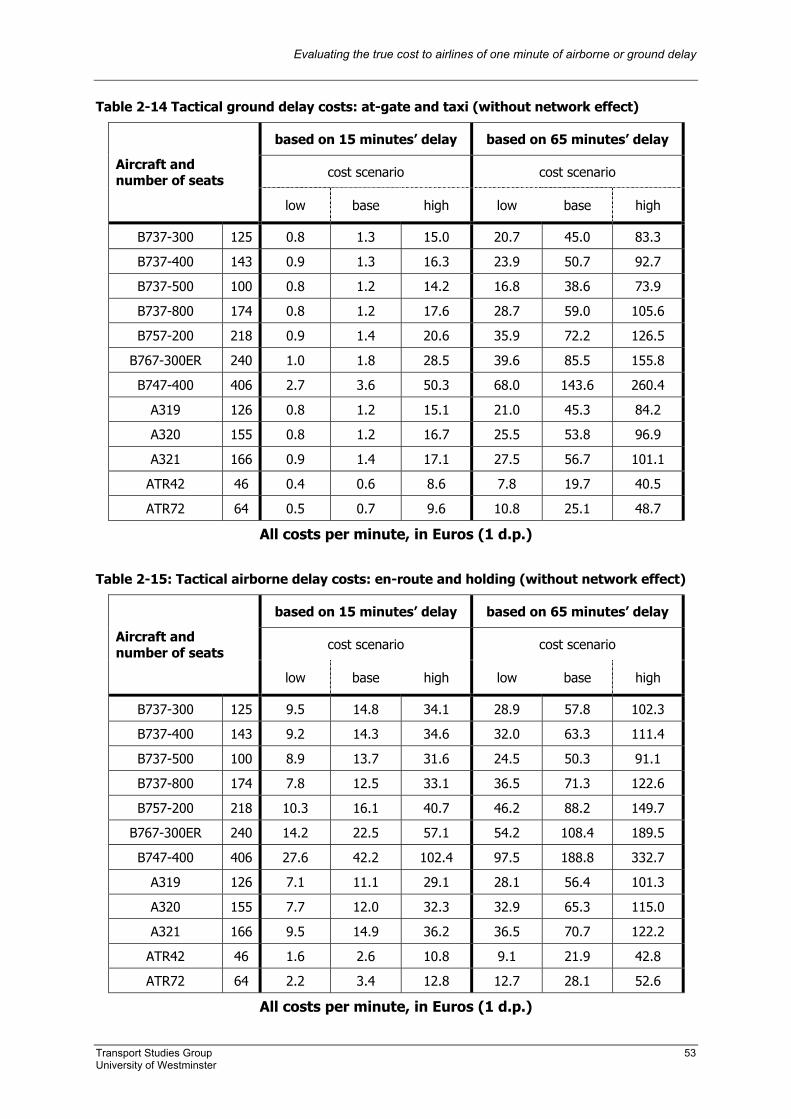
Evaluating the true cost to airlines of one minute of airborne or ground delay
Transport Studies Group 53 University of Westminster
Table 2-14 Tactical ground delay costs: at-gate and taxi (without network effect)
based on 15 minutes’ delay based on 65 minutes’ delay
cost scenario cost scenario Aircraft and number of seats
low base high low base high
B737-300 125 0.8 1.3 15.0 20.7 45.0 83.3
B737-400 143 0.9 1.3 16.3 23.9 50.7 92.7
B737-500 100 0.8 1.2 14.2 16.8 38.6 73.9
B737-800 174 0.8 1.2 17.6 28.7 59.0 105.6
B757-200 218 0.9 1.4 20.6 35.9 72.2 126.5
B767-300ER 240 1.0 1.8 28.5 39.6 85.5 155.8
B747-400 406 2.7 3.6 50.3 68.0 143.6 260.4
A319 126 0.8 1.2 15.1 21.0 45.3 84.2
A320 155 0.8 1.2 16.7 25.5 53.8 96.9
A321 166 0.9 1.4 17.1 27.5 56.7 101.1
ATR42 46 0.4 0.6 8.6 7.8 19.7 40.5
ATR72 64 0.5 0.7 9.6 10.8 25.1 48.7
All costs per minute, in Euros (1 d.p.)
Table 2-15: Tactical airborne delay costs: en-route and holding (without network effect)
based on 15 minutes’ delay based on 65 minutes’ delay
cost scenario cost scenario Aircraft and number of seats
low base high low base high
B737-300 125 9.5 14.8 34.1 28.9 57.8 102.3
B737-400 143 9.2 14.3 34.6 32.0 63.3 111.4
B737-500 100 8.9 13.7 31.6 24.5 50.3 91.1
B737-800 174 7.8 12.5 33.1 36.5 71.3 122.6
B757-200 218 10.3 16.1 40.7 46.2 88.2 149.7
B767-300ER 240 14.2 22.5 57.1 54.2 108.4 189.5
B747-400 406 27.6 42.2 102.4 97.5 188.8 332.7
A319 126 7.1 11.1 29.1 28.1 56.4 101.3
A320 155 7.7 12.0 32.3 32.9 65.3 115.0
A321 166 9.5 14.9 36.2 36.5 70.7 122.2
ATR42 46 1.6 2.6 10.8 9.1 21.9 42.8
ATR72 64 2.2 3.4 12.8 12.7 28.1 52.6
All costs per minute, in Euros (1 d.p.)
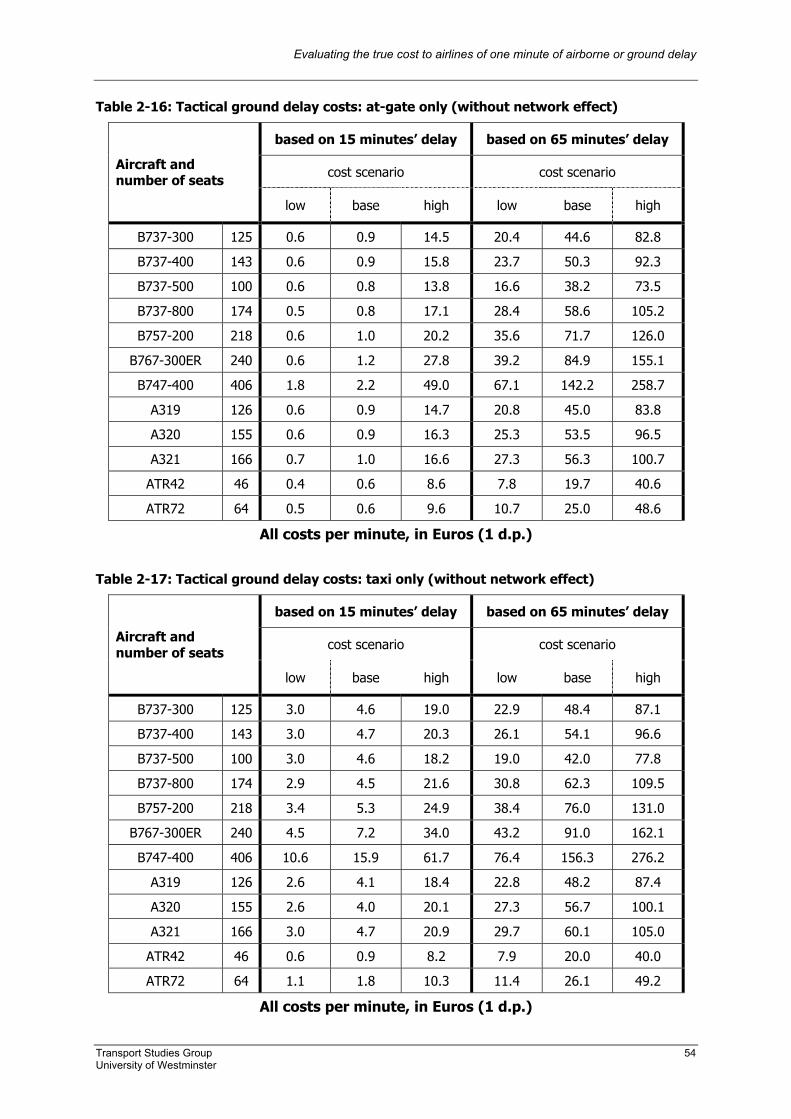
Evaluating the true cost to airlines of one minute of airborne or ground delay
Transport Studies Group 54 University of Westminster
Table 2-16: Tactical ground delay costs: at-gate only (without network effect)
based on 15 minutes’ delay based on 65 minutes’ delay
cost scenario cost scenario Aircraft and number of seats
low base high low base high
B737-300 125 0.6 0.9 14.5 20.4 44.6 82.8
B737-400 143 0.6 0.9 15.8 23.7 50.3 92.3
B737-500 100 0.6 0.8 13.8 16.6 38.2 73.5
B737-800 174 0.5 0.8 17.1 28.4 58.6 105.2
B757-200 218 0.6 1.0 20.2 35.6 71.7 126.0
B767-300ER 240 0.6 1.2 27.8 39.2 84.9 155.1
B747-400 406 1.8 2.2 49.0 67.1 142.2 258.7
A319 126 0.6 0.9 14.7 20.8 45.0 83.8
A320 155 0.6 0.9 16.3 25.3 53.5 96.5
A321 166 0.7 1.0 16.6 27.3 56.3 100.7
ATR42 46 0.4 0.6 8.6 7.8 19.7 40.6
ATR72 64 0.5 0.6 9.6 10.7 25.0 48.6
All costs per minute, in Euros (1 d.p.)
Table 2-17: Tactical ground delay costs: taxi only (without network effect)
based on 15 minutes’ delay based on 65 minutes’ delay
cost scenario cost scenario Aircraft and number of seats
low base high low base high
B737-300 125 3.0 4.6 19.0 22.9 48.4 87.1
B737-400 143 3.0 4.7 20.3 26.1 54.1 96.6
B737-500 100 3.0 4.6 18.2 19.0 42.0 77.8
B737-800 174 2.9 4.5 21.6 30.8 62.3 109.5
B757-200 218 3.4 5.3 24.9 38.4 76.0 131.0
B767-300ER 240 4.5 7.2 34.0 43.2 91.0 162.1
B747-400 406 10.6 15.9 61.7 76.4 156.3 276.2
A319 126 2.6 4.1 18.4 22.8 48.2 87.4
A320 155 2.6 4.0 20.1 27.3 56.7 100.1
A321 166 3.0 4.7 20.9 29.7 60.1 105.0
ATR42 46 0.6 0.9 8.2 7.9 20.0 40.0
ATR72 64 1.1 1.8 10.3 11.4 26.1 49.2
All costs per minute, in Euros (1 d.p.)
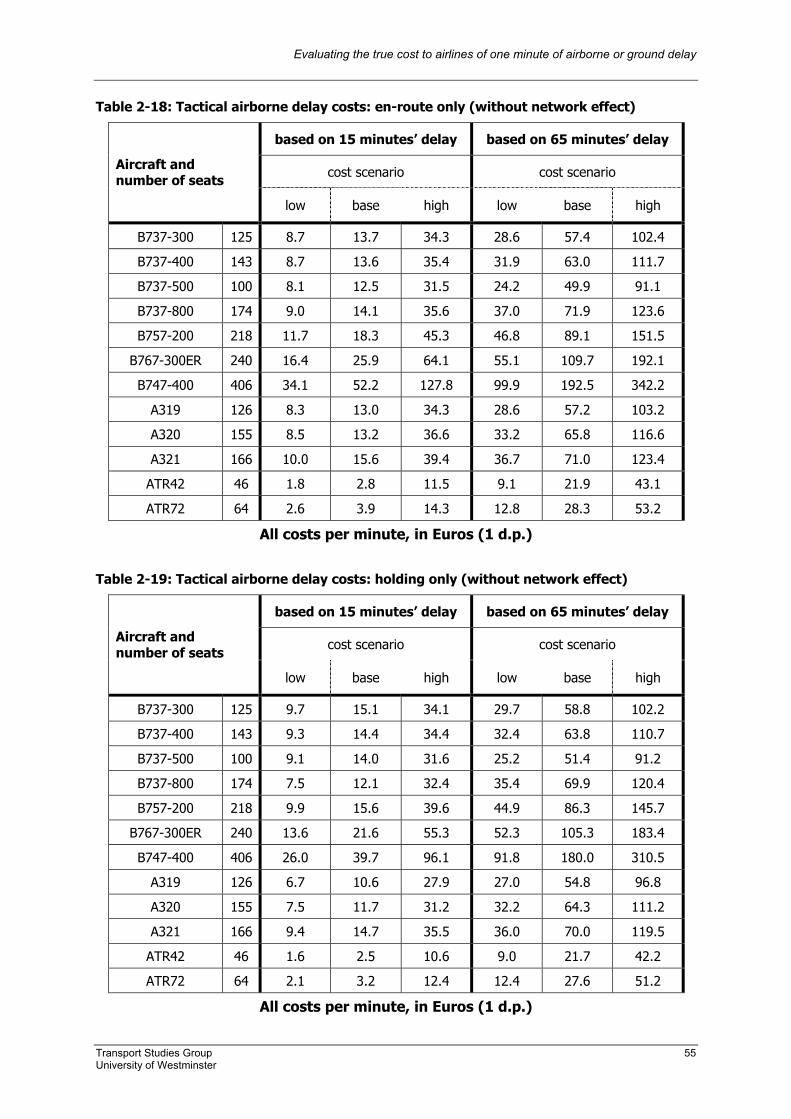
Evaluating the true cost to airlines of one minute of airborne or ground delay
Transport Studies Group 55 University of Westminster
Table 2-18: Tactical airborne delay costs: en-route only (without network effect)
based on 15 minutes’ delay based on 65 minutes’ delay
cost scenario cost scenario Aircraft and number of seats
low base high low base high
B737-300 125 8.7 13.7 34.3 28.6 57.4 102.4
B737-400 143 8.7 13.6 35.4 31.9 63.0 111.7
B737-500 100 8.1 12.5 31.5 24.2 49.9 91.1
B737-800 174 9.0 14.1 35.6 37.0 71.9 123.6
B757-200 218 11.7 18.3 45.3 46.8 89.1 151.5
B767-300ER 240 16.4 25.9 64.1 55.1 109.7 192.1
B747-400 406 34.1 52.2 127.8 99.9 192.5 342.2
A319 126 8.3 13.0 34.3 28.6 57.2 103.2
A320 155 8.5 13.2 36.6 33.2 65.8 116.6
A321 166 10.0 15.6 39.4 36.7 71.0 123.4
ATR42 46 1.8 2.8 11.5 9.1 21.9 43.1
ATR72 64 2.6 3.9 14.3 12.8 28.3 53.2
All costs per minute, in Euros (1 d.p.)
Table 2-19: Tactical airborne delay costs: holding only (without network effect)
based on 15 minutes’ delay based on 65 minutes’ delay
cost scenario cost scenario Aircraft and number of seats
low base high low base high
B737-300 125 9.7 15.1 34.1 29.7 58.8 102.2
B737-400 143 9.3 14.4 34.4 32.4 63.8 110.7
B737-500 100 9.1 14.0 31.6 25.2 51.4 91.2
B737-800 174 7.5 12.1 32.4 35.4 69.9 120.4
B757-200 218 9.9 15.6 39.6 44.9 86.3 145.7
B767-300ER 240 13.6 21.6 55.3 52.3 105.3 183.4
B747-400 406 26.0 39.7 96.1 91.8 180.0 310.5
A319 126 6.7 10.6 27.9 27.0 54.8 96.8
A320 155 7.5 11.7 31.2 32.2 64.3 111.2
A321 166 9.4 14.7 35.5 36.0 70.0 119.5
ATR42 46 1.6 2.5 10.6 9.0 21.7 42.2
ATR72 64 2.1 3.2 12.4 12.4 27.6 51.2
All costs per minute, in Euros (1 d.p.)
Evaluating the true cost to airlines of one minute of airborne or ground delay
Transport Studies Group 56 University of Westminster
2.5 Estimate and assessment of network reactionary costs 2.5.1 Extending gate-to-gate calculations to network reactionary level In Section 2.3.1.2 the concept of the network effect when calculating marginal delay costs was introduced in some detail, but without supporting quantitative calculations. Network reactionary delay was defined as follows:
Definition: network reactionary delay
All delays which may be directly attributed to an initial, causal or ‘primary’ delay, be they experienced by the causal aircraft, or by others. These may propagate throughout the network until the end of the same operational day. Either all, or part, of particular flight delay durations subsequent to the primary delay may be assigned as ‘reactionary’ in origin.
Now that the detailed calculations of the gate-to-gate marginal costs of delay have been completed, these results can be used as a basis for making an estimate of the network reactionary costs. The exercise of this Section is thus to ‘scale up’ the gate-to-gate costs calculated in Annex J, in order to account for the fact that for each primary delay encountered, there are likely to be ‘knock-on’ effects in the network. Thus, a 30 minute delay early in the morning, is likely to cause subsequent delays to the same aircraft, and possibly others, if there are insufficient buffers to accommodate this initial, primary delay (types of buffers, and their use, were introduced in Section 1.5.2). There are two approaches to dealing with this problem quantitatively, either a bottom-up approach, or a top-down approach may be used. A bottom-up approach could involve looking at specific delays to specific flights, and either directly recording all the knock-on (secondary) effects in the network, or building a model based on such data. The latter was the approach taken by Beatty et al (29), in which delay propagation was studied using actual American Airlines’ schedule data: this built up delay trees, with actual schedule buffers included in the delay-tree scenarios. After sampling from the distributions modelled, and performing various regression models on the sample data, then smoothing the resulting output – Table 2-20 was produced.
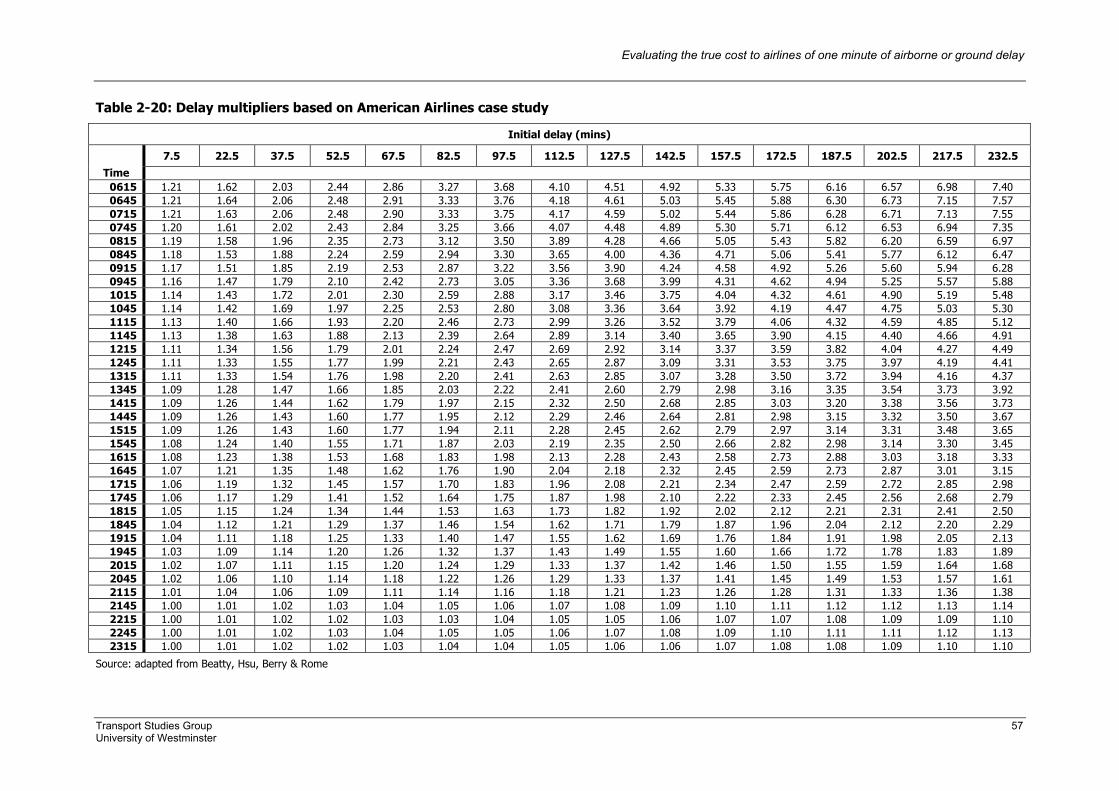
Evaluating the true cost to airlines of one minute of airborne or ground delay
Transport Studies Group 57 University of Westminster
Table 2-20: Delay multipliers based on American Airlines case study
Initial delay (mins)
7.5 22.5 37.5 52.5 67.5 82.5 97.5 112.5 127.5 142.5 157.5 172.5 187.5 202.5 217.5 232.5 Time
0615 1.21 1.62 2.03 2.44 2.86 3.27 3.68 4.10 4.51 4.92 5.33 5.75 6.16 6.57 6.98 7.40 0645 1.21 1.64 2.06 2.48 2.91 3.33 3.76 4.18 4.61 5.03 5.45 5.88 6.30 6.73 7.15 7.57 0715 1.21 1.63 2.06 2.48 2.90 3.33 3.75 4.17 4.59 5.02 5.44 5.86 6.28 6.71 7.13 7.55 0745 1.20 1.61 2.02 2.43 2.84 3.25 3.66 4.07 4.48 4.89 5.30 5.71 6.12 6.53 6.94 7.35 0815 1.19 1.58 1.96 2.35 2.73 3.12 3.50 3.89 4.28 4.66 5.05 5.43 5.82 6.20 6.59 6.97 0845 1.18 1.53 1.88 2.24 2.59 2.94 3.30 3.65 4.00 4.36 4.71 5.06 5.41 5.77 6.12 6.47 0915 1.17 1.51 1.85 2.19 2.53 2.87 3.22 3.56 3.90 4.24 4.58 4.92 5.26 5.60 5.94 6.28 0945 1.16 1.47 1.79 2.10 2.42 2.73 3.05 3.36 3.68 3.99 4.31 4.62 4.94 5.25 5.57 5.88 1015 1.14 1.43 1.72 2.01 2.30 2.59 2.88 3.17 3.46 3.75 4.04 4.32 4.61 4.90 5.19 5.48 1045 1.14 1.42 1.69 1.97 2.25 2.53 2.80 3.08 3.36 3.64 3.92 4.19 4.47 4.75 5.03 5.30 1115 1.13 1.40 1.66 1.93 2.20 2.46 2.73 2.99 3.26 3.52 3.79 4.06 4.32 4.59 4.85 5.12 1145 1.13 1.38 1.63 1.88 2.13 2.39 2.64 2.89 3.14 3.40 3.65 3.90 4.15 4.40 4.66 4.91 1215 1.11 1.34 1.56 1.79 2.01 2.24 2.47 2.69 2.92 3.14 3.37 3.59 3.82 4.04 4.27 4.49 1245 1.11 1.33 1.55 1.77 1.99 2.21 2.43 2.65 2.87 3.09 3.31 3.53 3.75 3.97 4.19 4.41 1315 1.11 1.33 1.54 1.76 1.98 2.20 2.41 2.63 2.85 3.07 3.28 3.50 3.72 3.94 4.16 4.37 1345 1.09 1.28 1.47 1.66 1.85 2.03 2.22 2.41 2.60 2.79 2.98 3.16 3.35 3.54 3.73 3.92 1415 1.09 1.26 1.44 1.62 1.79 1.97 2.15 2.32 2.50 2.68 2.85 3.03 3.20 3.38 3.56 3.73 1445 1.09 1.26 1.43 1.60 1.77 1.95 2.12 2.29 2.46 2.64 2.81 2.98 3.15 3.32 3.50 3.67 1515 1.09 1.26 1.43 1.60 1.77 1.94 2.11 2.28 2.45 2.62 2.79 2.97 3.14 3.31 3.48 3.65 1545 1.08 1.24 1.40 1.55 1.71 1.87 2.03 2.19 2.35 2.50 2.66 2.82 2.98 3.14 3.30 3.45 1615 1.08 1.23 1.38 1.53 1.68 1.83 1.98 2.13 2.28 2.43 2.58 2.73 2.88 3.03 3.18 3.33 1645 1.07 1.21 1.35 1.48 1.62 1.76 1.90 2.04 2.18 2.32 2.45 2.59 2.73 2.87 3.01 3.15 1715 1.06 1.19 1.32 1.45 1.57 1.70 1.83 1.96 2.08 2.21 2.34 2.47 2.59 2.72 2.85 2.98 1745 1.06 1.17 1.29 1.41 1.52 1.64 1.75 1.87 1.98 2.10 2.22 2.33 2.45 2.56 2.68 2.79 1815 1.05 1.15 1.24 1.34 1.44 1.53 1.63 1.73 1.82 1.92 2.02 2.12 2.21 2.31 2.41 2.50 1845 1.04 1.12 1.21 1.29 1.37 1.46 1.54 1.62 1.71 1.79 1.87 1.96 2.04 2.12 2.20 2.29 1915 1.04 1.11 1.18 1.25 1.33 1.40 1.47 1.55 1.62 1.69 1.76 1.84 1.91 1.98 2.05 2.13 1945 1.03 1.09 1.14 1.20 1.26 1.32 1.37 1.43 1.49 1.55 1.60 1.66 1.72 1.78 1.83 1.89 2015 1.02 1.07 1.11 1.15 1.20 1.24 1.29 1.33 1.37 1.42 1.46 1.50 1.55 1.59 1.64 1.68 2045 1.02 1.06 1.10 1.14 1.18 1.22 1.26 1.29 1.33 1.37 1.41 1.45 1.49 1.53 1.57 1.61 2115 1.01 1.04 1.06 1.09 1.11 1.14 1.16 1.18 1.21 1.23 1.26 1.28 1.31 1.33 1.36 1.38 2145 1.00 1.01 1.02 1.03 1.04 1.05 1.06 1.07 1.08 1.09 1.10 1.11 1.12 1.12 1.13 1.14 2215 1.00 1.01 1.02 1.02 1.03 1.03 1.04 1.05 1.05 1.06 1.07 1.07 1.08 1.09 1.09 1.10 2245 1.00 1.01 1.02 1.03 1.04 1.05 1.05 1.06 1.07 1.08 1.09 1.10 1.11 1.11 1.12 1.13 2315 1.00 1.01 1.02 1.02 1.03 1.04 1.04 1.05 1.06 1.06 1.07 1.08 1.08 1.09 1.10 1.10
Source: adapted from Beatty, Hsu, Berry & Rome
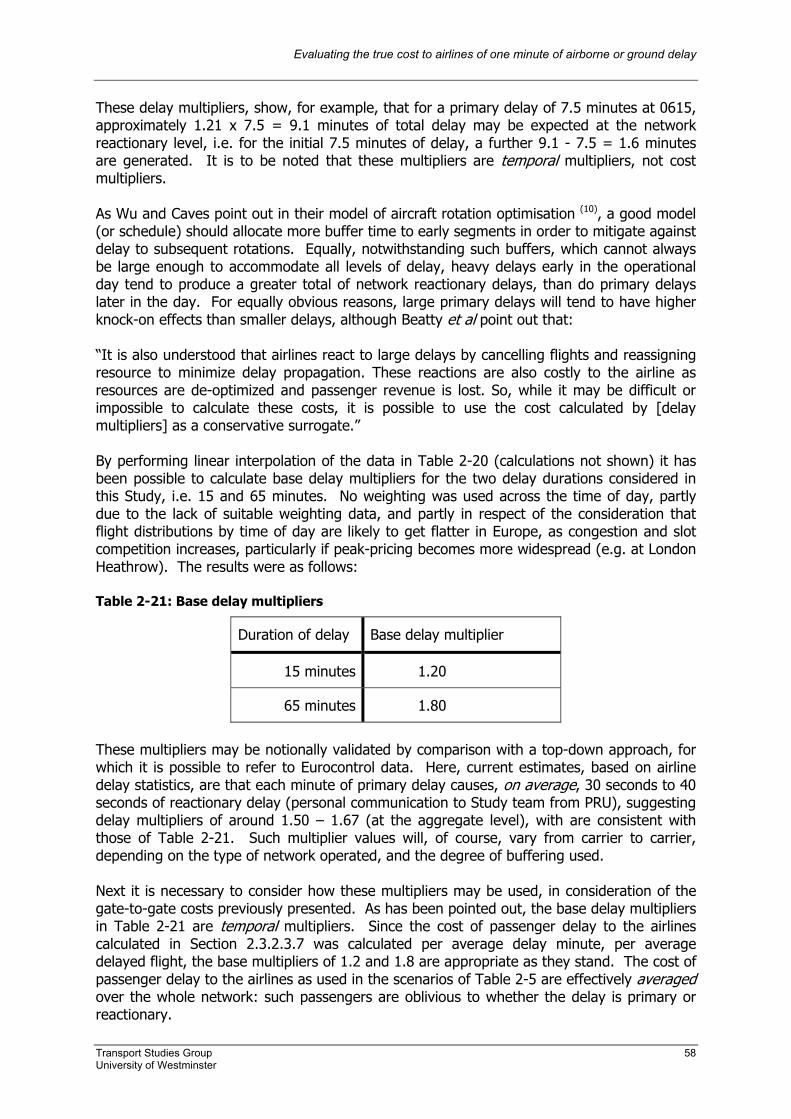
Evaluating the true cost to airlines of one minute of airborne or ground delay
Transport Studies Group 58 University of Westminster
These delay multipliers, show, for example, that for a primary delay of 7.5 minutes at 0615, approximately 1.21 x 7.5 = 9.1 minutes of total delay may be expected at the network reactionary level, i.e. for the initial 7.5 minutes of delay, a further 9.1 - 7.5 = 1.6 minutes are generated. It is to be noted that these multipliers are temporal multipliers, not cost multipliers. As Wu and Caves point out in their model of aircraft rotation optimisation (10), a good model (or schedule) should allocate more buffer time to early segments in order to mitigate against delay to subsequent rotations. Equally, notwithstanding such buffers, which cannot always be large enough to accommodate all levels of delay, heavy delays early in the operational day tend to produce a greater total of network reactionary delays, than do primary delays later in the day. For equally obvious reasons, large primary delays will tend to have higher knock-on effects than smaller delays, although Beatty et al point out that: “It is also understood that airlines react to large delays by cancelling flights and reassigning resource to minimize delay propagation. These reactions are also costly to the airline as resources are de-optimized and passenger revenue is lost. So, while it may be difficult or impossible to calculate these costs, it is possible to use the cost calculated by [delay multipliers] as a conservative surrogate.” By performing linear interpolation of the data in Table 2-20 (calculations not shown) it has been possible to calculate base delay multipliers for the two delay durations considered in this Study, i.e. 15 and 65 minutes. No weighting was used across the time of day, partly due to the lack of suitable weighting data, and partly in respect of the consideration that flight distributions by time of day are likely to get flatter in Europe, as congestion and slot competition increases, particularly if peak-pricing becomes more widespread (e.g. at London Heathrow). The results were as follows: Table 2-21: Base delay multipliers
Duration of delay Base delay multiplier
15 minutes 1.20
65 minutes 1.80
These multipliers may be notionally validated by comparison with a top-down approach, for which it is possible to refer to Eurocontrol data. Here, current estimates, based on airline delay statistics, are that each minute of primary delay causes, on average, 30 seconds to 40 seconds of reactionary delay (personal communication to Study team from PRU), suggesting delay multipliers of around 1.50 – 1.67 (at the aggregate level), with are consistent with those of Table 2-21. Such multiplier values will, of course, vary from carrier to carrier, depending on the type of network operated, and the degree of buffering used. Next it is necessary to consider how these multipliers may be used, in consideration of the gate-to-gate costs previously presented. As has been pointed out, the base delay multipliers in Table 2-21 are temporal multipliers. Since the cost of passenger delay to the airlines calculated in Section 2.3.2.3.7 was calculated per average delay minute, per average delayed flight, the base multipliers of 1.2 and 1.8 are appropriate as they stand. The cost of passenger delay to the airlines as used in the scenarios of Table 2-5 are effectively averaged over the whole network: such passengers are oblivious to whether the delay is primary or reactionary.
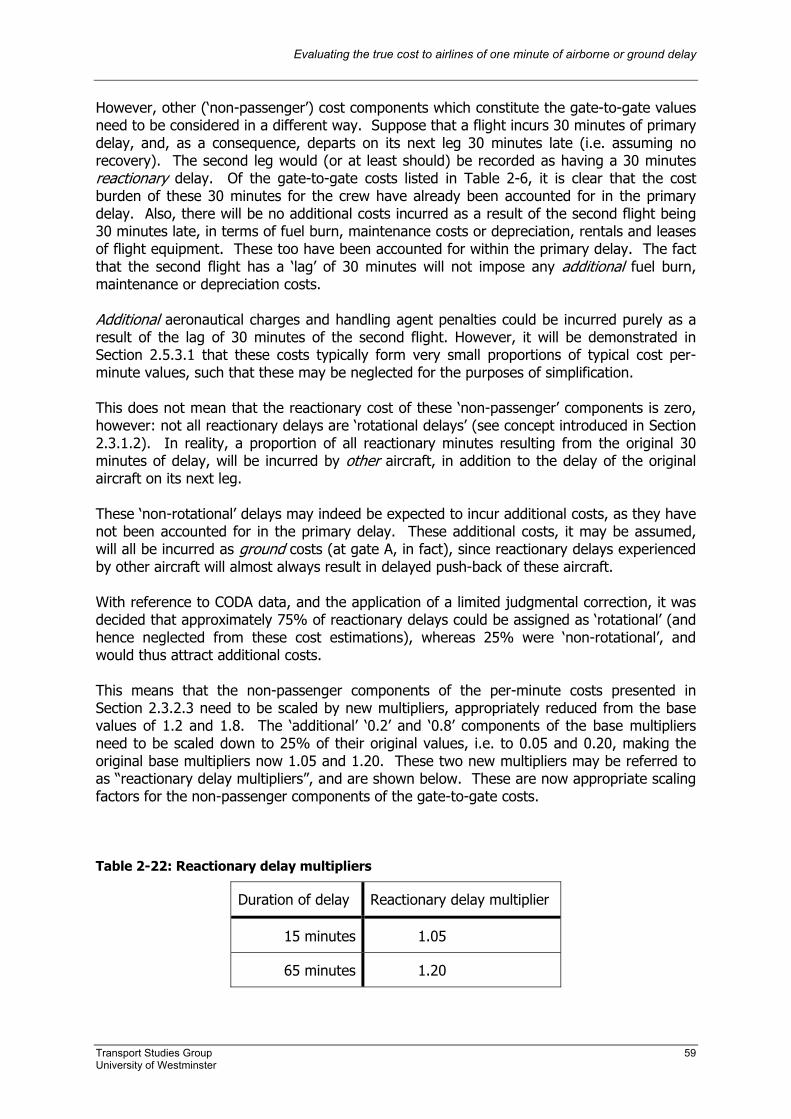
Evaluating the true cost to airlines of one minute of airborne or ground delay
Transport Studies Group 59 University of Westminster
However, other (‘non-passenger’) cost components which constitute the gate-to-gate values need to be considered in a different way. Suppose that a flight incurs 30 minutes of primary delay, and, as a consequence, departs on its next leg 30 minutes late (i.e. assuming no recovery). The second leg would (or at least should) be recorded as having a 30 minutes reactionary delay. Of the gate-to-gate costs listed in Table 2-6, it is clear that the cost burden of these 30 minutes for the crew have already been accounted for in the primary delay. Also, there will be no additional costs incurred as a result of the second flight being 30 minutes late, in terms of fuel burn, maintenance costs or depreciation, rentals and leases of flight equipment. These too have been accounted for within the primary delay. The fact that the second flight has a ‘lag’ of 30 minutes will not impose any additional fuel burn, maintenance or depreciation costs. Additional aeronautical charges and handling agent penalties could be incurred purely as a result of the lag of 30 minutes of the second flight. However, it will be demonstrated in Section 2.5.3.1 that these costs typically form very small proportions of typical cost per-minute values, such that these may be neglected for the purposes of simplification. This does not mean that the reactionary cost of these ‘non-passenger’ components is zero, however: not all reactionary delays are ‘rotational delays’ (see concept introduced in Section 2.3.1.2). In reality, a proportion of all reactionary minutes resulting from the original 30 minutes of delay, will be incurred by other aircraft, in addition to the delay of the original aircraft on its next leg. These ‘non-rotational’ delays may indeed be expected to incur additional costs, as they have not been accounted for in the primary delay. These additional costs, it may be assumed, will all be incurred as ground costs (at gate A, in fact), since reactionary delays experienced by other aircraft will almost always result in delayed push-back of these aircraft. With reference to CODA data, and the application of a limited judgmental correction, it was decided that approximately 75% of reactionary delays could be assigned as ‘rotational’ (and hence neglected from these cost estimations), whereas 25% were ‘non-rotational’, and would thus attract additional costs. This means that the non-passenger components of the per-minute costs presented in Section 2.3.2.3 need to be scaled by new multipliers, appropriately reduced from the base values of 1.2 and 1.8. The ‘additional’ ‘0.2’ and ‘0.8’ components of the base multipliers need to be scaled down to 25% of their original values, i.e. to 0.05 and 0.20, making the original base multipliers now 1.05 and 1.20. These two new multipliers may be referred to as “reactionary delay multipliers”, and are shown below. These are now appropriate scaling factors for the non-passenger components of the gate-to-gate costs. Table 2-22: Reactionary delay multipliers
Duration of delay Reactionary delay multiplier
15 minutes 1.05
65 minutes 1.20
Evaluating the true cost to airlines of one minute of airborne or ground delay
Transport Studies Group 60 University of Westminster
Using these multipliers in this way implicitly assumes that the per-minute cost of the non-rotational, reactionary delay is the same as the cost of primary delay, i.e. both marginal ground (at gate) costs are the same. It is thus important, when estimating costs which may not be considered as independent gate-to-gate costs (fuel burn is an example of such an independent cost), that these are not over-estimated at the ‘primary’ gate-to-gate level, otherwise double-allocation will occur. Thus, the crew cost calculations undertaken in this Study have erred on the conservative side, particularly in anticipation of avoiding this double-counting (see Section 2.3.2.3.4). It could be argued that as delay effects escalate and multiply through a network, they become more expensive, as the network becomes further and further from its planned operational state. However, neither increased nor reduced non-rotational, reactionary costs (compared to primary) will be assumed here, but rather those of cost equality. In summary of the way the reactionary network costs have been computed, the following steps were taken (although the intermediate steps are not shown): • gate-to-gate values presented in Section 2.3.2.3 were separated into ‘passenger’ and
‘non-passenger’ components; • ‘passenger’ components were multiplied by the appropriate ‘base delay multipliers’, of
1.20 and 1.80 (for 15-minute and 65-minute based costs, respectively); • ‘non-passenger’ components were scaled up using the appropriate ‘reactionary delay
multipliers’, of 1.05 and 1.20 (for 15-minute and 65-minute based costs, respectively). Whether the primary delay was incurred on the ground or airborne, factors of ‘0.05’ or ‘0.20’ of additional ground delay cost (at gate A – see Table 2-16) were added;
• the results of these calculations are presented over the following pages of tables, which
are indexed for ease of reference in Table 2-23. These values now represent per-minute costs which include estimates of associated network reactionary costs.
Plotting the base values of Table 2-26 and Table 2-25 results in the plot shown in Figure 2-7. This linear regression of at-gate and airborne marginal delay costs as function of aircraft seats (i.e. total aircraft seats, not occupied seats) shows a good linear fit of the marginal cost of delay. These regressions were attempted with the expectation that seat numbers could be a good indicator of aircraft marginal delay costs per minute, as most operating costs are some function of size / weight or passenger numbers. For example, fuel burn has a dependency on size and weight (which may be partially proxied by seat numbers), airport charges are dependent on MTOW and passenger numbers (which may also be proxied by seat numbers), and passenger ‘hard’ and ‘soft’ costs are also a function of seat numbers (particularly under model assumptions of constant load factors). The strength of these fits will clearly increase as components which are more closely related to passenger costs are increased – so, for example, if European passenger compensation levels were to increase markedly, these fits would become even better (i.e. the points would become even more tightly clustered around the lines). The cost of delay equations are given in the two tables following the plot (the former to higher precision for users who may wish to use these equations to test the fits, or model other aircraft data; the latter as a more indicative version). It will be noted that the seat dependencies and strength of fit (r2 values) are higher for the base 65-minute based values, which have passenger components included (unlike the base 15-minute based values) according to the scenarios of Table 2-5.
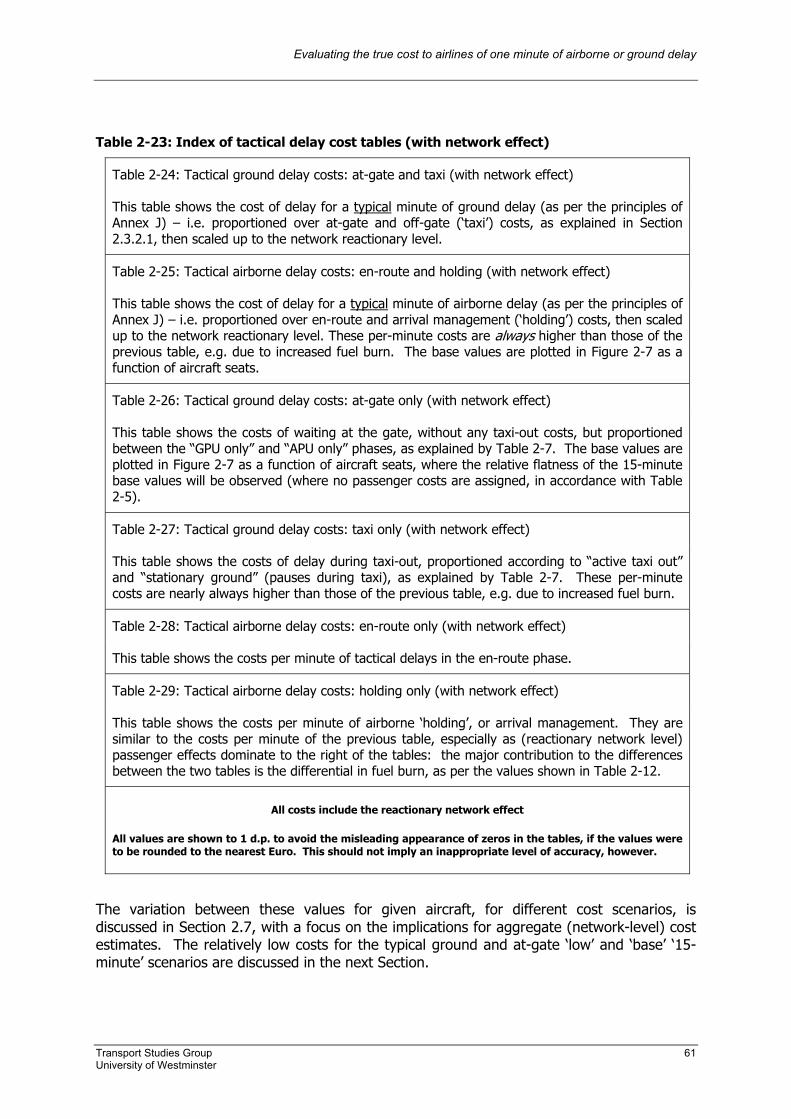
Evaluating the true cost to airlines of one minute of airborne or ground delay
Transport Studies Group 61 University of Westminster
Table 2-23: Index of tactical delay cost tables (with network effect)
Table 2-24: Tactical ground delay costs: at-gate and taxi (with network effect)
This table shows the cost of delay for a typical minute of ground delay (as per the principles of Annex J) – i.e. proportioned over at-gate and off-gate (‘taxi’) costs, as explained in Section 2.3.2.1, then scaled up to the network reactionary level.
Table 2-25: Tactical airborne delay costs: en-route and holding (with network effect)
This table shows the cost of delay for a typical minute of airborne delay (as per the principles of Annex J) – i.e. proportioned over en-route and arrival management (‘holding’) costs, then scaled up to the network reactionary level. These per-minute costs are always higher than those of the previous table, e.g. due to increased fuel burn. The base values are plotted in Figure 2-7 as a function of aircraft seats.
Table 2-26: Tactical ground delay costs: at-gate only (with network effect)
This table shows the costs of waiting at the gate, without any taxi-out costs, but proportioned between the “GPU only” and “APU only” phases, as explained by Table 2-7. The base values are plotted in Figure 2-7 as a function of aircraft seats, where the relative flatness of the 15-minute base values will be observed (where no passenger costs are assigned, in accordance with Table 2-5).
Table 2-27: Tactical ground delay costs: taxi only (with network effect)
This table shows the costs of delay during taxi-out, proportioned according to “active taxi out” and “stationary ground” (pauses during taxi), as explained by Table 2-7. These per-minute costs are nearly always higher than those of the previous table, e.g. due to increased fuel burn.
Table 2-28: Tactical airborne delay costs: en-route only (with network effect)
This table shows the costs per minute of tactical delays in the en-route phase.
Table 2-29: Tactical airborne delay costs: holding only (with network effect)
This table shows the costs per minute of airborne ‘holding’, or arrival management. They are similar to the costs per minute of the previous table, especially as (reactionary network level) passenger effects dominate to the right of the tables: the major contribution to the differences between the two tables is the differential in fuel burn, as per the values shown in Table 2-12.
All costs include the reactionary network effect
All values are shown to 1 d.p. to avoid the misleading appearance of zeros in the tables, if the values were to be rounded to the nearest Euro. This should not imply an inappropriate level of accuracy, however.
The variation between these values for given aircraft, for different cost scenarios, is discussed in Section 2.7, with a focus on the implications for aggregate (network-level) cost estimates. The relatively low costs for the typical ground and at-gate ‘low’ and ‘base’ ‘15-minute’ scenarios are discussed in the next Section.
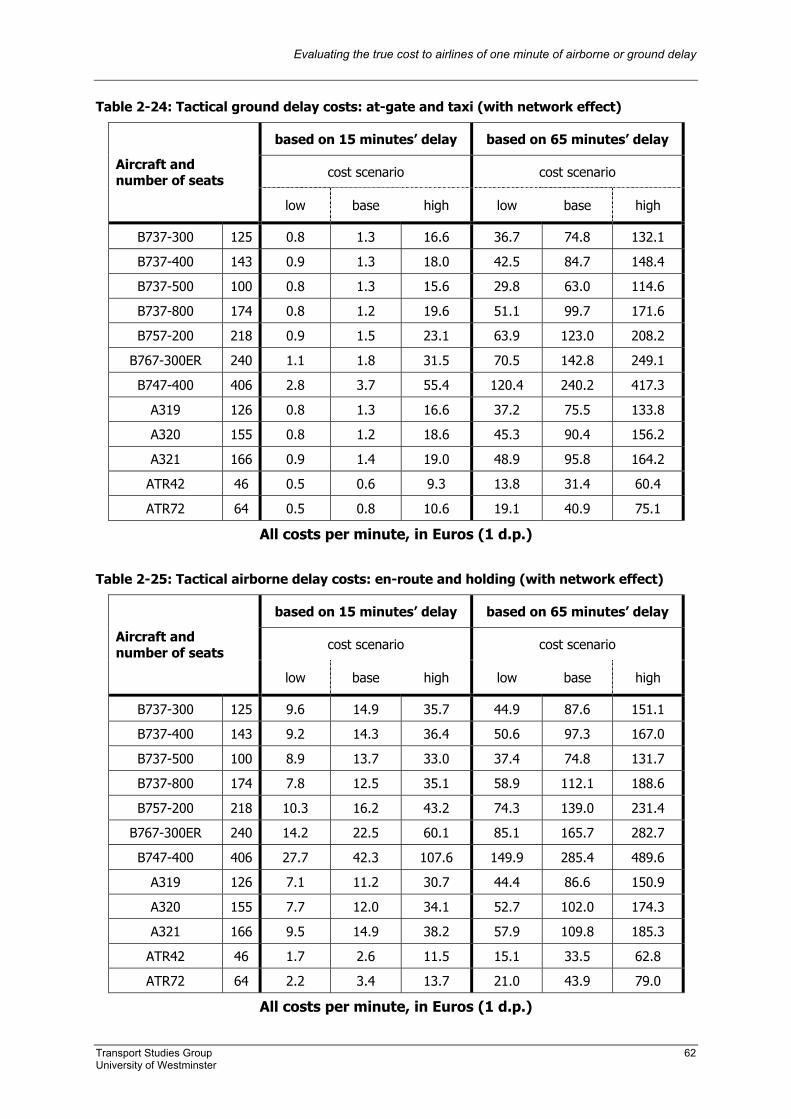
Evaluating the true cost to airlines of one minute of airborne or ground delay
Transport Studies Group 62 University of Westminster
Table 2-24: Tactical ground delay costs: at-gate and taxi (with network effect)
based on 15 minutes’ delay based on 65 minutes’ delay
cost scenario cost scenario Aircraft and number of seats
low base high low base high
B737-300 125 0.8 1.3 16.6 36.7 74.8 132.1
B737-400 143 0.9 1.3 18.0 42.5 84.7 148.4
B737-500 100 0.8 1.3 15.6 29.8 63.0 114.6
B737-800 174 0.8 1.2 19.6 51.1 99.7 171.6
B757-200 218 0.9 1.5 23.1 63.9 123.0 208.2
B767-300ER 240 1.1 1.8 31.5 70.5 142.8 249.1
B747-400 406 2.8 3.7 55.4 120.4 240.2 417.3
A319 126 0.8 1.3 16.6 37.2 75.5 133.8
A320 155 0.8 1.2 18.6 45.3 90.4 156.2
A321 166 0.9 1.4 19.0 48.9 95.8 164.2
ATR42 46 0.5 0.6 9.3 13.8 31.4 60.4
ATR72 64 0.5 0.8 10.6 19.1 40.9 75.1
All costs per minute, in Euros (1 d.p.)
Table 2-25: Tactical airborne delay costs: en-route and holding (with network effect)
based on 15 minutes’ delay based on 65 minutes’ delay
cost scenario cost scenario Aircraft and number of seats
low base high low base high
B737-300 125 9.6 14.9 35.7 44.9 87.6 151.1
B737-400 143 9.2 14.3 36.4 50.6 97.3 167.0
B737-500 100 8.9 13.7 33.0 37.4 74.8 131.7
B737-800 174 7.8 12.5 35.1 58.9 112.1 188.6
B757-200 218 10.3 16.2 43.2 74.3 139.0 231.4
B767-300ER 240 14.2 22.5 60.1 85.1 165.7 282.7
B747-400 406 27.7 42.3 107.6 149.9 285.4 489.6
A319 126 7.1 11.2 30.7 44.4 86.6 150.9
A320 155 7.7 12.0 34.1 52.7 102.0 174.3
A321 166 9.5 14.9 38.2 57.9 109.8 185.3
ATR42 46 1.7 2.6 11.5 15.1 33.5 62.8
ATR72 64 2.2 3.4 13.7 21.0 43.9 79.0
All costs per minute, in Euros (1 d.p.)
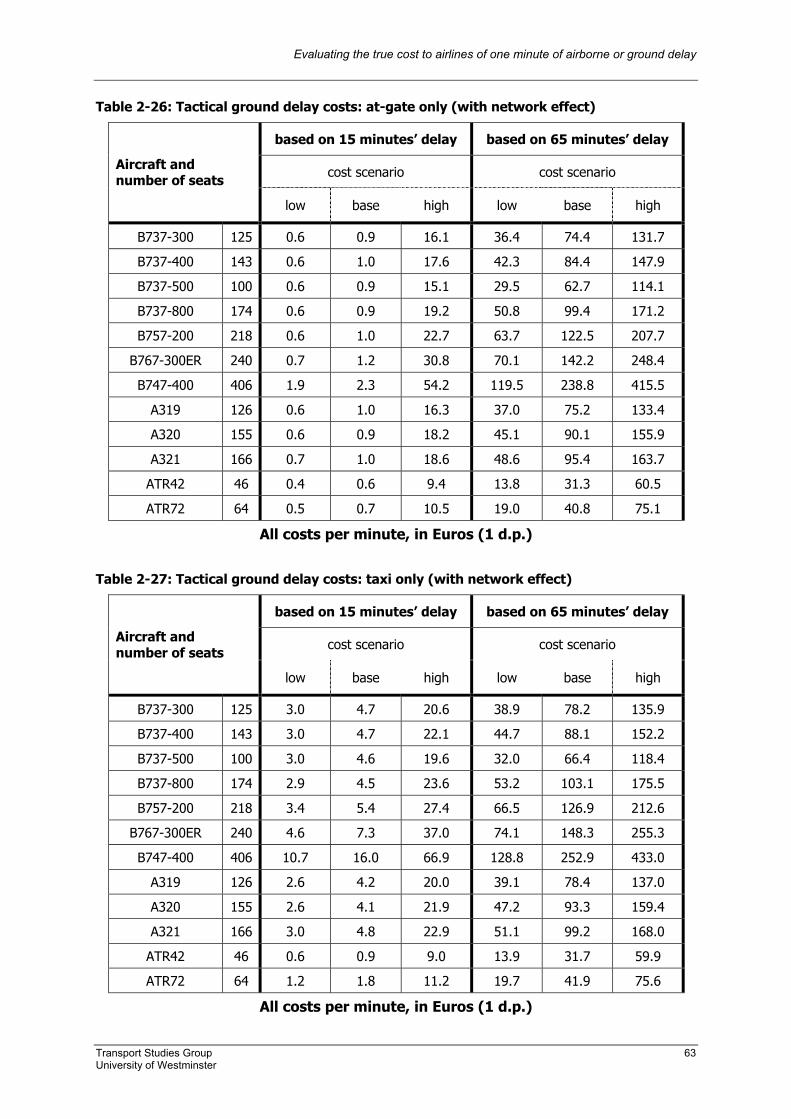
Evaluating the true cost to airlines of one minute of airborne or ground delay
Transport Studies Group 63 University of Westminster
Table 2-26: Tactical ground delay costs: at-gate only (with network effect)
based on 15 minutes’ delay based on 65 minutes’ delay
cost scenario cost scenario Aircraft and number of seats
low base high low base high
B737-300 125 0.6 0.9 16.1 36.4 74.4 131.7
B737-400 143 0.6 1.0 17.6 42.3 84.4 147.9
B737-500 100 0.6 0.9 15.1 29.5 62.7 114.1
B737-800 174 0.6 0.9 19.2 50.8 99.4 171.2
B757-200 218 0.6 1.0 22.7 63.7 122.5 207.7
B767-300ER 240 0.7 1.2 30.8 70.1 142.2 248.4
B747-400 406 1.9 2.3 54.2 119.5 238.8 415.5
A319 126 0.6 1.0 16.3 37.0 75.2 133.4
A320 155 0.6 0.9 18.2 45.1 90.1 155.9
A321 166 0.7 1.0 18.6 48.6 95.4 163.7
ATR42 46 0.4 0.6 9.4 13.8 31.3 60.5
ATR72 64 0.5 0.7 10.5 19.0 40.8 75.1
All costs per minute, in Euros (1 d.p.)
Table 2-27: Tactical ground delay costs: taxi only (with network effect)
based on 15 minutes’ delay based on 65 minutes’ delay
cost scenario cost scenario Aircraft and number of seats
low base high low base high
B737-300 125 3.0 4.7 20.6 38.9 78.2 135.9
B737-400 143 3.0 4.7 22.1 44.7 88.1 152.2
B737-500 100 3.0 4.6 19.6 32.0 66.4 118.4
B737-800 174 2.9 4.5 23.6 53.2 103.1 175.5
B757-200 218 3.4 5.4 27.4 66.5 126.9 212.6
B767-300ER 240 4.6 7.3 37.0 74.1 148.3 255.3
B747-400 406 10.7 16.0 66.9 128.8 252.9 433.0
A319 126 2.6 4.2 20.0 39.1 78.4 137.0
A320 155 2.6 4.1 21.9 47.2 93.3 159.4
A321 166 3.0 4.8 22.9 51.1 99.2 168.0
ATR42 46 0.6 0.9 9.0 13.9 31.7 59.9
ATR72 64 1.2 1.8 11.2 19.7 41.9 75.6
All costs per minute, in Euros (1 d.p.)
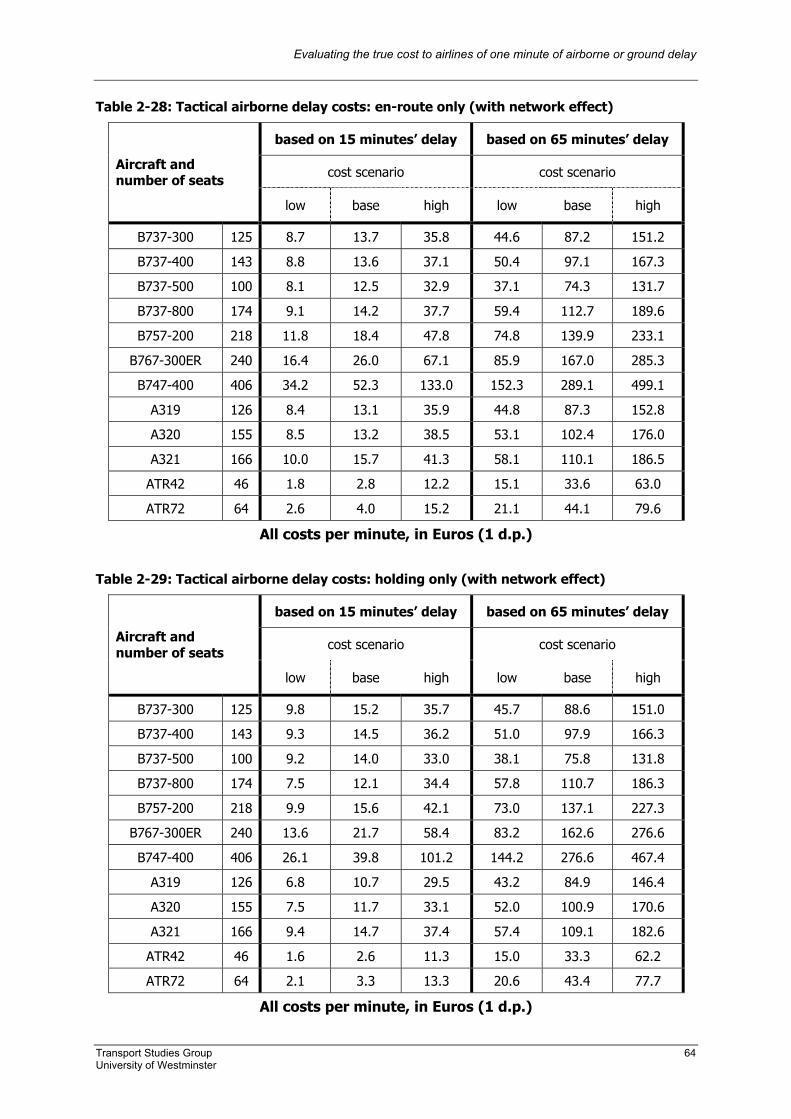
Evaluating the true cost to airlines of one minute of airborne or ground delay
Transport Studies Group 64 University of Westminster
Table 2-28: Tactical airborne delay costs: en-route only (with network effect)
based on 15 minutes’ delay based on 65 minutes’ delay
cost scenario cost scenario Aircraft and number of seats
low base high low base high
B737-300 125 8.7 13.7 35.8 44.6 87.2 151.2
B737-400 143 8.8 13.6 37.1 50.4 97.1 167.3
B737-500 100 8.1 12.5 32.9 37.1 74.3 131.7
B737-800 174 9.1 14.2 37.7 59.4 112.7 189.6
B757-200 218 11.8 18.4 47.8 74.8 139.9 233.1
B767-300ER 240 16.4 26.0 67.1 85.9 167.0 285.3
B747-400 406 34.2 52.3 133.0 152.3 289.1 499.1
A319 126 8.4 13.1 35.9 44.8 87.3 152.8
A320 155 8.5 13.2 38.5 53.1 102.4 176.0
A321 166 10.0 15.7 41.3 58.1 110.1 186.5
ATR42 46 1.8 2.8 12.2 15.1 33.6 63.0
ATR72 64 2.6 4.0 15.2 21.1 44.1 79.6
All costs per minute, in Euros (1 d.p.)
Table 2-29: Tactical airborne delay costs: holding only (with network effect)
based on 15 minutes’ delay based on 65 minutes’ delay
cost scenario cost scenario Aircraft and number of seats
low base high low base high
B737-300 125 9.8 15.2 35.7 45.7 88.6 151.0
B737-400 143 9.3 14.5 36.2 51.0 97.9 166.3
B737-500 100 9.2 14.0 33.0 38.1 75.8 131.8
B737-800 174 7.5 12.1 34.4 57.8 110.7 186.3
B757-200 218 9.9 15.6 42.1 73.0 137.1 227.3
B767-300ER 240 13.6 21.7 58.4 83.2 162.6 276.6
B747-400 406 26.1 39.8 101.2 144.2 276.6 467.4
A319 126 6.8 10.7 29.5 43.2 84.9 146.4
A320 155 7.5 11.7 33.1 52.0 100.9 170.6
A321 166 9.4 14.7 37.4 57.4 109.1 182.6
ATR42 46 1.6 2.6 11.3 15.0 33.3 62.2
ATR72 64 2.1 3.3 13.3 20.6 43.4 77.7
All costs per minute, in Euros (1 d.p.)
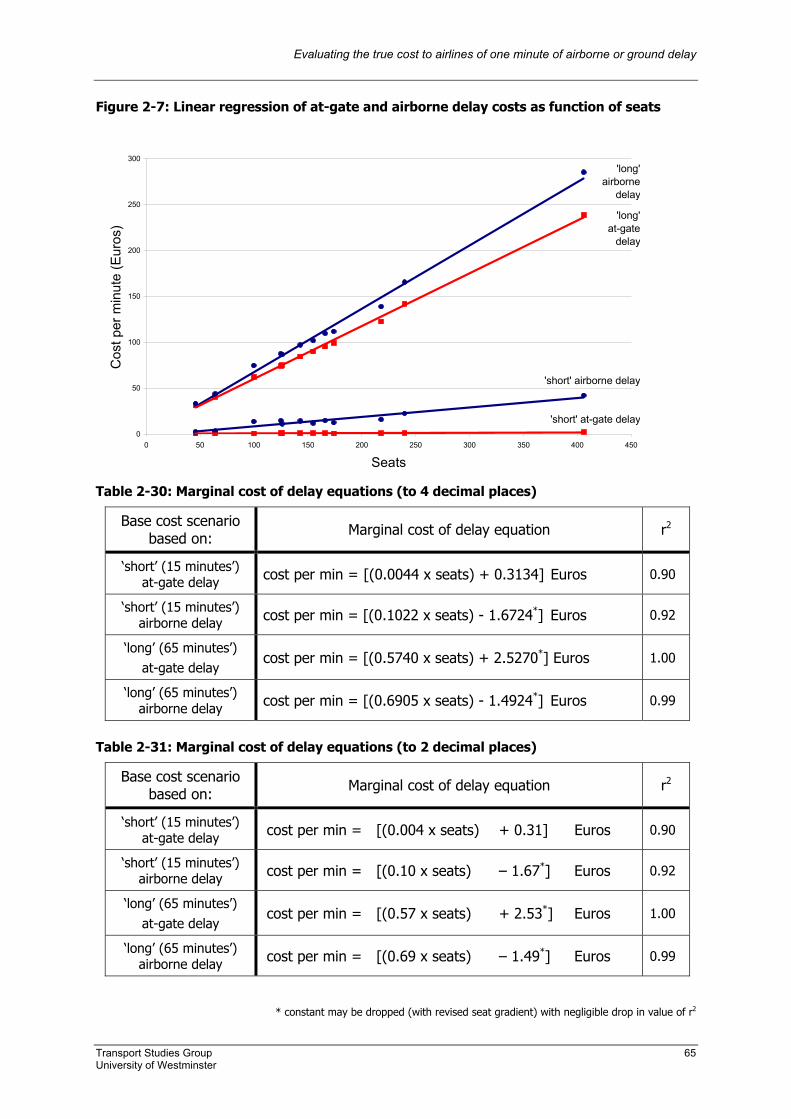
Evaluating the true cost to airlines of one minute of airborne or ground delay
Transport Studies Group 65 University of Westminster
Figure 2-7: Linear regression of at-gate and airborne delay costs as function of seats
Table 2-30: Marginal cost of delay equations (to 4 decimal places)
Base cost scenario based on: Marginal cost of delay equation r2
‘short’ (15 minutes’) at-gate delay cost per min = [(0.0044 x seats) + 0.3134] Euros 0.90
‘short’ (15 minutes’) airborne delay cost per min = [(0.1022 x seats) - 1.6724*] Euros 0.92
‘long’ (65 minutes’) at-gate delay
cost per min = [(0.5740 x seats) + 2.5270*] Euros 1.00
‘long’ (65 minutes’) airborne delay cost per min = [(0.6905 x seats) - 1.4924*] Euros 0.99
Table 2-31: Marginal cost of delay equations (to 2 decimal places)
Base cost scenario based on: Marginal cost of delay equation r2
‘short’ (15 minutes’) at-gate delay cost per min = [(0.004 x seats) + 0.31] Euros 0.90
‘short’ (15 minutes’) airborne delay cost per min = [(0.10 x seats) – 1.67*] Euros 0.92
‘long’ (65 minutes’) at-gate delay
cost per min = [(0.57 x seats) + 2.53*] Euros 1.00
‘long’ (65 minutes’) airborne delay cost per min = [(0.69 x seats) – 1.49*] Euros 0.99
* constant may be dropped (with revised seat gradient) with negligible drop in value of r2
0
50
100
150
200
250
300
0 50 100 150 200 250 300 350 400 450
Seats
Cos
t per
min
ute
(Eur
os)
'long' airborne
delay
'long' at-gate
delay
'short' at-gate delay
'short' airborne delay
Evaluating the true cost to airlines of one minute of airborne or ground delay
Transport Studies Group 66 University of Westminster
2.5.2 Focus on airborne and ground delay trade-offs From the linear fits just plotted, and the equations shown, it is clear that airborne delays are typically more expensive than ground delays. Also apparent are the relatively low costs for the ‘short’ at-gate delays, on the base cost scenarios. Comparing the costs of Table 2-25 and Table 2-26 for short delays (i.e. of up to 15 minutes, left-hand side of each table), suggests that it is hardly worth pursuing re-route options for CTOT delays of up to 15 minutes. Using the base scenarios for the different aircraft, airborne extensions of no more than between 1 and 3 minutes, with a reduction of the CTOT delay right back to zero (i.e. back to the original EOBT plus taxi time) would be required for the re-route to be acceptable. The ‘upper’ limit of 3 minutes applies to the ATRs; for the larger B747-400 and B767-300ER, even a single extra airborne (fuel burning) minute would not be an acceptable cost trade-off to completely remove the CTOT delay. An underlying factor driving these findings is the assumption in Table 2-5 of zero costs of passenger delay to the AO for delays of up to 15 minutes, for the base scenario. If the high cost scenarios were to be considered, where a small amount of passenger delay cost is assumed, airborne extensions of up to 12 minutes (for the ATR42; only up to 7 minutes for the B747-400) would be accepted, to reduce the CTOT delay from 15 to zero minutes. This computed finding seems to correspond well with AO practice in general terms. Two carriers interviewed had no set procedures but would pursue any (arrival) delay above 15 minutes, whilst one similarly had no set rules in place but would attempt to reduce only delays of above 10 minutes. Workloads in AO operations’ rooms are usually very high, and AOs will find it difficult to allocate precious staff time to reducing smaller delays, when there are usually larger delays to target for reduction (although see later comment in this Section on automatic re-route tools). It is also important to consider a delay of up to 15 minutes in the broader context of uncertainties such as taxi-times, and the –5 / +10 minutes (ATC) ‘slot window’ around the CTOT issued. Although a major overall contribution to delay costs is the cost of passenger delay to the AO (see next Section for cost breakdowns), these costs will typically be negligible for delays of up to 15 minutes, particularly as the arrival delay experienced (as a result of which the vast majority of passenger cost to the AO is incurred) will normally be off-set by schedule buffer, such that even a full 15 minutes of push-back delay may result in only 1 or 2 minutes’ arrival delay. When considering trade-off costs, care needs to be taken regarding which per-minute costs are compared. Typically, a relatively short airborne extension will be considered against a longer reduction in a CTOT delay. However, consider a 60 minute CTOT delay to a flight, with a re-route offering a reduction of 30 minutes to this ATFM delay, but with a 15 minute airborne extension. If the per-minute cost of the 15 minute airborne extension is calculated using values for airborne delays of up to 15 minutes, this would ignore the fact that the 15 minute extension is in addition to the new, expected 30 minute CTOT delay (offered in the re-route). In this case, therefore, and all similar cases, the per-minute cost of the airborne delay should be calculated using the ‘long’ delay type costs (as per the right-hand side of Table 2-25, “based on 65 minutes’ delay”). Although the airborne extensions offered in re-routes are often ‘short’ (up to 15 minutes), using the ‘short’ delay per-minute costs do not take into account, for example, the passenger delay costs associated with each airborne extension minute, due to the net arrival delay being greater than 15 minutes.
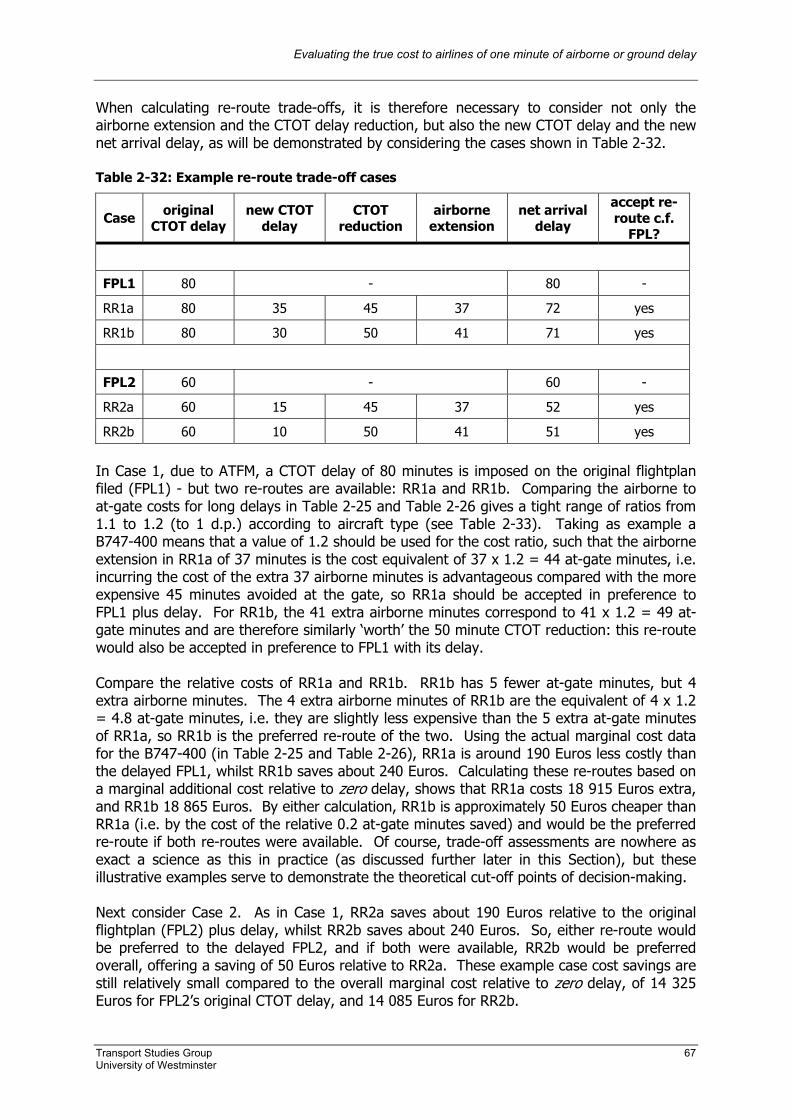
Evaluating the true cost to airlines of one minute of airborne or ground delay
Transport Studies Group 67 University of Westminster
When calculating re-route trade-offs, it is therefore necessary to consider not only the airborne extension and the CTOT delay reduction, but also the new CTOT delay and the new net arrival delay, as will be demonstrated by considering the cases shown in Table 2-32. Table 2-32: Example re-route trade-off cases
Case original CTOT delay
new CTOT delay
CTOT reduction
airborne extension
net arrival delay
accept re-route c.f.
FPL?
FPL1 80 - 80 -
RR1a 80 35 45 37 72 yes
RR1b 80 30 50 41 71 yes
FPL2 60 - 60 -
RR2a 60 15 45 37 52 yes
RR2b 60 10 50 41 51 yes
In Case 1, due to ATFM, a CTOT delay of 80 minutes is imposed on the original flightplan filed (FPL1) - but two re-routes are available: RR1a and RR1b. Comparing the airborne to at-gate costs for long delays in Table 2-25 and Table 2-26 gives a tight range of ratios from 1.1 to 1.2 (to 1 d.p.) according to aircraft type (see Table 2-33). Taking as example a B747-400 means that a value of 1.2 should be used for the cost ratio, such that the airborne extension in RR1a of 37 minutes is the cost equivalent of 37 x 1.2 = 44 at-gate minutes, i.e. incurring the cost of the extra 37 airborne minutes is advantageous compared with the more expensive 45 minutes avoided at the gate, so RR1a should be accepted in preference to FPL1 plus delay. For RR1b, the 41 extra airborne minutes correspond to 41 x 1.2 = 49 at-gate minutes and are therefore similarly ‘worth’ the 50 minute CTOT reduction: this re-route would also be accepted in preference to FPL1 with its delay. Compare the relative costs of RR1a and RR1b. RR1b has 5 fewer at-gate minutes, but 4 extra airborne minutes. The 4 extra airborne minutes of RR1b are the equivalent of 4 x 1.2 = 4.8 at-gate minutes, i.e. they are slightly less expensive than the 5 extra at-gate minutes of RR1a, so RR1b is the preferred re-route of the two. Using the actual marginal cost data for the B747-400 (in Table 2-25 and Table 2-26), RR1a is around 190 Euros less costly than the delayed FPL1, whilst RR1b saves about 240 Euros. Calculating these re-routes based on a marginal additional cost relative to zero delay, shows that RR1a costs 18 915 Euros extra, and RR1b 18 865 Euros. By either calculation, RR1b is approximately 50 Euros cheaper than RR1a (i.e. by the cost of the relative 0.2 at-gate minutes saved) and would be the preferred re-route if both re-routes were available. Of course, trade-off assessments are nowhere as exact a science as this in practice (as discussed further later in this Section), but these illustrative examples serve to demonstrate the theoretical cut-off points of decision-making. Next consider Case 2. As in Case 1, RR2a saves about 190 Euros relative to the original flightplan (FPL2) plus delay, whilst RR2b saves about 240 Euros. So, either re-route would be preferred to the delayed FPL2, and if both were available, RR2b would be preferred overall, offering a saving of 50 Euros relative to RR2a. These example case cost savings are still relatively small compared to the overall marginal cost relative to zero delay, of 14 325 Euros for FPL2’s original CTOT delay, and 14 085 Euros for RR2b.
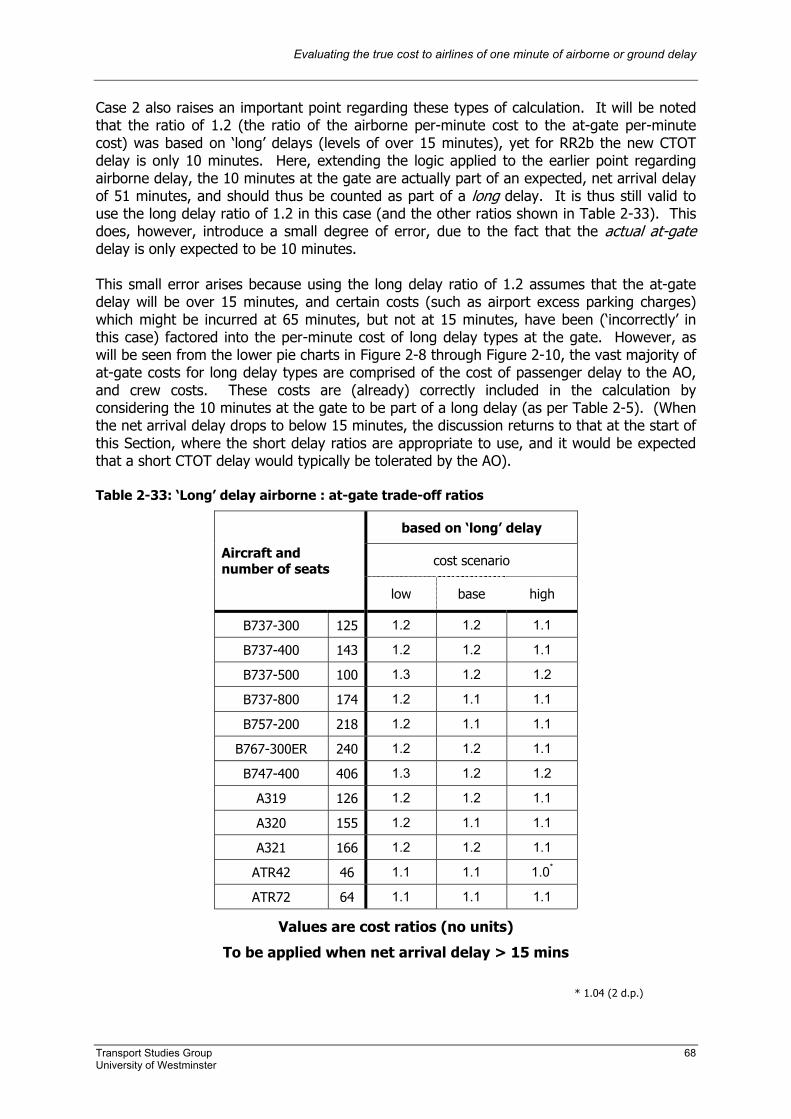
Evaluating the true cost to airlines of one minute of airborne or ground delay
Transport Studies Group 68 University of Westminster
Case 2 also raises an important point regarding these types of calculation. It will be noted that the ratio of 1.2 (the ratio of the airborne per-minute cost to the at-gate per-minute cost) was based on ‘long’ delays (levels of over 15 minutes), yet for RR2b the new CTOT delay is only 10 minutes. Here, extending the logic applied to the earlier point regarding airborne delay, the 10 minutes at the gate are actually part of an expected, net arrival delay of 51 minutes, and should thus be counted as part of a long delay. It is thus still valid to use the long delay ratio of 1.2 in this case (and the other ratios shown in Table 2-33). This does, however, introduce a small degree of error, due to the fact that the actual at-gate delay is only expected to be 10 minutes. This small error arises because using the long delay ratio of 1.2 assumes that the at-gate delay will be over 15 minutes, and certain costs (such as airport excess parking charges) which might be incurred at 65 minutes, but not at 15 minutes, have been (‘incorrectly’ in this case) factored into the per-minute cost of long delay types at the gate. However, as will be seen from the lower pie charts in Figure 2-8 through Figure 2-10, the vast majority of at-gate costs for long delay types are comprised of the cost of passenger delay to the AO, and crew costs. These costs are (already) correctly included in the calculation by considering the 10 minutes at the gate to be part of a long delay (as per Table 2-5). (When the net arrival delay drops to below 15 minutes, the discussion returns to that at the start of this Section, where the short delay ratios are appropriate to use, and it would be expected that a short CTOT delay would typically be tolerated by the AO). Table 2-33: ‘Long’ delay airborne : at-gate trade-off ratios
based on ‘long’ delay
cost scenario Aircraft and number of seats
low base high
B737-300 125 1.2 1.2 1.1
B737-400 143 1.2 1.2 1.1
B737-500 100 1.3 1.2 1.2
B737-800 174 1.2 1.1 1.1
B757-200 218 1.2 1.1 1.1
B767-300ER 240 1.2 1.2 1.1
B747-400 406 1.3 1.2 1.2
A319 126 1.2 1.2 1.1
A320 155 1.2 1.1 1.1
A321 166 1.2 1.2 1.1
ATR42 46 1.1 1.1 1.0*
ATR72 64 1.1 1.1 1.1
Values are cost ratios (no units)
To be applied when net arrival delay > 15 mins
* 1.04 (2 d.p.)
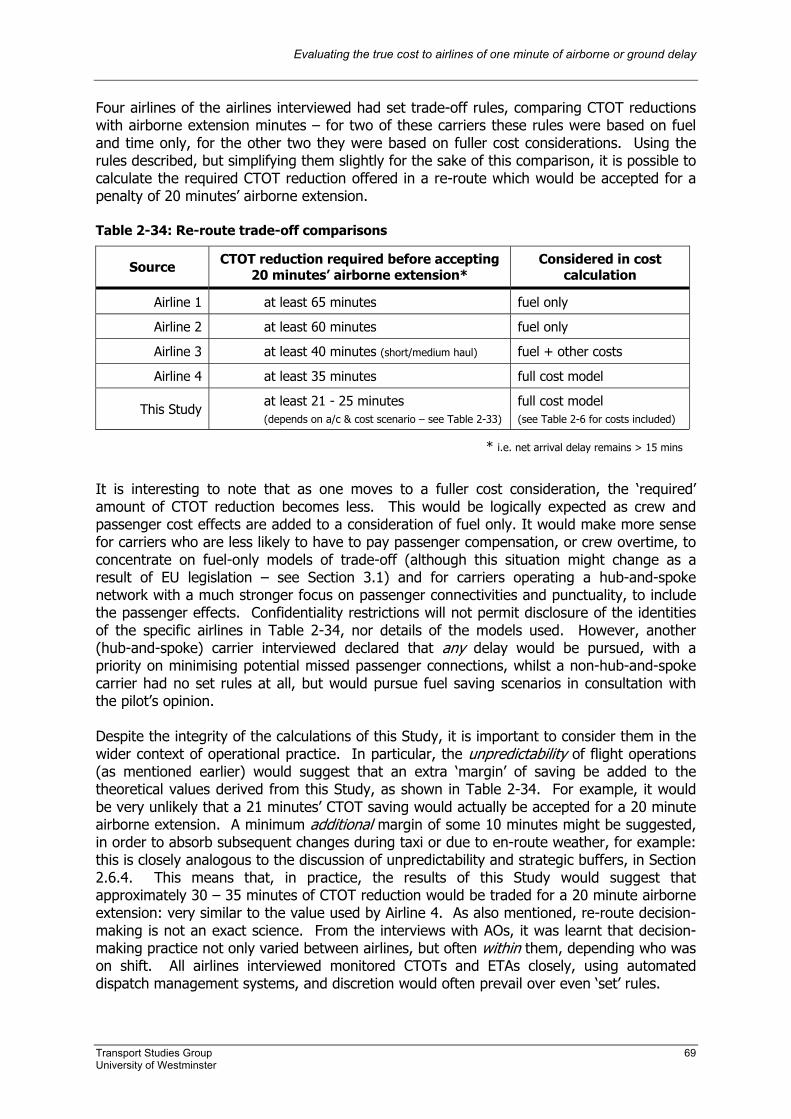
Evaluating the true cost to airlines of one minute of airborne or ground delay
Transport Studies Group 69 University of Westminster
Four airlines of the airlines interviewed had set trade-off rules, comparing CTOT reductions with airborne extension minutes – for two of these carriers these rules were based on fuel and time only, for the other two they were based on fuller cost considerations. Using the rules described, but simplifying them slightly for the sake of this comparison, it is possible to calculate the required CTOT reduction offered in a re-route which would be accepted for a penalty of 20 minutes’ airborne extension. Table 2-34: Re-route trade-off comparisons
Source CTOT reduction required before accepting 20 minutes’ airborne extension*
Considered in cost calculation
Airline 1 at least 65 minutes fuel only
Airline 2 at least 60 minutes fuel only
Airline 3 at least 40 minutes (short/medium haul) fuel + other costs
Airline 4 at least 35 minutes full cost model
This Study at least 21 - 25 minutes (depends on a/c & cost scenario – see Table 2-33)
full cost model (see Table 2-6 for costs included)
* i.e. net arrival delay remains > 15 mins
It is interesting to note that as one moves to a fuller cost consideration, the ‘required’ amount of CTOT reduction becomes less. This would be logically expected as crew and passenger cost effects are added to a consideration of fuel only. It would make more sense for carriers who are less likely to have to pay passenger compensation, or crew overtime, to concentrate on fuel-only models of trade-off (although this situation might change as a result of EU legislation – see Section 3.1) and for carriers operating a hub-and-spoke network with a much stronger focus on passenger connectivities and punctuality, to include the passenger effects. Confidentiality restrictions will not permit disclosure of the identities of the specific airlines in Table 2-34, nor details of the models used. However, another (hub-and-spoke) carrier interviewed declared that any delay would be pursued, with a priority on minimising potential missed passenger connections, whilst a non-hub-and-spoke carrier had no set rules at all, but would pursue fuel saving scenarios in consultation with the pilot’s opinion. Despite the integrity of the calculations of this Study, it is important to consider them in the wider context of operational practice. In particular, the unpredictability of flight operations (as mentioned earlier) would suggest that an extra ‘margin’ of saving be added to the theoretical values derived from this Study, as shown in Table 2-34. For example, it would be very unlikely that a 21 minutes’ CTOT saving would actually be accepted for a 20 minute airborne extension. A minimum additional margin of some 10 minutes might be suggested, in order to absorb subsequent changes during taxi or due to en-route weather, for example: this is closely analogous to the discussion of unpredictability and strategic buffers, in Section 2.6.4. This means that, in practice, the results of this Study would suggest that approximately 30 – 35 minutes of CTOT reduction would be traded for a 20 minute airborne extension: very similar to the value used by Airline 4. As also mentioned, re-route decision-making is not an exact science. From the interviews with AOs, it was learnt that decision-making practice not only varied between airlines, but often within them, depending who was on shift. All airlines interviewed monitored CTOTs and ETAs closely, using automated dispatch management systems, and discretion would often prevail over even ‘set’ rules.
Evaluating the true cost to airlines of one minute of airborne or ground delay
Transport Studies Group 70 University of Westminster
For example, all airlines were aware of subsequent rotations of aircraft, and priorities such as crew-out-of-hours and airport curfews were watched carefully, and could override existing ‘default’ rules. Local decision-makers may also affect the outcome of whether to accept a re-route or not. Even a small number of connecting passengers might lead the AO to accept a re-route to avoid a relatively small delay in cases where it might not otherwise, based more on ‘gut reaction’ than any formal trade-off calculation. Equally, the desire to push back on time to improve punctuality records may also (unduly) bias an AO towards accepting a re-route. (This ‘soft’ cost of punctuality has theoretically been included in this Study’s calculation of the passenger cost of delay to the AOs, as detailed in Section 2.3.2.3.7). Alternatively, an AO may decide not to accept a re-route, but to retain the slot given, based on local knowledge and previous experience that the slot for the original FPL may well improve, or to make an altruistic decision to benefit other airlines, at the request of air traffic management. Furthermore, care has to be taken in the way the results of the calculations of this Study are used. Firstly, treating all delays above 15 minutes as a common group clearly has certain limitations. The ratio of the airborne to at-gate costs of 1.2 might break down as the actual length of delay starts to increase. One way to partially account for this is to move from using a low cost scenario, to a base cost scenario, or from base to high, as per the ratios in Table 2-33. These ratios always decrease moving from a lower to a higher cost scenario for a given aircraft, implying that shorter CTOT savings relative to airborne extensions would become increasingly desirable. These changes are not very pronounced in the Table, however, and would be expected to be steeper still if ratios were modelled for delays based on 120 minutes, for example. Of course, delays much higher than this are rather rare, and a point will be reached where the flight will be cancelled: these costs have not been considered (although see sections 3.1 and 3.3). Secondly, care must be exercised in taking the 15-minute ‘cut-off’ value too literally. The methodology of this Study and the scenarios described in Table 2-5 were based on the premise of using 15 minutes as the boundary between ‘short’ and ‘long’ delay types, assuming, for example, that base cost scenarios for delays of up to 15 minutes would not incur passenger delay or crew costs. Had a value of 10 or 20 minutes been chosen, this would affect some of the quantitative statements in this Section regarding decision-making cut-off points. Although the 15-minute value chosen is nonetheless considered to be a perfectly credible one (for reasons detailed in Section 2.3.1.3: “Using ‘long’ and ‘short’ delay types”) it should not be taken too much in the absolute, literal sense. As has been observed, this ‘boundary’ between short and long delay types might move somewhat on a case-by-case decision-making basis, although remaining perfectly robust at the macro level. The following is presented as a summary of the preceding discussion, although the foregoing context must be borne in mind:
Ratios of at-gate to airborne marginal delay costs suggest that, on average, flights with ‘short’ CTOT delays (e.g. up to 15 minutes) are not usually worth re-routing, whereas for longer delays, an airborne extension of n minutes is typically worth accepting if it reduces the CTOT by around [(1.1n – 1.3n) + 10] minutes (if passenger delay and crew overtime costs will be incurred by the airline).
Evaluating the true cost to airlines of one minute of airborne or ground delay
Transport Studies Group 71 University of Westminster
In terms of actual AO practice, it would very interesting to examine re-route proposals actually accepted by AOs, were CFMU data to allow this. Such data would unfortunately be likely to be biased, as for certain message exchanges (e.g. the ‘CHG’ [change] message) it would presumably not be possible to determine whether they were the result of a response to a re-route proposal, AOWIR evaluation, or some other situation not connected with a re-route trade-off. Nonetheless, logs of re-route specific messaging might offer useful insights into AO practice, such as revealing averages and ranges of CTOT delay and corresponding airborne extensions which were rejected by AOs (e.g. by RJT messages). Such AO practice could well change were automatic re-route assessment tools to be developed (see first recommendation in Section 3.3). Such tools could allow AOs to pre-set parameters for accepting re-routes and, since such a process would be automated, even relatively smaller savings could be accepted by AOs, as they would require minimal human resourcing (currently a major barrier to such re-routes being accepted). This could amount to significant savings over time. It could also allow offered re-routes to be actively rejected, instead of allowing passive expiry, thus affording a more efficient use of regulated airspace. This discussion of the quantification of the trade-off between airborne and ground delays is concluded with the finding that the literature review did not reveal any other approaches at this level of disaggregation and specificity. Wu and Caves (7) cite two references which quote unit ground delay costs for aircraft, one for “medium, large and heavy jets” in Europe and another for “small, medium and large” aircraft in the United States. The US study cited (30) presents a stochastic linear programming solution for the optimisation of the trade-off between ground and airborne delays. Although ground delay costs are quoted without derivation, and scenarios tested with different airborne cost test assumptions, this model could provide a valuable insight with regard to any future extension of this Study, as it includes the constraints imposed by ATFM and airport capacity.
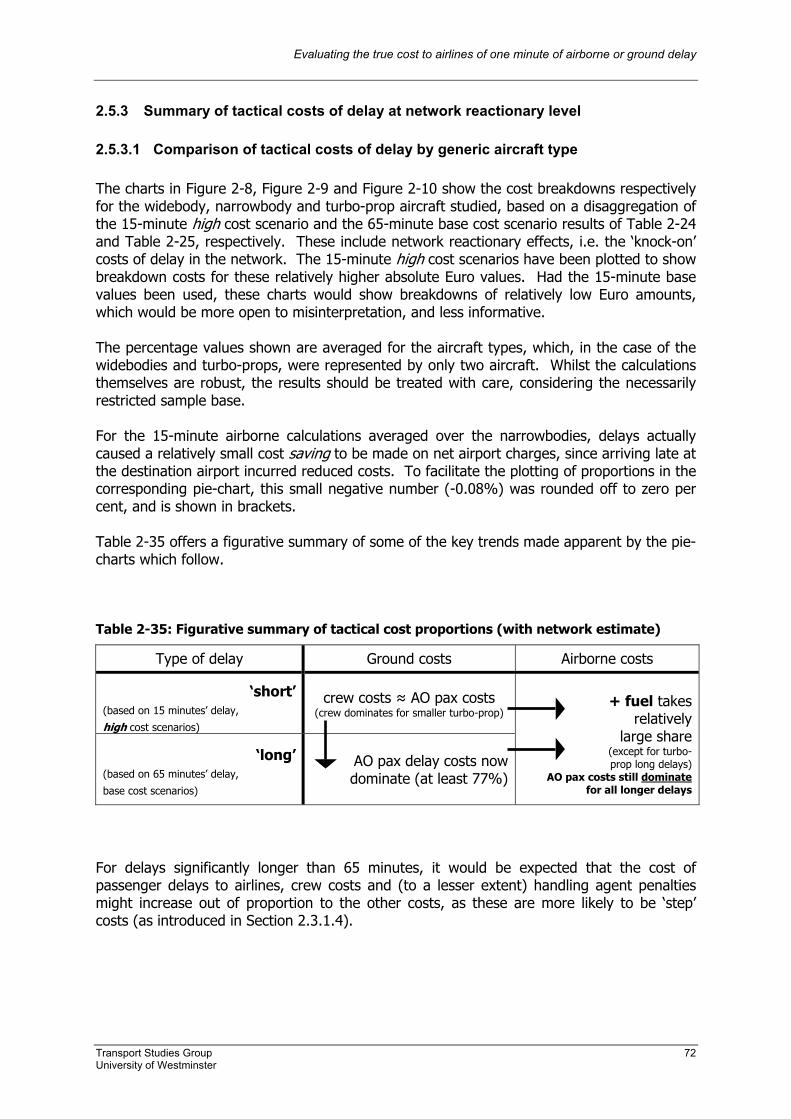
Evaluating the true cost to airlines of one minute of airborne or ground delay
Transport Studies Group 72 University of Westminster
2.5.3 Summary of tactical costs of delay at network reactionary level 2.5.3.1 Comparison of tactical costs of delay by generic aircraft type The charts in Figure 2-8, Figure 2-9 and Figure 2-10 show the cost breakdowns respectively for the widebody, narrowbody and turbo-prop aircraft studied, based on a disaggregation of the 15-minute high cost scenario and the 65-minute base cost scenario results of Table 2-24 and Table 2-25, respectively. These include network reactionary effects, i.e. the ‘knock-on’ costs of delay in the network. The 15-minute high cost scenarios have been plotted to show breakdown costs for these relatively higher absolute Euro values. Had the 15-minute base values been used, these charts would show breakdowns of relatively low Euro amounts, which would be more open to misinterpretation, and less informative. The percentage values shown are averaged for the aircraft types, which, in the case of the widebodies and turbo-props, were represented by only two aircraft. Whilst the calculations themselves are robust, the results should be treated with care, considering the necessarily restricted sample base. For the 15-minute airborne calculations averaged over the narrowbodies, delays actually caused a relatively small cost saving to be made on net airport charges, since arriving late at the destination airport incurred reduced costs. To facilitate the plotting of proportions in the corresponding pie-chart, this small negative number (-0.08%) was rounded off to zero per cent, and is shown in brackets. Table 2-35 offers a figurative summary of some of the key trends made apparent by the pie-charts which follow. Table 2-35: Figurative summary of tactical cost proportions (with network estimate)
Type of delay Ground costs Airborne costs
‘short’ (based on 15 minutes’ delay,
high cost scenarios)
crew costs ≈ AO pax costs (crew dominates for smaller turbo-prop)
‘long’ (based on 65 minutes’ delay,
base cost scenarios)
AO pax delay costs now dominate (at least 77%)
+ fuel takesrelatively
large share(except for turbo- prop long delays)
AO pax costs still dominate for all longer delays
For delays significantly longer than 65 minutes, it would be expected that the cost of passenger delays to airlines, crew costs and (to a lesser extent) handling agent penalties might increase out of proportion to the other costs, as these are more likely to be ‘step’ costs (as introduced in Section 2.3.1.4).

Evaluating the true cost to airlines of one minute of airborne or ground delay
Transport Studies Group 73 University of Westminster
Figure 2-8: Average widebody marginal cost distributions (network estimate basis)
Based on 15 minutes’ ground delay
(range for included aircraft: EUR 32 - 55/min) Based on 15 minutes’ airborne delay
(range for included aircraft: EUR 60 - 108/min)
Based on 65 minutes’ ground delay (range for included aircraft: EUR 143 - 240/min)
Based on 65 minutes’ airborne delay (range for included aircraft: EUR 166 - 285/min)
Cost element ►
Fuel Maintenance Crew Handling Airport charges AO pax cost
15 ground 4% 3% 41% 0% 12% 40% 65 ground 1% 1% 13% 0% 1% 85%
15 airborne 55% 3% 21% 0% 0% 21% 65 airborne 16% 1% 11% 0% 0% 72%
Cost elements ordered clockwise from 12 o’clock (to assist black and white viewing)
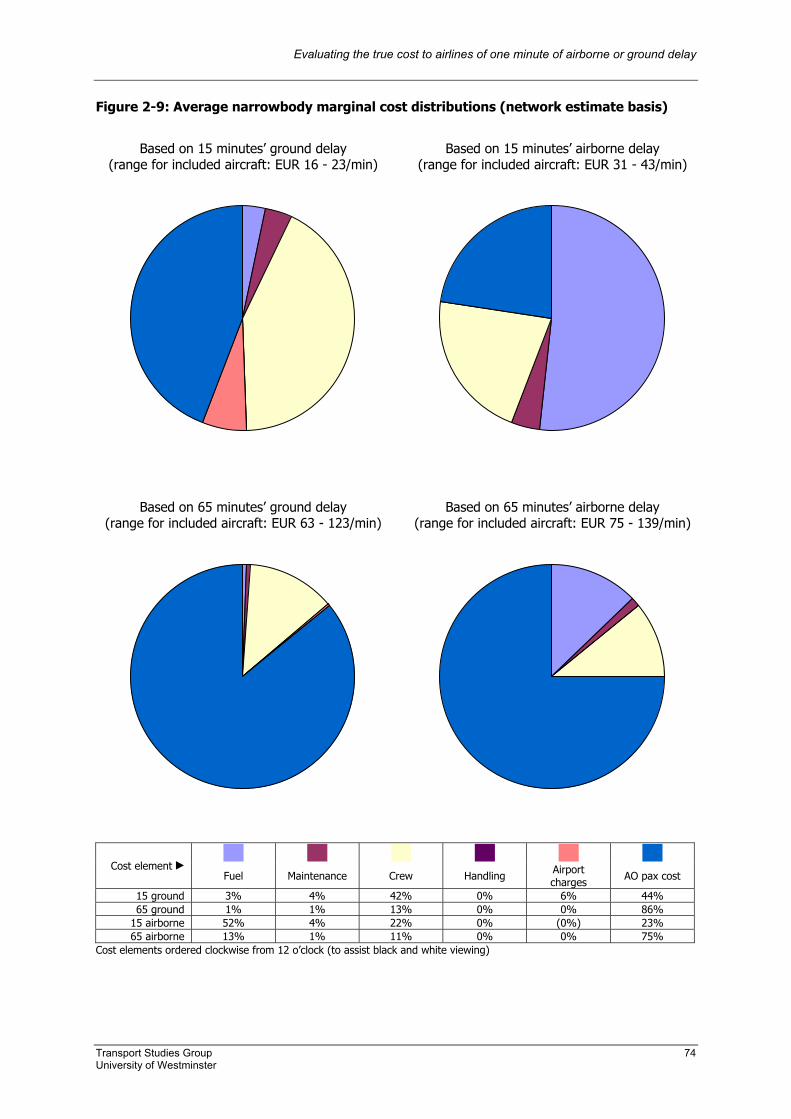
Evaluating the true cost to airlines of one minute of airborne or ground delay
Transport Studies Group 74 University of Westminster
Figure 2-9: Average narrowbody marginal cost distributions (network estimate basis)
Based on 15 minutes’ ground delay
(range for included aircraft: EUR 16 - 23/min) Based on 15 minutes’ airborne delay
(range for included aircraft: EUR 31 - 43/min)
Based on 65 minutes’ ground delay (range for included aircraft: EUR 63 - 123/min)
Based on 65 minutes’ airborne delay (range for included aircraft: EUR 75 - 139/min)
Cost element ►
Fuel Maintenance Crew Handling Airport charges AO pax cost
15 ground 3% 4% 42% 0% 6% 44% 65 ground 1% 1% 13% 0% 0% 86%
15 airborne 52% 4% 22% 0% (0%) 23% 65 airborne 13% 1% 11% 0% 0% 75%
Cost elements ordered clockwise from 12 o’clock (to assist black and white viewing)
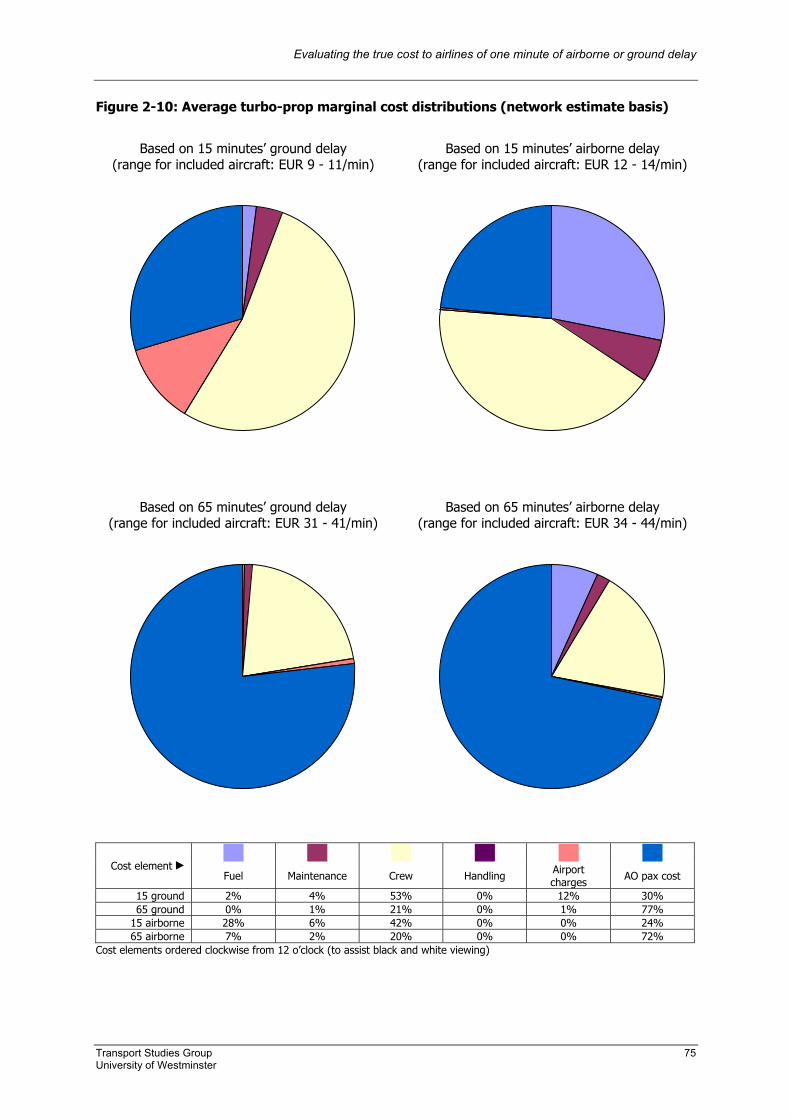
Evaluating the true cost to airlines of one minute of airborne or ground delay
Transport Studies Group 75 University of Westminster
Figure 2-10: Average turbo-prop marginal cost distributions (network estimate basis)
Based on 15 minutes’ ground delay
(range for included aircraft: EUR 9 - 11/min) Based on 15 minutes’ airborne delay
(range for included aircraft: EUR 12 - 14/min)
Based on 65 minutes’ ground delay (range for included aircraft: EUR 31 - 41/min)
Based on 65 minutes’ airborne delay (range for included aircraft: EUR 34 - 44/min)
Cost element ►
Fuel Maintenance Crew Handling Airport charges AO pax cost
15 ground 2% 4% 53% 0% 12% 30% 65 ground 0% 1% 21% 0% 1% 77%
15 airborne 28% 6% 42% 0% 0% 24% 65 airborne 7% 2% 20% 0% 0% 72%
Cost elements ordered clockwise from 12 o’clock (to assist black and white viewing)
Evaluating the true cost to airlines of one minute of airborne or ground delay
Transport Studies Group 76 University of Westminster
2.5.3.2 Comparison of tactical costs of delay with previous studies As mentioned in the introductory comments of this Report, a literature review was undertaken as part of this Study in order to assess existing research in this field. The literature review and interviews revealed that the most detailed study covering the cost of delay was previously undertaken by the Institut du Transport Aérien, published in November 2000 (2). This has been compared by Eurocontrol in Standard Inputs for Eurocontrol Cost Benefit Analyses (1), along with two other studies: one undertaken by the UK CAA (based on “all major UK airlines”) and another, by IATA (based on “a collection of [European] member airlines”). Both of these were also published, or updated, in 2000. Since the original documents for the UK CAA and IATA studies were not available to the authors of this Study, only some limited commentary on these is possible, based on information reported in the Eurocontrol document. However, a lack of commonality in the methodologies of these studies and this Study (as will be demonstrated) make comparisons of results not particularly instructive, in any case. Both the IATA and UK CAA studies considered a variety of costs similar to those calculated in this Study, and the UK CAA study identified reactionary effects and differentiated between long and short delays. The latter were defined as being of less than 20 minutes’ duration, and were ascribed no crew costs or passenger delay costs to the airline (as in the base scenario for short delays in this Study). Neither study, it would appear, included an assessment of ‘soft’ passenger costs, such as loss of market share due to unpunctuality. In fact, the IATA calculations do not appear to include any passenger costs of delay to the airline. Both studies allocated rental costs to both the ground and airborne phases. For flight equipment depreciation, the UK CAA study only allocated these costs to the airborne phase, whereas IATA only allocated these to the ground phase. This Study advocates that these costs should be not be allocated at the tactical level, but rather at the strategic level. Furthermore, it appears both the CAA and the IATA study essentially used unit costs to allocate costs of tactical delay to the ground and airborne phases, whereas this Study recommends the use of marginal costs for tactical delay. Consequently, any comparison between the results of these two studies and this Study are unlikely to be particularly informative, due to the differences in approach they use. This leaves the study by the Institut du Transport Aérien study (2) - henceforth referred to as the “ITA” study, to which focus is now turned. Table 2-36 offers an outline comparison of the methodologies of the ITA study, and this Study. It is important to note that the objective of this table is not to comment on the merits or remit of either study, but to draw attention to key aspects of the methodology which affect the comparability of the results. Of primary note is that: both studies used marginal cost allocations when calculating tactical costs of delay; both included and remarked upon the importance of passenger ‘hard’ and ‘soft’ costs (but did not include Values of Time in the basic results), and both excluded depreciation, rental and lease costs from the tactical calculations.
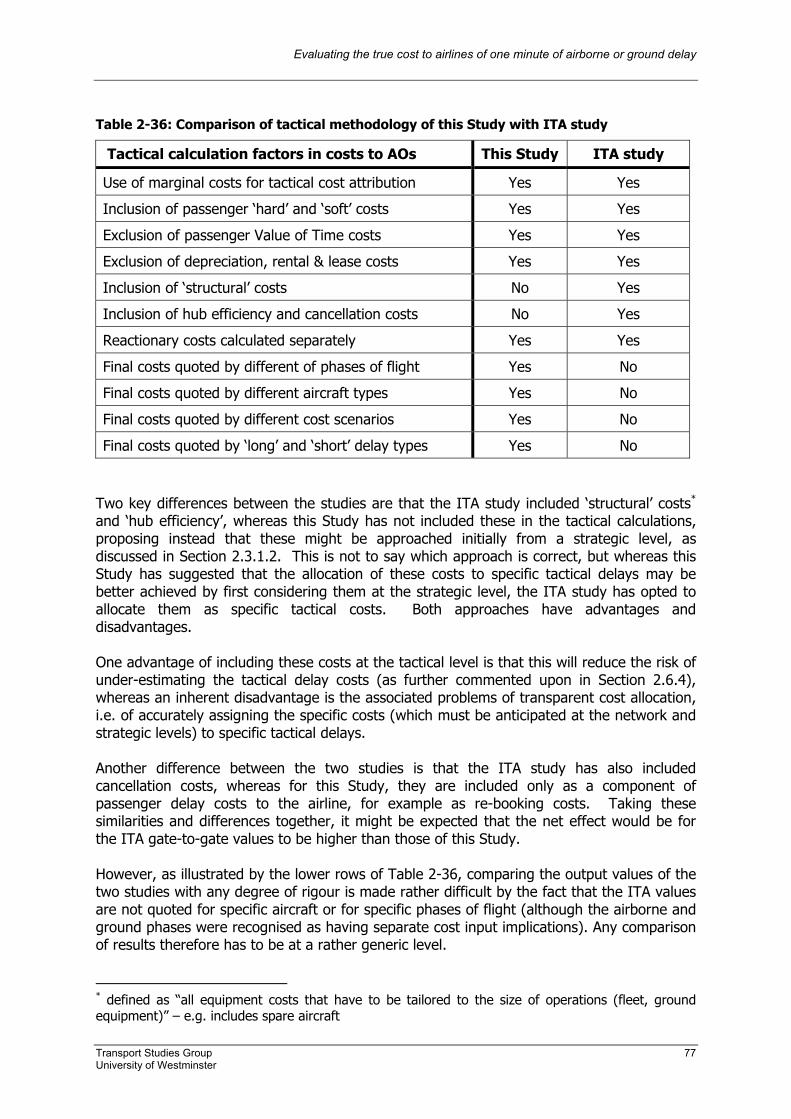
Evaluating the true cost to airlines of one minute of airborne or ground delay
Transport Studies Group 77 University of Westminster
Table 2-36: Comparison of tactical methodology of this Study with ITA study
Tactical calculation factors in costs to AOs This Study ITA study
Use of marginal costs for tactical cost attribution Yes Yes
Inclusion of passenger ‘hard’ and ‘soft’ costs Yes Yes
Exclusion of passenger Value of Time costs Yes Yes
Exclusion of depreciation, rental & lease costs Yes Yes
Inclusion of ‘structural’ costs No Yes
Inclusion of hub efficiency and cancellation costs No Yes
Reactionary costs calculated separately Yes Yes
Final costs quoted by different of phases of flight Yes No
Final costs quoted by different aircraft types Yes No
Final costs quoted by different cost scenarios Yes No
Final costs quoted by ‘long’ and ‘short’ delay types Yes No Two key differences between the studies are that the ITA study included ‘structural’ costs* and ‘hub efficiency’, whereas this Study has not included these in the tactical calculations, proposing instead that these might be approached initially from a strategic level, as discussed in Section 2.3.1.2. This is not to say which approach is correct, but whereas this Study has suggested that the allocation of these costs to specific tactical delays may be better achieved by first considering them at the strategic level, the ITA study has opted to allocate them as specific tactical costs. Both approaches have advantages and disadvantages. One advantage of including these costs at the tactical level is that this will reduce the risk of under-estimating the tactical delay costs (as further commented upon in Section 2.6.4), whereas an inherent disadvantage is the associated problems of transparent cost allocation, i.e. of accurately assigning the specific costs (which must be anticipated at the network and strategic levels) to specific tactical delays. Another difference between the two studies is that the ITA study has also included cancellation costs, whereas for this Study, they are included only as a component of passenger delay costs to the airline, for example as re-booking costs. Taking these similarities and differences together, it might be expected that the net effect would be for the ITA gate-to-gate values to be higher than those of this Study. However, as illustrated by the lower rows of Table 2-36, comparing the output values of the two studies with any degree of rigour is made rather difficult by the fact that the ITA values are not quoted for specific aircraft or for specific phases of flight (although the airborne and ground phases were recognised as having separate cost input implications). Any comparison of results therefore has to be at a rather generic level. * defined as “all equipment costs that have to be tailored to the size of operations (fleet, ground equipment)” – e.g. includes spare aircraft
Evaluating the true cost to airlines of one minute of airborne or ground delay
Transport Studies Group 78 University of Westminster
Although both studies recognise that delay costs increase as a function of time, only this Study explicitly evaluates each tactical cost (by aircraft type and phase of flight) according to whether it is part of a long or short delay. The ITA study considers “passenger driven costs” (e.g. compensation and subsistence payments) for passengers delayed by more than one hour, whilst “hub and connections additional costs” * are included for delays of above 15 minutes. Although the ITA study does offer a sensitivity analysis and different costings for certain results, this is not applied to all reported values. However, comparisons with the ‘base’ cost scenarios of this Study may be loosely made, as follows: ITA results based on marginal crew costs corrected (1) to 2001 values, give a generic value of 42 Euros per minute for gate-to-gate delay, and 62 Euros per minute including the network reactionary effect. To compare these values with those of this Study, a particular aircraft and phase of flight have to be chosen. Selecting the B737-300 (a commonly used aircraft in Europe) and looking at the at-gate costs for ‘long’ delay types, furnishes values of 45 Euros per minute (gate-to-gate) and 74 Euros per minute (with network reactionary effect). These values are taken from Table 2-16 and Table 2-26, respectively. However, given the constraints highlighted, it is imprudent to comment in any quantitative way on the apparent agreement of these values with the ITA results. Furthermore, it should also be noted that this Study has yielded results which range quite substantially according to the delay context. The per-minute costs of delay (base cost scenario, with network effect) for half the aircraft studied were less than one Euro per minute at-gate for short delays (Table 2-26), and for a B747-400 en-route, for a long delay, the per-minute cost was 289 Euros (Table 2-28). The literature review did not reveal any study which has allocated costs to aircraft for the three types of strategic buffer costs computed in the next Section. Therefore, the comparison of the results of this Study with those of others is restricted to the limited evaluation made in this Section, regarding tactical costs.
* defined as “costs occurred [sic] through the loss of hub efficiency”, including flight cancellations - the largest cost contributor under the marginal crew cost scenario
Evaluating the true cost to airlines of one minute of airborne or ground delay
Transport Studies Group 79 University of Westminster
2.6 Estimate of strategic costs of delay 2.6.1 Introduction to strategic cost calculations As an introduction to the calculation of the cost of delay at the strategic level, it is worthwhile recapping on some of the discussion earlier in the Report, whereby the different approaches to allocating the cost of delay at the strategic and tactical levels were discussed. In Section 2.3.1.2 it was explained that this Study would calculate the strategic cost of delay as the cost of adding an extra minute into the schedule, i.e. as schedule buffer. Such calculations are based on the assumption that these buffer minutes at the strategic level increase linearly as a unit cost. Assigning the costs at the strategic level in this way, treating each minute as an equal minute of unit cost, is essentially equivalent to proportioning much of the strategic cost of delay to the number of aircraft operated. This means that whereas the costs of tactical delay were calculated as marginal costs, not relying on BHDOC values, the unit costs associated with strategic buffers may logically be calculated often as a proportion of BHDOC values. In Table 2-4, the levels at which various cost elements could be calculated, were indicated. Ideally, all of these cost elements should be included in a full calculation of the cost of delay at the strategic level, but this would necessitate a network-level re-optimisation to fully assess such costs. Another approach to this is to assign ‘value’ to flights, and such calculations are explored in Annex P, but this methodology does have certain difficulties associated with it, whereas a calculation based on the cost of adding an extra minute into the schedule is arguably more robust. The ‘extra minute’ method will, however, require a limitation of the scope of the calculation, and some simplifying assumptions to be made. Table 2-37 summarises these, and presents the basis of the calculations to follow. In Table 2-2 a simplified cost structure for three different cases of the use of strategic buffers was presented. In all three cases, unit costs of buffer were consumed at the strategic level. In Case (1), the buffer allocated was exactly as required tactically, and there is, therefore, no additional, tactical cost effect. In Case (2), the strategic buffer is not used tactically, such that there are some marginal recoveries of cost at the tactical level. In Case (3), the unit costs of the schedule buffer are incurred, plus additional (marginal) tactical costs due to the buffer being insufficient to match the actual delay incurred. Table 2-38 builds on the detail of Table 2-2 by quantifying the costs of both the strategic minutes, and the tactical minutes. Three types of calculation are outlined, i.e. the costs of: • incorporating one strategic minute of buffer into the schedule, and using exactly one minute
tactically (Case 1) • incorporating one strategic minute of buffer into the schedule, but not using it (Case 2) • incorporating one strategic minute of buffer into the schedule, and then using an extra minute
tactically (Case 3) The quantification of the four cost elements considered (fuel, maintenance, crew and DRL) is discussed after Table 2-38.
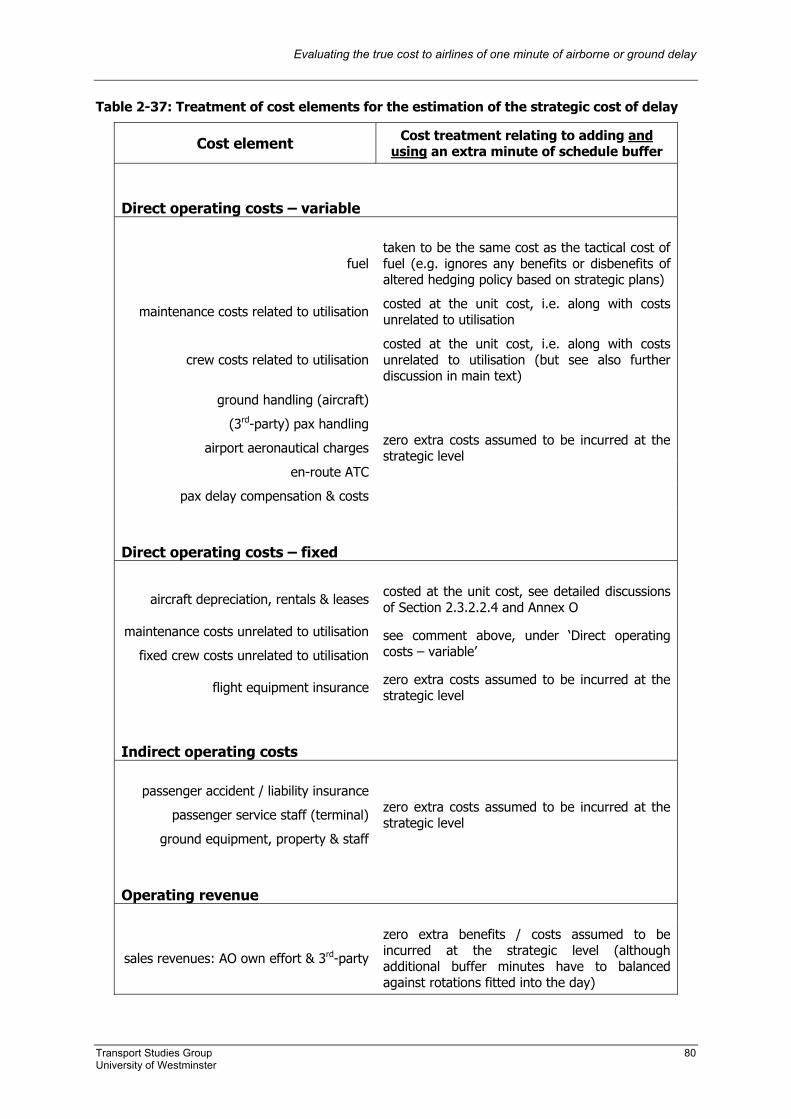
Evaluating the true cost to airlines of one minute of airborne or ground delay
Transport Studies Group 80 University of Westminster
Table 2-37: Treatment of cost elements for the estimation of the strategic cost of delay
Cost element Cost treatment relating to adding and using an extra minute of schedule buffer
Direct operating costs – variable
fueltaken to be the same cost as the tactical cost of fuel (e.g. ignores any benefits or disbenefits of altered hedging policy based on strategic plans)
maintenance costs related to utilisation costed at the unit cost, i.e. along with costs unrelated to utilisation
crew costs related to utilisationcosted at the unit cost, i.e. along with costs unrelated to utilisation (but see also further discussion in main text)
ground handling (aircraft)
(3rd-party) pax handling
airport aeronautical charges
en-route ATC
pax delay compensation & costs
zero extra costs assumed to be incurred at the strategic level
Direct operating costs – fixed
aircraft depreciation, rentals & leases costed at the unit cost, see detailed discussions of Section 2.3.2.2.4 and Annex O
maintenance costs unrelated to utilisation
fixed crew costs unrelated to utilisationsee comment above, under ‘Direct operating costs – variable’
flight equipment insurance zero extra costs assumed to be incurred at the strategic level
Indirect operating costs
passenger accident / liability insurance
passenger service staff (terminal)
ground equipment, property & staff
zero extra costs assumed to be incurred at the strategic level
Operating revenue
sales revenues: AO own effort & 3rd-party
zero extra benefits / costs assumed to be incurred at the strategic level (although additional buffer minutes have to balanced against rotations fitted into the day)

Evaluating the true cost to airlines of one minute of airborne or ground delay
Transport Studies Group 81 University of Westminster
Table 2-38: One minute of schedule buffer compared to one of tactical delay
Net cost – including tactical outcome
Case
Schedule buffer compared to tactical delay
Tactical minutes Cost element
Strategic cost of 1 minute Tactical effect of 0, ±1 minute
fuel 1 minute of fuel used, at same cost per minute as tactical
maintenance unit cost incurred: @ 15% of BHDOC*
crew unit cost incurred: @ 5/15/25% of BHDOC 1
schedule buffer just matches the tactical requirement
+ 0 minutes
DRL unit cost incurred: see Annex O
zero cost effect
fuel zero fuel cost
maintenance unit cost incurred: @ 15% of BHDOC* some marginal maintenance costs recovered
crew unit cost incurred: @ 5/15/25% of BHDOC some marginal crew costs recovered 2
schedule buffer is unnecessarily large: tactical delay is less than expected
-1 minute
DRL unit cost incurred: see Annex O zero cost effect
fuel ‘2.x’ minutes of fuel used, at same cost per minute as tactical (see text)
maintenance unit cost incurred: @ 15% of BHDOC* extra (marginal) maintenance costs incurred
crew unit cost incurred: @ 5/15/25% of BHDOC extra (marginal) crew costs incurred 3
schedule buffer is too small: tactical delay is greater than expected
+ 1 minute
DRL unit cost incurred: see Annex O zero cost effect
* except at gate: see main text
Evaluating the true cost to airlines of one minute of airborne or ground delay
Transport Studies Group 82 University of Westminster
2.6.2 Strategic cost elements 2.6.2.1 Strategic fuel costs Fuel costs are allocated simply at the tactical cost of fuel, i.e. the cost of supply on the day. In Case (1), one minute of fuel is used as the one minute of buffer is used. In Case (2) no minutes of (buffer) fuel are used, and no cost incurred for planning on using this minute of fuel at the strategic level. In Case (3), just over two minutes of fuel cost are assumed: one for the scheduled buffer minute, and just over the equivalent of 1 minutes’ worth for the second minute, to account for the reactionary effect of the tactical delay. 2.6.2.2 Strategic maintenance costs The consideration of maintenance costs is less straightforward. In each case, one minute, at the unit cost of maintenance, is incurred at the strategic level. Resources (such as infrastructure, labour force, and spares inventories) are planned in advance, and are not readily escapable. In Section 2.3.2.3.3, it was concluded that 15% of the BHDOC values may be attributed to the unit cost of maintenance. This same value has been used to assign cost contributions from maintenance to the cost of strategic buffer minutes. The question then arises as to what extent these costs are escapable if the minute of buffer is not used. The same philosophy has been used to calculate such potential recoveries as that of calculating tactical costs, i.e. as discussed in Section 2.3.2.3.3 and further developed in Annex H. These calculations were based on the premise that tactical delays tend to occur during periods of low maintenance burden. For example, engine stress is at its most extreme when the powerplant is at maximum thrust for take-off, but this period of exertion is never extended as a result of delay. Based on this qualitative logic (quantified in Annex H) tactical, marginal delay costs attributable to maintenance, as calculated at the gate-to-gate level in Annex J, represent some 4% (at gate) - 9% (airborne) of the unit cost of maintenance (i.e. of the 15% of BHDOC). If one minute of tactical delay thus costs 4% - 9% of the unit cost of maintenance, because of the likely timing of that delay minute at a time when the burden is in any case relatively very low, it seems logical to argue that avoiding such a minute will effectively prolong the engine life (for example) by an equivalent, small, monetary amount. It thus seems a good model of true maintenance costs to assign the tactical ‘saving’ of not using the buffer minute as the same magnitude as the tactical cost of actually using the minute. Such an argument should hold particularly well for cases where AOs carry out their own maintenance. Consider, however, how this might differ for power-by-the-hour (PBTH) arrangements. This will depend on how such terms and conditions are structured. If all aircraft were on PBTH contracts, and 100% of these were purely governed by actual block-hourly usage, then the tactical costs would be the same as the unit costs – and would be wholly escapable. However, PBTH charges will not reduce to zero if the aircraft are not used, as typically only a proportion of the costs will be directly geared to utilisation. This means that ‘power-by-the hour’ should not be taken too literally. Whether as part of an operating lease PBTH agreement, or as a service provided to an AO-owned aircraft, the PBTH service provider will first consider the expected utilisation of the aircraft – particularly sector length and the hour-to-cycle ratio - before setting the hourly charge. The number of expected cycles is particularly important when estimating maintenance costs, such that an AO with a longer sector length will typically be paying a lower hourly rate than one with a shorter sector.
Evaluating the true cost to airlines of one minute of airborne or ground delay
Transport Studies Group 83 University of Westminster
Often, a table of charges either side of the expected utilisation will be drawn up and agreed. If an AO were to over utilise the aircraft by 10% of the expected airborne hours recorded (not usually block hours), there would be an extra payment to be made. However, it is unlikely that this would be fully 10% extra in proportion to the full contract price paid (including a number of fixed elements, e.g. some minimum utilisation criteria, and/or some kind of stand-by, spares or other support). The amount extra paid, in proportion to the full contract price, might be just 1% or 2% (confidential disclosure from a major service provider). On the other hand, under utilisation by a similar amount, say 10%, would probably only be credited by half such a proportional amount, say 0.5% or 1%. In the absence of a literature value, two PBTH service providers were consulted, and agreed upon an approximate proportion of one-third of all aircraft in Europe currently on PBTH maintenance terms. This proportion is quite rapidly increasing, however, especially regarding new, smaller engine contracts. This value of one-third could thus soon rise overall to around a half of aircraft in Europe on PBTH maintenance terms. Taking the mid-percentage points of extra charges / rebates as 15% [(1% + 2%)/(10% x 2)] and 7.5%, respectively, and multiplying these by the upper and lower estimates of the proportion of aircraft on PBTH terms, one half and one third, suggests a crude range of some 8% - 3% of PBTH costs based purely on utilisation, which agrees quite well with the 9% - 4% referred to earlier in this Section, based on internal AO costs. Since PBTH ‘hours’ are more typically counted as airborne hours, this means that the 9% value arrived at through the Annex H calculations will in fact slightly over-estimate these costs relative to PBTH terms (although Annex H will more closely approximate PBTH terms as the proportion of aircraft on these terms increases), and the 4% ground value applied will also overestimate the cost for those PBTH terms whereby only airborne hours are counted in terms of operational, contract hours. Overall, however, the Annex H based costs hold as good estimates for the two-thirds or so of aircraft not on PBTH hours, and still represent a very reasonable approximation for those on hourly terms, in the absence of any further quantitative model of PBTH contracts, and the distribution of the numerous variations of terms applied, which is beyond the current remit of this Study. In accordance with the unit costing mechanisms for maintenance just described, 10% of the corresponding unit costs (i.e. 15% / 10 = 1.5% of BHDOC) has been judgementally applied to represent the at-gate unit cost. This reflects the relatively low additional cost of planning at-gate time at the strategic level, with respect to anticipated maintenance costs. Although PBTH cost terms themselves may not reflect true maintenance costs, since they include service provider profit margins, they are true costs to the AO, and should thus not be corrected for this profit. It should also be noted that in the Case 2 calculation, where the tactical, marginal cost of maintenance has been subtracted from the strategic cost, this ignores the asymmetry of PBTH rebates (compared to additional charges). For these partial cost recoveries, the gate-to-gate maintenance costs (which contributed to Table 2-16 through Table 2-19) have been used, not the reactionary costs (which must still be applied when considering the additional tactical costs of Case 3 calculations – i.e. when an extra tactical minute is required in addition to the schedule buffer minute).
Evaluating the true cost to airlines of one minute of airborne or ground delay
Transport Studies Group 84 University of Westminster
2.6.2.3 Strategic crew costs Regarding crew costs, the AO interviews produced quite a wide range as a percentage of BHDOC. There was more of a pattern that crew costs tended to be a low percentage of BHDOC for airlines with relatively lower BHDOCs, than any pattern by aircraft type. Conversely, AOs with high overall operating costs (BHDOCs) tended also to have a relatively high proportion of these costs resulting from crew costs. Due to reasons of confidentiality, it is not possible to reveal actual AO crew costs as a percentage of BHDOC, however, for the low, base and high cost scenarios these have been set to 5%, 15% and 25% of BHDOC (see Table 2-38), to reproduce this trend of increasing crew costs with BHDOC. These percentages reflect well the values given during interviews, and the same rates are applied to at-gate buffer minutes (although this will not apply to every airline’s practice). In terms of planning to use a minute of schedule buffer, but then not using it tactically, the question again arises as to what type of ‘saving’ may be made from the unused minute. In Section 2.3.2.3.4, it was explained how the marginal costs of crew overtime were calculated for the costs of tactical delay minutes. A range of scenarios was applied here, from zero extra costs incurred, to quite substantial overtime payments: to reflect actual AO practice. In considering the cost which could be recovered by not using the unit crew cost per minute allocated to schedule buffers, however, it would be inappropriate to equate some of these high tactical penalties, with a potential saving relative to the strategic buffer. Paying crew at a rate of 100 Euros per hour, for example, for overtime work, does not mean that (100/60) Euros would be ‘saved’ by not needing the crew for a planned minute of schedule buffer. Indeed, the schedule would still stand as it had been planned at the strategic level: the aircraft could not depart any earlier as a result of arriving earlier than expected. On the other hand, it was ascertained through the AO interviews, that airlines are quite efficient at re-allocating crew hours to match requirements, such that maximised benefit is accrued from this expensive resource. This model will therefore assume that, overall, 50% of the unit cost incurred (i.e. 2.5%, 7.5% and 12.5% of BHDOC) will be recovered overall – i.e. of all accumulated crew time saved in any given operational period, 50% is re-allocated and used, and paid for at the unit cost (not overtime rates). This is in keeping with the concept that at the 65-minute level of delay, low cost scenario, it would still be possible for AOs to incur no additional tactical costs, as was proposed in Section 2.3.2.3.4, whilst substantial crew costs were allocated to the base and high cost scenarios for 65 minutes, as would likely be incurred. Applying the same 50% recovery method to 15- and 65-minute scenarios implicitly makes the approximation that the AO is no better or worse at re-allocating relatively longer or shorter ‘spare’ crew time, but rather that the effect is cumulative and averaged. A similar assumption is implicit in allocating equal crew costs across phases of flight, i.e. not quantifying differential payment mechanisms.

Evaluating the true cost to airlines of one minute of airborne or ground delay
Transport Studies Group 85 University of Westminster
2.6.2.4 Strategic DRL costs For DRL calculations, the case is rather simpler. As explained in the detailed discussions of 2.3.2.2.4 and Annex O, to a very good level of approximation, it may be assumed that zero DRL costs, or savings, are associated with over- or under-utilisation, relative to planned activity. The unit costs, as calculated per service hour, and described in full in Section 2.3.2.2.4 and Annex O, are therefore ‘sunk’ costs at the strategic level, and are unchanged by the tactical outcome. 2.6.2.5 Strategic minutes plus extra tactical minutes For the Case 3 scenarios, the calculation of the cost per minute is simply the average of the unit cost of adding the buffer to the schedule at the strategic level, and the tactical, network reactionary cost of the additional minute, as previously calculated (thus covering more than just fuel, crew and maintenance costs). Thus, if a scheduled buffer minute cost 20 Euros, and a marginal, extra minute cost 10 Euros, the typical cost per minute of matching schedule buffer minutes with tactical buffer minutes would be 15 Euros. Other combinations may be calculated by the reader, by applying different ratios when combining the tables of Section 2.5.1 (see also index of these tables: Table 2-23) and the corresponding first four strategic calculations cost calculation tables. 2.6.3 Results of strategic cost of delay calculations The results of the strategic calculations are presented in the following tables, and indexed in Table 2-39, overleaf, whereby some limited comparisons between tables are made. The corresponding 15- and 65-minute-based delay costs are the same within each table from Table 2-40 to Table 2-47, as would be expected for calculations based on unit costs only. A exception possibly expected to this, based on the methodology as explained, might be caused by the maintenance recoveries in the latter four of these tables, but these recoveries are insensitive to the length of delay, i.e. the per-minute costs are the same for long and short delay types. Despite this ‘repetition’ of values in many of the tables, the full tables of values are nonetheless given to maintain conformity of structure with corresponding tables presented elsewhere in this Report, and later in this Section. A specific commentary on the relationship between the costs of strategic buffer minutes, and tactical delay minutes, is presented after the tables, in Section 2.6.4.
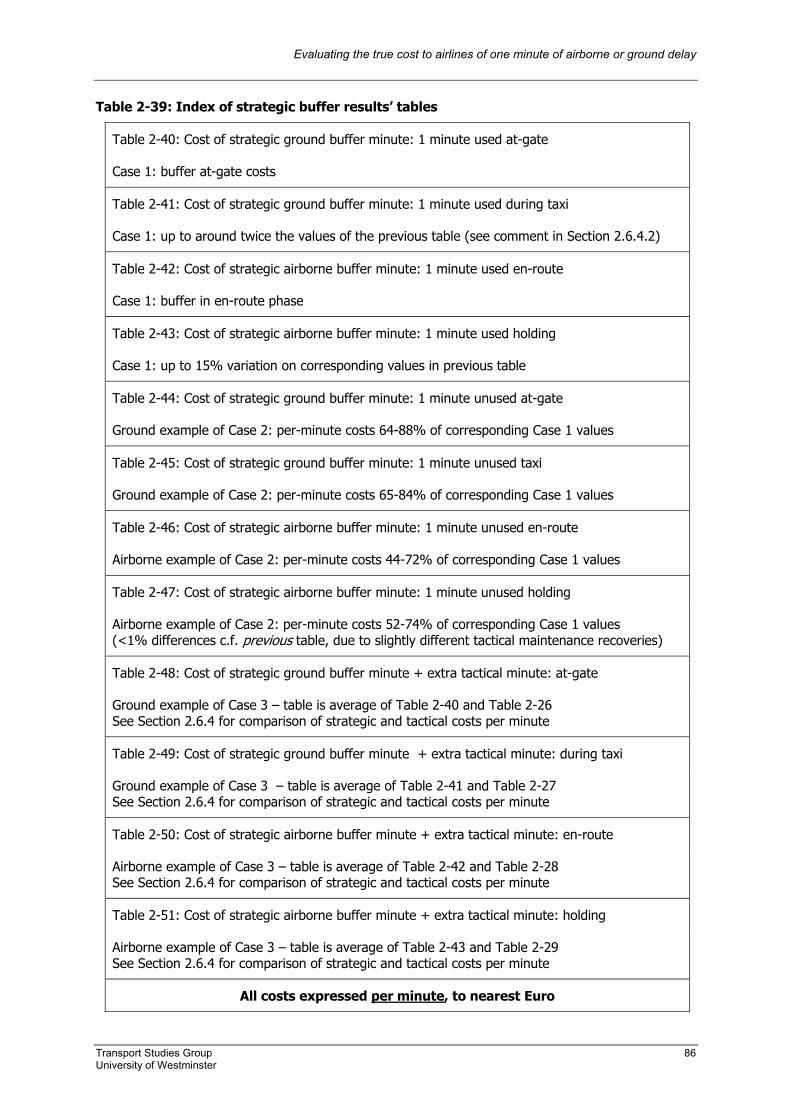
Evaluating the true cost to airlines of one minute of airborne or ground delay
Transport Studies Group 86 University of Westminster
Table 2-39: Index of strategic buffer results’ tables
Table 2-40: Cost of strategic ground buffer minute: 1 minute used at-gate
Case 1: buffer at-gate costs
Table 2-41: Cost of strategic ground buffer minute: 1 minute used during taxi
Case 1: up to around twice the values of the previous table (see comment in Section 2.6.4.2)
Table 2-42: Cost of strategic airborne buffer minute: 1 minute used en-route
Case 1: buffer in en-route phase
Table 2-43: Cost of strategic airborne buffer minute: 1 minute used holding
Case 1: up to 15% variation on corresponding values in previous table
Table 2-44: Cost of strategic ground buffer minute: 1 minute unused at-gate
Ground example of Case 2: per-minute costs 64-88% of corresponding Case 1 values
Table 2-45: Cost of strategic ground buffer minute: 1 minute unused taxi
Ground example of Case 2: per-minute costs 65-84% of corresponding Case 1 values
Table 2-46: Cost of strategic airborne buffer minute: 1 minute unused en-route
Airborne example of Case 2: per-minute costs 44-72% of corresponding Case 1 values
Table 2-47: Cost of strategic airborne buffer minute: 1 minute unused holding
Airborne example of Case 2: per-minute costs 52-74% of corresponding Case 1 values (<1% differences c.f. previous table, due to slightly different tactical maintenance recoveries)
Table 2-48: Cost of strategic ground buffer minute + extra tactical minute: at-gate
Ground example of Case 3 – table is average of Table 2-40 and Table 2-26 See Section 2.6.4 for comparison of strategic and tactical costs per minute
Table 2-49: Cost of strategic ground buffer minute + extra tactical minute: during taxi
Ground example of Case 3 – table is average of Table 2-41 and Table 2-27 See Section 2.6.4 for comparison of strategic and tactical costs per minute
Table 2-50: Cost of strategic airborne buffer minute + extra tactical minute: en-route
Airborne example of Case 3 – table is average of Table 2-42 and Table 2-28 See Section 2.6.4 for comparison of strategic and tactical costs per minute
Table 2-51: Cost of strategic airborne buffer minute + extra tactical minute: holding
Airborne example of Case 3 – table is average of Table 2-43 and Table 2-29 See Section 2.6.4 for comparison of strategic and tactical costs per minute
All costs expressed per minute, to nearest Euro

Evaluating the true cost to airlines of one minute of airborne or ground delay
Transport Studies Group 87 University of Westminster
Table 2-40: Cost of strategic ground buffer minute: 1 minute used at-gate
based on 15 minutes’ delay based on 65 minutes’ delay
cost scenario cost scenario Aircraft and number of seats
low base high low base high
B737-300 125 8 22 39 8 22 39
B737-400 143 9 24 42 9 24 42
B737-500 100 8 21 37 8 21 37
B737-800 174 10 23 44 10 23 44
B757-200 218 11 29 50 11 29 50
B767-300ER 240 14 38 72 14 38 72
B747-400 406 25 56 90 25 56 90
A319 126 10 26 46 10 26 46
A320 155 11 26 48 11 26 48
A321 166 13 31 52 13 31 52
ATR42 46 4 11 19 4 11 19
ATR72 64 5 14 25 5 14 25
All costs per minute, to nearest Euro
Table 2-41: Cost of strategic ground buffer minute: 1 minute used during taxi
based on 15 minutes’ delay based on 65 minutes’ delay
cost scenario cost scenario Aircraft and number of seats
low base high low base high
B737-300 125 16 37 58 16 37 58
B737-400 143 18 40 63 18 40 63
B737-500 100 16 35 55 16 35 55
B737-800 174 17 36 62 17 36 62
B757-200 218 22 47 73 22 47 73
B767-300ER 240 28 61 106 28 61 106
B747-400 406 55 96 139 55 96 139
A319 126 18 41 65 18 41 65
A320 155 19 40 68 19 40 68
A321 166 22 48 74 22 48 74
ATR42 46 7 17 27 7 17 27
ATR72 64 10 22 35 10 22 35
All costs per minute, to nearest Euro
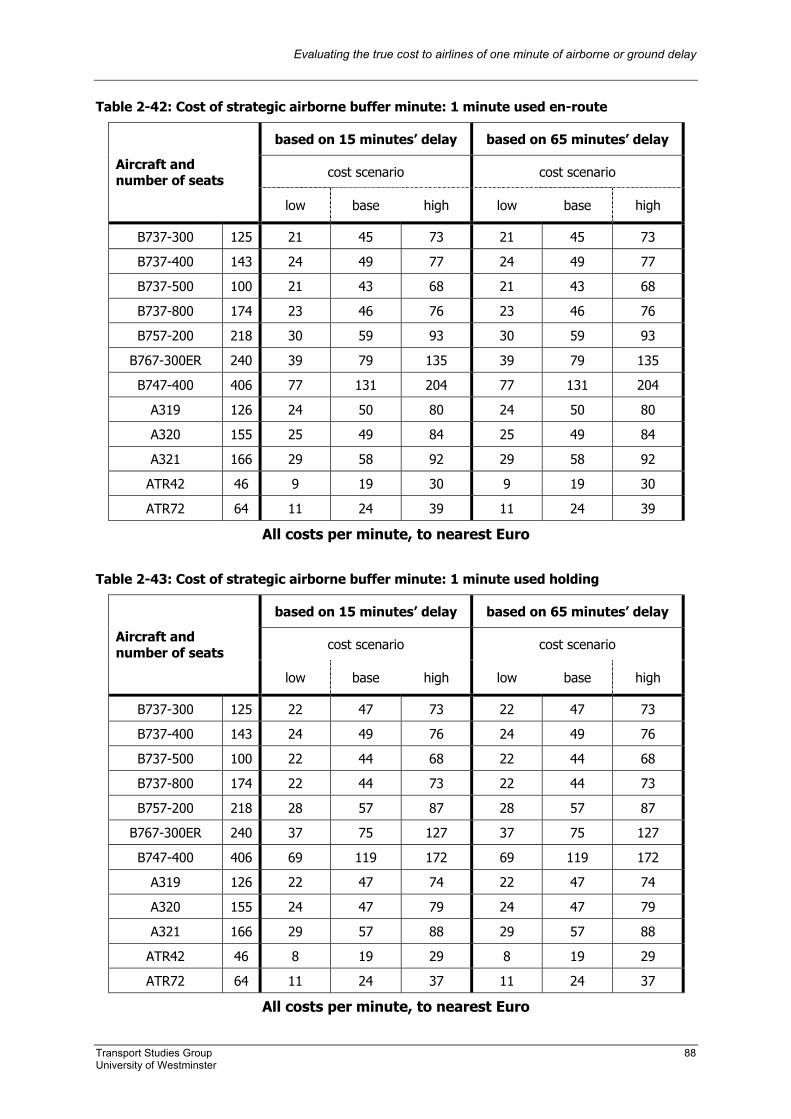
Evaluating the true cost to airlines of one minute of airborne or ground delay
Transport Studies Group 88 University of Westminster
Table 2-42: Cost of strategic airborne buffer minute: 1 minute used en-route
based on 15 minutes’ delay based on 65 minutes’ delay
cost scenario cost scenario Aircraft and number of seats
low base high low base high
B737-300 125 21 45 73 21 45 73
B737-400 143 24 49 77 24 49 77
B737-500 100 21 43 68 21 43 68
B737-800 174 23 46 76 23 46 76
B757-200 218 30 59 93 30 59 93
B767-300ER 240 39 79 135 39 79 135
B747-400 406 77 131 204 77 131 204
A319 126 24 50 80 24 50 80
A320 155 25 49 84 25 49 84
A321 166 29 58 92 29 58 92
ATR42 46 9 19 30 9 19 30
ATR72 64 11 24 39 11 24 39
All costs per minute, to nearest Euro
Table 2-43: Cost of strategic airborne buffer minute: 1 minute used holding
based on 15 minutes’ delay based on 65 minutes’ delay
cost scenario cost scenario Aircraft and number of seats
low base high low base high
B737-300 125 22 47 73 22 47 73
B737-400 143 24 49 76 24 49 76
B737-500 100 22 44 68 22 44 68
B737-800 174 22 44 73 22 44 73
B757-200 218 28 57 87 28 57 87
B767-300ER 240 37 75 127 37 75 127
B747-400 406 69 119 172 69 119 172
A319 126 22 47 74 22 47 74
A320 155 24 47 79 24 47 79
A321 166 29 57 88 29 57 88
ATR42 46 8 19 29 8 19 29
ATR72 64 11 24 37 11 24 37
All costs per minute, to nearest Euro

Evaluating the true cost to airlines of one minute of airborne or ground delay
Transport Studies Group 89 University of Westminster
Table 2-44: Cost of strategic ground buffer minute: 1 minute unused at-gate
based on 15 minutes’ delay based on 65 minutes’ delay
cost scenario cost scenario Aircraft and number of seats
low base high low base high
B737-300 125 6 15 25 6 15 25
B737-400 143 7 17 28 7 17 28
B737-500 100 7 15 25 7 15 25
B737-800 174 9 18 30 9 18 30
B757-200 218 9 21 34 9 21 34
B767-300ER 240 12 27 48 12 27 48
B747-400 406 21 42 64 21 42 64
A319 126 8 19 31 8 19 31
A320 155 9 19 33 9 19 33
A321 166 11 23 37 11 23 37
ATR42 46 3 8 13 3 8 13
ATR72 64 4 10 16 4 10 16
All costs per minute, to nearest Euro
Table 2-45: Cost of strategic ground buffer minute: 1 minute unused taxi
based on 15 minutes’ delay based on 65 minutes’ delay
cost scenario cost scenario Aircraft and number of seats
low base high low base high
B737-300 125 12 26 39 12 26 39
B737-400 143 14 29 43 14 29 43
B737-500 100 12 25 37 12 25 37
B737-800 174 13 27 44 13 27 44
B757-200 218 17 34 50 17 34 50
B767-300ER 240 21 44 73 21 44 73
B747-400 406 39 65 91 39 65 91
A319 126 14 30 46 14 30 46
A320 155 15 30 48 15 30 48
A321 166 18 36 53 18 36 53
ATR42 46 6 13 19 6 13 19
ATR72 64 8 17 25 8 17 25
All costs per minute, to nearest Euro

Evaluating the true cost to airlines of one minute of airborne or ground delay
Transport Studies Group 90 University of Westminster
Table 2-46: Cost of strategic airborne buffer minute: 1 minute unused en-route
based on 15 minutes’ delay based on 65 minutes’ delay
cost scenario cost scenario Aircraft and number of seats
low base high low base high
B737-300 125 12 25 38 12 25 38
B737-400 143 14 28 42 14 28 42
B737-500 100 12 25 37 12 25 37
B737-800 174 13 26 43 13 26 43
B757-200 218 16 33 49 16 33 49
B767-300ER 240 21 43 72 21 43 72
B747-400 406 39 64 89 39 64 89
A319 126 14 30 45 14 30 45
A320 155 15 29 48 15 29 48
A321 166 18 35 52 18 35 52
ATR42 46 6 13 19 6 13 19
ATR72 64 8 16 24 8 16 24
All costs per minute, to nearest Euro
Table 2-47: Cost of strategic airborne buffer minute: 1 minute unused holding
based on 15 minutes’ delay based on 65 minutes’ delay
cost scenario cost scenario Aircraft and number of seats
low base high low base high
B737-300 125 12 25 38 12 25 38
B737-400 143 14 28 42 14 28 42
B737-500 100 12 25 37 12 25 37
B737-800 174 13 27 43 13 27 43
B757-200 218 16 33 50 16 33 50
B767-300ER 240 21 43 72 21 43 72
B747-400 406 39 65 90 39 65 90
A319 126 14 30 45 14 30 45
A320 155 15 30 48 15 30 48
A321 166 18 35 52 18 35 52
ATR42 46 6 13 19 6 13 19
ATR72 64 8 16 24 8 16 24
All costs per minute, to nearest Euro

Evaluating the true cost to airlines of one minute of airborne or ground delay
Transport Studies Group 91 University of Westminster
Table 2-48: Cost of strategic ground buffer minute + extra tactical minute: at-gate
based on 15 minutes’ delay based on 65 minutes’ delay
cost scenario cost scenario Aircraft and number of seats
low base high low base high
B737-300 125 4 11 27 22 48 85
B737-400 143 5 13 30 26 54 95
B737-500 100 4 11 26 19 42 76
B737-800 174 5 12 31 30 61 107
B757-200 218 6 15 36 37 76 129
B767-300ER 240 8 19 52 42 90 160
B747-400 406 14 29 72 72 148 253
A319 126 5 13 31 23 51 89
A320 155 6 13 33 28 58 102
A321 166 7 16 36 31 63 108
ATR42 46 2 6 14 9 21 40
ATR72 64 3 7 18 12 27 50
All costs per minute, to nearest Euro
Table 2-49: Cost of strategic ground buffer minute + extra tactical minute: during taxi
based on 15 minutes’ delay based on 65 minutes’ delay
cost scenario cost scenario Aircraft and number of seats
low base high low base high
B737-300 125 9 21 39 27 57 97
B737-400 143 11 22 42 32 64 107
B737-500 100 10 20 37 24 51 87
B737-800 174 10 20 43 35 70 119
B757-200 218 13 26 50 44 87 143
B767-300ER 240 16 34 72 51 105 181
B747-400 406 33 56 103 92 174 286
A319 126 10 23 43 29 60 101
A320 155 11 22 45 33 67 114
A321 166 13 26 48 37 73 121
ATR42 46 4 9 18 11 24 44
ATR72 64 6 12 23 15 32 55
All costs per minute, to nearest Euro
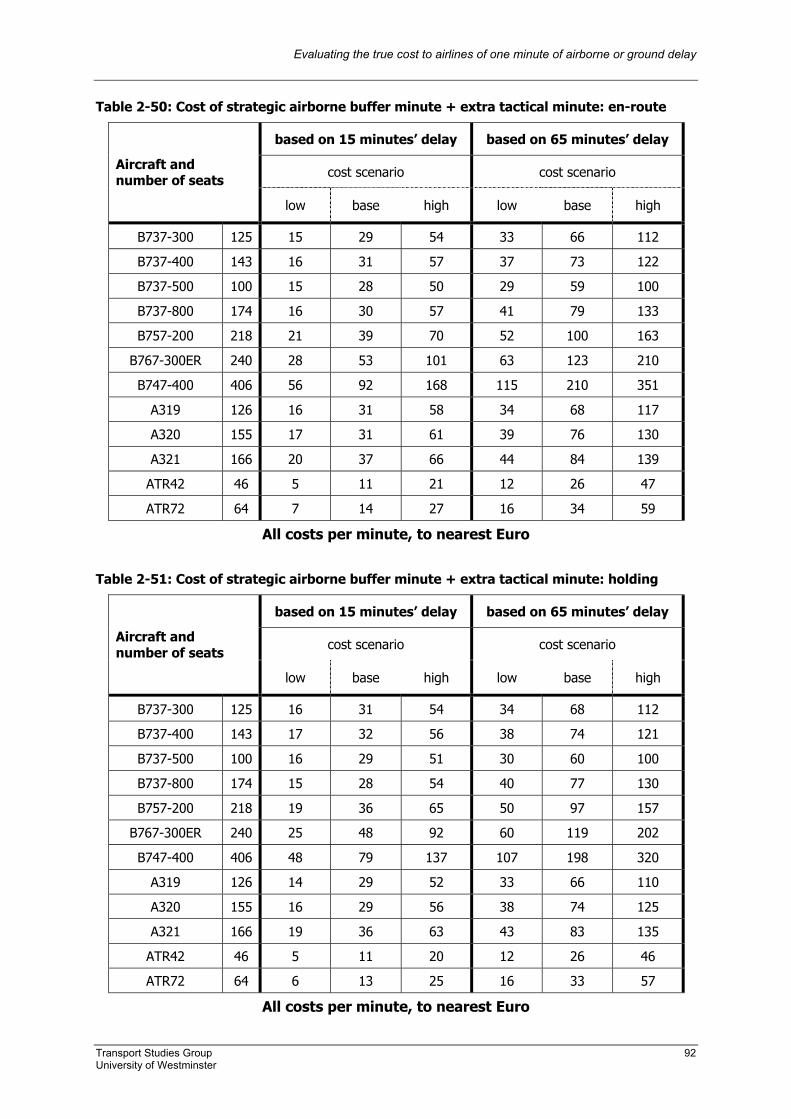
Evaluating the true cost to airlines of one minute of airborne or ground delay
Transport Studies Group 92 University of Westminster
Table 2-50: Cost of strategic airborne buffer minute + extra tactical minute: en-route
based on 15 minutes’ delay based on 65 minutes’ delay
cost scenario cost scenario Aircraft and number of seats
low base high low base high
B737-300 125 15 29 54 33 66 112
B737-400 143 16 31 57 37 73 122
B737-500 100 15 28 50 29 59 100
B737-800 174 16 30 57 41 79 133
B757-200 218 21 39 70 52 100 163
B767-300ER 240 28 53 101 63 123 210
B747-400 406 56 92 168 115 210 351
A319 126 16 31 58 34 68 117
A320 155 17 31 61 39 76 130
A321 166 20 37 66 44 84 139
ATR42 46 5 11 21 12 26 47
ATR72 64 7 14 27 16 34 59
All costs per minute, to nearest Euro
Table 2-51: Cost of strategic airborne buffer minute + extra tactical minute: holding
based on 15 minutes’ delay based on 65 minutes’ delay
cost scenario cost scenario Aircraft and number of seats
low base high low base high
B737-300 125 16 31 54 34 68 112
B737-400 143 17 32 56 38 74 121
B737-500 100 16 29 51 30 60 100
B737-800 174 15 28 54 40 77 130
B757-200 218 19 36 65 50 97 157
B767-300ER 240 25 48 92 60 119 202
B747-400 406 48 79 137 107 198 320
A319 126 14 29 52 33 66 110
A320 155 16 29 56 38 74 125
A321 166 19 36 63 43 83 135
ATR42 46 5 11 20 12 26 46
ATR72 64 6 13 25 16 33 57
All costs per minute, to nearest Euro
Evaluating the true cost to airlines of one minute of airborne or ground delay
Transport Studies Group 93 University of Westminster
2.6.4 Comparison of strategic and tactical costs per minute 2.6.4.1 A minute of buffer: a balance against expected tactical costs As was discussed in Section 1.5, many airlines add minutes of buffer into their schedules, at the strategic level, to ‘absorb’ tactical delays on the day of flight operations. These minutes of buffer come at a cost, as discussed in detail in the preceding sections. Airlines are usually prepared to pay some such costs, however, because preserving the schedule helps to maintain punctuality and predictability. Punctuality is often a key marketing tool for airlines to sell their product to passengers, and it helps to reduce the ‘soft’ costs of loss of market share which may result from not being punctual, as discussed in Section 2.3.2.3.7. Preserving some level of predictability in the schedule is also very important, particularly for airlines operating hub-and-spoke networks, where not being able to absorb tactical delays can have severe knock-on (reactionary) effects. The more the network moves away from the planned equilibrium point, the more the costs of recovery start to escalate. Airlines may apply buffers in a rather general way to a schedule, allowing say an extra 15 minutes’ additional block-time for a rotation, in terms of the scheduled arrival time of the flight, without necessarily ‘allocating’ these 15 minutes to any particular phase of the flight, e.g. at-gate or airborne. Added buffer minutes are often based on a statistical knowledge of past delays, e.g. the average or ‘expected’ delay on a given rotation is 20 minutes, and on the associated uncertainty or unpredictability of those 20 minutes. The number of buffer minutes added to the schedule is a matter of compromise. In theory, minutes of strategic buffer should be added to the airline schedule up to the point at which the cost of doing this equals the expected cost of the tactical delays they are designed to absorb, and possibly with some extra margin for uncertainty. The point of equilibrium may be described as that at which:
cost of minute of buffer cost of minute of tactical delay
x = x number of buffer minutes expected number of tactical delay minutes
Since the strategic and tactical calculations are now complete, it is possible to draw some interesting general, and specific, comparisons between these costs, and how they may be balanced. In general terms, it is important to bear in mind that the strategic costs of buffers are fixed as unit costs, and therefore it costs just as much to buffer against a lower cost tactical minute (e.g. one which is part of only a short delay) as it does against a ‘high cost’ tactical delay minute - whereas tactical costs increase as a function of the length of delay. 2.6.4.2 Allocating buffer minutes to different phases of flight Buffer minutes can either be added to the at-gate time, or to the airborne phase. In terms of the ability of the schedule to absorb 5 minutes of net arrival delay, there is of course no difference where the buffer minutes are allocated, and some airlines may not allocate buffer to any particular phase of flight. They may instead just add 10 minutes on to the scheduled arrival time, based on the fact that a particular flight often arrived 10 minutes late in the previous season of operations. Alternatively, the airline may decide to add no buffer at all, and to just reduce the turnaround time (e.g. by reduced aircraft internal cleaning) if needed. In some respects, this is as much an art as a science.
Evaluating the true cost to airlines of one minute of airborne or ground delay
Transport Studies Group 94 University of Westminster
The phase of flight to which buffer is added may well be determined by the root cause of delay, based on past experience. Buffer may be added at-gate to improve schedule reliability and to help with recovery from delayed inbound flights, and also to prevent knock-on effects to the same aircraft, or others in the network. Larger buffers of this kind might be added to the first rotations of the day, or in the middle of the day, to absorb earlier delays and prevent these from spilling over into the rest of the day. The earlier these tactical delays occur, the more reactionary effect they are likely to have if they are not absorbed. In general, it is less worthwhile to add large at-gate buffers to later rotations in the day. The costs of at-gate buffers are shown in Table 2-40. Other considerations may also affect an airline’s decision. For example, where gate access is in short supply, or airport charges for occupying the gate are particularly penalising, the airline may choose to opt for remote holding, (implicitly) adding ground buffer minutes off-gate. These are likely to incur other costs, such as APU fuel and maybe extra crew payments (e.g. if crew are paid more for off-block hours) which have to be carefully weighed against the at-gate costs which the AO is attempting to avoid. The costs of buffer minutes during taxi are given in Table 2-41. Airborne buffer might be added to anticipate regular holding, or route extensions (increased flying time) as a result of re-routes. These costs are presented in Table 2-43 and Table 2-42, respectively. As the tables show, it is cheaper to use buffer minutes at the gate than in the airborne phase. However, an airline may choose to plan on using buffer minutes during the airborne phase if it often experiences holding or route extensions on that flight, as failure to anticipate these extra hours of engine running may (for some airlines) have implications for the planning of maintenance schedules (e.g. engines taken off-wing unexpectedly early for heavy maintenance) or PBTH contracts (which may need to be adjusted for the expected annual increase in airborne hours). There may also be implications for crew rostering, according to payment schemes, e.g. whether the crew are paid according to block-time, total service hours, or based on the number of rotations. 2.6.4.3 Buffer minutes and predictability of expected tactical delays For simplicity, an example is used here to demonstrate the relationship between buffer minutes and the predictability of expected tactical delays, by using the strategic and tactical costs of delay calculated earlier for the B737-300 and restricting the discussion to ‘long’ at-gate delays, i.e. delays of over 15 minutes. In Table 2-40 it is evident that the cost of using a buffer, per minute, is 22 Euros. Table 2-44 shows that the cost of an unused buffer is 15 Euros per minute, whilst Table 2-26 shows that the per-minute cost of a tactical delay is 74 Euros per minute (all values to nearest Euro). If y represents the proportion of flights which are delayed by more than 15 minutes, the cost at which the addition of at-gate buffer to the schedule is worthwhile is given by: cost of buffer cost of tactical delay
22y + 15 (1-y) < 74y
Evaluating the true cost to airlines of one minute of airborne or ground delay
Transport Studies Group 95 University of Westminster
This simplified expression, which neglects the relatively small costs of short tactical delays, gives y > 0.22. This means that adding a number of buffer minutes to the schedule, equal to the average tactical delay, is expected to be cost-effective if more than 22% of flights are expected to be delayed by more than 15 minutes. Indeed, the tables show that, at face value, even more buffer minutes than the expected tactical delay may still be cost-effectively added to the schedule. The AO must be careful, however, to ensure that not too much buffer is added, to the point where the number of rotations in a given day is reduced. Restricting the number of rotations in the day may quickly become the limiting factor in the addition of buffer minutes*. With very large buffers in each rotation, the schedule could be very punctual, but generate little revenue, as market share (particularly for high-yield passengers) is both a function of punctuality and frequency of service. Airlines do not make money by having aircraft at the gate. Consider again the strategic costs of adding buffer minutes at the gate, as presented in Table 2-40, and compare these with the per-minute costs of long tactical delays at the gate, as shown in Table 2-26 (right-hand side of table). Looking at the base values, the strategic costs per minute are in a fairly narrow range of around 25% - 35% of the corresponding tactical costs. This means that, on average, for every 5 minutes of expected tactical delay, which are part of long expected delays, it is theoretically cost-effective planning up to 17 minutes of at-gate buffer. In practice, although an AO would rarely wish to add so much extra buffer, this does indicate that the AO may cost-effectively decide, in certain cases, to add more buffer minutes than the expected (average) amount of tactical delay, to allow for days when the tactical delay is greater than the expected value. This will vary from case to case. If it were the last rotation of the day, no buffer might be added. If this were the first rotation of the day, with high-yield connecting passengers, more buffer might be added than the expected delay. Again, a careful balance must be achieved, since it must be remembered that adding buffer minutes to a schedule, but not using them, also comes at a significant cost. Consider just 5 minutes of unused buffer, at-gate, for a B767-300ER. This would amount to very nearly 50 000 Euros over a period of one year, on just one leg per day (even allowing for the cost recoveries of these unused buffer minutes, i.e. using Table 2-44 values). Finally, this discussion should be briefly extended beyond the gate-to-gate level. Although small expected delays on each rotation might in themselves have little tactical cost, these may accumulate throughout the day, and ultimately cause greater cost penalties. An AO may decide to ‘risk’ this, and not buffer against small expected delays, either incurring the tactical costs, or relying on reduced turnaround times to make up the time, although this must be weighed carefully against incurring increased passenger arrival delays. * As mentioned in the introductory discussion on calculating the strategic cost of delay (see Section 2.6.1), a rudimentary calculation of strategic delay costs, based on estimating the ‘value’ of flight hours, has been explored in Annex P. This is an alternative way to estimate the cost of strategic buffer. Although it is based on an approach which directly considers the value of rotations, it is less robust than the methodology of the Main Report, i.e. of assigning a cost to adding an extra minute of strategic buffer to the schedule. The interested reader may refer to Annex P, where the shortcomings of a flight ‘value’ approach are also discussed: the range of per-minute costs calculated for strategic delay by this method were, in fact, reasonably close to those of Table 2-40 for at-gate strategic buffer, under the base cost scenarios.
Evaluating the true cost to airlines of one minute of airborne or ground delay
Transport Studies Group 96 University of Westminster
Alternatively, the AO may decide to include schedule buffer to absorb these small expected delays as they occur. An example might be prompted by two commonly used runway configurations at an airport, with a taxi-time difference of 10 minutes. With each configuration used around 50% of the time, the AO may decide to add a buffer of 5 minutes, in order to have a better chance of keeping the schedule operating punctually, and, for example, reducing the probability of running into problems with a noise restriction at the end of the day, on the last rotation. If tactical delays are not absorbed during the day, they may accumulate and worsen towards the end of the day, amounting to significant amounts of cumulative delay on the final rotations. Worse still, a flight may have to be cancelled or diverted due to a curfew, leaving the aircraft out of position at the end of the operational day, and causing the AO high cost penalties. 2.6.4.4 Adding minutes of buffer to the schedule: a broader context These results, which are dependent on the assumptions made in the model, need to be considered in a broader context. Firstly, it should be noted that the costs of tactical delay are themselves dependent on the amount of buffer added to schedules. If no buffers were used, tactical costs of delay would increase markedly. In particular, the network reactionary cost multipliers (discussed in Section 2.5.1) would be significantly larger. Indeed, some of the tactical delay costs calculated in this Study may already be under-estimated, since the efforts which AOs make in order to recover from tactical delay are not immediately identifiable, and the knock-on multipliers used are based on averages: in certain cases, however, the reactionary effects of a delay could be rather higher than those estimated. The results of this Study are implicitly based on the current equilibrium, and such results should not be extrapolated too far beyond this status quo. Secondly, it should be noted that some buffer minutes are almost ‘imposed’ on the AO. For example, it may not be possible to schedule an aircraft to leave a particular airport as early as might be operationally ideal, since the required airport slot at the aerodrome of departure and/or arrival is not available. It might also be necessary to keep an aircraft at a gate rather longer than its typical turnaround time, until connecting passengers arrive on other flights. Both of these types of constraint are locked into the schedule at the strategic level, and may impose additional minutes of at-gate time, which subsequently may serve as buffer minutes. It may be expected that these buffer minutes may, on average, cost the same as ‘freely chosen’ buffer minutes. However, they may not only force the inclusion of extra minutes in one leg, but may similarly push the AO to ‘risk’ a smaller buffer on a subsequent rotation, in order to achieve the desired number of rotations for that aircraft in the same day, which might systematically lead to additional tactical costs. These situations are unlikely to unduly bias the findings of the Study, but these examples are given to remind the reader that the choice of buffer allocation may not always be an entirely free one. Expected weather conditions may cause seasonal buffers to vary (e.g. to be higher in the winter); greater buffers may be added to critical city-pairs in the AO’s network, and experiences of restrictions in the Route Availability Document may also prompt the airline to adapt its buffers accordingly (e.g. by adding more at-gate or airborne buffer). Real buffering decisions may often be a lot less clear cut than the examples presented, or than the face value costs in the tables suggest, and the management of schedule risk may be much more of a compromise in many cases, with exogenous factors forcing AO decisions.
Evaluating the true cost to airlines of one minute of airborne or ground delay
Transport Studies Group 97 University of Westminster
2.7 Higher-level calculations As was introduced in Section 1.1, one objective of this Study was to calculate higher-level statistics (e.g. total European-level costs of delay). Consider Table 2-52, where the top 75% of CTOT (‘slot’) delay minutes in Europe, in 2002, by aircraft type, are shown split by delay durations of up to 15 minutes, and over 15 minutes (data provided by PRU). Although a number of the aircraft in the table were not included in this Study, by using regression curves fitted for the 15-minute and 65-minute base cost scenarios, for the at-gate data of Table 2-26, it is possible to produce an estimate of the high-level costs of delays, as shown in Table 2-53. The fitted regression equations include network reactionary estimates, and by using these values and the full CTOT delay minutes of Table 2-52, it is implicitly assumed that all CTOT delays are primary delays, such that the minute sub-totals do not require scaling down to remove reactionary minutes, to avoid double-counting. These calculations also assume that these costs are purely tactical costs, and ignore schedule buffer effects. In Table 2-26, the seat numbers used were the mid-points from the minimum and maximum number of seats available on the selected aircraft, taken from actual AO information for aircraft in passenger service, for all the AOs interviewed as part of this Study. For the extended cost calculations of this Section, where a number of additional aircraft are included in the computations, but were not investigated as part of this research, a common, single source of seat data was used for consistency, i.e. the same Airclaims database (dated 15 September 2002) as that used for the selection of aircraft (detailed in Annex N). An average number of seats was calculated for all aircraft in passenger service, for each variant. These averages are shown in Column B of Table 2-52. In columns C - D and E – F, the distributions of CTOT delay minutes are given for delays of up to 15 minutes, and over 15 minutes, respectively. Thus, CTOT delays experienced in the network have been split into two categories, and this must be borne in mind later when total network costs are calculated – i.e. the two categories must be re-combined. The reason for splitting the CTOT delays into two categories is such that separate higher-level calculations may be made for ‘long’ and ‘short’ delay types, as has been the basic premise applied throughout this Study. Columns D and F show that the top 75% of cumulative delay minutes have been included for each delay category, and Column G shows that the top 75% has also been included for the total delay duration (i.e. for all delays, regardless of duration). Corresponding numbers of delayed flights are shown in Column H for each variant – these values, disaggregated by delays of up to 15 minutes, and over 15 minutes (not shown to avoid additional clutter in the Table), were used to calculate the average costs per delayed flight in Table 2-53. It is to be noted that these calculations cannot readily be extrapolated much beyond the top 75%, because the proportion of freighter aircraft and aircraft types for which seat data were not obtained, becomes too high. It is questionable, in any case, the extent to which these fitted data may be applied outside the more common aircraft studied, and clearly cannot be applied to freighter or combi movements. If an adjustment were to be made to the final 75% of CTOT delay costs calculated in Table 2-53, adding another third (approximately 33%) to this 75% (to make the total up to 100%) would in all likelihood be too much (speculating on the costs of delay for smaller aircraft and freighters) but adding nothing would equally be clearly incorrect. Crudely adding some extra 15% might be very roughly acceptable, but this issue needs proper investigation.
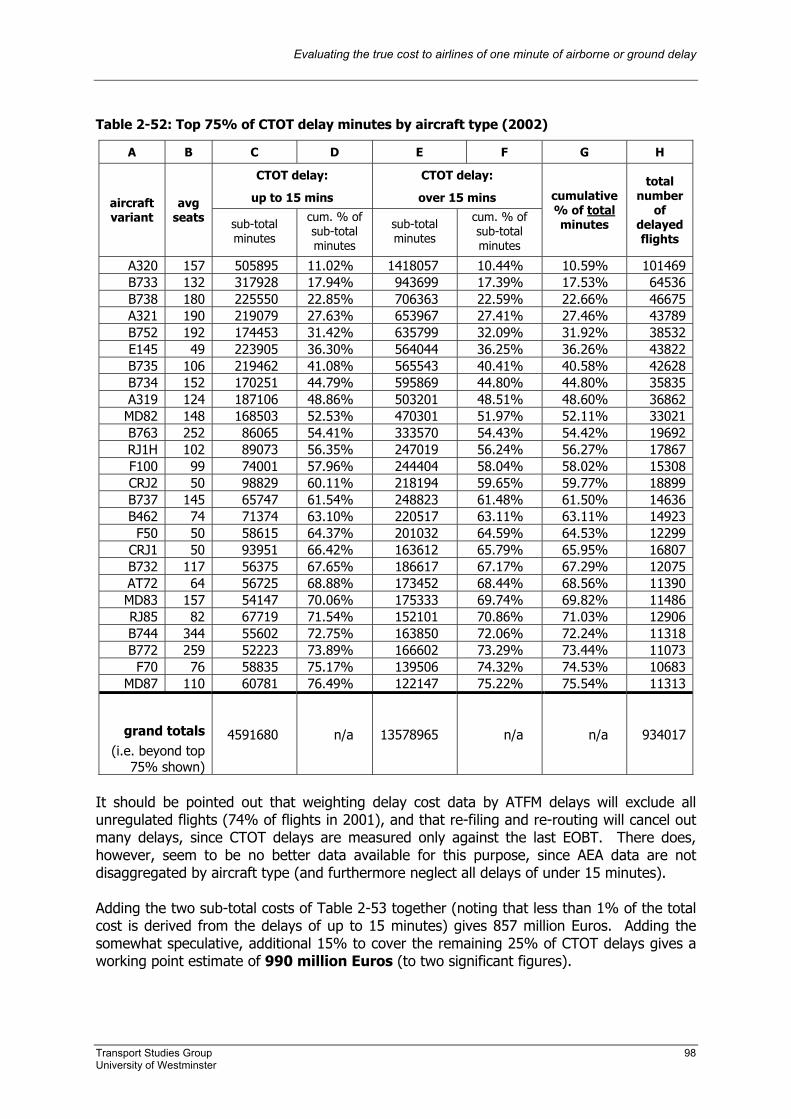
Evaluating the true cost to airlines of one minute of airborne or ground delay
Transport Studies Group 98 University of Westminster
Table 2-52: Top 75% of CTOT delay minutes by aircraft type (2002)
A B C D E F G H
CTOT delay:
up to 15 mins
CTOT delay:
over 15 mins aircraft variant
avg seats sub-total
minutes
cum. % of sub-total minutes
sub-total minutes
cum. % of sub-total minutes
cumulative % of total minutes
total number
of delayed flights
A320 157 505895 11.02% 1418057 10.44% 10.59% 101469B733 132 317928 17.94% 943699 17.39% 17.53% 64536B738 180 225550 22.85% 706363 22.59% 22.66% 46675A321 190 219079 27.63% 653967 27.41% 27.46% 43789B752 192 174453 31.42% 635799 32.09% 31.92% 38532E145 49 223905 36.30% 564044 36.25% 36.26% 43822B735 106 219462 41.08% 565543 40.41% 40.58% 42628B734 152 170251 44.79% 595869 44.80% 44.80% 35835A319 124 187106 48.86% 503201 48.51% 48.60% 36862MD82 148 168503 52.53% 470301 51.97% 52.11% 33021B763 252 86065 54.41% 333570 54.43% 54.42% 19692RJ1H 102 89073 56.35% 247019 56.24% 56.27% 17867F100 99 74001 57.96% 244404 58.04% 58.02% 15308CRJ2 50 98829 60.11% 218194 59.65% 59.77% 18899B737 145 65747 61.54% 248823 61.48% 61.50% 14636B462 74 71374 63.10% 220517 63.11% 63.11% 14923F50 50 58615 64.37% 201032 64.59% 64.53% 12299
CRJ1 50 93951 66.42% 163612 65.79% 65.95% 16807B732 117 56375 67.65% 186617 67.17% 67.29% 12075AT72 64 56725 68.88% 173452 68.44% 68.56% 11390MD83 157 54147 70.06% 175333 69.74% 69.82% 11486RJ85 82 67719 71.54% 152101 70.86% 71.03% 12906B744 344 55602 72.75% 163850 72.06% 72.24% 11318B772 259 52223 73.89% 166602 73.29% 73.44% 11073F70 76 58835 75.17% 139506 74.32% 74.53% 10683
MD87 110 60781 76.49% 122147 75.22% 75.54% 11313
grand totals (i.e. beyond top
75% shown)
4591680 n/a 13578965 n/a n/a 934017
It should be pointed out that weighting delay cost data by ATFM delays will exclude all unregulated flights (74% of flights in 2001), and that re-filing and re-routing will cancel out many delays, since CTOT delays are measured only against the last EOBT. There does, however, seem to be no better data available for this purpose, since AEA data are not disaggregated by aircraft type (and furthermore neglect all delays of under 15 minutes). Adding the two sub-total costs of Table 2-53 together (noting that less than 1% of the total cost is derived from the delays of up to 15 minutes) gives 857 million Euros. Adding the somewhat speculative, additional 15% to cover the remaining 25% of CTOT delays gives a working point estimate of 990 million Euros (to two significant figures).
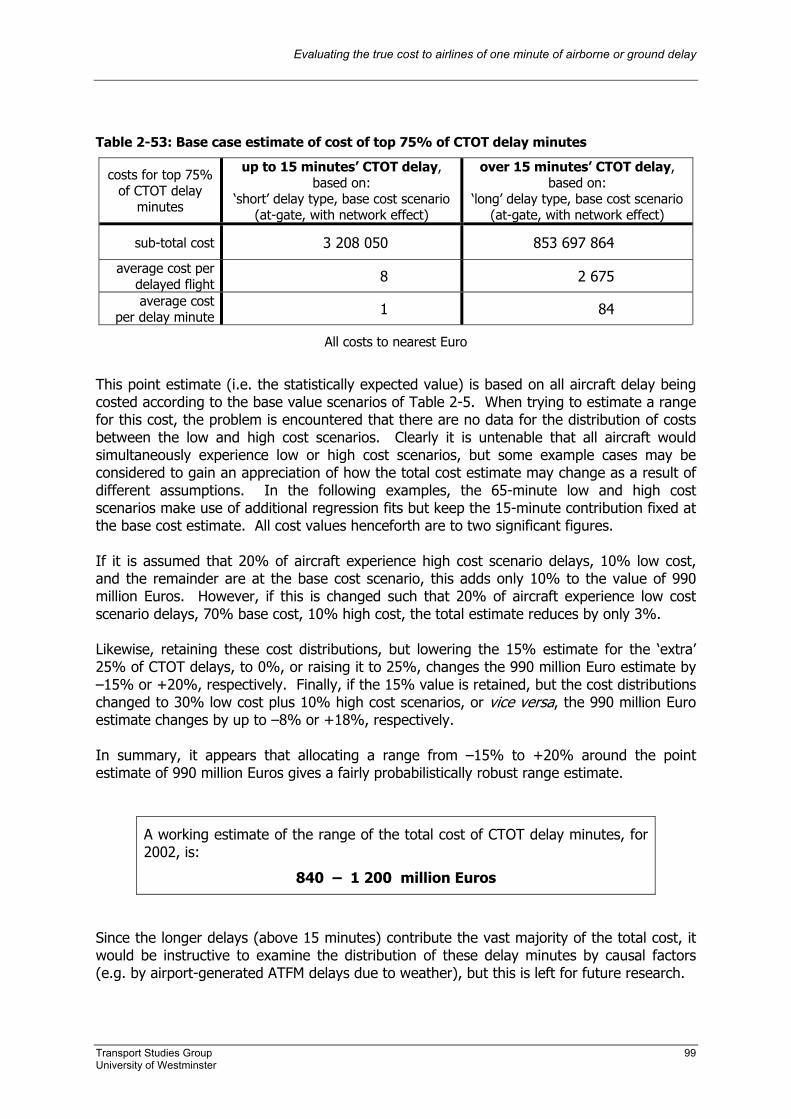
Evaluating the true cost to airlines of one minute of airborne or ground delay
Transport Studies Group 99 University of Westminster
Table 2-53: Base case estimate of cost of top 75% of CTOT delay minutes
costs for top 75% of CTOT delay
minutes
up to 15 minutes’ CTOT delay, based on:
‘short’ delay type, base cost scenario (at-gate, with network effect)
over 15 minutes’ CTOT delay, based on:
‘long’ delay type, base cost scenario (at-gate, with network effect)
sub-total cost 3 208 050 853 697 864
average cost per delayed flight 8 2 675
average cost per delay minute 1 84
All costs to nearest Euro
This point estimate (i.e. the statistically expected value) is based on all aircraft delay being costed according to the base value scenarios of Table 2-5. When trying to estimate a range for this cost, the problem is encountered that there are no data for the distribution of costs between the low and high cost scenarios. Clearly it is untenable that all aircraft would simultaneously experience low or high cost scenarios, but some example cases may be considered to gain an appreciation of how the total cost estimate may change as a result of different assumptions. In the following examples, the 65-minute low and high cost scenarios make use of additional regression fits but keep the 15-minute contribution fixed at the base cost estimate. All cost values henceforth are to two significant figures. If it is assumed that 20% of aircraft experience high cost scenario delays, 10% low cost, and the remainder are at the base cost scenario, this adds only 10% to the value of 990 million Euros. However, if this is changed such that 20% of aircraft experience low cost scenario delays, 70% base cost, 10% high cost, the total estimate reduces by only 3%. Likewise, retaining these cost distributions, but lowering the 15% estimate for the ‘extra’ 25% of CTOT delays, to 0%, or raising it to 25%, changes the 990 million Euro estimate by –15% or +20%, respectively. Finally, if the 15% value is retained, but the cost distributions changed to 30% low cost plus 10% high cost scenarios, or vice versa, the 990 million Euro estimate changes by up to –8% or +18%, respectively. In summary, it appears that allocating a range from –15% to +20% around the point estimate of 990 million Euros gives a fairly probabilistically robust range estimate.
A working estimate of the range of the total cost of CTOT delay minutes, for 2002, is:
840 – 1 200 million Euros
Since the longer delays (above 15 minutes) contribute the vast majority of the total cost, it would be instructive to examine the distribution of these delay minutes by causal factors (e.g. by airport-generated ATFM delays due to weather), but this is left for future research.
Evaluating the true cost to airlines of one minute of airborne or ground delay
Transport Studies Group 100 University of Westminster
Finally, in order to calculate a network-level average delay per minute, for at-gate delays of above 15 minutes, dividing the appropriate sub-total in Table 2-53 (854 million Euros), adding on 15% to approximately account for the remaining 25% of CTOT delay minutes, and dividing by the total number of delay minutes for delays of over 15 minutes (13.6 million, see foot of Table 2-52), gives a value of:
72 Euros per minute.
This value is, of course, based on the distribution of aircraft and their associated delay minutes as given in Table 2-52. Such an average should be used with caution, and may not be applicable for a different area of European airspace, e.g. a particular FIR/UIR, if the distribution of aircraft and delay minutes were significantly different in that area. Annex M offers an example of how weighted averages should be used and interpreted with due care. Particular averages should be calculated for given areas, and need to be regularly checked and updated for applicability, although the actual distributions and input costs could very well be quite stable from year to year. For more operationally appropriate marginal delay cost values, on a flight-by-flight basis, the reader is again referred to the tactical delay cost tables (with network effect costs) indexed in Table 2-23. Whilst these values vary by quite wide ranges across the cost scenarios, for a given aircraft type, it is important to remember that such wide variations would not be experienced at the network (aggregate) level. For a given sample of say 100 aircraft, it would be exceptionally unlikely that all were experiencing delay costs at either the low or high cost scenario levels, nor that they were all experiencing either ‘short’ or ‘long’ delay types.
Evaluating the true cost to airlines of one minute of airborne or ground delay
Transport Studies Group 101 University of Westminster
3 Caveats, conclusions and recommendations
3.1 Caveats • this Study intentionally focused on the costs of delay as incurred by airlines, not general
macro-economic costs (such as general social and environmental costs, except where the latter were included in airport noise charges)
• the specific values obtained for tactical costs of delay may not be used for military or
freighter / combi flights • the cost of cancellation has not been explicitly accounted for, and this could be
investigated further. It was considered in Airline Z’s calculations (see Section 2.3.2.3.7) of the passenger cost of delay to airlines, and could implicitly be considered to be better included by using ‘high’ cost scenarios and/or higher reactionary delay multipliers, but no proper quantification of this has been attempted in this Study
• the network effect costs are estimates only, and may warrant further research • the European Commission has agreed plans to introduce, in 2004 or 2005, explicit
compensation rights for passengers based on delays, which would affect the calculations of the cost of passenger delay to airlines (there are currently no laws for delay compensation, although minimum compensations exist for denied boarding)
• the rescinding of VAT exemption on aviation fuel (being discussed, for example, in the
UK) and ‘green taxes’ may drive fuel prices up permanently
3.2 Conclusions • future models of tactical delay and trade-offs should take into account all appropriate
cost elements, not only fuel burn, but particularly the costs of passenger delay to the airline, and crew costs
• passenger delay costs incurred by airlines in consideration of both ‘hard’ and ‘soft’ costs
are estimated as EUR 0.30 per average passenger, per average delay minute, per average delayed flight
• predictability of delay (especially at the city-pair level) is an important complementary
metric to average delay, and there is evidence to suggest that cancellations of flights should receive greater emphasis when reporting ‘delays’, and calculating their associated costs
• tactical costs of delay were found to vary widely according to cost scenario, aircraft type,
and length of delay. Network-level variations in such costs would always vary by much less, however
• it is possible to establish meaningful cost reference values, and basic rules, for the
purposes of calculating the trade-off between ground and airborne delays and, indeed, to formulate a linear relationship between aircraft seat numbers and the tactical cost of delay per minute for both at-gate and airborne delays
Evaluating the true cost to airlines of one minute of airborne or ground delay
Transport Studies Group 102 University of Westminster
• schedule buffer minutes cost the same per minute whatever the length of tactical delay they are designed to absorb. Allocating one minute of buffer in anticipation of the first minute of a short tactical delay costs the same as a minute of buffer designed to absorb the 60th minute of a long tactical delay. The actual cost of these tactical minutes, however, are not the same – longer tactical delays cost more
• adding buffer to the schedule impacts on all flights, whilst the saving made on tactical
delays will depend on the percentage of flights delayed. Based on a simplified example for B737-300, adding a number of buffer minutes to the schedule equal to the average tactical delay, is expected to be cost-effective if more than 22% of flights are expected to be delayed by more than 15 minutes
• a reduction in the number of rotations possible in the day may become a limiting factor
to the amount of buffer added, sooner than the apparent unit cost of the buffer minutes themselves suggest
3.3 Recommendations for future research • identify the causes of, and potential remedial actions for, long delays – with a particular
emphasis on which types of long primary delay cause most penalties in terms of reactionary delay
• improve the provision of delay predictability data at the city-pair level, to help airlines at
the strategic planning level • further develop decision-making rules for airlines when trading off ground versus
airborne delays. Such rules could be developed as a tool, possibly incorporated into AO flight planning systems, for automatic acceptance or rejection of re-routes offered by CFMU
• the cost of cancellations needs to be properly defined, and ATM conditions which are
most likely to cause cancellations should be identified • passenger attitudes and responses to delay are poorly understood, and receive relatively
little attention. Research should be undertaken to gain a better understanding of these, and should be linked to a much stronger focus on arrival delay, and its dependence on departure delay. Reference could be made to on-going EEC studies
• the model used in this Study suggests that the cost differences between en-route delay
and arrival management are not very large, although it has not been possible to include an assessment of the cost implications of reduced airborne speed as a means of managing capacity – this could be explored further through simulations and studying existing ANSP practice (e.g. in France)
• hold airline workshops to critically discuss progress in this field of research, at times
where new developments (e.g. changes in passenger compensation legislation) influence cost bases
Evaluating the true cost to airlines of one minute of airborne or ground delay
Transport Studies Group 103 University of Westminster
References
1 Eurocontrol EATMP Infocentre (2003) Standard Inputs for Eurocontrol Cost Benefit Analyses Eurocontrol EATMP Infocentre Reference 020717-02
2 Institut du Transport Aérien (November 2000) Costs of Air Transport Delay in Europe
3 European Commission (2001) Single European Sky, p2
4 Performance Review Commission (2003) Performance Review Report 6, p15
5 Air Traffic Statistics and Forecasts (STATFOR) Medium-Term Forecast of Annual Number of IFR Flights (2002 - 2009) Volume 1, Eurocontrol, March 2002, p3
6 Performance Review Commission (2003) Performance Review Report 6, p9
7 Wu C-L & Caves RE (2000) Aircraft operational costs and turnaround efficiency at airports Journal of Air Transport Management (6), pp201-208
8 Air Traffic Services Performance Focus Group (Boeing) 01 February 1999 Airline Metric Concepts for Evaluating Air Traffic Service Performance http://www.boeing.com/commercial/caft/cwg/ats_perf/ATSP_Feb1_Final.pdf
9 Hansen MM, Gillen D & Djafarian-Tehrani R (2001) Aviation infrastructure performance and airline cost: a statistical cost estimation approach Transportation Research Part E, (37) 1-23
10 Wu C-L & Caves RE (2002) Towards the optimisation of the schedule reliability of aircraft rotations Journal of Air Transport Management (8) 419-26
11 ICAO Digest of Statistics, Series F No. 53 (1999) & No. 54 (2000)
12 Operational data for ATR-72-200, ATR-42-300 and ATR-42-500 from ATR: http://www.atraircraft.com/asset72200.htm http://www.atraircraft.com/asset42300.htm http://www.atraircraft.com/atr42500.htm
13 Fourth Meeting of the ALLPIRG/Advisory Group (ICAO) (2001) Cost Tables for CNS/ATM Planning and Evaluation Tools (Appendix) http://www.icao.int/icao/en/ro/allpirg/allpirg4/wp44.doc
14 ESG Aviation Services (2002) A Review of Trends in the Airline and Commercial Jet Aircraft Industries The Airline Monitor (15) (No. 3; August 2002, Part II)
15 Boeing Commercial Aircraft (1997) (document date stamp) Estimated Annual Source and Value of ATC Losses ATA Member Airlines http://www.boeing.com/commercial/caft/reference/meetings/97_10_01/ata.doc
Evaluating the true cost to airlines of one minute of airborne or ground delay
Transport Studies Group 104 University of Westminster
16 Nichols WK and Kunz M (1999) Hubbing on Time Airline Business August 1999
17 Personal communication, Austrian (Airlines) 18 Airport and Air Navigation Charges Manual (June 2002)
International Air Transport Association (Geneva)
19 Stockman I, Doganis R, Fragoudaki A, Morrell P, Pagliari R & Whelan C (1998) User Costs at Airports in Europe, SE Asia and the USA (1997-98) Air Transport Group, Cranfield College of Aeronautics, Study Report 6
20 Review of Airport Charges (2001) Transport Research Laboratory (UK)
21 A Mercer Commentary (Mercer Management Consulting) (2002) Keeping the Customer (profitably) satisfied
22 Suzuki Y (2000) The relationship between on-time performance and airline market share: a new approach Transportation Research Part E (36) 139-54
23 Bates J, Polak J, Jones P and Cook A (2001) The valuation of reliability for personal travel Transportation Research Part E (37) 191-229
24 Suziki Y, Tyworth JE D & Novack RA (2001) Airline market share and customer service quality: a reference-dependent model Transportation Research Part A (35) 773-88
25 DRI – WEFA Inc. in collaboration with The Campbell-Hill Aviation Group Inc. (2002) The National Economic Impact of Civil Aviation
26 Citrenbaum D and Juliano R (1999) A Simplified Approach to Baselining Delays and Delay Costs for the NAS FAA, Preliminary Report 12a (August 1998; updated May 1999) DCN – R80406-02
27 Eurocontrol Experimental Centre (2002) Analysis of Passengers Delays: an Exploratory Case Study EEC Note No. 10/02 Project PFE-F-FM
28 Association of European Airlines Yearbook 2001 & 2002
29 Beatty R, Hsu R, Berry L & Rome J (1998) Preliminary Evaluation of Flight Delay Propagation through an Airline Schedule 2nd USA/Europe Air Traffic Management R&D Seminar (Orlando, 1st - 4th December 1998)
30 Richetta O (1993) Solving Optimally the Static Ground-Holding Policy Problem in Air Traffic Control Transportation Science 27(3)
31 Wu C-L & Caves RE (2002) Modelling of aircraft rotation in a multiple airport environment Transportation Research Part E (38) 265-77
32
IATA in Association with KPMG (1999) Components of Fleet Acquisition Cost and Associated Depreciation Airline Accounting Guideline No. 3 (effective 01 May 1996; revised 04 January 1999)

Evaluating the true cost to airlines of one minute of airborne or ground delay
Transport Studies Group 105 University of Westminster
33 The challenge of financing aircraft in 2002
Aircraft Commerce (22) pp4-8 (April/May 2002)
34 The risk & rewards of sale & leaseback Aircraft Commerce (15) pp6-10 (February/March 2001)
35 Structuring operating leases Aircraft Commerce (13) pp8-11 (September/October 2000)
36 Aircraft Value News (11 August 2003)
37 aircraftinvestor [sic] (4, 10) pp1-2 (May 2002)
38 Forming a policy to maximise aircraft residual values Aircraft Commerce (19) pp6-12 (October/November 2001)
39 The dilemma of weak aircraft values Aircraft Commerce (29) p6 (June/July 2003)
40 Aircraft Value News (24 February 2003)
41 Airclaims – ‘Aircraft Residual Value Forecasting’ and ‘Aircraft Valuations’: http://www.airclaimsv1.com
42 Top 20 operating lessor survey Aircraft Commerce (23) pp6-9 (June/July 2002)
43 Personal communication, GECAS
44 Allowing for maintenance condition Airline Fleet & Asset Management (September/October 2001), pp48-55
45 Engine leasing and maintenance Aircraft Technology Engineering & Maintenance (August / September 2002) pp24-30
46 Aircraft Value News (25 August 2003)
Evaluating the true cost to airlines of one minute of airborne or ground delay
Annexes to Final Report
Edition 4
17 February 2004
Transport Studies Group University of Westminster London
Evaluating the true cost to airlines of one minute of airborne or ground delay
Transport Studies Group University of Westminster
i
Evaluating the true cost to airlines of one minute of airborne or ground delay
This Report has been prepared by: Dr Andrew Cook Graham Tanner Stephen Anderson Transport Studies Group University of Westminster 35 Marylebone Road London GREAT BRITAIN GB-NW1 5LS tel: +44 (0)20 7911 5801 fax: +44 (0)20 7911 5057 email: [email protected]
Document history
Edition 0 10 March 2003
Edition 1 29 August 2003
Edition 2 03 October 2003
Edition 3 19 December 2003
Edition 4 17 February 2004
© University of Westminster February 2004
Evaluating the true cost to airlines of one minute of airborne or ground delay
Transport Studies Group University of Westminster
ii
Contents
Annex A: Glossary__________________________________________________ 1
Annex B: Conversions and exchange rates _____________________________ 2
Annex C: Aviation fuel: types and prices _______________________________ 3
Annex D: AO questionnaire example___________________________________ 7
Annex E: Exploratory questionnaire based on ICAO Form EF _____________ 19
Annex F: Aircraft weight data for Lido fuel burn table____________________ 22
Annex G: ATC costs as a function of re-routes _________________________ 23
Annex H: Allocation of maintenance burden by minute of delay ___________ 28
Annex I: Fuel burn penalties ________________________________________ 32
Annex J: Full tactical cost calculation results tables ____________________ 33
Annex K: Linear holding at FRA_____________________________________ 108
Annex L: Airport charges affected by time of day incurred ______________ 109
Annex M: Use of cost averages weighted by delay minutes ______________ 111
Annex N: Selection of aircraft variants and airlines_____________________ 113
Annex O: Calculation of DRL costs and further background on aircraft financing and maintenance reserves ________________________ 120
Annex P: Calculation of strategic opportunity cost based on flight value __ 128 Note on references and footnotes Local footnotes are indicated by superscript letters, e.g. “a” Document references (to be found in main Report) are indicated by a superscripted number, e.g. “(1)”
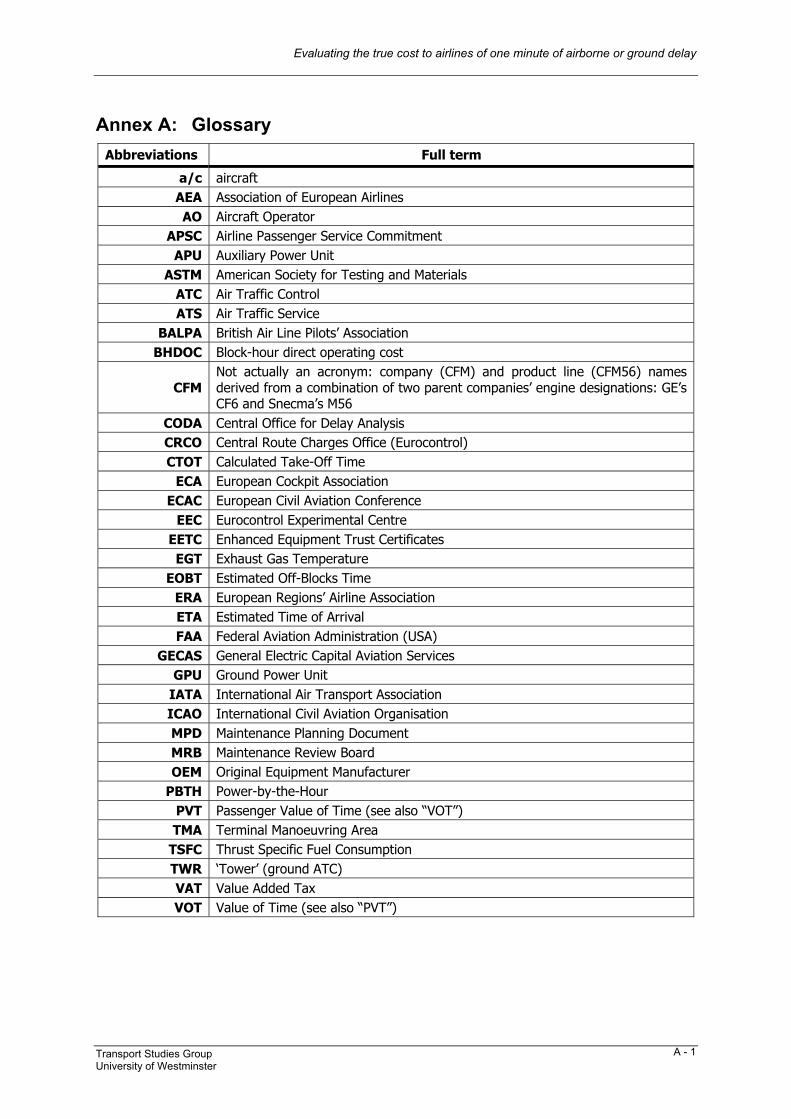
Evaluating the true cost to airlines of one minute of airborne or ground delay
Transport Studies Group University of Westminster
A - 1
Annex A: Glossary Abbreviations Full term
a/c aircraft AEA Association of European Airlines AO Aircraft Operator
APSC Airline Passenger Service Commitment APU Auxiliary Power Unit
ASTM American Society for Testing and Materials ATC Air Traffic Control ATS Air Traffic Service
BALPA British Air Line Pilots’ Association BHDOC Block-hour direct operating cost
CFM Not actually an acronym: company (CFM) and product line (CFM56) names derived from a combination of two parent companies’ engine designations: GE’s CF6 and Snecma’s M56
CODA Central Office for Delay Analysis CRCO Central Route Charges Office (Eurocontrol) CTOT Calculated Take-Off Time
ECA European Cockpit Association ECAC European Civil Aviation Conference
EEC Eurocontrol Experimental Centre EETC Enhanced Equipment Trust Certificates EGT Exhaust Gas Temperature
EOBT Estimated Off-Blocks Time ERA European Regions’ Airline Association ETA Estimated Time of Arrival FAA Federal Aviation Administration (USA)
GECAS General Electric Capital Aviation Services GPU Ground Power Unit
IATA International Air Transport Association ICAO International Civil Aviation Organisation MPD Maintenance Planning Document MRB Maintenance Review Board OEM Original Equipment Manufacturer
PBTH Power-by-the-Hour PVT Passenger Value of Time (see also “VOT”) TMA Terminal Manoeuvring Area
TSFC Thrust Specific Fuel Consumption TWR ‘Tower’ (ground ATC) VAT Value Added Tax VOT Value of Time (see also “PVT”)
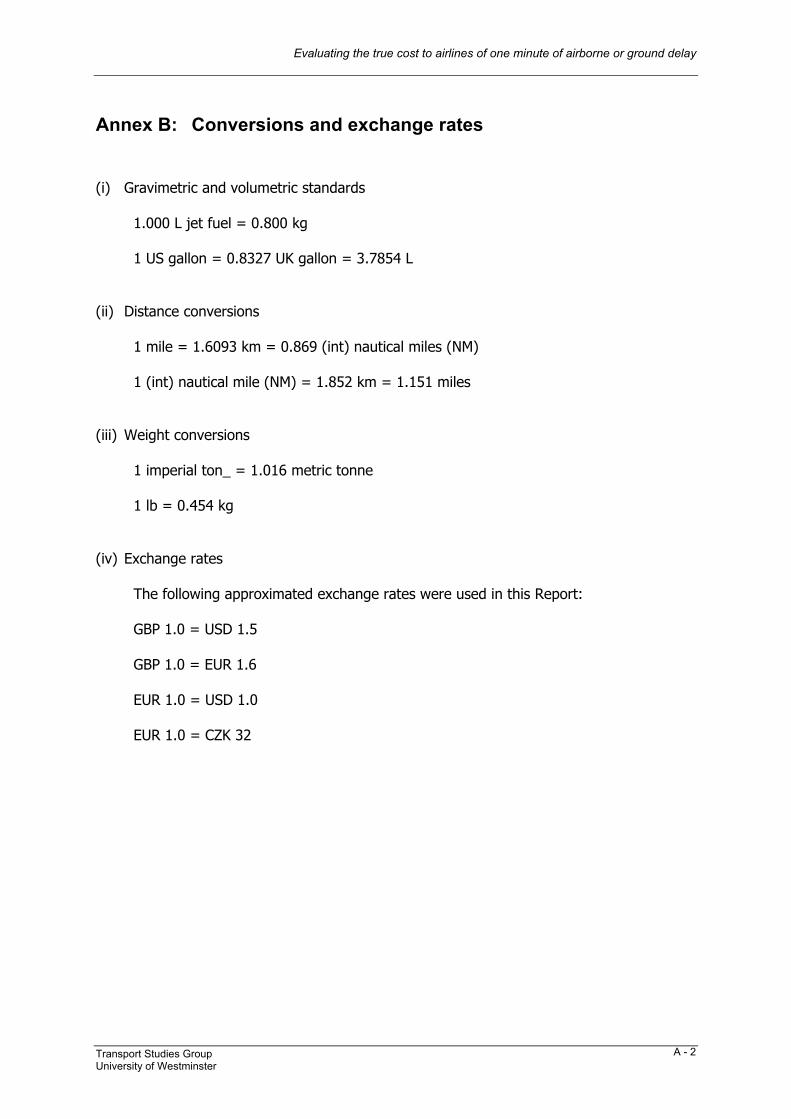
Evaluating the true cost to airlines of one minute of airborne or ground delay
Transport Studies Group University of Westminster
A - 2
Annex B: Conversions and exchange rates (i) Gravimetric and volumetric standards 1.000 L jet fuel = 0.800 kg 1 US gallon = 0.8327 UK gallon = 3.7854 L (ii) Distance conversions 1 mile = 1.6093 km = 0.869 (int) nautical miles (NM) 1 (int) nautical mile (NM) = 1.852 km = 1.151 miles (iii) Weight conversions 1 imperial ton_ = 1.016 metric tonne 1 lb = 0.454 kg (iv) Exchange rates The following approximated exchange rates were used in this Report: GBP 1.0 = USD 1.5 GBP 1.0 = EUR 1.6 EUR 1.0 = USD 1.0 EUR 1.0 = CZK 32

Evaluating the true cost to airlines of one minute of airborne or ground delay
Transport Studies Group University of Westminster
A - 3
Annex C: Aviation fuel: types and prices C1 Fuel types Aviation fuel is also referred to as ‘(aviation) turbine fuel’ and ‘jet fuel’, and covers a variety of fuel grades. They are used for powering both jet and turbo-prop aircraft. Table C1 outlines the major civil aviation fuels in use. Table C1: Civil aviation fuels
Fuel type Description Usage
Jet A
Kerosene-type fuel with maximum freezing point of –40ºC. Broader distillation cut than Jet A-1, but same flash point. Produced to an ASTM specification and normally only available in the USA.
United States (especially for domestic flights)
Jet A-1
Kerosene-type fuel with maximum freezing point of –47ºC, so more suitable for long international flights, especially on polar routes during the winter. Flash point above 38°C.
Costs more than Jet A (few percent more expensive to refine). Produced to a set of stringent, internationally agreed standards.
Most of rest of world
Jet B
A ‘wide-cut’ jet fuel (essentially a hydrocarbon mixture or blend, spanning the kerosene and gasoline/naptha boiling ranges). Has operational disadvantages due to its higher volatility: such as greater losses due to evaporation at high altitudes and greater risk of fire. Can be used as an alternative to Jet A-1. In Canada it conforms to Specification CAN/CGSB 3.23
Some parts of Canada and Alaska because it is suited to cold climates
TS-1 A Russian, light kerosene-type fuel CIS and parts of Eastern Europe
Major source: Aviation Fuels Technical Review (FTR-3), Chevron (2002)
Energy Administration Information statistics distinguish between two classes of jet fuel, viz. “naptha-based” (e.g. Jet B) and “kerosene-based” (e.g. Jet A and JP-5). JP-5 is a special military fuel, with a high flashpoint for additional fire safety, and is the military equivalent of Jet A. Fuel additives are often added (usually only in parts per million, and in strict accordance with the appropriate standards and specifications) such as: anti-knock additives (to reduce the tendency to detonate); anti-oxidants; static dissipaters; corrosion inhibitors; icing inhibitors; metal de-activators (suppressing the catalytic effect which some metals, particularly copper, have on fuel oxidation) and biocide additives. These additives are provided by the supplier and included in the price, and are not discussed further here.
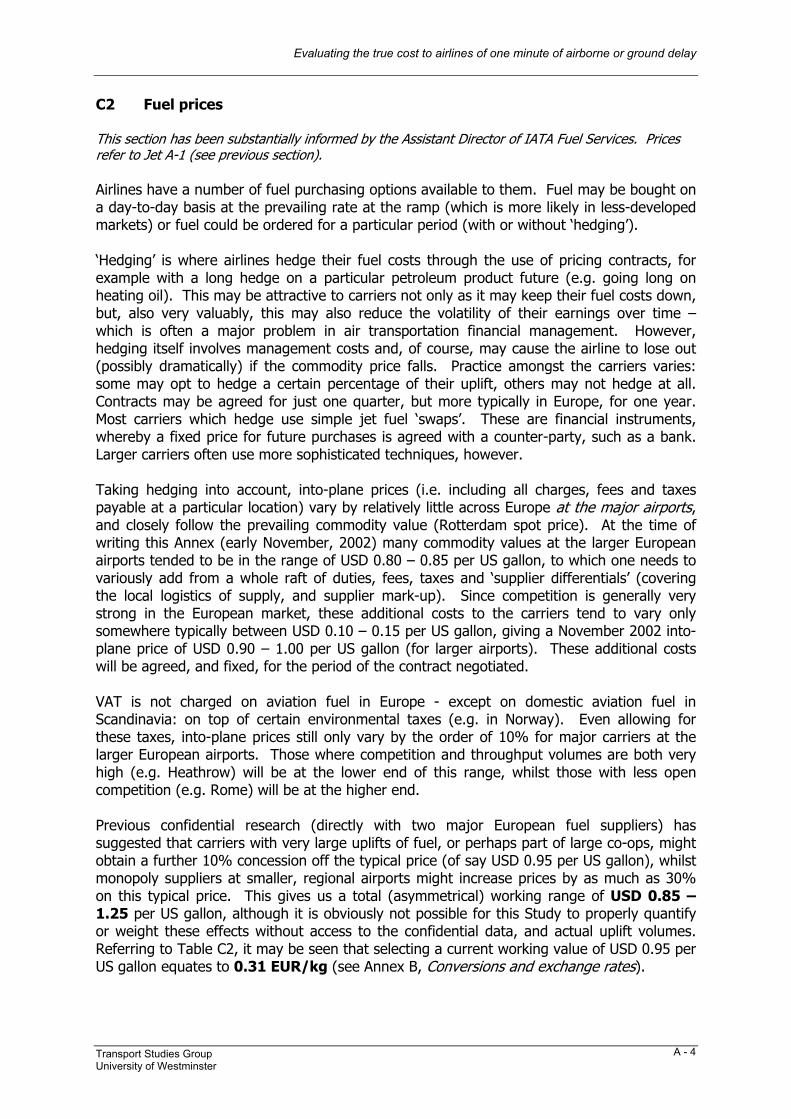
Evaluating the true cost to airlines of one minute of airborne or ground delay
Transport Studies Group University of Westminster
A - 4
C2 Fuel prices This section has been substantially informed by the Assistant Director of IATA Fuel Services. Prices refer to Jet A-1 (see previous section). Airlines have a number of fuel purchasing options available to them. Fuel may be bought on a day-to-day basis at the prevailing rate at the ramp (which is more likely in less-developed markets) or fuel could be ordered for a particular period (with or without ‘hedging’). ‘Hedging’ is where airlines hedge their fuel costs through the use of pricing contracts, for example with a long hedge on a particular petroleum product future (e.g. going long on heating oil). This may be attractive to carriers not only as it may keep their fuel costs down, but, also very valuably, this may also reduce the volatility of their earnings over time – which is often a major problem in air transportation financial management. However, hedging itself involves management costs and, of course, may cause the airline to lose out (possibly dramatically) if the commodity price falls. Practice amongst the carriers varies: some may opt to hedge a certain percentage of their uplift, others may not hedge at all. Contracts may be agreed for just one quarter, but more typically in Europe, for one year. Most carriers which hedge use simple jet fuel ‘swaps’. These are financial instruments, whereby a fixed price for future purchases is agreed with a counter-party, such as a bank. Larger carriers often use more sophisticated techniques, however. Taking hedging into account, into-plane prices (i.e. including all charges, fees and taxes payable at a particular location) vary by relatively little across Europe at the major airports, and closely follow the prevailing commodity value (Rotterdam spot price). At the time of writing this Annex (early November, 2002) many commodity values at the larger European airports tended to be in the range of USD 0.80 – 0.85 per US gallon, to which one needs to variously add from a whole raft of duties, fees, taxes and ‘supplier differentials’ (covering the local logistics of supply, and supplier mark-up). Since competition is generally very strong in the European market, these additional costs to the carriers tend to vary only somewhere typically between USD 0.10 – 0.15 per US gallon, giving a November 2002 into-plane price of USD 0.90 – 1.00 per US gallon (for larger airports). These additional costs will be agreed, and fixed, for the period of the contract negotiated. VAT is not charged on aviation fuel in Europe - except on domestic aviation fuel in Scandinavia: on top of certain environmental taxes (e.g. in Norway). Even allowing for these taxes, into-plane prices still only vary by the order of 10% for major carriers at the larger European airports. Those where competition and throughput volumes are both very high (e.g. Heathrow) will be at the lower end of this range, whilst those with less open competition (e.g. Rome) will be at the higher end. Previous confidential research (directly with two major European fuel suppliers) has suggested that carriers with very large uplifts of fuel, or perhaps part of large co-ops, might obtain a further 10% concession off the typical price (of say USD 0.95 per US gallon), whilst monopoly suppliers at smaller, regional airports might increase prices by as much as 30% on this typical price. This gives us a total (asymmetrical) working range of USD 0.85 – 1.25 per US gallon, although it is obviously not possible for this Study to properly quantify or weight these effects without access to the confidential data, and actual uplift volumes. Referring to Table C2, it may be seen that selecting a current working value of USD 0.95 per US gallon equates to 0.31 EUR/kg (see Annex B, Conversions and exchange rates).

Evaluating the true cost to airlines of one minute of airborne or ground delay
Transport Studies Group University of Westminster
A - 5
Table C2: Fuel price conversion table
USD per US gallon EUR per kg
0.50 0.17 0.55 0.18 0.60 0.20 0.65 0.21 0.70 0.23 0.75 0.25 0.80 0.26 0.85 0.28 0.90 0.30 0.95 0.31 1.00 0.33 1.05 0.35 1.10 0.36 1.15 0.38 1.20 0.40 1.25 0.41 1.30 0.43 1.35 0.45 1.40 0.46
For the purposes of this Study (as with other direct and indirect operating costs) it is desired to assign a ‘base’ value (for the price of fuel), and also a ‘high’ and a ‘low’ working value, in order to be able to estimate error margins in the calculations. A key question to ask is how variations between carriers at any given moment in time (horizontal variation) compare to those across time (longitudinal variation). Prices in November 2001 were based on a commodity value of around USD 0.50 – 0.55 per US gallon, giving typical into-plane prices at the larger European airports of around USD 0.60 – 0.70 per US gallon, i.e. approximately 0.21 EUR/kg. During the last two years, the commodity price peaked at the beginning of 2000, at around USD 1.20 per US gallon, giving a typical into-plane price of around 0.43 EUR/kg (again, at the larger European airports). Longitudinal price variations are thus greater than horizontal ones (particularly when the typical values paid at larger airports are considered) and are thus an important consideration in the context of this Study - which should reflect more than just a cross-section of current prices. Whilst it may well be argued that some carriers would have paid even less than the 0.21 EUR/kg quoted above, and some more than the larger-airport, typical high of 0.43 EUR/kg, these already represent fairly wide margins to apply either side of the current base value (0.31 EUR/kg), so these values (0.21 and 0.43 EUR/kg) will be (subjectively) adopted as the upper and lower bounds for this Study. Prices have historically been much lower than at the time of writing, and may conceivably drop below the lower working value (0.21 EUR/kg) in the future, although it is rather more likely that the upper value will be exceeded in the longer term. Whilst military action may result in relatively short-term price spikes, experience has shown that prices may then well fall back below pre-conflict values due to decline in demand.
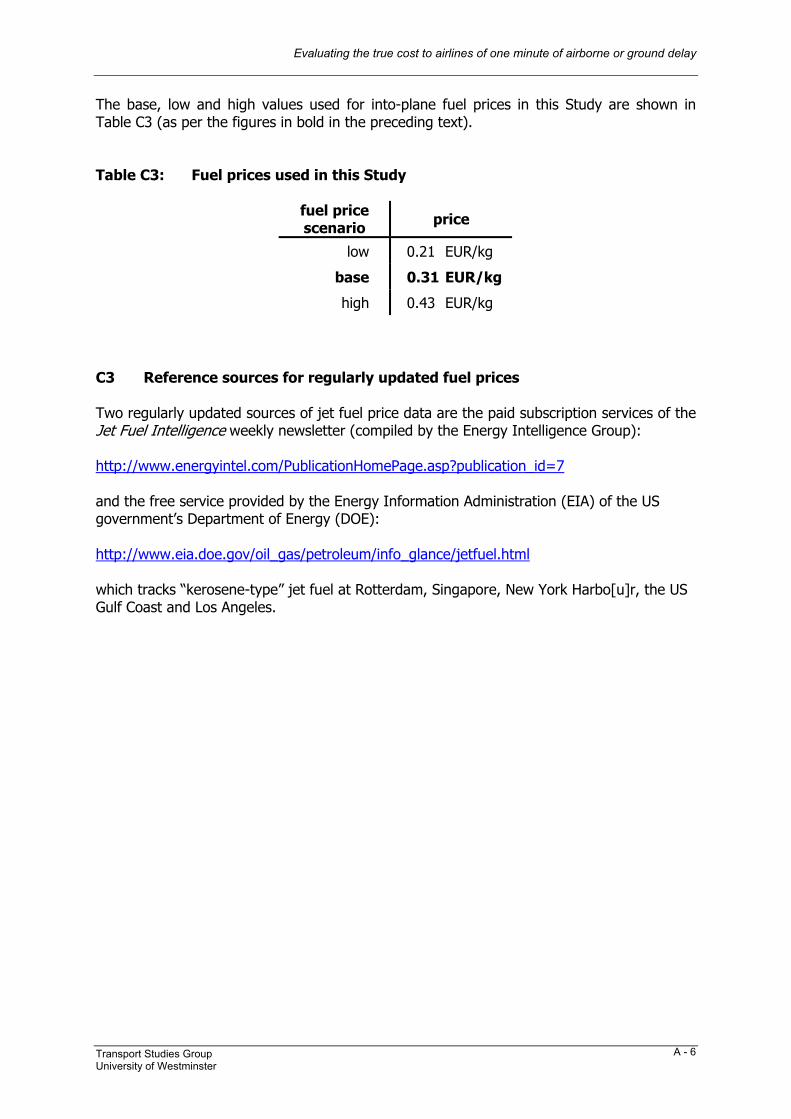
Evaluating the true cost to airlines of one minute of airborne or ground delay
Transport Studies Group University of Westminster
A - 6
The base, low and high values used for into-plane fuel prices in this Study are shown in Table C3 (as per the figures in bold in the preceding text). Table C3: Fuel prices used in this Study
fuel price scenario price
low 0.21 EUR/kg
base 0.31 EUR/kg
high 0.43 EUR/kg C3 Reference sources for regularly updated fuel prices Two regularly updated sources of jet fuel price data are the paid subscription services of the Jet Fuel Intelligence weekly newsletter (compiled by the Energy Intelligence Group): http://www.energyintel.com/PublicationHomePage.asp?publication_id=7 and the free service provided by the Energy Information Administration (EIA) of the US government’s Department of Energy (DOE): http://www.eia.doe.gov/oil_gas/petroleum/info_glance/jetfuel.html which tracks “kerosene-type” jet fuel at Rotterdam, Singapore, New York Harbo[u]r, the US Gulf Coast and Los Angeles.
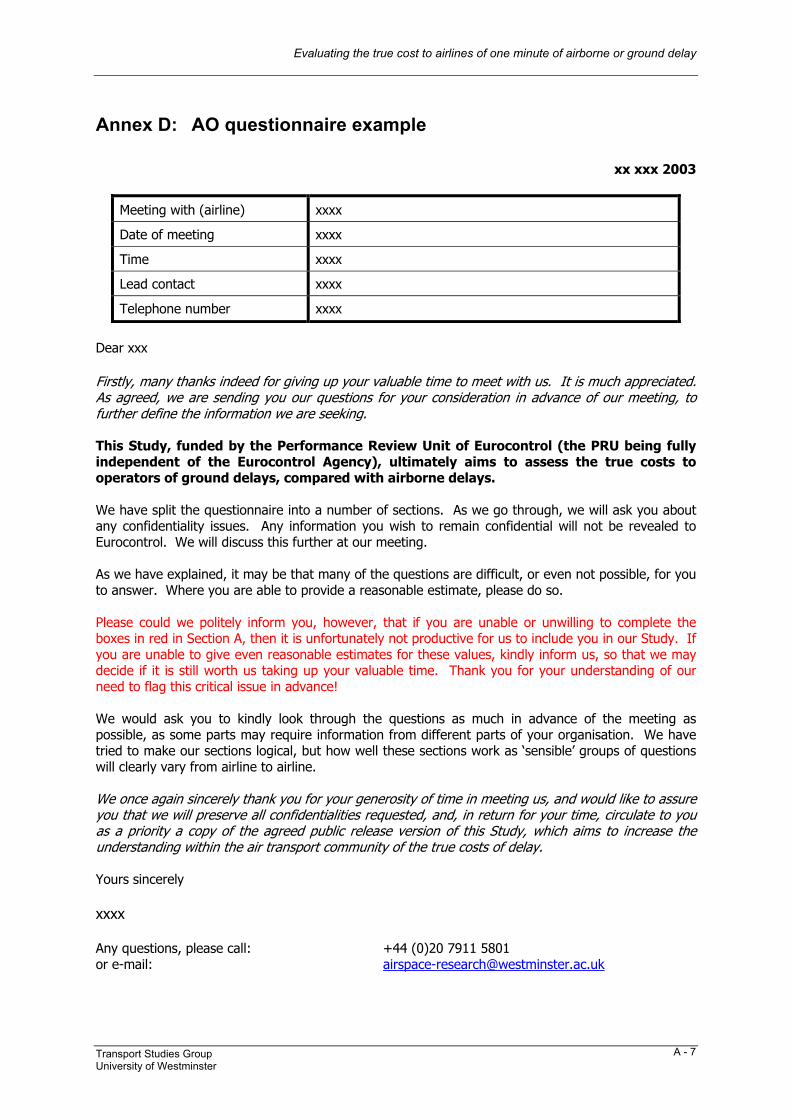
Evaluating the true cost to airlines of one minute of airborne or ground delay
Transport Studies Group University of Westminster
A - 7
Annex D: AO questionnaire example
xx xxx 2003
Meeting with (airline) xxxx
Date of meeting xxxx
Time xxxx
Lead contact xxxx
Telephone number xxxx
Dear xxx Firstly, many thanks indeed for giving up your valuable time to meet with us. It is much appreciated. As agreed, we are sending you our questions for your consideration in advance of our meeting, to further define the information we are seeking. This Study, funded by the Performance Review Unit of Eurocontrol (the PRU being fully independent of the Eurocontrol Agency), ultimately aims to assess the true costs to operators of ground delays, compared with airborne delays. We have split the questionnaire into a number of sections. As we go through, we will ask you about any confidentiality issues. Any information you wish to remain confidential will not be revealed to Eurocontrol. We will discuss this further at our meeting. As we have explained, it may be that many of the questions are difficult, or even not possible, for you to answer. Where you are able to provide a reasonable estimate, please do so. Please could we politely inform you, however, that if you are unable or unwilling to complete the boxes in red in Section A, then it is unfortunately not productive for us to include you in our Study. If you are unable to give even reasonable estimates for these values, kindly inform us, so that we may decide if it is still worth us taking up your valuable time. Thank you for your understanding of our need to flag this critical issue in advance! We would ask you to kindly look through the questions as much in advance of the meeting as possible, as some parts may require information from different parts of your organisation. We have tried to make our sections logical, but how well these sections work as ‘sensible’ groups of questions will clearly vary from airline to airline. We once again sincerely thank you for your generosity of time in meeting us, and would like to assure you that we will preserve all confidentialities requested, and, in return for your time, circulate to you as a priority a copy of the agreed public release version of this Study, which aims to increase the understanding within the air transport community of the true costs of delay. Yours sincerely xxxx Any questions, please call: +44 (0)20 7911 5801 or e-mail: [email protected]
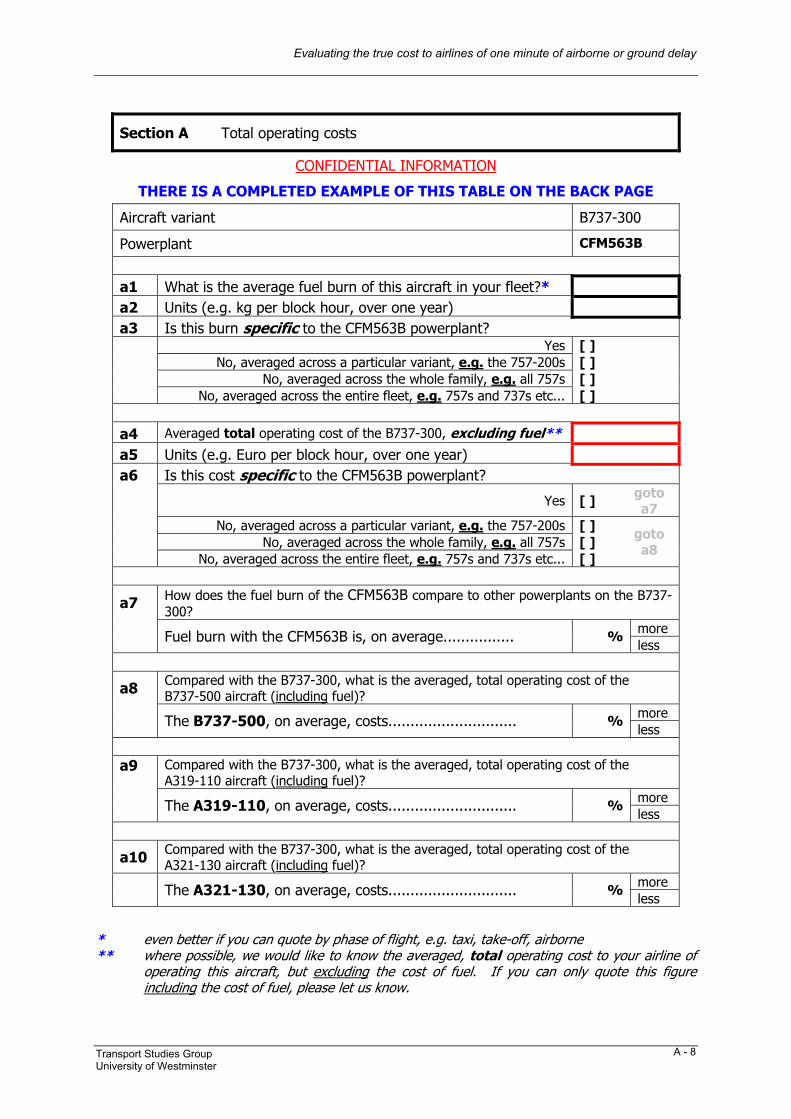
Evaluating the true cost to airlines of one minute of airborne or ground delay
Transport Studies Group University of Westminster
A - 8
Section A Total operating costs
CONFIDENTIAL INFORMATION
THERE IS A COMPLETED EXAMPLE OF THIS TABLE ON THE BACK PAGE
Aircraft variant B737-300
Powerplant CFM563B
a1 What is the average fuel burn of this aircraft in your fleet?* a2 Units (e.g. kg per block hour, over one year) a3 Is this burn specific to the CFM563B powerplant?
Yes [ ] No, averaged across a particular variant, e.g. the 757-200s [ ]
No, averaged across the whole family, e.g. all 757s [ ]
No, averaged across the entire fleet, e.g. 757s and 737s etc... [ ] a4 Averaged total operating cost of the B737-300, excluding fuel** a5 Units (e.g. Euro per block hour, over one year) a6 Is this cost specific to the CFM563B powerplant?
Yes [ ] goto a7
No, averaged across a particular variant, e.g. the 757-200s [ ] No, averaged across the whole family, e.g. all 757s [ ]
No, averaged across the entire fleet, e.g. 757s and 737s etc... [ ]
goto a8
a7 How does the fuel burn of the CFM563B compare to other powerplants on the B737-300?
more Fuel burn with the CFM563B is, on average................ % less
a8 Compared with the B737-300, what is the averaged, total operating cost of the B737-500 aircraft (including fuel)?
more The B737-500, on average, costs............................. % less
a9 Compared with the B737-300, what is the averaged, total operating cost of the
A319-110 aircraft (including fuel)? more The A319-110, on average, costs............................. % less
a10 Compared with the B737-300, what is the averaged, total operating cost of the A321-130 aircraft (including fuel)?
more The A321-130, on average, costs............................. % less
* even better if you can quote by phase of flight, e.g. taxi, take-off, airborne ** where possible, we would like to know the averaged, total operating cost to your airline of
operating this aircraft, but excluding the cost of fuel. If you can only quote this figure including the cost of fuel, please let us know.
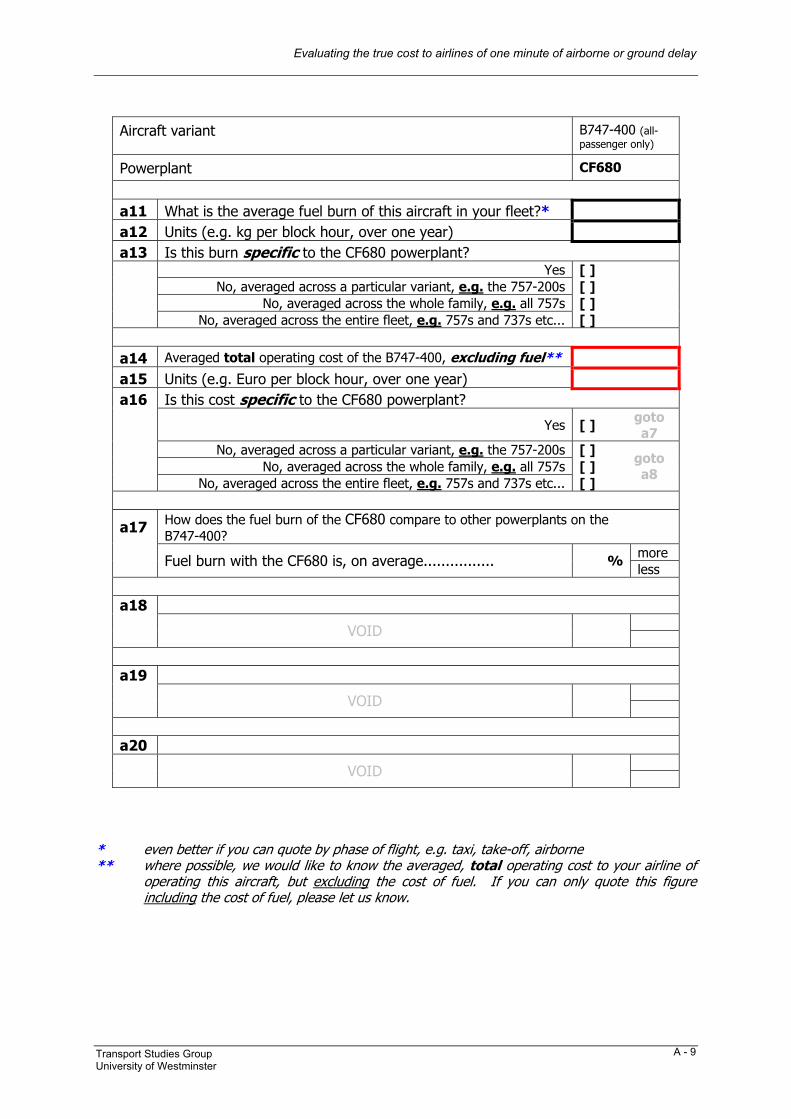
Evaluating the true cost to airlines of one minute of airborne or ground delay
Transport Studies Group University of Westminster
A - 9
Aircraft variant B747-400 (all-passenger only)
Powerplant CF680
a11 What is the average fuel burn of this aircraft in your fleet?* a12 Units (e.g. kg per block hour, over one year) a13 Is this burn specific to the CF680 powerplant?
Yes [ ] No, averaged across a particular variant, e.g. the 757-200s [ ]
No, averaged across the whole family, e.g. all 757s [ ]
No, averaged across the entire fleet, e.g. 757s and 737s etc... [ ] a14 Averaged total operating cost of the B747-400, excluding fuel** a15 Units (e.g. Euro per block hour, over one year) a16 Is this cost specific to the CF680 powerplant?
Yes [ ] goto a7
No, averaged across a particular variant, e.g. the 757-200s [ ] No, averaged across the whole family, e.g. all 757s [ ]
No, averaged across the entire fleet, e.g. 757s and 737s etc... [ ]
goto a8
a17 How does the fuel burn of the CF680 compare to other powerplants on the B747-400?
more Fuel burn with the CF680 is, on average................ % less
a18
VOID
a19 VOID
a20
VOID * even better if you can quote by phase of flight, e.g. taxi, take-off, airborne ** where possible, we would like to know the averaged, total operating cost to your airline of
operating this aircraft, but excluding the cost of fuel. If you can only quote this figure including the cost of fuel, please let us know.

Evaluating the true cost to airlines of one minute of airborne or ground delay
Transport Studies Group University of Westminster
A - 10
Section B Operating costs in more detail
We are interested to know to what level of detail you are able to allocate various costs to operating particular aircraft. The table below is adapted from standard financial ICAO reporting categories (“ICAO FORM EF - Financial Data – Commercial Air Carriers”).
b1 How does your airline allocate operating costs to your aircraft?
The first (example) item shows that “Ticketing, sales and promotion (total)” are not allocated to your aircraft at all, but more generally accounted, as indicated by the “5”.
Please write corresponding codes “1” – “5” in each of the boxes on the right. 1 We do this on an aircraft-by-aircraft basis (e.g. G-BYAT) 2 We take an average across a particular variant, e.g. the 757-200s 3 We take an average across the whole family, e.g. all 757s 4 We take an average across the entire fleet, e.g. 757s and 737s etc...
5 We do not really include this as part of costing aircraft ops, e.g. this cost gets accounted more generally elsewhere, but not as a fleet cost
Please amend these categories “1” – “5” if necessary!
11 Ticketing, sales and promotion (total) EXAMPLE 5 5.2 Aircraft fuel and oil (incl. throughput charges, non-refundable duties & taxes) 6 Flight equipment maintenance and overhaul (h) 5.1 Flight crew salaries and expenses (d) 10.1 Cabin crew salaries and expenses (d) 7.1 Depreciation – flight equipment (“purchased outright”) 5.4 Rental of flight equipment (f) (see also 7.2) 7.2 Amortisation of capital leases – flight equipment (excl. short-term leases) (i) 5.3 Flight equipment insurance 9 Station expenses (e.g. handling – own staff / equip; + all 3rd party costs) (l) 7.3 Depreciation & amortisation – ground property & equipment 7.4 Other such as “extension and development projects” 8.1 Landing & associated airport charges (incl. passenger fees; security, parking) 8.2 Air navigation charges (en-route, approach & aerodrome) 10.2 Other (e.g. pax liability/accident insurance + all pax services, e.g. meals) Over what period of time are such averages taken? How would a batch of C/D checks in one year affect your averages?
The footnotes are on page xx if you wish to refer to them
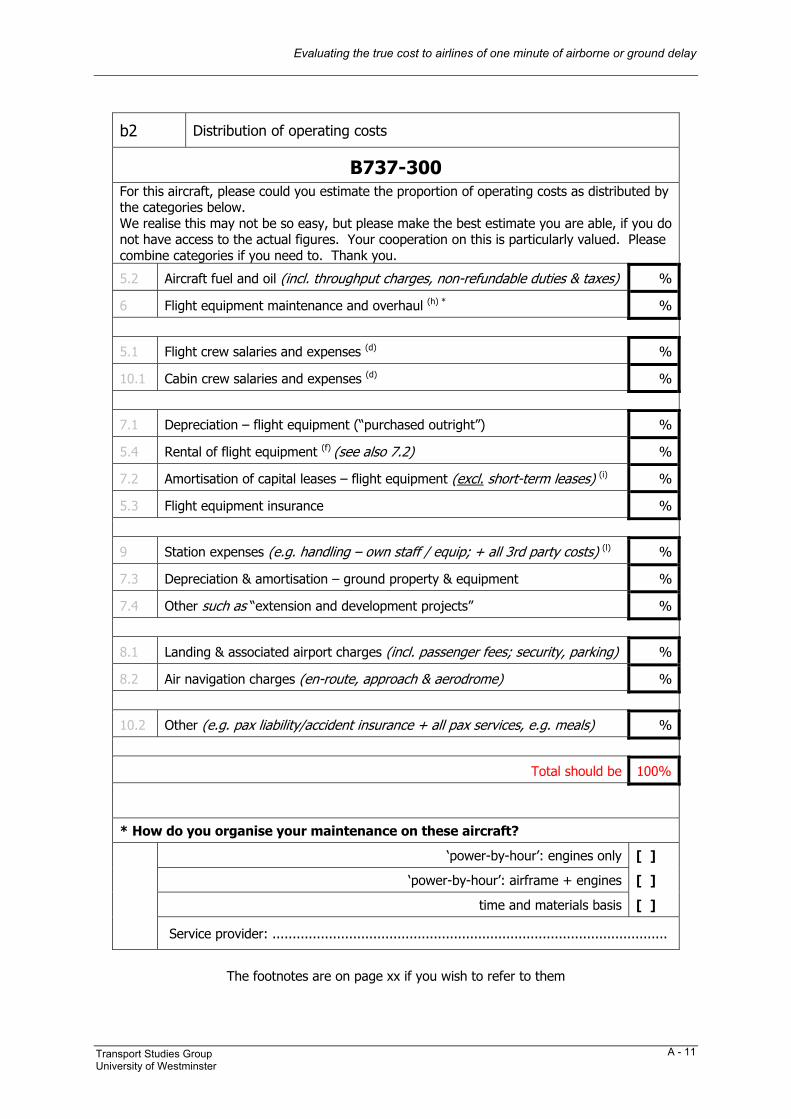
Evaluating the true cost to airlines of one minute of airborne or ground delay
Transport Studies Group University of Westminster
A - 11
b2 Distribution of operating costs
B737-300 For this aircraft, please could you estimate the proportion of operating costs as distributed by the categories below. We realise this may not be so easy, but please make the best estimate you are able, if you do not have access to the actual figures. Your cooperation on this is particularly valued. Please combine categories if you need to. Thank you.
5.2 Aircraft fuel and oil (incl. throughput charges, non-refundable duties & taxes) %
6 Flight equipment maintenance and overhaul (h) * %
5.1 Flight crew salaries and expenses (d) %
10.1 Cabin crew salaries and expenses (d) %
7.1 Depreciation – flight equipment (“purchased outright”) %
5.4 Rental of flight equipment (f) (see also 7.2) %
7.2 Amortisation of capital leases – flight equipment (excl. short-term leases) (i) %
5.3 Flight equipment insurance %
9 Station expenses (e.g. handling – own staff / equip; + all 3rd party costs) (l) %
7.3 Depreciation & amortisation – ground property & equipment %
7.4 Other such as “extension and development projects” %
8.1 Landing & associated airport charges (incl. passenger fees; security, parking) %
8.2 Air navigation charges (en-route, approach & aerodrome) %
10.2 Other (e.g. pax liability/accident insurance + all pax services, e.g. meals) %
Total should be 100%
* How do you organise your maintenance on these aircraft?
‘power-by-hour’: engines only [ ]
‘power-by-hour’: airframe + engines [ ]
time and materials basis [ ]
Service provider: ..................................................................................................
The footnotes are on page xx if you wish to refer to them
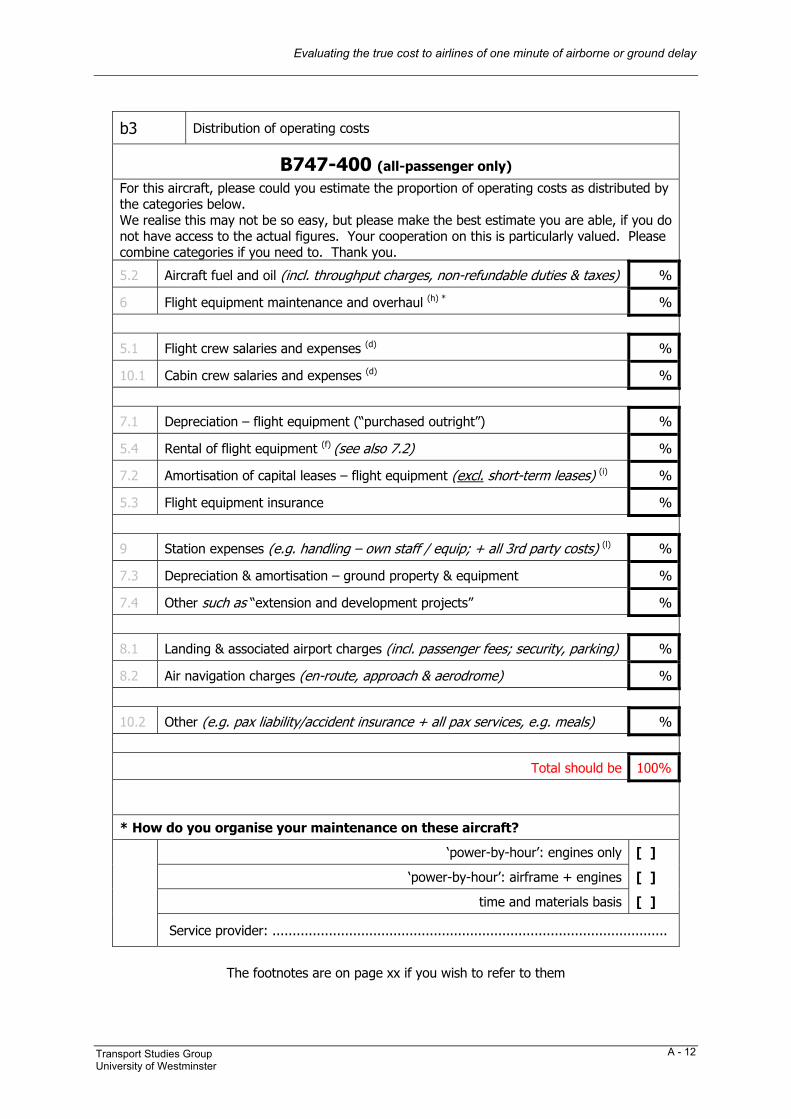
Evaluating the true cost to airlines of one minute of airborne or ground delay
Transport Studies Group University of Westminster
A - 12
b3 Distribution of operating costs
B747-400 (all-passenger only) For this aircraft, please could you estimate the proportion of operating costs as distributed by the categories below. We realise this may not be so easy, but please make the best estimate you are able, if you do not have access to the actual figures. Your cooperation on this is particularly valued. Please combine categories if you need to. Thank you.
5.2 Aircraft fuel and oil (incl. throughput charges, non-refundable duties & taxes) %
6 Flight equipment maintenance and overhaul (h) * %
5.1 Flight crew salaries and expenses (d) %
10.1 Cabin crew salaries and expenses (d) %
7.1 Depreciation – flight equipment (“purchased outright”) %
5.4 Rental of flight equipment (f) (see also 7.2) %
7.2 Amortisation of capital leases – flight equipment (excl. short-term leases) (i) %
5.3 Flight equipment insurance %
9 Station expenses (e.g. handling – own staff / equip; + all 3rd party costs) (l) %
7.3 Depreciation & amortisation – ground property & equipment %
7.4 Other such as “extension and development projects” %
8.1 Landing & associated airport charges (incl. passenger fees; security, parking) %
8.2 Air navigation charges (en-route, approach & aerodrome) %
10.2 Other (e.g. pax liability/accident insurance + all pax services, e.g. meals) %
Total should be 100%
* How do you organise your maintenance on these aircraft?
‘power-by-hour’: engines only [ ]
‘power-by-hour’: airframe + engines [ ]
time and materials basis [ ]
Service provider: ..................................................................................................
The footnotes are on page xx if you wish to refer to them
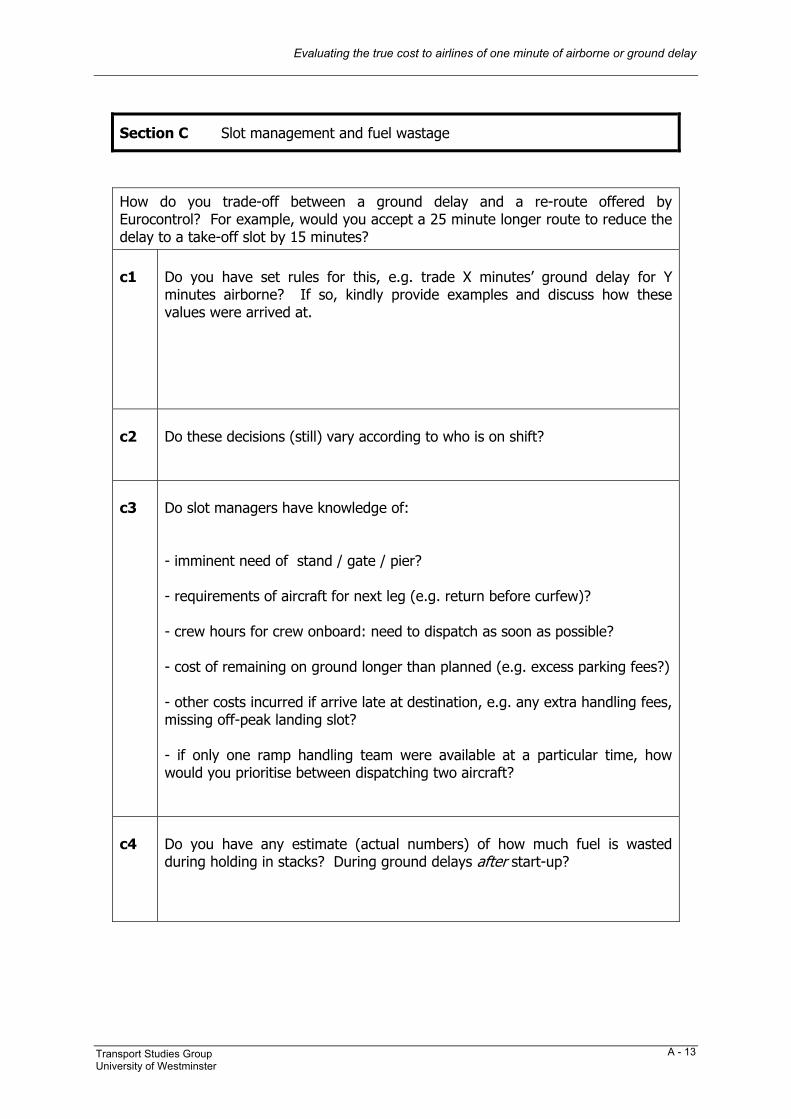
Evaluating the true cost to airlines of one minute of airborne or ground delay
Transport Studies Group University of Westminster
A - 13
Section C Slot management and fuel wastage
How do you trade-off between a ground delay and a re-route offered by Eurocontrol? For example, would you accept a 25 minute longer route to reduce the delay to a take-off slot by 15 minutes? c1
Do you have set rules for this, e.g. trade X minutes’ ground delay for Y minutes airborne? If so, kindly provide examples and discuss how these values were arrived at.
c2
Do these decisions (still) vary according to who is on shift?
c3
Do slot managers have knowledge of: - imminent need of stand / gate / pier? - requirements of aircraft for next leg (e.g. return before curfew)? - crew hours for crew onboard: need to dispatch as soon as possible? - cost of remaining on ground longer than planned (e.g. excess parking fees?) - other costs incurred if arrive late at destination, e.g. any extra handling fees, missing off-peak landing slot? - if only one ramp handling team were available at a particular time, how would you prioritise between dispatching two aircraft?
c4
Do you have any estimate (actual numbers) of how much fuel is wasted during holding in stacks? During ground delays after start-up?
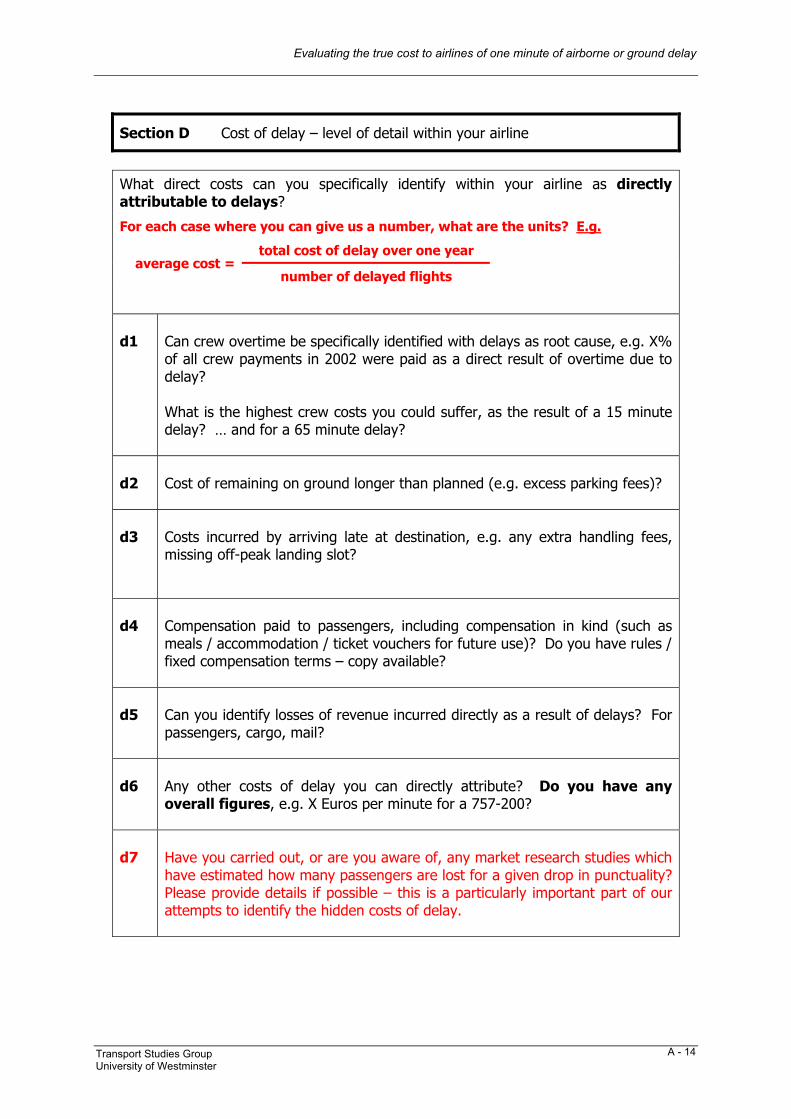
Evaluating the true cost to airlines of one minute of airborne or ground delay
Transport Studies Group University of Westminster
A - 14
Section D Cost of delay – level of detail within your airline
What direct costs can you specifically identify within your airline as directly attributable to delays?
For each case where you can give us a number, what are the units? E.g.
total cost of delay over one year average cost =
number of delayed flights
d1
Can crew overtime be specifically identified with delays as root cause, e.g. X% of all crew payments in 2002 were paid as a direct result of overtime due to delay? What is the highest crew costs you could suffer, as the result of a 15 minute delay? … and for a 65 minute delay?
d2
Cost of remaining on ground longer than planned (e.g. excess parking fees)?
d3
Costs incurred by arriving late at destination, e.g. any extra handling fees, missing off-peak landing slot?
d4
Compensation paid to passengers, including compensation in kind (such as meals / accommodation / ticket vouchers for future use)? Do you have rules / fixed compensation terms – copy available?
d5
Can you identify losses of revenue incurred directly as a result of delays? For passengers, cargo, mail?
d6
Any other costs of delay you can directly attribute? Do you have any overall figures, e.g. X Euros per minute for a 757-200?
d7
Have you carried out, or are you aware of, any market research studies which have estimated how many passengers are lost for a given drop in punctuality? Please provide details if possible – this is a particularly important part of our attempts to identify the hidden costs of delay.
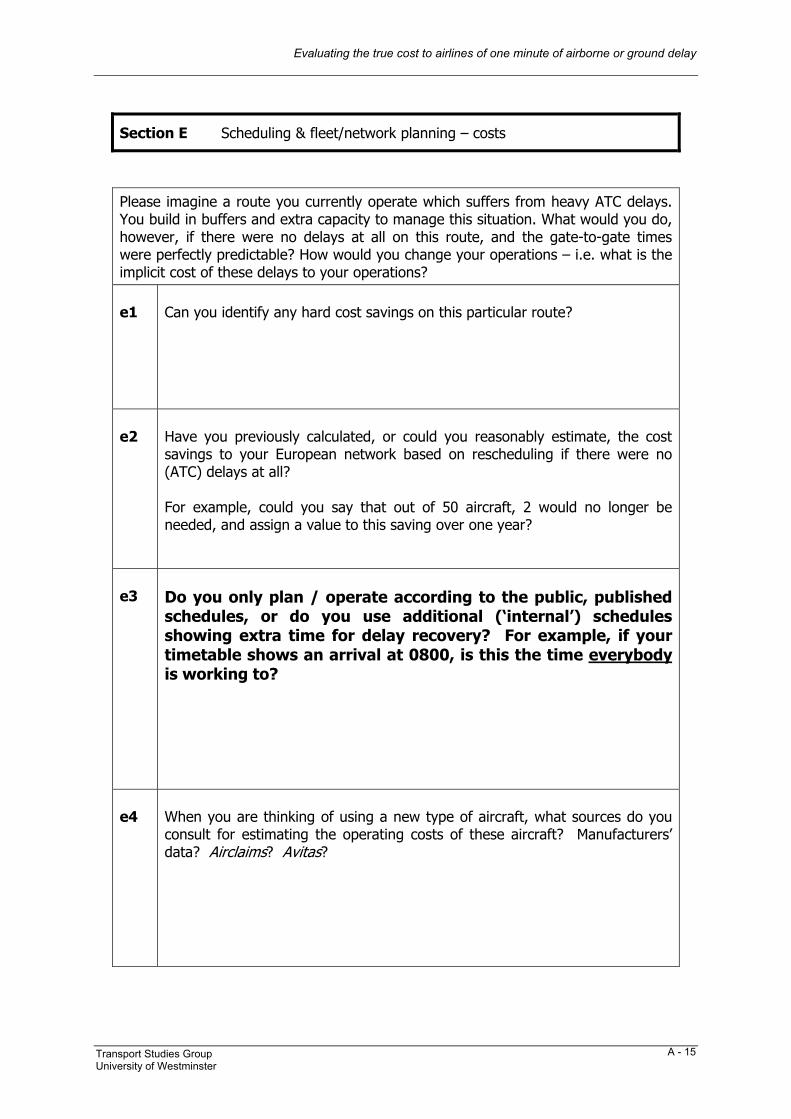
Evaluating the true cost to airlines of one minute of airborne or ground delay
Transport Studies Group University of Westminster
A - 15
Section E Scheduling & fleet/network planning – costs
Please imagine a route you currently operate which suffers from heavy ATC delays. You build in buffers and extra capacity to manage this situation. What would you do, however, if there were no delays at all on this route, and the gate-to-gate times were perfectly predictable? How would you change your operations – i.e. what is the implicit cost of these delays to your operations? e1
Can you identify any hard cost savings on this particular route?
e2
Have you previously calculated, or could you reasonably estimate, the cost savings to your European network based on rescheduling if there were no (ATC) delays at all? For example, could you say that out of 50 aircraft, 2 would no longer be needed, and assign a value to this saving over one year?
e3
Do you only plan / operate according to the public, published schedules, or do you use additional (‘internal’) schedules showing extra time for delay recovery? For example, if your timetable shows an arrival at 0800, is this the time everybody is working to?
e4
When you are thinking of using a new type of aircraft, what sources do you consult for estimating the operating costs of these aircraft? Manufacturers’ data? Airclaims? Avitas?
Evaluating the true cost to airlines of one minute of airborne or ground delay
Transport Studies Group University of Westminster
A - 16
Section F Special questions for airline
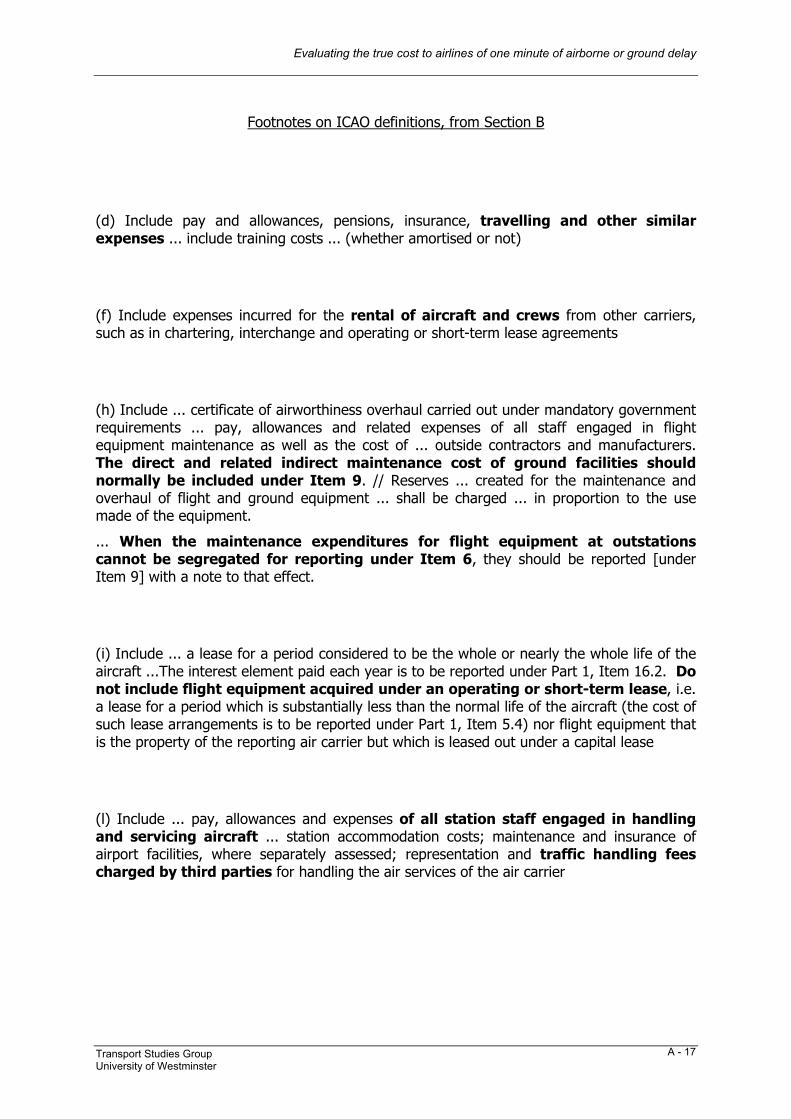
Evaluating the true cost to airlines of one minute of airborne or ground delay
Transport Studies Group University of Westminster
A - 17
Footnotes on ICAO definitions, from Section B
(d) Include pay and allowances, pensions, insurance, travelling and other similar expenses ... include training costs ... (whether amortised or not)
(f) Include expenses incurred for the rental of aircraft and crews from other carriers, such as in chartering, interchange and operating or short-term lease agreements
(h) Include ... certificate of airworthiness overhaul carried out under mandatory government requirements ... pay, allowances and related expenses of all staff engaged in flight equipment maintenance as well as the cost of ... outside contractors and manufacturers. The direct and related indirect maintenance cost of ground facilities should normally be included under Item 9. // Reserves ... created for the maintenance and overhaul of flight and ground equipment ... shall be charged ... in proportion to the use made of the equipment.
... When the maintenance expenditures for flight equipment at outstations cannot be segregated for reporting under Item 6, they should be reported [under Item 9] with a note to that effect.
(i) Include ... a lease for a period considered to be the whole or nearly the whole life of the aircraft ...The interest element paid each year is to be reported under Part 1, Item 16.2. Do not include flight equipment acquired under an operating or short-term lease, i.e. a lease for a period which is substantially less than the normal life of the aircraft (the cost of such lease arrangements is to be reported under Part 1, Item 5.4) nor flight equipment that is the property of the reporting air carrier but which is leased out under a capital lease
(l) Include ... pay, allowances and expenses of all station staff engaged in handling and servicing aircraft ... station accommodation costs; maintenance and insurance of airport facilities, where separately assessed; representation and traffic handling fees charged by third parties for handling the air services of the air carrier
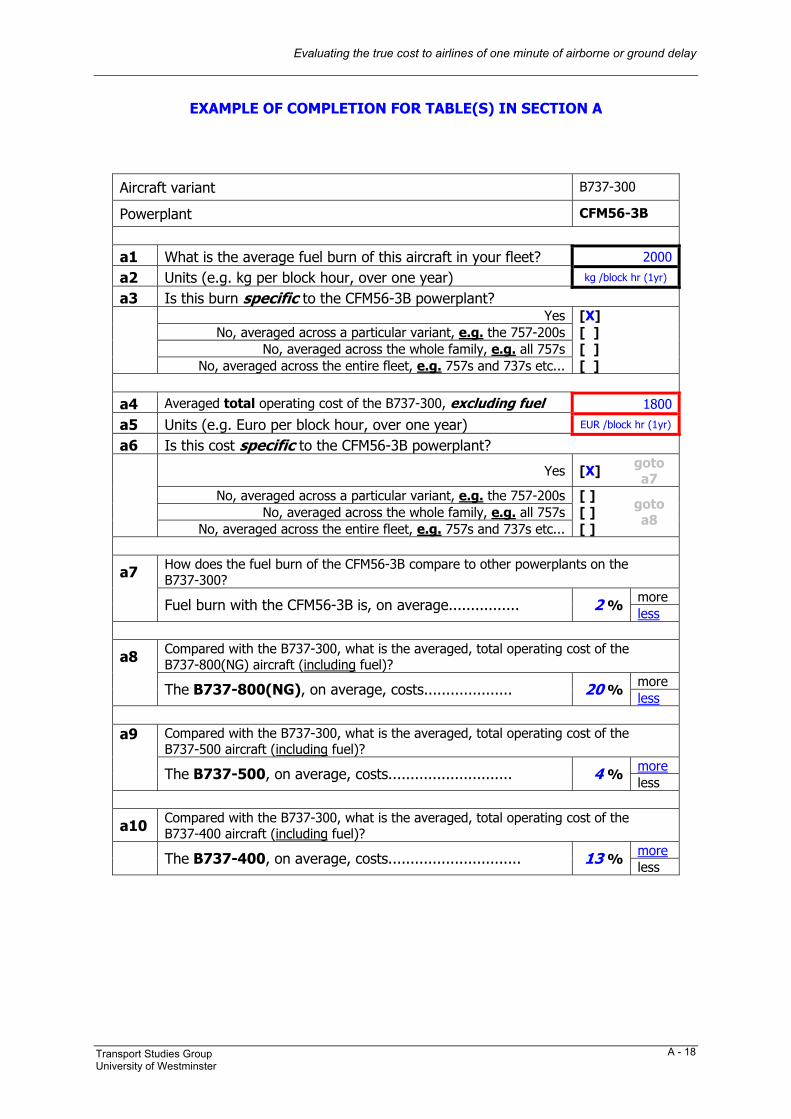
Evaluating the true cost to airlines of one minute of airborne or ground delay
Transport Studies Group University of Westminster
A - 18
EXAMPLE OF COMPLETION FOR TABLE(S) IN SECTION A
Aircraft variant B737-300
Powerplant CFM56-3B
a1 What is the average fuel burn of this aircraft in your fleet? 2000
a2 Units (e.g. kg per block hour, over one year) kg /block hr (1yr) a3 Is this burn specific to the CFM56-3B powerplant?
Yes [X] No, averaged across a particular variant, e.g. the 757-200s [ ]
No, averaged across the whole family, e.g. all 757s [ ]
No, averaged across the entire fleet, e.g. 757s and 737s etc... [ ] a4 Averaged total operating cost of the B737-300, excluding fuel 1800
a5 Units (e.g. Euro per block hour, over one year) EUR /block hr (1yr)
a6 Is this cost specific to the CFM56-3B powerplant?
Yes [X] goto a7
No, averaged across a particular variant, e.g. the 757-200s [ ] No, averaged across the whole family, e.g. all 757s [ ]
No, averaged across the entire fleet, e.g. 757s and 737s etc... [ ]
goto a8
a7 How does the fuel burn of the CFM56-3B compare to other powerplants on the B737-300?
more Fuel burn with the CFM56-3B is, on average................ 2 % less
a8 Compared with the B737-300, what is the averaged, total operating cost of the B737-800(NG) aircraft (including fuel)?
more The B737-800(NG), on average, costs.................... 20 % less a9 Compared with the B737-300, what is the averaged, total operating cost of the
B737-500 aircraft (including fuel)? more The B737-500, on average, costs............................ 4 % less
a10 Compared with the B737-300, what is the averaged, total operating cost of the B737-400 aircraft (including fuel)?
more The B737-400, on average, costs.............................. 13 % less
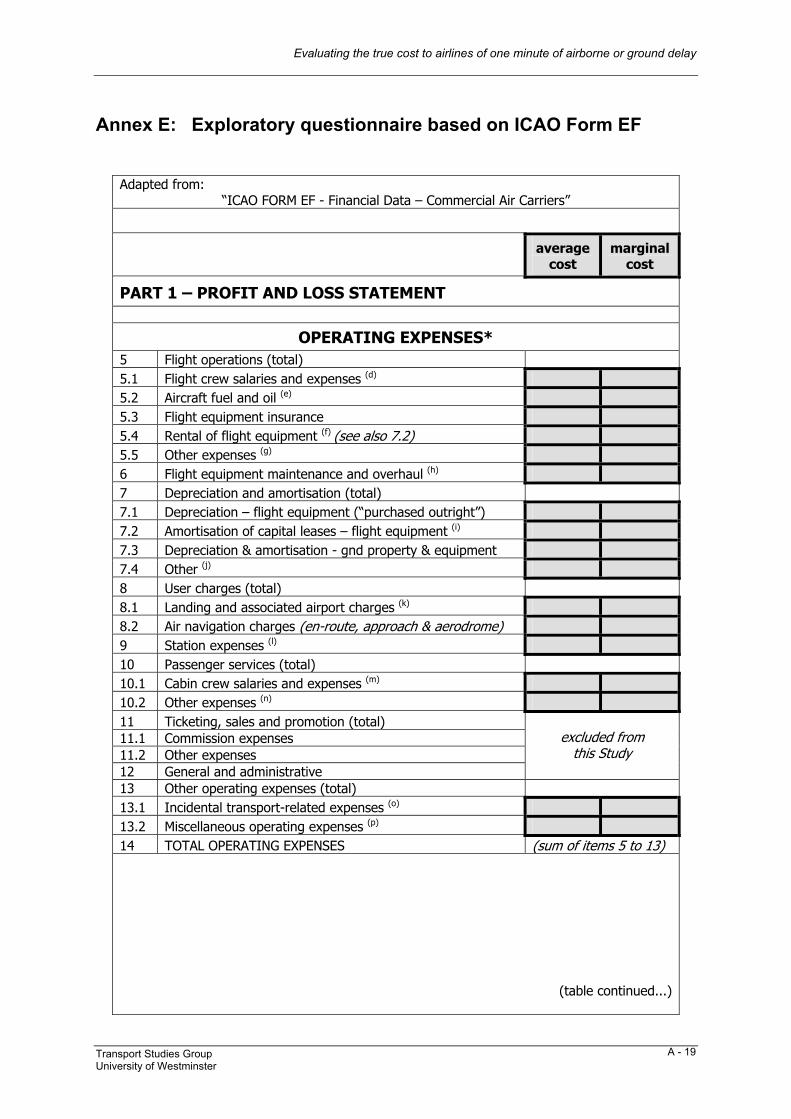
Evaluating the true cost to airlines of one minute of airborne or ground delay
Transport Studies Group University of Westminster
A - 19
Annex E: Exploratory questionnaire based on ICAO Form EF
Adapted from: “ICAO FORM EF - Financial Data – Commercial Air Carriers”
average cost
marginal cost
PART 1 – PROFIT AND LOSS STATEMENT
OPERATING EXPENSES* 5 Flight operations (total) 5.1 Flight crew salaries and expenses (d) 5.2 Aircraft fuel and oil (e) 5.3 Flight equipment insurance 5.4 Rental of flight equipment (f) (see also 7.2) 5.5 Other expenses (g) 6 Flight equipment maintenance and overhaul (h) 7 Depreciation and amortisation (total) 7.1 Depreciation – flight equipment (“purchased outright”) 7.2 Amortisation of capital leases – flight equipment (i) 7.3 Depreciation & amortisation - gnd property & equipment 7.4 Other (j) 8 User charges (total) 8.1 Landing and associated airport charges (k) 8.2 Air navigation charges (en-route, approach & aerodrome) 9 Station expenses (l) 10 Passenger services (total) 10.1 Cabin crew salaries and expenses (m) 10.2 Other expenses (n) 11 Ticketing, sales and promotion (total) 11.1 Commission expenses 11.2 Other expenses 12 General and administrative
excluded from this Study
13 Other operating expenses (total) 13.1 Incidental transport-related expenses (o) 13.2 Miscellaneous operating expenses (p) 14 TOTAL OPERATING EXPENSES (sum of items 5 to 13)
(table continued...)
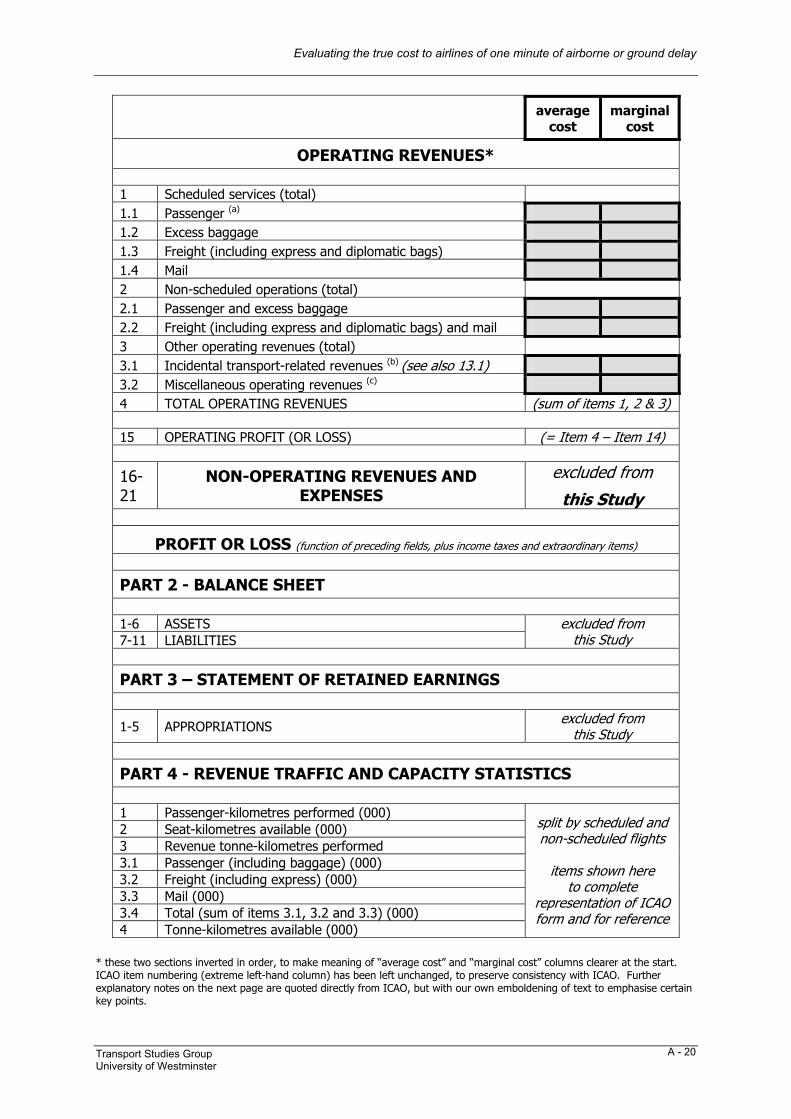
Evaluating the true cost to airlines of one minute of airborne or ground delay
Transport Studies Group University of Westminster
A - 20
average cost
marginal cost
OPERATING REVENUES* 1 Scheduled services (total) 1.1 Passenger (a) 1.2 Excess baggage 1.3 Freight (including express and diplomatic bags) 1.4 Mail 2 Non-scheduled operations (total) 2.1 Passenger and excess baggage 2.2 Freight (including express and diplomatic bags) and mail 3 Other operating revenues (total) 3.1 Incidental transport-related revenues (b) (see also 13.1) 3.2 Miscellaneous operating revenues (c) 4 TOTAL OPERATING REVENUES (sum of items 1, 2 & 3) 15 OPERATING PROFIT (OR LOSS) (= Item 4 – Item 14)
16-21
NON-OPERATING REVENUES AND EXPENSES
excluded from
this Study
PROFIT OR LOSS (function of preceding fields, plus income taxes and extraordinary items)
PART 2 - BALANCE SHEET 1-6 ASSETS 7-11 LIABILITIES
excluded from this Study
PART 3 – STATEMENT OF RETAINED EARNINGS
1-5 APPROPRIATIONS excluded from this Study
PART 4 - REVENUE TRAFFIC AND CAPACITY STATISTICS 1 Passenger-kilometres performed (000) 2 Seat-kilometres available (000) 3 Revenue tonne-kilometres performed 3.1 Passenger (including baggage) (000) 3.2 Freight (including express) (000) 3.3 Mail (000) 3.4 Total (sum of items 3.1, 3.2 and 3.3) (000) 4 Tonne-kilometres available (000)
split by scheduled and non-scheduled flights
items shown here
to complete representation of ICAO form and for reference
* these two sections inverted in order, to make meaning of “average cost” and “marginal cost” columns clearer at the start. ICAO item numbering (extreme left-hand column) has been left unchanged, to preserve consistency with ICAO. Further explanatory notes on the next page are quoted directly from ICAO, but with our own emboldening of text to emphasise certain key points.
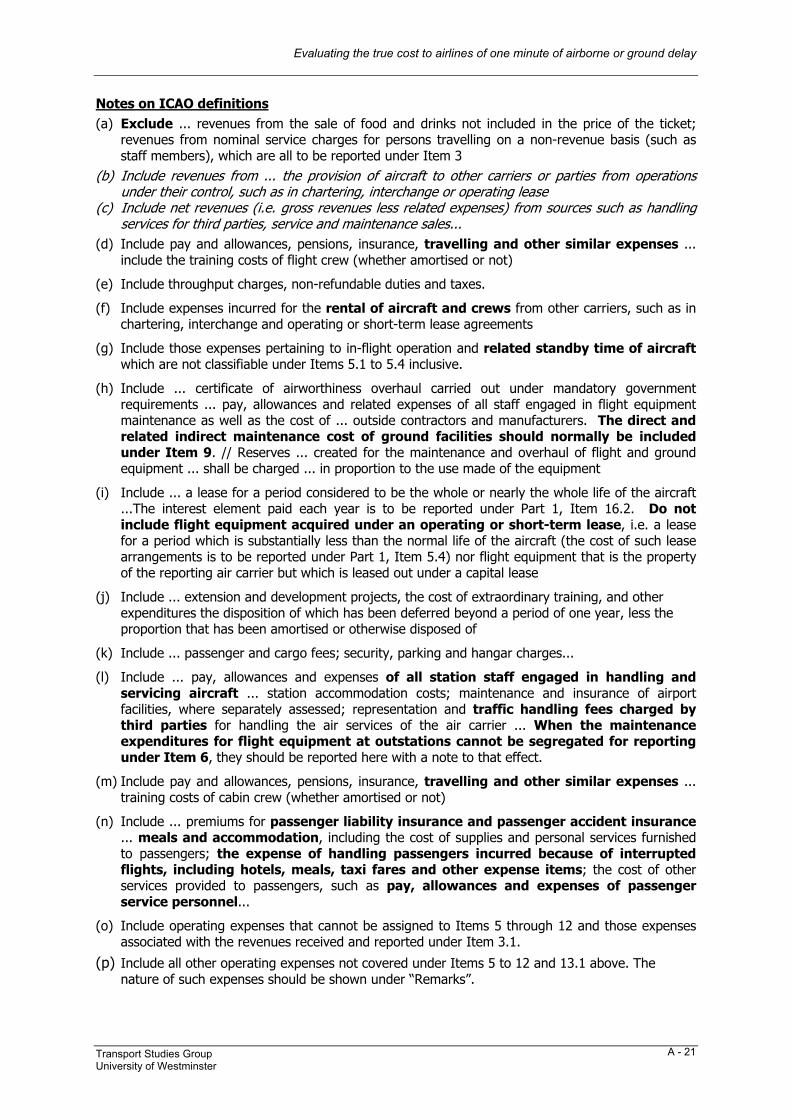
Evaluating the true cost to airlines of one minute of airborne or ground delay
Transport Studies Group University of Westminster
A - 21
Notes on ICAO definitions (a) Exclude ... revenues from the sale of food and drinks not included in the price of the ticket;
revenues from nominal service charges for persons travelling on a non-revenue basis (such as staff members), which are all to be reported under Item 3
(b) Include revenues from ... the provision of aircraft to other carriers or parties from operations under their control, such as in chartering, interchange or operating lease
(c) Include net revenues (i.e. gross revenues less related expenses) from sources such as handling services for third parties, service and maintenance sales...
(d) Include pay and allowances, pensions, insurance, travelling and other similar expenses ... include the training costs of flight crew (whether amortised or not)
(e) Include throughput charges, non-refundable duties and taxes.
(f) Include expenses incurred for the rental of aircraft and crews from other carriers, such as in chartering, interchange and operating or short-term lease agreements
(g) Include those expenses pertaining to in-flight operation and related standby time of aircraft which are not classifiable under Items 5.1 to 5.4 inclusive.
(h) Include ... certificate of airworthiness overhaul carried out under mandatory government requirements ... pay, allowances and related expenses of all staff engaged in flight equipment maintenance as well as the cost of ... outside contractors and manufacturers. The direct and related indirect maintenance cost of ground facilities should normally be included under Item 9. // Reserves ... created for the maintenance and overhaul of flight and ground equipment ... shall be charged ... in proportion to the use made of the equipment
(i) Include ... a lease for a period considered to be the whole or nearly the whole life of the aircraft ...The interest element paid each year is to be reported under Part 1, Item 16.2. Do not include flight equipment acquired under an operating or short-term lease, i.e. a lease for a period which is substantially less than the normal life of the aircraft (the cost of such lease arrangements is to be reported under Part 1, Item 5.4) nor flight equipment that is the property of the reporting air carrier but which is leased out under a capital lease
(j) Include ... extension and development projects, the cost of extraordinary training, and other expenditures the disposition of which has been deferred beyond a period of one year, less the proportion that has been amortised or otherwise disposed of
(k) Include ... passenger and cargo fees; security, parking and hangar charges...
(l) Include ... pay, allowances and expenses of all station staff engaged in handling and servicing aircraft ... station accommodation costs; maintenance and insurance of airport facilities, where separately assessed; representation and traffic handling fees charged by third parties for handling the air services of the air carrier ... When the maintenance expenditures for flight equipment at outstations cannot be segregated for reporting under Item 6, they should be reported here with a note to that effect.
(m) Include pay and allowances, pensions, insurance, travelling and other similar expenses ... training costs of cabin crew (whether amortised or not)
(n) Include ... premiums for passenger liability insurance and passenger accident insurance ... meals and accommodation, including the cost of supplies and personal services furnished to passengers; the expense of handling passengers incurred because of interrupted flights, including hotels, meals, taxi fares and other expense items; the cost of other services provided to passengers, such as pay, allowances and expenses of passenger service personnel...
(o) Include operating expenses that cannot be assigned to Items 5 through 12 and those expenses associated with the revenues received and reported under Item 3.1.
(p) Include all other operating expenses not covered under Items 5 to 12 and 13.1 above. The nature of such expenses should be shown under “Remarks”.
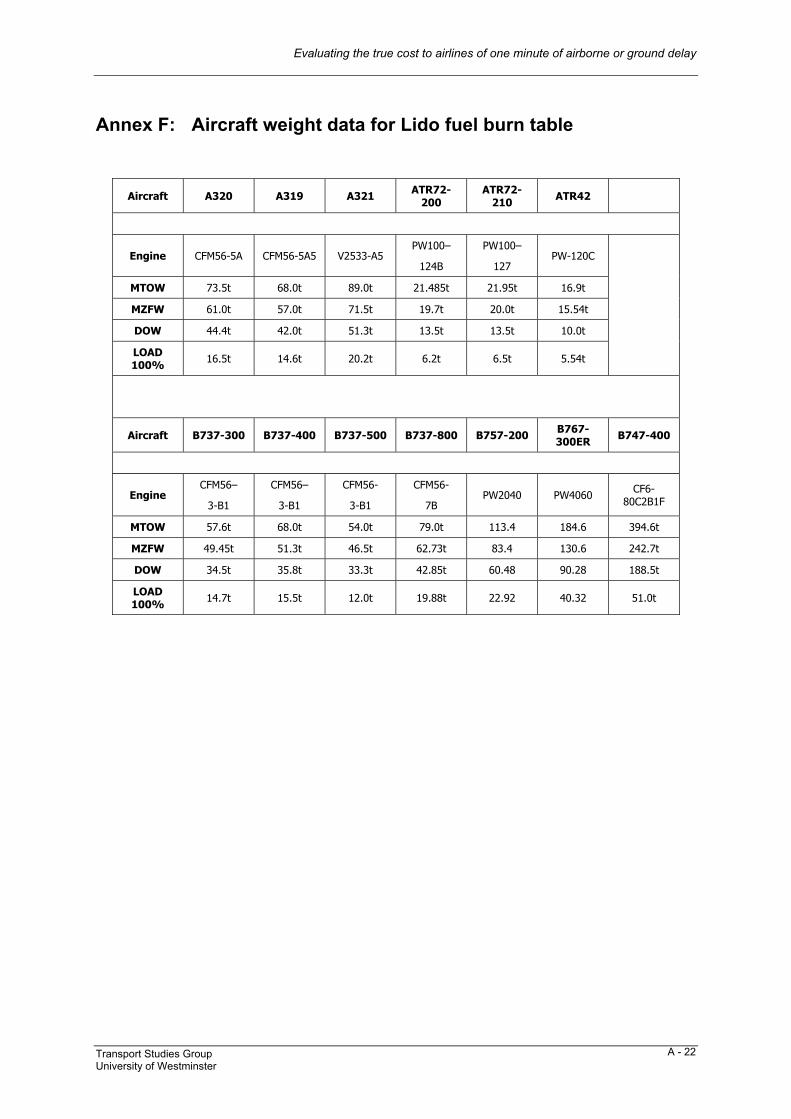
Evaluating the true cost to airlines of one minute of airborne or ground delay
Transport Studies Group University of Westminster
A - 22
Annex F: Aircraft weight data for Lido fuel burn table
Aircraft A320 A319 A321 ATR72-200
ATR72-210 ATR42
Engine CFM56-5A CFM56-5A5 V2533-A5 PW100–
124B
PW100–
127 PW-120C
MTOW 73.5t 68.0t 89.0t 21.485t 21.95t 16.9t
MZFW 61.0t 57.0t 71.5t 19.7t 20.0t 15.54t
DOW 44.4t 42.0t 51.3t 13.5t 13.5t 10.0t
LOAD 100% 16.5t 14.6t 20.2t 6.2t 6.5t 5.54t
Aircraft B737-300 B737-400 B737-500 B737-800 B757-200 B767-300ER B747-400
Engine CFM56–
3-B1
CFM56–
3-B1
CFM56-
3-B1
CFM56-
7B PW2040 PW4060 CF6-
80C2B1F
MTOW 57.6t 68.0t 54.0t 79.0t 113.4 184.6 394.6t
MZFW 49.45t 51.3t 46.5t 62.73t 83.4 130.6 242.7t
DOW 34.5t 35.8t 33.3t 42.85t 60.48 90.28 188.5t
LOAD 100% 14.7t 15.5t 12.0t 19.88t 22.92 40.32 51.0t
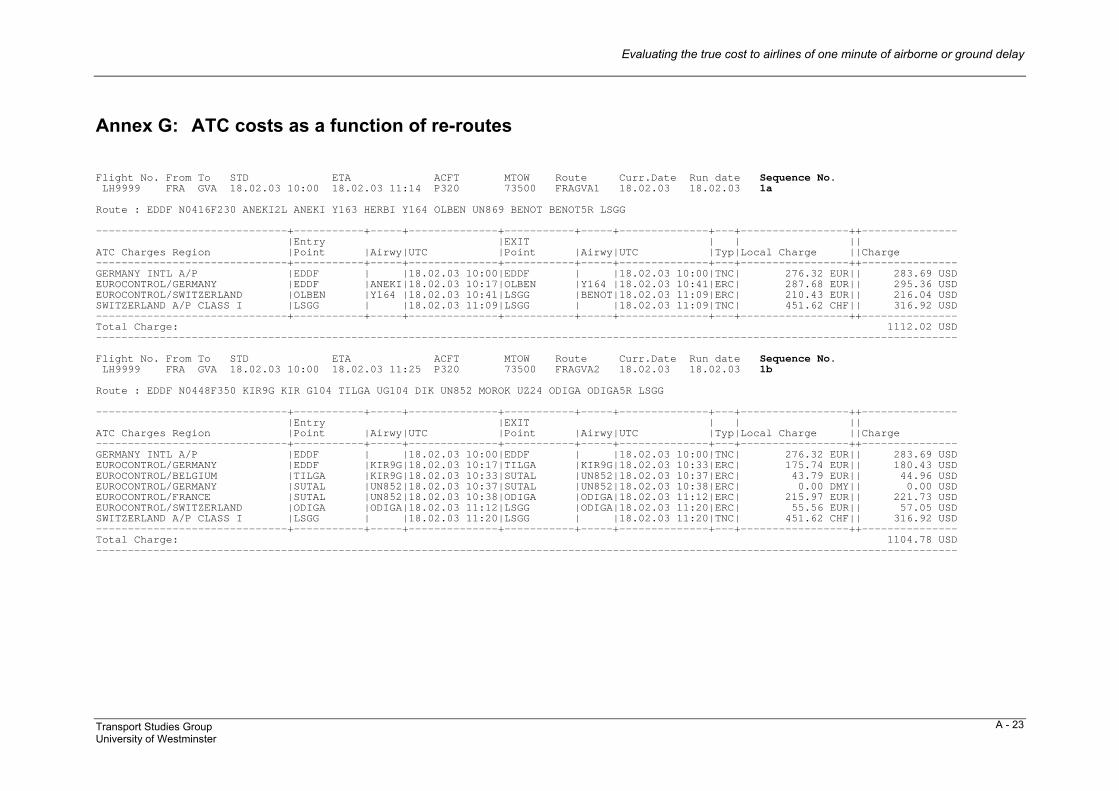
Evaluating the true cost to airlines of one minute of airborne or ground delay
Transport Studies Group University of Westminster
A - 23
Annex G: ATC costs as a function of re-routes Flight No. From To STD ETA ACFT MTOW Route Curr.Date Run date Sequence No. LH9999 FRA GVA 18.02.03 10:00 18.02.03 11:14 P320 73500 FRAGVA1 18.02.03 18.02.03 1a Route : EDDF N0416F230 ANEKI2L ANEKI Y163 HERBI Y164 OLBEN UN869 BENOT BENOT5R LSGG ------------------------------+-----------+-----+--------------+-----------+-----+--------------+---+-----------------++--------------- |Entry |EXIT | | || ATC Charges Region |Point |Airwy|UTC |Point |Airwy|UTC |Typ|Local Charge ||Charge ------------------------------+-----------+-----+--------------+-----------+-----+--------------+---+-----------------++--------------- GERMANY INTL A/P |EDDF | |18.02.03 10:00|EDDF | |18.02.03 10:00|TNC| 276.32 EUR|| 283.69 USD EUROCONTROL/GERMANY |EDDF |ANEKI|18.02.03 10:17|OLBEN |Y164 |18.02.03 10:41|ERC| 287.68 EUR|| 295.36 USD EUROCONTROL/SWITZERLAND |OLBEN |Y164 |18.02.03 10:41|LSGG |BENOT|18.02.03 11:09|ERC| 210.43 EUR|| 216.04 USD SWITZERLAND A/P CLASS I |LSGG | |18.02.03 11:09|LSGG | |18.02.03 11:09|TNC| 451.62 CHF|| 316.92 USD ------------------------------+-----------+-----+--------------+-----------+-----+--------------+---+-----------------++--------------- Total Charge: 1112.02 USD --------------------------------------------------------------------------------------------------------------------------------------- Flight No. From To STD ETA ACFT MTOW Route Curr.Date Run date Sequence No. LH9999 FRA GVA 18.02.03 10:00 18.02.03 11:25 P320 73500 FRAGVA2 18.02.03 18.02.03 1b Route : EDDF N0448F350 KIR9G KIR G104 TILGA UG104 DIK UN852 MOROK UZ24 ODIGA ODIGA5R LSGG ------------------------------+-----------+-----+--------------+-----------+-----+--------------+---+-----------------++--------------- |Entry |EXIT | | || ATC Charges Region |Point |Airwy|UTC |Point |Airwy|UTC |Typ|Local Charge ||Charge ------------------------------+-----------+-----+--------------+-----------+-----+--------------+---+-----------------++--------------- GERMANY INTL A/P |EDDF | |18.02.03 10:00|EDDF | |18.02.03 10:00|TNC| 276.32 EUR|| 283.69 USD EUROCONTROL/GERMANY |EDDF |KIR9G|18.02.03 10:17|TILGA |KIR9G|18.02.03 10:33|ERC| 175.74 EUR|| 180.43 USD EUROCONTROL/BELGIUM |TILGA |KIR9G|18.02.03 10:33|SUTAL |UN852|18.02.03 10:37|ERC| 43.79 EUR|| 44.96 USD EUROCONTROL/GERMANY |SUTAL |UN852|18.02.03 10:37|SUTAL |UN852|18.02.03 10:38|ERC| 0.00 DMY|| 0.00 USD EUROCONTROL/FRANCE |SUTAL |UN852|18.02.03 10:38|ODIGA |ODIGA|18.02.03 11:12|ERC| 215.97 EUR|| 221.73 USD EUROCONTROL/SWITZERLAND |ODIGA |ODIGA|18.02.03 11:12|LSGG |ODIGA|18.02.03 11:20|ERC| 55.56 EUR|| 57.05 USD SWITZERLAND A/P CLASS I |LSGG | |18.02.03 11:20|LSGG | |18.02.03 11:20|TNC| 451.62 CHF|| 316.92 USD ------------------------------+-----------+-----+--------------+-----------+-----+--------------+---+-----------------++--------------- Total Charge: 1104.78 USD ---------------------------------------------------------------------------------------------------------------------------------------
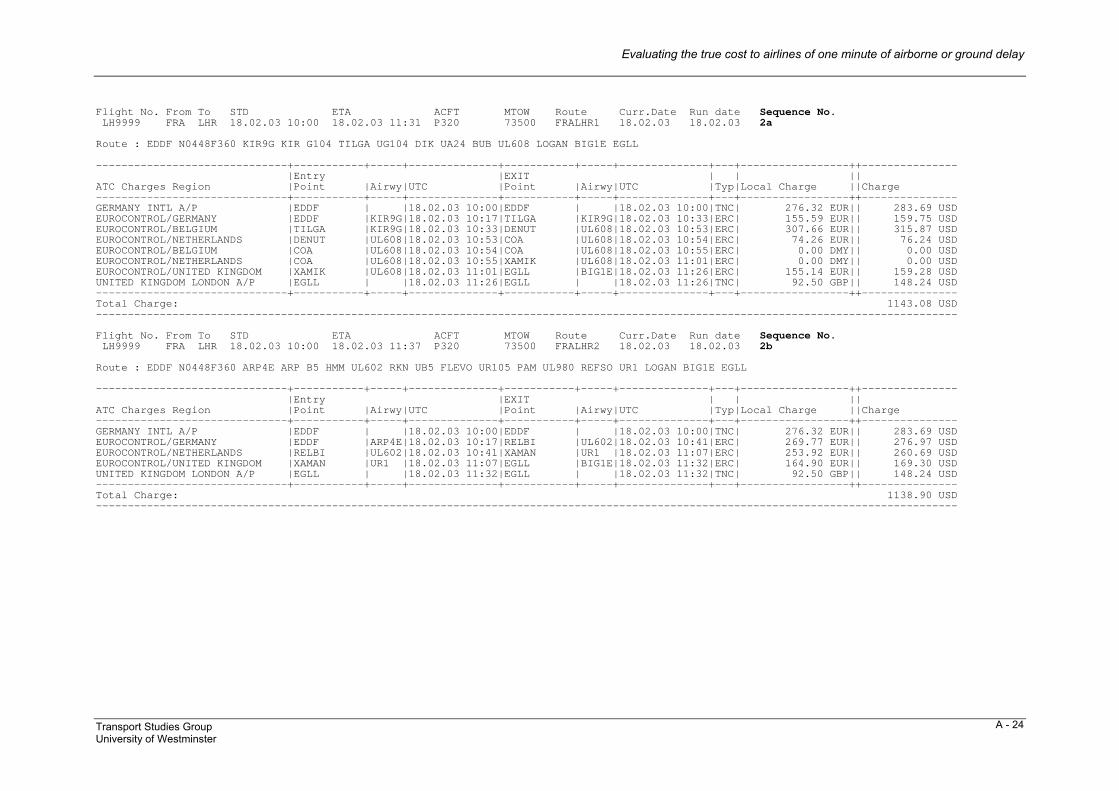
Evaluating the true cost to airlines of one minute of airborne or ground delay
Transport Studies Group University of Westminster
A - 24
Flight No. From To STD ETA ACFT MTOW Route Curr.Date Run date Sequence No. LH9999 FRA LHR 18.02.03 10:00 18.02.03 11:31 P320 73500 FRALHR1 18.02.03 18.02.03 2a Route : EDDF N0448F360 KIR9G KIR G104 TILGA UG104 DIK UA24 BUB UL608 LOGAN BIG1E EGLL ------------------------------+-----------+-----+--------------+-----------+-----+--------------+---+-----------------++--------------- |Entry |EXIT | | || ATC Charges Region |Point |Airwy|UTC |Point |Airwy|UTC |Typ|Local Charge ||Charge ------------------------------+-----------+-----+--------------+-----------+-----+--------------+---+-----------------++--------------- GERMANY INTL A/P |EDDF | |18.02.03 10:00|EDDF | |18.02.03 10:00|TNC| 276.32 EUR|| 283.69 USD EUROCONTROL/GERMANY |EDDF |KIR9G|18.02.03 10:17|TILGA |KIR9G|18.02.03 10:33|ERC| 155.59 EUR|| 159.75 USD EUROCONTROL/BELGIUM |TILGA |KIR9G|18.02.03 10:33|DENUT |UL608|18.02.03 10:53|ERC| 307.66 EUR|| 315.87 USD EUROCONTROL/NETHERLANDS |DENUT |UL608|18.02.03 10:53|COA |UL608|18.02.03 10:54|ERC| 74.26 EUR|| 76.24 USD EUROCONTROL/BELGIUM |COA |UL608|18.02.03 10:54|COA |UL608|18.02.03 10:55|ERC| 0.00 DMY|| 0.00 USD EUROCONTROL/NETHERLANDS |COA |UL608|18.02.03 10:55|XAMIK |UL608|18.02.03 11:01|ERC| 0.00 DMY|| 0.00 USD EUROCONTROL/UNITED KINGDOM |XAMIK |UL608|18.02.03 11:01|EGLL |BIG1E|18.02.03 11:26|ERC| 155.14 EUR|| 159.28 USD UNITED KINGDOM LONDON A/P |EGLL | |18.02.03 11:26|EGLL | |18.02.03 11:26|TNC| 92.50 GBP|| 148.24 USD ------------------------------+-----------+-----+--------------+-----------+-----+--------------+---+-----------------++--------------- Total Charge: 1143.08 USD --------------------------------------------------------------------------------------------------------------------------------------- Flight No. From To STD ETA ACFT MTOW Route Curr.Date Run date Sequence No. LH9999 FRA LHR 18.02.03 10:00 18.02.03 11:37 P320 73500 FRALHR2 18.02.03 18.02.03 2b Route : EDDF N0448F360 ARP4E ARP B5 HMM UL602 RKN UB5 FLEVO UR105 PAM UL980 REFSO UR1 LOGAN BIG1E EGLL ------------------------------+-----------+-----+--------------+-----------+-----+--------------+---+-----------------++--------------- |Entry |EXIT | | || ATC Charges Region |Point |Airwy|UTC |Point |Airwy|UTC |Typ|Local Charge ||Charge ------------------------------+-----------+-----+--------------+-----------+-----+--------------+---+-----------------++--------------- GERMANY INTL A/P |EDDF | |18.02.03 10:00|EDDF | |18.02.03 10:00|TNC| 276.32 EUR|| 283.69 USD EUROCONTROL/GERMANY |EDDF |ARP4E|18.02.03 10:17|RELBI |UL602|18.02.03 10:41|ERC| 269.77 EUR|| 276.97 USD EUROCONTROL/NETHERLANDS |RELBI |UL602|18.02.03 10:41|XAMAN |UR1 |18.02.03 11:07|ERC| 253.92 EUR|| 260.69 USD EUROCONTROL/UNITED KINGDOM |XAMAN |UR1 |18.02.03 11:07|EGLL |BIG1E|18.02.03 11:32|ERC| 164.90 EUR|| 169.30 USD UNITED KINGDOM LONDON A/P |EGLL | |18.02.03 11:32|EGLL | |18.02.03 11:32|TNC| 92.50 GBP|| 148.24 USD ------------------------------+-----------+-----+--------------+-----------+-----+--------------+---+-----------------++--------------- Total Charge: 1138.90 USD ---------------------------------------------------------------------------------------------------------------------------------------
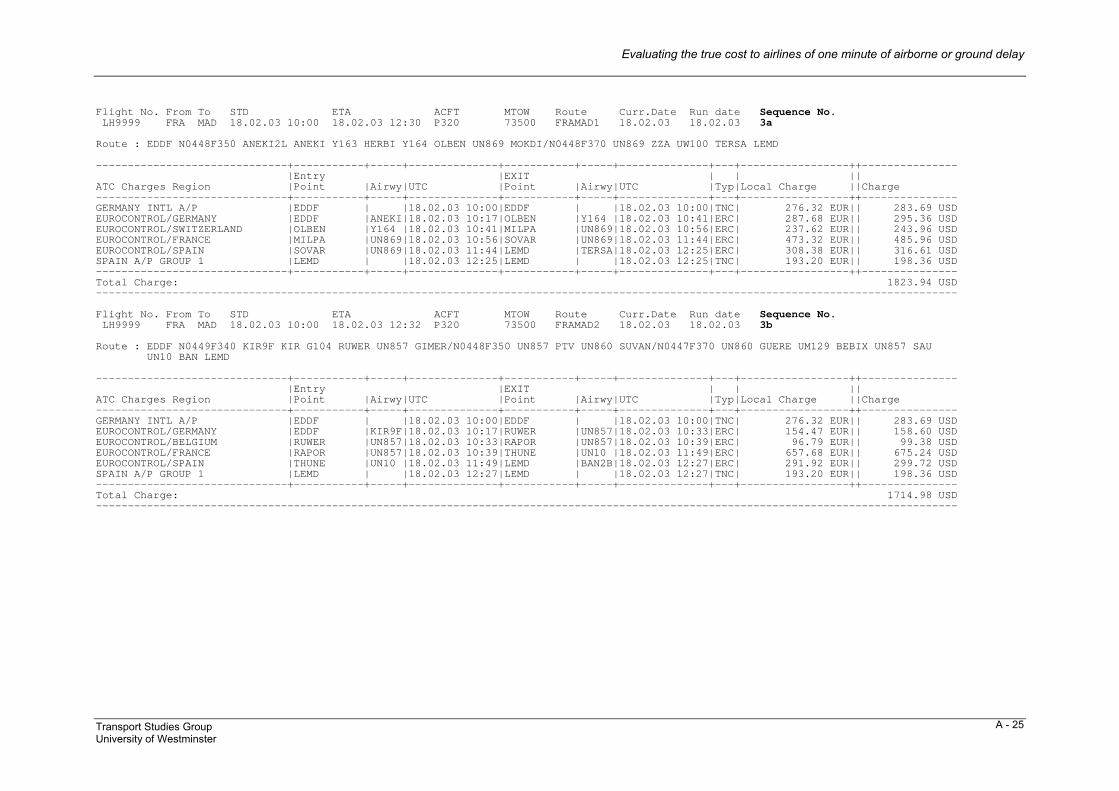
Evaluating the true cost to airlines of one minute of airborne or ground delay
Transport Studies Group University of Westminster
A - 25
Flight No. From To STD ETA ACFT MTOW Route Curr.Date Run date Sequence No. LH9999 FRA MAD 18.02.03 10:00 18.02.03 12:30 P320 73500 FRAMAD1 18.02.03 18.02.03 3a Route : EDDF N0448F350 ANEKI2L ANEKI Y163 HERBI Y164 OLBEN UN869 MOKDI/N0448F370 UN869 ZZA UW100 TERSA LEMD ------------------------------+-----------+-----+--------------+-----------+-----+--------------+---+-----------------++--------------- |Entry |EXIT | | || ATC Charges Region |Point |Airwy|UTC |Point |Airwy|UTC |Typ|Local Charge ||Charge ------------------------------+-----------+-----+--------------+-----------+-----+--------------+---+-----------------++--------------- GERMANY INTL A/P |EDDF | |18.02.03 10:00|EDDF | |18.02.03 10:00|TNC| 276.32 EUR|| 283.69 USD EUROCONTROL/GERMANY |EDDF |ANEKI|18.02.03 10:17|OLBEN |Y164 |18.02.03 10:41|ERC| 287.68 EUR|| 295.36 USD EUROCONTROL/SWITZERLAND |OLBEN |Y164 |18.02.03 10:41|MILPA |UN869|18.02.03 10:56|ERC| 237.62 EUR|| 243.96 USD EUROCONTROL/FRANCE |MILPA |UN869|18.02.03 10:56|SOVAR |UN869|18.02.03 11:44|ERC| 473.32 EUR|| 485.96 USD EUROCONTROL/SPAIN |SOVAR |UN869|18.02.03 11:44|LEMD |TERSA|18.02.03 12:25|ERC| 308.38 EUR|| 316.61 USD SPAIN A/P GROUP 1 |LEMD | |18.02.03 12:25|LEMD | |18.02.03 12:25|TNC| 193.20 EUR|| 198.36 USD ------------------------------+-----------+-----+--------------+-----------+-----+--------------+---+-----------------++--------------- Total Charge: 1823.94 USD --------------------------------------------------------------------------------------------------------------------------------------- Flight No. From To STD ETA ACFT MTOW Route Curr.Date Run date Sequence No. LH9999 FRA MAD 18.02.03 10:00 18.02.03 12:32 P320 73500 FRAMAD2 18.02.03 18.02.03 3b Route : EDDF N0449F340 KIR9F KIR G104 RUWER UN857 GIMER/N0448F350 UN857 PTV UN860 SUVAN/N0447F370 UN860 GUERE UM129 BEBIX UN857 SAU UN10 BAN LEMD ------------------------------+-----------+-----+--------------+-----------+-----+--------------+---+-----------------++--------------- |Entry |EXIT | | || ATC Charges Region |Point |Airwy|UTC |Point |Airwy|UTC |Typ|Local Charge ||Charge ------------------------------+-----------+-----+--------------+-----------+-----+--------------+---+-----------------++--------------- GERMANY INTL A/P |EDDF | |18.02.03 10:00|EDDF | |18.02.03 10:00|TNC| 276.32 EUR|| 283.69 USD EUROCONTROL/GERMANY |EDDF |KIR9F|18.02.03 10:17|RUWER |UN857|18.02.03 10:33|ERC| 154.47 EUR|| 158.60 USD EUROCONTROL/BELGIUM |RUWER |UN857|18.02.03 10:33|RAPOR |UN857|18.02.03 10:39|ERC| 96.79 EUR|| 99.38 USD EUROCONTROL/FRANCE |RAPOR |UN857|18.02.03 10:39|THUNE |UN10 |18.02.03 11:49|ERC| 657.68 EUR|| 675.24 USD EUROCONTROL/SPAIN |THUNE |UN10 |18.02.03 11:49|LEMD |BAN2B|18.02.03 12:27|ERC| 291.92 EUR|| 299.72 USD SPAIN A/P GROUP 1 |LEMD | |18.02.03 12:27|LEMD | |18.02.03 12:27|TNC| 193.20 EUR|| 198.36 USD ------------------------------+-----------+-----+--------------+-----------+-----+--------------+---+-----------------++--------------- Total Charge: 1714.98 USD ---------------------------------------------------------------------------------------------------------------------------------------
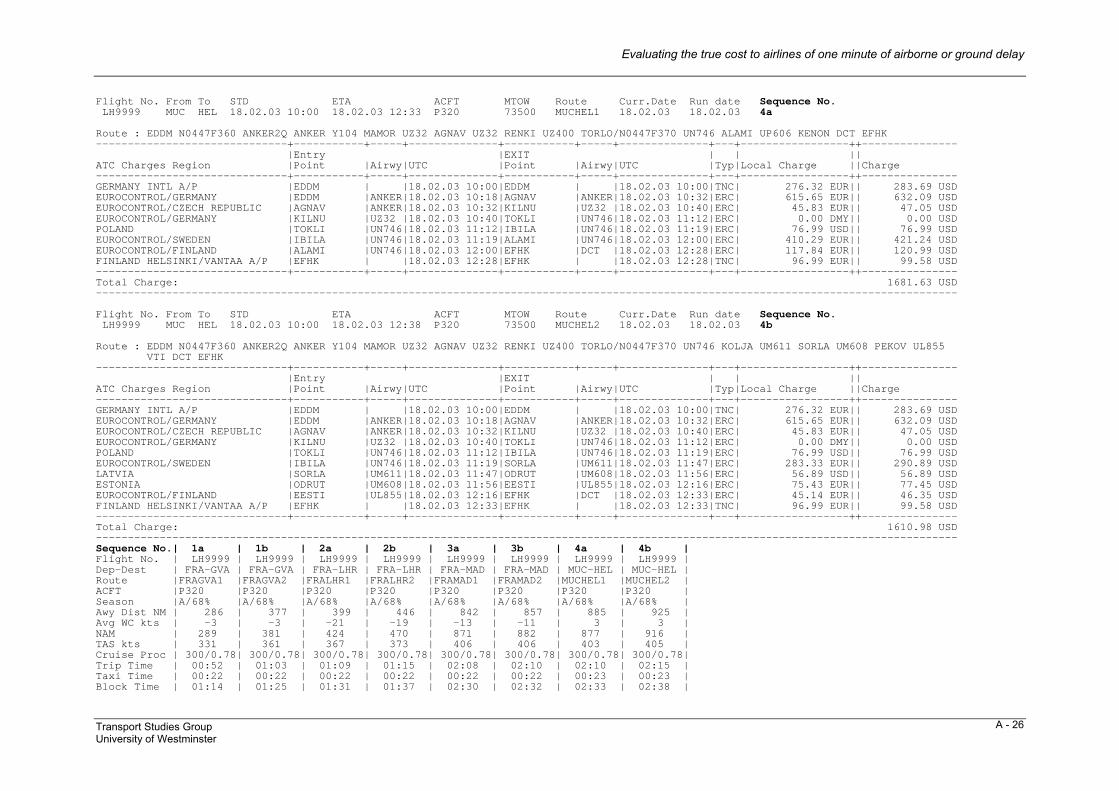
Evaluating the true cost to airlines of one minute of airborne or ground delay
Transport Studies Group University of Westminster
A - 26
Flight No. From To STD ETA ACFT MTOW Route Curr.Date Run date Sequence No. LH9999 MUC HEL 18.02.03 10:00 18.02.03 12:33 P320 73500 MUCHEL1 18.02.03 18.02.03 4a Route : EDDM N0447F360 ANKER2Q ANKER Y104 MAMOR UZ32 AGNAV UZ32 RENKI UZ400 TORLO/N0447F370 UN746 ALAMI UP606 KENON DCT EFHK ------------------------------+-----------+-----+--------------+-----------+-----+--------------+---+-----------------++--------------- |Entry |EXIT | | || ATC Charges Region |Point |Airwy|UTC |Point |Airwy|UTC |Typ|Local Charge ||Charge ------------------------------+-----------+-----+--------------+-----------+-----+--------------+---+-----------------++--------------- GERMANY INTL A/P |EDDM | |18.02.03 10:00|EDDM | |18.02.03 10:00|TNC| 276.32 EUR|| 283.69 USD EUROCONTROL/GERMANY |EDDM |ANKER|18.02.03 10:18|AGNAV |ANKER|18.02.03 10:32|ERC| 615.65 EUR|| 632.09 USD EUROCONTROL/CZECH REPUBLIC |AGNAV |ANKER|18.02.03 10:32|KILNU |UZ32 |18.02.03 10:40|ERC| 45.83 EUR|| 47.05 USD EUROCONTROL/GERMANY |KILNU |UZ32 |18.02.03 10:40|TOKLI |UN746|18.02.03 11:12|ERC| 0.00 DMY|| 0.00 USD POLAND |TOKLI |UN746|18.02.03 11:12|IBILA |UN746|18.02.03 11:19|ERC| 76.99 USD|| 76.99 USD EUROCONTROL/SWEDEN |IBILA |UN746|18.02.03 11:19|ALAMI |UN746|18.02.03 12:00|ERC| 410.29 EUR|| 421.24 USD EUROCONTROL/FINLAND |ALAMI |UN746|18.02.03 12:00|EFHK |DCT |18.02.03 12:28|ERC| 117.84 EUR|| 120.99 USD FINLAND HELSINKI/VANTAA A/P |EFHK | |18.02.03 12:28|EFHK | |18.02.03 12:28|TNC| 96.99 EUR|| 99.58 USD ------------------------------+-----------+-----+--------------+-----------+-----+--------------+---+-----------------++--------------- Total Charge: 1681.63 USD --------------------------------------------------------------------------------------------------------------------------------------- Flight No. From To STD ETA ACFT MTOW Route Curr.Date Run date Sequence No. LH9999 MUC HEL 18.02.03 10:00 18.02.03 12:38 P320 73500 MUCHEL2 18.02.03 18.02.03 4b Route : EDDM N0447F360 ANKER2Q ANKER Y104 MAMOR UZ32 AGNAV UZ32 RENKI UZ400 TORLO/N0447F370 UN746 KOLJA UM611 SORLA UM608 PEKOV UL855 VTI DCT EFHK ------------------------------+-----------+-----+--------------+-----------+-----+--------------+---+-----------------++--------------- |Entry |EXIT | | || ATC Charges Region |Point |Airwy|UTC |Point |Airwy|UTC |Typ|Local Charge ||Charge ------------------------------+-----------+-----+--------------+-----------+-----+--------------+---+-----------------++--------------- GERMANY INTL A/P |EDDM | |18.02.03 10:00|EDDM | |18.02.03 10:00|TNC| 276.32 EUR|| 283.69 USD EUROCONTROL/GERMANY |EDDM |ANKER|18.02.03 10:18|AGNAV |ANKER|18.02.03 10:32|ERC| 615.65 EUR|| 632.09 USD EUROCONTROL/CZECH REPUBLIC |AGNAV |ANKER|18.02.03 10:32|KILNU |UZ32 |18.02.03 10:40|ERC| 45.83 EUR|| 47.05 USD EUROCONTROL/GERMANY |KILNU |UZ32 |18.02.03 10:40|TOKLI |UN746|18.02.03 11:12|ERC| 0.00 DMY|| 0.00 USD POLAND |TOKLI |UN746|18.02.03 11:12|IBILA |UN746|18.02.03 11:19|ERC| 76.99 USD|| 76.99 USD EUROCONTROL/SWEDEN |IBILA |UN746|18.02.03 11:19|SORLA |UM611|18.02.03 11:47|ERC| 283.33 EUR|| 290.89 USD LATVIA |SORLA |UM611|18.02.03 11:47|ODRUT |UM608|18.02.03 11:56|ERC| 56.89 USD|| 56.89 USD ESTONIA |ODRUT |UM608|18.02.03 11:56|EESTI |UL855|18.02.03 12:16|ERC| 75.43 EUR|| 77.45 USD EUROCONTROL/FINLAND |EESTI |UL855|18.02.03 12:16|EFHK |DCT |18.02.03 12:33|ERC| 45.14 EUR|| 46.35 USD FINLAND HELSINKI/VANTAA A/P |EFHK | |18.02.03 12:33|EFHK | |18.02.03 12:33|TNC| 96.99 EUR|| 99.58 USD ------------------------------+-----------+-----+--------------+-----------+-----+--------------+---+-----------------++--------------- Total Charge: 1610.98 USD --------------------------------------------------------------------------------------------------------------------------------------- Sequence No.| 1a | 1b | 2a | 2b | 3a | 3b | 4a | 4b | Flight No. | LH9999 | LH9999 | LH9999 | LH9999 | LH9999 | LH9999 | LH9999 | LH9999 | Dep-Dest | FRA-GVA | FRA-GVA | FRA-LHR | FRA-LHR | FRA-MAD | FRA-MAD | MUC-HEL | MUC-HEL | Route |FRAGVA1 |FRAGVA2 |FRALHR1 |FRALHR2 |FRAMAD1 |FRAMAD2 |MUCHEL1 |MUCHEL2 | ACFT |P320 |P320 |P320 |P320 |P320 |P320 |P320 |P320 | Season |A/68% |A/68% |A/68% |A/68% |A/68% |A/68% |A/68% |A/68% | Awy Dist NM | 286 | 377 | 399 | 446 | 842 | 857 | 885 | 925 | Avg WC kts | -3 | -3 | -21 | -19 | -13 | -11 | 3 | 3 | NAM | 289 | 381 | 424 | 470 | 871 | 882 | 877 | 916 | TAS kts | 331 | 361 | 367 | 373 | 406 | 406 | 403 | 405 | Cruise Proc | 300/0.78| 300/0.78| 300/0.78| 300/0.78| 300/0.78| 300/0.78| 300/0.78| 300/0.78| Trip Time | 00:52 | 01:03 | 01:09 | 01:15 | 02:08 | 02:10 | 02:10 | 02:15 | Taxi Time | 00:22 | 00:22 | 00:22 | 00:22 | 00:22 | 00:22 | 00:23 | 00:23 | Block Time | 01:14 | 01:25 | 01:31 | 01:37 | 02:30 | 02:32 | 02:33 | 02:38 |
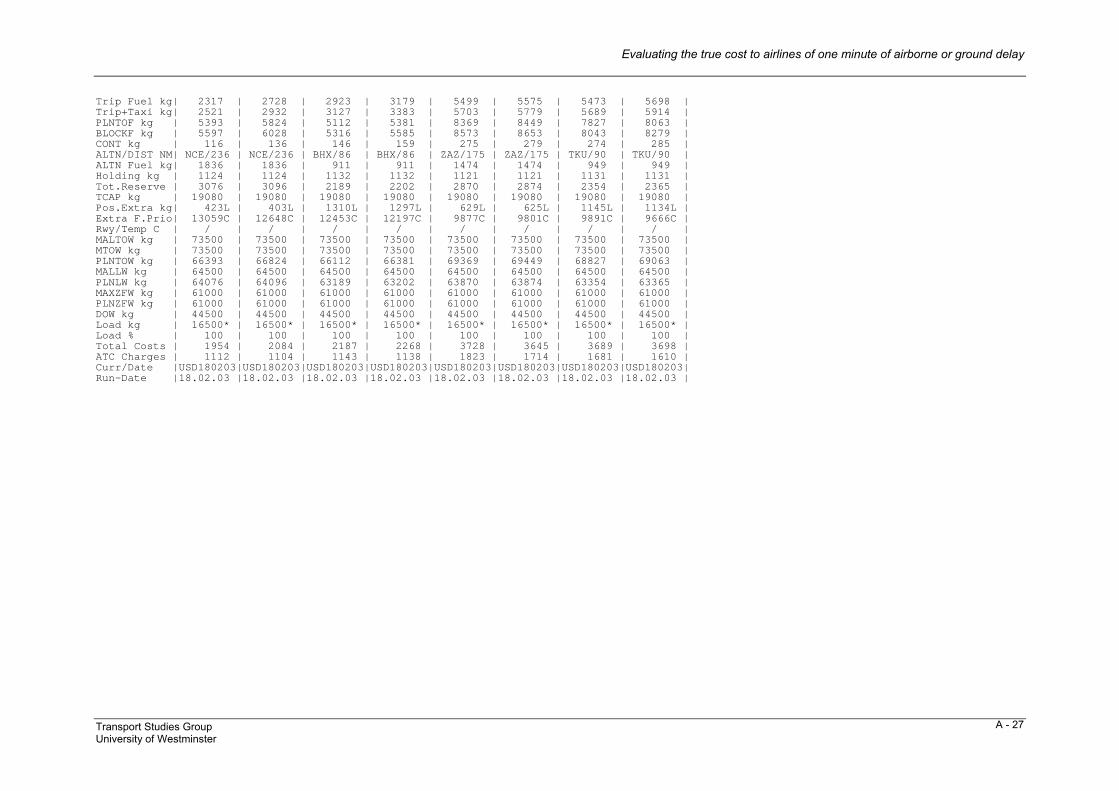
Evaluating the true cost to airlines of one minute of airborne or ground delay
Transport Studies Group University of Westminster
A - 27
Trip Fuel kg| 2317 | 2728 | 2923 | 3179 | 5499 | 5575 | 5473 | 5698 | Trip+Taxi kg| 2521 | 2932 | 3127 | 3383 | 5703 | 5779 | 5689 | 5914 | PLNTOF kg | 5393 | 5824 | 5112 | 5381 | 8369 | 8449 | 7827 | 8063 | BLOCKF kg | 5597 | 6028 | 5316 | 5585 | 8573 | 8653 | 8043 | 8279 | CONT kg | 116 | 136 | 146 | 159 | 275 | 279 | 274 | 285 | ALTN/DIST NM| NCE/236 | NCE/236 | BHX/86 | BHX/86 | ZAZ/175 | ZAZ/175 | TKU/90 | TKU/90 | ALTN Fuel kg| 1836 | 1836 | 911 | 911 | 1474 | 1474 | 949 | 949 | Holding kg | 1124 | 1124 | 1132 | 1132 | 1121 | 1121 | 1131 | 1131 | Tot.Reserve | 3076 | 3096 | 2189 | 2202 | 2870 | 2874 | 2354 | 2365 | TCAP kg | 19080 | 19080 | 19080 | 19080 | 19080 | 19080 | 19080 | 19080 | Pos.Extra kg| 423L | 403L | 1310L | 1297L | 629L | 625L | 1145L | 1134L | Extra F.Prio| 13059C | 12648C | 12453C | 12197C | 9877C | 9801C | 9891C | 9666C | Rwy/Temp C | / | / | / | / | / | / | / | / | MALTOW kg | 73500 | 73500 | 73500 | 73500 | 73500 | 73500 | 73500 | 73500 | MTOW kg | 73500 | 73500 | 73500 | 73500 | 73500 | 73500 | 73500 | 73500 | PLNTOW kg | 66393 | 66824 | 66112 | 66381 | 69369 | 69449 | 68827 | 69063 | MALLW kg | 64500 | 64500 | 64500 | 64500 | 64500 | 64500 | 64500 | 64500 | PLNLW kg | 64076 | 64096 | 63189 | 63202 | 63870 | 63874 | 63354 | 63365 | MAXZFW kg | 61000 | 61000 | 61000 | 61000 | 61000 | 61000 | 61000 | 61000 | PLNZFW kg | 61000 | 61000 | 61000 | 61000 | 61000 | 61000 | 61000 | 61000 | DOW kg | 44500 | 44500 | 44500 | 44500 | 44500 | 44500 | 44500 | 44500 | Load kg | 16500* | 16500* | 16500* | 16500* | 16500* | 16500* | 16500* | 16500* | Load % | 100 | 100 | 100 | 100 | 100 | 100 | 100 | 100 | Total Costs | 1954 | 2084 | 2187 | 2268 | 3728 | 3645 | 3689 | 3698 | ATC Charges | 1112 | 1104 | 1143 | 1138 | 1823 | 1714 | 1681 | 1610 | Curr/Date |USD180203|USD180203|USD180203|USD180203|USD180203|USD180203|USD180203|USD180203| Run-Date |18.02.03 |18.02.03 |18.02.03 |18.02.03 |18.02.03 |18.02.03 |18.02.03 |18.02.03 |
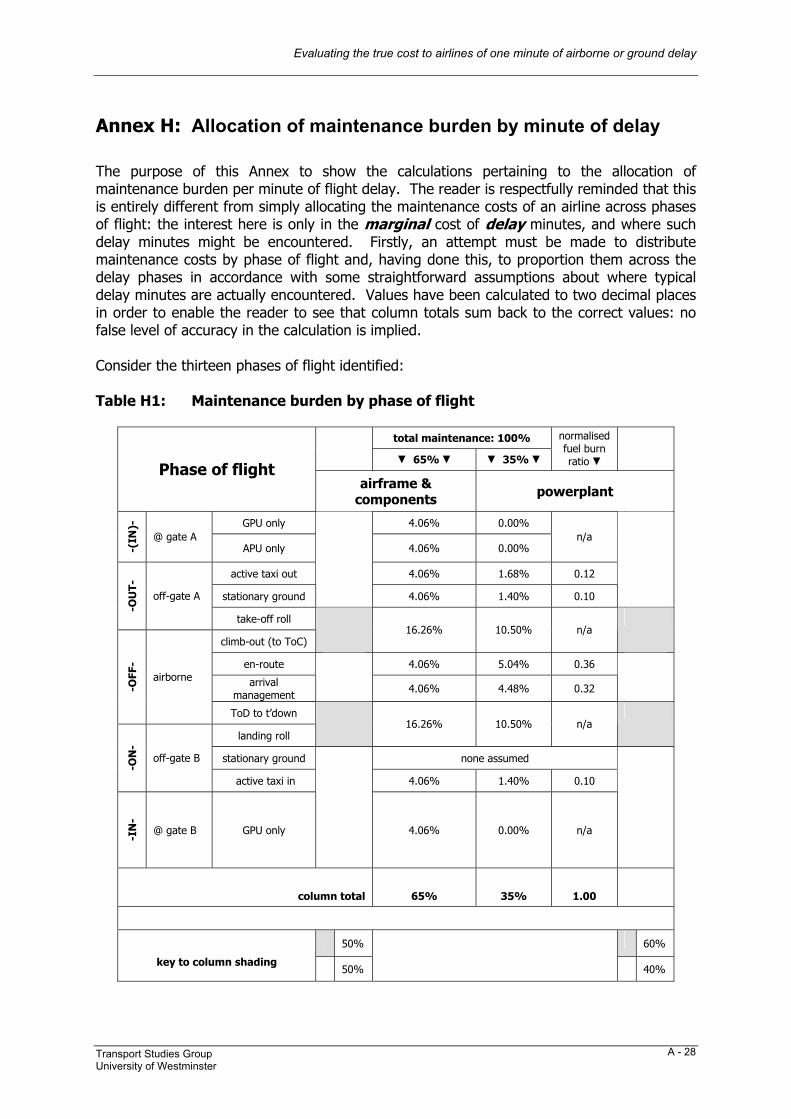
Evaluating the true cost to airlines of one minute of airborne or ground delay
Transport Studies Group University of Westminster
A - 28
Annex H: Allocation of maintenance burden by minute of delay The purpose of this Annex to show the calculations pertaining to the allocation of maintenance burden per minute of flight delay. The reader is respectfully reminded that this is entirely different from simply allocating the maintenance costs of an airline across phases of flight: the interest here is only in the marginal cost of delay minutes, and where such delay minutes might be encountered. Firstly, an attempt must be made to distribute maintenance costs by phase of flight and, having done this, to proportion them across the delay phases in accordance with some straightforward assumptions about where typical delay minutes are actually encountered. Values have been calculated to two decimal places in order to enable the reader to see that column totals sum back to the correct values: no false level of accuracy in the calculation is implied. Consider the thirteen phases of flight identified: Table H1: Maintenance burden by phase of flight
total maintenance: 100% ▼ 65% ▼ ▼ 35% ▼
normalised fuel burn ratio ▼
Phase of flight airframe &
components powerplant
GPU only 4.06% 0.00%
-(IN
)-
@ gate A APU only 4.06% 0.00%
n/a
active taxi out 4.06% 1.68% 0.12
stationary ground
4.06% 1.40% 0.10
-OU
T-
off-gate A
take-off roll
climb-out (to ToC)
16.26% 10.50% n/a
en-route 4.06% 5.04% 0.36
arrival management
4.06% 4.48% 0.32
-OFF
-
airborne
ToD to t’down
landing roll
16.26% 10.50% n/a
stationary ground none assumed
-ON
-
off-gate B
active taxi in 4.06% 1.40% 0.10
-IN
-
@ gate B GPU only
4.06% 0.00% n/a
column total 65% 35% 1.00
50% 60%
key to column shading 50%
40%
Evaluating the true cost to airlines of one minute of airborne or ground delay
Transport Studies Group University of Westminster
A - 29
Table H1 works from the edges inwards. Airbus has indicated that the typical maintenance burden for short-haul operations can be allocated 65% to airframe plus components, 35% to the powerplants. Considering the high intensity phases of flight operation (from take-off roll to Top of Climb, and from Top of Descent to landing roll), these combined phases have been allocated 50% of the total airframe and components’ maintenance costs. Hence, of the 100% of the total burden, these high intensity phases (combined into two blocks in the table) share 65% x 50% = 32.50% of the total burden, i.e. 16.25% to each block (the extra 0.01% allocated is to make the total sum back to 65%). The remaining airframe and component burdens are allocated equally between the remaining eight phases: (65% x 50%) / 8 = 4.06% each (per unit time) During both the taxi-out and taxi-in phases, the term ‘active taxi’ has been used to designate that the aircraft is actually moving, and ‘stationary ground’ to include pauses in taxi (e.g. at apron junctions and in take-off sequencing queues) plus any remote holding, combined. No ‘stationary ground’ activity has been assumed during the taxi-in phase, for the sake of simplicity of the model. Consider the distribution of the 35% of the engine maintenance burden. As per the shading on the extreme right-hand side of Table H1, it has been assumed that 60% of this cost should be allocated to the high intensity phases, where engine wear is at its peak - thus assigning (35% x 60%) / 2 = 10.50% to each of these phase blocks. This leaves 35% x 40% = 14% of the total maintenance burden to assign across the remaining eight phases. Three of these are “GPU only” or “APU only” phases at the gate, and thus accrue no significant engine wear. For the remaining five phases, the 14% has been distributed according to normalised fuel burn ratios taken from the averages of all Lido-derived fuel-burn data in Table 2-7. These normalised fuel burn ratios are in proportion to the fuel burn per minute of each of the corresponding phases of flight (which are implicitly thus equated with engine workload), and have the required property of summing to 1.00. The variability of these ratios across the aircraft types was low, such that the same ratios have been applied to every aircraft for the purposes of allocating relative engine workload. Thus, for example, for “active taxi out” the allocation of engine maintenance burden is 14% x 0.12 = 1.68% (per unit time) for all aircraft. The next task is to calculate an average minute of ground delay maintenance burden, and an average minute of airborne maintenance burden. It was thus necessary to ascribe typical times to the various phases of flight, in order to assign temporal weightings to the individual phase costs – see Table H2.

Evaluating the true cost to airlines of one minute of airborne or ground delay
Transport Studies Group University of Westminster
A - 30
Table H2: Time spent in phases of ground and airborne delay
Phase of flight allocated primary
proportion of time spent
allocated secondary
proportion of time spent
total
GPU only 90% 0.81
-(IN
)-
@ gate A APU only
90% 10% 0.09
active taxi out 40% 0.04
stationary ground 10%
60% 0.06
total 100% n/a 1.00
grou
nd
A
-OU
T-
off-gate A
take-off roll
climb-out (to ToC)
en-route 20% / 70% 0.20/0.70
arrival management 80% / 30% 0.80/
0.30
total 1.00
airb
orn
e
-OFF
-
airborne
ToD to t’down
landing roll
stationary ground none assumed
-ON
-
off-gate B
active taxi in 0%
-IN
-
@ gate B GPU only 0% n/a n/a
In the first data column, it is shown that 90% of ground-based delay time has been allocated to the gate, 10% to off-gate. APUs are usually started as late as possible before push-back, since running off the GPU (typically included in the ground handling agent’s turnaround fee) is cheaper. In the secondary proportion, only 10% of time at the gate is assigned with the APU running. Engines are assumed to be powered at the last possible minute, with no running at the gate. In terms of off-gate time (totalling 10% of ground delay time, under these assumptions) 60% of this time is allocated to the aircraft being stationary (e.g. at apron junctions and in take-off sequencing queues) and all remote holding, combined. The first four figures in the ‘total’ column show the assumed distribution of delay minutes across the ground phase. The airborne phase has been split (but only at one level of disaggregation) between delay incurred in the en-route phase, and delay incurred as a result of arrival management. Arrival management includes the rarer ‘traditional’ racetrack holding (e.g. commonplace at London Heathrow) and TMA holding, e.g. “RNAV arrival route” or “linear holding”. Airborne delay has been allocated as 80% arrival management for 15 minute delays, and as 30% arrival management for 65 minute delays, as described in the main text. Although Table H1 has an allocated cost to the maintenance burden for taxi-in and ‘inbound’ delay at the gate with GPU only, the former has been neglected (assigned a zero time value) and all gate delay has been assigned to the ‘ground A’ phase (with 90% of the total ground delay at the ‘A’ gate, it will be recalled), with a value of zero time at ground B (‘inbound’).
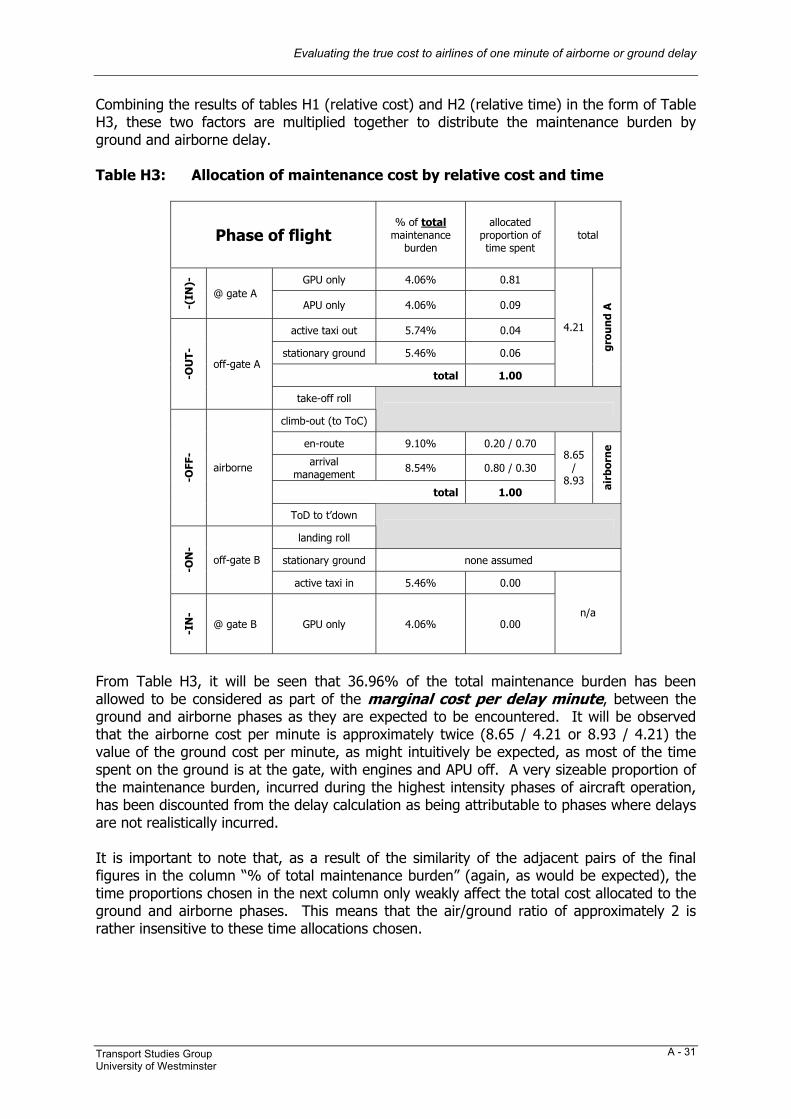
Evaluating the true cost to airlines of one minute of airborne or ground delay
Transport Studies Group University of Westminster
A - 31
Combining the results of tables H1 (relative cost) and H2 (relative time) in the form of Table H3, these two factors are multiplied together to distribute the maintenance burden by ground and airborne delay. Table H3: Allocation of maintenance cost by relative cost and time
Phase of flight % of total
maintenance burden
allocated proportion of time spent
total
GPU only 4.06% 0.81
-(IN
)-
@ gate A APU only 4.06% 0.09
active taxi out 5.74% 0.04
stationary ground 5.46% 0.06
total 1.00
4.21
grou
nd
A
-OU
T-
off-gate A
take-off roll
climb-out (to ToC)
en-route 9.10% 0.20 / 0.70
arrival management 8.54% 0.80 / 0.30
total 1.00
8.65/
8.93 airb
orn
e
-OFF
-
airborne
ToD to t’down
landing roll
stationary ground none assumed
-ON
-
off-gate B
active taxi in 5.46% 0.00
-IN
-
@ gate B GPU only 4.06% 0.00 n/a
From Table H3, it will be seen that 36.96% of the total maintenance burden has been allowed to be considered as part of the marginal cost per delay minute, between the ground and airborne phases as they are expected to be encountered. It will be observed that the airborne cost per minute is approximately twice (8.65 / 4.21 or 8.93 / 4.21) the value of the ground cost per minute, as might intuitively be expected, as most of the time spent on the ground is at the gate, with engines and APU off. A very sizeable proportion of the maintenance burden, incurred during the highest intensity phases of aircraft operation, has been discounted from the delay calculation as being attributable to phases where delays are not realistically incurred. It is important to note that, as a result of the similarity of the adjacent pairs of the final figures in the column “% of total maintenance burden” (again, as would be expected), the time proportions chosen in the next column only weakly affect the total cost allocated to the ground and airborne phases. This means that the air/ground ratio of approximately 2 is rather insensitive to these time allocations chosen.
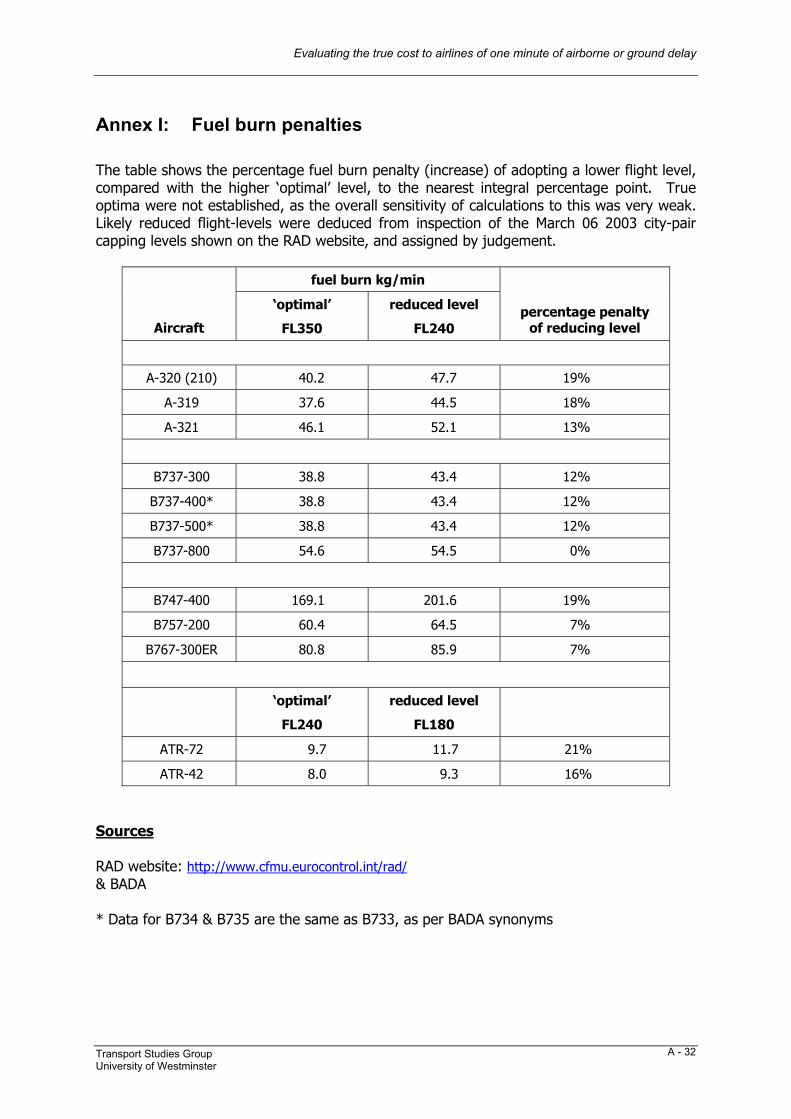
Evaluating the true cost to airlines of one minute of airborne or ground delay
Transport Studies Group University of Westminster
A - 32
Annex I: Fuel burn penalties The table shows the percentage fuel burn penalty (increase) of adopting a lower flight level, compared with the higher ‘optimal’ level, to the nearest integral percentage point. True optima were not established, as the overall sensitivity of calculations to this was very weak. Likely reduced flight-levels were deduced from inspection of the March 06 2003 city-pair capping levels shown on the RAD website, and assigned by judgement.
fuel burn kg/min
Aircraft
‘optimal’
FL350
reduced level
FL240 percentage penalty
of reducing level
A-320 (210) 40.2 47.7 19%
A-319 37.6 44.5 18%
A-321 46.1 52.1 13%
B737-300 38.8 43.4 12%
B737-400* 38.8 43.4 12%
B737-500* 38.8 43.4 12%
B737-800 54.6 54.5 0%
B747-400 169.1 201.6 19%
B757-200 60.4 64.5 7%
B767-300ER 80.8 85.9 7%
‘optimal’
FL240
reduced level
FL180
ATR-72 9.7 11.7 21%
ATR-42 8.0 9.3 16%
Sources RAD website: http://www.cfmu.eurocontrol.int/rad/ & BADA * Data for B734 & B735 are the same as B733, as per BADA synonyms
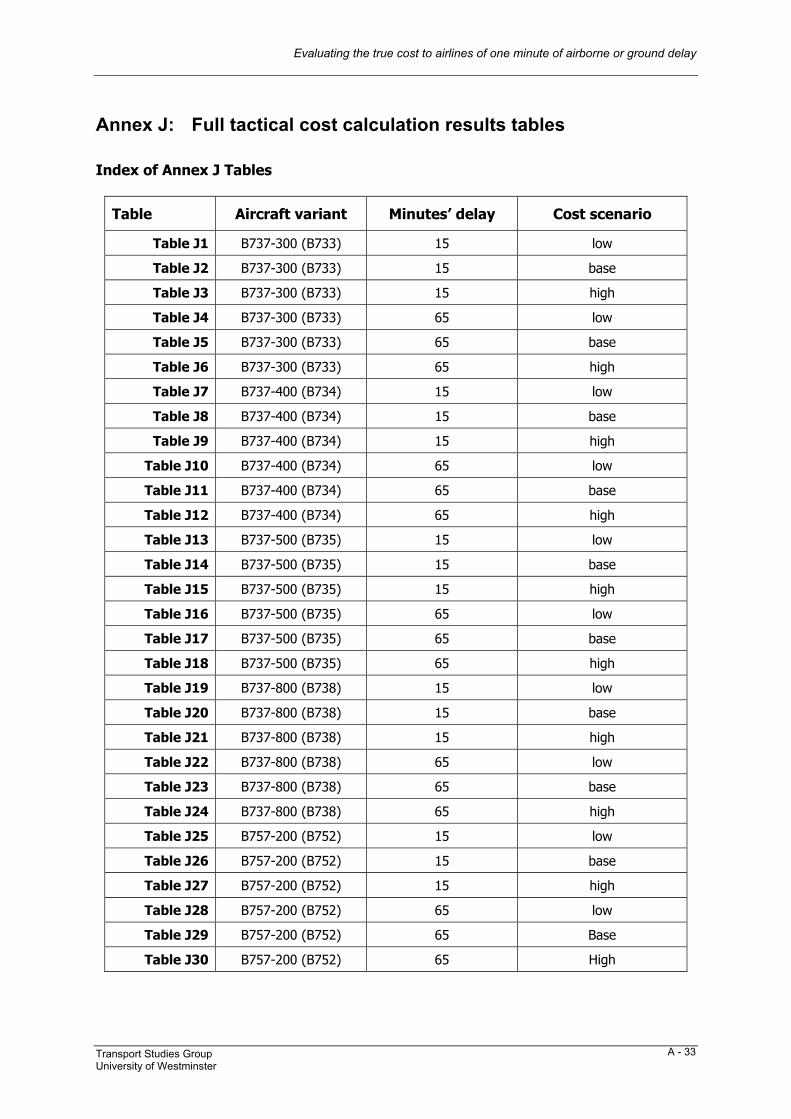
Evaluating the true cost to airlines of one minute of airborne or ground delay
Transport Studies Group University of Westminster
A - 33
Annex J: Full tactical cost calculation results tables Index of Annex J Tables
Table Aircraft variant Minutes’ delay Cost scenario
Table J1 B737-300 (B733) 15 low
Table J2 B737-300 (B733) 15 base
Table J3 B737-300 (B733) 15 high
Table J4 B737-300 (B733) 65 low
Table J5 B737-300 (B733) 65 base
Table J6 B737-300 (B733) 65 high
Table J7 B737-400 (B734) 15 low
Table J8 B737-400 (B734) 15 base
Table J9 B737-400 (B734) 15 high
Table J10 B737-400 (B734) 65 low
Table J11 B737-400 (B734) 65 base
Table J12 B737-400 (B734) 65 high
Table J13 B737-500 (B735) 15 low
Table J14 B737-500 (B735) 15 base
Table J15 B737-500 (B735) 15 high
Table J16 B737-500 (B735) 65 low
Table J17 B737-500 (B735) 65 base
Table J18 B737-500 (B735) 65 high
Table J19 B737-800 (B738) 15 low
Table J20 B737-800 (B738) 15 base
Table J21 B737-800 (B738) 15 high
Table J22 B737-800 (B738) 65 low
Table J23 B737-800 (B738) 65 base
Table J24 B737-800 (B738) 65 high
Table J25 B757-200 (B752) 15 low
Table J26 B757-200 (B752) 15 base
Table J27 B757-200 (B752) 15 high
Table J28 B757-200 (B752) 65 low
Table J29 B757-200 (B752) 65 Base
Table J30 B757-200 (B752) 65 High
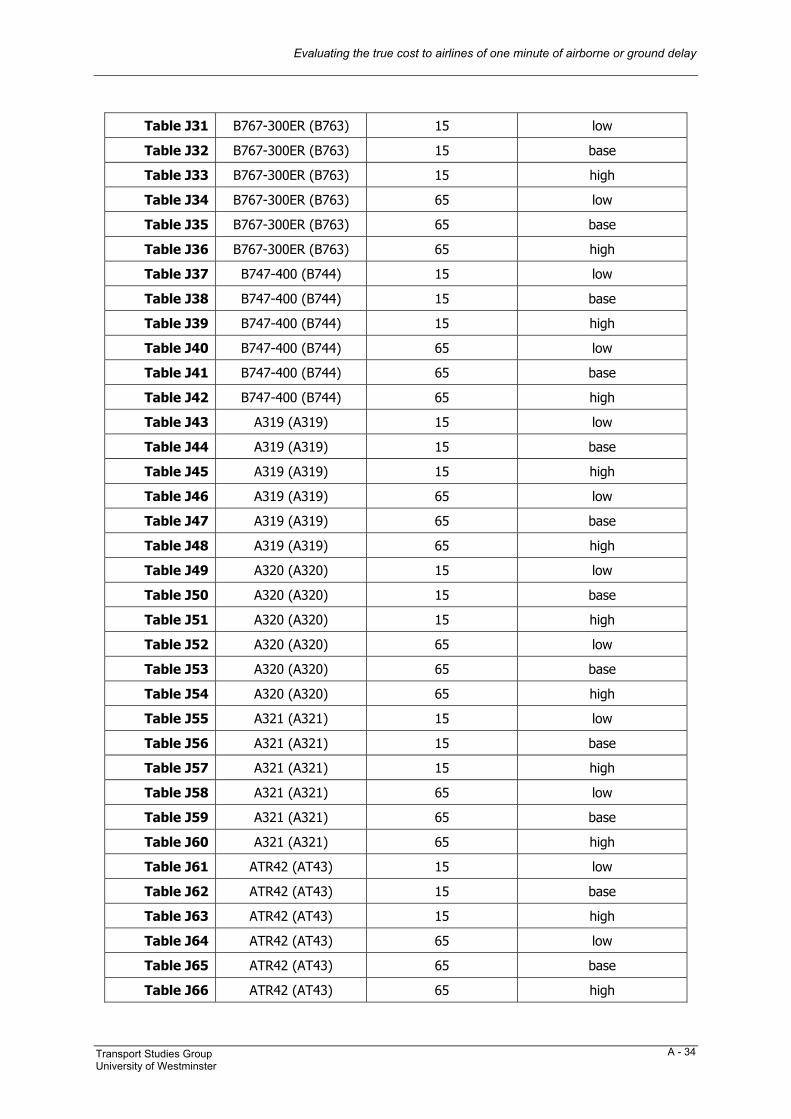
Evaluating the true cost to airlines of one minute of airborne or ground delay
Transport Studies Group University of Westminster
A - 34
Table J31 B767-300ER (B763) 15 low
Table J32 B767-300ER (B763) 15 base
Table J33 B767-300ER (B763) 15 high
Table J34 B767-300ER (B763) 65 low
Table J35 B767-300ER (B763) 65 base
Table J36 B767-300ER (B763) 65 high
Table J37 B747-400 (B744) 15 low
Table J38 B747-400 (B744) 15 base
Table J39 B747-400 (B744) 15 high
Table J40 B747-400 (B744) 65 low
Table J41 B747-400 (B744) 65 base
Table J42 B747-400 (B744) 65 high
Table J43 A319 (A319) 15 low
Table J44 A319 (A319) 15 base
Table J45 A319 (A319) 15 high
Table J46 A319 (A319) 65 low
Table J47 A319 (A319) 65 base
Table J48 A319 (A319) 65 high
Table J49 A320 (A320) 15 low
Table J50 A320 (A320) 15 base
Table J51 A320 (A320) 15 high
Table J52 A320 (A320) 65 low
Table J53 A320 (A320) 65 base
Table J54 A320 (A320) 65 high
Table J55 A321 (A321) 15 low
Table J56 A321 (A321) 15 base
Table J57 A321 (A321) 15 high
Table J58 A321 (A321) 65 low
Table J59 A321 (A321) 65 base
Table J60 A321 (A321) 65 high
Table J61 ATR42 (AT43) 15 low
Table J62 ATR42 (AT43) 15 base
Table J63 ATR42 (AT43) 15 high
Table J64 ATR42 (AT43) 65 low
Table J65 ATR42 (AT43) 65 base
Table J66 ATR42 (AT43) 65 high
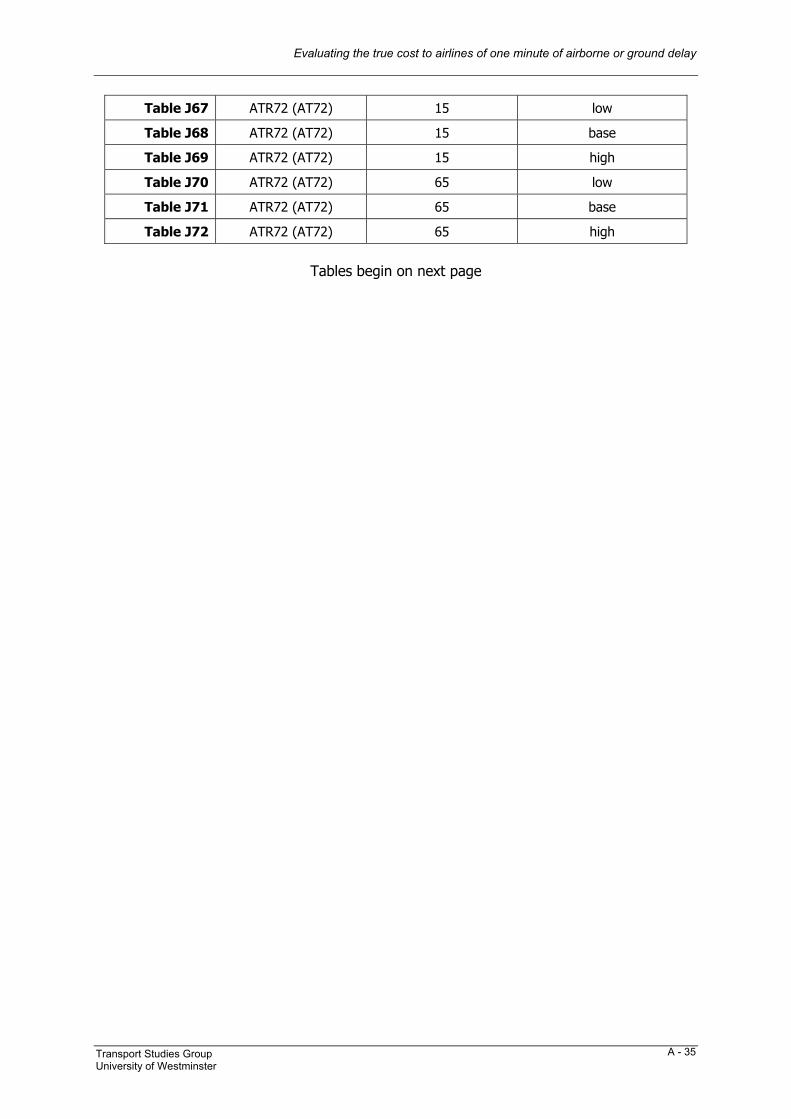
Evaluating the true cost to airlines of one minute of airborne or ground delay
Transport Studies Group University of Westminster
A - 35
Table J67 ATR72 (AT72) 15 low
Table J68 ATR72 (AT72) 15 base
Table J69 ATR72 (AT72) 15 high
Table J70 ATR72 (AT72) 65 low
Table J71 ATR72 (AT72) 65 base
Table J72 ATR72 (AT72) 65 high
Tables begin on next page
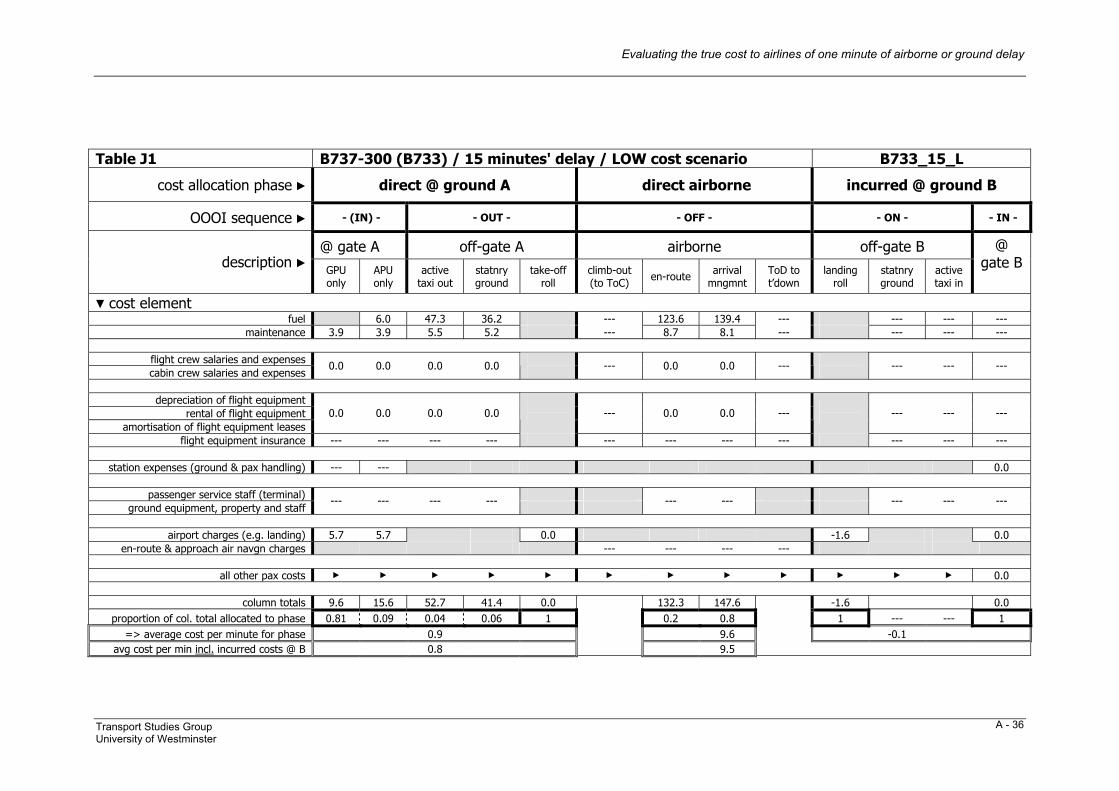
Evaluating the true cost to airlines of one minute of airborne or ground delay
Transport Studies Group University of Westminster
A - 36
Table J1 B737-300 (B733) / 15 minutes' delay / LOW cost scenario B733_15_L
cost allocation phase ► direct @ ground A direct airborne incurred @ ground B
OOOI sequence ► - (IN) - - OUT - - OFF - - ON - - IN -
@ gate A off-gate A airborne off-gate B description ►
GPU only
APU only
active taxi out
statnry ground
take-off roll
climb-out (to ToC) en-route arrival
mngmnt ToD to t’down
landing roll
statnry ground
active taxi in
@ gate B
▼ cost element fuel 6.0 47.3 36.2 --- 123.6 139.4 --- --- --- ---
maintenance 3.9 3.9 5.5 5.2 --- 8.7 8.1 --- --- --- ---
flight crew salaries and expenses cabin crew salaries and expenses
0.0 0.0 0.0 0.0 --- 0.0 0.0 ---
--- --- ---
depreciation of flight equipment
rental of flight equipment amortisation of flight equipment leases
0.0 0.0 0.0 0.0 --- 0.0 0.0 ---
--- --- ---
flight equipment insurance --- --- --- --- --- --- --- --- --- --- ---
station expenses (ground & pax handling) --- --- 0.0
passenger service staff (terminal) ground equipment, property and staff
--- --- --- ---
--- ---
--- --- ---
airport charges (e.g. landing) 5.7 5.7 0.0 -1.6 0.0
en-route & approach air navgn charges --- --- --- ---
all other pax costs ► ► ► ► ► ► ► ► ► ► ► ► 0.0
column totals 9.6 15.6 52.7 41.4 0.0 132.3 147.6 -1.6 0.0 proportion of col. total allocated to phase 0.81 0.09 0.04 0.06 1 0.2 0.8 1 --- --- 1
=> average cost per minute for phase 0.9 9.6 -0.1 avg cost per min incl. incurred costs @ B 0.8 9.5

Evaluating the true cost to airlines of one minute of airborne or ground delay
Transport Studies Group University of Westminster
A - 37
Table J2 B737-300 (B733) / 15 minutes' delay / BASE cost scenario B733_15_N
cost allocation phase ► direct @ ground A direct airborne incurred @ ground B
OOOI sequence ► - (IN) - - OUT - - OFF - - ON - - IN -
@ gate A off-gate A airborne off-gate B description ►
GPU only
APU only
active taxi out
statnry ground
take-off roll
climb-out (to ToC) en-route arrival
mngmnt ToD to t’down
landing roll
statnry ground
active taxi in
@ gate B
▼ cost element fuel 8.9 69.8 53.5 --- 188.8 211.7 --- --- --- ---
maintenance 7.5 7.5 10.7 10.1 --- 16.9 15.9 --- --- --- ---
flight crew salaries and expenses cabin crew salaries and expenses
0.0 0.0 0.0 0.0 --- 0.0 0.0 ---
--- --- ---
depreciation of flight equipment
rental of flight equipment amortisation of flight equipment leases
0.0 0.0 0.0 0.0 --- 0.0 0.0 ---
--- --- ---
flight equipment insurance --- --- --- --- --- --- --- --- --- --- ---
station expenses (ground & pax handling) --- --- 0.0
passenger service staff (terminal) ground equipment, property and staff
--- --- --- ---
--- ---
--- --- ---
airport charges (e.g. landing) 5.8 5.8 0.0 -0.9 0.0
en-route & approach air navgn charges --- --- --- ---
all other pax costs ► ► ► ► ► ► ► ► ► ► ► ► 0.0
column totals 13.3 22.2 80.4 63.6 0.0 205.7 227.5 -0.9 0.0 proportion of col. total allocated to phase 0.81 0.09 0.04 0.06 1 0.2 0.8 1 --- --- 1
=> average cost per minute for phase 1.3 14.9 -0.1 avg cost per min incl. incurred costs @ B 1.3 14.8

Evaluating the true cost to airlines of one minute of airborne or ground delay
Transport Studies Group University of Westminster
A - 38
Table J3 B737-300 (B733) / 15 minutes' delay / HIGH cost scenario B733_15_H
cost allocation phase ► direct @ ground A direct airborne incurred @ ground B
OOOI sequence ► - (IN) - - OUT - - OFF - - ON - - IN -
@ gate A off-gate A airborne off-gate B description ►
GPU only
APU only
active taxi out
statnry ground
take-off roll
climb-out (to ToC) en-route arrival
mngmnt ToD to t’down
landing roll
statnry ground
active taxi in
@ gate B
▼ cost element fuel 12.4 96.8 74.2 --- 303.8 302.5 --- --- --- ---
maintenance 9.5 9.5 13.5 12.8 --- 21.3 20.0 --- --- --- ---
flight crew salaries and expenses cabin crew salaries and expenses
106.0 106.0 106.0 106.0 --- 106.0 106.0 ---
--- --- ---
depreciation of flight equipment
rental of flight equipment amortisation of flight equipment leases
0.0 0.0 0.0 0.0 --- 0.0 0.0 ---
--- --- ---
flight equipment insurance --- --- --- --- --- --- --- --- --- --- ---
station expenses (ground & pax handling) --- --- 0.0
passenger service staff (terminal) ground equipment, property and staff
--- --- --- ---
--- ---
--- --- ---
airport charges (e.g. landing) 18.5 18.5 0.0 -1.1 0.0
en-route & approach air navgn charges --- --- --- ---
all other pax costs ► ► ► ► ► ► ► ► ► ► ► ► 84.0
column totals 134.0 146.3 216.2 193.0 0.0 431.1 428.5 -1.1 84.0 proportion of col. total allocated to phase 0.81 0.09 0.04 0.06 1 0.2 0.8 1 --- --- 1
=> average cost per minute for phase 9.5 28.6 5.5 avg cost per min incl. incurred costs @ B 15.0 34.1

Evaluating the true cost to airlines of one minute of airborne or ground delay
Transport Studies Group University of Westminster
A - 39
Table J4 B737-300 (B733) / 65 minutes' delay / LOW cost scenario B733_65_L
cost allocation phase ► direct @ ground A direct airborne incurred @ ground B
OOOI sequence ► - (IN) - - OUT - - OFF - - ON - - IN -
@ gate A off-gate A airborne off-gate B description ►
GPU only
APU only
active taxi out
statnry ground
take-off roll
climb-out (to ToC) en-route arrival
mngmnt ToD to t’down
landing roll
statnry ground
active taxi in
@ gate B
▼ cost element fuel 26.2 204.8 157.0 --- 535.8 604.2 --- --- --- ---
maintenance 16.8 16.8 23.7 22.5 --- 37.6 35.2 --- --- --- ---
flight crew salaries and expenses cabin crew salaries and expenses
0.0 0.0 0.0 0.0 --- 0.0 0.0 ---
--- --- ---
depreciation of flight equipment
rental of flight equipment amortisation of flight equipment leases
0.0 0.0 0.0 0.0 --- 0.0 0.0 ---
--- --- ---
flight equipment insurance --- --- --- --- --- --- --- --- --- --- ---
station expenses (ground & pax handling) --- --- 0.0
passenger service staff (terminal) ground equipment, property and staff
--- --- --- ---
--- ---
--- --- ---
airport charges (e.g. landing) 21.2 21.2 0.0 -1.6 0.3
en-route & approach air navgn charges --- --- --- ---
all other pax costs ► ► ► ► ► ► ► ► ► ► ► ► 1289.6
column totals 37.9 64.1 228.4 179.5 0.0 573.3 639.5 -1.6 1289.9 proportion of col. total allocated to phase 0.81 0.09 0.04 0.06 1 0.7 0.3 1 --- --- 1
=> average cost per minute for phase 0.9 9.1 19.8 avg cost per min incl. incurred costs @ B 20.7 28.9

Evaluating the true cost to airlines of one minute of airborne or ground delay
Transport Studies Group University of Westminster
A - 40
Table J5 B737-300 (B733) / 65 minutes' delay / BASE cost scenario B733_65_N
cost allocation phase ► direct @ ground A direct airborne incurred @ ground B
OOOI sequence ► - (IN) - - OUT - - OFF - - ON - - IN -
@ gate A off-gate A airborne off-gate B description ►
GPU only
APU only
active taxi out
statnry ground
take-off roll
climb-out (to ToC) en-route arrival
mngmnt ToD to t’down
landing roll
statnry ground
active taxi in
@ gate B
▼ cost element fuel 38.6 302.3 231.7 --- 818.1 917.2 --- --- --- ---
maintenance 32.7 32.7 46.2 43.9 --- 73.2 68.7 --- --- --- ---
flight crew salaries and expenses cabin crew salaries and expenses
577.0 577.0 577.0 577.0 --- 577.0 577.0 ---
--- --- ---
depreciation of flight equipment
rental of flight equipment amortisation of flight equipment leases
0.0 0.0 0.0 0.0 --- 0.0 0.0 ---
--- --- ---
flight equipment insurance --- --- --- --- --- --- --- --- --- --- ---
station expenses (ground & pax handling) --- --- 0.0
passenger service staff (terminal) ground equipment, property and staff
--- --- --- ---
--- ---
--- --- ---
airport charges (e.g. landing) 23.6 23.6 0.0 -0.9 0.3
en-route & approach air navgn charges --- --- --- ---
all other pax costs ► ► ► ► ► ► ► ► ► ► ► ► 2262.0
column totals 633.3 671.9 925.4 852.6 0.0 1468.3 1562.9 -0.9 2262.3 proportion of col. total allocated to phase 0.81 0.09 0.04 0.06 1 0.7 0.3 1 --- --- 1
=> average cost per minute for phase 10.2 23.0 34.8 avg cost per min incl. incurred costs @ B 45.0 57.8

Evaluating the true cost to airlines of one minute of airborne or ground delay
Transport Studies Group University of Westminster
A - 41
Table J6 B737-300 (B733) / 65 minutes' delay / HIGH cost scenario B733_65_H
cost allocation phase ► direct @ ground A direct airborne incurred @ ground B
OOOI sequence ► - (IN) - - OUT - - OFF - - ON - - IN -
@ gate A off-gate A airborne off-gate B description ►
GPU only
APU only
active taxi out
statnry ground
take-off roll
climb-out (to ToC) en-route arrival
mngmnt ToD to t’down
landing roll
statnry ground
active taxi in
@ gate B
▼ cost element fuel 53.6 419.3 321.4 --- 1316.3 1310.9 --- --- --- ---
maintenance 41.2 41.2 58.3 55.5 --- 92.4 86.7 --- --- --- ---
flight crew salaries and expenses cabin crew salaries and expenses
1580.0 1580.0 1580.0 1580.0 --- 1580.0 1580.0 ---
--- --- ---
depreciation of flight equipment
rental of flight equipment amortisation of flight equipment leases
0.0 0.0 0.0 0.0 --- 0.0 0.0 ---
--- --- ---
flight equipment insurance --- --- --- --- --- --- --- --- --- --- ---
station expenses (ground & pax handling) --- --- 160.0
passenger service staff (terminal) ground equipment, property and staff
--- --- --- ---
--- ---
--- --- ---
airport charges (e.g. landing) 92.4 92.4 0.0 -1.1 12.3
en-route & approach air navgn charges --- --- --- ---
all other pax costs ► ► ► ► ► ► ► ► ► ► ► ► 3494.4
column totals 1713.6 1767.2 2057.5 1956.9 0.0 2988.8 2977.6 -1.1 3666.7 proportion of col. total allocated to phase 0.81 0.09 0.04 0.06 1 0.7 0.3 1 --- --- 1
=> average cost per minute for phase 26.9 45.9 56.4 avg cost per min incl. incurred costs @ B 83.3 102.3

Evaluating the true cost to airlines of one minute of airborne or ground delay
Transport Studies Group University of Westminster
A - 42
Table J7 B737-400 (B734) / 15 minutes' delay / LOW cost scenario B734_15_L
cost allocation phase ► direct @ ground A direct airborne incurred @ ground B
OOOI sequence ► - (IN) - - OUT - - OFF - - ON - - IN -
@ gate A off-gate A airborne off-gate B description ►
GPU only
APU only
active taxi out
statnry ground
take-off roll
climb-out (to ToC) en-route arrival
mngmnt ToD to t’down
landing roll
statnry ground
active taxi in
@ gate B
▼ cost element fuel 6.0 47.3 36.2 --- 122.7 131.5 --- --- --- ---
maintenance 4.5 4.5 6.3 6.0 --- 10.1 9.4 --- --- --- ---
flight crew salaries and expenses cabin crew salaries and expenses
0.0 0.0 0.0 0.0 --- 0.0 0.0 ---
--- --- ---
depreciation of flight equipment
rental of flight equipment amortisation of flight equipment leases
0.0 0.0 0.0 0.0 --- 0.0 0.0 ---
--- --- ---
flight equipment insurance --- --- --- --- --- --- --- --- --- --- ---
station expenses (ground & pax handling) --- --- 0.0
passenger service staff (terminal) ground equipment, property and staff
--- --- --- ---
--- ---
--- --- ---
airport charges (e.g. landing) 5.8 5.8 0.0 -1.7 0.0
en-route & approach air navgn charges --- --- --- ---
all other pax costs ► ► ► ► ► ► ► ► ► ► ► ► 0.0
column totals 10.3 16.4 53.6 42.3 0.0 132.8 140.9 -1.7 0.0 proportion of col. total allocated to phase 0.81 0.09 0.04 0.06 1 0.2 0.8 1 --- --- 1
=> average cost per minute for phase 1.0 9.3 -0.1 avg cost per min incl. incurred costs @ B 0.9 9.2

Evaluating the true cost to airlines of one minute of airborne or ground delay
Transport Studies Group University of Westminster
A - 43
Table J8 B737-400 (B734) / 15 minutes' delay / BASE cost scenario B734_15_N
cost allocation phase ► direct @ ground A direct airborne incurred @ ground B
OOOI sequence ► - (IN) - - OUT - - OFF - - ON - - IN -
@ gate A off-gate A airborne off-gate B description ►
GPU only
APU only
active taxi out
statnry ground
take-off roll
climb-out (to ToC) en-route arrival
mngmnt ToD to t’down
landing roll
statnry ground
active taxi in
@ gate B
▼ cost element fuel 8.9 69.8 53.5 --- 186.8 200.6 --- --- --- ---
maintenance 8.0 8.0 11.4 10.8 --- 18.0 16.9 --- --- --- ---
flight crew salaries and expenses cabin crew salaries and expenses
0.0 0.0 0.0 0.0 --- 0.0 0.0 ---
--- --- ---
depreciation of flight equipment
rental of flight equipment amortisation of flight equipment leases
0.0 0.0 0.0 0.0 --- 0.0 0.0 ---
--- --- ---
flight equipment insurance --- --- --- --- --- --- --- --- --- --- ---
station expenses (ground & pax handling) --- --- 0.0
passenger service staff (terminal) ground equipment, property and staff
--- --- --- ---
--- ---
--- --- ---
airport charges (e.g. landing) 5.9 5.9 0.0 -1.0 0.0
en-route & approach air navgn charges --- --- --- ---
all other pax costs ► ► ► ► ► ► ► ► ► ► ► ► 0.0
column totals 14.0 22.9 81.1 64.3 0.0 204.8 217.5 -1.0 0.0 proportion of col. total allocated to phase 0.81 0.09 0.04 0.06 1 0.2 0.8 1 --- --- 1
=> average cost per minute for phase 1.4 14.3 -0.1 avg cost per min incl. incurred costs @ B 1.3 14.3

Evaluating the true cost to airlines of one minute of airborne or ground delay
Transport Studies Group University of Westminster
A - 44
Table J9 B737-400 (B734) / 15 minutes' delay / HIGH cost scenario B734_15_H
cost allocation phase ► direct @ ground A direct airborne incurred @ ground B
OOOI sequence ► - (IN) - - OUT - - OFF - - ON - - IN -
@ gate A off-gate A airborne off-gate B description ►
GPU only
APU only
active taxi out
statnry ground
take-off roll
climb-out (to ToC) en-route arrival
mngmnt ToD to t’down
landing roll
statnry ground
active taxi in
@ gate B
▼ cost element fuel 12.4 96.8 74.2 --- 300.8 287.7 --- --- --- ---
maintenance 9.9 9.9 14.1 13.4 --- 22.3 20.9 --- --- --- ---
flight crew salaries and expenses cabin crew salaries and expenses
112.0 112.0 112.0 112.0 --- 112.0 112.0 ---
--- --- ---
depreciation of flight equipment
rental of flight equipment amortisation of flight equipment leases
0.0 0.0 0.0 0.0 --- 0.0 0.0 ---
--- --- ---
flight equipment insurance --- --- --- --- --- --- --- --- --- --- ---
station expenses (ground & pax handling) --- --- 0.0
passenger service staff (terminal) ground equipment, property and staff
--- --- --- ---
--- ---
--- --- ---
airport charges (e.g. landing) 18.5 18.5 0.0 -1.2 0.0
en-route & approach air navgn charges --- --- --- ---
all other pax costs ► ► ► ► ► ► ► ► ► ► ► ► 96.8
column totals 140.4 152.8 222.8 199.5 0.0 435.0 420.6 -1.2 96.8 proportion of col. total allocated to phase 0.81 0.09 0.04 0.06 1 0.2 0.8 1 --- --- 1
=> average cost per minute for phase 9.9 28.2 6.4 avg cost per min incl. incurred costs @ B 16.3 34.6

Evaluating the true cost to airlines of one minute of airborne or ground delay
Transport Studies Group University of Westminster
A - 45
Table J10 B737-400 (B734) / 65 minutes' delay / LOW cost scenario B734_65_L
cost allocation phase ► direct @ ground A direct airborne incurred @ ground B
OOOI sequence ► - (IN) - - OUT - - OFF - - ON - - IN -
@ gate A off-gate A airborne off-gate B description ►
GPU only
APU only
active taxi out
statnry ground
take-off roll
climb-out (to ToC) en-route arrival
mngmnt ToD to t’down
landing roll
statnry ground
active taxi in
@ gate B
▼ cost element fuel 26.2 204.8 157.0 --- 531.7 569.7 --- --- --- ---
maintenance 19.5 19.5 27.5 26.2 --- 43.6 40.9 --- --- --- ---
flight crew salaries and expenses cabin crew salaries and expenses
0.0 0.0 0.0 0.0 --- 0.0 0.0 ---
--- --- ---
depreciation of flight equipment
rental of flight equipment amortisation of flight equipment leases
0.0 0.0 0.0 0.0 --- 0.0 0.0 ---
--- --- ---
flight equipment insurance --- --- --- --- --- --- --- --- --- --- ---
station expenses (ground & pax handling) --- --- 0.0
passenger service staff (terminal) ground equipment, property and staff
--- --- --- ---
--- ---
--- --- ---
airport charges (e.g. landing) 21.6 21.6 0.0 -1.7 0.3
en-route & approach air navgn charges --- --- --- ---
all other pax costs ► ► ► ► ► ► ► ► ► ► ► ► 1497.6
column totals 41.0 67.2 232.3 183.1 0.0 575.3 610.6 -1.7 1497.9 proportion of col. total allocated to phase 0.81 0.09 0.04 0.06 1 0.7 0.3 1 --- --- 1
=> average cost per minute for phase 0.9 9.0 23.0 avg cost per min incl. incurred costs @ B 23.9 32.0

Evaluating the true cost to airlines of one minute of airborne or ground delay
Transport Studies Group University of Westminster
A - 46
Table J11 B737-400 (B734) / 65 minutes' delay / BASE cost scenario B734_65_N
cost allocation phase ► direct @ ground A direct airborne incurred @ ground B
OOOI sequence ► - (IN) - - OUT - - OFF - - ON - - IN -
@ gate A off-gate A airborne off-gate B description ►
GPU only
APU only
active taxi out
statnry ground
take-off roll
climb-out (to ToC) en-route arrival
mngmnt ToD to t’down
landing roll
statnry ground
active taxi in
@ gate B
▼ cost element fuel 38.6 302.3 231.7 --- 809.4 869.1 --- --- --- ---
maintenance 34.8 34.8 49.2 46.8 --- 78.1 73.3 --- --- --- ---
flight crew salaries and expenses cabin crew salaries and expenses
608.0 608.0 608.0 608.0 --- 608.0 608.0 ---
--- --- ---
depreciation of flight equipment
rental of flight equipment amortisation of flight equipment leases
0.0 0.0 0.0 0.0 --- 0.0 0.0 ---
--- --- ---
flight equipment insurance --- --- --- --- --- --- --- --- --- --- ---
station expenses (ground & pax handling) --- --- 0.0
passenger service staff (terminal) ground equipment, property and staff
--- --- --- ---
--- ---
--- --- ---
airport charges (e.g. landing) 24.2 24.2 0.0 -1.0 0.3
en-route & approach air navgn charges --- --- --- ---
all other pax costs ► ► ► ► ► ► ► ► ► ► ► ► 2600.0
column totals 667.0 705.6 959.5 886.6 0.0 1495.4 1550.4 -1.0 2600.3 proportion of col. total allocated to phase 0.81 0.09 0.04 0.06 1 0.7 0.3 1 --- --- 1
=> average cost per minute for phase 10.7 23.3 40.0 avg cost per min incl. incurred costs @ B 50.7 63.3

Evaluating the true cost to airlines of one minute of airborne or ground delay
Transport Studies Group University of Westminster
A - 47
Table J12 B737-400 (B734) / 65 minutes' delay / HIGH cost scenario B734_65_H
cost allocation phase ► direct @ ground A direct airborne incurred @ ground B
OOOI sequence ► - (IN) - - OUT - - OFF - - ON - - IN -
@ gate A off-gate A airborne off-gate B description ►
GPU only
APU only
active taxi out
statnry ground
take-off roll
climb-out (to ToC) en-route arrival
mngmnt ToD to t’down
landing roll
statnry ground
active taxi in
@ gate B
▼ cost element fuel 53.6 419.3 321.4 --- 1303.3 1246.6 --- --- --- ---
maintenance 43.1 43.1 60.9 57.9 --- 96.6 90.6 --- --- --- ---
flight crew salaries and expenses cabin crew salaries and expenses
1664.0 1664.0 1664.0 1664.0 --- 1664.0 1664.0 ---
--- --- ---
depreciation of flight equipment
rental of flight equipment amortisation of flight equipment leases
0.0 0.0 0.0 0.0 --- 0.0 0.0 ---
--- --- ---
flight equipment insurance --- --- --- --- --- --- --- --- --- --- ---
station expenses (ground & pax handling) --- --- 160.0
passenger service staff (terminal) ground equipment, property and staff
--- --- --- ---
--- ---
--- --- ---
airport charges (e.g. landing) 92.4 92.4 0.0 -1.2 12.3
en-route & approach air navgn charges --- --- --- ---
all other pax costs ► ► ► ► ► ► ► ► ► ► ► ► 4024.8
column totals 1799.4 1853.0 2144.2 2043.4 0.0 3063.9 3001.2 -1.2 4197.1 proportion of col. total allocated to phase 0.81 0.09 0.04 0.06 1 0.7 0.3 1 --- --- 1
=> average cost per minute for phase 28.2 46.8 64.6 avg cost per min incl. incurred costs @ B 92.7 111.4

Evaluating the true cost to airlines of one minute of airborne or ground delay
Transport Studies Group University of Westminster
A - 48
Table J13 B737-500 (B735) / 15 minutes' delay / LOW cost scenario B735_15_L
cost allocation phase ► direct @ ground A direct airborne incurred @ ground B
OOOI sequence ► - (IN) - - OUT - - OFF - - ON - - IN -
@ gate A off-gate A airborne off-gate B description ►
GPU only
APU only
active taxi out
statnry ground
take-off roll
climb-out (to ToC) en-route arrival
mngmnt ToD to t’down
landing roll
statnry ground
active taxi in
@ gate B
▼ cost element fuel 6.0 47.3 36.2 --- 113.9 130.4 --- --- --- ---
maintenance 3.9 3.9 5.5 5.2 --- 8.7 8.1 --- --- --- ---
flight crew salaries and expenses cabin crew salaries and expenses
0.0 0.0 0.0 0.0 --- 0.0 0.0 ---
--- --- ---
depreciation of flight equipment
rental of flight equipment amortisation of flight equipment leases
0.0 0.0 0.0 0.0 --- 0.0 0.0 ---
--- --- ---
flight equipment insurance --- --- --- --- --- --- --- --- --- --- ---
station expenses (ground & pax handling) --- --- 0.0
passenger service staff (terminal) ground equipment, property and staff
--- --- --- ---
--- ---
--- --- ---
airport charges (e.g. landing) 5.6 5.6 0.0 -1.5 0.0
en-route & approach air navgn charges --- --- --- ---
all other pax costs ► ► ► ► ► ► ► ► ► ► ► ► 0.0
column totals 9.5 15.5 52.7 41.4 0.0 122.5 138.5 -1.5 0.0 proportion of col. total allocated to phase 0.81 0.09 0.04 0.06 1 0.2 0.8 1 --- --- 1
=> average cost per minute for phase 0.9 9.0 -0.1 avg cost per min incl. incurred costs @ B 0.8 8.9

Evaluating the true cost to airlines of one minute of airborne or ground delay
Transport Studies Group University of Westminster
A - 49
Table J14 B737-500 (B735) / 15 minutes' delay / BASE cost scenario B735_15_N
cost allocation phase ► direct @ ground A direct airborne incurred @ ground B
OOOI sequence ► - (IN) - - OUT - - OFF - - ON - - IN -
@ gate A off-gate A airborne off-gate B description ►
GPU only
APU only
active taxi out
statnry ground
take-off roll
climb-out (to ToC) en-route arrival
mngmnt ToD to t’down
landing roll
statnry ground
active taxi in
@ gate B
▼ cost element fuel 8.9 69.8 53.5 --- 172.4 196.1 --- --- --- ---
maintenance 6.9 6.9 9.8 9.3 --- 15.5 14.6 --- --- --- ---
flight crew salaries and expenses cabin crew salaries and expenses
0.0 0.0 0.0 0.0 --- 0.0 0.0 ---
--- --- ---
depreciation of flight equipment
rental of flight equipment amortisation of flight equipment leases
0.0 0.0 0.0 0.0 --- 0.0 0.0 ---
--- --- ---
flight equipment insurance --- --- --- --- --- --- --- --- --- --- ---
station expenses (ground & pax handling) --- --- 0.0
passenger service staff (terminal) ground equipment, property and staff
--- --- --- ---
--- ---
--- --- ---
airport charges (e.g. landing) 5.7 5.7 0.0 -0.9 0.0
en-route & approach air navgn charges --- --- --- ---
all other pax costs ► ► ► ► ► ► ► ► ► ► ► ► 0.0
column totals 12.6 21.5 79.5 62.8 0.0 187.9 210.6 -0.9 0.0 proportion of col. total allocated to phase 0.81 0.09 0.04 0.06 1 0.2 0.8 1 --- --- 1
=> average cost per minute for phase 1.3 13.7 -0.1 avg cost per min incl. incurred costs @ B 1.2 13.7

Evaluating the true cost to airlines of one minute of airborne or ground delay
Transport Studies Group University of Westminster
A - 50
Table J15 B737-500 (B735) / 15 minutes' delay / HIGH cost scenario B735_15_H
cost allocation phase ► direct @ ground A direct airborne incurred @ ground B
OOOI sequence ► - (IN) - - OUT - - OFF - - ON - - IN -
@ gate A off-gate A airborne off-gate B description ►
GPU only
APU only
active taxi out
statnry ground
take-off roll
climb-out (to ToC) en-route arrival
mngmnt ToD to t’down
landing roll
statnry ground
active taxi in
@ gate B
▼ cost element fuel 12.4 96.8 74.2 --- 275.5 277.8 --- --- --- ---
maintenance 8.6 8.6 12.1 11.5 --- 19.2 18.0 --- --- --- ---
flight crew salaries and expenses cabin crew salaries and expenses
112.0 112.0 112.0 112.0 --- 112.0 112.0 ---
--- --- ---
depreciation of flight equipment
rental of flight equipment amortisation of flight equipment leases
0.0 0.0 0.0 0.0 --- 0.0 0.0 ---
--- --- ---
flight equipment insurance --- --- --- --- --- --- --- --- --- --- ---
station expenses (ground & pax handling) --- --- 0.0
passenger service staff (terminal) ground equipment, property and staff
--- --- --- ---
--- ---
--- --- ---
airport charges (e.g. landing) 18.5 18.5 0.0 -1.0 0.0
en-route & approach air navgn charges --- --- --- ---
all other pax costs ► ► ► ► ► ► ► ► ► ► ► ► 67.5
column totals 139.0 151.4 220.9 197.7 0.0 406.7 407.8 -1.0 67.5 proportion of col. total allocated to phase 0.81 0.09 0.04 0.06 1 0.2 0.8 1 --- --- 1
=> average cost per minute for phase 9.8 27.2 4.4 avg cost per min incl. incurred costs @ B 14.2 31.6

Evaluating the true cost to airlines of one minute of airborne or ground delay
Transport Studies Group University of Westminster
A - 51
Table J16 B737-500 (B735) / 65 minutes' delay / LOW cost scenario B735_65_L
cost allocation phase ► direct @ ground A direct airborne incurred @ ground B
OOOI sequence ► - (IN) - - OUT - - OFF - - ON - - IN -
@ gate A off-gate A airborne off-gate B description ►
GPU only
APU only
active taxi out
statnry ground
take-off roll
climb-out (to ToC) en-route arrival
mngmnt ToD to t’down
landing roll
statnry ground
active taxi in
@ gate B
▼ cost element fuel 26.2 204.8 157.0 --- 493.4 564.9 --- --- --- ---
maintenance 16.8 16.8 23.7 22.5 --- 37.6 35.2 --- --- --- ---
flight crew salaries and expenses cabin crew salaries and expenses
0.0 0.0 0.0 0.0 --- 0.0 0.0 ---
--- --- ---
depreciation of flight equipment
rental of flight equipment amortisation of flight equipment leases
0.0 0.0 0.0 0.0 --- 0.0 0.0 ---
--- --- ---
flight equipment insurance --- --- --- --- --- --- --- --- --- --- ---
station expenses (ground & pax handling) --- --- 0.0
passenger service staff (terminal) ground equipment, property and staff
--- --- --- ---
--- ---
--- --- ---
airport charges (e.g. landing) 21.0 21.0 0.0 -1.5 0.3
en-route & approach air navgn charges --- --- --- ---
all other pax costs ► ► ► ► ► ► ► ► ► ► ► ► 1040.0
column totals 37.8 63.9 228.4 179.5 0.0 531.0 600.1 -1.5 1040.3 proportion of col. total allocated to phase 0.81 0.09 0.04 0.06 1 0.7 0.3 1 --- --- 1
=> average cost per minute for phase 0.9 8.5 16.0 avg cost per min incl. incurred costs @ B 16.8 24.5

Evaluating the true cost to airlines of one minute of airborne or ground delay
Transport Studies Group University of Westminster
A - 52
Table J17 B737-500 (B735) / 65 minutes' delay / BASE cost scenario B735_65_N
cost allocation phase ► direct @ ground A direct airborne incurred @ ground B
OOOI sequence ► - (IN) - - OUT - - OFF - - ON - - IN -
@ gate A off-gate A airborne off-gate B description ►
GPU only
APU only
active taxi out
statnry ground
take-off roll
climb-out (to ToC) en-route arrival
mngmnt ToD to t’down
landing roll
statnry ground
active taxi in
@ gate B
▼ cost element fuel 38.6 302.3 231.7 --- 746.9 849.7 --- --- --- ---
maintenance 30.0 30.0 42.4 40.4 --- 67.3 63.1 --- --- --- ---
flight crew salaries and expenses cabin crew salaries and expenses
608.0 608.0 608.0 608.0 --- 608.0 608.0 ---
--- --- ---
depreciation of flight equipment
rental of flight equipment amortisation of flight equipment leases
0.0 0.0 0.0 0.0 --- 0.0 0.0 ---
--- --- ---
flight equipment insurance --- --- --- --- --- --- --- --- --- --- ---
station expenses (ground & pax handling) --- --- 0.0
passenger service staff (terminal) ground equipment, property and staff
--- --- --- ---
--- ---
--- --- ---
airport charges (e.g. landing) 23.4 23.4 0.0 -0.9 0.3
en-route & approach air navgn charges --- --- --- ---
all other pax costs ► ► ► ► ► ► ► ► ► ► ► ► 1820.0
column totals 661.4 700.0 952.7 880.1 0.0 1422.2 1520.8 -0.9 1820.3 proportion of col. total allocated to phase 0.81 0.09 0.04 0.06 1 0.7 0.3 1 --- --- 1
=> average cost per minute for phase 10.6 22.3 28.0 avg cost per min incl. incurred costs @ B 38.6 50.3

Evaluating the true cost to airlines of one minute of airborne or ground delay
Transport Studies Group University of Westminster
A - 53
Table J18 B737-500 (B735) / 65 minutes' delay / HIGH cost scenario B735_65_H
cost allocation phase ► direct @ ground A direct airborne incurred @ ground B
OOOI sequence ► - (IN) - - OUT - - OFF - - ON - - IN -
@ gate A off-gate A airborne off-gate B description ►
GPU only
APU only
active taxi out
statnry ground
take-off roll
climb-out (to ToC) en-route arrival
mngmnt ToD to t’down
landing roll
statnry ground
active taxi in
@ gate B
▼ cost element fuel 53.6 419.3 321.4 --- 1193.7 1203.7 --- --- --- ---
maintenance 37.1 37.1 52.5 50.0 --- 83.3 78.1 --- --- --- ---
flight crew salaries and expenses cabin crew salaries and expenses
1664.0 1664.0 1664.0 1664.0 --- 1664.0 1664.0 ---
--- --- ---
depreciation of flight equipment
rental of flight equipment amortisation of flight equipment leases
0.0 0.0 0.0 0.0 --- 0.0 0.0 ---
--- --- ---
flight equipment insurance --- --- --- --- --- --- --- --- --- --- ---
station expenses (ground & pax handling) --- --- 160.0
passenger service staff (terminal) ground equipment, property and staff
--- --- --- ---
--- ---
--- --- ---
airport charges (e.g. landing) 92.4 92.4 0.0 -1.0 12.3
en-route & approach air navgn charges --- --- --- ---
all other pax costs ► ► ► ► ► ► ► ► ► ► ► ► 2808.0
column totals 1793.5 1847.1 2135.8 2035.4 0.0 2941.0 2945.8 -1.0 2980.3 proportion of col. total allocated to phase 0.81 0.09 0.04 0.06 1 0.7 0.3 1 --- --- 1
=> average cost per minute for phase 28.1 45.3 45.8 avg cost per min incl. incurred costs @ B 73.9 91.1

Evaluating the true cost to airlines of one minute of airborne or ground delay
Transport Studies Group University of Westminster
A - 54
Table J19 B737-800 (B738) / 15 minutes' delay / LOW cost scenario B738_15_L
cost allocation phase ► direct @ ground A direct airborne incurred @ ground B
OOOI sequence ► - (IN) - - OUT - - OFF - - ON - - IN -
@ gate A off-gate A airborne off-gate B description ►
GPU only
APU only
active taxi out
statnry ground
take-off roll
climb-out (to ToC) en-route arrival
mngmnt ToD to t’down
landing roll
statnry ground
active taxi in
@ gate B
▼ cost element fuel 6.0 47.3 36.2 --- 130.5 107.0 --- --- --- ---
maintenance 3.2 3.2 4.6 4.4 --- 7.3 6.8 --- --- --- ---
flight crew salaries and expenses cabin crew salaries and expenses
0.0 0.0 0.0 0.0 --- 0.0 0.0 ---
--- --- ---
depreciation of flight equipment
rental of flight equipment amortisation of flight equipment leases
0.0 0.0 0.0 0.0 --- 0.0 0.0 ---
--- --- ---
flight equipment insurance --- --- --- --- --- --- --- --- --- --- ---
station expenses (ground & pax handling) --- --- 0.0
passenger service staff (terminal) ground equipment, property and staff
--- --- --- ---
--- ---
--- --- ---
airport charges (e.g. landing) 6.3 6.3 0.0 -2.0 0.0
en-route & approach air navgn charges --- --- --- ---
all other pax costs ► ► ► ► ► ► ► ► ► ► ► ► 0.0
column totals 9.5 15.6 51.8 40.6 0.0 137.7 113.8 -2.0 0.0 proportion of col. total allocated to phase 0.81 0.09 0.04 0.06 1 0.2 0.8 1 --- --- 1
=> average cost per minute for phase 0.9 7.9 -0.1 avg cost per min incl. incurred costs @ B 0.8 7.8

Evaluating the true cost to airlines of one minute of airborne or ground delay
Transport Studies Group University of Westminster
A - 55
Table J20 B737-800 (B738) / 15 minutes' delay / BASE cost scenario B738_15_N
cost allocation phase ► direct @ ground A direct airborne incurred @ ground B
OOOI sequence ► - (IN) - - OUT - - OFF - - ON - - IN -
@ gate A off-gate A airborne off-gate B description ►
GPU only
APU only
active taxi out
statnry ground
take-off roll
climb-out (to ToC) en-route arrival
mngmnt ToD to t’down
landing roll
statnry ground
active taxi in
@ gate B
▼ cost element fuel 8.9 69.8 53.5 --- 199.3 169.5 --- --- --- ---
maintenance 6.2 6.2 8.7 8.3 --- 13.8 12.9 --- --- --- ---
flight crew salaries and expenses cabin crew salaries and expenses
0.0 0.0 0.0 0.0 --- 0.0 0.0 ---
--- --- ---
depreciation of flight equipment
rental of flight equipment amortisation of flight equipment leases
0.0 0.0 0.0 0.0 --- 0.0 0.0 ---
--- --- ---
flight equipment insurance --- --- --- --- --- --- --- --- --- --- ---
station expenses (ground & pax handling) --- --- 0.0
passenger service staff (terminal) ground equipment, property and staff
--- --- --- ---
--- ---
--- --- ---
airport charges (e.g. landing) 6.4 6.4 0.0 -1.2 0.0
en-route & approach air navgn charges --- --- --- ---
all other pax costs ► ► ► ► ► ► ► ► ► ► ► ► 0.0
column totals 12.5 21.4 78.4 61.7 0.0 213.1 182.4 -1.2 0.0 proportion of col. total allocated to phase 0.81 0.09 0.04 0.06 1 0.2 0.8 1 --- --- 1
=> average cost per minute for phase 1.3 12.6 -0.1 avg cost per min incl. incurred costs @ B 1.2 12.5

Evaluating the true cost to airlines of one minute of airborne or ground delay
Transport Studies Group University of Westminster
A - 56
Table J21 B737-800 (B738) / 15 minutes' delay / HIGH cost scenario B738_15_H
cost allocation phase ► direct @ ground A direct airborne incurred @ ground B
OOOI sequence ► - (IN) - - OUT - - OFF - - ON - - IN -
@ gate A off-gate A airborne off-gate B description ►
GPU only
APU only
active taxi out
statnry ground
take-off roll
climb-out (to ToC) en-route arrival
mngmnt ToD to t’down
landing roll
statnry ground
active taxi in
@ gate B
▼ cost element fuel 12.4 96.8 74.2 --- 286.8 239.6 --- --- --- ---
maintenance 9.1 9.1 12.8 12.2 --- 20.3 19.1 --- --- --- ---
flight crew salaries and expenses cabin crew salaries and expenses
112.0 112.0 112.0 112.0 --- 112.0 112.0 ---
--- --- ---
depreciation of flight equipment
rental of flight equipment amortisation of flight equipment leases
0.0 0.0 0.0 0.0 --- 0.0 0.0 ---
--- --- ---
flight equipment insurance --- --- --- --- --- --- --- --- --- --- ---
station expenses (ground & pax handling) --- --- 0.0
passenger service staff (terminal) ground equipment, property and staff
--- --- --- ---
--- ---
--- --- ---
airport charges (e.g. landing) 19.0 19.0 0.0 -1.4 0.0
en-route & approach air navgn charges --- --- --- ---
all other pax costs ► ► ► ► ► ► ► ► ► ► ► ► 117.0
column totals 140.0 152.4 221.6 198.4 0.0 419.1 370.7 -1.4 117.0 proportion of col. total allocated to phase 0.81 0.09 0.04 0.06 1 0.2 0.8 1 --- --- 1
=> average cost per minute for phase 9.9 25.4 7.7 avg cost per min incl. incurred costs @ B 17.6 33.1

Evaluating the true cost to airlines of one minute of airborne or ground delay
Transport Studies Group University of Westminster
A - 57
Table J22 B737-800 (B738) / 65 minutes' delay / LOW cost scenario B738_65_L
cost allocation phase ► direct @ ground A direct airborne incurred @ ground B
OOOI sequence ► - (IN) - - OUT - - OFF - - ON - - IN -
@ gate A off-gate A airborne off-gate B description ►
GPU only
APU only
active taxi out
statnry ground
take-off roll
climb-out (to ToC) en-route arrival
mngmnt ToD to t’down
landing roll
statnry ground
active taxi in
@ gate B
▼ cost element fuel 26.2 204.8 157.0 --- 565.3 463.6 --- --- --- ---
maintenance 14.1 14.1 19.9 18.9 --- 31.5 29.6 --- --- --- ---
flight crew salaries and expenses cabin crew salaries and expenses
0.0 0.0 0.0 0.0 --- 0.0 0.0 ---
--- --- ---
depreciation of flight equipment
rental of flight equipment amortisation of flight equipment leases
0.0 0.0 0.0 0.0 --- 0.0 0.0 ---
--- --- ---
flight equipment insurance --- --- --- --- --- --- --- --- --- --- ---
station expenses (ground & pax handling) --- --- 0.0
passenger service staff (terminal) ground equipment, property and staff
--- --- --- ---
--- ---
--- --- ---
airport charges (e.g. landing) 22.9 22.9 0.0 -2.0 0.3
en-route & approach air navgn charges --- --- --- ---
all other pax costs ► ► ► ► ► ► ► ► ► ► ► ► 1809.6
column totals 36.9 63.1 224.6 175.9 0.0 596.8 493.2 -2.0 1809.9 proportion of col. total allocated to phase 0.81 0.09 0.04 0.06 1 0.7 0.3 1 --- --- 1
=> average cost per minute for phase 0.8 8.7 27.8 avg cost per min incl. incurred costs @ B 28.7 36.5
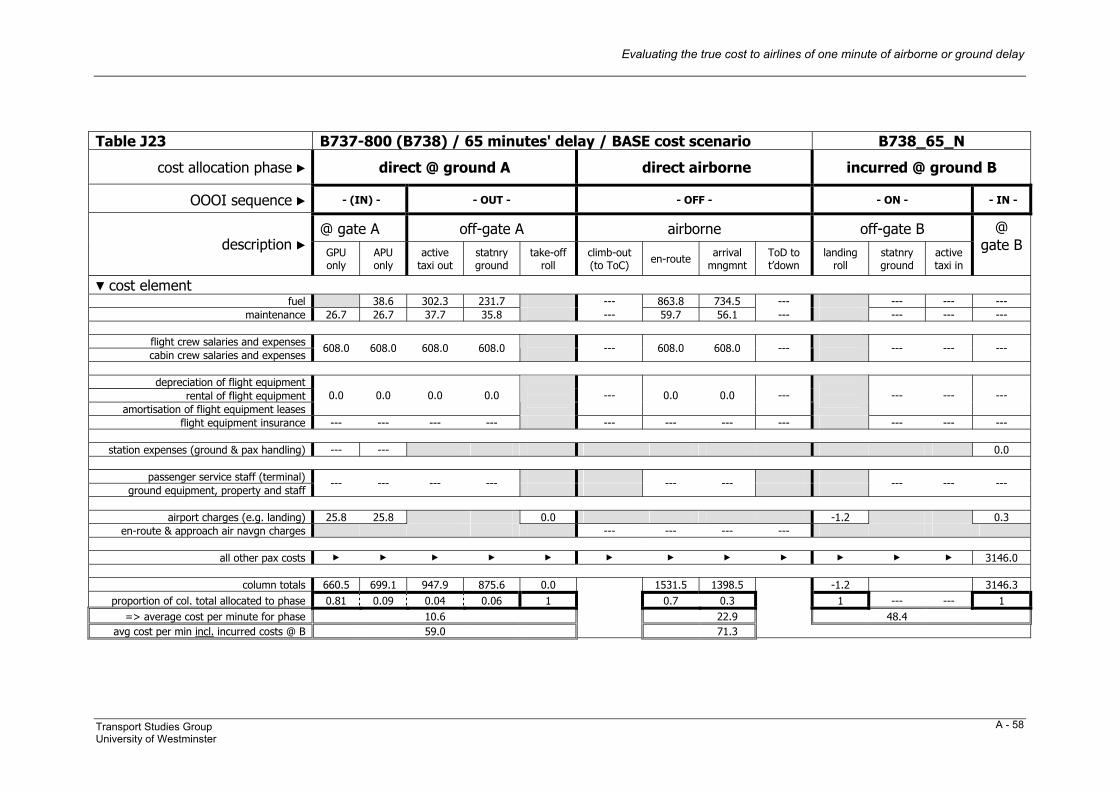
Evaluating the true cost to airlines of one minute of airborne or ground delay
Transport Studies Group University of Westminster
A - 58
Table J23 B737-800 (B738) / 65 minutes' delay / BASE cost scenario B738_65_N
cost allocation phase ► direct @ ground A direct airborne incurred @ ground B
OOOI sequence ► - (IN) - - OUT - - OFF - - ON - - IN -
@ gate A off-gate A airborne off-gate B description ►
GPU only
APU only
active taxi out
statnry ground
take-off roll
climb-out (to ToC) en-route arrival
mngmnt ToD to t’down
landing roll
statnry ground
active taxi in
@ gate B
▼ cost element fuel 38.6 302.3 231.7 --- 863.8 734.5 --- --- --- ---
maintenance 26.7 26.7 37.7 35.8 --- 59.7 56.1 --- --- --- ---
flight crew salaries and expenses cabin crew salaries and expenses
608.0 608.0 608.0 608.0 --- 608.0 608.0 ---
--- --- ---
depreciation of flight equipment
rental of flight equipment amortisation of flight equipment leases
0.0 0.0 0.0 0.0 --- 0.0 0.0 ---
--- --- ---
flight equipment insurance --- --- --- --- --- --- --- --- --- --- ---
station expenses (ground & pax handling) --- --- 0.0
passenger service staff (terminal) ground equipment, property and staff
--- --- --- ---
--- ---
--- --- ---
airport charges (e.g. landing) 25.8 25.8 0.0 -1.2 0.3
en-route & approach air navgn charges --- --- --- ---
all other pax costs ► ► ► ► ► ► ► ► ► ► ► ► 3146.0
column totals 660.5 699.1 947.9 875.6 0.0 1531.5 1398.5 -1.2 3146.3 proportion of col. total allocated to phase 0.81 0.09 0.04 0.06 1 0.7 0.3 1 --- --- 1
=> average cost per minute for phase 10.6 22.9 48.4 avg cost per min incl. incurred costs @ B 59.0 71.3
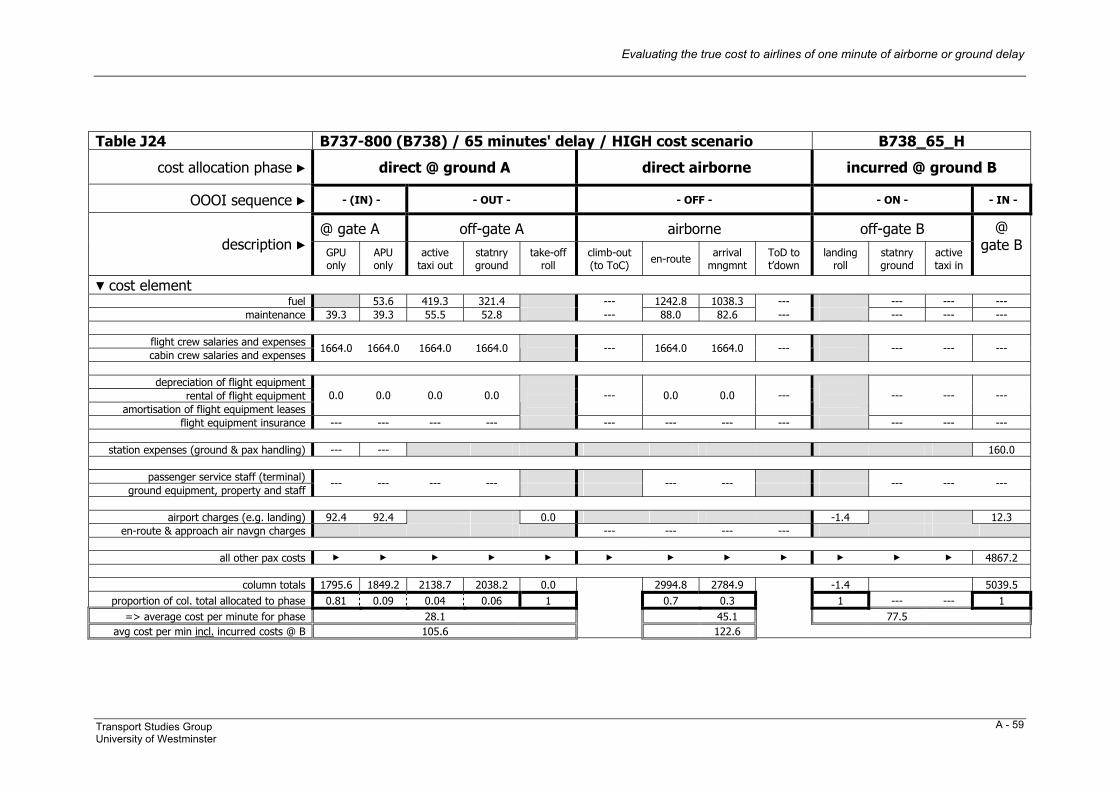
Evaluating the true cost to airlines of one minute of airborne or ground delay
Transport Studies Group University of Westminster
A - 59
Table J24 B737-800 (B738) / 65 minutes' delay / HIGH cost scenario B738_65_H
cost allocation phase ► direct @ ground A direct airborne incurred @ ground B
OOOI sequence ► - (IN) - - OUT - - OFF - - ON - - IN -
@ gate A off-gate A airborne off-gate B description ►
GPU only
APU only
active taxi out
statnry ground
take-off roll
climb-out (to ToC) en-route arrival
mngmnt ToD to t’down
landing roll
statnry ground
active taxi in
@ gate B
▼ cost element fuel 53.6 419.3 321.4 --- 1242.8 1038.3 --- --- --- ---
maintenance 39.3 39.3 55.5 52.8 --- 88.0 82.6 --- --- --- ---
flight crew salaries and expenses cabin crew salaries and expenses
1664.0 1664.0 1664.0 1664.0 --- 1664.0 1664.0 ---
--- --- ---
depreciation of flight equipment
rental of flight equipment amortisation of flight equipment leases
0.0 0.0 0.0 0.0 --- 0.0 0.0 ---
--- --- ---
flight equipment insurance --- --- --- --- --- --- --- --- --- --- ---
station expenses (ground & pax handling) --- --- 160.0
passenger service staff (terminal) ground equipment, property and staff
--- --- --- ---
--- ---
--- --- ---
airport charges (e.g. landing) 92.4 92.4 0.0 -1.4 12.3
en-route & approach air navgn charges --- --- --- ---
all other pax costs ► ► ► ► ► ► ► ► ► ► ► ► 4867.2
column totals 1795.6 1849.2 2138.7 2038.2 0.0 2994.8 2784.9 -1.4 5039.5 proportion of col. total allocated to phase 0.81 0.09 0.04 0.06 1 0.7 0.3 1 --- --- 1
=> average cost per minute for phase 28.1 45.1 77.5 avg cost per min incl. incurred costs @ B 105.6 122.6

Evaluating the true cost to airlines of one minute of airborne or ground delay
Transport Studies Group University of Westminster
A - 60
Table J25 B757-200 (B752) / 15 minutes' delay / LOW cost scenario B752_15_L
cost allocation phase ► direct @ ground A direct airborne incurred @ ground B
OOOI sequence ► - (IN) - - OUT - - OFF - - ON - - IN -
@ gate A off-gate A airborne off-gate B description ►
GPU only
APU only
active taxi out
statnry ground
take-off roll
climb-out (to ToC) en-route arrival
mngmnt ToD to t’down
landing roll
statnry ground
active taxi in
@ gate B
▼ cost element fuel 7.9 52.5 43.1 --- 167.7 141.0 --- --- --- ---
maintenance 5.1 5.1 7.2 6.8 --- 11.4 10.7 --- --- --- ---
flight crew salaries and expenses cabin crew salaries and expenses
0.0 0.0 0.0 0.0 --- 0.0 0.0 ---
--- --- ---
depreciation of flight equipment
rental of flight equipment amortisation of flight equipment leases
0.0 0.0 0.0 0.0 --- 0.0 0.0 ---
--- --- ---
flight equipment insurance --- --- --- --- --- --- --- --- --- --- ---
station expenses (ground & pax handling) --- --- 0.0
passenger service staff (terminal) ground equipment, property and staff
--- --- --- ---
--- ---
--- --- ---
airport charges (e.g. landing) 6.3 6.3 0.0 -3.1 0.0
en-route & approach air navgn charges --- --- --- ---
all other pax costs ► ► ► ► ► ► ► ► ► ► ► ► 0.0
column totals 11.3 19.2 59.7 49.9 0.0 179.1 151.6 -3.1 0.0 proportion of col. total allocated to phase 0.81 0.09 0.04 0.06 1 0.2 0.8 1 --- --- 1
=> average cost per minute for phase 1.1 10.5 -0.2 avg cost per min incl. incurred costs @ B 0.9 10.3

Evaluating the true cost to airlines of one minute of airborne or ground delay
Transport Studies Group University of Westminster
A - 61
Table J26 B757-200 (B752) / 15 minutes' delay / BASE cost scenario B752_15_N
cost allocation phase ► direct @ ground A direct airborne incurred @ ground B
OOOI sequence ► - (IN) - - OUT - - OFF - - ON - - IN -
@ gate A off-gate A airborne off-gate B description ►
GPU only
APU only
active taxi out
statnry ground
take-off roll
climb-out (to ToC) en-route arrival
mngmnt ToD to t’down
landing roll
statnry ground
active taxi in
@ gate B
▼ cost element fuel 11.6 77.5 63.6 --- 256.6 216.1 --- --- --- ---
maintenance 9.1 9.1 12.8 12.2 --- 20.3 19.1 --- --- --- ---
flight crew salaries and expenses cabin crew salaries and expenses
0.0 0.0 0.0 0.0 --- 0.0 0.0 ---
--- --- ---
depreciation of flight equipment
rental of flight equipment amortisation of flight equipment leases
0.0 0.0 0.0 0.0 --- 0.0 0.0 ---
--- --- ---
flight equipment insurance --- --- --- --- --- --- --- --- --- --- ---
station expenses (ground & pax handling) --- --- 0.0
passenger service staff (terminal) ground equipment, property and staff
--- --- --- ---
--- ---
--- --- ---
airport charges (e.g. landing) 6.4 6.4 0.0 -1.8 0.0
en-route & approach air navgn charges --- --- --- ---
all other pax costs ► ► ► ► ► ► ► ► ► ► ► ► 0.0
column totals 15.5 27.1 90.3 75.8 0.0 276.9 235.2 -1.8 0.0 proportion of col. total allocated to phase 0.81 0.09 0.04 0.06 1 0.2 0.8 1 --- --- 1
=> average cost per minute for phase 1.5 16.2 -0.1 avg cost per min incl. incurred costs @ B 1.4 16.1

Evaluating the true cost to airlines of one minute of airborne or ground delay
Transport Studies Group University of Westminster
A - 62
Table J27 B757-200 (B752) / 15 minutes' delay / HIGH cost scenario B752_15_H
cost allocation phase ► direct @ ground A direct airborne incurred @ ground B
OOOI sequence ► - (IN) - - OUT - - OFF - - ON - - IN -
@ gate A off-gate A airborne off-gate B description ►
GPU only
APU only
active taxi out
statnry ground
take-off roll
climb-out (to ToC) en-route arrival
mngmnt ToD to t’down
landing roll
statnry ground
active taxi in
@ gate B
▼ cost element fuel 16.1 107.5 88.2 --- 393.0 308.2 --- --- --- ---
maintenance 11.2 11.2 15.9 15.1 --- 25.2 23.6 --- --- --- ---
flight crew salaries and expenses cabin crew salaries and expenses
117.0 117.0 117.0 117.0 --- 117.0 117.0 ---
--- --- ---
depreciation of flight equipment
rental of flight equipment amortisation of flight equipment leases
0.0 0.0 0.0 0.0 --- 0.0 0.0 ---
--- --- ---
flight equipment insurance --- --- --- --- --- --- --- --- --- --- ---
station expenses (ground & pax handling) --- --- 0.0
passenger service staff (terminal) ground equipment, property and staff
--- --- --- ---
--- ---
--- --- ---
airport charges (e.g. landing) 27.8 27.8 0.0 -2.1 0.0
en-route & approach air navgn charges --- --- --- ---
all other pax costs ► ► ► ► ► ► ► ► ► ► ► ► 147.0
column totals 156.1 172.2 240.4 220.3 0.0 535.2 448.8 -2.1 147.0 proportion of col. total allocated to phase 0.81 0.09 0.04 0.06 1 0.2 0.8 1 --- --- 1
=> average cost per minute for phase 11.0 31.1 9.7 avg cost per min incl. incurred costs @ B 20.6 40.7

Evaluating the true cost to airlines of one minute of airborne or ground delay
Transport Studies Group University of Westminster
A - 63
Table J28 B757-200 (B752) / 65 minutes' delay / LOW cost scenario B752_65_L
cost allocation phase ► direct @ ground A direct airborne incurred @ ground B
OOOI sequence ► - (IN) - - OUT - - OFF - - ON - - IN -
@ gate A off-gate A airborne off-gate B description ►
GPU only
APU only
active taxi out
statnry ground
take-off roll
climb-out (to ToC) en-route arrival
mngmnt ToD to t’down
landing roll
statnry ground
active taxi in
@ gate B
▼ cost element fuel 34.1 227.5 186.6 --- 726.9 610.8 --- --- --- ---
maintenance 22.0 22.0 31.1 29.5 --- 49.2 46.2 --- --- --- ---
flight crew salaries and expenses cabin crew salaries and expenses
0.0 0.0 0.0 0.0 --- 0.0 0.0 ---
--- --- ---
depreciation of flight equipment
rental of flight equipment amortisation of flight equipment leases
0.0 0.0 0.0 0.0 --- 0.0 0.0 ---
--- --- ---
flight equipment insurance --- --- --- --- --- --- --- --- --- --- ---
station expenses (ground & pax handling) --- --- 0.0
passenger service staff (terminal) ground equipment, property and staff
--- --- --- ---
--- ---
--- --- ---
airport charges (e.g. landing) 25.0 25.0 0.0 -3.1 0.3
en-route & approach air navgn charges --- --- --- ---
all other pax costs ► ► ► ► ► ► ► ► ► ► ► ► 2267.2
column totals 47.0 81.1 258.6 216.1 0.0 776.1 657.0 -3.1 2267.5 proportion of col. total allocated to phase 0.81 0.09 0.04 0.06 1 0.7 0.3 1 --- --- 1
=> average cost per minute for phase 1.1 11.4 34.8 avg cost per min incl. incurred costs @ B 35.9 46.2

Evaluating the true cost to airlines of one minute of airborne or ground delay
Transport Studies Group University of Westminster
A - 64
Table J29 B757-200 (B752) / 65 minutes' delay / BASE cost scenario B752_65_N
cost allocation phase ► direct @ ground A direct airborne incurred @ ground B
OOOI sequence ► - (IN) - - OUT - - OFF - - ON - - IN -
@ gate A off-gate A airborne off-gate B description ►
GPU only
APU only
active taxi out
statnry ground
take-off roll
climb-out (to ToC) en-route arrival
mngmnt ToD to t’down
landing roll
statnry ground
active taxi in
@ gate B
▼ cost element fuel 50.4 335.8 275.4 --- 1111.9 936.6 --- --- --- ---
maintenance 39.3 39.3 55.6 52.9 --- 88.1 82.7 --- --- --- ---
flight crew salaries and expenses cabin crew salaries and expenses
638.0 638.0 638.0 638.0 --- 638.0 638.0 ---
--- --- ---
depreciation of flight equipment
rental of flight equipment amortisation of flight equipment leases
0.0 0.0 0.0 0.0 --- 0.0 0.0 ---
--- --- ---
flight equipment insurance --- --- --- --- --- --- --- --- --- --- ---
station expenses (ground & pax handling) --- --- 0.0
passenger service staff (terminal) ground equipment, property and staff
--- --- --- ---
--- ---
--- --- ---
airport charges (e.g. landing) 29.0 29.0 0.0 -1.8 0.3
en-route & approach air navgn charges --- --- --- ---
all other pax costs ► ► ► ► ► ► ► ► ► ► ► ► 3952.0
column totals 706.3 756.7 1029.4 966.3 0.0 1838.1 1657.3 -1.8 3952.3 proportion of col. total allocated to phase 0.81 0.09 0.04 0.06 1 0.7 0.3 1 --- --- 1
=> average cost per minute for phase 11.4 27.4 60.8 avg cost per min incl. incurred costs @ B 72.2 88.2

Evaluating the true cost to airlines of one minute of airborne or ground delay
Transport Studies Group University of Westminster
A - 65
Table J30 B757-200 (B752) / 65 minutes' delay / HIGH cost scenario B752_65_H
cost allocation phase ► direct @ ground A direct airborne incurred @ ground B
OOOI sequence ► - (IN) - - OUT - - OFF - - ON - - IN -
@ gate A off-gate A airborne off-gate B description ►
GPU only
APU only
active taxi out
statnry ground
take-off roll
climb-out (to ToC) en-route arrival
mngmnt ToD to t’down
landing roll
statnry ground
active taxi in
@ gate B
▼ cost element fuel 69.9 465.8 382.0 --- 1703.2 1335.5 --- --- --- ---
maintenance 48.7 48.7 68.8 65.5 --- 109.1 102.4 --- --- --- ---
flight crew salaries and expenses cabin crew salaries and expenses
1747.0 1747.0 1747.0 1747.0 --- 1747.0 1747.0 ---
--- --- ---
depreciation of flight equipment
rental of flight equipment amortisation of flight equipment leases
0.0 0.0 0.0 0.0 --- 0.0 0.0 ---
--- --- ---
flight equipment insurance --- --- --- --- --- --- --- --- --- --- ---
station expenses (ground & pax handling) --- --- 160.0
passenger service staff (terminal) ground equipment, property and staff
--- --- --- ---
--- ---
--- --- ---
airport charges (e.g. landing) 102.9 102.9 0.0 -2.1 12.3
en-route & approach air navgn charges --- --- --- ---
all other pax costs ► ► ► ► ► ► ► ► ► ► ► ► 6115.2
column totals 1898.6 1968.5 2281.7 2194.5 0.0 3559.3 3185.0 -2.1 6287.5 proportion of col. total allocated to phase 0.81 0.09 0.04 0.06 1 0.7 0.3 1 --- --- 1
=> average cost per minute for phase 29.8 53.0 96.7 avg cost per min incl. incurred costs @ B 126.5 149.7

Evaluating the true cost to airlines of one minute of airborne or ground delay
Transport Studies Group University of Westminster
A - 66
Table J31 B767-300ER (B763) / 15 minutes' delay / LOW cost scenario B763_15_L
cost allocation phase ► direct @ ground A direct airborne incurred @ ground B
OOOI sequence ► - (IN) - - OUT - - OFF - - ON - - IN -
@ gate A off-gate A airborne off-gate B description ►
GPU only
APU only
active taxi out
statnry ground
take-off roll
climb-out (to ToC) en-route arrival
mngmnt ToD to t’down
landing roll
statnry ground
active taxi in
@ gate B
▼ cost element fuel 7.9 73.5 58.8 --- 237.0 196.1 --- --- --- ---
maintenance 6.2 6.2 8.8 8.4 --- 14.0 13.1 --- --- --- ---
flight crew salaries and expenses cabin crew salaries and expenses
0.0 0.0 0.0 0.0 --- 0.0 0.0 ---
--- --- ---
depreciation of flight equipment
rental of flight equipment amortisation of flight equipment leases
0.0 0.0 0.0 0.0 --- 0.0 0.0 ---
--- --- ---
flight equipment insurance --- --- --- --- --- --- --- --- --- --- ---
station expenses (ground & pax handling) --- --- 0.0
passenger service staff (terminal) ground equipment, property and staff
--- --- --- ---
--- ---
--- --- ---
airport charges (e.g. landing) 7.6 7.6 0.0 -5.0 0.0
en-route & approach air navgn charges --- --- --- ---
all other pax costs ► ► ► ► ► ► ► ► ► ► ► ► 0.0
column totals 13.8 21.7 82.3 67.2 0.0 250.9 209.2 -5.0 0.0 proportion of col. total allocated to phase 0.81 0.09 0.04 0.06 1 0.2 0.8 1 --- --- 1
=> average cost per minute for phase 1.4 14.5 -0.3 avg cost per min incl. incurred costs @ B 1.0 14.2
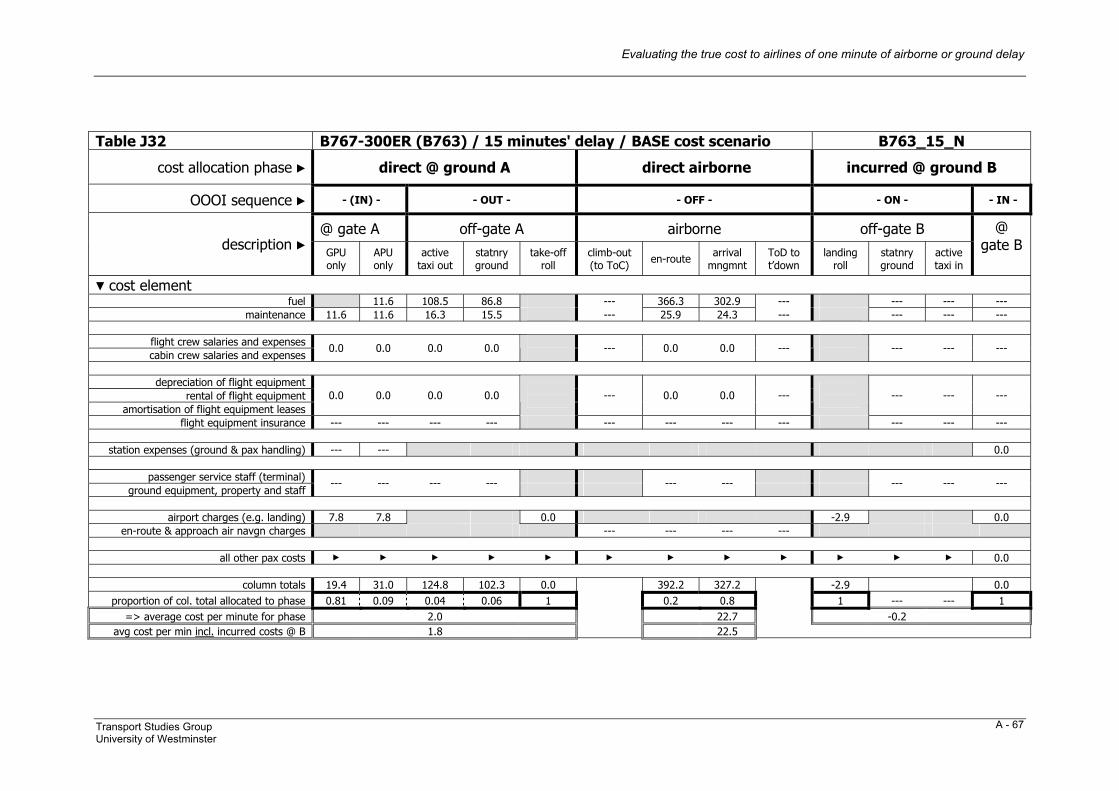
Evaluating the true cost to airlines of one minute of airborne or ground delay
Transport Studies Group University of Westminster
A - 67
Table J32 B767-300ER (B763) / 15 minutes' delay / BASE cost scenario B763_15_N
cost allocation phase ► direct @ ground A direct airborne incurred @ ground B
OOOI sequence ► - (IN) - - OUT - - OFF - - ON - - IN -
@ gate A off-gate A airborne off-gate B description ►
GPU only
APU only
active taxi out
statnry ground
take-off roll
climb-out (to ToC) en-route arrival
mngmnt ToD to t’down
landing roll
statnry ground
active taxi in
@ gate B
▼ cost element fuel 11.6 108.5 86.8 --- 366.3 302.9 --- --- --- ---
maintenance 11.6 11.6 16.3 15.5 --- 25.9 24.3 --- --- --- ---
flight crew salaries and expenses cabin crew salaries and expenses
0.0 0.0 0.0 0.0 --- 0.0 0.0 ---
--- --- ---
depreciation of flight equipment
rental of flight equipment amortisation of flight equipment leases
0.0 0.0 0.0 0.0 --- 0.0 0.0 ---
--- --- ---
flight equipment insurance --- --- --- --- --- --- --- --- --- --- ---
station expenses (ground & pax handling) --- --- 0.0
passenger service staff (terminal) ground equipment, property and staff
--- --- --- ---
--- ---
--- --- ---
airport charges (e.g. landing) 7.8 7.8 0.0 -2.9 0.0
en-route & approach air navgn charges --- --- --- ---
all other pax costs ► ► ► ► ► ► ► ► ► ► ► ► 0.0
column totals 19.4 31.0 124.8 102.3 0.0 392.2 327.2 -2.9 0.0 proportion of col. total allocated to phase 0.81 0.09 0.04 0.06 1 0.2 0.8 1 --- --- 1
=> average cost per minute for phase 2.0 22.7 -0.2 avg cost per min incl. incurred costs @ B 1.8 22.5

Evaluating the true cost to airlines of one minute of airborne or ground delay
Transport Studies Group University of Westminster
A - 68
Table J33 B767-300ER (B763) / 15 minutes' delay / HIGH cost scenario B763_15_H
cost allocation phase ► direct @ ground A direct airborne incurred @ ground B
OOOI sequence ► - (IN) - - OUT - - OFF - - ON - - IN -
@ gate A off-gate A airborne off-gate B description ►
GPU only
APU only
active taxi out
statnry ground
take-off roll
climb-out (to ToC) en-route arrival
mngmnt ToD to t’down
landing roll
statnry ground
active taxi in
@ gate B
▼ cost element fuel 16.1 150.5 120.4 --- 568.3 440.0 --- --- --- ---
maintenance 16.9 16.9 23.8 22.7 --- 37.8 35.5 --- --- --- ---
flight crew salaries and expenses cabin crew salaries and expenses
196.0 196.0 196.0 196.0 --- 196.0 196.0 ---
--- --- ---
depreciation of flight equipment
rental of flight equipment amortisation of flight equipment leases
0.0 0.0 0.0 0.0 --- 0.0 0.0 ---
--- --- ---
flight equipment insurance --- --- --- --- --- --- --- --- --- --- ---
station expenses (ground & pax handling) --- --- 0.0
passenger service staff (terminal) ground equipment, property and staff
--- --- --- ---
--- ---
--- --- ---
airport charges (e.g. landing) 44.4 44.4 0.0 -3.4 0.0
en-route & approach air navgn charges --- --- --- ---
all other pax costs ► ► ► ► ► ► ► ► ► ► ► ► 162.0
column totals 257.3 273.4 370.3 339.1 0.0 802.1 671.5 -3.4 162.0 proportion of col. total allocated to phase 0.81 0.09 0.04 0.06 1 0.2 0.8 1 --- --- 1
=> average cost per minute for phase 17.9 46.5 10.6 avg cost per min incl. incurred costs @ B 28.5 57.1

Evaluating the true cost to airlines of one minute of airborne or ground delay
Transport Studies Group University of Westminster
A - 69
Table J34 B767-300ER (B763) / 65 minutes' delay / LOW cost scenario B763_65_L
cost allocation phase ► direct @ ground A direct airborne incurred @ ground B
OOOI sequence ► - (IN) - - OUT - - OFF - - ON - - IN -
@ gate A off-gate A airborne off-gate B description ►
GPU only
APU only
active taxi out
statnry ground
take-off roll
climb-out (to ToC) en-route arrival
mngmnt ToD to t’down
landing roll
statnry ground
active taxi in
@ gate B
▼ cost element fuel 34.1 318.5 254.8 --- 1026.9 849.7 --- --- --- ---
maintenance 27.0 27.0 38.1 36.3 --- 60.5 56.8 --- --- --- ---
flight crew salaries and expenses cabin crew salaries and expenses
0.0 0.0 0.0 0.0 --- 0.0 0.0 ---
--- --- ---
depreciation of flight equipment
rental of flight equipment amortisation of flight equipment leases
0.0 0.0 0.0 0.0 --- 0.0 0.0 ---
--- --- ---
flight equipment insurance --- --- --- --- --- --- --- --- --- --- ---
station expenses (ground & pax handling) --- --- 0.0
passenger service staff (terminal) ground equipment, property and staff
--- --- --- ---
--- ---
--- --- ---
airport charges (e.g. landing) 29.4 29.4 0.0 -5.0 0.3
en-route & approach air navgn charges --- --- --- ---
all other pax costs ► ► ► ► ► ► ► ► ► ► ► ► 2496.0
column totals 56.4 90.5 356.6 291.1 0.0 1087.4 906.5 -5.0 2496.3 proportion of col. total allocated to phase 0.81 0.09 0.04 0.06 1 0.7 0.3 1 --- --- 1
=> average cost per minute for phase 1.3 15.9 38.3 avg cost per min incl. incurred costs @ B 39.6 54.2
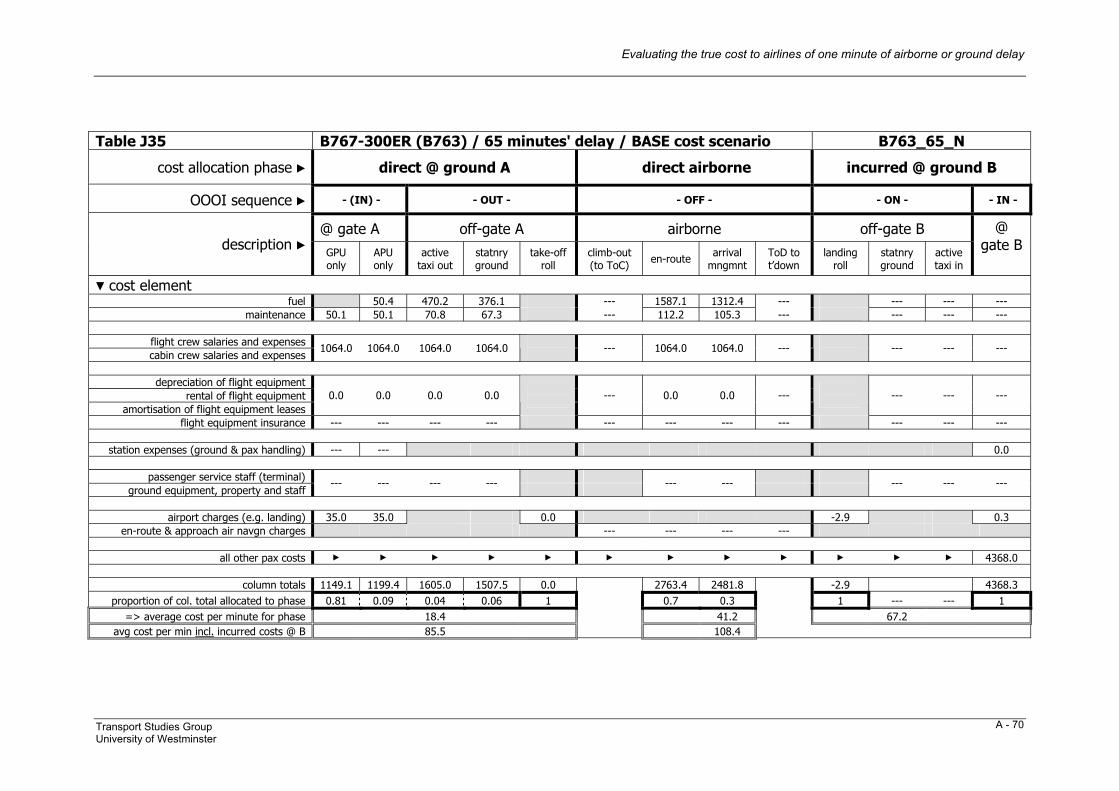
Evaluating the true cost to airlines of one minute of airborne or ground delay
Transport Studies Group University of Westminster
A - 70
Table J35 B767-300ER (B763) / 65 minutes' delay / BASE cost scenario B763_65_N
cost allocation phase ► direct @ ground A direct airborne incurred @ ground B
OOOI sequence ► - (IN) - - OUT - - OFF - - ON - - IN -
@ gate A off-gate A airborne off-gate B description ►
GPU only
APU only
active taxi out
statnry ground
take-off roll
climb-out (to ToC) en-route arrival
mngmnt ToD to t’down
landing roll
statnry ground
active taxi in
@ gate B
▼ cost element fuel 50.4 470.2 376.1 --- 1587.1 1312.4 --- --- --- ---
maintenance 50.1 50.1 70.8 67.3 --- 112.2 105.3 --- --- --- ---
flight crew salaries and expenses cabin crew salaries and expenses
1064.0 1064.0 1064.0 1064.0 --- 1064.0 1064.0 ---
--- --- ---
depreciation of flight equipment
rental of flight equipment amortisation of flight equipment leases
0.0 0.0 0.0 0.0 --- 0.0 0.0 ---
--- --- ---
flight equipment insurance --- --- --- --- --- --- --- --- --- --- ---
station expenses (ground & pax handling) --- --- 0.0
passenger service staff (terminal) ground equipment, property and staff
--- --- --- ---
--- ---
--- --- ---
airport charges (e.g. landing) 35.0 35.0 0.0 -2.9 0.3
en-route & approach air navgn charges --- --- --- ---
all other pax costs ► ► ► ► ► ► ► ► ► ► ► ► 4368.0
column totals 1149.1 1199.4 1605.0 1507.5 0.0 2763.4 2481.8 -2.9 4368.3 proportion of col. total allocated to phase 0.81 0.09 0.04 0.06 1 0.7 0.3 1 --- --- 1
=> average cost per minute for phase 18.4 41.2 67.2 avg cost per min incl. incurred costs @ B 85.5 108.4
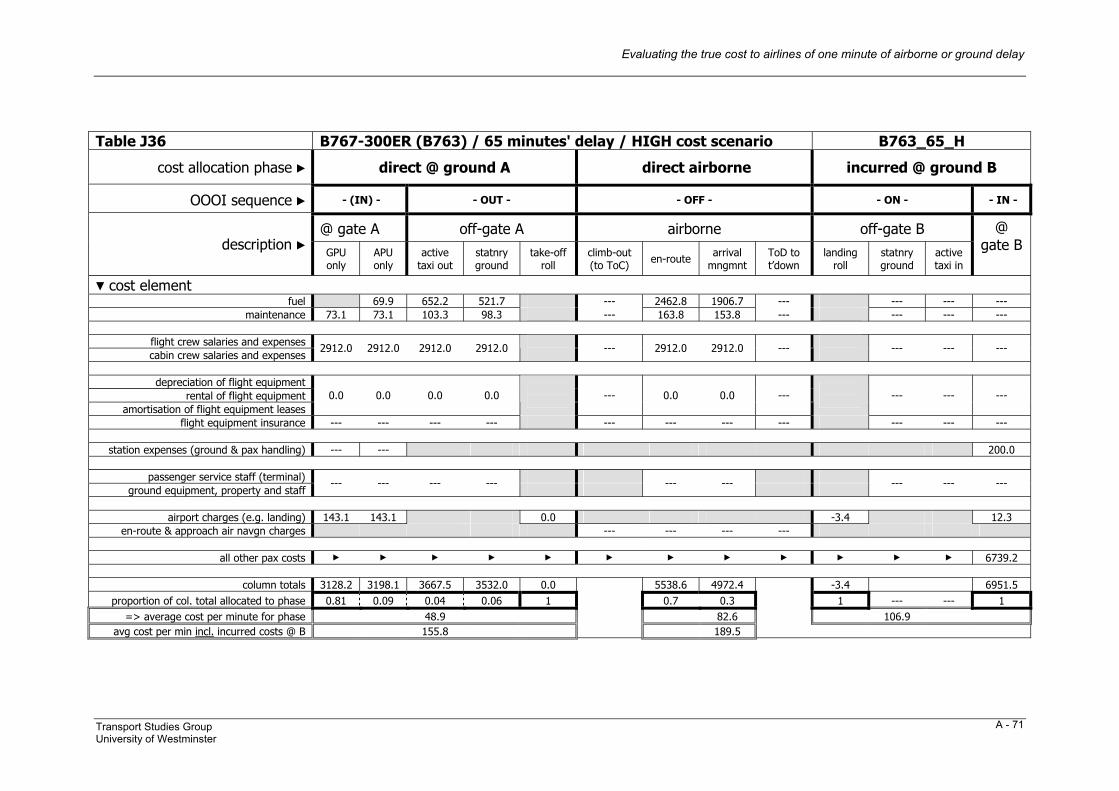
Evaluating the true cost to airlines of one minute of airborne or ground delay
Transport Studies Group University of Westminster
A - 71
Table J36 B767-300ER (B763) / 65 minutes' delay / HIGH cost scenario B763_65_H
cost allocation phase ► direct @ ground A direct airborne incurred @ ground B
OOOI sequence ► - (IN) - - OUT - - OFF - - ON - - IN -
@ gate A off-gate A airborne off-gate B description ►
GPU only
APU only
active taxi out
statnry ground
take-off roll
climb-out (to ToC) en-route arrival
mngmnt ToD to t’down
landing roll
statnry ground
active taxi in
@ gate B
▼ cost element fuel 69.9 652.2 521.7 --- 2462.8 1906.7 --- --- --- ---
maintenance 73.1 73.1 103.3 98.3 --- 163.8 153.8 --- --- --- ---
flight crew salaries and expenses cabin crew salaries and expenses
2912.0 2912.0 2912.0 2912.0 --- 2912.0 2912.0 ---
--- --- ---
depreciation of flight equipment
rental of flight equipment amortisation of flight equipment leases
0.0 0.0 0.0 0.0 --- 0.0 0.0 ---
--- --- ---
flight equipment insurance --- --- --- --- --- --- --- --- --- --- ---
station expenses (ground & pax handling) --- --- 200.0
passenger service staff (terminal) ground equipment, property and staff
--- --- --- ---
--- ---
--- --- ---
airport charges (e.g. landing) 143.1 143.1 0.0 -3.4 12.3
en-route & approach air navgn charges --- --- --- ---
all other pax costs ► ► ► ► ► ► ► ► ► ► ► ► 6739.2
column totals 3128.2 3198.1 3667.5 3532.0 0.0 5538.6 4972.4 -3.4 6951.5 proportion of col. total allocated to phase 0.81 0.09 0.04 0.06 1 0.7 0.3 1 --- --- 1
=> average cost per minute for phase 48.9 82.6 106.9 avg cost per min incl. incurred costs @ B 155.8 189.5

Evaluating the true cost to airlines of one minute of airborne or ground delay
Transport Studies Group University of Westminster
A - 72
Table J37 B747-400 (B744) / 15 minutes' delay / LOW cost scenario B744_15_L
cost allocation phase ► direct @ ground A direct airborne incurred @ ground B
OOOI sequence ► - (IN) - - OUT - - OFF - - ON - - IN -
@ gate A off-gate A airborne off-gate B description ►
GPU only
APU only
active taxi out
statnry ground
take-off roll
climb-out (to ToC) en-route arrival
mngmnt ToD to t’down
landing roll
statnry ground
active taxi in
@ gate B
▼ cost element fuel 14.7 178.5 141.8 --- 497.9 377.9 --- --- --- ---
maintenance 12.8 12.8 18.1 17.3 --- 28.8 27.0 --- --- --- ---
flight crew salaries and expenses cabin crew salaries and expenses
0.0 0.0 0.0 0.0 --- 0.0 0.0 ---
--- --- ---
depreciation of flight equipment
rental of flight equipment amortisation of flight equipment leases
0.0 0.0 0.0 0.0 --- 0.0 0.0 ---
--- --- ---
flight equipment insurance --- --- --- --- --- --- --- --- --- --- ---
station expenses (ground & pax handling) --- --- 0.0
passenger service staff (terminal) ground equipment, property and staff
--- --- --- ---
--- ---
--- --- ---
airport charges (e.g. landing) 27.4 27.4 0.0 -14.6 0.1
en-route & approach air navgn charges --- --- --- ---
all other pax costs ► ► ► ► ► ► ► ► ► ► ► ► 0.0
column totals 40.2 54.9 196.6 159.0 0.0 526.7 404.9 -14.6 0.1 proportion of col. total allocated to phase 0.81 0.09 0.04 0.06 1 0.2 0.8 1 --- --- 1
=> average cost per minute for phase 3.7 28.6 -1.0 avg cost per min incl. incurred costs @ B 2.7 27.6

Evaluating the true cost to airlines of one minute of airborne or ground delay
Transport Studies Group University of Westminster
A - 73
Table J38 B747-400 (B744) / 15 minutes' delay / BASE cost scenario B744_15_N
cost allocation phase ► direct @ ground A direct airborne incurred @ ground B
OOOI sequence ► - (IN) - - OUT - - OFF - - ON - - IN -
@ gate A off-gate A airborne off-gate B description ►
GPU only
APU only
active taxi out
statnry ground
take-off roll
climb-out (to ToC) en-route arrival
mngmnt ToD to t’down
landing roll
statnry ground
active taxi in
@ gate B
▼ cost element fuel 21.7 263.5 209.3 --- 760.2 575.1 --- --- --- ---
maintenance 16.3 16.3 23.1 22.0 --- 36.6 34.4 --- --- --- ---
flight crew salaries and expenses cabin crew salaries and expenses
0.0 0.0 0.0 0.0 --- 0.0 0.0 ---
--- --- ---
depreciation of flight equipment
rental of flight equipment amortisation of flight equipment leases
0.0 0.0 0.0 0.0 --- 0.0 0.0 ---
--- --- ---
flight equipment insurance --- --- --- --- --- --- --- --- --- --- ---
station expenses (ground & pax handling) --- --- 0.0
passenger service staff (terminal) ground equipment, property and staff
--- --- --- ---
--- ---
--- --- ---
airport charges (e.g. landing) 29.3 29.3 0.0 -14.6 0.1
en-route & approach air navgn charges --- --- --- ---
all other pax costs ► ► ► ► ► ► ► ► ► ► ► ► 0.0
column totals 45.7 67.4 286.6 231.2 0.0 796.8 609.5 -14.6 0.1 proportion of col. total allocated to phase 0.81 0.09 0.04 0.06 1 0.2 0.8 1 --- --- 1
=> average cost per minute for phase 4.6 43.1 -1.0 avg cost per min incl. incurred costs @ B 3.6 42.2

Evaluating the true cost to airlines of one minute of airborne or ground delay
Transport Studies Group University of Westminster
A - 74
Table J39 B747-400 (B744) / 15 minutes' delay / HIGH cost scenario B744_15_H
cost allocation phase ► direct @ ground A direct airborne incurred @ ground B
OOOI sequence ► - (IN) - - OUT - - OFF - - ON - - IN -
@ gate A off-gate A airborne off-gate B description ►
GPU only
APU only
active taxi out
statnry ground
take-off roll
climb-out (to ToC) en-route arrival
mngmnt ToD to t’down
landing roll
statnry ground
active taxi in
@ gate B
▼ cost element fuel 30.1 365.5 290.3 --- 1295.2 822.1 --- --- --- ---
maintenance 18.2 18.2 25.8 24.5 --- 40.8 38.3 --- --- --- ---
flight crew salaries and expenses cabin crew salaries and expenses
310.0 310.0 310.0 310.0 --- 310.0 310.0 ---
--- --- ---
depreciation of flight equipment
rental of flight equipment amortisation of flight equipment leases
0.0 0.0 0.0 0.0 --- 0.0 0.0 ---
--- --- ---
flight equipment insurance --- --- --- --- --- --- --- --- --- --- ---
station expenses (ground & pax handling) --- --- 0.0
passenger service staff (terminal) ground equipment, property and staff
--- --- --- ---
--- ---
--- --- ---
airport charges (e.g. landing) 133.0 133.0 0.0 -7.3 4.1
en-route & approach air navgn charges --- --- --- ---
all other pax costs ► ► ► ► ► ► ► ► ► ► ► ► 273.8
column totals 461.3 491.4 701.3 624.8 0.0 1646.1 1170.4 -7.3 277.9 proportion of col. total allocated to phase 0.81 0.09 0.04 0.06 1 0.2 0.8 1 --- --- 1
=> average cost per minute for phase 32.2 84.4 18.0 avg cost per min incl. incurred costs @ B 50.3 102.4
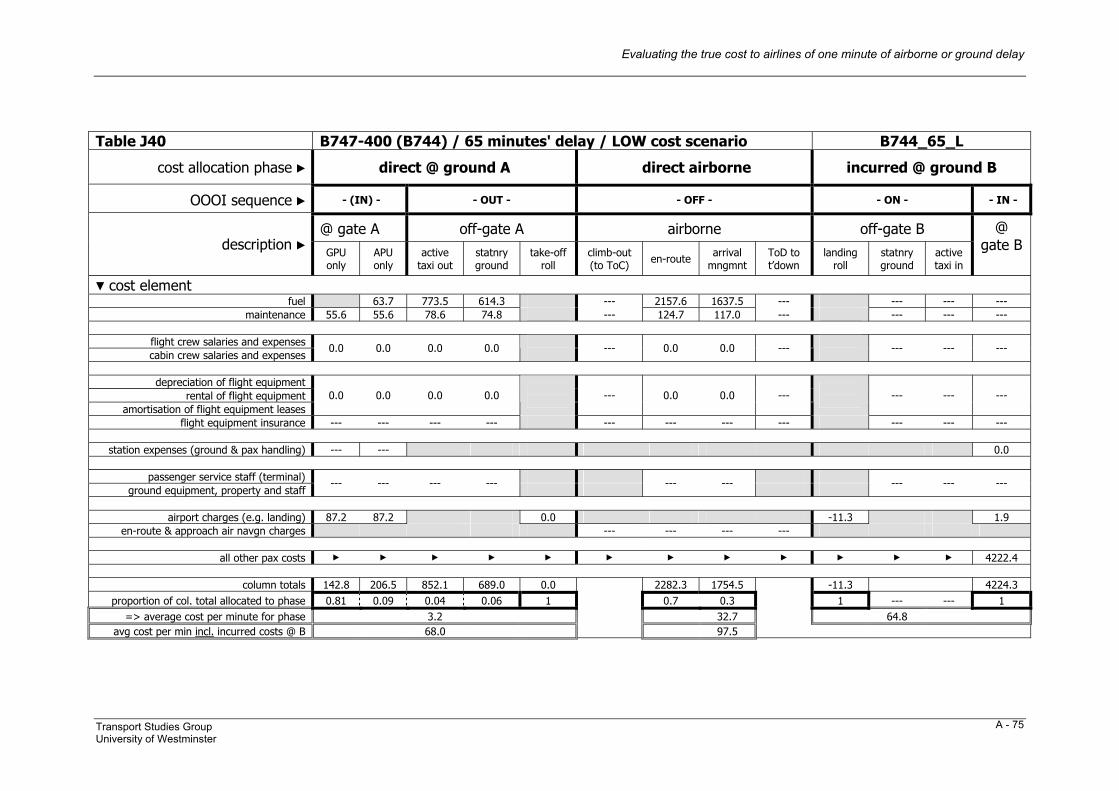
Evaluating the true cost to airlines of one minute of airborne or ground delay
Transport Studies Group University of Westminster
A - 75
Table J40 B747-400 (B744) / 65 minutes' delay / LOW cost scenario B744_65_L
cost allocation phase ► direct @ ground A direct airborne incurred @ ground B
OOOI sequence ► - (IN) - - OUT - - OFF - - ON - - IN -
@ gate A off-gate A airborne off-gate B description ►
GPU only
APU only
active taxi out
statnry ground
take-off roll
climb-out (to ToC) en-route arrival
mngmnt ToD to t’down
landing roll
statnry ground
active taxi in
@ gate B
▼ cost element fuel 63.7 773.5 614.3 --- 2157.6 1637.5 --- --- --- ---
maintenance 55.6 55.6 78.6 74.8 --- 124.7 117.0 --- --- --- ---
flight crew salaries and expenses cabin crew salaries and expenses
0.0 0.0 0.0 0.0 --- 0.0 0.0 ---
--- --- ---
depreciation of flight equipment
rental of flight equipment amortisation of flight equipment leases
0.0 0.0 0.0 0.0 --- 0.0 0.0 ---
--- --- ---
flight equipment insurance --- --- --- --- --- --- --- --- --- --- ---
station expenses (ground & pax handling) --- --- 0.0
passenger service staff (terminal) ground equipment, property and staff
--- --- --- ---
--- ---
--- --- ---
airport charges (e.g. landing) 87.2 87.2 0.0 -11.3 1.9
en-route & approach air navgn charges --- --- --- ---
all other pax costs ► ► ► ► ► ► ► ► ► ► ► ► 4222.4
column totals 142.8 206.5 852.1 689.0 0.0 2282.3 1754.5 -11.3 4224.3 proportion of col. total allocated to phase 0.81 0.09 0.04 0.06 1 0.7 0.3 1 --- --- 1
=> average cost per minute for phase 3.2 32.7 64.8 avg cost per min incl. incurred costs @ B 68.0 97.5

Evaluating the true cost to airlines of one minute of airborne or ground delay
Transport Studies Group University of Westminster
A - 76
Table J41 B747-400 (B744) / 65 minutes' delay / BASE cost scenario B744_65_N
cost allocation phase ► direct @ ground A direct airborne incurred @ ground B
OOOI sequence ► - (IN) - - OUT - - OFF - - ON - - IN -
@ gate A off-gate A airborne off-gate B description ►
GPU only
APU only
active taxi out
statnry ground
take-off roll
climb-out (to ToC) en-route arrival
mngmnt ToD to t’down
landing roll
statnry ground
active taxi in
@ gate B
▼ cost element fuel 94.0 1141.8 906.8 --- 3294.2 2492.2 --- --- --- ---
maintenance 70.8 70.8 100.1 95.2 --- 158.7 148.9 --- --- --- ---
flight crew salaries and expenses cabin crew salaries and expenses
1687.0 1687.0 1687.0 1687.0 --- 1687.0 1687.0 ---
--- --- ---
depreciation of flight equipment
rental of flight equipment amortisation of flight equipment leases
0.0 0.0 0.0 0.0 --- 0.0 0.0 ---
--- --- ---
flight equipment insurance --- --- --- --- --- --- --- --- --- --- ---
station expenses (ground & pax handling) --- --- 0.0
passenger service staff (terminal) ground equipment, property and staff
--- --- --- ---
--- ---
--- --- ---
airport charges (e.g. landing) 99.7 99.7 0.0 -11.3 1.9
en-route & approach air navgn charges --- --- --- ---
all other pax costs ► ► ► ► ► ► ► ► ► ► ► ► 7384.0
column totals 1857.5 1951.5 2928.9 2689.0 0.0 5139.9 4328.1 -11.3 7385.9 proportion of col. total allocated to phase 0.81 0.09 0.04 0.06 1 0.7 0.3 1 --- --- 1
=> average cost per minute for phase 30.1 75.3 113.5 avg cost per min incl. incurred costs @ B 143.6 188.8

Evaluating the true cost to airlines of one minute of airborne or ground delay
Transport Studies Group University of Westminster
A - 77
Table J42 B747-400 (B744) / 65 minutes' delay / HIGH cost scenario B744_65_H
cost allocation phase ► direct @ ground A direct airborne incurred @ ground B
OOOI sequence ► - (IN) - - OUT - - OFF - - ON - - IN -
@ gate A off-gate A airborne off-gate B description ►
GPU only
APU only
active taxi out
statnry ground
take-off roll
climb-out (to ToC) en-route arrival
mngmnt ToD to t’down
landing roll
statnry ground
active taxi in
@ gate B
▼ cost element fuel 130.4 1583.8 1257.8 --- 5612.7 3562.2 --- --- --- ---
maintenance 79.0 79.0 111.7 106.2 --- 177.0 166.1 --- --- --- ---
flight crew salaries and expenses cabin crew salaries and expenses
4617.0 4617.0 4617.0 4617.0 --- 4617.0 4617.0 ---
--- --- ---
depreciation of flight equipment
rental of flight equipment amortisation of flight equipment leases
0.0 0.0 0.0 0.0 --- 0.0 0.0 ---
--- --- ---
flight equipment insurance --- --- --- --- --- --- --- --- --- --- ---
station expenses (ground & pax handling) --- --- 300.0
passenger service staff (terminal) ground equipment, property and staff
--- --- --- ---
--- ---
--- --- ---
airport charges (e.g. landing) 266.6 266.6 0.0 120.0 29.9
en-route & approach air navgn charges --- --- --- ---
all other pax costs ► ► ► ► ► ► ► ► ► ► ► ► 11388.0
column totals 4962.5 5093.0 6312.5 5981.0 0.0 10406.7 8345.3 120.0 11717.9 proportion of col. total allocated to phase 0.81 0.09 0.04 0.06 1 0.7 0.3 1 --- --- 1
=> average cost per minute for phase 78.3 150.6 182.1 avg cost per min incl. incurred costs @ B 260.4 332.7

Evaluating the true cost to airlines of one minute of airborne or ground delay
Transport Studies Group University of Westminster
A - 78
Table J43 A319 (A319) / 15 minutes' delay / LOW cost scenario A319_15_L
cost allocation phase ► direct @ ground A direct airborne incurred @ ground B
OOOI sequence ► - (IN) - - OUT - - OFF - - ON - - IN -
@ gate A off-gate A airborne off-gate B description ►
GPU only
APU only
active taxi out
statnry ground
take-off roll
climb-out (to ToC) en-route arrival
mngmnt ToD to t’down
landing roll
statnry ground
active taxi in
@ gate B
▼ cost element fuel 6.3 37.8 33.1 --- 117.6 94.0 --- --- --- ---
maintenance 4.1 4.1 5.7 5.5 --- 9.1 8.6 --- --- --- ---
flight crew salaries and expenses cabin crew salaries and expenses
0.0 0.0 0.0 0.0 --- 0.0 0.0 ---
--- --- ---
depreciation of flight equipment
rental of flight equipment amortisation of flight equipment leases
0.0 0.0 0.0 0.0 --- 0.0 0.0 ---
--- --- ---
flight equipment insurance --- --- --- --- --- --- --- --- --- --- ---
station expenses (ground & pax handling) --- --- 0.0
passenger service staff (terminal) ground equipment, property and staff
--- --- --- ---
--- ---
--- --- ---
airport charges (e.g. landing) 5.7 5.7 0.0 -1.6 0.0
en-route & approach air navgn charges --- --- --- ---
all other pax costs ► ► ► ► ► ► ► ► ► ► ► ► 0.0
column totals 9.8 16.1 43.5 38.5 0.0 126.7 102.6 -1.6 0.0 proportion of col. total allocated to phase 0.81 0.09 0.04 0.06 1 0.2 0.8 1 --- --- 1
=> average cost per minute for phase 0.9 7.2 -0.1 avg cost per min incl. incurred costs @ B 0.8 7.1

Evaluating the true cost to airlines of one minute of airborne or ground delay
Transport Studies Group University of Westminster
A - 79
Table J44 A319 (A319) / 15 minutes' delay / BASE cost scenario A319_15_N
cost allocation phase ► direct @ ground A direct airborne incurred @ ground B
OOOI sequence ► - (IN) - - OUT - - OFF - - ON - - IN -
@ gate A off-gate A airborne off-gate B description ►
GPU only
APU only
active taxi out
statnry ground
take-off roll
climb-out (to ToC) en-route arrival
mngmnt ToD to t’down
landing roll
statnry ground
active taxi in
@ gate B
▼ cost element fuel 9.3 55.8 48.8 --- 178.6 143.7 --- --- --- ---
maintenance 8.0 8.0 11.3 10.7 --- 17.9 16.8 --- --- --- ---
flight crew salaries and expenses cabin crew salaries and expenses
0.0 0.0 0.0 0.0 --- 0.0 0.0 ---
--- --- ---
depreciation of flight equipment
rental of flight equipment amortisation of flight equipment leases
0.0 0.0 0.0 0.0 --- 0.0 0.0 ---
--- --- ---
flight equipment insurance --- --- --- --- --- --- --- --- --- --- ---
station expenses (ground & pax handling) --- --- 0.0
passenger service staff (terminal) ground equipment, property and staff
--- --- --- ---
--- ---
--- --- ---
airport charges (e.g. landing) 5.8 5.8 0.0 -0.9 0.0
en-route & approach air navgn charges --- --- --- ---
all other pax costs ► ► ► ► ► ► ► ► ► ► ► ► 0.0
column totals 13.8 23.1 67.1 59.6 0.0 196.4 160.5 -0.9 0.0 proportion of col. total allocated to phase 0.81 0.09 0.04 0.06 1 0.2 0.8 1 --- --- 1
=> average cost per minute for phase 1.3 11.2 -0.1 avg cost per min incl. incurred costs @ B 1.2 11.1

Evaluating the true cost to airlines of one minute of airborne or ground delay
Transport Studies Group University of Westminster
A - 80
Table J45 A319 (A319) / 15 minutes' delay / HIGH cost scenario A319_15_H
cost allocation phase ► direct @ ground A direct airborne incurred @ ground B
OOOI sequence ► - (IN) - - OUT - - OFF - - ON - - IN -
@ gate A off-gate A airborne off-gate B description ►
GPU only
APU only
active taxi out
statnry ground
take-off roll
climb-out (to ToC) en-route arrival
mngmnt ToD to t’down
landing roll
statnry ground
active taxi in
@ gate B
▼ cost element fuel 12.9 77.4 67.7 --- 301.1 206.3 --- --- --- ---
maintenance 10.1 10.1 14.3 13.6 --- 22.6 21.2 --- --- --- ---
flight crew salaries and expenses cabin crew salaries and expenses
106.0 106.0 106.0 106.0 --- 106.0 106.0 ---
--- --- ---
depreciation of flight equipment
rental of flight equipment amortisation of flight equipment leases
0.0 0.0 0.0 0.0 --- 0.0 0.0 ---
--- --- ---
flight equipment insurance --- --- --- --- --- --- --- --- --- --- ---
station expenses (ground & pax handling) --- --- 0.0
passenger service staff (terminal) ground equipment, property and staff
--- --- --- ---
--- ---
--- --- ---
airport charges (e.g. landing) 18.5 18.5 0.0 -1.1 0.0
en-route & approach air navgn charges --- --- --- ---
all other pax costs ► ► ► ► ► ► ► ► ► ► ► ► 85.5
column totals 134.6 147.5 197.7 187.3 0.0 429.8 333.5 -1.1 85.5 proportion of col. total allocated to phase 0.81 0.09 0.04 0.06 1 0.2 0.8 1 --- --- 1
=> average cost per minute for phase 9.4 23.5 5.6 avg cost per min incl. incurred costs @ B 15.1 29.1

Evaluating the true cost to airlines of one minute of airborne or ground delay
Transport Studies Group University of Westminster
A - 81
Table J46 A319 (A319) / 65 minutes' delay / LOW cost scenario A319_65_L
cost allocation phase ► direct @ ground A direct airborne incurred @ ground B
OOOI sequence ► - (IN) - - OUT - - OFF - - ON - - IN -
@ gate A off-gate A airborne off-gate B description ►
GPU only
APU only
active taxi out
statnry ground
take-off roll
climb-out (to ToC) en-route arrival
mngmnt ToD to t’down
landing roll
statnry ground
active taxi in
@ gate B
▼ cost element fuel 27.3 163.8 143.3 --- 509.6 407.5 --- --- --- ---
maintenance 17.6 17.6 24.9 23.7 --- 39.5 37.1 --- --- --- ---
flight crew salaries and expenses cabin crew salaries and expenses
0.0 0.0 0.0 0.0 --- 0.0 0.0 ---
--- --- ---
depreciation of flight equipment
rental of flight equipment amortisation of flight equipment leases
0.0 0.0 0.0 0.0 --- 0.0 0.0 ---
--- --- ---
flight equipment insurance --- --- --- --- --- --- --- --- --- --- ---
station expenses (ground & pax handling) --- --- 0.0
passenger service staff (terminal) ground equipment, property and staff
--- --- --- ---
--- ---
--- --- ---
airport charges (e.g. landing) 21.2 21.2 0.0 -1.6 0.3
en-route & approach air navgn charges --- --- --- ---
all other pax costs ► ► ► ► ► ► ► ► ► ► ► ► 1310.4
column totals 38.8 66.1 188.7 167.0 0.0 549.1 444.5 -1.6 1310.7 proportion of col. total allocated to phase 0.81 0.09 0.04 0.06 1 0.7 0.3 1 --- --- 1
=> average cost per minute for phase 0.8 8.0 20.1 avg cost per min incl. incurred costs @ B 21.0 28.1

Evaluating the true cost to airlines of one minute of airborne or ground delay
Transport Studies Group University of Westminster
A - 82
Table J47 A319 (A319) / 65 minutes' delay / BASE cost scenario A319_65_N
cost allocation phase ► direct @ ground A direct airborne incurred @ ground B
OOOI sequence ► - (IN) - - OUT - - OFF - - ON - - IN -
@ gate A off-gate A airborne off-gate B description ►
GPU only
APU only
active taxi out
statnry ground
take-off roll
climb-out (to ToC) en-route arrival
mngmnt ToD to t’down
landing roll
statnry ground
active taxi in
@ gate B
▼ cost element fuel 40.3 241.8 211.6 --- 773.8 622.6 --- --- --- ---
maintenance 34.6 34.6 48.9 46.5 --- 77.5 72.7 --- --- --- ---
flight crew salaries and expenses cabin crew salaries and expenses
577.0 577.0 577.0 577.0 --- 577.0 577.0 ---
--- --- ---
depreciation of flight equipment
rental of flight equipment amortisation of flight equipment leases
0.0 0.0 0.0 0.0 --- 0.0 0.0 ---
--- --- ---
flight equipment insurance --- --- --- --- --- --- --- --- --- --- ---
station expenses (ground & pax handling) --- --- 0.0
passenger service staff (terminal) ground equipment, property and staff
--- --- --- ---
--- ---
--- --- ---
airport charges (e.g. landing) 23.7 23.7 0.0 -0.9 0.3
en-route & approach air navgn charges --- --- --- ---
all other pax costs ► ► ► ► ► ► ► ► ► ► ► ► 2288.0
column totals 635.3 675.6 867.7 835.1 0.0 1428.2 1272.4 -0.9 2288.3 proportion of col. total allocated to phase 0.81 0.09 0.04 0.06 1 0.7 0.3 1 --- --- 1
=> average cost per minute for phase 10.2 21.3 35.2 avg cost per min incl. incurred costs @ B 45.3 56.4

Evaluating the true cost to airlines of one minute of airborne or ground delay
Transport Studies Group University of Westminster
A - 83
Table J48 A319 (A319) / 65 minutes' delay / HIGH cost scenario A319_65_H
cost allocation phase ► direct @ ground A direct airborne incurred @ ground B
OOOI sequence ► - (IN) - - OUT - - OFF - - ON - - IN -
@ gate A off-gate A airborne off-gate B description ►
GPU only
APU only
active taxi out
statnry ground
take-off roll
climb-out (to ToC) en-route arrival
mngmnt ToD to t’down
landing roll
statnry ground
active taxi in
@ gate B
▼ cost element fuel 55.9 335.4 293.5 --- 1304.9 893.9 --- --- --- ---
maintenance 43.7 43.7 61.8 58.8 --- 98.0 92.0 --- --- --- ---
flight crew salaries and expenses cabin crew salaries and expenses
1580.0 1580.0 1580.0 1580.0 --- 1580.0 1580.0 ---
--- --- ---
depreciation of flight equipment
rental of flight equipment amortisation of flight equipment leases
0.0 0.0 0.0 0.0 --- 0.0 0.0 ---
--- --- ---
flight equipment insurance --- --- --- --- --- --- --- --- --- --- ---
station expenses (ground & pax handling) --- --- 160.0
passenger service staff (terminal) ground equipment, property and staff
--- --- --- ---
--- ---
--- --- ---
airport charges (e.g. landing) 92.4 92.4 0.0 -1.1 12.3
en-route & approach air navgn charges --- --- --- ---
all other pax costs ► ► ► ► ► ► ► ► ► ► ► ► 3556.8
column totals 1716.1 1772.0 1977.2 1932.3 0.0 2983.0 2565.9 -1.1 3729.1 proportion of col. total allocated to phase 0.81 0.09 0.04 0.06 1 0.7 0.3 1 --- --- 1
=> average cost per minute for phase 26.8 44.0 57.4 avg cost per min incl. incurred costs @ B 84.2 101.3

Evaluating the true cost to airlines of one minute of airborne or ground delay
Transport Studies Group University of Westminster
A - 84
Table J49 A320 (A320) / 15 minutes' delay / LOW cost scenario A320_15_L
cost allocation phase ► direct @ ground A direct airborne incurred @ ground B
OOOI sequence ► - (IN) - - OUT - - OFF - - ON - - IN -
@ gate A off-gate A airborne off-gate B description ►
GPU only
APU only
active taxi out
statnry ground
take-off roll
climb-out (to ToC) en-route arrival
mngmnt ToD to t’down
landing roll
statnry ground
active taxi in
@ gate B
▼ cost element fuel 6.3 37.8 33.1 --- 119.6 105.1 --- --- --- ---
maintenance 4.1 4.1 5.9 5.6 --- 9.3 8.7 --- --- --- ---
flight crew salaries and expenses cabin crew salaries and expenses
0.0 0.0 0.0 0.0 --- 0.0 0.0 ---
--- --- ---
depreciation of flight equipment
rental of flight equipment amortisation of flight equipment leases
0.0 0.0 0.0 0.0 --- 0.0 0.0 ---
--- --- ---
flight equipment insurance --- --- --- --- --- --- --- --- --- --- ---
station expenses (ground & pax handling) --- --- 0.0
passenger service staff (terminal) ground equipment, property and staff
--- --- --- ---
--- ---
--- --- ---
airport charges (e.g. landing) 6.0 6.0 0.0 -1.9 0.0
en-route & approach air navgn charges --- --- --- ---
all other pax costs ► ► ► ► ► ► ► ► ► ► ► ► 0.0
column totals 10.2 16.5 43.7 38.6 0.0 128.9 113.8 -1.9 0.0 proportion of col. total allocated to phase 0.81 0.09 0.04 0.06 1 0.2 0.8 1 --- --- 1
=> average cost per minute for phase 0.9 7.8 -0.1 avg cost per min incl. incurred costs @ B 0.8 7.7

Evaluating the true cost to airlines of one minute of airborne or ground delay
Transport Studies Group University of Westminster
A - 85
Table J50 A320 (A320) / 15 minutes' delay / BASE cost scenario A320_15_N
cost allocation phase ► direct @ ground A direct airborne incurred @ ground B
OOOI sequence ► - (IN) - - OUT - - OFF - - ON - - IN -
@ gate A off-gate A airborne off-gate B description ►
GPU only
APU only
active taxi out
statnry ground
take-off roll
climb-out (to ToC) en-route arrival
mngmnt ToD to t’down
landing roll
statnry ground
active taxi in
@ gate B
▼ cost element fuel 9.3 55.8 48.8 --- 182.5 160.7 --- --- --- ---
maintenance 7.3 7.3 10.3 9.8 --- 16.3 15.3 --- --- --- ---
flight crew salaries and expenses cabin crew salaries and expenses
0.0 0.0 0.0 0.0 --- 0.0 0.0 ---
--- --- ---
depreciation of flight equipment
rental of flight equipment amortisation of flight equipment leases
0.0 0.0 0.0 0.0 --- 0.0 0.0 ---
--- --- ---
flight equipment insurance --- --- --- --- --- --- --- --- --- --- ---
station expenses (ground & pax handling) --- --- 0.0
passenger service staff (terminal) ground equipment, property and staff
--- --- --- ---
--- ---
--- --- ---
airport charges (e.g. landing) 6.1 6.1 0.0 -1.1 0.0
en-route & approach air navgn charges --- --- --- ---
all other pax costs ► ► ► ► ► ► ► ► ► ► ► ► 0.0
column totals 13.4 22.7 66.1 58.6 0.0 198.9 176.1 -1.1 0.0 proportion of col. total allocated to phase 0.81 0.09 0.04 0.06 1 0.2 0.8 1 --- --- 1
=> average cost per minute for phase 1.3 12.0 -0.1 avg cost per min incl. incurred costs @ B 1.2 12.0

Evaluating the true cost to airlines of one minute of airborne or ground delay
Transport Studies Group University of Westminster
A - 86
Table J51 A320 (A320) / 15 minutes' delay / HIGH cost scenario A320_15_H
cost allocation phase ► direct @ ground A direct airborne incurred @ ground B
OOOI sequence ► - (IN) - - OUT - - OFF - - ON - - IN -
@ gate A off-gate A airborne off-gate B description ►
GPU only
APU only
active taxi out
statnry ground
take-off roll
climb-out (to ToC) en-route arrival
mngmnt ToD to t’down
landing roll
statnry ground
active taxi in
@ gate B
▼ cost element fuel 12.9 77.4 67.7 --- 310.7 231.2 --- --- --- ---
maintenance 10.4 10.4 14.8 14.0 --- 23.4 22.0 --- --- --- ---
flight crew salaries and expenses cabin crew salaries and expenses
112.0 112.0 112.0 112.0 --- 112.0 112.0 ---
--- --- ---
depreciation of flight equipment
rental of flight equipment amortisation of flight equipment leases
0.0 0.0 0.0 0.0 --- 0.0 0.0 ---
--- --- ---
flight equipment insurance --- --- --- --- --- --- --- --- --- --- ---
station expenses (ground & pax handling) --- --- 0.0
passenger service staff (terminal) ground equipment, property and staff
--- --- --- ---
--- ---
--- --- ---
airport charges (e.g. landing) 18.5 18.5 0.0 -1.3 0.0
en-route & approach air navgn charges --- --- --- ---
all other pax costs ► ► ► ► ► ► ► ► ► ► ► ► 104.3
column totals 140.9 153.8 204.2 193.8 0.0 446.1 365.2 -1.3 104.3 proportion of col. total allocated to phase 0.81 0.09 0.04 0.06 1 0.2 0.8 1 --- --- 1
=> average cost per minute for phase 9.9 25.4 6.9 avg cost per min incl. incurred costs @ B 16.7 32.3

Evaluating the true cost to airlines of one minute of airborne or ground delay
Transport Studies Group University of Westminster
A - 87
Table J52 A320 (A320) / 65 minutes' delay / LOW cost scenario A320_65_L
cost allocation phase ► direct @ ground A direct airborne incurred @ ground B
OOOI sequence ► - (IN) - - OUT - - OFF - - ON - - IN -
@ gate A off-gate A airborne off-gate B description ►
GPU only
APU only
active taxi out
statnry ground
take-off roll
climb-out (to ToC) en-route arrival
mngmnt ToD to t’down
landing roll
statnry ground
active taxi in
@ gate B
▼ cost element fuel 27.3 163.8 143.3 --- 518.5 455.5 --- --- --- ---
maintenance 17.9 17.9 25.4 24.1 --- 40.2 37.7 --- --- --- ---
flight crew salaries and expenses cabin crew salaries and expenses
0.0 0.0 0.0 0.0 --- 0.0 0.0 ---
--- --- ---
depreciation of flight equipment
rental of flight equipment amortisation of flight equipment leases
0.0 0.0 0.0 0.0 --- 0.0 0.0 ---
--- --- ---
flight equipment insurance --- --- --- --- --- --- --- --- --- --- ---
station expenses (ground & pax handling) --- --- 0.0
passenger service staff (terminal) ground equipment, property and staff
--- --- --- ---
--- ---
--- --- ---
airport charges (e.g. landing) 22.0 22.0 0.0 -1.9 0.3
en-route & approach air navgn charges --- --- --- ---
all other pax costs ► ► ► ► ► ► ► ► ► ► ► ► 1601.6
column totals 40.0 67.3 189.2 167.5 0.0 558.7 493.2 -1.9 1601.9 proportion of col. total allocated to phase 0.81 0.09 0.04 0.06 1 0.7 0.3 1 --- --- 1
=> average cost per minute for phase 0.9 8.3 24.6 avg cost per min incl. incurred costs @ B 25.5 32.9

Evaluating the true cost to airlines of one minute of airborne or ground delay
Transport Studies Group University of Westminster
A - 88
Table J53 A320 (A320) / 65 minutes' delay / BASE cost scenario A320_65_N
cost allocation phase ► direct @ ground A direct airborne incurred @ ground B
OOOI sequence ► - (IN) - - OUT - - OFF - - ON - - IN -
@ gate A off-gate A airborne off-gate B description ►
GPU only
APU only
active taxi out
statnry ground
take-off roll
climb-out (to ToC) en-route arrival
mngmnt ToD to t’down
landing roll
statnry ground
active taxi in
@ gate B
▼ cost element fuel 40.3 241.8 211.6 --- 790.9 696.5 --- --- --- ---
maintenance 31.6 31.6 44.7 42.5 --- 70.8 66.5 --- --- --- ---
flight crew salaries and expenses cabin crew salaries and expenses
608.0 608.0 608.0 608.0 --- 608.0 608.0 ---
--- --- ---
depreciation of flight equipment
rental of flight equipment amortisation of flight equipment leases
0.0 0.0 0.0 0.0 --- 0.0 0.0 ---
--- --- ---
flight equipment insurance --- --- --- --- --- --- --- --- --- --- ---
station expenses (ground & pax handling) --- --- 0.0
passenger service staff (terminal) ground equipment, property and staff
--- --- --- ---
--- ---
--- --- ---
airport charges (e.g. landing) 24.8 24.8 0.0 -1.1 0.3
en-route & approach air navgn charges --- --- --- ---
all other pax costs ► ► ► ► ► ► ► ► ► ► ► ► 2808.0
column totals 664.4 704.7 894.5 862.1 0.0 1469.7 1371.0 -1.1 2808.3 proportion of col. total allocated to phase 0.81 0.09 0.04 0.06 1 0.7 0.3 1 --- --- 1
=> average cost per minute for phase 10.6 22.2 43.2 avg cost per min incl. incurred costs @ B 53.8 65.3

Evaluating the true cost to airlines of one minute of airborne or ground delay
Transport Studies Group University of Westminster
A - 89
Table J54 A320 (A320) / 65 minutes' delay / HIGH cost scenario A320_65_H
cost allocation phase ► direct @ ground A direct airborne incurred @ ground B
OOOI sequence ► - (IN) - - OUT - - OFF - - ON - - IN -
@ gate A off-gate A airborne off-gate B description ►
GPU only
APU only
active taxi out
statnry ground
take-off roll
climb-out (to ToC) en-route arrival
mngmnt ToD to t’down
landing roll
statnry ground
active taxi in
@ gate B
▼ cost element fuel 55.9 335.4 293.5 --- 1346.5 1002.0 --- --- --- ---
maintenance 45.3 45.3 64.0 60.9 --- 101.4 95.2 --- --- --- ---
flight crew salaries and expenses cabin crew salaries and expenses
1664.0 1664.0 1664.0 1664.0 --- 1664.0 1664.0 ---
--- --- ---
depreciation of flight equipment
rental of flight equipment amortisation of flight equipment leases
0.0 0.0 0.0 0.0 --- 0.0 0.0 ---
--- --- ---
flight equipment insurance --- --- --- --- --- --- --- --- --- --- ---
station expenses (ground & pax handling) --- --- 120.0
passenger service staff (terminal) ground equipment, property and staff
--- --- --- ---
--- ---
--- --- ---
airport charges (e.g. landing) 92.4 92.4 0.0 -1.3 12.3
en-route & approach air navgn charges --- --- --- ---
all other pax costs ► ► ► ► ► ► ► ► ► ► ► ► 4336.8
column totals 1801.6 1857.5 2063.4 2018.3 0.0 3111.9 2761.2 -1.3 4469.1 proportion of col. total allocated to phase 0.81 0.09 0.04 0.06 1 0.7 0.3 1 --- --- 1
=> average cost per minute for phase 28.2 46.3 68.7 avg cost per min incl. incurred costs @ B 96.9 115.0

Evaluating the true cost to airlines of one minute of airborne or ground delay
Transport Studies Group University of Westminster
A - 90
Table J55 A321 (A321) / 15 minutes' delay / LOW cost scenario A321_15_L
cost allocation phase ► direct @ ground A direct airborne incurred @ ground B
OOOI sequence ► - (IN) - - OUT - - OFF - - ON - - IN -
@ gate A off-gate A airborne off-gate B description ►
GPU only
APU only
active taxi out
statnry ground
take-off roll
climb-out (to ToC) en-route arrival
mngmnt ToD to t’down
landing roll
statnry ground
active taxi in
@ gate B
▼ cost element fuel 6.3 44.1 38.3 --- 141.5 132.5 --- --- --- ---
maintenance 4.8 4.8 6.8 6.5 --- 10.9 10.2 --- --- --- ---
flight crew salaries and expenses cabin crew salaries and expenses
0.0 0.0 0.0 0.0 --- 0.0 0.0 ---
--- --- ---
depreciation of flight equipment
rental of flight equipment amortisation of flight equipment leases
0.0 0.0 0.0 0.0 --- 0.0 0.0 ---
--- --- ---
flight equipment insurance --- --- --- --- --- --- --- --- --- --- ---
station expenses (ground & pax handling) --- --- 0.0
passenger service staff (terminal) ground equipment, property and staff
--- --- --- ---
--- ---
--- --- ---
airport charges (e.g. landing) 6.6 6.6 0.0 -2.3 0.0
en-route & approach air navgn charges --- --- --- ---
all other pax costs ► ► ► ► ► ► ► ► ► ► ► ► 0.0
column totals 11.4 17.7 50.9 44.8 0.0 152.3 142.7 -2.3 0.0 proportion of col. total allocated to phase 0.81 0.09 0.04 0.06 1 0.2 0.8 1 --- --- 1
=> average cost per minute for phase 1.0 9.6 -0.2 avg cost per min incl. incurred costs @ B 0.9 9.5

Evaluating the true cost to airlines of one minute of airborne or ground delay
Transport Studies Group University of Westminster
A - 91
Table J56 A321 (A321) / 15 minutes' delay / BASE cost scenario A321_15_N
cost allocation phase ► direct @ ground A direct airborne incurred @ ground B
OOOI sequence ► - (IN) - - OUT - - OFF - - ON - - IN -
@ gate A off-gate A airborne off-gate B description ►
GPU only
APU only
active taxi out
statnry ground
take-off roll
climb-out (to ToC) en-route arrival
mngmnt ToD to t’down
landing roll
statnry ground
active taxi in
@ gate B
▼ cost element fuel 9.3 65.1 56.6 --- 216.1 203.4 --- --- --- ---
maintenance 8.7 8.7 12.2 11.7 --- 19.4 18.2 --- --- --- ---
flight crew salaries and expenses cabin crew salaries and expenses
0.0 0.0 0.0 0.0 --- 0.0 0.0 ---
--- --- ---
depreciation of flight equipment
rental of flight equipment amortisation of flight equipment leases
0.0 0.0 0.0 0.0 --- 0.0 0.0 ---
--- --- ---
flight equipment insurance --- --- --- --- --- --- --- --- --- --- ---
station expenses (ground & pax handling) --- --- 0.0
passenger service staff (terminal) ground equipment, property and staff
--- --- --- ---
--- ---
--- --- ---
airport charges (e.g. landing) 6.7 6.7 0.0 -1.3 0.0
en-route & approach air navgn charges --- --- --- ---
all other pax costs ► ► ► ► ► ► ► ► ► ► ► ► 0.0
column totals 15.4 24.7 77.3 68.2 0.0 235.5 221.7 -1.3 0.0 proportion of col. total allocated to phase 0.81 0.09 0.04 0.06 1 0.2 0.8 1 --- --- 1
=> average cost per minute for phase 1.5 15.0 -0.1 avg cost per min incl. incurred costs @ B 1.4 14.9

Evaluating the true cost to airlines of one minute of airborne or ground delay
Transport Studies Group University of Westminster
A - 92
Table J57 A321 (A321) / 15 minutes' delay / HIGH cost scenario A321_15_H
cost allocation phase ► direct @ ground A direct airborne incurred @ ground B
OOOI sequence ► - (IN) - - OUT - - OFF - - ON - - IN -
@ gate A off-gate A airborne off-gate B description ►
GPU only
APU only
active taxi out
statnry ground
take-off roll
climb-out (to ToC) en-route arrival
mngmnt ToD to t’down
landing roll
statnry ground
active taxi in
@ gate B
▼ cost element fuel 12.9 90.3 78.5 --- 350.5 293.3 --- --- --- ---
maintenance 10.7 10.7 15.2 14.4 --- 24.0 22.5 --- --- --- ---
flight crew salaries and expenses cabin crew salaries and expenses
106.0 106.0 106.0 106.0 --- 106.0 106.0 ---
--- --- ---
depreciation of flight equipment
rental of flight equipment amortisation of flight equipment leases
0.0 0.0 0.0 0.0 --- 0.0 0.0 ---
--- --- ---
flight equipment insurance --- --- --- --- --- --- --- --- --- --- ---
station expenses (ground & pax handling) --- --- 0.0
passenger service staff (terminal) ground equipment, property and staff
--- --- --- ---
--- ---
--- --- ---
airport charges (e.g. landing) 21.4 21.4 0.0 -1.6 0.0
en-route & approach air navgn charges --- --- --- ---
all other pax costs ► ► ► ► ► ► ► ► ► ► ► ► 111.8
column totals 138.1 151.0 211.5 198.9 0.0 480.5 421.8 -1.6 111.8 proportion of col. total allocated to phase 0.81 0.09 0.04 0.06 1 0.2 0.8 1 --- --- 1
=> average cost per minute for phase 9.7 28.9 7.3 avg cost per min incl. incurred costs @ B 17.1 36.2

Evaluating the true cost to airlines of one minute of airborne or ground delay
Transport Studies Group University of Westminster
A - 93
Table J58 A321 (A321) / 65 minutes' delay / LOW cost scenario A321_65_L
cost allocation phase ► direct @ ground A direct airborne incurred @ ground B
OOOI sequence ► - (IN) - - OUT - - OFF - - ON - - IN -
@ gate A off-gate A airborne off-gate B description ►
GPU only
APU only
active taxi out
statnry ground
take-off roll
climb-out (to ToC) en-route arrival
mngmnt ToD to t’down
landing roll
statnry ground
active taxi in
@ gate B
▼ cost element fuel 27.3 191.1 166.1 --- 613.1 574.2 --- --- --- ---
maintenance 21.0 21.0 29.7 28.2 --- 47.0 44.1 --- --- --- ---
flight crew salaries and expenses cabin crew salaries and expenses
0.0 0.0 0.0 0.0 --- 0.0 0.0 ---
--- --- ---
depreciation of flight equipment
rental of flight equipment amortisation of flight equipment leases
0.0 0.0 0.0 0.0 --- 0.0 0.0 ---
--- --- ---
flight equipment insurance --- --- --- --- --- --- --- --- --- --- ---
station expenses (ground & pax handling) --- --- 0.0
passenger service staff (terminal) ground equipment, property and staff
--- --- --- ---
--- ---
--- --- ---
airport charges (e.g. landing) 23.7 23.7 0.0 -2.3 0.3
en-route & approach air navgn charges --- --- --- ---
all other pax costs ► ► ► ► ► ► ► ► ► ► ► ► 1726.4
column totals 44.7 72.0 220.8 194.3 0.0 660.1 618.3 -2.3 1726.7 proportion of col. total allocated to phase 0.81 0.09 0.04 0.06 1 0.7 0.3 1 --- --- 1
=> average cost per minute for phase 1.0 10.0 26.5 avg cost per min incl. incurred costs @ B 27.5 36.5

Evaluating the true cost to airlines of one minute of airborne or ground delay
Transport Studies Group University of Westminster
A - 94
Table J59 A321 (A321) / 65 minutes' delay / BASE cost scenario A321_65_N
cost allocation phase ► direct @ ground A direct airborne incurred @ ground B
OOOI sequence ► - (IN) - - OUT - - OFF - - ON - - IN -
@ gate A off-gate A airborne off-gate B description ►
GPU only
APU only
active taxi out
statnry ground
take-off roll
climb-out (to ToC) en-route arrival
mngmnt ToD to t’down
landing roll
statnry ground
active taxi in
@ gate B
▼ cost element fuel 40.3 282.1 245.2 --- 936.3 881.6 --- --- --- ---
maintenance 37.5 37.5 53.1 50.5 --- 84.1 79.0 --- --- --- ---
flight crew salaries and expenses cabin crew salaries and expenses
577.0 577.0 577.0 577.0 --- 577.0 577.0 ---
--- --- ---
depreciation of flight equipment
rental of flight equipment amortisation of flight equipment leases
0.0 0.0 0.0 0.0 --- 0.0 0.0 ---
--- --- ---
flight equipment insurance --- --- --- --- --- --- --- --- --- --- ---
station expenses (ground & pax handling) --- --- 0.0
passenger service staff (terminal) ground equipment, property and staff
--- --- --- ---
--- ---
--- --- ---
airport charges (e.g. landing) 26.9 26.9 0.0 -1.3 0.3
en-route & approach air navgn charges --- --- --- ---
all other pax costs ► ► ► ► ► ► ► ► ► ► ► ► 3016.0
column totals 641.5 681.8 912.2 872.6 0.0 1597.4 1537.5 -1.3 3016.3 proportion of col. total allocated to phase 0.81 0.09 0.04 0.06 1 0.7 0.3 1 --- --- 1
=> average cost per minute for phase 10.3 24.3 46.4 avg cost per min incl. incurred costs @ B 56.7 70.7

Evaluating the true cost to airlines of one minute of airborne or ground delay
Transport Studies Group University of Westminster
A - 95
Table J60 A321 (A321) / 65 minutes' delay / HIGH cost scenario A321_65_H
cost allocation phase ► direct @ ground A direct airborne incurred @ ground B
OOOI sequence ► - (IN) - - OUT - - OFF - - ON - - IN -
@ gate A off-gate A airborne off-gate B description ►
GPU only
APU only
active taxi out
statnry ground
take-off roll
climb-out (to ToC) en-route arrival
mngmnt ToD to t’down
landing roll
statnry ground
active taxi in
@ gate B
▼ cost element fuel 55.9 391.3 340.1 --- 1518.6 1270.8 --- --- --- ---
maintenance 46.4 46.4 65.7 62.5 --- 104.1 97.7 --- --- --- ---
flight crew salaries and expenses cabin crew salaries and expenses
1580.0 1580.0 1580.0 1580.0 --- 1580.0 1580.0 ---
--- --- ---
depreciation of flight equipment
rental of flight equipment amortisation of flight equipment leases
0.0 0.0 0.0 0.0 --- 0.0 0.0 ---
--- --- ---
flight equipment insurance --- --- --- --- --- --- --- --- --- --- ---
station expenses (ground & pax handling) --- --- 160.0
passenger service staff (terminal) ground equipment, property and staff
--- --- --- ---
--- ---
--- --- ---
airport charges (e.g. landing) 92.4 92.4 0.0 -1.6 12.3
en-route & approach air navgn charges --- --- --- ---
all other pax costs ► ► ► ► ► ► ► ► ► ► ► ► 4648.8
column totals 1718.8 1774.7 2037.0 1982.5 0.0 3202.7 2948.5 -1.6 4821.1 proportion of col. total allocated to phase 0.81 0.09 0.04 0.06 1 0.7 0.3 1 --- --- 1
=> average cost per minute for phase 27.0 48.1 74.1 avg cost per min incl. incurred costs @ B 101.1 122.2

Evaluating the true cost to airlines of one minute of airborne or ground delay
Transport Studies Group University of Westminster
A - 96
Table J61 ATR42 (AT43) / 15 minutes' delay / LOW cost scenario AT43_15_L
cost allocation phase ► direct @ ground A direct airborne incurred @ ground B
OOOI sequence ► - (IN) - - OUT - - OFF - - ON - - IN -
@ gate A off-gate A airborne off-gate B description ►
GPU only
APU only
active taxi out
statnry ground
take-off roll
climb-out (to ToC) en-route arrival
mngmnt ToD to t’down
landing roll
statnry ground
active taxi in
@ gate B
▼ cost element fuel 5.0 6.3 5.4 --- 22.0 20.1 --- --- --- ---
maintenance 2.1 2.1 3.0 2.9 --- 4.8 4.5 --- --- --- ---
flight crew salaries and expenses cabin crew salaries and expenses
0.0 0.0 0.0 0.0 --- 0.0 0.0 ---
--- --- ---
depreciation of flight equipment
rental of flight equipment amortisation of flight equipment leases
0.0 0.0 0.0 0.0 --- 0.0 0.0 ---
--- --- ---
flight equipment insurance --- --- --- --- --- --- --- --- --- --- ---
station expenses (ground & pax handling) --- --- 0.0
passenger service staff (terminal) ground equipment, property and staff
--- --- --- ---
--- ---
--- --- ---
airport charges (e.g. landing) 4.0 4.0 0.0 -0.3 0.0
en-route & approach air navgn charges --- --- --- ---
all other pax costs ► ► ► ► ► ► ► ► ► ► ► ► 0.0
column totals 6.1 11.1 9.3 8.2 0.0 26.8 24.5 -0.3 0.0 proportion of col. total allocated to phase 0.81 0.09 0.04 0.06 1 0.2 0.8 1 --- --- 1
=> average cost per minute for phase 0.5 1.7 0.0 avg cost per min incl. incurred costs @ B 0.4 1.6

Evaluating the true cost to airlines of one minute of airborne or ground delay
Transport Studies Group University of Westminster
A - 97
Table J62 ATR42 (AT43) / 15 minutes' delay / BASE cost scenario AT43_15_N
cost allocation phase ► direct @ ground A direct airborne incurred @ ground B
OOOI sequence ► - (IN) - - OUT - - OFF - - ON - - IN -
@ gate A off-gate A airborne off-gate B description ►
GPU only
APU only
active taxi out
statnry ground
take-off roll
climb-out (to ToC) en-route arrival
mngmnt ToD to t’down
landing roll
statnry ground
active taxi in
@ gate B
▼ cost element fuel 7.4 9.3 7.9 --- 33.6 30.4 --- --- --- ---
maintenance 3.8 3.8 5.4 5.1 --- 8.6 8.0 --- --- --- ---
flight crew salaries and expenses cabin crew salaries and expenses
0.0 0.0 0.0 0.0 --- 0.0 0.0 ---
--- --- ---
depreciation of flight equipment
rental of flight equipment amortisation of flight equipment leases
0.0 0.0 0.0 0.0 --- 0.0 0.0 ---
--- --- ---
flight equipment insurance --- --- --- --- --- --- --- --- --- --- ---
station expenses (ground & pax handling) --- --- 0.0
passenger service staff (terminal) ground equipment, property and staff
--- --- --- ---
--- ---
--- --- ---
airport charges (e.g. landing) 4.0 4.0 0.0 -0.2 0.0
en-route & approach air navgn charges --- --- --- ---
all other pax costs ► ► ► ► ► ► ► ► ► ► ► ► 0.0
column totals 7.8 15.2 14.7 13.0 0.0 42.1 38.4 -0.2 0.0 proportion of col. total allocated to phase 0.81 0.09 0.04 0.06 1 0.2 0.8 1 --- --- 1
=> average cost per minute for phase 0.6 2.6 0.0 avg cost per min incl. incurred costs @ B 0.6 2.6

Evaluating the true cost to airlines of one minute of airborne or ground delay
Transport Studies Group University of Westminster
A - 98
Table J63 ATR42 (AT43) / 15 minutes' delay / HIGH cost scenario AT43_15_H
cost allocation phase ► direct @ ground A direct airborne incurred @ ground B
OOOI sequence ► - (IN) - - OUT - - OFF - - ON - - IN -
@ gate A off-gate A airborne off-gate B description ►
GPU only
APU only
active taxi out
statnry ground
take-off roll
climb-out (to ToC) en-route arrival
mngmnt ToD to t’down
landing roll
statnry ground
active taxi in
@ gate B
▼ cost element fuel 10.2 12.9 11.0 --- 55.7 43.4 --- --- --- ---
maintenance 4.7 4.7 6.7 6.3 --- 10.6 9.9 --- --- --- ---
flight crew salaries and expenses cabin crew salaries and expenses
75.0 75.0 75.0 75.0 --- 75.0 75.0 ---
--- --- ---
depreciation of flight equipment
rental of flight equipment amortisation of flight equipment leases
0.0 0.0 0.0 0.0 --- 0.0 0.0 ---
--- --- ---
flight equipment insurance --- --- --- --- --- --- --- --- --- --- ---
station expenses (ground & pax handling) --- --- 0.0
passenger service staff (terminal) ground equipment, property and staff
--- --- --- ---
--- ---
--- --- ---
airport charges (e.g. landing) 18.5 18.5 0.0 -0.3 0.0
en-route & approach air navgn charges --- --- --- ---
all other pax costs ► ► ► ► ► ► ► ► ► ► ► ► 30.8
column totals 98.2 108.4 94.6 92.3 0.0 141.3 128.4 -0.3 30.8 proportion of col. total allocated to phase 0.81 0.09 0.04 0.06 1 0.2 0.8 1 --- --- 1
=> average cost per minute for phase 6.6 8.7 2.0 avg cost per min incl. incurred costs @ B 8.6 10.8

Evaluating the true cost to airlines of one minute of airborne or ground delay
Transport Studies Group University of Westminster
A - 99
Table J64 ATR42 (AT43) / 65 minutes' delay / LOW cost scenario AT43_65_L
cost allocation phase ► direct @ ground A direct airborne incurred @ ground B
OOOI sequence ► - (IN) - - OUT - - OFF - - ON - - IN -
@ gate A off-gate A airborne off-gate B description ►
GPU only
APU only
active taxi out
statnry ground
take-off roll
climb-out (to ToC) en-route arrival
mngmnt ToD to t’down
landing roll
statnry ground
active taxi in
@ gate B
▼ cost element fuel 21.6 27.3 23.2 --- 95.3 86.9 --- --- --- ---
maintenance 9.2 9.2 13.1 12.4 --- 20.7 19.4 --- --- --- ---
flight crew salaries and expenses cabin crew salaries and expenses
0.0 0.0 0.0 0.0 --- 0.0 0.0 ---
--- --- ---
depreciation of flight equipment
rental of flight equipment amortisation of flight equipment leases
0.0 0.0 0.0 0.0 --- 0.0 0.0 ---
--- --- ---
flight equipment insurance --- --- --- --- --- --- --- --- --- --- ---
station expenses (ground & pax handling) --- --- 0.0
passenger service staff (terminal) ground equipment, property and staff
--- --- --- ---
--- ---
--- --- ---
airport charges (e.g. landing) 17.2 17.2 0.2 -0.2 0.3
en-route & approach air navgn charges --- --- --- ---
all other pax costs ► ► ► ► ► ► ► ► ► ► ► ► 478.4
column totals 26.4 48.0 40.4 35.6 0.2 116.0 106.3 -0.2 478.7 proportion of col. total allocated to phase 0.81 0.09 0.04 0.06 1 0.7 0.3 1 --- --- 1
=> average cost per minute for phase 0.5 1.7 7.4 avg cost per min incl. incurred costs @ B 7.8 9.1

Evaluating the true cost to airlines of one minute of airborne or ground delay
Transport Studies Group University of Westminster
A - 100
Table J65 ATR42 (AT43) / 65 minutes' delay / BASE cost scenario AT43_65_N
cost allocation phase ► direct @ ground A direct airborne incurred @ ground B
OOOI sequence ► - (IN) - - OUT - - OFF - - ON - - IN -
@ gate A off-gate A airborne off-gate B description ►
GPU only
APU only
active taxi out
statnry ground
take-off roll
climb-out (to ToC) en-route arrival
mngmnt ToD to t’down
landing roll
statnry ground
active taxi in
@ gate B
▼ cost element fuel 31.9 40.3 34.3 --- 145.4 131.6 --- --- --- ---
maintenance 16.6 16.6 23.4 22.3 --- 37.1 34.8 --- --- --- ---
flight crew salaries and expenses cabin crew salaries and expenses
411.0 411.0 411.0 411.0 --- 411.0 411.0 ---
--- --- ---
depreciation of flight equipment
rental of flight equipment amortisation of flight equipment leases
0.0 0.0 0.0 0.0 --- 0.0 0.0 ---
--- --- ---
flight equipment insurance --- --- --- --- --- --- --- --- --- --- ---
station expenses (ground & pax handling) --- --- 0.0
passenger service staff (terminal) ground equipment, property and staff
--- --- --- ---
--- ---
--- --- ---
airport charges (e.g. landing) 18.2 18.2 0.2 0.0 0.3
en-route & approach air navgn charges --- --- --- ---
all other pax costs ► ► ► ► ► ► ► ► ► ► ► ► 832.0
column totals 445.8 477.7 474.7 467.5 0.2 593.5 577.5 0.0 832.3 proportion of col. total allocated to phase 0.81 0.09 0.04 0.06 1 0.7 0.3 1 --- --- 1
=> average cost per minute for phase 6.9 9.1 12.8 avg cost per min incl. incurred costs @ B 19.7 21.9

Evaluating the true cost to airlines of one minute of airborne or ground delay
Transport Studies Group University of Westminster
A - 101
Table J66 ATR42 (AT43) / 65 minutes' delay / HIGH cost scenario AT43_65_H
cost allocation phase ► direct @ ground A direct airborne incurred @ ground B
OOOI sequence ► - (IN) - - OUT - - OFF - - ON - - IN -
@ gate A off-gate A airborne off-gate B description ►
GPU only
APU only
active taxi out
statnry ground
take-off roll
climb-out (to ToC) en-route arrival
mngmnt ToD to t’down
landing roll
statnry ground
active taxi in
@ gate B
▼ cost element fuel 44.3 55.9 47.5 --- 241.5 188.2 --- --- --- ---
maintenance 20.5 20.5 28.9 27.5 --- 45.8 43.0 --- --- --- ---
flight crew salaries and expenses cabin crew salaries and expenses
1127.0 1127.0 1127.0 1127.0 --- 1127.0 1127.0 ---
--- --- ---
depreciation of flight equipment
rental of flight equipment amortisation of flight equipment leases
0.0 0.0 0.0 0.0 --- 0.0 0.0 ---
--- --- ---
flight equipment insurance --- --- --- --- --- --- --- --- --- --- ---
station expenses (ground & pax handling) --- --- 90.0
passenger service staff (terminal) ground equipment, property and staff
--- --- --- ---
--- ---
--- --- ---
airport charges (e.g. landing) 92.4 92.4 5.7 5.7 12.3
en-route & approach air navgn charges --- --- --- ---
all other pax costs ► ► ► ► ► ► ► ► ► ► ► ► 1279.2
column totals 1239.8 1284.1 1211.8 1202.0 5.7 1414.4 1358.2 5.7 1381.5 proportion of col. total allocated to phase 0.81 0.09 0.04 0.06 1 0.7 0.3 1 --- --- 1
=> average cost per minute for phase 19.2 21.5 21.3 avg cost per min incl. incurred costs @ B 40.5 42.8

Evaluating the true cost to airlines of one minute of airborne or ground delay
Transport Studies Group University of Westminster
A - 102
Table J67 ATR72 (AT72) / 15 minutes' delay / LOW cost scenario AT72_15_L
cost allocation phase ► direct @ ground A direct airborne incurred @ ground B
OOOI sequence ► - (IN) - - OUT - - OFF - - ON - - IN -
@ gate A off-gate A airborne off-gate B description ►
GPU only
APU only
active taxi out
statnry ground
take-off roll
climb-out (to ToC) en-route arrival
mngmnt ToD to t’down
landing roll
statnry ground
active taxi in
@ gate B
▼ cost element fuel 5.0 15.8 12.6 --- 33.0 26.1 --- --- --- ---
maintenance 2.6 2.6 3.7 3.5 --- 5.9 5.5 --- --- --- ---
flight crew salaries and expenses cabin crew salaries and expenses
0.0 0.0 0.0 0.0 --- 0.0 0.0 ---
--- --- ---
depreciation of flight equipment
rental of flight equipment amortisation of flight equipment leases
0.0 0.0 0.0 0.0 --- 0.0 0.0 ---
--- --- ---
flight equipment insurance --- --- --- --- --- --- --- --- --- --- ---
station expenses (ground & pax handling) --- --- 0.0
passenger service staff (terminal) ground equipment, property and staff
--- --- --- ---
--- ---
--- --- ---
airport charges (e.g. landing) 4.1 4.1 0.0 -0.4 0.0
en-route & approach air navgn charges --- --- --- ---
all other pax costs ► ► ► ► ► ► ► ► ► ► ► ► 0.0
column totals 6.8 11.7 19.5 16.1 0.0 38.9 31.7 -0.4 0.0 proportion of col. total allocated to phase 0.81 0.09 0.04 0.06 1 0.2 0.8 1 --- --- 1
=> average cost per minute for phase 0.6 2.2 0.0 avg cost per min incl. incurred costs @ B 0.5 2.2

Evaluating the true cost to airlines of one minute of airborne or ground delay
Transport Studies Group University of Westminster
A - 103
Table J68 ATR72 (AT72) / 15 minutes' delay / BASE cost scenario AT72_15_N
cost allocation phase ► direct @ ground A direct airborne incurred @ ground B
OOOI sequence ► - (IN) - - OUT - - OFF - - ON - - IN -
@ gate A off-gate A airborne off-gate B description ►
GPU only
APU only
active taxi out
statnry ground
take-off roll
climb-out (to ToC) en-route arrival
mngmnt ToD to t’down
landing roll
statnry ground
active taxi in
@ gate B
▼ cost element fuel 7.4 23.3 18.6 --- 48.8 39.1 --- --- --- ---
maintenance 4.7 4.7 6.7 6.3 --- 10.6 9.9 --- --- --- ---
flight crew salaries and expenses cabin crew salaries and expenses
0.0 0.0 0.0 0.0 --- 0.0 0.0 ---
--- --- ---
depreciation of flight equipment
rental of flight equipment amortisation of flight equipment leases
0.0 0.0 0.0 0.0 --- 0.0 0.0 ---
--- --- ---
flight equipment insurance --- --- --- --- --- --- --- --- --- --- ---
station expenses (ground & pax handling) --- --- 0.0
passenger service staff (terminal) ground equipment, property and staff
--- --- --- ---
--- ---
--- --- ---
airport charges (e.g. landing) 4.2 4.2 0.0 -0.2 0.0
en-route & approach air navgn charges --- --- --- ---
all other pax costs ► ► ► ► ► ► ► ► ► ► ► ► 0.0
column totals 8.9 16.2 29.9 24.9 0.0 59.4 49.0 -0.2 0.0 proportion of col. total allocated to phase 0.81 0.09 0.04 0.06 1 0.2 0.8 1 --- --- 1
=> average cost per minute for phase 0.8 3.4 0.0 avg cost per min incl. incurred costs @ B 0.7 3.4

Evaluating the true cost to airlines of one minute of airborne or ground delay
Transport Studies Group University of Westminster
A - 104
Table J69 ATR72 (AT72) / 15 minutes' delay / HIGH cost scenario AT72_15_H
cost allocation phase ► direct @ ground A direct airborne incurred @ ground B
OOOI sequence ► - (IN) - - OUT - - OFF - - ON - - IN -
@ gate A off-gate A airborne off-gate B description ►
GPU only
APU only
active taxi out
statnry ground
take-off roll
climb-out (to ToC) en-route arrival
mngmnt ToD to t’down
landing roll
statnry ground
active taxi in
@ gate B
▼ cost element fuel 10.2 32.3 25.8 --- 83.2 55.0 --- --- --- ---
maintenance 5.8 5.8 8.2 7.8 --- 13.1 12.3 --- --- --- ---
flight crew salaries and expenses cabin crew salaries and expenses
75.0 75.0 75.0 75.0 --- 75.0 75.0 ---
--- --- ---
depreciation of flight equipment
rental of flight equipment amortisation of flight equipment leases
0.0 0.0 0.0 0.0 --- 0.0 0.0 ---
--- --- ---
flight equipment insurance --- --- --- --- --- --- --- --- --- --- ---
station expenses (ground & pax handling) --- --- 0.0
passenger service staff (terminal) ground equipment, property and staff
--- --- --- ---
--- ---
--- --- ---
airport charges (e.g. landing) 18.5 18.5 0.0 -0.3 0.0
en-route & approach air navgn charges --- --- --- ---
all other pax costs ► ► ► ► ► ► ► ► ► ► ► ► 43.5
column totals 99.3 109.5 115.5 108.6 0.0 171.3 142.3 -0.3 43.5 proportion of col. total allocated to phase 0.81 0.09 0.04 0.06 1 0.2 0.8 1 --- --- 1
=> average cost per minute for phase 6.8 9.9 2.9 avg cost per min incl. incurred costs @ B 9.6 12.8

Evaluating the true cost to airlines of one minute of airborne or ground delay
Transport Studies Group University of Westminster
A - 105
Table J70 ATR72 (AT72) / 65 minutes' delay / LOW cost scenario AT72_65_L
cost allocation phase ► direct @ ground A direct airborne incurred @ ground B
OOOI sequence ► - (IN) - - OUT - - OFF - - ON - - IN -
@ gate A off-gate A airborne off-gate B description ►
GPU only
APU only
active taxi out
statnry ground
take-off roll
climb-out (to ToC) en-route arrival
mngmnt ToD to t’down
landing roll
statnry ground
active taxi in
@ gate B
▼ cost element fuel 21.6 68.3 54.6 --- 142.9 113.3 --- --- --- ---
maintenance 11.4 11.4 16.1 15.3 --- 25.6 24.0 --- --- --- ---
flight crew salaries and expenses cabin crew salaries and expenses
0.0 0.0 0.0 0.0 --- 0.0 0.0 ---
--- --- ---
depreciation of flight equipment
rental of flight equipment amortisation of flight equipment leases
0.0 0.0 0.0 0.0 --- 0.0 0.0 ---
--- --- ---
flight equipment insurance --- --- --- --- --- --- --- --- --- --- ---
station expenses (ground & pax handling) --- --- 0.0
passenger service staff (terminal) ground equipment, property and staff
--- --- --- ---
--- ---
--- --- ---
airport charges (e.g. landing) 17.6 17.6 0.0 -0.4 0.3
en-route & approach air navgn charges --- --- --- ---
all other pax costs ► ► ► ► ► ► ► ► ► ► ► ► 665.6
column totals 29.0 50.6 84.4 69.9 0.0 168.5 137.3 -0.4 665.9 proportion of col. total allocated to phase 0.81 0.09 0.04 0.06 1 0.7 0.3 1 --- --- 1
=> average cost per minute for phase 0.5 2.4 10.2 avg cost per min incl. incurred costs @ B 10.8 12.7

Evaluating the true cost to airlines of one minute of airborne or ground delay
Transport Studies Group University of Westminster
A - 106
Table J71 ATR72 (AT72) / 65 minutes' delay / BASE cost scenario AT72_65_N
cost allocation phase ► direct @ ground A direct airborne incurred @ ground B
OOOI sequence ► - (IN) - - OUT - - OFF - - ON - - IN -
@ gate A off-gate A airborne off-gate B description ►
GPU only
APU only
active taxi out
statnry ground
take-off roll
climb-out (to ToC) en-route arrival
mngmnt ToD to t’down
landing roll
statnry ground
active taxi in
@ gate B
▼ cost element fuel 31.9 100.8 80.6 --- 211.6 169.3 --- --- --- ---
maintenance 20.5 20.5 28.9 27.5 --- 45.8 43.0 --- --- --- ---
flight crew salaries and expenses cabin crew salaries and expenses
411.0 411.0 411.0 411.0 --- 411.0 411.0 ---
--- --- ---
depreciation of flight equipment
rental of flight equipment amortisation of flight equipment leases
0.0 0.0 0.0 0.0 --- 0.0 0.0 ---
--- --- ---
flight equipment insurance --- --- --- --- --- --- --- --- --- --- ---
station expenses (ground & pax handling) --- --- 0.0
passenger service staff (terminal) ground equipment, property and staff
--- --- --- ---
--- ---
--- --- ---
airport charges (e.g. landing) 18.8 18.8 0.0 -0.2 0.3
en-route & approach air navgn charges --- --- --- ---
all other pax costs ► ► ► ► ► ► ► ► ► ► ► ► 1170.0
column totals 450.2 482.1 540.7 519.1 0.0 668.4 623.3 -0.2 1170.3 proportion of col. total allocated to phase 0.81 0.09 0.04 0.06 1 0.7 0.3 1 --- --- 1
=> average cost per minute for phase 7.1 10.1 18.0 avg cost per min incl. incurred costs @ B 25.1 28.1

Evaluating the true cost to airlines of one minute of airborne or ground delay
Transport Studies Group University of Westminster
A - 107
Table J72 ATR72 (AT72) / 65 minutes' delay / HIGH cost scenario AT72_65_H
cost allocation phase ► direct @ ground A direct airborne incurred @ ground B
OOOI sequence ► - (IN) - - OUT - - OFF - - ON - - IN -
@ gate A off-gate A airborne off-gate B description ►
GPU only
APU only
active taxi out
statnry ground
take-off roll
climb-out (to ToC) en-route arrival
mngmnt ToD to t’down
landing roll
statnry ground
active taxi in
@ gate B
▼ cost element fuel 44.3 139.8 111.8 --- 360.7 238.5 --- --- --- ---
maintenance 25.3 25.3 35.7 34.0 --- 56.6 53.2 --- --- --- ---
flight crew salaries and expenses cabin crew salaries and expenses
1127.0 1127.0 1127.0 1127.0 --- 1127.0 1127.0 ---
--- --- ---
depreciation of flight equipment
rental of flight equipment amortisation of flight equipment leases
0.0 0.0 0.0 0.0 --- 0.0 0.0 ---
--- --- ---
flight equipment insurance --- --- --- --- --- --- --- --- --- --- ---
station expenses (ground & pax handling) --- --- 90.0
passenger service staff (terminal) ground equipment, property and staff
--- --- --- ---
--- ---
--- --- ---
airport charges (e.g. landing) 92.4 92.4 0.0 -0.3 12.3
en-route & approach air navgn charges --- --- --- ---
all other pax costs ► ► ► ► ► ► ► ► ► ► ► ► 1809.6
column totals 1244.6 1288.9 1302.5 1272.8 0.0 1544.4 1418.7 -0.3 1911.9 proportion of col. total allocated to phase 0.81 0.09 0.04 0.06 1 0.7 0.3 1 --- --- 1
=> average cost per minute for phase 19.3 23.2 29.4 avg cost per min incl. incurred costs @ B 48.7 52.6
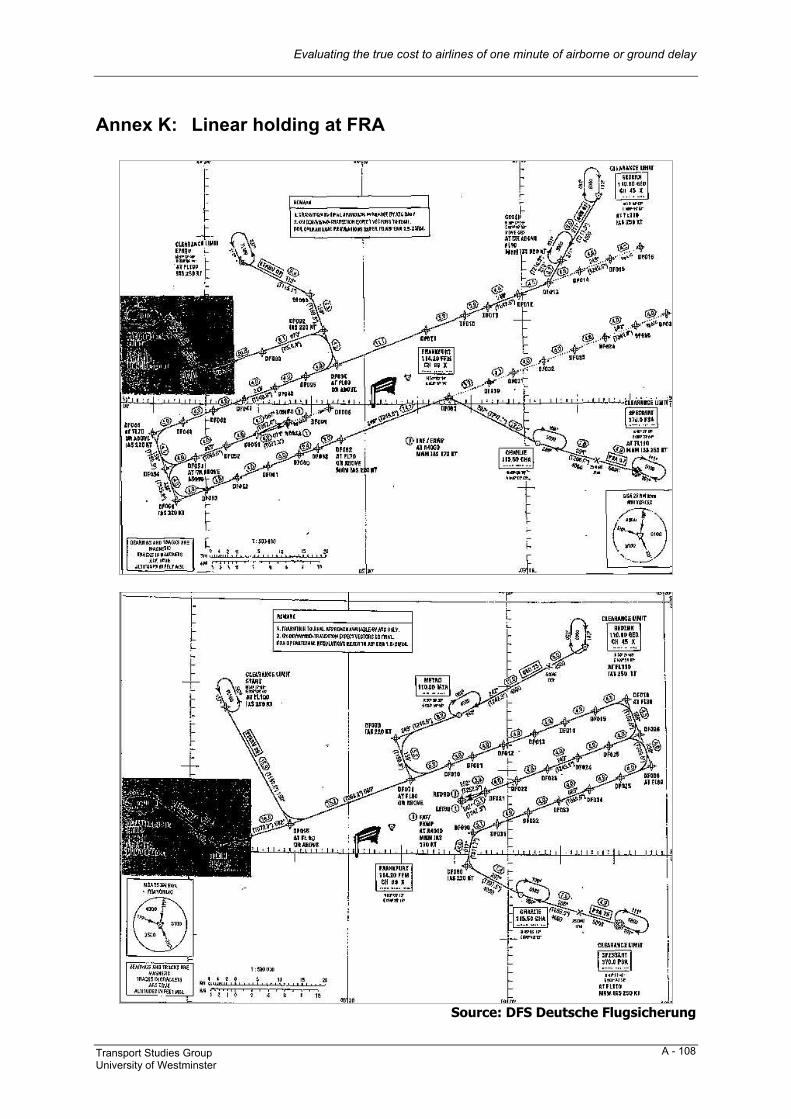
Evaluating the true cost to airlines of one minute of airborne or ground delay
Transport Studies Group University of Westminster
A - 108
Annex K: Linear holding at FRA
Source: DFS Deutsche Flugsicherung
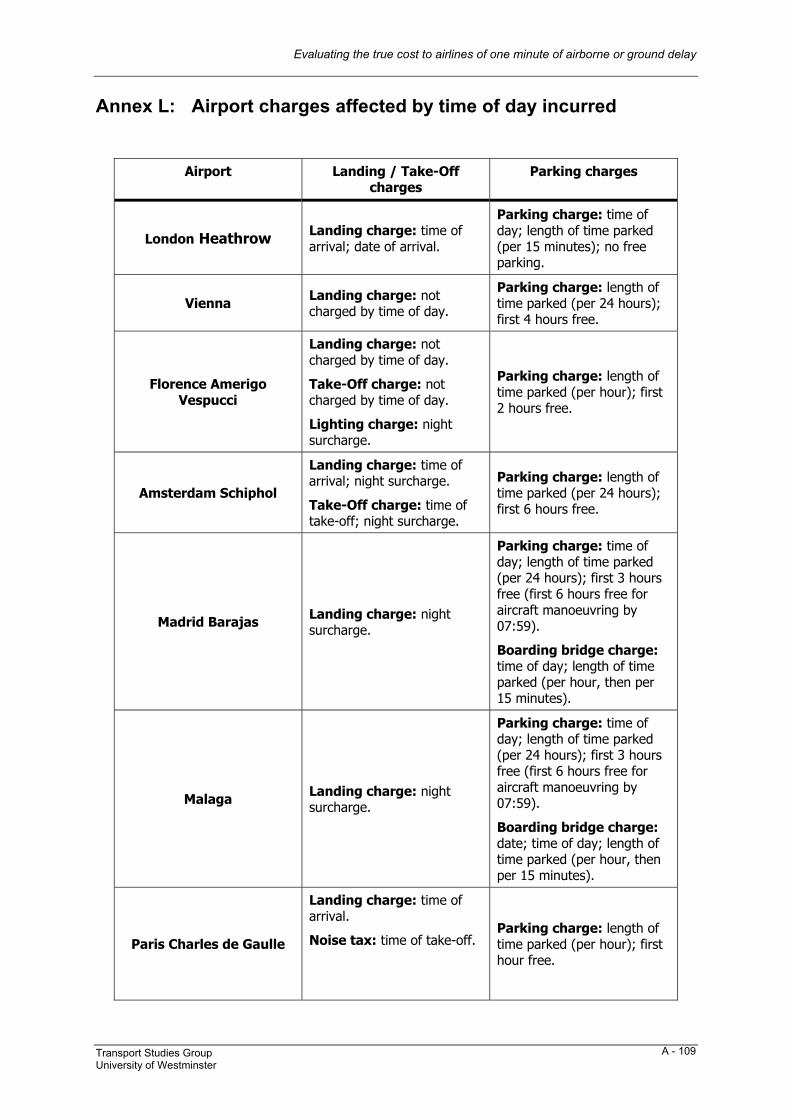
Evaluating the true cost to airlines of one minute of airborne or ground delay
Transport Studies Group University of Westminster
A - 109
Annex L: Airport charges affected by time of day incurred
Airport Landing / Take-Off charges
Parking charges
London Heathrow Landing charge: time of arrival; date of arrival.
Parking charge: time of day; length of time parked (per 15 minutes); no free parking.
Vienna Landing charge: not charged by time of day.
Parking charge: length of time parked (per 24 hours); first 4 hours free.
Florence Amerigo Vespucci
Landing charge: not charged by time of day.
Take-Off charge: not charged by time of day.
Lighting charge: night surcharge.
Parking charge: length of time parked (per hour); first 2 hours free.
Amsterdam Schiphol
Landing charge: time of arrival; night surcharge.
Take-Off charge: time of take-off; night surcharge.
Parking charge: length of time parked (per 24 hours); first 6 hours free.
Madrid Barajas Landing charge: night surcharge.
Parking charge: time of day; length of time parked (per 24 hours); first 3 hours free (first 6 hours free for aircraft manoeuvring by 07:59).
Boarding bridge charge: time of day; length of time parked (per hour, then per 15 minutes).
Malaga Landing charge: night surcharge.
Parking charge: time of day; length of time parked (per 24 hours); first 3 hours free (first 6 hours free for aircraft manoeuvring by 07:59).
Boarding bridge charge: date; time of day; length of time parked (per hour, then per 15 minutes).
Paris Charles de Gaulle
Landing charge: time of arrival.
Noise tax: time of take-off.
Parking charge: length of time parked (per hour); first hour free.

Evaluating the true cost to airlines of one minute of airborne or ground delay
Transport Studies Group University of Westminster
A - 110
Athens International Landing charge: not charged by time of day.
Parking charge: time of day; length of time parked (per 15 minutes); free night parking.
Boarding bridge charge: length of time parked (per hour, then per 15 minutes); maximum charge.
Infrastructure charge: length of check-in time (per 15 minutes).
Prague Ruzyne Landing charge: not charged by time of day.
Parking charge: time of day; length of time parked (per hour); first hour or first 2 hours free (aircraft seating capacity).
Frankfurt a/M
Landing charge: not charged by time of day.
Take-Off charge: not charged by time of day.
Noise charge: night surcharge.
Parking charge: time of day; length of time parked (per hour); no free parking.
Brussels National
Landing charge: time of arrival.
Take-Off charge: time of take-off.
Parking charge: length of time parked (per hour); first 4 hours free; free night parking.
Boarding bridge charge: length of time parked (per hour); first 6 hours free.
Electricity charge: length of time parked (per 15 minutes); minimum charge.
London Luton
Landing charge: not charged by time of day.
[Revised since our analysis - time of arrival is now a factor].
Noise charge: day and night surcharge.
Parking charge: length of time parked (per hour); first hour free.
[Revised since our analysis - now length of time parked (per minute); first 15 minutes free].
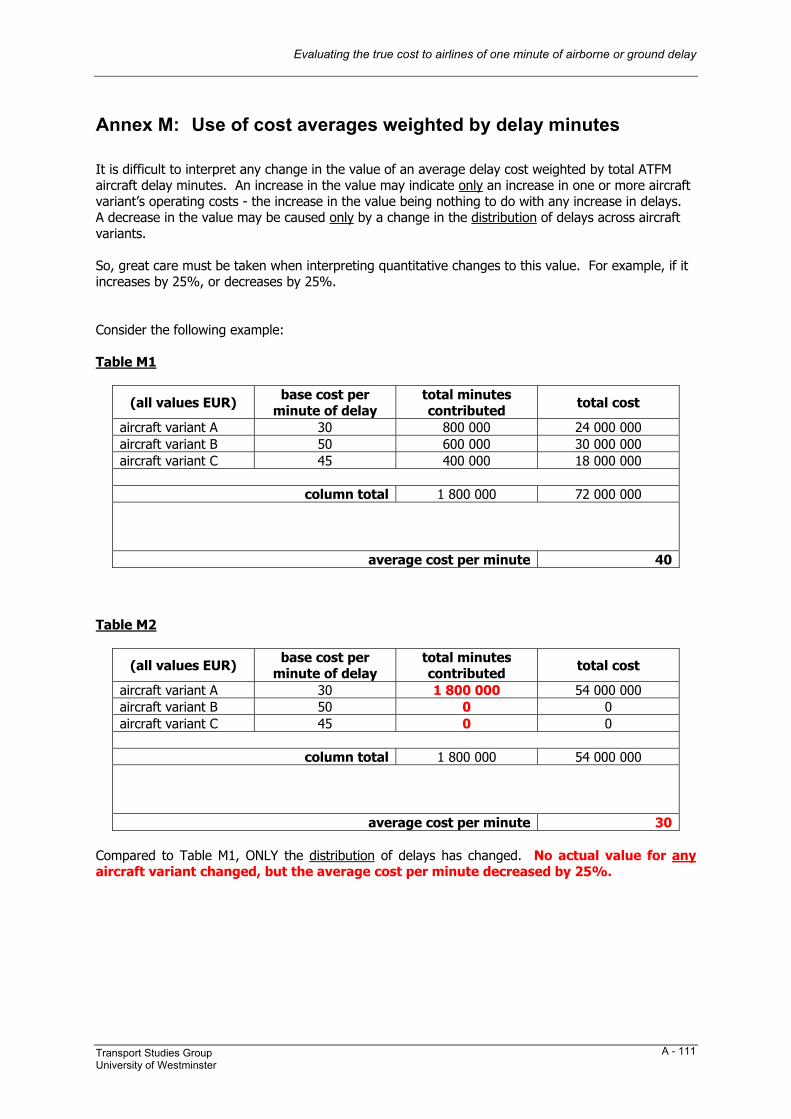
Evaluating the true cost to airlines of one minute of airborne or ground delay
Transport Studies Group University of Westminster
A - 111
Annex M: Use of cost averages weighted by delay minutes It is difficult to interpret any change in the value of an average delay cost weighted by total ATFM aircraft delay minutes. An increase in the value may indicate only an increase in one or more aircraft variant’s operating costs - the increase in the value being nothing to do with any increase in delays. A decrease in the value may be caused only by a change in the distribution of delays across aircraft variants. So, great care must be taken when interpreting quantitative changes to this value. For example, if it increases by 25%, or decreases by 25%. Consider the following example: Table M1
(all values EUR) base cost per minute of delay
total minutes contributed total cost
aircraft variant A 30 800 000 24 000 000 aircraft variant B 50 600 000 30 000 000 aircraft variant C 45 400 000 18 000 000
column total 1 800 000 72 000 000
average cost per minute 40 Table M2
(all values EUR) base cost per minute of delay
total minutes contributed total cost
aircraft variant A 30 1 800 000 54 000 000 aircraft variant B 50 0 0 aircraft variant C 45 0 0
column total 1 800 000 54 000 000
average cost per minute 30 Compared to Table M1, ONLY the distribution of delays has changed. No actual value for any aircraft variant changed, but the average cost per minute decreased by 25%.
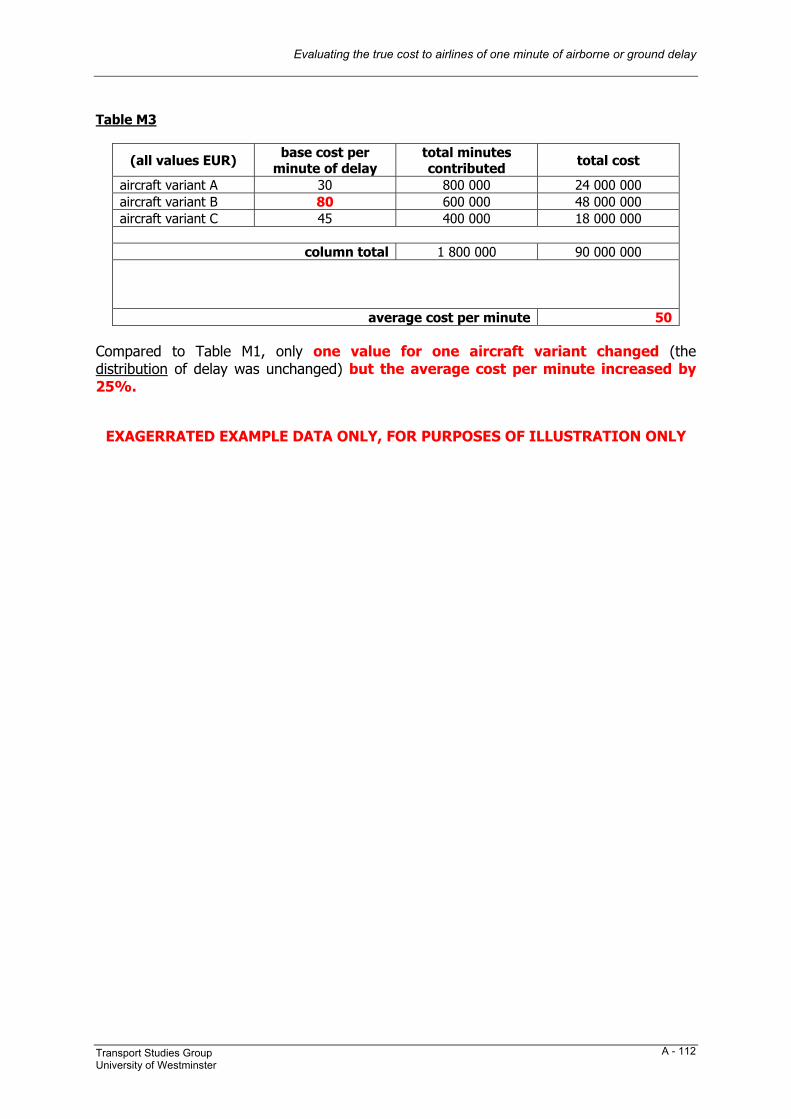
Evaluating the true cost to airlines of one minute of airborne or ground delay
Transport Studies Group University of Westminster
A - 112
Table M3
(all values EUR) base cost per minute of delay
total minutes contributed total cost
aircraft variant A 30 800 000 24 000 000 aircraft variant B 80 600 000 48 000 000 aircraft variant C 45 400 000 18 000 000
column total 1 800 000 90 000 000
average cost per minute 50 Compared to Table M1, only one value for one aircraft variant changed (the distribution of delay was unchanged) but the average cost per minute increased by 25%.
EXAGERRATED EXAMPLE DATA ONLY, FOR PURPOSES OF ILLUSTRATION ONLY
Evaluating the true cost to airlines of one minute of airborne or ground delay
Transport Studies Group University of Westminster
A - 113
Annex N: Selection of aircraft variants and airlines This Annex presents some further explanation of how the aircraft and airlines that formed the basis of the cost calculations were selected. The information set out below has been anonymised to ensure that it is not possible to make connections between operating costs and particular airlines that supplied the data. N1 Selection of six aircraft variants Planned flight data supplied by PRU (sourced from CFMU) for 2001 were used to ascertain the aircraft variants which made the greatest contributions to ECAC off-block hours (‘duration’) and movements. Despite the fact that these data were for planned (i.e. not actual) flights, they are likely to be reasonably good estimates of movements. In terms of estimating airborne duration, however, it is to be noted that duration was calculated as "time of exit from the last airspace" minus "EOBT". Although some flights contributing to the values did not have data for "duration" because one of these times was not available for this calculation, this constituted fewer than 1% of the data. These data include standard taxi-outs as part of the airborne duration, and curtail this duration at Top of Descent, with no allowance made for descent and taxi-ins. Since the data are “planned”, they obviously omit any estimate of arrival management (e.g. stacks). It is difficult to predict what bias is likely as a consequence of these omissions, except that aircraft with longer average flight times, and fewer cycles per given period, are likely to spend less time in arrival management. Thus, smaller aircraft, and aircraft higher up in Table N2, would be more likely to be higher up in Table N1, if this were based on actual, captured data. It is not possible to estimate these factors quantitatively, however. Notwithstanding these limitations, the data in Tables N1 and N2 are likely to be sufficiently good indicators for the purposes of selecting suitable aircraft variants for this Study, since this is a somewhat subjective task in any case. Taking these data as supplied, they have been sorted in Tables N1 and N2 by flight duration and movements, respectively. All aircraft are jets, except for turbo-props, designated ‘(t)’.
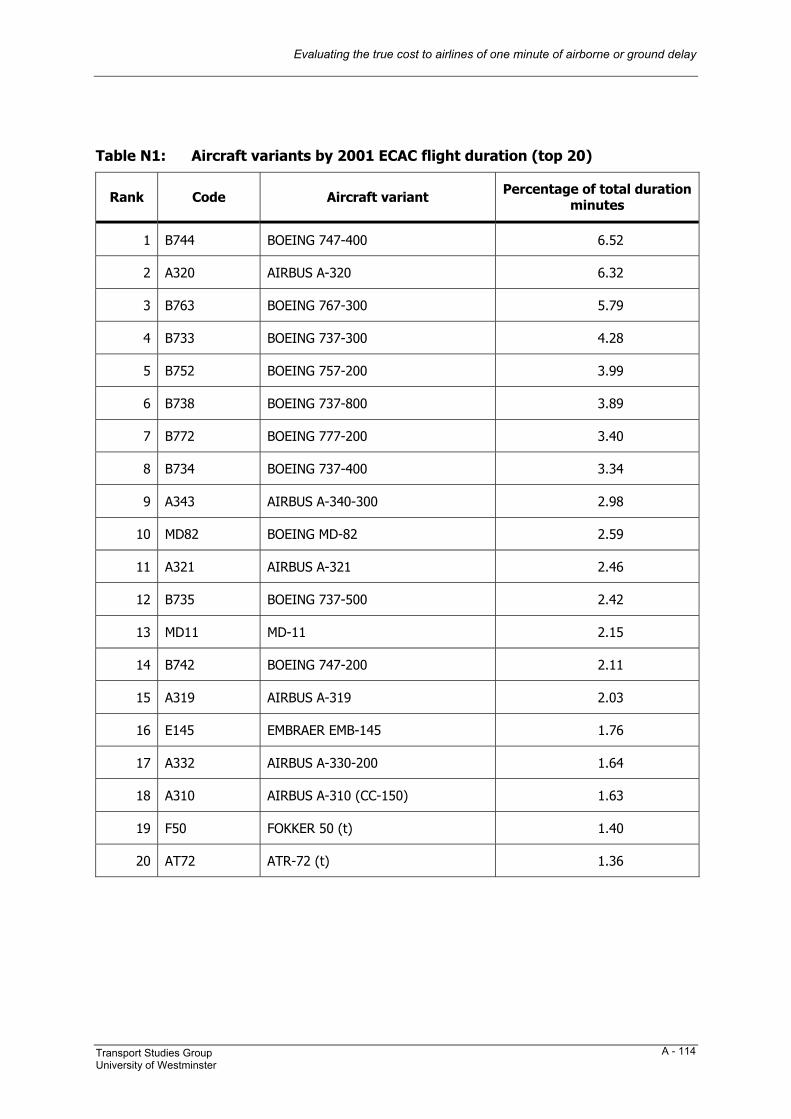
Evaluating the true cost to airlines of one minute of airborne or ground delay
Transport Studies Group University of Westminster
A - 114
Table N1: Aircraft variants by 2001 ECAC flight duration (top 20)
Rank Code Aircraft variant Percentage of total duration minutes
1 B744 BOEING 747-400 6.52
2 A320 AIRBUS A-320 6.32
3 B763 BOEING 767-300 5.79
4 B733 BOEING 737-300 4.28
5 B752 BOEING 757-200 3.99
6 B738 BOEING 737-800 3.89
7 B772 BOEING 777-200 3.40
8 B734 BOEING 737-400 3.34
9 A343 AIRBUS A-340-300 2.98
10 MD82 BOEING MD-82 2.59
11 A321 AIRBUS A-321 2.46
12 B735 BOEING 737-500 2.42
13 MD11 MD-11 2.15
14 B742 BOEING 747-200 2.11
15 A319 AIRBUS A-319 2.03
16 E145 EMBRAER EMB-145 1.76
17 A332 AIRBUS A-330-200 1.64
18 A310 AIRBUS A-310 (CC-150) 1.63
19 F50 FOKKER 50 (t) 1.40
20 AT72 ATR-72 (t) 1.36
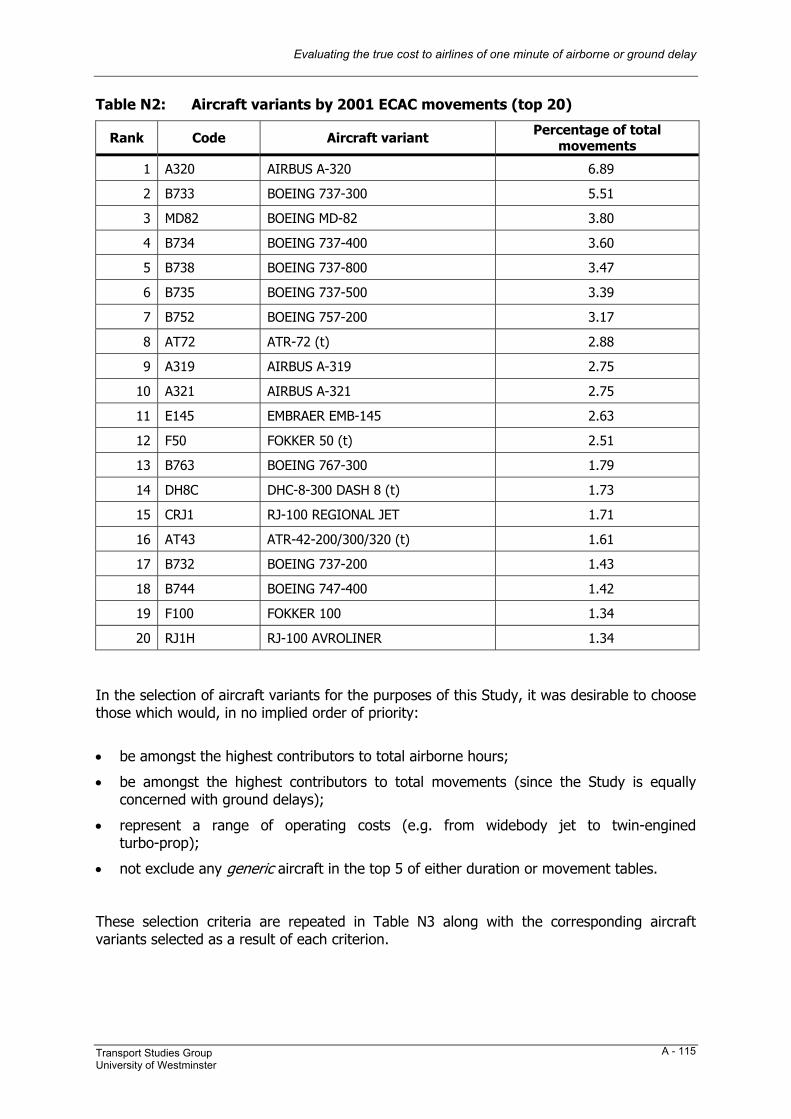
Evaluating the true cost to airlines of one minute of airborne or ground delay
Transport Studies Group University of Westminster
A - 115
Table N2: Aircraft variants by 2001 ECAC movements (top 20)
Rank Code Aircraft variant Percentage of total movements
1 A320 AIRBUS A-320 6.89
2 B733 BOEING 737-300 5.51
3 MD82 BOEING MD-82 3.80
4 B734 BOEING 737-400 3.60
5 B738 BOEING 737-800 3.47
6 B735 BOEING 737-500 3.39
7 B752 BOEING 757-200 3.17
8 AT72 ATR-72 (t) 2.88
9 A319 AIRBUS A-319 2.75
10 A321 AIRBUS A-321 2.75
11 E145 EMBRAER EMB-145 2.63
12 F50 FOKKER 50 (t) 2.51
13 B763 BOEING 767-300 1.79
14 DH8C DHC-8-300 DASH 8 (t) 1.73
15 CRJ1 RJ-100 REGIONAL JET 1.71
16 AT43 ATR-42-200/300/320 (t) 1.61
17 B732 BOEING 737-200 1.43
18 B744 BOEING 747-400 1.42
19 F100 FOKKER 100 1.34
20 RJ1H RJ-100 AVROLINER 1.34
In the selection of aircraft variants for the purposes of this Study, it was desirable to choose those which would, in no implied order of priority:
• be amongst the highest contributors to total airborne hours;
• be amongst the highest contributors to total movements (since the Study is equally concerned with ground delays);
• represent a range of operating costs (e.g. from widebody jet to twin-engined turbo-prop);
• not exclude any generic aircraft in the top 5 of either duration or movement tables. These selection criteria are repeated in Table N3 along with the corresponding aircraft variants selected as a result of each criterion.
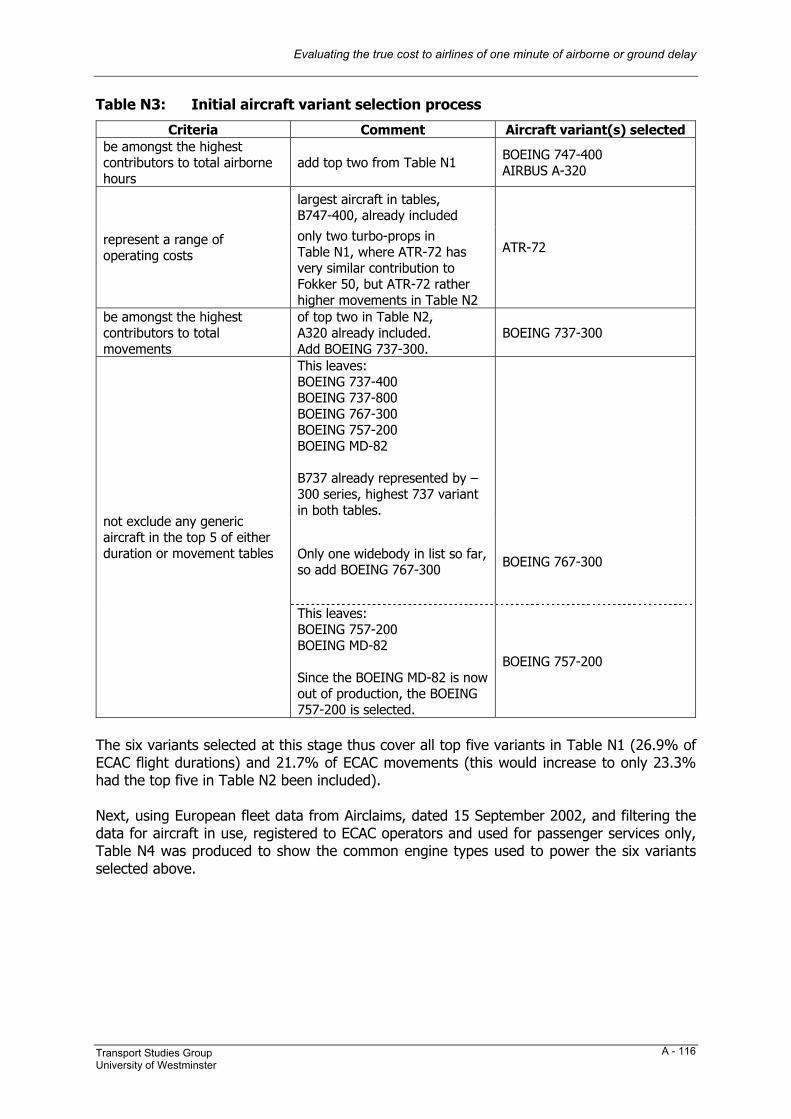
Evaluating the true cost to airlines of one minute of airborne or ground delay
Transport Studies Group University of Westminster
A - 116
Table N3: Initial aircraft variant selection process
Criteria Comment Aircraft variant(s) selected be amongst the highest contributors to total airborne hours
add top two from Table N1 BOEING 747-400 AIRBUS A-320
largest aircraft in tables, B747-400, already included
represent a range of operating costs
only two turbo-props in Table N1, where ATR-72 has very similar contribution to Fokker 50, but ATR-72 rather higher movements in Table N2
ATR-72
be amongst the highest contributors to total movements
of top two in Table N2, A320 already included. Add BOEING 737-300.
BOEING 737-300
This leaves: BOEING 737-400 BOEING 737-800 BOEING 767-300 BOEING 757-200 BOEING MD-82 B737 already represented by –300 series, highest 737 variant in both tables.
Only one widebody in list so far, so add BOEING 767-300 BOEING 767-300
not exclude any generic aircraft in the top 5 of either duration or movement tables
This leaves: BOEING 757-200 BOEING MD-82 Since the BOEING MD-82 is now out of production, the BOEING 757-200 is selected.
BOEING 757-200
The six variants selected at this stage thus cover all top five variants in Table N1 (26.9% of ECAC flight durations) and 21.7% of ECAC movements (this would increase to only 23.3% had the top five in Table N2 been included). Next, using European fleet data from Airclaims, dated 15 September 2002, and filtering the data for aircraft in use, registered to ECAC operators and used for passenger services only, Table N4 was produced to show the common engine types used to power the six variants selected above.
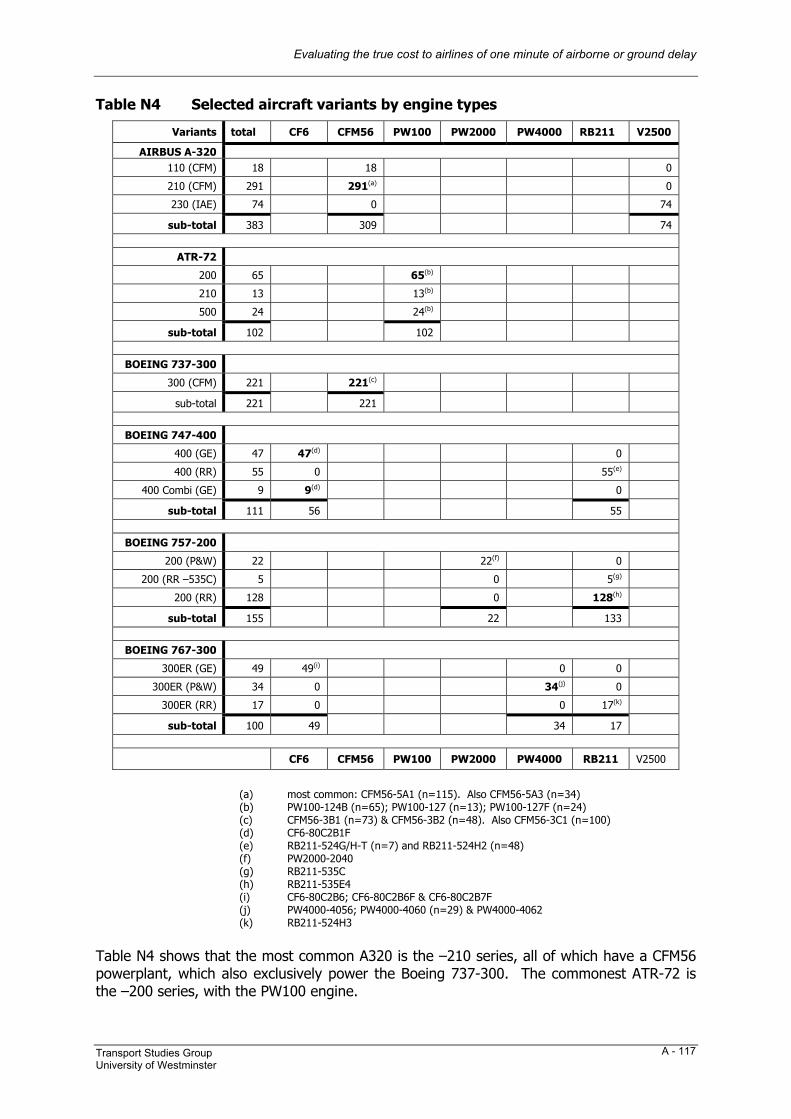
Evaluating the true cost to airlines of one minute of airborne or ground delay
Transport Studies Group University of Westminster
A - 117
Table N4 Selected aircraft variants by engine types
Variants total CF6 CFM56 PW100 PW2000 PW4000 RB211 V2500
AIRBUS A-320 110 (CFM) 18 18 0
210 (CFM) 291 291(a) 0
230 (IAE) 74 0 74
sub-total 383 309 74
ATR-72
200 65 65(b) 210 13 13(b) 500 24 24(b)
sub-total 102 102
BOEING 737-300 300 (CFM) 221 221(c)
sub-total 221 221
BOEING 747-400 400 (GE) 47 47(d) 0 400 (RR) 55 0 55(e)
400 Combi (GE) 9 9(d) 0 sub-total 111 56 55
BOEING 757-200
200 (P&W) 22 22(f) 0
200 (RR –535C) 5 0 5(g)
200 (RR) 128 0 128(h)
sub-total 155 22 133
BOEING 767-300
300ER (GE) 49 49(i) 0 0
300ER (P&W) 34 0 34(j) 0
300ER (RR) 17 0 0 17(k)
sub-total 100 49 34 17
CF6 CFM56 PW100 PW2000 PW4000 RB211 V2500
(a) most common: CFM56-5A1 (n=115). Also CFM56-5A3 (n=34) (b) PW100-124B (n=65); PW100-127 (n=13); PW100-127F (n=24) (c) CFM56-3B1 (n=73) & CFM56-3B2 (n=48). Also CFM56-3C1 (n=100) (d) CF6-80C2B1F (e) RB211-524G/H-T (n=7) and RB211-524H2 (n=48) (f) PW2000-2040 (g) RB211-535C (h) RB211-535E4 (i) CF6-80C2B6; CF6-80C2B6F & CF6-80C2B7F (j) PW4000-4056; PW4000-4060 (n=29) & PW4000-4062 (k) RB211-524H3
Table N4 shows that the most common A320 is the –210 series, all of which have a CFM56 powerplant, which also exclusively power the Boeing 737-300. The commonest ATR-72 is the –200 series, with the PW100 engine.
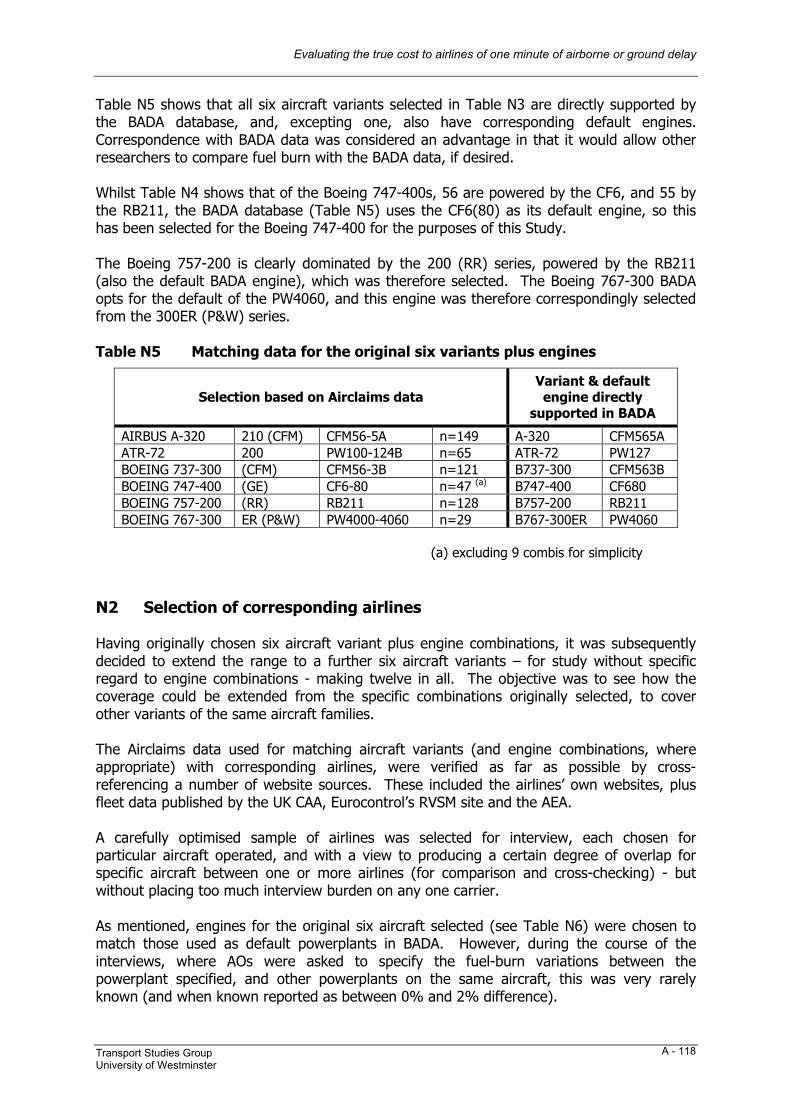
Evaluating the true cost to airlines of one minute of airborne or ground delay
Transport Studies Group University of Westminster
A - 118
Table N5 shows that all six aircraft variants selected in Table N3 are directly supported by the BADA database, and, excepting one, also have corresponding default engines. Correspondence with BADA data was considered an advantage in that it would allow other researchers to compare fuel burn with the BADA data, if desired. Whilst Table N4 shows that of the Boeing 747-400s, 56 are powered by the CF6, and 55 by the RB211, the BADA database (Table N5) uses the CF6(80) as its default engine, so this has been selected for the Boeing 747-400 for the purposes of this Study. The Boeing 757-200 is clearly dominated by the 200 (RR) series, powered by the RB211 (also the default BADA engine), which was therefore selected. The Boeing 767-300 BADA opts for the default of the PW4060, and this engine was therefore correspondingly selected from the 300ER (P&W) series. Table N5 Matching data for the original six variants plus engines
Selection based on Airclaims data Variant & default engine directly
supported in BADA
AIRBUS A-320 210 (CFM) CFM56-5A n=149 A-320 CFM565A ATR-72 200 PW100-124B n=65 ATR-72 PW127 BOEING 737-300 (CFM) CFM56-3B n=121 B737-300 CFM563B BOEING 747-400 (GE) CF6-80 n=47 (a) B747-400 CF680 BOEING 757-200 (RR) RB211 n=128 B757-200 RB211 BOEING 767-300 ER (P&W) PW4000-4060 n=29 B767-300ER PW4060
(a) excluding 9 combis for simplicity
N2 Selection of corresponding airlines Having originally chosen six aircraft variant plus engine combinations, it was subsequently decided to extend the range to a further six aircraft variants – for study without specific regard to engine combinations - making twelve in all. The objective was to see how the coverage could be extended from the specific combinations originally selected, to cover other variants of the same aircraft families. The Airclaims data used for matching aircraft variants (and engine combinations, where appropriate) with corresponding airlines, were verified as far as possible by cross-referencing a number of website sources. These included the airlines’ own websites, plus fleet data published by the UK CAA, Eurocontrol’s RVSM site and the AEA. A carefully optimised sample of airlines was selected for interview, each chosen for particular aircraft operated, and with a view to producing a certain degree of overlap for specific aircraft between one or more airlines (for comparison and cross-checking) - but without placing too much interview burden on any one carrier. As mentioned, engines for the original six aircraft selected (see Table N6) were chosen to match those used as default powerplants in BADA. However, during the course of the interviews, where AOs were asked to specify the fuel-burn variations between the powerplant specified, and other powerplants on the same aircraft, this was very rarely known (and when known reported as between 0% and 2% difference).
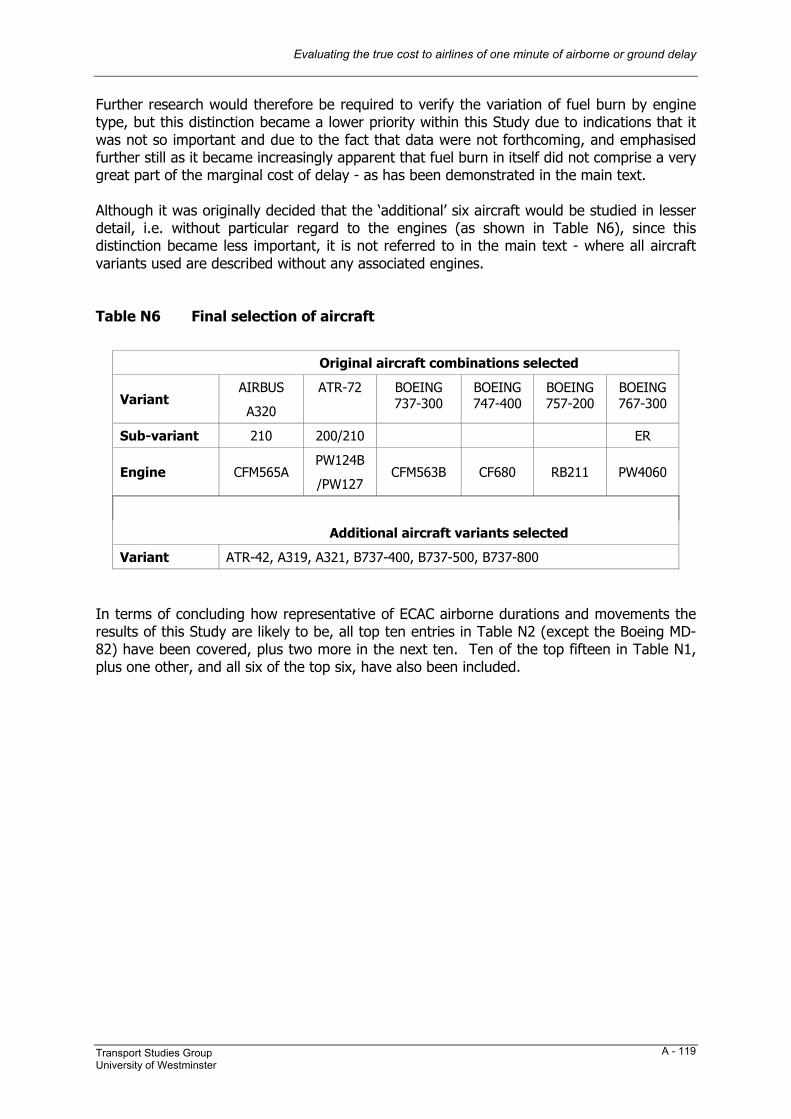
Evaluating the true cost to airlines of one minute of airborne or ground delay
Transport Studies Group University of Westminster
A - 119
Further research would therefore be required to verify the variation of fuel burn by engine type, but this distinction became a lower priority within this Study due to indications that it was not so important and due to the fact that data were not forthcoming, and emphasised further still as it became increasingly apparent that fuel burn in itself did not comprise a very great part of the marginal cost of delay - as has been demonstrated in the main text. Although it was originally decided that the ‘additional’ six aircraft would be studied in lesser detail, i.e. without particular regard to the engines (as shown in Table N6), since this distinction became less important, it is not referred to in the main text - where all aircraft variants used are described without any associated engines. Table N6 Final selection of aircraft
Original aircraft combinations selected
Variant AIRBUS
A320
ATR-72 BOEING 737-300
BOEING 747-400
BOEING 757-200
BOEING 767-300
Sub-variant 210 200/210 ER
Engine CFM565A PW124B
/PW127 CFM563B CF680 RB211 PW4060
Additional aircraft variants selected
Variant ATR-42, A319, A321, B737-400, B737-500, B737-800
In terms of concluding how representative of ECAC airborne durations and movements the results of this Study are likely to be, all top ten entries in Table N2 (except the Boeing MD-82) have been covered, plus two more in the next ten. Ten of the top fifteen in Table N1, plus one other, and all six of the top six, have also been included.
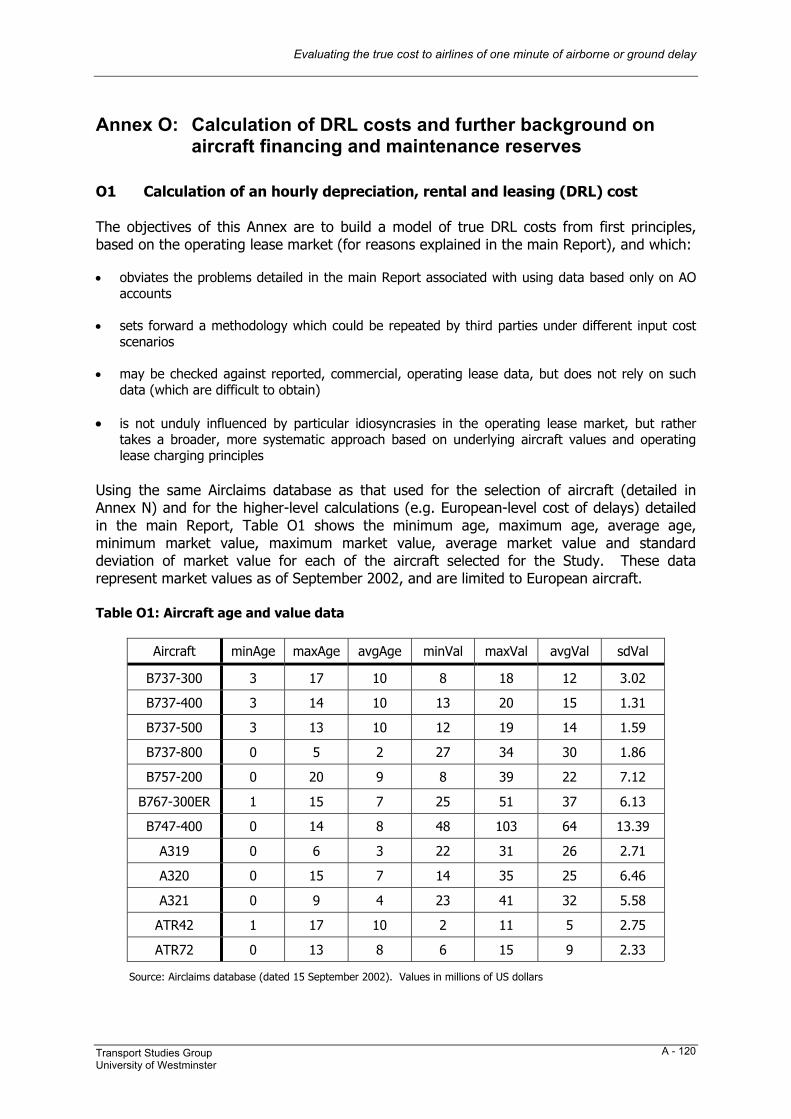
Evaluating the true cost to airlines of one minute of airborne or ground delay
Transport Studies Group University of Westminster
A - 120
Annex O: Calculation of DRL costs and further background on aircraft financing and maintenance reserves
O1 Calculation of an hourly depreciation, rental and leasing (DRL) cost The objectives of this Annex are to build a model of true DRL costs from first principles, based on the operating lease market (for reasons explained in the main Report), and which: • obviates the problems detailed in the main Report associated with using data based only on AO
accounts • sets forward a methodology which could be repeated by third parties under different input cost
scenarios • may be checked against reported, commercial, operating lease data, but does not rely on such
data (which are difficult to obtain) • is not unduly influenced by particular idiosyncrasies in the operating lease market, but rather
takes a broader, more systematic approach based on underlying aircraft values and operating lease charging principles
Using the same Airclaims database as that used for the selection of aircraft (detailed in Annex N) and for the higher-level calculations (e.g. European-level cost of delays) detailed in the main Report, Table O1 shows the minimum age, maximum age, average age, minimum market value, maximum market value, average market value and standard deviation of market value for each of the aircraft selected for the Study. These data represent market values as of September 2002, and are limited to European aircraft. Table O1: Aircraft age and value data
Aircraft minAge maxAge avgAge minVal maxVal avgVal sdVal
B737-300 3 17 10 8 18 12 3.02
B737-400 3 14 10 13 20 15 1.31
B737-500 3 13 10 12 19 14 1.59
B737-800 0 5 2 27 34 30 1.86
B757-200 0 20 9 8 39 22 7.12
B767-300ER 1 15 7 25 51 37 6.13
B747-400 0 14 8 48 103 64 13.39
A319 0 6 3 22 31 26 2.71
A320 0 15 7 14 35 25 6.46
A321 0 9 4 23 41 32 5.58
ATR42 1 17 10 2 11 5 2.75
ATR72 0 13 8 6 15 9 2.33
Source: Airclaims database (dated 15 September 2002). Values in millions of US dollars
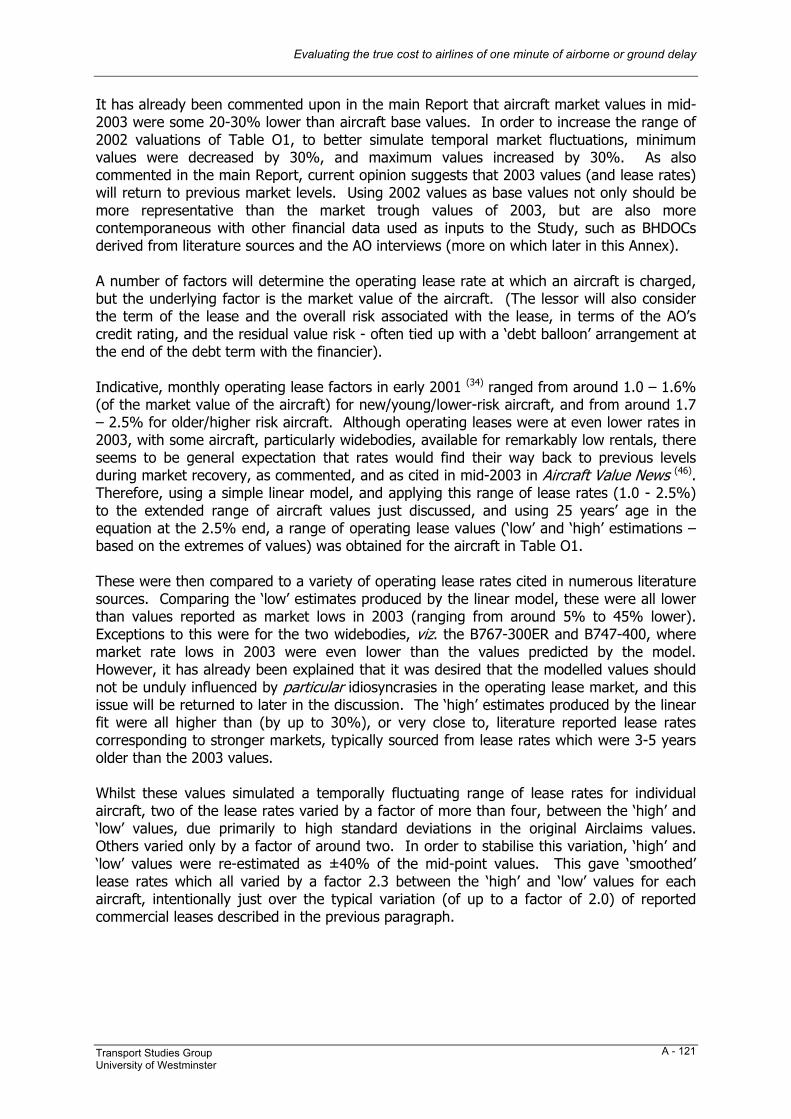
Evaluating the true cost to airlines of one minute of airborne or ground delay
Transport Studies Group University of Westminster
A - 121
It has already been commented upon in the main Report that aircraft market values in mid-2003 were some 20-30% lower than aircraft base values. In order to increase the range of 2002 valuations of Table O1, to better simulate temporal market fluctuations, minimum values were decreased by 30%, and maximum values increased by 30%. As also commented in the main Report, current opinion suggests that 2003 values (and lease rates) will return to previous market levels. Using 2002 values as base values not only should be more representative than the market trough values of 2003, but are also more contemporaneous with other financial data used as inputs to the Study, such as BHDOCs derived from literature sources and the AO interviews (more on which later in this Annex). A number of factors will determine the operating lease rate at which an aircraft is charged, but the underlying factor is the market value of the aircraft. (The lessor will also consider the term of the lease and the overall risk associated with the lease, in terms of the AO’s credit rating, and the residual value risk - often tied up with a ‘debt balloon’ arrangement at the end of the debt term with the financier). Indicative, monthly operating lease factors in early 2001 (34) ranged from around 1.0 – 1.6% (of the market value of the aircraft) for new/young/lower-risk aircraft, and from around 1.7 – 2.5% for older/higher risk aircraft. Although operating leases were at even lower rates in 2003, with some aircraft, particularly widebodies, available for remarkably low rentals, there seems to be general expectation that rates would find their way back to previous levels during market recovery, as commented, and as cited in mid-2003 in Aircraft Value News (46). Therefore, using a simple linear model, and applying this range of lease rates (1.0 - 2.5%) to the extended range of aircraft values just discussed, and using 25 years’ age in the equation at the 2.5% end, a range of operating lease values (‘low’ and ‘high’ estimations – based on the extremes of values) was obtained for the aircraft in Table O1. These were then compared to a variety of operating lease rates cited in numerous literature sources. Comparing the ‘low’ estimates produced by the linear model, these were all lower than values reported as market lows in 2003 (ranging from around 5% to 45% lower). Exceptions to this were for the two widebodies, viz. the B767-300ER and B747-400, where market rate lows in 2003 were even lower than the values predicted by the model. However, it has already been explained that it was desired that the modelled values should not be unduly influenced by particular idiosyncrasies in the operating lease market, and this issue will be returned to later in the discussion. The ‘high’ estimates produced by the linear fit were all higher than (by up to 30%), or very close to, literature reported lease rates corresponding to stronger markets, typically sourced from lease rates which were 3-5 years older than the 2003 values. Whilst these values simulated a temporally fluctuating range of lease rates for individual aircraft, two of the lease rates varied by a factor of more than four, between the ‘high’ and ‘low’ values, due primarily to high standard deviations in the original Airclaims values. Others varied only by a factor of around two. In order to stabilise this variation, ‘high’ and ‘low’ values were re-estimated as ±40% of the mid-point values. This gave ‘smoothed’ lease rates which all varied by a factor 2.3 between the ‘high’ and ‘low’ values for each aircraft, intentionally just over the typical variation (of up to a factor of 2.0) of reported commercial leases described in the previous paragraph.
Evaluating the true cost to airlines of one minute of airborne or ground delay
Transport Studies Group University of Westminster
A - 122
Comparing these new, ‘smoothed’ lease rates with the commercial highs and lows sourced from the literature, all (but three) of the ‘low’ modelled values were lower than the market lows (up to 35% lower) and all the ‘high’ modelled values were higher than the market highs (by up to 38%). These new, smoothed values thus appeared to offer good future-proofing either side of the mid-range values, relative to recent market fluctuations, and to be stable in terms of having ratios of only 2.3 between the high and low modelled values. The three exceptions to the above statement were that the market lows (sourced from the literature) were actually lower than the modelled low values, for three aircraft: the B757-200, B767-300 and B747-400. As mentioned in the introduction to this Annex, however, it is desirable for the modelled prices to represent realistic operational costs, and not for the model to be biased towards inclusion of very specific market conditions. For example, it would be inadvisable to model the true, medium- to long-term costs of financing B747-400s, with fleet replacement, based on a particular trough in the current market, resulting due to over-supply of these aircraft on the leasing market. Literature evidence suggests that market fluctuations were indeed the cause of currently very low lease rates for these three aircraft. For the B757-200, it was reported in August 2003 (36) that the ‘bottom had fallen out of the market’ for this aircraft. Even in May 2002, demand for virtually all widebodies was described (37) as “at best very low” with lease rates reduced to “unprecedented levels” – and the B767-300ER had suffered a “spectacular fall from grace”. Although the modelled lease rates (based on market values of aircraft) calculated for the B747-400 agree very well with 2000 data (35) for the A340-343, which very closely matches the B747-400 for price in the Airclaims data, more recent values (40) for 2003 show remarkably low rates available for older B747-400s, as little as USD 375 000 per month. It was thus decided to retain the modelled rates, adopting a consistent methodology across all aircraft. (The robustness of this approach will be demonstrated later in this discussion). Next, however, it was necessary to convert these monthly, modelled operating lease rates charged by lessors: (a) from charged rates (including lessor’s profit) into actual base costs, in order to
properly estimate the true ‘internal’ DRL cost to an airline (i.e. across a whole range of AO financing methods, but bearing in mind that to many AOs actually using operating leases, the lessor’s profit margin represents a true cost)
(b) from monthly rates, to hourly rates – clearly based on an assessment of utilisation The first correction, (a), required some level of judgement to be applied, but some quantitative data were available to assist with the adjustment. A first approach was to consider the extra amount the lessor charges the AO in the lease rate, over and above the internal cost to the lessor of financing the same debt. Such costs have been compared for only one of the aircraft variants included in this Report (the B737-300) by Aircraft Commerce (34) in early 2001, and also for the B767-200ER (whereas this Report has considered the B767-300ER, but the values for the –200ER will be used as indicative). In both cases, the monthly lease rate charged was calculated as around 21% higher than the monthly debt repayment paid by the lessor on the same aircraft, making a number of realistic financial assumptions.
Evaluating the true cost to airlines of one minute of airborne or ground delay
Transport Studies Group University of Westminster
A - 123
However, it was also necessary to consider the lessors’ profit margin in a wider context, for example: balancing residual value benefits against the ‘debt balloon’ usually paid at the end of the loan term; lessor overhead costs; and lessor re-deployment costs - such as repossession, possible reconfiguration, and remarketing of aircraft between leases. (These redeployment costs are particularly high for widebodies, which is another reason why they are relatively less attractive options to the operating lessors). Other data in Aircraft Commerce (34) suggested, however, that overall, operating leasing profit margins were still of the order of 20%, with these extra considerations taken into account. With this figure in mind, it should be remembered, that: (i) lessors will command better debt financing terms than are typically available to AOs
(which would suggest that the cost to AOs of self-financing under similar arrangements would be higher, i.e. the 20% profit margin could be an over-estimate for the model purposes of estimating pure self-financing costs)
(ii) the 20% figure related to early 2001; it was probably lower in mid-2003, but would be
expected to recover with lease rate recoveries (iii) as discussed in the main Report, operating leasing is expected to grow to up to around
40% of the total market (in volume, not value), such that around 40% of aircraft would be tied to the operating lessors’ profit margins of around 20% as a ‘real’ cost, and 60% would theoretically be available to many AOs at better, internally-financed total costs: i.e. without the full 20% lessor profit margin, but, for example, on poorer debt terms (see [i]), and with internal overheads of managing the fleet portfolio
Essentially, a reasonably judgmental estimate of how much to reduce the modelled rates by, relative to the 20% estimated profit margin, must be made. A value of 10% has been assumed – i.e. all the lease rates modelled have been reduced by 10% to make a reasoned correction for outright lessor profit margin which could be escaped by some AOs, in periods of average market conditions. Clearly, this is a rather crude assumption, but it is one which needs to be made at some level of correction, and will have a relatively small effect on the modelled values, compared to the range factor of 2.3 between the ‘high’ and ‘low’ modelled values. To convert these values from monthly to hourly costs, it was necessary to assess typical service usage of the aircraft under consideration. Firstly, using IATA data for each of the AOs included in the Study, reported utilisations for each aircraft type were used to make an averaged utilisation, weighted by the number of the aircraft type in each AO fleet. These IATA utilisations were then averaged (1:1) against total AEA data for each of the corresponding aircraft types, such that the utilisation figures shown in Table O2 (as “block-hours per day”, given to the nearest ten minutes) were ‘half way’ between a representative value of the AOs interviewed as part of the Study, and AEA-wide figures. Using similarly weighted AEA-wide data for revenue landings per day, and allocating 60 minute turnarounds for all aircraft except the B747-400 and B767-300ER (180 minutes and 120 minutes assigned, respectively), allowed DRL costs to be calculated per service-hour (i.e. block-hours plus turnaround time). The resulting costs, per service-hour, are in Table O2, to the nearest ten Euros. The ‘mid-point’ value (derived as described above) is assigned as the ‘base’ scenario value.
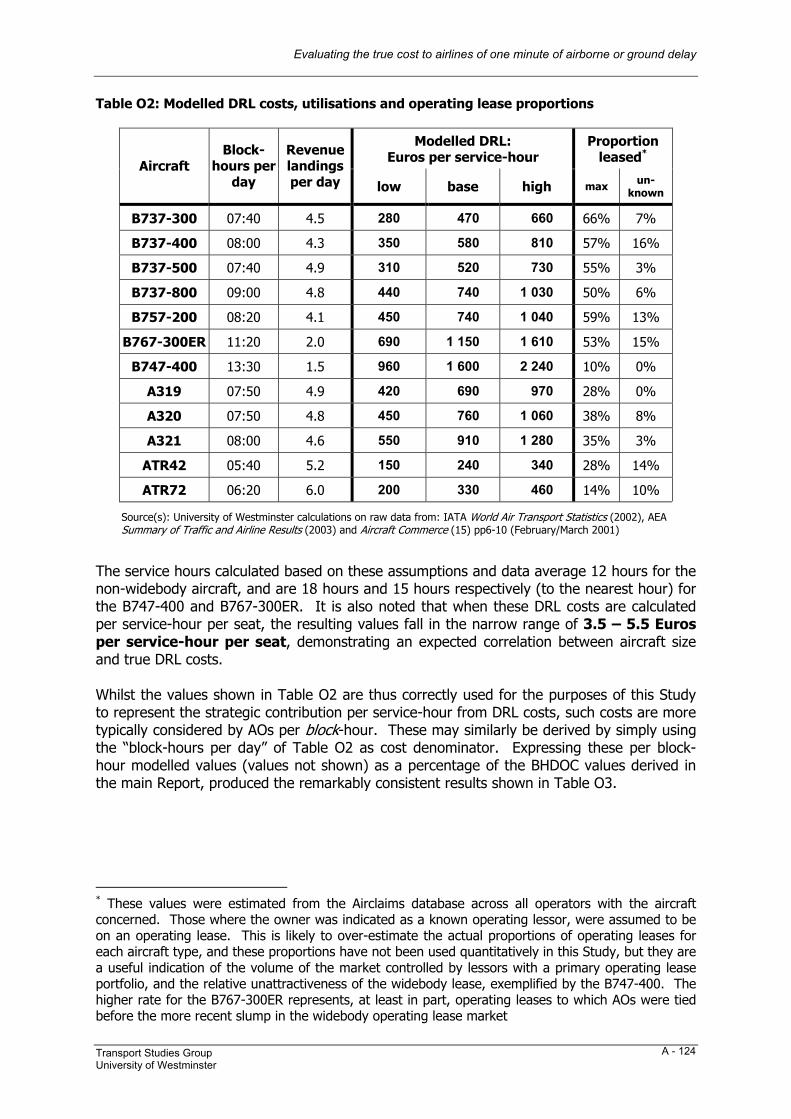
Evaluating the true cost to airlines of one minute of airborne or ground delay
Transport Studies Group University of Westminster
A - 124
Table O2: Modelled DRL costs, utilisations and operating lease proportions
Modelled DRL: Euros per service-hour
Proportion leased*
Aircraft Block-
hours per day
Revenue landings per day low base high max un-
known
B737-300 07:40 4.5 280 470 660 66% 7%
B737-400 08:00 4.3 350 580 810 57% 16%
B737-500 07:40 4.9 310 520 730 55% 3%
B737-800 09:00 4.8 440 740 1 030 50% 6%
B757-200 08:20 4.1 450 740 1 040 59% 13%
B767-300ER 11:20 2.0 690 1 150 1 610 53% 15%
B747-400 13:30 1.5 960 1 600 2 240 10% 0%
A319 07:50 4.9 420 690 970 28% 0%
A320 07:50 4.8 450 760 1 060 38% 8%
A321 08:00 4.6 550 910 1 280 35% 3%
ATR42 05:40 5.2 150 240 340 28% 14%
ATR72 06:20 6.0 200 330 460 14% 10%
Source(s): University of Westminster calculations on raw data from: IATA World Air Transport Statistics (2002), AEA Summary of Traffic and Airline Results (2003) and Aircraft Commerce (15) pp6-10 (February/March 2001)
The service hours calculated based on these assumptions and data average 12 hours for the non-widebody aircraft, and are 18 hours and 15 hours respectively (to the nearest hour) for the B747-400 and B767-300ER. It is also noted that when these DRL costs are calculated per service-hour per seat, the resulting values fall in the narrow range of 3.5 – 5.5 Euros per service-hour per seat, demonstrating an expected correlation between aircraft size and true DRL costs. Whilst the values shown in Table O2 are thus correctly used for the purposes of this Study to represent the strategic contribution per service-hour from DRL costs, such costs are more typically considered by AOs per block-hour. These may similarly be derived by simply using the “block-hours per day” of Table O2 as cost denominator. Expressing these per block-hour modelled values (values not shown) as a percentage of the BHDOC values derived in the main Report, produced the remarkably consistent results shown in Table O3.
* These values were estimated from the Airclaims database across all operators with the aircraft concerned. Those where the owner was indicated as a known operating lessor, were assumed to be on an operating lease. This is likely to over-estimate the actual proportions of operating leases for each aircraft type, and these proportions have not been used quantitatively in this Study, but they are a useful indication of the volume of the market controlled by lessors with a primary operating lease portfolio, and the relative unattractiveness of the widebody lease, exemplified by the B747-400. The higher rate for the B767-300ER represents, at least in part, operating leases to which AOs were tied before the more recent slump in the widebody operating lease market
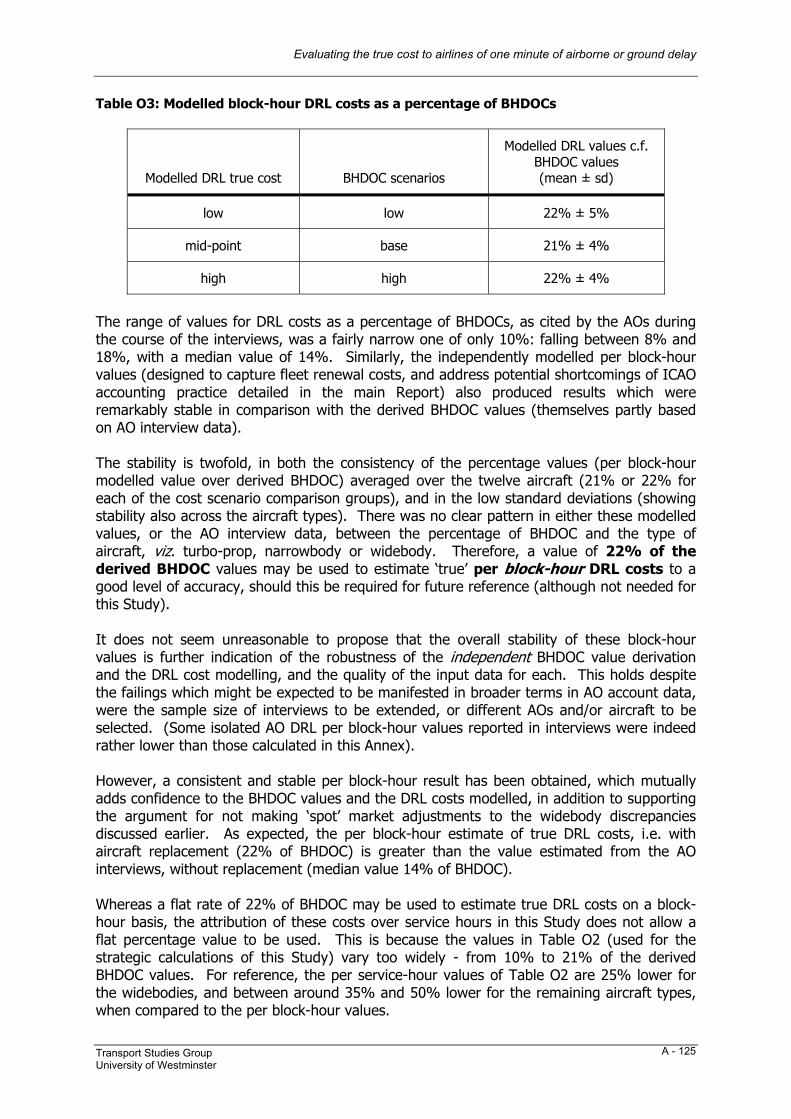
Evaluating the true cost to airlines of one minute of airborne or ground delay
Transport Studies Group University of Westminster
A - 125
Table O3: Modelled block-hour DRL costs as a percentage of BHDOCs
Modelled DRL true cost BHDOC scenarios
Modelled DRL values c.f. BHDOC values (mean ± sd)
low low 22% ± 5%
mid-point base 21% ± 4%
high high 22% ± 4%
The range of values for DRL costs as a percentage of BHDOCs, as cited by the AOs during the course of the interviews, was a fairly narrow one of only 10%: falling between 8% and 18%, with a median value of 14%. Similarly, the independently modelled per block-hour values (designed to capture fleet renewal costs, and address potential shortcomings of ICAO accounting practice detailed in the main Report) also produced results which were remarkably stable in comparison with the derived BHDOC values (themselves partly based on AO interview data). The stability is twofold, in both the consistency of the percentage values (per block-hour modelled value over derived BHDOC) averaged over the twelve aircraft (21% or 22% for each of the cost scenario comparison groups), and in the low standard deviations (showing stability also across the aircraft types). There was no clear pattern in either these modelled values, or the AO interview data, between the percentage of BHDOC and the type of aircraft, viz. turbo-prop, narrowbody or widebody. Therefore, a value of 22% of the derived BHDOC values may be used to estimate ‘true’ per block-hour DRL costs to a good level of accuracy, should this be required for future reference (although not needed for this Study). It does not seem unreasonable to propose that the overall stability of these block-hour values is further indication of the robustness of the independent BHDOC value derivation and the DRL cost modelling, and the quality of the input data for each. This holds despite the failings which might be expected to be manifested in broader terms in AO account data, were the sample size of interviews to be extended, or different AOs and/or aircraft to be selected. (Some isolated AO DRL per block-hour values reported in interviews were indeed rather lower than those calculated in this Annex). However, a consistent and stable per block-hour result has been obtained, which mutually adds confidence to the BHDOC values and the DRL costs modelled, in addition to supporting the argument for not making ‘spot’ market adjustments to the widebody discrepancies discussed earlier. As expected, the per block-hour estimate of true DRL costs, i.e. with aircraft replacement (22% of BHDOC) is greater than the value estimated from the AO interviews, without replacement (median value 14% of BHDOC). Whereas a flat rate of 22% of BHDOC may be used to estimate true DRL costs on a block-hour basis, the attribution of these costs over service hours in this Study does not allow a flat percentage value to be used. This is because the values in Table O2 (used for the strategic calculations of this Study) vary too widely - from 10% to 21% of the derived BHDOC values. For reference, the per service-hour values of Table O2 are 25% lower for the widebodies, and between around 35% and 50% lower for the remaining aircraft types, when compared to the per block-hour values.
Evaluating the true cost to airlines of one minute of airborne or ground delay
Transport Studies Group University of Westminster
A - 126
O2 Further background on aircraft financing and maintenance reserves The reader with less background knowledge of aircraft financing and maintenance reserves may find the following sections offer a useful supplement to the commentary provided in the main Report, although it was considered that its inclusion there was not central to the calculation and attribution of DRL costs. O2.1 Ownership The relative attractiveness of the various forms of financing to a given carrier will depend on many variables, which will vary from one airline to another, and will include a consideration of national taxation rules and the availability of export credits (government backed credit guarantees – less available in Europe). An operator with sufficient equity (although rarer in 2003 than at many other times) may find operating leasing too expensive an alternative relative to servicing debt. Debt terms made available to individual airlines will, of course, vary according to whether the carrier is considered a ‘weak credit’ or ‘strong credit’ case. The commonest depreciation methods are ‘current’ cost accounting (where the asset is re-valued during the depreciation term) and ‘historical’ (where the asset value is fixed). Different methods have been discussed by IATA and KPMG (32). The “industry standard” for depreciation is a term of around 25 – 30 years (35), although an AO could choose to fully depreciate over just 10 years (38). Using a typical straight-line depreciation over a 25 year term, to a residual value of 15%, gives a book depreciation of 3.4% per year (a residual of zero, e.g. for older aircraft, would push this up to 4.0%). Where debt is taken on, finance terms are usually over 12 – 15 years (38) (shorter terms are safer but earn less finance charges for the lender) after which an AO can operate the aircraft with low or zero finance charges for another 10 years or so. Levels of debt financing will vary according to market conditions, the credit risk of the airline, and the (residual value) risk associated with the aircraft. Debt financing is often in the range of 70 – 80%, or higher in stronger markets, of the fair market value of the aircraft, and, of course, higher still for internal financing within mega-lessors. These levels fall much lower, e.g. down to 50%, for older and higher-risk aircraft, and when market conditions (such as those of 2003) are such that debt financing is very difficult to obtain. Finance leases are typically (a little) cheaper than operating leases or sale and leasebacks (34), but usually only available to airlines with strong credit ratings. Apart from these, and the straight debt just referred to, the other major financing option for airline ownership is through the capital markets, e.g. through traded securitisations and Enhanced Equipment Trust Certificates (EETCs). EETCs are relatively complex, with bondholders having recourse to the aircraft if the AO defaults, i.e. the underlying asset is used as collateral. Although they are used widely in the US (mainly for narrowbodies – which may be considered to have a better guarantee of residual value), they are very little used in Europe, but capital markets are seen as a growth area in Europe (33), including in the area of re-financing. Non-mega lessors also tend to prefer the lower asset risks of the narrowbody market (35), although this is less of a problem with strong-credit lessees. Manufacturer financing has also increased since 11 September 2001, with both Airbus and Boeing providing back-stop financing to the AOs to help maintain delivery programmes, especially to strategic customers, even to the extent of providing the loans. This activity may decline in a future period of AO financial recovery.
Evaluating the true cost to airlines of one minute of airborne or ground delay
Transport Studies Group University of Westminster
A - 127
Low finance terms offered by the mega-lessors can be very attractive. They are able to achieve this due to their low internal costs of financing, furnished by the parent companies, with discounts of up to 25% on the aircraft list price reported even in 2000 (35), which are very likely to be even deeper in 2003 - it has been speculated that recent large orders by Ryanair (100 B737-800s) and easyJet (120 A319s) attracted nearer to 50% discounts. Lessors now order on a larger scale even than this, with concomitant advantages. Even outside the mega-lessor market, banks may prefer to provide debt to such lessors, rather than to airlines, because the lessors have lower failure rates. O2.2 Operating leases Although particularly attractive at times of fleet renewal, when deciding whether to then take on an operating lease, the AO needs to take care balancing the real financial benefits against operating an owned aircraft with little or no financing charges remaining, for example. On the other hand, operating lease terms which have not been renegotiated*, such as for older aircraft (e.g. even with an operating lease on a zero-worth asset), may be higher than for new aircraft, making the latter a more attractive option, especially whilst lease rates are as low as in 2003. Cost efficiencies of family homogeneity (e.g. in maintenance and Cross Crew Qualification) and the lower cash operating costs of new(er) aircraft are also drivers of change, although usually at the expense of some reduction in scheduling flexibility. The larger, more homogenous, US market tends to have lower operating lease rates than Europe (35). Sale and leaseback of owned aircraft, often (also) used for older aircraft which the airline is phasing out from its fleet or retiring, but increasingly used on AOs own, new deliveries, may be used by AOs for several reasons, for example: to raise cash through the release of equity on the aircraft; to lower the finance charge to a new lease rate; to pass on the residual value risk and/or to make the balance sheet look more attractive to investors. The leaseback is as an operating lease, typically for 3 – 10 years (34). O2.3 Maintenance reserves Lessors will typically arrange for maintenance reserves to be paid by the lessee to cover expected maintenance costs, although for longer leases the AO itself may assume such maintenance responsibilities (monitored by the lessor). Engines are at their most stressed condition every time they go to take-off power, such that the cost of overhaul varies much more strongly as a factor of sector length, rather than flight hours per se (45). Maintenance reserve calculations are thus typically based on the expected utilisation and hour-to-cycle ratio (45), and either paid in advance, or monthly in arrears, e.g. based on actual airborne hours recorded in the log book (43). Whatever the payment mechanism, maintenance reserve payments will be differentiated from the lease rental itself, and should appear under maintenance costs in ICAO accounting.
* Where lease rate reductions are negotiated by AOs in distress (e.g. those bordering Chapter 11 and/or with exhausted cash reserves) these losses are typically recovered by lessors by extending the term, or by an agreed, later increase in the rate.
Evaluating the true cost to airlines of one minute of airborne or ground delay
Transport Studies Group University of Westminster
A - 128
Annex P: Calculation of strategic opportunity cost based on flight value
The possibility of assessing strategic costs of delay using a re-optimised network model, under the assumption of reduced delays, has been discussed in the main Report. In this Annex, further considerations which would need to be accounted for in a rigorous treatment of such costs are explored. Although such a treatment was outside the remit of this Study, this Annex does go on to make a rudimentary estimate of these costs, based on a simplified example, based on flight ‘value’. The question at hand is an easy one to pose: if contingencies for delays could be reduced, how could an airline improve its network? This is far more difficult to answer, however. Two basic methods present themselves: a bottom-up approach, or a top-down approach. A bottom-up approach would certainly be the more rigorous of the two, and could involve a simulation of the new network, examining specific delay contingencies, their associated costs, and how such costs change under assumptions of reduced delay. An obvious example here is that of schedule buffers. If an airline were able to predict in advance, i.e. at the strategic level when planning its next season’s schedules, that it could reduce particular schedule buffers by specific amounts, it would be possible to obtain better aircraft utilisation once these savings reached critical thresholds (clearly, reducing buffers here and there by 1 or 2 minutes would have no practical effect at all). As was observed in the main Report, and as Wu and Caves point out in their model of aircraft rotation optimisation (10), a good model should allocate more buffer time to early segments in order to mitigate against delay to subsequent rotations, as is common airline practice. In a similar study (31), Caves and Wu describe how the aircraft turnaround process has been studied in the literature by using analytical methods and critical path methods, but state that these models have not been successful in capturing vital stochastic characteristics (such as the uncertainty of ground turnaround times). These authors hence adopted a Markov Chain model to capture such effects. Since the Markov Chain approach can indeed capture transition behaviour from ‘nominal’ to ‘disrupted’ states, and this Study concurs with the requirement to capture such behaviour, this would certainly be an eligible candidate method for the calculation of these opportunity costs – for example through iterations of disrupted state combinations. Furthermore, Caves and Wu demonstrate a good fit with certain key performance metrics, based on an (undisclosed) European airline case study, although the findings of their research were at too theoretical a level to directly benefit this Study. Such a methodology, if it were to be fully comprehensive, would also have to be extended to cover such issues as passenger service staff, maintenance overheads, and the whole raft of similar costs which cannot be assigned at the gate-to-gate level, which would clearly be a very substantial task. Critically, such a model would also have to take account of how AOs actually respond to delay, and cannot be based on abstract calculation alone.
Evaluating the true cost to airlines of one minute of airborne or ground delay
Transport Studies Group University of Westminster
A - 129
The alternative approach, but clearly one which is much less robust, is to make a top-down calculation. One such approach is to focus on the effect of reducing schedule buffers on the number of rotations an aircraft may make in one operational day. Taking the very simple case of an aircraft rotating between X and Y for the whole day, and assuming a requirement for it to return to its homebase at night, and where: T = total time of operations (from morning readiness at X to touch-down on final return leg) ta
XY = actual airborne time, per rotation, from X to Y (from take-off to touch-down) t’
XY = airborne saving due to reduced airborne buffer, per rotation, from X to Y
tg
X = total ground time at X (including taxi) t’
X = ground time saving due to reduced ground buffer, per rotation, at X
then the number of extra rotations possible, assuming 100% utilisation of all extra time gained as a result of reduced buffers, is given by:
+++−−−
−
−−−−+++
+++−−−= a
YXgY
aXY
gX
aYX
gY
aXY
aYX
gY
aXY
gX
aYX
gY
aXY
gX
aYX
gY
aXY
aYX
gY
aXY
e tttttttTInt
ttttttttttttttTIntR ''''
'''
If this model is simplified by removing the asymmetries of direction, and similarly equalising ground times and ground savings at X and Y, by setting: ta
XY = taYX = A (‘Airborne’ time for each rotation)
tg
X = tgY = G (‘Ground’ time for each rotation)
and: t’aXY = t’aYX = A’ (amount by which each airborne buffer reduced) t’gX = t’gY = G’ (amount by which each ground buffer reduced) then the formula above can be simplified to:
+
−−−
−−+−+−+
=)(2
2)(2
)(2''
''
GAGATInt
GAGAGGAAT
IntRe
The results of applying this formula to two example flight time and total ground time scenarios, with typical 14- and 15-hour operational days are shown in the following tables:
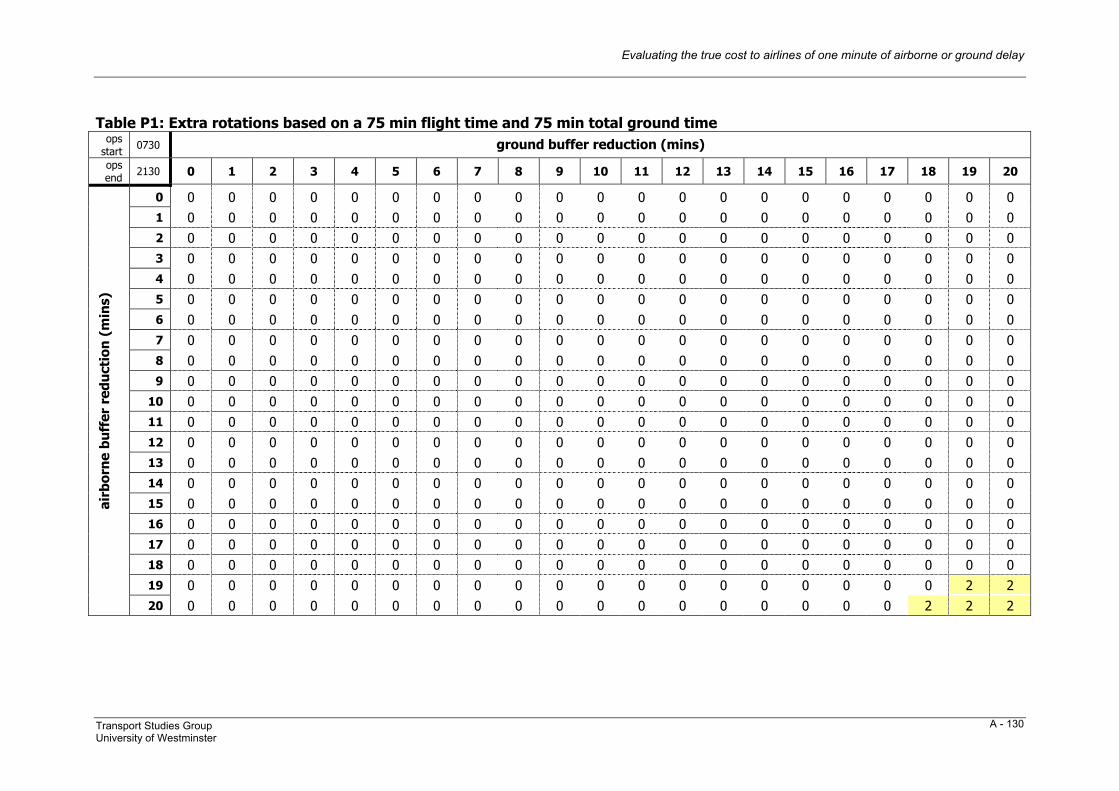
Evaluating the true cost to airlines of one minute of airborne or ground delay
Transport Studies Group University of Westminster
A - 130
Table P1: Extra rotations based on a 75 min flight time and 75 min total ground time
ops start 0730 ground buffer reduction (mins) ops end 2130 0 1 2 3 4 5 6 7 8 9 10 11 12 13 14 15 16 17 18 19 20
0 0 0 0 0 0 0 0 0 0 0 0 0 0 0 0 0 0 0 0 0 0 1 0 0 0 0 0 0 0 0 0 0 0 0 0 0 0 0 0 0 0 0 0 2 0 0 0 0 0 0 0 0 0 0 0 0 0 0 0 0 0 0 0 0 0 3 0 0 0 0 0 0 0 0 0 0 0 0 0 0 0 0 0 0 0 0 0 4 0 0 0 0 0 0 0 0 0 0 0 0 0 0 0 0 0 0 0 0 0 5 0 0 0 0 0 0 0 0 0 0 0 0 0 0 0 0 0 0 0 0 0 6 0 0 0 0 0 0 0 0 0 0 0 0 0 0 0 0 0 0 0 0 0 7 0 0 0 0 0 0 0 0 0 0 0 0 0 0 0 0 0 0 0 0 0 8 0 0 0 0 0 0 0 0 0 0 0 0 0 0 0 0 0 0 0 0 0 9 0 0 0 0 0 0 0 0 0 0 0 0 0 0 0 0 0 0 0 0 0
10 0 0 0 0 0 0 0 0 0 0 0 0 0 0 0 0 0 0 0 0 0 11 0 0 0 0 0 0 0 0 0 0 0 0 0 0 0 0 0 0 0 0 0 12 0 0 0 0 0 0 0 0 0 0 0 0 0 0 0 0 0 0 0 0 0 13 0 0 0 0 0 0 0 0 0 0 0 0 0 0 0 0 0 0 0 0 0 14 0 0 0 0 0 0 0 0 0 0 0 0 0 0 0 0 0 0 0 0 0 15 0 0 0 0 0 0 0 0 0 0 0 0 0 0 0 0 0 0 0 0 0 16 0 0 0 0 0 0 0 0 0 0 0 0 0 0 0 0 0 0 0 0 0 17 0 0 0 0 0 0 0 0 0 0 0 0 0 0 0 0 0 0 0 0 0 18 0 0 0 0 0 0 0 0 0 0 0 0 0 0 0 0 0 0 0 0 0 19 0 0 0 0 0 0 0 0 0 0 0 0 0 0 0 0 0 0 0 2 2
airb
orn
e bu
ffer
red
uct
ion
(m
ins)
20 0 0 0 0 0 0 0 0 0 0 0 0 0 0 0 0 0 0 2 2 2
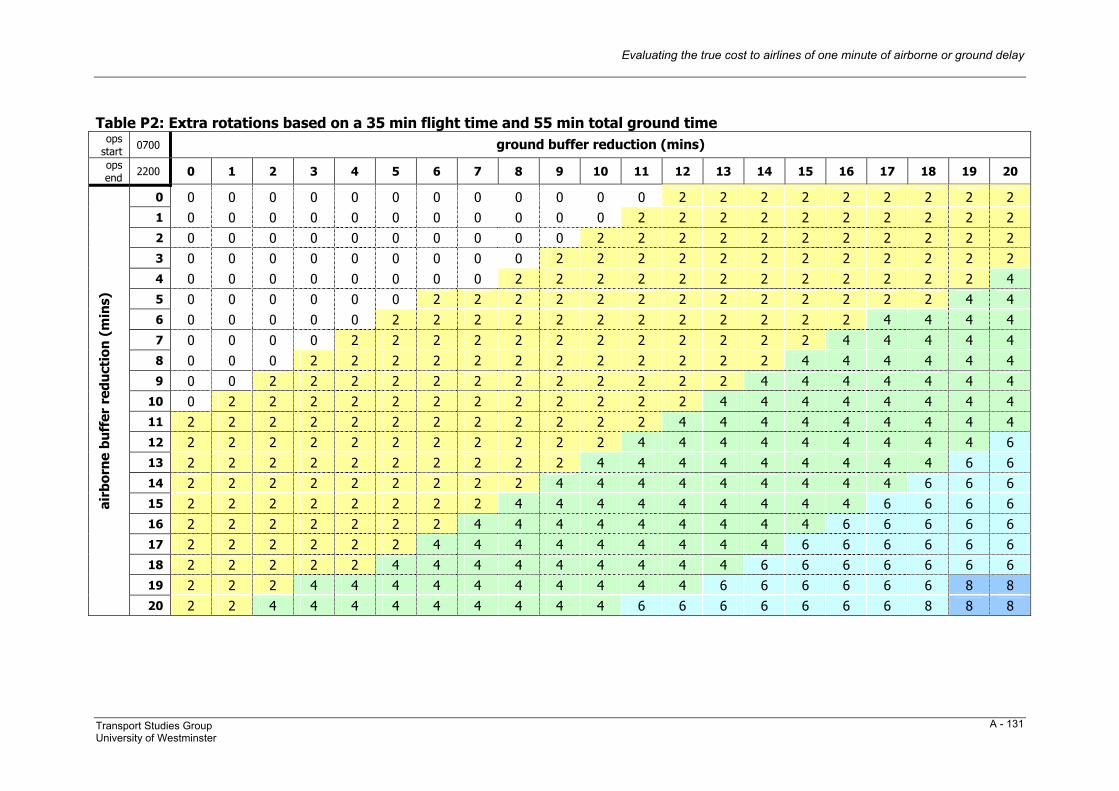
Evaluating the true cost to airlines of one minute of airborne or ground delay
Transport Studies Group University of Westminster
A - 131
Table P2: Extra rotations based on a 35 min flight time and 55 min total ground time
ops start 0700 ground buffer reduction (mins) ops end 2200 0 1 2 3 4 5 6 7 8 9 10 11 12 13 14 15 16 17 18 19 20
0 0 0 0 0 0 0 0 0 0 0 0 0 2 2 2 2 2 2 2 2 2 1 0 0 0 0 0 0 0 0 0 0 0 2 2 2 2 2 2 2 2 2 2 2 0 0 0 0 0 0 0 0 0 0 2 2 2 2 2 2 2 2 2 2 2 3 0 0 0 0 0 0 0 0 0 2 2 2 2 2 2 2 2 2 2 2 2 4 0 0 0 0 0 0 0 0 2 2 2 2 2 2 2 2 2 2 2 2 4 5 0 0 0 0 0 0 2 2 2 2 2 2 2 2 2 2 2 2 2 4 4 6 0 0 0 0 0 2 2 2 2 2 2 2 2 2 2 2 2 4 4 4 4 7 0 0 0 0 2 2 2 2 2 2 2 2 2 2 2 2 4 4 4 4 4 8 0 0 0 2 2 2 2 2 2 2 2 2 2 2 2 4 4 4 4 4 4 9 0 0 2 2 2 2 2 2 2 2 2 2 2 2 4 4 4 4 4 4 4
10 0 2 2 2 2 2 2 2 2 2 2 2 2 4 4 4 4 4 4 4 4 11 2 2 2 2 2 2 2 2 2 2 2 2 4 4 4 4 4 4 4 4 4 12 2 2 2 2 2 2 2 2 2 2 2 4 4 4 4 4 4 4 4 4 6 13 2 2 2 2 2 2 2 2 2 2 4 4 4 4 4 4 4 4 4 6 6 14 2 2 2 2 2 2 2 2 2 4 4 4 4 4 4 4 4 4 6 6 6 15 2 2 2 2 2 2 2 2 4 4 4 4 4 4 4 4 4 6 6 6 6 16 2 2 2 2 2 2 2 4 4 4 4 4 4 4 4 4 6 6 6 6 6 17 2 2 2 2 2 2 4 4 4 4 4 4 4 4 4 6 6 6 6 6 6 18 2 2 2 2 2 4 4 4 4 4 4 4 4 4 6 6 6 6 6 6 6 19 2 2 2 4 4 4 4 4 4 4 4 4 4 6 6 6 6 6 6 8 8
airb
orn
e bu
ffer
red
uct
ion
(m
ins)
20 2 2 4 4 4 4 4 4 4 4 4 6 6 6 6 6 6 6 8 8 8
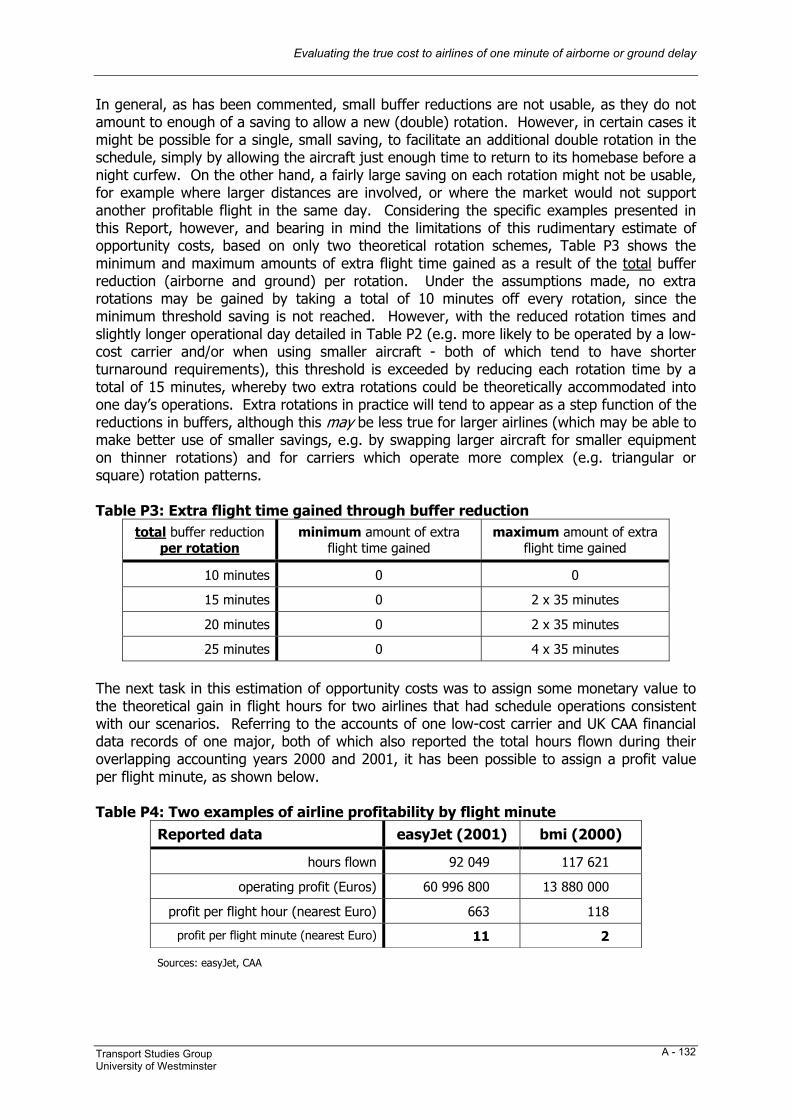
Evaluating the true cost to airlines of one minute of airborne or ground delay
Transport Studies Group University of Westminster
A - 132
In general, as has been commented, small buffer reductions are not usable, as they do not amount to enough of a saving to allow a new (double) rotation. However, in certain cases it might be possible for a single, small saving, to facilitate an additional double rotation in the schedule, simply by allowing the aircraft just enough time to return to its homebase before a night curfew. On the other hand, a fairly large saving on each rotation might not be usable, for example where larger distances are involved, or where the market would not support another profitable flight in the same day. Considering the specific examples presented in this Report, however, and bearing in mind the limitations of this rudimentary estimate of opportunity costs, based on only two theoretical rotation schemes, Table P3 shows the minimum and maximum amounts of extra flight time gained as a result of the total buffer reduction (airborne and ground) per rotation. Under the assumptions made, no extra rotations may be gained by taking a total of 10 minutes off every rotation, since the minimum threshold saving is not reached. However, with the reduced rotation times and slightly longer operational day detailed in Table P2 (e.g. more likely to be operated by a low-cost carrier and/or when using smaller aircraft - both of which tend to have shorter turnaround requirements), this threshold is exceeded by reducing each rotation time by a total of 15 minutes, whereby two extra rotations could be theoretically accommodated into one day’s operations. Extra rotations in practice will tend to appear as a step function of the reductions in buffers, although this may be less true for larger airlines (which may be able to make better use of smaller savings, e.g. by swapping larger aircraft for smaller equipment on thinner rotations) and for carriers which operate more complex (e.g. triangular or square) rotation patterns. Table P3: Extra flight time gained through buffer reduction
total buffer reduction per rotation
minimum amount of extra flight time gained
maximum amount of extra flight time gained
10 minutes 0 0
15 minutes 0 2 x 35 minutes
20 minutes 0 2 x 35 minutes
25 minutes 0 4 x 35 minutes
The next task in this estimation of opportunity costs was to assign some monetary value to the theoretical gain in flight hours for two airlines that had schedule operations consistent with our scenarios. Referring to the accounts of one low-cost carrier and UK CAA financial data records of one major, both of which also reported the total hours flown during their overlapping accounting years 2000 and 2001, it has been possible to assign a profit value per flight minute, as shown below. Table P4: Two examples of airline profitability by flight minute
Reported data easyJet (2001) bmi (2000)
hours flown 92 049 117 621
operating profit (Euros) 60 996 800 13 880 000
profit per flight hour (nearest Euro) 663 118
profit per flight minute (nearest Euro) 11 2
Sources: easyJet, CAA
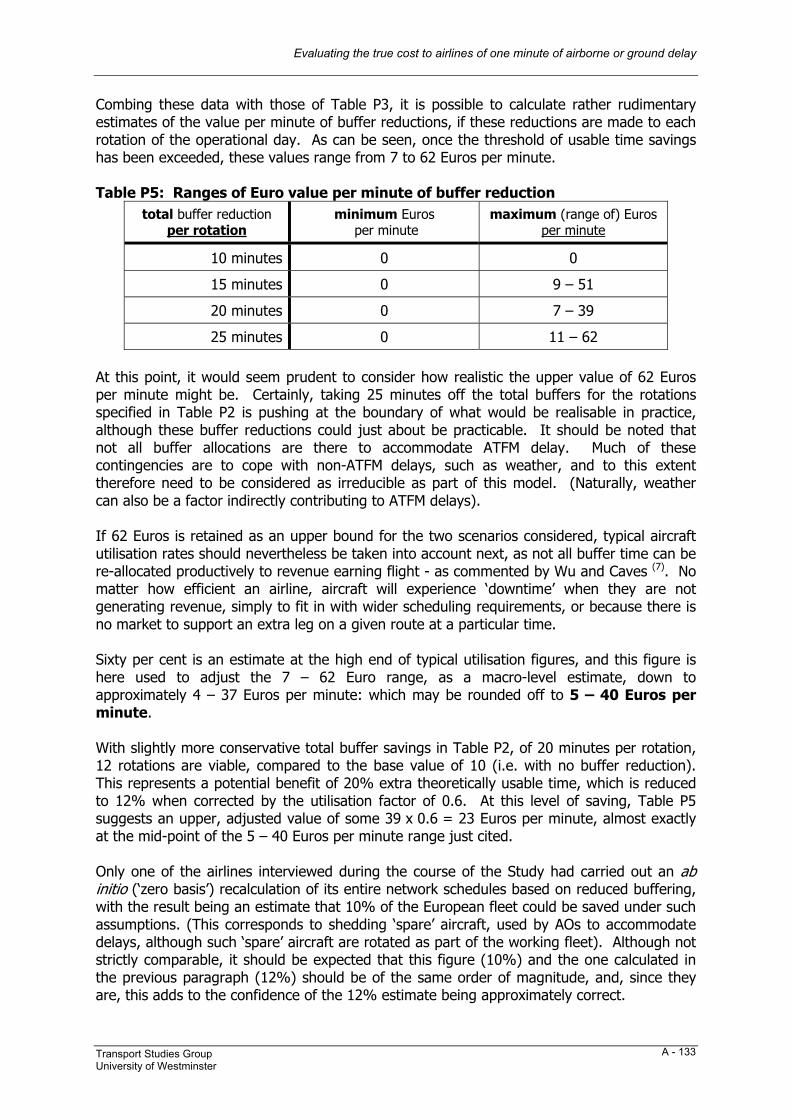
Evaluating the true cost to airlines of one minute of airborne or ground delay
Transport Studies Group University of Westminster
A - 133
Combing these data with those of Table P3, it is possible to calculate rather rudimentary estimates of the value per minute of buffer reductions, if these reductions are made to each rotation of the operational day. As can be seen, once the threshold of usable time savings has been exceeded, these values range from 7 to 62 Euros per minute. Table P5: Ranges of Euro value per minute of buffer reduction
total buffer reduction per rotation
minimum Euros per minute
maximum (range of) Euros per minute
10 minutes 0 0
15 minutes 0 9 – 51
20 minutes 0 7 – 39
25 minutes 0 11 – 62 At this point, it would seem prudent to consider how realistic the upper value of 62 Euros per minute might be. Certainly, taking 25 minutes off the total buffers for the rotations specified in Table P2 is pushing at the boundary of what would be realisable in practice, although these buffer reductions could just about be practicable. It should be noted that not all buffer allocations are there to accommodate ATFM delay. Much of these contingencies are to cope with non-ATFM delays, such as weather, and to this extent therefore need to be considered as irreducible as part of this model. (Naturally, weather can also be a factor indirectly contributing to ATFM delays). If 62 Euros is retained as an upper bound for the two scenarios considered, typical aircraft utilisation rates should nevertheless be taken into account next, as not all buffer time can be re-allocated productively to revenue earning flight - as commented by Wu and Caves (7). No matter how efficient an airline, aircraft will experience ‘downtime’ when they are not generating revenue, simply to fit in with wider scheduling requirements, or because there is no market to support an extra leg on a given route at a particular time. Sixty per cent is an estimate at the high end of typical utilisation figures, and this figure is here used to adjust the 7 – 62 Euro range, as a macro-level estimate, down to approximately 4 – 37 Euros per minute: which may be rounded off to 5 – 40 Euros per minute. With slightly more conservative total buffer savings in Table P2, of 20 minutes per rotation, 12 rotations are viable, compared to the base value of 10 (i.e. with no buffer reduction). This represents a potential benefit of 20% extra theoretically usable time, which is reduced to 12% when corrected by the utilisation factor of 0.6. At this level of saving, Table P5 suggests an upper, adjusted value of some 39 x 0.6 = 23 Euros per minute, almost exactly at the mid-point of the 5 – 40 Euros per minute range just cited. Only one of the airlines interviewed during the course of the Study had carried out an ab initio (‘zero basis’) recalculation of its entire network schedules based on reduced buffering, with the result being an estimate that 10% of the European fleet could be saved under such assumptions. (This corresponds to shedding ‘spare’ aircraft, used by AOs to accommodate delays, although such ‘spare’ aircraft are rotated as part of the working fleet). Although not strictly comparable, it should be expected that this figure (10%) and the one calculated in the previous paragraph (12%) should be of the same order of magnitude, and, since they are, this adds to the confidence of the 12% estimate being approximately correct.
Evaluating the true cost to airlines of one minute of airborne or ground delay
Transport Studies Group University of Westminster
A - 134
Clearly, the shortcomings of this rudimentary estimate are not to be overlooked. Not only is it based on only two scenarios and profitability data for only two airlines, but the approach further assumes a direct proportionality between revenue and rotations, thus neglecting non-linear effects, which are likely to be more pronounced with certain opportunity costs, such as those of passenger service staff. The estimate also depends on the profitability of the airline selected. Since many carriers will currently be operating in deficit, using loss-making airline data in Table P4 would of course imply that buffers should be increased! It should also be borne in mind that this simple model has also reduced the existing (‘non-extra’) rotational times, to which per-minute values had been assigned. Instead of reducing the existing value, however, it is implicitly assumed that these shorter rotations would cost less to operate and also be higher in the CRS, so could attain higher market share (assuming other AOs did not make the same buffer reduction). Implicitly, the existing value is assumed to remain constant. Notwithstanding the limitations of this approach, the values arrived at are likely to be a reasonable estimate of the order of magnitude of the opportunity cost of delay, and it is noteworthy that these values are broadly comparable with the tactical, at-gate costs of delay for the 65-minute, low cost scenario (with network reactionary effect – see main Report). These values should be compared with some degree of caution, however, since the opportunity cost requires the ‘buffer delay’ to be applied to every rotation, whereas the tactical cost is valid when applied to a single rotation.
A rudimentary estimate of the strategic, per-minute opportunity costs of delay (i.e. as fixed into schedule buffers for each rotation), based on a simple flight ‘value’ model, gives costs broadly comparable with per-minute costs of short (15 minute) high cost scenario at-gate, tactical delays (e.g. CTOT delays).
Whilst the lower limit of opportunity costs is zero, those for tactical delays are all non-zero (as some cost is always incurred for the latter).