report documentation page - dtic.mil report documentation page form approved ... to finish my degree...
TRANSCRIPT
REPORT DOCUMENTATION PAGE form Approved OMB No. 0704-0188
Public reporting burden for this collection of information is estimated to average 1 hour per response, including the time for reviewing instructions, searching existing data sources, gathering and maintaining the data needed, and completing and reviewing the collection of information. Send comments regarding this burden estimate or any other aspect of this collection of information, including suggestions for reducing this burden, to Washington Headquarters Services, Directorate for Information Operations and Reports, 1215 Jefferson Davis Highway, Suite 1204, Arlington, VA 222024302, and to the Office of Management and Budget, Paperwork Reduction Project (0704-0188), Washington, DC 20503.
1. AGENCY USE ONLY (Leave blank) 2. REPORT DATE
8.Feb.99
3. REPORT TYPE AND DATES COVERED
THESIS 4. TITLE AND SUBTITLE
VELOCITY FIELD OVER DELTA WINGS AT HIGH ANGLES OF ATTACK
6. AUTHOR(S)
2D LT O'DOWD DEVIN O
5. FUNDING NUMBERS
7. PERFORMING ORGANIZATION NAME(S) AND ADDRESS(ES)
UNIVERSITY OF WASHINGTON 8. PERFORMING ORGANIZATION
REPORT NUMBER
9. SPONSORING/MONITORING AGENCY NAME(S) AND ADDRESS(ES)
THE DEPARTMENT OF THE AIR FORCE AFIT/CIA, BLDG 125 2950 P STREET WPAFB OH 45433
10. SPONSORING/MONITORING AGENCY REPORT NUMBER
FY99-81
11. SUPPLEMENTARY NOTES
12a. DISTRIBUTION AVAILABILITY STATEMENT
Unlimited distribution In Accordance With AFI 35-205/AFIT Sup 1
12b. DISTRIBUTION CODE
13. ABSTRACT (Maximum 200 words)
I 99902191 31
14. SUBJECT TERMS IS. NUMBER OF PAGES
16. PRICE CODE
20. LIMITATION OF ABSTRACT 17. SECURITY CLASSIFICATION OF REPORT
18. SECURITY CLASSIFICATION OF THIS PAGE
19. SECURITY CLASSIFICATION OF ABSTRACT
Standard Form 298 (Rev. 2-89) (EG) Prescribed by ANSI Std. 239.18 Designed using Perform Pro, WHS/DIOR, Oct 94

Velocity Field Over Delta Wings at High Angles of Attack
by
Devin 0. O'Dowd
A thesis submitted in partial fulfillment of the requirements for the degree of
Master of Science in Aeronautics and Astronautics
university of Washington
1998
Approved by u^t . r^X (Chairman of Supervisory Committee]
Program Authorized To Offer Degree Aeronautics and Astronautics
Date August 19, 1998

In presenting this thesis in partial fulfillment of the requirements for a Master's degree at the University of Washington, I agree that the Library shall make its copies freely available for inspection. I further agree that extensive copying of this thesis is allowable only for scholarly purposes, consistent with "fair use" as prescribed in the U.S. Copyright Law. Any other reproduction for any purposes or by any means shall not be allowed without my written permission.
Signature ßJ^Lj^i Jr-HA>X
Date 2/ Ou^e, <=$

University of Washington
Abstract
Velocity Field Over Delta Wings at High Angles of Attack
By Devin 0. 0'Dowd
Chairman of Supervisory Committee: Professor Mitsuru Kurosaka
Department of Aeronautics and Astronautics
Water tunnel experiments were conducted to understand
the nature of vortex breakdown over delta wings at high
angles of attack and at various yaw angles. Two delta
wings with the same sweep angle but different chords and
slightly different thicknesses were placed inside the water
tunnel. Experiments were conducted using two techniques,
Laser Induced Fluorescence (LIF) and Particle Image
Velocimetry (PIV).
Results showed that the core flow experiences an
increase in velocity until breakdown followed by a sharp
decrease in velocity. As the angle of attack increases,
the core flow inside the vortices slows down, in general,
and the strength of the vortices increases. As yaw
increases, the windward side vortex increases in strength
and moves upstream while the leeward side vortex decreases
in strength and moves downstream. At a critical yaw angle,
the leeward side vortex leaves the plate and this vortex
neither leaves the plate, nor experiences an increase in
velocity such as the windward vortex does.

Table of Contents
page List of Figures ii
List of Tables v
List of Symbols vi
Chapter 1: Introduction . 1 1.1 Definition 2 1.2 Understanding the Theory 3 1.3 Problems with Breakdown 5 1.4 Present Study 6
Chapter 2: Experimental Facility and Techniques 7 2.1 Water Tunnel and Jet Supply System 7 2.2 Laser Induced Fluorescence Technique 9 2.3 Particle Image Velocimetry Technique 12
Chapter 3: Experimental Results 17 3.1 Velocity Calibration 18 3.2 Parallel Plane Flow 21 3.3 Transverse Plane 40
Chapter 4: Conclusions 48 4.1 Summary of Results 4 8 4 . 2 Future Research 49
4.2.1 Transition 50 4.2.2 Non-straight Leading Edge 50
References 51

List of Figures
page Figure 2-1: University of Washington Water Tunnel
Facility 8
Figure 2-2: Support of Delta Wings 9
Figure 2-3: LIF Set-up, Core Flow 11
Figure 2-4: LIF Set-up, Vortex Core Plane 11
Figure 2-5: Particle Image Velocimetry Set-up 13
Figure 3-1: PIV Calibration Conversion 20
Figure 3-2: Delta Wings Used 22
Figure 3-3: Definition of Angles and Vortices 22
Figure 3-4: Vortex Strength (oz) , Core-wise View, a = 20° 26
Figure 3-5: Vortex Strength (coz) , Core-wise View, a = 30° 27
Figure 3-6: Sign Switch of Vorticity 27
Figure 3-7: LIF Picture, a = 20° 28
Figure 3-8: LIF Picture, a = 30° 28
Figure 3-9: Velocity Field, a = 30°, ß = 0°, apex to 0.25c 30
Figure 3-10: Velocity Field, a = 30°, ß = 0°, 0.25c to 0.5c 30
Figure 3-11: Velocity Field, a = 30°, ß = 0° 31
Figure 3-12: LIF, a = 30°, ß = 30° 32
Figure 3-13: LIF, a = 40°, ß = 45° 33
n

page Figure 3-14: Windward Side Velocity Field, a = 30°,
ß = 45°, apex to 0.15c 34
Figure 3-15: Windward Side Velocity Field, a = 30°, ß = 45°, 0.15c to 0.25c (including breakdown) 34
Figure 3-16: Windward Side Velocity Field, a = 30°, P = 45° 35
Figure 3-17: Leeward Side Velocity Field, a = 30°, ß = 45°, apex to 0.2c 36
Figure 3-18: Leeward Side Velocity Field, a = 30°, ß = 45°, 0.2c to 0.4c 36
Figure 3-19: Leeward Side Velocity Field, a = 30°, ß = 45°, 0.4c to 0.6c 37
Figure 3-20: Leeward Side Velocity Field, a = 30°, ß = 45°, 0.6c to 0.8c 37
Figure 3-21: Windward Side Velocity Field, a = 30°, ß = 45° 38
Figure 3-22: Effect of Yaw Angle on Leeward Vortex Core 39
Figure 3-23: Asymmetry in the Flow 39
Figure 3-24: Sketch of Transverse Plane View 41
Figure 3-25: a = 30°, x/c = 0.1, Lower Vortex 41
Figure 3-26: a = 30°, x/c = 0.1, Lower Vortex 42
Figure 3-27: a = 30°, x/c = 0.4, Lower Vortex 43
Figure 3-28: Angle of Vortex off Wing, Zero Yaw .... 43
Figure 3-29: Effect of Yaw on Vortices 44
in

page
Figure 3-30: cox, a = 30°, x/c = 0.3, Windward Side Vortex 45
Figure 3-31: cox, a = 30°, x/c = 0.3, Leeward Side Vortex 45
IV

List of Tables
page Table 2-1: Synchronizer Set-up 14
Table 3-1: Location of Breakdown 23
v
List of Symbols
c Chord
u Stream-wise Velocity
v Lateral Velocity
V Velocity
x Stream-wise Direction
x/c Chord Position in Percentage of Chord
y Lateral Direction
z Vertical Direction
a Angle of Attack
ß Yaw Angle
co Vorticity
Subscripts
inf upstream Conditions
x Stream-wise Direction
y Lateral Direction
z Vertical Direction
VI

Acknowledgments
I would first like to thank the sovereign and personal
Triune God for the ability and the privilege to work on
this research. Without Him, I would not be able to even
understand, let alone accomplish this work. To God alone
be the glory.
I would also like to thank my advisor, Professor
Mitsuru Kurosaka, whose patience and enthusiasm helped me
to finish my degree in a timely manner. Without his help
and support, this study would not have been possible.
I also wish to thank the U.S. Air Force and the Air
Force Institute of Technology for the wonderful opportunity
to receive an advanced degree.
In addition, I would like to thank those who supported
me in my research. Sutthiphong Srigrarom (Spot), whose
help in teaching me how the water tunnel operates along
with the various techniques applied, was always there to
lend a hand. Thanks to Dennis Peterson, Greg Lipski, and
Spot, who helped me design and build the transition mount.
Thanks also to Denise Yamagata and Maj Brenda Haven, USAF,
who were always just a phone call away when I needed help
with the computer programs.
I would also like to thank the office staff (Wanda
Frederick, Diane Collum, Mario Anderson, and Lillian Lee)
for their support and for listening to me when I was having
problems.
Finally, I wish to thank my family for their continued
support throughout the years.
Vll

Chapter 1: Introduction
The study of vortex breakdown over delta wings at high
angles of attack (AOA) has been an interest to researchers,
mathematicians, and aircraft designers for decades. It is
a very hot topic as it relates to many aircraft being
designed today and because no complete understanding
exists. Most of the understanding that does exist comes in
the form of the problems associated with vortex breakdown.
Many question if it is possible to control the breakdown to
avoid the problems and to aid the aircraft in
maneuverability. The purpose of this study is to lay the
foundation for future research at the University of
Washington, so that the identity to the cause of the vortex
breakdown may be found.
Before discussing the results of the present research,
an awareness of what vortex breakdown is, the problems
2 associated with it, and how it can be used to improve the
aircraft is necessary.
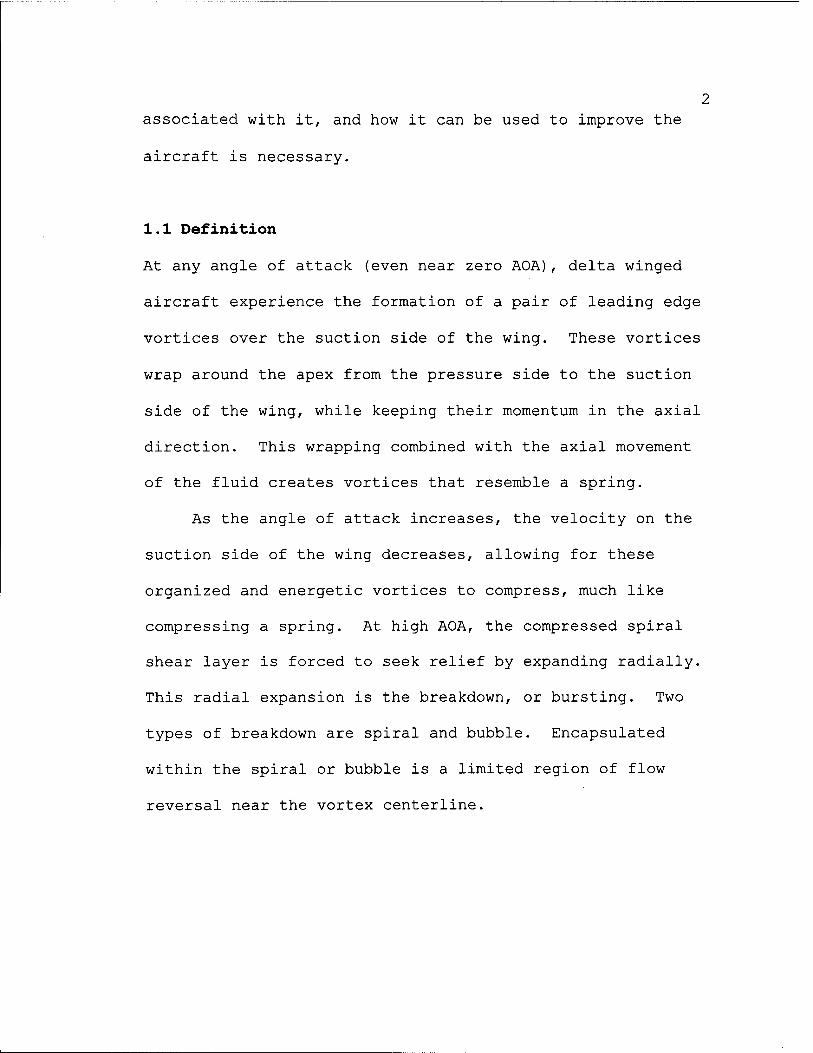
1.1 Definition
At any angle of attack (even near zero AOA), delta winged
aircraft experience the formation of a pair of leading edge
vortices over the suction side of the wing. These vortices
wrap around the apex from the pressure side to the suction
side of the wing, while keeping their momentum in the axial
direction. This wrapping combined with the axial movement
of the fluid creates vortices that resemble a spring.
As the angle of attack increases, the velocity on the
suction side of the wing decreases, allowing for these
organized and energetic vortices to compress, much like
compressing a spring. At high AOA, the compressed spiral
shear layer is forced to seek relief by expanding radially.
This radial expansion is the breakdown, or bursting. Two
types of breakdown are spiral and bubble. Encapsulated
within the spiral or bubble is a limited region of flow
reversal near the vortex centerline.

1.2 Understanding the Theory
Most engineers claim they understand the theory behind the
breakdown, as the majority of the articles published
confirm this. Others claim that no understanding exists.
One article from 1977 said that "the embarrassing number of
different theoretical notions has not, it must be admitted,
led to satisfactory understanding of the flows observed"
(Faler, 1977) . Even a recent article states that "a
comprehensive theory of vortex breakdown still does not
exist" (Spall, 1996).
Whether the theory is known or not, the problem does
exist and must be solved. However, the first step at
solving the problem is to understand the nature of the
vortices at different situations. An aircraft must be able
to maneuver in six degrees of freedom. An understanding of
the vortices must be sought at some of these maneuvering
conditions. With any success, the engineer will be able to
control these vortices so as to avoid the problems
associated with vortex breakdown and perhaps even take
advantage of the breakdown. The engineer will also be able
to achieve controllable maneuver at high AOA for both
steady and unsteady situations.

4 Many claims have been made as to the physics of the
flow field over the surface of the wing. Several
instabilities have been identified as relating to the
leading-edge vortex flow field. Gadel-Hak and Blackwelder
(1985) identified discrete vortices from the leading edge
of the delta wing that convect around the primary vortex
after they emanate from the leading edge of the wing.
Payne (1988) and Shi (1987) have also observed this
instability. These researchers attributed the emergence of
these small-scale vortices to the Kelvin-Helmholtz type
instability.
Another observation was the appearance of a stationary
longitudinal instability which they associated to the
curvature of the separated shear layer (Lowson, 1995).
Visbal and Gordnier confirmed this observation in their
Navier-Stokes computational study and claimed that this
unsteady vortex shedding is triggered by the interaction
between the primary vortex and the surface of the wing.
Though many observations and claims have been made,
the true identity to the cause of the vortex breakdown is
not fully known.
1.3 Problems with Breakdown
At high AOA, these organized and energetic vortices
breakdown (burst), causing many problems. One problem is
the vortices lose their effectiveness to generate high
normal forces after developing the large-scale
instabilities. This is not a suitable condition for an
aircraft that requires these forces to fly.
Another problem is that the burst vortices generate
large buffeting problems on the wing. This is probably one
of the most infamous problems. These problems have become
evident on such delta-winged aircraft as the F-22 and Joint
Strike Fighter (JSF).
Other problems that engineers have noticed is that the
breakdown leads to aircraft motion instabilities, the
hysteresis phenomena, and cross coupling between various
degrees of freedom of the motion of the aircraft (Shih
1996).
Solving the problem means the minimizing of the damage
placed on the aircraft due to breakdown and the better
operation of the aircraft.

1.4 Present Study
The present study will look at the location of the
breakdown and the velocity and vorticity patterns of a
delta wing at various angles of attack (AOA). Much
research has been done in the area of vortex breakdown at
various AOA. However, fewer studies have used the Particle
Image Velocimetry (PIV) technique, and fewer still have
introduced yaw into the research. This study will use the
PIV technique and a flow visualization technique to analyze
the velocity and vorticity of a delta wing at various AOA
and various yaw angles.

Chapter 2: Experimental Facility and Techniques
The study of the velocity field and vorticity pattern was
performed using two methods. Laser Induced Fluorescence
(LIF) was used to provide flow visualization. Particle
Image Velocimetry (PIV) provided a two-dimensional velocity
field and the corresponding vorticity perpendicular to the
two-dimensional plane. This chapter describes the water
tunnel facility and the set-up for both the LIF and PIV
techniques.
2.1 Water Tunnel and Jet Supply System
The University of Washington Water Tunnel Facility is a
recirculating tunnel with a 3.0m x 0.7m x 0.7m glass test
section. It has a maximum flow speed of 70 cm/s. A sketch
of the water tunnel is shown in figure 2-1. The paper by
Eroglu (1991) contains a complete description of the water
tunnel. A free stream turbulence level of approximately

0.3% of the mean flow existed for all tunnel speeds.
Except for the water tunnel velocity calibration, all
experiments were conducted at 3.83 cm/s.
pump
Dim ISCt Contraction
12.7m
Tea Section
m ,nm k
| i ^ /
V ■X , 1 " J
Figure 2-1: University of Washington Water Tunnel Facility
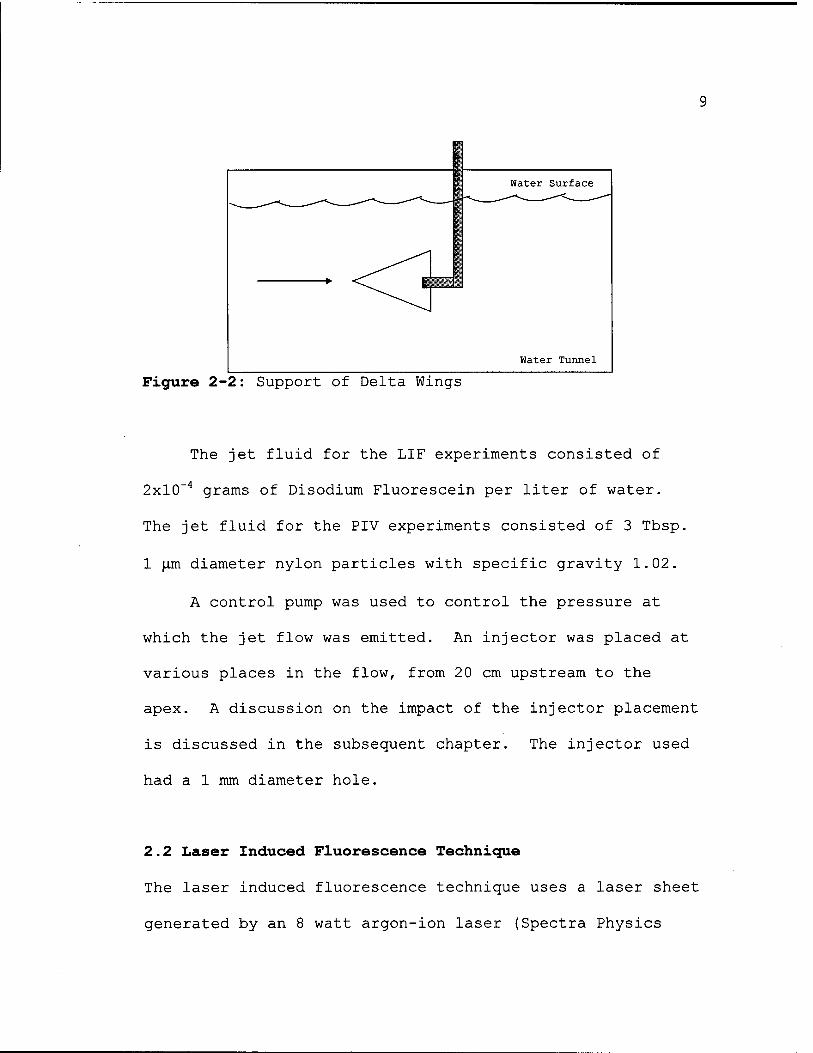
Two acrylic flat plated delta wings of different sizes
were suspended in the test section midway between the
surface of the water and the bottom of the tunnel. The
subsequent chapter gives a more detailed description of the
two wings. The wings were supported by a 0.63cm x 4cm
piece of aluminum 6 cm aft of the wing, as seen in the
following figure.
Water Surface
Water Tunnel
Figure 2-2: Support of Delta Wings
The jet fluid for the LIF experiments consisted of
2xl0~4 grams of Disodium Fluorescein per liter of water.
The jet fluid for the PIV experiments consisted of 3 Tbsp.
1 um diameter nylon particles with specific gravity 1.02.
A control pump was used to control the pressure at
which the jet flow was emitted. An injector was placed at
various places in the flow, from 20 cm upstream to the
apex. A discussion on the impact of the injector placement
is discussed in the subsequent chapter. The injector used
had a 1 mm diameter hole.
2.2 Laser Induced Fluorescence Technique
The laser induced fluorescence technique uses a laser sheet
generated by an 8 watt argon-ion laser (Spectra Physics

10 Model 2020-5) and a light sheet probe (TSI Model 9855-32)
to illuminate the jet fluid. With no lights, the
fluorescence is invisible to the naked eye; with the laser
sheet, the fluorescence is excited to illumination. A
digital video camera recorded the flow and Adobe Premiere™
was used to store the images on the computer as individual
pictures. Adobe Photoshop™ was then used to crop the
pictures and to invert them. The pictures are black with
neon-green colored fluorescence revealing the streamlines.
In the ensuing chapter, the images were inverted so that
the colors were not as dark.
The laser sheet was oriented along two different
planes. It was aligned both parallel and perpendicular to
the plate. The parallel view captured the core flow from
the apex to the end of the plate. The perpendicular view,
or transverse view, captured the vortex core plane, or
cross-section of the vortex, at a given chord-wise
position.
By shining the laser parallel to the suction side of
the wing, and giving the camera a direct line of sight, the
core flow was captured. The vortex core plane was much
more difficult to capture, as a mirror had to be used to
capture the images. Though there was no other solution,

11 the mirror diminished the accuracy of the results.
Figures 2-3 and 2-4 show the laser sheet orientations for
the core flow and vortex core plane, respectively.
ieet probe
Figure 2-3: LIF Set-up, Core Flow
laser
/z> Camera
w
Laser sfijeet
/ Flow
Delta wing
en Laser s
Camera
►|\
mirror
leer prsoe 1 ^fe /
/ /
,,-T 5 laser
Figure 2-4: LIF Set-up, Vortex Core Plane

12 2.3 Particle Image Velocimetry Technique
Quantitative flow field measurements were acquired using a
TSI Incorporated Particle Image Velocimetry (PIV) system.
Advantages to PIV are that it does not obstruct the flow
and it gives a two-dimensional result. This technique
allows for the simultaneous acquisition of hundreds of
velocity vectors. The laser sheet is used to illuminate
nylon particles and the particle images are recorded using
a CCD camera and saved on a computer. The CCD camera
records each laser pulse on separate video frames and a
cross-correlation algorithm can then be run on each pair of
images to determine the particle displacement. The laser
sheet orientations used are identical to those used during
LIF.
The PIV system consists of a laser, beam modulator,
synchronizer, laser sheet probe, camera, and computer as
shown in figure 2-5. The laser beam passes through a
collimating lens into the beam modulator (TSI Model
620010), which uses the first order beam to turn the laser
on and off. The TSI Instruction Manual is much more
specific in the set-up of the modulator. A 40 MHz signal
from the synchronizer (TSI Model 610030) controls the beam
modulator. The synchronizer provides the signal control

13 for both the camera and beam modulator. Table 2-1 lists
the synchronizer settings used for the cross-correlation of
two video frames (modified from TSI PIV Instruction Manual,
1995) .
Beam modulator Laser sheet probe Delta wing
Particle image
synchronizer
Computer with frame grabber
Figure 2-5: Particle Image Velocimetry Set-up

14 Table 2-1: Synchronizer Set-up
Synchroni z er Button
Parameter Settings
Description of Parameter
Pulse Mode Pulse Mode
Double Pulse Generates two pulses at the programmed separation time
Laser Type (2nd Function)
Argon Type of laser used
Duration Pulse Duration 50% Duty Cycle
Time the laser is on during a pulse (percentage of the pulse separation time - 50% maximum)
Separation Pulse Separation 0.01 sec 0.02 sec
Separation between two consecutive pulses (10 ms for core flow, 20 ms for vortex core plane)
Camera Mode Video Camera
Triggered Allows the camera to be the time master
# of Frames 00 Frames Camera is fired continuously until RUN/STOP button is pressed
Frame Rate N/A Does not apply to video triggered mode
Pulse Delay (2nd Function)
Pulse Delay Time 42.5 ms 35.0 ms
Used with Pulse Separation (10 ms, 20 ms respectively). See Instruction Manual, pg. 4-4, for approximate pulse delays for other pulse separations
External Start 00 Seconds
Stop 00 Seconds Trigger
Run/Stop Activates laser pulsing
Int/Ext Trigger Source Internal
Set to internal when no image shifting is being used
The CCD camera (TSI Model 630044) has a frame rate of
30 frames per second and a resolution of 640 pixels x 480
pixels. The camera has a Nikon Macro lens (AF Micro
Nikkor, 105 mm, f/2.8D) with maximum magnification of 10:1,

15 Two different images can be recorded on the order of 0.02
ms apart and a total of 13 consecutive images can be stored
in the frame grabber memory.
The computer is a 90 MHz Pentium equipped with two TSI
software packages: Insight™ and Datashow™. Insight™ is
responsible for the acquisition and processing of the
particle displacements from the raw image data while
Datashow™ is used for the post-processing of the pixel
displacement fields (in order to remove the obviously bad
vectors and to average with other image pairs to remove
noise). Details on the use and set-up of Insight™ and
Datashow™ can be found in Haven (1996) . The velocities and
vortices associated with the displacement fields were
processed by the software package Spyglass Transform™.
This program converted the data into velocities and
vortices using finite differencing to approximate
dv du
dx dy
Before using the Insight™ and Spyglass Transform™, the
interrogation grid size had to be determined, which is
dependant on the particle displacement, velocity, pulse
separation time, and pulse delay time. For the core flow,
the picture was divided up into a 30x30 grid. For the

16 vortex core plane, the picture was divided up into a
40x40 grid. This information was used when processing the
data in Insight™.
The dimensions of the picture viewed by the camera
also had to be determined. These dimensions were entered
into a Spyglass Transform™ macro that converts the velocity
from pixels per second to centimeters per second.
Chapter 3: Experimental Results
A combination of Laser Induced Fluorescence (LIF) and
Particle Image Velocimetry (PIV) was used to investigate
the behavior of the leading edge vortices, also known as
apex vortices. These vortices were observed both looking
down onto the top of the wing (which shows the vortex
lines), which is labeled parallel plane; and from the rear
of the wing (which shows the cross view), which is labeled
transverse plane.
For the majority of experiments, the water tunnel was
run at 3.8 cm/s. Faster and slower velocities were
desired, but caused problems. If the tunnel is any slower,
the bearings in the motor begin to vibrate and the flow
becomes less steady and increases the amount of
fluctuations in the velocity.
If the tunnel is any faster, the camera will not be
able to see the particles as they are moving to fast to
18 accurately measure their displacement. To observe faster
particles (especially in the transverse plane), the
separation time and pulse delay times must be short.
However, the shorter the time, the less power the laser
produces and consequently, the laser is not bright enough
for the particles to be reflected. Thus, one conservative
value for the velocity was chosen.
The research involved finding the flow field over the
delta wing. This includes velocity. The program Spyglass
Transform™ was used to calculate the velocities of the flow
based on particle displacement in centimeters. A
calibration of the system with Spyglass Transform™ was
first performed to relate the velocity that Spyglass
Transform™ gives to the free stream flow.
3.1 Velocity Calibration
Before placing any obstruction into the flow (e.g. delta
wing), PIV measurements of the free stream flow were taken.
For steady, one-dimensional flow, water tunnel velocities
tested were between about 2.5 cm/s and about 15 cm/s. The
camera did not have any problems in viewing the particles.
With variable water tunnel velocities, PIV
measurements were taken and were processed through Spyglass

19 Transform™ to obtain their velocity. The flow proved to
be very uniform and one-dimensional and the velocities from
Spyglass Transform™ were very close to constant. Comparing
these given values for velocities with the water tunnel
speed (which was provided with the tunnel and verified by
Maj. Brenda Haven using PIV), a linear relationship was
observed. Using Microsoft Excel, which uses a least
squares fit to form trendlines, the equation of the line
was calculated. The results were again verified by running
the same experiments with a different size flow field.
Initially, the flow field viewed by the camera was 4 cm by
3 cm. The flow field viewed was changed and the equation
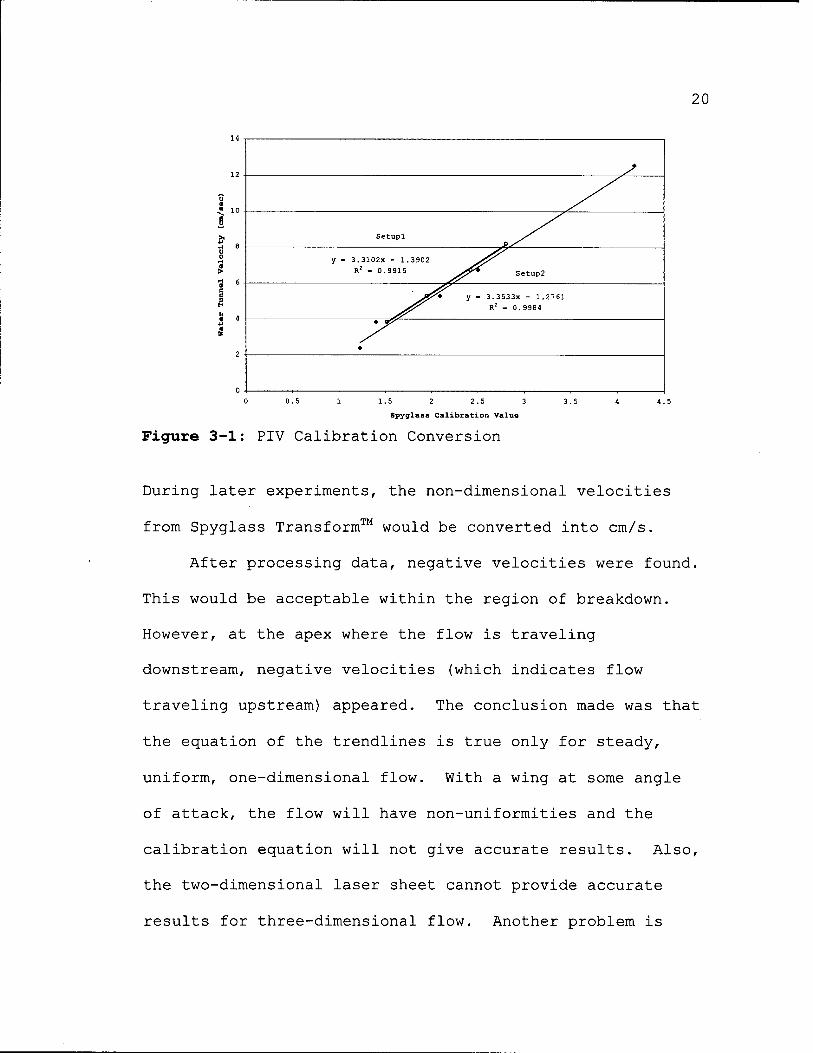
proved to be quite good. Figure 3-1 shows the two
different setups, corresponding to the initial and
subsequent flow field views, and the compared relationship
between the water tunnel velocity and the velocity measured
by Spyglass Transform™.
20
1.5 2 2.5 3
Spyglass Calibration Value
Figure 3-1: PIV Calibration Conversion
During later experiments, the non-dimensional velocities
from Spyglass Transform™ would be converted into cm/s.
After processing data, negative velocities were found.
This would be acceptable within the region of breakdown.
However, at the apex where the flow is traveling
downstream, negative velocities (which indicates flow
traveling upstream) appeared. The conclusion made was that
the equation of the trendlines is true only for steady,
uniform, one-dimensional flow. With a wing at some angle
of attack, the flow will have non-uniformities and the
calibration equation will not give accurate results. Also,
the two-dimensional laser sheet cannot provide accurate
results for three-dimensional flow. Another problem is

that Spyglass Transform™ uses a Macro that can give 21
inaccuracies when converting from pixels per second to
centimeters per second, especially when the camera is moved
and the picture viewed by the camera has changed. All of
these factors contribute to the inaccurate results. For
this reason, the calibration factor will not be applied in
this research.
Care must be taken in future research to find an
accurate relationship between the velocity provided by
Spyglass Transform™ and the actual velocity. For this
study, the upstream velocity, Vinf, that is provided by
Spyglass Transform™ normalized the velocities in the vortex
core.
3.2 Parallel Plane Flow
After having obtained the equation to convert the velocity
given in Spyglass Tranform™ to cm/s (though this equation
is not be used in this study because of the inaccuracy),
observations on the core flow were made. As it has been
stated previously, few studies of vortex breakdown have
been analyzed using PIV. It is also true that few studies
have looked at the change of yaw on the wing.

22 Two delta-wings, sketched below, which are similar
in shape but different in sizes, are used.
65°
* ».
-i_t. T=F
Large Delta Wing
c = 44.8 cm
b = 41.8 cm
t = 0.91 cm
30°
Small Delta Wing
c = 30.2 cm
b = 28.2 cm
t = 0.64 cm
Figure 3-2: Delta Wings Used
These delta wings were placed at different angles of
attack, a, and different yaw angles, ß, which are shown in
the following figure.
windward vortex leeward vortex
Figure 3-3: Definition of Angles and Vortices

23 As figure 3-2 illustrates, these two wings are only
different in the root chord and the thickness of the plate.
The small wing has thickness 0.25 in. (0.64 cm, 2.1% chord)
while the large has thickness 0.36 in. (0.91 cm, 2.0%
chord). The sweep angle of 65° is the same for both wings.
A visual test was performed to determine how much of a
difference there was between the large and small wings,
especially with regard to location of the breakdown. It
must first be noted that instabilities in the flow cause
the position of vortex breakdown to scatter within a range
of about 5 cm. The visual test confirmed that for the
large and small delta wings at the same AOA, the vortices
breakdown at almost the same x-position, equidistant from
the apex. Thus, expressed in terms of x/c, the vortex
breakdown positions are different: table 3-1 lists the
location in percentage of chord for each wing at three
different AOA.
Table 3-1: Location of Breakdown Angle of Attack ->
Wing i 20° 30° 40°
x/c for Small (chord =30.2 cm) >80% 40 - 50% 15 - 25% x/c for Large (chord =44.8 cm) >60% 30 - 40% 20 - 30%
Though breakdown does not occur at the exact same distance
from the apex, perhaps due to the difference in thickness
24 or the exact placement of the injector (where particles
or fluorescence is emitted), the two plates show so much
similarity that interchanging the plates during the
research would not affect results.
In the initial investigation, the large delta wing
analyzed. At very low angles of attack, leading edge
vortices appear, but generally do not breakdown. The
reason for this is because the root chord is not big enough
for a breakdown to appear; that after the vortex leaves the
trailing edge, it typically diffuses. A large delta wing
is beneficial because it allows for the observation of the
breakdown at lesser angles of attack (AOA), as compared to
a smaller delta wing. However, due to the size of the
water tunnel, the wing could not yaw without its apex
emerging from the water. For this reason, the smaller wing
was used.
Attempts were made to determine the importance of the
placement of the injector. The injector was placed
upstream in various locations and at the apex on the
pressure side of the wing. It was determined that the
placement did not affect results significantly. Many
requirements for where the injector is placed and how it is
used must be considered. First, the pressure at which the
25 particles or fluorescence is emitted must be low so as
not to induce too much jet flow. Second, the obstruction
of the injector in the flow does cause minor disturbances,
which are difficult to avoid. Third, the placement of the
injector can move the location of the breakdown up to about
five per cent of the chord. With this in mind, it was
concluded that although our results are not perfect, they
do provide powerful insight into the nature of the vortices
and the breakdown. Therefore, for the purposes of this
study, it did not make a difference whether the large wing
or small wing was used.
Baseline conditions were first observed to see how the
vortex acts at various angles of attacks. As the angle of
attack increases, the location of breakdown moves upstream
(as indicated in table 3-1). Also, as the angle of attack
increases, the strength of the vortex increases. Figures
3-4 and 3-5 show the component of vorticity normal to the
x-y plane (coz) for an AOA of 20° and 30°, respectively.
What is seen is the two-dimensional look at the flow. The
top regions show negative vorticity (clockwise) and the
bottom regions show positive vorticity (counterclockwise).
The key under each plot shows that a greater angle of
attack has a stronger vortex structure (represented by
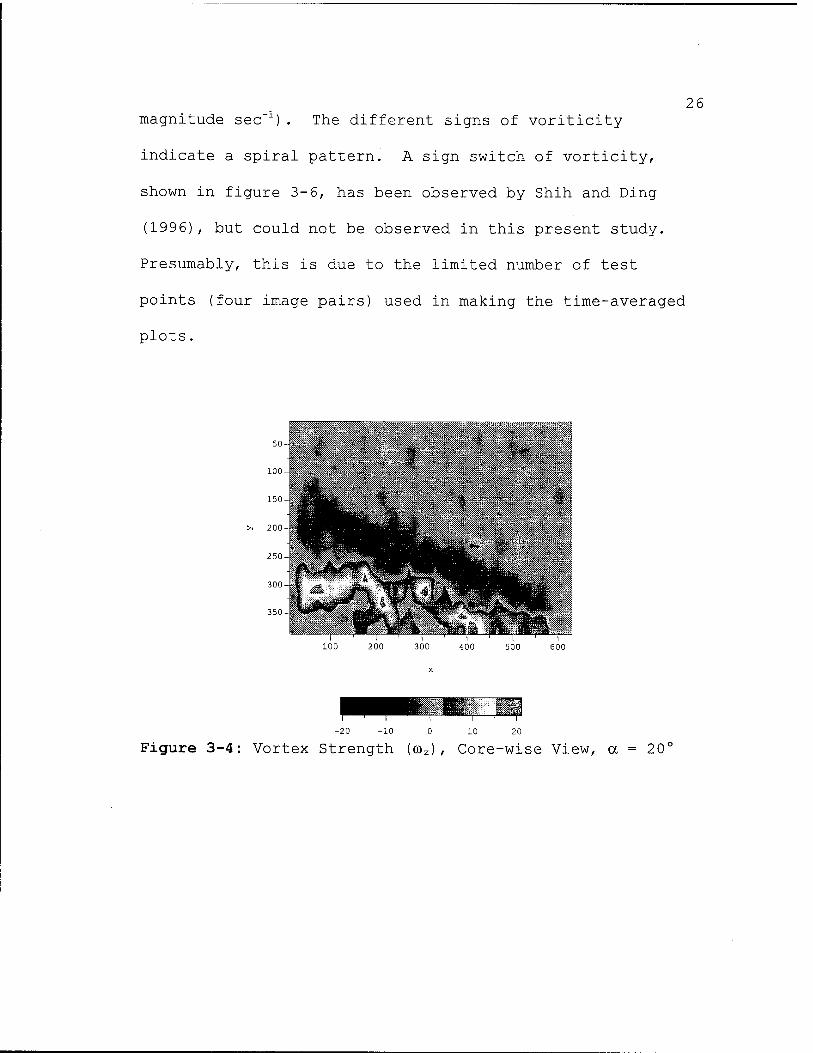
26 magnitude sec" ) . The different signs of voriticity
indicate a spiral pattern. A sign switch of vorticity,
shown in figure 3-6, has been observed by Shih and Ding
(1996), but could not be observed in this present study.
Presumably, this is due to the limited number of test
points (four image pairs) used in making the time-averaged
plots.
>< 200-1
250
100 200 300 400 500 600
-20 -10 0 10 20
Figure 3-4: Vortex Strength (coz) , Core-wise View, a = 20"

27
100 200 300 400 500 600
-50 -25 0 25 50
Figure 3-5: Vortex Strength (coz) , Core-wise View, a = 30°
Qpositive^)
Figure 3-6: Sign Switch of Vorticity
LIF pictures that correspond with the figures 3-4 and 3-5
are shown in figures 3-7 and 3-8.

'"v- ■•
Figure 3-7: LIF Picture, a = 20'
Figure 3-8: LIF Picture, a = 30'
■spv
28
Previous research has shown that the velocity in the
vortex core increases to the point at which it breaks down
and then a decrease in velocity occurs. The flow can be
described as jet flow until breakdown, followed by wake

29 flow. A study was performed at an AOA of 30° with no
yaw. The large wing was used and the observations were
made on the lower vortex. The LIF picture that corresponds
to this study is found in figure 3-8. A qualitative view
of the vector plot is demonstrated in figures 3-9 and 3-10.
Figure 3-9 is the velocity field from the apex to 25% of
the root chord (0.25c). Figure 3-10 is the velocity field
from the 0.25c to 0.5c. Figure 3-11 is a quantitative look
at the velocity field. Notice that the velocity increases
up to 3 times the upstream velocity, Vinf, on the "y-axis"
of figure 3-11. Though the velocities do not correspond
accurately to the velocity given in cm/s, the results show
both quantitatively and qualitatively how the velocity
behaves over the wing.

30
/ ~ - * t * - . • • • /x.
. ->-^->-»^-*=T^BAix -♦_-. ».,-».-
100 200 300 400 500 600
Figure 3-9: Velocity Field, a = 30°, ß = 0°, Apex to 0.25c
..r«. "-^r^ ^i ^ —-i
500
Figure 3-10: Velocity Field, a = 30°, ß = 0°, 0.25c to 0.5c

31
3.5
2.5
1.5
0.5
- 0.1 0.2 0.3
Chord Position (x/c)
0.4 0.5
Figure 3-11: Velocity Field, a = 30°, ß = 0°
The results confirmed previous studies (Erickson, 1980 and
Shih, 1996). Notice that in figure 3-11, the velocity has
a gradual increase in velocity, up to three times the
upstream velocity, and at the point of breakdown (about
0.3c), there is a rather sharp decrease in velocity.
The effects due to yaw were then considered. The
study attempted to determine whether or not the velocity
field looked as it did at zero yaw. It also tried to
analyze the point at which the leeward side vortex left the
plate and its corresponding velocity field.
Initial observations showed that as yaw increases, the
windward vortex breakdown moves upstream while the leeward
vortex breakdown moves downstream. Figure 3-12 shows the

LIF picture for 30° AOA and 30° yaw. The top vortex
(leeward side) shows no breakdown while the bottom vortex
(windward side) shows that the breakdown (spiral type) has
moved upstream.
32
Figure 3-12: LIF, a = 30°, ß = 30'
The next observation made was the point at which the
leeward side vortex moves off the plate. This is seen in
figure 3-13.

33
Figure 3-13: LIF, a = 40° ß = 45°
Though the plate is hard to see, it is observed that the
leeward side vortex has left the plate. The next study
considered was what the velocity fields look like at the
condition of 30° AOA and 45° yaw. Figures 3-14 and 3-15
show the vector plots for the velocity field of the
windward side vortex. Figure 3-14 corresponds to the apex
to 0.15c and figure 3-15 corresponds to 0.15c to 0.25c
(following the breakdown). Figure 3-16 shows the
quantitative look at the velocity field.

34
t { * ■ • * * • t f < • t t t t f t t t
. . . , ^ *
- * * < - t t V t ♦ i ^ • *■ I
(lift
»♦••♦•
t t ♦ ■
• ♦ *
> V*.\ ♦ • W... v x\* ♦ ♦ t •
»»It
-i-W *^^- 1 h t
Figure 3-14: Windward Side Velocity Field, a = 30°, ß Apex to 0.15c
= 45%
• - "*. ^^4, \ \ ■ ■ ■ ■ i
■ ■ -». -*>^»,
t - *
—f— 200
t > ■
t ♦■
/ J* J* -V
-+■ ^ -*■
j* f **
jr 0 *
t t ~*
-f •* -r-
Figure 3-15: Windward Side Velocity Field, a = 30°, ß = 45' 0.15c to 0.25c (Including Breakdown)

35
0.05 0.1 0.15
Chord Position (x/c)
0.2 0.25
Figure 3-16: Windward Side Velocity Field, a = 30°, ß = 45'
Notice the similarity to the velocity field with zero yaw
as shown in figure 3-11. Also, the maximum V/Vinf at a
higher yaw angle (approximately 1.9) is less than the
maximum V/Vinf at zero yaw (approximately 3.1).
When looking at the leeward side vortex, results are
much different. Initially, just after the apex, the
velocity increases sharply, but steadies out to a very
gradual increase. Figures 3-17 through 3-20 are the vector
plots for the apex to 0.2c, 0.2c to 0.4c, 0.4c to 0.6c, and
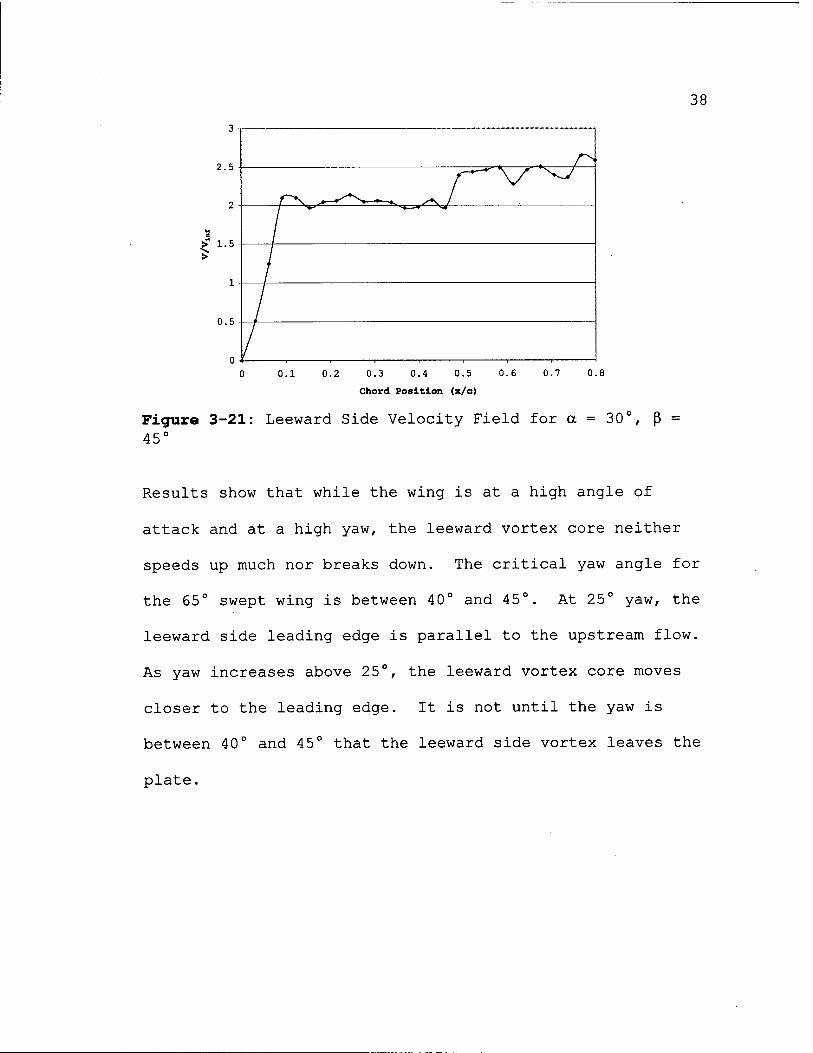
0.6c to 0.8c, respectively. Figure 3-21 shows the
quantitative look at the velocity field.

36
' 'i ^ >^f
Figure 3-17: Leeward Side Velocity Field, a = 30°, ß = 45°, Apex to 0.2c
■ -*■ -a* ■
300 400
Figure 3-18: Leeward Side Velocity Field, a = 30°, ß = 45°, 0.2c to 0.4c

37
>■ 200-.».
t • -~ >k -». - -*•-*- * -*. -*—»» » -*
^k -• -*■
300 400 500 600
Figure 3-19: Leeward Side Velocity Field, a = 30°, ß = 45°, 0.4c to 0.6c
Figure 3-20: Leeward Side Velocity Field, a = 30°, ß = 45°, 0.6c to 0.8c
38
Figure 3-21: Leeward Side Velocity Field for a = 30°, ß 45°
Results show that while the wing is at a high angle of
attack and at a high yaw, the leeward vortex core neither
speeds up much nor breaks down. The critical yaw angle for
the 65° swept wing is between 40° and 45°. At 25° yaw, the
leeward side leading edge is parallel to the upstream flow.
As yaw increases above 25°, the leeward vortex core moves
closer to the leading edge. It is not until the yaw is
between 40° and 45° that the leeward side vortex leaves the
plate.

39
ß = 25* ß = 40°-45c
Vortex has left the plate
Figure 3-22: Effect of Yaw Angle on Leeward Vortex Core
Other observations from this study noted is the
asymmetry that occurs over the plate, even at zero yaw. It
is evident from the following figure that even though the
experiment should involve no asymmetric results, they
appear nevertheless.
is^:^m
■Jt*
^m%^/
Figure 3-23: Asymmetry in the Flow
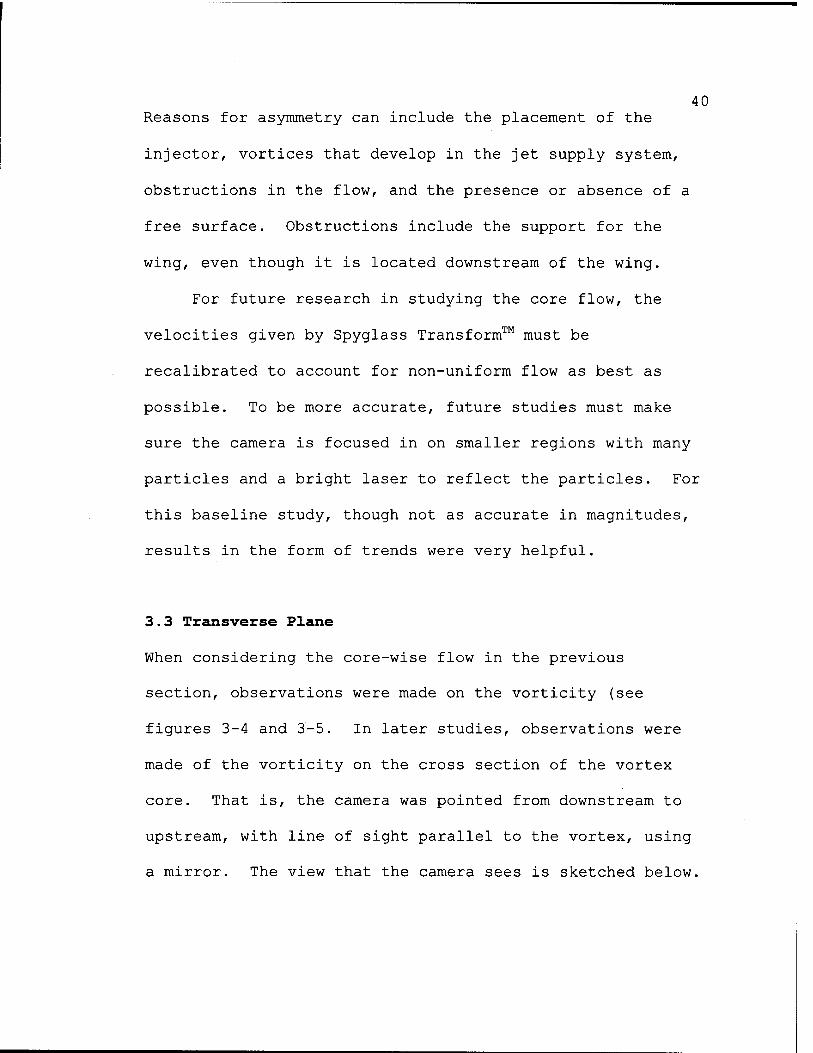
40 Reasons for asymmetry can include the placement of the
injector, vortices that develop in the jet supply system,
obstructions in the flow, and the presence or absence of a
free surface. Obstructions include the support for the
wing, even though it is located downstream of the wing.
For future research in studying the core flow, the
velocities given by Spyglass Transform™ must be
recalibrated to account for non-uniform flow as best as
possible. To be more accurate, future studies must make
sure the camera is focused in on smaller regions with many
particles and a bright laser to reflect the particles. For
this baseline study, though not as accurate in magnitudes,
results in the form of trends were very helpful.
3.3 Transverse Plane
When considering the core-wise flow in the previous
section, observations were made on the vorticity (see
figures 3-4 and 3-5. In later studies, observations were
made of the vorticity on the cross section of the vortex
core. That is, the camera was pointed from downstream to
upstream, with line of sight parallel to the vortex, using
a mirror. The view that the camera sees is sketched below.

41
Mirror Image Real Image
Figure 3-24: Sketch of Transverse Plane Vi ew
A sample image is shown below.
■^Finger"
1
Figure 3-25: a = 30°, x/c = 0.1, Lower Vortex

42 The right vortex is the actual vortex. With the delta
wing made of Plexiglas, a mirror image was created, which
is seen on the left. This vortex to the right has negative
vorticity (with clockwise rotation). An interesting note
is the "finger" that exists. This part is actually
rotating in the counter-clockwise direction, caused by a
shear layer. Shih and Ding (1996) observed similar trends.
Figures 3-26 and 3-27 give the vortex core plane view for a
30° angle of attack. Figure 3-26 has chord position 0.1c
and Figure 3-27 has chord position 0.4c. The further
downstream, the further away from the plate the vortex
filament travels.
dp1
:llll«li§ilt
Figure 3-26: a = 30°, x/c = 0.1, Lower Vortex

43
Figure 3-27: a = 30°, x/c =0.4, Lower Vortex
By measuring the distance between the two cross-view
pictures and their distances away from the plate, the angle
of the vortex filament off the plate was determined to be
8.2°, as shown in the following illustration.
V
Figure 3-28: Angle of Vortex off Wing, Zero Yaw
Another important observation was the strength of the
vortices when the wing is yawed. The wing was placed at
30° AOA and 30° yaw. The laser sheet was placed at 0.3c.
PIV was taken on both the windward side vortex and the
leeward side vortex. LIF observations showed that the

44 windward side vortex remained close to the plate, as it
did with zero yaw. However, the leeward side vortex was
raised even further off the plate, as shown in the
following figure.
V N^ \^ "\ Leeward Vortex
Windward Vortex
Figure 3-29: Effect of Yaw on Vortices
Because of this observation, an assumption can be made that
the windward side vortex would be stronger than the leeward
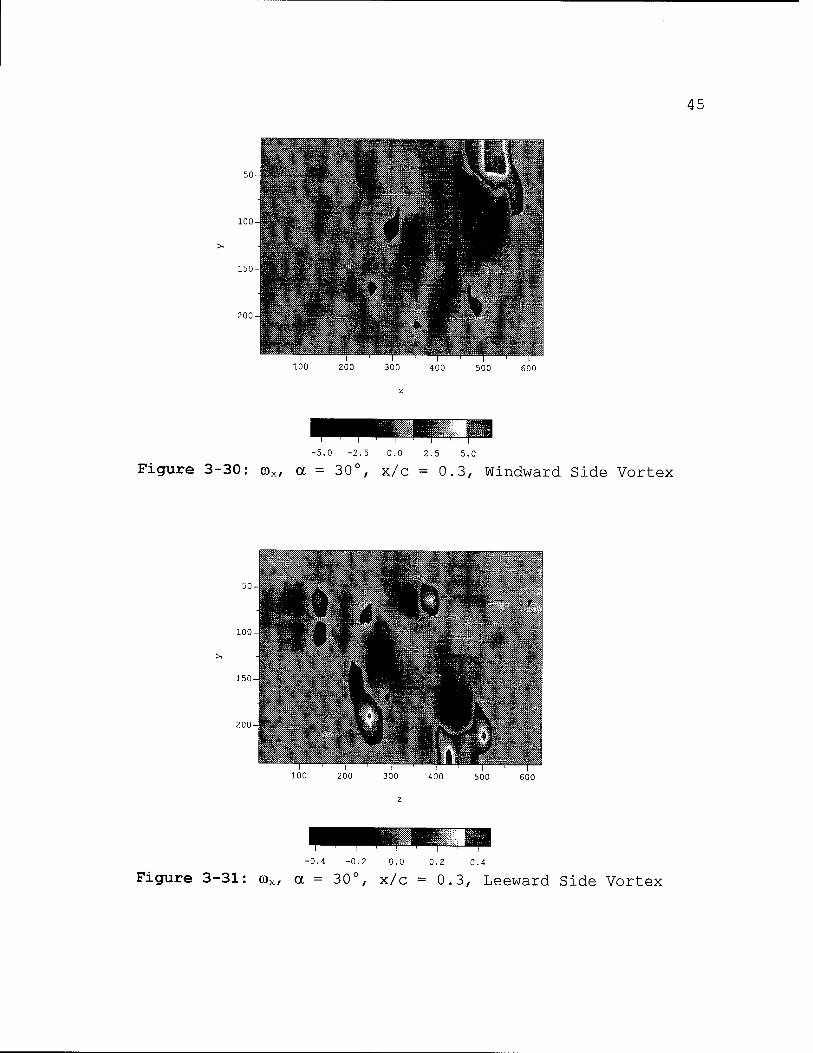
side vortex. Figures 3-30 and 3-31 show the component of
vorticity normal to the y-z plane, or ©x, for the windward
side vortex and the leeward side vortex, respectively.
45
100
200
100 200 300 500 600
-5.0 -2.5 0.0 2.5 5.0
Figure 3-30: <ax, a = 30°, x/c =0.3, Windward Side Vortex
400 500 600
-0.4 -0.2 0.0 0.2 0.4
Figure 3-31: <DX, a = 30°, x/c =0.3, Leeward Side Vortex

46 In figure 3-30, two strong vortices appear. The negative
vortex is the vortex that is moving in the clockwise
direction. This is the apex vortex. The positive vortex
is moving in the counter-clockwise direction. This is a
secondary vortex which is formed with the aid of a shear
layer observed as the "finger" in the LIF picture of figure
3-25. A more complete discussion concerning the secondary
vortices can be found in Shih and Ding (1996). The
magnitude of the apex vortex is about 5.
The vortices in Figure 3-31 are harder to see. The
reason for this is that it is very difficult to get rid of
the noise. After collecting data, many data points can be
deleted because their magnitude is beyond a certain
threshold. However, this method cannot be used for all the
bad data. With the help of LIF, the apex vortex was
observed to be at row 75, column 250. This vortex would
not appear to be the apex vortex as it is very small in
diameter and in magnitude compared to the other contours in
the figure. However, it is the location of the apex
vortex. The magnitude of this vortex is on the order of
0.1. Even if the other vortices present in the figure are
actual vortices caused by the flow, the maximum magnitude
is about 0.5.
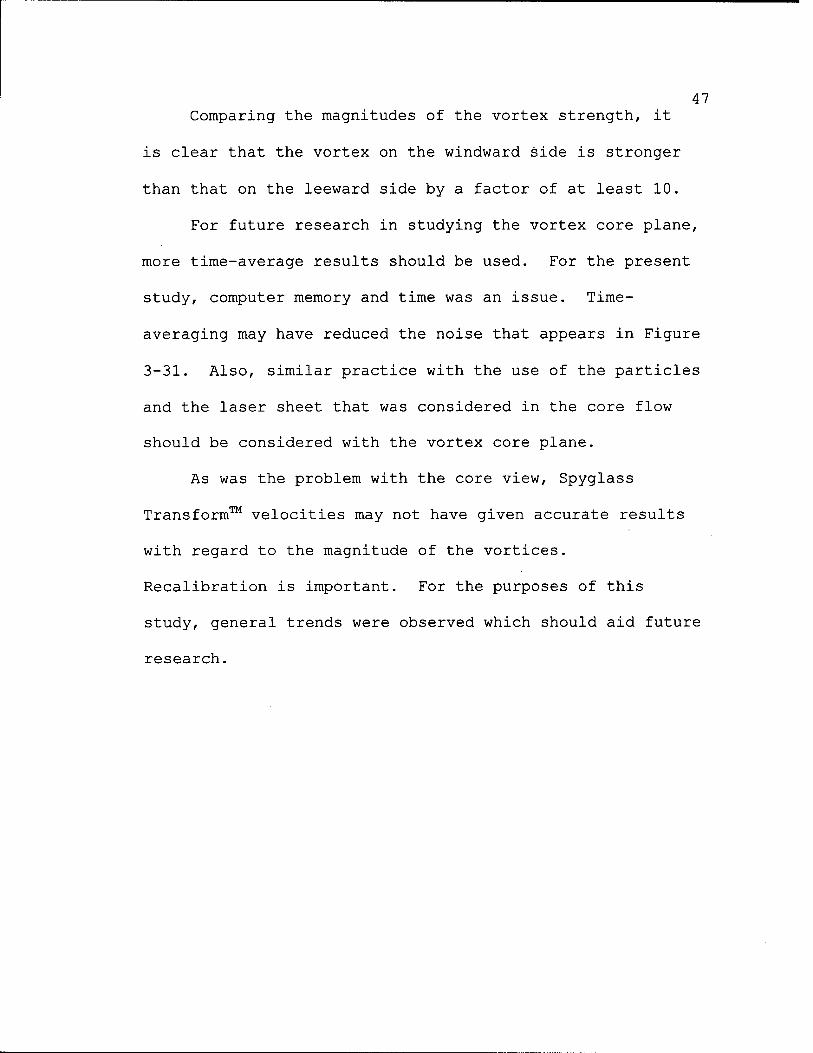
47 Comparing the magnitudes of the vortex strength, it
is clear that the vortex on the windward side is stronger
than that on the leeward side by a factor of at least 10.
For future research in studying the vortex core plane,
more time-average results should be used. For the present
study, computer memory and time was an issue. Time-
averaging may have reduced the noise that appears in Figure
3-31. Also, similar practice with the use of the particles
and the laser sheet that was considered in the core flow
should be considered with the vortex core plane.
As was the problem with the core view, Spyglass
Transform™ velocities may not have given accurate results
with regard to the magnitude of the vortices.
Recalibration is important. For the purposes of this
study, general trends were observed which should aid future
research.

Chapter 4: Conclusions
In this chapter, a summary of the experimental results will
be presented in addition to areas of future research.
4.1 Summary of Results
The first result was a visual observation. Two wings, with
the same leading edge but different root chords and
slightly different thicknesses, where placed at various
angles of attack to determine the location of the
breakdown. Despite the slight thickness difference, the
breakdown occurs at roughly the same distance downstream.
Therefore, it is reasonable to substitute one wing with the
other in these experiments.
With zero yaw, experimental results confirmed that
within the core of the vortex, the axial velocity speeds up
considerably until breakdown. At this point, the velocity
drops off rapidly.

49 By changing the yaw, results are consistent.
However, when the yaw angle is increased to a point where
the leeward side vortex leaves the plate, results are
different for the leeward side vortex. Initially, the
velocity increases rapidly, followed by a very gradual
increase in velocity. Also, a breakdown never occurs on
the leeward side after it has left the plate.
A view of the vortex core plane (the cross-view of a
vortex filament) shows that as the angle of attack
increases the strength of the vortex increases. The two
vortices, at zero yaw, have similar strengths (though
asymmetry does exist). As yaw increases, the windward side
vortex increases in strength while the leeward side vortex
decreases in strength.
4.2 Future Research
During the research for this present study, ideas were
sought as to what areas should be tested in the future.
Two ideas are a transition mount and a non-straight leading
edge.

50 4.2.1 Transition
Data in this study was collected as the wing was placed at
a stationary angle of attack. To better analyze what
happens in actual flight, the wing should operate at a
pitch-up and hold condition. In addition to this study, a
transition mount was created in order to change the angle
of attack at a pace consistent with actual flight.
4.2.2 Non-Straight Leading Edge
All the research on vortex breakdown is based on a delta
wing with straight leading edges. From flow visualization,
the vortex is seen to "wrap" around the leading edge. If a
non-straight leading edge is introduced, the flow will be
disturbed. The question is whether it will suppress the
breakdown or not. An idea for this analysis is to
introduce sinusoidal shaped cuts into the leading edges.

REFERENCES
Erickson, G.E., "Vortex Flow Correlation," Technical Report, AFWAL-TR-80-3143, 1980.
Eroglu, A., "An Experimental Investigation of Entrainment and Mixing in Pulsed and Exponential Transverse Jets," Ph.D. dissertation, University of Washington, 1991.
Faler, J.H. and Leibovich, S., Phys. Fluids, vol 20, pp. 1385-1400, 1977.
Gad-el-Hak, M. and Blackwelder, R.F., "The Discrete Vortices from a Delta Wing," AIAA Journal, Vol. 23, No. 6, 1985, pp. 961-962.
Haven, B.A., "The Effect of Hole Geometry on the Near Field Character of Crossflow Jets," Ph.D. dissertation, University of Washington, 1996.
Kurosaka, M., Campbell, M. and Taya, M., "Vortex Breakdown Control Using Flush-Mounted Micro Adaptive Actuators," Vol. I: Technical Proposal, 1998.
Lowson, M.V., Riley, A.J. and Swales, C, "Flow Structure over Delta Wings," AIAA Paper 95-0586, Jan. 1995.
Payne, F.M., Ng., T.T., Nelson, R.C. and Schiff, L.B., "Visualization and Wake Surveys of Vortical Flow over a Delta Wing," AIAA Journal, Vol. 26, No. 2, 1988.
Shi, Z., Wu, J.M. and Vakili, A.D., "An Investigation of Leading-Edge Vortices on Delta Wings with Jet Blowing," AIAA Paper, Jan. 1987.
Shih, C. and Ding, Z., "Unsteady Structure of Leading-Edge Vortex Flow Over a Delta Wing", AIAA Paper 96-0664, 1996
Spall, R.E., Phys. Fluids, vol. 8, pp. 1330-1332, 1996.
TSI Particle Image Velocimetry System Operation Manual, 1995.
Yamagata, D.K., "The Influence of Anti-Kidney Pair of Vortices on Shaped Film Cooling Holes," Master of Science thesis, University of Washington, 1996.

University of Washington
Abstract
Velocity Field Over Delta Wings at High Angles of Attack
By Devin 0. 0'Dowd
Chairman of Supervisory Committee: Professor Mitsuru Kurosaka
Department of Aeronautics and Astronautics
Water tunnel experiments were conducted to understand
the nature of vortex breakdown over delta wings at high
angles of attack and at various yaw angles. Two delta
wings with the same sweep angle but different chords and
slightly different thicknesses were placed inside the water
tunnel. Experiments were conducted using two techniques,
Laser Induced Fluorescence (LIF) and Particle Image
Velocimetry (PIV).
Results showed that the core flow experiences an
increase in velocity until breakdown followed by a sharp
decrease in velocity. As the angle of attack increases,
the core flow inside the vortices slows down, in general,
and the strength of the vortices increases. As yaw
increases, the windward side vortex increases in strength
and moves upstream while the leeward side vortex decreases
in strength and moves downstream. At a critical yaw angle,
the leeward side vortex leaves the plate and this vortex
neither leaves the plate, nor experiences an increase in
velocity such as the windward vortex does.

REFERENCES
Erickson, G.E., "Vortex Flow Correlation," Technical Report, AFWAL-TR-80-3143, 1980.
Eroglu, A., "An Experimental Investigation of Entrainment and Mixing in Pulsed and Exponential Transverse Jets," Ph.D. dissertation, University of Washington, 1991.
Faler, J.H. and Leibovich, S., Phys. Fluids, vol 20, pp. 1385-1400, 1977.
Gad-el-Hak, M. and Blackwelder, R.F., "The Discrete Vortices from a Delta Wing," AIAA Journal, Vol. 23, No. 6, 1985, pp. 961-962.
Haven, B.A., "The Effect of Hole Geometry on the Near Field Character of Crossflow Jets," Ph.D. dissertation, University of Washington, 1996.
Kurosaka, M., Campbell, M. and Taya, M., "Vortex Breakdown Control Using Flush-Mounted Micro Adaptive Actuators," Vol. I: Technical Proposal, 1998.
Lowson, M.V., Riley, A.J. and Swales, C, "Flow Structure over Delta Wings," AIAA Paper 95-0586, Jan. 1995.
Payne, F.M., Ng., T.T., Nelson, R.C. and Schiff, L.B., "Visualization and Wake Surveys of Vortical Flow over a Delta Wing," AIAA Journal, Vol. 26, No. 2, 1988.
Shi, Z., Wu, J.M. and Vakili, A.D., "An Investigation of Leading-Edge Vortices on Delta Wings with Jet Blowing," AIAA Paper, Jan. 1987.
Shih, C. and Ding, Z., "Unsteady Structure of Leading-Edge Vortex Flow Over a Delta Wing", AIAA Paper 96-0664, 1996
Spall, R.E., Phys. Fluids, vol. 8, pp. 1330-1332, 1996.
TSI Particle Image Velocimetry System Operation Manual, 1995.
Yamagata, D.K., "The Influence of Anti-Kidney Pair of Vortices on Shaped Film Cooling Holes," Master of Science thesis, University of Washington, 1996.
UT1C QTTAUT7 INSPECTED \

REFERENCES
Erickson, G.E., "Vortex Flow Correlation," Technical Report, AFWAL-TR-80-3143, 1980.
Eroglu, A., "An Experimental Investigation of Entrainment and Mixing in Pulsed and Exponential Transverse Jets," Ph.D. dissertation, University of Washington, 1991.
Faler, J.H. and Leibovich, S., Phys. Fluids, vol 20, pp. 1385-1400, 1977.
Gad-el-Hak, M. and Blackwelder, R.F., "The Discrete Vortices from a Delta Wing," AIAA Journal, Vol. 23, No. 6, 1985, pp. 961-962.
Haven, B.A., "The Effect of Hole Geometry on the Near Field Character of Crossflow Jets," Ph.D. dissertation, University of Washington, 1996.
Kurosaka, M., Campbell, M. and Taya, M., "Vortex Breakdown Control Using Flush-Mounted Micro Adaptive Actuators," Vol. I: Technical Proposal, 1998.
Lowson, M.V., Riley, A.J. and Swales, C, "Flow Structure over Delta Wings," AIAA Paper 95-0586, Jan. 1995.
Payne, F.M., Ng., T.T., Nelson, R.C. and Schiff, L.B., "Visualization and Wake Surveys of Vortical Flow over a Delta Wing," AIAA Journal, Vol. 26, No. 2, 1988.
Shi, Z., Wu, J.M. and Vakili, A.D., "An Investigation of Leading-Edge Vortices on Delta Wings with Jet Blowing," AIAA Paper, Jan. 1987.
Shih, C. and Ding, Z., "Unsteady Structure of Leading-Edge Vortex Flow Over a Delta Wing", AIAA Paper 96-0664, 1996
Spall, R.E., Phys. Fluids, vol. 8, pp. 1330-1332, 1996.
TSI Particle Image Velocimetry System Operation Manual, 1995.
Yamagata, D.K., "The Influence of Anti-Kidney Pair of Vortices on Shaped Film Cooling Holes," Master of Science thesis, University of Washington, 1996.