report documentation page - dtic.mil sponsoring / monitoring agency name(s) and address(es) 3. dates...
TRANSCRIPT

REPORT DOCUMENTATION PAGE Form Approved
0MB No. 0704-0188 Public reoortiiKi buitien for this collection of information is estimated to average 1 hour per response, including the lime for reviewing instructois, searching easting data sounces galhenng and rnaintaimg the Sl^^,^S^^nd <^c*Snq and reviewing this collection of informatfon. Send comments regarding this burden estimate or any other aspect of this collecbon of information, ineludKig suggestions for reducing ^.^^to^^^^^^^/^alNngt^Headquarteis Services, Directorate for Infomiation Operations and Reports (0704-0188). 1215 Jeffeison Davis H^hv^y, Surte 12M, Arlington, VA 22202- ^R^^S^d bea«lre that notvSthstandind any other provision of law, no person shall be subject to any penalty for foiling to comply with a coHecbon of infomnaton if it does not display a cunently SM OMR^Mitroi nirober. PLEASE DO NOT RETURN YOUR FORM TO THE ABOVE ADDRESS.
1. REPORT DATE (DD-MM-YYYY) 20-05-2004
2. REPORT TYPE REPRINT
4. TITLE AND SUBTITLE i . r.^ ^^ High-Resolution State-Selected Ion-Molecule Reaction Studies Using Pulsed Field lonization Photoelectron-Secondary Ion Coincidence Method
6.AUTHOR(S) „ .r -.-, ^ X.-M. Qian*, T. Zhang*, C. Chang*, P. Wang*, C.Y. Ng*, Y. Chiu**, D.J. Levandier**, J.S. Miller, R.A. Dressier, T. Baer***, D.S. Peterka#
7. PERFORMING ORGANIZATION NAME(S) AND ADDRESS(ES) Air Force Research Laboratory/VSBXT 29 Randolph Road Hanscom AFB MA 01731-3010
9. SPONSORING / MONITORING AGENCY NAME(S) AND ADDRESS(ES)
3. DATES COVERED (From - To)
5a. CONTRACT NUMBER
Sb. GRANT NUMBER
5c. PROGRAM ELEMENT NUMBER 61102F 5d. PROJECT NUMBER 2303
Se. TASK NUMBER RS
5f. WORK UNIT NUMBER Al 8. PERFORMING ORGANIZATION REPORT
NUMBER
AFRL-VS-HA-TR-2004-1100
10. SPONSOR/MONITOR'S ACRONYM(S) AFRL/VSBXT
11. SPONSOR/MONITOR'S REPORT NUMBER(S)
12. DISTRIBUTION / AVAILABILITY STATEMENT T^proved for Public Release; Distribution Unlimited *Dept Chemistry, Univ Calif at Davis, CA; **Inst Sci Res, Boston College, Newton, MA; ***Dept Chemistry, Univ North Carolina, Chapel Hill, NC; #Chemical Sci Div, Lawrence Berkeley National Lab, Berkeley, CA
REPRINTED FRCM: REVIEW OF SCIENTIFIC INSTRUMENTS, Vol 74, No. 9, pp 4096-4109, September 2003. 14. ABSTRACT
We have developed an octopole-quadrapole photoionization apparatus at the Advanced Light Source for absolute integral cross-section measurements of rovibrational-state-selected ion-molecule reactions. This apparatus consists of a high-resolution photoionization ion source, a wired ion gate lens, a dual radio-frequency (rO octopole ion guide reaction gas cell, and a quadmpole mass spectrometer for reactant and product ion detection. The unique feature of this apparatus is the implementation of the high-resolution pulsed field ionization-photoelectron (PFI-PE)-photoion coincidence (PFI-PEPICO) technique, which has allowed the rotational-state selection of diatomic ions for ion-molecule reaction studies, The novel application of the wired ion gate lens for the rejection of false coincidence background ions is described. This application, along with the difFerenti?d-ion-gate scheme, has made possible the measurements of rovibrationai-state-selected absolute integral reaction cross sections for ion-molecule collisions using the PFI-PE-secondaiy ion coincidence (PFI-PESICO) method. '
15. SUBJECT TERMS Pulsed-field ionization Coincidence measurements Vibrational state selection Synchrotron radiation
State-selected ion-molecule reactions Vacuum ultraviolet Guided-ion beams
16. SECURITY CLASSIFICATION OF:
a. REPORT UNCLAS
b. ABSTRACT UNCLAS
c. THIS PAGE UNCLAS
17. LIMITATION OF ABSTRACT
SAR
18. NUMBER OF PAGES
15
19a. NAME OF RESPONSIBLE PERSON R. Dressier 19b. TELEPHONE NUMBER (include area code) 781-377-2332
Best Available Copy standard Form 298 (Rev. 8-98) Prescribed by ANSI Std. 239.18

J* AFRL-VS-HA-TR-2004-1100
"REVIEW OF SCffiNTIFIC INSTRUMENTS VOLUME 74, NUMBER 9 SEPTEMBER 2003
High-resolution state-selected ion-molecule reaction studies using pulsed field ionization photoelectron-secondary ion coincidence method
X.-M. Qian, T. Zhang, C. Chang, P. Wang, and C. Y. Ng^' Department of Chemistry, University of California at Davis, One Shields Avenue, Davis, California 95616
Yu-Hui Chiu and Dale J. Levandier Institute for Scientific Research, Boston College, Newton, Massachusetts 02159
J. Scott Miller''' and Rainer A. Dressier^' Air Force Research Laboratory, Space Vehicles Directorate, Hanscom AFB, Massachusetts 01731-3010
Tomas Baer Department of Chemistry, The University of North Carolina, Chapel Hill, North Carolina 27599-3290
Darcy S. Peterka Chemical Science Division, Lawrence Berkeley National Laboratory, Berkeley, California 94720
(Received 21 March 2003; accepted 6 June 2003)
We have developed an octopole-quadrupole photoionization apparatus at the Advanced Light Source for absolute integral cross-section measurements of rovibrational-state-selected ion-molecule reactions. This apparatus consists of a high-resolution photoionization ion source, a wired ion gate lens, a dual radio-frequency (rf) octopole ion guide reaction gas cell, and a quadrupole mass spectrometer for reactant and product ion detection. The unique feature of this apparatus is the implementation of the high-resolution pulsed field ionization-photoelectron (PFI-PE)-photoion coincidence (PFI-PEPICO) technique, which has allowed the rotational-state selection of diatomic ions for ion-molecule reaction studies. The novel application of the wired ion gate lens for the rejection of false coincidence background ions is described. This application, along with the diflferential-ion-gate scheme, has made possible the measurements of rovibrational-state-selected absolute integral reaction cross sections for ion-molecule collisions using the PFI-PE-secondary ion coincidence (PFI-PESICO) method. The successful measurement of absolute state-selected cross sections for H2"''(X,i;*,i\r"'')-l-Ar(Ne) with y^ up to 17 [the third to the last vibrational state of Ha^W] demonstrates the high sensitivity of this differential-ion-gate PFI-PESICO method. In order to gain a detailed understanding and to obtain optimal performance of the wired ion gate lens for PFI-PESICO measurements, we have carried out ion trajectory calculations of reactant ions between the photoionization region and the rf-octopole ion guide. On the basis of these calculations, possible future improvements for the application of this differential-ion-gate PFI-PESICO scheme are discussed. © 2003 American Institute of Physics. [DOI: 10.1063/1.1599071]
I. INTRODUCTION The threshold photoelectron (TPE)-photoion coincidence (TPEPICO) method,^'^ which concems the detection of cor-
Photoionization is the most versatile method for the related TPE-photoion pairs using tunable VUV radiation, preparation of state- or energy-selected reactant ions.'"^ represents a more advanced photoionization teclinique for Single-photon ionization, which usually occurs in the the preparation of state-or energy-selected ions. In such ex- vacuum ultraviolet (VUV), is among the most general and periments, the internal state or energy of photoions detected cleanest photoionization schemes. " Because of the fine j^ coincidence of TPEs is equal to the difference between the control in photon energy, simple reactant ions in their ground photoionization energy and the IE of the neutral precursor states with 100% purity or in a well-defined distribution of ^^^^^^^ ^^ ^PEs have near-zero kinetic energies. Due to the mtemal states can be easily prepared by photoionization. ,. ,. x- ^ ^ ■ ■ ■ ^^s^i 1-^1- „ ., , ... ,. ., mediation of near-resonant autoionizmg states, the TPE By virtue of the photoionization mechanism, excited reactant , , ^ -i • . x- 1 . ■ -.i .• 1, . . , , , f , . , , , ,, , bands for vibronic states of photoions with negligible ions in metastable states, which cannot be produced by pho- „ ,^,^ ^ .. , ... ,,
., ,. r ■ . 1. J- J 1 ,7TTT7 Franck-Condon factors for direct photoionization can be ob- toexcitation of ions, can also be formed by VUV A TU ■ ■ -A
, 4 ■ - J.. 1-4 ' served. Thus, reactant ions in a wide range of internal states photoionization. " or energies can, in principle, be prepared using the TPEPICO method. If the product ions formed by ion-neutral collisions
^'Electronic mail: [email protected] ^^ , ^ _^ ,^, _^ involving the statc-selccted reactant ions maintain the time 'NRC Postdoctoral Fellow. Current address: Naval Surface Warfare • , , mT^x- - ■ • , ■ . . „ Center-Indian Head, 101 Strauss Avenue, Indian Head, MD 20640. correlation With the TPE tnggenng Signals, the reactivity of
"'Electronic mail: [email protected] mil the State- or energy-selected reactant ions can be examined
0034-6748/2003/74(9)/4096/14/$20.00 4096 © 2003 American Institute of Physics
Downloaded 02 Sop 2003 to 146.153.144,33. Redistribution subject to AlP license or copyright, see http://ojps.aip.org/rsio/rsicr.jsp

Rev. Sci. Instrum., Vol. 74, No. 9, September 2003 Ion-molecule reaction studies 4097
5,6
by coincidence detection of the TPE-product ion pairs. This technique, which is known in the literature as the TPE- secondary ion coincidence (TPESICO) method,' has been demonstrated to be a general scheme for state-selected ion molecule reaction studies. However, previous applications' of the TPESICO method for state-selected ion-molecule col- lisions experiments have been constrained by the relatively poor TPE resolution [&20 meV, full width at half maximum (FWHM)] and experimental sensitivity, limiting reactivity studies to reactant ions prepared in relatively low vibrational levels. The problem associated with the hot-electron tail in TPE detection* can also degrade the purity of vibronic states prepared in TPESICO experiments. The use of the penetrat- ing field scheme, along with the time-of-flight (TOF) dis- crimination of hot electrons in TPE measurements has shown to greatly reduce the hot-tail problem.''"* The successful ap- plication of the penetration field and TOF method in syn- chrotron based TPEPICO measurements of rare gas dimers has achieved TPE resolutions of 2-3 meV (FWHM).'° How- ever, this TOF discrimination method requires a single-bunch or a two-bunch synchrotron operation, a mode that has a significantly lower light intensity than that of a multibunch synchrotron operation.
The pulsed field ionization (PFI)-photoelectron (PFI-PE) scheme""'* is a variant of the TPE method and has been shown to be free from the hot-tail problem. The high- resolution PFI-PE vibrational bands for many diatomic and polyatomic hydride species have been recorded with rota- tional resolution even for vibrational states close to the ion dissociation limits.'""'* We have recently developed a gen- erally applicable synchrotron based PFI-PE-photoion coinci- dence (PFI-PEPICO) scheme, making it possible to select the internal state or energy of reactant ions with a resolution of "=5-10 "cm"' (FWHM) for unimolecular dissociation studies.'"•'*•'' Since laser-based PFI-PE studies are, typically, conducted at a repetition rate of < 100 Hz, it is not suitable to employ the coincidence technique for the state selection of reactant ions. The state selection of reactant ions can be made by the PFI-photoion (PFI-PI).'' We note that both the PFI-PEPICO and laser based PFI-PI methods are concerned with the selection of PFI-PIs in well-defined internal states. In the laser based PFI-PI method, the PFI-PI detection is timed with respect to the excitation laser pulse, whereas the PFI-PI detection in the case of PFI-PEPICO measurements is timed with respect to the PFI-PE pulses. The PFI-PI scheme'^ usually requires a relatively large dc field and/or a relatively long delay between the VUV excitation and PFI field in order to separate background prompt ions from PFI- PIs. The higher dc field used has the effect of inducing field ionization of high-« Rydberg species initially populated by VUV excitation, and thus lowers the sensitivity and resolu- tion. The PFI-PEPICO method has the potential to be a more sensitive and a higher resolution method than the PFI-PI scheme because the use of a high dc field is not required. However, a major limitation in the coincidence approach is the background noise resulting from false coincidences. This is especially problematic in high-resolution studies where the true energy selected ions consist of a very small fraction of all the ions that are produced.
As shown in a previous analysis,"" the signal-to-noise (S/N) for PFI-PEPICO (TPEPICO) studies of unimolecular reactions is calculated as
A^ Vn- NJJit
INAt' (1)
whereas tliat for PFI-PE-secondary ion coincidence (PFI- PESICO) or TPESICO studies'* of bimolecular ion-molecule collisions is predicted to be
-4 \+2NAt'' (2)
Here, N,, N,fg, f,, and i represent the threshold ionization rate, the total ionization rate, the electron transmission, the ion transmission, and the data accumulation time, respec- tively. For PFI-PEPICO TOF measurements, the full width (Ar) for the TOF peak of a daughter ion is, typically, equal to a few /is. In reactions that involve the formation of slow product ion, such as in charge transfer reactions, the full width (A/') for slow product ions can span the TOF range of =« 100-200 /is. Taking into account that typical total cross sections ((r«=10"'*-10~"'cm^) for ion-neutral collisions and the typical density (««'2X10~''Torr or 6 X10'^ molecules/cm^) for neutral reactants^""* and the length (/'^Scm) for the reaction gas cell used, we expect that the S/N for PFI-PESICO (TPESICO) TOF measure- ments of bimolecular reactions is generally more than two orders of magnitude lower than that for PFI-PEPICO (TPEPICO) TOF measurements of unimolecular dissociation reactions. Thus, the success of the PFI-PESICO scheme de- pends critically on the efficient rejection of false coincidence background ions.
In this article, we report the development of the PFI-PE- secondary ion coincidence (PFI-PESICO) method for state- selected ion-neutral collision studies at the Chemical Dy- namics Beamline'* of the Advanced Light Source (ALS). We have achieved the optimal rejection of false coincidence ions by the novel application of a wired ion gate lens, which is referred to as an ion gate below. "'^'' This gate can be opened for a very short period (>20 ns) to let the true ions pass while rejecting the false ions during its closed period. This scheme of using an ion gate to pass only the true coincidence ions to the ion detector as signified by the threshold electron signals has been employed in previous TPEPICO studies.^''^^ Due to the random nature of false coincidence ions, some false coincidence ions are expected to pass to the ion detector together with the true coincidence ions when the ion gate is on. In order to correct for this false coincidence background, a second ion gate witli tlie same gate width is opened at an arbitrary delay with respect to the first ion gate, which only samples the false coincidence ions. Since the false coinci- dence ions are produced randomly and have a uniform inten- sity in time, the true coincidence ion intensity can be ob- tained by taking the difference between the ion counts associated with the first and second ion gates. This differential-ion-gate coincidence scheme has been success- fully used previously for measuring the TPE spectra of van der Waals dimers formed by supersonic expansions and radi-
Downloaded 02 Sop 2003 to 146.153.144.33. Redistribution subject to AlP license or copyright, see http://ojps.aip.org/rsio/rstcr.jsp
4098 Rev. Sci. Instrum., Vol. 74, No. 9, September 2003 Qian et al.
cals produced in gaseous discharge despite the fact that the ion-gate width used was significantly greater than those em- ployed in the present study.^'"^^ As shown below, the narrow ion-gate width achieved using the wired ion gate lens, to- gether with the application of the differential-ion-gate coin- cidence scheme, is critical for the success of the present PFI- PESICO experiment. The procedures for fabrication of tlie wired ion gate lens are described here. In order to gain a detailed understanding concerning the performance of the ion gate, we have also performed trajectory calculations of photoions between the photoionization region and the rf- octopole ion guide. These calculations have not only pro- vided guidance in setting the parameters for the optimal op- eration of the ion gate, but have also yielded useful insight on possible improvements of the PFI-PESICO scheme.
Experimental cross sections on the state-selected ion- molecule reactions Ar'^(^Pi/2,i/2)'^^i ^nd H2'*'(i''^ = 0-17,Af"''=l) + Ar(Ne) have been obtained using tliis PFI-PESICO scheme.^^ Selected results are presented here to illustrate the application of the differential-pulse-ion-gate scheme for PFI-PEPICO and PFI-PESICO measurements. Witli further improvement in the kinetic energy resolution for reactant ions, we believe that this new PFI-PESICO scheme will play an important role in providing accurate new state-selected cross-section data for simulation of ion- molecule reaction cycles in plasma and planetary atmo- spheres, in addition to providing new challenges for theorists in the field of chemical reaction dynamics.
II. EXPERIMENTAL CONSIDERATIONS
The experiments were carried out using the high- resolution monochromatized VUV undxilator synchrotron source of the Chemical Dynamics Beamline'* at the ALS. This VUV synchrotron source consists of a 10-cm-period undulator, a gas harmonic filter, and a high-resolution 6.65 m off-plane Eagle mounted scanning monochromator. All de- tails concerning these elements have been described previ- ously. The ALS ring was operated in the multibunch mode with a dark gap of 104 ns.'^ Neon was used in the haimonic gas filter to suppress the higher undulator harmonics with photon energies greater than 21.565 eV. A 2400 lines/mm grating (dispersion= 0.64 A/mm) was used to disperse the first harmonic of the undulator VUV beam with entrance/exit slits sizes in the range of 30-100 /xm. The dispersed VUV radiation emerging firom the monochromator was focused into the photoionization center of the octopole-quadrapole photoionization apparatus.
A. The octopole-quadrupole photoionization apparatus
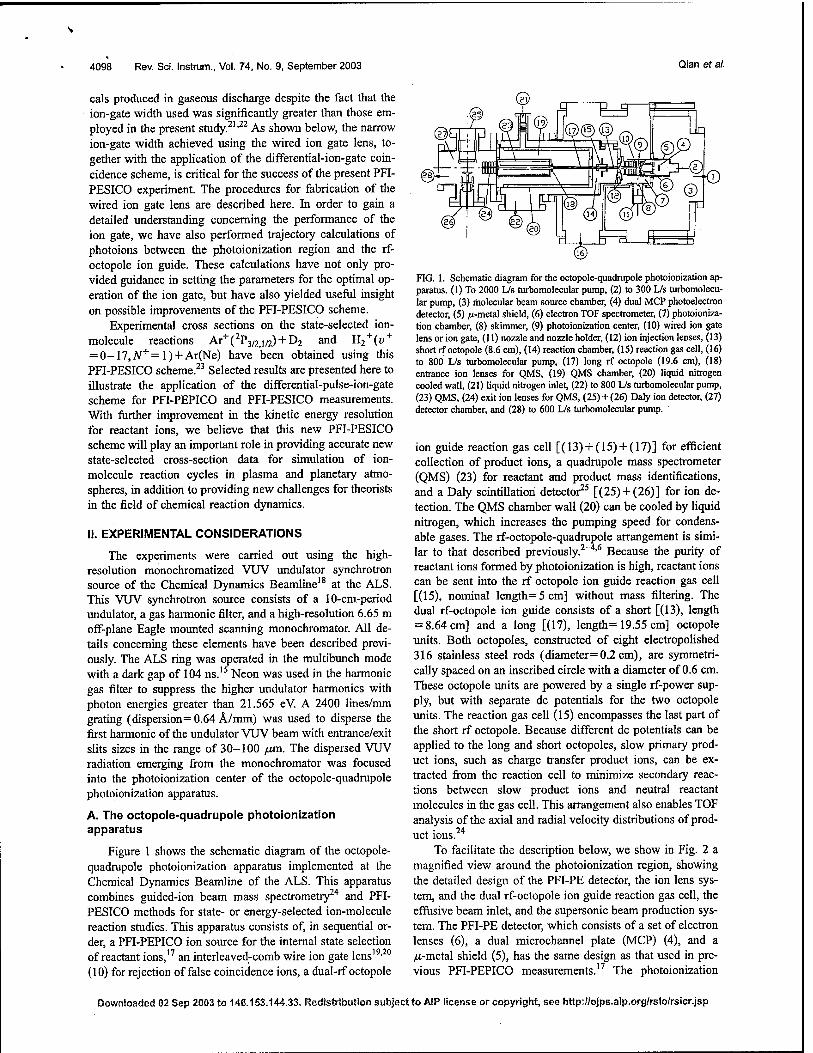
Figure 1 shows the schematic diagram of the octopole- quadrupole photoionization apparatus implemented at the Chemical Dynamics Beamline of the ALS. This apparatus combines guided-ion beam mass spectrometry^'* and PFI- PESICO methods for state- or energy-selected ion-molecule reaction studies. This apparatus consists of, in sequential or- der, a PFI-PEPICO ion source for the internal state selection of reactant ions," an interleaved-comb wire ion gate lens"'^'' (10) for rejection of false coincidence ions, a dual-rf octopole
FIG. 1. Schematic diagram for the octopole-quadrupole photoionization ap- paratus. (1) To 2000 L/s turbomolecular pump, (2) to 300 L/s turbomolecu- lar pump, (3) tholecular beam source chamber, (4) dual MCP photoelectron detector, (5) /i-metal shield, (6) electron TOF spectrometer, (7) photoioniza- tion chamber, (8) skimmer, (9) photoionization center, (10) wired ion gate lens or ion gate, (11) nozzle and nozzle holder, (12) ion injection lenses, (13) short rf octopole (8.6 cm), (14) reaction chamber, (15) reaction gas cell, (16) to 800 L/s turbomolecular pump, (17) long rf octopole (19.6 cm), (18) entrance ion lenses for QMS, (l9) QMS chamber, (20) liquid nitrogen cooled wall, (21) Hquid nitrogen inlet, (22) to 800 L/s turbomolecular pump, (23) QMS, (24) exit ion lenses for QMS, (25)+ (26) Daly ion detector, (27) detector chamber, and (28) to 600 L/s turbomolecular pump.
ion guide reaction gas cell [(13) + (15) + (17)] for efScient collection of product ions, a quadrupole mass spectrometer (QMS) (23) for reactant and product mass identifications, and a Daly scintillation detector^^ [(25)-I-(26)] for ion de- tection. The QMS chamber wall (20) can be cooled by liquid nitrogen, which increases the pumping speed for condens- able gases. Tlie rf-octopole-quadrupole arrangement is simi- lar to that described previously.^"'''* Because the purity of reactant ions formed by photoionization is high, reactant ions can be sent into the rf octopole ion guide reaction gas cell [(15), nominal length=5cm] without mass filtering. The dual rf-octopole ion guide consists of a short [(13), length = 8.64 cm] and a long [(17), length= 19.55 cm] octopole units. Both octopoles, constructed of eight electropolished 316 stainless steel rods (diameter=0.2 cm), are symmetri- cally spaced on an inscribed circle with a diameter of 0.6 cm. These octopole units are powered by a single rf-power sup- ply, but with separate dc potentials for the two octopole units. The reaction gas cell (15) encompasses the last part of the short rf octopole. Because different dc potentials can be applied to the long and short octopoles, slow primary prod- uct ions, such as charge transfer product ions, can be ex- tracted fi-om the reaction cell to minimize secondary reac- tions between slow product ions and neutral reactant molecules in the gas cell. This arrangement also enables TOF analysis of the axial and radial velocity distributions of prod- uct ions.
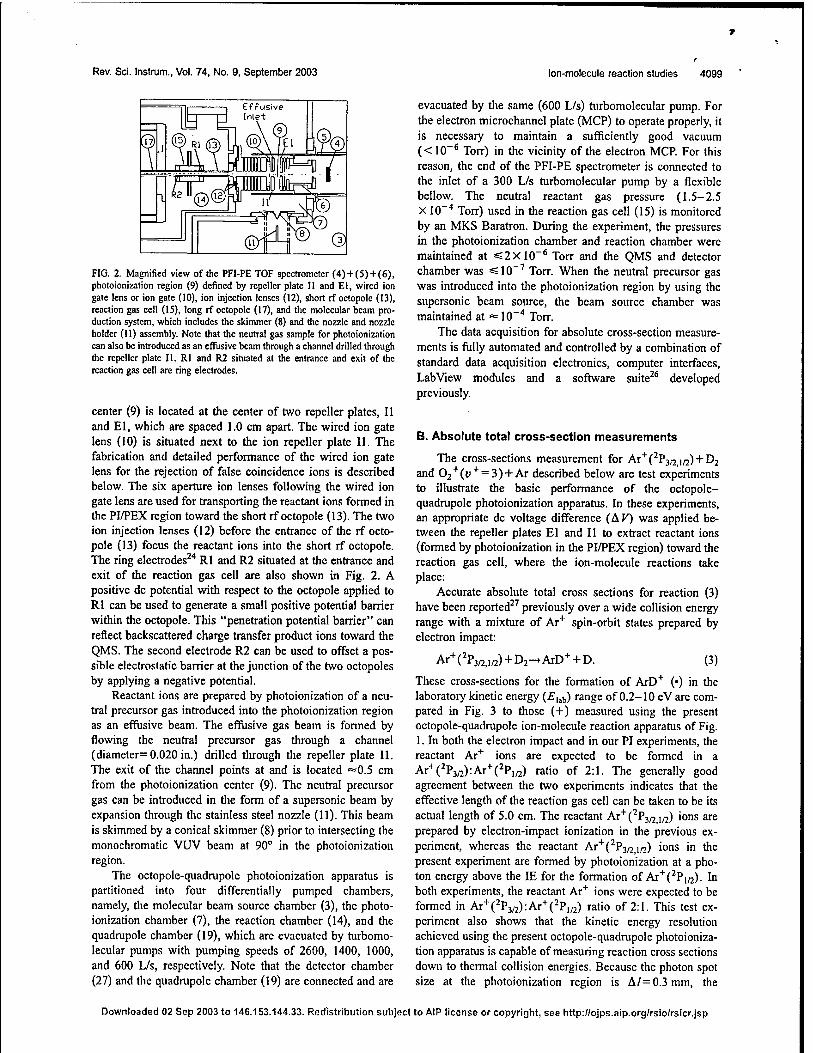
To facilitate the description below, we show in Fig. 2 a magnified view around the photoionization region, showing the detailed design of the PFI-PE detector, the ion lens sys- tem, and the dual rf-octopole ion guide reaction gas cell, the effusive beam inlet, and the supersonic beam production sys- tem. The PFI-PE detector, which consists of a set of electron lenses (6), a dual microchannel plate (MCP) (4), and a /i-metal shield (5), has the same design as that used in pre- vious PFI-PEPICO measurements.'^ The photoionization
Downloaded 02 Sep 2003 to 146.153.144.33. Redistribution subject to AtP license or copyright, see http://ojps.aip.org/rsio/rsicr.jsp
Rev. Sci. Instrum., Vol. 74, No. 9, September 2003 Ion-molecule reaction studies 4099
FIG. 2. Magnified view of the PFI-PE TOF spectrometer (4) + (5) + (6), photoionization region (9) defined by rcpeller plate II and El, wired ion gate lens or ion gate (10), ion injection lenses (12), short rf octopole (13), reaction gas cell (15), long rf octopole (17), and the molecular beam pro- duction system, which includes the skimmer (8) and the nozzle and nozzle holder (11) assembly. Note that the neutral gas sample for photoionization can also he introduced as an effusive beam through a channel drilled through the repcller plate II. Rl and R2 situated at the entrance and exit of the reaction gas cell are ring electrodes.
center (9) is located at the center of two repeller plates, II and El, which are spaced 1.0 cm apart. The wired ion gate lens (10) is situated next to the ion repeller plate II. The fabrication and detailed performance of the wired ion gate lens for the rejection of false coincidence ions is described below. The six aperture ion lenses following the wired ion gate lens are used for transporting the reactant ions formed in the PI/PEX region toward the short rf octopole (13). The two ion injection lenses (12) before the entrance of the rf octo- pole (13) focus the reactant ions into the short rf octopole. The ring electrodes^'' Rl and R2 situated at the entrance and exit of the reaction gas cell are also shown in Fig. 2. A positive dc potential with respect to the octopole applied to Rl can be used to generate a small positive potential barrier within the octopole. This "penetration potential barrier" can reflect backscattered charge transfer product ions toward the QMS. The second electrode R2 can be used to offset a pos- sible electrostatic barrier at the junction of the two octopoles by applying a negative potential.
Reactant ions are prepared by photoionization of a neu- tral precursor gas introduced into the photoionization region as an efifiisive beam. The effiisive gas beain is fonried by flowing the neutral precursor gas through a channel (diameter= 0.020 in.) drilled tlirough the repeller plate II. The exit of the channel points at and is located «=0.5 cm from the photoionization center (9). The neutral precursor gas can be introduced in tlie form of a supersonic beam by expansion through the stainless steel nozzle (11). This beam is skimmed by a conical skimmer (8) prior to intersecting the monochromatic VUV beam at 90° in the photoionization region.
The octopole-quadrupole photoionization apparatus is partitioned into four differentially pumped chambers, namely, the molecular beam source chamber (3), the photo- ionization chamber (7), the reaction chamber (14), and the quadrupole chamber (19), which are evacuated by turbomo- lecular pumps with pumping speeds of 2600, 1400, 1000, and 600 L/s, respectively. Note that the detector chamber (27) and the quadrupole chamber (19) are connected and are
evacuated by the same (600 L/s) turbomolecular pump. For the electron microchannel plate (MCP) to operate property, it is necessary to maintain a sufficiently good vacuum (<10"* Torr) in the vicinity of the electron MCR For this reason, the end of the PFI-PE spectrometer is connected to the inlet of a 300 L/s turbomolecular pump by a flexible bellow. The neutral reactant gas pressure (1.5-2.5 X 10"'' Torr) used in the reaction gas cell (15) is monitored by an MKS Baratron. During the experiment, the pressures in the photoionization chamber and reaction chamber were maintained at =S2X10~* Torr and the QMS and detector chamber was «10"^ Torr. When the neutral precursor gas was introduced into the photoionization region by using the supersonic beam source, the beam source chamber was maintained at ^10"'' Torr.
The data acquisition for absolute cross-section measure- ments is fully automated and controlled by a combination of standard data acquisition electronics, computer interfaces, LabView modules and a software suite^* developed previously.
B. Absolute total cross-section measurements
The cross-sections measurement for Ar*(^Vi,',ia)'^^2 and 02"''(i;''' = 3) + Ar described below are test experiments to illustrate the basic performance of the octopole- quadrupole photoionization apparatus. In these experiments, an appropriate dc voltage difference (AF) was applied be- tween the repeller plates El and II to extract reactant ions (formed by photoionization in the PI/PEX region) toward the reaction gas cell, where the ion-molecule reactions take place:
Accurate absolute total cross sections for reaction (3) have been reported^^ previously over a wide collision energy range with a mixture of Ar''" spin-orbit states prepared by electron impact:
Ar+(%2,i/2) + D2-^ArD+ + D. (3)
These cross-sections for the formation of ArD"*" (•) in the laboratory kinetic energy (£iab) range of 0.2-10 eV are com- pared in Fig. 3 to those (-I-) measured using the present octopole-quadrupole ion-molecule reaction apparatus of Fig. 1. In both the electron impact and in our PI experiments, the reactant Ar""" ions are expected to be formed in a Ar'^(^P3/2):Ar+(^P,/2) ratio of 2:1. The generally good agreement between the two experiments indicates that the effective length of the reaction gas cell can be taken to be its actual length of 5.0 cm. The reactant AT'''(^P^Q^fi) ions are prepared by electron-impact ionization in the previous ex- periment, whereas the reactant Ar*(^P3/2,i/2) ions in tlie present experiment are formed by photoionization at a pho- ton energy above the IE for the formation of Ai'*'C?if2). In both experiments, the reactant Ar"^ ions were expected to be formed in Ar+(^P3/2):Ar+(-P,;2) ratio of 2:1. This test ex- periment also shows that the kinetic energy resolution achieved using the present octopole-quadrupole photoioniza- tion apparatus is capable of measuring reaction cross sections down to thermal collision energies. Because the photon spot size at the photoionization region is A/=0.3mm, the
Downloaded 02 Scp 2003 to 146.153.144.33. Redistribution subject to AlP license or copyright, see http://ojps.aip.org/rsio/rsicr.jsp

4100 Rev. Sci. Instrum., Vol. 74, No. 9, September 2003 Qian et al.
100 I I I I I I I I I I I I I I I I I I I I I I I I I I I I I I I I I I I I 1 I I I
ArVP3/2,i/2) + Dj-»ArD* + D
FIG. 3. Absolute total cross sections for reaction AT*CP3a,m) + ^2 -♦ArD+ + D in the ^^b range of 0.03-10 eV. (—): reported in Ref 27 and (+): obtained using the octopole-quadrupole photoionization apparatus shown in Fig. 1.
resolution for Ei^y, (A^iab) is predicted to be AEi^^,= {Al/l) X(AF) = (0.03)AF. Using the AF value of 1 V, a AE^ value of «=0.03 eV can be readily attained.
We have also examined the collision-induced dissocia- tion and charge transfer cross sections for the reaction of 02"^ +Ar (not shown here) with reactant Oj"*" prepared in the v*^3 state by photoionization. These cross-section curves are similar to those reported in Ref 28. Despite the low cross sections at the thresholds, the appearance energies observed for O"^ and Ar""" were found to be consistent with their ther- mochemical thresholds, demonstrating that reaction cross sections dovm to the range of 10" '*-10" " cm^ can be mea- sured using the octopole-quadnipole photoionization apparatus.
C. Fabrication and performance of the fast ion gate
As pointed out above, the success of the PFI-PESICO TOF measurements for state-selected ion-molecule reactions depends critically on the novel application of the fast ion gate"'^" (10). The ion gate consists of an array of parallel wires separated by 0.0125 in. The wires are electrically con- nected in an interleaved manner such that neighboring wires are electrically insulated from each other. The parallel wire assembly was fabricated by winding of a 0.0008 in. gold plated tungsten wire on a 4in.X5in. rectangular circuit board with a 3 in.X4 in. open central area, as shown in Fig. 4, where the outer gray regions are the common area (where a floating voltage can be applied), the upper and lower T-shaped regions are conducting areas for connection to the even and odd sets of tungsten wires, respectively. The upper and lower light-gray strips between the T-shaped region and the open central region are areas for applying epoxy to fix the positions of the odd and even sets of wires, respectively.
The fabrication was made on an assembly of eight iden- tical circuit boards (Fig. 4), which were mounted to the faces of an aluminum octagon. The axle of the octagon was placed in the chuck of a lathe. The wire spacing of 0.0125 in. was determined by the 80 threads/in. pitch on the lathe. A pully
SiL
Qrounf:
Wire Set Even |
^^^^^^^^^^^^^^^^B Ground
r Wire Set Odd |
\r:MmM 1 : .:| FIG. 4. The 4 in.X5 in. rectangular circuit board with a 3 in. X 4 in. open area. The outer gray region is the grounding area, the black upper and lower T-shaped regions are conducting areas for connection to the even and odd tungsten wires, respectively. The light-gray strips just above and below the open area are areas for applying epoxy to fix the positions of the odd and even sets of wires.
system was used to hang a fixed mass on the wire feed to provide a constant tension while being wound. A piece of double sided tape was applied to each vertex of the octagon in order to prevent the wires from slipping on the circuit board. Once the wire was completely wound, two beads of epoxy were applied (to the strip regions located at the upper and lower edges of the open central area as shown in Fig. 4) to fix the wires on each of the frames. The frames could then be removed from the wheel. The next step involves cutting every other wire between the epoxy and the conductive strip. To simphfy this procedure, the wired circuit board was placed on a micrometer-adjust franslation stage, and a splined jewelers drill was used, with a small bit sharpened to a chisel point (the drill was not rotating). The construction of the wired ion gate lens is completed by soldering the remain- ing wires on each side to the conductive strip.
By applying a positive and negative potential of across the two sets of wires, a strong and highly local electric field can be generated between adjacent wires. Ions can be effec- tively deflected away from the beam path as they pass through the grid. Due to the small distance between adjacent wires, a small potential difference is sufficient for deflecting the false coincidence ions. Because low kinetic energy ions are more easily deflected than fast ions, and because it is desirable to reject the false ions when they are spatially com- pact, we have placed the ion gate early in the ion trajectory, namely next to the ion repeller plate II. Due to the short range natiue of the wire deflection fields, the ion gate can be used as a fast "ion gate" to pass the coincidence PFI-PI at a fixed delay with respect to the detection of a PFI-PE by switching off the wire deflection field.
In the present experiment, there are two sources of false coincidence ions. One contribution arises from direct VUV photoionization. The time distribution of this coincidence background as seen by the ion detector is determined by the
Downloaded 02 Sep 2003 to 146.153.144.33. Redistribution subject to AlP license or copyright, see http://ojps.alp.org/rsio/rsicr.isp
Rev. Sci. Instrum., Vol. 74, No. 9, September 2003 Ion-molecule reaction studies 4101
pattern of VUV niicropulses emitted by the ALS synchrotron ring. One ALS synclirotron period of 656 ns consists of a light-on interval of 552 ns [276 micropulses (width= 50 ps) with uniform separations of 2 ns] and a dark gap of 104 ns.'^''^ The coincidence TOF measurements show that the ion TOF widths observed are in the range of 1-5 jjs. Thus, tlie ion arrivals at tlie ion detector are dispersed into the temporal regions associated with the dark gaps, making the time distribution of false coincidence ions more uniform. The PFl-PIs are formed by PFI in the dark gap using a 200 ns electric field pulse. False coincidence events can also oc- cur if either the PFI-PE or PFI-PI is lost on the way to the electron or ion detector. The distribution of this second source of false coincidence ions should center in the tempo- ral regions associated with the dark gaps. Both the contribu- tions by direct ionization and by PFI events are expected to give rise to a wave-like pattern of the false coincidence back- ground witli the period equal to that of the ALS ring (656 ns). This expectation was confimied by previous PFI- PEPICO measurements.'^ However, the large ion dispersion of 1-5 fis as observed by coincidence ion TOF measure- ments in this experiment has greatly smoothened the wave- like pattern, yielding a near time-independent false comci- dence counting rate when average over a temporal range of a few /JLS. The near uniform time distribution of false coinci- dence ions is confirmed by PFI-PEPICO ion TOF spectra presented below. Since the PFI pulse is applied at a repetition rate of 1.53 MHz and the PFI-PE intensity is generally <3000 counts/s, the probability of forming a PFI-PI by one PFI pulse is <2X10~-'. Considering the fact that the total ionization rate is «10' ions/s, the average false coincidence ion produced in the time window of 200 ns is <2 X10"^ ions. This analysis shows that the probability of pro- ducing a PFI-PI and a false coincidence ion together in the same time window of 200 ns is negligibly small. The statis- tical or random nature of the formation of PFI-PIs and false coincidence ions has made possible the PFI-PEPICO and PFI-PESICO measurements.'^
In the experiments described below, the ion gate is floated at a dc voltage (applied to all wires) in the range of —2.5 to —8 V. This dc potential can be detennined by maxi- mizing the ion transmission. The deflecting field resulting from the positive and negative potential does not affect the trajectories of ions at a distance of a few times of the wire spacing fi-om the ion gate because the alternate positive and negative potentials seen by these ions are exactly canceled. The detection of a PFI-PE by the electron detector signifies the production of an energy-selected ion, i.e., PFI-PI, at the photoionization region. In order to select tliis one ion and reject all the nonenergy selected ions, the strategy is to open tlie fast ion gate for the minimum time necessary to let this ion pass, while rejecting all other ions. As described below, typical open times for the ion gate are 200-300 ns. For a PFI-PE trigger rate of «^1000 counts/s, the opening time per second for the ion gate is '="2-3X10"' s. Assuming that background false coincidence ions are generated uniformly in time, the false coincidence signal should be reduced by a factor of =2-3 X 10"'' by using the wired ion gate scheme.
D. PFI-PEPICO measurements
The experimental conditions and dark-gap PFI scheme used for PFI-PE detection and PFI-PI extraction are similar to those described in previous PFI-PEPICO measurements.'^ Briefly, a nominal dc field of zero V/cm was set across the photoionization region. The application of a PFI and ion ex- traction field pulse (8 V/cm, width=200 ns) was delayed by '^'lO ns with respect to the beginning of the 104 ns dark gap. The field was achieved by applying an electric pulse of -4.0 V at U and +4.0 V at El. As pointed out in previous studies, the employment of a PFI pulse with the duration of 200 ns is necessary for efficient extraction of the PFI-PI.
The PFI-PEPICO TOF peak for Ar+ observed using the 10 V/cm (-5.0 V at II and +5.0 V at El), 200 ns long pulsed extraction field and a linear TOF mass spectrometer with an Ar supersonic beam sample has a FWHM of =300 ns." Figure 5(a) shows the experimental PFI-PEPICO TOF spectrum for Ar*(^P|Q) formed by photoionization of an effusive Ar beam at 298 K without using the ion gate. The observed FWHM for the AT*{^?i^) TOF peak of Fig. 5(a) is =4 /MS (FWHM). Thus, the false coincidence background for the PFI-PEPICO measurement of Ar+(^P|/2) (measured un- der the coincidence TOF peak) is expected to be "=13 times higher than that observed in the previous molecular beam TOF measurement. The intensity of false coincidences in the spectrum of Fig. 5(a) is a factor of 4 higher than the coinci- dence peak. Figures 5(b) and 5(c) show the PFI-PEPICO TOF spectra for Ar*(^P3/2) and Ar*(^P,/2), respectively, ob- tained using the ion gate. Here, the ion gate (duration = 200 ns) was opened twice for each PFI-PE trigger pulse. The first ion gate was opened at the correct delay of 4.7 fis with respect to the PFI-PE trigger pulse to pass the true PFI- PIs, whereas the second ion gate was opened after an arbi- trary delay of 25 ^s with respect to the first ion gate. Thus, the first TOF peak measures mostly the intensity of true co- incidence ions, whereas the second TOF peak [marked by arrow in Figs. 5(a) and 5(b)] gives only the false coincidence ions. The true coincidence counts can be obtained by taking the difference in counts of the first and second TOF peaks. For the spectra shown in Figs. 5(b) and 5(c), the center bias voltage and the (positive, negative) voltages (with respect to the center bias voltage) applied to the (even, odd) sets of wires of the ion gate are -2.5 V and (+2.5 V, -2.5 V), respectively. Note tliat the background level observed in Figs. 5(b) and 5(c) is not zero. As expected, the background level for the Ar'''(^P,/2) band is higher than that for the ^^C^iii) band. This constant background also depends on the (positive, negative) voltages (or the deflection field) ap- plied to the wired ion gate for shutting off the false back- ground ions.
Figures 6(a), 6(b), and 6(c) compare the PFI-PEPICO TOF spectra obtained using a constant bias voltage of -2.5 V, but setting the relative voltages on the wires to ±2.5, ±3.0, and ±3.5 V applied to the odd and even sets of wires, respectively. As shown in these figures, the constant back- ground of the PFI-PEPICO spectrum decreases as the mag- nitude of the (positive, negative) voltage increases, i.e., the deflection field between adjacent wires is increased, resulting
Downloaded 02 Sep 2003 to 146.153.144.33. Redistribution subject to AlP license or copyright, see http://ojps.aip.org/rsio/rslcr.jsp

4102 Rev. Sci. Instrum., Vol. 74, No. 9, September 2003 Qian et al.
600
400
200 -
c 3
I I I I I I I I I I [ I t I I I I I I I [ 1 I I I I I 1 I I I I
(a) Wired gate off: Ar* (^P,„)
w «MM<<IM«»«I (B(wi»i>Oy<h<m^#>i«»Wi'* iiAl<>*JM'yW*''w^*N¥!
I I I I I I I I I I I I I I I I I M I I I I I I I I M I I I I I I I I
l(b) Double gates: Ar* (^P,-) 200
c O O O O Q. LJJ Q.
E Q.
100
300
200
100
H
ri I M [ I I I I
(c) Double gates: Ar* (^P,„) •
oL^ 0
JUL. '■■'■''■■■'■■'■'■■■■'
20 40 60 80 100 120 140
TOF (^is)
FIG. 5. (a) PFI-PEPICO bands for Ar'^(^P3n) obtained without using the wired gate, (b) PFI-PEPICO band for AT^C?I/2) obtained using the ion gate, (c) PFI-PEPICO band for Ar^C^Pia) obtained using the ion gate. The ion gate (duration=200 ns) was opened twice for each PFI-PE trigger pulse. The first ion gate was opened at the correct delay (4.70 /is) to pass the true PFI-PIs and the second ion gate was opened after an arbitrary delay of 25 fts with respect to the first ion gate. The first TOF peaks measure mostly the intensities for true coincidence ions, whereas the second TOF peaks (marked by arrows) give only the false coincidence ions. That is, the true coincidence counts equal to the difference in counts of the first and second TOF peaks. The do bias and deflection voltages of the ion gate are -2.5 V and ±2.5 V, respectively.
in more effective deflection of the false coincidence ions. As expected, the appropriate deflection voltage for shutting off the false coincidence ions also depends on the ion energy at (or the center bias dc voltage applied to) the ion gate. Once the conditions for selecting state-selected reactant ions are determined by maximizing the intensity of coincidence PFI- PIs from the photoionization region to the ion detector, the voltage settings of all the ion lenses situated between the photoionization region and the ion injection lenses can be fixed throughout the PFI-PESICO measurement to be de- scribed below. Because the photoionization center is always maintained (nominally) at ground potential, £1^1, of the ion- molecule reaction under investigation is thus controlled by the dc bias potential of the short rf octopole, where the reac-
500
400
300
-m 200
c 3 100
■P 0 nl
£ 300 tz 3 0 0 200
0 0 100
a Hi 0 Q.
- (" " I ■■' I I I I I I I I I I " I I I I I T"
I I I I
(a) Wired gate = ± 2.5V.
w
300
200
100
0 -
I I I I I I I I I I I :
(b) Wired gate = ± 3.0V
mj HKIIII^II
I I I I I I I I
' ■"'"I" '■
I I I I I I I
(c) Wired gate = ± 3.5V ^
_1 I I I I -I I I I L. 50 100
TOF (M-S)
150
FIG. 6. PFI-PEPICO spectra for Ax^C^^ii) obtained using the ion gate. Delay of the ion gate=4.70 /iS. The second ion gate was opened after an arbitrary delay of 25 IJS with respect to the first ion gate. Floating dc or center bias voltage=-2.5 V. Ion gate duration=200 ns. The (positive, negative) voltages are: (a) (+2.5 V, -2.5 V); (b) (-1-3.0 V, -3.0 V); and (c) (-1-3.5 V, —3.5 V). The second TOF peaks that measure the false coinci- dence ion counts are marked by arrows.
tion gas cell is situated. The efficiency of ion injection into the reaction gas cell (or short rf octopole) is mostly govemed by the injection lenses (12) shown in Figs. 1 and 2.
Figure 7 compares the PFI-PE band for Ar"'"(^Pi/2) (open circles) with the PFI-PEPICO band for Ar'*'(^P,/2) (solid squares) obtained using the differential-pulse-ion-gate PFI- PEPICO scheme. The good agreement between the PFI-PE and PFI-PEPICO bands can be taken as confirmation of the differential-pulse-ion-gate PFI-PEPICO scheme. However, the counting rate for the PFI-PEPICO measurement is nearly
500
15.932 15.934 15.936 15.938
hv(eV) 15.940
FIG. 7. Comparison of the PFI-PE band for Ai'*'(^V^f^ (open circles) with the PFI-PEPICO band for Ax*(^'P^i^ (solid squares) measured using the differential-pulse-ion-gate scheme. Note that the PFI-PEPICO band was measured only at four distinct energies and was scaled to match the PFI-PE band.
Downloaded 02 Sop 2003 to 146.153.144.33. Redistribution subject to AlP license or copyright, see http://ojps.aip.org/rsio/rsicr.jsp

Rev. Sci. Instrum., Vol. 74, No. 9, September 2003 Ion-molecule reaction studies 4103
hv (cm ) 127500 128000 128500 129000
X N*=2 4 6 . ■
50 1
(a) v*=2
3 5 3 p 4
3 , a 40 2 '
iao ?
10
0
XO.4
0 '■ ■ 1 ■ ■ ■ ■ 1 ■ ■ ■ ■ 1 •—+- ■ ■ ■ ■ 1 ■ •■ -^
134500 135000
15.900
hv (cm"') 135500
15.950 16.000
136000
25
"■20
■e S. 15
10
N*.
(b) v*=6
U_
■.A.,.i.....A... tm^n , ni -"^*'^''* • n ^-V' T-* •• - i
16.700 16.800
hv(eV)
16.850
FIG. 8. (a) Rotationally resolved PFI-PE vibrational band for Ui*{v'*^ = 2). Note that the intensities for {N*,f) = {\,\) and (2,0) transitions are reduced by a factor of 0.4. (b) Rotationally resolved PFI-PE vibrational band forH2*(u + = 6).
40-fold lower than that of the PFI-PE measurement, indicat- ing the low transmission for Ar"*".
E. PFI-PESICO measurements
We have obtained absolute integral cross sections for the state-selected ion-molecule reaction H2'''(i'''' = 0-17^'^ = 1)-I-Ar at specific E^j„^ values using the PFI-PESICO method.^^ Selected results of this reaction are described here to illustrate the performance of the differential-pulse-ion-gate PFI-PESICO scheme. Previous experiments have only pro- vided absolute integral cross sections for the vibrational state-selected reaction of H2'''(u'''^4) +Ar.^'' To our knowledge, the cross-section measurements for the rotational and vibrational state-selected reaction of H2'''(i;'*^,A'^''") + Ar have not been made.
The rotationally resolved vibrational PFI-PE bands for H2"'(y"^ = 0-18) have been obtained previously.'^''*'^''^" As an example, we show in Figs. 8(a) and 8(b) the PFI-PE bands for H2"^(y + = 2,A^+) and H2*(i;'* = 6,A^+), respectively, which reveal well-resolved rotational transitions as marked in the figures. We note that Figs. 8(a) and 8(b) have tlie same intensity scale. Due to the rotational distributions of ortho-
100
eo
60
40
20
0
(0 ■£ 20 3 O O 15 o = 10 O w lU Q. I u. Q.
I I I I I I I I ' I I I I ' I I I I I I I' I I
(a) H2*(v*=2, N*=1)
i... ., 1. — .. ....... —.^^
I I I I I I I I I I II I III I II
(b) Ar*/ArH*
I I II I II II I II II I I I I I I I
(c) Ar*/ArH*
200 300
TOF (US) 400 500
FIG. 9. (a) PFI-PEPICO TOF spectrum for reactant H2+(u* = 2,A^+ = l) (accumulation time=2 min). (b) PFI-PESICO TOF spectrum for product Ar*/ArH* at £1,^=2.5 eV obtained by setting the dc potential of the long octopole 0.4 V lower than that of the short octopole (accumulation time = 50 min). (c) PFI-PESICO spectrum for Ar+/ArH* at £■,,6=2.5 eV ob- tained by setting the dc potential of the long octopole -2 V lower than that of the short octopole (accumulation time=60 min).
and para-hydrogen at 298 K and selection rules for photoion- ization, the Af'' = 0, 1, 2, and 3 rotational states for many H2*(u"'') states, as shown in Figs. 8(a) and 8(b) for v^ = 2 and 6, can be prepared with good intensities by photoioniza- tion of normal H2 at 298 K.
Figure 9(a) shows tlie PFI-PEPICO TOF spectrum for reactant H2'^(i;"^ = 2,A^'^ = l) recorded at i:|,b= 2.5 eV using the differential-pulse-ion-gate scheme described above. The first ion gate (duration=300 ns) is delayed by 1.50 ;us with respect to the PFI-PE pulse and the second ion gate (duration= 300 ns) is set at 150 /iS with respect to the first ion gate. The TOF peak observed in Fig. 9(a) represents the true coincidence Hj* ions [or H2"^(u^ = 2,7^"^= 1) PFI-PIs] and false coincidence llj* ions transmitted through the ion gate. The second TOF peak, which samples only the false coincidences, is not discernible. This observation indicates that the false coincidence ion intensity under the (first) TOF peak of Fig. 9(a) is negligible. The PFI-PESICO TOF spec- trum shown in Fig. 9(b) is for the sum of product Ar"^ and ArH'*' (Ar'''/ArH''') and is obtained for an accumulation time of 50 min by using an Ar gas cell pressure of 2.15
Downloaded 02 Sep 2003 to 146,153.144.33. Redistribution subject to AlP license or copyright, see http://ojps.aip.org/rsio/rsicr.jsp
4104 Rev. Sci. Instrum., Vol. 74, No. 9, September 2003 Qian et at.
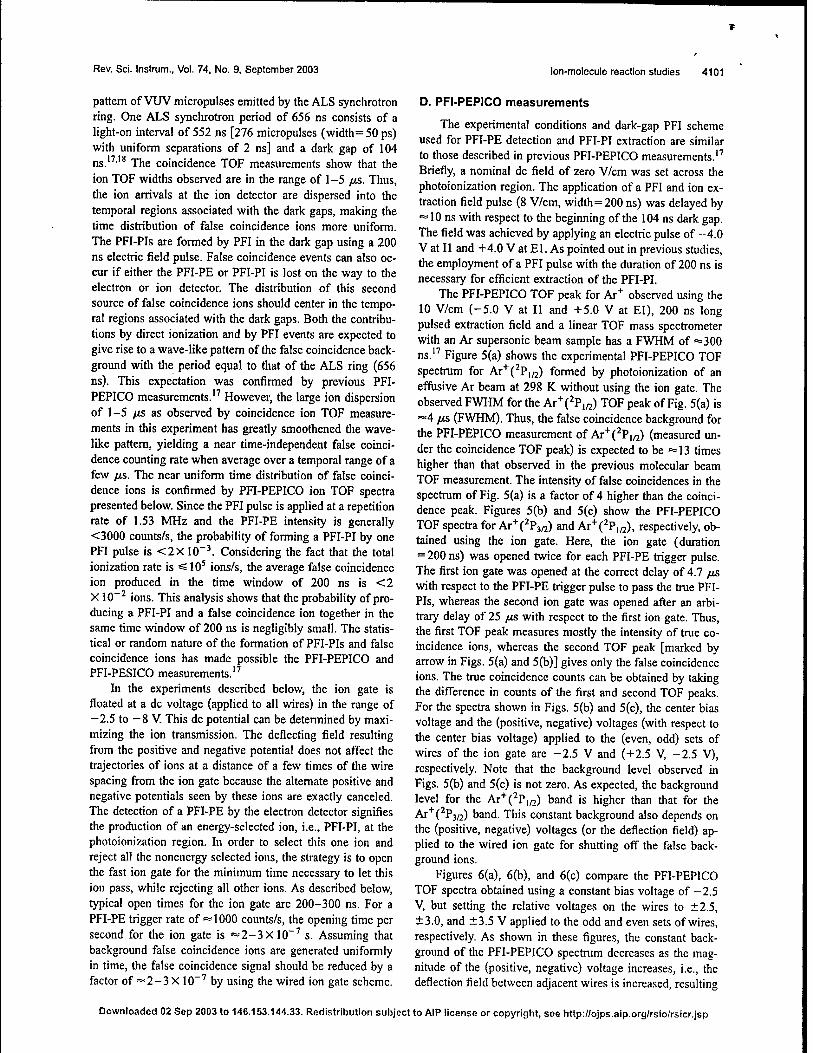
X 10"'* Torr and by setting the dc potential of the long oc- topole 0.4 V lower than that of the short octopole. Here, the resolution of the QMS is lowered to maximize the transmis- sion of Ar"^ and ArH"*" product ions, and thus both Ar* and ArH+ are transmitted. As shown in the PFI-PESICO TOP spectrum of Fig. 9(b), product Ar''"/ArH"'' ions are slow ions and are spread in a temporal region of «=200 /ts. A velocity inversion of the TOP spectrum demonstrates that the product ions are all produced with near-thermal velocities. Figure 9(c) shows the PFI-PESICO TOP spectrum for product Ar'^/ArH'^ obtained by setting die dc potential of the long octopole at -2 V below that of the short octopole, in order to extract slow product Ar^/ArH"^ ions from the gas cell. As a result, the TOP distribution for product Ar''"/ArH"'" observed in Fig. 9(c) is peaked at shorter flight times with a narrower temporal range of =100 /is. The intensities for reactant B.2*{v^ = 2,N'^ =\) and product Ar"'"/ArH"'" are measured by their coincidence counts after normalizing with the re- spective number of PFI-PE triggers. The absolute total cross sections for Ar"''/ArH"'" can then be calculated by the ratio of the product and reactant ion intensities, the neutral reactant gas density, and the length of the gas cell.
In order to determine the branching ratios for Ar"*" and ArH"*", the resolution for the QMS was increased to resolve these ions and PFI-PESICO TOP spectra for these ions were recorded. As an example, we show in Figs. 10(a), 10(b), and 10(c) the PFI-PESICO TOP spectra recorded at E^^^, = 2.5 eV for reactant H2'^(i;'^ = 2^+ = 0), product ArH"^ and product Ar"*", respectively. This measurement gives a Ar''':ArH"'' ratio of 1.3, which is consistent with results of previous experiments, indicating that at E]^\j=2.5 €W the cross section for charge transfer Ar''" is '=40% liigher than that for ArH*.^ As expected, Figs. 10(b) and 10(c) reveal that the arrival times for product ArH^ ions are in the range of = 100-200 /is, which is shorter than that of == 100-250 /JUS.
for charge transfer Ar"*". Although the intensities for PPI-PE vibrational bands of
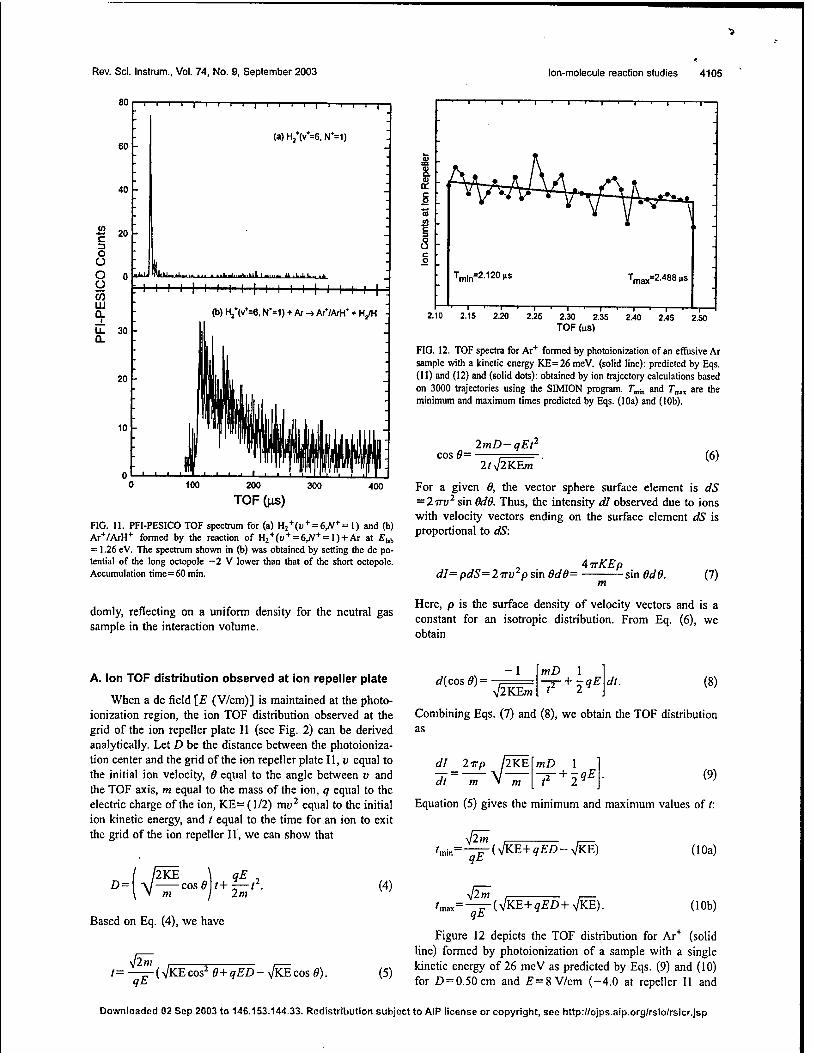
H2^(y*>4) are significantly lower than those for t;"''«4, we have still been able to record the PFI-PESICO spectra for Ar+ZArH"^ from H2'^(i;'^>4,JV+)-l-Ar. As an illustration, we show in Figs. 11(a) and 11(b), the PFI-PESICO TOF spectra at £i,b=1.26eV for H2''(j;* = 6,A^"*'= 1) and Ar'*'/ArH'''. Absolute total cross sections for Ar'^'/ArH* formed by the reaction H2'^(i;'^,A''+= 1)-F Ar with i; + = 17 have been reported recently.^^
III. ION TRAJECTORY CALCULATIONS
In order to understand and to optimize the application of the ion gate, we have performed ion trajectory calculations between the PI/PEX region and the short rf octopole using the SIMION program.'" The ion lens system of interest is divided into finite sections. Based on the two-dimensional (or three-dimensional) geometries used, the SIMION pro- gram calculates the electrostatic potentials for the ion lens sections. Since individual sections can be modeled indepen- dently, higher resolution arrays can be used in more critical areas such as the wired ion gate lens. SIMION has the func- tion to assemble individual potential arrays for modeling of
200
100 -
1—I—I—I—I—I—I—I—I—I—I—I—I—I—I—I—I—I—r
(a) H, V=2, N*=0)
0
c 3 o
o w UJ .
Xlmiaill ill 11 II I I ml laakMdkiAiii^A. I I I I I I I I I I I I I I I I I
(b) HjV=2, N*=0) + Ar -> Ar* + H,
I I I I I I I I I I !< I I I I I II f
(c) Hj>*=2, N*=0) + Ar -»ArH* + H
200
TOF (us) 300 400
FIG. 10. PFI-PESICO TOF spectra for (a) H2+(u"'=2,Af* = 0), (b) Ar+ and (c) ArH+ formed by the reaction of H2'^(u'^=2,Af+ = 0) + Ar at E^ = 2.5 eV. The accumulation time used for each of the Ar'*' and ArH"'' spec- tra was 90 min. The dc potential of the long octopole was set -2 V lower than that of the short octopole.
the entire ion lens system. The trajectories of charged par- ticles are calculated based on the modeled potential arrays of the entire ion lens system. We have also integrated the tra- jectory calculations to include rf fields appUed to the octo- poles and QMS. However, only the calculations involving the dc fields applied to the aperture lenses in the region be- tween the photoionization region (9) and the short rf octo- pole that are relevant to understanding the performance of the wired ion gate lens are shown here.
In the simulation, ions were randomly generated inside a cubic volume of 0.3X0.3X0.3 mm^ centered at the photo- ionization center. This cubic volume is an estimate of the interaction volume of the VUV beam and the neutral gas sample. We note that this volume ignores ion and electrons generated along the VUV beam, particularly when the neu- tral precursor sample is introduced as an effusive beam. For ions produced with non-zero initial kinetic energies, velocity vectors are generated isotropically with a chosen vector ori- gin situated inside the cubic interaction volume. The isotro- pic vector generation is ensured by the uniform vector den- sity on the surface of a given vector sphere. The vector origins in the cubic photoionization volume are chosen ran-
Downloaded 02 Sep 2003 to 146.153.144.33. Redistribution subject to AlP license or copyright, see http://ojps.aip.org/rsio/rsicr.jsp
Rev. Sci. Instrum., Vol. 74, No. 9, September 2003 Ion-molecule reaction studies 4105
80 [—1—I—I—I—I—I—I—I—I—I—I—I—1—I—I—I—I—I—I—r
60
40
je ?n c 3 O O o 0 o to UJ QL
u. 30 Q.
20
10
(a)HjV=6,N*=1)
"ll""'-^ ■■ ...t-J.-L.tLll I1.LJ.L...1
I I I I I I I I I I I I I I I I I I I
(b) HjV=6, N*=1) + Ar -»ArVArH* + HJH -
200
TOF (us) 300 400
FIG. 11. PFI-PESICO TOF spectrum for (a) H2+(i; + = 6,Ar+ = 1) and (b) Ar*/ArH* formed by the reaction of H2*(u + = 6,//+ = l) + Ar at £^b = 1.26 eV. The spectrum shown in (b) was obtained by setting the dc po- tential of the long octopole —2 V lower than that of the short octopole. Accumulation time=60 min.
domly, reflecting on a uniform density for the neutral gas
sample in the interaction volume.
- 1 . I F , 1 1 -^—1—•—I—•—r ■ r
^rAiW^ o "i \ ' \ J2 »
§ : T„ln=2.120,s Tmax=2t88.s
1 1 1 I 1 , r-l '-T- 2.10 2.15 2.20 2.25 2.30 2.3S
TOF (us) 2.40 2.45 2.50
FIG. 12. TOF spectra for Ar* formed by photoionization of an effusive Ar sample with a kinetic energy KE=26 meV. (solid line): predicted by Eqs. (11) and (12) and (solid dots): obtained by ion trajectory calculations based on 3000 trajectories using the SIMION program. r„j„ and T^, are the minimum and maximum times predicted by Eqs. (10a) and (10b).
C0S^= ImD-qEt^
2l-j2KEm ' (6)
For a given 6, the vector sphere surface element is dS = 27n;^ sin Odd. Thus, the intensity dl observed due to ions with velocity vectors ending on the surface element dS is proportional to dS:
dl= pdS=2Trv^p sin ede= A-rrKEp
sin Ode. (7)
Here, p is the surface density of velocity vectors and is a constant for an isotropic distribution. From Eq. (6), we obtain
A. Ion TOF distribution observed at ion repeller plate
When a dc field \_E (V/cm)] is maintained at the photo- ionization region, the ion TOF distribution observed at the grid of the ion repeller plate II (see Fig. 2) can be derived analytically. Let D be the distance between the photoioniza- tion center and the grid of the ion repeller plate II, i; equal to the initial ion velocity, B equal to the angle between v and the TOF axis, m equal to the mass of the ion, q equal to the electric charge of the ion, KE= (1/2) mv^ equal to the initial ion kinetic energy, and / equal to the time for an ion to exit the grid of the ion repeller II, we can show that
qE cos^|/+r—/^
m I 2m (4)
Based on Eq. (4), we have
/= 2m
(^iKEcosFJ+qED-ylKEcosd). (5)
d{cosO)-- x/2KE«
mD 1 dt. (8)
Combining Eqs. (7) and (8), we obtain the TOF distribution as
dl 2iTp /2KE
dt m
/2KE mD 1 (9)
Equation (5) gives the minimum and maximum values of /:
V2w
qE UKB+qED-ylKF.)
2m
qE iyJKE+qED+^).
(10a)
(10b)
Figure 12 depicts the TOF distribution for Ar"*" (solid line) formed by photoionization of a sample with a single kinetic energy of 26 meV as predicted by Eqs. (9) and (10) for Z) = 0.50cm and £=8 V/cm (-4.0 at repeller II and
Downloaded 02 Sop 2003 to 146.153.144.33. Redistribution subject to AlP llcensB or copyright, see http://ojps.aip.org/rsio/rsicr.jsp

4106 Rev. Sci. Instrum., Vol. 74, No. 9, September 2003 Qian et al.
Wired Gate 1/16" Lit.till,I I
FIG. 13. Ion trajectories deflected by the wired ion gate lens and equipo- tential lines in the vicinity of the wired ion gate lens. The wired ion gate lens was floated at a dc potential of -4.4 V. On top of this dc field, potentials of +4.4 and —4.4 V were applied to the even and odd sets of wires, respec- tively. That is, net potentials for even wires were zero, while tliat for odd wires were -8.8 V. The dc potentials applied to II and the adjacent lens on the right are -4.0 and -5.0 V, respectively.
+4.0 V at repeller El). This single kinetic energy calculation is a model for a thermal gas source m which the average kinetic energy is 26 meV. The p value can be viewed as a scaling parameter. We have also obtained the TOF spectrum for Ar"*" (solid dots) based on ion trajectory calculations. Since only 3000 trajectories are sampled, the fluctuation ob- served in the latter spectrum is statistical in nature. As shown in Fig. 12, the TOF spectra for Ar"*" obtained by trajectory sampling and by Eqs. (9) and (10) are in excellent agree- ment. This observation can be taken as a test of the ion trajectory calculations, validating the calculation procedures based on the SMION program.
B. Calculations of ion trajectories and TOF spectra
Figure 13 depicts the ion trajectories calculated using the SIMION program as they pass through jthe ion gate with tlae ion gate off, i.e., deflection fields on. As shown by the elec- trostatic equipotential lines shown in Fig. 13, strong local deflection fields exist between adjacent wires of the wired ion gate lens. With the exception of these short-range local fields around the wires, the equi-potential lines of Fig. 13 are essentially identical to those observed when the deflection fields between adjacent wires were tumed off. The simula- tion shows that the deflecting fields between adjacent wires resulting from the positive and negative potentials applied to the even and odd sets of wires do not affect the ion trajecto- ries at a distance of <1 mm («*3 times the wire spacing) away from the ion gate.
The analytical solution for the ion TOF spectrum ob- served in the PFI experiment is complicated by the pulsed
1.05 1.10 1.15 1.20 1.25 1.30 1.35 1.05 1.10 1.15 1.20 1.25 1.30 1.35 TOF (nS) TOF (nS)
FIG. 14. TOF spectrum for PFI H2+ ions (dots) formed by PFI of a VUV excited effusive H2 sample (KE= 26 meV) as observed at the wired ion gate lens. Time zero corresponds to the beginning of the ALS dark gap. The PFI-PIs were formed at 10 ns when the PFI field was switched on. (b) TOF spectrum for PFI Hz"^ formed by the PFI of a VUV excited supersonic beam sample (KE of 3 meV). Three thousand trajectories were calculated for PFI-PIs.
namre of the ion exh-action field. However, the ion TOF spectrum resulting fi-om the PFI ion extraction can be esti- mated by ion trajectory calculations. The calculated ion TOF spectrum would yield estimates for the delay and gate width for turning on the wired ion gate to pass the PFI-PI. Figure 14(a) shows the TOF spectrum for PFI Hz""" ions formed by PFI of high-« (w&lOO) Rydberg H2 observed at the wired ion gate lens. Since the H2 sample was introduced as an effusive beam, we have assumed that the average kinetic energy for H2'*' was 26 meV. In this calculation, time zero is taken to be die beginning of the dark gap. We assume that the PFI-PIs were formed immediately as tlie PFI field was tumed on (10 ns with respect to the beginning of the dark gap).
As shown in Fig. 14(a), PFI H2"^ ions are predicted to arrive at the ion gate between 1.10 and 1.31 /iS. Thus, in the state selection of H2"^ using the PFI-PEPICO scheme, the delay and the gate width for opening the ion gate should be set at 1.1 /IS and 210 ns, respectively. These values are con- sistent with the delay («1.2 fis) and gate width (250 ns) used in the experimental studies of the state-selected reactions U2^(v'^,N'^) + Ai. We find that the shape of the TOF spec- trum depends sensitively on the initial ion KE and the posi- tion where the PFI-PIs are bom in the photoionization re- gion. The sti-ong peak observed at 1.10-1.14 ytts in the TOF spectrum of Fig. 14(a) results from the pulse nature of the PFI field used for ion extraction.
Figures 15(a) and 15(b) depict the trajectories for PFI H2"'" ions and prompt background H2''' ions, respectively, between the photoionization center and the entrance of the short rf-octopole ion guide. Employing the delay of 1.1 /us and gate width of 250 ns for turning on the wired ion gate, the simulation of Fig. 15(a) indicates that 96% of the PFI H2 ions pass the ion gate and are focused by the ion injec- tion lenses into the short rf-octopole ion guide. For prompt background H2"^ ions, which arrive at the ion gate when the ion gate is "off," the trajectory calculation of Fig. 15(b)
Downloaded 02 Sep 2003 to 146.153.144.33. Redistribution subject to AlP license or copyright, see http://ojps.aip.org/rsio/rsicr.jsp

Rev. Sci. Instrum., Vol. 74, No. 9, September 2003 Ion-molecule reaction studies 4107
DC-4.4V/AC 4.4V -17.7V -20.3V +4V -4V / -5V -«2V /-16.9V/-10 33V-342V -SO.SBV
DC-4.4V/AC4.4V -17.7V -20.3V -4V / -5V -6.2V /-16.9V/-10.33V-3.42V -30.36V
FIG. 15. (a) Trajectories for PFI H2''' ions between the PI/PEX region and die short rfoctopole. The wired ion gate (gate width=250 ns) was turned on at a delay of 1.1 fis with respect to the formation of the PFI H2'''. The trajectory calculations show that 96% of the PFI-PIs were transmitted, (b) Trajectories for prompt background H2''' ions between the PI/PEX region and tlie short octopolc. The prompt ions arrived at the wired ion gate lens when the wired ion gate is turned "off." The trajectory calculations show that 96% of the ions were rejected.
5.0 5.2 5.4 5 6 5.B 60 6.2 6.4 5.0 5.2 5.4 5.6 68 6 0 6 2 6 4 TOP (MS) TOF (^S)
FIG. 16. Calculated TOF spectra for Ar* formed by PFI of a VUV excited (a) effusive Ar sample with a KE of 26 meV. (b) Supersonic Ar beam with aKEofSmeV.
transmission in the PFI-PEPICO measurement. The calcu- lated TOF spectrum for Ar""" shown in Fig. 16(a) suggests that the ion gate of 200 ns in the PFI-PEPICO measurements (Figs. 5 and 6) was most likely centered at the strong TOF peak for Ar* at 5.35 fjs. In the PFI-PEPICO measurements of Ar"^(^P3/2,i/2). the actual delay (with respect to the PFI-PE trigger pulse) used for turning off the deflection field of the wired ion gate is 4.7 fis. The difference in the calculated and experimental delays can be attributed to the electron flight time and a finite delay due to the electronics. In any case, the calculated TOF distribution shown in Fig. 16(a) serves to provide a rationalization for the use of a 200 ns ion gate width in the PFI-PEPICO measurements shown in Figs. 5 and 6.
shows that 96% of the prompt background H2''' ions are rejected by the ion gate. The calculation also shows that the ion injection lenses [see (12) of Figs. 1 and 2] are important elements for efficient injection of reactant ions into the short rf octopole at different Ei^^, values.
Figure 16(a) shows the calculated TOF spectrum for Ar* PFI ions from the photoionization region to the ion gate. The calculations assume that the PFI Ar* ions are formed from an Ar sample with a KE of 26 meV. The Ar* TOF distribu- tion of Fig. 16(a) exhibits two prominent peaks at 5.35 and 6.05 /M5. Similar to the TOF spectrum for PFI H2*, the tra- jectory calculations show that these peaks result from the pulse nature of the PFI ion extraction field. The full width of the Ar* spectrum indicates that the use of an ion gate width of ''^l.l fjs is required to transmit all PFI Ar* through the wired ion gate lens.
The ion gate width of 200 ns used in recording the PFI- PEPICO spectra of Figs. 5(b), 5(c), and 6(a)-6(c) was ob- tained by maximizing the coincidence ion counts, i.e., the difference in ion counts between the first ion gate and the second ion gate. These measurements were made prior to the ion trajectory calculations. Obviously, the 200 ns ion gate width used is significantly narrower tlian the predicted fiill width of 1.1 fjs, and is thus expected to reduce the Ar* ion
IV. POSSIBLE IMPROVEMENTS OF PFI-PEPICO AND PFI-PESICO MEASUREMENTS
The preparation of state-selected reactant ions using the PFI-PEPICO method along with the wired ion gate scheme, can be significantly improved if the neutral gas sample is introduced to the PI/PEX region in the form of a supersonic molecular beam traveling in a direction perpendicular to the ion TOF axis or the axis of the octopole-quadrupole assem- bly. We note that the rotational cooling achieved by the su- personic beam method is essential in some experiments for obtaining a better-resolved PFI-PE spectrum for the reactant ion of interest. As shown in the analysis below, due to the low translational temperature achieved in the supersonic beam arrangement, the FWHM of the coincidence ion TOF peak is significantly reduced as compared to that observed in using an effiisive beam sample. Furthermore, the supersonic beam method also can reduce the kinetic energy spread for the reactant ions in PFI-PESICO measurements.
Figure 14(b) depicts the calculated TOF spectrum for PFI H2* ions formed by PFI of a VUV excited Hj* sample with a translational temperamre of 20-30 K (or an average KE of 3 meV) along the ion TOF axis. As expected, the full width (95 ns) of the TOF distribution observed in Fig. 14(b) is considerably narrower than that (210 ns) of Fig. 14(a). If a
Downloaded 02 Sop 2003 to 146.153.144.33. Redistribution subject to AlP license or copyright, see http://ojps.aip.org/rsio/rsicr.jsp

*"
4108 Rev. Sci. Instrum., Vol. 74, No. 9, September 2003 Qian et a/.
O
(a) KE <= 26 meV
T493nieV 232 meV "
(b) KE » 3 meV
t., 245 n I ' ' * 1—'—r
meV 232 meV
1.0 1.5 ZO 2.5 3.0 3.5 4.0 4.5 5.0 1.0 1.5 2.0 2.5 3.0 3.5 4.0 4.5 5 0
E|ab (eV) E|ab (eV)
FIG. 17. Comparison of the calculated E^^ distribution for Ha* (observed at the grid of the ion repeller II) extracted using the PFI ion extraction scheme with that using the dc ion extraction arrangement, (a) The Hi* ions are assumed to be formed by photoionization of an effusive H2 sample with a KE of 26 meV. The calculation gives £|j|,=4.25eV and AE^^, = 0.232 eV for the dc ion extraction arrangement, whereas the calculation predicts £|,i,'=1.75 eV and A£]ai,= 0.493 eV for the PFI ion extraction mode, (b) The H2''' ions are assumed to be formed by photoionization of a supersonically cooled H2 sample with a KE of 3 meV. The calculation predicts £ijj«>4.25 eV and A£|j|,=0.232 eV for the dc ion extraction ar- rangement and £],b= 1.75 eV and a A.E|ab= 0.245 eV for the PFI ion extrac- tion scheme.
«^1.75eV and AEi^= 0.493 6V. The lower Ei^ observed for the PFI ion extraction mode results from the shorter ac- celeration time for the reactant ions. These predicted AEi.^^ values are consistent with the measured A^iai, values using the retarding potential method. Assuming that the 112"*^ ions are formed by photoionization of a supersonically cooled H2 sample at 20-30 K or a KE of 3 meV, we have calculated the E]ify distributions for H2* using the PFI ion extraction scheme and the dc ion extraction arrangement [see Fig. 17(b)]. As shown in Figs. 17(a) and 17(b), the AE^^ values (0.232 eV) for H2'*' formed by dc ion extraction of effusive and supersonic beam samples are predicted to be essentially identical. However, the A£iab= 0.245 eV for H2"'" formed by PFI of a supersonically cooled H2 sample is found to be a factor of 2 less than the value of A.E,ab= 0.493 eV for H2'^ produced by PFI of an effusive H2 sample.
ACKNOWLEDGMENTS
This work has been supported by AFOSR through Task No. 2303EP02 and Grant No. F49620-99-1-0234 (Program Manager: Michael R. Herman). One of the authors (C.Y.N.) also acknowledges support by NSF Grant No. ATM-0001646 and partial support by the U.S. Department of Energy, Office of Basic Energy Sciences, Division of Chemical Sciences, Geosciences, and Biosciences. One of the authors (J.S.M.) was the beneficiary of a NRC postdoctoral fellowship.
H2 supersonic beam of 20-30 K is used to introduce the H2 sample into the PI/PEX center, the wired ion gate width can be reduced to 95 ns, which should result in a reduction factor of 0.95X10""' for background false coincidences as com- pared to that (2.1X10"') expected in using the effusive beam. For an Ar"*" kinetic energy of 3 meV (or translational temperature of 20-30 K), the Ar"*" TOF distribution has a full width of '=550 ns and is peaked at 5.6 //s [see Fig. 16(b)]. That is, an ion gate width of «=550 ns can be used to transmit all Ar""" PFI ions formed from a supersonically cooled Ar sample at 20-30 K. To transmit all Ar+ PFI-PIs in the present experiment would require a gate width of 1100 ns [see Fig. 16(a)]. We note tliat the achievement of a nanow PFI-PEPICO TOF distribution for the reactant ions would also allow the use of the wired ion gate as a mass filter to reject background ions originating from the photoionization region with masses different from that of the reactant ion of interest.
The trajectory calculations also reveal that the pulse na- ture of tlie PFI ion extraction field has a strong effect on the achievable laboratory kinetic energy resolution A^i^b for the reactant ions. Figure 17(a) compares the Ei^^ distribution for H2"'" extracted using the PFI pulsed ion extraction scheme as described above with that using dc voltages of +4.0 V at the electron repeller plate El and —4.0 V at the ion repeller plate II. In this calculation, we assume that the 112""" ions are formed by photoionization of an effusive H2 sample with a KE of 26 meV. For tlie dc ion extraction arrangement, the calculation gives £|ab^4.25 eV and A£iab= 0.232 eV as ob- served at the grid of the ion repeller plate II (see Fig. 2), whereas for the PFI ion extraction mode, we obtain Ei^^,
W. A. Chupka, in Ion-Molecule Reactions, edited by J. L. Franklin (Ple- num, New York, 1972), p. 33.
^C. Y. Ng, in Techniques for the Study of Gas-Phase Ion-Molecule Reac- tions, edited by J. M. Farrar and W. H. Saunder, Jr. (Wiley, New York, 1988), p. 417
'C. Y Ng, Adv. Chem. Phys. 82, 401 (1992). *C. Y. Ng, J. Phys. Chem. A 106, 5952 (2002). 'I. Koyano and K. Tanaka, Adv. Chem. Phys. 82, 263 (1992). "O. Dutuit, C. Alcaraz, D. Gerlich, P. M. Guyon, J. Hepburn, C. Metayer- Zcitoun, J. B. Ozenne, M. Schweizer, and T. Weng, Chem. Phys. 209, 177 (1996).
'S. L. Anderson, Adv. Chem. Phys. 82, 213 (1992). *T. Bacr and P. M. Guyon, in High Resolution Laser Photoionization and Photoelectron Studies, edited by I. Powis, T. Baer, and C. Y. Ng, Wiley Series in Ion Chemistry and Physics (Wiley, Chichester, 1995), p. 1.
'R. I. Hall, A. McConkey, K. Ellis, G. Dawber, L. Avaldi, M. A. Mac- Donald, and G. C. King, Meas. Sci. Technol. 3, 316 (1992).
'"Y. Morioka, Adv. Ser. Phys. Chem. lOA, 347 (2000). "K. Miiller-Dethlefs, M. Sander, and E. W. Schlag, Chem. Phys. Lett. 112,
291 (1984). '^E. W. Schlag, ZEKE Spectroscopy (Cambridge University Press, Cam-
bridge, U.K., 1996). "P M. Johnson, Adv Ser. Phys. Chem. IDA, 296 (2000). "C. Y. Ng, Annu. Rev. Phys. Chem. 53, 101 (2002). '^C. Y. Ng, Adv. Ser. Phys. Chem. 10, 394 (2000). "C. Y. Ng, Int. J. Mass. Spectrom. 200, 357 (2000). "G. K. Jarvis, K.-M. Weitzcl, M. Malow, T. Baer, Y. Song, and C. Y Ng,
Rev. Sci. Instrum. 70, 3892 (1999). "P. Heimann, M. Koike, C.-W. Hsu, D. Blank, X. M. Yang, A. Suits, Y T
Lee, M. Evans, C. Y. Ng, C. Flaim, and H. A. Padmore, Rev. Sci. Instrum. 68, 1945 (1997).
"N. E. Bradbury and R. A. Nielsen, Phys. Rev. 49, 388 (1936). ^"P R. Vlasak, D. J. Beussman, M. R. Davenport, and C. G. Enke, Rev. Sci.
Instrum. 67, 68 (1996). -'K. Norwood and C. Y. Ng, Chem. Phys. Lett. 156, 145 (1989). ■'"C. Y. Ng, in Vacuum Ultraviolet Photoionization and Photodissociation of
Molecules and Clusters, edited by C. Y. Ng (World Scientific, Singapore, 1.991), p. 169.
Downloaded 02 Sep 2003 to 146.153.144.33. Redistribution subject to AlP license or copyright, see http://ojps.aip.org/rsio/rsicr.jsp

Rev. Sci. Instrum., Vol. 74, No. 9, September 2003 Ion-molecule reaction studies 4109
"X. M. Qian, T. Zhang, Y. Chiu, D. J. Levandicr, J. S. Miller, R. A. ^'R. A. Dressier, Y.-H. C. Chiu, D. J. Lcvandicr, and C. Y. Ng, J. Chem. Dressier, and C. Y. Ng, J. Chem. Phys. 118, 2455 (2003). Phys. 113, 8561 (2000).
"D. Gerlich, Adv. Chem. Phys. 82. 1 (1992). "S. Stimson, Ph.D. thesis, Iowa State University (1998). 25v, „ T. , „ r-, ,. ,^\. ,./^„N '"S. Stimson,Y.-J. Chen.M. Evans, C.-L. Liao, C. YNg,C.-W. Hsu, andP. "N. R. Daly, Rev. Sc. Instrum. 31, 264 (1960). H^i^^„„_ Chem. Phys. Lett. 289. 507 (1998). ^'R. A. Dressier (unpublished). 3i D, A. Dahl. in Proceedings of the 43rd ASMS Conference on Mass Spcc- "K. M. Ervin and P. B. Armentrout, J. Chem. Phys. 83. 166 (1985). trometry and Allied Topics, Atlanta, GA, 21-26 May (1995), p. 717.
Downloaded 02 Sep 2003 to 146.153.144.33. Redistribution subject to AlP license or copyright, see http://ojps.aip.org/rsio/rsicr.isp