report - esig · dp deposition plate fid flame ionisation detector gc-fid gas chromatography...
TRANSCRIPT

page 1 of 37
Report
Experimental assessment of inhalation and dermal exposure to industrial spraying
products during industrial and professional spraying activities (PROC 7 and PROC 11)
Test Facility
Fraunhofer Institute for Toxicology and
Experimental Medicine ITEM
Nikolai-Fuchs-Str. 1
30625 Hannover
Germany
Executive Director
Univ.-Prof. Dr. med. Norbert Krug
Project Manager
Prof. Dr. Wolfgang Koch
Phone: +49 511 5350-117
Email: [email protected]
Sponsor
Cefic Petrochemicals Industry Sector
Avenue Van Nieuwenhuyse 4
B-1160 Brussels
Belgium
Sponsor’s representative
Gerson Martin (PhD)
Phone: + 32 2 792 75 14
Email: [email protected]
This report consists of 37 pages.
Date: June 2018

page 2 of 37
Members of staff at Fraunhofer ITEM participating in the project
Katharina Bluemlein (Analytical Chemistry)
Frank Günther (Aerosol Research)
Stefan Hahn (Risk Assessment)
Wolfgang Koch (Aerosol Research) – Project Manager
Heiko Kock (Analytical Chemistry)
page 3 of 37
Abbreviation
C. V. Coefficient of variation
DP Deposition plate
FID Flame Ionisation Detector
GC-FID Gas chromatography coupled to flame ionisation
detector
GSP Inhalable dust sampler (Gesamtstaubprobenahme an der
Person)
IPA Isopropyl alcohol
MW Molecular weight
MV Mean value
PROC Process category
PTEO Propyltriethoxysilane
STDEV Standard deviation
Vp Vapour pressure

page 4 of 37
Content
1 Introduction and Objective .............................................................................................. 5
2 Line of thought ............................................................................................................... 5
3 Experimental .................................................................................................................. 8
3.1 Equipment and Chemicals ....................................................................................... 8
3.2 Laboratory based simulations - Spray applications .................................................. 9
3.2.1 Test substances ............................................................................................... 9
3.2.2 Outcome of pilot study ...................................................................................... 9
3.2.3 Experimental simulations (baseline scenario) ..................................................11
3.3 Determination of aerosol and gas phase concentration ..........................................14
3.3.1 Aerosol ............................................................................................................14
3.3.2 Gas phase .......................................................................................................14
3.4 Determination of potential dermal exposure ...........................................................16
4 Results ..........................................................................................................................16
4.1 Literature evaluation ...............................................................................................16
4.2 Laboratory based simulations - Spray applications .................................................17
5 Discussion .....................................................................................................................25
6 Conclusion ....................................................................................................................26
7 Outook ..........................................................................................................................27
8 Appendix A – Concentration data (on-line monitoring) ...................................................33
9 Appendix B - Derivation of the airborne release rate from the measured average
concentration ........................................................................................................................37

page 5 of 37
1 Introduction and Objective
The ECETOC TRA tool is a tier 1 model applied to give dermal and inhalation exposure
estimates for professional and industrial processes as well as consumers and the environment.
For several process categories (PROCs) it has been demonstrated to provide conservative
estimates for work exposure [BAuA F23031, Kupczewska-Dobecka et al. 20112, Hofstetter et
al. 20133]. Industrial spraying (PROC 7) and professional spraying (PROC 11) are two process
categories where model and field data differ according to BAuA F2303. BAuA analysis of
measurement data for such tasks compared to exposure estimates provided by ECETOC TRA
for PROC 7 and PROC 11 activities suggests the model values may not be sufficiently
conservative for these process categories.
The special aspect of solvent release in spray processes in contrast to wiping, brushing and
rolling is the creation of a high liquid surface area due to the liquid dispersion into fine droplets.
In most cases, this spray related airborne evaporative surface area is much higher than the
treated surface area from which the solvent evaporates. This can result in a much higher
exposure concentration as estimated from Tier1 models based on simple fugacity
considerations. In addition to the gas phase of the volatiles in the spray cloud, exposure to
solvents in the aerosol phase may contribute to the overall inhalation exposure.
Based on physical properties as well as on the activity duration, inhalation exposure estimates
are calculated which neither consider the amount of the applied compound nor the surface
area. Formation of aerosols and the accompanying substantial increase of surface area from
which the compound can evaporate are an integral part of PROC 7 and PROC 11 activities.
ECETOC TRA does not consider the aerosol contribution in the estimation of inhalation
exposure of workers during spraying applications [TRA 114, 20124], suggesting this
shortcoming as a possible reason behind the mismatch between model and field data.
Currently the lack of field/experimental data does not allow an evaluation of the ECETOC TRA
performance in regards to dermal exposure during industrial and professional spraying.
ESIG proposed to generate data regarding inhalation (vapour and aerosol) and dermal
exposure during PROC 7 and PROC 11 activities. These experimental data are necessary to
shed more light on the performance of the ECETOC TRA tool when it comes to these two
process categories. The aim of this project was to generate inhalation and dermal exposure
data to assess aerosol and vapour phase contributions to inhalation and dermal exposure
during PROC 7 and PROC 11 spray activities.
2 Line of thought
Industrial and professional process categories, PROC 7 and 11, do not differ in their general
description of the process. The made distinction of two work environments suggests the extent
1 BAuA F2303: Evaluation of Tier 1 Exposure Assessment Models under REACH (eteam) Project - Final Overall Project Summary Report. Endbericht zur Evaluierung von Tier 1-Modellen (2015).
2 Kupczewska-Dobecka, M., Czerczak, S., Jakubowski, M. (2011) Evaluation ofthe TRA ECETOC model for inhalation workplace exposure to different organic solvents for selected process categories. Int J Occup Med Environ Health. 24(2):208-217.
3 Hofstetter, E., Spencer, J.W., Hiteshew, K. Coutu, M., Neally, M. (2013) Evaluation of recommended REACH exposure modeling tools and near-field, far-field model in assessing occupational exposure to toluene from spray paint. Ann Occup Hyg, 57(2):210-220.
4 TR114: ECETOC AISBL, (2012), ECETOC TRA version 3: Background and Rationale for the Improvements. Technical Report No. 114.

page 6 of 37
and effectiveness of applied control measures as a conceivable distinctive feature; insinuating
more sophisticated standards in industrial environments. The underlying mechanisms of the
spray processes determining exposure during application, however, are considered the same
for PROC 7 and 11 scenarios. In general, sprays can be applied either by a locally fixed device
(e.g. spraying booth) or by transportable spraying equipment (e.g. spray guns). Having the
technical feasibility in mind, the conduction of spray simulation with manual spray guns are
favoured in this study. The vapour pressure band of a sprayed product dictates the set default
value for the initial inhalation exposure estimate (no control measures in place) for PROC 7
and PROC 11 applications in ECETOC TRA. Unambiguous definition of the term “spraying
activity”5 is crucial/desirable for the correct and uniform use of an exposure estimation tool
such as ECETOC TRA. The following theoretical derivation for inhalation exposure during
spraying processes considers the spraying activity only and does not take into account any
peripheral activities related to the spraying process.
The main source for inhalation exposure of workers during spraying processes is the
overspray, fo, defined as the solvent fraction not being deposited on the surface. The overspray
consists of an aerosol/droplet phase and a gas phase. Their individual contribution to the near
field inhalation exposure is influenced by mainly two parameters: the droplet size distribution
(influenced by application pressure, nozzle parameter, flow rate etc.) and the vapour pressure
of the substance of interest (non-volatile, co-formulant, propellant) in the spraying product.
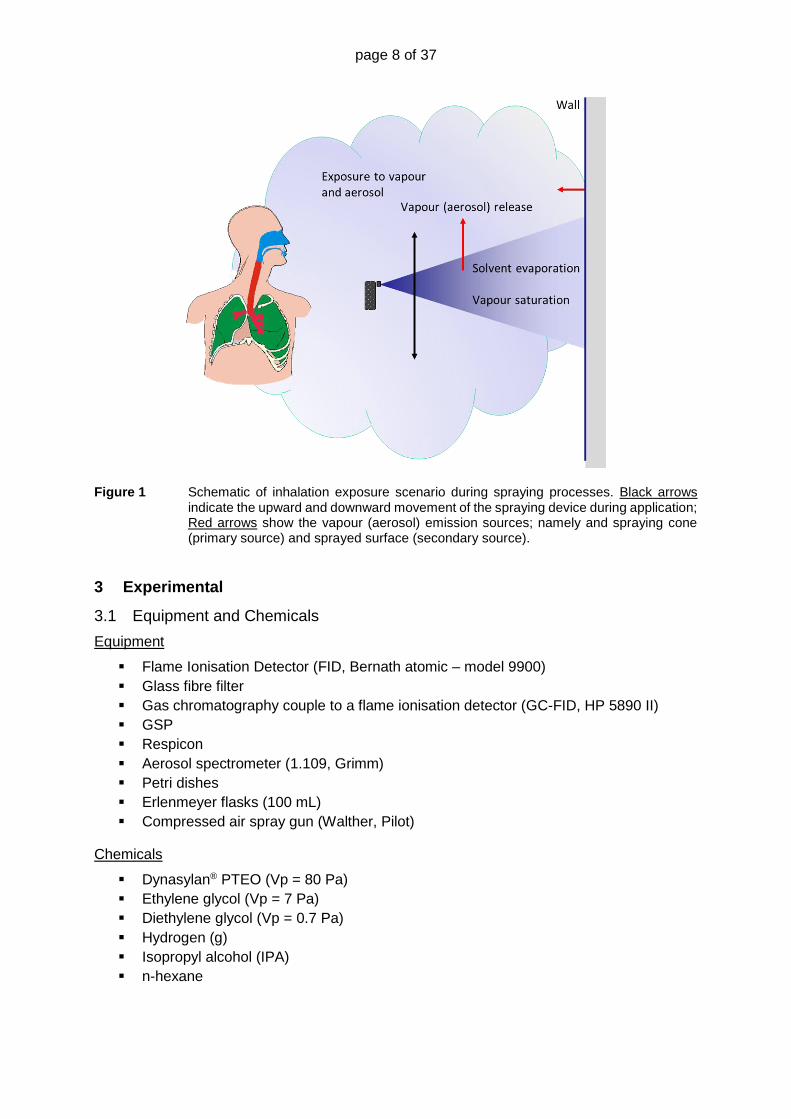
Figure 1 shows a schematic of an exposure scenario. The spray cone is moving up and down.
For sufficiently high vapour pressures of the solvent there will be vapour saturation; Cs inside
the spray cone at any time during spraying; the mass flux, Qv, of vapour released into the
atmosphere is given by the translational motion of the spray cone characterized by the volume
velocity dV/dt and Cs:
𝑄𝑣𝑎𝑝 =𝑑𝑉
𝑑𝑡∙ 𝐶𝑠 Eq. 1
This contribution to the vapour mass flux is independent of the material throughput through the
spray nozzle. A second contribution of vapour mass flux originates from the evaporating
droplets of the overspray i.e. the fraction of the liquid not deposited on the surface. These two
determine the near field vapour concentration of the sprayer. Far field contributions result from
the dispersion of the near field cloud as well as vapour emissions from treated surfaces.
Aerosol contribution to airborne solvent mass flux, Qaer, can only originate from the overspray
formation. The spray droplet size distribution of the overspray is a key quantity controlling the
inhalable aerosol fraction, i. The inhalable aerosol source term is characterized by
𝑄𝑎𝑒𝑟 = 𝑀 ∙̇ 𝑓𝑜 ∙ 𝜂𝑖 Eq. 2
where �̇� is the mass flux of spray liquid.
Previous studies at Fraunhofer ITEM with one-component spraying products (organolsilane,
fugacity band: low) showed a strong vapour pressure dependence of the aerosol-vapour
partitioning in the overspray. The lower the vapour pressure the higher the aerosol contribution.
5 Considering the activity of spraying only vs considering spraying and any peripheral work associated with it.
page 7 of 37
In this context, substances with vapour pressures above 100 Pa turned out to be “highly
volatile” because the aerosol fraction in the overspray was negligibly small compared to the
vapour concentration. The outcome of this study suggests the following hypothesis:
the vapour release weakly depends on the spray droplet size distribution and the
product mass flow,
the aerosol contribution to exposure strongly depends on the droplet distribution and
the product mass flow.
Based on this experience, the focus in this study was on liquids in a vapour pressure band Vp:
0.01 – 500 Pa to simulate the transition from aerosol to vapour dominated exposure.
Variation of the vapour pressure can be achieved by using one-component spraying products
(e.g. organosilanes, higher alcohols), with the additional advantage of having a simple
composition of the exposure atmosphere. Different one-component liquids with varying vapour
pressure are commercially available. The primary droplet size distribution of the spray relevant
for aerosol-dominated exposure can be controlled by the spray nozzle type and the operating
pressure of the spray nozzle.
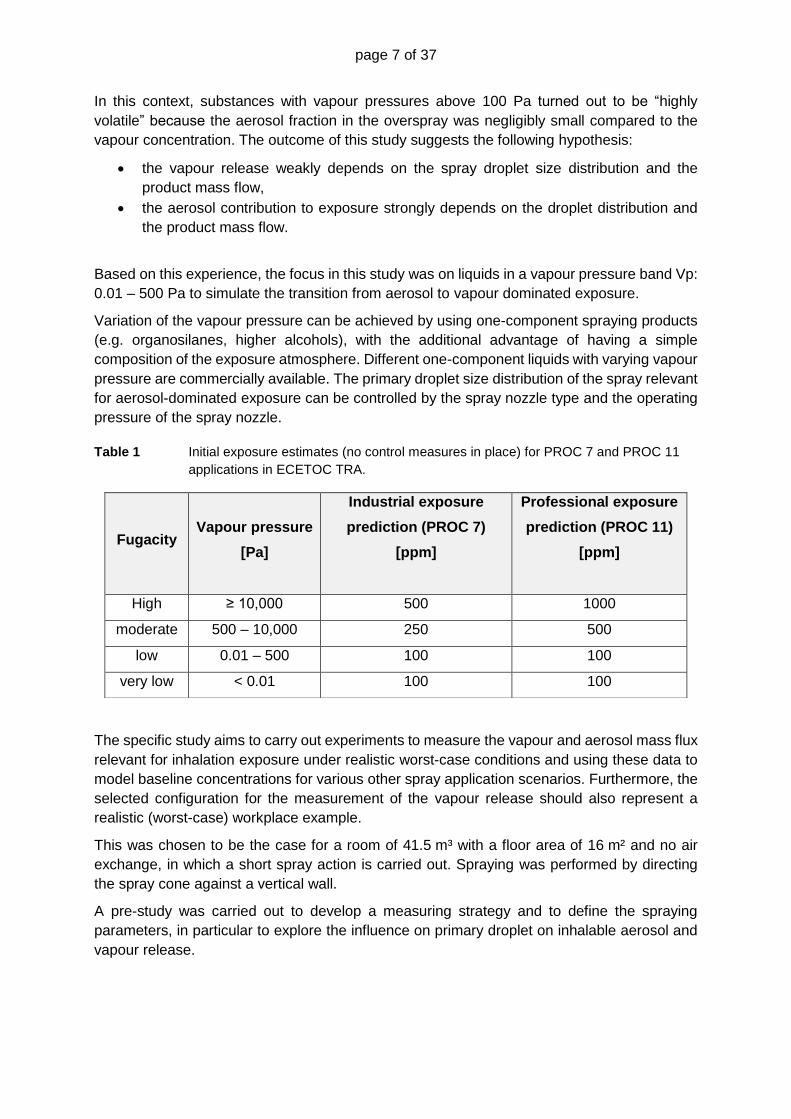
Table 1 Initial exposure estimates (no control measures in place) for PROC 7 and PROC 11
applications in ECETOC TRA.
The specific study aims to carry out experiments to measure the vapour and aerosol mass flux
relevant for inhalation exposure under realistic worst-case conditions and using these data to
model baseline concentrations for various other spray application scenarios. Furthermore, the
selected configuration for the measurement of the vapour release should also represent a
realistic (worst-case) workplace example.
This was chosen to be the case for a room of 41.5 m³ with a floor area of 16 m² and no air
exchange, in which a short spray action is carried out. Spraying was performed by directing
the spray cone against a vertical wall.
A pre-study was carried out to develop a measuring strategy and to define the spraying
parameters, in particular to explore the influence on primary droplet on inhalable aerosol and
vapour release.
Fugacity Vapour pressure
[Pa]
Industrial exposure
prediction (PROC 7)
[ppm]
Professional exposure
prediction (PROC 11)
[ppm]
High ≥ 10,000 500 1000
moderate 500 – 10,000 250 500
low 0.01 – 500 100 100
very low < 0.01 100 100
page 8 of 37
Figure 1 Schematic of inhalation exposure scenario during spraying processes. Black arrows indicate the upward and downward movement of the spraying device during application; Red arrows show the vapour (aerosol) emission sources; namely and spraying cone (primary source) and sprayed surface (secondary source).
3 Experimental
3.1 Equipment and Chemicals
Equipment
Flame Ionisation Detector (FID, Bernath atomic – model 9900)
Glass fibre filter
Gas chromatography couple to a flame ionisation detector (GC-FID, HP 5890 II)
GSP
Respicon
Aerosol spectrometer (1.109, Grimm)
Petri dishes
Erlenmeyer flasks (100 mL)
Compressed air spray gun (Walther, Pilot)
Chemicals
Dynasylan® PTEO (Vp = 80 Pa)
Ethylene glycol (Vp = 7 Pa)
Diethylene glycol (Vp = 0.7 Pa)
Hydrogen (g)
Isopropyl alcohol (IPA)
n-hexane

page 9 of 37
3.2 Laboratory based simulations - Spray applications
3.2.1 Test substances
Based on previous studies, the switch from aerosol dominated to gas (vapour) phase
dominated inhalation exposure was expected for the ECETOC TRA fugacity “low” band.
Diethylene glycol, ethylene glycol and Propyltriethoxysilane (PTEO) were chosen as model
substances. All three liquids are categorised as substances with a low vapour pressure,
according to the ECETOC TRA tool. Table 2 details the substance specific information of the
test substances.
Table 2 Test substances – Substance specific information
Substance MW
[g/mol]
Vp
[Pa]
Sat. Conc. (gas)
[mg/m³]
Sat. Conc. (gas)
[ppm]
PTEO 206 80 6700 800
Ethylene glycol 62 7 177 70
Diethylene glycol 106 0.7 30 7
3.2.2 Outcome of pilot study
As part of a pilot study exemplary simulations investigating the impact of droplet size on the
aerosol and gas phase exposure during spraying activities were run using PTEO as model
compound. Primary droplet size distribution was adjusted by using different spraying nozzle
and/or varying application pressure. In total three different mean (x̄50) droplet size were
considered in the experiments:
x̄50 = > 300 µm (GLORIA 142 TC, fan nozzle, application pressure: 3 bar)
x̄50 = approx. 375 µm (compressed air spray gun Walther-Pilot, application pressure:
0.8 bar)
x̄50 = approx. 45 µm (compressed air spray gun Walther, application pressure: 2 bar)
These values were determined in separate measurements prior to the spray tests using laser
diffraction spectrometry.
Aerosol data was collected using a Respicon® device. The data showed a strong correlation
between the primary spray droplet size and the aerosol counts. The smaller the droplet size
the higher the aerosol concentration during spraying (Figure 2). The aerosol concentration
increased by a factor of 15 when the primary droplet size was reduced from 400 µm to 45 µm.
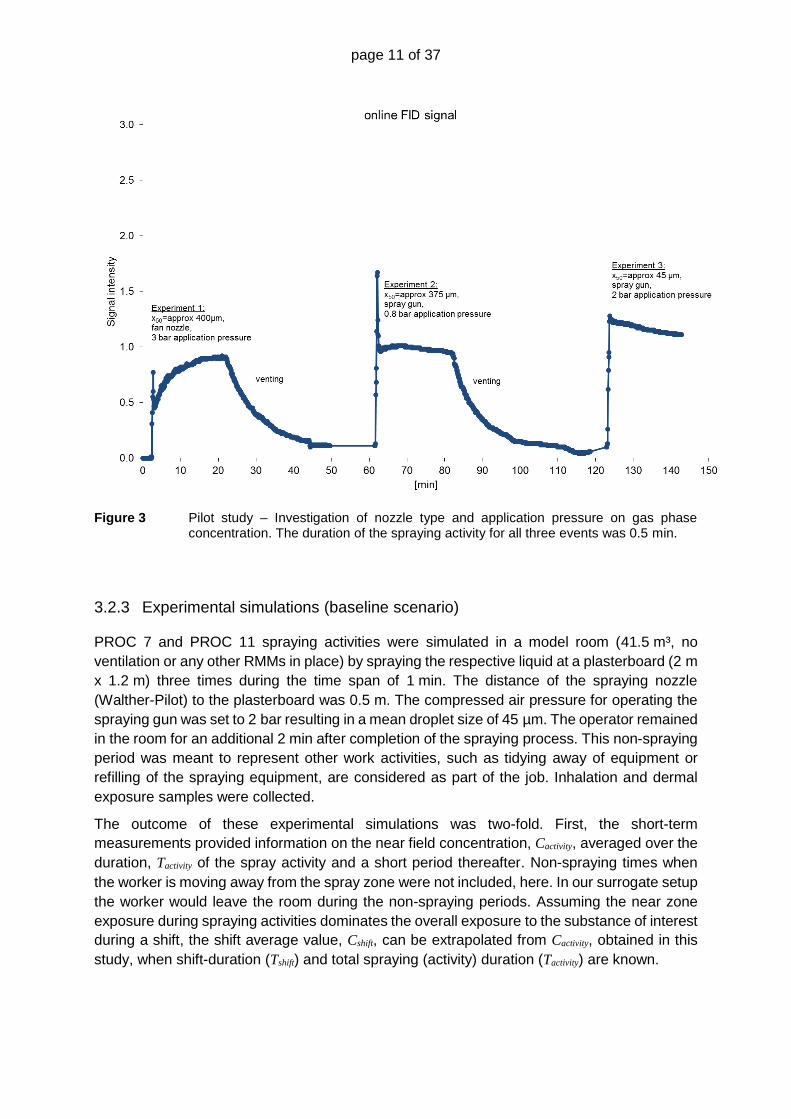
A much less pronounced effect was observed for the gas phase (Figure 3). The gas phase
concentrations increased only by 30 % when spraying with the 45 µm droplets compared to
the outcome when using the 400 µm spray droplets.
Note: During the pilot study, uniform distribution of the aerosol and gas phase was achieved
by a fan.

page 10 of 37
ECETOC TRA aims at providing conservative exposure estimates. Hence, all laboratory-based
simulations were run using the compressed air spray gun at an application pressure of 2 bar,
resulting in a mean primary droplet size of the spray of approx. 45 µm. This would represent a
realistic worst case scenario, when there is a significant aerosol contribution to exposure,
whereas this choice is irrelevant for high vapour pressure substances where inhalation
exposure is dominated by the vapour phase of the solvent.
Figure 2 Pilot study – Investigation of nozzle type and application pressure on aerosol
concentration. The duration of the spraying activity for all three events was 0.5 min.
page 11 of 37
Figure 3 Pilot study – Investigation of nozzle type and application pressure on gas phase concentration. The duration of the spraying activity for all three events was 0.5 min.
3.2.3 Experimental simulations (baseline scenario)
PROC 7 and PROC 11 spraying activities were simulated in a model room (41.5 m³, no
ventilation or any other RMMs in place) by spraying the respective liquid at a plasterboard (2 m
x 1.2 m) three times during the time span of 1 min. The distance of the spraying nozzle
(Walther-Pilot) to the plasterboard was 0.5 m. The compressed air pressure for operating the
spraying gun was set to 2 bar resulting in a mean droplet size of 45 µm. The operator remained
in the room for an additional 2 min after completion of the spraying process. This non-spraying
period was meant to represent other work activities, such as tidying away of equipment or
refilling of the spraying equipment, are considered as part of the job. Inhalation and dermal
exposure samples were collected.
The outcome of these experimental simulations was two-fold. First, the short-term
measurements provided information on the near field concentration, Cactivity, averaged over the
duration, Tactivity of the spray activity and a short period thereafter. Non-spraying times when
the worker is moving away from the spray zone were not included, here. In our surrogate setup
the worker would leave the room during the non-spraying periods. Assuming the near zone
exposure during spraying activities dominates the overall exposure to the substance of interest
during a shift, the shift average value, Cshift, can be extrapolated from Cactivity, obtained in this
study, when shift-duration (Tshift) and total spraying (activity) duration (Tactivity) are known.
page 12 of 37
𝐶𝑠ℎ𝑖𝑓𝑡 = 𝐶𝑎𝑐𝑡𝑖𝑣𝑖𝑡𝑦𝑇𝑎𝑐𝑡𝑖𝑣𝑖𝑡𝑦
𝑇𝑠ℎ𝑖𝑓𝑡 Eq. 36;7
Secondly, vapour and aerosol release rates, two quantities characteristic for spraying,
processes were determined for substances with different vapour pressures. These data were
used as input parameters to model baseline concentrations for scenarios different from the
one selected here.
The sampling equipment used for the assessment of inhalation exposure consisted of aerosol
samplers/monitors (3 GSP samplers, 2 Respicon®, aerosol spectrometer) and gas phase
samplers/monitors (1 set of wash bottles holding an appropriate solvent, FID). One GSP
sampler was connected to the inlet of the wash bottles, preventing particles from entering and
allowing for offline quantification of the sprayed liquid in the gas phase. The FID inlet was also
equipped with a filter, thereby allowing online monitoring of the evaporated liquid. All samplers
were stationary and positioned close to the operator (Figure 4 and Figure 5).
Horizontal and vertical deposition plates assessed potential dermal exposure. Two glass petri
dishes were used as horizontal deposition plates with surface areas of a. 87 cm² and b.
165 cm² respectively. These plates were positioned in immediate proximity of the operator at
a height of 0.65 m and distance of 0.75 m from the plasterboard. Six circular filter papers were
used as vertical deposition plates (=patches; 95 cm² each) attached to the operator (Figure 4
and Figure 7).
All samplers were switched off after 3 min (1 min spraying activity + 2 min additional residence)
and the deposition plates as well as the personal dermal samplers (patches) were removed
from the room/operator. The filters of the GSP samplers were removed, transferred into
Erlenmeyer flasks and covered with the respective extraction solvent (5 mL) after each run.
The Respicon® samplers were used to accumulate the particles released over all three runs of
each simulation scenario. The collection of the gas phase in wash bottles was also
accumulated over three runs.
The patches (personal dermal sampler) were removed, transferred in Erlenmeyer flasks and
covered with extraction solvent (50 mL). The deposition plate (petri dish) was rinsed twice with
extraction solvent (IPA: ethylene glycol and diethylene glycol; n-hexane: PTEO) and the
extracts were combined to one sample.
6 Please note, that several spraying activities can be conducted by one person over the duration of a work-shift. 7 Please note, that the term activity can comprise either: 1. Spraying process only or 2. Spraying process and peripheral work associated with it.

page 13 of 37
Figure 4 Simulation of baseline workplace scenario. A and B: General set-up before spray application; C: General set-up 3 min after spray application of ethylene glycol where a visible aerosol mist is generated. WB – wash bottle, R – Respicon®, DP – horizontal deposition plate, AS – Aerosol spectrometer.
Figure 5 Positioning of the sample equipment in the room. WB –Wash bottle; R – Respicon, GSP
– Inhalable dust sampler; DP – horizontal deposition plates; AS – Aerosol spectrometer

page 14 of 37
Table 3 Three consecutive spray test were carried out with each substances. The total amount of spray liquid applied during one minute of spraying are listed as well as the release rate (for the spray liquid) calculated from this value
# Applied amount of
spray liquid [g]
Spray liquid release rate [g/sec]
Diethylene glycol (Vp 0.7Pa)
E1 267 4.5
E2 257 4.3
E3 260 4.3
MV 261 4.4
Ethylene glycol (Vp 7Pa)
E1 270 4.5
E2 256 4.3
E3 283 4.7
MV 270 4.5
PTEO (Vp 80 Pa)
E1 253 4.2
E2 246 4.1
E3 253 4.2
MV 251 4.2
3.3 Determination of aerosol and gas phase concentration
3.3.1 Aerosol
The aerosols released during the spraying activities were monitored using
a. An aerosol spectrometer (1.109; Grimm) providing time-resolved records of air-borne
particles (0.3 to 30 µm)
b. Two Respicon samplers with one containing an optical unit allowing time-resolved
monitoring of the particles classes (< 40 µm; < 10 µm; < 5 µm)
c. GSP samplers – for off-line quantification of inhalable particles (< 100 µm).
The filters of the Respicon and GSP samplers were subsequently extracted with a suitable
solvent (IPA: ethylene glycol and diethylene glycol; n-hexane: PTEO) and subjected to GC-
FID analysis (chapter 3.3.2, Table 4).
3.3.2 Gas phase
A Flame Ionisation Detector (FID) monitored the gas phase concentration of the respective
one-component spraying products. For diethylene glycol and ethylene glycol, calibration of the
FID signal was achieved by measuring the gas phase above the spraying product in a closed
container, where the equilibrium concentration between liquid and gas phase exists. Based on
the vapour pressure the saturated gas phase concentration can be calculated. The two values,
experimental FID reading and calculated value, permit the calibration of the FID for the
respective spraying product. An example is given in Figure 6, where the FID reading of the gas
phase concentration for ethylene glycol above ethylene glycol (l) in a closed container is
depicted. A conversion factor of 2.3 was determined between the experimental reading of

page 15 of 37
30 ppm and the calculated 70 ppm. The gas phase concentration in the test room during the
spraying of ethylene glycol was determined by multiplying the FID reading by factor 2.3.
The volatility of PTEO did result in analyte concentration in the sorbent of the wash bottles well
above the limit of quantification of the GC-FID method, allowing the calibration of the on-line
FID signal using those data.
Figure 6 Determination of FID conversion factor – Example: ethylene glycol
In addition, the spraying product in the gas phase was also collected in wash bottles containing
an appropriate solvent (IPA: ethylene glycol and diethylene glycol; n-hexane: PTEO).
Subsequently, the concentration of the spraying product in the sorbent was determined by GC-
FID analysis (Table 4).
Table 4 GC-FID Parameters and settings
Column DB5-MS; 30 m x 0.32 mm; 0.25 µm
Injection volume 1 µL
Injection mode Splitless
Temperature program Initial temperature: 60 °C for 2 min;
20 °C/min to 120 °C (1 min)
70 °C/min to 230 °C (2 min)
page 16 of 37
3.4 Determination of potential dermal exposure
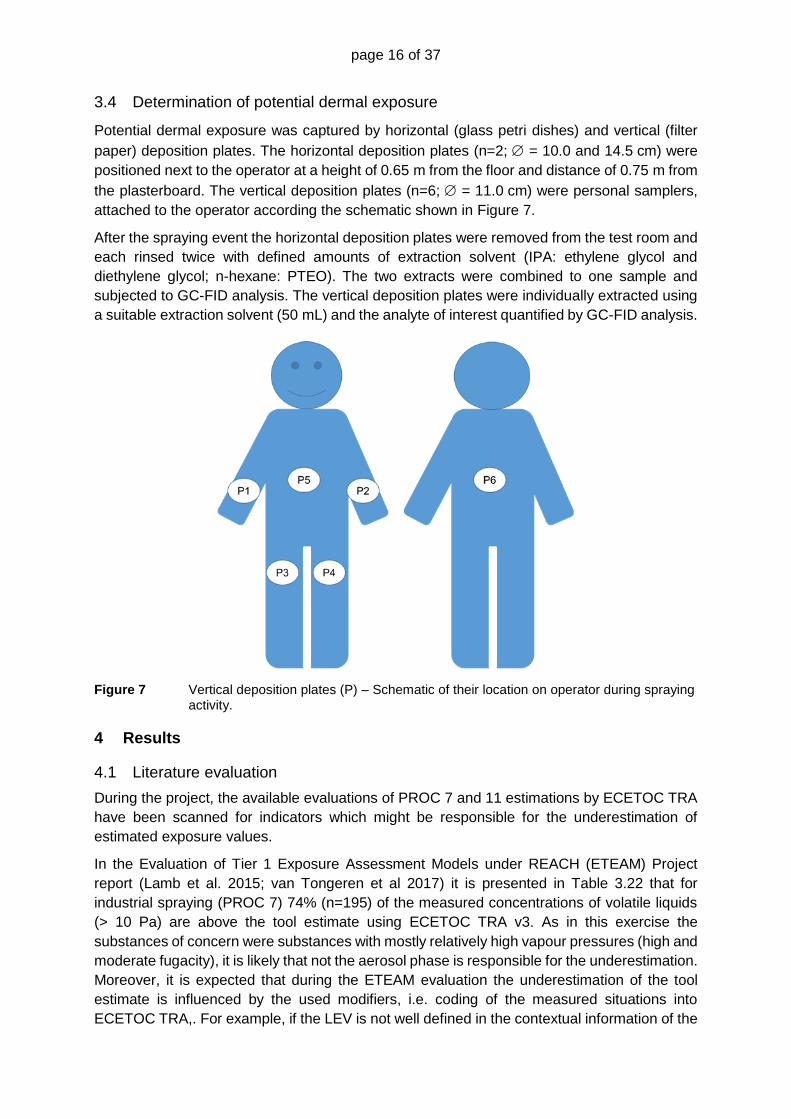
Potential dermal exposure was captured by horizontal (glass petri dishes) and vertical (filter
paper) deposition plates. The horizontal deposition plates (n=2; = 10.0 and 14.5 cm) were
positioned next to the operator at a height of 0.65 m from the floor and distance of 0.75 m from
the plasterboard. The vertical deposition plates (n=6; = 11.0 cm) were personal samplers,
attached to the operator according the schematic shown in Figure 7.
After the spraying event the horizontal deposition plates were removed from the test room and
each rinsed twice with defined amounts of extraction solvent (IPA: ethylene glycol and
diethylene glycol; n-hexane: PTEO). The two extracts were combined to one sample and
subjected to GC-FID analysis. The vertical deposition plates were individually extracted using
a suitable extraction solvent (50 mL) and the analyte of interest quantified by GC-FID analysis.
Figure 7 Vertical deposition plates (P) – Schematic of their location on operator during spraying activity.
4 Results
4.1 Literature evaluation
During the project, the available evaluations of PROC 7 and 11 estimations by ECETOC TRA
have been scanned for indicators which might be responsible for the underestimation of
estimated exposure values.
In the Evaluation of Tier 1 Exposure Assessment Models under REACH (ETEAM) Project
report (Lamb et al. 2015; van Tongeren et al 2017) it is presented in Table 3.22 that for
industrial spraying (PROC 7) 74% (n=195) of the measured concentrations of volatile liquids
(> 10 Pa) are above the tool estimate using ECETOC TRA v3. As in this exercise the
substances of concern were substances with mostly relatively high vapour pressures (high and
moderate fugacity), it is likely that not the aerosol phase is responsible for the underestimation.
Moreover, it is expected that during the ETEAM evaluation the underestimation of the tool
estimate is influenced by the used modifiers, i.e. coding of the measured situations into
ECETOC TRA,. For example, if the LEV is not well defined in the contextual information of the
page 17 of 37
measured situation the highest possible modifier (“Indoors with LEV and enhanced general
ventilation”) has been used resulting in the lowest estimate, which is the worst-case for this
exercise. Therefore, the ascertained underestimation is not solely based on the initial exposure
estimate (baseline). For PROC 11 the dataset was very limited (n=23) and 0% of the estimate
are below measured concentrations. Therefore, the results are of limited use and not presented
in the peer-reviewed publication (van Tongeren et al 2017). The coding was revised during
re-evaluation by ECETOC and presented at Poster at ISES 2016 (Bachler et al. 2016), which
results still in some situations where an underestimation of the workplace situation exist.
4.2 Laboratory based simulations - Spray applications
The results of the concentration measurements are summarized in Table 5. The average
concentration, �̅�, is calculated based on 3 minutes residence time in the room, of which 1 min
was dedicated to the spraying process and the remaining 2 min were spent as additional
residence time in the room. The temporal concentration pattern is determined by a linear
increase during the spraying time and an almost constant pattern during the extra residence
time as shown in Figure 13 for diethylene glycol (mainly aerosol) and Figure 15 for the example
of PTEO (mainly vapour phase). Based on this pattern, the total airborne mass (vapour +
aerosol), Ma, released as well as the release rate, Ra, can be calculated from the average
concentration. For 1-minute spray time (T1) and 2 minutes additional residence time (T2), the
following relations are obtained (see Appendix):
V
TTT
TTcRa
211
21
5.0 Eq. 4
and
1TRM aa Eq. 5
where, V, is the room volume.
The three different compounds showed a vapour pressure dependent partitioning between
aerosol and vapour phase during spraying. For the substance with a vapour pressure of 0.7
Pa the exposure was dominated by the aerosol phase, whereas aerosol exposure for the
substance with a vapour pressure of 80 Pa (and above) was negligible and exposure to the
vapour phase only.
The release rate is the quantity characterizing the spray process; it represents the source
strength for human exposure and can be used for generalization of the exposure scenario. The
release rates measured with the Walther-Pilot spray gun at 2 bar (producing a very fine droplet
spray, MMD=45 µm) varied from approx. 0.27 g/s (Diethylene glycol) to 1.25 g/s (PTEO). When
the exposure is aerosol dominated the fraction of liquid becoming available to exposure is
about 6% and for the (volatile) PTEO, releasing only vapour, it is 28%.
In the following paragraph the data obtained with the spray gun are compared with data from
previous investigations at ITEM using a flat fan spray nozzle (MMD>300 µm). The use of a flat
fan spray nozzle resulted in airborne release rates of 0.8 g/s and release fractions of 9% for
PTEO (Vp=80Pa). These slightly lower values are due to the coarser droplet spectrum of the
flat fan nozzle accompanied with a smaller surface area and, thus, a lower evaporation rate of
the substance. For low vapour pressure substances where exposure is aerosol dominated,
such as OCTEO (Vp < 1 Pa), the effect of droplet spectrum on release rate is much stronger.

page 18 of 37
For the flat fan nozzle the release rate was 0.003 g/s i.e. a factor of 100 lower than for the
spray gun with MMD=45 µm.
For the aerosol-dominated scenarios, the airborne release rate is proportional to the liquid
mass flow of the spray device and its droplet size distribution. For liquids with vapour pressures
above 80 Pa, the influence of the droplet spectrum and liquid mass flow on vapour release is
weak. Vapour release is dominated by the saturation vapour pressure of the spray liquid. The
volume of the spray cone is saturated with the vapour and the airborne release rate of vapour
is proportional to the volume the spray cone is scanning per time (here: (0.5m x 1.2m x 2m) x
3 = 3.6 m³)8. This view is in accordance with the fact that the measured vapour phase
concentrations in the 41.5 m³ control room is approximately 25% of the saturation
concentration for both substances, irrespective of their vapour pressures which are 5 and 80
Pa, respectively. The measured release rate for PTEO is RPTEO=1.25 g/s. Since for substances
of high volatility the release rate is entirely driven by their vapour pressure, the following
general extrapolation can be applied to calculate the release rate (in g/s) as function of the gas
phase saturation concentration, Cs, of the substance under consideration:
𝑹 = 𝟏. 𝟐𝟓 ∙𝑪𝒔
𝑪𝒔,𝑷𝑻𝑬𝑶 Eq. 6
Dermal exposure was also measured by exposing patches to the airborne material. The values
represent the material accumulated over a time of 3 minutes. During exposure time, T, and at
a given airborne concentration (Cg) of the compound of interest, the mass, Md, per surface area
taken up by the skin is given by:
𝑴𝒅 = 𝒌 ∙ 𝑪𝒈 ∙ 𝑻 Eq. 7
Here k (m/s) is the mass transfer coefficient, from the gas phase in the room onto the skin
surface. For vapours, it is determined by the transfer from air to skin by diffusion characterized
by the mass transfer coefficient k=dV and aerosols by the droplet settling velocity, k=vd.
For aerosols, dermal exposure is by droplet deposition onto the skin. In a conservative
approach (exposure of horizontal surfaces such as hands), the mass transfer coefficient is
simply the droplet settling velocity9, vd, independent of the chemical nature of the liquid10. In
Table 5 the mass transfer coefficient is calculated from the measured mass density
accumulated during the 3 minutes averaging time and the average airborne concentration
using the above equation. Both measurements for the aerosol dominated scenario result in
similar values, 39.6 and 50.4 m/h. A value of k= 50 m/h corresponds to a settling velocity of 22
µm droplets. This is quite reasonable for the overspray generated when using the spray gun
producing a spray with median droplet spray of 45 µm; as the median droplet, size of the
overspray is expected to be smaller. Vertical patches are virtually not loaded by aerosols.
For the vapour dominated scenario the mass transfer coefficient is expected to take lower
values and is approximately the same for vertical and horizontal patches (within the
measurement error). The deposition plates included in the experimental set-up of this study
were sufficient to capture potential dermal exposure to aerosols, but not for dermal exposure
to vapours. An additional experiment with horizontal deposition plates (petri dishes)
8 Distance between spray nozzle and plasterboard: 0.5 m; plasterboard height: 2 m; plasterboard width: 1.2 m; plasterboard
was sprayed 3 times.
9 𝑣 =𝑑²∙𝜌∙𝑔
18∙ɳ 𝑣 – droplet settling velocity; d – particle diameter in [m]; g – gravity constant (9.807 m/s); 𝜌 – particle density
(1000 kg/m³); ɳ - viscosity of air in 0.0000181 Pa s) 10 It is assumed that the entire liquid material deposited on the skin will finally become systemically available.
page 19 of 37
n-hexane was conducted for the vapour dominated spraying scenario with PTEO. Potential
dermal exposure was determined as 28 (± 6) µg/cm² (n = 6) compared to 1.9 (± 1.1) µg/cm²
(n = 6), when empty petri dishes were used as horizontal deposition plates. In this case a
transfer coefficient of =3.7 m/h would be applicable. These experiments aimed to simulate
worst case, 100% transfer (k=) of the vapour to the skin surface. The mass transfer is
controlled by the diffusion process from the air to the surface (skin, here simulated by n-
hexane). In a study by Weschler and Nazaroff (2014), the value for the “[...] mass-transfer
coefficient for external transport of an organic compound from the gas phase in the core of a
room through the boundary layer adjacent to the skin.”11, was taken as 6 m/h (please see
supporting information in Weschler and Nazaroff; 2014). This is in good agreement with our
finding revealing 3.7 m/h. However, depending on the phys.-chem. properties of the
of interest only a certain proportion will permeate through the boundary skin corneum and
become systemically available. Systemic exposure estimates will have to be carried out for
each substance individually, considering their transdermal permeability coefficient, kp-g.
Julander et al.12 cite the work of Potts and Guy13 for the calculation of kp-g based on the two
compound specific parameters molecular weight and octanol:water partition coefficient. They
also point out that synergistic effects might enhance dermal uptake of individual substances
mixtures. As systemic exposure is not within the scope of this study dermal exposure
are limited to external exposure on the skin surface. For vapours these estimates are based
on the mass-transfer coefficient, dv, which is taken as 6 m/h and for aerosols on the droplet
settling velocity, vd, of 50 m/h (Table 9 and
Table 10).
The use of n-hexane as sampling medium to determine the dermal exposure to vapours as
well as the subsequent application of a mass-transfer coefficient of 6 m/h will result in an
overestimation of dermal exposure. Reducing factors such as the evaporation of the
from the skin surface were not taken into consideration. The phys. – chem. properties of the
substance (e.g. vapour pressure, lipophilicity, molecular weight, etc.), (co-)formulant and the
climatic conditions (e.g. temperature, humidity, etc.) of the work environment are two factors
impacting on the evaporation of the substance of interest from the skin. The trapping of a
substance in the fabric of either ordinary or protective clothes on the other hand, can lead to
enhancement of dermal exposure. In real life scenarios, dermal exposure to substances
applied by spraying activities will have multiple sources with varying contributions. In this
the data presented in Table 9 and
Table 10, should be viewed as a starting point for dermal exposure estimates; which will need
adaptation to derive at exposure estimates that can reasonably be expected for industrial and
professional spraying activities.
11 In this study denoted as dv. 12 Julander A., Boman A.,Johanson G, Lidén C. (2018): The Nordic Expert Group for Criteria Documentation of Health Risks and Chemicals 151. Occupational skin exposure to chemicals. Arbete och Hälsa; 52:1-69. 13 Potts R.O., Guy R. H. (1992): Predicting skin permeability. Pharm. Res., 9:663-669.

page 20 of 37
Table 5 Results of concentration measurements in a test room of 41.5 m³ volume. Averaging
time 3 minutes.
0.7 Pa 7 Pa 80 Pa
Experimental Experimental Experimental
MV MV MV
Gas phase [mg/m³] BLQ 45 1500
Percent of saturation concentration [%] NA 25 22
Respicon inhalative [mg/m³] 295 385 NA
GSP (aerosol) [mg/m³] 338 313 NA (4.5)
Total average concentration [mg/m³] 317 349 1500
Total mass released, Ma [g] 15.8 17.4 74.7
Release rate, R [g/s] 0.27 0.29 1.25
Release fraction [-] 0.06 0.06 0.28
Dermal horizontal [µg/cm²] 65 88 1.9
Mass transfer coefficient [m/h] 39.6 50.4 0.25
Dermal vertical [µg/cm²] # 4 (n=18) 0.7 (n=6)
Mass transfer coefficient [m/h] - 2.27 0.09
BLQ – Below limit of quantitation; # - see Table 6
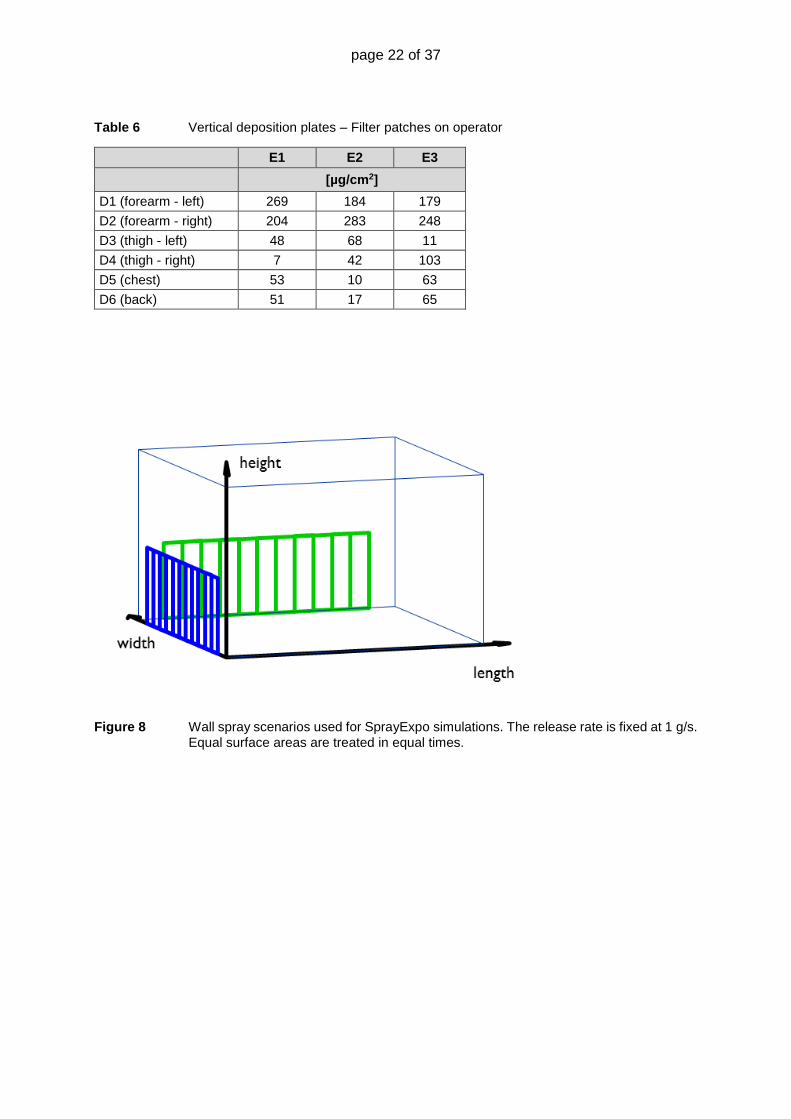
Table 6 Vertical deposition plates – Filter patches on operator
The release rates measured in our small control room can be used to model exposure to
aerosol/vapour for other scenarios; using the software tool SprayExpo. The task of wall
spraying is modelled exemplarily for various room sizes and release times using SprayExpo
and a release rate of 1 g/s. The spraying scenario is shown in Figure 8. Two different process
sequences were investigated: continuous spraying, and spraying with interruption without
spray activities. The room sizes are varied by a factor of 44. The application time is adjusted
to the treated wall area such that there is always the same surface coverage with spray liquid.
Figure 9, shows the time-averaged concentration of the first process. Except from the very last
one, all simulations are carried out for zero air exchange. The graphs show the exposure
concentration averaged over the time starting with zero up to the x-axes value. Since the
average concentration over time starts with a value of zero it quickly rises and finally, for large
volumes, approaches a constant value of approximately 1200 mg/m³, nearly independent of
the room size. The sprayer is in his personal vapour cloud generated locally, which moves with
the sprayer as the work progresses. In this sense, the modelled exposure concentrations result
in values independent of the averaging time when the spraying is carried out.
The simulation results shown in Figure 10 represent the same spraying scenarios as in Figure
9 with the modification that the worker resides for another 10 minutes in a place distant from
the wall that has been treated. This is to simulate preparation, refilling or maintenance work.
Exposure at this location is primarily related to the far field contribution resulting from the spray
cloud after turbulent dispersion inside the room. In the examples, the two spraying times of 2
and 4 minutes cover 17%, respectively, 29% of the total simulation time (12 and 14 minutes).
The mean concentration averaged over the entire simulation time decreases compared with
the results of Figure 9 for continuous spraying without interruption. This decrease is most
prominent for large rooms with large mixing volumes. According to Figure 10 a mean
concentration of 500-600 mg/m³ would be a sufficiently conservative estimate that is applicable
to rooms with a floor area larger than 100 m².
For the small 25 m²-room (floor area), where the concentration homogeneity is reached in
shorter times, the reduction in mean concentration due to the non-spray period is smaller.
page 21 of 37
However, for a small room it is quite unlikely that the sprayer stays in the room during filling
and preparation of the spraying system. If the concentration outside the room is assumed to
be zero, the concentration averaged over the entire simulation time (2 or 4 minutes spraying +
10 minutes non-spraying) is just 17% and 29% of the mean concentration reached after 120 s
and 240 s, respectively. This results in approximately 300 and 600 mg/m³ for an airborne
release rate of 1 g/s. Assuming spraying and peripheral work are linked together suggests
approximately 600 mg/m³ to be a conservative mean concentration averaged over the process
time when the release rate of airborne material from the spray cone is 1 g/s as assumed in the
simulation exercise.
These results serve as starting point for calculating the exposure to vapours with release rates
determined from Eq. 6. For aerosol, dominated exposure a release rate of 0.3 g/s
is suggested to be used since it represents a realistic worst case resulting from values of the
spray droplet MMD and upper values of the liquid flow rate through the spray nozzle as
discussed above.
page 22 of 37
Table 6 Vertical deposition plates – Filter patches on operator
E1 E2 E3
[µg/cm2]
D1 (forearm - left) 269 184 179
D2 (forearm - right) 204 283 248
D3 (thigh - left) 48 68 11
D4 (thigh - right) 7 42 103
D5 (chest) 53 10 63
D6 (back) 51 17 65
Figure 8 Wall spray scenarios used for SprayExpo simulations. The release rate is fixed at 1 g/s.
Equal surface areas are treated in equal times.

page 23 of 37
20 x 20 m², 1 g/s, 120 s spraying; 1-9 m wall length and 240 s 1-17 m wall length
10 x 10 m², 1 g/s, 120 s spraying,1-9 m wall length; 240 s 2 x 1-9 m wall length
5 x 5 m², 1 g/s, 120 s spraying, 2 x 0.5 – 4.5 m wall length; 240 s 4 x 0.5-4.5 m wall length
3 x 3 m², 1 g/s, 120 s spraying, 4 x 0.5 – 2.5 m wall length; right: 20 fold air exchange per h
Figure 9 Average concentration values for wall spraying as calculated from the software tool SprayExpo. Moving average concentration over time means time averaging starts at t=0 and ends at the time point specified by the value on the abscissa. Simulation represents the spray cloud for a painter spraying on walls while moving as work progresses. For large rooms the average concentration quickly becomes stationary because the operator resides always in his personal cloud. The distance of the sprayer from the wall is 1.2 m. For small room sizes, there is accumulation of vapour mass due to the confined space leading to an increase in average concentration with time. In general the impact of the room size on the inhalation exposure is negligible.

page 24 of 37
20 x 20 m², 1 g/s, 120 s spraying; 1-9 m wall length and 240 s 1-17 m wall length
10 x 10 m², 1 g/s, 120 s spraying,1-9 m wall length; 240 s 2 x 1-9 m wall length
5 x 5 m², 1 g/s, 120 s spraying, 2 x 0.5 – 4.5 m wall length; 240 s 2 x 0.5-4.5 m wall length
As above with 20-fold air exchange per h.
Figure 10 Average concentration values for wall spraying as calculated from the software tool SprayExpo. Moving average concentration over time means time averaging starts at t=0 and ends at the time point specified by the value on the abscissa. Simulation represents the spray cloud for a painter spraying on walls while moving as work progresses. The distance of the sprayer from the wall is 1.2 m. After the spraying (t=120), the worker moves away from the wall. He resides another 10 minutes at his new position.

page 25 of 37
5 Discussion
The aim of this project was to generate inhalation and dermal exposure data to assess aerosol
and vapour phase contributions to inhalation and dermal exposure during (PROC 7- Industrial
spraying) and professional spraying (PROC 11- professional spraying) activities.
The airborne release rate of solvent (as aerosol and vapour) during any spray activity is the
key parameter influencing the exposure concentration. For high vapour pressure solvents, the
release of vapour into the air is determined by the saturation concentration of the solvent, and
the volume that the spray cone covers per time during application since it can be assumed that
the entire spray cone is always saturated with the vapour due to the high surface area provided
by the droplets independent of the droplet size distribution and the solvent flow rate through
the nozzle. By contrast, for very low vapour pressure liquids where the exposure is aerosol
dominated, the airborne release is controlled by the material mass flow and particularly by the
droplet size distribution. Spray gun technology (MMD>=45 µm, mass flow =300 ml/min) results
in highest release rates compared to other spray technologies such as flat and round spray
nozzles operated without compressed air and having much coarser droplet distributions. Use
of the spray gun is a realistic worst-case scenario. In this study upper limit, values of the release
rates of aerosols and vapours have been determined experimentally. For aerosols a value of
0.3 g/s was measured, i.e. 1.7% of the total mass flow of the liquid through the spray nozzle.
For the vapour phase, a release rate of 1.25 g/s was measured for PTEO (Vp: 80 Pa). The
hypothesized release mechanism (saturation in the spray cone) leads to the extrapolation
given by Eq.6 for substances with higher vapour pressures.
The experimentally determined release rates were used as inputs to the exposure model
SprayExpo. Two scenarios for activities were modeled:
The first one was a constant continuous spraying process where exposure is
dominated by the near field concentration close to the spray cloud.
The second scenario of a work process combines near field exposure during the
spraying action and far field exposure during peripheral work (without spraying) such
as refilling, maintenance etc. distant from the spraying location. Here two scenarios are
considered, where spraying contributes 17%, respectively, 29% to the total time of the
work process.
Simulations run with the exposure model SprayExpo predict exposure concentration of Csim
=1200 mg/m³ for an applied release rate of 1 g/s for the first scenario of continuous spraying
and approximately Csim=600 mg/m³ for the scenario taking into account non-spraying times
during the working process.
According to this prediction, a base line concentration of
𝐶𝑎𝑒 = 𝐶𝑠𝑖𝑚 ∙ 0.3 Eq. 8
is an appropriate upper limit exposure concentration for aerosol dominated scenarios (release
rates 0.3 g/s), as was verified by laboratory based simulations in this study. For substances
with higher vapour pressures (Vp > 80 Pa), where exposure is gas phase dominated (release
rate 1.25 g/s), the base line concentration for inhalation exposure can be estimated as follows:

page 26 of 37
𝐶𝑣𝑎𝑝 = 𝐶𝑠𝑖𝑚 ∙ 1.25 ∙𝐶𝑠
𝐶𝑠,𝑃𝑇𝐸𝑂 . Eq. 9
This methodology has been applied to substances of different vapour pressures as listed in
Table 7. The exposure concentrations as calculated from Eqs. 8 and 9 are listed in mg/m³ and,
for vapours, in ppm. The two scenarios - continuous spraying as worst case and intermittent
spraying as alternative worst case - are treated separately in Table 7 and Table 8. In Table 7
the activity is entirely spraying while, in Table 8, the activity covers both, spraying and
peripheral work. If shorter activity durations (sum of all spraying activities) are considered, the
estimates of this study have to be reduced according to Eq. 3 where we assume a shift duration
of 8 h. The comparison with ECETOC TRA has been made with ECETOC TRA predictions
listed for “Long-term Inhalation Exposure Estimate” based on “Duration of activity > 4h” and
“Short-term Inhalation Exposure Estimate”. In this context, it has to be noted that ECETOC
TRA estimates a shift exposure that will include a much more complex exposure profile than
what is reflected by the experiments. For a meaningful comparison of the data sets more
detailed information from “behind the scene” of ECETOC TRA are required.
For the estimates of the dermal exposure these values are inserted in Eq. 6 which for T=8 h (long term) and T=1 h (short-term) using values for an coefficient of 6 m/h for vapour and a deposition rate of 50 m/h for aerosol dominated scenarios (Table 9 and
Table 10). The estimates should be considered as conservative as neither the conceivable
evaporation of the substances from the skin surface nor the wearing of clothes, ordinary or
protective, are considered in the calculations. As for the inhalation exposure estimates a direct
comparison between this study and ECETOC TRA should not be made at this point. The
dermal exposure estimates presented in this report should be viewed as a starting point; which
requires adaptation to derive at exposure estimates that can reasonably be expected for
industrial and professional spraying activities.
6 Conclusion
This study has provided a first insight into the underlying parameter of inhalation and dermal
exposure during spraying activities (PROC 7 and 11). Initial experiments demonstrated the
impact of the spraying method, and therefore the droplet size distribution, for aerosol
dominated spraying scenarios on the exposure concentration - the smaller the droplet size, the
higher the aerosol concentration. Aerosol dominated exposure is to be expected for vapour
pressures below 10 Pa. Above this value there exists a transition regime (10-100 Pa)
characterized by simultaneous exposure to aerosols and vapours. For substances above 100
Pa, the saturation concentration of the vapour is the parameter controlling exposure. The
measurements have shown a direct proportionality of estimated exposure concentration to the
saturation concentration of the substance. The findings of this study indicate an
underestimation of the inhalation baseline concentration by ECETOC TRA for high vapour
pressure substances (>300 Pa). This underestimation increases with increasing vapour
pressure, which also seems to hold true for dermal exposure. However, a direct comparison
between the findings of this study and ECETOC TRA estimates could not be made, due to our
limited knowledge of the data sets behind the ECETOC TRA exposure estimates.
page 27 of 37
7 Outook
There are still several remaining uncertainties of this analysis:
The experimental basis for the derivation of Eq. 6 and, related to this, the
extrapolation to high vapour pressure solvents was based on measurements with two
substances only, with vapour pressure around 10 and 100 Pa, respectively.
The results of the dispersion modelling was verified experimentally by carrying out
measurements in a rather small room under laboratory-like conditions
Only wall spraying processes were considered.
No realistic industrial scenarios such as wall spraying in a large hall or spray
treatment of surfaces at a fixed position (spray booth, surface coating of components)
inside the hall were considered experimentally to validate the simulation results.
These gaps could be filled by performing a limited number of additional tests in a professional
as well as industrial environment. Two different room sizes of 45 m² (10.7x4.2 m²) and 425 m²
(17x25m²) are envisaged. Wall spraying (moving source) as well as spraying at a fixed location
will be carried out using a solvent with very low vapour pressure simulating the aerosol
dominated exposure and two solvents with vapour pressures of 100 Pa and 1,000 Pa. These
experiments should be complemented by model calculations.
The data given in Table 9 and
Table 10 should be viewed as a starting point for dermal exposure estimates in mg/cm² over
the given time periods. They are based on a mass transfer coefficient of 6 m/h for vapour as
suggested by Weschler et. al 2014 and experimental work conducted in this study, deriving
at a deposition rate of 50 m/h for aerosols. Additional experiments with solvent loaded
horizontal deposition plate, provided first confirmation that 6 m/h is a reasonable mass
transfer coefficient that can be applied for vapours. The use of solvent loaded horizontal
deposition plates, however, poses the question of overestimating vapour deposition, as the
solvent loaded deposition plate serves as a perfect sink which realistic surfaces do not. The
exposure estimates should not be viewed as instantaneous loading of the skin with the given
substance; but as the amount that comes into contact with the skin over the given time
periods, 1 and 8 h respectively. Depending on for example the phys.-chem. properties
(permeability coefficient) of the substance of interest a certain fraction will become
systemically available, whereas the remainder will either be removed from or remains on the
skin surface. But all fractions will have been in contact with the skin surface. The estimates
in Table 9 and
Table 10 do not consider physical skin adherence or the implication of a maximum loading
capacity of human skin towards vapours or aerosols. Maximum skin adherence and other
modifying factors such as those outlined in the dermal conceptual model (Schneider et al.14)
are not considered in the dermal exposure estimates given Table 9 and 10. Even though
maximum skin adherence has been reported for solids and liquids, information on whether this
concept is also applicable for vapours is currently not available, to our knowledge.
For aerosol dominated scenarios the short-term dermal exposure estimates reported in Table
9 and
Table 10 are in good agreement with the 2 mg/cm²/day baseline value stipulated by the
ECETOC TRA tool; whereas the long-term estimates for aerosol dominated scenarios and
14 Schneider T; Vermeulen R; Brouwer D H; Cherrie W; Kromhout H; Fogh C L (1999): Conceptual model for assessment of dermal exposure. Occup. Environ. Med.; 56:765-773.

page 28 of 37
vapour dominated scenarios (short- and long term) are clearly exceeding this value. Bearing
this in mind two questions come into mind:
1. Is one baseline value for dermal exposure sufficient?-or do we need to take
different fugacity bands into account? This question has already been
addressed by Marquart et al.15; who came to the conclusion that not a single
default value for dermal exposure estimates should be applied.
2. Do we need time-weighted dermal exposure estimates? – considering that
dermal exposure during spraying activities is seldomly an instantaneous event
but occurs continuously over a given time period; with substance molecules
moving to and from the skin surface, and the substance specific permeability
coefficient being a measure for systemic uptake. The skin surface merely being
a passing point and the dermal exposure estimate providing an indication for
the amount of substance “passing by” during any given spray related task.
These two question as well as reducing and/or enhancing factors on dermal exposure
estimates will require further investigation, either experimentally or desk based.
15 Marquart H; Warren N D; Laitinen J, Van Hemmen J J (2006): Default values for assessment of potential dermal exposure of the hands to industrial chemicals in the scope of regulatory risk assessments. Ann. Occup. Hyg, 50:496-489.

page 29 of 37
Table 7: Inhalation exposure: Comparison of estimates based on this study and ECETOC TRA base line values (PROC 7). Exposure scenario 1. Scenario 1 is defined as constant continuous spraying process where exposure is dominated by the near field concentration close to the spray cloud.
Product data
Estimate for peak as well as > 4 h spraying activity*
Ratio to ECETOC based on mg/m³
ECETOC TRA v3 PROC 7 values
MW Vp Saturated air
conc., Cs at 20 °C Aerosol Vapour
long-term (activity duration
> 4h)
short-term Long-term inhalation
exposure estimate (activity duration > 4h)
Short-term inhalation exposure estimate
Substance [g/mol] [Pa] [mg/m3] [ppm] [mg/m³] [mg/m3] [ppm] - - [ppm] [mg/m3] [ppm] [mg/m3]
1-Bromopropane 123 14600 737192 143842 NA 163453 31893 63.8 15.9 500 2563 2000 10250
butan-2-one 72.11 10500 310819 103448 NA 68916 22937 45.9 11.5 500 1502 2000 6009
trichloroethylene 131.39 7760 418549 76453 NA 92802 16951 67.8 17.0 250 1369 1000 5475
propan-2-ol 60.1 4260 105101 41970 NA 23303 9306 37.2 9.3 250 626 1000 2504
Toluene 92.14 2910 110069 28670 NA 24405 6357 25.4 6.4 250 960 1000 3839
2-methyl-propan-1-ol 74.12 1180 35904 11626 NA 7961 2578 10.3 2.6 250 772 1000 3088
n-butyl acetate 116.16 1070 51023 10542 NA 11313 2337 9.3 2.3 250 1210 1000 4840
Xylene 106.17 670 29201 6601 NA 6475 1464 5.9 1.5 250 1106 1000 4424
1-methoxy-2-propyl acetate 132.16 310 16818 3054 NA 3729 677 6.8 1.7 100 551 400 2203
N-methyl-2-pyrrolidone 99.13 32 1302 315 400 289 NA 1.7 0.4 100 413 400 1652
PTEO 206 80 6765 788 NA 1500 175 1.7 0.4 100 858 400 3433
Ethylene glycol 62.07 5.3 135 52 400 30 NA 1.7 0.4 100 259 400 1035
Diethylene glycol 106.12 0.8 35 8 400 8 NA 0.9 0.2 100 442 400 1769
*These values are the maximum values. In case the activity duration, Tactivity, are shorter than 8 h the TWA concentrations in these columns have to reduced according to Eq. 3.

page 30 of 37
Table 8: Inhalation exposure: Comparison of estimates based on this study and ECETOC TRA base line values (PROC 7). Exposure scenario 2. Scenario 2 is defined as a work process combines near field exposure during the spraying action and far zone exposure during peripheral work (without spraying) such as refilling, maintenance etc. distant from the spraying location.
Product data
Estimate for intermittent peak as well as
> 4 h spraying activity*
Ratio to ECETOC based on mg/m³
ECETOC TRA v3 PROC 7 baseline
MW Vp Saturated air
conc., Cs at 20 °C Aerosol Vapour
long-term (activity duration
> 4h)
short-term Long-term inhalation
exposure estimate (activity duration > 4h)
Short-term inhalation exposure estimate
Substance [g/mol] [Pa] [mg/m3] [ppm] [mg/m³] [mg/m3] [ppm] - - [ppm] [mg/m3] [ppm] [mg/m3]
1-Bromopropane 123 14600 737192 143842 0 81726 15947 31.9 8.0 500 2563 2000 10250
butan-2-one 72.11 10500 310819 103448 0 34458 11468 22.9 5.7 500 1502 2000 6009
trichloroethylene 131.39 7760 418549 76453 0 46401 8476 33.9 8.5 250 1369 1000 5475
propan-2-ol 60.1 4260 105101 41970 0 11652 4653 18.6 4.7 250 626 1000 2504
Toluene 92.14 2910 110069 28670 0 12202 3178 12.7 3.2 250 960 1000 3839
2-methyl-propan-1-ol 74.12 1180 35904 11626 0 3980 1289 5.2 1.3 250 772 1000 3088
n-butyl acetate 116.16 1070 51023 10542 0 5656 1169 4.7 1.2 250 1210 1000 4840
Xylene 106.17 670 29201 6601 0 3237 732 2.9 0.7 250 1106 1000 4424
1-methoxy-2-propyl acetate 132.16 310 16818 3054 0 1865 339 3.4 0.8 100 551 400 2203
N-methyl-2-pyrrolidone 99.13 32 1302 315 200 144 0.8 0.2 100 413 400 1652
PTEO 206 80 6765 788 0 750 87 0.9 0.2 100 858 400 3433
Ethylene glycol 62.07 5.3 135 52 200 30 0.9 0.2 100 259 400 1035
Diethylene glycol 106.12 0.8 35 8 200 8 0.5 0.1 100 442 400 1769
*These values are the maximum values. In case the activity duration, Tactivity, are shorter than 8 h the TWA concentrations in these columns have to reduced according to Eq. 3.

page 31 of 37
Table 9 Dermal exposure: Comparison of estimates based on this study and ECETOC TRA base line values. Scenario 1. Scenario 1 is defined as constant
continuous spraying process where exposure is dominated by the near field concentration close to the spray cloud. External exposure on the skin, Md, are calculated according to the following equation: 𝑴𝒅 = (𝒄𝒂𝒆𝒓𝒐𝒔𝒐𝒍 ∙ 𝑻 ∙ 𝒗𝒅/𝟏𝟎𝟎𝟎𝟎) + (𝒄𝒗𝒂𝒑𝒐𝒖𝒓 ∙ 𝑻 ∙ 𝒅𝒗/𝟏𝟎𝟎𝟎𝟎) , with caerosol – airborne aerosol
concentration in mg/m³; cvapour – airborne vapour concentration in mg/m³; T – time in h; vd – mass transfer coefficient for aerosols (droplet settling velocity) taken as 50 m/h; dv – mass transfer coefficient for vapours, taken as 6 m/h. Please note: Dermal exposure estimates presented here, reflect only external exposure on the skin surface, without considering reducing factors such as the evaporation of the substance from the skin surface. Systemic exposure is determined by the phys.-chem. properties of the substance under consideration and has to be determined for each substance individually. The skin surface is viewed as merely being a passing point for the substance of interest and the dermal exposure estimate provides an indication for the amount of substance “passing by” over the given time period (e.g. 1 and 8 h).
Estimate (this study) ECETOC TRA v3 PROC 7
baseline
MW VP Aerosol Vapour Dermal (long-
term, 8h) Dermal (short-
term,1 h) dermal
Substance [g/mol] [Pa] [mg/m³] [ppm] [mg/cm²] [mg/cm²] [mg/cm²/day]
1-Bromopropane 123 14600 0 163453 31893 7 85 98,1 2
butan-2-one 72,11 10500 0 68916 22937 331 41,3 2
trichloroethylene 131,39 7760 0 92802 16951 445 55,7 2
propan-2-ol 60,1 4260 0 23303 9306 112 14,0 2
Toluene 92,14 2910 0 24405 6357 117 14,6 2
2-methyl-propan-1-ol 74,12 1180 0 7961 2578 38,2 4,78 2
n-butyl acetate 116,16 1070 0 11313 2337 54,3 6,79 2
Xylene 106,17 670 0 6475 1464 31,1 3,88 2
1-methoxy-2-propyl acetate 132,16 310 0 3729 677 17,9 2,24 2
N-methyl-2-pyrrolidone 99,13 32 400 289 70 17,4 2,17 2
PTEO 206 80 0 1500 175 7,20 0,90 2
Ethylene glycol 62,07 5,3 400 30 16,1 2,02 2
Diethylene glycol 106,12 0,8 400 8 16,0 2,00 2

page 32 of 37
Table 10 Dermal exposure: Comparison of estimates based on this study and ECETOC TRA base line values. Scenario 2. Scenario 2 is defined as a work process combines near field exposure during the spraying action and far zone exposure during peripheral work (without spraying) such as refilling, maintenance etc. distant from the spraying location. External exposure on the skin, Md, are calculated according to the following equation: 𝑴𝒅 =(𝒄𝒂𝒆𝒓𝒐𝒔𝒐𝒍 ∙ 𝑻 ∙ 𝒗𝒅/𝟏𝟎𝟎𝟎𝟎) + (𝒄𝒗𝒂𝒑𝒐𝒖𝒓 ∙ 𝑻 ∙ 𝒅𝒗/𝟏𝟎𝟎𝟎𝟎) , with caerosol – airborne aerosol concentration in mg/m³; cvapour – airborne vapour concentration
in mg/m³; T – time in h; vd – mass transfer coefficient for aerosols (droplet settling velocity) taken as 50 m/h; dv – mass transfer coefficient for vapours, taken as 6 m/h. Please note: Dermal exposure estimates presented here, reflect only external exposure on the skin surface, without considering reducing factors such as the evaporation of the substance from the skin surface. Systemic exposure is determined by the phys.-chem. properties of the substance under consideration and has to be determined for each substance individually. The skin surface is viewed as merely being a passing point for the substance of interest and the dermal exposure estimate provides an indication for the amount of substance “passing by” over the given time period (e.g. 1 and 8 h).
Estimate (this study) ECETOC TRA v3 PROC 7
baseline
MW VP Aerosol Vapour Dermal (long-
term, 8h) Dermal (short-
term, 1 h) dermal
Substance [g/mol] [Pa] [mg/m³] [ppm] [mg/cm²] [mg/cm²] [mg/cm²/day]
1-Bromopropane 123 14600 0 81726 15947 392 49.0 2
butan-2-one 72.11 10500 0 34458 11468 165 20.7 2
trichloroethylene 131.39 7760 0 46401 8476 223 27.8 2
propan-2-ol 60.1 4260 0 11652 4653 55.9 6.99 2
Toluene 92.14 2910 0 12202 3178 58.6 7.32 2
2-methyl-propan-1-ol 74.12 1180 0 3980 1289 19.1 2.39 2
n-butyl acetate 116.16 1070 0 5656 1169 27.2 3.39 2
Xylene 106.17 670 0 3237 732 15.5 1.94 2
1-methoxy-2-propyl acetate 132.16 310 0 1865 339 8.95 1.12 2
N-methyl-2-pyrrolidone 99.13 32 200 144 8.69 1.09 2
PTEO 206 80 0 750 87 3.60 0.45 2
Ethylene glycol 62.07 5.3 200 15 8.07 1.01 2
Diethylene glycol 106.12 0.8 200 4 8.02 1.00 2
page 33 of 37
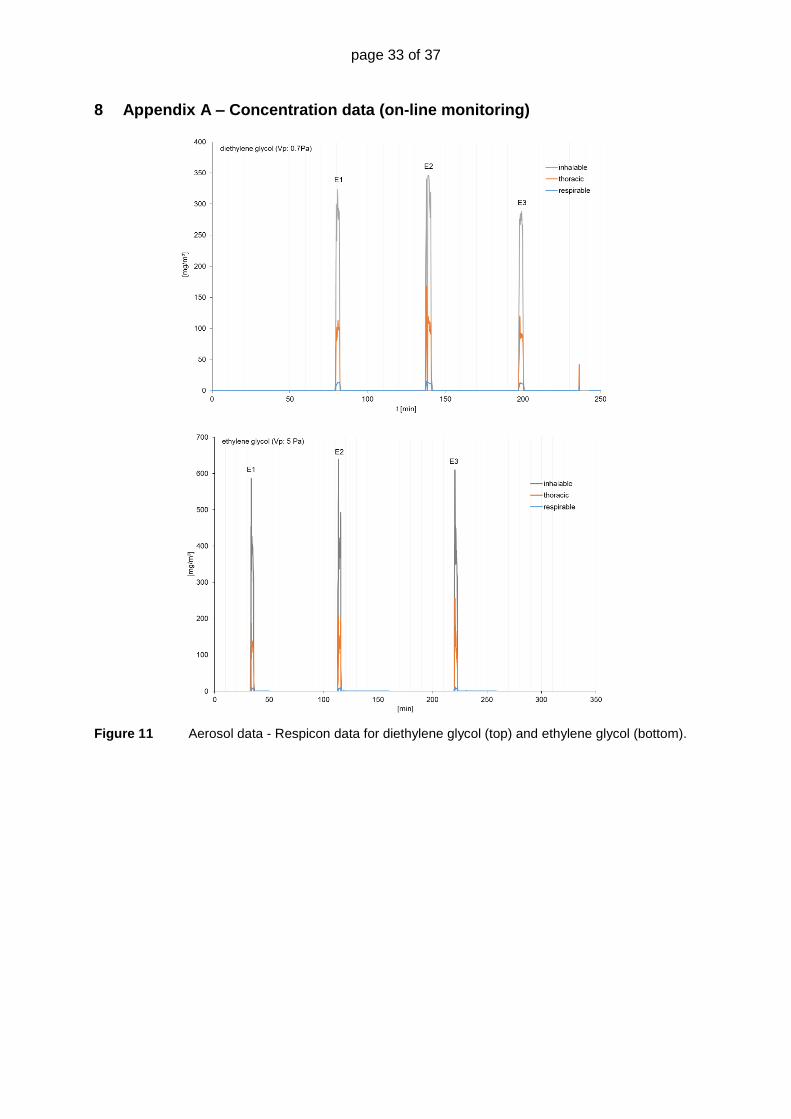
8 Appendix A – Concentration data (on-line monitoring)
Figure 11 Aerosol data - Respicon data for diethylene glycol (top) and ethylene glycol (bottom).
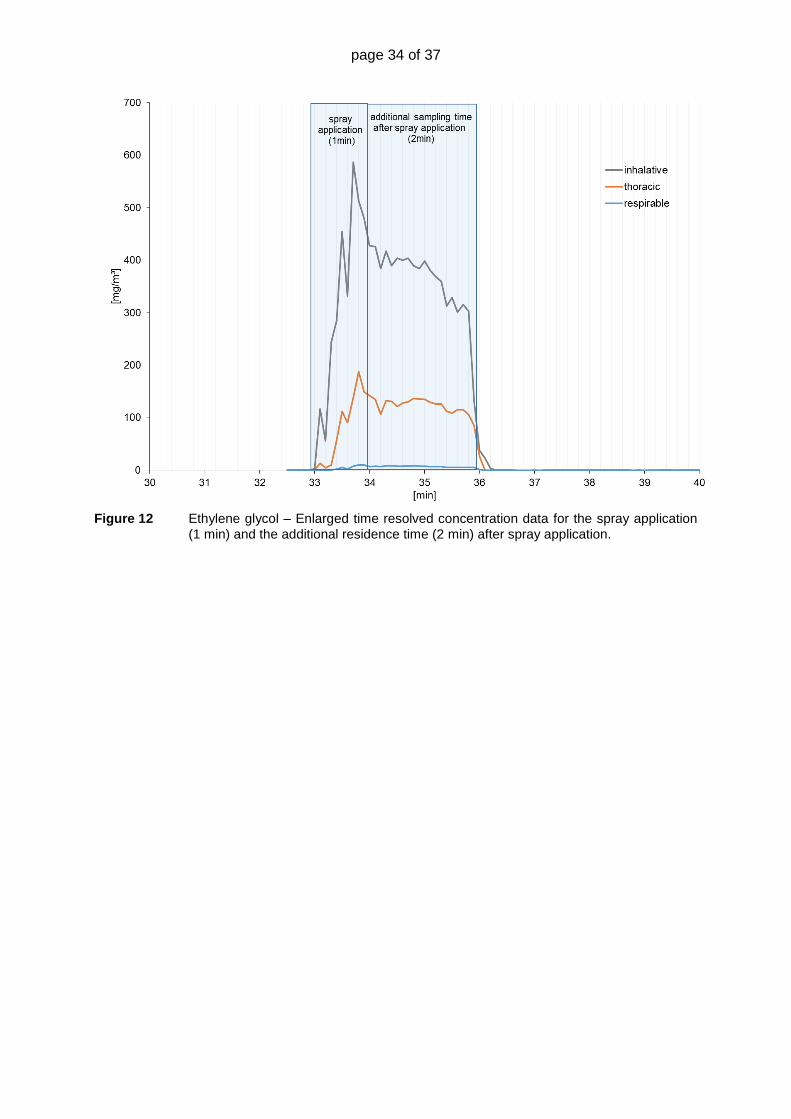
page 34 of 37
Figure 12 Ethylene glycol – Enlarged time resolved concentration data for the spray application
(1 min) and the additional residence time (2 min) after spray application.

page 35 of 37
Figure 13 Aerosol data – Grimm (aerosol spectrometer) data for diethylene glycol (top), ethylene
glycol (mid) and PTEO (bottom).

page 36 of 37
Figure 14 Gas phase data – On-line FID signal: Ethylene glycol
Figure 15 Gas phase data – On-line FID signal: PTEO

page 37 of 37
9 Appendix B - Derivation of the airborne release rate from the measured average concentration
The average concentration is given by:
2211
21
1cTcT
TTc
A1
where
V
TRc a 1
12
1 and
V
TRc a 1
2
A2
Inserting into A1 and solving for Ra :
V
TTT
TTcRa
211
21
5.0 A3
and
1TRM aa A4