report from nlcta cern built t18’s 1.820 degc vacuum braze 2.1050 degc h2 braze (slac procedure) -...
TRANSCRIPT
Report from NLCTA
• CERN Built T18’s1. 820 degC Vacuum Braze
2. 1050 degC H2 Braze (SLAC procedure) - New
• T24s1. CERN Built (cells pre-fired)
2. KEK/SLAC Built - New
3. Comparison to T26
• NLCTA S-band Gun– Cathode breakdown damage and laser pulse heating - New
Chris Adolphsen, 10/20/10
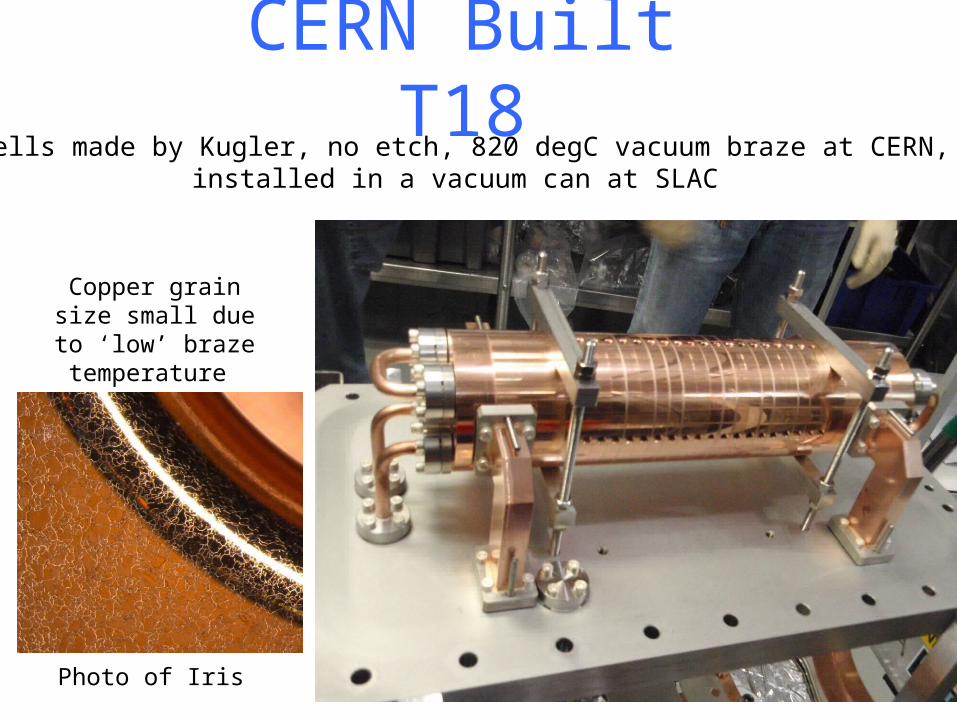
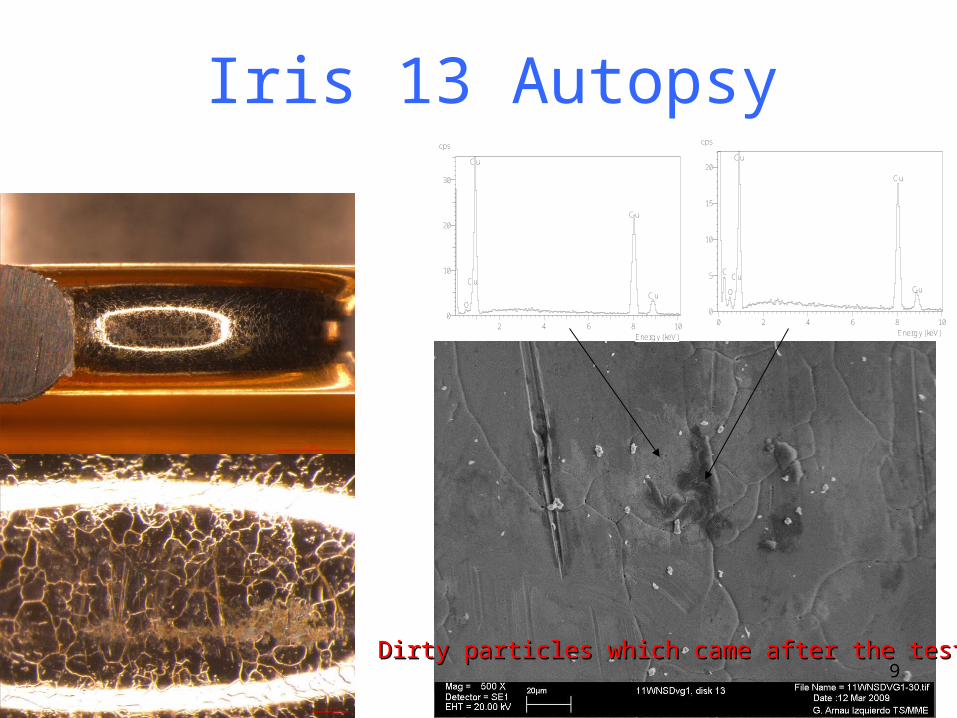
CERN Built T18Cells made by Kugler, no etch, 820 degC vacuum braze at CERN,
installed in a vacuum can at SLAC
Copper grain size small due to ‘low’
braze temperature
Photo of Iris
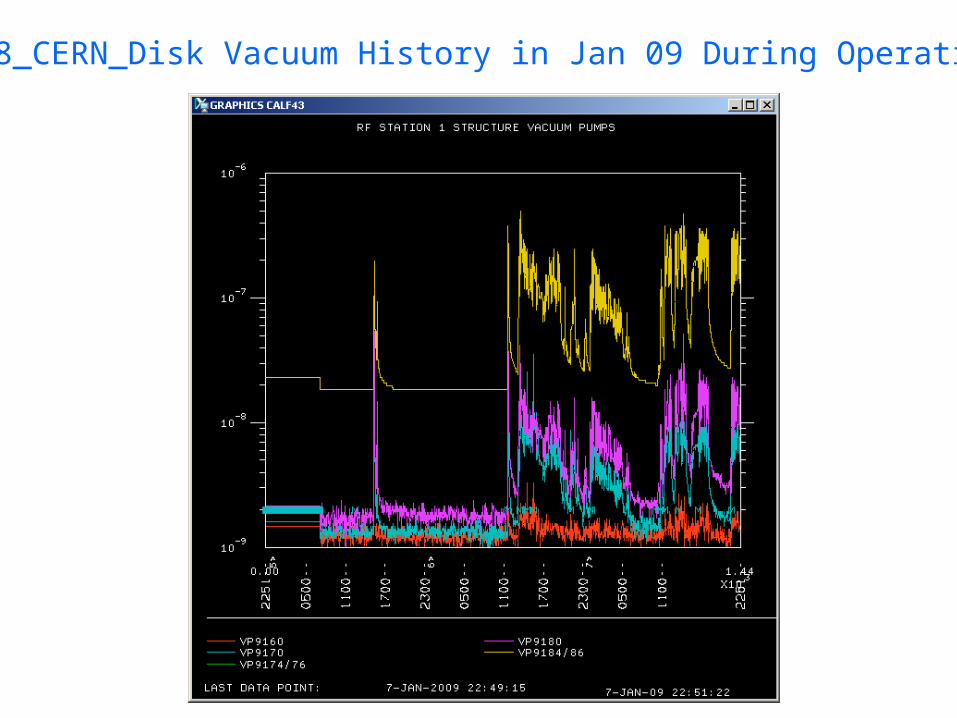
T18_CERN_Disk Vacuum History in Jan 09 During Operation
0 10 20 30 40 50 60 70 80 900
50
100
Ave
rag
e U
nlo
ad
ed
Gra
die
nt: M
V/m
0 10 20 30 40 50 60 70 80 900
50
100 Bre
akd
ow
n R
ate
: 1
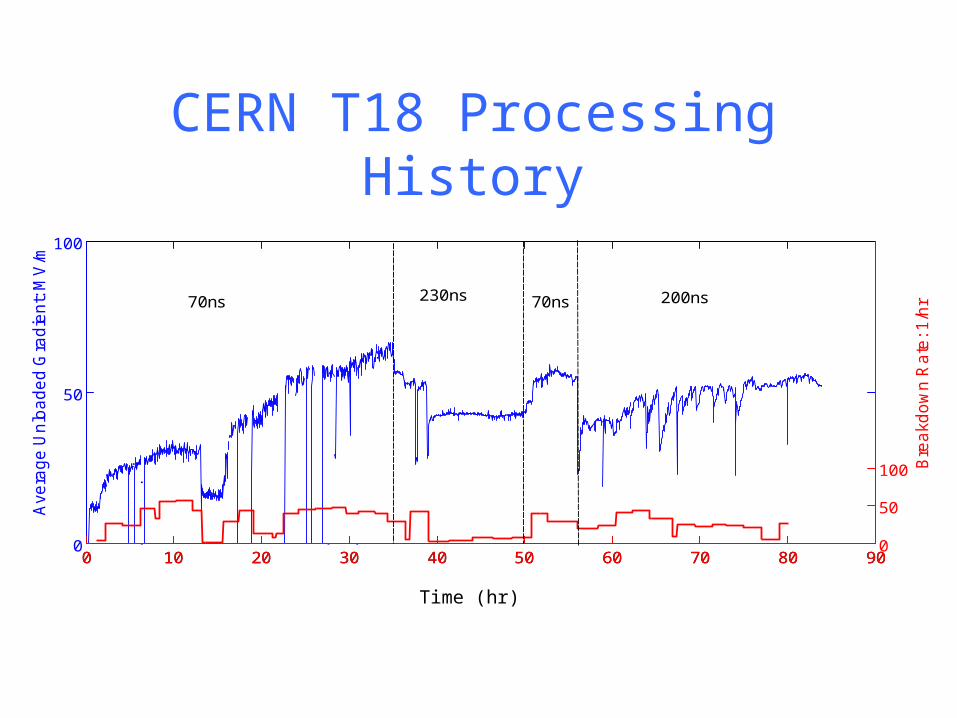
/hr70ns 230ns 200ns70ns
CERN T18 Processing History
Time (hr)
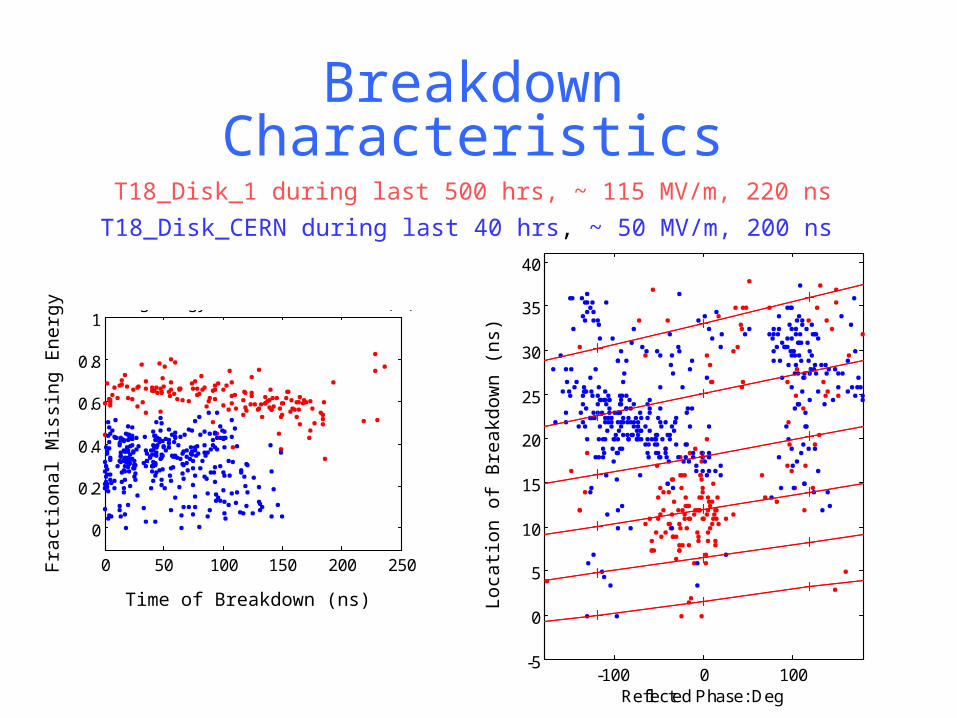
Breakdown Characteristics T18_Disk_1 during last 500 hrs, ~ 115 MV/m, 220 ns
T18_Disk_CERN during last 40 hrs, ~ 50 MV/m, 200 ns
-100 0 100-5
0
5
10
15
20
25
30
35
40
Reflected Phase: Deg
Fill
ing
tim
e fo
r d
iffe
ren
t ce
ll: n
s
0 10 20 300
0.2
0.4
0.6
0.8
1Missing Energy -vs- Breakdown Position (cell #)
-100 0 10010
-2
10-1
100Reflected Power -vs- Reflected Phase (deg)
0 50 100 150 200 250
0
0.2
0.4
0.6
0.8
1Missing Energy -vs- Time of Breakdown (ns)
Time of Breakdown (ns)
Fra
ctio
nal M
issi
ng E
nerg
y
Loca
tion
of B
reak
dow
n (n
s)
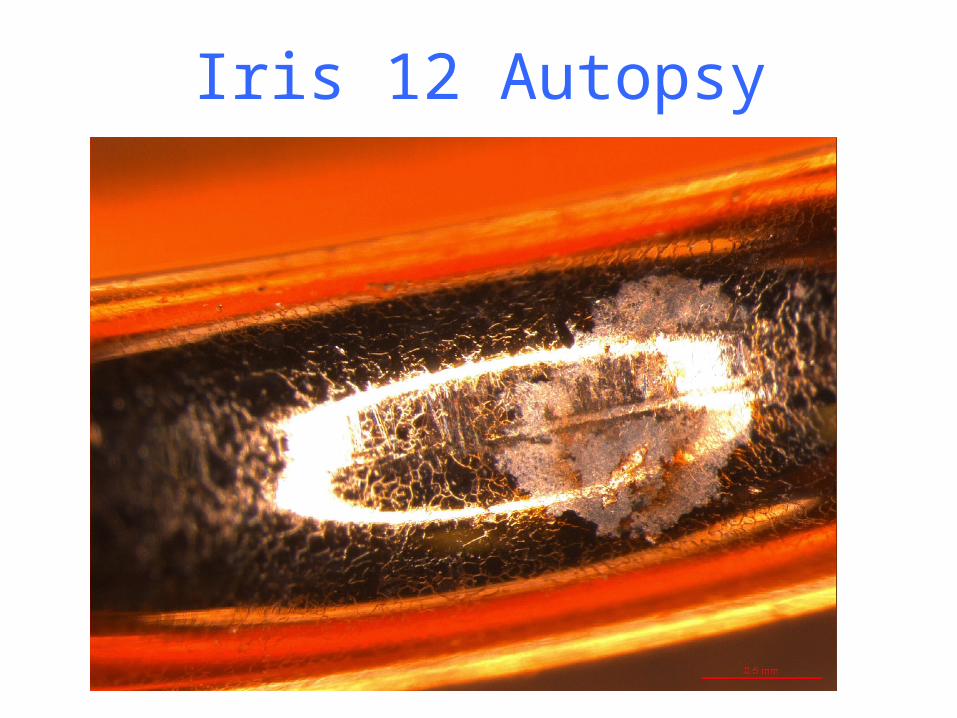
Iris 12 Autopsy
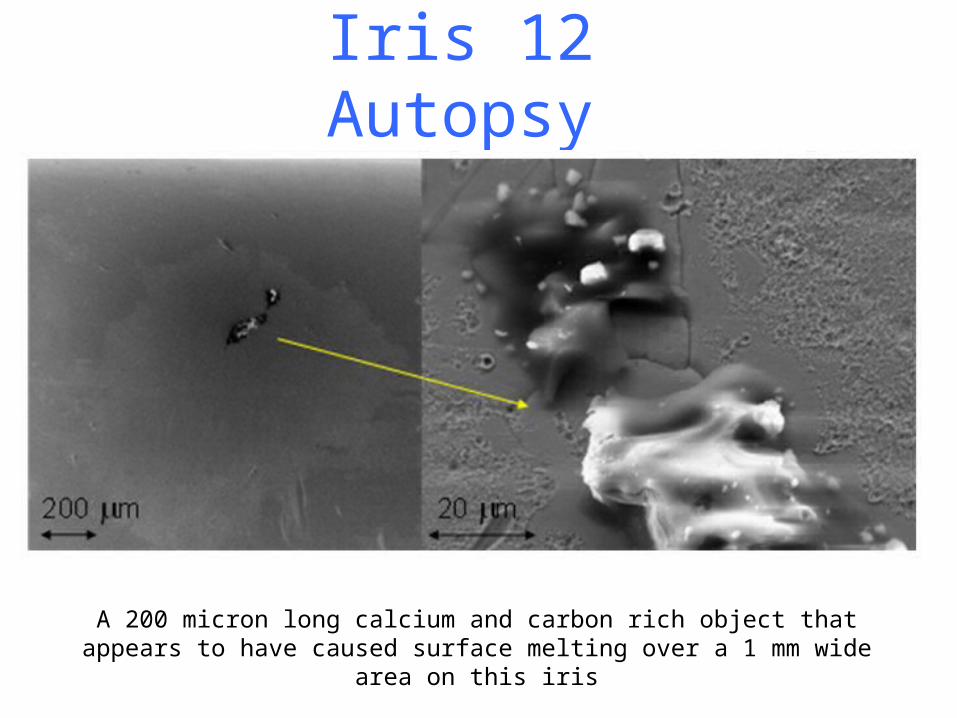
Iris 12 Autopsy
A 200 micron long calcium and carbon rich object that appears to have caused surface melting over a 1 mm wide area on this iris
0 2 4 6 8 10Energy (keV)
0
2
4
6
8
10
cps
Ca
OCu
Cu
SiS
Ca
Ca
Cu
Cu
0 2 4 6 8 10Energy (keV)
0
2
4
6
cps
C
CaTiO
Cu
Cu
Mg
Si
SK
K
Ca
Ca
Ti
Ti Fe CuCu
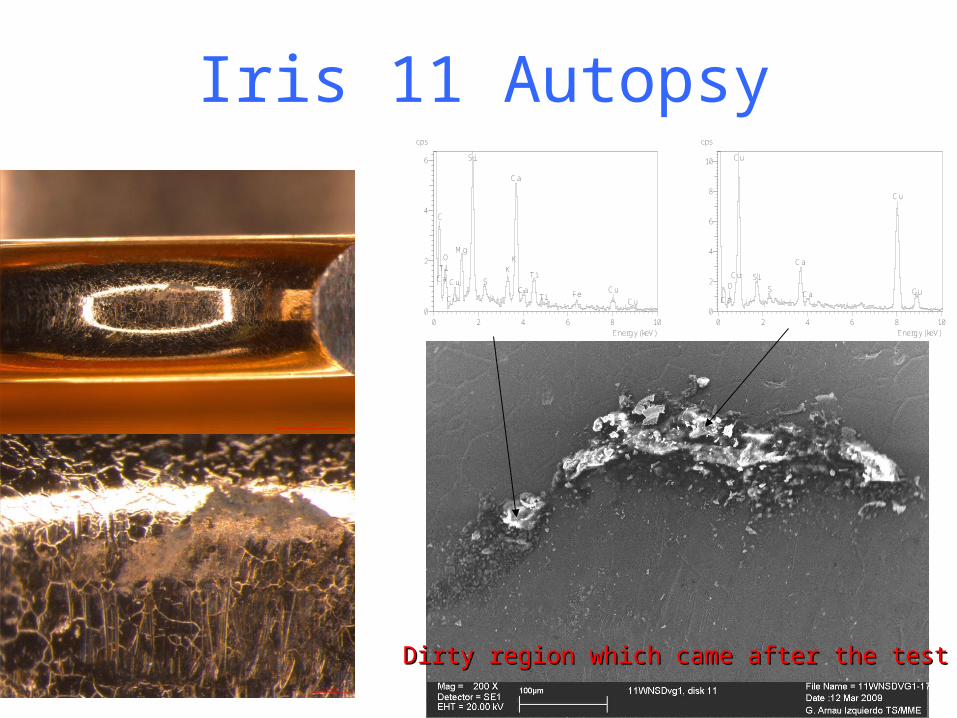
Dirty region which came after the test ?Dirty region which came after the test ?
Iris 11 Autopsy
2 4 6 8 10Energy (keV)
0
10
20
30
cps
O
Cu
Cu
Cu
Cu
0 2 4 6 8 10Energy (keV)
0
5
10
15
20
cps
C
O
Cu
Cu
Cu
Cu
Dirty particles which came after the test ?Dirty particles which came after the test ?
Iris 13 Autopsy
9
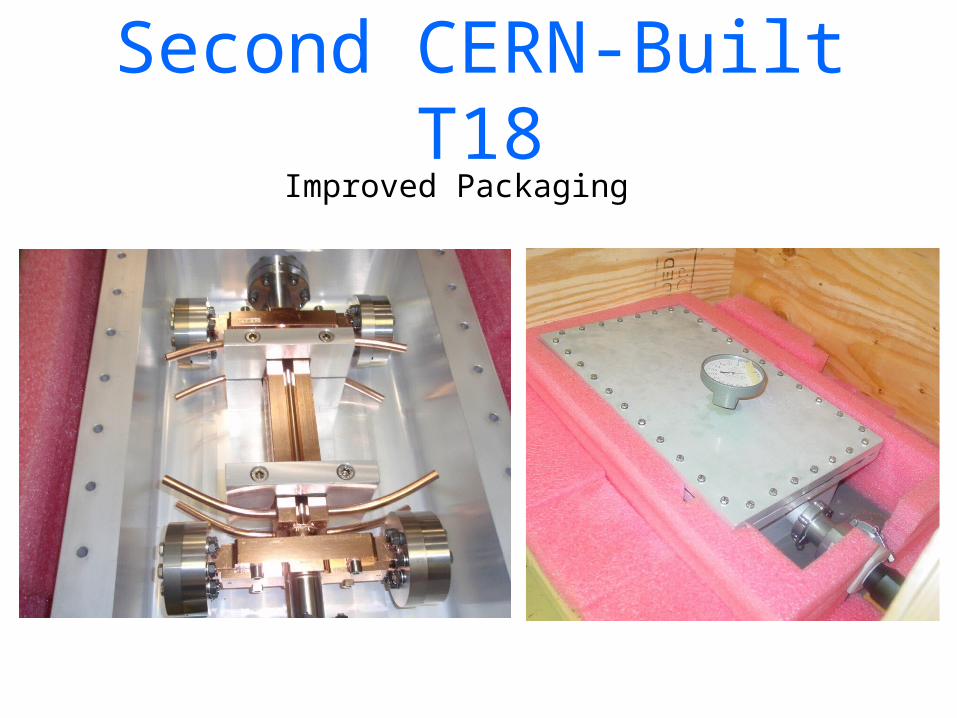
Second CERN-Built T18Improved Packaging
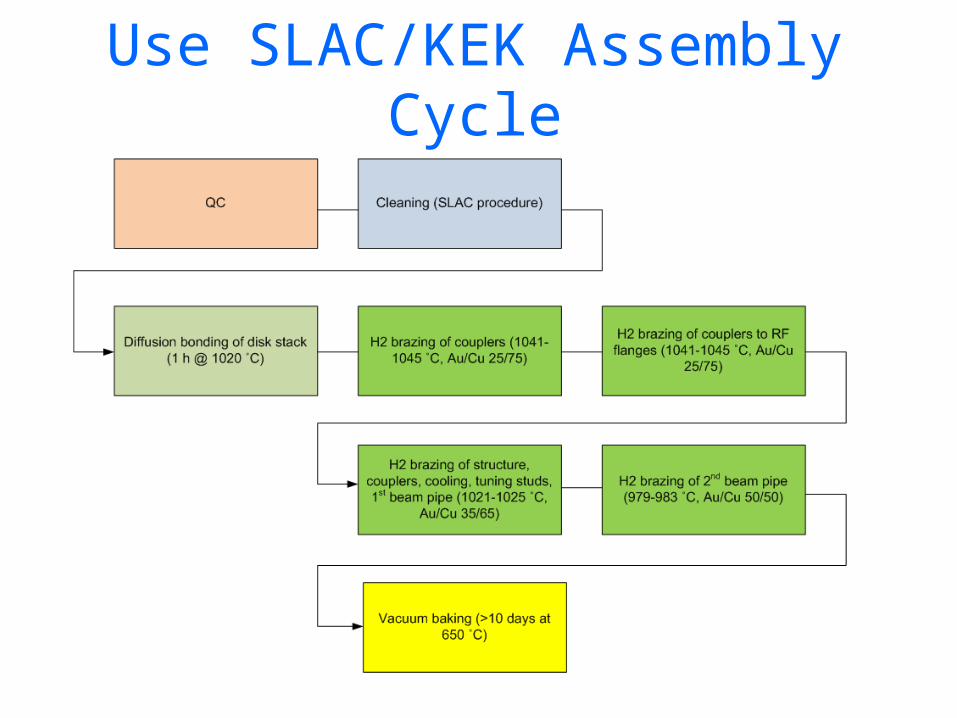
Use SLAC/KEK Assembly Cycle
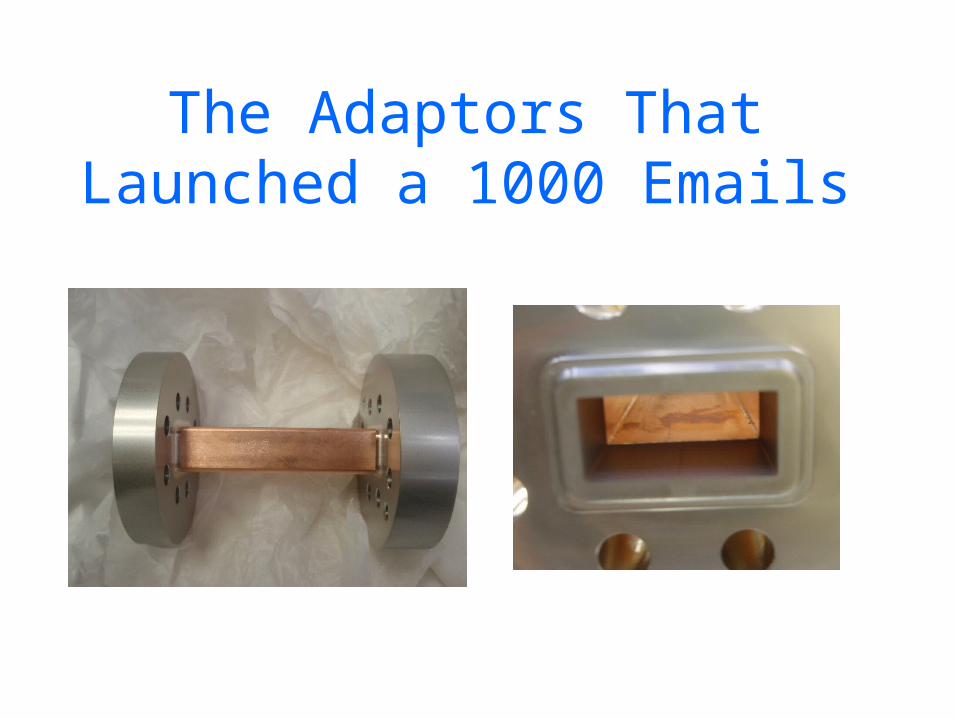
The Adaptors That Launched a 1000 Emails
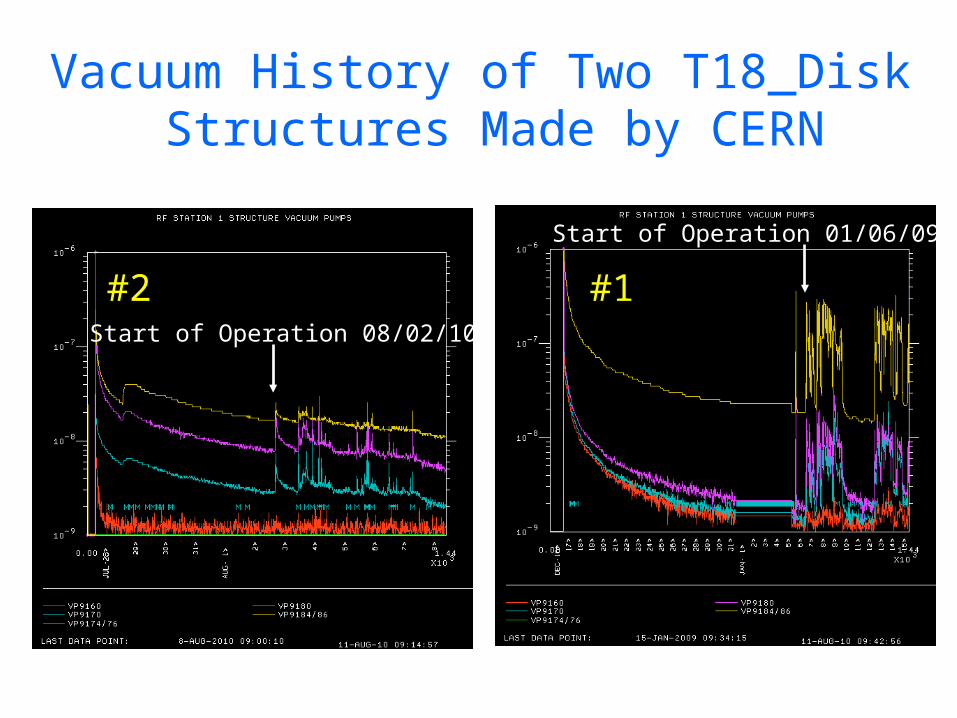
Start of Operation 08/02/10
Start of OperationStart of Operation 01/06/09
Vacuum History of Two T18_Disk Structures Made by CERN
#2 #1
0 100 200 300 400 5000
20
40
60
80
100
120
Time with rf on (hours)
Ave
rag
e U
nlo
ad
ed
Gra
die
nt (
MV
/m)
0 100 200 300 400 500
-5.5-5-4.5-4-3.5-3-2.5
Lg
(BD
R)
(1/p
uls
e/m
)
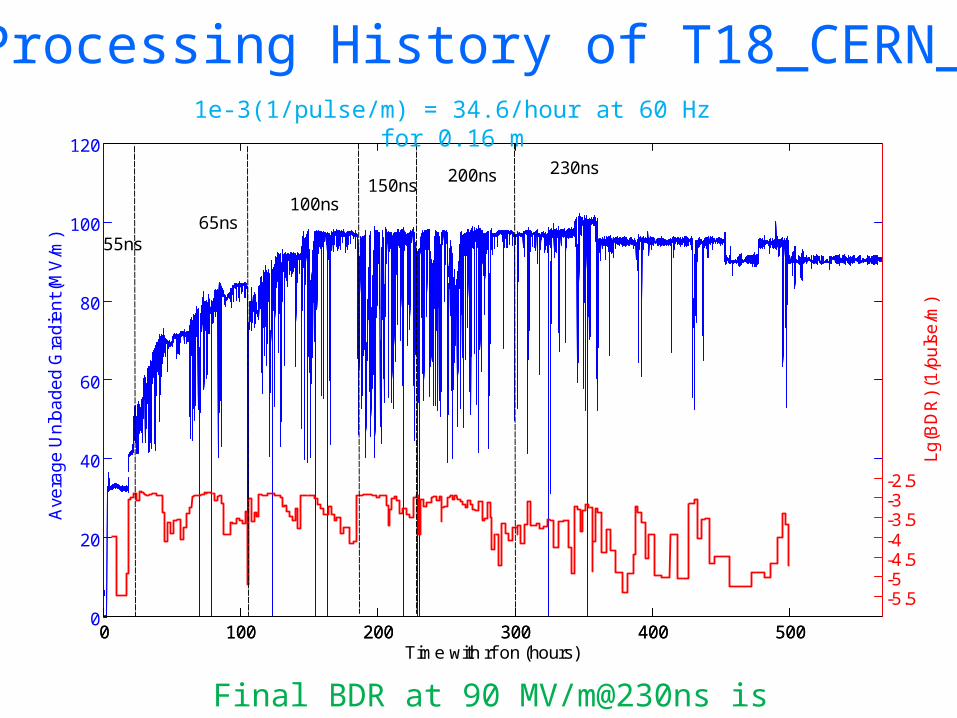
55ns65ns
100ns150ns
200ns 230ns
Processing History of T18_CERN_21e-3(1/pulse/m) = 34.6/hour at 60 Hz for 0.16 m
Final BDR at 90 MV/m@230ns is 1.3e-6/pulse/m
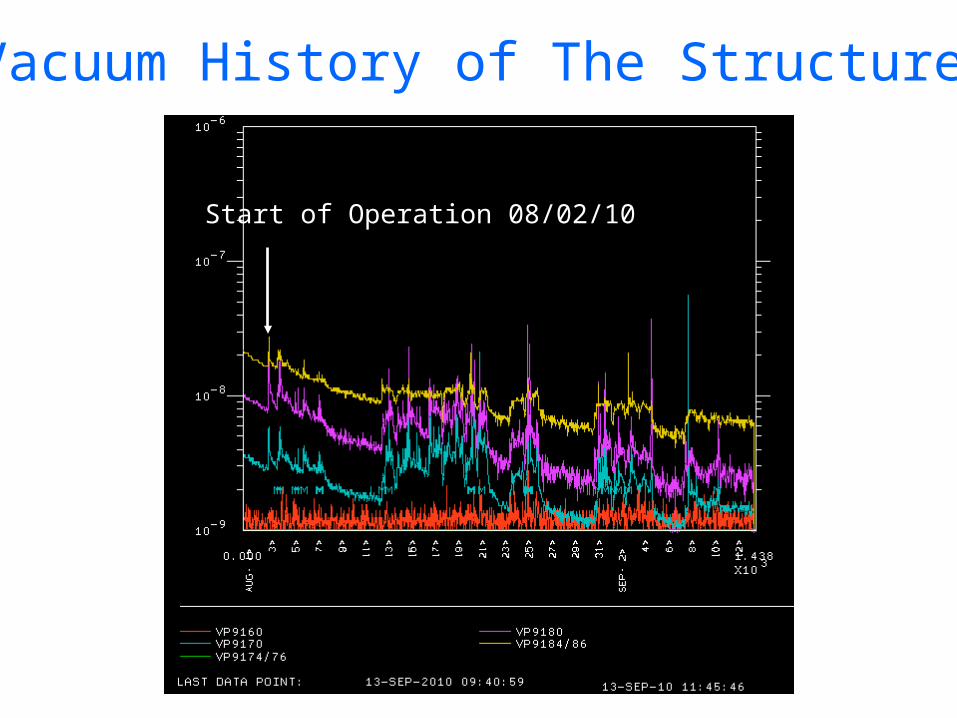
Start of Operation 08/02/10
Vacuum History of The Structure
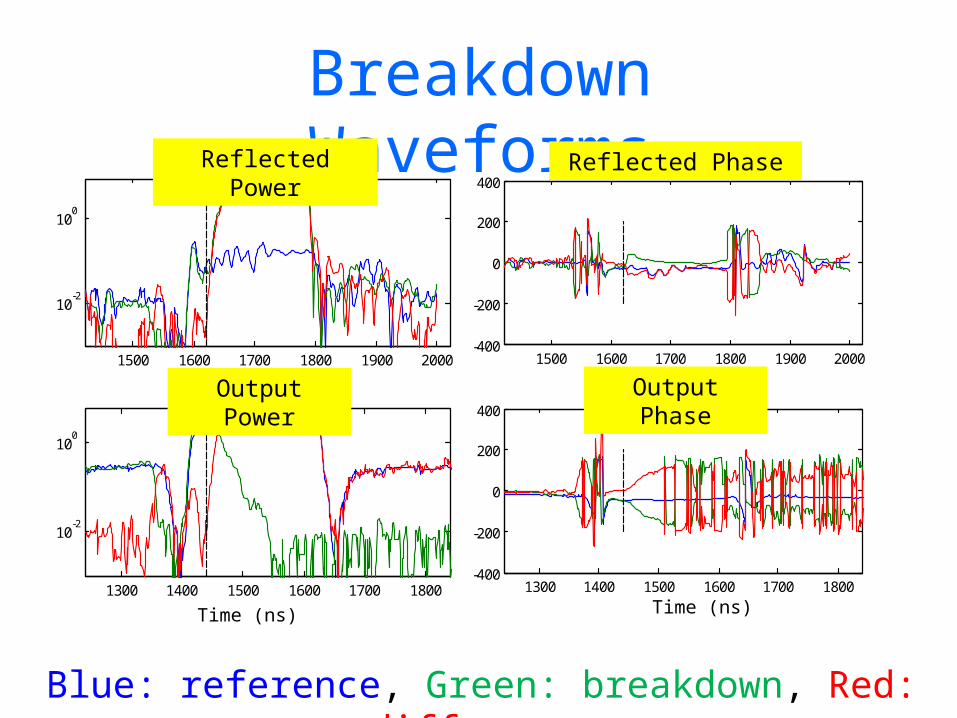
Breakdown Waveforms
1500 1600 1700 1800 1900 2000
10-2
100
Event 21 at 23-Aug-2010 15:20:28
1300 1400 1500 1600 1700 1800
10-2
100
1500 1600 1700 1800 1900 2000-400
-200
0
200
400
1300 1400 1500 1600 1700 1800-400
-200
0
200
400
Reflected Power Reflected Phase
Output Power Output Phase
Blue: reference, Green: breakdown, Red: difference
Time (ns) Time (ns)
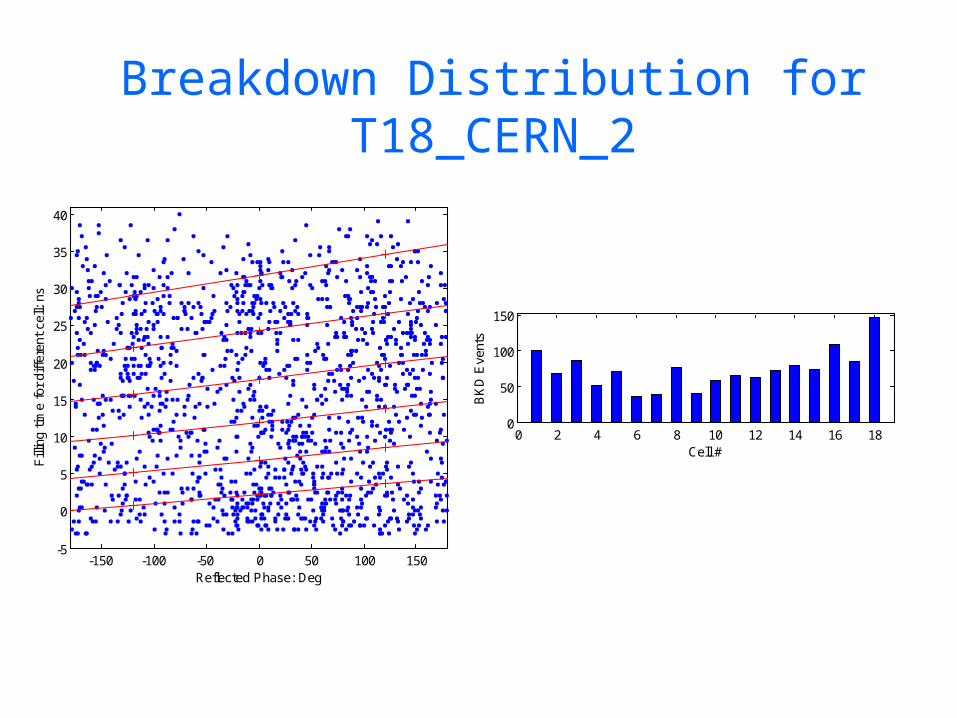
Breakdown Distribution for T18_CERN_2
-150 -100 -50 0 50 100 150-5
0
5
10
15
20
25
30
35
40
Reflected Phase: Deg
Fill
ing
time
for
diff
eren
t ce
ll: n
s
0 2 4 6 8 10 12 14 16 180
50
100
150
Cell #
BK
D E
vent
s
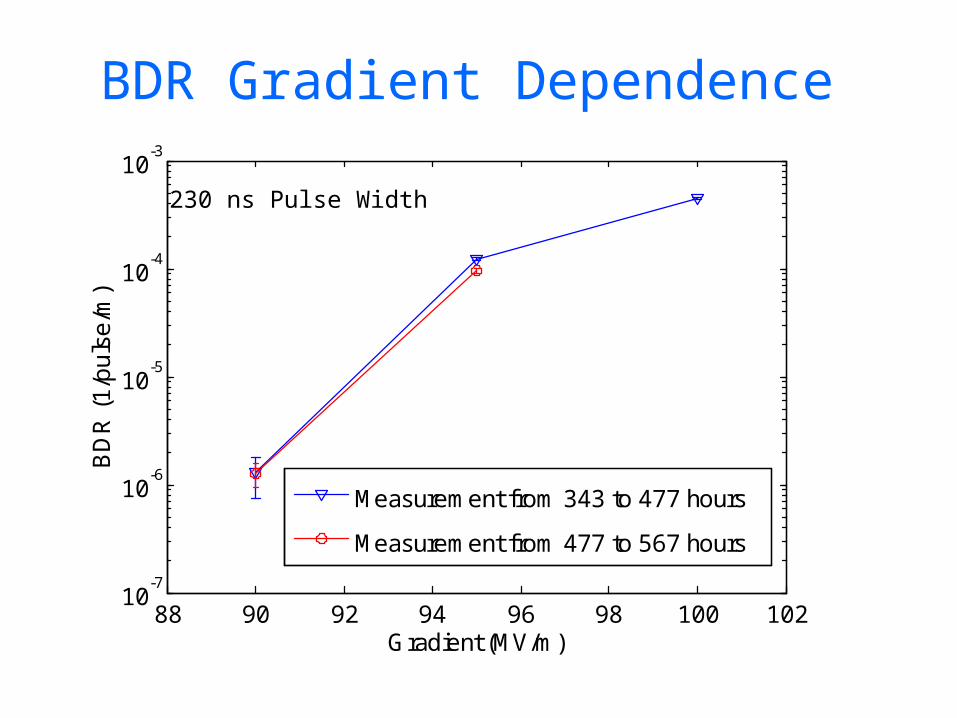
BDR Gradient Dependence
88 90 92 94 96 98 100 10210
-7
10-6
10-5
10-4
10-3
Gradient (MV/m)
BD
R (
1/p
uls
e/m
)
Measurement from 343 to 477 hours
Measurement from 477 to 567 hours
230 ns Pulse Width
90 95 100 105 11010
-7
10-6
10-5
10-4
10-3
Gradient (MV/m)
BD
R (
1/p
uls
e/m
)
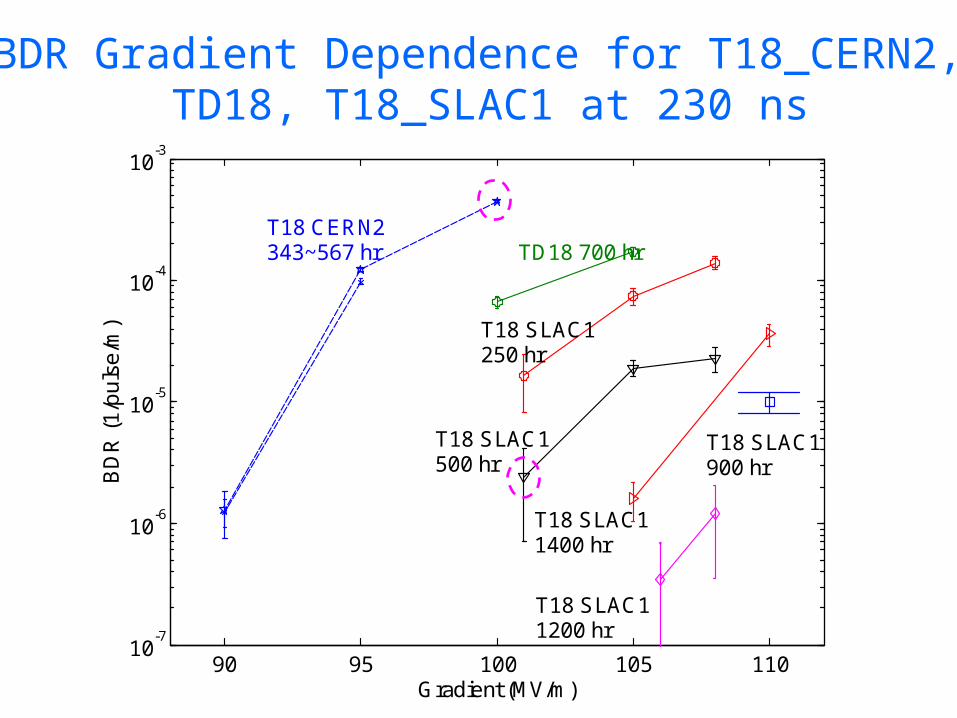
TD18 700 hr
T18 SLAC11200 hr
T18 SLAC1900 hr
T18 CERN2343~567 hr
T18 SLAC1250 hr
T18 SLAC1500 hr
T18 SLAC11400 hr
BDR Gradient Dependence for T18_CERN2, TD18, T18_SLAC1 at 230 ns
4 6 8 10 12 140
0.05
0.1
0.15
0.2
0.25
0.3
0.35
Position (a.u.)
E fie
ld (
a.u
.)
11.427 GHz FROM INPUT
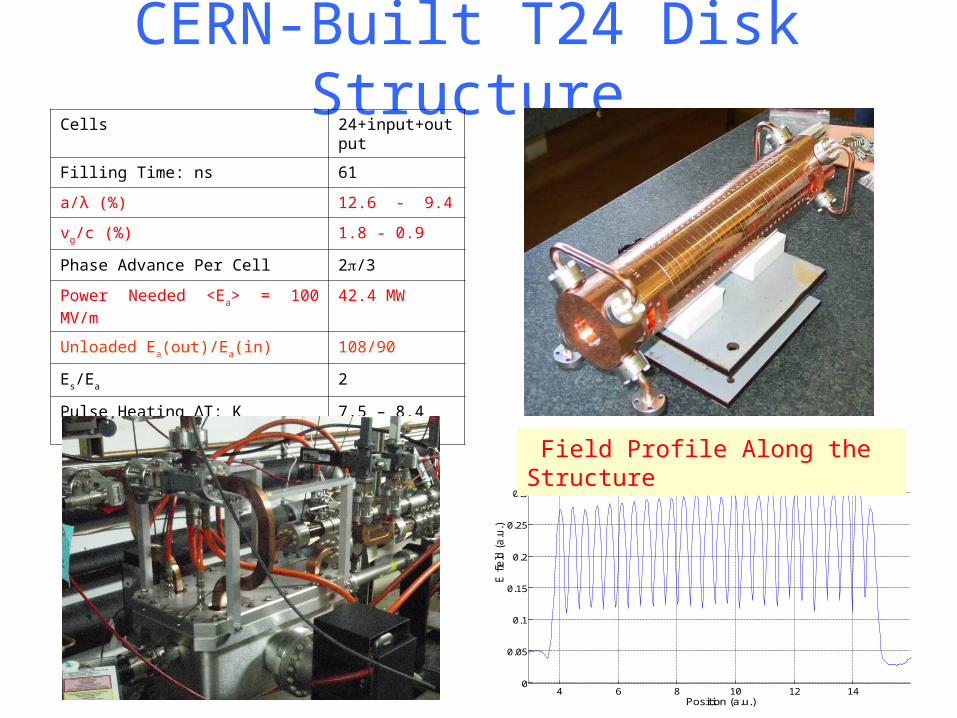
CERN-Built T24 Disk StructureCells 24+input+output
Filling Time: ns 61
a/λ (%) 12.6 - 9.4
vg/c (%) 1.8 - 0.9
Phase Advance Per Cell 2/3
Power Needed <Ea> = 100 MV/m 42.4 MW
Unloaded Ea(out)/Ea(in) 108/90
Es/Ea 2
Pulse Heating ΔT: K (<100MV/m>@100ns)
7.5 – 8.4
Field Profile Along the Structure
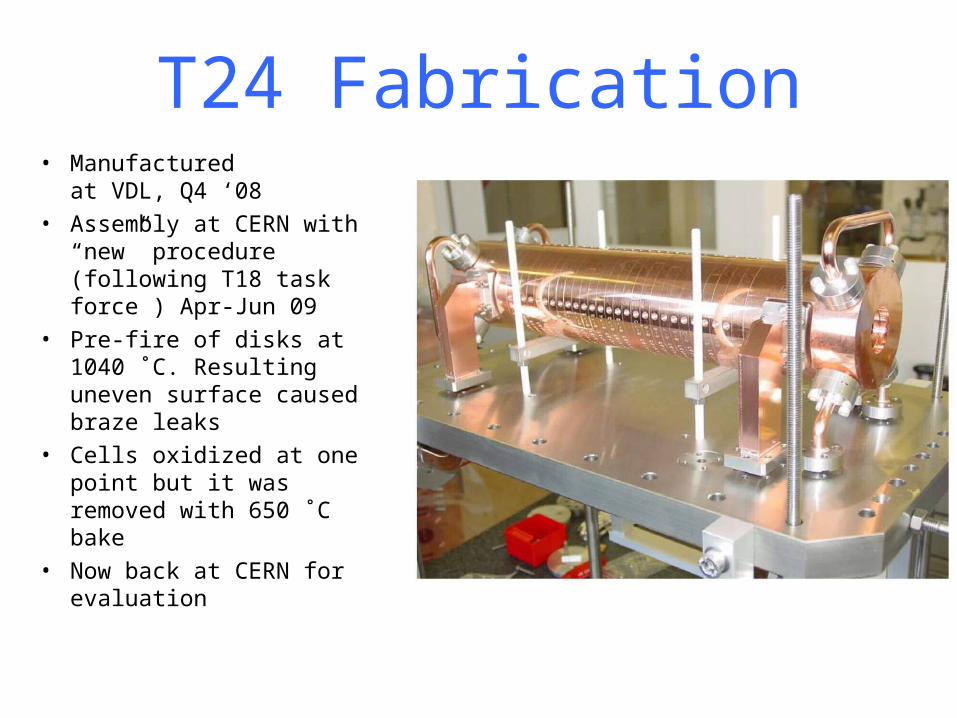
T24 Fabrication• Manufactured
at VDL, Q4 ‘08 • Assembly at CERN with
“new” procedure (following T18 task force ) Apr-Jun 09
• Pre-fire of disks at 1040 ˚C. Resulting uneven surface caused braze leaks
• Cells oxidized at one point but it was removed with 650 ˚C bake
• Now back at CERN for evaluation
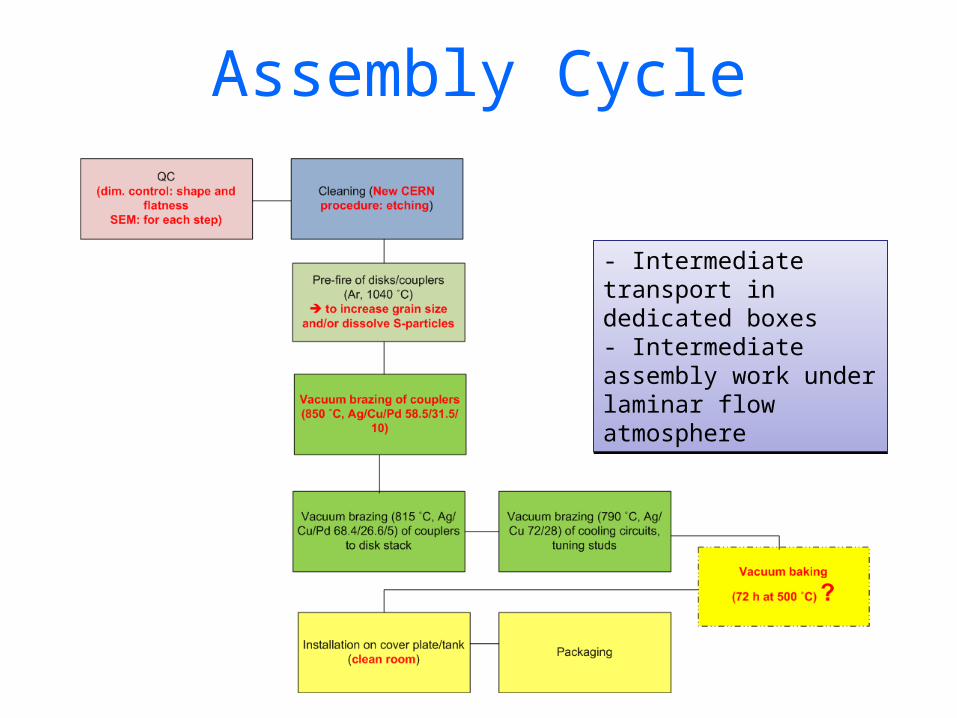
Assembly Cycle
- Intermediate transport in dedicated boxes - Intermediate assembly work under laminar flow atmosphere
- Intermediate transport in dedicated boxes - Intermediate assembly work under laminar flow atmosphere
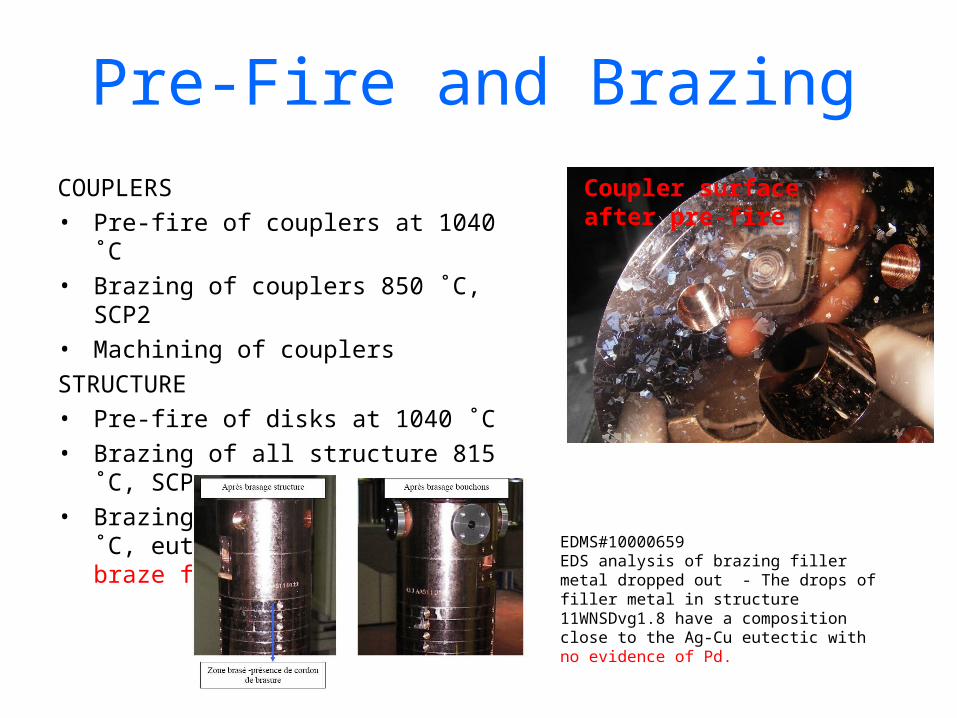
Pre-Fire and Brazing
COUPLERS
• Pre-fire of couplers at 1040 ˚C
• Brazing of couplers 850 ˚C, SCP2
• Machining of couplers
STRUCTURE
• Pre-fire of disks at 1040 ˚C
• Brazing of all structure 815 ˚C, SCP1
• Brazing of cooling circuit 790 ˚C, eutectic AgCu – spots of braze filler material
Coupler surface after pre-fire
EDMS#10000659EDS analysis of brazing filler metal dropped out - The drops of filler metal in structure 11WNSDvg1.8 have a composition close to the Ag-Cu eutectic with no evidence of Pd.
RF Check and Tank Installation • RF check and tuning in building 112 clean room
• Problem occurred in the clean room: oxidation of the structure (all the parts made of annealed copper which were lying in the lab had blue or purple spots and those which were not annealed preserved their Cu color)
• Baking 650 ˚C for ½ day
– Witness piece analyzed (EDMS#1009001) –
• Before baking: traces of Cl and S
• After baking: traces of S (traces of Cl disappeared)
• Installation in the tank to verify part compatibility (EDMS#1003726)
• Shipment to SLAC (all parts under N2) – cover design incompatible with transport loads
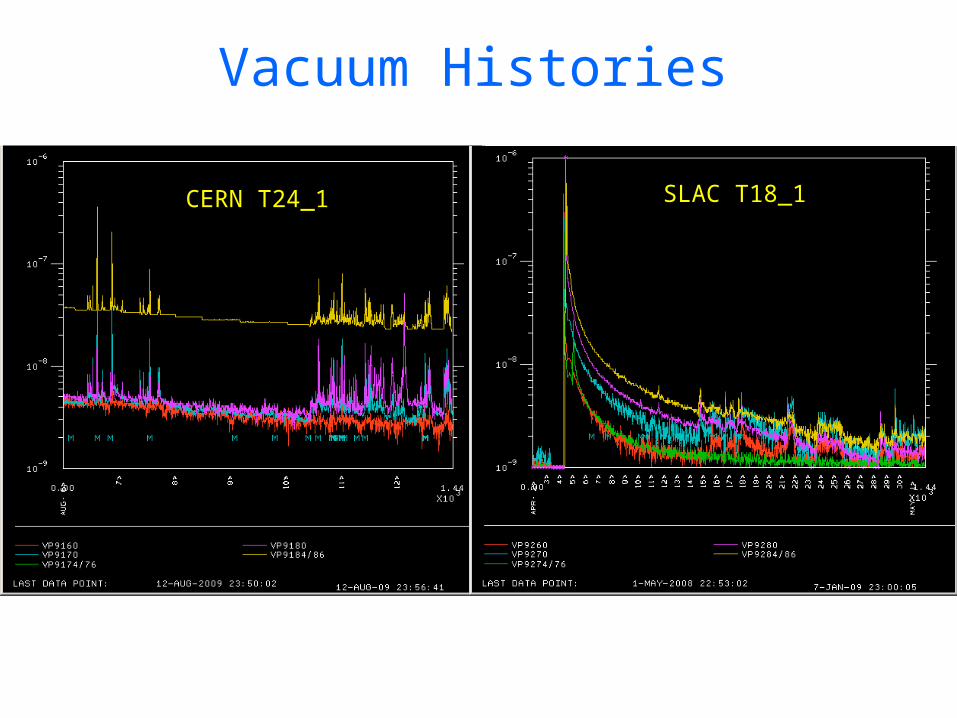
Vacuum Histories
SLAC T18_1CERN T24_1
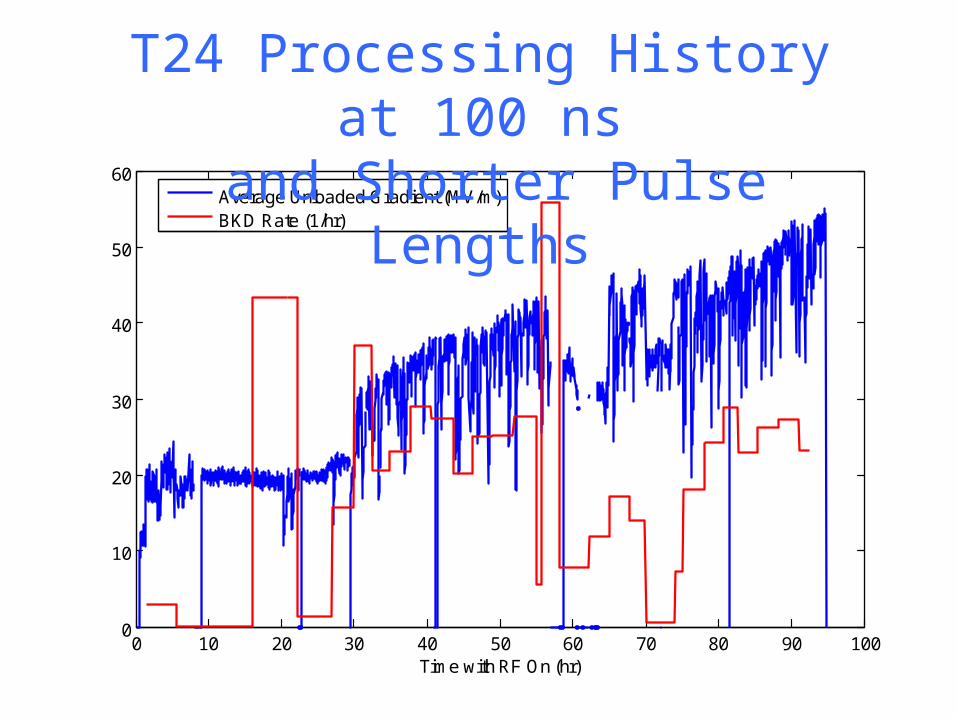
0 10 20 30 40 50 60 70 80 90 1000
10
20
30
40
50
60
Time with RF On (hr)
Average Unloaded Gradient (MV/m)BKD Rate (1/hr)
T24 Processing History at 100 ns and Shorter Pulse Lengths
0.2
0.4
0.6
0.8
30
210
60
240
90
270
120
300
150
330
180 0
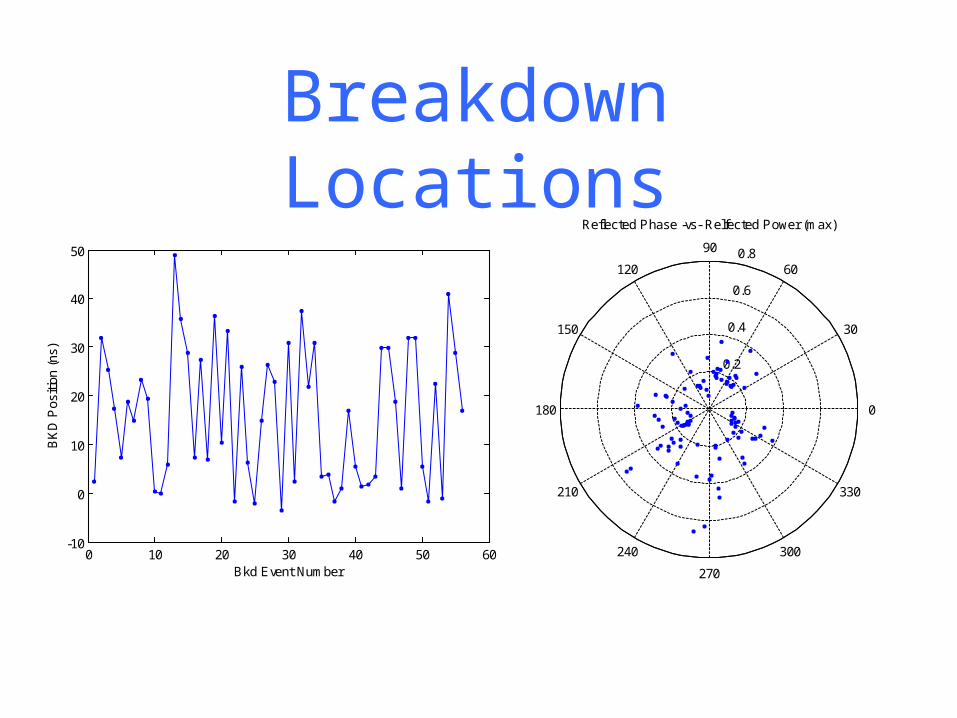
Reflected Phase -vs- Relfected Power (max)
0 10 20 30 40 50 60-10
0
10
20
30
40
50
Bkd Event Number
BK
D P
ositi
on (
ns)
Breakdown Locations
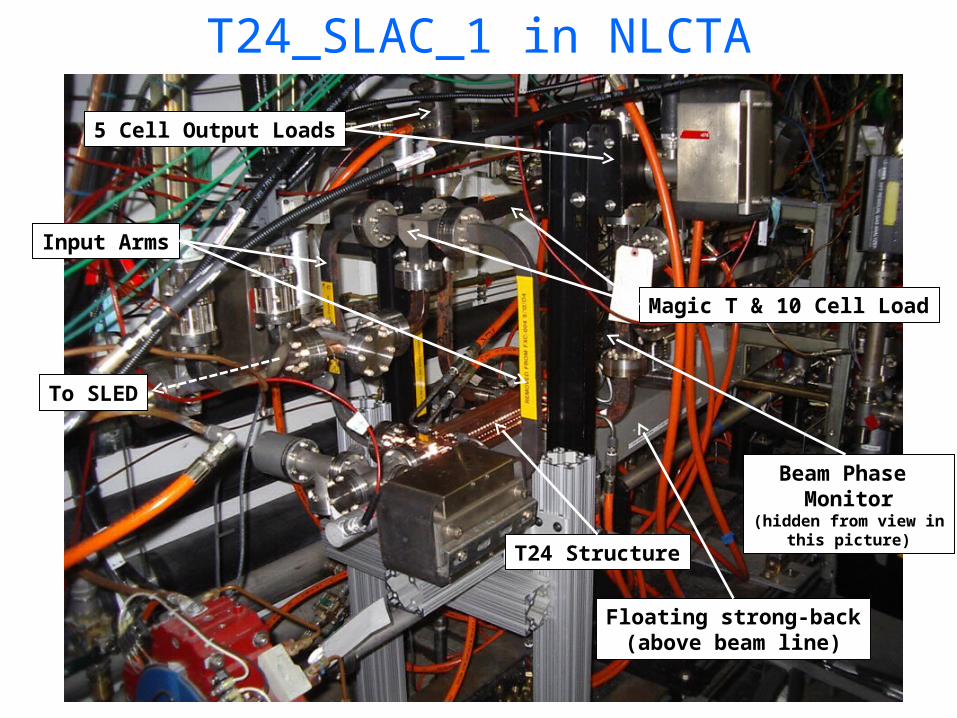
T24_SLAC_1 in NLCTA
T24 Structure
To SLED
Input Arms
5 Cell Output Loads
Magic T & 10 Cell Load
Floating strong-back(above beam line)
Beam Phase Monitor
(hidden from view inthis picture)
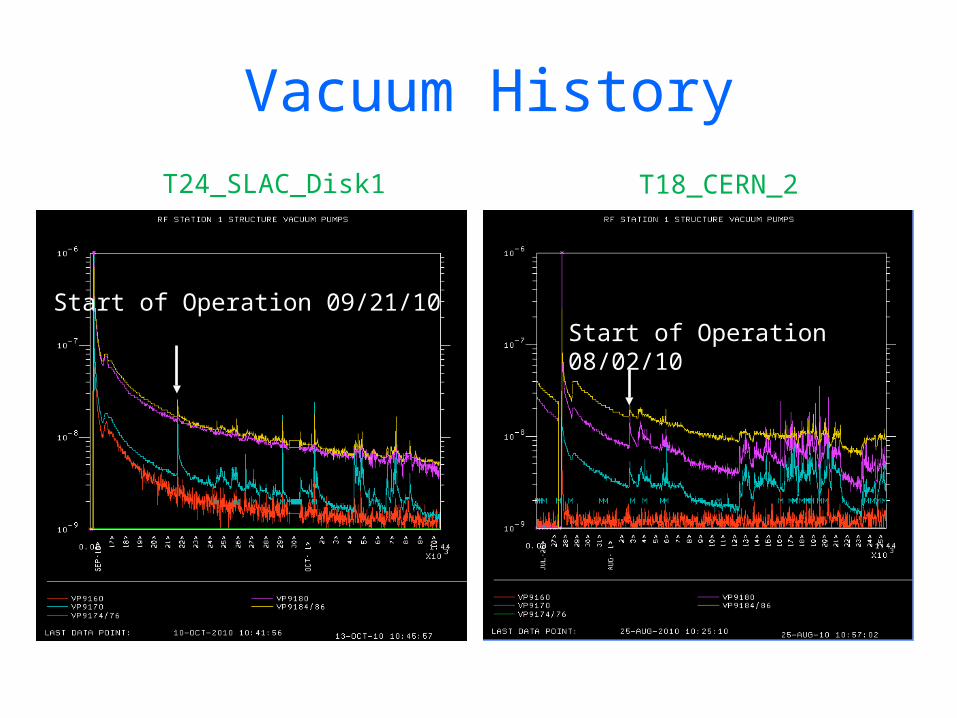
Start of Operation 09/21/10
Vacuum History
Start of Operation 08/02/10
T18_CERN_2T24_SLAC_Disk1
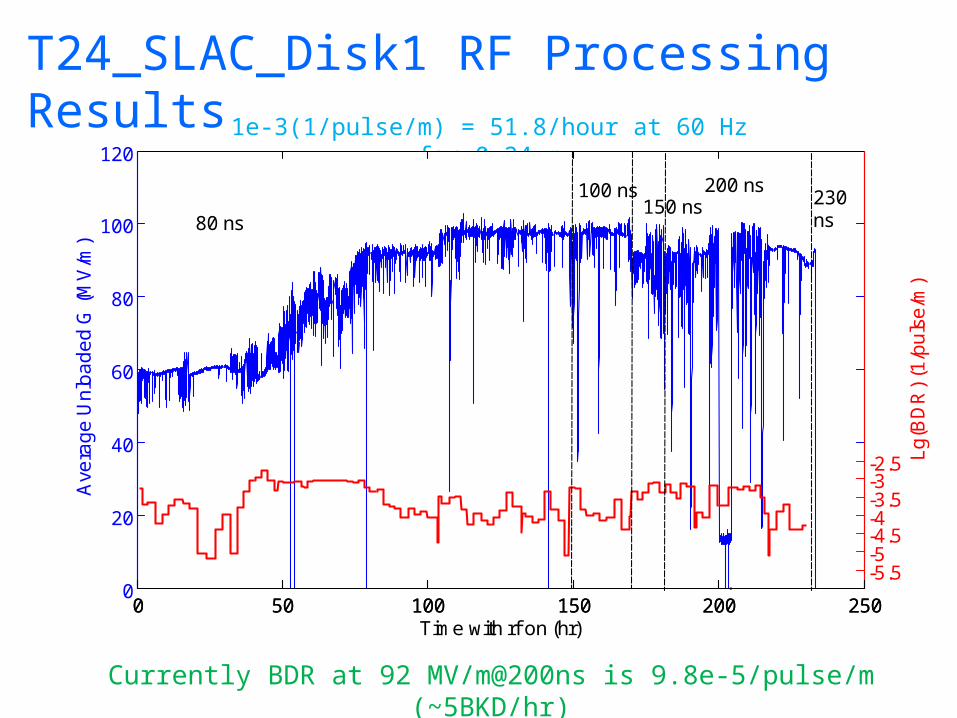
T24_SLAC_Disk1 RF Processing Results1e-3(1/pulse/m) = 51.8/hour at 60 Hz for 0.24 m
Currently BDR at 92 MV/m@200ns is 9.8e-5/pulse/m (~5BKD/hr)
0 50 100 150 200 2500
20
40
60
80
100
120
Ave
rag
e U
nlo
ad
ed
G (
MV
/m)
0 50 100 150 200 250
-5.5-5-4.5-4-3.5-3-2.5 L
g(B
DR
) (1
/pu
lse
/m)
Time with rf on (hr)
80 ns
100 ns150 ns
200 ns230ns
-150 -100 -50 0 50 100 150
0
10
20
30
40
50
60
Reflected Phase: Deg
Fill
ing
time
for
diff
eren
t ce
ll: n
s
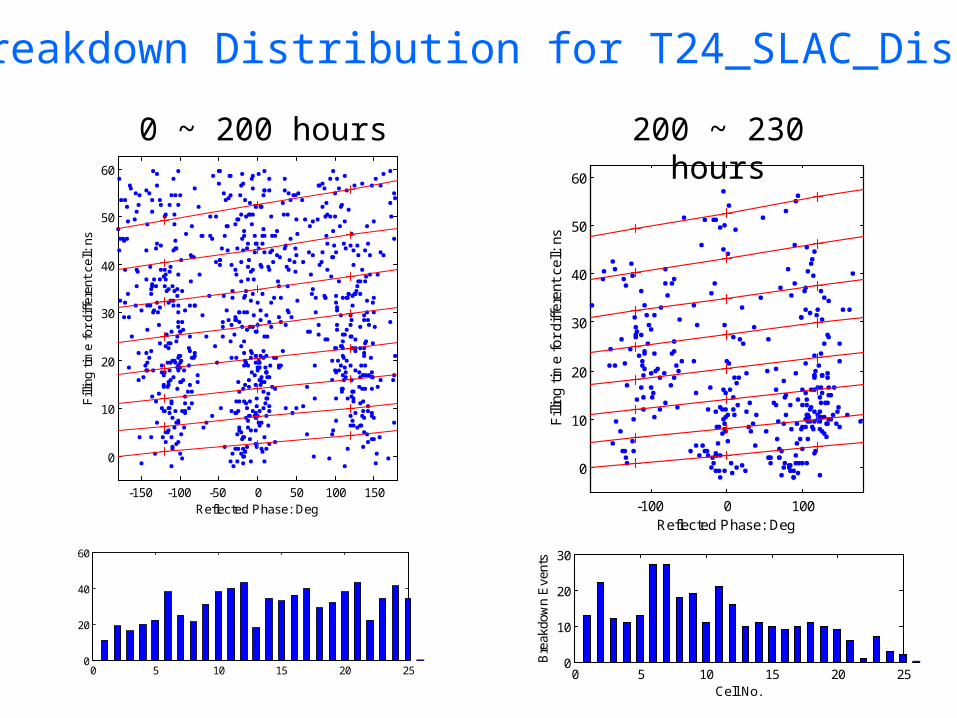
Breakdown Distribution for T24_SLAC_Disk1
0 5 10 15 20 250
20
40
60
0 5 10 15 20 250
10
20
30
Cell No.
Bre
akdo
wn
Eve
nts
-100 0 100
0
10
20
30
40
50
60
Reflected Phase: Deg
Fill
ing
time
for
diff
eren
t ce
ll: n
s
0 ~ 200 hours 200 ~ 230 hours
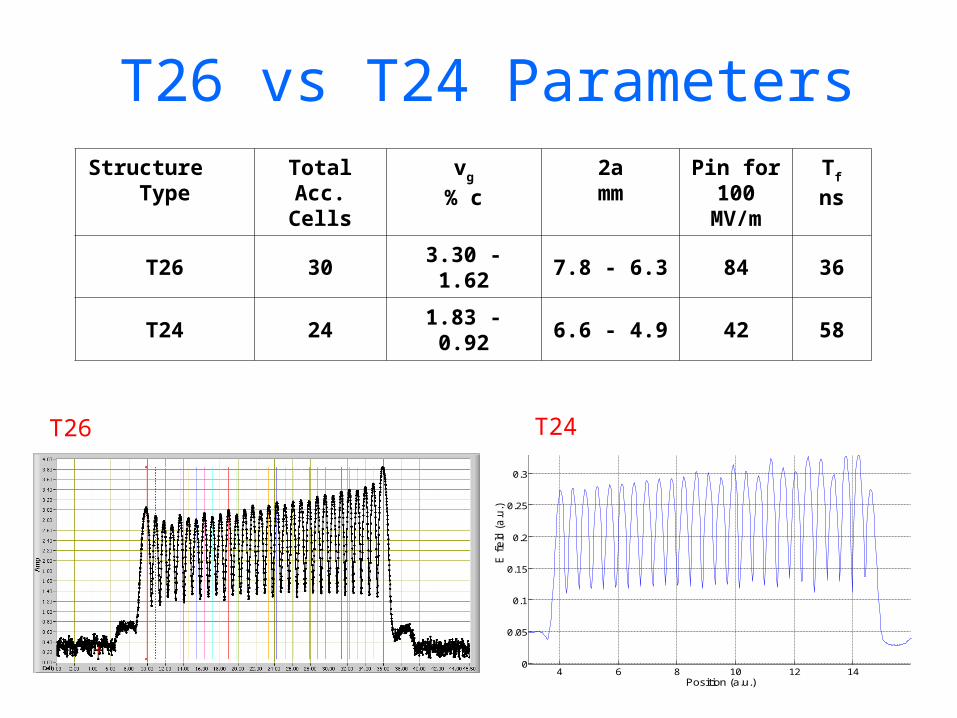
T26 vs T24 ParametersStructure
TypeTotalAcc.Cells
vg
% c
2amm
Pin for 100
MV/m
Tf
ns
T26 30 3.30 - 1.62 7.8 - 6.3 84 36
T24 24 1.83 - 0.92 6.6 - 4.9 42 58
4 6 8 10 12 140
0.05
0.1
0.15
0.2
0.25
0.3
0.35
Position (a.u.)
E fie
ld (
a.u
.)
11.427 GHz FROM INPUT
T26 T24
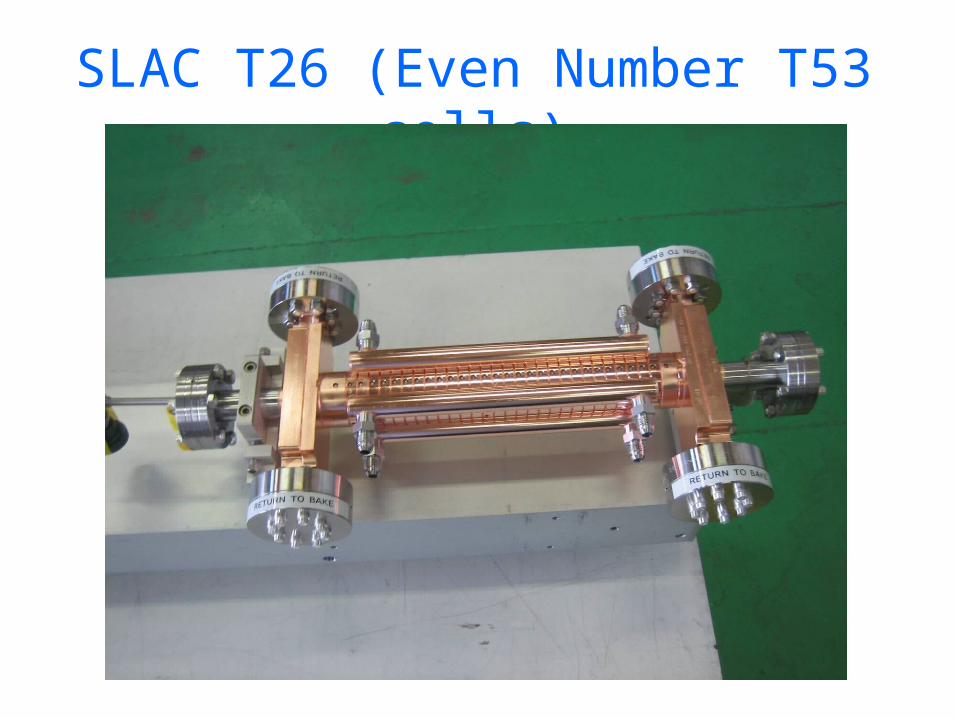
SLAC T26 (Even Number T53 cells)
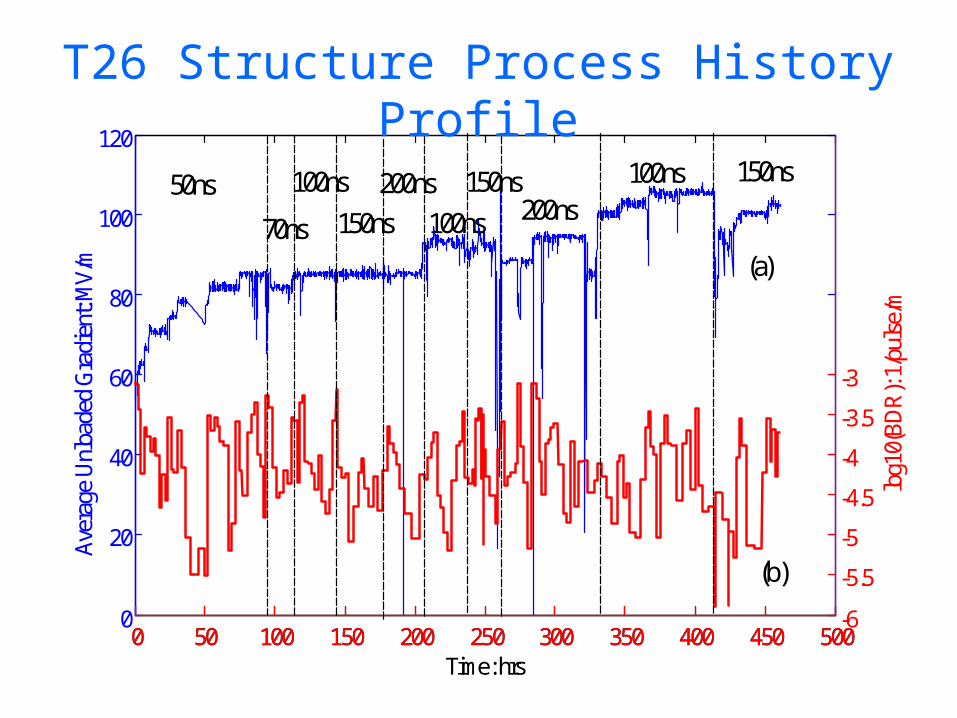
0 50 100 150 200 250 300 350 400 450 5000
20
40
60
80
100
120
Time: hrs
Ave
rage
Unl
oade
d G
radi
ent:
MV
/m
0 50 100 150 200 250 300 350 400 450 500-6
-5.5
-5
-4.5
-4
-3.5
-3
log1
0(B
DR
): 1/
puls
e/m
50ns
70ns
100ns
150ns
200ns 150ns
100ns 200ns100ns 150ns
(a)
(b)
T26 Structure Process History Profile
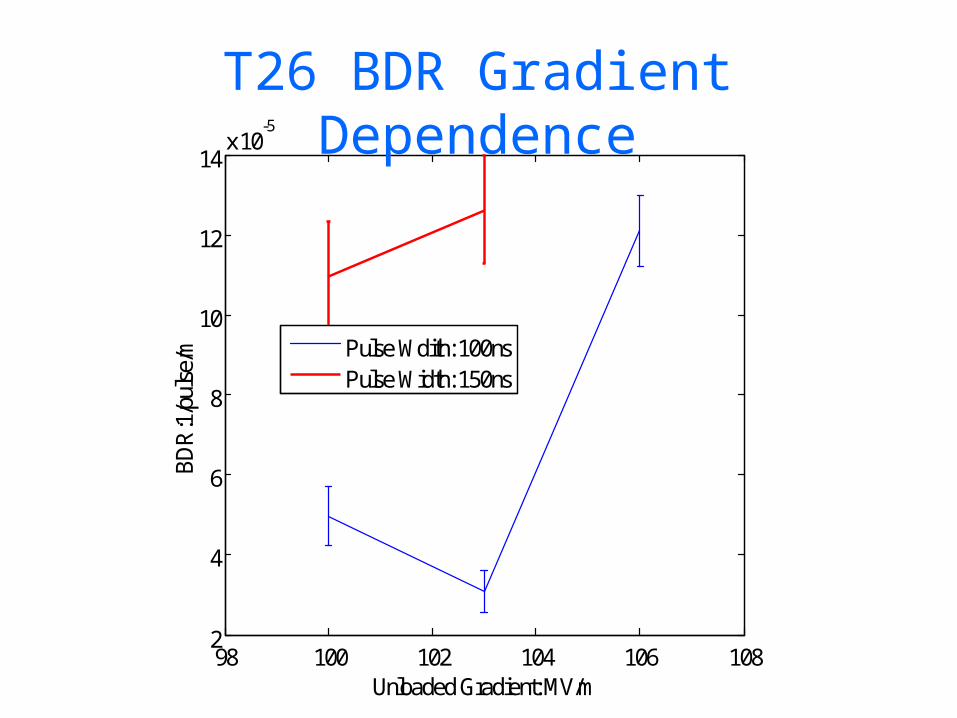
98 100 102 104 106 1082
4
6
8
10
12
14x 10
-5
Unloaded Gradient: MV/m
BD
R:1
/pul
se/m
Pulse Wdith: 100nsPulse Width: 150ns
T26 BDR Gradient Dependence
0 10 200
2
4
6
8
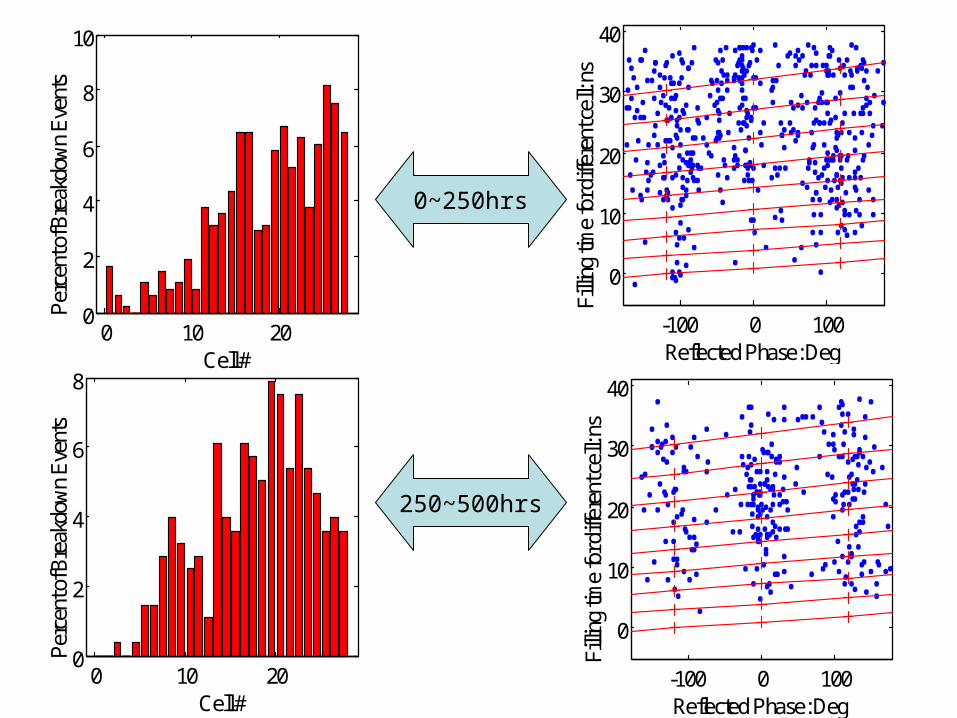
Cell #
Per
cent
of B
reak
dow
n E
vent
s
-100 0 100
0
10
20
30
40
Reflected Phase: Deg
Filli
ng ti
me
for d
iffer
ent c
ell:
ns
0 10 200
2
4
6
8
10
Cell #
Per
cent
of B
reak
dow
n E
vent
s
-100 0 100
0
10
20
30
40
Reflected Phase: Deg
Filli
ng ti
me
for d
iffer
ent c
ell:
ns
0~250hrs
250~500hrs
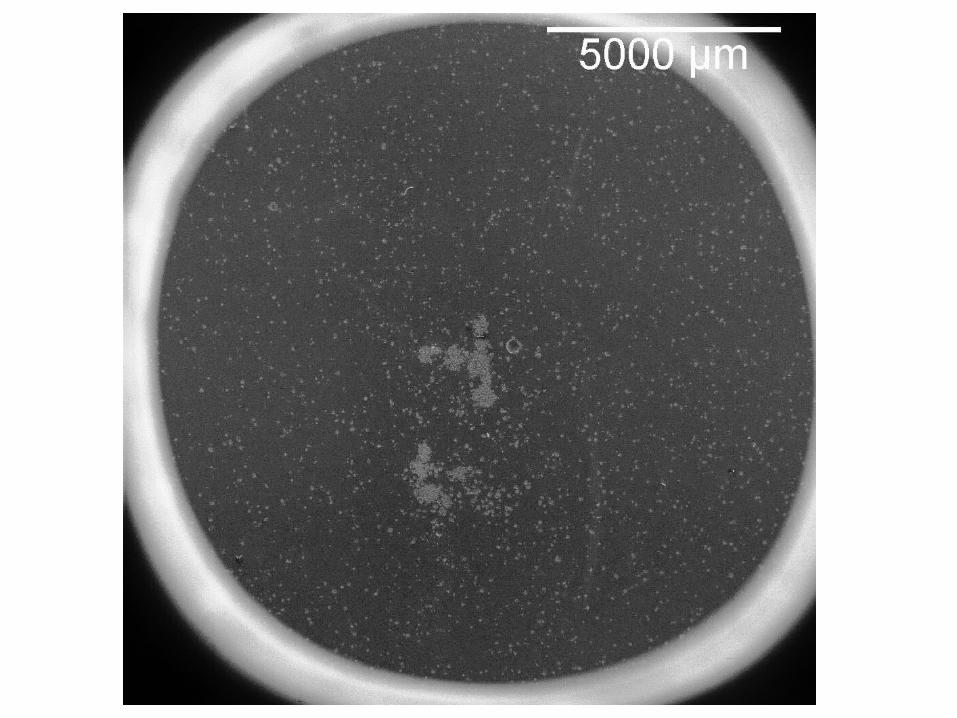
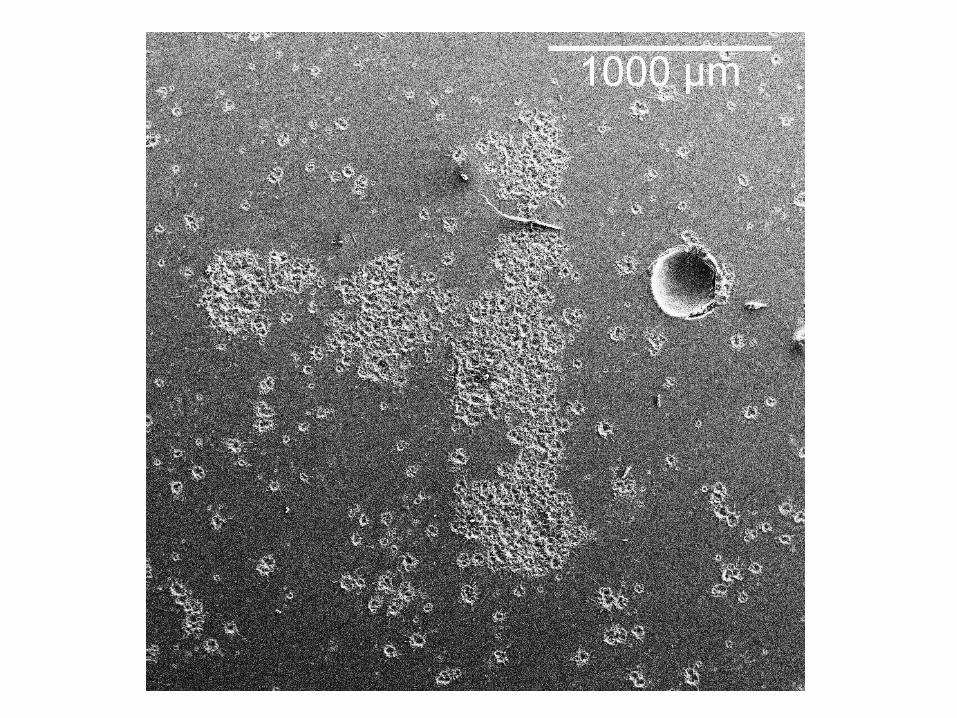
NLCTA S-Band Gun Cathode
Ran at 105 MV/m without interlocks (~ 1 us fill)
Recently removed since dark current become too large
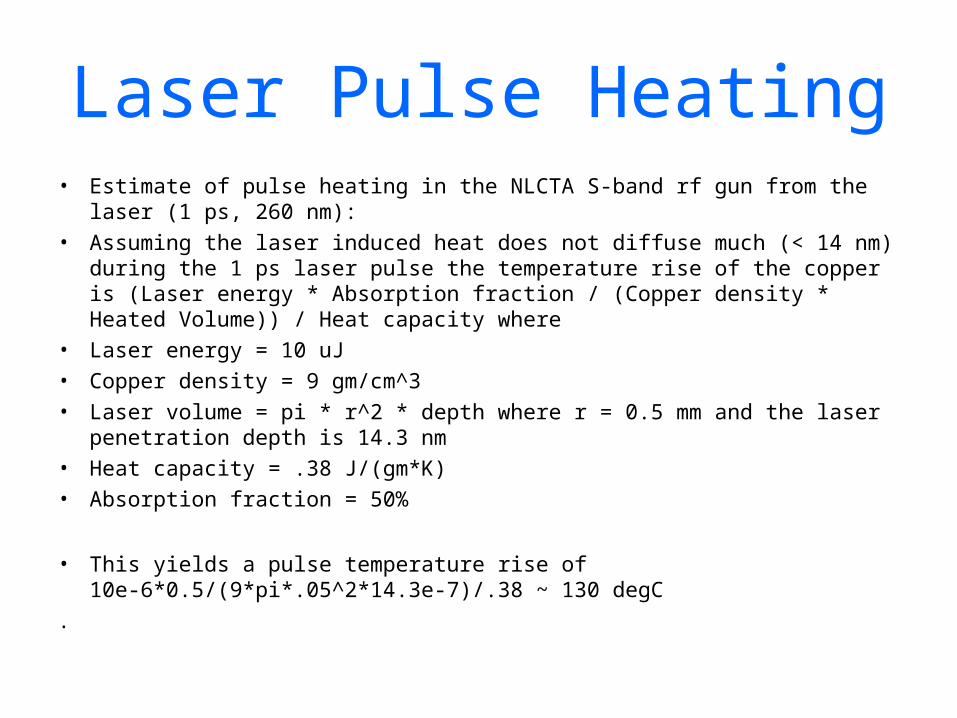
Laser Pulse Heating• Estimate of pulse heating in the NLCTA S-band rf gun from the laser (1 ps, 260
nm):• Assuming the laser induced heat does not diffuse much (< 14 nm) during the 1
ps laser pulse the temperature rise of the copper is (Laser energy * Absorption fraction / (Copper density * Heated Volume)) / Heat capacity where
• Laser energy = 10 uJ• Copper density = 9 gm/cm^3• Laser volume = pi * r^2 * depth where r = 0.5 mm and the laser penetration
depth is 14.3 nm • Heat capacity = .38 J/(gm*K)• Absorption fraction = 50%
• This yields a pulse temperature rise of 10e-6*0.5/(9*pi*.05^2*14.3e-7)/.38 ~ 130 degC
.
Laser Ablation• As shown in a paper at the url below on short pulse (0.5 ps), 248 nm
laser ablation of metals, they find it starts to occur (i.e. > 1 nm
removal per pulse) at a laser fluence of about 100 mJ/cm^2 versus
~ 1 mJ/cm^2 for the NLCTA gun.
• They assume the threshold of ablation is when the evaporation
enthalpy at 298 degK is exceeded, which is about 50 kJ/cm^3 for
copper - using the above copper heat capacity and density, this
would be equivalent to a 14e3 degK temperature rise, and is thus
consistent with the above computed temperature rise of 130 degC
with 1/100 of the laser fluence.
• http://www.springerlink.com/content/p6t732u61452t6t7/fulltext.pdf
Summary• Second CERN-built T18 did much better than the first, but has
breakdown rate over two orders of magnitude larger than the
SLAC/KEK built T18’s for the same operation parameters and
processing time
• The CERN-built T24 preformed poorly and the SLAC/KEK version is
doing OK after 230 hours of processing
• Based on earlier T26 results, would expect better performance of the
T24 thus far.
• Lasers pulses used for photocathodes can raise surface temperature
above 100 degC. However, the pulses are only about 1 ps long, and
the heat quickly dissipates. Nonetheless, cathode breakdowns
appear clustered in the area exposed to the laser.