report from the data center - amazon s3 · greater than $3,333 per month ... katrina and the 2010...
TRANSCRIPT
D A T A C E N T E R R E S E A R C H . O R G
An uneven recovery
I n the nearly ten years since Hurricane Katrina struck the Gulf Coast, causing the levees to fail and devastating the New Orleans economy, the region1 has recovered nearly all of its peak pre-Hurricane Katrina jobs and shows signs of continuing economic strength.2 Entrepreneurial activity has grown faster than the national average3 and an influx of young professionals has helped
reverse the decades-long brain drain, sparking a sense of optimism and evoking a narrative of resilience.4
Despite New Orleans’ economic resurgence, many workers are stuck in low-wage jobs. The income gap has widened, with New Orleans ranking second in income inequality among 300 U.S. cities,5 and poverty remains entrenched. More than one out of every three chil-dren in New Orleans lives in poverty even though the majority of children in the city have at least one parent in the workforce.6
The issues of income inequality and working poverty are of increasing concern nationwide. Indeed, they formed the backdrop for Pres-ident Obama’s 2015 State of the Union address.7 Moreover, working poverty is not just an economic issue — it is a resilience issue as well. Low-income households struggle to bounce back from disasters and economic shocks, more so than those who are economically
The New Orleans Index at Ten
Persistent Low Wages in New Orleans’ Economic Resurgence: Policies for
Improving Earnings for the Working PoorMarla Nelson, University of New Orleans
Laura Wolf-Powers, City University of New York
Jessica Fisch, Georgia Institute of Technology
Source: U.S. Census Longitudinal Employer-Household Dynamics (LEHD) Origin
Destination Employment Statistics.
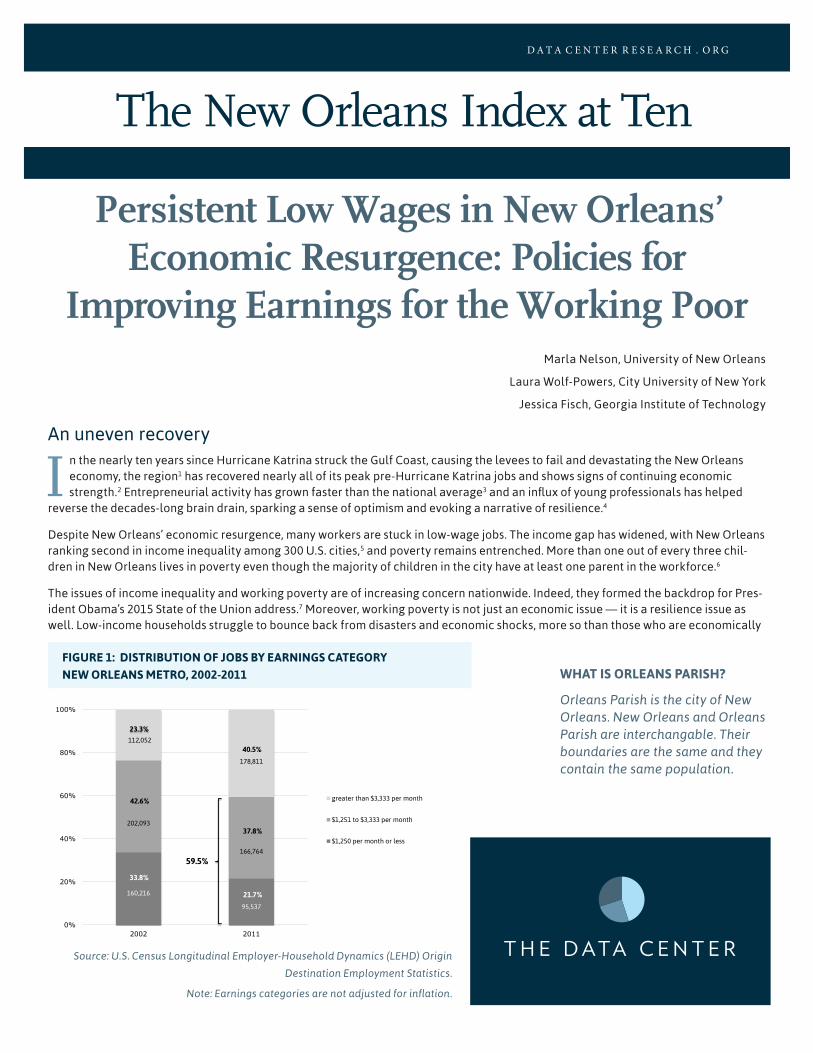
FIGURE 1: DISTRIBUTION OF JOBS BY EARNINGS CATEGORY
NEW ORLEANS METRO, 2002-2011 WHAT IS ORLEANS PARISH?
Orleans Parish is the city of New Orleans. New Orleans and Orleans Parish are interchangable. Their boundaries are the same and they contain the same population.
160,216
95,537
202,093
166,764
112,052
178,811
0%
20%
40%
60%
80%
100%
2002 2011
greater than $3,333 per month
$1,251 to $3,333 per month
$1,250 per month or less
42.6%
37.8%
33.8%
21.7%
40.5%
23.3%
59.5%
Note: Earnings categories are not adjusted for inflation.

D A T A C E N T E R R E S E A R C H . O R G2 | August 2015
comfortable.8 Thus a community’s capacity to be resilient after a disaster is hindered if large segments of the population are work-ing poor.9 Connecting the working poor to opportunities that move them into the middle class can ultimately increase the resilience capacity of the region. This is a priority in Southeast Louisiana given the multiple shocks the region has experienced since 2005.10 This essay sheds light on the lingering issues of low-wage work and working poverty in New Orleans’ recovery, highlights promising work-force initiatives in the region, and points to key policy recommendations that can increase opportunity and resiliency regionwide.
The prevalence of low-wage work and concentration of working poverty The federal poverty rate is widely considered inadequate for measuring economic hardship in today’s economy.11 Scholars from the Mas-sachussets Institute of Technology have calculated the wage levels necessary for a family to cover basic expenses, taking into account the cost of living that varies from region to region. Our analysis applies this definition to a new data set from the U.S. Census Bureau that provides detailed insights into workers—where they live, where they work, and how much they earn—to assess the extent to which New Orleans workers earn sufficient wages to provide for their families and be resilient. We also examine where the working poor live and work in New Orleans, and recommend geographically targeted measures that provide greater connectivity to opportunity and prosperity.
Specifically, our analysis relies on the U.S. Census Bureau’s Longitudinal Employer-Household Dynamics (LEHD) data set, which divides jobs into three earnings categories: $1,250 per month or less, $1,251–$3,333 per month, and greater than $3,333 per month. The wage lev-el needed to cover basic expenses for a househeld consisting of one adult and one child in each of the seven parishes in the New Orleans region exceeds $3,333 per month.12 Thus, we consider all primary jobs paying less than $3,333 per month to be “low-wage.”13
PREVALENCE AND LOCATION OF LOW-WAGE JOBS, 2002-2011
From 2002 to 2011, the New Orleans metro experienced significant earnings upgrades (Figure 1).14 In 2002, less than a quarter of all primary jobs paid more than $3,333 per month, compared to 41 percent in 2011. Jobs in the highest earning category grew in absolute and percentage terms as the number of jobs in the first two categories declined. While part of this upgrading is due to inflation,15 it also reflects the growth in knowledge-based industries in the metropolitan region.16 Yet despite the gains in high-wage jobs, nearly 60 percent of all primary jobs in the region failed to pay a self-sufficiency wage in 2011.
Low wage jobs are relatively evenly distributed across the region’s major job centers. In 2002, Jefferson Parish had the largest number of low-wage jobs, followed closely by Orleans Parish (Table 1). However, by 2011 the number of low-wage jobs in Jefferson Parish had jumped far ahead of Orleans Parish, largely due to more significant job losses in Orleans post-Katrina. Over this same period, St. Tam-many experienced an increase in low-wage jobs in both absolute and percentage terms.
TABLE 1: LOW-WAGE JOBS BY PARISH, 2002-2011
PARISH 2002 2011
# % OF TOTAL # % OF TOTAL
Jefferson 145,222 40.1% 108,139 41.2%
Orleans 141,701 39.1% 84,314 32.1%
St. Tammany 38,099 10.5% 42,698 16.3%
St. Charles 11,530 3.2% 9,994 3.8%
St. Bernard 9,586 2.6% 5,329 2.0%
Plaquemines 8,300 2.3% 4,916 1.9%
St. John 7,871 2.2% 6,911 2.6%
Metro Total 362,309 100.0% 262,301 100.0%
Source: U.S. Census Longitudinal Employer-Household Dynamics (LEHD) Origin Destination Employment Statistics.

D A T A C E N T E R R E S E A R C H . O R G3 | August 2015
COMMUTING PATTERNS OF LOW-EARNING WORKERS
Studies suggest that workers are traveling longer distances to their jobs and spend more time commuting than ever.17 Our findings indi-cate that a substantial share of low-earning workers commute outside of their parish to work, and that the share is increasing (Table 2). Nearly half (48 percent) of metro New Orleans’ low-earning workers commuted outside of their home parish for work in 2011, up from 44 percent in 2002, with the incidence of out-commuting increasing in six of the seven parishes. While high levels of out-commuting are to be expected in parishes where workers outnumber jobs — such as St. John, St. Tammany, and St. Bernard — low-wage earners in Jef-ferson and Orleans also exhibit high and increasing levels of out-commuting, despite considerable concentrations of low-wage jobs in their home parishes. Meanwhile, in St. Tammany Parish the percentage of low-earning out-commuters held steady between 2002 and 2011 even as the number of low-earning residents grew, yet in Plaquemines Parish, which had endured the full brunt of both Hurricane Katrina and the 2010 Deepwater Horizon oil spill, the share of out-commuters jumped from 49 percent to 72 percent as the number of low-earning residents grew. Moreover, while high-earning workers in the metro area were more likely than low-earners to out-com-mute in both 2002 and 2011, the gap in out-commuting between the groups narrowed over the study period. In 2011, low-earners in all of the parishes except Orleans and Plaquemines were more likely than their high-earning counterparts to commute outside their home parish to work. These trends could reflect escalating real estate prices in parts of the most job-dense parishes; workers who once lived closer to their employment may have had to move in order to find affordable places to live.
Low-wage labor flows for the two largest regional job centers also indicate considerable cross-commuting of low-earning workers (Figure 2). This includes a surprising proportion of low-earning workers who commute into Orleans and Jefferson parishes from outside the metro area and a sizable number of workers from both Orleans and Jefferson whose jobs lie outside the metro. In Jefferson Parish, which has the largest net inflow of low-wage workers (about 54,000), 37 percent commute from Orleans parish, but an almost equal proportion, 36 percent, commutes from outside New Orleans metro boundaries. Similarly, of the 44,000 low-earning workers that com-mute into Orleans, more than half are from Jefferson Parish, but another 23 percent are from outside the region. Further, 26 percent of low-earning out-commuters from Jefferson and 23 percent from New Orleans leave the metro area for work. This suggests a low-wage labor market that extends well beyond the seven-parish area.
TABLE 2: OUT-COMMUTING BY PARISH, NEW ORLEANS METRO 2002-2011
PARISH OF RESIDENCE
2002 % OUT-COMMUTERS 2011 % OUT-COMMUTERS
LOW-EARNING WORKERS
HIGH-EARNING WORKERS
LOW-EARNING WORKERS
HIGH-EARNING WORKERS
Jefferson 42.4% 42.4% 44.0% 43.1%
Orleans 38.2% 51.1% 43.6% 49.5%
St. Tammany 44.2% 81.3% 43.6% 79.3%
St. John 69.4% 69.8% 76.9% 58.5%
St. Charles 63.9% 62.5% 72.8% 69.2%
St. Bernard 73.5% 73.5% 77.0% 76.5%
Plaquemines 49.3% 53.2% 71.9% 71.5%
Metro Total 44.4% 54.8% 48.3% 53.9%
Source: U.S. Census Longitudinal Employer-Household Dynamics (LEHD) Origin Destination Employment Statistics.

D A T A C E N T E R R E S E A R C H . O R G4 | August 2015
SPATIAL CONCENTRATION OF NEW ORLEANS’ WORKING POOR
Many scholars have raised alarms about the effects of concentrated poverty.18 In the context of growing concern about working poverty, we highlight the spatial concentration of the working poor and recommend the development of place-based policies that can connect these workers to greater opportunities. Building on the success with which public health planners and practitioners have used the metaphor of a “food desert” to place hunger and food security at the center of debates on nutrition policy, we employ the concept of a “wage desert,” developed by Wolf-Powers and colleagues to draw policy attention to the geographic concentration of working poverty.19
Wage deserts are census tracts in which at least 80 percent of all earners in primary jobs are earning less than $3,333 per month (equiv-alent to $39,996 per year) and areas of greater wage sufficiency as census tracts in which 50 percent or fewer of employed workers earn less than $3,333 per month). We focus our analysis on Orleans Parish, where working poverty is highly concentrated. Forty of the metro region’s 44 wage desert tracts are located in Orleans Parish. The remaining four are located in Jefferson.There are no wage deserts in the other five parishes.
Figure 3 displays the percentages of low-wage workers in Orleans Parish census tracts, as well as the locations of wage desert and wage sufficiency tracts.
Table 3 displays characteristics of wage deserts tracts compared with tracts of greater wage sufficiency and all tracts in Orleans Parish. These are characteristics of workers living in Orleans, although their jobs may be located in other parishes. Of workers living in wage deserts, approximately 83 percent earned below the self-sufficiency wage in 2011.
Wage desert tracts differed significantly in racial composition compared to wage sufficiency tracts and all tracts in Orleans Parish, suggesting a strong correlation between race and earnings. Approximately 83 percent of workers in wage deserts identified as black or African American (compared to 12 percent in wage sufficiency tracts); approximately 15 percent identified as white (compared to 84 percent in wage sufficiency tracts); and just over 1 percent identified as Asian (compared to 3 percent in wage sufficiency tracts). Wage sufficiency tracts in Orleans Parish also had slightly higher proportions of workers identifying as Hispanic or Latino.
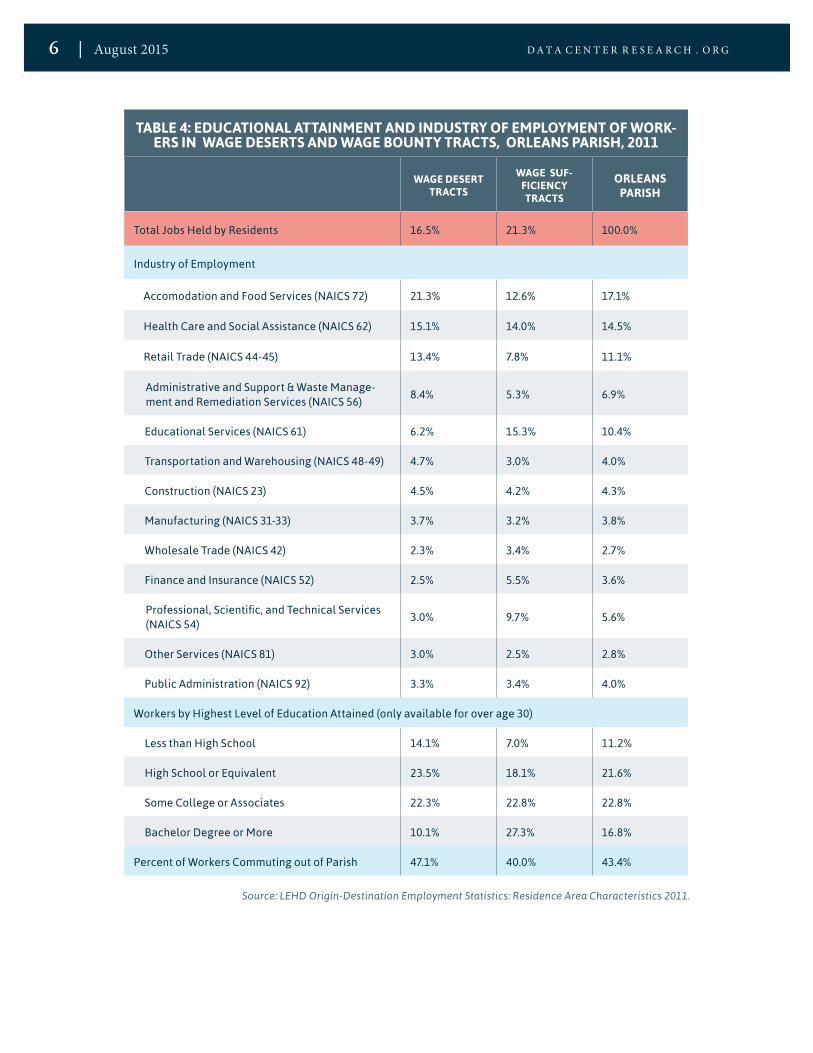
Workers living in wage deserts were primarily employed in accomodation and food services, health care and social assistance, retail trade, and administrative and support, and waste management and remediation services (Table 4). Workers living in all tracts, were more likely to be employed in educational services; professional, scientific, and technical services; and finance and insurance com-pared to wage desert workers. Workers residing in wage sufficiency areas were overrepresented in educational services; professional, scientific, and technical services; and finance and insurance.20
FIGURE 2: LOW WAGE LABOR FLOWS FOR REGIONAL JOB CENTERS, 2011
Source: U.S. Census Longitudinal Employer-Household Dynamics (LEHD) Origin Destination
Employment Statistics.
31,586
42,813
43,378
53,679
54,460
40,936
in-commuters37% from Orleans36% from outside metro27% from elsewhere in metro
in-commuters55% from Jefferson23% from outside metro22% from elsewhere in metro
out-commuters63% work in Jefferson23% work outside metro14% work elsewhere in metro
live and work in parish
live and work in parish
Jefferson Parish108,139 low-wage jobs
Orleans Parish84,314 low-wage jobs
out-commuters56% work in Orleans26% work outside metro18% work elsewhere in metro

D A T A C E N T E R R E S E A R C H . O R G5 | August 2015
Wage desert workers had fewer years of education than workers overall. Of workers living in wage desert tracts, approximately 38 per-cent had completed only a high school degree or less.21 Workers in tracts with greater wage sufficiency and workers overall were more likely to have attained a bachelors degree or higher, and were less likely not to have completed high school.
Workers living in wage deserts were more likely than their wage sufficiency counterparts or workers citywide to work outside of Orleans Parish. Nearly half of wage desert workers commuted out of parish, compared to 40 percent of workers from wage sufficiency tracts and 43 percent of all workers. Wage desert workers in Orleans Parish commuted mainly into Jefferson Parish, with some travel-ing to jobs in St. Bernard, St. Charles, and Plaquemines parishes, or outside of the metro region (Figure 4).
Improving the earnings prospects of low-wage workers In the last decade, policymakers and planners concerned with attracting, and retaining businesses in the New Orleans region have in-creasingly articulated the need to build a skilled workforce. They have also called for a redesign of the workforce development system to meet this challenge. One in five adults in Louisiana does not have a high school diploma.22 In the New Orleans region, where an estimated 27 percent of the working-age population is low-skilled and low-literacy, there is a growing gap between the skills required by new knowl-edge-based jobs and the skills of the region’s workers.23 Updating the skills and education of the workforce is crucial to meet the needs of current and future industries and enable local workers to secure jobs that pay sufficient wages and offer opportunities for advancement.
TABLE 3: SELECTED CHARACTERISTICS OF WAGE DESERTS AND WAGE BOUNTY TRACTS IN ORLEANS PARISH, 2011
WAGE DESERT TRACTS
WAGE SUF-FICIENCY TRACTS
ORLEANS PARISH
Total Jobs Held by Residents 16.5% 19.1% 100.0%
Jobs By Earnings
$15,000 or less per year 31.6% 15.4% 24.0%
$15,001- $39,996 per year 51.3% 27.2% 41.6%
$39,996 or greater per year 17.0% 57.3% 34.4%
"Low Wage"- Below $39,996 per year 83.0% 42.7% 65.6%
Workers by Race
White Alone 14.7% 83.5% 41.7%
Black or African American Alone 82.7% 12.4% 54.3%
Asian Alone 1.3% 2.8% 2.7%
American Indian or Alaskan Native Alone 0.3% 0.2% 0.3%
Native Hawaiian or Pacific Islander 0.1% 0.1% 0.1%
Two or More Races 0.8% 0.9% 0.9%
Workers by Ethnicity
Not Hispanic or Latino 96.1% 94.9% 95.6%
Hispanic or Latino 3.9% 5.1% 4.4%
Source: LEHD Origin-Destination Employment Statistics: Residence Area Characteristics 2011.
D A T A C E N T E R R E S E A R C H . O R G6 | August 2015
TABLE 4: EDUCATIONAL ATTAINMENT AND INDUSTRY OF EMPLOYMENT OF WORK-ERS IN WAGE DESERTS AND WAGE BOUNTY TRACTS, ORLEANS PARISH, 2011
WAGE DESERT TRACTS
WAGE SUF-FICIENCY TRACTS
ORLEANS PARISH
Total Jobs Held by Residents 16.5% 21.3% 100.0%
Industry of Employment
Accomodation and Food Services (NAICS 72) 21.3% 12.6% 17.1%
Health Care and Social Assistance (NAICS 62) 15.1% 14.0% 14.5%
Retail Trade (NAICS 44-45) 13.4% 7.8% 11.1%
Administrative and Support & Waste Manage-ment and Remediation Services (NAICS 56)
8.4% 5.3% 6.9%
Educational Services (NAICS 61) 6.2% 15.3% 10.4%
Transportation and Warehousing (NAICS 48-49) 4.7% 3.0% 4.0%
Construction (NAICS 23) 4.5% 4.2% 4.3%
Manufacturing (NAICS 31-33) 3.7% 3.2% 3.8%
Wholesale Trade (NAICS 42) 2.3% 3.4% 2.7%
Finance and Insurance (NAICS 52) 2.5% 5.5% 3.6%
Professional, Scientific, and Technical Services (NAICS 54)
3.0% 9.7% 5.6%
Other Services (NAICS 81) 3.0% 2.5% 2.8%
Public Administration (NAICS 92) 3.3% 3.4% 4.0%
Workers by Highest Level of Education Attained (only available for over age 30)
Less than High School 14.1% 7.0% 11.2%
High School or Equivalent 23.5% 18.1% 21.6%
Some College or Associates 22.3% 22.8% 22.8%
Bachelor Degree or More 10.1% 27.3% 16.8%
Percent of Workers Commuting out of Parish 47.1% 40.0% 43.4%
Source: LEHD Origin-Destination Employment Statistics: Residence Area Characteristics 2011.

D A T A C E N T E R R E S E A R C H . O R G7 | August 2015
This dilemma is not unique to New Orleans. Many U.S. cities facing high unemployment and poverty rates also see low educational attain-ment relative to labor market demand for educated workers.24 Best practices for confronting poverty, economic inequality, and fiscal distress in these places are still being debated and developed by scholars and policymakers. In this section we discuss three types of policies to help working people move toward economic self-sufficiency, examine the progress the New Orleans region has made in these areas since Hur-ricane Katrina, and identify areas of future action, including the potential for place-based policies to target wage desert communities with training and interventions for the working poor.
SECTORAL APPROACHES TO CLOSE THE SKILLS GAP AND CREATE CAREER PATHWAYS
A first set of proposed policies would transform workforce development efforts for low-skilled individuals by focusing those efforts more intently on training organized around industry-recognized certifications in specific sectors.25 Funding for federal so-called “second chance” workforce programs (the chief resource for adults who have emerged from secondary school without the skills they need to obtain and main-tain work) has declined over time. The bulk of federal employment and training funds is now spent to match unemployed people to jobs, as opposed to helping them develop skills. A “work first” approach has come to dominate policy for the vast majority of individuals left behind by the K-12 education system.26 Research suggests, however, that in order to engender economic mobility (as opposed to mere labor market attachment), workforce programs must rely on strong and direct ties with employers, engage in intensive case management services for par-ticipants who require them, and integrate basic literacy and numeracy with workplace skills. Programs with these features are often known as sectoral initiatives and target occupations in which an industry-recognized credential, such as a practical nursing license or a computer technology competency certification is widely accepted by employers in growth industries.27 Sector programs often feature contextualized learning, internships with potential future employers during training, and active programming for former participants who wish to continue their education or obtain additional credentials.28 Many are run through community colleges.29
In 2008, Louisiana adopted legislation (LA HB 1104) to redesign the workforce system to: integrate workforce development programs from across the state into a single demand-driven system under the Louisiana Workforce Commission (LWC), target funding for worker training in high-demand sectors, and strengthen the role of community and technical colleges in workforce development. Within the redesigned sys-tem, state and regional economic development organizations (EDOs) have achieved greater alignment in the sectors or clusters they target and some—including Greater New Orleans, Inc. and the New Orleans Business Alliance—have taken on the important role of engaging key workforce stakeholders and forging partnerships among investors, industry leaders, employers, and service providers.
A number of promising sector initiatives to close the skills gap and create career pathways have also emerged. To better align adult educa-tion and workforce development, the state shifted adult basic education from the responsibility of the Board of Elementary and Secondary Education to the Louisiana Community and Technical College System (LCTCS) in 2010. LCTCS, working with a host of workforce partners, has established a Work Ready U, a program that combines traditional literacy and GED attainment with worker readiness and technical training. Through the program, adult learners simultaneously obtain a high school equivalency diploma and an industry-recognized postsecond-ary certificate or degree. The Louisiana Department of Education also recently initiated Jump Start, a partnership between high schools, community colleges, and industry leaders to enable students to work toward selected industry credentials while pursuing their high school diplomas.
While pathways programs show promise in increasing workers’ opportunity for earnings gains and advancement, finding stable funding to sustain and expand them remains a challenge. Funding is insufficient to meet the region’s overwhelming workforce development needs.30 To facilitate upward mobility, limited workforce resources should target high-demand occupations that pay sufficient wages while promoting skill attainment and industry-recognized credentialing.
INCREASE JOB CREATION AND JOB QUALITY STANDARDS IN ECONOMIC DEVELOPMENT SUBSIDY PROGRAMS
A second set of proposals centers on the reform of state and local economic development policy. Detractors of traditional economic de-velopment incentives claim that such incentives are inefficient because any increases in demand for local labor or increases in wages that result from these policies will quickly be cancelled out by in-migration and by rising prices.31 Some scholars have countered, however, that traditional economic development incentives can lead to positive employment and earnings gains for local residents, especially in commu-nities that have high unemployment.32 Advocates have thus sought policies that explicitly offer subsidies to firms as an incentive to hire more workers.33 Several studies in the state of North Carolina—where job creation requirements are negotiated in conjunction with economic development incentives, and where these requirements are strictly enforced on pain of subsidy forfeiture offer evidence that employers do create jobs as part of shrewdly crafted incentive agreements, particularly when the incentives are provided to firms in industries receiving targeted strategic and policy support.34
Many subsidy programs run by Louisiana Economic Development have job creation or quality standards, but these standards need to be strengthened to improve outcomes for low-earning workers. LED’s Quality Jobs Program, for instance, provides a cash rebate to companies that provide well-paying jobs. However, the minimum wage requirement for a new direct job is $14.50 in wages and health care benefits, which is well below the hourly self-sufficiency wage of $22.67 in the New Orleans region. Meanwhile, Louisiana’s FastStart program, which

D A T A C E N T E R R E S E A R C H . O R G8 | August 2015
Fig
ure
3:
Wag
e D
eser
t an
d W
age
Bou
nty
Cen
sus
Trac
ts,
Orl
ean
s P
aris
h,
20
11
Ü 01.
53
4.5
60.
75M
iles
Sour
ce: L
EHD
Orig
in-D
estin
atio
n E
mpl
oym
ent S
tatis
tics,
201
1, R
esid
ence
Are
a C
hara
cter
istic
s
Pro
por
tion
of
Wo
rker
s Ea
rnin
g B
elow
a S
elf-
Su
ffic
ien
cy
Wag
e (<
$3
9,9
96
per
yea
r)
30 -
39.
9%
40 -
49.
9%
50 -
59.
9%
60 -
69.
9%
70 -
79.
9%
80 -
89.
9%
Wag
e D
eser
t Tr
acts
Wag
e Suf
ficie
ncy
Trac
ts
Pari
sh B
ound
arie
s

D A T A C E N T E R R E S E A R C H . O R G9 | August 2015
Jeff
erso
n
St.
Ber
nar
d
Pla
qu
emin
es
St.
Ch
arle
sO
rlea
nsSt.
Tam
man
y
St.
Jo
hn
the
Bap
tist
Fig
ure
4:
Pla
ce o
f W
ork
(D
esti
nat
ion
s) o
f O
rlea
ns
Par
ish
Res
iden
tsO
rig
inat
ing
in W
age
Des
ert
Cen
sus
Trac
tsLo
uisi
ana
Empl
oym
ent
Onl
y*
Ü
05
1015
202.
5M
iles
Sou
rce:
LEH
D O
rigi
n-D
estina
tion
Em
ploy
men
t S
tatist
ics,
201
1, O
rigi
n D
estin
atio
n (O
D)
Orl
ean
s P
aris
h W
age
Des
ert
Trac
ts (
40
)To
tal E
arne
rs:
18,6
54
Wor
king
in O
rlea
ns P
aris
h: 9
,858
In S
urro
undi
ng P
aris
hes:
8,7
81
Wor
king
in L
A:
18,6
39
*Tra
cts
with
< 2
0 jo
bs o
mitt
ed.
Orl
eans
Par
ish
Wag
e D
eser
t Tr
acts
Pari
sh B
ound
arie
s
Loui
sian
a Cen
susT
ract
s
Emp
loym
ent
by
Trac
tJo
bs H
eld
by W
age
Des
ert
Ori
gina
tors
20 -
49
50 -
99
100
- 14
9
150
- 24
9
250
- 44
9
450
- 30
44

D A T A C E N T E R R E S E A R C H . O R G1 0 | August 2015
provides free employee recruitment, screening, training development, and training delivery for new or expanding companies, has no wage requirements. Self-sufficiency wage requirements would maximize the effectiveness of subsidy programs and ensure that the jobs created provide for workers’ basic needs.
Finally economic development officials should actively tie location subsidies to employer commitments to create on-the-job learning and career advancement opportunities for their incumbent low-skilled workers.35 Private firms currently offer very little training to low-level em-ployees, limiting their opportunities for advancement.36 Advocates recommend that state and local governments offer tax abatements and financial incentives to employers that offer in-house training or tuition reimbursement to low-skilled workers. State and local governments can also encourage businesses receiving other kinds of incentives and abatements to cooperate actively with local workforce development agencies or community colleges to build or expand career ladder initiatives.
”RAISE THE FLOOR” STRATEGIES
A third type of intervention encompasses policies and regulations that raise the wage floor and ensure that work effort is fairly and legally compensated. President Obama’s announcement during the 2013 State of the Union Address of a proposal to raise the federal minimum wage to $10.10 an hour has been endorsed by dozens of economists and economic policymakers. Numerous states have increased their minimum wage above the $7.25 federal level, and several cities—notably Seattle, Los Angeles, and San Francisco—have enacted local mini-mums as high as $15 per hour.37
While the push for better wages has gained momentum statewide and in New Orleans,38 prospects for a citywide minimum are unlikely. In 2002, New Orleans residents supported a ballot initiative to increase the minimum wage within the city above the federal minimum but the Louisiana Supreme Court overturned it, upholding an earlier law barring cities from imposing their own minimums. Louisiana’s legislature could act on its own to raise the statewide minimum wage. State legislators could also improve low-wage jobs by mandating paid sick leave, by passing laws that step up enforcement and penalties for employers who pay workers below the minimum, or, as described below, by mak-ing changes to the so-called “tipped wage.”
A wage issue of particular importance to New Orleans, with its large share of workers in the restaurant and hospitality industries, is that of the “tipped” or “sub-minimum” wage paid to tipped workers in hotels, restaurants, and other personal service industries such as nail salons. An act now before Congress, would reconnect the tipped minimum wage back to the regular minimum wage by requiring the former be equal to 70 percent of the latter.39 Additionally, legal advocacy around wage theft—which was widespread in the wake of Hurricane Katrina and remains an issue in New Orleans, especially in the hospitality sector—is mounting. A number of states, counties, and cities have passed laws making it easier for workers to report unpaid or underpaid work, and easier for departments of labor to investigate it. While wage enforcement and regulation is sometimes seen as controversial, it is an important tool available to public officials who want to promote workers’ economic self-sufficiency and help them reduce their dependence on government benefits such as food stamps and Medicaid.
THE POTENTIAL OF PLACE-BASED POLICIES TO ADDRESS WORKING POVERTY
In urban policy and planning, there is a persistent tension between interventions directed at individuals and those designed to transform places: municipalities, neighborhoods, or sites.40 Low-wage work and the concentration of working poverty affect individuals, yet place-based policies can also play an important role in alleviating working poverty and improving outcomes for low-earning workers.41 Recogniz-ing this potential, some workforce practitioners and policymakers have called for the creation of federal place-based initiatives (similar to the Choice Neighborhoods program) to better coordinate adult basic education, workforce development, and community economic devel-opment activities in low-income communities.42 Through such initiatives, local officials and policymakers hope to reach out to low-earning, unemployed, and discouraged workers to increase awareness about high-growth jobs that pay family-sustaining wages and the training necessary to obtain them.43
Place-based initiatives can also help reduce the cost burden of commuting for the working poor and increase access to employment. As our findings indicated, nearly half of low-earning workers commute outside of their home parish for work, with many commuting from long distances within and outside the metro area. Policies to expand public transportation routes, lengthen service hours, and expand transpor-tation options between areas with high concentrations of low-earning workers and the employment centers in which they work can help workers connect more reliably and efficiently to their jobs. Reliable, affordable job access will likely become increasingly important for both employees and employers in Southeast Louisiana, where major growth in well-paying jobs is expected to occur outside of major population centers.44 Finally, policymakers and planners can target neighborhoods with high proportions of low-earning workers as priorities for inter-ventions that increase awareness of medical, childcare, and housing subsidies; food stamps; and the Earned Income Tax Credit.45

D A T A C E N T E R R E S E A R C H . O R G1 1 | August 2015
A call for supportTo help low-earning workers secure high-quality jobs and achieve economic mobility, second chance workforce programs focused around industry-recognized certifications in high-growth sectors are needed. Since Hurricane Katrina, a number of promising sector initiatives have emerged to address the skills gap and create career pathways for low-earning workers in the New Orleans region. Yet greater support at the federal and state levels is needed for sector initiatives and the support services that enable underemployed and unemployed workers to obtain jobs that pay self-sufficiency wages.
While sector-based training initiatives are essential, we cannot train our way out of the current situation, given the abundance of low-wage jobs in the regional economy. To alleviate working poverty and improve conditions for low-earning workers, a broader range of workforce initiatives is needed. Sector-based training initiatives must be coupled with: stronger job creation and quality standards in the state’s economic development subsidy programs; policies and regulations to raise wages and ensure that work is fairly and legally remunerated; and support for safety net programs that boost incomes for the working poor. Through spatial analyses such as this one, policymakers and local officials can target interventions to neighborhoods with high concentrations of low-earning, unemployed, and discouraged workers. Clearly, the task of improving outcomes for low-earning workers is complex and will require significant invest-ment. But if leaders make these investments, job openings in high-growth occupations can be filled by local residents, and more New Orleaneans will be able to participate in the region’s post-Katrina economic recovery, alleviating entrenched problems of poverty and economic inequality.

D A T A C E N T E R R E S E A R C H . O R G1 2 | August 2015
Endnotes 1. We define the New Orleans metropolitan region as consisting of the following seven parishes: Jefferson, Orleans, Plaquemines, St. Bernard, St. Charles, St. John, and St.
Tammany.
2. Liu, A. (2015) Amy Liu Extols New Orleans’ Resilience 10 Years After Hurricane Katrina. Brookings Institution. Retrieved from http://www.brookings.edu/research/pod-casts/2015/07/amy-liu-extols-new-orleans-resilience-ten-years-hurricane-katrina
3. Plyer, A., Shrinath, N., & Mack, V. (2015). The New Orleans Index at Ten: Measuring Greater New Orleans’ Progress Toward Prosperity. New Orleans, LA: The Data Center. Retrieved from: http://www.datacenterresearch.org/reports_analysis/new-orleans-index-at-ten/
4. Ehrenfeucht, R., & Nelson, M. (2013). Young professionals as ambivalent change agents in New Orleans after the 2005 hurricanes. Urban Studies 50(4): 825-84.
5. Bloomberg. (2014). Most income inequality: U.S. cities. Retrieved from http://www.bloomberg.com/visual-data/best-and-worst//most-income-inequality-us-cities
6. Mack , V. (2015). New Orleans kids, working parents, and poverty. New Orleans, LA: The Data Center. Retrieved from: http://www.datacenterresearch.org/reports_analysis/new-orleans-kids-working-parents-and-poverty/
7. Remarks by the President in State of the Union Address. (2015). Retrieved from https://www.whitehouse.gov/the-press-office/2015/01/20/remarks-presi-dent-state-union-address-january-20-2015.
8. Mutter, J. (2005). The earth sciences, human well-being, and the reduction of global poverty, Eos, 86(16), 157–165.
9. Liu, A., Anglin, R., Mizelle, R., & Plyer, A. (Eds.). (2011). Resilience and opportunity: Lessons from the U.S. Gulf Coast after Katrina and Rita. Washington, DC: Brookings Institution Press.
10. Since 2005 the region has experienced destruction from not only Hurricane Katrina, but also Hurricane Gustav in 2008, the Deepwater Horizon oil spill in 2010, and Hurricane Isaac in 2012.
11. Ruggles, P. (1990). Drawing the line. Washington, DC: Urban Institute Press.
12. We utilized the MIT Living Wage Calculator to determine the living wage level for the New Orleans metro region for 2013. (Retrieved from http://livingwage.mit.edu/). The living wage is the hourly wage that full-time, year-round workers need in order to cover local living expenses. Drawing on the forthcoming work of Shearer et al. (Shearer, R., Liu, A., Holmes, N., & Ng, J. (2015) Opportunity clusters: Identifying pathways to good jobs in metro New Orleans. Washington, DC: Brookings Institution, Metropolitan Policy Program) we included an additional $0.73 per hour for mortgage savings.
13. A primary job is the highest paying job for an individual worker for the year. The use of primary jobs ensures that each worker is only counted once in their place of residence but it underestimates the total number of jobs.
14. We selected the 2002–2011 time period because 2002 is the first year for which data were available and 2011 is the most recent.
15. The income categories are not adjusted for inflation, thus inflation pushes jobs into higher earnings categories.
16. Plyer, A., Shrinath, N., & Mack, V. (2015). The New Orleans Index at Ten: Measuring Greater New Orleans’ Progress Toward Prosperity. New Orleans, LA: The Data Center. Retrieved from: http://www.datacenterresearch.org/reports_analysis/new-orleans-index-at-ten/
17. Kneebone, E. & Holmes, N. (2015). The growing distance between people and jobs in metropolitan America. Washington, DC: Brookings Institution, Metropolitan Policy Program. Roberto, E. (2008). Commuting to opportunity: The working poor and commuting in the United States. Washington, DC: Brookings Institution, Transportation Reform Series for the Metropolitan Policy Program.
18. Orfield, M. (2005). Land use and housing policies to reduce concentrated poverty and racial segregation. Fordham Urban Law Journal, 33 (877); Wilson, W. J. (1987). The truly disadvantaged: The inner city, the underclass, and public policy. University of Chicago Press. Wilson, W.J. (2013). Combating concentrated poverty in urban neighborhoods. Journal of Applied Social Science 7(2): 125–143.
19. Wolf-Powers, L, Nelson, K., Warner, J. & Kooragayala, S. (2014). “Wage deserts:” An exploration of geographically concentrated poverty in Philadelphia, PA using census LEHD data. U.S. Census Bureau 2014 Annual Partnership Workshop. U.S. Department of Commerce, Washington, DC, September 8. Retrieved from http://lehd.ces.census.gov/doc/workshop/2014/Presentations/WageDesertsPresentation-September8.pdf
20. The LEHD data set provides data on workers in 20 broad industry categories. These categories do not necessarily coincide with 2-digit NAICS code, nor more detailed industry cluster analyses.
21. Educational attainment of jobholders is only available for workers over the age of 30. This limitation potentially skews the estimates toward higher education levels.
22. Louisiana Community and Technical College System (LCTCS). (2011). Moving Adult Education Forward: A Pro Forma Business Plan. Retrieved from http://www.lctcs.edu/assets/docs/Adult%20Ed/AttachmentD.WorkReadyUProformaBusinessPlan.02.07.11.pdf
23. Sellers, S., Ortiz, E. & Plyer, A. (2013). Strengthening our workforce from within: Adult education’s role in furthering economic growth in greater New Orleans. New Or-leans, LA: The Data Center; Rothwell, J. and Berube, A. (2011). Education, demand and unemployment in metropolitan America. Washington, DC: Brookings Institute, Metropolitan Policy Program.
24. Rothwell, J. & Berube, A. (2011); Rothwell, J. (2012). Education, job openings and unemployment in metropolitan America. Washington, DC: Brookings Institute Metro-politan Policy Program.
25. See Maguire, S., Freely, J., Clymer, C., Conway, M., & Schwartz, D. (2010). Tuning in to local labor markets: Findings from the sectoral employment study. Philadelphia, PA: Public/Private Ventures; Wolf-Powers, L. & Andreason, S. (2013). Aligning secondary and post-secondary credentialization with economic development strategy, or if low educational attainment = poor metropolitan competitiveness, what can be done about it? In L. Perna and S. Wachter (Eds.), Preparing today’s students for tomorrow’s jobs in metropolitan America. Philadelphia: University of Pennsylvania Press.
26. Carnevale, A. (2010). Postsecondary education and training as we know it is not enough: Why we need to leaven postsecondary strategy with more attention to em-ployment policy, social policy, and career and technical education in high school. Paper Prepared for the Georgetown University and Urban Institute Conference on Reducing Poverty and Economic Distress after American Recovery and Reinvestment Act (ARRA) January 15, 2010.

D A T A C E N T E R R E S E A R C H . O R G1 3 | August 2015
27. Holzer, H. & Lerman, R. (2007). America’s forgotten middle-skill jobs. Washington, DC: The Workforce Alliance. See, for example Maguire et. al. (2010).
28. Chapple, K. (2006). Moving beyond the divide: Workforce development and upward mobility in information technology. Berkeley, CA: PolicyLink. Retrieved from http://www.policylink.org/sites/default/files/MOVINGBEYONDTHEDIVIDE_FINAL.PDF ; Wolf-Powers, L. (2005). Building a workforce infrastructure. In R. Hanley (Ed.), Moving people, goods and information in the 21st century: The cutting-edge infrastructures of networked cities. (245–259) London.
29. Lowe, N. J. (2007). Job creation and the knowledge economy: Lessons from North Carolina’s life science manufacturing initiative. Economic Development Quarterly, 21(4), 339–353.
30. Greater New Orleans Community Data Center (GNOCDC). (2013). Targeting quality jobs for in-demand occupations. New Orleans, LA: Report commissioned by the Regional Planning Association.
31. Fisher, P. (2007). The fiscal consequences of competition for capital. In A. Markusen (Ed.), Reining in the competition for capital. Kalamazoo, MI: W.E. Upjohn Institute for Employment Research.
32. Bartik, T. (1991). Who benefits from state and local economic development policies? Kalamazoo, MI: W.E. Upjohn Institute for Employment Research; Bartik, T. (2007). Solving the problems of economic development incentives. In A. Markusen (Ed.), Reining in the competition for capital. Kalamazoo, MI: W.E. Upjohn Institute for Em-ployment Research.
33. See Schweke, W. (2007). Do better job creation subsidies hold real promise for business incentive reformers? In A. Markusen (Ed.), Reining in the competition for capi-tal. Kalamazoo, MI: W.E. Upjohn Institute for Employment Research; Bartik, T. (2007). Solving the problems of economic development incentives. In A. Markusen (Ed.), Reining in the competition for capital. Kalamazoo, MI: W.E. Upjohn Institute for Employment Research; Neumark, D. (2011). Spurring job creation in response to severe recessions: Reconsidering hiring tax credits. Working Paper 16866. Cambridge, MA: National Bureau of Economic Research.
34. Freyer, A. (2014). Why incentive deals fail: Implications for industry targeting, policy coordination and inter-regional equity. Paper presented at ACSP Annual Meeting, Philadelphia, PA; Lester, T.W., Lowe, N.J., & Freyer, A.M. (2014). Mediating incentive use: A time-series assessment of economic development deals in North Carolina. Economic Development Quarterly 28(2): 132-146.
35. Wolf-Powers, L. & Andreason, S. (2013). Aligning secondary and post-secondary credentialization with economic development strategy, or if low educational attain-ment = poor metropolitan competitiveness, what can be done about it? In L. Perna and S. Wachter (Eds.), Preparing today’s students for tomorrow’s jobs in metropolitan America. Philadelphia: University of Pennsylvania Press.
36. Osterman, P. (2007). Employment and training policies: New directions for less skilled adults. In H.J. Holzer and D.S. Nightingale (Eds.), Reshaping the American work-force in a changing economy. Washington, DC: Urban Institute Press.
37. Researchers have speculated that the additional money circulating in local economies as a result of higher earnings has helped to prevent expected disemployment effects (Dube, A., Lester, T.W. and Reich, M. 2010. Minimum Wage Effects Across State Borders: Estimates Using Contiguous Counties. Review of Economics and Statistics 92(4): 945-964.; Schmitt, J. 2013 Why Does the Minimum Wage Have No Discernible Effect on Employment? Washington, DC: Center for Economic and Policy Research. Retrieved from http://www.cepr.net/documents/publications/min-wage-2013-02.pdf).
38. Reckdahl, K. (2015, March 16). Push for better wages driven by New Orleans area families falling short. The Advocate. Retrieved from http://theadvocate.com/news/neworleans/11828458-148/push-for-better-wages-driven
39. Allegretto, S. & Cooper, D. (2014). Twenty-three years and still waiting for change: Why it’s time to give tipped workers the minimum wage. Washington, DC: Economic Policy Institute and Center on Wage and Employment Dynamics.
40. See Crane, R. & Manville, M. (2008). People or place? Revisiting the who versus the where of urban development. Land Lines, 20(3), 2-7
41. Wolf-Powers, et al (2014).
42. U.S. Department of Education. (2015). Career pathways: Approaches for the delivery of education, training, employment and human services. Retrieved from http://lincs.ed.gov/publications/pdf/CP_RFI.pdf
43. See Shearer, R., Liu, A., Holmes, N. & Ng, J. (2015).
44. Hobor, G. & Ortiz, E. (2014, January 30). The transformative possibility of the new “energy boom” in Southeast Louisiana. New Orleans, LA: The Data Center. Retrieved fromhttp://www.datacenterresearch.org/reports_analysis/the-transformative-possibility-of-the-new-energy-boom-in-southeast-louisiana/
45. Wolf-Powers, L. (2015, April 28). Food deserts and wage deserts: The importance of metaphor in policy and activism. Metropolitics. Retrieved from http://www.metro-politiques.eu/Food-Deserts-and-Wage-Deserts-The.html

D A T A C E N T E R R E S E A R C H . O R G1 4 | August 2015
Acknowledgments from the Authors
The authors would like to thank Liza Cowan, Melissa Ehlinger, Shiva Kooragayala, Katie Nelson, Linda Pompa, Jana Sikdar, Josh Warner, and Jill Zimmerman for their data and policy insights. We would additionally like to thank Walter Brooks of the Regional Planning Com-mission, Richard Shearer of the Brookings Institution, and William Wainwright of the Northshore Technical Community College for their valuable comments on an earlier draft of this essay.
For more InformationMarla Nelson
Associate Professor
Department of Planning and Urban Studies
University of New Orleans
Laura Wolf-Powers
Research Fellow
Center for Human Environments
The Graduate Center, CUNY
Jessica Fisch
Doctoral Student
Department of City and Regional Planning
Georgia Institute of Technology

D A T A C E N T E R R E S E A R C H . O R G1 5 | August 2015
About The Data CenterThe Data Center is the most trusted resource for data about greater New Orleans and Southeast Louisiana. Since 1997, The Data Center has been an objective partner in bringing reliable, thoroughly researched data to conversations about building a prosperous, inclusive, and sustainable region.
About The New Orleans Index at Ten CollectionThe New Orleans Index at Ten collection includes contributions from The Data Center, the Brookings Institution, and more than a doz-en local scholars. The aim of this collection is to advance discussion and action among residents and leaders in greater New Orleans and maximize opportunities provided by the 10-year anniversary of Katrina.
The New Orleans Index at Ten: Measuring Greater New Orleans’ Progress toward Prosperity analyzes more than 30 indicators to track the region’s progress on economic, inclusive, and sustainable growth. Essays contributed by leading local scholars and the Brookings Institution systematically document major post-Katrina reforms, and hold up new policy opportunities. Together these reports provide New Orleanians with facts to form a common understanding of our progress and possible future.
The New Orleans Index series, developed in collaboration with the Brookings Institution, and published since shortly after Katrina, has proven to be a widely used and cited publication. The Index’s value as a regularly updated, one-stop shop of metrics made it the go-to resource for national and local media, decisionmakers across all levels of government, and leaders in the private and nonprofit sectors.
Acknowledgments from The Data CenterMany thanks go to Erin Kenzie for editorial assistance, and Southpaw Creative for design.
The Data Center wishes to thank blue moon fund, Foundation for Louisiana, Greater New Orleans Foundation, JPMorgan Chase Foun-dation, Walton Family Foundation, and Zemurray Foundation for their generous support of The New Orleans Index at Ten. Additional gratitude goes to Baptist Community Ministries, GPOA Foundation, Entergy Corp., Institute for Mental Hygiene, Methodist Health Systems Foundation, RosaMary Foundation, Patrick F. Taylor Foundation, United Way of Southeast Louisiana for their support of the ongoing work of The Data Center.
For More Information
Allison Plyer
Executive Director and Chief Demographer
The Data Center
Nihal Shrinath
Data Manager and Research Associate
The Data Center
DisclaimerThe New Orleans Index at Ten collection represents studies and reports on timely topics worthy of public consideration. The views expressed are those of the authors and should not be attributed to The Data Center, its trustees, or its funders.