report fromthe bipm electricity department activities of the electricity department • voltage...
TRANSCRIPT

Report from the BIPM Electricity Department
CCEM meeting12‐13 March 2015
2
Activities of the Electricity Department
• Voltagemetrology: international comparisons, calibrations, watt balance
• Resistancemetrology: international comparisons, calibrations, watt balance
• Capacitancemetrology: international comparisons, calibrations
• Calculable capacitor: capacitance metrology, measurement of RK for mise enpratique of the electrical units
• Coordination (CCEM, CCPR, RMO‐TCs, CIE, CPEM Exec. Com.)

3
BIPM.EM‐K10: on‐site Josephson comparisons (1.018 V and 10 V)
10 V Josephson voltage, degrees of equivalence in nV(copied from the KCDB)
PTB Oct‐2014
INM Jun‐2014
On average 2 comparisons / year
Technical expertise and improvements leading to better
results for 85% of the comparisons
Best relative results achieved: a few parts in 1011
2 comparisons already scheduled for 2015 (DMDM, NIMT)
Diff Unc. /nV
NRC Nov‐2005 NIST Mar‐2009
MSL‐ May‐2011
Draft B
Meas. Sci. Technol. 23 (2012), 124001
5 nV

4
BIPM.EM‐K11: bilateral Zener comparisons (1.018 V and 10 V)
Automated BIPM Zener measurement setup
based on a PTB – programmable Josephson
Voltage Standard
Significant increase of participation in 2014 (Serbia, Egypt, Belgium,
Ireland, Thailand)
Reasons for this success:
Preparation for an on-site comparison of JVSs
As a final training exercise for new staff
To support CMC claims and Quality Systems
Results published within 6 months
date of measurement
dU/ µ
V
BIPM BIPMNMI

5
Secondment of S. Solve at NIST (July 2012 – July 2013)
Training on the use of the NIST 10 V PJVS: hardware and software (July 2012 – Sep. 2012)
DC applications: Investigations on possible voltage errors produced at the output of 10 V PJVS ultimately checked by a direct comparison between two PJVS systems (Oct. 2012 – March 2013) ‐> Metrologia 50 (2013) 441
‐ systematic error sources investigated (biased at non‐zero currents)‐ agreement of 2.6 parts in 1011 (ur=3.4 parts in 1011)‐ dominant error source: leakage resistance to ground (up to 2 nV at 10 V)
AC applications: calibrator gain and linearity investigations using the differential sampling method for voltages up to 7 V rms and frequencies below 400 Hz. (April 2013 – May 2013)
Assembly and tests of the 10 V NIST PJVS dedicated to BIPM for future comparison of ac JVS (June 2013 – July 2013)
‐ further work planned with a secondee from an NMI
6
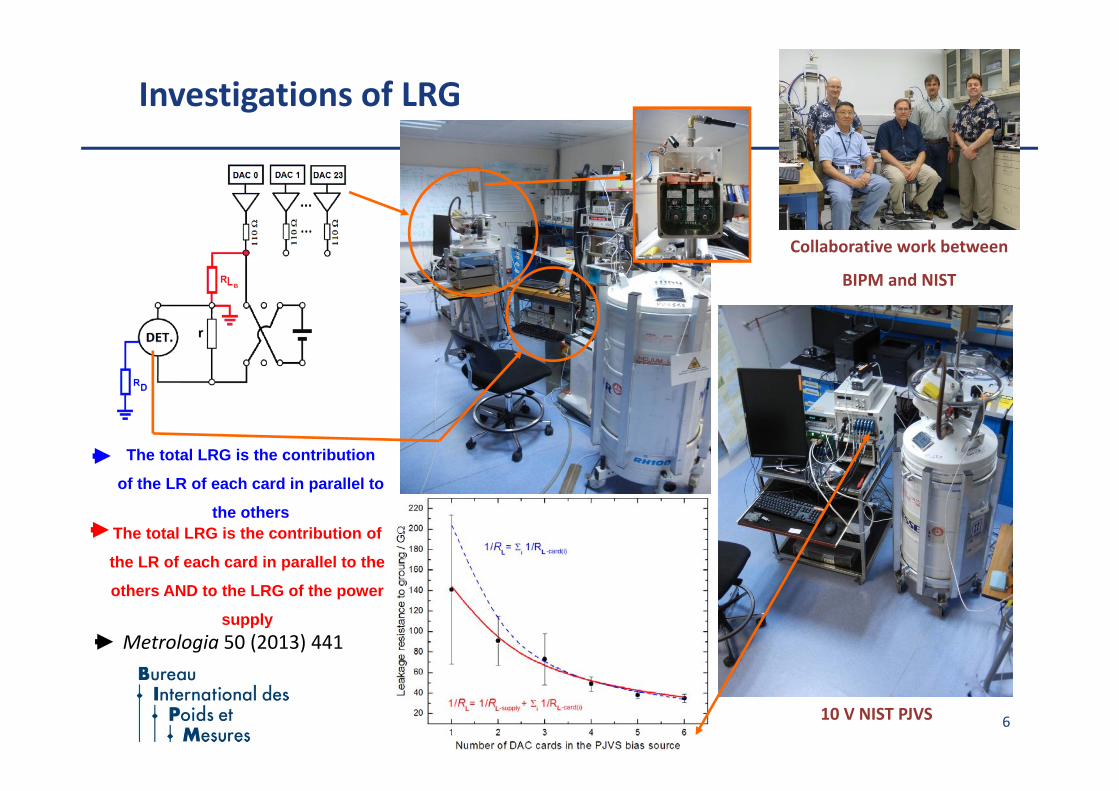
Investigations of LRG
Collaborative work between
BIPM and NIST
10 V NIST PJVS
The total LRG is the contribution
of the LR of each card in parallel to
the othersThe total LRG is the contribution of
the LR of each card in parallel to the
others AND to the LRG of the power
supplyMetrologia 50 (2013) 441

7
The simultaneous measurement mode of the BIPM Watt Balance (Force and velocity) requires 2 different Josephson Voltage
Standards: one to measure the current in the coil (J1) and one to measure the induced voltage across the coil (J2)
Installation of (J1) in the WB
lab Sep. 2014voltage of JVSremains quantized on the Shapiro step in the complex electrical environment of the watt balance
drift caused by current source
4 cm
Josephson array - NIST technology18.5 GHz,
1 bias source for 3 segments in series
Measuring the current in the coil of the watt balance: implementation of a Josephson Voltage Standard
1 kΩ
1 mA
each point includespolarity reversal
HP 34420A

8
On‐site quantum Hall resistance key comparisons(BIPM.EM‐K12)
To verify international coherence of primary resistance standards by comparing quantum Hall effect based standards of the NMIs with that of the BIPM
Five such comparisons have already been carried out in the period 1993 to 1999. This comparison has been resumed in 2013 at the request of the CCEM
A first comparison has been carried out with the PTB in Nov 2013
15 new comparisons are expected for the coming years (2015: VSL, INMETRO)
BIPM
QHR ‐ RH(2)
NMI
QHR ‐ RH(2) BIPM
100 R
BIPM
1
BIPM
10 k
K’
K
Resistance measurementsR
K 1/100 ratio measurements
PTB Nov 2013
BIPM 1 Hz bridge
NMI bridge
BIPM RT 1 Hz bridge

9
On‐site quantum Hall resistance key comparison(BIPM.EM‐K12)
Di Relative difference between the result of measurement of NMI i and that of the BIPM
10 k/100
100 /1
NMI Di (10‐9) Ui (10‐9)LNE 2.2 6.6
METAS 0.1 3.6
NPL 3.3 6.4
NIST 5.9 11.0
PTB 2013 0.7 3.8
NMI Di (10‐9) Ui (10‐9)LNE ‐3.2 8.8
METAS 0.8 5.4
NPL 2.8 9.6
NIST 3.8 6.2
PTB 2013 ‐0.8 8.0
Graph of equivalence (KCDB)
100 /RH(2) 2013(former 1995)
1999
19971993
1994

10
Additional investigations around BIPM.EM‐K12
Typical frequency dependence for 1 and 100 standard resistors
1×10⁻⁸ No well definedtrue dc value !
PTB‐BIPM comp. at 1 done for short cycle times (not “dc”)
BIPM CCC (340 s)BIPM 1 Hz bridge

11
Additional investigations around BIPM.EM‐K12
Comparison with PTB has offered the opportunity to investigate differences between currently accepted “dc” measurements and very low frequency measurements
It has been shown that this effect may be particularly important especially for low resistance values such as 1 resistors which may show unexpected frequency dependence between 1 Hz and few mHz depending on their fabrication technology
This demonstrate the importance of the choice of the 1 standard resistor for such key comparisons and of the way the “dc” resistance value is defined
Typical “dc” measurement cycle(BIPM CCC bridge)
Total cycle time = 340 s (3 mHz)
PTB bridge uses nearly rectangular signals

12
Comparisons in capacitance: EURAMET‐S31, CCEM‐K4.201X
• EURAMET EM‐S31 comparison of 10 pF and 100 pF standards for measurements traceable to a quantum Hall effect resistance standard – piloted by PTB, participation of LNE, METAS, VSL and BIPM. Circulation of standards 2010‐11.
• Original aim was to support capacitor charging single electron transport experiments –but has highlighted a wider lack of consistency in capacitance traceability.
• A supplementary circulation of ac‐dc resistors in 2013 gave excellent results and eliminated one suspected cause of errors. Other internal investigations in each lab have so far not resolved the discrepancies.
• A new circulation of standards has started end 2014, this time to include calculable capacitor traceability from NMIA. The new BIPM calculable capacitor will also contribute useful information in this period.
• The 2016‐19 work programme proposes a Key Comparison in capacitance piloted by the BIPM. The present situation indicates that this will be a valuable exercise to reaffirm confidence in capacitance traceability.

13
Calibrations
voltage: Zeners at 1.018 V, 10 V 2 per year
resistance: 1 Ω, 100 Ω, 10 k Ω 25‐30 per yearcapacitance: 1 pF, 10 pF, 100 pF 25‐30 per year
6 months ofInterruption due to air conditioning problems

14www.bipm.org
0 log 2eC l
For Δl ≈ 0.2 m, ΔC ≈ 0.4 pF
To compare C to R, we also have to chose a frequency, f
(in our case, f ≈ 1 kHz) for i = 2 plateau: R ≈ 13 kΩ
Quantum Hall effect(2‐d electron gas, B 10 tesla, T < 1 K)
Rhall = RK / i (i = 1,2,4…)RK = h / e2 25.8 kΩ
QuantumClassical
Capacitance ResistanceQuadrature bridge
C1 C2
Determining RK with a calculable capacitor
Calculable capacitor
f ≈ 1 kHz

15
The new NMIA capacitor design
‘A Calculable Standard of Capacitance’, Clothier, Thesis 1963
‘Design of a Calculable Cross‐Capacitor’, Small and Fiander, CPEM Digest 2004
‘Fabrication and Measurement of the Main Electrodes of the NMIA‐BIPM Calculable Cross Capacitors’, Small and Fiander, IEEE Trans. Instr. Meas. 2011
This instrument exists thanks to many years of dedicated work by Greig Small and John Fiander, well beyond their ‘retirement’.
4 main electrodes
mov. guardelectrode
fixed guardelectrode

16www.bipm.org
0.2 m (0.4 pF) ≈ 770 000 fringes
Servo‐control of the distance between guard electrodes
Laser source stabilized on molecular 127I2 transition : a10 component, f=563 260 223 513 kHz
1 part in 109 of L=0,2 m in terms of interferometric fringes = 0.77 mfr
/2 (≈ 0.5 aF on C)
Interferometricfringes
Errorsignal
≈ 532,245 nm

17www.bipm.org
→ Jumps between a10 line and its two adjacent lines a9 and a11 could explain instabilities of measurements
→ Laser frequency ‘a priori’ locked on the hyperfine component a10 in the transition of iodine
First set of measurements (2014)
‐0.3
‐0.2
‐0.1
0.0
0.1
0.2
0.3
0 20 40 60 80
Differen
cefrom
the meanof th
e grou
p (ppm
)
Measurement number
‐0.19 ppm
0.18 ppm
(a10 – a9) frequency error +0.22 ppm
(a11 – a10) frequency error ‐0.21 ppm
0‐200 200
(MHz)
a10a9 a11
Lack of stability of the first set of measurements obtained; but the cloud of data may be split in 3 different parts
2014

18www.bipm.org
New frequency stabilized laser source
LaserAOM
Photo‐detector
Photo‐detector
To calculable capacitor
From second stabilizedlaser source (WB)
λ/2
λ/2Double polarizingbeam splitter
I2 cell
Corner cube
Polarizingbeam splitter
Servoloop
electron
ics
Modulationfrequency
Beatfrequencyrecording
→ Previous compact laser source doesn’t offer access to all possible tuning→ Change for home made stabilized source→ Realization of a beat with a second source and recording

19www.bipm.org
‐0.3
‐0.2
‐0.1
0
0.1
0.2
0.3
0 10 20 30 40 50 60 70 80
Differen
cefrom
the meanof th
e grou
p (ppm
)
Measurement number
Comparison of a 1 pF standard to Calculable Capacitor
‐0.19 ppm
0.18 ppm
New data with the new frequency stabilized laser source
Similar to the measurements carried out with the previous laser source supposed locked on the a10 line
Remains some instabilities within ± few parts in 108
Std deviation: 0.021 ppmMin‐Max interval: ±0.033 ppm
New stabilized laser source is operational since few weeks only start a new set of measurements

20www.bipm.org
Preliminary uncertainty budget – part 1: bridge
Component u /10−9
Bridge divider ratio 0.5
Loading of divider 0.1
In‐phase balance injection 1.5
Phase error of quadrature injection 2
Detector noise and offset 1
Effectiveness of current equalisers 0.5
Cable corrections 0.1
Type A (repeatability) 2
3.4
Component u /10−9
In‐phase balance injection 0.1
Phase error of quadrature injection 0.2
Detector noise and offset 0.1
Effectiveness of current equalisers 0.1
Value of guard potential 0.3
Voltage drift during calibration 0.2
Voltage dependence of IVD 0.1
Type A (repeatability) 0.1
0.5
Bridge uncertainty budget for 1541 Hz, 250 V (100 V on 1 pF)Estimated relative standard uncertainties in parts in 109
Divider calibration Bridge to 1 pF
21www.bipm.org
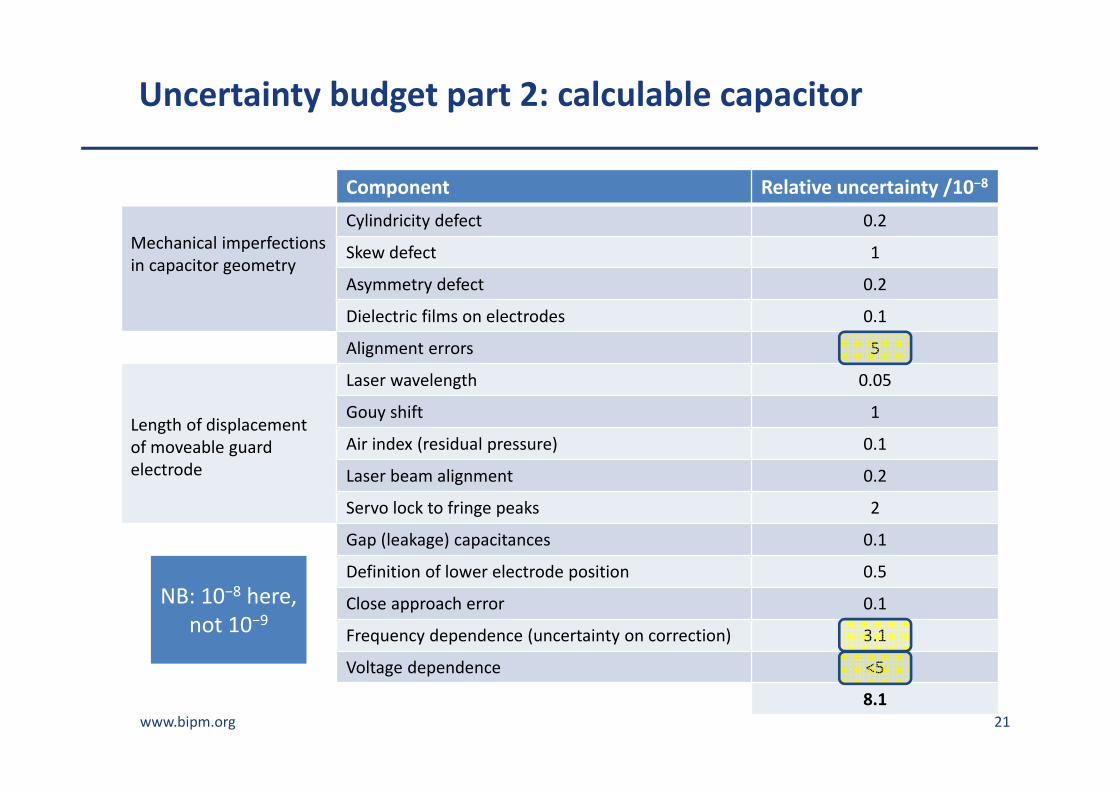
Uncertainty budget part 2: calculable capacitor
Component Relative uncertainty /10−8
Mechanical imperfections in capacitor geometry
Cylindricity defect 0.2
Skew defect 1
Asymmetry defect 0.2
Dielectric films on electrodes 0.1
Alignment errors 5
Length of displacement of moveable guard electrode
Laser wavelength 0.05
Gouy shift 1
Air index (residual pressure) 0.1
Laser beam alignment 0.2
Servo lock to fringe peaks 2
Gap (leakage) capacitances 0.1
Definition of lower electrode position 0.5
Close approach error 0.1
Frequency dependence (uncertainty on correction) 3.1
Voltage dependence <5
8.1
NB: 10−8 here, not 10−9
22www.bipm.org
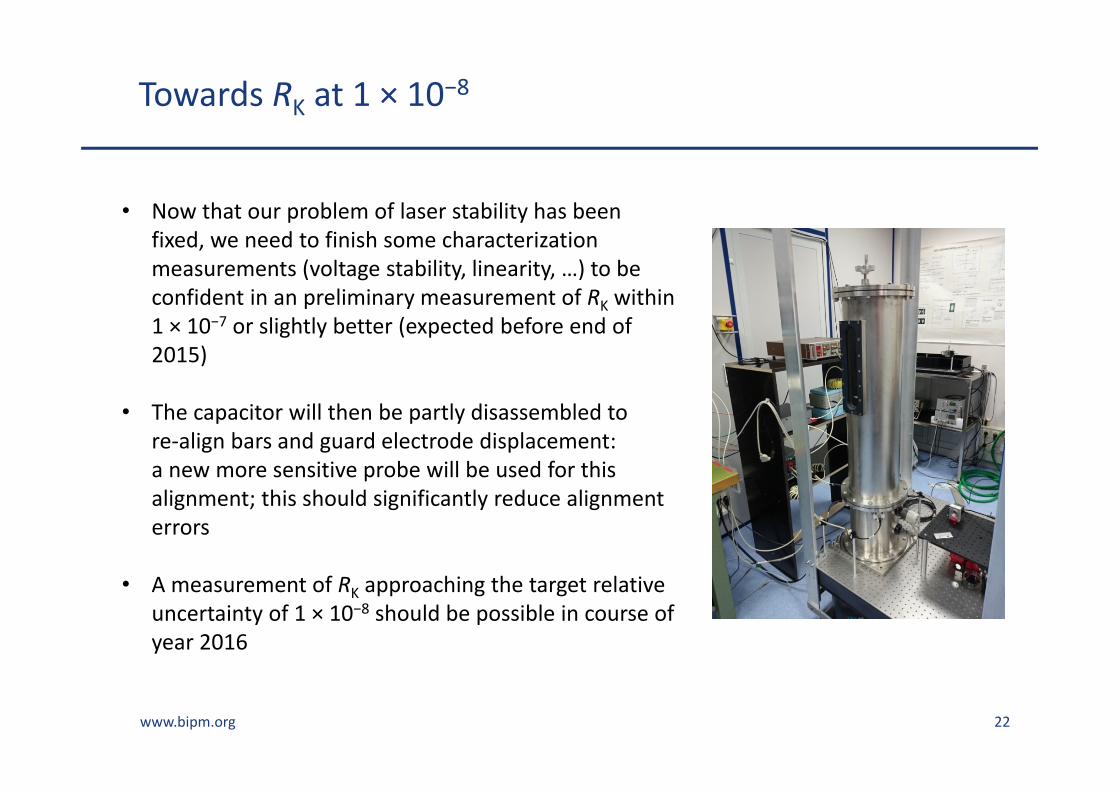
Towards RK at 1 × 10⁻⁸
• Now that our problem of laser stability has been fixed, we need to finish some characterization measurements (voltage stability, linearity, …) to be confident in an preliminary measurement of RK within 1 × 10⁻⁷ or slightly better (expected before end of 2015)
• The capacitor will then be partly disassembled to re‐align bars and guard electrode displacement: a new more sensitive probe will be used for this alignment; this should significantly reduce alignment errors
• A measurement of RK approaching the target relative uncertainty of 1 × 10⁻⁸ should be possible in course of year 2016

23
Work Programme 2016‐2019
E‐A1 International reference standard for voltageE‐A1.1 On‐site comparisons of dc Josephson voltage standards (JVS)E‐A1.2 On‐site comparisons of ac Josephson voltage standardsE‐A1.3 Bilateral voltage comparisons using Zener diode transfer standardsE‐A1.4 Calibrations of Zener diode secondary standards
E‐A2 International reference standard for resistanceE‐A2.1 On‐site comparisons of quantum Hall resistance (QHR) standardsE‐A2.2 Bilateral resistance comparisons using resistance transfer standardsE‐A2.3 Calibrations of resistance secondary standards
E‐A3 International reference standard for capacitanceE‐A3.1 Bilateral capacitance comparisons using capacitance transfer standardsE‐A3.2 CCEM key comparison of capacitanceE‐A3.3 Calibrations of capacitance secondary standardsE‐A3.4 ac quantum Hall effect
E‐A4 CoordinationE‐A4.1 Coordination of CCEM (Electricity and Magnetism)E‐A4.2 Coordination of CCPR (Photometry and Radiometry)E‐A4.3 Liaison activities (RMO TCs, CIE etc…)

Update from the BIPM Watt Balance

25www.bipm.org
Motivationprovide long‐term sustainable operation for a primary realizationof the kilogram on a cost‐shared basis
Main featurecapability of implementing a “one‐phase” measurement scheme
in addition to conventional “two‐phase” scheme
BIPM watt balance
B
Fe
I
B v
vB
Fe
I
weighingphase
moving phase
simultaneous (weighing & moving)

26www.bipm.org
Brief overview over project history
Early 2013: new laboratory(improved thermal and vibrational
environment)
2005: start of construction
2009: operational in air
2010: first h determination
2011: improved repeatability
move to the new lab.

27www.bipm.org
Planck constant determination
Determination of the Planck constant hType A: 5 x 10‐7 Type B: 5 x 10‐5
-3.E-05
-2.E-05
-1.E-05
0.E+00
1.E-05
2.E-05
3.E-05
Rel
ativ
e di
ffere
nce
agai
nst t
he C
OD
ATA
2010
val
ue
CODATA 2010
2011 rel. std. dev. of 1.4 x 10‐6
2010rel. std. dev. of 5.7 x 10‐6
2013 rel. std. dev. of 5 x 10‐7
massive “closed” support structure

28www.bipm.org
New support structure & new mass loading device
Pentapod structure
open access
rigid & stable
Finite elements analysis → no resonancefrequencies in vertical direction below200 Hz
New mass loading device

29www.bipm.org
New magnet
parallelism of pole faces < 5 µm along 50 mm
2 x 10‐4 along 40 mm (probe resolution)

30www.bipm.org
New method for magnet alignment
rotating
Rot.
PB
B
Simple magnetic circuit
Horizontal alignment of the magnetic fieldof a test magnet using a Hall probe withuncertainty of 50 µrad
Alignment of the new magnet next month
New magnetic circuit
rotatingHall probe

31www.bipm.org
Coil alignment
Alignment of the electric plane of a wattbalance coil with an uncertainty of150 µrad, presently improved
Alignment to be transferred usingseveral small mirrors fixed onto the coil
To be compared with magnet alignment
Long solenoid (long term loan from NIST)
Watt balance coil inside the solenoid
Double auto‐collimation system

32www.bipm.org
Dynamic coil alignment mechanism
counter weight
coil
flexure strips
piezoactuators
Initial alignment of the apparatus
magnet alignment↔ coil alignment
Dynamic correction of the coil trajectory inworking mode
test in‐situ under measurement conditions
uncorrected
corrected

33www.bipm.org
New interferometer
Frequency stabilized laser source
3 heterodyne interferometers
Beat between two frequency stabilized lasers
Interferometric signal
> 70 dBbetter frequency stability (<<10‐8)less non‐linearity (< 1 nm)

34www.bipm.org
Expected progress
Targetur(h) = 2 × 10‐8early 2017
urA(h) = 5 × 10‐8urB(h) = 1 × 10‐7 end 2018
urA(h) = 1 × 10‐8urB(h) < 5 × 10‐8
early 2016urA(h) = 1 × 10‐7urB(h) = 5 × 10‐7
vacuum operationJVSs
continuous improvementmass from 100 g to 1 kg
operation of the improved
apparatus in air
Deadline CODATA1 July 2017
assembly of the improved
apparatus in air