report green bonds for cities: a strategic guide for city ... strategic guide for city-level...
TRANSCRIPT

Funded by: Climate-KIC Prepared by: Padraig Oliver, Climate Policy Initiative Date: December 2016
Report
Green Bonds for Cities:A Strategic Guide for City-level Policymakers in Developing Countries
1
About Low Carbon City Lab (LoCaL)
This report was written through support from the Low Carbon City Lab (LoCaL) as part of the Green Bonds for Cities project.
LoCaL aims to reduce 1 Gt of CO2 and mobilize € 25 billion of climate finance for cities annually by 2050. It is an innovation platform aiming to provide cities with better tools for assessing greenhouse gas emissions, planning, investing and evaluating progress. Started in 2015, LoCaL is a growing community of more than 20 organisations dedicated to unlocking climate finan-ce for cities. LoCaL is a Climate-KIC flagship programme.
Website: http://local.climate-kic.org Contact: [email protected]
About Climate-KICClimate-KIC is the EU’s largest public private partnership addressing climate change through innovation to build a zero carbon economy. We address climate change across four priority themes: urban areas, land use, production systems, climate metrics and finance. Education is at the heart of these themes to inspire and empower the next generation of climate leaders. We run programmes for students, start-ups and innovators across Europe via centres in major cities, convening a community of the best people and organisations. Our approach starts with improving the way people live in cities. Our focus on industry creates the products required for a better living environment, and we look to optimise land use to produce the food people need.
Climate-KIC is supported by the European Institute of Innovation and Technology (EIT), a body of the European Union.
About this reportClimate Policy Initiative conducted the analysis contained in this report as part of The Green Bonds for Cities project. The pro-ject aims to support cities in emerging and developing countries access the green bond market to finance their urban infra-structure needs. In particular, it focuses on capacity building around capital markets and green bonds, support in developing a pipeline of viable projects and possible credit enhancement solutions for issuers.
The project is led by South Pole Group in collaboration with Climate Policy Initiative, Climate Bonds Initiative and ICLEI – Local Governments for Sustainability.
About Climate Policy Initiative (CPI)CPI works to improve the most important energy and land use policies around the world, with a particular focus on finance. An independent organization supported in part by a grant from the Open Society Foundations, CPI works in places that provide the most potential for policy impact including Brazil, China, Europe, India, Indonesia, and the United States.
CPI‘s work helps nations grow while addressing increasingly scarce resources and climate risk. This is a complex challenge in which policy plays a crucial role.
Corresponding author: [email protected]

Contents1. Executive Summary 3
1.1 Choosing a strategy to access green bond finance 4
2. Understanding existing green bond market flows and how they reach cities in developing countries 5
2.1 Potential partners: Green bond market issuers by actor type 52.2 Potential investors: Mainstream and mandated green bond market investors 62.3 Cities access flows from green bonds both directly and indirectly 62.4 Accessing finance requires adhering to market norms on green project identification, performance and reporting 8
3. Choosing a route to market: Strategies to access green bond finance for city-based infrastructure 9
3.1 Deciding on a short-term strategy to access the green bond market 93.2 Strategy for cities with bond issuing power 103.3 Strategy for cities without bond issuing power 12
4. Choosing a route to market: Performance metrics and processes necessary to make city projects eligible for a green bond 14
4.1 Eligibility of projects in selection process 144.2 Independent reviews encouraged to add credibility 164.3 Project level green reporting metrics 16
5. Next steps 18
6. References 19
7. Glossary of key terms 21

3
1. Executive Summary
1 Generally, a city can only access the international capital markets if has an ‘investment grade‘ credit rating indicating that it has a low risk of default on its debt obligation. They typical thresholds for investment grade are BBB- or Baa up to a AAA maximum rating.
As of November 2016, 271 cities in developing countries had committed to developing climate mitigation and adaptation plans (Compact of Mayors, 2016). They currently have limited access to the capital necessary to implement these plans. Less than 20% of cities in developing countries have access to local capital markets, through for example issuing bonds to investors, and only 4% are deemed creditworthy enough to access international capital markets (World Bank, 2013).1
This report offers a strategic guide for cities in developing countries to access green bond market flows, a potential sour-ce of finance for cities in developing countries looking to secure investment in low-carbon, climate-resilient infrastructure to meet the water, energy, housing and transportation needs of their expanding urban populations. Since 2007, USD 131 billion in green bonds have been sold to institutional and retail investors attracted by their link to green projects, goods and services. The last three years has seen an exponential 13-fold increase in the value of annual bonds issued, from USD 3.2 billion in 2012 to USD 44 billion in 2015. This is projected to reach USD 75 billion by the end of 2016 (Bloomberg, 2016).
There would seem to be considerable room for these cities to access increased finance from the green bonds market. CPI analysis of the projects underlying green bonds currently in the market shows USD 2.3 billion in value is linked with city-based projects in developing countries, including urban mass transit systems, district heating and water distribution networks. To put this in context, this represents:
•1.7% of total green bond market flows since 2007•6% of all flows to developing countries: A total of USD 38 billion of the proceeds from green bonds issued by development
finance institutions (DFIs), commercial banks, and corporations has been directed toward projects in developing countries•11% of flows to all city-based projects worldwide: USD 17 billion has been raised by cities in developed countries such as
the US, France, and Sweden.
ES-1: Breakdown of green bond market flows from total issuance 2007-mid-2016
TOTAL GREEN BOND MARKET
CITIES IN SOUTH
DEVELOPING
CITIES IN NORTH13117
38
2.3
MUNICIPAL 14
DFI 2
CORPORATE 0.4BANKS 0.04
DFI 2
MUNICIPAL 0.1
94%6%
CITIES IN SOUTH
CITIES IN NORTH
84%
13%

4
1.1 Choosing a strategy to access green bond financeDeveloping country cities’ own creditworthiness is the key constraint limiting their ability to issue bonds themselves. As of November 2016, the USD 137 million bond from Johannesburg in South Africa is the only municipal green bond issued by a developing country city. Most finance that flowed to developing country city-based projects did so indirectly. 94% from green bonds issued by DFIs such as the World Bank and Asian Development Bank.
The subsequent sections of this report will help cities to decide on the most appropriate short and long-term strategies based on their current creditworthiness, regulatory context and financing goals. There are a number of ways that cities in developing countries can address their creditworthiness in order to access the green bond markets directly. There are also opportunities for cities to access the green bond markets indirectly regardless of their creditworthiness.
•Cities or affiliated entities able to issue green bonds can explore options to enhance their creditworthiness through struc-turing, guarantee instruments or securing a cornerstone buyer such as a DFI.
•Cities or affiliated entities unable to issue green bonds can align their investment plans with the green bond performance and reporting criteria of other issuers that participate in city infrastructure projects such as national or multilateral DFIs, private sector corporations or commercial banks.
Both approaches can increase the visibility of cities’ green infrastructure plans and policies among international and domestic investor communities helping to make it easier to raise finance in the longer term. They can also make investment more at-tractive through improved reporting on green performance metrics. For investors seeking additional environmental and social impacts, bonds linked to sustainable urbanization plans have significant co-benefits in the form of improved health, air quality and social conditions that may fit with their investment mandates.
As well as raising finance, developing a bond market strategy can provide additional benefits:
•Linking green projects to loans or bonds can help support transparency and build internal administration procedures as part of efforts to improve overall sound financial management.
•Aligning city-based projects with the green bond frameworks of issuers can ensure urban infrastructure follows national or international green performance requirements.

5
2. Understanding existing green bond market flows and how they reach cities in developing countries
Cities in developing countries can access finance through green bonds directly by issuing bonds or indirectly by linking their projects to bonds issued by another entity.
94% of the USD 2.3 billion that has flowed from green bonds to developing country cities or city-based projects came from DFIs.
The kinds of organizations issuing green bonds in developing countries is diversifying, bringing new potential partners for developing country cities looking to access finance.
The green bond market is integrated with global bond markets where public agencies, municipa-lities, banks and corporations raise finance. By understanding existing green bond market flows, cities in developing countries may identify poten-tial investors or partners to access flows.
2.1 Potential partners: Green bond market issuers by actor type
Since issuing the first green bonds in 2007, development finance institutions (DFIs) such as the European Investment Bank (EIB), the World Bank, International Finance Corporation (IFC) and German development bank KfW have led the way in the market. DFIs had issued 46% of the total market value to May 2016.
In recent years, however, corporations such as elec-tricity utilities, real estate companies and industrial sectors have been catching up. They began to issue green bonds in 2013 and had reached 29% of market value in May 2016 when commercial banks and mu-nicipalities made up 13% and 11% respectively.
In emerging markets, the type of issuers is also diversifying with corporations and commercial banks in China and India increasing issuance.
0
17
34
51
68
$85BN
0
100%Project
Cover
Corporate
Bank
Municipal
DFI
*2016 issuance amount based on projections. 2016 type of issuer share based on data from up to May 31
2016*201520142013201220112010200920082007
Figure 1: Growth of Green Bond market by issuance amount (annual $/bn) and type of of issue (% of yearly total)
issuance amounttype of issuer
50
Source: Bloomberg, author’s calculations
Figure 2: Green bond market flows to the south, by issuer type
Bank
Municipal
Project
Corporate
DFI
2016201520142013201220112010200920080
25
50
75
100%

6
2.2 Potential investors: Mainstream and mandated green bond market investors
Investors in green bonds range from the mainstream investor market to more niche market players:
• Institutional investors such as pension funds, insurance companies and their investment managers•Public agencies such as central banks and national governments•Corporations•Commercial banks •Retail investors such as Japanese or Scandinavian household investors•Dedicated green bond funds
Data on green bond holdings is limited with only 11% of market value disclosed. Of this group, the top investors are among the largest mainstream asset managers in the US, European and Japanese markets.2 The top holders of bonds from emerging markets, at 3.9% of market value also include investors in China, Peru and Southeast Asia.
Table 1: Leading investors in emerging market green bonds by disclosed holdings
Top 8 Holders of Green Bonds
from issuers in emerging
markets (3.84% of market value
outstanding reported)
Institutional investor Country Size (m) No. of bonds held
No. of benefi-ciaries
% of reported market held
HSBC UK 72 7 5 6.31
AFP Integra Peru 70 1 2 6.12
Union Investment Sri Lanka 68 7 10 5.95
TIAA US 64 5 11 5.63
Carmignac Gestion France 58 1 2 5.05
Blackrock US 56 11 24 4.90
JP Morgan Chase US 49 4 8 4.28
Bank of Communications Schroder China 45 1 1 3.94
Source: Bloomberg as of August 2016
Some investors have also begun to more directly indicate support for the green bond market. Seven different investors have publicized portfolio targets amounting to over USD 11 billion. Dedicated Green Bond Funds have also been established with a current size of USD 1.3 billion (see Annex 2).
For cities in developing countries, the primary green bond investor base would be domestic investors. However more research among mandated green bond funds and mainstream investors may uncover demand for green bonds reporting sustainable urbanization impacts in developing countries.
2.3 Cities access flows from green bonds both directly and indirectlyImproved reporting on the use of the finance raised (commonly referred to as the use of proceeds) reveals the types and loca-tions of the projects linked to green bonds.
Figure 3 estimates approximately USD 19 billion of green bond flows have been linked with cities or city-based projects. USD
2 See Annex 1 for the leading eight green bond investors in the overall market by disclosed holdings

7
17 billion went to cities or municipalities in developed countries, predominantly the US and Europe, while USD 2.3 billion went to cities in developing countries.
Cities in the North mainly use their own municipal (MUNI) issuance power either alone (41%) or through an associated public agency (37%). They also benefit from DFIs linking city-based projects to their green bonds (13%).
Cities in developing countries, in contrast, rely almost entirely on DFIs to raise finance for their projects (94%). Urban mass transit systems, district heating and water distribution networks are the most common type of city-based infrastructure pro-jects in developing countries that are linked to green bonds. The World Bank links the most projects with its green bonds.3
However, the USD 2.1 billion of flows to city-based projects in developing countries amounts to less than 10% of the total USD 21 billion of DFI flows to developing countries, revealing the high proportion of large renewable energy and industrial energy efficiency projects linked to green bonds.
Table 3: Flows to city-based projects by sector (USD millions)
Source: Author’s calculations from issuers green bond reports
3 City-based projects include green projects within urban areas not including private rooftop or ground-based renewable energy plants.
Figure 3: Breakdown of green bond market flows from total issuance 2007-mid-2016
TOTAL GREEN BOND MARKET
CITIES IN SOUTH
DEVELOPING
CITIES IN NORTH13117
38
2.3
MUNICIPAL 14
DFI 2
CORPORATE 0.4BANKS 0.04
DFI 2
MUNICIPAL 0.1
94%6%
CITIES IN SOUTH
CITIES IN NORTH
84%
13%
DFI name Energy Transport Water & Waste Total
World Bank 165 1091 348 1604
ADB 201 228 – 430
AFDB – – 19 19
IFC – 25 – 25
EBRD – 10 7 17
Export import bank of India – 10 – 10
Total 2104

8
2.4 Accessing finance requires adhering to market norms on green project identification, performance and reportingIn 2013, a group of leading investment banks active in the green bond market released voluntary guidelines to help encourage more transparency and standardization for each bond and thereby attract more investors. The Green Bond Principles (GBPs) (ICMA 2016) have four components around:
•Use of proceeds: establishing that a bond’s proceeds are to be used to finance or re-finance green projects. Broad catego-ries of eligible projects are listed in the GBPs but no specific green definitions are prescribed (see Table 4 in section 4.1).
•Process for project evaluation and selection: outlining how the bond issuer determined which projects were eligible to be linked to the green bond.
•Management of proceeds: requiring issuers to track the net proceeds from green bonds through formal internal accoun-ting processes to the investments in the green projects. How unallocated proceeds may be used temporarily should also be outlined.
•Reporting: describing the projects that have received proceeds of the green bond and their impact on an annual basis.
The GBPs also encourage and recommend external reviews of the green projects to be linked to green bonds to provide added assurance as to the use of proceeds. Investors in green bonds report that adherence to the GBPs is a requisite for inclusion in their green bond mandates and external reviews are helpful in assisting in their environmental due diligence (Novethic 2016, Gerhold 2016, interviews).
Reviews can take various forms depending on the type of support enlisted from service providers:
•Second opinions are provided by environmental consultants to check the green claims of the projects underlying the bond issuance or the robustness of the framework applied by the issuer to select projects. They are often provided by academic think tanks, engineering and environmental certification bodies, or sustainability consultants.
•Verification or auditing is carried out by accountancy firms to check the green claims linked to the bond where external criteria, often in particular assets such as buildings, may be referred to. In addition, these firms may check whether inter-nal tracking and accounting procedures have been established to enable proper use of proceeds and reporting.
•Certification of bonds against a standard such as the Climate Bond Standard (CBS) may also be pursued. The CBS provi-des sector-specific, asset-level environmental criteria ranging from performance-based metrics to process-based design and operations of assets for green classification (see section 4). Approved auditors review projects against these criteria.
•Ratings of green bonds are carried out against an established assessment framework similar to a credit rating methodo-logy. Specialized research providers or credit rating agencies develop scores based on the GBPs to rate the bond.
55% of green bond deals from emerging markets conducted an external review. Bond size or location do not appear to be a factor in the decision to procure one.
We estimate that of the 31 bonds issued in emerging markets, 55% have associated external reviews. These external reviews are spread evenly across DFIs, corporations and commercial banks although this initial analysis suggests that the lat-ter are more likely to carry out an external review.
Size of the bond or country of issuer did not have an effect on whether the bond carried out an independent review. The average deal size is lower for reviewed than for unreviewed bonds in the DFI and corporate category. Bonds from China and India-based issuers are evenly split between revie-wed and unreviewed.
Figure 4: External reviews on green bonds issued in emerging markets (CPI analysis; CBI 2016)
CORPORATE
DFI
BANK
CITY
55%EXTERNALLY
REVIEWED
45%NOT EXTERNALLY REVIEWED
= 1 bond
6
5
2
1
6
6
5

9
3. Choosing a route to market: Strategies to access green bond finance for city-based infrastructureOur analysis shows that with the sources of green bond market flows to developing countries coming from DFIs and more recently, local banks and corporations, cities do not necessarily need to issue their own issuance green bonds to access finan-ce from the market. Below we outline options to consider during the strategy development process.
While securing regular and low-cost access to capital markets may be a long-term goal for some cities, there are other stra-tegies in the short-term that can provide lower-cost access to green bond finance. These strategies may use the green ‘use of proceeds’ model in the market to help increase the visibility of and trust in cities’ green investment plans among international and domestic investor communities.
Shorter term strategies could, therefore, form part of longer-term plan to directly issue green bonds or be pursued for their own sake depending on a city’s creditworthiness, regulatory context and financing goals.
3.1 Deciding on a short-term strategy to access the green bond market The key variables driving a cities green bond market strategy include:
•National regulation dictates whether a city is legally able to issue their own bonds in domestic or international capital markets and currencies
•The size and risk profile of the green infrastructure investment indicates the likely investor segment to target•The creditworthiness of a city’s own balance sheet established either through a rating from an external credit rating
agency or implicitly rated through external due diligence dictates its attractiveness to investors. Investment-grade credit ratings denote if the city has a low risk of default with typical thresholds at BBB- or Baa up to a AAA maximum rating.
•A city’s level of engagement with or ownership of other organizations that have access to capital markets and may want to include city-based green projects in potential bond issuance, including:
o City-based entities such as public utilities or agencies that city administrators exert a degree of control overo Public-private partnershipso Commercial banks or private sector companies with access to capital marketso National-level development agencies and bankso Multilateral or bilateral development agencies and banks
Some or all of these variables may exist in some cities. Others may find their options more limited. The decision-tree in Figure 5 provides a useful overview for developing a green bond market strategy for cities based on their individual context.
A city’s green bond market strategy is driven by its context – in relation to its own issuance power, its size, creditworthiness and ability to engage with potential proxy issuers.
Although not a determining factor in developing a successful strategy, establishing whether a city possesses its own issuance power is a natural starting point for exploring the strategies suggested by the decision tree and which we outline in further detail in the following sections.

10
3.2 Strategy for cities with bond issuing power
The potential for cities or regions in the 16 developing countries that have issued non-labelled bonds since 2007 to issue green bonds could be particularly high.
The process of issuing a green bond does not enhance creditworthiness by itself. But applying traditional credit enhancement techniques such as structuring investment and securing credit guarantees could allow cities with bond issuing power and low credit ratings to reach new investors.
Some cities may have the legal ability to issue bonds on local or international markets but not have an investment-grade cre-dit rating (above BBB- or Baa) needed to attract investors. For this reason, we split this section into two subsections.
Cities with creditworthinessCities in developing countries may follow the lead of 35 municipal or city governments in US, Europe as well as Johannesburg in South Africa by issuing their own green bond. In the cities or regions in 16 developing countries that have issued non-label-led bonds since 2007 (Bloomberg, 2016), five are in countries with investment-grade credit ratings.4 The potential for greening existing bond issuance in these countries is therefore particularly high.
Initial steps needed for a green city bond to adhere to the Green Bond Principles require:
•Communication between a city’s treasury and its environmental or infrastructure departments on eligible green pro-jects. Based on interviews with city representatives, the potential to diversify a city’s investor base is often cited as the most persuasive reason in obtaining board or treasury approval for issuing a green bond (interviews).
•Establishing reporting and monitoring processes that tracks investment draw downs, delays, use of cash proceeds, and matching bond principal with project value
•Assessing the market of external independent reviewers to determine which approach best suits target investors as well as internal institutional structures
4 They are Colombia, Mexico, Malaysia, Kazakhstan and South Africa.
Figure 5: Decision tree to develop green bond market access strategy

11
Interviews with city issuers reveal these preliminary activities take 4-7 weeks the first time they issue a green bond and less time for subsequent issuances.
Cities typically issue green bonds against their general revenue (tax) base through general obligation bonds. Revenue bonds, where an identified cash flow or revenue stream from projects is ring-fenced to support bond repayments, may also be used if the current tax base is too narrow or there are creditworthiness concerns.
Cities without sufficient creditworthinessFor cities without sufficient creditworthiness, either through explicit ratings or based on their balance sheet, there are two main credit enhancement approaches available:
•Structuring the investment through overcollateralization of the bond. This reduces repayment risk by allocating a grea-ter share of cash flows derived from tax collections or project revenues than is needed to service the debt to bondholders and other liabilities. Cities may provide specific revenue pledges or ring-fenced cash flows to support this claim. When the investment needs of one city are not significant enough for the bond to attract investors, requiring the city to pool assets with other cities in an special purpose vehicle (SPV), structuring may also enhance the creditworthiness of this vehicle.
•Securing credit guarantees from national or multilateral agencies. Such guarantees reduce risk for investors further by offering them reserve funds and first-loss buffers in the event an issuer defaults on its debt obligations.
Aside from credit enhancement, securing a cornerstone investor such as a multilateral bank can add legitimacy and credibili-ty to a city’s bond issue (see Box 1). While a cornerstone investor does not directly reduce the credit risk of the bond itself, the ‘halo effect’ and the due diligence requirements associated with securing lead investment from a credible institution increase other investors’ confidence to enter the transaction. In the case of a first or pilot issuance by a city, a total investment by the single DFI investor could be justified in order to demonstrate to a wider investment community.
Box 1: Examples of potential structures of green bonds flows to city-based projects
Viveracqua hydrobondIn 2014, local municipal water utilities in the Veneto region, Italy pooled their own mini-bonds into an SPV in order to issue a EUR 150 million bond on the market. The SPV structure was supported with a 4% cash reserve by a regional finance agency, 16% by the utilities in the structure, and en-abled by a cornerstone investor in the form of the European Investment Bank. The pooling of the assets allows for a diversification of risks for investors. In 2016, the SPV issued another EUR 77m at a lower coupon rate (EIB 2014, Securitisation Services 2016).
IFC Yes Bank Green Masala BondIndia’s Yes Bank issued an INR 10 billion (USD 160 million) green bond in February 2016 targeted at local investors. In August, it issued an INR 3.15 billion green bond (USD 50 million) that was wholly purchased by IFC under its own ‘masala’ bond issuance program to encourage the listing of INR-denominated debt in international markets, in this case an IFC bond listed on the London stock exchange (IFC 2015a, Environmental Finance 2016). As the World Banks, private sector arm, the IFC is precluded from lending to public authorities however other DFIs internationally or dome-stically may adopt this approach for prospective city issuers.

12
3.3 Strategy for cities without bond issuing power
Cities unable to access the bond markets directly can access finance by working with city-affiliated or owned public agencies, utilities or project companies, commercial banks or corporations, and national or international DFIs.
Domestic DFIs in developing countries, such as NAFIN in Mexico and the Agricultural Bank of China, already account for 18% of total flows from DFIs’ green bonds to developing countries. They could be potential partners for cities.
Cities may be constrained in accessing green bond markets through their own issuance power, for example, because of:
•A lack of available credit-enhancement options•A lack of capacity to pay back debts, financial management capacity or track record for operating within budget•Limited or lacking regulatory frameworks or legal barriers in their country prohibiting city bond issuance
City creditworthiness initiatives highlight the need to review different potential sources of long-term capital to finance infrastructure in addition to bond markets, including loans and public-private partnerships (World Bank 2016; C40 2015). These loan providers or private entities can include city-based projects within their green bond portfolio, providing they meet their eligibility criteria. For the city, this has the added benefit of raising awareness among investors and demonstrating its commitment to climate-smart development, and sound financial and debt management.
City-based projects may be particularly attractive for some of their investors. For in-vestors seeking additional environmental and social impacts, bonds linked to sustain-able urbanization plans have significant co-benefits in the form of health, air quality and improving social conditions that may fit investment mandates.
There are four levels of such “proxy issuers” that cities who do not have access to capital markets directly can partner with to indirectly access green bond market finance. We order them here by their likely closeness to a city administration:
•City-affiliated or owned public agencies, utilities or project companies. Partnering with these organizations allows city administrators to retain control over financing terms of bonds and the underlying projects. 22 such bonds have been issued by sector-specific city authorities in the green bond market to June 2016 – 9 in relation to water infrastructure, 3 each in relation to transport and education, and 7 for multi-purpose use. Most of these issues have happened in the US. With the notable exceptions of China, India and Singapore, city-owned public agencies, companies or utilities issuing bonds are not yet commonplace in developing countries (Bloomberg 2016).
•National-level agencies or development banks. Issuance from national level agencies or development banks is more common and has taken place in 49 developing countries (World Bank 2012). Some agencies may be dedicated specifically to local government financing needs such as the Kommunalbanken and Kommuninvest models applied in Norway and Sweden (see Box 2). Domestic DFIs in developing countries, such as NAFIN in Mexico and the Agricultural Bank of China, already account for 18% of total flows from DFIs’ green bonds to developing countries. They could provide a potential source of collaboration for cities (see Figure 6).
•Private sector partners. The growing diversification in the kinds of organizations from developing countries issuing green bonds (see Figure 2) means that outreach and partnership with private sector entities – commercial banks and corpo-rations – offer another avenue of potential green bond proxy issuers. Private sector entities could issue green bonds themselves and link to them to city-based projects or enter into public-private partnerships (PPP) vehicles with the city to issue the bond. IFC has announced a USD 2 billion cornerstone green bond fund to invest in green bonds from banks in emerging markets (Hamza, 2016).
•Multilateral or bilateral development agencies and banks. These entities’ green bond portfolios include up to USD 21 bil-lion in flows to developing countries. However, less than 10% of this flows to city-based projects such as urban electrifica-tion, mass transit and district heating (see Table 3 above). Cities entering into loan arrangements with MDBs and bilateral agencies should work to ensure that projects align with these institutions’ green bond framework eligibility criteria.
Figure 6: Green Bond DFI Flows to Developing Countries
18%
11%
71%
MULTILATERAL
DOMESTIC
BILATERAL

13
Box 2: Examples of a national-level agency set up to meet local government financing needs
Kommuninvest, SwedenLocal and regional governments in Sweden established a non-profit company in 1986 to allow them to collectively access long-term capital through the bond markets. Members of the cooperative issue joint and several guarantees to cover repayments for the collective. In March, 2016 Kommuninvest issued a USD 600m green bond. Its membership stands at 281 councils (S&P Global Ratings 2016).

14
4. Choosing a route to market: Performance metrics and processes necessary to make city projects eligible for a green bond
Cities should seek to ensure that climate investment plans and projects align with and perform to the criteria of green bond frameworks in the market.
This section provides an overview of the green performance metrics and processes that cities in developing countries should follow to adhere to market norms or be eligible for inclusion in green bond market portfolios, regardless of whether a green bond is issued by the city or by other parties. This means that in addition to developing a strategy to access finance from green bond markets, cities must also devise an internal process on adhering to market norms and expectations on how to identify projects, monitor performance and report on impacts. This section provides an overview on green criteria for project identification and reporting based on market practices and across different project types.
4.1 Eligibility of projects in selection processThe Green Bond Principles provide high-level categories on eligible green projects (see Table 4). For cities seeking green bond finance for projects through their own issuance or partnering with other issuers, green criteria may be superseded through: •National regulations or standards e.g. green building codes, or national targets on climate change, that are more likely to
be adopted by domestic issuers• Institutional standards and metrics in use by multilateral or bilateral development banks that they would require align-
ment with in order to act as a cornerstone investor of a city bond or potential inclusion in their green bond portfolio. Identified projects within a cities’ green growth infrastructure and investment plans may already fit with green bond eligibi-lity criteria in the market. Proactively aligning plans with green bond frameworks could therefore enhance the visibility and credibility of investment plans and help a city attract potential new investors as it works towards accessing long-term sources of finance directly.
The table below outlines the broad eligibility categories of the Green Bond Principles in the left-hand column and adds further detail provided by important market players including the Climate Bond Standard (CBS), the World Bank (WB), African Develop-ment Bank (AfDB) and Scandinavian local authority lenders Kommuninvest and Kommunalbanken (KBN) in the right-hand column.
As the only country to have published a specific green bond eligibility guidelines, China is included too. Its guidelines largely reference sector-specific national guidelines (China Green Finance Committee 2015). India has published guidelines on the management and reporting of green bond use of proceeds but has not yet published guidance on selection criteria (OECD et al 2016).

15
Table 4: Green Bond Principles project categories and other notable market practices
Green Bond Principles project categories Differences in project criteria in use by various actors in the market
Renewable energy (including production, transmissi-on, appliances and products)
CBS applies restrictions on the emissions intensity of geothermal energyChina permits ultra-supercritical and supercritical coal plants less than 300MW in its guidelines.World Bank does not permit fossil fuel efficiency projects, however IFC does, following certain criteria.
Energy efficiency (such as in new and refurbished buildings, energy storage, district heating, smart grids, appliances and products)
CBS requires 30-50% emission reductions for upgrades or the green commercial buildings to be within the top 15% of city emissions performance for the building. It has yet to approve any building codes in for residential buildings developing countries.Swedish local government lending authority Kommuninvest requires new builds with 25% less than Swedish building regulations plus LEED gold; BREEAM very good, or EE measures with 25% energy savings or renovations with 35% energy per sq.m savings or equal to new build regulations
Pollution prevention and control (including waste water treatment, greenhouse gas control, soil reme-diation, recycling and waste-to-energy, value-added products from waste and remanufacturing, and asso-ciated environmental monitoring analysis)
Norwegian local authority lender, Kommunalbanken (KBN) refer to waste management projects that “must improve the waste management chain, for ex-ample by increasing the recovery rate, or by reducing the use of incineration, CO2 emissions or transport requirements, or by improving resource use.”
Sustainable management of living natural resources (including sustainable agriculture, fishery, aquaculture, forestry and climate smart farm inputs such as biolo-gical crop protection or drip-irrigation)
KBN’s eligible urban projects include converting land from car parks into recreati-on areas; facilitating walking, cycling, and public transport solutions; development of areas for car sharing; and planting new forests.China excludes tobacco cultivation and support for net fishing
Terrestrial and aquatic biodiversity conservation, (including the protection of coastal, marine and wa-tershed environments)
African Development Bank’s portfolio includes biosphere conservation projects that aim to reduce emissions from deforestation and degradation of ecosystems
Clean transportation (such as electric, hybrid, public, rail, non-motorized, multi-modal transportation, infrastructure for clean energy vehicles and reduction of harmful emissions)
The CBS applies per passenger/KM and per tonne/KM carbon emissions th-resholds for all vehicles and forms of public transport, and more specific criteria on enabling infrastructureThe WB, AfDB and city authorities apply broad descriptions of modal shift pro-jects and efficiency upgrades
Sustainable water management (including sustain-able infrastructure for clean and/or drinking water, sustainable urban drainage systems and river training and other forms of flooding mitigation)
CBS includes specific flood defense and waste energy recovery projects and ap-plies emission reductions criteria and vulnerability assessments (for projects <20 years life) for other water infrastructure projects. MDBs refer to broader water supply and wastewater projects
Climate change adaptation (including information support systems, such as climate observation and early warning systems)
AfDB’s list of eligible projects specifically refers to city-based projects in Urban Development: e.g. rehabilitation and upgrade of urban water drainage systems in areas vulnerable to frequent or severe flash floods and storm surges due to climate changeKBN also reference natural disaster warning systems, landslide security systems, climate research and education programs
Eco-efficient products, production technologies and processes (such as development and introduction of environmentally friendlier, eco-labelled or certified products, resource efficient packaging and distributi-on)
AFDB projects include reducing GHG emissions through improvements to indust-rial processes and cleaner production
Sources: AfDB 2016, CBI 2016b, China Green Finance Committee 2015, Cicero 2015, 2016, KBN 2016, Kommuninvest 2016, and ICMA 2016
16
4.2 Independent reviews encouraged to add credibility
Although not mandatory, both the GBPs and the Chinese and Indian guidelines recommend and encourage independent reviews of green bond use of proceeds. This may take the form of certification such as the CBS, or auditing against detailed national criteria.
The most common form of independent review however is provision of Second Opinions with 72% of issuance volume in 2015 receiving reviews from organizations such as CICERO, Sustainalytics, Oekom, EY and Vigeo (Elders 2016).
Second Opinions are an independent environmental quality and process check of the issuers green bond framework, typically a top-down overview of the project selection criteria applied (Cicero 2016). They are reported to help new issuers understand the requirements of investors and the market on green performance, although may also be relatively costly (OECD et al 2016). Second Opinion also allow for gradations in the environmental process of projects selected. For example Cicero applies a ‘sha-des of green’ overlay on the project selection criteria used by the issuer to denote:
• If the overall framework is in line with low-carbon solutions (dark green) •Projects that are a step in the right direction (medium green)•Projects that are environmentally friendly but not part of a low-carbon solutions (light green)
For example, the IFC green bond framework receives a medium shade of green due to the inclusion of fossil fuel energy effi-ciency projects and other categories (Cicero 2015). More recently, credit rating agencies such as Moody’s and S&P have developed green bond evaluation frameworks or tools to provide weighted scores to the different environmental and accounting aspects of green bonds in order to help investors assess comparability across many of the approaches reviewed above.
4.3 Project level green reporting metricsIn developing a green bond strategy, cities should consider upfront the project or program-level metrics to be tracked for reporting requirements later. Using environmental and social metrics can make investment in specific projects more attractive particularly for investors seeking additional impacts. Bonds linked to sustainable urbanization plans have significant co-bene-fits in the form of health, air quality and improving social conditions that may fit investment mandates.
Establishing and monitoring these metrics can also benefit cities by building their planning capacities and helping to ensure that green growth plans deliver effectively on their economic, environmental, and social goals.
As an example of specific performance metrics related to city-based projects, the table below highlights selected existing green bonds across the transport, housing, water and waste and energy sectors. These metrics are used to report impact to green bond investors on the use of proceeds of green bonds and also to provide reassurance that the projects linked to the green bond are performing.
MDBs issuing green bonds support a harmonized impact reporting framework for green bonds, however, only metrics for renewable energy and energy efficiency have been published to date (IFI 2015).

17
Table 5: Asset-specific green performance metrics in use in the green bond market (DC Water 2015, TFL 2015, IFC 2015b, Cicero 2015)
Sector Green Bond issuer Projects Metrics used in reporting
TransportTransport for London (TfL) 2015 GBP500 million green bond
•Rail capacity•Station upgrades•New buses•Cycling improvements
•Emissions of CO2 by mode of public transport;•Emissions of CO2 per passenger km travelled;•Total CO2 emissions for TfL and its business units;•Total NOx emissions from TfL operations;•PM10 emissions from TfL operations;•Construction and demolition waste.
HousingPunjab National Housing Finance 2016 USD 75m
•Green buildings loans •EDGE certification
Water & Waste DC Water •Tunnel construction to
reduce overflow
Water quality:•% reduction in combined sewer overflow volume•Construction progress of tunnel
Climate resilience: •Description of flood relief and mitigation programs
Quality of life •Nitrogen and phosphorus removalSuspended solids removal
Energy World Bank Green Bond portfolio •District heating •Annual energy savings (MWh)
•Annual GHG emission avoided, CO2 tonnes

18
5. Next steps
5 Support to do so is currently available through various efforts such as the World Bank City Creditworthiness Initiative, the C40 Creditworthiness Academy, or the Emerging and Sustainable Cities Program (ESC) of the Inter-American Development Bank: http://www.citycred.org
Cities in developing countries require long-term sources of finance to implement climate-smart urban infrastructure invest-ment plans. However, only 4% of these cities have access to international capital markets and 20% to domestic capital markets that enable them to source private finance through bonds (World Bank 2013).
Other cities need to either enhance their creditworthiness in order to access bond markets or review other sources of finance such as loans from commercial banks, development agencies and public-private partnerships.5
Although the green bond market has had relatively less impact on cities in developing countries to date in terms of financial flows, it is growing rapidly, with more investors engaging and more domestic market actors participating. Cities may therefore consider how a green bond market strategy may support their efforts in expanding their access to regular, low-cost capital over the long-term. If cities are already able to issue their own green bonds, options to explore include:
•Credit enhancement through structuring or guarantees•Public institutions acting as cornerstone investors to facilitate demonstration
If cities are unable to issue their own green bonds, options include leveraging the green bonds ‘use of proceeds’ model in part-nering with other bond market participants in support of green city-based projects and investment plans such as:
•City-affiliated agencies or entities•National development agencies or banks•Private sector entities such as commercial banks or corporations•Multilateral development agencies or banks.
Regardless of which options are selected in the short-term, they should support longer-term goals by increasing awareness of cities‘ green investment plans among domestic and international investment communities. In addition, there are common benefits that may be derived from adopting a strategy that can support a long-term goal to attract capital to green city-based projects:
•Supporting city creditworthiness improvements through increasing transparency uses of finance through reporting requi-rements and internal administrative coordination between city departments.
•Aligning city-based projects with the green bond frameworks of issuers can ensure urban infrastructure follows national or international green performance requirements.
•Visibility among international and domestic investor community with regard to how cities are sustainably urbanizing can support broader investment flows and trust in city planning and management.
•Using city-specific green bond reporting metrics in the form of health, air quality and improving social conditions can make investment in specific projects more attractive particularly for investors seeking additional environmental and social impacts.

19
6. ReferencesAfDB 2016. Green Bond Program – Portfolio Selection. African Development Bank Group. Available at: http://www.afdb.org/en/topics-and-sectors/initiatives-partnerships/green-bond-program/portfolio-selection/
Bloomberg 2016. Green Bonds Database. Accessed at 31 May 2016
C40 2016. Good practice guide: Creditworthiness. C40 Cities Climate Leadership Initiative, London. CBI 2016a. Labelled green bonds data. Climate Bonds Initiative, London. Available at: http://www.climatebonds.net/cbi/pub/data/bonds
CBI 2016b. Climate Bond Standard. Climate Bonds Initative, London. Available at: http://www.climatebonds.net/standards/about
China Green Finance Committee 2015. Preparation Instructions on Green Bond Endorsed Project Catalogue. Green Finance Committee of China Society of Finance and Banking, Beijing. Available in English and Chinese at: http://www.icmagroup.org/News/news-in-brief/new-official-rules-for-chinese-green-bond-market/
CICERO 2015. Second Opinion on World Bank’s Green Bond framework. Center for International Climate and Environmental Research, Oslo
CICERO 2016. Framework for CICERO’s ‘Second Opinions’ on Green Bond Investments. Center for International Climate and Environmental Research, Oslo.
Compact of Mayors 2016. Cities committed to the Compact of Mayors. Available at https://www.compactofmayors.org/cities/ DC Water 2015. Public utility subordinate lien revenue bonds, series 2015A (Green Bonds). District of Columbia Water and Sewer Authority, Washington D.C.
Elders, G. 2016. As green bonds grow, issuers hesitate. Bloomberg Intelligence, London. Available at: https://www.bloomberg.com/professional/blog/green-bonds-grow-issuers-hesitate-2//
EIB 2014. Viveracqua Hydrobond. European Investment Bank, Luxembourg. Available at: http://www.eib.org/projects/pipe-line/2013/20130515.htm
Environmental Finance 2016. Special Award for Innovation (Structure) – Yes Bank/IFC ‘back-to-back’ transaction. Field Gibson Media Ltd, London. Available at: https://www.environmental-finance.com/content/green-bonds-awards/most-innovative-bond-structure-yes-bank-/-ifc-back-to-back-transaction.html
Gerhold, M. 2016. The evolution of the green bond sector. Available at: https://cbcm.commerzbank.com/en/hauptnavigation/thought_leadership/financing_and_capital_markets/green_bond_market_evolution/green_bond_market_evolution.htm-lGreen Bond Principles 2016
Hamza, A. 2016. IFC plans $2bn emerging market green bond fund. Environmental Finance, London. Available at: https://www.environmental-finance.com/content/news/ifc-plans-2bn-emerging-market-green-bond-fund.html
ICMA 2016. Green Bond Principles 2016 – Voluntary Guidelines for Issuing Green Bonds. International Capital Market Associa-tion, London. Available at: http://www.icmagroup.org/Regulatory-Policy-and-Market-Practice/green-bonds/green-bond-prin-ciples/
IFC 2015a. Yes Bank Infra: Summary of Proposed Investment. International Finance Corporation, Washington D.C. Available at: http://ifcext.ifc.org/ifcext/spiwebsite1.nsf/DocsByUNIDForPrint/11A1778D9E58BB6785257DF900550B32?opendocument
20
IFC 2015b. PNBHF Green bond – Summary of Investment Information. International Finance Corporation, Washington D.C. Available at: http://ifcextapps.ifc.org/IFCExt%5Cspiwebsite1.nsf%5C0%5CF8E532AB53FF9F7A85257F0500424AF5
IFI informal green bond working group, 2015. Green Bonds: Working Towards a Harmonized Framework for Impact Reporting. Available at: http://www.icmagroup.org/assets/documents/Regulatory/Green-Bonds/20151202-0530-FINALRevised-Pro-posal.pdf
KBN 2016. Green Lending Program – Criteria Document: KBN Green bonds supplementary guidelines for project selection, documentation and reporting. Kommunalbanken Norge, Oslo. Available at: http://www.kommunalbanken.no/media/231471/kbn-supplement-document-for-project-selection-documentation-and-reporting.pdf
Kommuninvest 2016. Kommuninvest – Green Bonds Framework. Kommuninvest I Sverige AB, Orebro. http://kommuninvest.se/for-kunder/vara-produkter/grona-lan/kommuninvest-green-bonds-framework-12-january-2016/
Novethic 2016. Green bonds: an investors’ perspective. Available at: http://www.novethic.com/fileadmin//user_upload/tx_ausynovethicetudes/pdf_complets/2016-greenbonds-report.pdf
OECD/ICMA/CBI/China GFC 2016, Green Bonds, Country experiences, barriers and options: in support of the G20 Green Finance Study Group. Available at: http://unepinquiry.org/wp-content/uploads/2016/09/6_Green_Bonds_Country_Experi-ences_Barriers_and_Options.pdf
Oliver, P. 2016. Understanding green bond data can help cities in developing countries tap the market. Climate Policy Initiative, London. Available at: https://climatepolicyinitiative.org/2016/09/06/understanding-green-bond-data-to-help-cities-develo-ping-countries-tap-market/
S&P Global Ratings 2016. Kommuninvest I Sverige AB. Standard & Poor’s Financial Services, Available at: http://kommunin-vest.se/wp-content/uploads/2016/07/SP-Kommuninvest-i-Sverige-AB-July-20161.pdf
Securitisation-Services 2016. Viveracqua Hydrobond 1: new minibond issuance for E77m by the corporates belonging to the water utilities consortium in the Veneto region. Available at: http://www.securitisation-services.com/en/news/viver-acqua-hydrobond-1-new-minibond-issuance-for-77-mln-by-the-corporates-belonging-to-the-water-utilities-consorti-um-in-the-veneto-region
TFL 2015. Framework for a TFL Green Bond. Transport for London, London. Available at: http://content.tfl.gov.uk/tfl-green-bond-framework.pdf
World Bank 2012. Global Survey of Development Banks. Financial and Private Sector Development, World Bank, Washington D.C.
World Bank, 2013. Financing Sustainable Cities: How We’re Helping Africa’s Cities Raise Their Credit Ratings. World Bank Group, Washington D.C. Available at: http://www.worldbank.org/en/news/feature/2013/10/24/financing-sustainable-ci-ties-africa-creditworthy
World Bank, 2016. City Creditworthiness: Self-Assessment & Planning Toolkit. City Creditworthiness Initiative, Washington D.C. Available at: http://www.citycred.org/

21
7. Glossary of key termsBond – A debt investment or security in which an investor loans funds to an entity for a defined period of time at a rate of interest.
Green bond – A green ‘labelled’ debt security that is linked to green projects, goods or services.
Green bond market – the market of labelled green bonds.
DFI – Development finance institution such as a national or multilateral development bank, and export credit agency or public agency
City-based infrastructure – projects in urbanized environments such as urban housing; transport (mass urban transit); energy (district heating; municipal biomass); urban water and sanitation; municipal waste and biogas etc.
Use of proceeds – the green projects underlying the green bonds.
Credit rating – the evaluation of a credit risk of a debtor, predicting their ability to payback the debtInvestment grade credit rating – a credit rating that denotes low risk of default on debt.

22
Annex 1: Leading green bond investors in the overall market by disclosed holders
Top 8 Holders of Green Bonds
(11% of market value outstan-ding reported)
Institutional investor Country Size No. bonds held No. of beneficiaries% market reported
heldVanguard Group US 1 bn 77 54 7.35
TIAA-CREF US 1 bn 47 15 7.31Blackrock US 824m 105 192 5.62
Nordea Bank Sweden 689m 27 35 4.70Natixis France 481m 81 15 3.28Allianz Germany 477m 61 132 3.25
Nikko AM Japan 326m 38 9 2.22SPP Fonder Sweden 305m 47 6 2.08
23
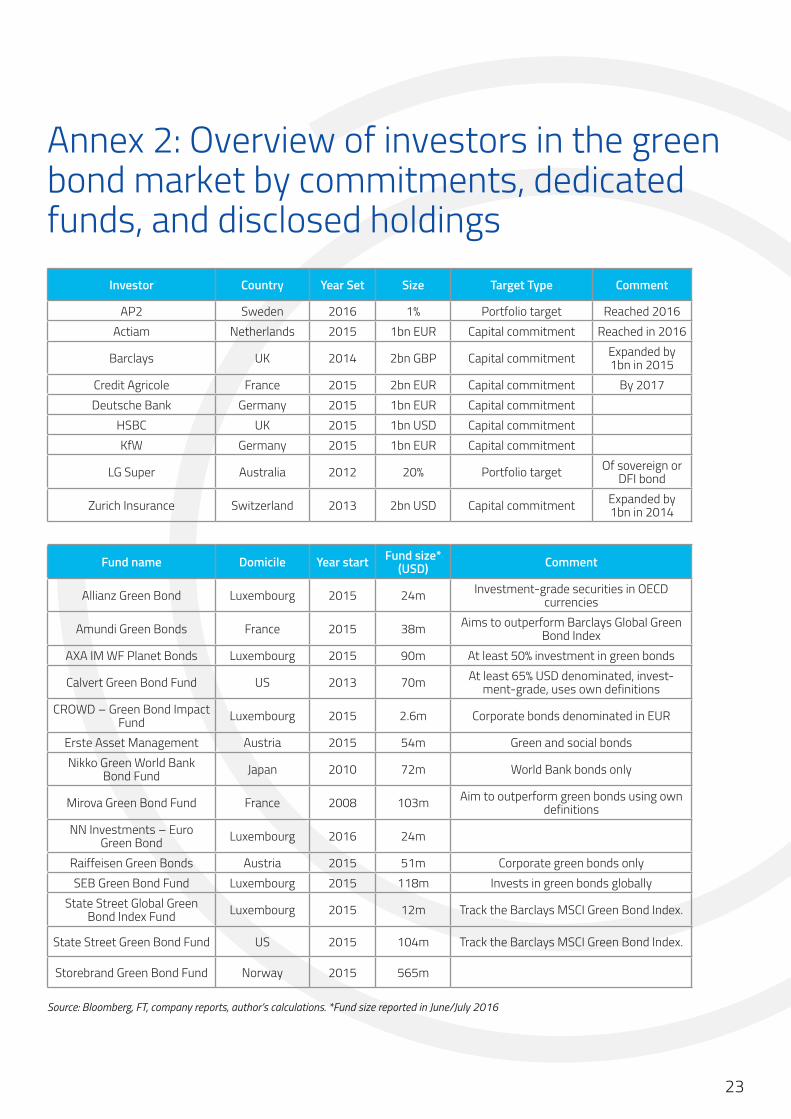
Annex 2: Overview of investors in the green bond market by commitments, dedicated funds, and disclosed holdings
Investor Country Year Set Size Target Type Comment
AP2 Sweden 2016 1% Portfolio target Reached 2016Actiam Netherlands 2015 1bn EUR Capital commitment Reached in 2016
Barclays UK 2014 2bn GBP Capital commitment Expanded by 1bn in 2015
Credit Agricole France 2015 2bn EUR Capital commitment By 2017Deutsche Bank Germany 2015 1bn EUR Capital commitment
HSBC UK 2015 1bn USD Capital commitmentKfW Germany 2015 1bn EUR Capital commitment
LG Super Australia 2012 20% Portfolio target Of sovereign or DFI bond
Zurich Insurance Switzerland 2013 2bn USD Capital commitment Expanded by 1bn in 2014
Fund name Domicile Year start Fund size* (USD) Comment
Allianz Green Bond Luxembourg 2015 24m Investment-grade securities in OECD currencies
Amundi Green Bonds France 2015 38m Aims to outperform Barclays Global Green Bond Index
AXA IM WF Planet Bonds Luxembourg 2015 90m At least 50% investment in green bonds
Calvert Green Bond Fund US 2013 70m At least 65% USD denominated, invest-ment-grade, uses own definitions
CROWD – Green Bond Impact Fund Luxembourg 2015 2.6m Corporate bonds denominated in EUR
Erste Asset Management Austria 2015 54m Green and social bondsNikko Green World Bank
Bond Fund Japan 2010 72m World Bank bonds only
Mirova Green Bond Fund France 2008 103m Aim to outperform green bonds using own definitions
NN Investments – Euro Green Bond Luxembourg 2016 24m
Raiffeisen Green Bonds Austria 2015 51m Corporate green bonds onlySEB Green Bond Fund Luxembourg 2015 118m Invests in green bonds globally
State Street Global Green Bond Index Fund Luxembourg 2015 12m Track the Barclays MSCI Green Bond Index.
State Street Green Bond Fund US 2015 104m Track the Barclays MSCI Green Bond Index.
Storebrand Green Bond Fund Norway 2015 565m
Source: Bloomberg, FT, company reports, author’s calculations. *Fund size reported in June/July 2016