report h-39 brain perfusion 11-29-17
TRANSCRIPT

REPORT
OF THE
H-‐39 TASK FORCE ON CT BRAIN PERFUSION EXPOSURE SURVEY
MEMBERS
Bradley Grinstead, RPS, AL, Chairperson James Lawson, RPS, ND
Teresa Purrington, RPS, MN Denny Gallloway, RPS, CT Sebly Aynachew, RPS, TN
Carole Chafin, Sr., RPS, CA (Former Chair) Jim Cole, Sr. RPS, CA (Former Member)
John Winston, RHP II, PA (Former Member)
H-‐39 ADVISORS AND RESOURCE INDIVIDUALS
Sherry Davidson, AR (Former Advisor) Asfaw Fenta, MD
Andrew Thatcher, WA (Former Advisor) Mary Ellen Jafari, Affil.-WI
Nick Walker, CDRH Doug Pfeiffer, Affil.-CO
Mahadevappa Mahesh, Affil.-MD Cindi-Luckett Gilbert, SNM
Jenny Rollins, NC (Former Advisor) Lynne Roy, Affil-CA
Lynne Fairobent, Affil.-MD Melissa Martin, Affil.-CA
Stephen Vastagh, Affil.-VA Aubrey Godwin, AZ Lisa Bruedigan, TX
CONTACT PERSON H-39 Chairperson, Bradley Grinstead [email protected]
NOVEMBER 2017

ii
REPORT OF THE H-‐39 TASK FORCE ON CT BRAIN PERFUSION EXPOSURE SURVEY
The Conference of Radiation Control Program Directors charged the H-39 Task Force with the following tasks:
1. Review available information regarding the computed tomography (CT) brain perfusion investigation with regard to how the exam is conducted, as well as the available information regarding the recent overexposures primarily in Los Angeles County, California, and other states.
2. Review how the auto mA function works on the different CT units of various manufactures.
3. Prepare a white paper explaining the CT brain perfusion study, any relevant background information related to the operation of the CT units by manufacturer, the initial incident causing concern, and the survey that the Task Force developed as well as the results of the survey.
The white paper should also include some areas of recommendation for adaptation by the interested parties. The white paper should be completed no later than May 1, 2017.

iii
TABLE OF CONTENTS
EXECUTIVE SUMMARY ....................................................................................................................... iv
INTRODUCTION AND PURPOSE ....................................................................................................... 1 THE INITIAL INCIDENT AT CEDARS-‐SINAI MEDICAL CENTER ............................................... 1
Comparison of Dose Using Original & Revised Protocols .......................................... 1 THE BASIC PRINCIPLES OF CT PERFUSION OF THE BRAIN ..................................................... 5
TECHNICAL DESCRIPTION OF CT BRAIN PERFUSION ............................................................... 6 Time/Density Curves ............................................................................................................. 7 CT Perfusion Color Bitmap ................................................................................................... 7 GE 40 mm Field on 16 cm Lucite Phantom ..................................................................... 8 Graph Z ........................................................................................................................................ 8
H-‐39 TASK FORCE SURVEY .............................................................................................................. 10 Map of Participating States ................................................................................................ 11
SUMMARY ............................................................................................................................................. 12
RECOMMENDATIONS ........................................................................................................................ 15
ABBREVIATIONS ................................................................................................................................. 18 REFERENCES ........................................................................................................................................ 19
APPENDIX A -‐ CURRENT BRIEFING ON SIDE EFFECTS ASSOCIATED WITH CT PERFUSION BRAIN SCANS DONE IN ALABAMA ......................................................................... 21
APPENDIX B -‐ DEFINITION OF UNITS OF MEASURE FOR ASSESSING DOSE IN CT .......... 23
APPENDIX C -‐ THE QUESTIONNAIRE RESULTS ......................................................................... 24 APPENDIX D -‐ SPECIFIC CHARACTERISTICS FOR mA MODULATION SYSTEMS .............. 28 General Electric Medical .............................................................................................................. 28 Philips Medical................................................................................................................................ 29 Siemans Medical ............................................................................................................................. 29 Toshiba Medical ............................................................................................................................. 29 Comparison of Manufacturers ................................................................................................... 29
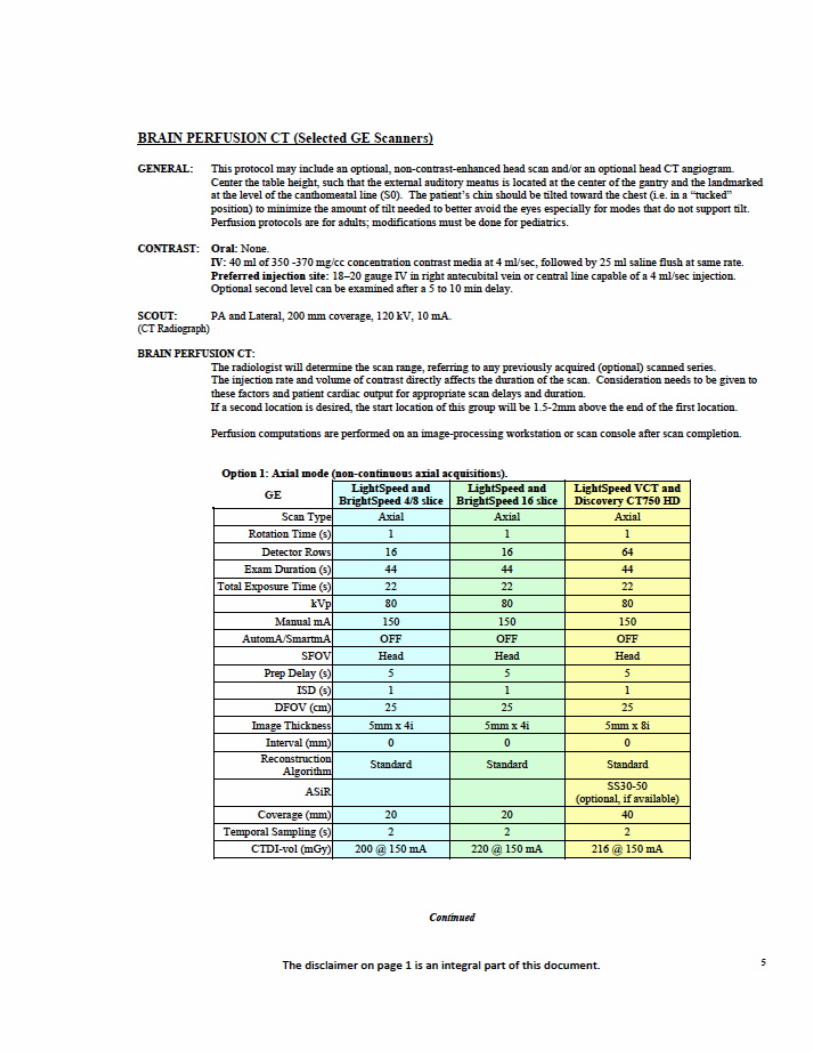
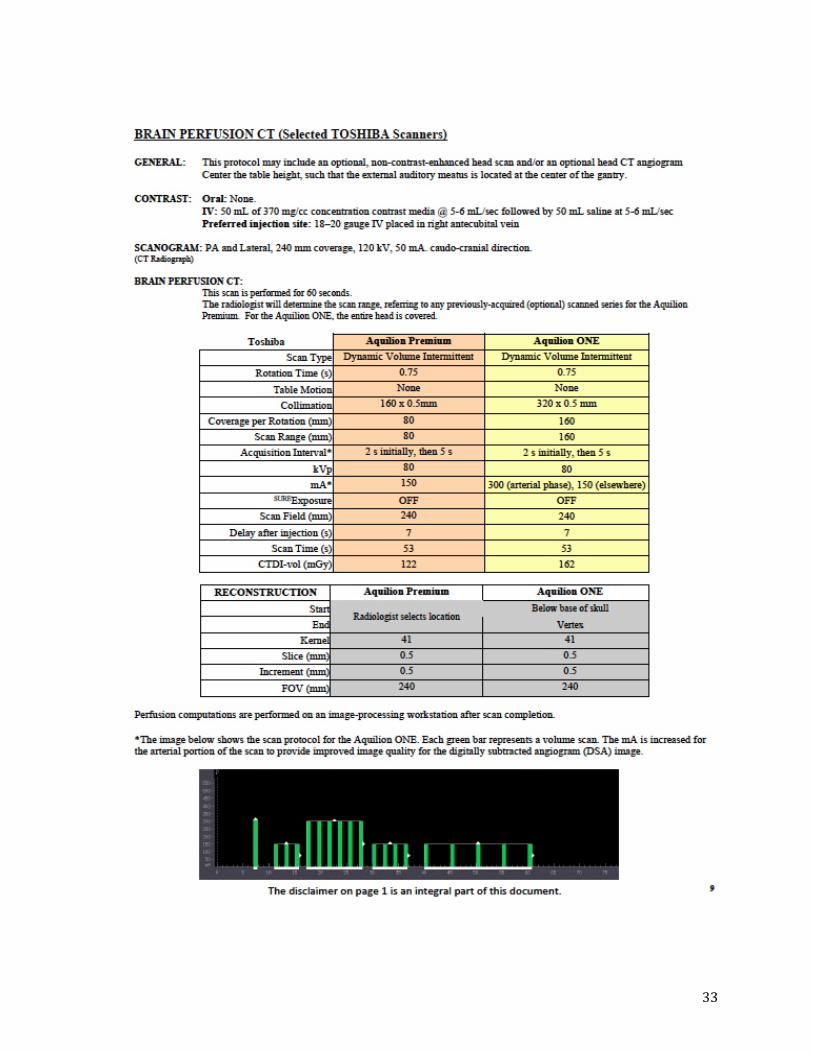
APPENDIX E -‐ AAPM CT PERFUSION PROTOCOL ...................................................................... 31

iv
EXECUTIVE SUMMARY In late August of 2009, Los Angeles County Radiation Management (LACRM) received a report of an incident from Cedars-Sinai Medical Center. Officials from the medical center reported that two patients who had undergone CT brain perfusion procedures were found to have segmental hair loss that presented as a ring around their heads. The cause of this hair loss was not determined immediately but after ruling out other possible causes; the only common link between these patients was the CT procedure. LACRM conducted an on-site investigation of the incident. As of the September 2009 investigation, Cedars-Sinai Medical Center had identified 205 patients who might be affected by this incident. This number later was increased to 269 patients as more information became available. Upon completion of the initial investigation, the investigators from LACRM determined that this incident also could occur at facilities elsewhere in the nation. LACRM alerted the California Radiological Health Branch (CRHB), the U.S. Food and Drug Administration (USFDA) and the Conference of Radiation Control Program Directors (CRCPD) about their initial findings. On October 8, 2009, USFDA issued a “Safety Investigation of CT Brain Perfusion Scans: Initial Notification.” The purpose of this notice was to inform all CT users and regulatory agencies about the incident in Los Angeles County as well as the potential for this to occur elsewhere. Upon the release of these notices, several newspaper articles were published concerning the injuries and legal actions were started on behalf of some of the patients. In late October 2009, representatives of Huntsville Hospital Systems of Alabama contacted the Office of Radiation Control (ORC) of the Alabama Department of Public Health (ADPH). They informed the agency that one of their patients who had received a CT brain perfusion procedure had suffered from segmental hair loss that presented as a ring around the patient’s head. Huntsville Hospital System had just received the USFDA notice when they were told about this patient by the referring physician. Huntsville Hospital System personnel had determined that since they started doing perfusion procedures in 2006, a total of 1900 patients had received this procedure. They further reviewed the most recent records and based on the information available, they determined that there were approximately 55 patients who could possibly be affected in the same way as the patient who reported the injury (side effect). See Appendix A for the Alabama Department of Public Health Office of Radiation Control report on patients at Huntsville Hospital with side effects reported. In February 2010, CRCPD formed the H-39 Task Force on CT Brain Perfusion Exposure Survey. The purpose of this Task Force was to:

v
• develop a survey for use by all state radiation control programs to determine if other facilities were having similar problems;
• evaluate the dose from this procedure, and; • produce a technical white paper to describe this procedure and the
problems associated with it to the CRCPD membership. The Task Force members have now completed their work and are reporting it to the organization. It has been an interesting project. While advancing technology in most cases has reduced patient dose, it also has allowed users to perform new procedures that were not possible before. When doing these new procedures, it was not always obvious to the users that dose would become a problem. There were, however, some occasions where it did. The CT Brain Perfusion study is one example of this. Fortunately, it was determined also that the problem of excess dose appears to be manageable by increased security, administrative procedures, and the watchful eye of a protocol committee.

1
INTRODUCTION AND PURPOSE THE INITIAL INCIDENT AT CEDARS-‐SINAI MEDICAL CENTER
SEPTEMBER 2009 – JUNE 2010
On August 28, 2009, Cedars-Sinai Medical Center contacted LACRM by telephone to report that two patients who had undergone brain perfusion scans had presented with segmental hair loss. The cause of the hair loss was not apparent immediately but, after ruling out other possible causes, the only common link between these patients was the CT procedure. An internal investigation found that the routine brain perfusion protocol had undergone an unauthorized change on February 8, 2008. This date is known because the operating software for the scanner time stamps any alterations to existing protocols. The password protection feature had not been activated. As soon as this altered protocol was discovered, it was quickly removed as an option on the three scanners used for brain perfusion. Despite an in-depth investigation, the facility was unable to determine who had made the protocol changes.
Note that in this report, frequent references are made to terms used in CT radiation dose evaluation. Some definitions and clarification are necessary to aid understanding of the analyzed results. See Appendix B for definitions of:
• Computed Tomography Dose Index (CTDI); • Volume Computed Tomography Dose Index (CTDIvol); • Dose-Length Product (DLP); and • Effective Dose (E).
12
0500
10001500200025003000350040004500
mGy
64 Slice 16Slice
original protocol
Revised Protocol
Comparison of Dose Using Original & Revised Protocols

2
The original protocol (80 kVp, 200 mA, 40 second scan time) delivered a CTDIvol of approximately 500 mGy. The altered protocol (120 kVp, Auto mA, 40 second scan time) resulted in a CTDIvol of 4000 mGy. The dramatic increase in patient exposure was due to the kVp increase from 80 to 120, which accounted for about 40% of the dose increase, and to the use of the auto mA mode. This mode can reduce dose when properly applied, but was in this case employed inappropriately. Sixty percent (60%) of the increased dose was attributable to the use of the auto mA feature, which increased the mA from 200 to 500. LACRM conducted an on-site investigation of the incident that included confirming the reported dose levels with physical measurements and interviewing the physicians, physicists, and technologists. As of the September 2009 investigation, Cedars-Sinai Medical Center had identified 205 patients who were exposed using the altered protocol. Subsequently, additional patients were discovered, bringing the total to 269 patients. It also was noted that the Radiation Safety Officer, medical physicist, physicians (including radiologists) and the CT technologists were not aware that the protocol in use for the brain perfusion examinations resulted in such high patient radiation exposure. The CT scanners at Cedars-Sinai Medical Center are surveyed regularly by the physics staff and all routine protocols are reviewed regularly. Of the thousands of scans performed each month, the brain perfusion scans represented less than 0.005 percent. These factors contributed to the incident:
• absence of password protection of the CT protocols; • color bitmaps that do not reflect the effects of overexposure; • inattention to the dose information provided on the scanner console; and • lack of review of the perfusion protocols.
LACRM alerted the State Radiologic Health Branch, the USFDA, and CRCPD as it became apparent that the incident had national implications and the probability of other facilities having similar incidents was high. Other patients likely were to have experienced hair loss as yet unreported or reported to a primary care physician who had not correlated it with the CT scan. Prior to the Cedars-Sinai Medical Center reporting no one had linked hair loss to a CT brain perfusion scan. All three agencies distributed advisories, alerting CT facilities. The State of California mailed an advisory to every facility with a registered CT scanner. LACRM then contacted every one of the 108 hospitals in the county to determine which hospitals were performing the CT brain perfusion studies. Twelve facilities were identified and on-site surveys were conducted. Two facilities were identified with higher than necessary patient radiation exposures (CTDIvol 2341 mGy and 3520 mGy) and another facility self-reported that it had delivered unnecessary radiation exposure (CTDIvol 3650 mGy). These facilities

3
represented 50 additional patients who had received a higher than necessary exposure. On October 10, 2009, the Los Angeles Times published its first story, and it was soon broadcast on television and radio news. The LA Times published several follow-up articles over the next few months, and the New York Times also picked up the story, which by now was receiving considerable media attention. Consulting with medical physicists from UCLA, LACRM developed and refined an on-site survey protocol, including an interview questionnaire and methods for making physical measurements. Over several months additional information and expertise were obtained. In addition to interviewing facility personnel and measuring current protocols, a review was made of the facilities’ brain perfusion programs from the beginning to determine what, if any changes had been made to the protocols over time. The review was performed by surveying historical data in the CT scanner and/or in the facility’s archived images in the picture archiving and communications system (PACS) from their earliest patients to their most recent. This process was complicated by the fact that some facilities coded the perfusion study under the initial non-contrast brain scan, which made them difficult to distinguish from routine brain scans. In other instances the scanners employed were incapable of recording or the facilities had failed to record the CTDIvol and DLP for earlier exams. In these instances the previous dose values were calculated from physical measurements of the facilities’ current protocols. It became clear that the high level of publicity had resulted in many facilities reviewing and revising their protocols. After survey results were reported for Los Angeles County, the State Radiologic Health Branch requested that LACRM conduct the same surveys throughout the State of California. State regional offices identified facilities within their respective regions and helped to schedule site surveys. Staff from the regional offices also accompanied LACRM inspectors and aided in the survey process. From February 2010 through June 2010, 35 facilities with 47 scanners were surveyed. Of these, two more facilities were found to have delivered unnecessary radiation exposures (CTDIvol 2361 mGy and 2684 mGy) to their patients prior to the Cedars-Sinai Medical Center media attention and the state-issued advisory. Both revised their protocols prior to the onsite visits, and at the time of the survey, their CTDIvol values were 447 mGy and 347 mGy. Of the 62 scanners evaluated in the State of California, 40 units were manufactured by General Electric (GE), 15 by Siemens, and 7 by Toshiba. In California, no Philips scanners were being used to perform brain perfusion studies at that time. The CTDIvol ranged from about 180 mGy to 4270 mGy. Of the 47 facilities surveyed, 25 had revised their original protocols to reduce
4
patient exposures, and of those, 20 had revised their protocols as a result of the Cedars-Sinai Medical Center publicity and/or the site survey. The average CTDIvol prior to the Cedars -Sinai Medical Center publicity and surveys was 1100 mGy, and the 75th percentile was 550 mGy. Following the publicity and surveys, the average CTDIvol was 420 mGy, and the 75th percentile was 360 mGy. Clearly the widespread publicity following the Cedars-Sinai Medical Center incident had a great impact on the actions of other facilities. However, the first surveys were begun before the media coverage began and some facilities were still using inappropriate protocols even after the media coverage. This would seem to indicate that the site surveys and interaction with facility staff affected change in many instances.

5
THE BASIC PRINCIPLES OF CT PERFUSION OF THE BRAIN
Stroke is the third most frequent cause of death after cardiovascular disease and cancer in the United States. There are two main types of stroke, hemorrhagic and ischemic. The former involves a bleed or hemorrhage within the brain and the latter involves a blockage in one or more vessels within the brain. While both conditions may result in the loss of brain tissue due to lack of blood supply, their treatments are quite different. Brain perfusion imaging is a tool for use with ischemic stroke. The treatment success and prognosis can be greatly improved if thrombolytic therapy, an anti-clotting drug and tissue plasminogen activator (TPA or PLAT), a protein involved in the breakdown of blood clots, is administered within the first three hours. Therefore, imaging the brain and its blood flow in a short window of time is crucial in diagnosis and treatment. Many imaging techniques have been developed and applied to evaluate brain hemodynamics. Among these imaging modalities, CT perfusion is an active and informative imaging method, which provides rapid evaluation of patients presenting with acute stroke symptoms. With cerebral CT perfusion imaging, it is possible to diagnose ischemia early and gather information about the extent and severity.

6
TECHNICAL DESCRIPTION OF CT BRAIN PERFUSION Brain perfusion scans are performed using conventional multi-detector CT scanners. A bolus, typically 40-50 mL of 350 to 370 mg/cc iodinated contrast material, is administered at 4-6 mL/sec either via a central line or intravenously via the right anticubital vein. This is followed by 25-45 mL saline. Perfusion studies are obtained by monitoring the first pass of a contrast bolus through the cerebral vasculature. There is a linear relationship between contrast agent concentration and attenuation, with the contrast agent causing a transient increase in attenuation proportional to the amount of contrast agent in a given region. Contrast agent time-concentration curves are generated in an arterial region of interest (ROI), a venous ROI, and in each pixel. Deconvolution of arterial and tissue enhancement curves, a complex mathematical process, provides the mean transit time (MTT) and the time to peak (TTP). There is a direct correlation between these values and cerebral perfusion pressure. In clinical studies on strokes, the MTT and TTP were found to be very sensitive to disruption in regional perfusion of the brain. Pathological MTT and TTP values are found both in the infarct core and in the surrounding area. Cerebral blood volume (CVB) is defined as the percentage of blood vessels in a specific volume of tissue. Highly vascularized areas of the brain such as the basal ganglia or cerebral surface have a higher CBV than the less vascularized cerebral white matter. Therefore, any changes in the density of these regions would indicate the presence or absence of an ischemic region. CBV is calculated by the area under the curve in a parenchymal pixel divided by the area under the curve in an arterial pixel. The central volume equation can then be solved for cerebral blood flow (CBF). CBF is the most important parameter in the brain perfusion sequence. It indicates the volume of blood flowing through the brain tissues in a specific period, and it is measured in mL/100g brain tissue/minute. Normal values for CBF are between 20 and 80 ml.

7
Time/Density Curves Typical time/density curves after injection of a contrast medium bolus in perfusion CT. The density sequences are imaged (idealized view) in an arterial vessel (middle branch of the cerebral artery: blue), a venous vessel (confluence of sinuses: yellow) and in the cerebral parenchyma (thalamus: red). Note the typical staggered time between the arterial and venous time/density curves and the flattened and slightly delayed density sequence in the parenchyma compared with the arterial curve (Figure adopted from Fig. 22. Wiesman Martin, http://www.visions-iournal.com/GB-2006-V09/S06-08.pdf.) A CT brain perfusion scan differs from typical CT scans of the brain in that it images the same portion of anatomy continuously for 40 to 60 seconds. The routine CT brain scan covers a larger volume with each rotation imaging an adjacent slice of anatomy in a much shorter time (15 seconds or less). The perfusion scan CTDIvol is typically 500 mGy. The routine CT brain scan CTDIvol is typically around 60 mGy. Additionally, the perfusion scan differs in that the data collected during the CT scan is used to formulate colored bitmap images of the contrast perfusion within the brain. Unlike standard CT images, the effects of under or overexposure to patients are not readily observable in the color bitmaps. CT scanner operating systems come with manufacturer suggested protocols. A protocol is defined as a collection of settings and parameters that fully describe each CT examination. These protocols specify the technical factors used by the x-ray tube during imaging, data collection and reconstruction routines, and may include notes on patient positioning and contrast volumes and timings.
CT Perfusion Color Bitmap

8
The manufacturer’s protocols may be used by a facility or modified to suit the facility’s preferences. Brain perfusion protocols are usually included with most new scanners, but an additional software module must be purchased to perform perfusion studies. This software contains the algorithms that describe the cerebral blood flow and a graphics engine to produce the color bitmaps. A typical CT brain perfusion study consists of three scans:
1. a non-contrast brain scan from the skull base to the vertex; 2. an angio brain scan with contrast from aortic arch to the vertex, and; 3. a perfusion scan.
There are slight variations in procedure and the order of scans from one facility to another. CT perfusion is an axial scan over a prescribed portion of the brain, typically including the circle of Willis. The length of the scan is determined by the volume of interest and also by the limitations of the scanner model. Various manufacturers and models range from 10mm to 160mm maximum beam collimation thickness. Some facilities utilizing smaller volume scanners may perform two adjacent scans to increase the coverage volume. This also increases the patient exposure, particularly along the field intersect. Other facilities utilize a shuttle or toggle mode in which the table is moved from one scan field to the other alternately. Because the scanned volume is larger and the beam on time is the same, the calculated dose is lower than for a stationary scan. Some scanner models also provide for pulsing of the x-ray beam. This involves turning the beam on and off during the scan, reducing the total beam on time and therefore the exposure. The patient exposure in every CT study is influenced by many parameters such as tube voltage (kVp), current (mA), collimation, scan time, table speed, etc. The changing of any one of these parameters will have a profound effect on patient exposure. (See Graph Z.)
Graph Z
0
GE 40 mm Field on 16 cm Lucite Phantom

9
To this point we have discussed brain perfusion imaging in connection with ischemic stroke. During the investigations in Los Angeles County, the State of California, and subsequently the H-H-39 Task Force national survey, it was learned that there are other uses for this type CT scan, including:
• vasospasm; • carotid stenosis; • acetazolamide challenges; • traumatic brain injury; • certain tumors of the brain, and; • as a forecast of suspected stroke.
Initially the focus was on certified stroke centers as the most likely to be using this procedure. In retrospect, some of the facilities surveyed were not stroke centers, some did not even have emergency facilities, and a few were non-hospital imaging centers.

10
H-‐39 TASK FORCE SURVEY
In February 2010, CRCPD formed the H-39 Task Force on CT Brain Perfusion Exposure Survey. The Task Force was charged with developing a survey and compiling the results so that state radiation control programs could use it to determine if incidents similar to what occurred in California and Alabama could take place in their state. Because of the urgency of the investigation, questions for the survey interviews were developed while the site visits were underway. Some questions were added later and do not have results from the facilities that responded earlier. Some questions were answered unknown or not answered because the individuals interviewed were not able to obtain the information. See Appendix C for a breakdown of the questionnaire results. As discussed previously, LACRM inspectors found four facilities that had administered higher than necessary exposures during CT brain perfusion studies, and an additional two facilities were found during the statewide survey. A national survey was deemed prudent to more completely evaluate the potential for further incidents. The Task Force held several conference calls and face-to-face meetings to craft a questionnaire, using the one developed by the LACRM as a model. The survey would give the Task Force the ability to identify factors contributing to the administration of unnecessary radiation exposure as a result of CT brain perfusion studies and to determine how widespread these occurrences might be. Because the scope of the H-39 Task Force survey was national, it was necessary to develop survey techniques that would be usable by all state programs, which vary widely in personnel and resources. Three protocols were developed for this purpose.
1. The first was based solely on a telephone interview, during which the facility would be contacted and identified as a facility performing CT brain perfusion. These facilities would be surveyed by completing the questionnaire over the phone. This method was included to be accessible to those states with very limited programs.
2. The second protocol was intended for programs with the capability to make site visits to facilities in their jurisdiction, but possibly without the instrumentation necessary to make physical measurements of the CT scanners. This method was believed to be more likely to reach the key personnel within the radiology departments involved in the CT perfusion studies. This method would allow the questions to be answered more completely.

11
3. The third method, like the second, involved site visits but included instructions for making physical measurements on the CT scanners.
Once the questionnaire, instructions, and cover were finalized, packets were sent to the state programs. CRCPD posted the questionnaire as an online survey. This allowed the state regulatory bodies to upload their survey results.
Map of Participating States
28 States res306 scanners report
e28
306 scanners reported 28
28 States responded 223 facilities surveyed 306 scanners reported

12
SUMMARY
Regional blood flow and perfusion of the brain have been studied in many institutions using CT scanners. The advantage of the perfusion CT compared to other modalities is that the perfusion CT can be performed easily and rapidly in the emergency setting and that CT scanners are readily accessible. Imaging parameters, such as x-ray tube voltage, tube current, scanning time, and collimation, are important factors in determining how much radiation will be administered to a patient. Therefore, it is imperative to understand and evaluate contributing factors in CT brain perfusion procedures in order to prevent unnecessary exposure. Some of the facilities where patients received unnecessary exposure were certified stroke centers. A method to designate stroke centers, such as the Joint Commission standards, may be used to ensure that centers have the expertise and resources to provide modern stroke care. Based on the guidelines published by the American Heart Association (AHA) and American Stroke Association (ASA), the certification provided to the stroke centers is based on the breadth of their operation and capabilities. At this time, ASA and the Joint Commission lead the formal certification process, which includes a detailed evaluation of a hospital’s:
• staffing; • education; • disease management programs; • outcomes, and • infrastructure.
Because CT dose was just beginning to raise concerns prior to the Cedars-Sinai Medical Center incident, it is not surprising that CT protocols were not evaluated in the certification process. This would certainly be an important addition in the future. Similarly, nearly half of the procedures in question were performed by technologists with American Registry of Radiological Technologists (ARRT) advanced certification in CT. The survey revealed that prior to the Cedars-Sinai Medical Center incident and accompanying publicity, little attention was paid to the significance of the dose values reported by the scanner. In many facilities these values were not recorded, forwarded to the interpreting physician, or reviewed in any way. An emphasis on CT dose should be included in the material covered by technologist certification programs.

13
Additionally, the accreditation of CT scanners did not prevent any of the incidents that occurred in facilities whose scanners had undergone the process. As rigorous and thorough as the ACR accreditation process is, its focus is on the mainstream exams;
• adult head; • adult body; • pediatric head, and • pediatric body.
This was added to the American College of Radiology (ACR) Quality Control (QC) manual in 2012. A consideration going forward might be to accredit scanners according to their clinical application, i.e. coronary, virtual colonoscopy, brain perfusion, total body, positron emission tomography (PET), etc. Many of the facilities surveyed reported their protocols were developed in collaboration with the CT manufacturer. The survey revealed different protocols on the same model scanner. This seems to indicate that the information received from manufacturers was not always consistent. Again, the significance of dose factors was not clearly understood or emphasized in the formulation of protocols. For examples of recommended protocol for performing scans with the minimum amount of radiation required to obtain the necessary diagnostic information, see Appendix E for the American Association of Physicists (APPM) CT Perfusion Protocol. One thing still not clear is the requirements of the reconstruction software that creates the color bitmaps for the brain perfusion study. The images produced by the perfusion study are not traditional CT images, but are color bitmaps representing the blood flow within the brain. The minimum amount of information required to produce a diagnostic bitmap is not clearly understood. This has been demonstrated by the fact that the CTDI from some protocols has been reduced by half with no perceptible degradation of the color maps. It seems that the approach to creating perfusion protocols relied too heavily on the assumptions of regular CT images with regard to the kVp and mA selections. Because the perfusion study was preceded by and followed by routine CT brain scans, it must have seemed logical to use similar settings for the perfusion study even though the images produced were quite different. It has been demonstrated by this whole process that radiation protection is a team effort. Everyone in the imaging chain, including the manufacturer, application specialist, radiologist, physicist, and technologist, must all work together to achieve quality diagnostic information at the lowest exposure necessary. It could be said that it was a perfect storm of events that led to the initial incident in California. Digital technology is the area of low pressure in

14
which that storm is formed. Computers have made many new capabilities possible, but they also have blinded some users. Some have relied on the computer’s accuracy and reproducibility and became lax in individual observations. In the old world with previous technology, there was a box on the floor where all the rejected films used to go. Someone was tasked with reviewing those films periodically. Over or under exposures, inaccurate patient positioning and processor imbalances were easily identified and corrections were made. In today’s world, the only image that is seen is a post processed, perfectly windowed and leveled, tightly collimated image that may not reflect how the image is produced. In many of the facilities surveyed prior to the Cedars-Sinai Medical Center publicity, CT protocols were not reviewed and the dose information provided on the scanner console was not understood by the technologists, forwarded to the radiologist’s work station or recorded in any way. Because inappropriate protocols were listed in the scanner library, they were not questioned, and it was assumed that because they were in the computer they must be correct. One instance during the survey process, reported by a facility and unrelated to any brain perfusion study, illustrates the importance of close observation. A technologist prepared to scan a pediatric patient and intended to reduce the exposure by reducing the mA from 120 to 80. The technologist selected the mA field and changed it to 80. At that point a drop down menu appeared with mA selections. The technologist selected 80 mA from the list and the scanner prepared to perform the scan. Prior to initiating the scan, the technologist previewed (this was after the Cedars-Sinai Medical Center publicity) the expected dose values presented on the console and found it to be unusually high. A recheck of the protocol revealed that the scanner had reset to 800 mA. Subsequently, a service engineer confirmed that by highlighting the mA field and replacing it, or by selecting from the drop down menu, the scanner accepted the correct mA setting. If both operations were performed the scanner defaulted to an incorrect mA setting. The technologist, because of the Cedars-Sinai Medical Center publicity and the increased discussions of the incident, was more alert to the details and was checking and recording dose values for all CT patients. The increased scrutiny prevented an unnecessary radiation exposure to the pediatric patient.

15
RECOMMENDATIONS
Based on the analyzed data, the following points are recommended by the H-39 Task Force Task Force on CT Brain Perfusion Exposure Survey.
• Radiologists and technologists should be familiar with and aware of the dose indices normally displayed for perfusion studies on the CT scanner console. These indices include the CTDIvol and DLP.
• The findings highlight the importance of CT quality assurance (QA)
programs. These should include regular reviews of CT protocols by a physicist with expertise in CT, the testing of scan protocols on phantoms, and the monitoring of actual doses received by patients for each type of CT protocol. This shall include new protocols, any change in a protocol, and any modification or upgrade of the CT unit itself.
• Hospitals should have a designated person in charge of ensuring that all
CT protocols respect and apply the principle of assuring radiation exposure is as low as reasonably achievable (ALARA).
• Evidence based guidelines (standards) should be used to evaluate brain
perfusion protocol variation within and among institutions. These guidelines should be limited to those available from nationally known experts such as American College of Radiology (ACR).
• Annual accreditation of the CT scanners, such as ACR, provide standard
criteria for the scanners and reduce the probability of operating a CT unit that may deliver excessive radiation doses.
• The CTDIvol and DLP doses displayed for each brain perfusion study
should be documented in the patient’s medical record. • A CT technologist should not define or decide on the region of brain to be
scanned, and only a qualified medical professional such as a radiologist should decide on the region of brain for scanning.
• Certification of the CT technologists by national or state authorities has
not increased the awareness of the technologists concerning their responsibility and immediate reaction in cases when elevated doses are
16
observed in a brain perfusion study. Technologists and radiologists must be educated regarding the importance of minimizing radiation doses.
• Facilities must monitor delivered doses and compare them with recognized standards. Facilities that could not meet the standards should not be certified to conduct CT studies.
• In a CT scanner operation, one person should be responsible for
reporting a problem in cases where the patient is receiving excessive radiation doses. The technologist should report these conditions to the interpreting physician prior to starting procedure.
• Protocols should be password protected so that unauthorized users
cannot modify the protocol. The password should be be restricted to use by the physicist if readily available or a supervising physician.
• Changes in the protocol should be made by authorized individuals, after
review by a team including a medical physicist, radiologist and lead CT technologist. This team should justify any modification of the protocol.
• CT protocols and techniques must be optimized and standardized by
means of an organized and systematic approach. This will minimize the risk of error attributable to any individual’s decision about which protocol to use. Physicians must be specific about which protocol they are ordering.
• Unnecessary radiation doses must be reduced by improvement in
equipment by manufacturers. Manufacturers should revise their protocols and the exposure factors to reduce the output of their equipment when possible, while still achieving the clinical aim of the procedure. Manufacturers should incorporate safeguards against radiation overdosing into equipment design.
• Manufacturers should provide adequate and specific training for
personnel (technologists and radiologists) on their machines when sold and installed in a facility.
• CT scanners should not exceed 80 kVp in their brain perfusion protocols
because higher kVp would result in reduced iodine contrast and elevated CTDIvol and consequently excessive radiation doses to the patients. CT scanners should not exceed 150 mA in their brain perfusion protocols because higher tube current (mA) would result into elevated CTDIvol and hence excessive radiation dose to the patient.

17
• In order to minimize the radiation dose to the patient, the total scan time should be kept below 60 seconds, as shorter scanning times lead to less radiation dose to the patient.
• CT scanners should operate in pulsed mode rather than continuous mode in order to reduce the CTDIvol in the brain perfusion protocols.
• Reference values or levels should be defined and stated for the brain perfusion CT procedure. When the reference levels are exceeded, the physicist should investigate and determine the cause in cooperation with the radiologist in order to minimize patient dose.
• Programming a maximum mA limit would prevent the CT scanner from
elevating mA automatically at thicker body parts including the base of the skull.
• CT technologists should receive consistent education about what
radiation doses are excessive in CT studies.
• Guidelines should be defined for what radiation doses are reasonable or achievable for CT brain perfusion.

18
ABBREVIATIONS
AAPM American Association of Physicists in Medicine AART American Registry of Radiological Technologists ACR American College of Radiology ALARA As Low As Reasonably Achievable ASA American Stroke Association CBF Cerebral Blood Flow CBV Cerebral Blood Volume CRHB California Radiological Health Branch CT Computed Tomography CTDI Computed Tomography Dose Index CTDIvol Volume Computed Tomography Dose Index DLP Dose-length Product E Effective Dose FOV Field of View GE General Electric IAC Intersocietal Accreditation Commission kVp Tube Voltage LACRM Los Angeles County Radiation Management mA Current MDCT Multi-detector Computed Tomography MTT Mean Transit Time NCRP National Council on Radiation Protection and Measurements PACS Picture Archiving and Communication System RIO Region of Interest TTP Time to Peak ORC Office of Radiation Control, Alabama Department of Public
Health PET Positron Emission Tomography QA Quality Assurance QC Quality Control RT Registered Technologist USEPA U.S. Environmental Protection Agency USFDA U.S. Food and Drug Administration
19
REFERENCES
Adams et al. 2007. Guidelines for the early management of adults with ischemic stroke. Stroke 2007: 1655-1711. American Association of Physicists in Medicine. 2008. AAPM Report No. 96. The Measurement, Reporting, and Management of Radiation Dose in CT. Report of AAPM Task Group 23:2008:1-28. Cohnen, M. et al. 2006. Radiation Exposure of patients in Comprehensive Computed Tomography of the Head in Acute Stroke. AJNR 2006: 27:1741-1746. CRCPD. 2009. Computed Tomography Protocol Reviews. Lexington, Kentucky: CRCPD, October 2009. Eheman, C.R., P. Garbe, and R.M. Tuttle. 2003. Autoimmune thyroid disease associated with environmental thyroidal irradiation. Thyroid 2003:13:453-464. Hall P. et al. 2004. Effect of low doses of ionizing radiation in infancy on cognitive function in adulthood: Swedish population based cohort study. BMJ 2004:328. Hamberg et al. 2003. Multi-Detector Row CT: Radiation Dose Characteristics. Radiology 2003:226:762-772. Henk, J.M., R.A. Whitelocke, A.P. Warrington et al. 1993. Radiation dose to the lens and cataract formation. International Journal of Oncology, Biology and Physics 1993:25:815-820. Imanishi, Y, A., H. Fukui, H. Niimi et al. 2005. Radiation-induced temporary hair loss as a radiation damage only occurring in patients who had the combination of MDCT and DSA. European Radiology 2005:15:41-46. Kalra, M., M.M. Maher, T.L Toth et al. 2004. Strategies for CT Radiation Dose Optimization. Radiology 2004:230:619-628.

20
Ledezma, C.J., and M. Wintermark. 2009. Multimodal CT in Stroke imaging: New Concepts. Radiol Clin North America 2009:47(1):109-116. Lee, C.L., A.H. Haims, E.P. Monico, J.A. Brink, and H.P. Forman. 2004. Diagnostic CT scans: assessment of patient, physicians, and radiologist awareness of radiation dose and possible risks. Radiology 2004:231:393-398. Merriam, G.R., Jr., E.F. Focht, and R.W. Parsons. 1969. The relative radiosensitivity of the young and the adult lens. Radiology 1969:92:1114-1115. National Council on Radiation Protection and Measurements. 1993. Limitation of exposure to ionizing radiation. NUCRP report 116. Bethesda, Maryland: National Council on Radiation Protection and Measurements, 1993. Pierce, D.A., and D.L. Preston. 2000. Radiation-related cancer risks at low doses among atomic bomb survivors. Radiation Research 2000:154:178-186. Rehani, M.M. and M. Berry. 2000. Radiation doses in computed tomography: the increasing doses of radiation need to be controlled. BMJ 2000:320:593-594. Ron, E., J.H. Lubin, R.E. Shore et al. 1995. Thyroid cancer after exposure to external radiation: a pooled analysis of seven studies. Radiation Research 1995: 141:259-277. Smith et al. 2007. Radiation Dose-Reduction Strategies for Neuroradiology CT Protocols. AJNR 2007:28:1628-1632. Smith-Bindman, R. 2010. Is Computed Tomography safe? NEJM:2010:1-3. Tack, D. and P.A. Gevenois. 2004. Radiation dose in computed tomography of the chest. European Respiratory Monograph 2004:30:39-50. Wiesman, Martin. http://www.visions-iournal.com/GB-2006-V09/S06-08.pdf Wintermark, M. et al. 2000. Using 80 kVp versus 120 kVp in Perfusion CT Measurement of Regional Cerebral Blood Flow. AJNR 2000:21:1881-1884.

21
APPENDIX A CURRENT BRIEFING ON SIDE EFFECTS ASSOCIATED WITH CT
PERFUSION BRAIN SCANS DONE IN ALABAMA JULY 16, 2010
The Agency was informed of side effects from CT Perfusion Brain Scans during October 2009. We were informed by a registrant that a patient had recently come to them with side effects. This all occurred about the time the FDA sent out their notice on this. The agency had not been informed of FDA's actions prior to receiving a copy of it from our registrant. Due to this, the Office of Radiation Control sent out an Information Notice/Request for Information to all hospitals that had CT machines. We further sent copies of this same notice to Jefferson County Health Department so they could inform the hospitals there. There were one hundred and four notices sent out, from which we received seventy responses. We determined that there were four hospitals performing this specific procedure and that only one had side effects reported to them. We have determined that the thirty hospitals that did not answer were small rural facilities that did not treat stroke patients and therefore did not answer. The one hospital in Alabama that has seen patients with side effects was Huntsville Hospital. They informed the Office of Radiation Control that the CT Brain Perfusion Examination was first done in 2006. Since that time it had been done on approximately 1,900 patients. When they were informed that side effects could occur, they reviewed all of the patient doses and determined that approximately 60 patients received doses large enough to make such side effects possible. These patients were all sent letters informing them of this and asking them to contact Huntsville Hospital for further consultation. Huntsville Hospital was contacted today to get further information on these sixty patients. A risk management representative informed the caller that some of the 60 patients did telephone the hospital and that the conversations were documented in a logbook. She further stated that she was not aware of any other letters being sent to the sixty patients or that they were providing any follow-up care. The hospital representative who is responsible for this program was not available at the time of this conversation. Therefore further information may become available within the next week after he returns from vacation. Huntsville Hospital has had three patients report side effects to them. One patient was discovered when they came in for a follow-up visit with the

22
radiologist. The other two were discovered when they came in asking for further information about their scans, including dose information. When the hospital did the research for these three cases, it was discovered that all three had received similar doses. The CTDIvol for the three examinations were 5.7, 5.8, and 5.9 Gray. All of the examinations were conducted at 120 kVp with a 20 mm slice thickness. The mA was recorded as 460, 465, and 470. There is no further information available on these patients.

23
APPENDIX B
DEFINITION OF UNITS OF MEASURE FOR ASSESSING DOSE IN CT In this report, frequent references are made to terms used in CT radiation dose evaluation. Some definitions and clarification are necessary to aid understanding of the analyzed results. The Computed Tomography Dose Index (CTDI) is the primary dose measurement concept in CT. The Volume Computed Tomography Dose Index (CTDIvol) provides a dose parameter, based on the average dose within a prescribed volume. The units of CTDIvol are milliGray (mGy). CTDIvol is the average dose within the scan volume to a standard (CTDI) phantom for a specific exam protocol. The CTDIvol values are usually displayed on the scanner console. To better represent the overall energy delivered by a given scan protocol, the dose can be integrated along the scan length to compute the Dose-Length Product (DLP). DLP (mGy-cm)=CTDIvol (mGy) x scan length (cm) The DLP reflects the total absorbed energy attributable to the complete scan acquisition. The DLP is also displayed on the CT console. Values of such reference dose quantities provide useful indications of relative patient exposure for a given type of procedure. These dose values are useful indicators for comparison but do not represent the actual dose to the patient. DLP may be used to derive broad estimates of Effective dose (E) using an organ specific coefficient. It is important to recognize that biological effects from radiation not only depend on the radiation dose to a tissue or organ, but also on the biological sensitivity of the tissue or organs irradiated. Effective dose is a dose parameter that reflects the risk of a non-uniform exposure in terms of an equivalent whole-body exposure. The units of effective dose are Sieverts (Sv). New and more accurate methods of calculating patient dose are being developed. Such methods would consider the radiosensitivity of the tissues and organs being exposed and the contribution of scattered radiation, and would seek to more accurately identify risks for all x-ray exposures.

24
APPENDIX C
THE QUESTIONNAIRE RESULTS
Because of the urgency of the investigation, questions for the survey interviews were developed while the site visits were underway. Some questions were added later and do not have results from the earlier facilities. Some questions were answered “unknown” or not answered because the individuals interviewed were not able to obtain the information. Some percentages may exceed 100% because multiple answer may apply, such as in the case of multiple accreditations.

25
Facility specific questions
Responses
1. Is the facility a “certified stroke center”?
73% YES 22% NO 5% Ukn
2. If yes, by whom?
87% Joint Commission 2% DNV1 11% Other
3. Is the CT scanner accredited?
48% YES 44% NO 8%
4. Accredited by: 96% ACR 6% Joint Commission 1% IAC
5. Date the facility first performed brain perfusion study:
<2000 7 2001 2 2003 11 2004 11 2005 18 2006 20 2007 24 2008 34 2009 48 2010 22
6. Number of patients per year:
0-100 142 100-500 40 500-1000 7 >1000 6
7. What percentage are pediatric patients?
No pediatric patients were reported.
8. How many technologists perform CT brain perfusion studies?
2874 with 209 facilities responding
9. How many of the technologists are ARRT-CT certified?
2028 with 193 facilities responding
11. Is there a procedure for 70% YES
1 international accredited registrar and classification society

26
Facility specific questions
Responses
reporting unusual or excessive CTDIvol or DLP?
25% NO 5% Ukn
12. Who is supervising/interpreting the brain perfusion study?
49% Radiologist 60% Neuroradiologist 7% Neurologist
13. Is a dose report provided to the interpreting physician?
92% YES 7% NO 1% Ukn
14. If yes, does the interpreting physician review the dose report?
74% YES 9% NO 17% Ukn
15. Was the dose report provided since the facility began brain perfusion studies?
58% YES 36% NO 6% Ukn
16. If no, indicate the date that the dose report was made available for review.
Before September 2009 30 After September 2009 37
17. Is patient dose information permanently recorded?
93% YES 4% NO 3% Ukn
Scanner Specific Questions
Responses
1. Units by manufacturer: 54% GE
23% Siemens 12% Philips 11% Toshiba
2. Units by detector configuration (slice):
320 = 7 256 = 2 128 = 7 64 = 142 40 = 3 16 = 40 8 = 3 4 = 3
3. Date of manufacture:
November 2000 to August 2010

27
Scanner Specific Questions
Responses
4. Specify the protocol(s) used for brain perfusion studies:
Current average 86 kVp Current average 200mA Previous average 91 kVp Previous average 220mA
5. Has the protocol been changed since the facility began performing the study?
YES 53% NO 47%
6. If question 5 yes, what was the reason for the change?
Reduce patient dose 79% Other 21%
7. Who initiated the change?
Manufacturer’s advice 21% Internal decision 78%
8. Does facility have a procedure for changing a protocol on the scanner?
79% YES 16% NO 5% Ukn
9. Are the protocols password protected?
50% YES 46% NO 34% Ukn
28
APPENDIX D SPECIFIC CHARACTERISTICS FOR mA MODULATION SYSTEMS AMONG
THE FOUR MAJOR MANUFACTURERS OF MEDICAL CT IMAGING SYSTEMS
There are four major manufacturers of CT imaging systems that are being used in U.S. healthcare facilities today:
• General Electric (G.E.); • Philips; • Siemens, and; • Toshiba.
Each of these corporations has developed software that allows the mA to be changed during an examination, during successive exposures (slices) and also during the acquisition of an individual slice. An examination of each of these systems and an attempt to highlight the differences between them follows. General Electric Medical GE Medical has named their mA modulation systems AutomA and SmartmA. To use the software, an operator must first take a scout image, which is acquired without tube rotation, (A/P and or lateral) translating the table over the desired range. The scout image is used to determine the patient size and maps out densities along the Z-axis that are changing because of varying anatomical thickness and density differences in the underlying structures. If more than one scout image is acquired, the last scout is used for this determination. The system utilizes a Noise Index (NI), which determines the amount of noise in the resulting images, a maximum mA, and a minimum mA. The NI is usually exam specific. All of these values are preset by the facility and typically are not changed by the operator. The software will then evaluate data from each rotation against the NI and change the mA for the subsequent rotation to maintain the predetermined value. AutomA accommodates varying patient sizes and varying attenuation along the Z-axis. SmartmA was developed to compensate for density differences along the X and Y axes. This software adjusts the mA during a single rotation in a sinusoidal manner in addition to the variations previously discussed. This is generally used when performing examinations of the chest, abdomen, and pelvis, as most patients are more attenuating in the lateral direction than in the A/P direction. Note that SmartmA is not appropriate for rotund patients with a roughly circular body habitus.

29
Philips Medical Philips Medical has termed their mA modulation systems DoseRight ACS, DoseRight Z-DOM, and DoseRight D-DOM. As with GE, a scout image (Surview) must be obtained. The scout determines the patient size and maps the changes in density along the Z-axis due to varying patient thickness and density differences in the underlying structures. The DoseRight ACS function is an auto current selector. This software takes the information from the scout and determines the mA needed for the patient’s overall size based on maintaining a predetermined image quality from a pre-established reference image. The mA is set for 98% of the maximum body diameter and does not vary in the X, Y, or Z-axis directions. The DoseRight Z-DOM is similar to the GE AutomA and performs Z-axis mA modulation by determining attenuation changes along the Z-axis and setting mA to achieve the desired noise level. DoseRight D-DOM is used to compensate for changes in angular attenuation. Note, however, that at least one study has shown that dose reduction is greater with Z-DOM than with D-DOM, since it does not allow for variations along the Z-axis. The D-DOM and Z-DOM functions cannot be used simultaneously, but both must be used with the ACS. Siemans Medical Siemens Medical has named their mA modulation system CAREDose 4D. Unlike GE and Philips, Siemens decided to build one mA modulation platform for all three types of modulation. As with the others, a scout image (topogram) is required. This data then is used to determine the patient size, which is then combined with a reference mAs that has been established by the facility for the procedure. The system then determines an mA baseline that varies along the Z-axis. During the helical exposure, the system monitors the attenuation in real time and makes adjustments to the mA in the X-Y plane based on that attenuation. The result is an mA variation in all three directions based on the specific attenuation of the patient. Toshiba Medical Toshiba Medical has named their mA modulation system Sure Exposure 3D. The system is initiated by obtaining two scout exposures (scanogram). The radiographs collect data from the X-axis and then the Y-axis. The system makes use of the A/P and lateral patient attenuation to determine the oscillating tube current modulation during each gantry rotation and along the Z-axis. The system allows the operator to define the range within which the tube current can be modulated by selecting minimum and maximum mA limits. Comparison of Manufacturers

30
When comparing the mA modulation methods employed by the four manufacturers, it appears they can be placed into two groups.
1. The first group is the method of General Electric and Philips, both of which decided to create a program to evaluate the subject by the Z-axis and another to evaluate the X/Y-axes during the rotation. (Note that Philips actually developed two programs to evaluate the Z-axis at the same time.)
2. The second group, Siemens and Toshiba, chose to have one program for mA modulation that handles everything. CAREDose 4D and SureExposure 3D both utilize scout information related to the X, Y & Z-axes to plug into an algorithm that determines the modulation of the mA throughout the scan. The Toshiba system has a feature that allows the operator to turn off the angular (X/Y) modulation when it is not needed.
In all cases, the scout images must be acquired using the same kVp that will be used for the mA modulated sequences. Also, these systems only work in the helical mode. All mA modulation schemes are designed to lower patient dose while maintaining consistent image quality for the physician. When used properly, all accomplish this goal with varying degrees of success. However, many user-dependent issues can limit, negate, or reverse the gains these systems provide. Improper patient position can easily lead to increased patient dose. If the reference mA or noise goals are set improperly, patient dose may be increased rather than decreased, or suboptimal images may result.

31
APPENDIX E AAPM CT PERFUSION PROTOCOL
To ensure that CT scans are performed using the minimum amount of radiation required to obtain the diagnostic information for which the CT scan was ordered, AAPM is committed to the publication of a set of reasonable scan protocols, summarizing the basic requirements of the exam and giving several model-specific examples of scan and reconstruction parameters. The provided protocols are considered by the Working Group to be reasonable and appropriate to the specified diagnostic task. http://www.aapm.org/pubs/CTProtocols/default.asp
Available Protocols
Adult Protocols • Brain Perfusion CT (added 01/11/2011)
Your feedback regarding the content of this website is welcome. Feedback regarding this website will not be monitored daily. Users experiencing problems in performing an exam should contact their service provider.
32
33

34

35