report itu-r bt.2467-1 - methods for the evaluation of the
TRANSCRIPT

Report ITU-R BT.2467-1 (03/2021)
Methods for the evaluation of the quality of service of second generation DTTB systems
BT Series
Broadcasting service
(television)

ii Rep. ITU-R BT.2467-1
Foreword
The role of the Radiocommunication Sector is to ensure the rational, equitable, efficient and economical use of the radio-
frequency spectrum by all radiocommunication services, including satellite services, and carry out studies without limit
of frequency range on the basis of which Recommendations are adopted.
The regulatory and policy functions of the Radiocommunication Sector are performed by World and Regional
Radiocommunication Conferences and Radiocommunication Assemblies supported by Study Groups.
Policy on Intellectual Property Right (IPR)
ITU-R policy on IPR is described in the Common Patent Policy for ITU-T/ITU-R/ISO/IEC referenced in Resolution
ITU-R 1. Forms to be used for the submission of patent statements and licensing declarations by patent holders are
available from http://www.itu.int/ITU-R/go/patents/en where the Guidelines for Implementation of the Common Patent
Policy for ITU-T/ITU-R/ISO/IEC and the ITU-R patent information database can also be found.
Series of ITU-R Reports
(Also available online at http://www.itu.int/publ/R-REP/en)
Series Title
BO Satellite delivery
BR Recording for production, archival and play-out; film for television
BS Broadcasting service (sound)
BT Broadcasting service (television)
F Fixed service
M Mobile, radiodetermination, amateur and related satellite services
P Radiowave propagation
RA Radio astronomy
RS Remote sensing systems
S Fixed-satellite service
SA Space applications and meteorology
SF Frequency sharing and coordination between fixed-satellite and fixed service systems
SM Spectrum management
Note: This ITU-R Report was approved in English by the Study Group under the procedure detailed in
Resolution ITU-R 1.
Electronic Publication
Geneva, 2021
© ITU 2021
All rights reserved. No part of this publication may be reproduced, by any means whatsoever, without written permission of ITU.

Rep. ITU-R BT.2467-1 1
REPORT ITU-R BT.2467-1
Methods for the evaluation of the quality of service of
second generation DTTB systems
(Question ITU-R 132-4/6)
(2019-2021)
Objective
The objective of this Report is to introduce methods that have been used for evaluating the quality of
service of 2nd generation digital television broadcasting systems using the VHF and UHF bands.
Recommendation ITU-R BT.1735 [1] provides two methods for digital objective reception quality
assessment for DVB-T, one for multi-frequency networks (MFN) and one for single frequency
networks (SFN).
This Report gives some details about the relevant parameters for DVB-T2 and the results of some
measurements, in order to identify a possible method for objective reception quality assessment for
this DTTB system.
The final goal would be to obtain criteria that, even without knowing exactly all the useful signals
and the interferences1 but looking only at a limited number of parameters, could indicate if a requested
level of C/I is satisfied and quantify the available “margin” with respect to the QEF threshold.
Measurements in the field should be performed in a known controlled order to validate the proposed
method(s) in real world environments.
TABLE OF CONTENTS
Page
PART 1 − Study for the definition of a method for the assessment of DVB-T2 reception
quality ............................................................................................................................. 3
1 Introduction .................................................................................................................... 3
2 Assumptions for DVB-T2 .............................................................................................. 3
3 Overview on the reference parameters ........................................................................... 4
4 Description of the laboratory measurements done to define the method ....................... 6
4.1 Description of the laboratory measurements (MFN) .......................................... 6
4.2 Description of the laboratory measurements (SFN) ........................................... 6
4.3 Description of some results of the laboratory measurements for the MFN ........ 8
4.4 Description of some results of the laboratory measurements for the SFN ......... 10
5 Criteria for DVB-T2 ....................................................................................................... 17
5.1 MFN Networks ................................................................................................... 18
1 E.g. using “impulse response” or similar methods, in case of SFN.

2 Rep. ITU-R BT.2467-1
Page
5.2 SFN Networks .................................................................................................... 21
6 Conclusions .................................................................................................................... 25
7 References ...................................................................................................................... 25
Annex 1 to Part 1 − Example of the method to obtain the additional margin Lcmfn ................ 26
Annex 2 to Part 1 − Results of DVB-T2 laboratory measurements (SFN) ............................. 28
Annex 3 to Part 1 − Summary of the values needed to obtain the margin to the failure point 37
Annex 4 to Part 1 − Laboratory tests on DVB-T2 performed by Rai Way S.p.A ................... 50
PART 2 − Laboratory and field measurement results on DVB-T2 in France ......................... 60
1 Introduction .................................................................................................................... 60
2 Laboratory measurements............................................................................................... 60
3 On field measurements ................................................................................................... 65
Annex 1 to Part 2 − Professional vs monitoring DVB-T2 test equipment comparison ........... 68
PART 3 .................................................................................................................................... 70
1 Introduction .................................................................................................................... 70
2 DVB-T2 VHF / UHF trials in Sydney, Australia ........................................................... 72
2.1 Objectives ........................................................................................................... 72
2.2 Results ................................................................................................................. 73
2.3 Methodology adopted for objective quality assessment of DVB-T2 coverage .. 73
2.4 Objective quality assessment of DVB-T2 signal quality / coverage for Sydney
Trials ................................................................................................................... 74
2.5 Preliminary analysis of Sydney VHF / UHF trials measurement data ............... 81
2.6 Next steps ............................................................................................................ 81
3 Gold Coast UHF replication trial ................................................................................... 81
3.1 Objectives ........................................................................................................... 82
3.2 Preliminary results .............................................................................................. 84
3.3 Observations – Overall findings ......................................................................... 87
3.4 Comparative assessment of Sydney Trials to Gold Coast Trials ........................ 88
4 Brisbane / Gold Coast Extended DVB – T2 SFN Trial .................................................. 88
4.1 Objectives ........................................................................................................... 89
4.2 Measurement data analysis ................................................................................. 94
4.3 Observations ....................................................................................................... 97

Rep. ITU-R BT.2467-1 3
PART 1
Study for the definition of a method for the assessment
of DVB-T2 reception quality
1 Introduction
Laboratory and field measurements were done by different companies (EiTowers/Elettronica
Industriale (I), IRT (D), Rai Way (I), TDF (F)) in order to define a method for assessment of DVB-T2
reception quality.
Different tests have been carried out in order to identify a possible method for objective reception
quality assessment. The DVB-T2 system parameters, MER, BER Before LDPC decoder, BER Before
BCH (outer) decoder, and the Number of LDPC Iterations have been investigated and a criterion
based on the evaluation of MER has been established. The starting point of this method is to indicate
if a requested level of C/I is satisfied and to provide the value of the available margin above the
threshold point of the QEF signal. In this Report the description of the technique, laboratory tests and
results of measurements in service area are reported.
2 Assumptions for DVB-T2
DVB-T2 offers additional possibilities with respect to DVB-T: for example, a selection of
FFT-variants (from 1K to 32k), different modulation schemes (QSPK, …, 256 QAM), Guard
Intervals (1/128, …, 1/4) and the possibility to use different Physical Layer Pipes2 (PLPs).
The parameters used in Recommendation ITU-R BT.1735 for the assessment of the quality of service,
BER Before Viterbi and BER Before Reed Solomon, are not available for DVB-T2 [2]. Similar
parameters, BER Before LDPC (inner) decoder, BER Before BCH (outer) decoder and the Number
of LDPC Iterations in DVB-T2 could be used for this purpose. The method for digital objective
reception quality and for evaluation of quality of service performance has to take this into account.
The “quality of coverage” could be regarded as an “operative margin” with respect to the “picture
failure point” because there is no smooth degradation of the received signal quality at the failure
point, in particular in case of DVB-T2 reception (see § 4.5.10 of [3]) In fact, this “margin” gives an
idea of “how many dB” the signal is above the “picture failure point”.
This margin depends on the received field strength, E, and on the possible presence of interferences.
It is important to point out that this study is carried out for a fixed roof-top scenario in the case of
MFN and SFN. If the received level is too low, the noise might overcome the interference and, in this
case, a requirement on the received field strength E remains valid to qualify the assessment of the
DVB-T2 received signal.
The described criteria to evaluate the margin assume that all relevant parameters (RF level, BER,
MER, etc.) are available. In this Annex, no indications are given on the method to perform the
measurements of these parameters. Finally, the margin could be also considered as an indicator of the
quality of the received signal and of the quality of the coverage for a specific receiving condition in
a given location.
2 Each PLP may require a different C/N and, therefore, may have a different level of “margin” at any receiving
point.

4 Rep. ITU-R BT.2467-1
3 Overview on the reference parameters
This section describes the reference parameters that have been considered in this study and have to
be measured “on field” for DVB-T2 systems.
Field strength (level), E
The received field E should be >Emed, where Emed is the sum of Emin plus an appropriate additional
“location correction factor”.
Minimum field strength, Emin, is the minimum signal level needed to overcome the noise. It represents
the sensitivity of the receiver plus other contributions depending on the feeder loss, on the antenna
gain, on the noise figure of the receiver, on C/N, on the frequency, on the modulation scheme, etc.
(see §§ 3.1, 3.2 and 3.3 of [4]).
If the standard deviation is 5.5 dB, the “location correction factor” to be used for coverage predictions
for fixed reception is 9 dB for 95% of locations covered and 3 dB for 70% of locations.
In [1], Emed is also indicated as Exx. In this case, Exx may represent the planning value for the
percentage of location for the wanted service chosen by administrations (e.g. E95 indicates the field
strength planning value to have 95% of the location covered and includes the 9 dB margin to the
minimum value E50).
BER Before LDPC (inner) decoder
This value of BER is calculated before the LDPC decoder and depends on the transmission channel
and not on the codes (FEC). It is affected by the receiving conditions and by the occurrences of
interferences. In case of SFN, the impulse response analysis gives the details of the amplitudes and
the relative delays of each received signal coming from the transmitters of the SFN and helps in
detecting possible interferences.
BER Before BCH (outer) decoder
This BER is calculated after the LDPC decoder (or before the BCH decoder) and, therefore, depends
on the mod-codes. A value of 1E-7 is required to have the reception of the video without errors or
visible “artefacts” (see Table 5.1 of [5]) but the transition to the picture failure point is very fast.
Thus, this parameter gives a precise measure of the possibility to receive and decode the DVB-T2
signal, but it is possible to use it for the evaluation of the quality of signal due to its fast transition
from the perfect reception to the picture failure point.
Number of LDPC Iterations
As indicated in ETSI TR 101 290 [6], this measurement:
“Gives an in-service indication of the quality of the received signal and the computational
resources activated for the LDPC decoder. Since the results of these measurements are largely
dependent on the actual LDPC decoder implementation, results can only be compared when
taken from the same test instrument”
This parameter could be used in the assessment of the service quality but its dependency on the
specific LDPC decoder implementation limits its application.
MER (Modulation Error Ratio)
MER is described in [1] and in [5]
As indicated in [6], MER is measured:

Rep. ITU-R BT.2467-1 5
“To provide a “figure of merit” for L1 Signalling data3and each PLP4 of the T2 signal,
typically at a transmitter output (for assessing the quality of the transmitted signal) or in a
fixed location in a SFN for identifying severe distortions in the set-up of the transmitters
forming the SFN”.
“The sensitivity of the measurement, the typical magnitude of measured values and the units
of measurement combine to give MER an immediate familiarity for those who have previous
experience of C/N or SNR measurement.
MER can be regarded as a form of Signal-to-Noise ratio measurement that will give an
accurate indication of a receiver's ability to demodulate the signal, because it includes not
just Gaussian noise, but all other uncorrectable impairments of the received constellation as
well.
If the only significant impairment present in the signal is Gaussian noise then MER and SNR
are equivalent”.
Therefore, MER gives an indication5 of the C/I, e.g. expressed in dB.
As described in [6], MER is measured before PLP selection, i.e. before LDPC decoding, and so it
does not depend on the adopted mod-code.
At this regard, practical measurements of DVB-T2 signals shows a non-perfect linearity of MER with
respect to the receiving conditions (C/N or C/I)6. Furthermore, and exactly as expected, when one
(or more) PLP is under its “failure point” but it is still possible to decode L1, the measured MER of
this PLP is not available while MER for L1 is given.
Finally, in case of SFNs, MER depends also on the number of the received paths, their relative delays
and attenuations.
Therefore, MER can be used for the evaluation of the quality of service but, the knowledge of some
other additional parameters is required in order to have a proper assessment. In § 4.2 some SFN
measurements are described for this purpose.
3 The Layer-1 (L1) signalling has two main functions. First, it provides receiver a means for fast signal
detection and hence enables fast signal scanning. Secondly, it provides all information that receiver needs
to access the Layer-2 signalling and the services themselves within the current (and possibly also the next)
frame.
The L1 signalling is divided into L1-pre signalling and L1-post signalling. The modulation and code rate of
the L1-pre signalling is BPSK 1/2 and the number of signalling bits in L1-pre is constant. The number of
signalling bits in L1-post signalling depends on the number of PLPs, number of auxiliary streams, the use
of FEFs and the possible future use of TFS. The L1-post signalling can be modulated using BPSK, QPSK,
16-QAM or 64-QAM. The FEC code rate is always 1/2. The modulation for the L1-post signalling is chosen
so that the L1 signalling is always more robust than any PLP.
4 MER of PLP is measured at interface C2 (i.e. after equalisation), as described in [6] and it is not dependent
from the modulation and code (FEC).
5 The Protection Ratio PR (C/I) is the difference between the wanted and unwanted signal, given in dB. If no
interferers are present, only noise is considered as the unwanted signal and C/I becomes C/N
(see Recommendation ITU-R SM.1875).
6 Document 6A/352 “The use of MER to assess impact of anomalous propagations on co-channel
interference”.

6 Rep. ITU-R BT.2467-1
4 Description of the laboratory measurements done to define the method
Laboratory measurements were done by different companies (EiTowers/Elettronica Industriale (I),
IRT (D), Rai Way (I), TDF (F)) in order to simulate the typical conditions of reception, especially for
SFNs, where many signals may be present inside or outside the guard interval, together with
interferences external to the SFN.
The measurement system included a multi-standard signal generator with Noise and Fading simulator
and a reference radio receiver with DVB-T2 real-time signal analysis. The “Indirect objective and
subjective quality measurement procedure” (see [7]) was also used making measurements and
watching the decoded video for 30 seconds. The embedded measurements of BER before BCH
(or after LDPC) provided by the receiver was adopted to identify the failure point.
Two main values of level at the input of the receiver were used: −60 dBm (see [8]) and −50 dBm
(see [7]). The results obtained with these two values are comparable.
In addition, the behaviour of the system with lower levels of the useful signal at the input of the
receiver was also measured, when the effect of the (Gaussian) noise became relevant.
Most tests were carried out at 610 MHz (Channel 38) with some specific trials having been performed
in Band III.
A system with two different code rates (2/3 and 3/5) was considered:
– FFT: 32k not extended
– Pilot pattern: PP2
– Guard Interval (GI): 1/16 (224 μs)
– Modulation: 256 QAM.
This system could be adopted for a fixed reception SFN, replacing a typical DVB-T mode (64 QAM,
GI ¼, code rates ¾ and 2/3 respectively, see [3]). A configuration with Pilot Pattern PP2 rather than
PP4 was selected due to smoother transition in presence of signals arriving outside the GI. The results
for these two pilot patterns7 are comparable.
Results for some other system variants are presented in the Annexes.
4.1 Description of the laboratory measurements (MFN)
For MFN purposes, the values of the relevant parameters were measured in two different ways:
decreasing the input level (“noise limited”) and arising the noise (“interference limited”). This latter
method could also be used in the simulation of a co-channel interference in SFNs when only a single
signal is perceivable.
4.2 Description of the laboratory measurements (SFN)
For SFN purposes, different simulations have been tested in order to cover some of the possible
scenarios.
Figure 1-1 shows the case with only one signal inside the GI plus an additional one outside it.
7 There is only a little difference (of the order of 0.5 dB) in terms of C/N and Sensitivity in favour of PP4.

Rep. ITU-R BT.2467-1 7
FIGURE 1-1
Example of one SFN profile used for the tests
In this test, the amplitude of the path #2 was changed and the C/I varied accordingly.
Figure 1-2 shows a more complex situation where more than one signal was present inside the GI. In
this case, the amplitude and the delay of the signal outside the GI vary. Figure 1-3 is an example of
measured impulse response for this SFN profile, without interferences.
FIGURE 1-2
A second example of SFN profile
FIGURE 1-3
Example of typical measured impulse response for the useful path in Fig. 2
In detail, SFN measurements have been performed in the following conditions:
– SFN with 1, 2, 3 and 4 useful paths (inside GI) and one interfering path (outside GI). For
each of these configurations, the interference is placed at three different time distances:
“near” the end of GI; just “before” the end of the equalization interval (Nyquist time); “far”
from the end of GI.
– SFN with 2 useful paths with “comparable” value (2 dB) in order to simulate a measuring
condition similar to “echo 0dB” and one interfering path.
The values of useful level, interference level, BER before LDPC, BER before LDPC, number of
iterations, PLP MER and L1 MER were measured for each of the tested conditions.
The results are reported in Annex 2 to Part 1.
0 600 delay (ms)
Path #2
Path #1 (useful)
This level (and the mod-code) varied in tests
SFN Profile (dB,ms):0@0, + echo @600 (outside GI )
-10 dB
-6
dB
0 50 170 <- variable -> delay (ms)
Path #4
Path #2
Path #1 Path #3
This level and position varied in tests
SFN Profile (dB,ms):-6@0, 0@50, -10 @180, + echo outside GI

8 Rep. ITU-R BT.2467-1
4.3 Description of some results of the laboratory measurements for the MFN
Tables 1-1 and 1-2 show the results of “noise limited”8 and “interference limited” measurements for
one of the considered DVB-T2 modes (code 2/3).
In these examples, MER at failure point is 18.3 dB for both cases. In the case of “interference limited”
a level of −50 dBm at the input of the receiver was used and measurements done at lower input levels,
e.g. −65, −68, −70 dBm, confirmed this result (see Table 2). For values lower than −70 dBm this
MER value is increased by a fraction of a dB (i.e. from 18.3 to 18.9 dB).
TABLE 1-1 TABLE 1-2
Noise limited
(Typical measured values)
Interference limited
(Level = −50 dBm)
8 Failure point is in line with Report ITU-R BT.2254, AWGN Profile sensitivity, −78.7 dBm (Ricean
−78.4 dBm).
Level
(dBm)
Iter
numb.
BER
Before
LDPC
MER PLP
(dB)
margin
(dB)
-30 2.5 5.9E-05 43.5
-40 2.5 5.9E-05 43.2
-50 2.5 5.9E-05 41,5
-55 2.6 5.9E-05 38.8
-60 2.7 6.1E-05 34.8
-61 2.8 6.2E-05 33.9
-62 2.8 6.5E-05 33
-63 2.8 7.4E-05 32
-64 2.9 1.0E-04 31.1
-65 3 1.9E-04 30.2
-66 3.1 5.2E-04 29.2
-67 3.5 1.3E-03 28.2
-68 3.7 3.0E-03 27.2
E95% -69 4.3 6.2E-03 26.2 9
-70 4.8 1.0E-02 25.3
-71 5.2 1.7E-02 24.3
-72 6 2.6E-02 23.2
… … … …
… … … …
E70% -75 9.5 5.0E-02 21 3
-76 11.8 6.4E-02 19.9
-77 16 7.8E-02 18.9
E50% -78 23 8.7E-02 18.3 0
-79 … … …
C/I (dB)
Iter
numb.
BER
Before
LDPC
MER PLP
(dB)
margin
(dB)
Add. Noise=0 2.5 5.9E-05 41.5
40 2.5 6.0E-05 36.9 20
39 2.6 6.1E-05 36.2 19
38 2.6 6.1E-05 35.4 18
37 2.6 6.1E-05 34.7 17
36 2.65 6.1E-05 33.9 16
35 2.7 6.5E-05 33 15
34 2.75 6.8E-05 32.2 14
33 2.8 8.9E-05 31.3 13
32 2.8 1.7E-04 30.4 12
31 2.9 4.0E-04 29.5 11
30 3.2 1.0E-03 28.5 10
29 3.4 2.4E-03 27.6 9
28 3.8 4.8E-03 26.6 8
27 4.4 8.9E-03 25.6 7
26 4.9 1.5E-02 24.6 6
25 5.8 2.3E-02 23.6 5
24 6.6 3.2E-02 22.5 4
23 7.7 4.3E-02 21.4 3
22 9.3 5.5E-02 20.2 2
21 12.3 6.8E-02 19.1 1
20.5 14.9 7.5E-02 18.7 0.5
20 19.5 8.2E-02 18.3 0

Rep. ITU-R BT.2467-1 9
TABLE 1-3
Results “interference limited” with different input levels
(Mode 32k, 1/16, PP2, 256 QAM, 2/3)
The MER measured at the failure point could be regarded as the “reference MER” (18.3 dB). The
difference between the measured MER and this “reference MER” might be used as a starting point to
quantify the margin when the received level is at least −63 dBm.
margin = MER – “reference MER” (1)
Note that this equation (1), by definition, gives margin = 0 at the failure point and, as a possible
improvement, a further adjustment like the addition of a constant “b” might also be used, e.g. to
minimize the “average” error, rather than the error “near the failure point”9.
For levels lower than −63 dBm, the results of C/I calculations are more influenced by the presence of
the noise and the maximum BER and MER values that it’s possible to measure are limited
(see Table 1-3). This effect leads to an underestimation of the margin to the threshold.
However, for MFN, knowing the received input level, it’s possible to identify a “Level correction
factor”, Lcmfn, as a function of the received level and the measured BER, that could be applied to
obtain a better approximation.
9 The results of the measurements show that the more appropriate adjustment is dependent from the adopted
mode.
MFN reference MER (dB) 18.3
level (dBm)
C/I (dB) mar
gin
(d
B)
BER
Before
LDPC
MER
PLP
(dB) mar
gin
(d
B)
x =
MER
- r
ef
MER
(d
B)
del
ta (
dB
)
(x-m
argi
n)
BER
Before
LDPC
MER
PLP
(dB) mar
gin
(d
B)
x =
MER
- r
ef
MER
(d
B)
del
ta (
dB
)
(x-m
argi
n)
BER
Before
LDPC
MER
PLP
(dB) mar
gin
(d
B)
x =
MER
- r
ef
MER
(d
B)
del
ta (
dB
)
(x-m
argi
n)
BER
Before
LDPC
MER
PLP
(dB) mar
gin
(d
B)
x =
MER
- r
ef
MER
(d
B)
del
ta (
dB
)
(x-m
argi
n)
BER
Before
LDPC
MER
PLP
(dB) mar
gin
(d
B)
x =
MER
- r
ef
MER
(d
B)
del
ta (
dB
)
(x-m
argi
n)
I=0 5.7E-05 41.4 1.8E-04 30.3 2.9E-03 27.3 9.7E-03 25.4 2.5E-02 23.4
40 20 6.0E-05 36.9 20 18.6 -1.4 3.5E-04 29.6 19.5 11.3 -8.2 3.6E-03 27 19 8.7 -10.3 1.1E-02 25.2 19 6.9 -12.1 2.6E-02 23.2 18 4.9 -13.1
39 19 6.1E-05 36.2 19 17.9 -1.1 3.9E-04 29.5 18.5 11.2 -7.3 3.9E-03 26.9 18 8.6 -9.4
38 18 6.1E-05 35.4 18 17.1 -0.9 4.8E-04 29.3 17.5 11 -6.5 4.1E-03 26.8 17 8.5 -8.5 2.7E-02 23.1 16 4.8 -11.2
37 17 6.1E-05 34.7 17 16.4 -0.6 5.6E-04 29.1 16.5 10.8 -5.7 4.5E-03 26.7 16 8.4 -7.6
36 16 6.1E-05 33.9 16 15.6 -0.4 7.4E-04 28.9 15.5 10.6 -4.9 4.9E-03 26.6 15 8.3 -6.7 2.7E-02 23 14 4.7 -9.3
35 15 6.5E-05 33 15 14.7 -0.3 9.6E-04 28.6 14.5 10.3 -4.2 5.5E-03 26.4 14 8.1 -5.9 1.3E-02 24.8 14 6.5 -7.5 2.8E-02 22.9 13 4.6 -8.4
34 14 6.8E-05 32.2 14 13.9 -0.1 1.3E-03 28.3 13.5 10 -3.5 6.3E-03 26.2 13 7.9 -5.1 1.4E-02 24.7 13 6.4 -6.6 3.0E-02 22.8 12 4.5 -7.5
33 13 8.9E-05 31.3 13 13 0 1.8E-03 27.9 12.5 9.6 -2.9 7.3E-03 25.9 12 7.6 -4.4 1.5E-02 24.5 12 6.2 -5.8 3.0E-02 22.7 11 4.4 -6.6
32 12 1.7E-04 30.4 12 12.1 0.1 2.6E-03 27.4 11.5 9.1 -2.4 8.7E-03 25.7 11 7.4 -3.6 1.7E-02 24.3 11 6 -5 3.2E-02 22.5 10 4.2 -5.8
31 11 4.0E-04 29.5 11 11.2 0.2 3.8E-03 27 10.5 8.7 -1.8 1.0E-02 25.3 10 7 -3 2.0E-02 23.9 10 5.6 -4.4 3.4E-02 22.3 9 4 -5
30 10 1.0E-03 28.5 10 10.2 0.2 5.6E-03 26.4 9.5 8.1 -1.4 1.3E-02 24.9 9 6.6 -2.4 2.2E-02 23.6 9 5.3 -3.7 3.6E-02 22.2 8 3.9 -4.1
29.5 9.5 6.7E-03 26.1 9 7.8 -1.2 1.4E-02 24.7 8.5 6.4 -2.1 2.4E-02 23.4 9 5.1 -3.9
29 9 2.4E-03 27.6 9 9.3 0.3 8.1E-03 25.8 8.5 7.5 -1 1.6E-02 24.4 8 6.1 -1.9 2.6E-02 23.2 8 4.9 -3.1 3.9E-02 21.8 7 3.5 -3.5
28.5 8.5 9.8E-03 25.4 8 7.1 -0.9 1.8E-02 24.2 7.5 5.9 -1.6 2.7E-02 23 7.5 4.7 -2.8 4.0E-02 21.7 6.5 3.4 -3.1
28 8 4.8E-03 26.6 8 8.3 0.3 1.2E-02 25.1 7.5 6.8 -0.7 2.0E-02 23.9 7 5.6 -1.4 2.9E-02 22.8 7 4.5 -2.5 4.2E-02 21.5 6 3.2 -2.8
27.5 7.5 6.6E-03 26.1 7.5 7.8 0.3 1.4E-02 24.7 7 6.4 -0.6 2.2E-02 23.7 6.5 5.4 -1.1 3.2E-02 22.6 6.5 4.3 -2.2 4.4E-02 21.3 5.5 3 -2.5
27 7 8.9E-03 25.6 7 7.3 0.3 1.7E-02 24.3 6.5 6 -0.5 2.5E-02 23.3 6 5 -1 3.4E-02 22.3 6 4 -2 4.6E-02 21.1 5 2.8 -2.2
26.5 6.5 1.2E-02 25.1 6.5 6.8 0.3 1.9E-02 24 6 5.7 -0.3 2.8E-02 23 5.5 4.7 -0.8 3.7E-02 22.1 5.5 3.8 -1.7 4.9E-02 20.8 4.5 2.5 -2
26 6 1.5E-02 24.6 6 6.3 0.3 2.3E-02 23.6 5.5 5.3 -0.2 3.1E-02 22.7 5 4.4 -0.6 3.9E-02 21.8 5 3.5 -1.5 5.1E-02 20.6 4 2.3 -1.7
25.5 5.5 1.8E-02 24.1 5.5 5.8 0.3 2.6E-02 23.1 5 4.8 -0.2 3.4E-02 22.3 4.5 4 -0.5 4.3E-02 21.4 4.5 3.1 -1.4 5.4E-02 20.3 3.5 2 -1.5
25 5 2.3E-02 23.6 5 5.3 0.3 3.0E-02 22.7 4.5 4.4 -0.1 3.8E-02 21.9 4 3.6 -0.4 4.6E-02 21.1 4 2.8 -1.2 5.7E-02 20.1 3 1.8 -1.2
24.5 4.5 2.7E-02 23.1 4.5 4.8 0.3 3.5E-02 22.2 4 3.9 -0.1 4.2E-02 21.5 3.5 3.2 -0.3 5.0E-02 20.7 3.5 2.4 -1.1 6.0E-02 19.8 2.5 1.5 -1
24 4 3.2E-02 22.5 4 4.2 0.2 3.9E-02 21.8 3.5 3.5 0 4.6E-02 21.1 3 2.8 -0.2 5.4E-02 20.3 3 2 -1 6.4E-02 19.5 2 1.2 -0.8
23.5 3.5 3.8E-02 22 3.5 3.7 0.2 4.4E-02 21.3 3 3 0 5.1E-02 20.6 2.5 2.3 -0.2 5.8E-02 20 2.5 1.7 -0.8 6.7E-02 19.2 1.5 0.9 -0.6
23 3 4.3E-02 21.4 3 3.1 0.1 5.0E-02 20.7 2.5 2.4 -0.1 5.6E-02 20.1 2 1.8 -0.2 6.2E-02 19.6 2 1.3 -0.7 7.1E-02 18.9 1 0.6 -0.4
22.5 2.5 4.9E-02 20.8 2.5 2.5 0 5.5E-02 20.2 2 1.9 -0.1 6.1E-02 19.7 1.5 1.4 -0.1 6.7E-02 19.2 1.5 0.9 -0.6 7.5E-02 18.7 0.5 0.4 -0.1
22 2 5.5E-02 20.2 2 1.9 -0.1 6.1E-02 19.7 1.5 1.4 -0.1 6.6E-02 19.3 1 1 0 7.2E-02 18.9 1 0.6 -0.4 8.0E-02 18.3 0 0 0
21.5 1.5 6.2E-02 19.6 1.5 1.3 -0.2 6.7E-02 19.2 1 0.9 -0.1 7.2E-02 18.9 0.5 0.6 0.1 7.7E-02 18.6 0.5 0.3 -0.2
21 1 6.8E-02 19.1 1 0.8 -0.2 7.3E-02 18.8 0.5 0.5 0 7.8E-02 18.5 0 0.2 0.2 8.2E-02 18.3 0 0 0
20.5 0.5 7.5E-02 18.7 0.5 0.4 -0.1 7.9E-02 18.4 0 0.1 0.1
20 0 8.2E-02 18.3 0 0 0
-72-50 -65 -68 -70

10 Rep. ITU-R BT.2467-1
Table 1-4 summarizes the results for the “Level correction factor” obtained by the measurements
presented in Table 1-3 and Fig. 1-4 shows the curves.
This Lcmfn can be added to the margin obtaining the following formula (2):
A2.6margin = MER – “reference MER” + Lcmfn (2)
The maximum value of the “Level correction factor” is limited to 6 dB and, if BER is worse than
4E-2, the factor is assumed equal to zero (no additional margin is added).
TABLE 1-4
FIGURE 1-4
4.4 Description of some results of the laboratory measurements for the SFN
Table 1-5 shows some results related to the profile of Fig. 1-1 for the chosen system variant with the
two code rates (FEC 2/3 and FEC 3/5).
As expected, for each value of C/I, BER before LDPC and PLP MER do not depend on the code rate,
while the margin and the iteration number change.
Lcmfn BER
≤ 1e-2 ≤ 2e-2 ≤ 4e-2 >4e-2
-63 0 0 0 0
-64 0.5 0.18 0 0
-65 0.85 0.28 0 0
-66 1.35 0.65 0.25 0
-67 2.1 0.9 0.28 0
-68 3 1.4 0.4 0
-69 6 2.2 0.7 0
-70 6 3.5 1.2 0
-71 6 1.9 0
-72 3.1 0
-73 0
leve
l (d
Bm
)

Rep. ITU-R BT.2467-1 11
TABLE 1-5
Results of measurements (code rate 3/5, code rate 2/3)
Table 1-6 shows some results for the two modes 3/5 and 2/3 for the profile of Fig. 1-2.
code 3/5 code 2/3
C/I (dB)
Iter
numb.
BER
Before
LDPC
BER
Before
BCH
MER
PLP
(dB)
margin
(dB) C/I (dB)
Iter
numb.
BER
Before
LDPC
BER
Before
BCH
MER
PLP
(dB)
margin
(dB)
40 3 4.9E-05 35.5 20 40 2.5 4.9E-05 35.6 18.5
39 3.1 5.0E-05 34.8 19 39 2.6 4.9E-05 34.8 17.5
38 3.1 5.0E-05 34 18 38 2.6 5.0E-05 34 16.5
37 3.1 5.1E-05 33.2 17 37 2.6 5.1E-05 33.2 15.5
36 3.1 5.2E-05 32.3 16 36 2.7 5.1E-05 32.3 14.5
35 3.2 5.5E-05 31.5 15 35 2.7 5.5E-05 31.5 13.5
34 3.3 7.4E-05 30.6 14 34 2.8 7.5E-05 30.5 12.5
33 3.3 1.7E-04 29.6 13 33 2.9 1.7E-04 29.6 11.5
32 3.6 5.2E-04 28.8 12 32 3.1 5.2E-04 28.8 10.5
31 3.9 1.5E-03 27.8 11 31 3.3 1.5E-03 27.8 9.5
30 4.5 3.6E-03 26.8 10 30 3.6 3.6E-03 26.8 8.5
29 5.2 7.4E-03 25.8 9 29 4.2 7.4E-03 25.8 7.5
28 6.2 1.3E-02 24.7 8 28 4.6 1.3E-02 24.7 6.5
27 7.5 2.1E-02 23.7 7 27 5.5 2.1E-02 23.7 5.5
26 9.1 3.0E-02 22.4 6 26 6.3 3.0E-02 22.5 4.5
25 11.1 4.0E-02 21.2 5 25 7.3 4.0E-02 21.3 3.5
24.5 12.3 4.6E-02 20.5 4.5 24.5 7.9 4.6E-02 20.5 3
24 13.6 5.1E-02 19.8 4 24 8.6 5.1E-02 19.8 2.5
23.5 15 5.7E-02 19.1 3.5 23.5 9.5 5.7E-02 19.1 2
23 16.9 6.3E-02 18.6 3 23 10.7 6.3E-02 18.6 1.5
22.5 19 6.9E-02 18.1 2.5 22.5 12.6 6.9E-02 18.2 1
22 21.7 7.6E-02 17.8 2 22 15.5 7.6E-02 17.8 0.5
21.5 24.8 8.2E-02 17.3 1.5 limit -> 21.5 21.3 8.2E-02 17.3 0
21 28.7 8.9E-02 - 16.9 1 21 - - - -
20.5 33.2 9.6E-02 16.4 0.5
20.1 35.7 1.0E-01 9.0E-09 16
limit -> 20 36 1.0E-01 6.3E-08 15.9 0
19.9 36.1 1.1E-01 3.0E-07 15.8 < 0
12 Rep. ITU-R BT.2467-1
TABLE 1-6
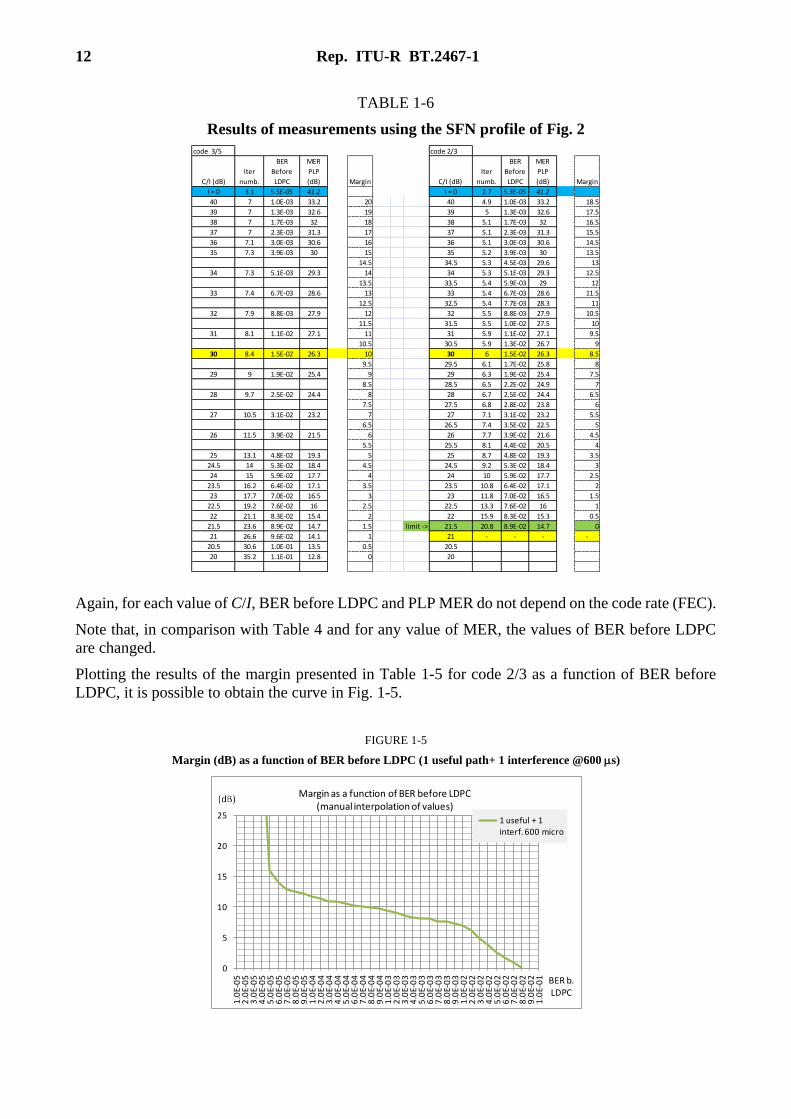
Results of measurements using the SFN profile of Fig. 2
Again, for each value of C/I, BER before LDPC and PLP MER do not depend on the code rate (FEC).
Note that, in comparison with Table 4 and for any value of MER, the values of BER before LDPC
are changed.
Plotting the results of the margin presented in Table 1-5 for code 2/3 as a function of BER before
LDPC, it is possible to obtain the curve in Fig. 1-5.
FIGURE 1-5
Margin (dB) as a function of BER before LDPC (1 useful path+ 1 interference @600 ms)
code 3/5 code 2/3
C/I (dB)
Iter
numb.
BER
Before
LDPC
MER
PLP
(dB) Margin C/I (dB)
Iter
numb.
BER
Before
LDPC
MER
PLP
(dB) Margin
I = 0 3.1 5.5E-05 41.2 I = 0 2.7 5.3E-05 41.2
40 7 1.0E-03 33.2 20 40 4.9 1.0E-03 33.2 18.5
39 7 1.3E-03 32.6 19 39 5 1.3E-03 32.6 17.5
38 7 1.7E-03 32 18 38 5.1 1.7E-03 32 16.5
37 7 2.3E-03 31.3 17 37 5.1 2.3E-03 31.3 15.5
36 7.1 3.0E-03 30.6 16 36 5.1 3.0E-03 30.6 14.5
35 7.3 3.9E-03 30 15 35 5.2 3.9E-03 30 13.5
14.5 34.5 5.3 4.5E-03 29.6 13
34 7.3 5.1E-03 29.3 14 34 5.3 5.1E-03 29.3 12.5
13.5 33.5 5.4 5.9E-03 29 12
33 7.4 6.7E-03 28.6 13 33 5.4 6.7E-03 28.6 11.5
12.5 32.5 5.4 7.7E-03 28.3 11
32 7.9 8.8E-03 27.9 12 32 5.5 8.8E-03 27.9 10.5
11.5 31.5 5.5 1.0E-02 27.5 10
31 8.1 1.1E-02 27.1 11 31 5.9 1.1E-02 27.1 9.5
10.5 30.5 5.9 1.3E-02 26.7 9
30 8.4 1.5E-02 26.3 10 30 6 1.5E-02 26.3 8.5
9.5 29.5 6.1 1.7E-02 25.8 8
29 9 1.9E-02 25.4 9 29 6.3 1.9E-02 25.4 7.5
8.5 28.5 6.5 2.2E-02 24.9 7
28 9.7 2.5E-02 24.4 8 28 6.7 2.5E-02 24.4 6.5
7.5 27.5 6.8 2.8E-02 23.8 6
27 10.5 3.1E-02 23.2 7 27 7.1 3.1E-02 23.2 5.5
6.5 26.5 7.4 3.5E-02 22.5 5
26 11.5 3.9E-02 21.5 6 26 7.7 3.9E-02 21.6 4.5
5.5 25.5 8.1 4.4E-02 20.5 4
25 13.1 4.8E-02 19.3 5 25 8.7 4.8E-02 19.3 3.5
24.5 14 5.3E-02 18.4 4.5 24.5 9.2 5.3E-02 18.4 3
24 15 5.9E-02 17.7 4 24 10 5.9E-02 17.7 2.5
23.5 16.2 6.4E-02 17.1 3.5 23.5 10.8 6.4E-02 17.1 2
23 17.7 7.0E-02 16.5 3 23 11.8 7.0E-02 16.5 1.5
22.5 19.2 7.6E-02 16 2.5 22.5 13.3 7.6E-02 16 1
22 21.1 8.3E-02 15.4 2 22 15.9 8.3E-02 15.3 0.5
21.5 23.6 8.9E-02 14.7 1.5 limit -> 21.5 20.8 8.9E-02 14.7 0
21 26.6 9.6E-02 14.1 1 21 - - - -
20.5 30.6 1.0E-01 13.5 0.5 20.5
20 35.2 1.1E-01 12.8 0 20
0
5
10
15
20
25
1.0
E-0
52
.0E-
05
3.0
E-0
54
.0E-
05
5.0
E-0
56
.0E-
05
7.0
E-0
58
.0E-
05
9.0
E-0
51
.0E-
04
2.0
E-0
43
.0E-
04
4.0
E-0
45
.0E-
04
6.0
E-0
47
.0E-
04
8.0
E-0
49
.0E-
04
1.0
E-0
32
.0E-
03
3.0
E-0
34
.0E-
03
5.0
E-0
36
.0E-
03
7.0
E-0
38
.0E-
03
9.0
E-0
31
.0E-
02
2.0
E-0
23
.0E-
02
4.0
E-0
25
.0E-
02
6.0
E-0
27
.0E-
02
8.0
E-0
29
.0E-
02
1.0
E-0
1
1 useful + 1 interf. 600 micro
Margin as a function of BER before LDPC(manual interpolation of values)
BER b.LDPC

Rep. ITU-R BT.2467-1 13
Repeating the measurements for different SFN configurations, it is possible to obtain Fig. 1-6, which
summarizes the results of the margin in function of the number of BER before LDPC, for some
measured conditions.
FIGURE 1-6
Margin (dB) as a function of BER before LDPC
In Fig. 1-6:
– “1U+I@600” is the result using the profile showed in Fig. 1-1 with 1 useful signal and
1 interference @ 600 ms. This is the case with the minimum margin as a function of the
measured BER. A very similar result can be obtained also with one interference “I” at a
greater delay, e.g. 1 500 ms.
– “1U+I@300” is the result with 1useful signal and 1 interference @300 ms, just outside the
GI.
– “2U+ I@600” is the case with two useful signals inside GI and 1 interference @600 ms.
– “2U (−3 dB) + I@600” is the case with two useful signals inside GI, one main plus a second
that is attenuated 3 dB and 1 interference @600 ms. This case is close to the example of one
“0 dB echo” plus the interference.
– “3U+ I@600” is the result using the profile showed in Fig. 1-2.
Figure 1-6 shows that:
– The measured margin is the minimum (having equal BER), if there is a single useful
contribution “far to the end of GI”.
– In the case of conditions similar to “0 dB echo” BER underestimates the available margin.
– In the case of echo outside the GI and “near to the end of GI” (e.g. 1 path+I@300), the
measured margin as a function of BER is similar to the case with echo “far to the end of GI”.
Table 1-7 summarizes some cases with the minimum margin as a function of the measured BER.
Looking at Fig. 1-6, if BER is equal or better than 1E-3, the margin will be at least 9 dB.
0
5
10
15
20
25
1.0
E-0
5
3.0
E-0
5
5.0
E-0
5
7.0
E-0
5
9.0
E-0
5
2.0
E-0
4
4.0
E-0
4
6.0
E-0
4
8.0
E-0
4
1.0
E-0
3
3.0
E-0
3
5.0
E-0
3
7.0
E-0
3
9.0
E-0
3
2.0
E-0
2
4.0
E-0
2
6.0
E-0
2
8.0
E-0
2
1.0
E-0
1
1U+I@600
1U+I@300
2U+I@600
2U -3dB+I@600
3U+I@600
Margin as a function of BER before LDPC(manual interp. of values)
margin(dB)
BER b.LDPC

14 Rep. ITU-R BT.2467-1
TABLE 1-7
BER before LDPC Margin
<= 8E - 2 >= 0
<= 6E - 2 >= 2
<= 4E - 2 >= 3
<= 1E - 2 >= 6
<= 1E - 3 >= 9
<= 1E - 4 >= 11
Figure 1-7 summarizes the results of the margin value in function of LDPC iterations, for some
measured conditions.
FIGURE 1-7
Margin as a function of LDPC iterations
Figure 1-7 shows that:
– As a function of number of useful contribution (and path configuration), there is a different
asymptotical (minimum) value of LDPC iterations.
– Having the same number of LDPC iterations, the margin is the minimum when there is a
single useful contribution.
Table 1-8 summarizes some cases with the minimum margin as a function of the measured iterations.
Looking at Fig. 1-7, if the iterations are equal or less than 6, the margin will be at least 4 dB.
TABLE 1-8
LDPC iterations Margin
<= 20 >= -1
<= 15 >= 0
<= 10 >= 2
<= 6 >= 4
<= 5 >= 6
<= 3 >= 10
0
5
10
15
20
25
30
1 2 3 4 5 6 7 8 9 10 11 12 13 14 15 16 17 18 19 20
1 path+I@1500
1 path+I@600
2paths@0dB+I@600

Rep. ITU-R BT.2467-1 15
It is to be noted that the results related to LDPC iterations depend on the chipset inside the receiver
that is used for the tests.
In light of the results, in case of SFN:
– BER before BCH is not useful to identify the margin; and
– none of the parameters mentioned above (BER, MER, LDPC and received level) could be
used alone to identify the margin.
For example, looking at the data listed in Table 1-9, extrapolated from the tests, BER before LDPC
is the same in the two cases: the iteration number is better in the example #2 but example #1 has
11 dB of margin while the example #2 has only 7 dB. The use of PLP MER can help to better identify
these margins.
TABLE 1-9
Two indicative examples of measurements with the same BER before LDPC
Vice-versa, in the example of Table 1-10, a SFN with 4 signals inside GI of which 2 near to the “0 dB
echo” condition, the MER is very low, under the “reference MER”, while the margin is 1.5 dB.
TABLE 1-10
Example of measurement of MER lower than the “reference MER” and margin > 0 dB
These preliminary measurements show that the usage of PLP MER, BER and the number of LDPC
iterations together can help to identify a possible criterion to be used for objective reception quality
assessment of a DVB-T2 signal.
Finally, equation (1) defined for the MFN case could be adopted as a starting point to identify the
margin also for SFN where the “reference MER” at failure point can remain the same as for the MFN
case.
In fact, in the case of a SFN with a single contribution, the results are similar to the ones of the MFN
case and, at least as a first approximation, this value is accurate enough and does not overestimate the
margin. At least for the considered modes, equation (2) could be used also for SFN with a slight
modification that takes into account the BER before LDPC (see Table 1-7) and the iterations number
(see Table 1-8). In § 5.2 a detailed description of the criteria is reported.
example
1 SFN x2 (0dB) + AWGN
C/I (dB)
Iter
numb.
BER
Before LDPC
MER PLP
(dB)
margin
(dB)
33 6 1.1E-02 28.1 11
2 SFN x2 +600
C/I (dB)
Iter
numb.
BER
Before LDPC
MER PLP
(dB)
margin
(dB)
29 4.8 1.1E-02 25.7 7
10 SFN x4 (0dB) + 600
C/I (dB)
Iter
numb.
BER
Before LDPC MER
margin
(dB)
22 12 6.9E-02 16.7 1.5

16 Rep. ITU-R BT.2467-1
4.4.1 Dependency on the received level for the SFN case
Similar to the MFN case, it is possible to identify a dependency on the received level also for SFN.
The SFN profile “1U+I@600” shown in Fig. 1-1 was used and the value of the interference varied in
test.
Table 1-11 shows the results and Table 1-12 summarizes the results for the “Level correction factor”,
Lcsfn, derived by these measurements. Figure 1-8 shows the curves.
It can be noted that the values of margin presented in Table 1-7 and Table 1-8 are conservative with
respect to possible variations of the input.
TABLE 1-11
Results with different Input levels (SFN)
(Mode “32k not extended, PP2, 256 QAM, 2/3)
SFN ref. MER (dB) 18.3
level (dBm)
C/I (dB) mar
gin
(MFN
) (d
B)
BER
Before
LDPC
MER
PLP
(dB) mar
gin
(d
B)
x =
MER
- r
ef
MER
(d
B)
del
ta (
dB
)
(x-m
argi
n)
BER
Before
LDPC
MER
PLP
(dB) mar
gin
(d
B)
x =
MER
- r
ef
MER
(d
B)
del
ta (
dB
)
(x-m
argi
n)
BER
Before
LDPC
MER
PLP
(dB) mar
gin
(d
B)
x =
MER
- r
ef
MER
(d
B)
del
ta (
dB
)
(x-m
argi
n)
BER
Before
LDPC
MER
PLP
(dB) mar
gin
(d
B)
x =
MER
- r
ef
MER
(d
B)
del
ta (
dB
)
(x-m
argi
n)
BER
Before
LDPC
MER
PLP
(dB) mar
gin
(d
B)
x =
MER
- r
ef
MER
(d
B)
del
ta (
dB
)
(x-m
argi
n)
C/I (dB)
I=0 5.3E-05 41.2 2.0E-04 30.3 2.9E-03 27.4 1.0E-02 25.5 2.5E-02 23 I=0
40 20 5.6E-05 35.6 18.5 17.3 -1.2 5.0E-04 29.4 18 11.1 -6.9 4.0E-03 27 17.5 8.7 -8.8 1.2E-02 25.1 17 6.8 -10.2 2.7E-02 23.2 16.5 4.9 -11.6 40
39 19 5.6E-05 34.8 17.5 16.5 -1 4.4E-03 26.9 16.5 8.6 -7.9 39
38 18 5.6E-05 34 16.5 15.7 -0.8 7.6E-04 29.1 16 10.8 -5.2 4.7E-03 26.8 15.5 8.5 -7 38
37 17 5.6E-05 33.2 15.5 14.9 -0.6 9.9E-04 28.8 15 10.5 -4.5 5.2E-03 26.6 14.5 8.3 -6.2 37
36 16 5.8E-05 32.3 14.5 14 -0.5 6.0E-03 26.4 13.5 8.1 -5.4 36
35 15 6.1E-05 31.5 13.5 13.2 -0.3 1.7E-03 28.1 13 9.8 -3.2 6.9E-03 26.2 12.5 7.9 -4.6 1.5E-02 24.6 12 6.3 -5.7 3.0E-02 22.7 11.5 4.4 -7.1 35
34.5 14.5 6.6E-05 31 13 12.7 -0.3 34.5
34 14 7.9E-05 30.6 12.5 12.3 -0.2 8.1E-03 25.9 11.5 7.6 -3.9 34
33.5 13.5 1.1E-04 30.1 12 11.8 -0.2 33.5
33 13 1.7E-04 29.6 11.5 11.3 -0.2 3.4E-03 27.2 11 8.9 -2.1 9.7E-03 25.5 10.5 7.2 -3.3 1.8E-02 24.2 10 5.9 -4.1 33
32.5 12.5 2.9E-04 29.5 11 11.2 0.2 1.1E-02 25.3 10 7 -3 1.9E-02 24 9.5 5.7 -3.8 32.5
32 12 5.2E-04 28.8 10.5 10.5 0 5.0E-03 26.6 10 8.3 -1.7 1.2E-02 25.1 9.5 6.8 -2.7 2.1E-02 23.8 9 5.5 -3.5 32
31.5 11.5 8.8E-04 28.3 10 10 0 31.5
31 11 1.5E-03 27.8 9.5 9.5 0 7.2E-03 26 9 7.7 -1.3 1.4E-02 24.7 8.5 6.4 -2.1 3.7E-02 21.9 7.5 3.6 -3.9 31
30.5 10.5 2.4E-03 27.3 9 9 0 30.5
30 10 3.6E-03 26.8 8.5 8.5 0 1.0E-02 25.3 8 7 -1 1.8E-02 24.2 7.5 5.9 -1.6 2.8E-02 22.9 7 4.6 -2.4 4.1E-02 21.4 6.5 3.1 -3.4 30
29.5 9.5 5.3E-03 26.3 8 8 0 1.3E-02 24.9 7.5 6.6 -0.9 2.0E-02 23.8 7 5.5 -1.5 2.9E-02 22.7 6.5 4.4 -2.1 29.5
29 9 7.4E-03 25.8 7.5 7.5 0 1.5E-02 24.6 7 6.3 -0.7 2.2E-02 23.6 6.5 5.3 -1.2 4.4E-02 21 5.5 2.7 -2.8 29
28.5 8.5 1.0E-02 25.2 7 6.9 -0.1 1.8E-02 24.2 6.5 5.9 -0.6 2.5E-02 23.2 6 4.9 -1.1 28.5
28 8 1.3E-02 24.7 6.5 6.4 -0.1 2.1E-02 23.8 6 5.5 -0.5 2.8E-02 22.8 5.5 4.5 -1 3.7E-02 21.8 5 3.5 -1.5 28
27.5 7.5 1.7E-02 24.2 6 5.9 -0.1 3.1E-02 22.4 5 4.1 -0.9 4.0E-02 21.4 4.5 3.1 -1.4 27.5
27 7 2.1E-02 23.7 5.5 5.4 -0.1 2.8E-02 22.8 5 4.5 -0.5 3.5E-02 22 4.5 3.7 -0.8 4.3E-02 21 4 2.7 -1.3 27
26.5 6.5 2.5E-02 23.1 5 4.8 -0.2 3.9E-02 21.5 4 3.2 -0.8 26.5
26 6 3.0E-02 22.5 4.5 4.2 -0.3 3.6E-02 21.8 4 3.5 -0.5 4.3E-02 21 3.5 2.7 -0.8 6.0E-02 19 2.5 0.7 -1.8 26
25.5 5.5 3.5E-02 21.9 4 3.6 -0.4 4.1E-02 21.2 3.5 2.9 -0.6 4.7E-02 20.4 3 2.1 -0.9 5.4E-02 19.6 2.5 1.3 -1.2 6.4E-02 18.7 2 0.4 -1.6 25.5
25 5 4.0E-02 21.2 3.5 2.9 -0.6 4.6E-02 20.5 3 2.2 -0.8 5.1E-02 19.8 2.5 1.5 -1 5.8E-02 19.1 2 0.8 -1.2 6.7E-02 18.4 1.5 0.1 -1.4 25
24.5 4.5 4.6E-02 20.5 3 2.2 -0.8 5.1E-02 19.9 2.5 1.6 -0.9 5.6E-02 19.3 2 1 -1 6.3E-02 18.7 1.5 0.4 -1.1 7.1E-02 18.1 1 -0.2 -1.2 24.5
24 4 5.1E-02 19.8 2.5 1.5 -1 5.6E-02 19.2 2 0.9 -1.1 6.1E-02 18.8 1.5 0.5 -1 6.7E-02 18.3 1 0 -1 7.5E-02 17.9 0.5 -0.4 -0.9 24
23.5 3.5 5.7E-02 19.1 2 0.8 -1.2 6.2E-02 18.7 1.5 0.4 -1.1 6.6E-02 18.4 1 0.1 -0.9 7.2E-02 18 0.5 -0.3 -0.8 8.0E-02 17.6 0 -0.7 -0.7 23.5
23 3 6.3E-02 18.6 1.5 0.3 -1.2 6.7E-02 18.3 1 0 -1 7.2E-02 18 0.5 -0.3 -0.8 7.7E-02 17.7 0 -0.6 -0.6 23
22.5 2.5 6.9E-02 18.1 1 -0.2 -1.2 7.3E-02 17.9 0.5 -0.4 -0.9 7.7E-02 17.7 0 -0.6 -0.6 8.2E-02 17.4 -0.5 -0.9 -0.4 22.5
22 2 7.6E-02 17.7 0.5 -0.6 -1.1 8.0E-02 17.5 0 -0.8 -0.8 8.3E-02 17.3 -0.5 -1 -0.5 22
21.5 1.5 8.2E-02 17.3 0 -1 -1
21 1 - - - - -
-70 -72-68-65-50

Rep. ITU-R BT.2467-1 17
TABLE 1-12 FIGURE 1-8
5 Criteria for DVB-T2
As a result of the described measurements, the type of the broadcasting network (MFN-SFN) and the
receiving conditions have to be considered in determining the criterion for the estimation of the
available “margin to failure” and, therefore, the reception quality.
The criteria hereafter described are valid for fixed reception which implies a roof-top mounted
antenna and an appropriate measuring time10 and it is preferable to not overestimate the value of the
margin.
For simplicity, only the profile 32k not extended, GI 1/16, PP2, 256 QAM, code rate 2/3 is considered
for both MFN11 and SFN.
At this regard, it is to be noted that the results of measurements using different DVB-T2 modes
(like those adopted for portable reception, e.g. 16k, 64 QAM, code rate 1/2) show that the difference
between the measured MER and the “reference MER” may also lead to overestimation of the margin
in a wide range of values. Therefore, in these cases, a different correction value has to be applied to
the method.
Table 1-13 summarizes the C/N values and the sensitivity for the selected mode as per Report
ITU-R BT.2254 [4] and the Italian HD-Book 3.012.
10 Note that the “BER reset time” of any test set-up instruments is typically over 2 seconds.
11 For MFN purposes, in a real network, a different configuration of Pilot Patters e.g. PP4 can be selected.
12 HD Book 3.0 was published in 2014 and is in line with EBU TECH 3348 rev.4 and NorDig requirements
for Gaussian and “echo 0dB” profiles (ref. NorDig-Unified_ver_2_6 and NorDig Unified Test plan,
ver. 2.5.0). There are only differences of the order of 0.1 dB between the values presented in these
documents, due to different rounding of the terms that contribute to give the overall C/N values and,
therefore, the Minimum input levels (dBm) that are required at the input of the receivers.
Lcsfn BER
≤ 1e-2 ≤ 2e-2 ≤ 4e-2 >4e-2
-60 0 0 0 0
-61 0 0 0.1 0
-62 0.1 0.1 0.2 0
-63 0.4 0.2 0.3 0
-64 0.7 0.4 0.4 0
-65 1 0.6 0.5 0
-66 1.4 0.8 0.6 0
-67 2 1.1 0.7 0
-68 3.3 1.6 0.8 0
-69 6 2.4 1.1 0
-70 6 3.8 1.5 0
-71 6 2.3 0
-72 3.6 0
-73 6 0
leve
l (d
Bm
)

18 Rep. ITU-R BT.2467-1
TABLE 1-13
32k PP2 C/N (dB) Sensitivity 8MHz, noise figure = 6 dB
AWGN
RC20
(Ricean)
RL20
(Rayleigh) 0dB AWGN
RC20
(Ricean)
RL20
(Rayleigh) 0dB
256-QAM 2/3 20.8 21.1 23.3 25.1 −78.2 −77.9 −75.8 −73.9
Table 1-14 summarizes the description of Quality Grades as in [1].
TABLE 1-14
Quality grades
Quality grade Description
Q1 Signal level is below minimum planning target
Q2 Signal level is below minimum planning target or margin to failure is too low (reception
may be possible, but signal is very susceptible to failure)
Q3 Signal level and margin to failure have some margin above minimum planning targets
Q4 Signal level and margin to failure above planning target
Q5 No measureable defects can be reasonably detected
5.1 MFN Networks
In case of MFN13, where the interference is uncorrelated, equation (3) could be applied to identify
the margin to the failure point and in the case of DVB-T2 profile 32k not extended, GI 1/16, PP2,
256 QAM, code rate 2/3, the “reference MER” is assumed as 18.3 dB and the Lcmfn factor is obtained
from the Table 1-15 and Fig. 1-9, as described in § 4.3.
margin = MER – “reference MER” + Lcmfn (3)
TABLE 1-15
13 The same considerations and results should be valid in case of a SFN with a single useful signal or when
the effect of the other transmitters are negligible.
Lcmfn BER
≤ 1e-2 ≤ 2e-2 ≤ 4e-2 >4e-2
-63 0 0 0 0
-64 0.5 0.18 0 0
-65 0.85 0.28 0 0
-66 1.35 0.65 0.25 0
-67 2.1 0.9 0.28 0
-68 3 1.4 0.4 0
-69 6 2.2 0.7 0
-70 6 3.5 1.2 0
-71 6 1.9 0
-72 3.1 0
-73 0
leve
l (d
Bm
)

Rep. ITU-R BT.2467-1 19
FIGURE 1-9
The following examples show how to consider this factor.
Example 1
Measured data: RF level= −68 dBm; MER = 23.9 dB; BER 2E-2
Using equation (1), the margin “m” would be 23.9 – 18.3 = 5.6 dB and comparing this value with the
one of Table A1 in Annex 1, where the margin is 7 dB and C/I is 28 dB, there is an underestimation
of 1.4 dB.
As the level is −68 dBm and BER is 2E-2, the Lcmfn is 1.4 dB and, applying equation (3),
m = 23.9 – 18.3 + 1.4 = 7 dB, in line with the laboratory tests.
Example 2
Measured data: RF Level −69 dBm; MER = 21.9 dB; BER 3.8E-2
From Table A3.2 in Annex 3: C/I = 25.5 dB; margin = 4.5 dB
Using equation (1), the margin “m” would be 21.9 – 18.3 = 3.6 dB and therefore 0.9 dB of difference.
As the level is −69 dBm and BER is 3.8E-2, the Lcmfn is 0.7 dB and, applying equation (3)
m = 21.9 – 18.3 + 0.7 = 4.3 dB, in line with the laboratory tests.
Example 3
Measured data: RF Level −72 dBm; MER = 21.8 dB; BER 3.9E-2
From Table A1 in Annex 1: C/I = 29 dB; margin = 7 dB
Using equation (1), the margin “m” =21.8 – 18.3 = 3.5 dB and therefore 3.5 dB of underestimation.
As the level is −72 dBm and BER is 3.9E-2, the Lcmfn is 3.2 dB and applying equation (3)
m = 21.8 – 18.3 + 3.2 = 6.7 dB, in line with the laboratory tests.
For MFN fixed reception, a possible “quality scale” could be:
TABLE 1-16
Quality scale for MFN
Quality 1 2 3 4 5
level E E < E70 E >= E70 E >= E95 E >= E95 E >= E95
Margin "m" – m >= 0 dB m >= 4 dB m >= 8 dB m >= 12 dB

20 Rep. ITU-R BT.2467-1
To have a certain “grade” in the scale, both requirements on level and margin have to be satisfied.
E.g.:
– if E >= E50 and E <E70 (irrespectively of the margin “m”), then Q = 1
– if E >= E70 and margin m < 0 dB, then Q = 1.
At this stage of work, all the values of margins and field strengths in Table 1-165 are only indicative
and the results presented here still have to be compared with the results valid for DVB-T in [1].
It is noted that when using of strong modulation, e.g. 64 QAM, an additional correction factor,
f (BER), which depends on the value of the measured BER, should be included to take into account
the non-linearity of the PLP MER. In this case, the formula becomes:
margin = MER – “reference MER” + Lcmfn+ f (BER) (4)
In Table A3.1 in Annex 3 to Part 1 values for the f (BER) factor are reported.
5.1.1 Dependency of the MFN method on the model of the receiver
Previous results are obtained using a professional receiver “A” that has its own documentation of
calibration values from the manufacturer and is subject to a periodical calibration procedure.
However, this method could be used also with receivers (or semi-professional probes that e.g. are
used for installation of receiving antennas for end-users) without a specific calibration procedure.
It has to be noted that, for a number of these equipment, the values of some parameters (like PLP
MER and others) are not given when the received level is under a certain threshold (e.g. −60 dBm).
Therefore, in this case, a different method has to be identified, e.g. using “L1 MER” as the reference
parameter.
Table 1-17a shows the results @−50 dBm of input level for the professional receiver “A” and
Table 16b the equivalent results for a semi-professional receiver “B”.
In this case the results in terms of measured MER are equivalent and this equivalence remains true at
least for input levels greater than −65 dBm.
If the PLP MER is not available, the L1-MER can be used to obtain the margin but in this case
equation (1) has to be modified and the addition of the “Level correction factor” is not applied.
Note that Table 1-17b for receiver B is obtained with an input level of −50 dBm and the results for
PLP MER are available. For lower levels (e.g. <−65 dBm), PLP MER is not available and only L1
MER is given.

Rep. ITU-R BT.2467-1 21
TABLE 1-17a TABLE 1-17b
Receiver A @ −50 dBm Receiver B @ −50 dBm
5.2 SFN Networks
In the case of SFN, the proposed criterion for MFN is also applicable. A further assumption is that
the “Impulse response” is not available, therefore the number and nature of the received SFN paths
is “unknown”.
Step 1) If the level E < E70, identifying the margin is not relevant because the quality is low due to
the low level.
Step 2) If the level E > E70, the following equation (5) is applied
margin >= MER – “reference MER” + Lcsfn + f (BER)sfn (5)
where, in the case of DVB-T2 profile 32k not extended, GI 1/16, PP2, 256 QAM, code rate 2/3:
– the “reference MER” is the same value of the “reference MER” as for the MFN case, 18.3 dB;
– Lcsfn is obtained from the Table 17 and Fig. 10. E.g. if the input level Ps is
−67 dBm < Ps <= −66 dBm and BER (before LDPC) is “1e-2” < BER <= “2e-2”, then Lcsfn
is 0.8 dB;
– f (BER)sfn is an empirical correction, based on the results of the measurements with different
SFN profiles, depending on BER as shown in Fig. 11. f (BER)sfn is equal to 0 when the input
level is equal or lower than a certain value (e.g. −60 dBm in this case) and the predominant
correction is done with the parameter Lcsfn.
level = -50 dBm ref. MER 18.3 level = -50 dBm ref. MER 18.3
Mod-Code C/I (dB)
Iter
numb.
BER
Before
LDPC
MER PLP
(dB)
margin
(dB)
MER -
ref MER
(dB) Mod-Code C/I (dB)
Iter
numb.
BER
Before
LDPC
MER PLP
(dB)
margin
(dB)
MER -
ref MER
(dB)
256 QAM, 2/3 Add. Noise=0 2.5 5.9E-05 41.5 256 QAM, 2/3 Add. Noise=0 1 1.0E-04 41.2
PP4, IG=1/16 40 2.5 6.0E-05 36.9 20 18.6 PP4, IG=1/16 40 1 1.0E-04 36.4 20 18.1
39 2.6 6.1E-05 36.2 19 17.9 39 1 1.0E-04 35.9 19 17.6
38 2.6 6.1E-05 35.4 18 17.1 38 18
37 2.6 6.1E-05 34.7 17 16.4 37 1 1.0E-04 34.4 17 16.1
36 2.65 6.1E-05 33.9 16 15.6 36 16
35 2.7 6.5E-05 33 15 14.7 35 1 1.0E-04 32.8 15 14.5
34 2.75 6.8E-05 32.2 14 13.9 34 14
33 2.8 8.9E-05 31.3 13 13 33 13
32 2.8 1.7E-04 30.4 12 12.1 32 1 1.0E-04 30 12 11.7
31 2.9 4.0E-04 29.5 11 11.2 31 11
30 3.2 1.0E-03 28.5 10 10.2 30 2 1.0E-03 28.2 10 9.9
29 3.4 2.4E-03 27.6 9 9.3 29 2 2.0E-03 27.2 9 8.9
28 3.8 4.8E-03 26.6 8 8.3 28 2 4.0E-03 26.2 8 7.9
27.5 4 6.6E-03 26.1 7.5 7.8 27.5 7.5
27 4.4 8.9E-03 25.6 7 7.3 27 3 7.0E-03 25.2 7 6.9
26.5 4.6 1.2E-02 25.1 6.5 6.8 26.5 6.5
26 4.9 1.5E-02 24.6 6 6.3 26 3 1.0E-02 24.2 6 5.9
25.5 5.4 1.8E-02 24.1 5.5 5.8 25.5 5.5
25 5.8 2.3E-02 23.6 5 5.3 25 3 1.0E-02 23.3 5 5
24.5 6.2 2.7E-02 23.1 4.5 4.8 24.5 4.5
24 6.6 3.2E-02 22.5 4 4.2 24 5 2.0E-02 22.2 4 3.9
23.5 7.1 3.8E-02 22 3.5 3.7 23.5 6 3.0E-02 21.6 3.5 3.3
23 7.7 4.3E-02 21.4 3 3.1 23 6 3.0E-02 21.3 3 3
22.5 8.4 4.9E-02 20.8 2.5 2.5 22.5 6 4.0E-02 20.8 2.5 2.5
22 9.3 5.5E-02 20.2 2 1.9 22 7 4.0E-02 20.3 2 2
21.5 10.6 6.2E-02 19.6 1.5 1.3 21.5 8 5.0E-02 19.8 1.5 1.5
21 12.3 6.8E-02 19.1 1 0.8 21 10 6.0E-02 19.3 1 1
20.5 14.9 7.5E-02 18.7 0.5 0.4 20.5 11 6.0E-02 18.5 0.5 0.2
20 19.5 8.2E-02 18.3 0 0 20 14 7.0E-02 18.3 0 0

22 Rep. ITU-R BT.2467-1
TABLE 1-18
FIGURE 1-10
FIGURE 1-11
f (BER)sfn for mode “32k not extended, GI 1/16, PP2, 256 QAM, 2/3”
Step 3) The values in Table 1-18 can be used to further check and correct the margin.
Lcsfn BER
≤ 1e-2 ≤ 2e-2 ≤ 4e-2 >4e-2
-60 0 0 0 0
-61 0 0 0.1 0
-62 0.1 0.1 0.2 0
-63 0.4 0.2 0.3 0
-64 0.7 0.4 0.4 0
-65 1 0.6 0.5 0
-66 1.4 0.8 0.6 0
-67 2 1.1 0.7 0
-68 3.3 1.6 0.8 0
-69 6 2.4 1.1 0
-70 6 3.8 1.5 0
-71 6 2.3 0
-72 3.6 0
-73 6 0
leve
l (d
Bm
)
-1.3
-0.8
-0.3
0.2
0.7
4.0
E-0
55
.0E-
05
6.0
E-0
57
.0E-
05
8.0
E-0
59
.0E-
05
1.0
E-0
42
.0E-
04
3.0
E-0
44
.0E-
04
5.0
E-0
46
.0E-
04
7.0
E-0
48
.0E-
04
9.0
E-0
41
.0E-
03
2.0
E-0
33
.0E-
03
4.0
E-0
35
.0E-
03
6.0
E-0
37
.0E-
03
8.0
E-0
39
.0E-
03
1.0
E-0
22
.0E-
02
3.0
E-0
24
.0E-
02
5.0
E-0
26
.0E-
02
7.0
E-0
28
.0E-
02

Rep. ITU-R BT.2467-1 23
TABLE 1-18
BER before LDPC Margin
<= 8E - 2 >= 0
<= 6E - 2 >= 2
<= 4E - 2 >= 3
<= 1E - 2 >= 6
<= 1E - 3 >= 9
<= 1E - 4 >= 11
Step 4) As a further approximation, the margin can also be checked and corrected, if necessary, using
the values in Table 1-19. These values depend on the implementation of the receiver and, therefore,
are only indicative.
TABLE 1-19
LDPC iterations Margin
<= 20 >= -1
<= 15 >= 0
<= 10 >= 2
<= 6 >= 4
<= 5 >= 6
<= 3 >= 10
Step 5) The margin is the highest values obtained from step 2, step 3 and step 414.
Table 1-20 could be used to define the quality of service.
TABLE 1-20
Quality scale for SFN
Quality 1 2 3 4 5
level E E < E70 E >= E70 E >= E95 E >= E95 E >= E95
margin "m" – m >= 0 dB m >= 4 dB m >= 8 dB m >= 12 dB
To have a certain “grade” in the scale, both requirements on level and margin have to be satisfied.
E.g.:
– if E >= E50 and E < E70 (irrespectively of the margin “m”), then Q = 1
– If E >= E70 and margin m < 0 dB, then Q = 1.
14 For more “robust” modes, like those adopting 16k FFT and 64 QAM modulation for portable reception, a
different correction has to be applied in order not to overestimate the margin.

24 Rep. ITU-R BT.2467-1
The proposed “quality scale” for SFN is the same as for the MFN case. The values of margins and
Field Strengths are only indicative, at this stage of work, and the results presented here still have to
be compared with those valid for DVB-T in [1].
5.2.1 Dependency of the SFN method on the model of receiver
At this stage of work, the dependency of the SFN method on the model of receiver has still to be fully
checked.
5.2.2 Examples of application of the SFN criteria
In Table 1-21 some examples of SFN configurations are listed for mode 32 k not extended, GI 1/16,
PP2, 256 QAM, 2/3 with the respective margin and values of the measured parameters. These data
are coming from the laboratory measurements and, therefore, the expected values of the margin to
the failure point and the quality “Q” are known.
The margin and the quality are evaluated using the proposed criteria and the obtained results are
compared with the expected values. The reported discrepancies are limited to a fraction of a dB.
TABLE 1-21
Examples of SFN configurations: margin and evaluated Quality
* margin has to be better than …
** Evaluated margin is the better value between the three results of step 2, step 3 and step 4.
# SFN profile
interf.
C/I
(dB)
Iter
numb.
BER
Before
LDPC
MER PLP
(dB)
margin
(dB)
MER -
Ref. MER
(dB)
f(BER)
(dB)
formula (4)
(step2)
(dB)
table BER
(step 3 *)
(dB)
table ITER
(step 4 *)
(dB)
evaluation
of margin
(dB) **
error
(dB)Quality
Evaluated
Quality
1 2U (-3dB) + AWGN 33 6 1.1E-02 28.1 11 9.8 -0.6 9.2 3 2 9.2 -1.8 4 4
2 2U + Interf 600 29 4.8 1.1E-02 25.7 7 7.4 -0.6 6.8 3 6 6.8 -0.2 3 3
3 2U + Interf 600 36 3.5 1.1E-04 31.8 14 13.5 0 13.5 9 6 13.5 -0.5 5 5
4 1U + Interf 600 24.5 7.9 4.6E-02 20.5 3 2.2 0 2.2 2 2 2.2 -0.8 2 2
5 1U + Interf 600 33 2.9 1.7E-04 29.6 11.5 11.3 0 11.3 9 10 11.3 -0.2 4 4
6 1U + Interf 300 17 3.5 2.0E-03 28.9 10 10.6 -0.8 9.8 6 6 9.8 -0.2 4 4
7 1U + Interf 1500 27 5.1 1.6E-02 24.7 6 6.4 -0.6 5.8 3 4 5.8 -0.2 4 4
8 2U (3dB) + interf 350 13 9.3 5.1E-02 20.6 3.5 2.3 0.2 2.5 2 2 2.5 -1 2 2
9a 3U + Interf 600 30 5.9 1.5E-02 26.1 8.5 7.8 -0.6 7.2 3 4 7.2 -1.3 4 3
9b 3U + Interf 600 29 6.2 2.0E-02 25.2 7.5 6.9 -0.4 6.5 3 2 6.5 -1 3 3
10 4U (3dB) + interf 600 22 12 6.9E-02 16.7 1.5 -1.6 0.4 -1.2 0 0 0 -1.5 2 2
11 4U (3dB) + interf 1500 35 5.5 2.2E-03 31 15.5 12.7 -0.8 11.9 6 4 11.9 -3.6 5 4
12 1U + Interf 600 28 4.6 1.3E-02 24.7 6.5 6.4 -0.6 5.8 3 6 6 -0.5 2 2
13 1U + Interf 600 21.5 21.3 8.2E-02 17.3 0 -1 0.6 -0.4 0 -2 0 0 2 2
Application of the method to obtain the marginResults of measurements and margin

Rep. ITU-R BT.2467-1 25
TABLE 1-22
Reference parameters (mode 32k, GI 1/16, PP2, 256 QAM, code 2/3)
6 Conclusions
Some of the parameters that are commonly used for DVB-T assessment of the quality of service
(e.g. BER before Viterbi and BER before Reed Solomon) are no longer available for DVB-T2, while
there are some additional ones like PLP MER, BER before LDPC (inner) decoder, BER before BCH
(outer) decoder and Number of LDPC Iterations.
At this regard, laboratory measurements show that the difference between the measured MER and
the MER at the failure point, when only noise is added, can be used as a preliminary approximation
of the margin available in a specific location of reception.
This is valid in case of the modes (using 32 k, 256 QAM modulation) that are treated in this study,
while, in case of more robust modes (e.g. 16 k, 16 QAM), an additional correction has to be
introduced in order to not over-estimate the margin.
The evaluation of PLP MER, BER before LDPC, and also the number of LDPC iterations together
can be used for the objective reception quality assessment for the DVB-T2 signals, for both MFNs
and SFNs.
The study should be extended considering additional modes, including those used for portable
reception. Moreover, an analysis on the applicability of the method when using different model of
receivers should be considered as well as the study of multiple interferences.
On field measurements should be performed in order to validate the proposed method(s) in real world
environments.
7 References
[1] Recommendation ITU-R BT.1735 – Methods for objective reception quality assessment of digital
terrestrial television broadcasting signal of System B specified in Recommendation ITU-R BT.1306.
[2] ETSI TR 101 290 V.1.3.1 – 2014-07 (DVB-M) – Measurement guidelines for DVB system.
[3] ETSI TS 102 831 V1.2.1 Digital Video Broadcasting (DVB) – Implementation guidelines for a
second generation digital terrestrial television broadcasting system (DVB-T2).
[4] Report ITU-R BT.2254 – Frequency and network planning aspects of DVB-T2.
[5] Report ITU-R BT.2389 – Guidelines on measurements for digital terrestrial television broadcasting
systems.
[6] ETSI TR 101 290 Digital Video Broadcasting (DVB) – Measurement guidelines for DVB systems.
[7] NorDig Unified Test Plan for Integrated Receiver Decoders for use in cable, satellite, terrestrial and
IP-based networks.
[8] Recommendation ITU-R BT.2033 – Planning criteria, including protection ratios, for second
generation of digital terrestrial television broadcasting systems in the VHF/UHF bands.
reference
MER (dB)
BER before
LDPC margin
LDPC
iterations margin
18.3 <= 8E-2 >= 0 <= 20 >= -1
<= 6E-2 >= 2 <= 15 >= 0
<= 4E-2 >= 3 <= 10 >= 2
<= 1E-2 >= 6 <= 6 >= 4
<= 1E-3 >= 9 <= 5 >= 6
<= 1E-4 >= 11 <= 3 >= 10

26 Rep. ITU-R BT.2467-1
Annex 1
to Part 1
Example of the method to obtain the additional margin Lcmfn
MFN C/I (I = co-channel interference, equivalent to Gaussian noise) indicates the ratio between the
useful signal and the added noise. The results in Table A1.1 are obtained with the professional
receiver “A1” for the mode 32 k not extended, 256 QAM, PP2, 256 QAM, 2/3 and, in this case,
“Reference MER” (the MER at failure point, with input level –50 dBm and when only noise is added)
is 18.3 dB.
Using these results, e.g. if the level is −68 dBm and BER Before LDPC is 2.0E-2, the margin should
be 7 dB, while the difference “MER – Reference MER” is 5.6 dB. Therefore the “delta” to add as a
function of the level is −1.4 dB and this value (with positive sign) is placed in Table A1.2.

Rep. ITU-R BT.2467-1 27
TABLE A1.1
Results with different input levels
Mode 32k not extended, 256 QAM, PP2, 256 QAM, 2/3
TABLE A1.2
Level correction factor, Lcmfn
FIGURE A1
Level correction factor, Lcmfn
MFN reference MER (dB) 18.3
level (dBm)
C/I (dB) mar
gin
(d
B)
BER
Before
LDPC
MER
PLP
(dB) mar
gin
(d
B)
x =
MER
- r
ef
MER
(d
B)
del
ta (
dB
)
(x-m
argi
n)
BER
Before
LDPC
MER
PLP
(dB) mar
gin
(d
B)
x =
MER
- r
ef
MER
(d
B)
del
ta (
dB
)
(x-m
argi
n)
BER
Before
LDPC
MER
PLP
(dB) mar
gin
(d
B)
x =
MER
- r
ef
MER
(d
B)
del
ta (
dB
)
(x-m
argi
n)
BER
Before
LDPC
MER
PLP
(dB) mar
gin
(d
B)
x =
MER
- r
ef
MER
(d
B)
del
ta (
dB
)
(x-m
argi
n)
BER
Before
LDPC
MER
PLP
(dB) mar
gin
(d
B)
x =
MER
- r
ef
MER
(d
B)
del
ta (
dB
)
(x-m
argi
n)
I=0 5.7E-05 41.4 1.8E-04 30.3 2.9E-03 27.3 9.7E-03 25.4 2.5E-02 23.4
40 20 6.0E-05 36.9 20 18.6 -1.4 3.5E-04 29.6 19.5 11.3 -8.2 3.6E-03 27 19 8.7 -10.3 1.1E-02 25.2 19 6.9 -12.1 2.6E-02 23.2 18 4.9 -13.1
39 19 6.1E-05 36.2 19 17.9 -1.1 3.9E-04 29.5 18.5 11.2 -7.3 3.9E-03 26.9 18 8.6 -9.4
38 18 6.1E-05 35.4 18 17.1 -0.9 4.8E-04 29.3 17.5 11 -6.5 4.1E-03 26.8 17 8.5 -8.5 2.7E-02 23.1 16 4.8 -11.2
37 17 6.1E-05 34.7 17 16.4 -0.6 5.6E-04 29.1 16.5 10.8 -5.7 4.5E-03 26.7 16 8.4 -7.6
36 16 6.1E-05 33.9 16 15.6 -0.4 7.4E-04 28.9 15.5 10.6 -4.9 4.9E-03 26.6 15 8.3 -6.7 2.7E-02 23 14 4.7 -9.3
35 15 6.5E-05 33 15 14.7 -0.3 9.6E-04 28.6 14.5 10.3 -4.2 5.5E-03 26.4 14 8.1 -5.9 1.3E-02 24.8 14 6.5 -7.5 2.8E-02 22.9 13 4.6 -8.4
34 14 6.8E-05 32.2 14 13.9 -0.1 1.3E-03 28.3 13.5 10 -3.5 6.3E-03 26.2 13 7.9 -5.1 1.4E-02 24.7 13 6.4 -6.6 3.0E-02 22.8 12 4.5 -7.5
33 13 8.9E-05 31.3 13 13 0 1.8E-03 27.9 12.5 9.6 -2.9 7.3E-03 25.9 12 7.6 -4.4 1.5E-02 24.5 12 6.2 -5.8 3.0E-02 22.7 11 4.4 -6.6
32 12 1.7E-04 30.4 12 12.1 0.1 2.6E-03 27.4 11.5 9.1 -2.4 8.7E-03 25.7 11 7.4 -3.6 1.7E-02 24.3 11 6 -5 3.2E-02 22.5 10 4.2 -5.8
31 11 4.0E-04 29.5 11 11.2 0.2 3.8E-03 27 10.5 8.7 -1.8 1.0E-02 25.3 10 7 -3 2.0E-02 23.9 10 5.6 -4.4 3.4E-02 22.3 9 4 -5
30 10 1.0E-03 28.5 10 10.2 0.2 5.6E-03 26.4 9.5 8.1 -1.4 1.3E-02 24.9 9 6.6 -2.4 2.2E-02 23.6 9 5.3 -3.7 3.6E-02 22.2 8 3.9 -4.1
29.5 9.5 6.7E-03 26.1 9 7.8 -1.2 1.4E-02 24.7 8.5 6.4 -2.1 2.4E-02 23.4 9 5.1 -3.9
29 9 2.4E-03 27.6 9 9.3 0.3 8.1E-03 25.8 8.5 7.5 -1 1.6E-02 24.4 8 6.1 -1.9 2.6E-02 23.2 8 4.9 -3.1 3.9E-02 21.8 7 3.5 -3.5
28.5 8.5 9.8E-03 25.4 8 7.1 -0.9 1.8E-02 24.2 7.5 5.9 -1.6 2.7E-02 23 7.5 4.7 -2.8 4.0E-02 21.7 6.5 3.4 -3.1
28 8 4.8E-03 26.6 8 8.3 0.3 1.2E-02 25.1 7.5 6.8 -0.7 2.0E-02 23.9 7 5.6 -1.4 2.9E-02 22.8 7 4.5 -2.5 4.2E-02 21.5 6 3.2 -2.8
27.5 7.5 6.6E-03 26.1 7.5 7.8 0.3 1.4E-02 24.7 7 6.4 -0.6 2.2E-02 23.7 6.5 5.4 -1.1 3.2E-02 22.6 6.5 4.3 -2.2 4.4E-02 21.3 5.5 3 -2.5
27 7 8.9E-03 25.6 7 7.3 0.3 1.7E-02 24.3 6.5 6 -0.5 2.5E-02 23.3 6 5 -1 3.4E-02 22.3 6 4 -2 4.6E-02 21.1 5 2.8 -2.2
26.5 6.5 1.2E-02 25.1 6.5 6.8 0.3 1.9E-02 24 6 5.7 -0.3 2.8E-02 23 5.5 4.7 -0.8 3.7E-02 22.1 5.5 3.8 -1.7 4.9E-02 20.8 4.5 2.5 -2
26 6 1.5E-02 24.6 6 6.3 0.3 2.3E-02 23.6 5.5 5.3 -0.2 3.1E-02 22.7 5 4.4 -0.6 3.9E-02 21.8 5 3.5 -1.5 5.1E-02 20.6 4 2.3 -1.7
25.5 5.5 1.8E-02 24.1 5.5 5.8 0.3 2.6E-02 23.1 5 4.8 -0.2 3.4E-02 22.3 4.5 4 -0.5 4.3E-02 21.4 4.5 3.1 -1.4 5.4E-02 20.3 3.5 2 -1.5
25 5 2.3E-02 23.6 5 5.3 0.3 3.0E-02 22.7 4.5 4.4 -0.1 3.8E-02 21.9 4 3.6 -0.4 4.6E-02 21.1 4 2.8 -1.2 5.7E-02 20.1 3 1.8 -1.2
24.5 4.5 2.7E-02 23.1 4.5 4.8 0.3 3.5E-02 22.2 4 3.9 -0.1 4.2E-02 21.5 3.5 3.2 -0.3 5.0E-02 20.7 3.5 2.4 -1.1 6.0E-02 19.8 2.5 1.5 -1
24 4 3.2E-02 22.5 4 4.2 0.2 3.9E-02 21.8 3.5 3.5 0 4.6E-02 21.1 3 2.8 -0.2 5.4E-02 20.3 3 2 -1 6.4E-02 19.5 2 1.2 -0.8
23.5 3.5 3.8E-02 22 3.5 3.7 0.2 4.4E-02 21.3 3 3 0 5.1E-02 20.6 2.5 2.3 -0.2 5.8E-02 20 2.5 1.7 -0.8 6.7E-02 19.2 1.5 0.9 -0.6
23 3 4.3E-02 21.4 3 3.1 0.1 5.0E-02 20.7 2.5 2.4 -0.1 5.6E-02 20.1 2 1.8 -0.2 6.2E-02 19.6 2 1.3 -0.7 7.1E-02 18.9 1 0.6 -0.4
22.5 2.5 4.9E-02 20.8 2.5 2.5 0 5.5E-02 20.2 2 1.9 -0.1 6.1E-02 19.7 1.5 1.4 -0.1 6.7E-02 19.2 1.5 0.9 -0.6 7.5E-02 18.7 0.5 0.4 -0.1
22 2 5.5E-02 20.2 2 1.9 -0.1 6.1E-02 19.7 1.5 1.4 -0.1 6.6E-02 19.3 1 1 0 7.2E-02 18.9 1 0.6 -0.4 8.0E-02 18.3 0 0 0
21.5 1.5 6.2E-02 19.6 1.5 1.3 -0.2 6.7E-02 19.2 1 0.9 -0.1 7.2E-02 18.9 0.5 0.6 0.1 7.7E-02 18.6 0.5 0.3 -0.2
21 1 6.8E-02 19.1 1 0.8 -0.2 7.3E-02 18.8 0.5 0.5 0 7.8E-02 18.5 0 0.2 0.2 8.2E-02 18.3 0 0 0
20.5 0.5 7.5E-02 18.7 0.5 0.4 -0.1 7.9E-02 18.4 0 0.1 0.1
20 0 8.2E-02 18.3 0 0 0
-72-50 -65 -68 -70
Lcmfn BER
≤ 1e-2 ≤ 2e-2 ≤ 4e-2 >4e-2
-63 0 0 0 0
-64 0.5 0.18 0 0
-65 0.85 0.28 0 0
-66 1.35 0.65 0.25 0
-67 2.1 0.9 0.28 0
-68 3 1.4 0.4 0
-69 6 2.2 0.7 0
-70 6 3.5 1.2 0
-71 6 1.9 0
-72 3.1 0
-73 0
leve
l (d
Bm
)

28 Rep. ITU-R BT.2467-1
Annex 2
to Part 1
Results of DVB-T2 laboratory measurements (SFN)
DVB T2 Bands IV-V
This Annex illustrates the results of some laboratory measurements and derived parameters, obtained
using different SFN profiles for mode 32 k not extended, PP2, GI 1/16, 256 QAM, code rate 2/3. In
particular, this Annex gives an example of comparison of results between two different receivers of
the same model and show the results of the measurements used to obtain the Fig. 6 “Margin as a
function of BER Before LDPC”.
TABLE A2.1
SFN: 1 Useful signal + 1 interference @600 ms (comparison between instruments A1 and A2)
date 27/03/2018 (A1) & 07/08/2018 (A2)
time
generator SFU1 and SFU2
receiver A1 and A2 useful "C" = 0 @ 0 microseconds
MFN/SFN SFN interf. "I" = @ 600 microseconds
Measurem. type Pr. Ratio *
CH 38
Level -50 dBm
FFT, PP 32kn, PP2
GI 1/16
GI duration 224 ms (nominal value)
PLP Mod 256QAM
PLP Code 2/3* 1 useful signal plus 1 interference outside GI
reference MER 18.3 dB
comparison
C/I (dB)
Iter
numb.
BER
Before
LDPC
BER
Before
BCH
MER
PLP (dB)
MER L1
(dB)
C/I -
MER
(dB)margin
(dB)
MER-ref
MER
(dB)
delta
(dB) C/I (dB)
Iter
numb.
BER
Before
LDPC
BER
Before
BCH
MER
PLP (dB)
MER L1
(dB)
C/I -
MER
(dB)margin
(dB)
MER-ref
MER
(dB)
delta
(dB)
delta A1
- delta A2
(dB)
I=0 2.5 5.9E-05 41.5 39.4 I=0 2.9 5.8E-05 40.4 38.5
40 2.5 4.9E-05 35.6 4.4 18.5 17.3 -1.2 40 3 6.0E-05 35.3 34.4 4.7 18.5 17 -1.5 0.3
39 2.6 4.9E-05 34.8 4.2 17.5 16.5 -1 39 3 6.0E-05 34.6 33.7 4.4 17.5 16.3 -1.2 0.2
38 2.6 5.0E-05 34 4 16.5 15.7 -0.8 38 2.9 6.1E-05 33.9 33 4.1 16.5 15.6 -0.9 0.1
37 2.6 5.1E-05 33.2 3.8 15.5 14.9 -0.6 37 3 6.1E-05 33.1 32.3 3.9 15.5 14.8 -0.7 0.1
36 2.7 5.1E-05 32.3 3.7 14.5 14 -0.5 36 3 6.2E-05 32.2 31.5 3.8 14.5 13.9 -0.6 0.1
35 2.7 5.5E-05 31.5 3.5 13.5 13.2 -0.3 35 3 6.7E-05 31.4 30.7 3.6 13.5 13.1 -0.4 0.1
34 2.8 7.5E-05 30.5 3.5 12.5 12.2 -0.3 34 3.1 9.0E-05 30.5 29.8 3.5 12.5 12.2 -0.3 0
33 2.9 1.7E-04 29.6 3.4 11.5 11.3 -0.2 33 3.2 2.0E-04 29.6 28.9 3.4 11.5 11.3 -0.2 0
32 3.1 5.2E-04 28.8 3.2 10.5 10.5 0 32 3.3 5.7E-04 28.7 28 3.3 10.5 10.4 -0.1 0.1
31 3.3 1.5E-03 27.8 3.2 9.5 9.5 0 31 3.6 1.6E-03 27.8 27.1 3.2 9.5 9.5 0 0
30 3.6 3.6E-03 26.8 3.2 8.5 8.5 0 30 3.9 3.7E-03 26.8 26.2 3.2 8.5 8.5 0 0
29 4.2 7.4E-03 25.8 3.2 7.5 7.5 0 29 4.3 7.5E-03 25.7 25.2 3.3 7.5 7.4 -0.1 0.1
28 4.6 1.3E-02 24.7 3.3 6.5 6.4 -0.1 28 4.9 1.3E-02 24.7 24.3 3.3 6.5 6.4 -0.1 0
27 5.5 2.1E-02 23.7 3.3 5.5 5.4 -0.1 27 5.6 2.1E-02 23.7 23.3 3.3 5.5 5.4 -0.1 0
26 6.3 3.0E-02 22.5 3.5 4.5 4.2 -0.3 26 6.5 3.0E-02 22.5 22.4 3.5 4.5 4.2 -0.3 0
25 7.3 4.0E-02 21.3 3.7 3.5 3 -0.5 25 7.4 4.0E-02 21.2 21.4 3.8 3.5 2.9 -0.6 0.1
24.5 7.9 4.6E-02 20.5 20.9 4 3 2.2 -0.8 24.5 8 4.6E-02 20.5 20.9 4 3 2.2 -0.8 0
24 8.6 5.1E-02 19.8 20.4 4.2 2.5 1.5 -1 24 8.7 5.1E-02 19.8 20.4 4.2 2.5 1.5 -1 0
23.5 9.5 5.7E-02 19.1 19.9 4.4 2 0.8 -1.2 23.5 9.6 5.7E-02 19.2 19.9 4.3 2 0.9 -1.1 -0.1
23 10.7 6.3E-02 18.6 19.4 4.4 1.5 0.3 -1.2 23 10.9 6.3E-02 18.6 19.4 4.4 1.5 0.3 -1.2 0
22.5 12.6 6.9E-02 18.2 18.9 4.3 1 -0.1 -1.1 22.5 12.7 6.9E-02 18.1 18.9 4.4 1 -0.2 -1.2 0.1
22 15.5 7.6E-02 17.8 18.4 4.2 0.5 -0.5 -1 22 15.5 7.6E-02 17.7 18.4 4.3 0.5 -0.6 -1.1 0.1
21.9 16.3 7.7E-02 0,0E-09 17.7 18.3 4.2 0.4 -0.6 -1
ok 21.5 21.3 8.2E-02 17.3 17.9 4.2 0 -1 -1 21.5 21.4 8.2E-02 17.3 17.9 4.2 0 -1 -1 0
ko 21.4 24.3 8.3E-02 6.1E-04 - 17.8 21.4 24.2 8.4E-02 6.2E-04 17.2 17.8
21 - - - - 17.4 21 - - - - 17.4
visual failure point: where the picture is only just good (due to ESR5) in 0.1 dB steps
* receiver failure point: where are measured values are still there (even only for a shirt time)
** BER before BCH first time (0,1 dB steps) worst than 1E-07
results of measurementsresults of measurements "derived" parameters "derived" parameters
instrument "A2"instrument "A1"
- 0 dB
0 50 170 delay (ms)
Path #2 (SFN interf.)
Path #1 (SFN useful)
600 224
(this level is varying in tests)

Rep. ITU-R BT.2467-1 29
Table A2.1 shows the outcomes of measurements performed by two different companies, which used
two professional receivers “A1” and “A2” of the same model type “A” and two different signal
generators. The differences of the results is lower than 0.3 dB.
TABLE A2.2
SFN: 1 Useful signal + 1 interference @600 ms (measurement repeated for instrument A1)

30 Rep. ITU-R BT.2467-1
FIGURE A2.1
SFN: 1 Useful signal + 1 interference @600 ms
(data from Table A2.2)
TABLE A2.3
SFN: 1 Useful signal + 1 interference @300 ms
(just outside the GI)
0
5
10
15
20
25
1.0
E-0
52
.0E-
05
3.0
E-0
54
.0E-
05
5.0
E-0
56
.0E-
05
7.0
E-0
58
.0E-
05
9.0
E-0
51
.0E-
04
2.0
E-0
43
.0E-
04
4.0
E-0
45
.0E-
04
6.0
E-0
47
.0E-
04
8.0
E-0
49
.0E-
04
1.0
E-0
32
.0E-
03
3.0
E-0
34
.0E-
03
5.0
E-0
36
.0E-
03
7.0
E-0
38
.0E-
03
9.0
E-0
31
.0E-
02
2.0
E-0
23
.0E-
02
4.0
E-0
25
.0E-
02
6.0
E-0
27
.0E-
02
8.0
E-0
29
.0E-
02
1.0
E-0
1
1 useful + 1 interf. 600 micro
Margin as a function of BER before LDPC(manual interp. of values)
margin(dB)
BER b.LDPC

Rep. ITU-R BT.2467-1 31
FIGURE A2.2
SFN: 1 Useful signal + 1 interference @300 ms
(data from Table A2.3)
TABLE A2.4
SFN: 2 Useful signal + 1 interference @600 ms
0
5
10
15
20
25
1.0
E-0
52
.0E-
05
3.0
E-0
54
.0E-
05
5.0
E-0
56
.0E-
05
7.0
E-0
58
.0E-
05
9.0
E-0
51
.0E-
04
2.0
E-0
43
.0E-
04
4.0
E-0
45
.0E-
04
6.0
E-0
47
.0E-
04
8.0
E-0
49
.0E-
04
1.0
E-0
32
.0E-
03
3.0
E-0
34
.0E-
03
5.0
E-0
36
.0E-
03
7.0
E-0
38
.0E-
03
9.0
E-0
31
.0E-
02
2.0
E-0
23
.0E-
02
4.0
E-0
25
.0E-
02
6.0
E-0
27
.0E-
02
8.0
E-0
29
.0E-
02
1.0
E-0
1
1 useful + 1 interf. 300 micro
margin(dB)
BER b.LDPC
date 06.02.2018 (Tuesday )
time PM
generator SFU
receiver A1 useful "C" = 0 @ 0 microseconds
MFN/SFN SFN useful "C" = -10 @ 130 microseconds
Measurem. type Pr. Ratio * interf. "I" = @ 600 microseconds
CH 38
Level -50 dBm
FFT, PP 32kn, PP2
GI 1/16
GI duration 224 ms (nominal value)
PLP Mod 256QAM
PLP Code 2/3
L1 mod 16 QAM
reference MER ** 18.3 dB
C/I (dB)
Iter
numb.
BER
Before
LDPC
BER
Before
BCH
MER PLP
(dB)
MER L1
(dB)
C/I -
MER
(dB)
margin
(dB)
MER-ref
MER (dB)
delta
(dB)
I=0 3.2 5.6E-05 40.2 38.6
40 3.3 5.9E-05 34.9 34.1 5.1 18 16.6 -1.4
39 3.3 6.0E-05 34.4 33.4 4.6 17 16.1 -0.9
38 3.3 6.4E-05 33.4 32.7 4.6 16 15.1 -0.9
37 3.4 7.6E-05 32.6 32 4.4 15 14.3 -0.7
36 3.5 1.1E-04 31.8 31.1 4.2 14 13.5 -0.5
35 3.5 2.3E-04 30.9 30.3 4.1 13 12.6 -0.4
34 3.6 5.1E-04 30.1 29.4 3.9 12 11.8 -0.2
33 3.7 1.1E-03 29.2 28.5 3.8 11 10.9 -0.1
32 3.9 2.3E-03 28.4 27.6 3.6 10 10.1 0.1
31 4.1 4.2E-03 27.5 26.7 3.5 9 9.2 0.2
30 4.5 7.1E-03 26.6 25.7 3.4 8 8.3 0.3
29 4.8 1.1E-02 25.7 24.8 3.3 7 7.4 0.4
28 5.4 1.7E-02 24.7 23.8 3.3 6 6.4 0.4
27 6 2.4E-02 23.7 22.9 3.3 5 5.4 0.4
26 6.7 3.3E-02 22.6 21.9 3.4 4 4.3 0.3
25 7.6 4.2E-02 21.2 20.9 3.8 3 2.9 -0.1
24.5
24 9 5.3E-02 19.6 19.9 4.4 2 1.3 -0.7
23.5
23 11.1 6.5E-02 18.3 18.9 4.7 1 0 -1
22.5
ok 22 15.5 7.8E-02 17.3 17.9 4.7 0 -1 -1
ok 21.6 19.9 8.3E-02 16.9 17.6
KO 21.5 21.5 8.5E-02 4.2E-06 16.8 17.4
KO 21.4 24.5 8.6E-02 2.4E-06 16.7 17.3
KO 21 - - - - 17.4
* 2 useful signal plus 1 interference outside GI
** MER "at failure" (1 useful @ level -50 dBm + noise)
results of measurements "derived" parameters
- 0 dB
0 50 180 delay (ms)
Path #3 (SFN interf.)
Path #1 (SFN main)
600 224
(this level is varying in test)
Path #2 -10 dB

32 Rep. ITU-R BT.2467-1
FIGURE A2.3
SFN: 2 Useful signal + 1 interference @600 ms
(data from Table A2.4)
TABLE A2.5
SFN: 2 Useful signal (0, −3 dB) + 1 interference @600 ms
0
5
10
15
20
25
1.0
E-0
52
.0E-
05
3.0
E-0
54
.0E-
05
5.0
E-0
56
.0E-
05
7.0
E-0
58
.0E-
05
9.0
E-0
51
.0E-
04
2.0
E-0
43
.0E-
04
4.0
E-0
45
.0E-
04
6.0
E-0
47
.0E-
04
8.0
E-0
49
.0E-
04
1.0
E-0
32
.0E-
03
3.0
E-0
34
.0E-
03
5.0
E-0
36
.0E-
03
7.0
E-0
38
.0E-
03
9.0
E-0
31
.0E-
02
2.0
E-0
23
.0E-
02
4.0
E-0
25
.0E-
02
6.0
E-0
27
.0E-
02
8.0
E-0
29
.0E-
02
1.0
E-0
1
2 useful + 1 interf 600 micro
margin(dB)
BER b.LDPC
date 08.02.2018
time AM
generator SFU
receiver …………… useful "C" = 0 @ 0 microseconds
MFN/SFN SFN useful "C" = -3@ 30 microseconds
Measurem. type Pr. Ratio * interf. "I" = @ 600 microseconds
CH 38
Level -50 dBm
FFT, PP 32kn, PP2
GI 1/16
GI duration 224 ms (nominal value)
PLP Mod 256QAM
PLP Code 2/3
L1 mod 16 QAM
reference MER ** 18.3 dB
C/I (dB)
Iter
numb.
BER
Before
LDPC
BER
Before
BCH
MER PLP
(dB)
MER L1
(dB)
C/I -
MER
(dB)
margin
(dB)
MER-ref
MER (dB)
delta
(dB)
I=0 4.8 7.1E-05 36.6 35.9
40 5.1 1.2E-03 32.3 31.6 7.7 18.5 14 -4.5
39 5.2 1.7E-03 31.8 31 7.2 17.5 13.5 -4
38 5.2 2.4E-03 31.2 30.4 6.8 16.5 12.9 -3.6
37 5.3 3.3E-03 30.6 29.4 6.4 15.5 12.3 -3.2
36 5.5 4.4E-03 30 28.7 6 14.5 11.7 -2.8
35 5.6 5.9E-03 29.4 28 5.6 13.5 11.1 -2.4
34 5.7 7.7E-03 28.9 27.1 5.1 12.5 10.6 -1.9
33 5.8 9.8E-03 28.3 26.3 4.7 11.5 10 -1.5
32 6 1.2E-02 27.7 25.3 4.3 10.5 9.4 -1.1
31 6.1 1.5E-02 27 24.4 4 9.5 8.7 -0.8
30 6.3 1.9E-02 26.2 23.5 3.8 8.5 7.9 -0.6
29 6.6 2.4E-02 25.4 22.5 3.6 7.5 7.1 -0.4
28 7 2.9E-02 24.4 21.5 3.6 6.5 6.1 -0.4
27 7.4 3.5E-02 23.2 20.6 3.8 5.5 4.9 -0.6
26 8 4.2E-02 21.5 19.6 4.5 4.5 3.2 -1.3
25 8.9 5.1E-02 19 18.6 6 3.5 0.7 -2.8
24 10 6.1E-02 17.4 17.6 6.6 2.5 -0.9 -3.4
23 12 7.3E-02 16 16.6 7 1.5 -2.3 -3.8
22 15.9 8.5E-02 14.7 15.6 7.3 0.5 -3.6 -4.1
ok 21.5 20.2 9.1E-02 14 15.1 7.5 0 -4.3 -4.3
ok 21.4 21.7 9.3E-02 13.9 15
ok 21.3 23.4 9.4E-02 13.7 14.9
ok 21.2 26 9.5E-02 13.6 14.8
KO 21.1 30 9.7E-02 5.1E-05 13.5 14.7
KO 21 35 9.8E-02 1.8E-03 13.3 14.7
* 2 useful signal (near echo 0 dB) plus 1 interference outside GI
** MER "at failure" (1 useful @ level -50 dBm + noise)
"derived" parametersresults of measurements
- 0 dB
0 30 180 delay (ms)
Path #3 (SFN interf.)
Path #1 (SFN main)
600 224
(this level is varying in test)
Path #2 -3 dB

Rep. ITU-R BT.2467-1 33
FIGURE A2.4
SFN: 2 Useful signal (0, –3 dB) + 1 interference @600 ms
(data from Table A2.5)
The profile used to obtain Table A2.5 is similar to the case of “0 dB echo”.
TABLE A2.6
SFN: 3 Useful signal + 1 interference @600 ms
0
5
10
15
20
25
1.0
E-0
52
.0E-
05
3.0
E-0
54
.0E-
05
5.0
E-0
56
.0E-
05
7.0
E-0
58
.0E-
05
9.0
E-0
51
.0E-
04
2.0
E-0
43
.0E-
04
4.0
E-0
45
.0E-
04
6.0
E-0
47
.0E-
04
8.0
E-0
49
.0E-
04
1.0
E-0
32
.0E-
03
3.0
E-0
34
.0E-
03
5.0
E-0
36
.0E-
03
7.0
E-0
38
.0E-
03
9.0
E-0
31
.0E-
02
2.0
E-0
23
.0E-
02
4.0
E-0
25
.0E-
02
6.0
E-0
27
.0E-
02
8.0
E-0
29
.0E-
02
1.0
E-0
1
2 Useful -3dB + 1 interf. 600 micro
margin(dB)
BER b.LDPC
date 17.01.2018
time AM
generator SFU
receiver A1 useful "C" = -6 @ 0 microseconds
MFN/SFN SFN useful "C" = 0 @ 50 microseconds
Measurem. type Pr. Ratio * useful "C" = -10 @ 180 microseconds
CH 38 interf. "I" = @ 600 microseconds
Level -50 dBm
FFT, PP 32kn, PP2
GI 1/16
GI duration 224 ms (nominal value)
PLP Mod 256QAM
PLP Code 2/3
L1 mod 16 QAM
reference MER ** 18.3 dB
C/I (dB)
Iter
numb.
BER
Before
LDPC
BER
Before
BCH
MER PLP
(dB)
MER L1
(dB)
C/I -
MER
(dB)
margin
(dB)
MER-ref
MER (dB)
delta
(dB)
I=0 4.6 2.0E-04 37.3 36.5
40 4.8 1.4E-03 33 32 7 18.5 14.7 -3.8
39 4.9 1.7E-03 32.5 31.4 6.5 17.5 14.2 -3.3
38 5 2.2E-03 31.9 30.7 6.1 16.5 13.6 -2.9
37 5 2.7E-03 31.2 30 5.8 15.5 12.9 -2.6
36 5.1 3.4E-03 30.6 29.2 5.4 14.5 12.3 -2.2
35 5.1 4.3E-03 29.9 28.4 5.1 13.5 11.6 -1.9
34 5.2 5.5E-03 29.2 27.5 4.8 12.5 10.9 -1.6
33 5.3 7.1E-03 28.6 26.6 4.4 11.5 10.3 -1.2
32 5.4 9.2E-03 27.8 25.7 4.2 10.5 9.5 -1
31 5.6 1.2E-02 27 24.8 4 9.5 8.7 -0.8
30 5.9 1.5E-02 26.1 23.9 3.9 8.5 7.8 -0.7
29 6.2 2.0E-02 25.2 22.9 3.8 7.5 6.9 -0.6
28 6.5 2.5E-02 24.2 21.9 3.8 6.5 5.9 -0.6
27 6.9 3.2E-02 22.9 20.9 4.1 5.5 4.6 -0.9
26 7.7 4.0E-02 21.1 19.9 4.9 4.5 2.8 -1.7
25 8.6 4.9E-02 18.9 18.9 6.1 3.5 0.6 -2.9
24 9.9 5.9E-02 17.5 18 6.5 2.5 -0.8 -3.3
23 11.8 7.1E-02 16.3 17 6.7 1.5 -2 -3.5
ok 22 15.8 8.3E-02 15.1 16 6.9 0.5 -3.2 -3.7
ok 21.5 20.9 9.0E-02 14.5 15.5 7 0 -3.8 -3.8
ok 21.4 22.7 9.1E-02 14.4 15.4
KO 21.3 25.6 9.2E-02 6.3E-06 14.3 15.3
KO 21.2 29.3 9.4E-02 4.6E-04 14.2 15.2
KO 21 15
* 3 useful signal plus 1 interference outside GI
** MER "at failure" (1 useful @ level -50 dBm + noise)
"derived" parametersresults of measurements
- 0 dB
0 50 180 delay (ms)
Path #4 (SFN interf.)
Path #2 (SFN main)
600 224
(this level is varying in test)
Path #3 -10 dB
Path #1 -6 dB

34 Rep. ITU-R BT.2467-1
FIGURE A2.5
SFN: 3 Useful signal + 1 interference @600 ms
(data from Table A2.6)
FIGURE A2.6
Figure A2.6 shows the margin as a function of BER before LDPC (with manual interpolation of
values) derived from the examples of Tables A2.1, A2.3, A2.4, A2.5, A2.6 for the mode 32 k not
extended, PP2, GI 1/16, 256 QAM, code rate 2/3.
In the following pages, Tables A2.7 and A2.8 are illustrated. They are related to mode 32 k not
extended, PP2, GI 1/16, 256 QAM, code rate 3/5 and show the behavior of SFN with one useful path
and one interference outside the Guard Interval at 600 ms and 350 ms, respectively.
0
5
10
15
20
25
1.0
E-0
52
.0E-
05
3.0
E-0
54
.0E-
05
5.0
E-0
56
.0E-
05
7.0
E-0
58
.0E-
05
9.0
E-0
51
.0E-
04
2.0
E-0
43
.0E-
04
4.0
E-0
45
.0E-
04
6.0
E-0
47
.0E-
04
8.0
E-0
49
.0E-
04
1.0
E-0
32
.0E-
03
3.0
E-0
34
.0E-
03
5.0
E-0
36
.0E-
03
7.0
E-0
38
.0E-
03
9.0
E-0
31
.0E-
02
2.0
E-0
23
.0E-
02
4.0
E-0
25
.0E-
02
6.0
E-0
27
.0E-
02
8.0
E-0
29
.0E-
02
1.0
E-0
1
3 Useful + 1 interf.
600 micro
margin(dB)
BER b.LDPC
0
5
10
15
20
25
1.0
E-0
5
3.0
E-0
5
5.0
E-0
5
7.0
E-0
5
9.0
E-0
5
2.0
E-0
4
4.0
E-0
4
6.0
E-0
4
8.0
E-0
4
1.0
E-0
3
3.0
E-0
3
5.0
E-0
3
7.0
E-0
3
9.0
E-0
3
2.0
E-0
2
4.0
E-0
2
6.0
E-0
2
8.0
E-0
2
1.0
E-0
1
1U+I@600
1U+I@300
2U+I@600
2U -3dB+I@600
3U+I@600
Margin as a function of BER before LDPC(manual interp. of values)
margin(dB)
BER b.LDPC

Rep. ITU-R BT.2467-1 35
TABLE A2.7
SFN: 1 Useful signal + 1 interference @600 ms
Mode 256 QAM, code 3/5
date 09/08/18
time
generator SFU
receiver A2
MFN/SFN SFN
Measurem. type Pr. Ratio * ETL and A2 connected with 1 meter Coax cable
CH 38 610 MHz LDPC Iterations: mean value
Level -50 dBm
FFT, PP 32kn, PP2 useful "C" = 0 @ 0 microseconds
GI 1/16 interf. "I" = @ 600 microseconds
GI duration 224 ms (nominal value)
PLP Mod 256QAM
PLP Code 3/5
* 1 useful signal plus 1 interference outside GI
reference MER (MFN) 17.1 dB Bei *
reference C/I 20 db Bei *
C/I (dB)
Iter
numb.
BER
Before
LDPC
BER
Before
BCH
MER
PLP (dB)
MER L1
(dB)
C/I -
MER
(dB)margin
(dB)
MER-ref
MER (dB)
delta
(dB)
Echo off 3.5 5.9E-05 40.3 38.5
40.0 3.5 6.0E-05 35.3 34.3 4.7 20.0 18.2 -1.8
39.0 3.5 6.0E-05 34.6 33.7 4.4 19.0 17.5 -1.5
38.0 3.5 6.0E-05 33.8 33.0 4.2 18.0 16.7 -1.3
37.0 3.6 6.1E-05 33.1 32.3 3.9 17.0 16.0 -1.0
36.0 3.6 6.2E-05 32.2 31.5 3.8 16.0 15.1 -0.9
35.0 3.6 6.7E-05 31.4 30.6 3.6 15.0 14.3 -0.7
34.0 3.7 9.1E-05 30.5 29.8 3.5 14.0 13.4 -0.6
33.0 3.8 2.0E-04 29.6 28.9 3.4 13.0 12.5 -0.5
32.0 4.1 5.7E-04 28.7 28.0 3.3 12.0 11.6 -0.4
31.0 4.4 1.6E-03 27.8 27.1 3.2 11.0 10.7 -0.3
30.0 4.9 3.7E-03 26.8 26.2 3.2 10.0 9.7 -0.3
29.0 5.5 7.5E-03 25.7 25.2 3.3 9.0 8.6 -0.4
28.0 6.4 1.3E-02 24.7 24.3 3.3 8.0 7.6 -0.4
27.0 7.6 2.1E-02 23.7 23.3 3.3 7.0 6.6 -0.4
26.0 9.2 3.0E-02 22.5 22.3 3.5 6.0 5.4 -0.6
25.0 11.2 4.0E-02 21.3 21.4 3.7 5.0 4.2 -0.8
24.5 12.2 4.6E-02 20.5 20.9 4.0 4.5 3.4 -1.1
24.0 13.7 5.1E-02 19.8 20.4 4.2 4.0 2.7 -1.3
23.5 15.2 5.7E-02 19.2 19.9 4.3 3.5 2.1 -1.4
23.0 17.0 6.3E-02 18.6 19.4 4.4 3.0 1.5 -1.5
22.5 19.1 6.9E-02 18.1 18.9 4.4 2.5 1.0 -1.5
22.0 22.0 7.6E-02 17.8 18.4 4.2 2.0 0.7 -1.3
21.5 25.0 8.2E-02 17.3 17.9 4.2 1.5 0.2 -1.3
21.0 28.9 8.9E-02 16.9 17.4 4.1 1.0 -0.2 -1.2
20.5 33.3 9.6E-02 16.4 16.9 4.1 0.5 -0.7 -1.2
20.0 36.0 1.0E-01 7.9E-08 15.8 16.4 4.2 0.0 -1.3 -1.3
*** 19.9 36.1 1.0E-01 3.4E-07 15.8 16.3 4.1 -0.1 -1.3 -1.2
* 19.7 36.3 1.1E-01 6.6E-06 15.5 16.1 4.2 -0.3 -1.6 -1.3
C/I (dB)
Iter
numb.
BER
Before
LDPC
BER
Before
BCH
MER
PLP (dB)
MER L1
(dB)
* visual failure point: where the picture is only just good (due to ESR5) in 0.1 dB steps
** receiver failure point: where are measured values are still there (even only for a shirt time)
*** BER before BCH first time (0,1 dB steps) worst than 1E-07
results of measurements "derived" parameters
- 0 dB
0 50 170 delay (ms)
Path #2 (SFN interf.)
Path #1 (SFN useful)
600 224
(this level is varying in tests)

36 Rep. ITU-R BT.2467-1
TABLE A2.8
SFN: 1 Useful signal + 1 interference @350 ms
Mode 256 QAM, code 3/5
date 09/08/18
time
generator SFU A2 and SFU connected with 1 meter Coax cable
receiver A2 LDPC Iterations: mean value
MFN/SFN SFN
Measurem. type Pr. Ratio * useful "C" = 0 @ 0 microseconds
CH 38 610 MHz interf. "I" = @ 350 microseconds
Level -50 dBm
FFT, PP 32kn, PP2
GI 1/16
GI duration 224 ms (nominal value)
PLP Mod 256QAM
PLP Code 3/5L1 mod 16 QAM
reference MER 17.1 dB Bei *
reference C/I 7.0 db Bei *
C/I (dB) Iter numb.
BER
Before
LDPC
BER
Before
BCH
MER PLP
(dB)
MER L1
(dB)
C/I - MER
(dB)margin
(dB)
MER-ref
MER (dB)
delta
(dB)
Echo off 3.5 5.8E-05 40.3 38.4
40.0 3.4 6.1E-05 34.4 33.2 5.6 33.0 17.3 -15.7
39.0 3.4 6.1E-05 34.2 33.0 4.8 32.0 17.1 -14.9
38.0 3.5 6.1E-05 33.5 32.5 4.5 31.0 16.4 -14.6
37.0 3.5 6.1E-05 32.8 32.0 4.2 30.0 15.7 -14.3
36.0 3.5 6.2E-05 32.1 31.3 3.9 29.0 15.0 -14.0
35.0 3.4 6.0E-05 38.9 37.5 -3.9 28.0 21.8 -6.2
34.0 3.4 6.1E-05 38.6 37.1 -4.6 27.0 21.5 -5.5
33.0 3.4 6.1E-05 38.3 37.0 -5.3 26.0 21.2 -4.8
32.0 3.4 6.1E-05 37.9 36.6 -5.9 25.0 20.8 -4.2
31.0 3.5 6.1E-05 37.5 36.2 -6.5 24.0 20.4 -3.6
30.0 3.5 6.1E-05 37.0 35.8 -7.0 23.0 19.9 -3.1
29.0 3.5 6.2E-05 36.4 35.4 -7.4 22.0 19.3 -2.7
28.0 3.5 6.2E-05 35.8 34.8 -7.8 21.0 18.7 -2.3
27.0 3.6 6.3E-05 35.2 34.1 -8.2 20.0 18.1 -1.9
26.0 3.5 6.5E-05 34.4 33.6 -8.4 19.0 17.3 -1.7
25.0 3.6 7.0E-05 33.7 32.9 -8.7 18.0 16.6 -1.4
24.0 3.7 8.6E-05 32.9 32.2 -8.9 17.0 15.8 -1.2
23.0 3.8 1.3E-04 32.1 31.4 -9.1 16.0 15.0 -1.0
22.0 3.9 2.4E-04 31.2 30.6 -9.2 15.0 14.1 -0.9
21.0 4.0 5.1E-04 30.4 29.7 -9.4 14.0 13.3 -0.7
20.0 4.3 1.1E-03 29.5 28.8 -9.5 13.0 12.4 -0.6
19.0 4.6 2.1E-03 28.7 27.9 -9.7 12.0 11.6 -0.4
18.0 5.0 3.8E-03 27.8 27.0 -9.8 11.0 10.7 -0.3
17.0 5.6 6.6E-03 26.9 26.1 -9.9 10.0 9.8 -0.2
16.0 6.4 1.1E-02 26.1 25.1 -10.1 9.0 9.0 0.0
15.0 7.4 1.6E-02 25.2 24.1 -10.2 8.0 8.1 0.1
14.0 8.4 2.3E-02 24.3 23.1 -10.3 7.0 7.2 0.2
13.0 10.3 3.2E-02 23.4 22.1 -10.4 6.0 6.3 0.3
12.0 12.4 4.1E-02 22.4 21.1 -10.4 5.0 5.3 0.3
11.0 15.1 5.2E-02 21.1 20.1 -10.1 4.0 4.0 0.0
10.0 18.5 6.4E-02 19.5 19.0 -9.5 3.0 2.4 -0.6
9.0 23.3 7.8E-02 18.2 17.9 -9.2 2.0 1.1 -0.9
8.0 29.9 9.2E-02 17.1 16.8 -9.1 1.0 0.0 -1.0
7.5 34.4 1.0E-01 16.5 16.1 -9.0 0.5 -0.6 -1.1
7.1 36.1 1.1E-01 4.1E-08 16.0 15.6 -8.9 0.1 -1.1 -1.2
7.0 36.2 1.1E-01 1.4E-06 15.9 15.5 -8.9 0.0 -1.2 -1.2
6.9 36.2 1.1E-01 5.0E-05 15.8 15.4 -8.9 -0.1 -1.3 -1.2
C/I (dB) Iter numb.
BER
Before
LDPC
BER
Before
BCH
MER PLP
(dB)
MER L1
(dB)
visual failure point: where the picture is only just good (due to ESR5) in 0.1 dB steps
receiver failure point: where are measured values are still there (even only for a shirt time)
BER before BCH first time (0,1 dB steps) worst than 1E-07
"derived" parametersresults of measurements
0 50 170 delay (ms)350 224
- 0 dB
Path #2 (SFN interf.)
Path #1 (SFN useful)
(this level is varying in tests)
“Reference MER” value for this
mode is 17.1 dB and 15.9 − 17.1 =
−1.2 dB

Rep. ITU-R BT.2467-1 37
Annex 3
to Part 1
Summary of the values needed to obtain the margin to the failure point
This Annex 3 to Part 1 summarizes for a number of DVB-T2 system variants the values of “reference
MER”, Lc and f (BER) that can be used in the two formulas, one for MFN and the other for SFN, to
obtain the margin to the failure point following the procedure indicated in §§ 5.1 and 5.2.
The two formulas are shown below.
• MFN margin = MER – reference MER + Lcmfn + f (BER) mfn
• SFN margin = MER – reference MER + Lcsfn + f (BER) sfn
In particular, Lc is used to correct the results as a function of the received level, while f (BER) is used
to correct the non-linearity of MER as a function of the C/I.
Note that the reference MER has the same value for both the MFN case and the SFN case.
Furthermore, for the same modes, this Annex also summarizes the values of the additional factors,
function of the BER Before LDPC and of the number of LDPC iterations, that can also be used to
obtain the margin.
NOTE − The following Tables show the results for different input levels, each of the columns labeled
as “margin (dB)” should be understood as “C/I margin (dB)”.

38 Rep. ITU-R BT.2467-1
TABLE A3.1
32k not extended, PP2, 1/16, 256 QAM, 2/3
Ref
MER
LDPC iter.
and BER
Tables
Lc f (BER)
MFN 18.3 dB
Not relevant for MFN
SFN 18.3 dB
f (BER) for level > −60 dBm
Lcmfn BER
≤ 1e-2 ≤ 2e-2 ≤ 4e-2 >4e-2
-63 0 0 0 0
-64 0.5 0.18 0 0
-65 0.85 0.28 0 0
-66 1.35 0.65 0.25 0
-67 2.1 0.9 0.28 0
-68 3 1.4 0.4 0
-69 6 2.2 0.7 0
-70 6 3.5 1.2 0
-71 6 1.9 0
-72 3.1 0
-73 0
leve
l (d
Bm
)
BER before
LDPC margin
<= 8E-2 >= 0
<= 6E-2 >= 2
<= 4E-2 >= 3
<= 1E-2 >= 6
<= 1E-3 >= 9
<= 1E-4 >= 11
LDPC
iterations margin
<= 20 >= -1
<= 15 >= 0
<= 10 >= 2
<= 6 >= 4
<= 5 >= 6
<= 3 >= 10
Lcsfn BER
≤ 1e-2 ≤ 2e-2 ≤ 4e-2 >4e-2
-60 0 0 0 0
-61 0 0 0.1 0
-62 0.1 0.1 0.2 0
-63 0.4 0.2 0.3 0
-64 0.7 0.4 0.4 0
-65 1 0.6 0.5 0
-66 1.4 0.8 0.6 0
-67 2 1.1 0.7 0
-68 3.3 1.6 0.8 0
-69 6 2.4 1.1 0
-70 6 3.8 1.5 0
-71 6 2.3 0
-72 3.6 0
-73 6 0
leve
l (d
Bm
)
-1.3
-0.8
-0.3
0.2
0.7
4.0
E-0
55
.0E-
05
6.0
E-0
57
.0E-
05
8.0
E-0
59
.0E-
05
1.0
E-0
42
.0E-
04
3.0
E-0
44
.0E-
04
5.0
E-0
46
.0E-
04
7.0
E-0
48
.0E-
04
9.0
E-0
41
.0E-
03
2.0
E-0
33
.0E-
03
4.0
E-0
35
.0E-
03
6.0
E-0
37
.0E-
03
8.0
E-0
39
.0E-
03
1.0
E-0
22
.0E-
02
3.0
E-0
24
.0E-
02
5.0
E-0
26
.0E-
02
7.0
E-0
28
.0E-
02

Rep. ITU-R BT.2467-1 39
TABLE A3.2
Results* (AWGN interference limited) with different input levels (MFN)
(32k not extended, PP2, 1/16, 256 QAM, 2/3)
(*) values obtained using two receivers of the same type.
MFN reference MER (dB) 18.3
level (dBm)
C/I (dB) mar
gin
(d
B)
**
BER
Before
LDPC
MER
PLP
(dB) mar
gin
(d
B)
x =
MER
- r
ef
MER
(d
B)
del
ta (
dB
)
(x
-
mar
gin
)
Iter
numb.
BER
Before
LDPC
MER
PLP
(dB) mar
gin
(d
B)
x =
MER
- r
ef
MER
(d
B)
del
ta (
dB
)
(x
-
mar
gin
)
BER
Before
LDPC
MER
PLP
(dB) mar
gin
(d
B)
x =
MER
- r
ef
MER
(d
B)
del
ta (
dB
)
(x
-
mar
gin
)
BER
Before
LDPC
MER
PLP
(dB) mar
gin
(d
B)
x =
MER
- r
ef
MER
(d
B)
del
ta (
dB
)
(x
-
mar
gin
)
I=0 5.7E-05 41.4 2.6 6.2E-05 34.9 1.8E-04 30.3 2.9E-03 27.3 4 5.9E-03 26.3 9.7E-03 25.4 2.5E-02 23.4
40 20 6.0E-05 36.9 20 18.6 -1.4 2.6 6.5E-05 33.4 20 15.1 -4.9 3.5E-04 29.6 19.5 11.3 -8.2 3.6E-03 27 19 8.7 -10.3 4.1 6.9E-03 26 19 7.6 -11.4 1.1E-02 25.2 19 6.9 -12.1 2.6E-02 23.2 18 4.9 -13.1
39 19 6.1E-05 36.2 19 17.9 -1.1 2.6 6.4E-05 33.1 19 14.8 -4.2 3.9E-04 29.5 18.5 11.2 -7.3 3.9E-03 26.9 18 8.6 -9.4 4.1 7.0E-03 26 18 7.6 -10.4
38 18 6.1E-05 35.4 18 17.1 -0.9 2.6 6.6E-05 32.7 18 14.4 -3.6 4.8E-04 29.3 17.5 11 -6.5 4.1E-03 26.8 17 8.5 -8.5 4.2 7.5E-03 25.9 17 7.5 -9.5 2.7E-02 23.1 16 4.8 -11.2
37 17 6.1E-05 34.7 17 16.4 -0.6 2.6 6.9E-05 32.3 17 14 -3 5.6E-04 29.1 16.5 10.8 -5.7 4.5E-03 26.7 16 8.4 -7.6 4.3 8.0E-03 25.8 16 7.4 -8.6
36 16 6.1E-05 33.9 16 15.6 -0.4 2.6 7.6E-05 31.8 16 13.5 -2.5 7.4E-04 28.9 15.5 10.6 -4.9 4.9E-03 26.6 15 8.3 -6.7 4.35 8.5E-03 25.7 15 7.3 -7.7 2.7E-02 23 14 4.7 -9.3
35 15 6.5E-05 33 15 14.7 -0.3 2.7 9.3E-05 31.3 15 13 -2 9.6E-04 28.6 14.5 10.3 -4.2 5.5E-03 26.4 14 8.1 -5.9 4.4 9.2E-03 25.5 14 7.1 -6.9 1.3E-02 24.8 14 6.5 -7.5 2.8E-02 22.9 13 4.6 -8.4
34 14 6.8E-05 32.2 14 13.9 -0.1 2.7 1.3E-04 30.7 14 12.4 -1.6 1.3E-03 28.3 13.5 10 -3.5 6.3E-03 26.2 13 7.9 -5.1 4.5 1.0E-02 25.4 13 7 -6 1.4E-02 24.7 13 6.4 -6.6 3.0E-02 22.8 12 4.5 -7.5
33 13 8.9E-05 31.3 13 13 0 2.8 2.2E-04 30.1 13 11.8 -1.2 1.8E-03 27.9 12.5 9.6 -2.9 7.3E-03 25.9 12 7.6 -4.4 4.6 1.1E-02 25.2 12 6.8 -5.2 1.5E-02 24.5 12 6.2 -5.8 3.0E-02 22.7 11 4.4 -6.6
32 12 1.7E-04 30.4 12 12.1 0.1 2.9 4.5E-04 29.4 12 11.1 -0.9 2.6E-03 27.4 11.5 9.1 -2.4 8.7E-03 25.7 11 7.4 -3.6 4.8 1.3E-02 24.9 11 6.5 -4.5 1.7E-02 24.3 11 6 -5 3.2E-02 22.5 10 4.2 -5.8
31 11 4.0E-04 29.5 11 11.2 0.2 3.1 9.3E-04 28.6 11 10.3 -0.7 3.8E-03 27 10.5 8.7 -1.8 1.0E-02 25.3 10 7 -3 4.9 1.4E-02 24.6 10 6.2 -3.8 2.0E-02 23.9 10 5.6 -4.4 3.4E-02 22.3 9 4 -5
30 10 1.0E-03 28.5 10 10.2 0.2 3.3 2.0E-03 27.8 10 9.5 -0.5 5.6E-03 26.4 9.5 8.1 -1.4 1.3E-02 24.9 9 6.6 -2.4 5.2 1.7E-02 24.3 9 5.9 -3.1 2.2E-02 23.6 9 5.3 -3.7 3.6E-02 22.2 8 3.9 -4.1
29.5 9.5 6.7E-03 26.1 9 7.8 -1.2 1.4E-02 24.7 8.5 6.4 -2.1 5.4 1.8E-02 24.1 8.5 5.7 -2.8 2.4E-02 23.4 9 5.1 -3.9
29 9 2.4E-03 27.6 9 9.3 0.3 3.5 3.7E-03 27 9 8.7 -0.3 8.1E-03 25.8 8.5 7.5 -1 1.6E-02 24.4 8 6.1 -1.9 5.6 2.0E-02 23.9 8 5.5 -2.5 2.6E-02 23.2 8 4.9 -3.1 3.9E-02 21.8 7 3.5 -3.5
28.5 8.5 3.8 5.0E-03 26.5 8.5 8.2 -0.3 9.8E-03 25.4 8 7.1 -0.9 1.8E-02 24.2 7.5 5.9 -1.6 5.7 2.2E-02 23.7 7.5 5.3 -2.2 2.7E-02 23 7.5 4.7 -2.8 4.0E-02 21.7 6.5 3.4 -3.1
28 8 4.8E-03 26.6 8 8.3 0.3 4.1 6.5E-03 26.1 8 7.8 -0.2 1.2E-02 25.1 7.5 6.8 -0.7 2.0E-02 23.9 7 5.6 -1.4 5.9 2.4E-02 23.4 7 5 -2 2.9E-02 22.8 7 4.5 -2.5 4.2E-02 21.5 6 3.2 -2.8
27.5 7.5 6.6E-03 26.1 7.5 7.8 0.3 4.3 8.6E-03 25.6 7.5 7.3 -0.2 1.4E-02 24.7 7 6.4 -0.6 2.2E-02 23.7 6.5 5.4 -1.1 6.1 2.6E-02 23.1 6.5 4.7 -1.8 3.2E-02 22.6 6.5 4.3 -2.2 4.4E-02 21.3 5.5 3 -2.5
27 7 8.9E-03 25.6 7 7.3 0.3 4.5 1.1E-02 25.2 7 6.9 -0.1 1.7E-02 24.3 6.5 6 -0.5 2.5E-02 23.3 6 5 -1 6.3 2.9E-02 22.9 6 4.5 -1.5 3.4E-02 22.3 6 4 -2 4.6E-02 21.1 5 2.8 -2.2
26.5 6.5 1.2E-02 25.1 6.5 6.8 0.3 4.8 1.4E-02 24.7 6.5 6.4 -0.1 1.9E-02 24 6 5.7 -0.3 2.8E-02 23 5.5 4.7 -0.8 6.6 3.2E-02 22.6 5.5 4.2 -1.3 3.7E-02 22.1 5.5 3.8 -1.7 4.9E-02 20.8 4.5 2.5 -2
26 6 1.5E-02 24.6 6 6.3 0.3 5.1 1.7E-02 24.3 6 6 0 2.3E-02 23.6 5.5 5.3 -0.2 3.1E-02 22.7 5 4.4 -0.6 6.8 3.5E-02 22.3 5 3.9 -1.1 3.9E-02 21.8 5 3.5 -1.5 5.1E-02 20.6 4 2.3 -1.7
25.5 5.5 1.8E-02 24.1 5.5 5.8 0.3 5.5 2.1E-02 23.8 5.5 5.5 0 2.6E-02 23.1 5 4.8 -0.2 3.4E-02 22.3 4.5 4 -0.5 7.2 3.8E-02 21.9 4.5 3.5 -1 4.3E-02 21.4 4.5 3.1 -1.4 5.4E-02 20.3 3.5 2 -1.5
25 5 2.3E-02 23.6 5 5.3 0.3 5.9 2.5E-02 23.3 5 5 0 3.0E-02 22.7 4.5 4.4 -0.1 3.8E-02 21.9 4 3.6 -0.4 7.8 4.2E-02 21.6 4 3.2 -0.8 4.6E-02 21.1 4 2.8 -1.2 5.7E-02 20.1 3 1.8 -1.2
24.5 4.5 2.7E-02 23.1 4.5 4.8 0.3 6.3 2.9E-02 22.8 4.5 4.5 0 3.5E-02 22.2 4 3.9 -0.1 4.2E-02 21.5 3.5 3.2 -0.3 8.1 4.6E-02 21.1 3.5 2.7 -0.8 5.0E-02 20.7 3.5 2.4 -1.1 6.0E-02 19.8 2.5 1.5 -1
24 4 3.2E-02 22.5 4 4.2 0.2 6.8 3.4E-02 22.3 4 4 0 3.9E-02 21.8 3.5 3.5 0 4.6E-02 21.1 3 2.8 -0.2 8.6 5.0E-02 20.7 3 2.3 -0.7 5.4E-02 20.3 3 2 -1 6.4E-02 19.5 2 1.2 -0.8
23.5 3.5 3.8E-02 22 3.5 3.7 0.2 7.2 4.0E-02 21.8 3.5 3.5 0 4.4E-02 21.3 3 3 0 5.1E-02 20.6 2.5 2.3 -0.2 9.2 4.0E-02 20.3 2.5 1.9 -0.6 5.8E-02 20 2.5 1.7 -0.8 6.7E-02 19.2 1.5 0.9 -0.6
23 3 4.3E-02 21.4 3 3.1 0.1 7.9 4.5E-02 21.2 3 2.9 -0.1 5.0E-02 20.7 2.5 2.4 -0.1 5.6E-02 20.1 2 1.8 -0.2 10 5.9E-02 19.9 2 1.5 -0.5 6.2E-02 19.6 2 1.3 -0.7 7.1E-02 18.9 1 0.6 -0.4
22.5 2.5 4.9E-02 20.8 2.5 2.5 0 8.7 5.1E-02 20.6 2.5 2.3 -0.2 5.5E-02 20.2 2 1.9 -0.1 6.1E-02 19.7 1.5 1.4 -0.1 11.1 6.4E-02 19.5 1.5 1.1 -0.4 6.7E-02 19.2 1.5 0.9 -0.6 7.5E-02 18.7 0.5 0.4 -0.1
22 2 5.5E-02 20.2 2 1.9 -0.1 9.6 5.7E-02 20 2 1.7 -0.3 6.1E-02 19.7 1.5 1.4 -0.1 6.6E-02 19.3 1 1 0 12.6 6.9E-02 19.1 1 0.7 -0.3 7.2E-02 18.9 1 0.6 -0.4 8.0E-02 18.3 0 0 0
21.5 1.5 6.2E-02 19.6 1.5 1.3 -0.2 10.9 6.3E-02 19.5 1.5 1.2 -0.3 6.7E-02 19.2 1 0.9 -0.1 7.2E-02 18.9 0.5 0.6 0.1 14.5 7.4E-02 18.7 0.5 0.3 -0.2 7.7E-02 18.6 0.5 0.3 -0.2
21 1 6.8E-02 19.1 1 0.8 -0.2 12.7 7.0E-02 19 1 0.7 -0.3 7.3E-02 18.8 0.5 0.5 0 7.8E-02 18.5 0 0.2 0.2 17.7 8.0E-02 18.4 0 0 0 8.2E-02 18.3 0 0 0
20.5 0.5 7.5E-02 18.7 0.5 0.4 -0.1 15.5 7.6E-02 18.6 0.5 0.3 -0.2 7.9E-02 18.4 0 0.1 0.1 25.5 8.5E-02 18.1
20 0 8.2E-02 18.3 0 0 0 20.8 8.3E-02 18.2 0 -0.1 -0.1
* margin for levels > - 50 dBm
-72-50 -60 -65 -68 -69 -70

40 Rep. ITU-R BT.2467-1
TABLE A3.3
Results with different input levels (SFN)*
(32k not extended, PP2, 1/16, 256 QAM, 2/3)
(*) 1 Useful signal + 1 SFN auto-interference @600 μs.
SFN ref. MER (dB) 18.3
level (dBm)
C/I (dB) mar
gin
(MFN
) (d
B)
BER
Before
LDPC
MER
PLP (dB) mar
gin
(d
B)
x =
MER
-
ref
MER
(d
B)
del
ta (
dB
)
(x-m
argi
n)
BER
Before
LDPC
MER
PLP (dB) mar
gin
(d
B)
x =
MER
-
ref
MER
(d
B)
del
ta (
dB
)
(x-m
argi
n)
BER
Before
LDPC
MER
PLP (dB) mar
gin
(d
B)
x =
MER
-
ref
MER
(d
B)
del
ta (
dB
)
(x-m
argi
n)
BER
Before
LDPC
MER
PLP (dB) mar
gin
(d
B)
x =
MER
-
ref
MER
(d
B)
del
ta (
dB
)
(x-m
argi
n)
BER
Before
LDPC
MER
PLP (dB) mar
gin
(d
B)
x =
MER
-
ref
MER
(d
B)
del
ta (
dB
)
(x-m
argi
n)
BER
Before
LDPC
MER
PLP (dB) mar
gin
(d
B)
x =
MER
-
ref
MER
(d
B)
del
ta (
dB
)
(x-m
argi
n)
BER
Before
LDPC
MER
PLP (dB) mar
gin
(d
B)
x =
MER
-
ref
MER
(d
B)
del
ta (
dB
)
(x-m
argi
n)
BER
Before
LDPC
MER
PLP (dB) mar
gin
(d
B)
x =
MER
-
ref
MER
(d
B)
del
ta (
dB
)
(x-m
argi
n)
C/I (dB)
I=0 5.3E-05 41.2 5.4E-05 34.9 7.0E-05 32.1 2.0E-04 30.3 2.9E-03 27.4 5.7E-03 26.4 1.0E-02 25.5 2.5E-02 23 I=0
40 20 5.6E-05 35.6 18.5 17.3 -1.2 5.8E-05 32.7 18 14.4 -3.6 1.3E-04 30.8 18 12.5 -5.5 5.0E-04 29.4 18 11.1 -6.9 4.0E-03 27 17.5 8.7 -8.8 7.2E-03 26.1 17.5 7.8 -9.7 1.2E-02 25.1 17 6.8 -10.2 2.7E-02 23.2 16.5 4.9 -11.6 40
39 19 5.6E-05 34.8 17.5 16.5 -1 4.4E-03 26.9 16.5 8.6 -7.9 7.6E-03 26 16.5 7.7 -8.8 39
38 18 5.6E-05 34 16.5 15.7 -0.8 7.6E-04 29.1 16 10.8 -5.2 4.7E-03 26.8 15.5 8.5 -7 8.2E-03 25.9 15.5 7.6 -7.9 38
37 17 5.6E-05 33.2 15.5 14.9 -0.6 9.9E-04 28.8 15 10.5 -4.5 5.2E-03 26.6 14.5 8.3 -6.2 8.9E-03 25.7 14.5 7.4 -7.1 37
36 16 5.8E-05 32.3 14.5 14 -0.5 6.0E-03 26.4 13.5 8.1 -5.4 9.5E-03 25.6 13.5 7.3 -6.2 36
35 15 6.1E-05 31.5 13.5 13.2 -0.3 1.8E-04 30.1 13 11.8 -1.2 7.0E-04 29 13 10.7 -2.3 1.7E-03 28.1 13 9.8 -3.2 6.9E-03 26.2 12.5 7.9 -4.6 1.1E-02 25.4 12.5 7.1 -5.4 1.5E-02 24.6 12 6.3 -5.7 3.0E-02 22.7 11.5 4.4 -7.1 35
34.5 14.5 6.6E-05 31 13 12.7 -0.3 34.5
34 14 7.9E-05 30.6 12.5 12.3 -0.2 8.1E-03 25.9 11.5 7.6 -3.9 34
33.5 13.5 1.1E-04 30.1 12 11.8 -0.2 33.5
33 13 1.7E-04 29.6 11.5 11.3 -0.2 3.4E-03 27.2 11 8.9 -2.1 9.7E-03 25.5 10.5 7.2 -3.3 1.8E-02 24.2 10 5.9 -4.1 33
32.5 12.5 2.9E-04 29.5 11 11.2 0.2 1.1E-02 25.3 10 7 -3 1.9E-02 24 9.5 5.7 -3.8 32.5
32 12 5.2E-04 28.8 10.5 10.5 0 5.0E-03 26.6 10 8.3 -1.7 1.2E-02 25.1 9.5 6.8 -2.7 2.1E-02 23.8 9 5.5 -3.5 32
31.5 11.5 8.8E-04 28.3 10 10 0 31.5
31 11 1.5E-03 27.8 9.5 9.5 0 7.2E-03 26 9 7.7 -1.3 1.4E-02 24.7 8.5 6.4 -2.1 3.7E-02 21.9 7.5 3.6 -3.9 31
30.5 10.5 2.4E-03 27.3 9 9 0 2.0E-02 23.9 8 5.6 -2.4 30.5
30 10 3.6E-03 26.8 8.5 8.5 0 5.6E-03 26.3 8 8 0 8.0E-03 25.8 8 7.5 -0.5 1.0E-02 25.3 8 7 -1 1.8E-02 24.2 7.5 5.9 -1.6 2.2E-02 23.6 7.5 5.3 -2.2 2.8E-02 22.9 7 4.6 -2.4 4.1E-02 21.4 6.5 3.1 -3.4 30
29.5 9.5 5.3E-03 26.3 8 8 0 9.9E-03 25.4 7.5 7.1 -0.4 1.3E-02 24.9 7.5 6.6 -0.9 2.0E-02 23.8 7 5.5 -1.5 2.4E-02 23.4 7 5.1 -1.9 2.9E-02 22.7 6.5 4.4 -2.1 29.5
29 9 7.4E-03 25.8 7.5 7.5 0 9.6E-03 25.4 7 7.1 0.1 1.2E-02 25 7 6.7 -0.3 1.5E-02 24.6 7 6.3 -0.7 2.2E-02 23.6 6.5 5.3 -1.2 2.7E-02 23.1 6.5 4.8 -1.7 4.4E-02 21 5.5 2.7 -2.8 29
28.5 8.5 1.0E-02 25.2 7 6.9 -0.1 1.2E-02 24.9 6.5 6.6 0.1 1.5E-02 24.5 6.5 6.2 -0.3 1.8E-02 24.2 6.5 5.9 -0.6 2.5E-02 23.2 6 4.9 -1.1 2.9E-02 22.7 6 4.4 -1.6 28.5
28 8 1.3E-02 24.7 6.5 6.4 -0.1 1.5E-02 24.4 6 6.1 0.1 1.8E-02 24.1 6 5.8 -0.2 2.1E-02 23.8 6 5.5 -0.5 2.8E-02 22.8 5.5 4.5 -1 3.2E-02 22.4 5.5 4.1 -1.4 3.7E-02 21.8 5 3.5 -1.5 28
27.5 7.5 1.7E-02 24.2 6 5.9 -0.1 1.9E-02 23.9 5.5 5.6 0.1 2.1E-02 23.6 5.5 5.3 -0.2 3.1E-02 22.4 5 4.1 -0.9 3.5E-02 22 5 3.7 -1.3 4.0E-02 21.4 4.5 3.1 -1.4 27.5
27 7 2.1E-02 23.7 5.5 5.4 -0.1 2.3E-02 23.4 5 5.1 0.1 2.5E-02 23.1 5 4.8 -0.2 2.8E-02 22.8 5 4.5 -0.5 3.5E-02 22 4.5 3.7 -0.8 3.8E-02 21.6 4.5 3.3 -1.2 4.3E-02 21 4 2.7 -1.3 27
26.5 6.5 2.5E-02 23.1 5 4.8 -0.2 2.9E-02 22.6 4.5 4.3 -0.2 3.9E-02 21.5 4 3.2 -0.8 4.2E-02 21.1 4 2.8 -1.2 26.5
26 6 3.0E-02 22.5 4.5 4.2 -0.3 3.2E-02 22.3 4 4 0 3.4E-02 22.1 4 3.8 -0.2 3.6E-02 21.8 4 3.5 -0.5 4.3E-02 21 3.5 2.7 -0.8 4.6E-02 20.6 3.5 2.3 -1.2 6.0E-02 19 2.5 0.7 -1.8 26
25.5 5.5 3.5E-02 21.9 4 3.6 -0.4 3.7E-02 21.7 3.5 3.4 -0.1 3.9E-02 21.4 3.5 3.1 -0.4 4.1E-02 21.2 3.5 2.9 -0.6 4.7E-02 20.4 3 2.1 -0.9 5.0E-02 20 3 1.7 -1.3 5.4E-02 19.6 2.5 1.3 -1.2 6.4E-02 18.7 2 0.4 -1.6 25.5
25 5 4.0E-02 21.2 3.5 2.9 -0.6 4.2E-02 21 3 2.7 -0.3 4.4E-02 20.8 3 2.5 -0.5 4.6E-02 20.5 3 2.2 -0.8 5.1E-02 19.8 2.5 1.5 -1 5.4E-02 19.5 2.5 1.2 -1.3 5.8E-02 19.1 2 0.8 -1.2 6.7E-02 18.4 1.5 0.1 -1.4 25
24.5 4.5 4.6E-02 20.5 3 2.2 -0.8 4.7E-02 20.3 2.5 2 -0.5 4.9E-02 20.1 2.5 1.8 -0.7 5.1E-02 19.9 2.5 1.6 -0.9 5.6E-02 19.3 2 1 -1 5.9E-02 19 2 0.7 -1.3 6.3E-02 18.7 1.5 0.4 -1.1 7.1E-02 18.1 1 -0.2 -1.2 24.5
24 4 5.1E-02 19.8 2.5 1.5 -1 5.3E-02 19.6 2 1.3 -0.7 5.4E-02 19.4 2 1.1 -0.9 5.6E-02 19.2 2 0.9 -1.1 6.1E-02 18.8 1.5 0.5 -1 6.4E-02 18.6 1.5 0.3 -1.2 6.7E-02 18.3 1 0 -1 7.5E-02 17.9 0.5 -0.4 -0.9 24
23.5 3.5 5.7E-02 19.1 2 0.8 -1.2 5.9E-02 19 1.5 0.7 -0.8 6.0E-02 18.9 1.5 0.6 -0.9 6.2E-02 18.7 1.5 0.4 -1.1 6.6E-02 18.4 1 0.1 -0.9 6.9E-02 18.2 1 -0.1 -1.1 7.2E-02 18 0.5 -0.3 -0.8 8.0E-02 17.6 0 -0.7 -0.7 23.5
23 3 6.3E-02 18.6 1.5 0.3 -1.2 6.5E-02 18.5 1 0.2 -0.8 6.6E-02 18.4 1 0.1 -0.9 6.7E-02 18.3 1 0 -1 7.2E-02 18 0.5 -0.3 -0.8 7.4E-02 17.9 0.5 -0.4 -0.9 7.7E-02 17.7 0 -0.6 -0.6 23
22.5 2.5 6.9E-02 18.1 1 -0.2 -1.2 7.1E-02 18.1 0.5 -0.2 -0.7 7.2E-02 18 0.5 -0.3 -0.8 7.3E-02 17.9 0.5 -0.4 -0.9 7.7E-02 17.7 0 -0.6 -0.6 8.0E-02 17.5 0 -0.8 -0.8 8.2E-02 17.4 -0.5 -0.9 -0.4 22.5
22 2 7.6E-02 17.7 0.5 -0.6 -1.1 7.7E-02 17.7 0 -0.6 -0.6 7.8E-02 17.6 0 -0.7 -0.7 8.0E-02 17.5 0 -0.8 -0.8 8.3E-02 17.3 -0.5 -1 -0.5 0.0E+00 0 22
21.5 1.5 8.2E-02 17.3 0 -1 -1 8.3E-02 17.3 -0.5 -1 -0.5 - - - - - 21.5
21 1 - - - - - 21
20.5 0.5 20.5
-70 -72-60 -69-63 -68-65-50

Rep. ITU-R BT.2467-1 41
TABLE A3.4
32k, PP2, 1/16, 256 QAM, 3/5
Ref
MER
LDPC iter.
and BER
Tables
Lc f (BER)
MFN 17.1 dB
Not relevant for MFN
SFN 17.1 dB
For level > –60 dBm
Lcmfn BER
1e-2 2e-2 4e-2 6e-2
-60 0.3 0.1 0.2 0.5
-61 0.35 0.2 0.2 0.5
-62 0.4 0.2 0.2 0.52
-63 0.6 0.3 0.35 0.55
-64 1.2 0.7 0.5 0.6
-65 1.9 1 0.7 0.7
-66 2.6 1.4 0.85 0.8
-67 3.5 1.9 1.1 0.9
-68 4.3 2.5 1.4 1.1
-69 5.3 3.4 1.75 1.25
-70 6 4.6 2.2 1.45
-71 6 6 3 1.8
-72 6 6 4.3 2.2
-73 6 6 6 3
-74 6 6 6 5.5
leve
l (d
Bm
)
0
1
2
3
4
5
6
-60 -61 -62 -63 -64 -65 -66 -67 -68 -69 -70 -71 -72 -73 -74
BER 1E-2
BER 2E-2
BER 4E-2
BER 6E-2
dB Additional margin Lc (function of the level) MFN
BER before
LDPC margin
<= 8E-2 >= 1
<= 6E-2 >= 3
<= 4E-2 >= 4
<= 1E-2 >= 8
<= 1E-3 >= 12
<= 1E-4 >= 15
LDPC
iterations margin
<= 20 >= 1
<= 15 >= 3
<= 10 >= 5
<= 6 >= 7
<= 5 >= 9
<= 4 >= 15
Lcsfn BER
1e-2 2e-2 4e-2 6e-2
-60 0.2 0.2 0.4 1.1
-61 0.25 0.25 0.42 1.12
-62 0.4 0.35 0.45 1.15
-63 0.6 0.5 0.5 1.2
-64 0.9 0.65 0.6 1.25
-65 1.2 0.8 0.8 1.3
-66 1.6 1.2 1 1.4
-67 2.2 1.65 1.2 1.55
-68 3 2.2 1.5 1.7
-69 4.5 3 1.8 1.85
-70 6 4.6 2.2 2
-71 6 6 2.9 2.2
-72 6 6 4.1 2.5
-73 6 6 6 3
-74 6 6 6 4
-75 6 6 6 6
leve
l (d
Bm
)
0
1
2
3
4
5
6
-60-61-62-63-64-65-66-67-68-69-70-71-72-73-74-75
BER1E-2
BER2E-2
BER4E-2
BER6E-2
dB Additional margin Lc (function of the level) SFN
-0.4
-0.2
0
0.2
0.4
0.6
0.8
1
4.0
E-0
55
.0E-
05
6.0
E-0
57
.0E-
05
8.0
E-0
59
.0E-
05
1.0
E-0
42
.0E-
04
3.0
E-0
44
.0E-
04
5.0
E-0
46
.0E-
04
7.0
E-0
48
.0E-
04
9.0
E-0
41
.0E-
03
2.0
E-0
33
.0E-
03
4.0
E-0
35
.0E-
03
6.0
E-0
37
.0E-
03
8.0
E-0
39
.0E-
03
1.0
E-0
22
.0E-
02
3.0
E-0
24
.0E-
02
5.0
E-0
26
.0E-
02
7.0
E-0
28
.0E-
02

42 Rep. ITU-R BT.2467-1
TABLE A3.5
Results* (AWGN interference limited) with different input levels (MFN)
(32k not extended, PP2, 1/16 256 QAM, 3/5)
(*) values obtained using two receivers of the same type.
MFN ref. MER (dB) 17.1
level (dBm)
C/N
(dB) mar
gin
(d
B)
BER
Before
LDPC
MER PLP
(dB) mar
gin
(d
B)
x =
MER
-
ref
MER
(dB
) del
ta
(x-m
argi
n)
(dB
) BER
Before
LDPC
MER PLP
(dB) mar
gin
(d
B)
x =
MER
-
ref
MER
(dB
) del
ta
(x-m
argi
n)
(dB
) BER
Before
LDPC
MER PLP
(dB) mar
gin
(d
B)
x =
MER
-
ref
MER
(dB
) del
ta
(x-m
argi
n)
(dB
) BER
Before
LDPC
MER PLP
(dB) mar
gin
(d
B)
x =
MER
-
ref
MER
(dB
) del
ta
(x-m
argi
n)
(dB
) BER
Before
LDPC
MER PLP
(dB) mar
gin
(d
B)
x =
MER
-
ref
MER
(dB
) del
ta
(x-m
argi
n)
(dB
) BER
Before
LDPC
MER PLP
(dB) mar
gin
(d
B)
x =
MER
-
ref
MER
del
ta
(x-m
argi
n)
(dB
) BER
Before
LDPC
MER PLP
(dB) mar
gin
(d
B)
x =
MER
-
ref
MER
del
ta
(x-m
argi
n)
(dB
) BER
Before
LDPC
MER PLP
(dB) mar
gin
(d
B)
x =
MER
-
ref
MER
del
ta
(x-m
argi
n)
(dB
)
C/N (dB)
Noise off 5.1E-05 41.3 5.4E-05 34.8 6.7E-05 32.1 9.8E-04 28.7 2.9E-03 27.4 1.0E-02 25.4 2.5E-02 23.3 4.7E-02 21.0 Noise off
40 21.0 5.3E-05 36.5 21.0 19.4 -1.6 5.7E-05 33.2 20.7 16.1 -4.6 9.8E-05 31.2 20.5 14.1 -6.4 1.5E-03 28.2 20.5 11.1 -9.4 3.8E-03 27.1 20.5 10.0 -10.5 1.2E-02 25.2 20.0 8.1 -11.9 2.5E-02 23.2 19.5 6.1 -13.4 4.8E-02 20.8 18.5 3.7 -14.8 40
20.5 39.5
39 20.0 5.3E-05 35.8 20.0 18.7 -1.3 1.1E-04 30.9 19.5 13.8 -5.7 1.7E-03 28.1 19.5 11.0 -8.5 3.9E-03 27.0 19.5 9.9 -9.6 39
19.5 38.5
38 19.0 5.3E-05 35.0 19.0 17.9 -1.1 1.8E-03 28.0 18.5 10.9 -7.6 4.2E-03 26.9 18.5 9.8 -8.7 38
18.5 37.5
37 18.0 5.5E-05 34.2 18.0 17.1 -0.9 1.8E-04 30.4 17.5 13.3 -4.2 2.3E-03 27.8 17.5 10.7 -6.8 37
17.5 36.5
36 17.0 5.6E-05 33.4 17.0 16.3 -0.7 2.5E-03 27.6 16.5 10.5 -6.0 36
16.5 35.5
35 16.0 5.9E-05 32.6 16.0 15.5 -0.5 1.1E-04 31.0 15.7 13.9 -1.8 3.7E-04 29.6 15.5 12.5 -3.0 3.0E-03 27.3 15.5 10.2 -5.3 5.8E-03 26.4 15.5 9.3 -6.2 1.5E-02 24.6 15.0 7.5 -7.5 35
15.5 34.5
34 15.0 7.2E-05 31.7 15.0 14.6 -0.4 3.7E-03 27.1 14.5 10.0 -4.5 6.6E-03 26.2 14.5 9.1 -5.4 34
14.5 33.5
33 14.0 1.2E-04 30.8 14.0 13.7 -0.3 9.5E-04 28.7 13.5 11.6 -1.9 4.6E-03 26.8 13.5 9.7 -3.8 7.8E-03 25.9 13.5 8.8 -4.7 33
13.5 32.5
32 13.0 2.7E-04 29.9 13.0 12.8 -0.2 1.6E-03 28.2 12.5 11.1 -1.4 5.8E-03 26.4 12.5 9.3 -3.2 9.3E-03 25.6 12.5 8.5 -4.0 1.9E-02 24.0 12.0 6.9 -5.1 32
12.5 2.0E-02 23.9 12 6.8 -4.7 31.5
31 12.0 6.9E-04 29.0 12.0 11.9 -0.1 2.7E-03 27.5 11.5 10.4 -1.1 7.7E-03 26.0 11.5 8.9 -2.6 1.1E-02 25.2 11.5 8.1 -3.4 2.1E-02 23.8 11.0 6.7 -4.3 31
11.5 2.3E-02 23.6 10.5 6.5 -4 3.6E-02 22.1 10.0 5 -5 30.5
30 11.0 1.6E-03 28.1 11.0 11.0 0.0 2.8E-03 27.5 10.7 10.4 -0.3 4.4E-03 26.8 10.5 9.7 -0.8 1.0E-02 25.5 10.5 8.4 -2.1 1.4E-02 24.8 10.5 7.7 -2.8 2.4E-02 23.5 10.0 6.4 -3.6 3.7E-02 22.0 9.5 4.9 -4.6 5.7E-02 19.9 8.5 2.8 -5.7 30
29.5 10.5 2.4E-03 27.6 10.5 10.5 0.0 2.6E-02 23.3 9.5 6.2 -3.3 3.9E-02 21.8 9 4.7 -4.3 29.5
29 10.0 3.5E-03 27.2 10.0 10.1 0.1 5.1E-03 26.6 9.7 9.5 -0.2 7.1E-03 26.1 9.5 9.0 -0.5 1.3E-02 24.9 9.5 7.8 -1.7 1.7E-02 24.3 9.5 7.2 -2.3 2.8E-02 23.1 9.0 6.0 -3.0 4.1E-02 21.6 8.5 4.5 -4.0 29
28.5 9.5 4.9E-03 26.7 9.5 9.6 0.1 2.9E-02 22.8 8.5 5.7 -2.8 28.5
28 9.0 6.7E-03 26.2 9.0 9.1 0.1 8.7E-03 25.7 8.7 8.6 -0.1 1.1E-02 25.3 8.5 8.2 -0.3 1.8E-02 24.3 8.5 7.2 -1.3 2.2E-02 23.8 8.5 6.7 -1.8 3.1E-02 22.6 8.0 5.5 -2.5 4.4E-02 21.2 7.5 4.1 -3.4 28
27.5 8.5 8.9E-03 25.7 8.5 8.6 0.1 2.0E-02 23.9 8.0 6.8 -1.2 3.4E-02 22.3 7.5 5.2 -2.3 27.5
27 8.0 1.2E-02 25.2 8.0 8.1 0.1 1.4E-02 24.8 7.7 7.7 0.0 1.6E-02 24.5 7.5 7.4 -0.1 2.3E-02 23.6 7.5 6.5 -1.0 2.7E-02 23.1 7.5 6.0 -1.5 3.7E-02 22.0 7.0 4.9 -2.1 4.9E-02 20.8 6.5 3.7 -2.8 27
26.5 7.5 1.5E-02 24.7 7.5 7.6 0.1 1.7E-02 24.4 7.2 7.3 0.1 2.6E-02 23.2 7.0 6.1 -0.9 4.0E-02 21.7 6.5 4.6 -1.9 26.5
26 7.0 1.8E-02 24.2 7.0 7.1 0.1 2.1E-02 23.9 6.7 6.8 0.1 2.3E-02 23.6 6.5 6.5 0.0 3.0E-02 22.8 6.5 5.7 -0.8 3.4E-02 22.4 6.5 5.3 -1.2 4.3E-02 21.4 6.0 4.3 -1.7 5.4E-02 20.2 5.5 3.1 -2.4 26
25.5 6.5 2.2E-02 23.7 6.5 6.6 0.1 2.5E-02 23.4 6.2 6.3 0.1 3.4E-02 22.4 6.0 5.3 -0.7 4.6E-02 21.1 5.5 4.0 -1.5 25.5
25 6.0 2.7E-02 23.1 6.0 6.0 0.0 2.9E-02 22.9 5.7 5.8 0.1 3.2E-02 22.6 5.5 5.5 0.0 3.8E-02 21.9 5.5 4.8 -0.7 4.1E-02 21.6 5.5 4.5 -1.0 5.0E-02 20.7 5.0 3.6 -1.4 6.0E-02 19.6 4.5 2.5 -2.0 7.5E-02 18.5 3.5 1.4 -2.1 25
24.5 5.5 3.2E-02 22.6 5.5 5.5 0.0 3.4E-02 22.3 5.2 5.2 0.0 4.2E-02 21.4 5.0 4.3 -0.7 5.4E-02 20.3 4.5 3.2 -1.3 24.5
24 5.0 3.7E-02 22.0 5.0 4.9 -0.1 3.9E-02 21.8 4.7 4.7 0.0 4.1E-02 21.5 4.5 4.4 -0.1 4.7E-02 20.9 4.5 3.8 -0.7 5.0E-02 20.6 4.5 3.5 -1.0 5.8E-02 19.9 4.0 2.8 -1.2 6.7E-02 19.0 3.5 1.9 -1.6 24
23.5 4.5 4.3E-02 21.4 4.5 4.3 -0.2 4.5E-02 21.2 4.2 4.1 -0.1 4.7E-02 21.0 4.0 3.9 -0.1 5.2E-02 20.4 4.0 3.3 -0.7 6.2E-02 19.4 3.5 2.3 -1.2 23.5
23 4.0 4.9E-02 20.7 4.0 3.6 -0.4 5.0E-02 20.6 3.7 3.5 -0.2 5.2E-02 20.4 3.5 3.3 -0.2 5.7E-02 19.9 3.5 2.8 -0.7 6.0E-02 19.6 3.5 2.5 -1.0 6.7E-02 19.1 3.0 2.0 -1.0 7.5E-02 18.5 2.5 1.4 -1.1 23
22.5 3.5 5.5E-02 20.1 3.5 3.0 -0.5 5.7E-02 19.9 3.2 2.8 -0.4 6.3E-02 19.4 3.0 2.3 -0.7 7.2E-02 18.7 2.5 1.6 -0.9 9.1E-02 17.7 1.0 0.6 -0.4 22.5
22 3.0 6.1E-02 19.5 3.0 2.4 -0.6 6.3E-02 19.4 2.7 2.3 -0.4 6.4E-02 19.2 2.5 2.1 -0.4 6.9E-02 18.9 2.5 1.8 -0.7 7.1E-02 18.8 2.5 1.7 -0.8 7.7E-02 18.4 2.0 1.3 -0.7 8.4E-02 18.0 1.5 0.9 -0.6 9.5E-02 17.5 0.5 0.4 -0.1 22
21.5 2.5 6.8E-02 19.0 2.5 1.9 -0.6 6.9E-02 18.9 2.2 1.8 -0.4 7.4E-02 18.5 2.0 1.4 -0.6 8.2E-02 18.1 1.5 1.0 -0.5 8.9E-02 17.8 1.0 0.7 -0.3 9.9E-02 17.3 0.0 0.2 0.2 21.5
21 2.0 7.5E-02 18.5 2.0 1.4 -0.6 7.6E-02 18.5 1.7 1.4 -0.3 7.7E-02 18.4 1.5 1.3 -0.2 8.1E-02 18.2 1.5 1.1 -0.4 8.3E-02 18.1 1.5 1.0 -0.5 8.8E-02 17.8 1.0 0.7 -0.3 9.4E-02 17.6 0.5 0.5 0.0 1.0E-01 17.1 0.0 0.0 0.0 21
20.5 1.5 8.1E-02 18.2 1.5 1.1 -0.4 8.3E-02 18.1 1.2 1.0 -0.2 8.7E-02 17.9 1.0 0.8 -0.2 9.4E-02 17.6 0.5 0.5 0.0 1.0E-01 17.3 0.0 0.2 0.2 20.5
20 1.0 8.9E-02 17.8 1.0 0.7 -0.3 9.0E-02 17.8 0.7 0.7 0.0 9.1E-02 17.7 0.5 0.6 0.1 9.4E-02 17.6 0.5 0.5 0.0 9.5E-02 17.5 0.5 0.4 -0.1 1.0E-01 17.3 0.0 0.2 0.2 20
19.5 0.5 9.6E-02 17.5 0.5 0.4 -0.1 9.7E-02 17.4 0.2 0.3 0.1 9.8E-02 17.4 0.0 0.3 0.3 1.1E-01 17.2 0.0 0.1 0.1 1.0E-01 17.2 0.0 0.1 0.1 1.1E-01 16.9 19.5
19 0.0 1.0E-01 17.1 0.0 0.0 0.0 1.0E-01 17.0 -0.3 -0.1 0.2 1.1E-01 17.0 -0.5 -0.1 0.4 1.1E-01 16.9 1.1E-01 16.9 1.1E-01 16.7 19
18.5 -0.5 1.1E-01 16.7 -0.5 -0.4 0.1 1.1E-01 16.7 1.1E-01 16.7 18.5
-74 -50 dBm -60 -65 -70 -72-63 -68

Rep. ITU-R BT.2467-1 43
TABLE A3.6
Results with different input levels (SFN)*
(32k not extended, PP2, 1/16 256 QAM, 3/5)
(*) 1 Useful signal + 1 SFN auto-interference @600 μs.
SFN ref. MER (dB) 17.1
level (dBm)
C/I
(dB) mar
gin
(MFN
)(d
B)
BER
Before
LDPC
MER
PLP
(dB) mar
gin
(d
B)
x =
MER
- r
ef
MER
(d
B)
del
ta
(x-m
argi
n)
(dB
) BER
Before
LDPC
MER
PLP
(dB) mar
gin
(d
B)
x =
MER
- r
ef
MER
(d
B)
del
ta
(x-m
argi
n)
(dB
) BER
Before
LDPC
MER
PLP
(dB) mar
gin
(d
B)
x =
MER
- r
ef
MER
(d
B)
del
ta
(x-m
argi
n)
(dB
) BER
Before
LDPC
MER
PLP
(dB) mar
gin
(d
B)
x =
MER
- r
ef
MER
(d
B)
del
ta
(x-m
argi
n)
(dB
) BER
Before
LDPC
MER
PLP
(dB) mar
gin
(d
B)
x =
MER
- r
ef
MER
(d
B)
del
ta
(x-m
argi
n)
(dB
) BER
Before
LDPC
MER
PLP
(dB) mar
gin
(d
B)
x =
MER
- r
ef
MER
(d
B)
del
ta
(x-m
argi
n)
(dB
) BER
Before
LDPC
MER
PLP
(dB) mar
gin
(d
B)
x =
MER
- r
ef
MER
(d
B)
del
ta
(x-m
argi
n)
(dB
) BER
Before
LDPC
MER
PLP
(dB) mar
gin
(d
B)
x =
MER
- r
ef
MER
(d
B)
del
ta
(x-m
argi
n)
(dB
)
C/I
(dB)
Int.off 5.0E-05 41.2 5.4E-05 34.8 6.7E-05 32.1 2.0E-04 30.3 2.8E-03 27.4 1.0E-02 25.4 2.4E-02 23.4 2.4E-02 19.9 Int.off
40 21.0 5.2E-05 35.6 19.7 18.5 -1.2 5.8E-05 32.7 19.7 15.6 -4.1 1.3E-04 30.9 19.7 13.8 -5.9 4.9E-04 29.4 19.5 12.3 -7.2 4.0E-03 27.0 19.5 9.9 -9.6 1.2E-02 25.2 19.0 8.1 -10.9 2.6E-02 23.3 18.5 6.2 -12.3 6.0E-02 19.6 16.5 2.5 -14.0 40
39 20.0 6.0E-05 32.3 18.7 15.2 -3.5 1.5E-04 30.6 18.7 13.5 -5.2 5.8E-04 29.3 18.5 12.2 -6.3 4.4E-03 26.9 18.5 9.8 -8.7 39
38 19.0 6.4E-05 31.8 17.7 14.7 -3.0 4.7E-03 26.8 17.5 9.7 -7.8 38
37 18.0 7.9E-05 31.3 16.7 14.2 -2.5 5.3E-03 26.6 16.5 9.5 -7.0 37
36 17.0 1.1E-04 30.8 15.7 13.7 -2.0 6.1E-03 26.4 15.5 9.3 -6.2 36
35 16.0 5.7E-05 31.5 14.7 14.4 -0.3 1.8E-04 30.1 14.7 13.0 -1.7 6.6E-04 29.1 14.7 12.0 -2.7 1.8E-03 28.1 14.5 11.0 -3.5 6.9E-03 26.2 14.5 9.1 -5.4 1.6E-02 24.6 14.0 7.5 -6.5 2.9E-02 22.8 13.5 5.7 -7.8 6.2E-02 19.4 11.5 2.3 -9.2 35
34 15.0 8.1E-04 29.5 13.7 12.4 -1.3 1.1E-03 28.6 13.7 11.5 -2.2 2.4E-03 27.7 13.5 10.6 -2.9 8.2E-03 25.9 13.5 8.8 -4.7 34
1.8E-02 24.3 13 7.2 -5.3
33 14.0 7.2E-04 28.8 12.7 11.7 -1.0 1.8E-03 28.0 12.7 10.9 -1.8 9.7E-03 25.5 12.5 8.4 -4.1 1.9E-02 24.1 12.0 7.0 -5.0 3.2E-02 22.5 11.5 5.4 -6.1 33
1.1E-03 28.4 12.2 11.3 -0.9 1.9E-02 24.0 11.5 6.9 -4.6 3.3E-02 22.4 11.0 5.3 -5.7
32 13.0 1.5E-03 28.0 11.7 10.9 -0.8 3.0E-03 27.3 11.7 10.2 -1.5 2.1E-02 23.8 11.0 6.7 -4.3 3.4E-02 22.2 10.5 5.1 -5.4 32
2.1E-03 27.6 11.2 10.5 -0.7 2.2E-02 23.7 11 6.6 -3.9 3.6E-02 22.1 10.0 5.0 -5.0
31 12.0 3.0E-03 27.2 10.7 10.1 -0.6 4.9E-03 26.6 10.7 9.5 -1.2 1.5E-02 24.7 10.5 7.6 -2.9 2.4E-02 23.4 10.0 6.3 -3.7 3.7E-02 21.9 9.5 4.8 -4.7 31
4.2E-03 26.7 10.2 9.6 -0.6 1.6E-02 24.5 10.0 7.4 -2.6 2.6E-02 23.2 9.5 6.1 -3.4 3.8E-02 21.8 9.0 4.7 -4.3
30 11.0 3.6E-03 26.8 9.7 9.7 0.0 5.6E-03 26.3 9.7 9.2 -0.5 7.8E-03 25.8 9.7 8.7 -1 1.0E-02 25.3 9.5 8.2 -1.3 1.8E-02 24.2 9.5 7.1 -2.4 2.7E-02 23.0 9.0 5.9 -3.1 4.0E-02 21.5 8.5 4.4 -4.1 7.0E-02 18.6 6.5 1.5 -5.0 30
29.5 10.0 5.3E-03 26.3 9.2 9.2 0.0 7.4E-03 25.8 9.2 8.7 -0.5 2.0E-02 23.9 9.0 6.8 -2.2 3.0E-02 22.7 8.5 5.6 -2.9 4.2E-02 21.3 8 4.2 -3.8 7.2E-02 18.5 6.0 1.4 -4.6 29.5
29 9.5 7.4E-03 25.8 8.7 8.7 0.0 9.6E-03 25.4 8.7 8.3 -0.4 1.2E-02 25.0 8.7 7.9 -0.8 2.3E-02 23.6 8.5 6.5 -2 3.2E-02 22.4 8.0 5.3 -2.7 4.4E-02 21.1 7.5 4.0 -3.5 7.3E-02 18.4 5.5 1.3 -4.2 29
28.5 9.0 1.0E-02 25.3 8.2 8.2 0.0 1.2E-02 24.9 8.2 7.8 -0.4 3.4E-02 22.1 7.5 5 -2.5 4.6E-02 20.8 7.0 3.7 -3.3 7.4E-02 18.3 5.0 1.2 -3.8 28.5
28 8.5 1.3E-02 24.7 7.7 7.6 -0.1 1.5E-02 24.4 7.7 7.3 -0.4 1.8E-02 24.1 7.7 7 -0.7 2.1E-02 23.8 7.5 6.7 -0.8 2.8E-02 22.8 7.5 5.7 -1.8 3.7E-02 21.8 7.0 4.7 -2.3 4.8E-02 20.4 6.5 3.3 -3.2 7.6E-02 18.2 4.5 1.1 -3.4 28
27.5 8.0 1.7E-02 24.2 7.2 7.1 -0.1 1.9E-02 23.9 7.2 6.8 -0.4 3.1E-02 22.4 7.0 5.3 -1.7 4.0E-02 21.4 6.5 4.3 -2.2 5.1E-02 20.1 6.0 3.0 -3.0 7.8E-02 18.0 4.0 0.9 -3.1 27.5
27 7.5 2.1E-02 23.7 6.7 6.6 -0.1 2.3E-02 23.4 6.7 6.3 -0.4 2.5E-02 23.1 6.7 6 -0.7 2.8E-02 22.8 6.5 5.7 -0.8 3.5E-02 22.0 6.5 4.9 -1.6 4.3E-02 21.0 6.0 3.9 -2.1 5.3E-02 19.8 5.5 2.7 -2.8 8.0E-02 17.9 3.5 0.8 -2.7 27
26.5 7.0 2.5E-02 23.1 6.2 6.0 -0.2 2.7E-02 22.9 6.2 5.8 -0.4 3.8E-02 21.5 6.0 4.4 -1.6 4.7E-02 20.5 5.5 3.4 -2.1 5.6E-02 19.4 5.0 2.3 -2.7 8.2E-02 17.8 3.0 0.7 -2.3 26.5
26 6.5 3.0E-02 22.6 5.7 5.5 -0.2 3.2E-02 22.3 5.7 5.2 -0.5 3.4E-02 22.1 5.7 5 -0.7 3.6E-02 21.8 5.5 4.7 -0.8 4.3E-02 21.0 5.5 3.9 -1.6 5.0E-02 20.1 5.0 3.0 -2.0 5.9E-02 19.1 4.5 2.0 -2.5 8.4E-02 17.6 2.5 0.5 -2.0 26
25.5 6.0 3.5E-02 21.9 5.2 4.8 -0.4 3.7E-02 21.7 5.2 4.6 -0.6 5.4E-02 19.5 4.5 2.4 -2.1 6.3E-02 18.7 4.0 1.6 -2.4 8.6E-02 17.5 2.0 0.4 -1.6 25.5
25 5.5 4.0E-02 21.2 4.7 4.1 -0.6 4.2E-02 21.0 4.7 3.9 -0.8 4.4E-02 20.8 4.7 3.7 -1 4.6E-02 20.5 4.5 3.4 -1.1 5.1E-02 20.3 4.5 3.2 -1.3 5.8E-02 19.1 4.0 2.0 -2.0 6.7E-02 18.5 3.5 1.4 -2.1 8.9E-02 17.3 1.5 0.2 -1.3 25
24.5 5.0 4.6E-02 20.5 4.2 3.4 -0.8 4.7E-02 20.3 4.2 3.2 -1.0 6.3E-02 18.7 3.5 1.6 -1.9 7.1E-02 18.2 3.0 1.1 -1.9 9.2E-02 17.1 1.0 0.0 -1.0 24.5
24 4.5 5.1E-02 19.8 3.7 2.7 -1.0 5.3E-02 19.6 3.7 2.5 -1.2 5.4E-02 19.4 3.7 2.3 -1.4 5.6E-02 19.3 3.5 2.2 -1.3 6.1E-02 18.8 3.5 1.7 -1.8 6.7E-02 18.3 3.0 1.2 -1.8 7.5E-02 17.9 2.5 0.8 -1.7 9.5E-02 16.9 0.5 -0.2 -0.7 24
23.5 4.0 5.7E-02 19.1 3.2 2.0 -1.2 5.9E-02 19.0 3.2 1.9 -1.3 7.2E-02 18.0 2.5 0.9 -1.6 7.9E-02 17.6 2.0 0.5 -1.5 9.8E-02 16.7 0.0 -0.4 -0.4 23.5
23 3.5 6.3E-02 18.6 2.7 1.5 -1.2 6.5E-02 18.5 2.7 1.4 -1.3 6.6E-02 18.4 2.7 1.3 -1.4 6.8E-02 18.3 2.5 1.2 -1.3 7.2E-02 18.0 2.5 0.9 -1.6 7.7E-02 17.7 2.0 0.6 -1.4 8.4E-02 17.4 1.5 0.3 -1.2 1.0E-01 16.4 -0.5 -0.7 -0.2 23
22.5 3.0 6.9E-02 18.1 2.2 1.0 -1.2 7.1E-02 18.1 2.2 1.0 -1.2 7.7E-02 17.7 2.0 0.6 -1.4 8.2E-02 17.4 1.5 0.3 -1.2 8.9E-02 17.1 1.0 0.0 -1.0 1.1E-01 16.1 -1.0 -1.0 0.0 22.5
22 2.5 7.6E-02 17.7 1.7 0.6 -1.1 7.7E-02 17.7 1.7 0.6 -1.1 7.8E-02 17.6 1.7 0.5 -1.2 7.9E-02 17.5 1.5 0.4 -1.1 8.3E-02 17.3 1.5 0.2 -1.3 8.8E-02 17.0 1.0 -0.1 -1.1 9.4E-02 16.7 0.5 -0.4 -0.9 22
21.5 2.0 8.2E-02 17.3 1.2 0.2 -1.0 8.3E-02 17.2 1.2 0.1 -1.1 8.6E-02 17.1 1.0 0 -1 8.9E-02 16.9 1.0 -0.2 -1.2 9.4E-02 16.6 0.5 -0.5 -1.0 9.9E-02 16.3 0.0 -0.8 -0.8 21.5
21 1.5 8.9E-02 16.9 0.7 -0.2 -0.9 9.0E-02 16.8 0.7 -0.3 -1.0 9.1E-02 16.7 0.7 -0.4 -1.1 9.2E-02 16.7 0.5 -0.4 -0.9 9.6E-02 16.5 0.5 -0.6 -1.1 1.0E-01 16.2 0.0 -0.9 -0.9 1.0E-01 15.9 -0.5 -1.2 -0.7 21
20.5 1.0 9.6E-02 16.4 0.2 -0.7 -0.9 9.7E-02 16.3 0.2 -0.8 -1.0 9.8E-02 16.3 0.2 -0.8 -1 9.9E-02 16.2 0.0 -0.9 -0.9 1.0E-01 16.0 0.0 -1.1 -1.1 1.1E-01 15.8 -0.5 -1.3 -0.8 20.5
20 0.5 1.0E-01 15.8 -0.3 -1.3 -1.0 1.0E-01 15.8 -0.3 -1.3 -1.0 1.0E-01 15.7 -0.3 -1.4 -1.1 1.1E-01 15.7 -0.5 -1.4 -0.9 1.1E-01 15.5 -0.5 -1.6 -1.1 20
19.5 0.0 19.5
18.5
-65-63-50 -60 -68 -70 -72 -75

44 Rep. ITU-R BT.2467-1
TABLE A3.7
16k extended, PP2, 19/128, 64 QAM, 1/2
Ref
MER
LDPC iter.
and BER
Tables
Lc f (BER)
MFN 11.0 dB
f (BER) for level > –60 dBm
SFN 11.0 dB
f (BER) for level > –60 dBm
Lcmfn
BER
1e-2 2e-2 4e-2 6e-2 8e-2 1.1e-1
-40 -0.2 -0.1 0.1 0.4 1.2 3.1
-50 -0.2 -0.1 0.1 0.4 1.2 3.1
-60 -0.2 -0.1 0.1 0.4 1.2 3.1
0 0.1 0.15 0.45 1.25 3.15
-65 0.2 0.2 0.2 0.55 1.4 3.2
0.6 0.4 0.4 0.65 1.5 3.3
-70 1.3 0.8 0.6 0.8 1.6 3.5
1.9 1.2 0.8 1 1.75 3.7
-72 2.5 1.6 1.1 1.3 1.9 3.8
3.5 2.5 1.4 1.7 2.1 3.9
4.6 3.4 1.9 2.1 2.3 3.95
-75 5.5 4.3 2.5 2.55 2.6 4
6 4.9 3.1 3 2.9 4
6 5.3 3.8 3.6 3.2 4
6 5.6 4.5 4.3 3.6 4
6 5.8 5.2 5 4.3 4
-80 6 6 6 5.8 4.9 4
6 6 6 6 5.6 4
-83 6 6 6 6 6 4
leve
l (d
Bm
)
-1
0
1
2
3
4
5
6
-40-50-60 -65 -70 -72 -75 -80 -83
1.0E-2
2.0E-2
4.0E-2
6.0E-2
8.0E-2
1.1E-1
Additional margin (function of the level and BER)
MFN
dB
level dBm
0
0.5
1
1.5
2
2.5
3
3.5
4
4.5
5
4.0
E-0
55
.0E-
05
6.0
E-0
57
.0E-
05
8.0
E-0
59
.0E-
05
1.0
E-0
42
.0E-
04
3.0
E-0
44
.0E-
04
5.0
E-0
46
.0E-
04
7.0
E-0
48
.0E-
04
9.0
E-0
41
.0E-
03
2.0
E-0
33
.0E-
03
4.0
E-0
35
.0E-
03
6.0
E-0
37
.0E-
03
8.0
E-0
39
.0E-
03
1.0
E-0
22
.0E-
02
3.0
E-0
24
.0E-
02
5.0
E-0
26
.0E-
02
7.0
E-0
28
.0E-
02
9.0
E-0
21
.0E-
01
1.1
E-0
11
.2E-
01
BER before
LDPC margin
<= 1.3 E-1 >= 2
<= 1.1 E-1 >= 6
<= 1.0 E-1 >= 10
<= 6E-2 >= 13
<= 4E-2 >= 15
<= 1E-3 >= 18
LDPC
iterations margin
<= 40 >= 2
<= 25 >= 6
<= 17 >= 10
<= 15 >= 12
<= 12 >= 15
<= 7 >= 18
Lcsfn
BER
1e-2 2e-2 4e-2 6e-2 8e-2 1.1e-1
-40 0.4 0.6 0.8 2 4 5.9
-50 0.4 0.6 0.8 2 4 5.9
-60 0.45 0.65 0.85 2.05 4 5.9
0.6 0.7 0.95 2.1 4 5.9
-65 0.8 0.8 1.1 2.2 4.1 6
1.2 1.1 1.25 2.3 4.1 6
-70 1.6 1.4 1.4 2.4 4.1 6
2 1.7 1.5 2.5 4.1 6
-72 2.5 2.2 1.75 2.5 3.8 6
3.5 2.7 1.95 2.6 3.8 5.8
4.6 3.3 2.2 2.7 3.8 5.3
-75 6 4 2.7 2.9 3.8 5.1
6 5 3.5 3.3 4.2 5.1
-77 6 6 4.8 3.9 4.4 5.1
6 6 6 4.5 5 5.3
6 6 6 5.5 5.5 5.8
-80 6 6 6 6 6 6
6 6 6 6 6 6
-83 6 6 6 6 6 6
leve
l (d
Bm
)
-1
0
1
2
3
4
5
6
-40-50-60 -65 -70 -72 -75 -77 -80 -83
1.0E-2
2.0E-2
4.0E-2
6.0E-2
8.0E-2
1.1E-1
Additional margin (function of the level and BER) SFNdB
level dBm
-0.5
0
0.5
1
1.5
2
2.5
3
2.0
E-0
53
.0E-
05
4.0
E-0
55
.0E-
05
6.0
E-0
57
.0E-
05
8.0
E-0
59
.0E-
05
1.0
E-0
42
.0E-
04
3.0
E-0
44
.0E-
04
5.0
E-0
46
.0E-
04
7.0
E-0
48
.0E-
04
9.0
E-0
41
.0E-
03
2.0
E-0
33
.0E-
03
4.0
E-0
35
.0E-
03
6.0
E-0
37
.0E-
03
8.0
E-0
39
.0E-
03
1.0
E-0
22
.0E-
02
3.0
E-0
24
.0E-
02
5.0
E-0
26
.0E-
02
7.0
E-0
28
.0E-
02
9.0
E-0
21
.0E-
01
1.1
E-0
11
.2E-
01
1.3
E-0
1

Rep. ITU-R BT.2467-1 45
TABLE A3.8
Results (AWGN interference limited) with different input levels (MFN)
(16k extended, PP2, 19/128, 64 QAM, 1/2)
MFN ref. MER (dB) 11.0
level (dBm)
C/N
(dB) mar
gin
(d
B)
BER
Before
LDPC
MER PLP
(dB) mar
gin
(d
B)
x =
MER
- r
ef
MER
(d
B)
del
ta
(x-m
argi
n)
(dB
) BER
Before
LDPC
MER PLP
(dB) mar
gin
(d
B)
x =
MER
- r
ef
MER
(d
B)
del
ta
(x-m
argi
n)
(dB
) BER
Before
LDPC
MER PLP
(dB) mar
gin
(d
B)
x =
MER
- r
ef
MER
(d
B)
del
ta
(x-m
argi
n)
(dB
) BER
Before
LDPC
MER PLP
(dB) mar
gin
(d
B)
x =
MER
- r
ef
MER
(d
B)
del
ta
(x-m
argi
n)
(dB
) BER
Before
LDPC
MER PLP
(dB) mar
gin
(d
B)
x =
MER
- r
ef
MER
(d
B)
del
ta
(x-m
argi
n)
(dB
) BER
Before
LDPC
MER PLP
(dB) mar
gin
(d
B)
x =
MER
- r
ef
MER
(d
B)
del
ta
(x-m
argi
n)
(dB
) BER
Before
LDPC
MER PLP
(dB) mar
gin
(d
B)
x =
MER
- r
ef
MER
(d
B)
del
ta
(x-m
argi
n)
(dB
)
C/N
(dB)
N=0 2.6E-05 41 2.8E-05 41 2.8E-05 30.1 6.9E-05 25.3 5.8E-04 23.2 6.6E-03 20.3 5.7E-02 14.7 N=0
40 27.5 2.8E-05 36.4 28 25.4 -2.1 2.9E-05 36.4 27 25.4 -1.6 3.0E-05 29.5 27 18.5 -8.5 8.3E-05 25 27 14 -13 6.7E-04 23.1 27 12.1 -14.9 6.9E-03 20.2 27 9.2 -17.8 5.8E-02 14.6 25 3.6 -21.4 40
39 26.5 6.9E-04 23.1 26 12.1 -13.9 7.6E-03 20.1 26 9.1 -16.9 5.8E-02 14.6 24 3.6 -20.4 39
38 25.5 3.0E-05 29.2 25 18.2 -6.8 7.4E-04 25 7.7E-03 20 25 9 -16 38
37 24.5 3.0E-05 29 24 18 -6 7.6E-04 24 7.8E-03 20 24 9 -15 37
36 23.5 3.1E-05 28.7 23 17.7 -5.3 8.2E-04 23 8.0E-03 20 23 9 -14 36
35 22.5 2.9E-05 32.6 23 21.6 -0.9 3.1E-05 32.6 22 21.6 -0.4 1.4E-04 24.5 22 13.5 -8.5 9.0E-04 22.8 22 11.8 -10.2 8.1E-03 20 22 9 -13 35
34 21.5 3.1E-05 31.7 22 20.7 -0.8 3.2E-05 28.1 21 17.1 -3.9 9.7E-04 22.7 21 11.7 -9.3 5.8E-02 14.6 19 3.6 -15.4 34
33 20.5 3.2E-05 30.8 21 19.8 -0.7 1.1E-03 22.6 20 11.6 -8.4 8.9E-03 19.8 20 8.8 -11.2 5.9E-02 14.6 18 3.6 -14.4 33
32 19.5 3.3E-05 29.9 20 18.9 -0.6 1.3E-03 19 9.2E-03 19.7 19 8.7 -10.3 32
31 18.5 3.4E-05 29 19 18 -0.5 3.6E-05 26.7 18 15.7 -2.3 1.5E-03 18 31
30 17.5 3.4E-05 28 18 17 -0.5 3.5E-05 28 17 17 0 4.3E-05 26.1 17 15.1 -1.9 4.4E-04 23.5 17 12.5 -4.5 1.9E-03 22 17 11 -6 1.0E-02 19.6 17 8.6 -8.4 6.0E-02 14.4 15 3.4 -11.6 30
29.5 17 29.5
29 16.5 3.8E-05 27.1 17 16.1 -0.4 6.0E-05 25.4 16 14.4 -1.6 6.4E-04 23.1 16 12.1 -3.9 2.3E-03 21.7 16 10.7 -5.3 29
28.5 16 28.5
28 15.5 4.5E-05 26.1 16 15.1 -0.4 1.0E-04 24.8 15 13.8 -1.2 9.7E-04 22.7 15 11.7 -3.3 2.9E-03 15 1.3E-02 19.2 15 8.2 -6.8 6.1E-02 14.3 13 3.3 -9.7 28
27.5 15 27.5
27 14.5 2.2E-04 25.1 15 14.1 -0.4 2.2E-04 24 14 13 -1 1.5E-03 22.2 14 11.2 -2.8 3.9E-03 14 6.3E-02 14.1 12 3.1 -8.9 27
26.5 14 26.5
26 13.5 1.9E-04 24.1 14 13.1 -0.4 5.2E-04 23.3 13 12.3 -0.7 2.4E-03 21.7 13 10.7 -2.3 5.3E-03 13 6.5E-02 13.9 11 2.9 -8.1 26
25.5 13 4.4E-04 23.5 12.5 12.5 0 1.7E-02 18.5 12.5 7.5 -5 25.5
25 12.5 5.7E-04 23.2 13 12.2 -0.3 7.3E-04 23.2 12 12.2 0.2 1.2E-03 22.5 12 11.5 -0.5 3.9E-03 21.1 12 10.1 -1.9 7.2E-03 20.2 12 9.2 -2.8 1.8E-02 18.4 12 7.4 -4.6 6.8E-02 13.5 10 2.5 -7.5 25
24.5 12 9.4E-04 22.7 12 11.7 -0.3 1.2E-03 22.7 11.5 11.7 0.2 4.8E-03 20.8 11.5 9.8 -1.7 2.0E-02 18.2 11.5 7.2 -4.3 24.5
24 11.5 1.5E-03 22.2 12 11.2 -0.3 1.8E-03 22.2 11 11.2 0.2 2.6E-03 6.0E-03 20.4 11 9.4 -1.6 9.9E-03 19.6 11 8.6 -2.4 2.2E-02 18 11 7 -4 6.9E-02 13.3 9 2.3 -6.7 24
23.5 11 2.4E-03 21.7 11 10.7 -0.3 2.7E-03 21.7 10.5 10.7 0.2 7.0E-03 20.1 10.5 9.1 -1.4 23.5
23 10.5 3.5E-03 21.2 11 10.2 -0.3 3.9E-03 21.2 10 10.2 0.2 5.1E-03 20.7 10 9.7 -0.3 7.5E-03 19.7 10 8.7 -1.3 1.4E-02 10 7.2E-02 13 8 2 -6 23
22.5 10 5.1E-03 20.7 10 9.7 -0.3 5.6E-03 20.7 9.5 9.7 0.2 1.1E-02 19.3 9.5 8.3 -1.2 22.5
22 9.5 7.1E-03 20.2 9.5 9.2 -0.3 7.7E-03 20.2 9 9.2 0.2 9.1E-03 19.8 9 8.8 -0.2 1.4E-02 19 9 8 -1 1.9E-02 18.4 9 7.4 -1.6 7.5E-02 12.6 7 1.6 -5.4 22
21.5 9 1.4E-02 19.7 9 8.7 -0.3 1.0E-02 19.7 8.5 8.7 0.2 1.7E-02 18.6 8.5 7.6 -0.9 3.4E-03 16.8 8.5 5.8 -2.7 21.5
21 8.5 1.3E-02 19.1 8.5 8.1 -0.4 1.3E-02 19.1 8 8.1 0.1 1.5E-02 18.8 8 7.8 -0.2 2.0E-02 18.2 8 7.2 -0.8 2.5E-02 8 3.7E-02 16.5 8 5.5 -2.5 8.0E-02 12.1 6 1.1 -4.9 21
20.5 8 1.7E-02 18.6 8 7.6 -0.4 1.7E-02 18.6 7.5 7.6 0.1 2.4E-02 17.7 7.5 6.7 -0.8 4.1E-03 16.2 7.5 5.2 -2.3 20.5
20 7.5 2.1E-02 18.1 7.5 7.1 -0.4 2.2E-02 18.1 7 7.1 0.1 2.3E-02 2.9E-02 17.3 7 6.3 -0.7 3.3E-02 7 4.5E-02 15.8 7 4.8 -2.2 8.6E-02 11.4 5 0.4 -4.6 20
19.5 7 2.6E-02 17.6 7 6.6 -0.4 2.6E-02 17.6 6.5 6.6 0.1 3.4E-02 16.8 6.5 5.8 -0.7 5.0E-02 15.4 6.5 4.4 -2.1 19.5
19 6.5 3.1E-02 17.1 6.5 6.1 -0.4 3.2E-02 17.1 6 6.1 0.1 3.4E-02 3.9E-02 16.4 6 5.4 -0.6 4.3E-02 16 6 5 -1 5.5E-02 14.9 6 3.9 -2.1 9.2E-02 10.6 4 -0.4 -4.4 19
18.5 6 3.7E-02 16.5 6 5.5 -0.5 3.8E-02 16.5 5.5 5.5 0 4.5E-02 15.8 5.5 4.8 -0.7 6.0E-02 14.3 5.5 3.3 -2.2 18.5
18 5.5 4.4E-02 15.9 5.5 4.9 -0.6 4.5E-02 15.9 5 4.9 -0.1 4.6E-02 15.7 5 4.7 -0.3 5.1E-02 15.3 5 4.3 -0.7 5.5E-03 5 6.5E-03 13.9 5 2.9 -2.1 9.9E-02 9.9 3 -1.1 -4.1 18
17.5 5 5.1E-02 15.3 5 4.3 -0.7 5.1E-02 15.3 4.5 4.3 -0.2 5.7E-02 14.7 4.5 3.7 -0.8 17.5
17 4.5 5.8E-02 14.6 4.5 3.6 -0.9 5.9E-02 14.6 4 3.6 -0.4 6.0E-02 14.4 4 3.4 -0.6 6.4E-02 13.9 4 2.9 -1.1 6.8E-02 4 7.7E-02 12.4 4 1.4 -2.6 1.1E-01 9 2 -2 -4 17
16.5 4 6.6E-02 13.7 4 2.7 -1.3 6.6E-02 13.7 3.5 2.7 -0.8 7.2E-02 13.1 3.5 2.1 -1.4 16.5
16 3.5 7.4E-02 12.8 3.5 1.8 -1.7 7.4E-02 12.8 3 1.8 -1.2 7.5E-02 12.6 3 1.6 -1.4 7.9E-02 12.2 3 1.2 -1.8 8.2E-02 11.8 3 0.8 -2.2 9.0E-02 11 3 0 -3 1.2E-01 7.9 1 -3.1 -4.1 16
15.5 3 8.2E-02 11.9 3 0.9 -2.1 8.2E-02 11.9 2.5 0.9 -1.6 8.7E-02 11.3 2.5 0.3 -2.2 15.5
15 2.5 9.0E-02 10.9 2.5 -0.1 -2.6 9.1E-02 10.9 2 -0.1 -2.1 9.2E-02 10.8 2 -0.2 -2.2 9.5E-02 10.4 2 -0.6 -2.6 9.7E-02 10.1 2 -0.9 -2.9 1.0E-01 9.4 2 -1.6 -3.6 1.3E-01 6.5 0 -4.5 -4.5 15
14.5 2 9.9E-02 10 2 -1 -3 9.9E-02 10 1.5 -1 -2.5 1.0E-01 9.5 1.5 -1.5 -3 1.3E-01 6 -0.5 -5 -4.5 14.5
14 1.5 1.1E-01 8.9 1.5 -2.1 -3.6 1.1E-01 8.9 1 -2.1 -3.1 1.1E-01 8.8 1 -2.2 -3.2 1.1E-01 8.5 1 -2.5 -3.5 1.1E-01 8.2 1 -2.8 -3.8 1.2E-01 7.6 1 -3.4 -4.4 1.4E-01 5.2 -1 -5.8 -4.8 14
13.5 1 1.2E-01 7.9 1 -3.1 -4.1 1.2E-01 7.9 0.5 -3.1 -3.6 1.2E-01 7.5 0.5 -3.5 -4 13.5
13 0.5 1.3E-01 6.8 0.5 -4.2 -4.7 1.3E-01 6.8 0 -4.2 -4.2 1.4E-01 6.8 0 -4.2 -4.2 1.3E-01 6.5 0 -4.5 -4.5 1.3E-01 6.2 0 -4.8 -4.8 1.4E-01 5.7 0 -5.3 -5.3 13
12.5 0 1.4E-01 5.7 0 -5.3 -5.3 1.4E-01 5.7 -0.5 -5.3 -4.8 1.4E-01 5.6 -0.5 -5.4 -4.9 1.4E-01 5.4 -0.5 -5.6 -5.1 1.4E-01 5.1 -0.5 -5.9 -5.4 - - - - - 12.5
12 -0.5
-50 -65 -72 -75 -80-60 -70

46 Rep. ITU-R BT.2467-1
TABLE A3.9
Results with different input levels (SFN)*
(16k extended, PP2, 19/128, 64 QAM, 1/2)
(*) 1 Useful signal + 1 SFN auto-interference @600 microseconds.
SFN ref. MER (dB) 11.0
level (dBm)
C/I
(dB) mar
gin
(A
WG
N
MFN
) (d
B)
BER
Before
LDPC
MER
PLP
(dB) mar
gin
(d
B)
x =
MER
- r
ef
MER
(d
B)
del
ta
(x-m
argi
n)
(dB
)
BER
Before
LDPC
MER
PLP
(dB) mar
gin
(d
B)
x =
MER
- r
ef
MER
(d
B)
del
ta
(x-m
argi
n)
(dB
)
BER
Before
LDPC
MER
PLP
(dB) mar
gin
(d
B)
x =
MER
- r
ef
MER
(d
B)
del
ta
(x-m
argi
n)
(dB
)
BER
Before
LDPC
MER
PLP
(dB) mar
gin
(d
B)
x =
MER
- r
ef
MER
(d
B)
del
ta
(x-m
argi
n)
(dB
)
BER
Before
LDPC
MER
PLP
(dB) mar
gin
(d
B)
x =
MER
- r
ef
MER
(d
B)
del
ta
(x-m
argi
n)
(dB
)
BER
Before
LDPC
MER
PLP
(dB) mar
gin
(d
B)
x =
MER
- r
ef
MER
(d
B)
del
ta
(x-m
argi
n)
(dB
)
BER
Before
LDPC
MER
PLP
(dB) mar
gin
(d
B)
x =
MER
- r
ef
MER
(d
B)
del
ta
(x-m
argi
n)
(dB
)
BER
Before
LDPC
MER
PLP
(dB) mar
gin
(d
B)
x =
MER
- r
ef
MER
(d
B)
del
ta
(x-m
argi
n)
(dB
)
C/I (dB)
I=0 2.5E-05 41 2.4E-05 30.1 6.6E-05 25.4 5.2E-04 23.2 6.5E-03 20.3 2.0E-02 18.2 5.6E-02 14.8 1.1E-01 9.1 I=0
40 27.5 2.5E-05 25.7 27 14.7 -11.8 2.8E-05 29.4 26.5 18.4 -8.1 8.1E-05 25.1 26.5 14.1 -12.4 6.4E-05 23.1 26.5 12.1 -14.4 6.8E-03 20.2 26 9.2 -16.8 2.1E-02 18.2 26 7.2 -18.8 5.7E-02 14.7 25 3.7 -21.3 1.1E-01 9.1 21.5 -1.9 -23.4 40
39 26.5 2.8E-05 29.2 25.5 18.2 -7.3 6.8E-05 23.1 25.5 12.1 -13.4 2.1E-02 18.1 25 7.1 -17.9 39
26
38 25.5 38
25
37 24.5 7.6E-05 23 23.5 12 -11.5 37
24
36 23.5 36
23
35 22.5 2.7E-05 31.7 22 20.7 -0.8 2.8E-05 28.1 21.5 17.1 -4.4 1.5E-04 24.5 21.5 13.5 -8 9.0E-04 22.8 21.5 11.8 -9.7 7.7E-03 20 21 9 -12 2.2E-02 18 21 7 -14 5.8E-02 14.6 20 3.6 -16.4 1.1E-01 9 16.5 -2 -18.5 35
22
34 21.5 2.7E-05 30.8 21 19.8 -0.7 1.8E-04 24.3 20.5 13.3 -7.2 8.2E-03 19.9 20 8.9 -11.1 34
21
33 20.5 2.7E-05 29.9 20 18.9 -0.6 3.1E-05 27.2 19.5 16.2 -3.3 2.3E-04 24.1 19.5 13.1 -6.4 1.2E-03 22.5 19.5 11.5 -8 8.5E-03 19.9 19 8.9 -10.1 1.1E-01 8.8 14.5 -2.2 -16.7 33
20
32 19.5 2.7E-05 29 19 18 -0.5 3.1E-05 26.7 18.5 15.7 -2.8 3.1E-04 23.8 18.5 12.8 -5.7 1.4E-03 22.4 18.5 11.4 -7.1 9.2E-03 19.7 18 8.7 -9.3 32
19
31 18.5 2.8E-05 28 18 17 -0.5 3.4E-05 26.1 17.5 15.1 -2.4 4.1E-04 23.6 17.5 12.6 -4.9 1.7E-03 22.1 17.5 11.1 -6.4 1.0E-02 19.5 17 8.5 -8.5 31
18 3.5E-05 25.8 17 14.8 -2.2
30 17.5 2.8E-05 27.1 17 16.1 -0.4 4.4E-05 25.4 16.5 14.4 -2.1 6.1E-04 23.2 16.5 12.2 -4.3 2.2E-03 21.8 16.5 10.8 -5.7 1.1E-02 19.4 16 8.4 -7.6 2.5E-02 17.6 16 6.6 -9.4 6.1E-02 14.2 15 3.2 -11.8 1.1E-01 8.6 11.5 -2.4 -13.9 30
5.5E-05 - 16 - - 29.5
29 16.5 2.9E-05 26.1 16 15.1 -0.4 7.1E-05 24.8 15.5 13.8 -1.7 9.0E-04 22.8 15.5 11.8 -3.7 2.8E-03 21.5 15.5 10.5 -5 1.3E-02 19.2 15 8.2 -6.8 2.6E-02 - 15 - - 29
1.0E-04 24.4 15 13.4 -1.6 28.5
28 15.5 3.7E-05 25.1 15 14.1 -0.4 1.5E-04 24 14.5 13 -1.5 1.4E-03 22.3 14.5 11.3 -3.2 3.7E-03 21.1 14.5 10.1 -4.4 1.4E-02 19 14 8 -6 2.8E-02 - 14 - - 28
2.4E-04 - 14 - - 27.5
27 14.5 7.7E-05 24.2 14 13.2 -0.3 3.7E-04 23.3 13.5 12.3 -1.2 2.2E-03 21.7 13.5 10.7 -2.8 4.9E-03 20.7 13.5 9.7 -3.8 1.6E-02 18.7 13 7.7 -5.3 3.0E-02 17.1 13 6.1 -6.9 1.1E-01 8.4 8.5 -2.6 -11.1 27
5.9E-04 - 13 - - 26.5
26 13.5 2.7E-04 23.2 13 12.2 -0.3 9.1E-04 22.5 12.5 11.5 -1 3.5E-03 21.1 12.5 10.1 -2.4 6.8E-03 20.2 12.5 9.2 -3.3 1.8E-02 18.4 12 7.4 -4.6 3.2E-02 - 12 - - 1.1E-01 8.2 7.5 -2.8 -10.3 26
25.5 13 5.2E-04 22.7 12 11.7 -0.3 1.4E-03 - 12 - - 1.9E-02 18.2 11.5 7.2 -4.3 25.5
25 12.5 9.5E-04 22.2 12 11.2 -0.3 2.1E-03 21.6 11.5 10.6 -0.9 5.5E-03 20.5 11.5 9.5 -2 9.4E-03 19.6 11.5 8.6 -2.9 2.1E-02 18 11 7 -4 3.5E-02 - 11 - - 6.8E-02 13.2 10 2.2 -7.8 1.1E-01 8.1 6.5 -2.9 -9.4 25
24.5 12 1.6E-03 21.7 11 10.7 -0.3 7.0E-03 20.1 11 9.1 -1.9 2.3E-02 17.8 10.5 6.8 -3.7 24.5
24 11.5 2.7E-03 21.2 11 10.2 -0.3 4.4E-03 20.7 10.5 9.7 -0.8 8.7E-03 19.7 10.5 8.7 -1.8 1.3E-03 19 10.5 8 -2.5 2.5E-02 17.5 10 6.5 -3.5 3.9E-02 16.2 10 5.2 -4.8 7.0E-02 12.8 9 1.8 -7.2 1.1E-01 7.8 5.5 -3.2 -8.7 24
23.5 11 4.1E-03 20.6 10 9.6 -0.4 6.1E-03 20.2 10 9.2 -0.8 1.1E-02 19.3 10 8.3 -1.7 2.7E-02 17.3 9.5 6.3 -3.2 23.5
23 10.5 6.1E-03 20.1 9.5 9.1 -0.4 8.3E-03 19.7 9.5 8.7 -0.8 1.3E-02 18.9 9.5 7.9 -1.6 1.8E-02 18.3 9.5 7.3 -2.2 3.0E-02 17 9 6 -3 4.4E-02 - 9 - - 7.4E-02 12.3 8 1.3 -6.7 1.2E-01 7.5 4.5 -3.5 -8 23
22.5 10 8.7E-03 19.6 9 8.6 -0.4 1.1E-02 19.2 9 8.2 -0.8 1.6E-02 18.5 9 7.5 -1.5 3.3E-02 16.7 8.5 5.7 -2.8 22.5
22 9.5 1.2E-02 19 8.5 8 -0.5 1.4E-02 18.7 8.5 7.7 -0.8 1.9E-02 18.1 8.5 7.1 -1.4 2.4E-02 17.6 8.5 6.6 -1.9 3.6E-02 16.4 8 5.4 -2.6 4.9E-02 15.1 8 4.1 -3.9 7.8E-02 11.7 7 0.7 -6.3 1.2E-01 7.1 3.5 -3.9 -7.4 22
21.5 9 1.6E-02 18.5 8 7.5 -0.5 2.3E-02 17.6 8 6.6 -1.4 3.9E-02 16 7.5 5 -2.5 21.5
21 8.5 2.0E-02 17.9 7.5 6.9 -0.6 2.2E-02 17.7 7.5 6.7 -0.8 2.7E-02 17.1 7.5 6.1 -1.4 3.2E-02 16.7 7.5 5.7 -1.8 4.3E-02 15.6 7 4.6 -2.4 5.6E-02 - 7 - - 8.4E-02 10.9 6 -0.1 -6.1 1.2E-01 6.6 2.5 -4.4 -6.9 21
20.5 8 2.5E-02 17.4 7 6.4 -0.6 3.2E-02 16.7 7 5.7 -1.3 4.8E-02 15.1 6.5 4.1 -2.4 20.5
20 7.5 3.0E-02 16.8 6.5 5.8 -0.7 3.2E-02 16.6 6.5 5.6 -0.9 3.7E-02 16.1 6.5 5.1 -1.4 4.1E-02 15.7 6.5 4.7 -1.8 5.2E-02 14.5 6 3.5 -2.5 6.4E-02 13.1 6 2.1 -3.9 8.9E-02 10.1 5 -0.9 -5.9 1.3E-01 6 1.5 -5 -6.5 20
19.5 7 3.6E-02 16.2 6 5.2 -0.8 3.8E-02 16 6 5 -1 4.3E-02 15.5 6 4.5 -1.5 5.7E-02 13.9 5.5 2.9 -2.6 19.5
19 6.5 4.2E-02 15.6 5.5 4.6 -0.9 4.4E-02 15.4 5.5 4.4 -1.1 4.9E-02 14.9 5.5 3.9 -1.6 5.2E-02 14.4 5.5 3.4 -2.1 6.2E-02 13.1 5 2.1 -2.9 7.3E-02 - 5 - - 9.6E-02 9.2 4 -1.8 -5.8 1.3E-01 5.2 0.5 -5.8 -6.3 19
18.5 6 4.9E-02 14.8 5 3.8 -1.2 5.1E-02 14.6 5 3.6 -1.4 5.5E-02 14 5 3 -2 5.9E-02 13.5 5 2.5 -2.5 6.8E-02 12.3 4.5 1.3 -3.2 7.7E-02 11.1 4.5 0.1 -4.4 1.3E-01 4.9 0 -6.1 -6.1 18.5
18 5.5 5.6E-02 13.9 4.5 2.9 -1.6 5.8E-02 13.6 4.5 2.6 -1.9 6.2E-02 13.1 4.5 2.1 -2.4 6.5E-02 12.6 4.5 1.6 -2.9 7.4E-02 11.5 4 0.5 -3.5 8.3E-02 10.3 4 -0.7 -4.7 1.0E-01 8.1 3 -2.9 -5.9 1.4E-01 4.2 -0.5 -6.8 -6.3 18
17.5 5 6.3E-02 12.8 4 1.8 -2.2 6.5E-02 12.6 4 1.6 -2.4 6.8E-02 12.1 4 1.1 -2.9 6.8E-02 11.6 4 0.6 -3.4 8.6E-02 10.6 3.5 -0.4 -3.9 8.8E-02 9.6 3.5 -1.4 -4.9 17.5
17 4.5 7.1E-02 11.7 3.5 0.7 -2.8 7.2E-02 11.5 3.5 0.5 -3 7.5E-02 11.1 3.5 0.1 -3.4 7.2E-02 10.7 3.5 -0.3 -3.8 9.3E-02 9.7 3 -1.3 -4.3 9.4E-02 8.7 3 -2.3 -5.3 1.1E-01 6.7 2 -4.3 -6.3 17
16.5 4 7.8E-02 10.7 3 -0.3 -3.3 8.0E-02 10.5 3 -0.5 -3.5 8.3E-02 10 3 -1 -4 7.8E-02 9.6 3 -1.4 -4.4 9.9E-02 8.9 2.5 -2.1 -4.6 1.0E-01 8 2.5 -3 -5.5 16.5
16 3.5 8.6E-02 9.5 2.5 -1.5 -4 8.7E-02 9.4 2.5 -1.6 -4.1 9.0E-02 8.9 2.5 -2.1 -4.6 8.6E-02 8.6 2.5 -2.4 -4.9 1.1E-01 7.9 2 -3.1 -5.1 1.1E-01 7.9 2 -3.1 -5.1 1.2E-01 5.2 1 -5.8 -6.8 16
15.5 3 9.4E-02 8.4 2 -2.6 -4.6 9.5E-02 8.3 2 -2.7 -4.7 9.8E-02 7.9 2 -3.1 -5.1 9.3E-02 7.6 2 -3.4 -5.4 1.1E-01 6.9 1.5 -4.1 -5.6 1.1E-01 6.1 1.5 -4.9 -6.4 15.5
15 2.5 1.0E-01 7.2 1.5 -3.8 -5.3 1.0E-01 7.1 1.5 -3.9 -5.4 1.1E-01 6.7 1.5 -4.3 -5.8 1.0E-01 6.5 1.5 -4.5 -6 1.1E-01 5.8 1 -5.2 -6.2 1.2E-01 5.1 1 -5.9 -6.9 1.4E-01 3.6 0 -7.4 -7.4 15
14.5 2 1.1E-01 6.1 1 -4.9 -5.9 1.1E-01 5.8 1 -5.2 -6.2 1.1E-01 5.6 1 -5.4 -6.4 1.1E-01 5.3 1 -5.7 -6.7 1.2E-01 4.8 0.5 -6.2 -6.7 1.3E-01 4.2 0.5 -6.8 -7.3 14.5
14 1.5 1.2E-01 4.8 0.5 -6.2 -6.7 1.2E-01 4.7 0.5 -6.3 -6.8 1.2E-01 4.5 0.5 -6.5 -7 1.2E-01 4.2 0.5 -6.8 -7.3 1.3E-01 3.7 0 -7.3 -7.3 1.4E-01 3.1 0 -7.9 -7.9 14
13.5 1 1.3E-01 3.5 0 -7.5 -7.5 1.3E-01 3.4 0 -7.6 -7.6 1.3E-01 3.2 0 -7.8 -7.8 1.3E-01 3 0 -8 -8 1.4E-01 3 13.5
13 0.5 1.4E-01 2.3 0.5 -4.2 -4.7 1.4E-01 2.2 -0.5 -8.8 -8.3 13
12.5 0 12.5
-50 -83-65 -70 -75 -80-72 -77

Rep. ITU-R BT.2467-1 47
TABLE A3.10
(32k extended, PP4, 1/32, 256 QAM, 3/5)
Ref
MER LDPC iter.
and BER
Tables
Lc f (BER)
MFN 17.3 dB
Not relevant for MFN
SFN 17.3 dB
f (BER) for level > –60 dBm
Lcmfn BER
1e-2 2e-2 4e-2 6e-2
-60
-61
-62
-63
-64
-65 1.3 0.9 0.5 0.6
-66 1.8 1.1 0.7 0.7
-67 2.8 1.6 1 0.9
-68 4 2.4 1.4 1.1
-69 5.5 3.8 1.9 1.4
-70 6 5.5 2.5 1.8
-71 6 6 3.3 2.1
-72 6 6 4.5 2.6
-73 6 6 5.5 3.5
-74 6 6 6 6
leve
l (d
Bm
)
0
1
2
3
4
5
6
-60 -61 -62 -63 -64 -65 -66 -67 -68 -69 -70 -71 -72 -73 -74
BER 1E-2
BER 2E-2
BER 4E-2
BER 6E-2
dB Additional margin Lc (function of the level) MFN
BER before
LDPC margin
<= 8E-2 >= 1
<= 6E-2 >= 3
<= 4E-2 >= 4
<= 1E-2 >= 8
<= 1E-3 >= 12
<= 1E-4 >= 15
LDPC
iterations margin
<= 20 >= 1
<= 15 >= 3
<= 10 >= 5
<= 6 >= 7
<= 5 >= 9
<= 4 >= 15
Lcsfn BER
1e-2 2e-2 4e-2 6e-2
-60
-61
-62
-63
-64
-65 1.7 1.4 1.3 1.6
-66 2 1.6 1.4 1.6
-67 2.6 1.9 1.5 1.65
-68 4 2.5 1.6 1.7
-69 5.2 3.5 1.8 1.8
-70 6 5 2.1 1.9
-71 6 5.8 3 2.3
-72 6 6 4.8 3.1
-73 6 6 5.8 4
-74 6 6 6 4.9
-75 6 6 6 5.5
leve
l (d
Bm
)
0
1
2
3
4
5
6
-60-61-62-63-64-65-66-67-68-69-70-71-72-73-74-75
BER1E-2
BER2E-2
BER4E-2
BER6E-2
dB Additional margin Lc (function of the level) SFN
-0.4
-0.2
0
0.2
0.4
0.6
0.8
1
4.0
E-0
55
.0E-
05
6.0
E-0
57
.0E-
05
8.0
E-0
59
.0E-
05
1.0
E-0
42
.0E-
04
3.0
E-0
44
.0E-
04
5.0
E-0
46
.0E-
04
7.0
E-0
48
.0E-
04
9.0
E-0
41
.0E-
03
2.0
E-0
33
.0E-
03
4.0
E-0
35
.0E-
03
6.0
E-0
37
.0E-
03
8.0
E-0
39
.0E-
03
1.0
E-0
22
.0E-
02
3.0
E-0
24
.0E-
02
5.0
E-0
26
.0E-
02
7.0
E-0
28
.0E-
02

48 Rep. ITU-R BT.2467-1
TABLE A3.11
Results* (AWGN interference limited) with different input levels (MFN)
(32k extended, PP4, 1/32, 256 QAM, 3/5)
MFN ref. MER (dB) 17.3
level (dBm)
C/N
(dB) mar
gin
(d
B)
BER
Before
LDPC
MER PLP
(dB) mar
gin
(d
B)
x =
MER
- r
ef
MER
(d
B)
del
ta
(x-m
argi
n)
(dB
) BER
Before
LDPC
MER PLP
(dB) mar
gin
(d
B)
x =
MER
- r
ef
MER
(d
B)
del
ta
(x-m
argi
n)
(dB
) BER
Before
LDPC
MER PLP
(dB) mar
gin
(d
B)
x =
MER
- r
ef
MER
(d
B)
del
ta
(x-m
argi
n)
(dB
) BER
Before
LDPC
MER PLP
(dB) mar
gin
(d
B)
x =
MER
- r
ef
MER
(d
B)
del
ta
(x-m
argi
n)
(dB
) BER
Before
LDPC
MER PLP
(dB) mar
gin
(d
B)
x =
MER
- r
ef
MER
(d
B)
del
ta
(x-m
argi
n)
(dB
) BER
Before
LDPC
MER PLP
(dB) mar
gin
(d
B)
x =
MER
- r
ef
MER
(d
B)
del
ta
(x-m
argi
n)
(dB
)
C/N (dB)
Noise off 7.7E-05 40.1 2.5E-04 30.0 3.1E-03 27.2 1.0E-02 25.3 2.5E-02 23.3 4.7E-02 21.0 Noise off
40 21.5 8.0E-05 36.4 21.5 19.1 -2.4 4.1E-04 29.5 21.0 12.2 -8.8 3.9E-03 26.9 21.0 9.6 -11.4 1.2E-02 25.1 21.0 7.8 -13.2 2.7E-02 23.1 20.0 5.8 -14.2 6.0E-02 19.8 18.5 2.5 -16.0 40
21.0 39.5
39 20.5 39
20.0 38.5
38 19.5 38
19.0 37.5
37 18.5 37
18.0 36.5
36 17.5 36
17.0 35.5
35 16.5 8.5E-05 32.8 16.5 15.5 -1.0 1.0E-03 28.5 16.0 11.2 -4.8 1.4E-02 24.7 16.0 7.4 -8.6 2.9E-02 22.8 15.0 5.5 -9.5 35
16.0 34.5
34 15.5 9.2E-05 32.0 15.5 14.7 -0.8 3.0E-02 22.7 14.0 5.4 -8.6 34
15.0 33.5
33 14.5 1.1E-04 31.2 14.5 13.9 -0.6 33
14.0 32.5
32 13.5 2.0E-04 30.3 13.5 13.0 -0.5 9.0E-03 25.6 13.0 8.3 -4.7 1.8E-02 24.2 13.0 6.9 -6.1 32
13.0 31.5
31 12.5 4.5E-04 29.4 12.5 12.1 -0.4 1.1E-02 25.3 12.0 8.0 -4.0 2.0E-02 23.9 12.0 6.6 -5.4 31
12.0 30.5
30 11.5 1.1E-03 28.5 11.5 11.2 -0.3 5.8E-03 26.3 11.0 9.0 -2.0 1.3E-02 24.8 11.0 7.5 -3.5 2.2E-02 23.6 11.0 6.3 -4.7 3.7E-02 22.1 10.0 4.8 -5.2 6.7E-02 19.2 8.5 1.9 -6.6 30
29.5 11.0 29.5
29 10.5 2.4E-03 27.5 10.5 10.2 -0.3 8.1E-03 25.7 10.0 8.4 -1.6 1.6E-02 24.4 10.0 7.1 -2.9 2.5E-02 23.3 10.0 6.0 -4.0 3.9E-02 21.8 9.0 4.5 -4.5 6.8E-02 19.1 7.5 1.8 -5.7 29
28.5 10.0 28.5
28 9.5 5.0E-03 26.5 9.5 9.2 -0.3 1.2E-02 25.0 9.0 7.7 -1.3 2.0E-02 23.9 9.0 6.6 -2.4 2.9E-02 22.9 9.0 5.6 -3.4 4.3E-02 21.4 8.0 4.1 -3.9 7.1E-02 18.9 6.5 1.6 -4.9 28
27.5 9.0 27.5
27 8.5 9.0E-03 25.6 8.5 8.3 -0.2 1.7E-02 24.4 8.0 7.1 -0.9 2.5E-02 23.3 8.0 6.0 -2.0 3.4E-02 22.3 8.0 5.0 -3.0 4.7E-02 21.0 7.0 3.7 -3.3 7.4E-02 18.7 5.5 1.4 -4.1 27
26.5 8.0 26.5
26 7.5 1.5E-02 24.6 7.5 7.3 -0.2 2.3E-02 23.6 7.0 6.3 -0.7 3.1E-02 22.6 7.0 5.3 -1.7 3.9E-02 21.8 7.0 4.5 -2.5 5.1E-02 20.6 6.0 3.3 -2.7 7.7E-02 18.6 4.5 1.3 -3.2 26
25.5 7.0 25.5
25 6.5 2.3E-02 23.6 6.5 6.3 -0.2 3.1E-02 22.7 6.0 5.4 -0.6 3.8E-02 21.9 6.0 4.6 -1.4 4.6E-02 21.1 6.0 3.8 -2.2 5.7E-02 20.0 5.0 2.7 -2.3 8.1E-02 18.4 3.5 1.1 -2.4 25
24.5 6.0 24.5
24 5.5 3.2E-02 22.5 5.5 5.2 -0.3 4.0E-02 21.8 5.0 4.5 -0.5 4.7E-02 21.1 5.0 3.8 -1.2 5.4E-02 20.3 5.0 3.0 -2.0 6.4E-02 19.5 4.0 2.2 -1.8 8.6E-02 18.1 2.5 0.8 -1.7 24
23.5 5.0 23.5
23 4.5 4.3E-02 21.4 4.5 4.1 -0.4 5.0E-02 20.7 4.0 3.4 -0.6 5.6E-02 20.1 4.0 2.8 -1.2 6.2E-02 19.6 4.0 2.3 -1.7 7.1E-02 18.9 3.0 1.6 -1.4 9.1E-02 17.9 1.5 0.6 -0.9 23
22.5 4.0 22.5
22 3.5 5.5E-02 20.2 3.5 2.9 -0.6 6.1E-02 19.7 3.0 2.4 -0.6 6.6E-02 19.3 3.0 2.0 -1.0 7.2E-02 18.9 3.0 1.6 -1.4 8.0E-02 18.4 2.0 1.1 -0.9 9.8E-02 17.6 0.5 0.3 -0.2 22
21.5 3.0 21.5
21 2.5 6.8E-02 19.1 2.5 1.8 -0.7 7.3E-02 18.8 2.0 1.5 -0.5 7.8E-02 18.6 2.0 1.3 -0.7 8.2E-02 18.3 2.0 1.0 -1.0 9.0E-02 17.9 1.0 0.6 -0.4 1.1E-01 17.2 -0.5 -0.1 0.4 21
20.5 2.0 20.5
20 1.5 8.2E-02 18.3 1.5 1.0 -0.5 8.6E-02 18.1 1.0 0.8 -0.2 9.0E-02 17.9 1.0 0.6 -0.4 9.4E-02 17.7 1.0 0.4 -0.6 1.0E-01 17.4 0.0 0.1 0.1 20
19.5 1.0 1.0E-01 17.5 0.5 0.2 -0.3 1.1E-01 17.2 -0.5 -0.1 0.4 19.5
19 0.5 9.6E-02 17.7 0.5 0.4 -0.1 1.0E-01 17.5 0.0 0.2 0.2 1.0E-01 17.3 0.0 0.0 0.0 1.1E-01 17.2 0.0 -0.1 -0.1 19
18.5 0.0 1.0E-01 17.3 0.0 0.0 0.0 1.1E-01 17.1 0.0 -0.2 0.0 1.1E-01 17.0 -0.5 -0.3 0.2 18.5
18 -0.5 1.1E-01 16.9 -0.5 -0.4 0.1 18
-74 -50 dBm -70 -72-65 -68

Rep. ITU-R BT.2467-1 49
TABLE A3.12
Results with different input levels (SFN)*
(32k extended, PP4, 1/32, 256 QAM, 3/5)
(*) 1 Useful signal + 1 SFN auto-interference @600 microseconds.
SFN ref. MER (dB) 17.3
level (dBm)
C/I
(dB) mar
gin
(MFN
)(d
B)
BER
Before
LDPC
MER
PLP
(dB) mar
gin
(d
B)
x =
MER
- r
ef
MER
(d
B)
del
ta
(x-m
argi
n)
(dB
) BER
Before
LDPC
MER
PLP
(dB) mar
gin
(d
B)
x =
MER
- r
ef
MER
(d
B)
del
ta
(x-m
argi
n)
(dB
) BER
Before
LDPC
MER
PLP
(dB) mar
gin
(d
B)
x =
MER
- r
ef
MER
(d
B)
del
ta
(x-m
argi
n)
(dB
) BER
Before
LDPC
MER
PLP
(dB) mar
gin
(d
B)
x =
MER
- r
ef
MER
(d
B)
del
ta
(x-m
argi
n)
(dB
) BER
Before
LDPC
MER
PLP
(dB) mar
gin
(d
B)
x =
MER
- r
ef
MER
(d
B)
del
ta
(x-m
argi
n)
(dB
) BER
Before
LDPC
MER
PLP
(dB) mar
gin
(d
B)
x =
MER
- r
ef
MER
(d
B)
del
ta
(x-m
argi
n)
(dB
)
C/I
(dB)
Int.off 8.0E-05 40.1 2.5E-04 30.1 3.1E-03 27.2 1.0E-02 25.3 2.4E-02 23.3 4.7E-02 21.0 Int.off
40 20.0 8.2E-05 35.4 20.0 18.1 -1.9 4.9E-04 29.3 20.0 12.0 -8.0 4.2E-03 26.8 19.5 9.5 -10.0 1.2E-02 25.0 19.0 7.7 -11.3 2.6E-02 23.1 19.0 5.8 -13.2 4.8E-02 20.9 18.0 3.6 -14.4 40
39 19.0 39
38 18.0 38
37 17.0 37
36 16.0 36
35 15.0 8.6E-05 31.6 15.0 14.3 -0.7 1.6E-03 28.1 15.0 10.8 -4.2 7.0E-03 26.0 14.5 8.7 -5.8 1.6E-02 24.5 14.0 7.2 -6.8 2.9E-02 22.7 14.0 5.4 -8.6 5.1E-02 20.5 13.0 3.2 -9.8 35
34 14.0 5.1E-02 20.5 12.0 3.2 -8.8 34
33 13.0 9.6E-03 25.4 12.5 8.1 -4.4 1.8E-02 24.1 12.0 6.8 -5.2 5.3E-02 20.3 11.0 3.0 -8.0 33
32 12.0 1.2E-02 25.1 11.5 7.8 -3.7 2.1E-02 23.8 11.0 6.5 -4.5 3.4E-02 22.1 11.0 4.8 -6.2 5.5E-02 20.1 10.0 2.8 -7.2 32
31 11.0 1.4E-02 24.6 10.5 7.3 -3.2 2.3E-02 23.4 10.0 6.1 -3.9 5.7E-02 19.8 9.0 2.5 -6.5 31
30 10.0 3.2E-03 27.0 10.0 9.7 -0.3 9.8E-03 25.4 10.0 8.1 -1.9 1.8E-02 24.1 9.5 6.8 -2.7 2.7E-02 23.0 9.0 5.7 -3.3 4.0E-02 21.5 9.0 4.2 -4.8 5.9E-02 19.6 8.0 2.3 -5.7 30
29 9.0 6.6E-03 26.0 9.0 8.7 -0.3 1.4E-02 24.7 9.0 7.4 -1.6 2.2E-02 23.6 8.5 6.3 -2.2 3.1E-02 22.5 8.0 5.2 -2.8 6.1E-02 19.3 7.0 2.0 -5.0 29
28 8.0 1.2E-02 25.0 8.0 7.7 -0.3 1.9E-02 23.9 8.0 6.6 -1.4 2.7E-02 22.9 7.5 5.6 -1.9 3.5E-02 21.9 7.0 4.6 -2.4 4.8E-02 20.5 7.0 3.2 -3.8 6.5E-02 19.0 6.0 1.7 -4.3 28
27 7.0 1.9E-02 23.9 7.0 6.6 -0.4 2.6E-02 23.0 7.0 5.7 -1.3 3.3E-02 22.1 6.5 4.8 -1.7 4.1E-02 21.2 6.0 3.9 -2.1 5.3E-02 19.9 6.0 2.6 -3.4 6.9E-02 18.6 5.0 1.3 -3.7 27
26 6.0 2.7E-02 22.9 6.0 5.6 -0.4 3.4E-02 22.1 6.0 4.8 -1.2 4.1E-02 21.2 5.5 3.9 -1.6 4.8E-02 20.3 5.0 3.0 -2.0 5.9E-02 19.2 5.0 1.9 -3.1 7.4E-02 18.2 4.0 0.9 -3.1 26
25 5.0 3.7E-02 21.7 5.0 4.4 -0.6 4.3E-02 20.9 5.0 3.6 -1.4 4.9E-02 20.1 4.5 2.8 -1.7 5.6E-02 19.4 4.0 2.1 -1.9 6.7E-02 18.6 4.0 1.3 -2.7 7.9E-02 17.9 3.0 0.6 -2.4 25
24 4.0 4.8E-02 20.4 4.0 3.1 -0.9 5.3E-02 19.7 4.0 2.4 -1.6 5.9E-02 19.1 3.5 1.8 -1.7 6.5E-02 18.5 3.0 1.2 -1.8 7.5E-02 18.0 3.0 0.7 -2.3 8.6E-02 17.5 2.0 0.2 -1.8 24
23 3.0 6.0E-02 19.1 3.0 1.8 -1.2 6.4E-02 18.6 3.0 1.3 -1.7 6.9E-02 18.2 2.5 0.9 -1.6 7.4E-02 17.9 2.0 0.6 -1.4 8.4E-02 17.5 2.0 0.2 -1.8 9.3E-02 17.0 1.0 -0.3 -1.3 23
22 2.0 7.2E-02 18.0 2.0 0.7 -1.3 7.6E-02 17.8 2.0 0.5 -1.5 8.0E-02 17.5 1.5 0.2 -1.3 8.5E-02 17.3 1.0 0.0 -1.0 9.4E-02 16.9 1.0 -0.4 -1.4 1.0E-01 16.4 0.0 -0.9 -0.9 22
1.1E-01 16.1 -0.5 -1.2 -0.7 21.5
21 1.0 8.5E-02 17.2 1.0 -0.1 -1.1 8.8E-02 16.9 1.0 -0.4 -1.4 9.2E-02 16.7 0.5 -0.6 -1.1 9.6E-02 16.5 0.0 -0.8 -0.8 1.0E-01 16.2 0.0 -1.1 -1.1 21
20.5 0.5 9.6E-02 16.7 0.5 -0.6 -1.1 9.8E-02 16.3 0.0 -1 -1 1.0E-01 16.1 -0.5 -1.2 -0.7 1.1E-01 15.8 -0.5 0.0 -1.1 20.5
20 0.0 9.8E-02 16.2 0.0 -1.1 -1.1 1.0E-01 16.0 0.0 -1.3 -1.3 1.1E-01 15.8 -0.5 -1.5 -1 20
19.5 -0.5 1.1E-01 15.6 -0.5 -1.7 -1.2 19.5
-74-65-50 -68 -70 -72

50 Rep. ITU-R BT.2467-1
Annex 4
to Part 1
Laboratory tests on DVB-T2 performed by Rai Way S.p.A
Some laboratory tests were performed in order to identify a method for the evaluation of DVB-T2
services.
The analysis was focused on the behaviour of the following parameters: MER of a PLP; BER before
LDPC and BER before BCH.
Some trials have been carried out comparing DVB-T and DVB-T2.
Test in Band IV and Band III – SFN with a signal outside Guard Interval
A first set of trials were performed in order to study the variability of the MER of PLP and the BER,
BER before LDPC and BER before BCH, in an SFN with a signal outside the Guard Interval. The
trials were carried out changing the level of this interferer.
Tests have been executed in band IV and in band III. Various Pilot Pattern profiles (PP), Code Rates
(CR) and Guard Interval (GI) have been selected.
A signal with the following general features was generated by a high level professional equipment:
– Single PLP
– Constellation: 256 QAM (rotated where specified)
– FFT variant: 32k Not Extended
– Single Input Single Output (SISO) transmission
– Signal level 47.8 dBμV
Band IV measurements
Channel 21 (474 MHz) or CH 30 (546 MHz)
Interferer: delay 600 μs, variable level
PP2 PP4 PP7
Guard Interval 1/16, 224 μs
1/8, 448 μs
1/16, 224 μs 1/128, 28 μs
Code Rate
3/5
2/3
3/4
3/5
2/3
3/4
3/4

Rep. ITU-R BT.2467-1 51
PP2 GI 1/16 – CR 3/5 GI 1/16 – CR 2/3
Interferer
level
dB
Iteration MER PLP
BER
before
LDPC
BER
before
BCH
Iteration MER PLP
BER
before
LDPC
BER
before
BCH
–40,0 1,1 33,3 1,30E-06 0,00E+00 1,1 33,2 2,20E-06 0,00E+00
–35,0 2,1 30,4 7,00E-05 0,00E+00 2,0 30,4 8,00E-05 0,00E+00
–30,0 4,5 26,4 5,00E-03 0,00E+00 3,5 26,4 5,00E-03 0,00E+00
–25,0 11,3 21,1 4,00E-02 0,00E+00 7,3 21,1 4,00E-02 0,00E+00
–22,0 22,0 17,7 7,60E-02 0,00E+00 15,9 17,7 7,00E-02 0,00E+00
–21,9
16,8 17,6 8,00E-02 0,00E+00
–21,8
17,7 17,5 8,00E-02 0,00E+00
–21,7
19,0 17,4 8,00E-02 0,00E+00
–21,6
20,5 17,4 8,00E-02 0,00E+00
–21,5
22,5 17,3 8,00E-02 1,00E-04
–21,4
27,0 17,2 8,00E-02 3,00E-03
–21,0 30,3 17,2 8,80E-02 0,00E+00
–20,0 36,1 16,2 1,00E-01 0,00E+00
–19,9 36,1 16,1 1,00E-01 2,70E-09
–19,8 36,2 16,0 1,00E-01 1,40E-07
–19,7 36,2 15,9 1,00E-01 1,70E-06
–19,6 36,2 15,8 1,00E-01 1,30E-05
–19,5 36,3 15,7 1,00E-01 8,00E-05
–19,4 36,4 15,6 1,00E-01 4,00E-04
–19,3 36,5 15,5 1,00E-01 2,00E-03
–19,2 36,5 15,3 1,00E-01 8,00E-03

52 Rep. ITU-R BT.2467-1
PP2 GI 1/8 – CR 2/3 GI 1/8 – CR 3/4
Interferer
level
dB
Iteration MER PLP
dB
BER
before
LDPC
BER
before
BCH
Iteration MER PLP
dB
BER
before
LDPC
BER
before
BCH
–40,0 1,1 33,2 3,00E-06 0,00E+00 1,3 33,2 6,00E-06 0,00E+00
–35,0 2,0 30,4 7,00E-05 0,00E+00 2,0 30,4 8,00E-05 0,00E+00
–30,0 3,5 26,3 5,00E-03 0,00E+00 3,5 26,3 5,00E-03 0,00E+00
–25,0 7,4 21,0 4,00E-02 0,00E+00 9,5 21,0 4,00E-02 0,00E+00
–24,0
13,9 19,6 5,00E-02 0,00E+00
–23,5
19,4 19,0 6,00E-02 0,00E+00
–23,4
21,6 18,8 6,00E-02 0,00E+00
–23,3
26,0 18,7 6,00E-02 5,00E-04
–22,0 16,4 17,7 7,80E-02 0,00E+00
–21,9 17,8 17,6 8,00E-02 0,00E+00
–21,8 18,7 17,5 8,00E-02 0,00E+00
–21,7 20,0 17,4 8,20E-02 0,00E+00
–21,6 22,3 17,3 8,30E-02 3,00E-06
–21,5 26,0 17,2 8,40E-02 2,00E-03

Rep. ITU-R BT.2467-1 53
PP4 Code Rate 3/5 Code Rate 2/3 Code Rate 3/4
Interferer
level
dB
MER
PLP
BER
before
LDPC
BER
before
BCH
Iter. MER
PLP
BER
before
LDPC
BER
before
BCH
Iter. MER
PLP
BER
before
LDPC
BER
before
BCH
Iter.
–40,0 33,3 4,0E-06 0,0E+00 1,0 33,3 1,3E-06 0,0E+00 1,0 33,3 1,4E-06 0,0E+00 1,0
–35,0 30,5 6,3E-05 0,0E+00 2,1 30,5 6,0E-05 0,0E+00 2,0 30,5 6,0E-05 0,0E+00 2,0
–30,0 26,5 4,6E-03 0,0E+00 4,4 26,5 4,6E-03 0,0E+00 3,3 26,5 4,6E-03 0,0E+00 3,3
–25,0 21,5 3,9E-02 0,0E+00 11,0 21,5 4,0E-02 0,0E+00 7,0 21,5 4,0E-02 0,0E+00 8,7
–24,0 20,2 5,0E-02 0,0E+00 13,5 20,2 5,0E-02 0,0E+00 8,3 20,2 5,0E-02 0,0E+00 12,1
–23,9 20,1 5,1E-02 0,0E+00 13,5 20,0 5,1E-02 0,0E+00 8,5 20,1 5,1E-02 0,0E+00 12,6
–23,8 19,9 5,2E-02 0,0E+00 14,0 19,9 5,2E-02 0,0E+00 8,6 19,9 5,2E-02 0,0E+00 13,2
–23,7 19,8 5,3E-02 0,0E+00 14,5 19,8 5,3E-02 0,0E+00 8,7 19,8 5,30-02 0,0E+00 14,0
–23,6 19,7 5,4E-02 0,0E+00 14,5 19,6 5,4E-02 0,0E+00 9,0 19,6 5,4E-02 0,0E+00 14,7
–23,5 19,5 5,5E-02 0,0E+00 14,9 19,5 5,5E-02 0,0E+00 9,1 19,5 5,5E-02 0,0E+00 15,5
–23,4 19,4 5,6E-02 0,0E+00 15,2 19,4 5,7E-02 0,0E+00 9,3 19,4 5,6E-02 0,0E+00 16,5
–23,3 19,3 5,8E-02 0,0E+00 15,5 19,3 5,8E-02 0,0E+00 9,6 19,3 5,8E-02 0,0E+00 17,8
–23,2 19,1 5,9E-02 0,0E+00 15,7 19,1 5,9E-02 0,0E+00 9,8 19,1 5,9E-02 0,0E+00 19,5
–23,1 19,0 6,0E-02 0,0E+00 16,1 19,0 6,0E-02 0,0E+00 10,0 19,0 6,0E-02 0,0E+00 21,7
–23,0 18,9 6,0E-02 0,0E+00 16,6 18,9 6,1E-02 0,0E+00 10,2 18,9 6,1E-02 3,0E-04 26,0
–22,0 17,9 7,3E-02 0,0E+00 21,0 17,9 7,3E-02 0,0E+00 14,2
–21,9 17,9 7,4E-02 0,0E+00 21,3 17,9 7,4E-02 0,0E+00 15,0
–21,8 17,8 7,6E-02 0,0E+00 22,0 17,8 7,6E-02 0,0E+00 15,6
–21,7 17,7 7,7E-02 0,0E+00 23,0 17,7 7,7E-02 0,0E+00 16,5
–21,6 17,6 7,7E-02 0,0E+00 23,0 17,6 7,8E-02 0,0E+00 17,3
–21,5 17,5 7,9E-02 0,0E+00 24,0 17,5 7,9E-02 0,0E+00 18,6
–21,4 17,4 8,1E-02 0,0E+00 25,0 17,4 8,1E-02 0,0E+00 20,1
–21,3 17,3 8,2E-02 0,0E+00 25,4 17,4 8,2E-02 0,0E+00 21,0
–21,2 17,3 8,3E-02 0,0E+00 26,1 17,3 8,3E-02 1,0E-03 25,5
–21,0 17,1 8,6E-02 0,0E+00 27,8
–20,0 16,1 9,9E-02 5,0E-09 35,4
–19,9 16,0 1,0E-01 1,0E-08 35,7
–19,8 15,9 1,0E-01 6,3E-08 36,0
–19,7 15,7 1,0E-01 3,0E-07 36,0
–19,6 15,6 1,0E-01 2,0E-06 36,0
–19,5 15,5 1,0E-01 8,0E-06 36,0
–19,4 15,4 1,0E-01 4,3E-05 36,0
–19,3 15,3 1,0E-01 5,0E-04 37,0
–19,2 15,2 1,0E-01 8,0E-03 38,0

54 Rep. ITU-R BT.2467-1
PP7 GI 1/128 – CR 3/4
Rotated constellation
Interfere
r level
dB
Iteration
MER
PLP
dB
BER
before
LDPC
BER
before
BCH
–40,0 1,1 33,9 2,60E-06 0,00E+00
–35,0 1,8 31,0 2,40E-05 0,00E+00
–30,0 3,2 27,0 2,60E-03 0,00E+00
–25,0 8,1 22,2 3,00E-02 0,00E+00
–23,0 18,1 19,6 5,70E-02 0,00E+00
–22,7 26,0 19,2 6,00E-02 7,00E-04
Remarks on Band IV measurements
BER before BCH is generally equal to 0 and when it becomes greater, the failure threshold is reached.
The MER PLP has different lower limit, depending on the CR.
PP2
CR 3/5: 15.3 dB
CR 2/3: 17.2 dB
CR 3/4: 18.7 dB
PP4
CR 3/5: 15.2 dB
CR 2/3: 17.3 dB
CR 3/4: 18.9 dB
PP7
CR 3/4: 19.2 dB
Relation between the level of the interferer and the MER PLP: Δ= Level of Interferer – MER
PP2 PP4 PP7
Interferer level
dB
MER PLP
dB
Δ=I-MER
dB
MER PLP
dB
Δ=I-MER
dB
MER PLP
dB
Δ=I-MER
dB
–40,0 33,2 6,8 33,3 6,7 33,9 6,1
–35,0 30,4 4,6 30,5 4,5 31,0 4,0
–30,0 26,4 3,7 26,5 3,5 27,0 3,0
–25,0 21,1 4,0 21,5 3,5 22,2 2,8
–24,0 19,6 4,4 20,2 3,8
–23,9 20,1 3,8
–23,8 19,9 3,9
–23,7 19,8 3,9
–23,6 19,6 4,0
–23,5 19,0 4,5 19,5 4,0

Rep. ITU-R BT.2467-1 55
PP2 PP4 PP7
Interferer level
dB
MER PLP
dB
Δ=I-MER
dB
MER PLP
dB
Δ=I-MER
dB
MER PLP
dB
Δ=I-MER
dB
–23,4 18,8 4,6 19,4 4,0
–23,3 18,7 4,6 19,3 4,0
–23,2 19,1 4,1
–23,1 19,0 4,1
–23,0 18,9 4,1 19,6 3,4
–22,7 19,2 3,5
–22,0 17,7 4,3 17,9 4,1
–21,9 17,6 4,3 17,9 4,0
–21,8 17,5 4,3 17,8 4,0
–21,7 17,4 4,3 17,7 4,0
–21,6 17,4 4,3 17,6 4,0
–21,5 17,3 4,3 17,5 4,0
–21,4 17,2 4,2 17,4 4,0
–21,3 17,4 4,0
–21,2 17,3 3,9
–21,0 17,2 3,8 17,1 3,9
–20,0 16,2 3,8 16,1 3,9
–19,9 16,1 3,8 16,0 3,9
–19,8 16,0 3,8 15,9 3,9
–19,7 15,9 3,8 15,7 4,0
–19,6 15,8 3,8 15,6 4,0
–19,5 15,7 3,8 15,5 4,0
–19,4 15,6 3,8 15,4 4,0
–19,3 15,5 3,8 15,3 4,0
–19,2 15,3 3,9 15,2 4,0
Band III measurements
Channel 9 (205.5 MHz – 7 MHz channel)
Interferer: delay 600 μs/150 μs, variable level
PP2 PP7
Guard Interval 1/8, 512 μs
Interferer 600 μs
1/128, 32 μs
Interferer 150 μs
Code Rate 3/5
2/3
3/4
3/5

56 Rep. ITU-R BT.2467-1
PP2 CR 3/5 CR 2/3 CR 3/4
Interfe
rer
level
dB
Iter.
MER
PLP
dB
BER
before
LDPC
BER
before
BCH
Iter.
MER
PLP
dB
BER
before
LDPC
BER
before
BCH
Iter.
MER
PLP
dB
BER
before
LDPC
BER
before
BCH
–40,0 1,5 33,8 9,00E-06 0,00E+00 1,4 34,0 1,00E-05 0,00E+00 1,5 34,0 1,30E-05 0,00E+00
–35,0 2,1 30,7 3,00E-05 0,00E+00 1,9 30,8 2,70E-05 0,00E+00 1,8 30,8 2,80E-05 0,00E+00
–30,0 3,8 26,5 4,00E-03 0,00E+00 3,3 26,5 4,00E-03 0,00E+00 3,2 26,5 4,00E-03 0,00E+00
–25,0 12,6 21,1 4,20E-02 0,00E+00 8,3 21,1 4,00E-02 0,00E+00 9,3 21,1 4,00E-02 0,00E+00
–23,5
16,0 19,2 5,90E-02 0,00E+00
–23,2
20,6 18,9 6,20E-02 0,00E+00
–23,1
23,8 18,8 6,30E-02 0,00E+00
–23,0
30,0 18,7 6,40E-02 1,50E-03
–22,0 24,3 17,8 7,70E-02 0,00E+00 15,6 17,8 7,70E-02 0,00E+00
–21,5
20,0 17,4 8,30E-02 0,00E+00
–21,4
21,5 17,3 8,50E-02 0,00E+00
–21,3
23,2 17,3 8,60E-02 0,00E+00
–21,2
26,0 17,2 8,70E-02 0,00E+00
–21,1
30,0 17,1 8,90E-02 7,00E-05
–21,0 32,0 17,0 9,00E-02 0,00E+00
–20,0 36,2 16,0 1,00E-01 1,00E-07
–19,9 36,3 15,9 1,00E-01 1,50E-06
–19,8 36,3 15,7 1,00E-01 1,00E-05
–19,7 36,4 15,6 1,00E-01 6,00E-05
–19,6 36,5 15,5 1,00E-01 4,00E-04
–19,5 36,5 15,4 1,00E-01 2,00E-03
–19,4 36,5 15,3 1,00E-01 7,00E-03
PP7 CR 3/5
Interferer level
dB Iteration
MER PLP
dB
BER before
LDPC
BER before
BCH
–40,0 2,7 33,9 6,40E-05 0,00E+00
–35,0 2,9 30,8 7,00E-05 0,00E+00
–30,0 4,5 26,7 4,40E-03 0,00E+00
–25,0 10,9 22,0 4,00E-02 0,00E+00
–23,0 17,0 19,5 6,20E-02 0,00E+00
–22,0 21,6 18,3 7,00E-02 0,00E+00
–21,0 28,6 17,3 8,00E-02 0,00E+00
–20,0 35,8 16,2 9,00E-02 4,90E-09
–19,5 36,3 15,5 1,00E-01 5,00E-05
–19,4 36,3 15,4 1,00E-01 7,00E-04
Remarks on Band III measurements
BER before BCH is generally equal to 0 and when it becomes greater, the failure threshold is reached.

Rep. ITU-R BT.2467-1 57
PP2
CR 3/5: 15.3 dB
CR 2/3: 17.1 dB
CR 3/4: 18.7 dB
PP7
CR 3/5: 15.4 dB
Relation between the level of the interferer and the MER PLP: Δ=Level of Interferer – MER
PP2 PP7
Interferer level
dB
MER
PLP
dB
Δ=I-MER
dB
MER
PLP
dB
Δ=I-MER
dB
–40,0 33,9 6,1 33,9 6,1
–35,0 30,8 4,2 30,8 4,2
–30,0 26,5 3,5 26,7 3,3
–25,0 21,1 3,9 22,0 3,0
–23,5 19,2 4,3
–23,2 18,9 4,3
–23,1 18,8 4,3
–23,0 18,7 4,3 19,5 3,5
–22,0 17,8 4,2 18,3 3,7
–21,5 17,4 4,1
–21,4 17,3 4,1
–21,3 17,3 4,0
–21,2 17,2 4,0
–21,1 17,1 4,0
–21,0 17,0 4,0 17,3 3,7
–20,0 16,0 4,0 16,2 3,8
–19,9 15,9 4,0
–19,8 15,7 4,1
–19,7 15,6 4,1
–19,6 15,5 4,1
–19,5 15,4 4,1 15,5 4,0
–19,4 15,3 4,1 15,4 4,0
General remarks
The results obtained in the two bands are comparable.
BER before BCH is not a useful parameter for the assessment of the quality of service.
Test in Band IV. SFN with a signal outside GI. DVB-T vs DVB-T2
Two tests were focused on the comparison between DVB-T and DVB-T2 performance in a SFN with
a signal outside GI.

58 Rep. ITU-R BT.2467-1
In the first trial only the level of the interferer was varying. In the second one, the level and the delay
have been modified.
First test
DVB-T2:
– CH 30
– 32k Not Extended
– 256 QAM
– SISO
– PP2
– Guard Interval: 1/16, 224 μs
– Code Rate: 2/3 – 34.5 Mbit/s
DVB-T:
– CH 30
– 64 QAM
– Guard Interval: 1/4, 224 μs
– Code Rate: 2/3 – 19.9 Mbit/s
SFN:
– Main signal 47 dBμV
– 2° signal: delay 8 μs, level −5 dB
– 3° signal: delay 57 μs, level −5 dB
– 4° signal: delay 148 μs, level −5 dB
– interferer: delay 234 μs (outside GI), variable level
Level
interferer
DVB-T2 DVB-T
Iteration BER before
LDPC
BER before
BCH
MER
PLP bBER aBER MER
–30.0 4.8 4.70E-03 0 30.0 1.50E-03 0 29.3
–15.0 5.0 7.00E-03 0 29.3 4.30E-03 0 25.5
–10.0 5.4 1.00E-02 0 27.9 9.00E-03 0 22.9
–5.0 6.5 2.30E-02 0 25.2 2.30E-02 9.00E-07 20.3
–3.0 7.5 3.10E-02 0 23.8 3.30E-02 1.20E-05 19.0
Second test
DVB-T2:
– CH 30
– 32k Not Extended
– 256 QAM
– SISO
– PP2
– Guard Interval: 1/16, 224 μs

Rep. ITU-R BT.2467-1 59
– Code Rate: 2/3 – 34.5 Mbit/s
DVB-T:
– CH 30
– 64 QAM
– Guard Interval: 1/4, 224 μs
– Code Rate: 2/3 – 19.9 Mbit/s
SFN:
– Main signal 47 dBμV
– 2° signal: delay 8 μs, level −5 dB
– 3° signal: delay 57 μs, level −5 dB
– 4° signal: delay 148 μs, level −5 dB
– interferer: variable delay (outside GI), variable level:
• 234 μs; −5 dB
• 244 μs; −5 dB
• 254 μs; −10 dB
• 264 μs; −15 dB
• 274 μs; −16 dB
• 284 μs; −16 dB
• 334 μs; −16 dB
• 384 μs; −18 dB
• 400 μs; −21.5 dB
• 500 μs; −21.5 dB
Interferer
delay and level
DVB-T2 DVB-T
BER
before
LDPC
BER before
BCH
MER
PLP
dB
bBER aBER MER
dB
234 μs; −5 dB 2,30E-02 0,00E+00 25,1 2,30E-02 9,00E-07 20,3
244 μs; −5 dB 3,00E-02 0,00E+00 22,3 5,70E-02 2,00E-03 17,2
254 μs; −10 dB 2,30E-02 0,00E+00 25,5 6,10E-02 2,30E-03 16,8
264 μs; −15 dB 1,30E-02 0,00E+00 27,4 5,40E-02 7,60E-04 17,2
274 μs; −16 dB 1,30E-02 0,00E+00 27,7 7,10E-02 2,60E-03 16,4
284 μs; −16 dB 1,30E-02 0,00E+00 27,0 8,70E-02 1,00E-02 15,7
334 μs; −16 dB 2,00E-02 0,00E+00 25,6 8,60E-02 1,10E-02 15,8
384 μs; −18 dB 9,40E-02 0,00E+00 13,1
400 μs; −21,5 dB 7,20E-02 0,00E+00 15,4
500 μs; −21,5 dB 8,40E-02 0,00E+00 14,0

60 Rep. ITU-R BT.2467-1
PART 2
Laboratory and field measurement results on DVB-T2 in France
1 Introduction
Following a consultation on the evolution of the terrestrial platform by the CSA end of 2017, France
is currently considering a potential migration from DVB-T to DVB-T2 before the 2024 Olympic
Games, the higher capacity provided by DVB-T2 enabling the broadcasting of UHD programmes.
Different technical subjects are being considered regarding this migration, among which the choice
of DVB-T2 profiles to “seamlessly” replace the existing DVB-T profile in use for the national
multiplexes: i.e. robustness and coverage should be maintained as they are currently so that the
operation should not lead to a loss in viewers, while maintaining the existing network architecture
and frequency plan in their current state (or at least to the state that they will be once the migration
outside of the 700 MHz band is finalized, circa June 2019).
Currently, the DVB-T configuration used in France is 8K FFT, 64-QAM 3/4 with a 1/8 guard interval
(112 µs). This configuration benefits from an 18.6 dB C/N for Ricean channel (fixed reception being
the main target) and provide around 24.8 Mbits/s capacity.
Two DVB-T2 profiles have been identified on this basis, providing similar or equal robustness:
– “C1” profile: 32k FFT, extended bandwidth, 256-QAM 3/5 PP6 with a 1/32 guard interval.
The corresponding C/N for a Ricean channel is 18 dB, and the capacity is 34.9 Mbits/s
– “C’1” profile: 32k FFT, extended bandwidth, 256-QAM 3/5 PP4 with a 1/32 guard interval.
The corresponding C/N for a Ricean channel is 18.6 dB, and the capacity is 34.2 Mbits/s
As can be seen, the main difference between those two profiles lies in the choice of the pilot pattern,
which may lead to a substantial behaviour difference when receiving the corresponding signals in a
SFN configuration, which is common in the current network architecture. Despite the small difference
in capacity between the two profiles, it might be useful for some broadcasters to be able to use the
C1 profile, in a context where UHD is considered as a strong use case.
While PP4 DVB-T2 profiles are already in use in some European countries (Finland, Germany,
Austria…) and feedback can be sought from those countries, PP6 DVB-T2 profiles do not seem to
benefit from the same interest. In consequence it was decided to investigate further the difference
between the two selected profiles at the French level.
Thus, investigations were lead both in laboratory and in the field, to have a better view of what the
two profiles can provide.
2 Laboratory measurements
To check the in-lab behaviour of receivers with respect to the two selected DVB-T2 profiles,
15 receivers from different manufacturers were examined (10 TV sets – 4 from 2014, 6 from 2018 −,
4 Set-top-boxes and 1 USB key). While all receivers were DVB-T2 compatible, only a subset of them
were HEVC compatible and yet a more reduced set UHD compatible. Since the focus of the
measurements was on RF performances, those limitations have no practical impact on the results.

Rep. ITU-R BT.2467-1 61
A first set of measurements was done to determine the basic behaviour of the receivers: sensitivity,
robustness and noise figure in the case of Gaussian channel, Ricean channel, 0 dB echo channel
(with echo inside guard interval, see below) and variable amplitude pre-echo inside the guard interval.
For this last channel type, only robustness was measured.
TABLE 2-1
0 dB echo configuration (based on Nordig requirements)
Delay Att Δf Phase Status
1st path 0 µs 0 dB 0 Hz 0° Main path
2nd path 1.95 µs 0 dB 0 Hz 0° 0 dB echo
TABLE 2-2
Variable pre-echo configuration
Delay Att Δf Status
1st path 0 µs 0 dB 0 Hz Variable pre-echo
2nd path 0 µs −1 dB 0.1 Hz
3rd path 10 µs 0 dB 2 Hz Main path
FIGURE 2-1
Channel impulse response for variable pre-echo configuration
The input level was set at −50 dBm for the robustness measurement. All measured parameters are
determined based on a QEF situation (no picture impairment for at least 30 seconds), at 514 MHz
(channel 26).

62 Rep. ITU-R BT.2467-1
TABLE 2-3
Expected vs measured parameters (worst case) for C1 profile
TABLE 2-4
Expected vs measured parameters (worst case) for C’1 profile
The two Tables above summarize the expected and measured values for each selected profile. Based
on those basic measurements, no real difference can be drawn between the two profiles, except for
the behaviour in the case of a variable pre-echo:
– Robustness and sensitivity are really close for the examined receivers for gaussian, ricean
and 0 dB echo channels.
– Measurements for the C’1 profile exhibit better than expected values (between 0.5 and 1 dB)
for gaussian and ricean channels.
– The case of 0 dB echo channel shows good behavior, bearing in mind that the examined
situation represents only a part of the full Nordig expected behavior (2nd path echo delay
should be varied between 1.95 µs and 95% of the guard interval duration).
– Variable echo results are a bit more specific
• Setting aside 2014 TV receivers and one low-end set-top-box, the remaining TV
receivers behave identically when switching from one profile to another, with a C/N close
to 22.3 dB.
• The situation is the same for 3 STB among the 4 and for the USB key.
• It is assumed that the difference lies in the AGC part of the chipset, which adapts faster
to the channel variation.
• No clear conclusion can be drawn from those results, which are specific to some difficult
receiving situations encountered in France in past DTT deployments.
The second set of measurements addressed the receivers’ behaviour in SFNs with echoes outside of
the guard interval, as the expectations were to have something similar or better to the existing DVB-T
situation. The theoretical difference between C1 and C’1 profiles lie in the equalization interval
duration, due to the difference in pilot patterns: equalization interval for the C1 profile is 133 µs while
C1 DVB-T2 Profile (Bw = 8 MHz)
Sensitivity C min -81,4 dBm -81,2 dBm -77,1 dBm -
Robustness (C/N) Min 17,8 dB 18,0 dB 22,1 dB 25,1 dB
C min -81,8 dBm -81,3 dBm -78,7 dBm
(C/N) Min 17,6 dB 18,2 dB 20,6 dB 25,3 dB
Noise figure 6,1 dB 6,0 dB 6,1 dB
Channel
256-QAM, CR = 3/5, 32 k ext, LDPC = 64k, PP6, GI = 1/32 (112 µs)Gaussian
(ETSI)
Rice
(ETSI)
0 dB Echo
(NorDig)
Variable
echo
Gaussian
(ETSI)
Rice
(ETSI)
0 dB Echo
(NorDig)
Variable
echo
Measurements
C'1 DVB-T2 Profile (Bw = 8 MHz)
Sensitivity C min -80,8 dBm -80,6 dBm -76,6 dBm -
Robustness (C/N) Min 18,4 dB 18,6 dB 22,6 dB 25,6 dB
C min -81,8 dBm -81,3 dBm -78,7 dBm
(C/N) Min 17,6 dB 18,2 dB 20,6 dB 24,0 dB
Noise figure 6,1 dB 6,0 dB 6,2 dB
Measurements
Channel
256-QAM, CR = 3/5, 32 k ext, LDPC = 64k, PP4, GI = 1/32 (112 µs)Gaussian
(ETSI)
Rice
(ETSI)
0 dB Echo
(NorDig)
Variable
echo
Gaussian
(ETSI)
Rice
(ETSI)
0 dB Echo
(NorDig)
Variable
echo

Rep. ITU-R BT.2467-1 63
it is 266 µs for the C’1 profile (considering a 57/64 ratio). For the current DVB-T French
configuration, the equalization interval is 133 µs, meaning that the C1 profile should fulfil the
requirements.
Two SFN profiles were used for the assessment of the receivers’ behaviour:
– “Simple channel” profile: the profile is composed of two paths, one main path and one
secondary path with variable delay (outside of the guard interval) / variable amplitude.
TABLE 2-5
“Simple channel” impulse response for echo outside of the guard interval
Delay Att Δf Phase Status
1st path 0 µs 0 dB 0 Hz 0° Main path
2nd path Variable
(−300 to −112,
+112 to +300 µs)
Variable 0 Hz 0° Echo outside of the
GI
The corresponding measurements are presented in Fig. 2-2: the C1/C’1 curves represent the
“envelope” characterizing the set of considered receivers, while the DVB-T curve represents the
modeled behavior for the selected French profile.
As can be seen, while theoretically equivalent to the DVB-T profile, the C1 profile presents a sharper
transition between full constructive / full destructive contribution, and hence has a risk of inducing a
loss in existing difficult DVB-T reception conditions. The C’1 profile on the contrary is more tolerant
than the DVB-T profile when the echo is between 133-260 µs. Despite these differences, the behavior
of the receivers is in line with the theoretically expected behavior for the corresponding DVB-T2
profile.
FIGURE 2-2
“Simple channel” measurement results
– “Complex channel” profile: this profile is inspired by the second SFN profile from § 4.2,
adapted to the C1 / C’1 DVB-T2 profiles. It comprises 3 paths inside the guard interval with
fixed delays / amplitude, and an additional path outside of the guard interval with variable
delay and amplitude.

64 Rep. ITU-R BT.2467-1
This channel profile has the advantage of forcing the receiver on a specific receiving window
positioning, contrary to the simple profile, which may produce “strange” results (in some cases when
presented with a simple profile, the behavior of the receiver may oscillate between good reception /
no reception for a given delay / amplitude for the echo outside of the guard interval, because the
synchronization algorithm is oscillating between two window positions).
FIGURE 2-3
“Complex channel” impulse response for echo outside of the guard interval
The corresponding measurements for the whole set of receivers are presented below, in the same way
as for the simple channel profile case. For the C1 profile, we can note a correct equalization
(fully constructive signals) when all signals lie in a ~130 µs time span; for the C’1 profile, the
equalization interval represents a ~270 µs time span, with partially constructive / fully constructive
signals depending on the echo timing. For this last profile, the behavior between pre-echo and
post-echo is non symmetrical (at least for the envelope, in the case of individual receivers it might be
variable, i.e. symmetrical or non-symmetrical behavior depending on the receiver).
FIGURE 2-4
“Complex channel” measurement results
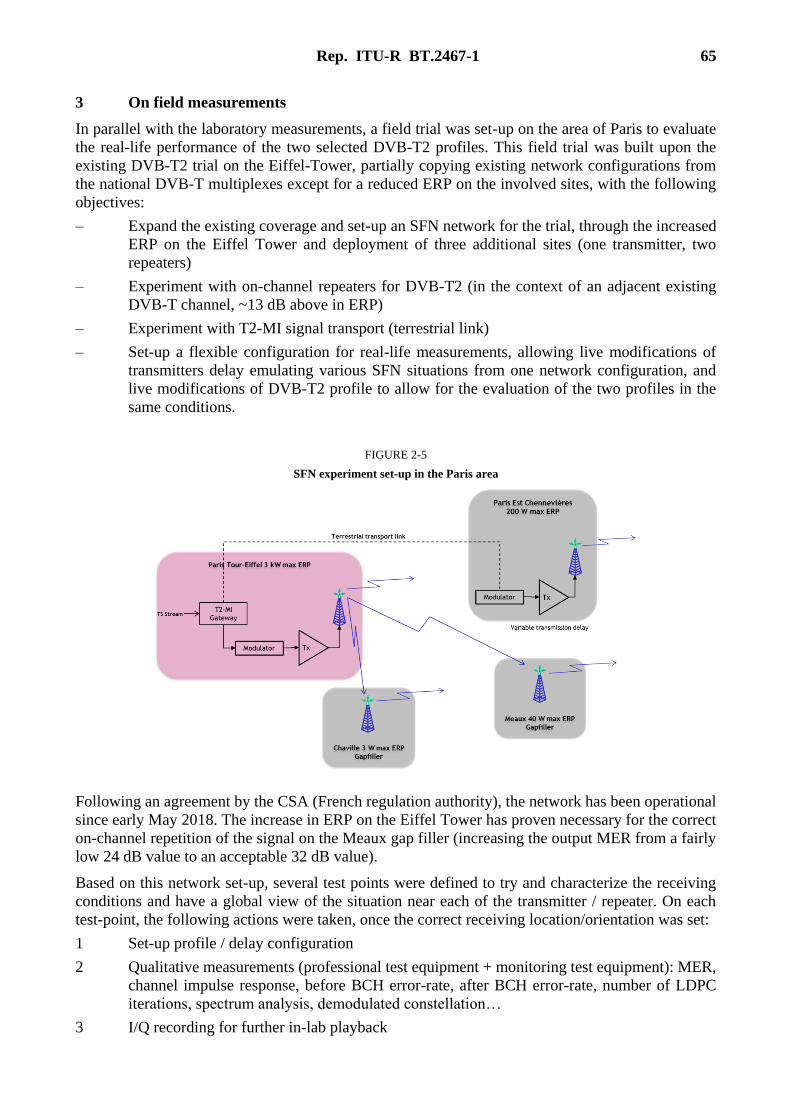
Rep. ITU-R BT.2467-1 65
3 On field measurements
In parallel with the laboratory measurements, a field trial was set-up on the area of Paris to evaluate
the real-life performance of the two selected DVB-T2 profiles. This field trial was built upon the
existing DVB-T2 trial on the Eiffel-Tower, partially copying existing network configurations from
the national DVB-T multiplexes except for a reduced ERP on the involved sites, with the following
objectives:
– Expand the existing coverage and set-up an SFN network for the trial, through the increased
ERP on the Eiffel Tower and deployment of three additional sites (one transmitter, two
repeaters)
– Experiment with on-channel repeaters for DVB-T2 (in the context of an adjacent existing
DVB-T channel, ~13 dB above in ERP)
– Experiment with T2-MI signal transport (terrestrial link)
– Set-up a flexible configuration for real-life measurements, allowing live modifications of
transmitters delay emulating various SFN situations from one network configuration, and
live modifications of DVB-T2 profile to allow for the evaluation of the two profiles in the
same conditions.
FIGURE 2-5
SFN experiment set-up in the Paris area
Following an agreement by the CSA (French regulation authority), the network has been operational
since early May 2018. The increase in ERP on the Eiffel Tower has proven necessary for the correct
on-channel repetition of the signal on the Meaux gap filler (increasing the output MER from a fairly
low 24 dB value to an acceptable 32 dB value).
Based on this network set-up, several test points were defined to try and characterize the receiving
conditions and have a global view of the situation near each of the transmitter / repeater. On each
test-point, the following actions were taken, once the correct receiving location/orientation was set:
1 Set-up profile / delay configuration
2 Qualitative measurements (professional test equipment + monitoring test equipment): MER,
channel impulse response, before BCH error-rate, after BCH error-rate, number of LDPC
iterations, spectrum analysis, demodulated constellation…
3 I/Q recording for further in-lab playback

66 Rep. ITU-R BT.2467-1
4 Quantitative measurements: assessment of reception on a dedicated TV-set, reception margin
(using an adjustable attenuator, determine the level at QEF reception failure)
5 Go-back to step 2 until all configurations are measured for the current test-point
Since the field-trial was limited in time (one week) and due to the large amount of measurements on
each test point, the initial set of 10 test-points (representing virtually 60 different receiving conditions
when varying the DVB-T2 profiles and the Chennevières transmitter delay) was in the end limited to
six test-points (see Figure below). Despite this limitation, all the expected representative delays /
profiles configurations have been covered in the timeframe.
FIGURE 2-6
Location of transmitters / test points
Tables 2-6 and 2-7 illustrate the situation for test-point 4, showing the six different configurations
examined (three different delays on Chennevières for two different DVB-T2 profiles), noting that:
– The presence of echoes outside the guard interval may decrease significantly the measured
MER, while still allowing the good reception of the signal in some cases.
– A bad MER value may still allow to benefit from a good reception margin on the signal level
in some cases.

Rep. ITU-R BT.2467-1 67
TABLE 2-6
Channel impulse response for three different delay configurations
on the Chennevières transmitter
TABLE 2-7
Corresponding measurements for the three delay configurations / 2 DVB-T2 profiles
Configuration Measurement C1 Profile C’1 Profile
All echoes
within GI
Reception level −54.7 dBm −53.4 dBm
MER 29.3 – 30.2 dB 30.9 – 31.1 dB
Reception margin 26 dB 29 dB
One echo
outside of GI
(181 µs)
Reception level −53.8 dBm −53.2 dBm
MER 20.7 – 21 dB 19.6 – 19.8 dB
Reception margin 22.9 dB 29 dB
One echo
outside GI
(311 µs)
Reception level −53.4 dBm −53.0 dBm
MER 16.7 dB 17.5 dB
Reception margin No margin
(difficult reception)
19 dB
Considering the various test-points, the conclusions of the real-life measurements are in line with lab
measurements:
– In the case of nominal SFN reception (optimal delay on Chennevières transmitter)
• No distinction is possible between the two profiles, based on the receiver behaviour
• The reception margin is similar between the two profiles on the six test-points
– In the case of a degraded SFN reception (Chennevières transmitter delay artificially changed
to have at least one echo outside of the guard interval)
• If the main path level is significantly above the level of the echo outside of the guard
interval (C/I >> 21 dB, test-points 5 & 8Bis)
– The receiver behaviour does not depend on the position of the echo outside of the
guard interval (271, 281, 401 and 411 µs).
– The reception margin is identical between the two DVB-T2 profiles, despite a
significant loss in MER for some configurations.
Meaux
T-Eiffel + Chennevières
Meaux
T-Eiffel Chennevières
T-Eiffel Chennevières
Meaux

68 Rep. ITU-R BT.2467-1
• With echoes outside the guard interval having a level close to the interference threshold
(C/I ~> 21 dB)
– With 190 and 320 µs echoes, good reception is possible.
– With a 190 µs echo, the reception margin for C1 profile is degraded (~5 dB) while
the reception margin for C’1 profile remains stable.
– With a 320 µs echo, the reception margin is degraded identically for both DVB-T2
profiles.
• With echoes above the interference threshold (C/I < 21 dB between main path and echo
out of the guard interval, points 2 and 4)
– The C’1 profile allows the good reception in most configurations (−200, 153, 283 µs
echoes). The case of a −330 µs echo leads to no reception at all.
– The C1 profile only allows a good reception for a 153 µs echo. All other echo
configurations (−330, −200, 283 µs) lead to difficult or no reception.
Annex 1
to Part 2
Professional vs monitoring DVB-T2 test equipment comparison
During the field trial, there was the opportunity to use two different DVB-T2 test equipment from
well-known manufacturers: one professional test equipment and one monitoring test equipment. Both
are bound to be used for field tests. The professional test equipment is supposedly superior in terms
of performances and remained the reference for all the measurements we conducted but as can be
seen below, the monitoring test equipment offers a fair view of the situation, despite not completely
identical to what the professional test equipment provides.
The following Tables show the comparison of the two equipment for measuring/controlling DVB-T2
signals (all measurements were done using the DVB-T2 C1 profile; no substantial differences were
observed using the C’1 profile).
TABLE 2-8
Professional vs Monitoring test equipment performances for different
input levels (no noise added)
Input Level Level MER #LDPC It Pre LDPC Post LDPC Post BCH Level MER #LDPC It Pre LDPC Post LDPC Post BCH
-50 -50,2 40,9 1,3 3,40E-06 0 0 -51,5 39,2 1 3,60E-05 0 0
-55 -55,2 38,7 1,3 3,60E-06 0 0 -56,3 39,2 1 3,80E-05 0 0
-60 -60,2 35,2 1,3 4,00E-06 0 0 -60,6 38,7 1 3,10E-05 0 0
-65 -65,1 30,9 2,2 4,90E-05 0 0 -66,6 34,6 2 4,90E-05 0 0
-70 -70,2 26 4,4 6,90E-03 0 0 -70,7 28,8 2 1,40E-03 0 0
-75 -75,2 20,9 14,7 5,10E-02 0 0 -75,7 23,5 4 2,20E-02 0 0
-78 -78,2 18,2 31,8 9,20E-02 0 0 -78,9 20,6 9 5,00E-02 0 0
-79 -79,2 17,6 36,2 1,00E-01 3,10E-07 1,00E-05 -79,7 19,7 13 6,20E-02 0 0
-80 -80,2 - - - - - -80,4 18,7 17 7,40E-02 0 0
-81 -81,2 - - - - - -81,2 17,7 25 8,70E-02 1,00E-07 0
-82 -82,2 - - - - - -82,5 16,6 36 1,00E-01 5,00E-07 0
-83 -83,2 - - - - - -83,2 15 40 - - -
Professional test equipment Monitoring test equipment

Rep. ITU-R BT.2467-1 69
The comparison between the two apparatus is quite difficult as MER values differ significantly even
for comfortable input level values. Close to the sensitivity level of the equipment, the MER value
degrades very fast. The monitoring equipment has an edge in terms of sensitivity level but is slower
when doing the measurements and/or to follow a change in the input signal characteristics.
TABLE 2-9
Professional vs Monitoring test equipment performances for different C/N values
(input level @ −50 dBm)
For sufficiently high C/N values (> 20/21 dB), the two equipment offer similar readings in terms of
MER, and bit error rates; the number of LDPC iterations is somewhat more an indication of the
situation than a usable metric. They start diverging when the C/N values come close to the specific
C/N threshold for the DVB-T2 C1 profile.
FIGURE 2-7
MER vs C/N for tested equipment
C/N Level MER #LDPC It Pre LDPC Post LDPC Post BCH Level MER #LDPC It Pre LDPC Post LDPC Post BCH
30 -50,5 29,2 2,8 4,0E-04 0 0 -51,5 29,1 1 1,0E-03 0 0
29 -50,5 28,3 3,1 1,1E-03 0 0 -51,5 28,1 2 2,2E-03 0 0
28 -50,5 27,3 3,5 2,7E-03 0 0 -51,5 27,1 2 4,3E-03 0 0
27 -50,5 26,3 4,2 5,6E-03 0 0 -51,5 26 2 7,5E-03 0 0
26 -50,5 25,3 6,4 1,0E-02 0 0 -51,5 25 3 1,2E-02 0 0
25 -50,2 24,4 7,6 1,7E-02 0 0 -51,4 23,9 4 1,9E-02 0 0
24 -50,2 23,4 9,3 2,5E-02 0 0 -51,4 22,9 4 2,7E-02 0 0
23 -50,2 22,3 11,2 3,5E-02 0 0 -51,4 21,9 6 3,7E-02 0 0
22 -50,2 21,3 13,8 4,7E-02 0 0 -51,4 21 11 4,8E-02 0 0
21 -50,2 20,2 17 5,9E-02 0 0 -51,4 20 12 6,0E-02 0 0
20 -50,2 19,3 21,5 7,2E-02 0 0 -51,4 18,9 15 7,4E-02 0 0
19 -50,2 18,5 28,3 8,6E-02 0 0 -51,4 17,8 23 8,6E-02 0 0
18 -50,2 17,9 35,8 1,0E-01 0 0 -51,4 16,8 37 1,0E-01 2,0E-07 0
17,5 -50,1 17,5 36,3 1,1E-01 2,9E-06 3,9E-04 -51,4 16,3 40 1,1E-01 1,4E-05 1,2E-02
17,3 -50,1 17,4 36,4 1,1E-01 2,0E-04 1,7E-01 -51,4 15,9 40 - - -
17 -50,2 17,2 36,5 - - - -51,4 15,5 40 - - -
Professional test equipment Monitoring test equipment

70 Rep. ITU-R BT.2467-1
PART 3
DVB-T2 VHF / UHF Trials in Sydney, Australia
1 Introduction
Australian television broadcasters have been on air using DVB-T since 2001 with coverage of over
97% of the population. DVB-T transmissions are in the 174-230 MHz and 526-694 MHz bands in
Australia.
Since the standardisation of DVB-T2 in 2009, Australian television broadcasters have been
monitoring the developments on Next Generation Digital Television Technologies which have the
potential of delivering new viewing and listening experiences to the Australian public, including
UHDTV, High Dynamic Range images and Immersive Sound.
In 2018, Australian television broadcasters and their transmission infrastructure service providers
conducted trials of the DVB-T2 system in Sydney in the state of New South Wales and the Gold
Coast in the state of Queensland. In early 2019 trials were conducted in the area between Brisbane
and the Gold Coast in the state of Queensland. These trials focused on the expanded COFDM
modulation modes available in DVB-T2 and the performance of DVB-T2 over DVB-T.
Within the context of these studies, Australian television broadcasters and their transmission
infrastructure service providers analysed some of the terminology applied to description of DVB-T2
with respect to its performance and efficiency; namely interpretation of terms applied to DVB-T2
Single Frequency Networks – extension and optimisation. For the purpose of the Australian studies,
the following definitions were applied:
DVB-T2 Extended SFN – extension of coverage and / or bit rate capacity.
DVB-T2 SFN Optimisation – optimising guard interval to address SFN synchronisation of
transmitters re self-interference and multipath interference at the receive antenna.

Rep. ITU-R BT.2467-1 71
FIGURE 3-1
Sydney DVB-T2 trial transmission sites

72 Rep. ITU-R BT.2467-1
2 DVB-T2 VHF / UHF trials in Sydney, Australia
In 2018, Australian television broadcasters and their transmission infrastructure service providers
commenced a series of DVB-T2 trials in Sydney. These trials focussed on the expanded COFDM
modulation modes available in DVB-T2 and the performance of DVB-T2 over DVB-T. The
Australian DVB-T modulation parameters are:
Australian implemented DVB-T modulation parameters
Modulation Code rate C/N Guard
interval
Data rate
7 MHz
64-QAM 3/4 20 dB 1/16 23 Mbit/s
2.1 Objectives
The overall objective of the Sydney trials was evaluation of a possible DVB-T2 system in Australia,
specifically comparing the DVB-T2 coverage and that provided by the existing DVB-T system. The
specific objectives of the trials were to:
– validate the theoretical performance characteristics of the system, particularly minimum
performance characteristics and the practicality of off-air fed Single Frequency Networks,
– validate results for a range of potential system configurations,
– validation of interoperability of multiple broadcast vendor’s systems, and
– confirm the practicality of the co-existence of DVB-T and DVB-T2 services.
Test transmissions on VHF Channel 10 (209-216 MHz) from Gore Hill tower for Greater Sydney
area commenced on 17th April 2018 at half power and 18th April 2018 at full power, and Channel 29
(533-540 MHz) low power UHF transmissions commenced on 19th April 2018 from the Manly North
Head site covering the Manly/Mosman area and on 20th April 2018 from the Kings Cross Elan
Building site covering Kings Cross. The system configuration is shown in Fig. 3-1.
DVB-T2 target modes tested for these trials were based on the following principles:
a) Significantly increasing data capacity with a compromise towards achieving same coverage
as DVB-T – Mode A
b) Achieving same coverage as DVB-T - with increased T2 data capacity – Mode B
c) Operating fixed and portable / mobile coverage multiplexed within one 7 MHz channel –
Mode C
d) An extended SFN mode with increased T2 data capacity with a compromise on achieving
same coverage – Mode D – only tested in the Laboratory.

Rep. ITU-R BT.2467-1 73
TABLE 3-1
Selected DVB-T2 transmission modes
Mode
label
FFT
E-extended
mode
GI
(µs)
Max
equalisable
echo delay*
(µs)
Pilot
pattern Modulation FEC
Payload
(Mbit/s)
C/N for
Ricean
channel
(dB)
A 16KE 1/32
(64)
76 PP7 256 QAM ¾ 38.6 22
B 32KE 1/16
(256)
304 PP4 256 QAM 2/3 32.2 20
C1 16KE 1/32
(64)
76 PP6 256 QAM 2/3 27.1 20 (Ricean)
C2 16KE 1/32
(64)
76 PP6 16 QAM ½ 2.54 9 (0 dB
Echo
channel)
D 32KE 19/256
(304)
304 PP4 256QAM 3/4 35.8 23
Signal measurements across Sydney commenced on 20th April 2018. Over 4,000 measurements were
taken across VHF and UHF transmissions.
There were 46 locations for VHF measurements in the Greater Sydney area, 31 locations for UHF
measurements for the Manly/Mosman area and 46 locations for UHF measurements for the Kings
Cross area of the three different transmission modes.
2.2 Results
This DVB-T2 trial involved in a number of “firsts”, namely these trials:
– are the first to be conducted in the VHF broadcasting services band,
– proposed a DVB-T2 coverage assessment methodology for comparison with DVB-T
coverage,
– implemented an off-air fed Single Frequency Network for the first time, and
– after initial investigation demonstrated interoperability of TV transmission equipment from
multiple vendors.
Following analysis of the DVB-T and DVB-T2 measurement data the following observations have
been made:
– DVB-T2 provides a larger range of transmission options than DVB-T.
– The DVB-T2 trials demonstrated that most current DVB-T combiners installed at sites have
spectral performance acceptable for DVB-T2 Extended Carrier Mode.
2.3 Methodology adopted for objective quality assessment of DVB-T2 coverage
One of the major discoveries in planning the DVB-T2 trials is there was not widely recognised
methodology for objective assessment of DVB-T2 signal quality and coverage. However Australian
television broadcasters identified that in Report ITU-R BT.2389 an assessment method was proposed
where BER requirements in DVB systems of the first and second generations in Table 5.1 of Report
ITU-R BT.2389 could be compared.

74 Rep. ITU-R BT.2467-1
TABLE 3-2
BER requirements in DVB systems of the first and second generations
(Table 5.1 from Report ITU-R BT.2389)
System
BER
Before Viterbi
decoder
Before Reed-Solomon
decoder
After Reed-Solomon
decoder
DVB-C – 41 10−
( )11 121 10 ..1 10− − DVB-S 2 37 10 ..7 10− − 42 10−
DVB-T
Before LDPC decoder Before BCH decoder After BCH decoder
DVB-C2
2 31 10 ..1 10− − 71 10− ( )11 121 10 ..1 10− − DVB-S2
DVB-T2
Following consultation with European broadcasters this method was applied to the objective quality
assessment of DVB-T2 in the Australian trials.
While ITU-R has yet to establish a worldwide Recommendation for objective assessment of DVBT2
signal characteristics, at its July 2019 meeting, ITU-R Study Group 6 agreed on the following
definition for a Quasi Error Free (QEF) condition of a digital television broadcasting signal – QEF
means less than one uncorrected error event per hour and a corresponding BER can be calculated
for an assumed transmission bit rate. For example, for a DTTB transmission with a bit rate of about
28 Mbit/s, QEF corresponds to BER less than 1−11 after the whole error correction process.
Which in the case of:
– DVB-T corresponds to BER less than 2 × 10⁻⁴ after Viterbi decoder or BER less than 10−11
after Reed-Solomon decoder, and
– DVB-T2 corresponds to BER less than 107 before BCH decoder or BER less than 10−11 after
BCH decoder.
The Australian DVB-T2 studies therefore applied the QEF point for DVB-T2 defined as < 1 × 10⁻⁷
post LDPC decoding.
To assist with an assessment of DVB-T2 signal quality during the Australian DVB-T2 trials,
Australian broadcasting organisations introduced analysis of the margin to failure of the DVB-T2
signals as a comparison. This was a technique applied to the European Regional Radio Conference
in 2006 for DVB-T where a lower protection margin of −3 dB was applied for DVB-T for a 90%
location probability for the case of protection against the combination of interference and noise. This
was subsequently adopted by the Australian Communications and Media Authority in its
Measurement Methodology of Analog and Digital Television Signal Coverage, ACMA DAP Field
Measurement Program 2007.
2.4 Objective quality assessment of DVB-T2 signal quality / coverage for Sydney Trials
The following graphics show how the DVB-T2 modes compare to the quasi error free (QEF) DVB-T
signals.
As expected, Mode B provided equivalent availability to the DVB-T signal, Mode A had a slightly
reduced availability and Mode C2 had an enhanced availability.

Rep. ITU-R BT.2467-1 75
An unexpected result was the reduced availability of the Mode C1 compared to both the DVB-T and
Mode B signals as this had an equivalent C/N requirement.
Gore Hill VHF Channel 10 (209-216 MHz)
Figure 3-2 represents QEF being achieved for the DVB-T reference signal at 38 measurement sites.
FIGURE 3-2
Objective quality assessment
Figure 3-3 represents QEF being achieved for the DVB-T reference signal at 38 measurement sites
with measured Receiver Margin to Failure ≥ 6 dB.
FIGURE 3-3
Signal margin to failure
Kings Cross UHF Channel 29 (533-540 MHz)
The graphics below show how the DVB-T2 modes compared to the QEF DVB-T signals.
0%
20%
40%
60%
80%
100%
120%
ABC/ Chan 12 A /Chan 10 B /Chan 10 C1 / Chan 10 C2 / Chan 10
DVB-T reference DVB-T2 DVB-T2 DVB-T2 DVB-T2
% QEF (BER) relative to DVB-T Reference
0%
20%
40%
60%
80%
100%
120%
ABC/ Chan 12 A /Chan 10 B /Chan 10 C1 / Chan 10 C2 / Chan 10
DVB-T reference DVB-T2 DVB-T2 DVB-T2 DVB-T2
% Level of margin relative to QEF DVB-T Ref

76 Rep. ITU-R BT.2467-1
As expected, Mode A had a slightly reduced availability relative to the DVB-T signal.
The enhanced availability of Mode C2 is less pronounced in this case.
An unexpected result was the reduced availability of the Modes B and C1 compared to the DVB-T at
UHF given the similar C/N requirements and the Mode B VHF performance.
Figure 3-4 represents QEF being achieved for the DVB-T reference signal at 36 measurement sites.
FIGURE 3-4
Objective quality assessment
Figure 3-5 represents QEF being achieved for the DVB-T reference signal at 36 measurement sites
with measured Receiver Margin to Failure ≥ 6 dB.
FIGURE 5
Signal margin to failure
Manly UHF Channel 29
The graphs below show how the DVB-T2 modes compared to the QEF DVB-T signals.
As expected, Mode A had a slightly reduced availability relative to the DVB-T signal.
The availability improvement of Mode C2 is not consistently evident in these measurements.
An unexpected result was the reduced availability of the Modes B and C1 compared to the DVB-T at
UHF given the similar C/N requirements and the Mode B VHF performance.
0%
20%
40%
60%
80%
100%
120%
ABC/ Chan 30 A /Chan 29 B /Chan 29 C1 / Chan 29 C2 / Chan 29
DVB-T reference DVB-T2 DVB-T2 DVB-T2 DVB-T2
% QEF (BER) relative to DVB-T Reference
0%
20%
40%
60%
80%
100%
120%
ABC/ Chan 30 A /Chan 29 B /Chan 29 C1 / Chan 29 C2 / Chan 29
DVB-T reference DVB-T2 DVB-T2 DVB-T2 DVB-T2
% Level of Margin relative to QEF DVB-T Ref

Rep. ITU-R BT.2467-1 77
Figure 3-6 represents QEF being achieved for the DVB-T reference signal at 24 measurement sites.
FIGURE 3-6
Objective quality assessment
Figure 3-7 represents QEF being achieved for the DVB-T reference signal at 24 measurement sites
with measured Receiver Margin to Failure ≥ 6 dB.
FIGURE 3-7
Signal margin to failure
0%
20%
40%
60%
80%
100%
120%
ABC/ Chan 30 A /Chan 29 B /Chan 29 C1 / Chan 29 C2 / Chan 29
DVB-T reference DVB-T2 DVB-T2 DVB-T2 DVB-T2
% QEF (BER) relative to DVB-T Reference
0%
20%
40%
60%
80%
100%
120%
ABC/ Chan 30 A /Chan 29 B /Chan 29 C1 / Chan 29 C2 / Chan 29
DVB-T reference DVB-T2 DVB-T2 DVB-T2 DVB-T2
% Level of Margin relative to QEF DVB-T Ref

78 Rep. ITU-R BT.2467-1
VHF MFN MER v Field Strength – Gore Hill
FIGURE 3-8
VHF Band III – Gore Hill Site Mode B: Field Strength Values vs MER
“o” represents a QEF signal / “×” represents a failed signal
Above 75 dBuV/m, the MER approaches the transmitter performance. Below 75 dBuV/m, the MER
is impacted by the RF channel. Signal failure indicates failure to achieve QEF or the signal failed to
decode.
UHF SFN MER v Field Strength – Manly
FIGURE 3-9
UHF Band IV – Manly Site Mode B: Field Strength Values vs MER
“o” represents a QEF signal / “×” represents a failed signal
Above 75 dBuV/m, the MER approaches the transmitter performance. Below 75 dBuV/m, the MER
is impacted by the RF channel. Signal failure indicates failure to achieve QEF or the signal failed to
decode.

Rep. ITU-R BT.2467-1 79
UHF SFN MER vs field strength – Kings Cross
FIGURE 3-10
UHF Band IV – Kings Cross Site Mode B: field strength values vs MER
“o” represents a QEF signal / “×” represents a failed signal
Inconsistent MER performance at all signal levels across both DVB-T and DVB-T2 channels maybe
due to the impact of multipath. Signal failure indicates failure to achieve QEF or the signal failed to
decode.
VHF MFN vBER (LBER) v cBER – Gore Hill Mode B
FIGURE 3-11
VHF Band III – DVB-T2 Mode B (212.5 MHz) & DVB-T (226.5 MHz) – vBER(LBER) vs cBER
“o” represents a QEF signal / “×” represents a failed signal
The DVB-T2 signals were either QEF with no BER or failed. The DVB-T signal showed some signals
with a degraded BER. This indicates that this DVB-T2 signal (Mode B) has a sharper cliff-edge than
the current DVB-T mode. Signal failure indicates failure to achieve QEF or the signal failed to
decode.

80 Rep. ITU-R BT.2467-1
UHF SFN vBER (LBER) vs cBER – Manly Mode B
FIGURE 3-12
Manly UHF Band IV – DVB-T2 Mode B (536.5 MHz) & DVB-T (543.5 MHz) – vBER(LBER) vs cBER
“o” represents a QEF signal / “×” represents a failed signal
Consistent with the VHF MFN results, the DVB-T2 signals were either QEF with 0 BER or failed.
The DVB-T signal showed some signals with a degraded BER but still adequate. This indicates that
this DVB-T2 signal (Mode B) has a sharper cliff-edge than the current DVB-T mode used. Signal
failure indicates failure to achieve QEF or the signal failed to decode.
UHF SFN vBER (LBER) vs cBER – Kings Cross Mode B
FIGURE 3-13
Kings Cross UHF Band IV – DVB-T2 Mode B (536.5 MHz) & DVB-T (543.5 MHz) – vBER vs cBER
“o” represents a QEF signal / “×” represents a failed signal
As with some of the results above a similar pattern is also demonstrated here with the DVB-T2 signals
either QEF with 0 BER or failed. The DVB-T signal showed some signals with a degraded BER but
still adequate. This indicates that this DVB-T2 signal (Mode B) has a sharper cliff-edge than the
current DVB-T mode used. Signal failure indicates failure to achieve QEF or the signal failed to
decode.

Rep. ITU-R BT.2467-1 81
2.5 Preliminary analysis of Sydney VHF / UHF trials measurement data
Preliminary analysis of measurement data indicated some locations with abnormal results required
revisits for additional measurements. A number of findings/observations made as a result of the
DVB-T2 trial were:
a) DVB-T2 can co-exist using an adjacent channel in Australia’s DVB-T designed network
using the same ERP, without introducing interference to existing services;
b) The spectral performance of most combiners in Australia’s DVB-T designed network is
expected to be adequate for operating DVB-T2 Extended Carrier modes;
c) During these trials DVB-T2 was implemented to operate with Off Air fed Single Frequency
Network as deployed throughout Australia in DVB-T. The specifications of this product are
yet to be included in any DVB-T2 transmission standards;
d) DVB-T2 Mode B provided equivalent coverage as DVB-T for VHF, with same ERP, and
e) More trials are required to confirm equivalent coverage DVB-T2 to DVB-T in the UHF band.
2.6 Next steps
a) further analysis and investigation are required to quantify the performance of DVB-T2
relative to DVB-T transmission in UHF frequencies i.e. at or above Channel 28
(526-533 MHz);
b) further investigation is required to assess the performance of multiple Physical Layer Pipes
in DVB-T2;
c) further development may be required in DVB-T2 standard to improve interoperability of
DVB-T2 transmission equipment;
d) transmission and receiver standards for DVB-T2 need to be developed to meet the
requirements of Australian television broadcasters, and
e) further testing of the theoretical improved performance of DVB-T2 in Single Frequency
Networks is required.
3 Gold Coast UHF replication trial
As a consequence of the Sydney trial results which indicated:
– analysis and investigation were required to quantify the performance of DVB-T2 relative to
DVB-T transmission in UHF frequencies i.e. at or above Channel 28 (526-533 MHz);
– investigation was required to assess the performance of multiple Physical Layer Pipes in
DVB-T2, and
– development may be required in DVB-T2 specifications to improve interoperability of DVB-
T2 transmission equipment.
To follow up from the results and the next steps of the Sydney trial, DVB-T2 test transmissions on
UHF Channel 43 (631-638 MHz) commenced on Monday 12th November from Mt Tamborine for
the Gold Coast area. Signal measurements at selected sites on the Gold Coast also commenced on
12th November which included assessment of multiple Physical Layer Pipes in DVB-T2. There were
42 locations for UHF measurements from Mt Tamborine of the DVB-T2 transmission modes.
DVB-T2 modes tested for these trials included the modes from the Sydney field trial plus added
Modes D and E. Mode D from the Sydney laboratory trials was used in the field trials. Mode E with
equivalent parameters to Mode B but operating dual PLPs – Modes E1 and E2 – to confirm effective
bit rate capacity in each PLP and signal robustness in the field.
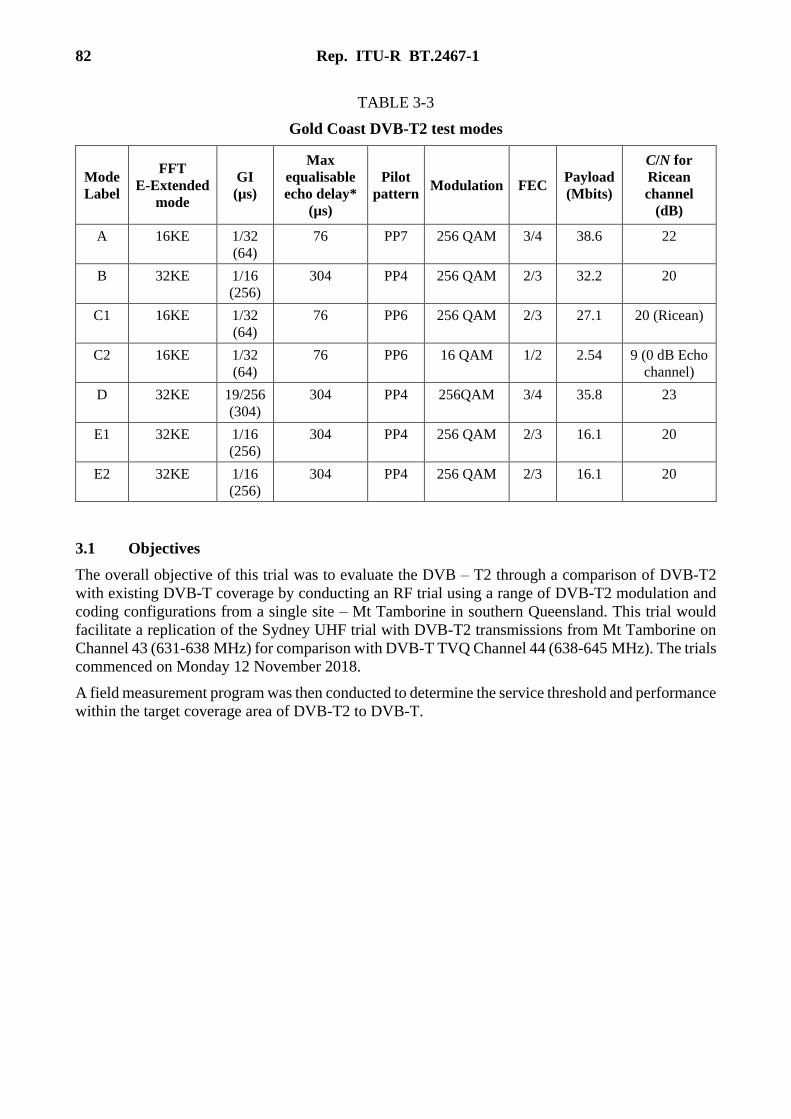
82 Rep. ITU-R BT.2467-1
TABLE 3-3
Gold Coast DVB-T2 test modes
Mode
Label
FFT
E-Extended
mode
GI
(µs)
Max
equalisable
echo delay*
(µs)
Pilot
pattern Modulation FEC
Payload
(Mbits)
C/N for
Ricean
channel
(dB)
A 16KE 1/32
(64)
76 PP7 256 QAM 3/4 38.6 22
B 32KE 1/16
(256)
304 PP4 256 QAM 2/3 32.2 20
C1 16KE 1/32
(64)
76 PP6 256 QAM 2/3 27.1 20 (Ricean)
C2 16KE 1/32
(64)
76 PP6 16 QAM 1/2 2.54 9 (0 dB Echo
channel)
D 32KE 19/256
(304)
304 PP4 256QAM 3/4 35.8 23
E1 32KE 1/16
(256)
304 PP4 256 QAM 2/3 16.1 20
E2 32KE 1/16
(256)
304 PP4 256 QAM 2/3 16.1 20
3.1 Objectives
The overall objective of this trial was to evaluate the DVB – T2 through a comparison of DVB-T2
with existing DVB-T coverage by conducting an RF trial using a range of DVB-T2 modulation and
coding configurations from a single site – Mt Tamborine in southern Queensland. This trial would
facilitate a replication of the Sydney UHF trial with DVB-T2 transmissions from Mt Tamborine on
Channel 43 (631-638 MHz) for comparison with DVB-T TVQ Channel 44 (638-645 MHz). The trials
commenced on Monday 12 November 2018.
A field measurement program was then conducted to determine the service threshold and performance
within the target coverage area of DVB-T2 to DVB-T.

Rep. ITU-R BT.2467-1 83
FIGURE 3-14
Gold Coast UHF replication trial measurement sites
To establish some common parameters between the Sydney and Gold Coast trials, the audio and
visual content from the Sydney Trial was used in the Brisbane / Gold Coast Trial.
The focus of reporting these matters was:
a) replicability of the characteristics measured and analysed in the April / June DVB-T2 Sydney
trials;
b) determining the performance of different DVB-T2 modulation modes with respect to existing
coverage of DVB-T;
c) assessing signal robustness of DVB-T2;
d) interoperability of DVB-T2 transmission equipment;
e) edge of coverage signal measurements for DVB-T and DVB-T2; and
f) any other parameters and configurations of interest.
Towards establishing replicability of the Sydney trials, the Signal Data Analysis of the Gold Coast
Trials took into consideration:
(i) the Sydney DVB-T2 raw data and reviewing the Sydney measurement campaign;
(ii) the objective assessment methodology for the Sydney trials found in Report ITU-R BT.2389,
clause 5.1, and
(iii) any other critical issues arising from the Sydney trials UHF band analysis.
The testing procedures applied were to:
– determine the minimum input C/N, where the DVB-T and DVB-T2 Test receivers could
maintain stable lock, and
– measure the receiver failure margin in noise limited testing scenarios in simulated Gaussian
and Ricean channels.

84 Rep. ITU-R BT.2467-1
3.2 Preliminary results
Preliminary analysis of measurement data indicated some eleven locations with no DVB-T signals
being decodable which required revisits for additional measurement locations.
The graphics below show how the qualitive assessment for the DVB-T2 modes compare to the
DVB-T signals.
The statistical analysis used for 3 different assessment conditions are provided in Table 3-4.
TABLE 3-4
Gold coast trials assessment conditions
DVB-T2 QEF condition compared to DVB-T QEF
DVB-T2 DVB-T
DVB-T2 QEF vs DVB-T QEF BER post LDPC ≥ Reference BER BER post Viterbi ≥ Reference BER
Reference BER = 1.00E-07 2.00E-04
DVB-T2 signal margin to failure conditions
Signal margin to failure Threshold ≥ 6 dB
Measured values
Threshold ≥ 6 dB
measured values
Signal margin to failure Threshold ≥ 6 dB
Measured values
Threshold ≥ 6 dB
predicted values
Minimum median field strength needed for location probability of 80% = 50 dBuV/m
Mt Tamborine UHF Channel 44 (638-645 MHz)
FIGURE 3-15
Objective quality assessment
Figure 3-15 represents QEF being achieved for the DVB-T2 vs DVB-T reference signal at
38 measurement sites. There were 42 measurement sites in total. DVB-T reference achieved QEF at
37 measurement sites out of the remaining 38 measurement sites. DVB-T2 Mode B also achieved
QEF at 37 measurement sites.
100.00%91.89%
100.00% 97.30% 102.70% 102.70% 100.00% 102.70%
0.00%
20.00%
40.00%
60.00%
80.00%
100.00%
120.00%
TVQ44/Chan 44
A /Chan43
B /Chan43
C1 / Chan43
C2 / Chan43
D / Chan43
E1 / Chan43
E2 / Chan43
DVB-Treference
DVB-T2 DVB-T2 DVB-T2 DVB-T2 DVB-T2 DVB-T2 DVB-T2
% QEF (BER) relative to DVB-T Reference

Rep. ITU-R BT.2467-1 85
FIGURE 3-16
Signal margin to failure
Figure 3-16 represents adequate coverage being achieved (with measured Receiver Margin to Failure
≥ 6 dB) for the DVB-T2 Vs. DVB-T reference signal at 38 measurement sites.
There were 42 measurement sites in total. DVB-T reference achieved adequate coverage at
32 measurement sites out of the remaining 38 measurement sites. DVB-T2 Mode B achieved
adequate coverage at 31 measurement sites.
100.00%90.63%
96.88% 93.75%
118.75%
93.75% 96.88% 96.88%
0.00%
20.00%
40.00%
60.00%
80.00%
100.00%
120.00%
TVQ44/Chan 44
A /Chan 43 B /Chan 43 C1 / Chan43
C2 / Chan43
D / Chan43
E1 / Chan43
E2 / Chan43
DVB-Treference
DVB-T2 DVB-T2 DVB-T2 DVB-T2 DVB-T2 DVB-T2 DVB-T2
Signal Margin to Failure

86 Rep. ITU-R BT.2467-1
UHF MER vs Field Strength – Mt Tamborine
FIGURE 3-17
UHF Band V – Mt Tamborine Site DVB-T2 Mode B: Field Strength Values vs MER
QEF – “o” : BER post LDPC decoder ≤ 1E-7 for DVB-T2 Mode B or BER post Viterbi decoder
≤ 2E-4 for DVB-T reference
NQEF – “×”: BER post LDPC decoder > 1E-7 for DVB-T2 Mode B or BER post Viterbi decoder
> 2E-4 for DVB-T reference
Red: DVB-T2 Mode B Measurement without applying signal attenuation;
Green: DVB-T2 Mode B Measurement after applying the maximum signal attenuation;
Blue: DVB-T Reference Measurement
Above 75 dBµV/m, the MER approaches the transmitter performance. Below 75 dBµV/m, the MER
is impacted by the RF channel
The DVB-T2 Mode B measurements at the professional receiver’s failure thresholds (i.e. receiver
required minimum input power) had the field strength values clustered mostly below 65 dBµV/m and
the MER values clustered mostly below 20 dB.

Rep. ITU-R BT.2467-1 87
UHF BER results for Mt Tamborine
FIGURE 3-18
UHF Band V – Mt Tamborine Site Mode B
QEF – “o” : BER post LDPC decoder ≤ 1E-7 for DVB-T2 Mode B or BER post Viterbi decoder
≤ 2E-4 for DVB-T reference
NQEF – “×”: BER post LDPC decoder >1E-7 for DVB-T2 Mode B or BER post Viterbi decoder
> 2E-4 for DVB-T reference
Red: DVB-T2 Mode B Measurement without applying signal attenuation;
Black: DVB-T2 Mode B Measurement after applying the maximum signal attenuation;
Blue: DVB-T Reference Measurement; with X dimension: BER pre Viterbi decoder; Y dimension:
BER post Viterbi decoder
The DVB-T2 signals before applying maximum signal attenuations (Red) were either QEF with no
BER (“o”) or Failed (“×”). The DVB-T2 signals after applying maximum signal attenuations (Black)
were either QEF with no BER (“o”) or Failed (“×”), with a very sharp turning point- in terms of cBER
at around 1E-1. The DVB-T2 signal (Mode B) has a sharper cliff-edge than the current DVB-T mode
used.
3.3 Observations – Overall findings
It was confirmed that DVB-T2 in extended carrier mode was compatible with another high power
DVB-T tuned combiner module.

88 Rep. ITU-R BT.2467-1
Comparative Coverage to the DVB-T signal:
a) Modes B, E1 and E2 substantially replicated the coverage provided by the comparable
DVB-T signal.
b) Modes A, C1 and D provided lesser coverage than the DVB-T signal. This is expected for
modes A and D with a higher C/N requirement. In the case of C1, it is expected to have been
the case because of the less robust Pilot Pattern used.
c) Mode C2 provided greater coverage than the DVB-T signal as expected.
Comparison between single and multiple PLPs:
a) Modes B, E1 and E2 substantially provided the same coverage and the combined Mode E
throughput was identical that of Mode B.
3.4 Comparative assessment of Sydney Trials to Gold Coast Trials
The UHF DVB-T2 coverage in this analysis better reflected the expected results than the
measurements in the Sydney trials. The ability to have a single service to confirm comparative
coverage from a single site gives confidence that Modes B and E provide equivalent coverage to the
existing DVB-T services.
The performance questions raised by the use of Mode C in the Sydney trials have been confirmed in
that the robustness of the signal using PP6 means that in realistic environments, a greater C/N
requirement is necessary.
The use of Mode E in this trial confirmed that a two PLP signal does provide equivalent coverage to
the single PLP equivalent mode.
4 Brisbane / Gold Coast Extended DVB – T2 SFN15 Trial
Australia implemented SFNs within its planning for DVB-T services commencing in 2001. Planning
and implementing SFNs could potentially be challenging due to the following:
– timing of transmissions;
– reception between transmitter sites;
– local terrain; and
– correct receive antenna installation.
With its introduction in 2009, DVB-T2 was viewed as a significant upgrade on DVB-T. One feature
of DVB-T2 which interested Australian television broadcasters was Extended SFNs. In 2018
Australian television broadcasters considered it may be appropriate to conduct a DVB-T2 Extended
SFN trial in the Brisbane TV1 licence area.
Australian broadcasters network planning for the DVB-T system in a 7 MHz channel using the 8 k
carrier mode and guard interval 1/16, provides a maximum inter transmitter distance of ~19.1 km.
This RF trial was conducted transmitting from the Gold Coast Mount Tamborine and Brisbane Mt
Coot-tha sites in a Single Frequency Network (SFN) on UHF Channel 28 (526-533 MHz). The
DVB-T2 Extended SFN trial commenced at the Mt Tamborine Site – ~ 1 400 hrs Tuesday 5th March
2019 and Mt Coot-tha Q Site – ~ 1000 hrs Wednesday 6th March 2019 and concluded at 4 pm on
Friday 5th April 2019.
15 Extended DVB-T2 SFN – the methodology for the Australian DVB-T2 Extended SFN trial focused on
extension of coverage.

Rep. ITU-R BT.2467-1 89
FIGURE 3-19
Mt Coot-tha Q-Site Tower
FIGURE 3-20
Mt Tamborine Site Tower
Mt Tamborine on the Gold Coast to Mt Coot-tha in Brisbane is a distance between sites of ~60 km.
This compares favourably with existing DVB-T SFNs in south east Queensland which have distances
of Gold Coast (22 km) and Sunshine Coast (24 km). The Mt Coot-tha site was fed via a microwave
link from Mt Tamborine.
FIGURE 3-21
Extended SFN transmission sites
4.1 Objectives
Australian television broadcasters conducted these trials of the DVB-T2 system in March 2019 where
the objective was to assess extension of digital terrestrial television coverage by testing the increased
guard interval durations of DVB-T2.

90 Rep. ITU-R BT.2467-1
The specific objectives were to determine:
a) the efficacy of the DVB-T2 standards with respect to Extended SFN Mode;
b) the suitability and interoperability of DVB-T2 equipment sourced for the Extended SFN
Mode;
c) signal coverage of DVB-T2 signals south of Brisbane;
d) signal coverage of DVB-T2 signals in the overlap area between the Gold Coast and Brisbane,
and
e) test any other parameters and configurations agreed which contribute to the studies.
DVB-T2 target modes tested for these trials were based on the following principles in UHF SFN with
link-feed inputs whilst:
a) Achieving an equivalent SFN scale as DVB-T – with significantly increasing data capacity-
Mode A;
b) Achieving an extended SFN compared to DVB-T – with increased T2 data capacity – Mode
B, and
c) Operating dual PLPs for coverage within one 7 MHz channel – Modes E1 and E2 –
to confirm effective bit rate capacity in each PLP.
The DVB-T2 Extended SFN trials applied a range of DVB-T2 modulation and coding configurations
utilising the increased guard interval, for the trials:
TABLE 3-5
DVB-T2 Modes selected for extended SFN testing
Mode
Label
FFT
E-Extended
mode
GI
(µs)
90%
of GI
(µs)
110%
of GI
(µs)
Max
Equalisable
Echo Delay*
(µs)
Pilot
Pattern Modulation FEC
Payload
(Mbit/s)
C/N for
Ricean
channel
(dB)
A 16KE 1/32
(64) 58 70 76 PP7 256 QAM 3/4 38.6 22
B 32KE 1/16
(256) 230 282 304 PP4 256 QAM 2/3 32.2 20
E1 32KE 1/16
(256) 230 282 304 PP4 256 QAM 2/3 16.1 20
E2 32KE 1/16
(256) 230 282 304 PP4 256 QAM 2/3 16.1 20

Rep. ITU-R BT.2467-1 91
FIGURE 3-22
Extended SFN measurement sites
Triangles: Transmitters in the SFN
Dots: Measurement survey sites
Red Dots: The receive antenna was pointing toward Mt Tamborine
Blue Dots: The receive antenna was pointing toward Mt Coot-tha

92 Rep. ITU-R BT.2467-1
FIGURE 3-23
Extended SFN measurement vehicle configuration

Rep. ITU-R BT.2467-1 93
FIGURE 3-24
Extended SFN survey vehicle

94 Rep. ITU-R BT.2467-1
4.2 Measurement data analysis
The graphics below show how the DVB-T2 modes in SFN scenarios compared to the MFN scenario
under each of the DVB-T2 analysis approaches, measured with the test professional receiver.
FIGURE 3-25
Objective quality assessment method
From Fig. 3-25 we can observe the coverage of the SFN is equivalent to the coverage of MFN, when
the time delay ≤ 90%GI – refer to the first, second and fourth group of the bars of Mode B/E, where
this represents 12 measurement sites (Mode B in MFN is the reference, i.e. 100% of the
12 measurement sites).
Signal margin to failure
FIGURE 3-26
Signal margin to failure method

Rep. ITU-R BT.2467-1 95
Figure 3-26 represents locations where QEF decoding is being achieved for the DVB-T2 (mode B/E1)
in the MFN at 11 measurement sites (Mode B in MFN is the reference i.e. 100% of the
12 measurement sites).
From Fig. 3-26 we can see the higher C/N required in the SFN comparing to that in MFN, as the
receiver margin to failure thresholds were reduced, when the time delay ≤ 90%GI – refer to the first,
second and fourth group of the bars of Mode B/E. The performance of the comparative single PLP
(Mode B) and multiple PLPs (Mode E1 and Mode E2) were found to be consistent.
Field strength vs MER
FIGURE 3-27
Field strength vs MER – SFN vs MFN
Figure 3-27 shows the movement trends of Field Strength Vs MER from MFN scenarios to SFN
scenarios, where the received signals have a delay of 90% Guard Interval with Mode B and passed
the QEF Assessment. The graphics below show how the DVB-T2 modes in SFN scenarios compared
to the MFN scenario.
From Fig. 3-27 we can observe that the field strength values increased at all the measurement
locations, as the aggregated received powers in SFN increased compared to those in MFN. In general,
the MER values tended to be degraded in these SFN scenarios (with Field strength > 64 dBuV/m,
SFN relative time delay 90%GI of Mode B). The impact on MER degradation was less significant
with lower field strength and lower MER (field strength < 72 dBuV/m and MER < 32 dB) compared
to the MER degradation with higher field strength and higher MER values.

96 Rep. ITU-R BT.2467-1
FIGURE 3-28
Field strength versus MER variations – SFN vs MFN
(Field strength > 64 dBuV/m)
From Fig. 3-28 it can be observed that:
a) The MER tended to degrade in all the SFN implementations relative to the MFN case.
b) The MER degradations were less significant when the relative SFN time delays were shorter
(refer to the Grey dots (< 77%GI of Mode B, i.e. ±3 ~ ±59 km) and Blue dots (≈ 90%GI of
Mode B, i.e. ±69 km). The worse MER degradations were observed with an SFN relative
delay beyond the Guard Interval (refer to the Orange dots (≈ 110%GI of Mode B,
i.e. ±84 km)).
c) The MER degradation was less significant when the Field Strength values were lower
(i.e. < 72 dBuV/m) and the relative SFN time delay was within the Guard Interval.

Rep. ITU-R BT.2467-1 97
4.3 Observations
The following key observations can be made from this extended SFN trial:
1 The transmission system worked as expected. The link fed SFN transmissions worked as
expected for Modes B and E. For Mode A, some configuration adjustments were required.
2 No SFN gain is available. Whilst the signal level increases with SFN operation, the decrease
in received MER and decrease in margin to failure indicate that there is no SFN gain available
for the modes tested. In fact, this observation indicates that an increase in required/planned
minimum signal level would be appropriate compared to MFN operation.
3 Larger SFNs are practical whilst also increasing payload. Modes B and E demonstrated that
an SFN with a larger guard interval (four times that currently used) is practical whilst also
providing an increased payload to that available in DVB-T.
4 Multiple PLP performance equivalent to single PLP. The RF performance of the single PLP
(Mode B) and the equivalent two PLP (Mode E) signals was equivalent.
5 Domestic receivers may perform better in an SFN environment than the professional receiver
used as configured.