report no. 1228 soils proficiency testing program round 28
TRANSCRIPT
SD 2.12.19
Report No. 1228
Soils Proficiency Testing Program
Round 28
January 2021
Acknowledgments
PTA wishes to gratefully acknowledge the technical assistance provided for this program by Mr Matthew McCarthy from Soil Engineering Services, Townsville, QLD. Also our thanks go to Ms Denise Weier from Soil Engineering Services, Townsville, QLD for the supply and distribution of the samples.
© Copyright Proficiency Testing Australia, 2020
PO Box 7507 SILVERWATER NSW 2128, Australia
SD 2.12.19
CONTENTS
1. FOREWORD ........................................................................................................ 1
2. FEATURES OF THE PROGRAM ......................................................................... 1
3. FORMAT OF THE APPENDICES ........................................................................ 2
4. STATISTICAL DESIGN OF THE PROGRAM ...................................................... 2
5. PTA AND TECHNICAL ADVISER’S COMMENTS ............................................... 5
6. OUTLIER RESULTS ............................................................................................ 9
7. REFERENCES ................................................................................................... 10
APPENDIX A – Results and Data Analysis
CBR 2.5 mm Uncorrected AS................................................................................... …A2
CBR 2.5 mm Corrected AS...................................................................................... …A5
CBR 5.0 mm Uncorrected AS................................................................................... …A8
CBR 5.0 mm Corrected AS....................................................................................... …A11
Achieved Dry Density Before Soaking AS……………………………………………… A14
Achieved Moisture Content Before Soaking AS……………………………………….. A17
Penetration Correction AS......................................................................................... A20
Compaction Apparatus AS……………………………………………………………….. A22
Swell Measurements AS........................................................................................... A24
Moisture Content Of The Top 30mm AS………………………………………………... A26
CBR 2.5 mm Uncorrected Q..................................................................................... A28
CBR 2.5 mm Corrected Q…...................................................................................... A29
CBR 5.0 mm Uncorrected Q..................................................................................... A30
CBR 5.0 mm Corrected Q......................................................................................... A31
Achieved Dry Density Before Soaking Q...……………………………………………… A32
Achieved Moisture Content Before Soaking Q..……………………………………….. A33
Penetration Correction Q........................................................................................... A34
Compaction Apparatus Q..……………………………………………………………….. A34

SD 2.12.19
Swell Measurements Q............................................................................................. A35
Moisture Content Of The Top 30mm Q..………………………………………………... A35 APPENDIX B – Homogeneity and Stability Testing
Homogeneity Testing................................................................................................ …B2
Stability Testing........................................................................................................ …B3
APPENDIX C – Documentation
Instructions to Participants........................................................................................ …C2
Results Sheet............................................................................................................ ….C4
1
SD 2.12.19
1. FOREWORD
This report summarises the results of a proficiency testing program on the determination of California Bearing Ratio (CBR) in Soil. It constitutes the twenty eighth round of an ongoing series of programs. This program is accredited to ISO/IEC 17043:2010 “Conformity assessment - General requirements for proficiency testing” by International Accreditation New Zealand (IANZ). The program was conducted in September 2020 - December 2020 by Proficiency Testing Australia (PTA). The aim of the program was to assess laboratories’ abilities to competently perform the prescribed analyses. The Program Coordinators were Dr Emilia Cincu and Mr Nicholas Fox and the Technical Adviser was Mr Matthew McCarthy from Soil Engineering Services, Townsville, QLD. This report was authorised by Mr Philip Briggs, PTA General Manager.
2. FEATURES OF THE PROGRAM (a) Participants were provided with one 15 - 16 kg soil sample containing road
base material. (b) A total of 58 laboratories received samples, comprising:
- 54 Australian participants; and
- 1 Overseas participants, including:
- Philippines (1). Of these 58 laboratories, 2 were unable to submit results by the due date. (c) Laboratories were provided with the Instructions to Participants and Results
Sheet (see Appendix C). Laboratories were requested to perform the tests according to their routine methods and to record their results on the Results Sheet.
(d) Prior to sample distribution, a number of randomly selected samples were
analysed for homogeneity. Based on the results of this testing (see Appendix B), the homogeneity of the samples was established.
(e) Each laboratory was randomly allocated a unique code number for the
program to ensure confidentiality of results. Reference to each laboratory in this report is by code number only. Please note that a number of laboratories reported more than one set of results and, therefore, their code numbers (with letter) could appear several times in the same data set.
2
SD 2.12.19
(f) Results (as reported by participants) with corresponding summary statistics (i.e. number of results, median, uncertainty of the median, normalised interquartile range, robust coefficient of variation, minimum, maximum and range) are presented in Appendix A (for each sample and for each of the analyses performed).
(g) A robust statistical approach, using z-scores, was utilised to assess
laboratories’ testing performance (see Section 4). Robust z-scores and z-score charts relevant to each test are presented in Appendix A.
(h) The document entitled Guide to Proficiency Testing Australia, 2019 (reference
[1]) defines the statistical terms and details the statistical procedures referred to in this report.
(i) A tabulated listing of laboratories (by code number) identified as having outlier
results can be found on page 9.
3. FORMAT OF THE APPENDICES
(a) Appendix A contains the analysis of results reported by laboratories for the
samples. This section contains the following for each determinant, where appropriate: - A table of results and calculated z-scores;
- A list of summary statistics; and
- Ordered z-score charts.
(b) Appendix B contains details of the homogeneity and stability testing. (c) Appendix C contains copies of the Instructions to Participants and Results
Sheet.
4. STATISTICAL DESIGN OF THE PROGRAM (a) Outlier Results and Z-scores In order to assess laboratories’ testing performance, a robust statistical
approach, using z-scores, was utilised. Z-scores give a measure of how far a result is from the consensus value (i.e. the median), and gives a "score" to each result relative to the other results in the group.
A z-score close to zero indicates that the result agrees well with those from
other laboratories, whereas a z-score with an absolute value greater than or
equal to 3.0 is considered to be an outlier and is marked by the symbol “§”.
3
SD 2.12.19
(b) Results Tables and Summary Statistics Each of these tables contains the results returned by each laboratory, the
method used, and the robust z-score calculated for each result. Results have been entered exactly as reported by participants. That is,
laboratories which did not report results to the precision (i.e. number of decimal places) requested on the Results Sheet have not been rounded to the requested precision before being included in the statistical analysis.
A list of summary statistics appears at the bottom of each of the tables of results and consists of:
- The number of results for that test/sample (No. of Results);
- The median of these results, i.e. the middle value (Median);
- The uncertainty of the median; a robust estimate of the standard deviation of the Median;
- The normalised interquartile range of the results (Normalised IQR);
- The robust coefficient of variation, expressed as a percentage (Robust CV) - i.e. 100 x Normalised IQR / Median;
- The minimum and maximum laboratory results; and
- The range (Maximum - Minimum).
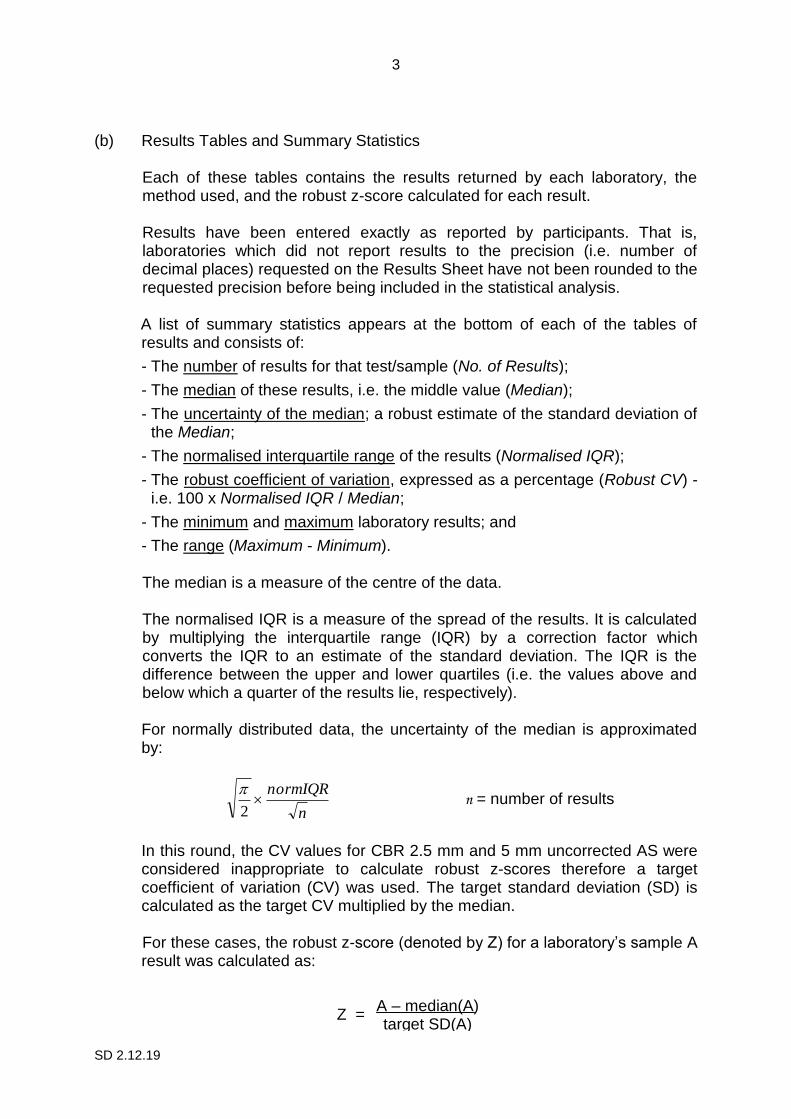
The median is a measure of the centre of the data. The normalised IQR is a measure of the spread of the results. It is calculated by multiplying the interquartile range (IQR) by a correction factor which converts the IQR to an estimate of the standard deviation. The IQR is the difference between the upper and lower quartiles (i.e. the values above and below which a quarter of the results lie, respectively). For normally distributed data, the uncertainty of the median is approximated by:
n
normIQR
2
n = number of results
In this round, the CV values for CBR 2.5 mm and 5 mm uncorrected AS were considered inappropriate to calculate robust z-scores therefore a target coefficient of variation (CV) was used. The target standard deviation (SD) is calculated as the target CV multiplied by the median.
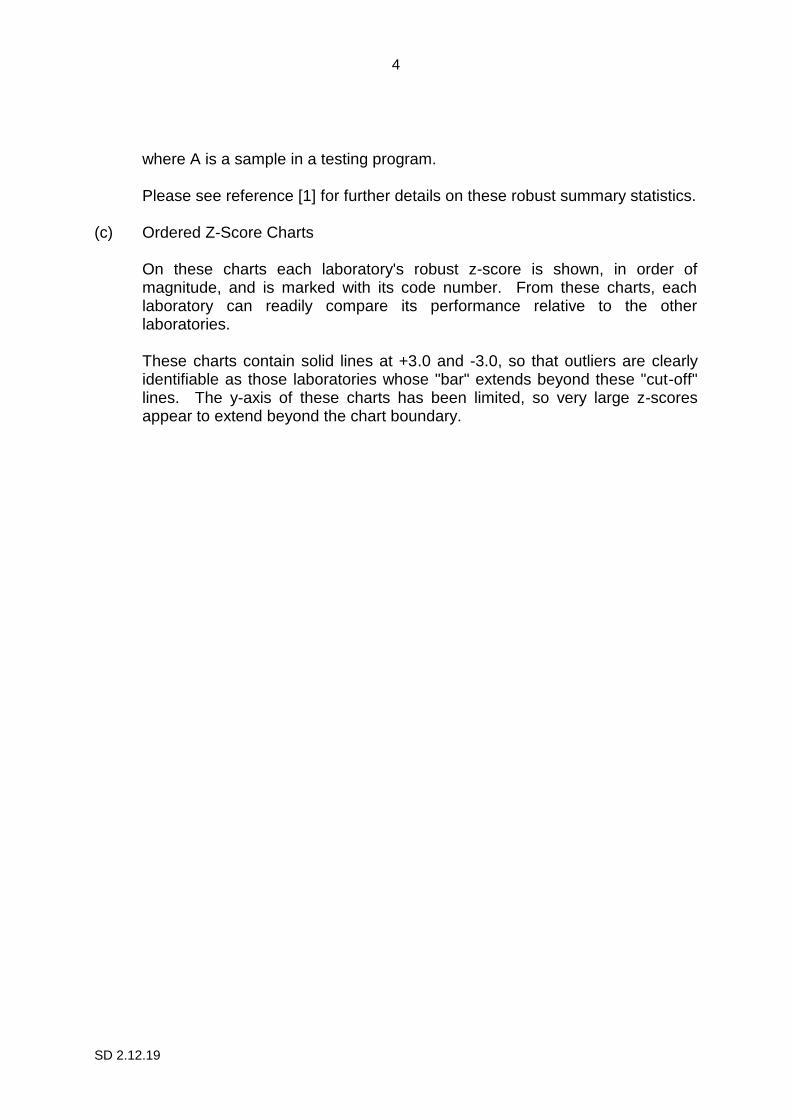
For these cases, the robust z-score (denoted by Z) for a laboratory’s sample A result was calculated as:
Z = A – median(A) target SD(A)
4
SD 2.12.19
where A is a sample in a testing program.
Please see reference [1] for further details on these robust summary statistics.
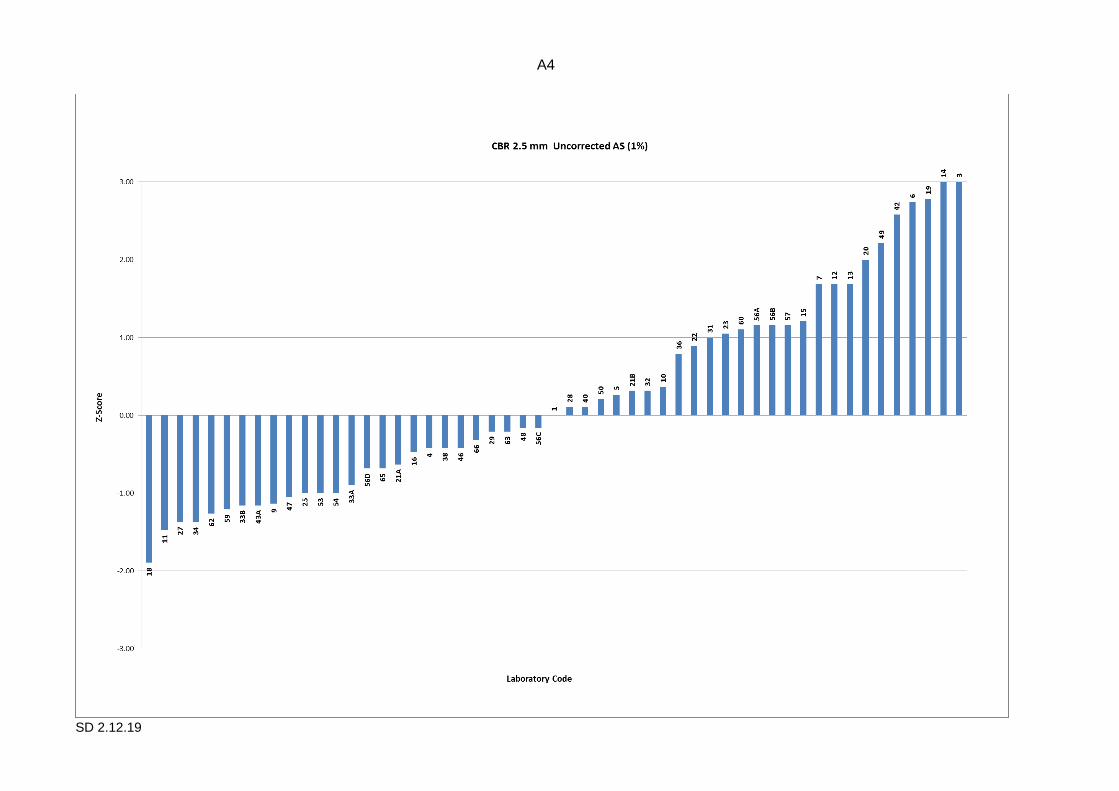
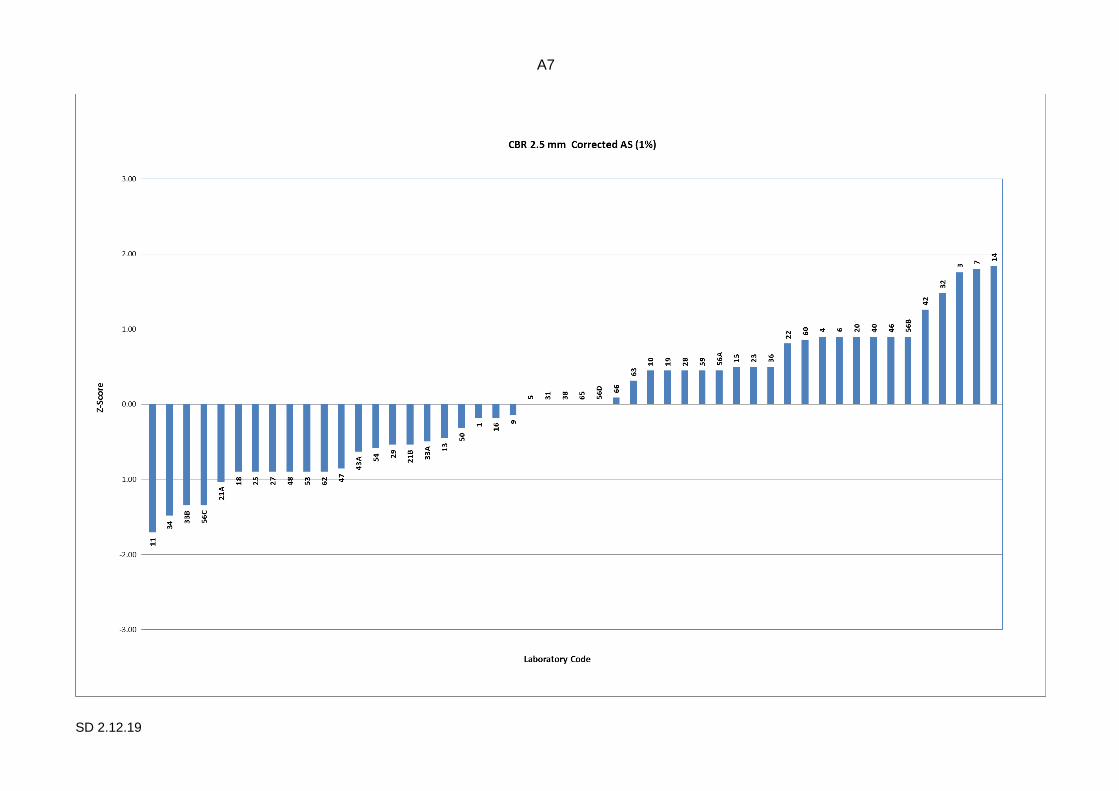
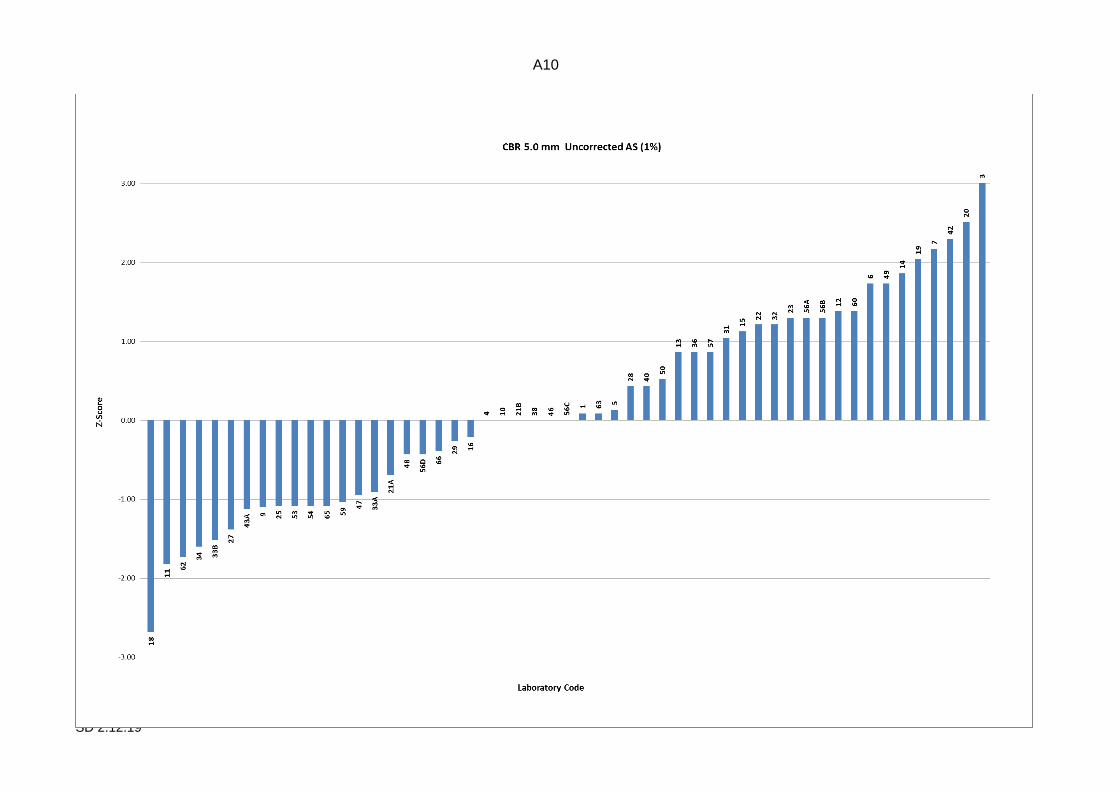
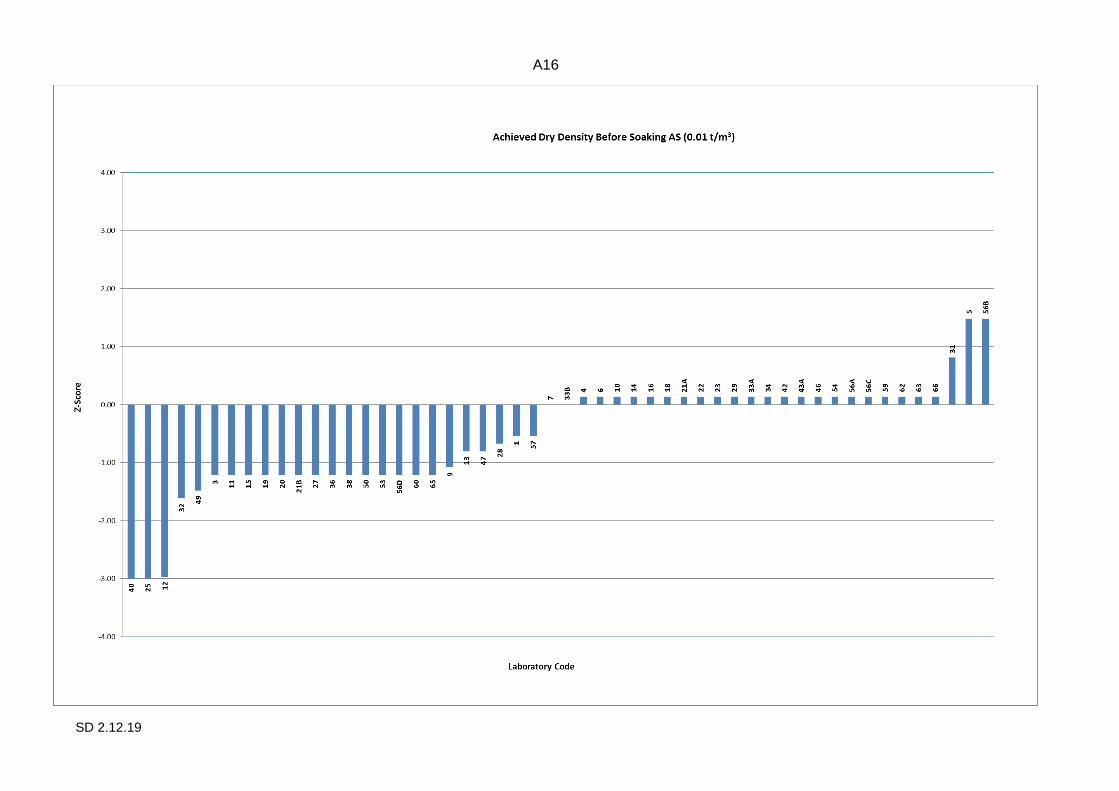
(c) Ordered Z-Score Charts On these charts each laboratory's robust z-score is shown, in order of
magnitude, and is marked with its code number. From these charts, each laboratory can readily compare its performance relative to the other laboratories.
These charts contain solid lines at +3.0 and -3.0, so that outliers are clearly
identifiable as those laboratories whose "bar" extends beyond these "cut-off" lines. The y-axis of these charts has been limited, so very large z-scores appear to extend beyond the chart boundary.

5
SD 2.12.19
The following table summarises the results submitted by participants for the program.
TABLE A: SUMMARY STATISTICS
Test No. of Results Median Normalised IQR
CBR 2.5 mm uncorrected AS
53 38.0 28.9
CBR 2.5 mm corrected AS
50 80.0 22.2
CBR 5.0 mm uncorrected AS
53 70.0 37.1
CBR 5.0 mm corrected AS
50 106.5 24.1
Achieved Dry Density AS
52 2.099 0.007
Achieved Moisture Content AS
52 9.70 0.15
CBR 2.5 mm uncorrected Q
10 32.5 20.0
CBR 2.5 mm corrected Q
9 45.0 12.2
CBR 5.0 mm uncorrected Q
10 70.5 29.2
CBR 5.0 mm corrected Q
9 76.0 21.9
Achieved Dry Density Q
10 2.098 0.009
Achieved Moisture Content Q
10 9.60 0.17
5. PTA AND TECHNICAL ADVISER’S COMMENTS Out of 58 participating laboratories (57 Australian participants and 1 overseas participant), 2 were unable to submit the results in time to be included in the final report. A total number of 10 sets of results were returned for the Q113C method. All laboratories with outliers or an absolute z-score between 2.0 and 3.0 are encouraged to review their procedures. Overall, a satisfactory level of testing was achieved by the majority of the participants. A total of 7 outliers have been identified out of 368 results, representing 1.9%. This percentage is lower than previous rounds, as presented in Table B. The spread of results is notably higher than previous rounds for AS 1289.6.1.1 but lower for Q113C, as presented in Table C. For the AS tests there were varying CVs with the CBR 2.5 mm uncorrected having a far higher CV compared to round 26. On the
6
SD 2.12.19
other hand the corrected values for CBR 2.5 mm were consistent with previous rounds. For CBR 2.5 mm uncorrected and CBR 5 mm uncorrected an average of the previous rounds were used to assign the target CV.
Laboratory code 40 recorded an initial and final value for the swell measurement. This is inconsistent with the standard as AS1289.6.1.1. mentions to take an initial reading before soaking and after the soaking is completed, place the measuring device on the marked points and take another reading. These two initial and final readings will give you the swell of the specimen as a percentage as required by both AS and Q test methods. Also note that Lab 40 used AS1289.5.1.1 and not AS1289.6.1.1 which is used for MDR testing. No explanation was provided for this decision. Laboratory code 48 reported a blunder result for Achieved Dry Density that was not considered for statistical analysis. Laboratory code 9 reported a blunder result for Achieved Moisture Control that was not considered for statistical analysis. Laboratory codes 3, 12, 13, 37 and 57 did not apply a correction to the penetration curve. All other laboratories applied a correction for the provided material. Due to surface irregularities of this type of material, correction is expected. Laboratory codes 4, 7, 19, 20, 29, 40, 48 and 56B submitted both corrected and uncorrected values, but no penetration correction values. It is recommended that in future rounds, the laboratories submit the value of the penetration correction applied. Laboratory code 49 submitted uncorrected values but no corrected ones even if a penetration correction was applied. It is recommended that in the future a corrected value is also provided. AS 1289.6.1.1 specifies that Achieved Dry Density should be within 1% of the SMDD. The analysis of the results has shown that with the exception of laboratory code 48, all other laboratories have obtained a satisfactory result for this parameter. Note that laboratory code 48 result is considered a blunder. The requirements for Achieved Moisture Content state that it should not differ from the specified moisture content (SOMC) by more than 0.5%. Laboratory codes 5 and 40 obtained Achieved Moisture Content results outside of this range, therefore their results were identified as outliers. Q113C specifies that Achieved Dry Density should not differ by more than 0.02 t/m
3
of the SMDD and Achieved Moisture Content should not differ by more than 1% of the SOMC. All laboratories have fulfilled these requirements.
Possible sources of error and suggestions for improvements Some processes to look out for may include but are not limited to: Compaction patterns and procedures Seating load at time of penetration Thickness of each layer Calibration of equipment

7
SD 2.12.19
Tester competence Software program for CBR Calculations, especially units of measurements, examination of application to
any correction applied to penetration graph Reporting and Training
Participants should take care when recording results and note the units and calculations when testing the samples.
TABLE B: COMPARISON OF PREVIOUS ROUND % OF OUTLIERS
Test Round
20
Round
22
Round
24
Round
26
Round
28
Percentage of outliers 5.6% N/A 5.0% 3.2% 1.9%
TABLE C: COMPARISON OF PREVIOUS ROUND ROBUST CVs
Test Round
20
Round
22
Round
24
Round
26
Round
28
CBR 2.5 mm uncorrected AS 55.6% 37.1% 46.8% 58.2% 76.1%
CBR 2.5 mm corrected AS 26.8% 31.8% 29.2% 20.8% 27.8%
CBR 5.0 mm uncorrected AS 31.9% 33.4% 31.3% 35.8% 53.0%
CBR 5.0 mm corrected AS 16.3% 29.0% 24.9% 15.4% 22.6%
Achieved Dry Density AS 0.3% 0.2% N/A 0.4% 0.4%
Achieved Moisture Content AS 2.8% 0.9% 1.9% 2.3% 1.5%
CBR 2.5 mm uncorrected Q N/A N/A 34.6% 76.1% 61.7%
CBR 2.5 mm corrected Q N/A N/A 38.7% 55.2% 27.2%
CBR 5.0 mm uncorrected Q N/A N/A 21.5% 46.5% 41.4%
CBR 5.0 mm corrected Q N/A N/A 34.0% 43.2% 28.8%
Achieved Dry Density Q N/A N/A N/A 0.2% 0.4%
8
SD 2.12.19
Test Round
20
Round
22
Round
24
Round
26
Round
28
Achieved Moisture Content Q N/A N/A 1.9% 3.3% 1.8%
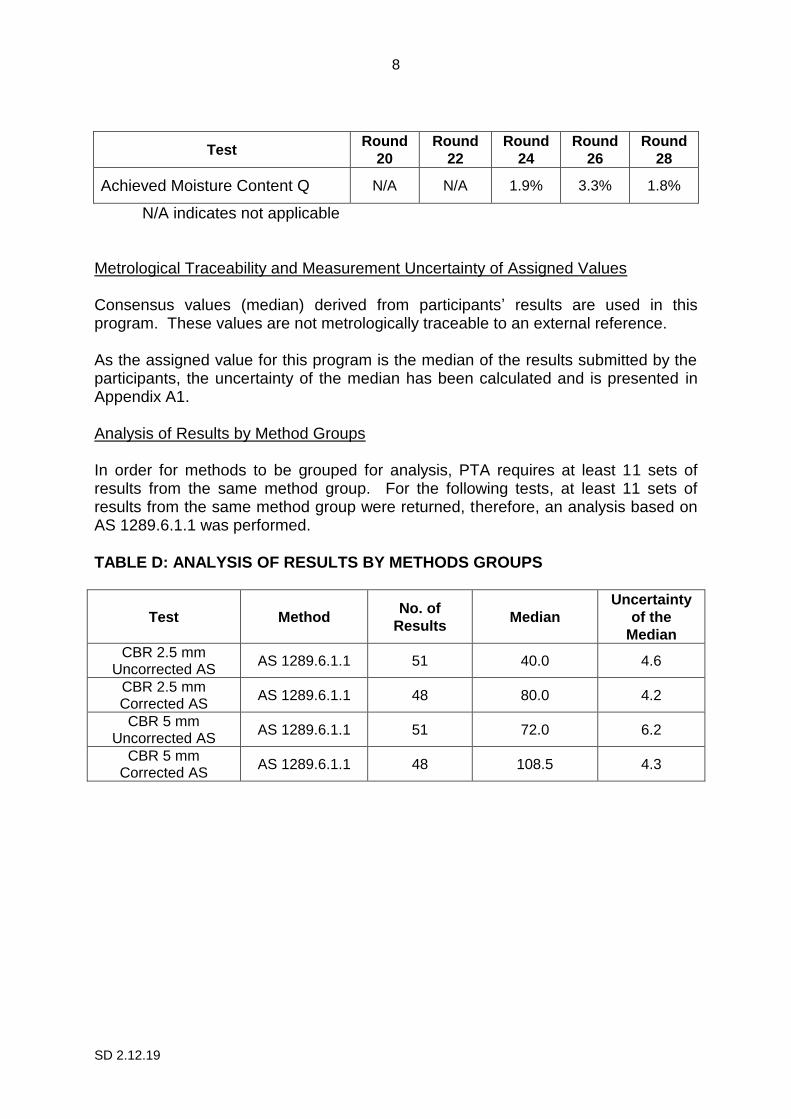
N/A indicates not applicable Metrological Traceability and Measurement Uncertainty of Assigned Values Consensus values (median) derived from participants’ results are used in this program. These values are not metrologically traceable to an external reference. As the assigned value for this program is the median of the results submitted by the participants, the uncertainty of the median has been calculated and is presented in Appendix A1. Analysis of Results by Method Groups In order for methods to be grouped for analysis, PTA requires at least 11 sets of results from the same method group. For the following tests, at least 11 sets of results from the same method group were returned, therefore, an analysis based on AS 1289.6.1.1 was performed.
TABLE D: ANALYSIS OF RESULTS BY METHODS GROUPS
Test Method No. of
Results Median
Uncertainty
of the
Median
CBR 2.5 mm Uncorrected AS
AS 1289.6.1.1 51 40.0 4.6
CBR 2.5 mm Corrected AS
AS 1289.6.1.1 48 80.0 4.2
CBR 5 mm Uncorrected AS
AS 1289.6.1.1 51 72.0 6.2
CBR 5 mm Corrected AS
AS 1289.6.1.1 48 108.5 4.3

9
SD 2.12.19
6. OUTLIER RESULTS
Laboratories reporting outlier results are listed in the following table:
TABLE E: SUMMARY OF STATISTICAL AND NON-STATISTICAL OUTLIERS
Test Laboratory
Code No.
CBR 2.5 mm uncorrected AS 3, 14
CBR 2.5 mm corrected AS -
CBR 5.0 mm uncorrected AS 3
CBR 5.0 mm corrected AS -
Achieved Dry Density AS 48
Achieved Moisture Content AS 5, 40, 9
CBR 2.5 mm uncorrected Q -
CBR 2.5 mm corrected Q -
CBR 5.0 mm uncorrected Q -
CBR 5.0 mm corrected Q -
Achieved Dry Density Q -
Achieved Moisture Content Q -
10
SD 2.12.19
7. REFERENCES
[1] Guide to Proficiency Testing Australia, 2019 (This document can be found on the PTA website, www.pta.asn.au)
[2] AS1289.6.1.1:2014 Methods of testing soils for engineering purposes
Soil strength and consolidation tests - Determination of the California Bearing Ratio of a Soil - Standard laboratory method for a remoulded specimen
[3] Q113C:2020 California Bearing Ratio of soil at nominated levels of dry
density and moisture content
A1
SD 2.12.19
APPENDIX A
Results and Data Analysis
CBR 2.5 mm Uncorrected AS................................................................................... …A2
CBR 2.5 mm Corrected AS...................................................................................... …A5
CBR 5.0 mm Uncorrected AS................................................................................... …A8
CBR 5.0 mm Corrected AS....................................................................................... …A11
Achieved Dry Density Before Soaking AS……………………………………………… A14
Achieved Moisture Content Before Soaking AS……………………………………….. A17
Penetration Correction AS......................................................................................... A20
Compaction Apparatus AS……………………………………………………………….. A22
Swell Measurements AS........................................................................................... A24
Moisture Content Of The Top 30mm AS………………………………………………... A26
CBR 2.5 mm Uncorrected Q..................................................................................... A28
CBR 2.5 mm Corrected Q…...................................................................................... A29
CBR 5.0 mm Uncorrected Q..................................................................................... A30
CBR 5.0 mm Corrected Q......................................................................................... A31
Achieved Dry Density Before Soaking Q...……………………………………………… A32
Achieved Moisture Content Before Soaking Q..……………………………………….. A33
Penetration Correction Q........................................................................................... A34
Compaction Apparatus Q..……………………………………………………………….. A34
Swell Measurements Q............................................................................................. A35
Moisture Content Of The Top 30mm Q..………………………………………………... A35
A2
SD 2.12.19
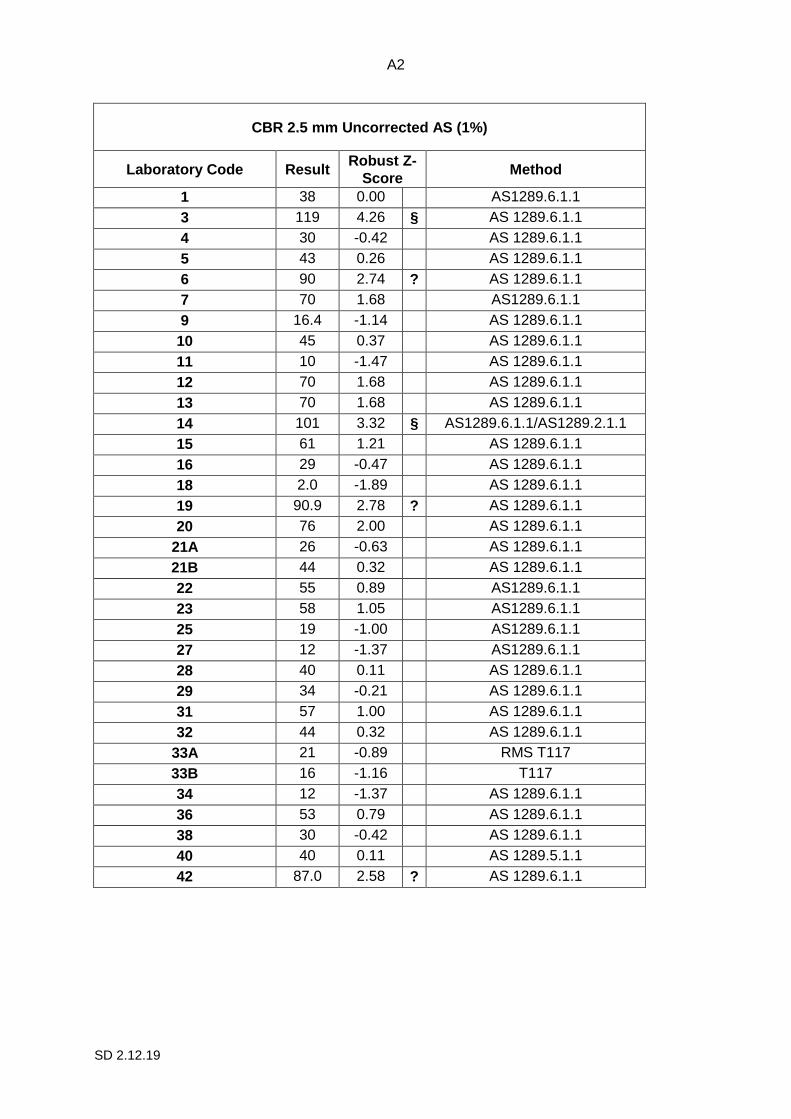
CBR 2.5 mm Uncorrected AS (1%)
Laboratory Code Result Robust Z-
Score Method
1 38 0.00 AS1289.6.1.1
3 119 4.26 § AS 1289.6.1.1
4 30 -0.42 AS 1289.6.1.1
5 43 0.26 AS 1289.6.1.1
6 90 2.74 ? AS 1289.6.1.1
7 70 1.68 AS1289.6.1.1
9 16.4 -1.14 AS 1289.6.1.1
10 45 0.37 AS 1289.6.1.1
11 10 -1.47 AS 1289.6.1.1
12 70 1.68 AS 1289.6.1.1
13 70 1.68 AS 1289.6.1.1
14 101 3.32 § AS1289.6.1.1/AS1289.2.1.1
15 61 1.21 AS 1289.6.1.1
16 29 -0.47 AS 1289.6.1.1
18 2.0 -1.89 AS 1289.6.1.1
19 90.9 2.78 ? AS 1289.6.1.1
20 76 2.00 AS 1289.6.1.1
21A 26 -0.63 AS 1289.6.1.1
21B 44 0.32 AS 1289.6.1.1
22 55 0.89 AS1289.6.1.1
23 58 1.05 AS1289.6.1.1
25 19 -1.00 AS1289.6.1.1
27 12 -1.37 AS1289.6.1.1
28 40 0.11 AS 1289.6.1.1
29 34 -0.21 AS 1289.6.1.1
31 57 1.00 AS 1289.6.1.1
32 44 0.32 AS 1289.6.1.1
33A 21 -0.89 RMS T117
33B 16 -1.16 T117
34 12 -1.37 AS 1289.6.1.1
36 53 0.79 AS 1289.6.1.1
38 30 -0.42 AS 1289.6.1.1
40 40 0.11 AS 1289.5.1.1
42 87.0 2.58 ? AS 1289.6.1.1

A3
SD 2.12.19
CBR 2.5 mm Uncorrected AS (1%)
Laboratory Code Result Robust Z-Score Method
43A 16 -1.16 AS1289.6.1.1
46 30 -0.42 AS1289.6.1.1
47 18 -1.05 AS 1289.6.1.1
48 35 -0.16 AS 1289.6.1.1
49 80 2.21 ? AS 1289.6.1.1
50 42 0.21 AS 1289.6.1.1
53 19 -1.00 AS 1289.6.1.1
54 19 -1.00 AS 1289.6.1.1
56A 60 1.16 #
56B 60 1.16 AS 1289.6.1.1
56C 35 -0.16 AS 1289.6.1.1
56D 25 -0.68 AS 1289.6.1.1
57 60 1.16 AS 1289.6.1.1
59 15 -1.21 AS 1289.6.1.1
60 59 1.11 AS 1289.6.1.1
62 14 -1.26 AS 1289.6.1.1
63 34 -0.21 AS 1289.6.1.1
65 25 -0.68 AS 1289.6.1.1
66 32 -0.32 AS 1289.6.1.1
No. of Results 53
Median 38.0
Normalised IQR 28.9
Uncertainty of the Median
5.0
Robust CV 76.1%
Target CV 50.0%
Target SD 19.00
Minimum 2
Maximum 119
Range 117
Notes:
"?" indicates an absolute z-score greater than 2.0 but less than 3, i.e. 2.0 < |z-score| < 3.0
“§” indicates an outlier, i.e. |z-score| ≥ 3.0
"#" indicates no response was provided by the laboratory
A4
SD 2.12.19
A5
SD 2.12.19
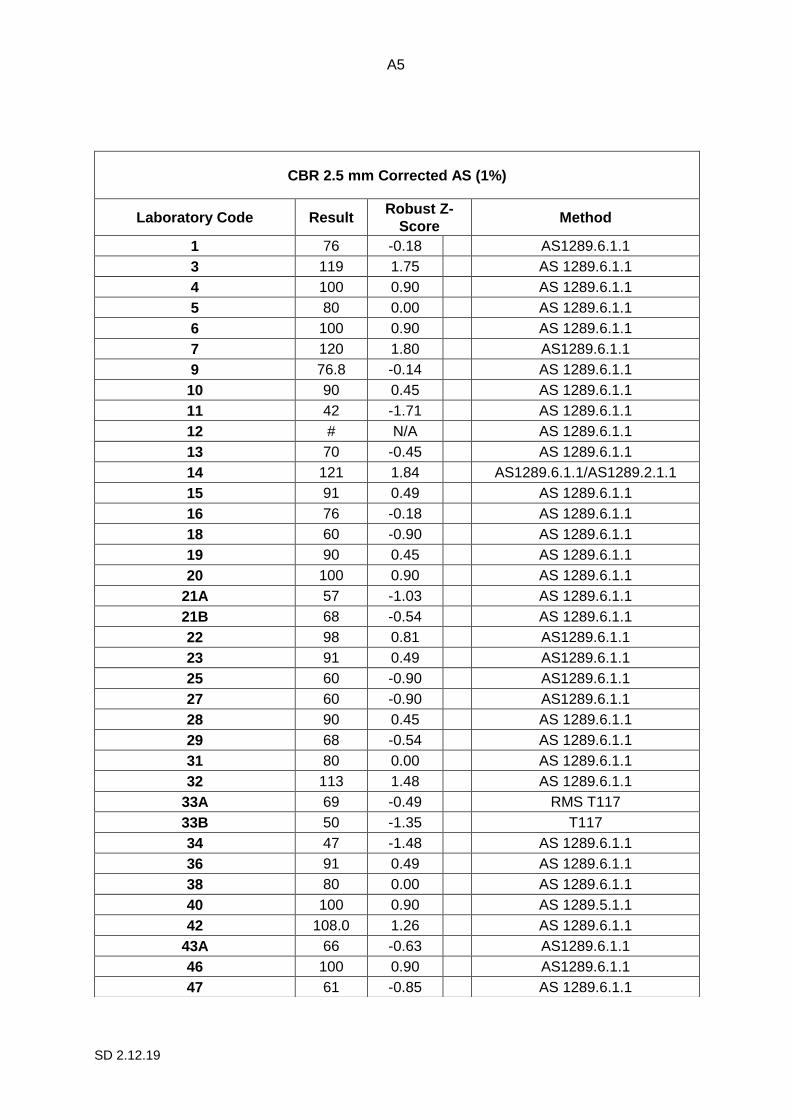
CBR 2.5 mm Corrected AS (1%)
Laboratory Code Result Robust Z-
Score Method
1 76 -0.18 AS1289.6.1.1
3 119 1.75 AS 1289.6.1.1
4 100 0.90 AS 1289.6.1.1
5 80 0.00 AS 1289.6.1.1
6 100 0.90 AS 1289.6.1.1
7 120 1.80 AS1289.6.1.1
9 76.8 -0.14 AS 1289.6.1.1
10 90 0.45 AS 1289.6.1.1
11 42 -1.71 AS 1289.6.1.1
12 # N/A AS 1289.6.1.1
13 70 -0.45 AS 1289.6.1.1
14 121 1.84 AS1289.6.1.1/AS1289.2.1.1
15 91 0.49 AS 1289.6.1.1
16 76 -0.18 AS 1289.6.1.1
18 60 -0.90 AS 1289.6.1.1
19 90 0.45 AS 1289.6.1.1
20 100 0.90 AS 1289.6.1.1
21A 57 -1.03 AS 1289.6.1.1
21B 68 -0.54 AS 1289.6.1.1
22 98 0.81 AS1289.6.1.1
23 91 0.49 AS1289.6.1.1
25 60 -0.90 AS1289.6.1.1
27 60 -0.90 AS1289.6.1.1
28 90 0.45 AS 1289.6.1.1
29 68 -0.54 AS 1289.6.1.1
31 80 0.00 AS 1289.6.1.1
32 113 1.48 AS 1289.6.1.1
33A 69 -0.49 RMS T117
33B 50 -1.35 T117
34 47 -1.48 AS 1289.6.1.1
36 91 0.49 AS 1289.6.1.1
38 80 0.00 AS 1289.6.1.1
40 100 0.90 AS 1289.5.1.1
42 108.0 1.26 AS 1289.6.1.1
43A 66 -0.63 AS1289.6.1.1
46 100 0.90 AS1289.6.1.1
47 61 -0.85 AS 1289.6.1.1
A6
SD 2.12.19
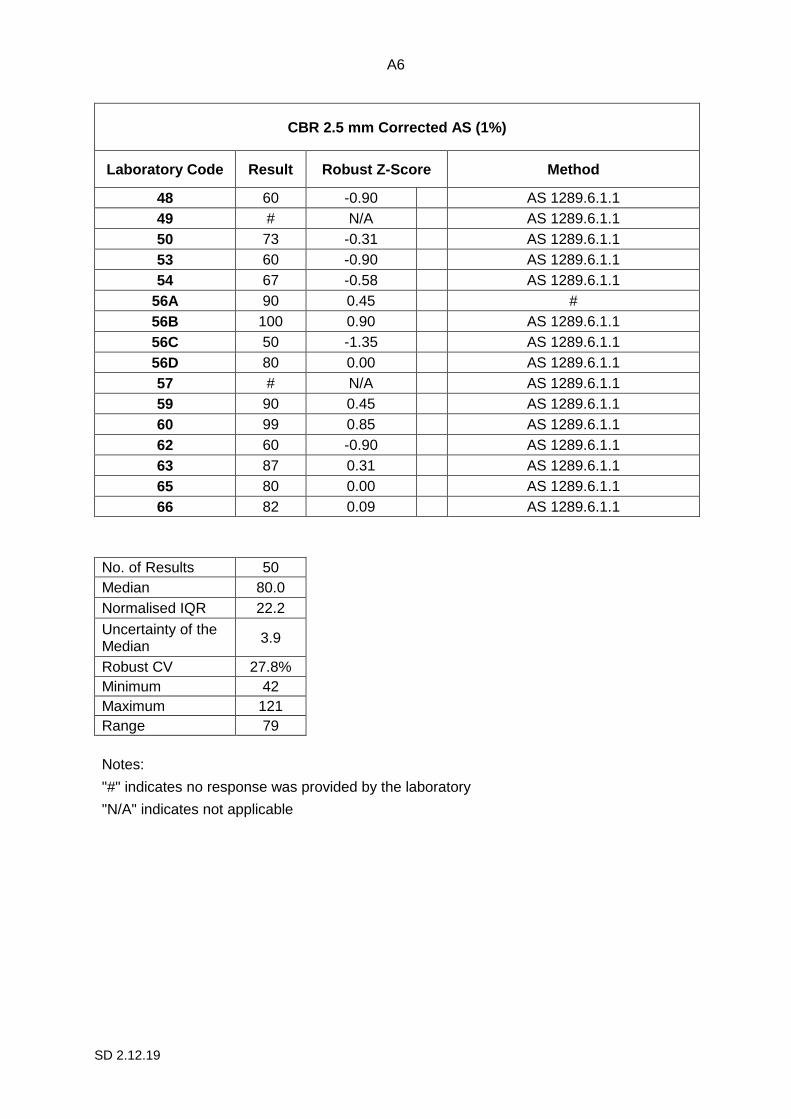
CBR 2.5 mm Corrected AS (1%)
Laboratory Code Result Robust Z-Score Method
48 60 -0.90 AS 1289.6.1.1
49 # N/A AS 1289.6.1.1
50 73 -0.31 AS 1289.6.1.1
53 60 -0.90 AS 1289.6.1.1
54 67 -0.58 AS 1289.6.1.1
56A 90 0.45 #
56B 100 0.90 AS 1289.6.1.1
56C 50 -1.35 AS 1289.6.1.1
56D 80 0.00 AS 1289.6.1.1
57 # N/A AS 1289.6.1.1
59 90 0.45 AS 1289.6.1.1
60 99 0.85 AS 1289.6.1.1
62 60 -0.90 AS 1289.6.1.1
63 87 0.31 AS 1289.6.1.1
65 80 0.00 AS 1289.6.1.1
66 82 0.09 AS 1289.6.1.1
No. of Results 50
Median 80.0
Normalised IQR 22.2
Uncertainty of the Median
3.9
Robust CV 27.8%
Minimum 42
Maximum 121
Range 79
Notes:
"#" indicates no response was provided by the laboratory
"N/A" indicates not applicable
A7
SD 2.12.19

A8
SD 2.12.19
CBR 5.0 mm Uncorrected AS (1%)
Laboratory Code Result Robust Z-Score Method
1 72 0.09 AS1289.6.1.1
3 151 3.51 § AS 1289.6.1.1
4 70 0.00 AS 1289.6.1.1
5 73 0.13 AS 1289.6.1.1
6 110 1.73 AS 1289.6.1.1
7 120 2.16 ? AS1289.6.1.1
9 44.5 -1.10 AS 1289.6.1.1
10 70 0.00 AS 1289.6.1.1
11 28 -1.82 AS 1289.6.1.1
12 102 1.39 AS 1289.6.1.1
13 90 0.87 AS 1289.6.1.1
14 113 1.86 AS1289.6.1.1/AS1289.2.1.1
15 96 1.13 AS 1289.6.1.1
16 65 -0.22 AS 1289.6.1.1
18 8 -2.68 ? AS 1289.6.1.1
19 117.2 2.04 ? AS 1289.6.1.1
20 128 2.51 ? AS 1289.6.1.1
21A 54 -0.69 AS 1289.6.1.1
21B 70 0.00 AS 1289.6.1.1
22 98 1.21 AS1289.6.1.1
23 100 1.30 AS1289.6.1.1
25 45 -1.08 AS1289.6.1.1
27 38 -1.39 AS1289.6.1.1
28 80 0.43 AS 1289.6.1.1
29 64 -0.26 AS 1289.6.1.1
31 94 1.04 AS 1289.6.1.1
32 98 1.21 AS 1289.6.1.1
33A 49 -0.91 RMS T117
33B 35 -1.52 T117
34 33 -1.60 AS 1289.6.1.1
36 90 0.87 AS 1289.6.1.1
38 70 0.00 AS 1289.6.1.1
40 80 0.43 AS 1289.5.1.1
42 123.0 2.29 ? AS 1289.6.1.1
43A 44 -1.13 AS1289.6.1.1
46 70 0.00 AS1289.6.1.1
47 48 -0.95 AS 1289.6.1.1
48 60 -0.43 AS 1289.6.1.1
49 110 1.73 AS 1289.6.1.1
A9
SD 2.12.19
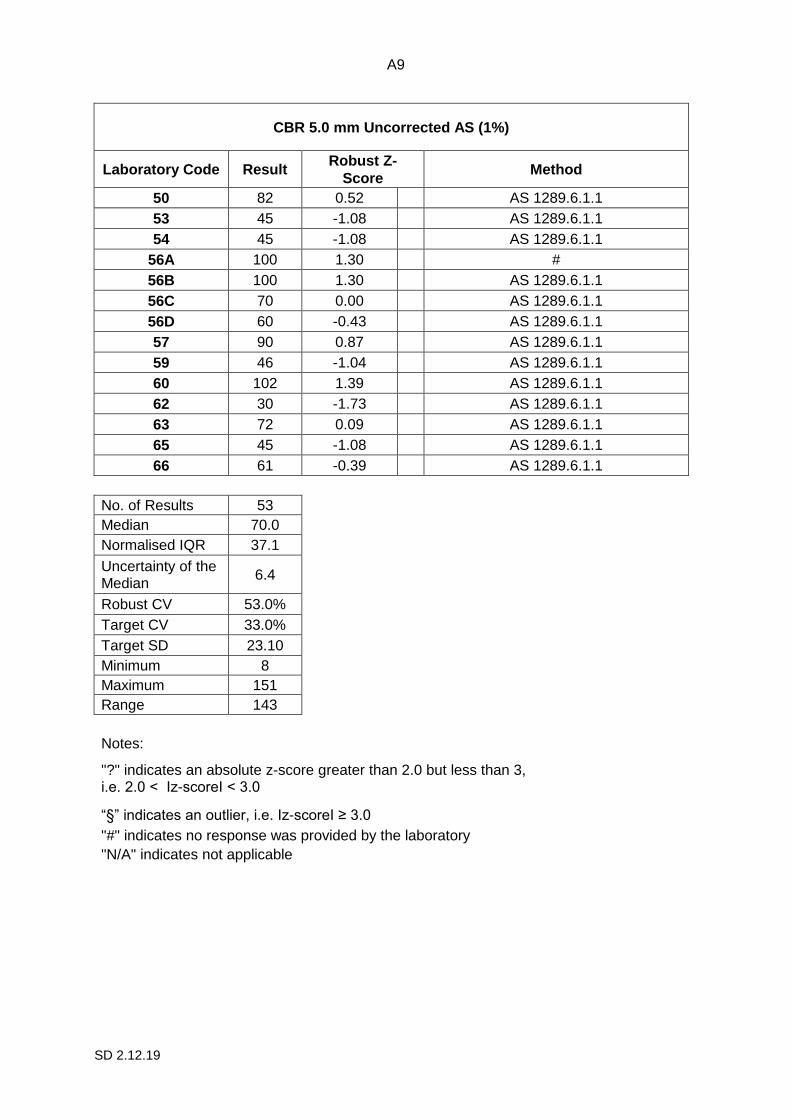
CBR 5.0 mm Uncorrected AS (1%)
Laboratory Code Result Robust Z-
Score Method
50 82 0.52 AS 1289.6.1.1
53 45 -1.08 AS 1289.6.1.1
54 45 -1.08 AS 1289.6.1.1
56A 100 1.30 #
56B 100 1.30 AS 1289.6.1.1
56C 70 0.00 AS 1289.6.1.1
56D 60 -0.43 AS 1289.6.1.1
57 90 0.87 AS 1289.6.1.1
59 46 -1.04 AS 1289.6.1.1
60 102 1.39 AS 1289.6.1.1
62 30 -1.73 AS 1289.6.1.1
63 72 0.09 AS 1289.6.1.1
65 45 -1.08 AS 1289.6.1.1
66 61 -0.39 AS 1289.6.1.1
No. of Results 53
Median 70.0
Normalised IQR 37.1
Uncertainty of the Median
6.4
Robust CV 53.0%
Target CV 33.0%
Target SD 23.10
Minimum 8
Maximum 151
Range 143
Notes:
"?" indicates an absolute z-score greater than 2.0 but less than 3, i.e. 2.0 < Ιz-scoreΙ < 3.0
“§” indicates an outlier, i.e. Ιz-scoreΙ ≥ 3.0
"#" indicates no response was provided by the laboratory
"N/A" indicates not applicable
A10
SD 2.12.19
A11
SD 2.12.19
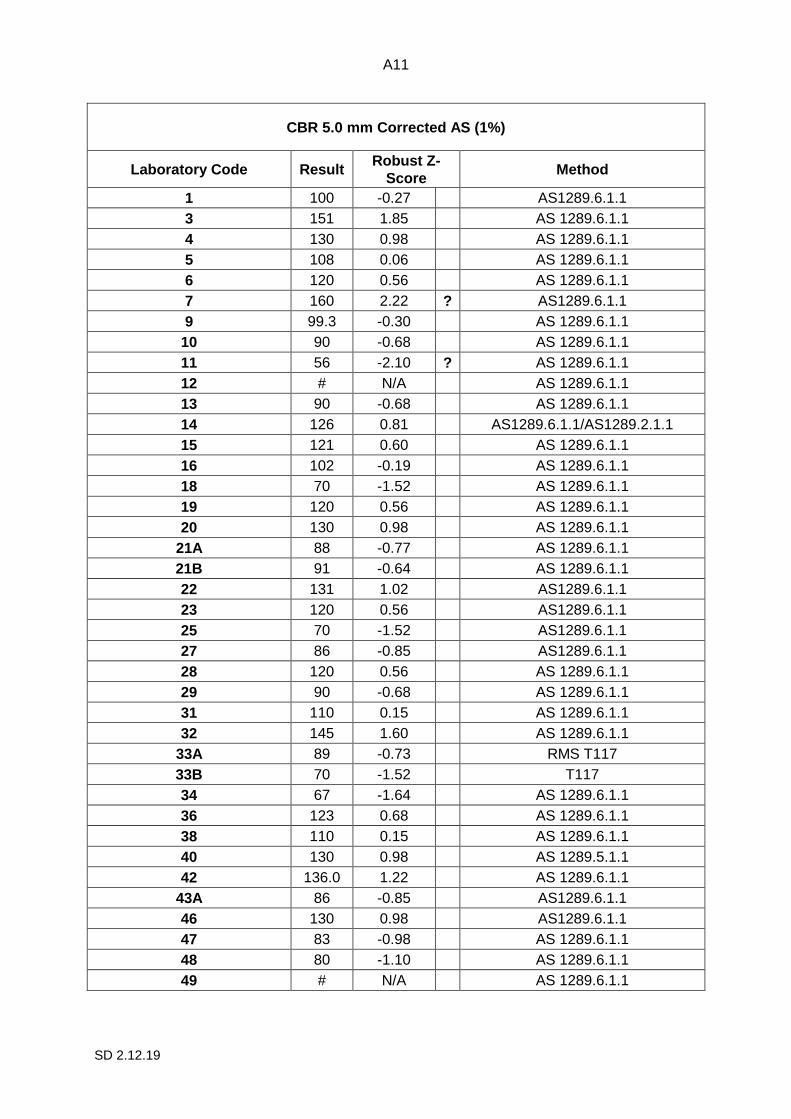
CBR 5.0 mm Corrected AS (1%)
Laboratory Code Result Robust Z-
Score Method
1 100 -0.27 AS1289.6.1.1
3 151 1.85 AS 1289.6.1.1
4 130 0.98 AS 1289.6.1.1
5 108 0.06 AS 1289.6.1.1
6 120 0.56 AS 1289.6.1.1
7 160 2.22 ? AS1289.6.1.1
9 99.3 -0.30 AS 1289.6.1.1
10 90 -0.68 AS 1289.6.1.1
11 56 -2.10 ? AS 1289.6.1.1
12 # N/A AS 1289.6.1.1
13 90 -0.68 AS 1289.6.1.1
14 126 0.81 AS1289.6.1.1/AS1289.2.1.1
15 121 0.60 AS 1289.6.1.1
16 102 -0.19 AS 1289.6.1.1
18 70 -1.52 AS 1289.6.1.1
19 120 0.56 AS 1289.6.1.1
20 130 0.98 AS 1289.6.1.1
21A 88 -0.77 AS 1289.6.1.1
21B 91 -0.64 AS 1289.6.1.1
22 131 1.02 AS1289.6.1.1
23 120 0.56 AS1289.6.1.1
25 70 -1.52 AS1289.6.1.1
27 86 -0.85 AS1289.6.1.1
28 120 0.56 AS 1289.6.1.1
29 90 -0.68 AS 1289.6.1.1
31 110 0.15 AS 1289.6.1.1
32 145 1.60 AS 1289.6.1.1
33A 89 -0.73 RMS T117
33B 70 -1.52 T117
34 67 -1.64 AS 1289.6.1.1
36 123 0.68 AS 1289.6.1.1
38 110 0.15 AS 1289.6.1.1
40 130 0.98 AS 1289.5.1.1
42 136.0 1.22 AS 1289.6.1.1
43A 86 -0.85 AS1289.6.1.1
46 130 0.98 AS1289.6.1.1
47 83 -0.98 AS 1289.6.1.1
48 80 -1.10 AS 1289.6.1.1
49 # N/A AS 1289.6.1.1

A12
SD 2.12.19
CBR 5.0 mm Corrected AS (1%)
Laboratory Code Result Robust Z-
Score Method
50 105 -0.06 AS 1289.6.1.1
53 90 -0.68 AS 1289.6.1.1
54 88 -0.77 AS 1289.6.1.1
56A 120 0.56 #
56B 120 0.56 AS 1289.6.1.1
56C 80 -1.10 AS 1289.6.1.1
56D 100 -0.27 AS 1289.6.1.1
57 # N/A AS 1289.6.1.1
59 114 0.31 AS 1289.6.1.1
60 129 0.93 AS 1289.6.1.1
62 80 -1.10 AS 1289.6.1.1
63 113 0.27 AS 1289.6.1.1
65 90 -0.68 AS 1289.6.1.1
66 109 0.10 AS 1289.6.1.1
No. of Results 50
Median 106.5
Normalised IQR 24.1
Uncertainty of the Median
4.3
Robust CV 22.6%
Minimum 56
Maximum 160
Range 104
Notes:
"?" indicates an absolute z-score greater than 2.0 but less than 3, i.e. 2.0 < Ιz-scoreΙ < 3.0 "#" indicates no response was provided by the laboratory "N/A" indicates not applicable

A13
SD 2.12.19
A14
SD 2.12.19
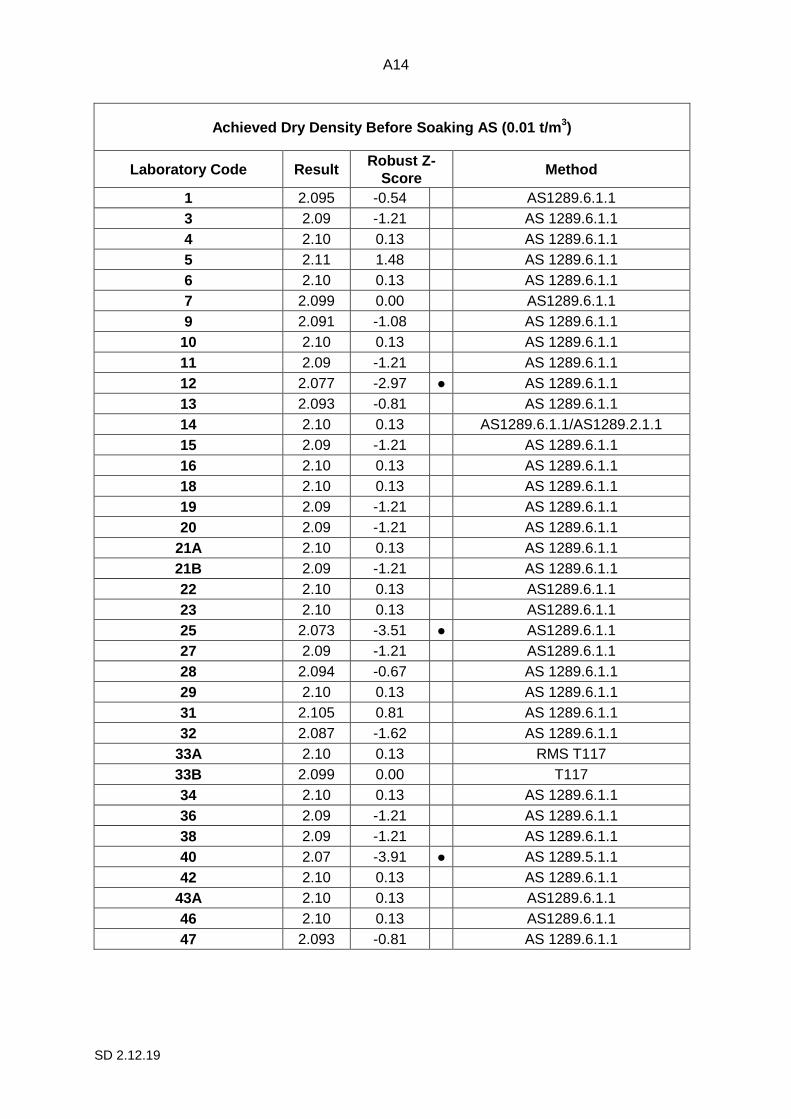
Achieved Dry Density Before Soaking AS (0.01 t/m3)
Laboratory Code Result Robust Z-
Score Method
1 2.095 -0.54 AS1289.6.1.1
3 2.09 -1.21 AS 1289.6.1.1
4 2.10 0.13 AS 1289.6.1.1
5 2.11 1.48 AS 1289.6.1.1
6 2.10 0.13 AS 1289.6.1.1
7 2.099 0.00 AS1289.6.1.1
9 2.091 -1.08 AS 1289.6.1.1
10 2.10 0.13 AS 1289.6.1.1
11 2.09 -1.21 AS 1289.6.1.1
12 2.077 -2.97 ● AS 1289.6.1.1
13 2.093 -0.81 AS 1289.6.1.1
14 2.10 0.13 AS1289.6.1.1/AS1289.2.1.1
15 2.09 -1.21 AS 1289.6.1.1
16 2.10 0.13 AS 1289.6.1.1
18 2.10 0.13 AS 1289.6.1.1
19 2.09 -1.21 AS 1289.6.1.1
20 2.09 -1.21 AS 1289.6.1.1
21A 2.10 0.13 AS 1289.6.1.1
21B 2.09 -1.21 AS 1289.6.1.1
22 2.10 0.13 AS1289.6.1.1
23 2.10 0.13 AS1289.6.1.1
25 2.073 -3.51 ● AS1289.6.1.1
27 2.09 -1.21 AS1289.6.1.1
28 2.094 -0.67 AS 1289.6.1.1
29 2.10 0.13 AS 1289.6.1.1
31 2.105 0.81 AS 1289.6.1.1
32 2.087 -1.62 AS 1289.6.1.1
33A 2.10 0.13 RMS T117
33B 2.099 0.00 T117
34 2.10 0.13 AS 1289.6.1.1
36 2.09 -1.21 AS 1289.6.1.1
38 2.09 -1.21 AS 1289.6.1.1
40 2.07 -3.91 ● AS 1289.5.1.1
42 2.10 0.13 AS 1289.6.1.1
43A 2.10 0.13 AS1289.6.1.1
46 2.10 0.13 AS1289.6.1.1
47 2.093 -0.81 AS 1289.6.1.1

A15
SD 2.12.19
Achieved Dry Density Before Soaking AS (0.01 t/m3)
Laboratory Code Result Robust Z-Score Method
48 99.6 N/A § AS 1289.6.1.1
49 2.088 -1.48 AS 1289.6.1.1
50 2.09 -1.21 AS 1289.6.1.1
53 2.09 -1.21 AS 1289.6.1.1
54 2.10 0.13 AS 1289.6.1.1
56A 2.10 0.13 #
56B 2.11 1.48 AS 1289.6.1.1
56C 2.10 0.13 AS 1289.6.1.1
56D 2.09 -1.21 AS 1289.6.1.1
57 2.095 -0.54 AS 1289.6.1.1
59 2.10 0.13 AS 1289.6.1.1
60 2.09 -1.21 AS 1289.6.1.1
62 2.10 0.13 AS 1289.6.1.1
63 2.10 0.13 AS 1289.6.1.1
65 2.09 -1.21 AS 1289.6.1.1
66 2.10 0.13 AS 1289.6.1.1
No. of Results 52
Median 2.099
Normalised IQR 0.007
Uncertainty of the Median
0.001
Robust CV 0.4%
Minimum 2.07
Maximum 2.11
Range 0.04
Notes:
"●" indicates that the result is acceptable (not an outlier) based on the requirements of the standard
“§” indicates a non-statistical outlier (blunder)
"#" indicates no response was provided by the laboratory
"N/A" indicates not applicable
A16
SD 2.12.19
A17
SD 2.12.19
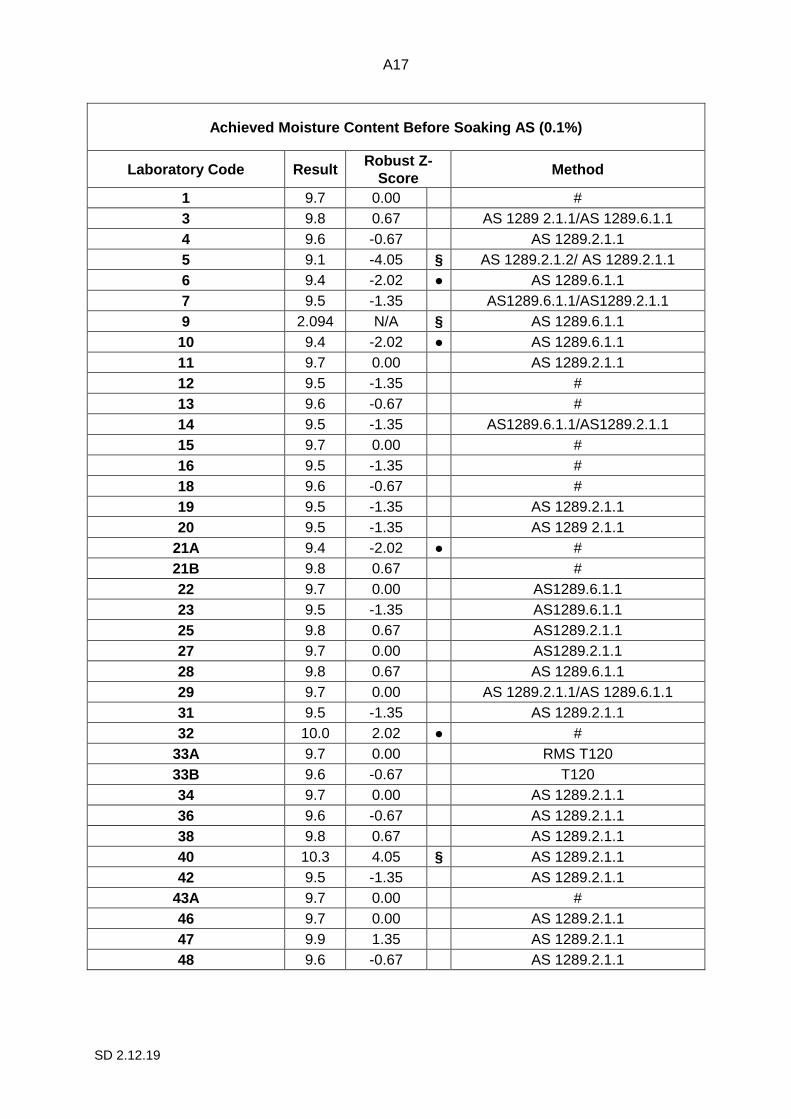
Achieved Moisture Content Before Soaking AS (0.1%)
Laboratory Code Result Robust Z-
Score Method
1 9.7 0.00 #
3 9.8 0.67 AS 1289 2.1.1/AS 1289.6.1.1
4 9.6 -0.67 AS 1289.2.1.1
5 9.1 -4.05 § AS 1289.2.1.2/ AS 1289.2.1.1
6 9.4 -2.02 ● AS 1289.6.1.1
7 9.5 -1.35 AS1289.6.1.1/AS1289.2.1.1
9 2.094 N/A § AS 1289.6.1.1
10 9.4 -2.02 ● AS 1289.6.1.1
11 9.7 0.00 AS 1289.2.1.1
12 9.5 -1.35 #
13 9.6 -0.67 #
14 9.5 -1.35 AS1289.6.1.1/AS1289.2.1.1
15 9.7 0.00 #
16 9.5 -1.35 #
18 9.6 -0.67 #
19 9.5 -1.35 AS 1289.2.1.1
20 9.5 -1.35 AS 1289 2.1.1
21A 9.4 -2.02 ● #
21B 9.8 0.67 #
22 9.7 0.00 AS1289.6.1.1
23 9.5 -1.35 AS1289.6.1.1
25 9.8 0.67 AS1289.2.1.1
27 9.7 0.00 AS1289.2.1.1
28 9.8 0.67 AS 1289.6.1.1
29 9.7 0.00 AS 1289.2.1.1/AS 1289.6.1.1
31 9.5 -1.35 AS 1289.2.1.1
32 10.0 2.02 ● #
33A 9.7 0.00 RMS T120
33B 9.6 -0.67 T120
34 9.7 0.00 AS 1289.2.1.1
36 9.6 -0.67 AS 1289.2.1.1
38 9.8 0.67 AS 1289.2.1.1
40 10.3 4.05 § AS 1289.2.1.1
42 9.5 -1.35 AS 1289.2.1.1
43A 9.7 0.00 #
46 9.7 0.00 AS 1289.2.1.1
47 9.9 1.35 AS 1289.2.1.1
48 9.6 -0.67 AS 1289.2.1.1
A18
SD 2.12.19
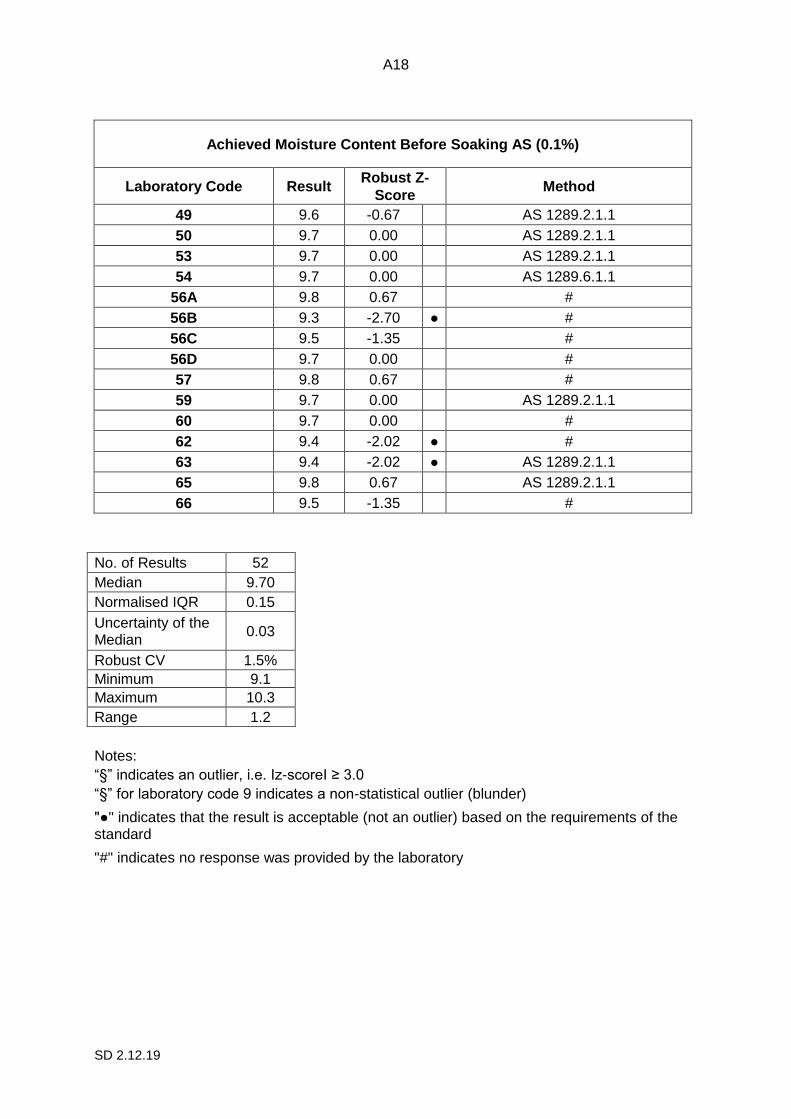
Achieved Moisture Content Before Soaking AS (0.1%)
Laboratory Code Result Robust Z-
Score Method
49 9.6 -0.67 AS 1289.2.1.1
50 9.7 0.00 AS 1289.2.1.1
53 9.7 0.00 AS 1289.2.1.1
54 9.7 0.00 AS 1289.6.1.1
56A 9.8 0.67 #
56B 9.3 -2.70 ● #
56C 9.5 -1.35 #
56D 9.7 0.00 #
57 9.8 0.67 #
59 9.7 0.00 AS 1289.2.1.1
60 9.7 0.00 #
62 9.4 -2.02 ● #
63 9.4 -2.02 ● AS 1289.2.1.1
65 9.8 0.67 AS 1289.2.1.1
66 9.5 -1.35 #
No. of Results 52
Median 9.70
Normalised IQR 0.15
Uncertainty of the Median
0.03
Robust CV 1.5%
Minimum 9.1
Maximum 10.3
Range 1.2
Notes:
“§” indicates an outlier, i.e. Ιz-scoreΙ ≥ 3.0
“§” for laboratory code 9 indicates a non-statistical outlier (blunder)
"●" indicates that the result is acceptable (not an outlier) based on the requirements of the standard
"#" indicates no response was provided by the laboratory

A19
SD 2.12.19
A20
SD 2.12.19
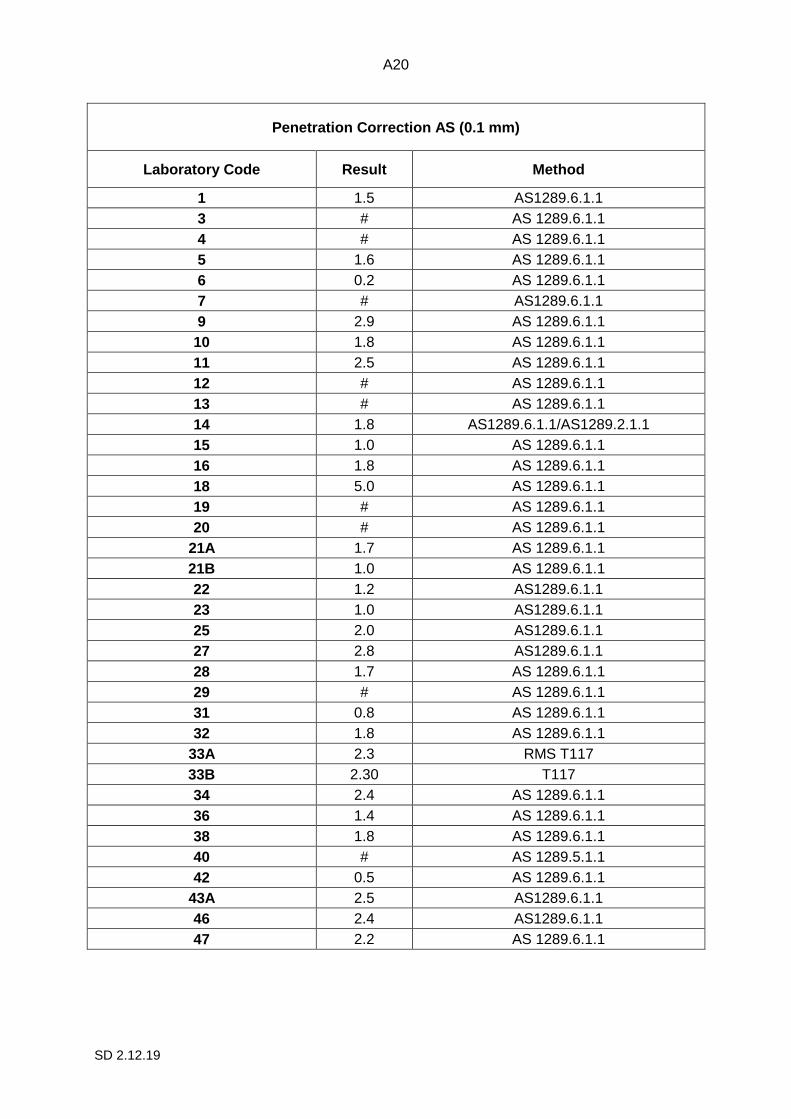
Penetration Correction AS (0.1 mm)
Laboratory Code Result Method
1 1.5 AS1289.6.1.1
3 # AS 1289.6.1.1
4 # AS 1289.6.1.1
5 1.6 AS 1289.6.1.1
6 0.2 AS 1289.6.1.1
7 # AS1289.6.1.1
9 2.9 AS 1289.6.1.1
10 1.8 AS 1289.6.1.1
11 2.5 AS 1289.6.1.1
12 # AS 1289.6.1.1
13 # AS 1289.6.1.1
14 1.8 AS1289.6.1.1/AS1289.2.1.1
15 1.0 AS 1289.6.1.1
16 1.8 AS 1289.6.1.1
18 5.0 AS 1289.6.1.1
19 # AS 1289.6.1.1
20 # AS 1289.6.1.1
21A 1.7 AS 1289.6.1.1
21B 1.0 AS 1289.6.1.1
22 1.2 AS1289.6.1.1
23 1.0 AS1289.6.1.1
25 2.0 AS1289.6.1.1
27 2.8 AS1289.6.1.1
28 1.7 AS 1289.6.1.1
29 # AS 1289.6.1.1
31 0.8 AS 1289.6.1.1
32 1.8 AS 1289.6.1.1
33A 2.3 RMS T117
33B 2.30 T117
34 2.4 AS 1289.6.1.1
36 1.4 AS 1289.6.1.1
38 1.8 AS 1289.6.1.1
40 # AS 1289.5.1.1
42 0.5 AS 1289.6.1.1
43A 2.5 AS1289.6.1.1
46 2.4 AS1289.6.1.1
47 2.2 AS 1289.6.1.1
A21
SD 2.12.19
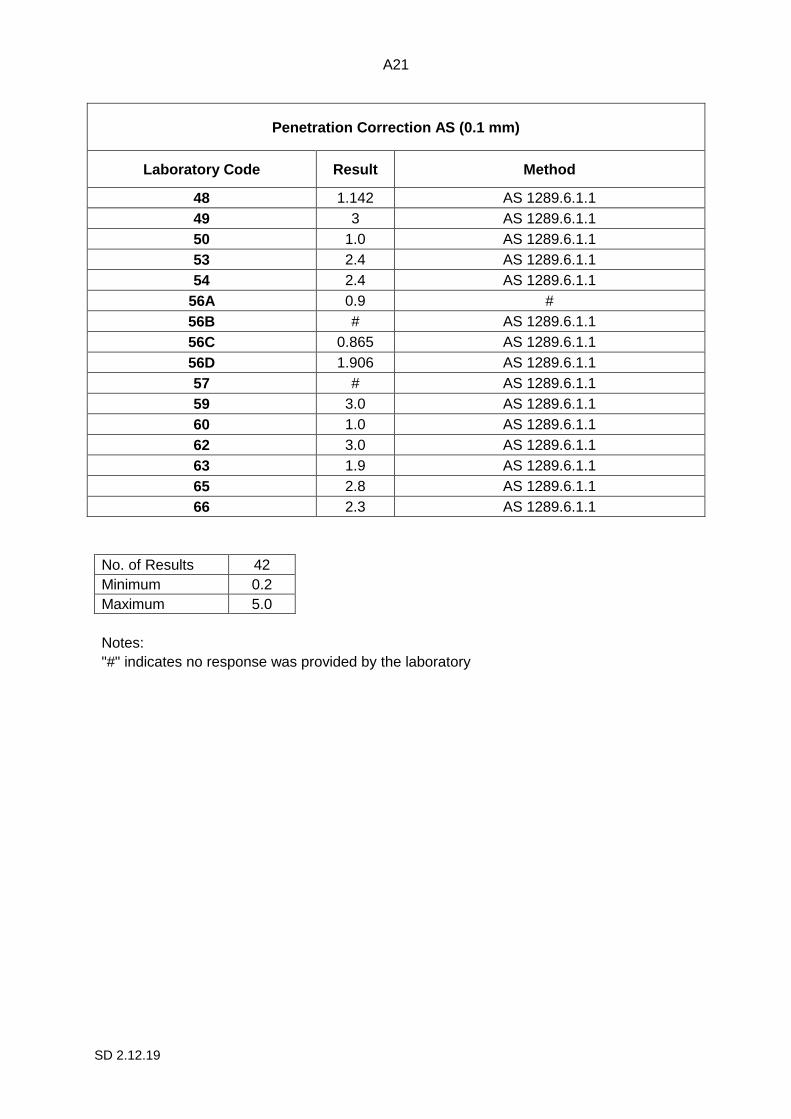
Penetration Correction AS (0.1 mm)
Laboratory Code Result Method
48 1.142 AS 1289.6.1.1
49 3 AS 1289.6.1.1
50 1.0 AS 1289.6.1.1
53 2.4 AS 1289.6.1.1
54 2.4 AS 1289.6.1.1
56A 0.9 #
56B # AS 1289.6.1.1
56C 0.865 AS 1289.6.1.1
56D 1.906 AS 1289.6.1.1
57 # AS 1289.6.1.1
59 3.0 AS 1289.6.1.1
60 1.0 AS 1289.6.1.1
62 3.0 AS 1289.6.1.1
63 1.9 AS 1289.6.1.1
65 2.8 AS 1289.6.1.1
66 2.3 AS 1289.6.1.1
No. of Results 42
Minimum 0.2
Maximum 5.0
Notes:
"#" indicates no response was provided by the laboratory
A22
SD 2.12.19
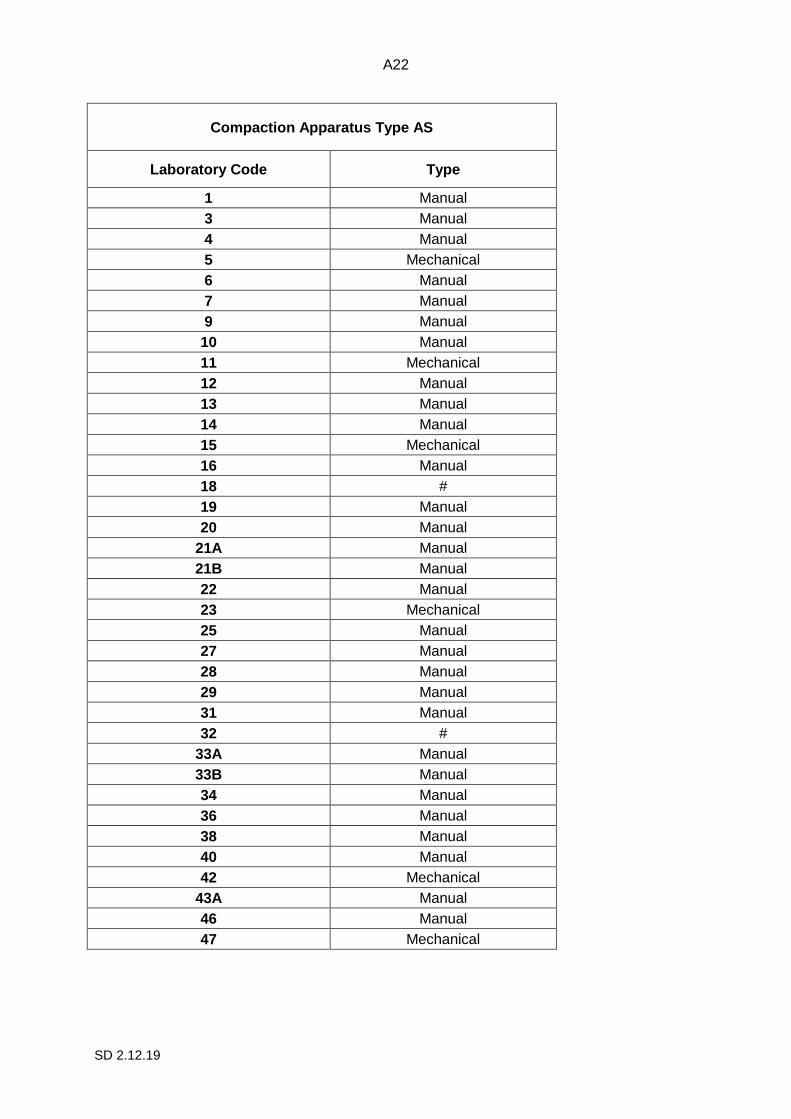
Compaction Apparatus Type AS
Laboratory Code Type
1 Manual
3 Manual
4 Manual
5 Mechanical
6 Manual
7 Manual
9 Manual
10 Manual
11 Mechanical
12 Manual
13 Manual
14 Manual
15 Mechanical
16 Manual
18 #
19 Manual
20 Manual
21A Manual
21B Manual
22 Manual
23 Mechanical
25 Manual
27 Manual
28 Manual
29 Manual
31 Manual
32 #
33A Manual
33B Manual
34 Manual
36 Manual
38 Manual
40 Manual
42 Mechanical
43A Manual
46 Manual
47 Mechanical

A23
SD 2.12.19
Compaction Apparatus Type AS
Laboratory Code Type
48 Manual
49 Mechanical
50 Manual
53 Manual
54 Manual
56A Manual
56B Manual
56C Manual
56D Manual
57 Mechanical
59 Manual
60 Mechanical
62 Manual
63 Manual
65 Mechanical
66 Mechanical
Notes:
"#" indicates no response was provided by the laboratory

A24
SD 2.12.19
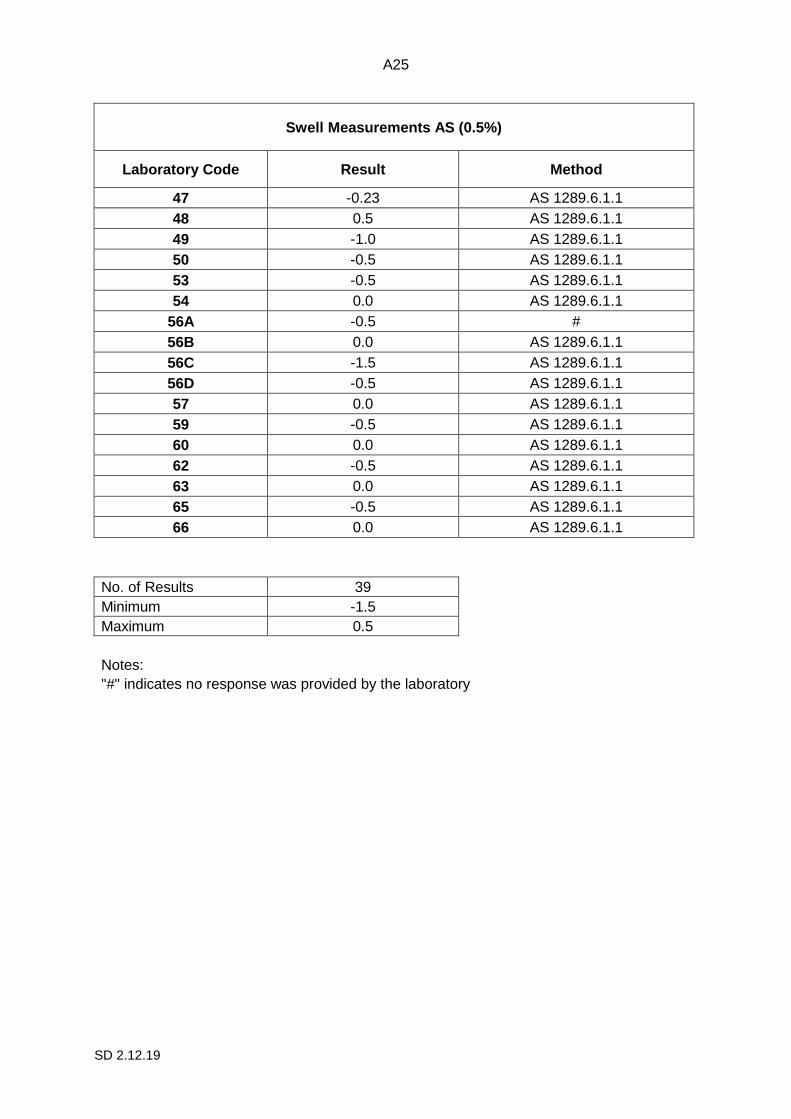
Swell Measurements AS (0.5%)
Laboratory Code Result Method
1 -0.5 AS1289.6.1.1
3 0.0 AS 1289.6.1.1
4 -0.5 AS 1289.6.1.1
5 0.0 AS 1289.6.1.1
6 0.0 AS 1289.6.1.1
7 -0.5 AS1289.6.1.1
9 0.0 AS 1289.6.1.1
10 0.0 AS 1289.6.1.1
11 0.0 AS 1289.6.1.1
12 0.0 AS 1289.6.1.1
13 0.00 AS 1289.6.1.1
14 -0.5 AS1289.6.1.1/AS1289.2.1.1
15 0.0 AS 1289.6.1.1
16 0.0 AS 1289.6.1.1
18 0 AS 1289.6.1.1
19 -0.3 AS 1289.6.1.1
20 0.0 AS 1289.6.1.1
21A -0.5 AS 1289.6.1.1
21B -0.5 AS 1289.6.1.1
22 -0.5 AS1289.6.1.1
23 0 AS1289.6.1.1
25 -0.5 AS1289.6.1.1
27 -0.5 AS1289.6.1.1
28 0.0 AS 1289.6.1.1
29 -0.5 AS 1289.6.1.1
31 0.0 AS 1289.6.1.1
32 -0.5 AS 1289.6.1.1
33A -0.5 RMS T117
33B 0.01 T117
34 -0.5 AS 1289.6.1.1
36 0 AS 1289.6.1.1
38 0.0 AS 1289.6.1.1
40 Initial: 0.80, Final: 0.10 AS 1289.5.1.1
42 0 AS 1289.6.1.1
43A 0.0 AS1289.6.1.1
46 -0.5 AS1289.6.1.1
A25
SD 2.12.19
Swell Measurements AS (0.5%)
Laboratory Code Result Method
47 -0.23 AS 1289.6.1.1
48 0.5 AS 1289.6.1.1
49 -1.0 AS 1289.6.1.1
50 -0.5 AS 1289.6.1.1
53 -0.5 AS 1289.6.1.1
54 0.0 AS 1289.6.1.1
56A -0.5 #
56B 0.0 AS 1289.6.1.1
56C -1.5 AS 1289.6.1.1
56D -0.5 AS 1289.6.1.1
57 0.0 AS 1289.6.1.1
59 -0.5 AS 1289.6.1.1
60 0.0 AS 1289.6.1.1
62 -0.5 AS 1289.6.1.1
63 0.0 AS 1289.6.1.1
65 -0.5 AS 1289.6.1.1
66 0.0 AS 1289.6.1.1
No. of Results 39
Minimum -1.5
Maximum 0.5
Notes:
"#" indicates no response was provided by the laboratory

A26
SD 2.12.19
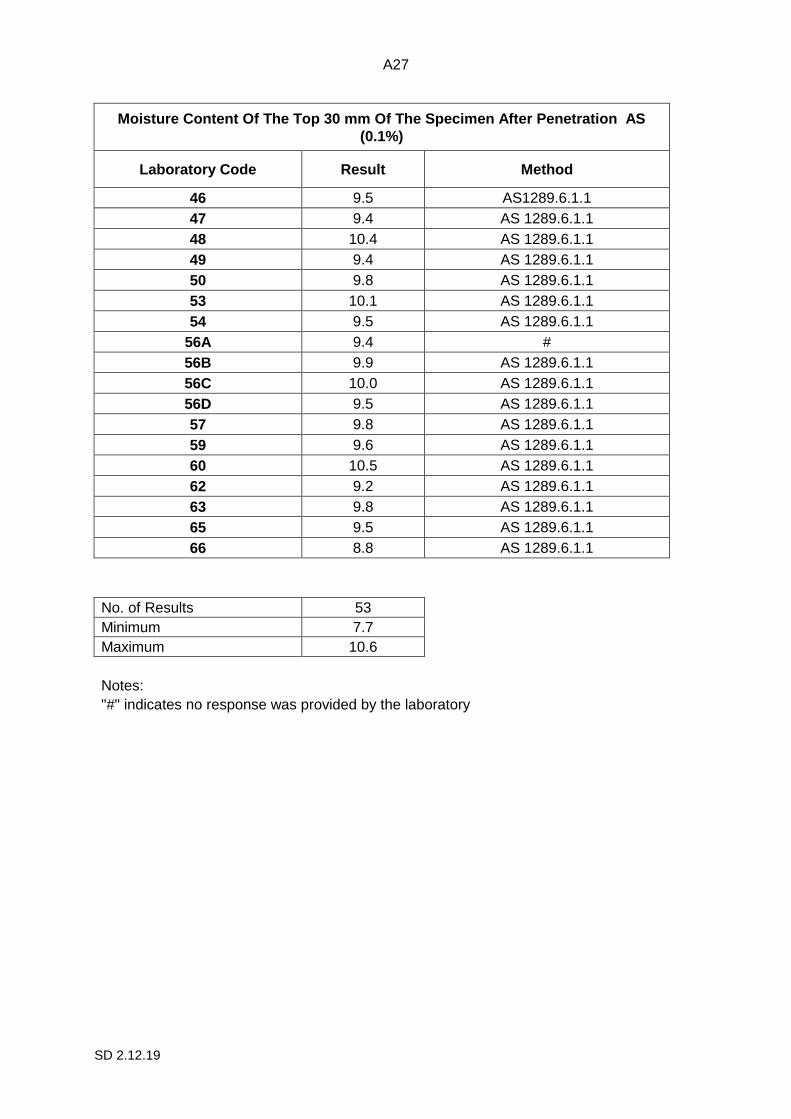
Moisture Content Of The Top 30 mm Of The Specimen After Penetration AS (0.1%)
Laboratory Code Result Method
1 10.0 AS1289.6.1.1
3 8.2 AS 1289.6.1.1
4 9.9 AS 1289.6.1.1
5 8.9 AS 1289.6.1.1
6 8.9 AS 1289.6.1.1
7 9.4 AS1289.6.1.1
9 9.7 AS 1289.6.1.1
10 9.3 AS 1289.6.1.1
11 10.4 AS 1289.6.1.1
12 9.5 AS 1289.6.1.1
13 8.9 AS 1289.6.1.1
14 9.9 AS1289.6.1.1/AS1289.2.1.1
15 9.6 AS 1289.6.1.1
16 10.1 AS 1289.6.1.1
18 10.0 AS 1289.6.1.1
19 9.3 AS 1289.6.1.1
20 10.1 AS 1289.6.1.1
21A 9.8 AS 1289.6.1.1
21B 9.4 AS 1289.6.1.1
22 8.5 AS1289.6.1.1
23 9.7 AS1289.6.1.1
25 10.6 AS1289.6.1.1
27 9.6 AS1289.6.1.1
28 8.1 AS 1289.6.1.1
29 9.7 AS 1289.6.1.1
31 10.5 AS 1289.6.1.1
32 7.7 AS 1289.6.1.1
33A 9.6 RMS T117
33B 9.6 T117
34 10.6 AS 1289.6.1.1
36 9.9 AS 1289.6.1.1
38 10.5 AS 1289.6.1.1
40 8.3 AS 1289.5.1.1
42 8.9 AS 1289.6.1.1
43A 9.8 AS1289.6.1.1
A27
SD 2.12.19
Moisture Content Of The Top 30 mm Of The Specimen After Penetration AS
(0.1%)
Laboratory Code Result Method
46 9.5 AS1289.6.1.1
47 9.4 AS 1289.6.1.1
48 10.4 AS 1289.6.1.1
49 9.4 AS 1289.6.1.1
50 9.8 AS 1289.6.1.1
53 10.1 AS 1289.6.1.1
54 9.5 AS 1289.6.1.1
56A 9.4 #
56B 9.9 AS 1289.6.1.1
56C 10.0 AS 1289.6.1.1
56D 9.5 AS 1289.6.1.1
57 9.8 AS 1289.6.1.1
59 9.6 AS 1289.6.1.1
60 10.5 AS 1289.6.1.1
62 9.2 AS 1289.6.1.1
63 9.8 AS 1289.6.1.1
65 9.5 AS 1289.6.1.1
66 8.8 AS 1289.6.1.1
No. of Results 53
Minimum 7.7
Maximum 10.6
Notes:
"#" indicates no response was provided by the laboratory

A28
SD 2.12.19
CBR 2.5 mm Uncorrected Q (1%)
Laboratory Code Result Robust
Z-Score Method
2 24 -0.42 Q113C
5 61 1.42 Q113C
8 53 1.02 Q113C
24 34 0.07 Q113C
30 31 -0.07 Q113C
37 70 1.87 Q113C
45 36 0.17 Q113C
55 24 -0.42 Q113C
61 29 -0.17 Q113C
62 19 -0.67 Q113C
No. of Results 10
Median 32.5
Normalised IQR 20.0
Uncertainty of the Median
7.9
Robust CV 61.7%
Minimum 19
Maximum 70
Range 51
A29
SD 2.12.19
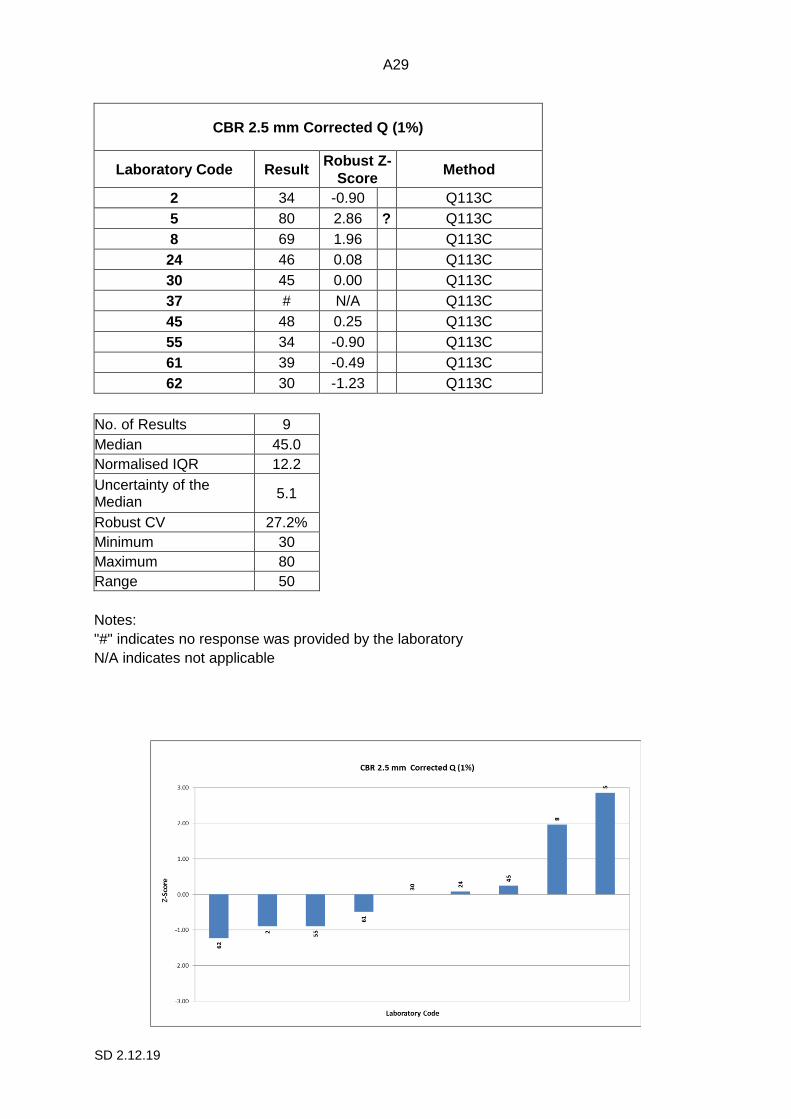
CBR 2.5 mm Corrected Q (1%)
Laboratory Code Result Robust Z-
Score Method
2 34 -0.90 Q113C
5 80 2.86 ? Q113C
8 69 1.96 Q113C
24 46 0.08 Q113C
30 45 0.00 Q113C
37 # N/A Q113C
45 48 0.25 Q113C
55 34 -0.90 Q113C
61 39 -0.49 Q113C
62 30 -1.23 Q113C
No. of Results 9
Median 45.0
Normalised IQR 12.2
Uncertainty of the Median
5.1
Robust CV 27.2%
Minimum 30
Maximum 80
Range 50
Notes:
"#" indicates no response was provided by the laboratory
N/A indicates not applicable
A30
SD 2.12.19
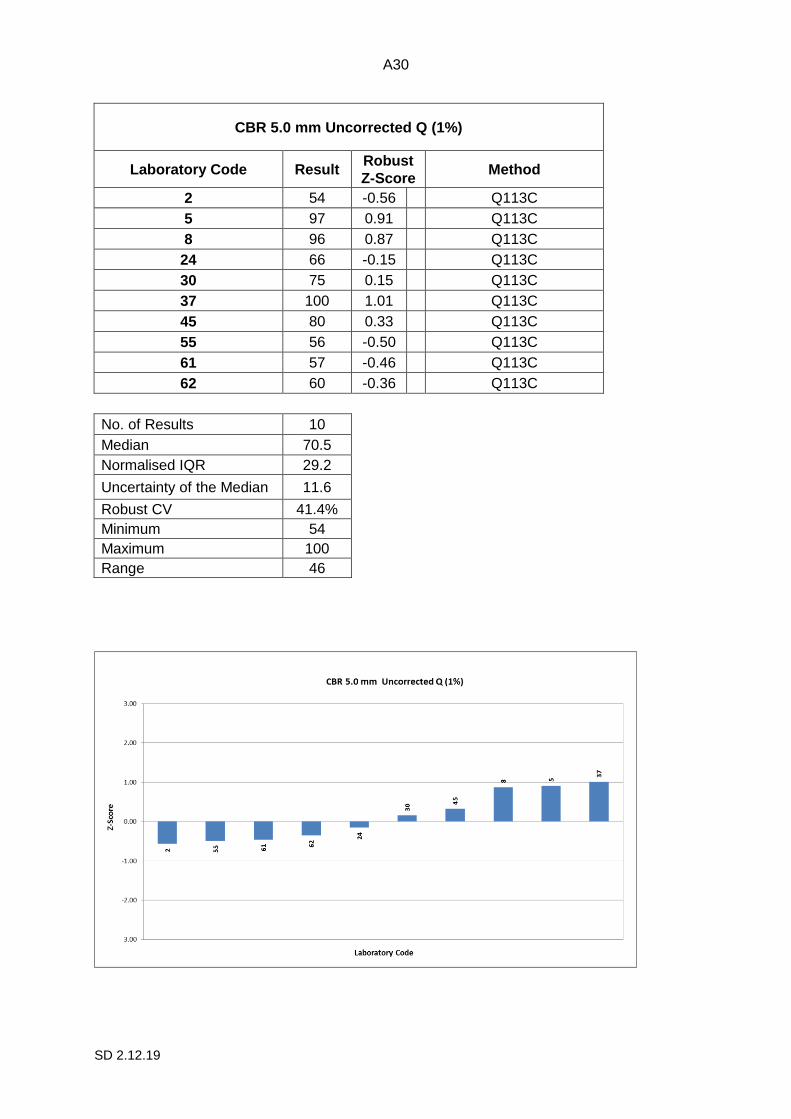
CBR 5.0 mm Uncorrected Q (1%)
Laboratory Code Result Robust
Z-Score Method
2 54 -0.56 Q113C
5 97 0.91 Q113C
8 96 0.87 Q113C
24 66 -0.15 Q113C
30 75 0.15 Q113C
37 100 1.01 Q113C
45 80 0.33 Q113C
55 56 -0.50 Q113C
61 57 -0.46 Q113C
62 60 -0.36 Q113C
No. of Results 10
Median 70.5
Normalised IQR 29.2
Uncertainty of the Median 11.6
Robust CV 41.4%
Minimum 54
Maximum 100
Range 46
A31
SD 2.12.19
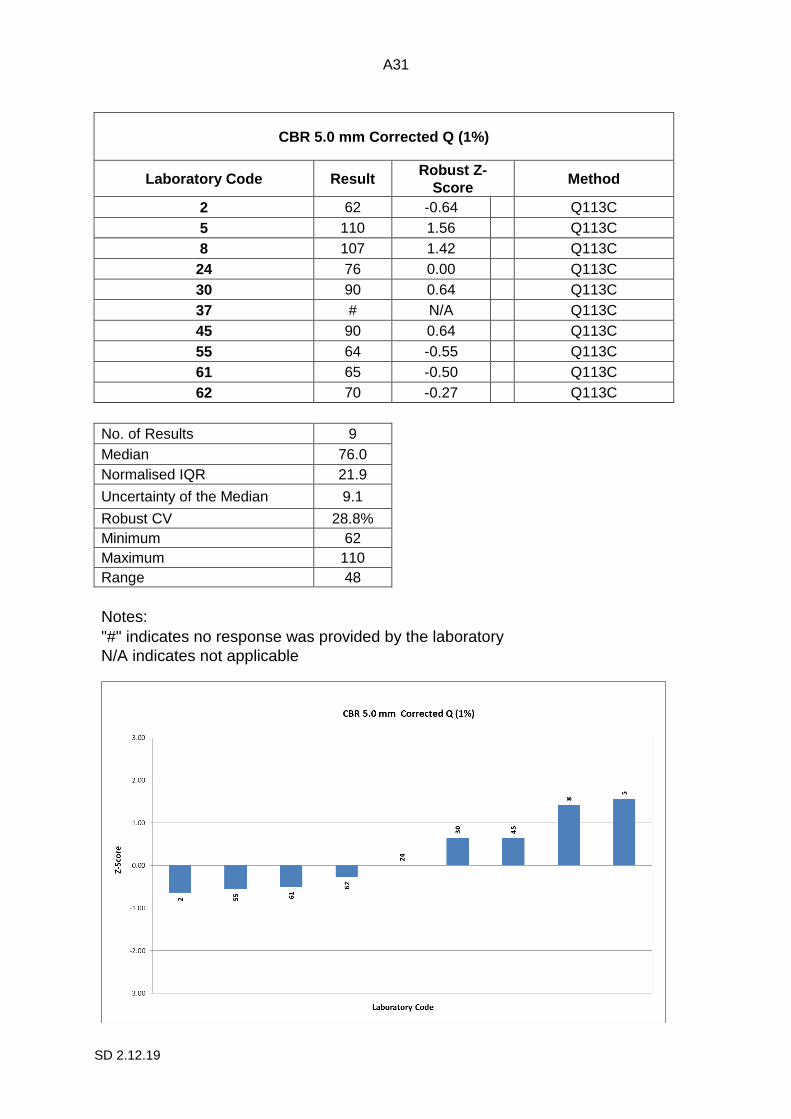
CBR 5.0 mm Corrected Q (1%)
Laboratory Code Result Robust Z-
Score Method
2 62 -0.64 Q113C
5 110 1.56 Q113C
8 107 1.42 Q113C
24 76 0.00 Q113C
30 90 0.64 Q113C
37 # N/A Q113C
45 90 0.64 Q113C
55 64 -0.55 Q113C
61 65 -0.50 Q113C
62 70 -0.27 Q113C
No. of Results 9
Median 76.0
Normalised IQR 21.9
Uncertainty of the Median 9.1
Robust CV 28.8%
Minimum 62
Maximum 110
Range 48
Notes:
"#" indicates no response was provided by the laboratory
N/A indicates not applicable

A32
SD 2.12.19
Achieved Dry Density Before Soaking Q (0.01 t/m3)
Laboratory Code Result Robust Z-
Score Method
2 2.09 -0.88 Q113C
5 2.08 -2.05 ● Q113C
8 2.09 -0.88 Q113C
24 2.095 -0.29 Q113C
30 2.10 0.29 Q113C
37 2.10 0.29 Q113C
45 2.09 -0.88 Q113C
55 2.10 0.29 Q113C
61 2.10 0.29 Q113C
62 2.11 1.47 Q113C
No. of Results 10
Median 2.098
Normalised IQR 0.009
Uncertainty of the Median 0.003
Robust CV 0.4%
Minimum 2.08
Maximum 2.11
Range 0.03
Notes
● indicates that laboratory 5 result is correct based on the requirements of the standard
A33
SD 2.12.19
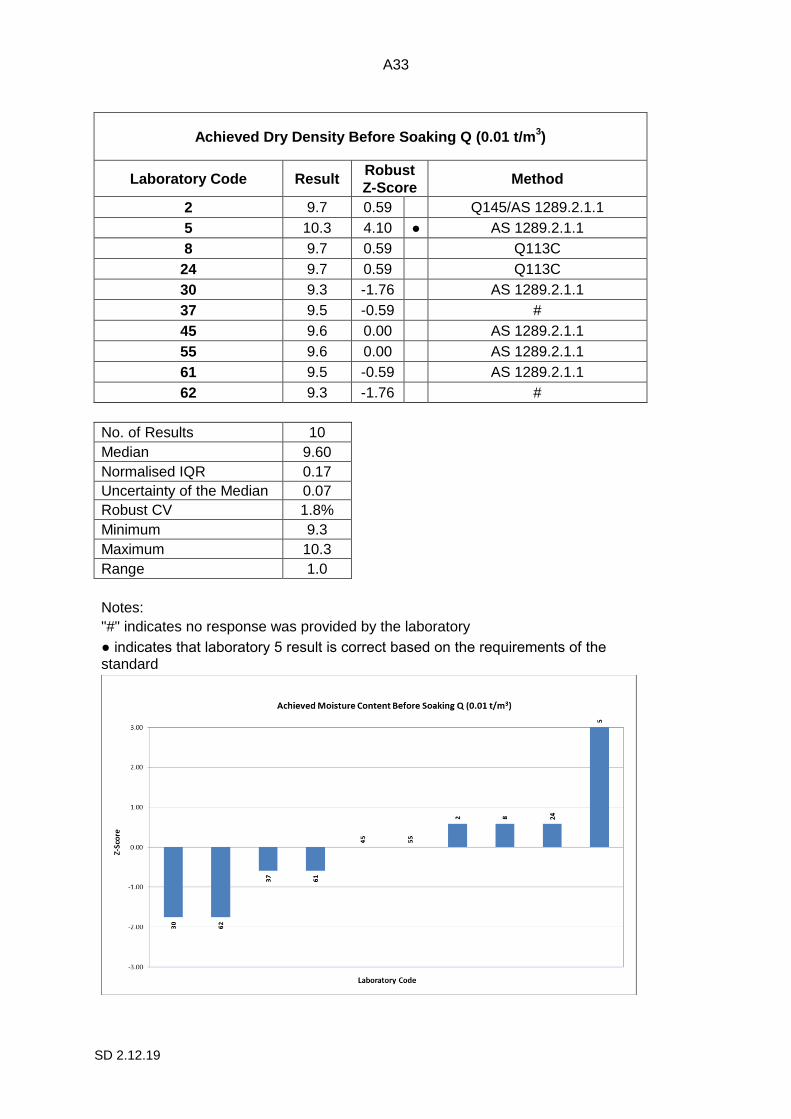
Achieved Dry Density Before Soaking Q (0.01 t/m3)
Laboratory Code Result Robust
Z-Score Method
2 9.7 0.59 Q145/AS 1289.2.1.1
5 10.3 4.10 ● AS 1289.2.1.1
8 9.7 0.59 Q113C
24 9.7 0.59 Q113C
30 9.3 -1.76 AS 1289.2.1.1
37 9.5 -0.59 #
45 9.6 0.00 AS 1289.2.1.1
55 9.6 0.00 AS 1289.2.1.1
61 9.5 -0.59 AS 1289.2.1.1
62 9.3 -1.76 #
No. of Results 10
Median 9.60
Normalised IQR 0.17
Uncertainty of the Median 0.07
Robust CV 1.8%
Minimum 9.3
Maximum 10.3
Range 1.0
Notes:
"#" indicates no response was provided by the laboratory
● indicates that laboratory 5 result is correct based on the requirements of the standard
A34
SD 2.12.19
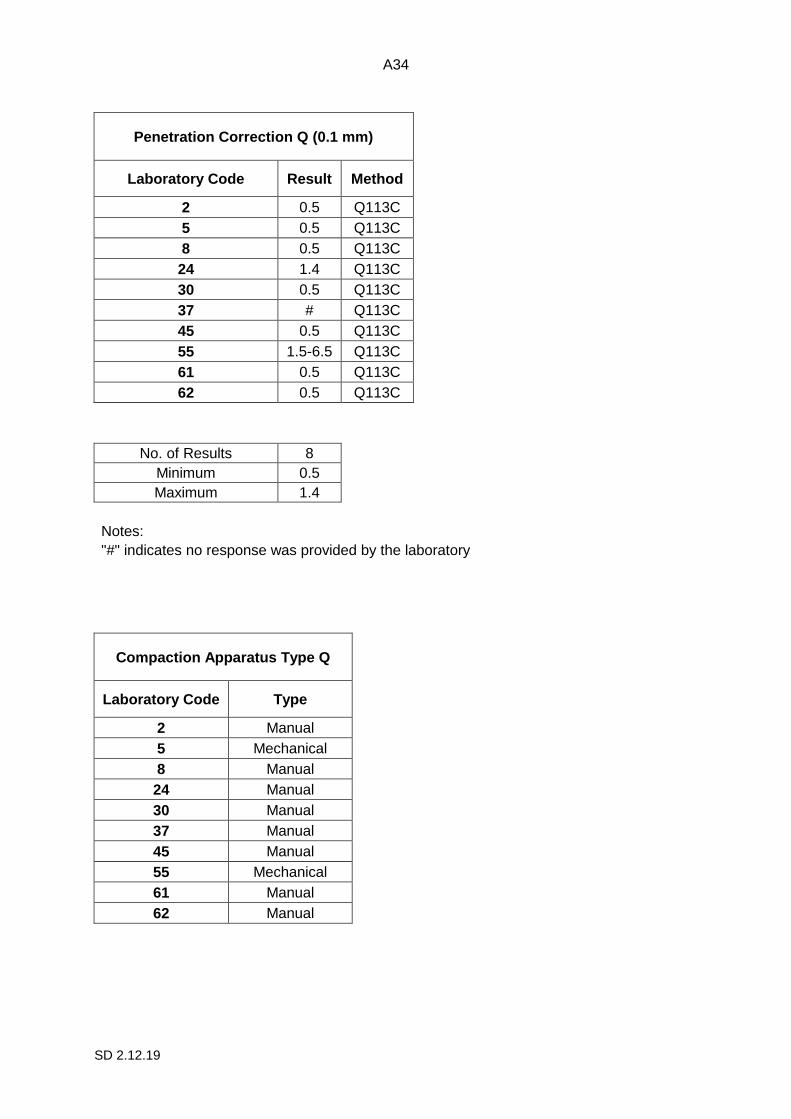
Penetration Correction Q (0.1 mm)
Laboratory Code Result Method
2 0.5 Q113C
5 0.5 Q113C
8 0.5 Q113C
24 1.4 Q113C
30 0.5 Q113C
37 # Q113C
45 0.5 Q113C
55 1.5-6.5 Q113C
61 0.5 Q113C
62 0.5 Q113C
No. of Results 8
Minimum 0.5
Maximum 1.4
Notes:
"#" indicates no response was provided by the laboratory
Compaction Apparatus Type Q
Laboratory Code Type
2 Manual
5 Mechanical
8 Manual
24 Manual
30 Manual
37 Manual
45 Manual
55 Mechanical
61 Manual
62 Manual

A35
SD 2.12.19
Swell Measurements Q (0.5%)
Laboratory Code Result Method
2 -1.0 Q113C
5 0.0 Q113C
8 -0.2 Q113C
24 -0.5 Q113C
30 0.0 Q113C
37 # Q113C
45 0.0 Q113C
55 0.0 Q113C
61 -0.5 Q113C
62 -0.5 Q113C
No. of Results 9
Minimum -1.0
Maximum 0.0
Moisture Content Of The Top 30 mm Of The Specimen
After Penetration Q (0.1%)
Laboratory Code Result Method
2 8.6 Q145/AS 1289.2.1.1
5 9.5 AS 1289.2.1.1
8 8.6 Q113C
24 9.9 Q113C
30 9.0 AS 1289.2.1.1
37 # #
45 8.9 AS 1289.2.1.1
55 10.1 AS 1289.2.1.1
61 9.3 AS 1289.2.1.1
62 10.0 #
No. of Results 9
Minimum 8.6
Maximum 10.1
Notes:
"#" indicates no response was provided by the laboratory

B1
SD 2.12.19
APPENDIX B
Homogeneity and Stability Testing
Homogeneity…………………………………………………………………….………….B2
Stability Testing…………………………………………………………………………….B3

B2
SD 2.12.19
Homogeneity
The samples utilised in this program were supplied by Soil Engineering Services Pty Ltd, Townsville Laboratory. Ten samples were randomly selected and CBR test was performed as per AS 1289.6.1.1. The results of the homogeneity testing, along with summary statistics are provided in the tables below. Analysis of this data indicates that the samples were sufficiently homogeneous and therefore, any results later identified as outliers could not be attributed to sample variability.
Method AS 1289.6.1.1
CBR @
2.5 mm
(1%)
Corrected
CBR @
5.0 mm
(1%)
Corrected
Achieved
Dry Density
before
soaking
(0.01 t/m3)
Achieved
Moisture
Content before
soaking (0.1
%)
Compaction
Apparatus
Type (Manual
or Mechanical)
Swell
Measurements
(0.5%)
Moisture content of
the top 30mm of the
specimen after
penetration (0.1%)
Sample Number
3 82 100 2.09 9.7 Manual -1 8.3
7 109 114 2.07 10.2 Manual -1 8.5
35 124 135 2.11 9.2 Manual -0.5 8.4
36 73 84 2.09 9.8 Manual -1 8.4
38 67 85 2.10 9.5 Manual 0 8.4
61 96 118 2.12 9.4 Manual 0 8.2
63 96 118 2.09 10.0 Manual -0.5 8.7
65 88 108 2.06 9.6 Manual -1 8.7
97 116 133 2.10 9.7 Manual 0 9.4
131 91 113 2.11 9.5 Manual 0 8.4
Mean 94.2 110.8 2.094 9.66
Standard Deviation 17.25 16.45 0.02 0.28
Coefficient of Variation (CV) (%) 18.31% 14.85% 0.83% 2.86%
Lowest Value 67 84 2.06 9.2
Highest Value 124 135 2.12 10.2
Range 57 51 0.06 1
B2
SD 2.12.19
Stability Testing
Due to the nature of the samples it was not considered necessary to perform stability testing.
B3
C1
SD 2.12.19
APPENDIX C
Documentation
Instructions to Participants ……………………………………………………………… C2
Results Sheet ……………………………………………………………………………. C4
C2
SD 2.12.19
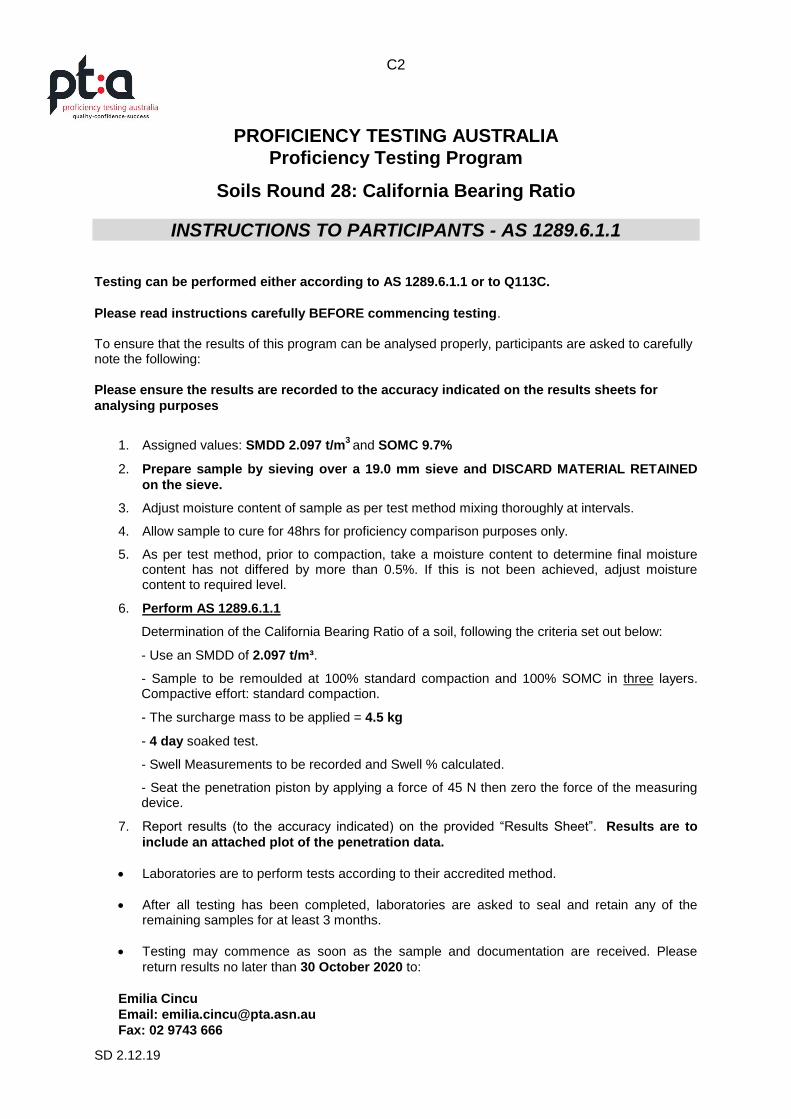
PROFICIENCY TESTING AUSTRALIA
Proficiency Testing Program
Soils Round 28: California Bearing Ratio
INSTRUCTIONS TO PARTICIPANTS - AS 1289.6.1.1
Testing can be performed either according to AS 1289.6.1.1 or to Q113C.
Please read instructions carefully BEFORE commencing testing. To ensure that the results of this program can be analysed properly, participants are asked to carefully note the following:
Please ensure the results are recorded to the accuracy indicated on the results sheets for
analysing purposes
1. Assigned values: SMDD 2.097 t/m3 and SOMC 9.7%
2. Prepare sample by sieving over a 19.0 mm sieve and DISCARD MATERIAL RETAINED
on the sieve.
3. Adjust moisture content of sample as per test method mixing thoroughly at intervals.
4. Allow sample to cure for 48hrs for proficiency comparison purposes only.
5. As per test method, prior to compaction, take a moisture content to determine final moisture content has not differed by more than 0.5%. If this is not been achieved, adjust moisture content to required level.
6. Perform AS 1289.6.1.1
Determination of the California Bearing Ratio of a soil, following the criteria set out below:
- Use an SMDD of 2.097 t/m³.
- Sample to be remoulded at 100% standard compaction and 100% SOMC in three layers. Compactive effort: standard compaction.
- The surcharge mass to be applied = 4.5 kg
- 4 day soaked test.
- Swell Measurements to be recorded and Swell % calculated.
- Seat the penetration piston by applying a force of 45 N then zero the force of the measuring device.
7. Report results (to the accuracy indicated) on the provided “Results Sheet”. Results are to
include an attached plot of the penetration data.
Laboratories are to perform tests according to their accredited method.
After all testing has been completed, laboratories are asked to seal and retain any of the remaining samples for at least 3 months.
Testing may commence as soon as the sample and documentation are received. Please
return results no later than 30 October 2020 to:
Emilia Cincu
Email: [email protected]
Fax: 02 9743 666
C3
SD 2.12.19
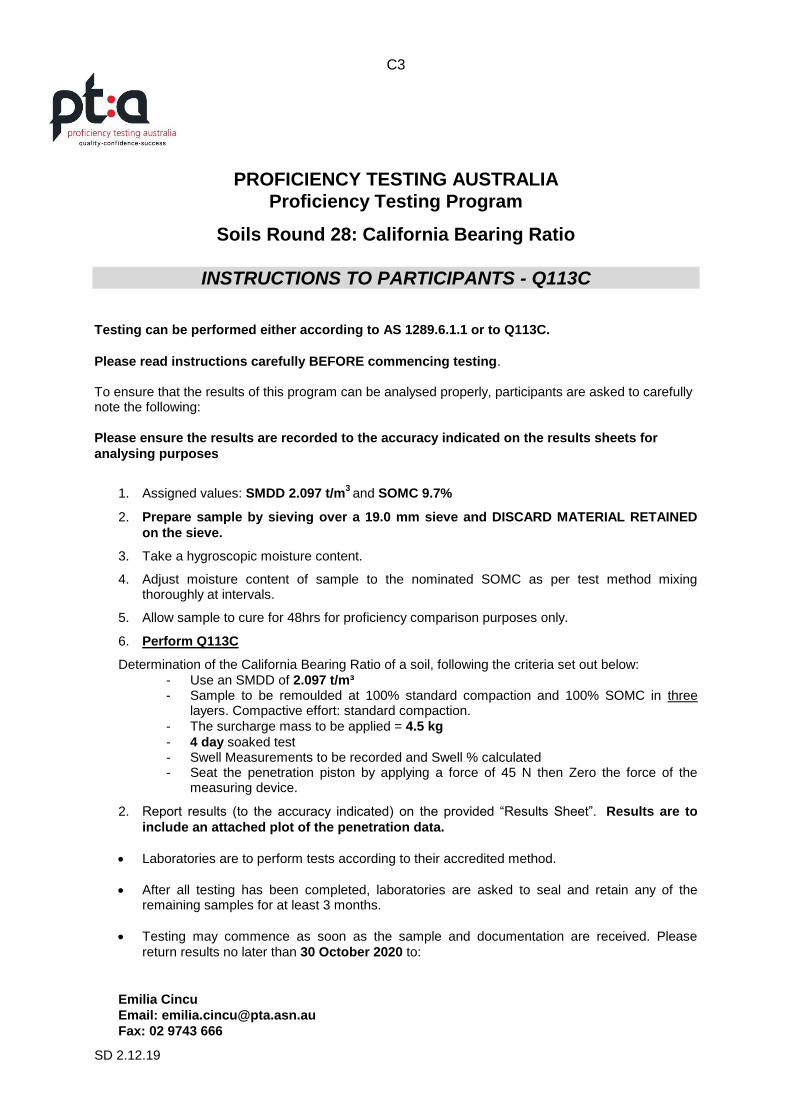
PROFICIENCY TESTING AUSTRALIA
Proficiency Testing Program
Soils Round 28: California Bearing Ratio
INSTRUCTIONS TO PARTICIPANTS - Q113C
Testing can be performed either according to AS 1289.6.1.1 or to Q113C.
Please read instructions carefully BEFORE commencing testing. To ensure that the results of this program can be analysed properly, participants are asked to carefully note the following:
Please ensure the results are recorded to the accuracy indicated on the results sheets for
analysing purposes
1. Assigned values: SMDD 2.097 t/m3 and SOMC 9.7%
2. Prepare sample by sieving over a 19.0 mm sieve and DISCARD MATERIAL RETAINED
on the sieve.
3. Take a hygroscopic moisture content.
4. Adjust moisture content of sample to the nominated SOMC as per test method mixing thoroughly at intervals.
5. Allow sample to cure for 48hrs for proficiency comparison purposes only.
6. Perform Q113C
Determination of the California Bearing Ratio of a soil, following the criteria set out below:
- Use an SMDD of 2.097 t/m³ - Sample to be remoulded at 100% standard compaction and 100% SOMC in three
layers. Compactive effort: standard compaction.
- The surcharge mass to be applied = 4.5 kg
- 4 day soaked test - Swell Measurements to be recorded and Swell % calculated - Seat the penetration piston by applying a force of 45 N then Zero the force of the
measuring device.
2. Report results (to the accuracy indicated) on the provided “Results Sheet”. Results are to
include an attached plot of the penetration data.
Laboratories are to perform tests according to their accredited method.
After all testing has been completed, laboratories are asked to seal and retain any of the remaining samples for at least 3 months.
Testing may commence as soon as the sample and documentation are received. Please
return results no later than 30 October 2020 to:
Emilia Cincu
Email: [email protected]
Fax: 02 9743 666
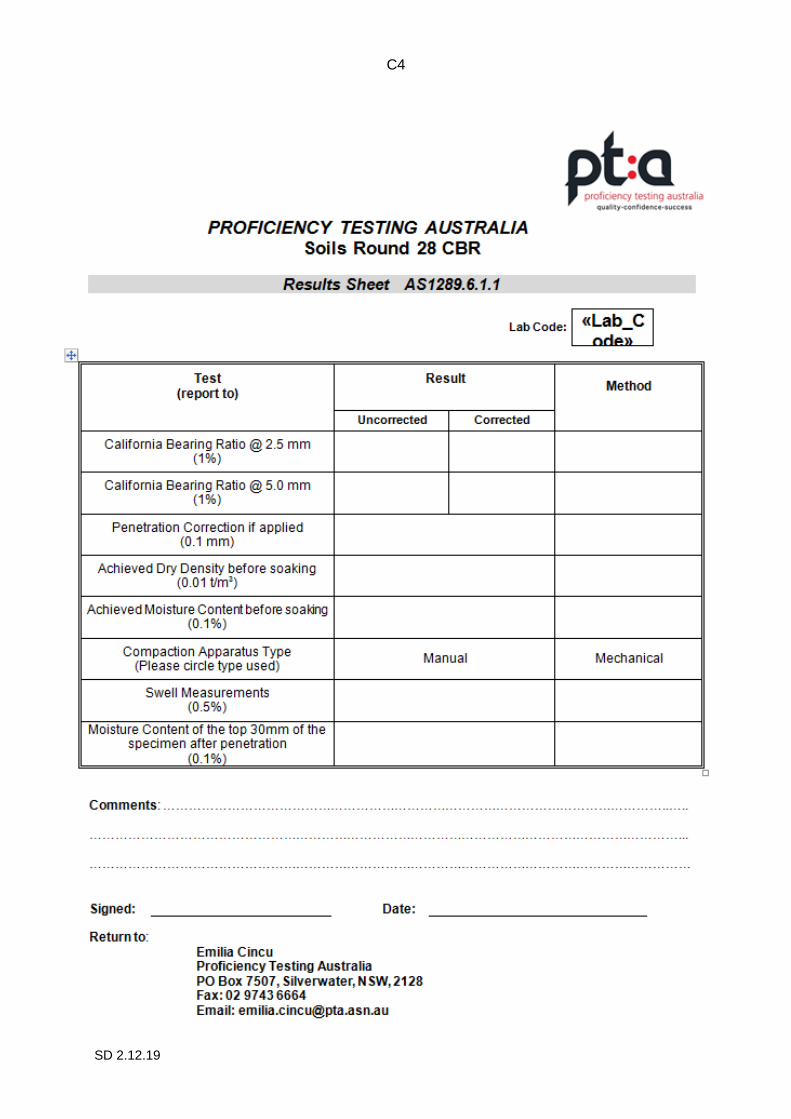
C4
SD 2.12.19
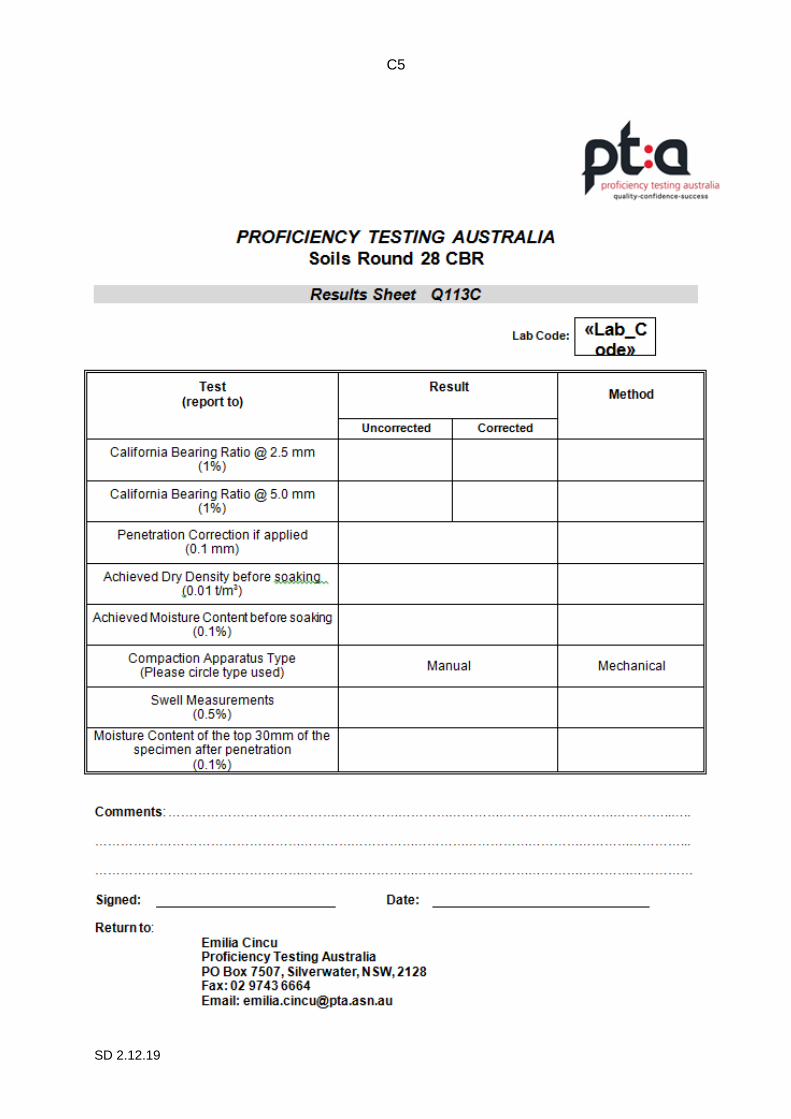
C5
SD 2.12.19

C6
SD 2.12.19
- End of Report -