report no. 19920-ec ecuador poverty and social...
TRANSCRIPT

Report No. 19920-EC
EcuadorCrisis, Poverty and Social Services(InTwoVolumes)Volumell: Annexes
June 26, 2000
Human Development DepartmentLatin America and the Caribbean Region
Document of the World Bank
Pub
lic D
iscl
osur
e A
utho
rized
Pub
lic D
iscl
osur
e A
utho
rized
Pub
lic D
iscl
osur
e A
utho
rized
Pub
lic D
iscl
osur
e A
utho
rized
Pub
lic D
iscl
osur
e A
utho
rized
Pub
lic D
iscl
osur
e A
utho
rized
Pub
lic D
iscl
osur
e A
utho
rized
Pub
lic D
iscl
osur
e A
utho
rized
EXCHANGE RATE(1999 average)
Sucres 1 1,786.8 = US$1.00S1,000 = US$0.09
SCHOOL YEARCoast: April - JanuaryInland: October - July
FISCAL YEARJanuary 1 - December 31
ACRONYMS AND ABBREVIATIONS
BCE Banco Central del EcuadorPUCE Pontificia Universidad Cat6lica del EcuadorBMI Bono Matemo InfantilCAF Corporaci6n Andina de FomentoCEM Centros Educativos Matriz (School Network)CEPAL Comisi6n Econ6mica pam Latinoamerica y el Caribe, (Economic Commission for Latin
America and the Caribbean)CEPLAKS Centro de Planificaci6n y Estudios SocialesCONAMU Consejo Nacional de la MujerCOPEFEN Unidad Coordinadora del Fen6meno El NifloDDSB. Debt and Debt Service ReductionDINIEB Direcci6n Nacional de Educaci6n Intercultural BilingfleDL Decentralization and Social Participation Law (1997)EB/PRODEC Educaci6n Basica - Proyecto de Educaci6nECD Early Childhood DevelopmentECV Encuesta Condiciones de Vida (LSMS)FASBASE Proyecto de fortalecinmiento y Ampliaci6n de Servicios Basicos de Salud en Ecuador,
(Basic Primary Health Project)FGT Foster - Greer- ThorbeckeFISK Fondo de Inversi6n de Emergencia, (Emergency Social Fund)GDP Gross Domestic ProductIDB Inter-American Development Bank, (Banco Interamericano de Desarrollo)IESS Instituto Ecuatoriano de Seguridad Social, (Ecuadoran Social Security Institute)INEC Instituto Nacional de Estadistica y Censo, (National lnsfitutefor Statistics and Census)INECEL Instituto Ecuatoriano de Electrificaci6n, (Ecuadoran Electricity Company)INNFA Instituto Nacional de la Juventud y de la Famnilia, (Nafional Institute of the Youth and the
Family)JBG Junta de Beneficiencia de Guayaquil
Vice-President David De FerrantiCountry Director Andrds SolimanoSector Leader: Constance A. CorbettSector Director Xavier CoiTask Manager: Donald Winkler

ISMS Living Standard Measurement Survey (ECV)M & PL Law of the Modernization of the State, Privatization, and Delivery of Public Services by
the Private Sectors (1993)MEC Ministerio de Educaci6n y Cultua, (Minisny of Education and Culture)MHEB Municipal Health BoardMHCN Municipal Integrated Health Care NetworksMODERSA Modernizaci6n Gesti6n Hospitalaria y Reforma Sector SaludMOE MSP Ministerio de Salud Publica, (Ministry ofPublic Health)MSB Ministry of Social WelfareMTI Medium Term ImprovementNGO Non-Governmental Organizations, (Organizaciones No-Gubernamentales)OECD Organization for Economic Co-operation and DevelopmentOREALC Oficina Regional de la Educaci6n para Amdrica Latina y el CaribeORI Operaci6n de Rescate Infantil, (Operation Child Rescue)PACMI Programa de Alimentacion Complementario Materno InfantilPAHO/WHO Organizaci6n Panamericana de la Salud, (World Health Organization)PCE Gasto per Capita, (Per Capita Expenditures)'PDI Programa Desarrollo Infantil?PP Purchasing Power ParityPRAF Programa de Asistencia Familiar, (FamilyAssistant Program)PROMECEB Proyecto de Mejoramiento de Calidad y Eficiencia de la Educaci6n Bdsica, (Projectfor
Improvement ofEfficiency and Quality of Basic Education (1DB-Financed)PRONEPE Programa Nacional de Educaci6n Preescolar AlternativaSEDES Secretaria de Desarroilo SocialSEGEPLAN Secretaria General de Planificaci6n, (General Planning Secretariat)SIMUJER Sistema de Indicadores sobre la Situaci6n de las Mujeres y de las Diferencias entre
Hombres y Mujeres en el Paiss.InSE Proyecto de Sistema Integrado de Indicadores Sociales del EcuadorSISVAN National System of Nutritional VigilanceSOLCA Sociedad de Lucha contra el CAncerSSFA Seguro Social de la Policia, (Police Social Securty)STD StandardTEMSS Third International Mathematics and Science StudyTQM Total Quality ManagementUNDP Programa de Desarrollo de las Naciones Unidas, (United Nations Developnent Program)USAID United States Agency for Intemational DevelopmentVAT Value Added Tax, (Impuesto de ValorAgregado)


ANNEXES
Table of Contents
Annex 1: Statistical Annex
Annex 2: Methodology Used for Deriving Estimates of Poverty
Annex 3: Protecting the Poor in Ecuador: Priorities and Options for the BonoSolidario
Annex 4: An Emerging Education Strategy for Ecuador
Annex 5: Health in Ecuador
Annex 6: Incidence Analysis of Social Expenditures and Public Subsidies inEcuador
Annex 7: Employment Generation in Ecuador
Annex 8: Indigenous Education in Ecuador
Annex 1: Statistical Annex
Adela Garcia Aracil, M6nica Sarmiento, Renee Hendley1999
Index of Tables
Table Al. Distribution and Incidence of Poverty in 1998, by Geographic Area
Table A2. Distribution and Incidence of Poverty in 1998, by Consumption Quintiles
(Percentages)
Table A3. Household Characteristics by Consumption Quintiles and Poverty Status
Table A4. Mean Total Consumption Expenditures per Capita and per Household in
Ecuador, 1998
Table A5. Age Distribution of Households in Ecuador, 1998. Percent of Household With
Children in Both Age Groups
Table A6. Population According to Sex, Disease Symptoms and Age Groups by
Consumption Quintiles
Table A7. Type of Health Providers Attending to Individuals with Disease Symptoms by
Consumption Quintiles
Table Ag. Enrollment of Children Less Than 6 Years Old in Daycare and Preschool.
Table A9. Education Enrollment Rates
Table A10. Distribution of Education Enrollments by School Type (Percentages)
Table A1l. Mothly Education Expenditures by Households with Children between 6 and
17 Years Old in Public Schools
Table A12. Monthly Education Expenditures by Households with Children between 6 and
17 Years Old in Public Schools
Table A13. Monthly Education Expenditures by Households with Children between 6 and
17 Years Old in Private Schools
Table A14. Monthly Education Expenditures by Households with Children between 6 and
17 Years Old in Public and Private Schools
'Table Al5. Self reported Number of Days of School Missed Monthly
Table A16. Children's Economic and Educational Activity. Age Group 6-l1
(Percentages)
Table A17. Children's Economic and Educational Activity. Age Group 12-14
(Percentages)
Table Al8. Children's Economic and Educational Activity. Age Group 15-17
(Percentages)
Table A19. Average Salary per Hour and Monthly Age Groups
Table A20. Average Hours Worked per Week
Central Government Expenditure in the Social Sectors
Table A21. Summary of total Central Govermnent Expenditures (Real 1995 Sucres)
Table A22. Social Sectors as a Percentage of GDP
Table A23. Central Govemment Expenditures in Social Sectors and Additional Programs
in 1999 (Millions of Real 1995 Sucres)
Table A24. Central Government Expenditures in the Social Sectors - Personnel vs. Other
Costs (Real 1995 Sucres)
Table A25. Central Government Expenditures in the Social Sectors - Recurrent Costs vs.
Capital Investment (Real 1995 Sucres)
Central Government Expenditures in the Health Sector
Table A26. Central Government Expenditures in the Health Sector by Institution (Real
1995 Sucres)
Table A27. Central Govemment Expenditures in the Health Sector by Activity (Real 1995
Sucres)
Table A28. Central Government Expenditures in the Health Sector by Personnel and
Other Costs (Real 1995 Sucres)

Table A29. Central Government Expenditures in the Health Sector by Personnel and
Other Costs (Percentage haring of total health expenditures)
Table A30. Central Government Expenditures in the Health Sector by Recurrent and
Capital Costs (Real 1995 Sucres)
Table A31. Central Government Expenditures in the Health Sector by Recurrent and
Capital Costs (Percentage sharing of total health expenditures)
Table A32. Central Government Expenditures in the Health Sector by Province (Real
1995 Sucres)
Table A33. Central Government Expenditures in the Health Sector by Province
(Percentage sharing of total health expenditures)
Central Government Expenditures in Education
Table A34. Central Government Expenditures in Education by Institution (Real 1995
Sucres)
Table A35. Central Government Expenditures in Education by Personnel and Other Costs
(Real 1995 Sucres)
Table A36. Non-personnel Expenditures as a Percentage of Total Education Expenditures
Table A37. Central Government Expenditures in Education by Personnel and Other Costs
as a Percentage of Total Education Expenditures
Table A38. Central Government Expenditures in Education by Recurrent and Capital
Costs (Real 1995 Sucres)
Table A39. Central Government Expenditures in Education by Recurrent and Capital
Costs (Percentage sharing)
Table A40. Central Government Expenditures in Education by Activity (Real 1995
Sucres)
Table A41. Central Government Expenditures in Education as a percent of GDP (Real
1995 Sucres)
Table A42. Central Government Expenditures in Education as a percent of Non-Debit
Spending (Real 1995 Sucres)
Table A43. Per Student Spending (Real 1995 Sucres)
Table A44. Per Student Spending (Real terms average 1995 exchange rate)
Table A45. Central Government Expenditures in Education by Province (Real 1995
Sucres)
Table A46. Central Government Expenditures in Education by Province (Percentage
sharing)
Central Government Expenditures in the Labor Sector
Table A47. Central Government Expenditures in the Labor Sector by Institution (Real
1995 Sucres)
Table A48. Central Government Expenditures in the Labor Sector by Activity (Real 1995
Sucres)
Table A49. Central Government Expenditures in the Labor Sector by Personnel and Other
Costs (Real 1995 Sucres)
Table A50. Central Government Expenditures in the Labor Sector by Personnel and Other
Costs (Percentage sharing)
Table A51. Central Government Expenditures in the Labor Sector by Recurrent and
Capital Costs (Real 1995 Sucres)
Table A52. Central Government Expenditures in the Labor Sector by Recurrent and
Capital Costs (Percentage sharing)

Central Government Expenditures in Social Welfare
Table A53. Central Government Expenditures Social Welfare by Institution (Real 1995
Sucres)
Table A54. Central Government Expenditures in Social Welfare by Personnel and Other
Costs (Real 1995 Sucres)
Table A55. Central Government Expenditures in Social Welfare by Personnel and Other
Costs (Percentage sharing)
Table A56. Central Government Expenditures in Social Welfare by Recurrent and Capital
Costs (Real 1995 Sucres)
Table A57. Central Government Expenditures in Social Welfare by Recurrent and Capital
Costs (Percentage sharing)
Table A58. Central Government Expenditures in Social Welfare by Province (Real 1995
Sucres)

Annex 1: Statistical Annex
Table Al. Distribution and Incidence of Poverty in 1998, by Geographic Area
Population % National All Poor % All Poor Extreme Poor % ExtremePopulation Poor
Costa 6,109,026 55 2,646,758 52 790,170 42Rural 2,052,163 18 1,334,604 26 473,236 25Urban 4,056,863 36 1,312,154 26 316,934 17
Sierra 4,708,827 42 2,275,786 45 1,017,881 55Rural 2,353,073 21 1,687,092 33 874,092 47Urban 2,355,754 21 588,694 12 143,789 8
Oriente 376,452 3 169,986 3 57,047 3Rural 302,023 3 151,706 3 54,106 3Urban 74,429 1 18,280 0 2,941 0
National 11,194,305 100 5,092,530 100 1,865,098 100Rural 4,707,259 42 3,173,402 62 1,401,434 75Urban 6,487,046 58 1,919,128 38 463,664 25
Source: LSMS 98.
Statistical Annex, Page 1

Table A2. Distribution and Incidence of Poverty In 1998, by Consumption Quintiles. (Percentages)
Qi Q2 Q3 Q' Qs pExtreme Poor Non-poor Rural Urban Costa Sierra Oriente NationalPoor
Population 20.0 20.0 20.0 20.0 20.0 16.8 45.8 54.2 42.1 57.9 54.6 42.1 3.4 100.0
Extreme Poor 96.4 3.6 0.0 0.0 0.0 100.0 100.0 0.0 75.1 24.9 42.4 54.6 3.1 100.0Poor 43.7 42.9 13.3 0.1 0.0 36.6 100.0 0.0 62.3 37.7 52.0 44.7 3.3 100.0
Non-poor 0.0 0.6 25.7 36.9 36.9 0.0 0.0 100.0 25.1 74.9 56.7 39.9 3.4 100.0
Source: LSMS 98.
Table A3. Household Characteristics by Conswnption Quintiles and Poverty Status
Qi Q2 Q3 Q4 Qs OExtren Poor Non-poor Rural Urban Costa Sierra Oriente NationalPoor
Family Size 7.40 6.28 5.65 4.84 4.29 7.60 6.70 4.84 6.13 5.34 5.74 5.56 6.00 5.67Female Headed 16.22 17.89 17.57 18.64 21.32 16.54 17.13 19.56 15.07 21.27 18.23 19.86 14.56 18.81
AverageAge 23.08 24.01 25.57 25.90 29.91 22.71 23.70 27.37 26.06 25.49 25.49 26.31 22.50 25.73Number of Children LessThan6Years 1.50 1.11 0.83 0.63 0.46 1.61 1.24 0.62 0.98 0.85 0.94 0.84 1.15 0.90
NumberofElderlyPeople 0.34 0.23 0.26 0.17 0.18 0.34 0.28 0.20 0.30 0.19 0.23 0.25 0.14 0.24
Years SchoolingMothers 3.64 5.21 6.43 8.26 10.90 3.57 4.72 8.79 4.67 8.61 7.41 6.71 6.22 7.08
25 YearsOld 6.31 7.10 8.89 10.04 12.43 6.80 6.96 10.74 6.84 10.60 9.37 8.97 8.86 9.19
Household &Spouse 3.37 4.87 6.14 7.96 11.17 3.28 4.38 8.91 4.51 8.95 7.32 7.05 6.34 7.17Dependance Rate 3.47 2.62 2.28 2.02 1.63 3.53 2.94 1.96 2.84 2.08 2.46 2.27 3.15 2.40HouseHasBad Wall 32.31 25.29 17.86 12.19 2.28 32.46 27.77 9.71 26.43 11.90 29.07 4.93 2.13 18:01House Has Mud Floor 34.13 14.58 7.54 3.66 1.50 36.02 22.41 3.72 23.71 3.94 4.80 22.75 1.91 12.26
Percent Lacking PipedWater 75.41 58.56 41.00 31.34 12.13 74.27 64.07 26.46 71.71 23.18 51.02 32.42 62.69 43.59
House WithoutElectricity 22.31 10.27 4.44 1.38 0.61 22.15 15.05 1.07 18.12 0.26 7.18 6.90 28.33 7.77Overcrowded 0.37 0.51 0.58 0.71 1.09 0.35 0.45 81.95 0.58 0.71 0.63 0.69 0.62 0.66Rent Home 21.38 27.00 31.06 34.94 33.02 21.61 25.63 32.73 19.99 36.68 26.33 34.23 26.42 29.66
Source: LSMS 98.
Statistical Annex, Page 2
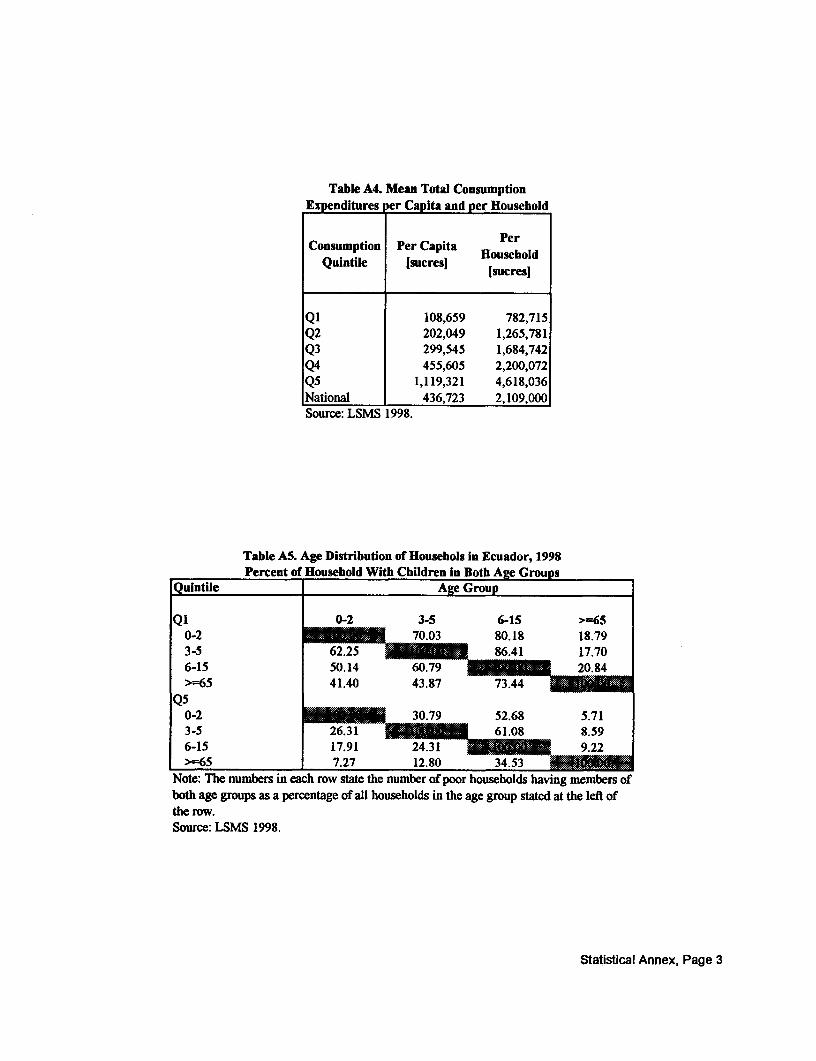
Table A4. Mean Total ConsumptionExpenditures 1 er Capita and per Household
Consumption Per Capita PerQuintile Isucres] Hsucresl
Q1 108,659 782,715Q2 202,049 1,265,781Q3 299,545 1,684,742Q4 455,605 2,200,072Q5 1,119,321 4,618,036National 436,723 2,109,000Source: LSMS 1998.
Table AS. Age Distribution of Househols in Ecuador, 1998Percent of Household With Children in Both Age Groups
Quintile Age Group
Q0 2 35 -15 >=650-2 _70.03 80.18 18.793-S 6 .706-15 50.14 60 _>=65 41.40 43.87 73.44
Q50-2 52.68 5.713-5 26.31 61.08 8.596-15 17.91 24.31>=65 7.27 12.80 34.53
Note: The numbers in each row state the number of poor households having members ofboth age groups as a percentage of all households in the age group stated at the left ofthe row.Source: LSMS 1998.
Statistical Annex, Page 3
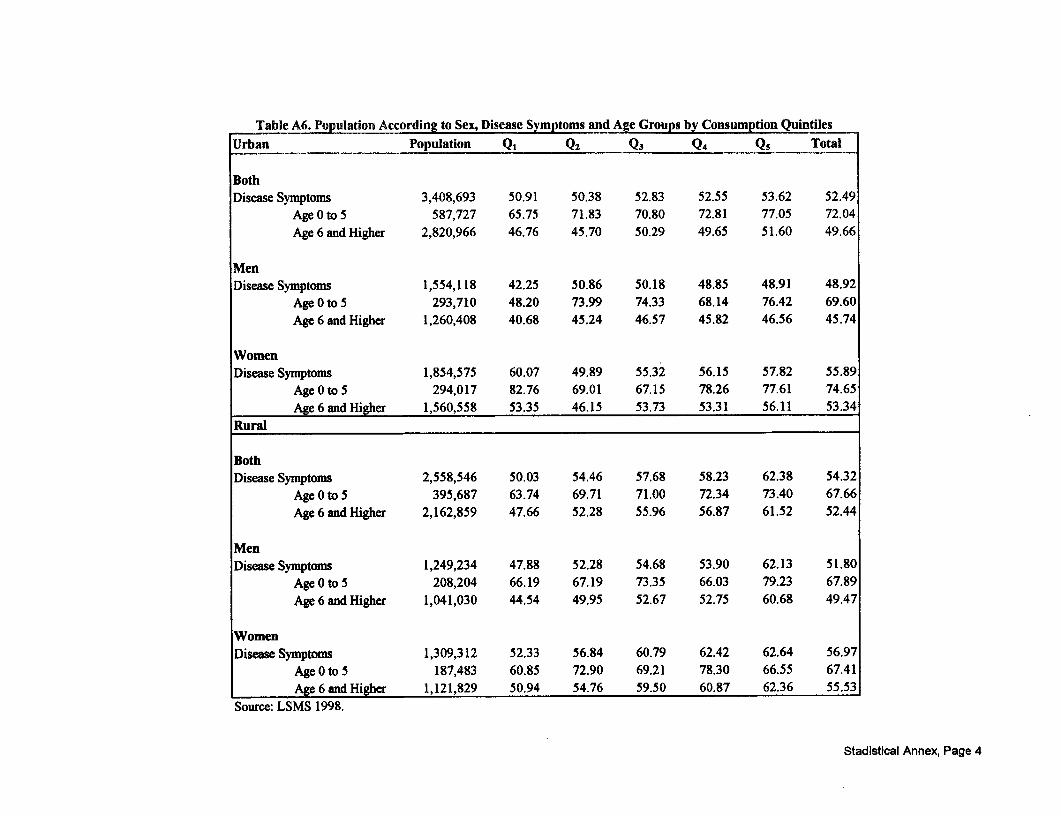
Table A6. Population According to Sex, Disease Symptoms and Age Groups by Consumption Quintiles
Urban Population Q1 Q2 Q3 Q4 Qs Total
BothDisease Symptoms 3,408,693 50.91 50.38 52.83 52.55 53.62 52.49
Age 0 to 5 587,727 65.75 71.83 70.80 72.81 77.05 72.04
Age 6 and Higher 2,820,966 46.76 45.70 50.29 49.65 51.60 49.66
MenDisease Symptoms 1,554,118 42.25 50.86 50.18 48.85 48.91 48.92
Age 0 to 5 293,710 48.20 73.99 74.33 68.14 76.42 69.60
Age 6 and Higher 1,260,408 40.68 45.24 46.57 45.82 46.56 45.74
WomenDisease Symptoms 1,854,575 60.07 49.89 55.32 56.15 57.82 55.89
Age 0 to 5 294,017 82.76 69.01 67.15 78.26 77.61 74.65
Age 6 and Higher 1,560,558 53.35 46.15 53.73 53.31 56.11 53.34
Rural
BothDisease Symptoms 2,558,546 50.03 54.46 57.68 58.23 62.38 54.32
Age 0 to 5 395,687 63.74 69.71 71.00 72.34 73.40 67.66
Age 6 and Higher 2,162,859 47.66 52.28 55.96 56.87 61.52 52.44
MenDisease Symptoms 1,249,234 47.88 52.28 54.68 53.90 62.13 51.80
Age 0 to 5 208,204 66.19 67.19 73.35 66.03 79.23 67.89
Age 6 and Higher 1,041,030 44.54 49.95 52.67 52.75 60.68 49.47
WomenDisease Symptoms 1,309,312 52.33 56.84 60.79 62.42 62.64 56.97
Age 0 to 5 187,483 60.85 72.90 69.21 78.30 66.55 67.41
Age 6 and Higher 1,121,829 50.94 54.76 59.50 60.87 62.36 55.53
Source: LSMS 1998.
Stadistical Annex, Page 4

Table A7. Type of Health Providers Attending to Individuals with Diseae Symptonms by Consumption Quinties
Urban Population Qi Q2 Q3 Q4 Q5 Total
Both 1,590,385 100.00 100.00 100.00 100.00 100.00 100.00Hospital 259,746 14.22 16.76 14.67 17.44 16.60 16.33Healih Center 120,080 15.55 10.93 7.56 7.66 4.52 7.55Healih Subcenter 69,076 6.93 6.20 5.22 4.18 2.63 4.34Clinic 639,533 27.11 30.33 37.09 39.20 49.82 40.21Phamacy 375,654 32.39 30.67 29.65 24.41 14.44 23.62
Home 69,042 NA 1.89 2.22 3.38 8.34 4.34Other 57,254 3.80 3.22 3.58 3.73 3.64 3.60
Men 727,473 100.00 100.00 100.00 100.00 100.00 100.00Hospital 131,849 16.13 19.85 15.23 20.13 17.73 18.12Health Center 56,577 21.36 13.43 6.68 6.00 3.89 7.78Heath Subcenter 35,130 6.96 6.81 5.73 4.56 2.77 4.83Clinic 272,443 18.42 26.47 38.15 39.94 45.39 37.45Pharmacy 176,382 33.98 29.15 28.88 22.68 17.32 24.25Home 24,543 NA 1.20 1.61 2.61 7.37 3.37Oder 30,549 3.16 3.10 3.72 4.09 5.54 4.20
Women 862,912 100.00 100.00 100.00 100.00 100.00 100.00Hospital 127,897 12.28 13.05 14.17 15.30 15.81 14.S2Health Center 63,503 9.67 7.94 8.35 9.00 4.97 7.36Health Subcenter 33,946 6.90 5.47 4.78 3.87 2.53 3.93Clinic 367,090 35.92 34.95 36.15 38.60 52.92 42.54Phanmacy 199,272 30.77 32.50 30.33 25.79 12.42 23.09Home 44,499 NA 2.72 2.77 4.00 9.02 5.16Other 26,705 4.46 3.38 3.46 3.44 2.32 3.09
|Rural
Both 984,836 100.00 100.00 100.00 100.00 100.00 100.00Hospital 137,597 15.32 12.68 13.92 12.69 16.44 13.97Health Center 63,622 6.39 7.78 7.66 6.42 0.54 6.46Health Subcenter 164,786 22.23 16.02 16.43 14.63 9.59 16.73Clinic 360,968 30.31 35.20 33.39 44.93 48.70 36.65Phannacy 192,748 16.91 21.95 23.88 13.93 20.08 19.57Home 30,306 4.07 3.17 2.45 2.69 2.48 3.08Odher 34,809 4.77 3.19 2.27 4.71 2.17 3.53
Mein 484,605 100.00 100.00 100.00 100.00 100.00 100.00Hospital 69,529 15.38 12.63 14.60 13.84 16.40 14.35Health Center 31,174 5.95 8.07 7.84 6.35 0.66 6.43Health Subcenter 76,945 22.99 14.02 14.98 14.61 6.98 15.88Clinic 179,147 29.95 37.31 30.43 47.49 50.15 36.97Pharmacy 99,500 18.64 20.16 27.91 13.91 21.28 20.53Home 12,833 2.82 3.39 2.51 1.13 3.10 2.65Odier 15,477 4.28 4.42 1.72 2.66 1.44 3.19
WOUND 500,231 100.00 100.00 100.00 100.00 100.00 100.00Hospital 68,068 15.27 12.73 13.28 11.65 16.48 13.61Health Center 32.448 6.86 7.52 7.49 6.49 0.41 6.49Health Subcenter 87,841 21.42 17.88 17.80 14.64 12.28 17.56Clinic 181,821 30.70 33.23 36.19 42.62 47.21 36.35Phannacy 93,248 15.08 23.62 20.06 13.94 18.84 18.64Home 17,473 5.39 2.96 2.39 4.09 1.84 3.49Other 19,332 5.29 2.05 2.80 6.55 2.93 3.86
Source: LSMS 1998.
Statistical Annex, Page 5
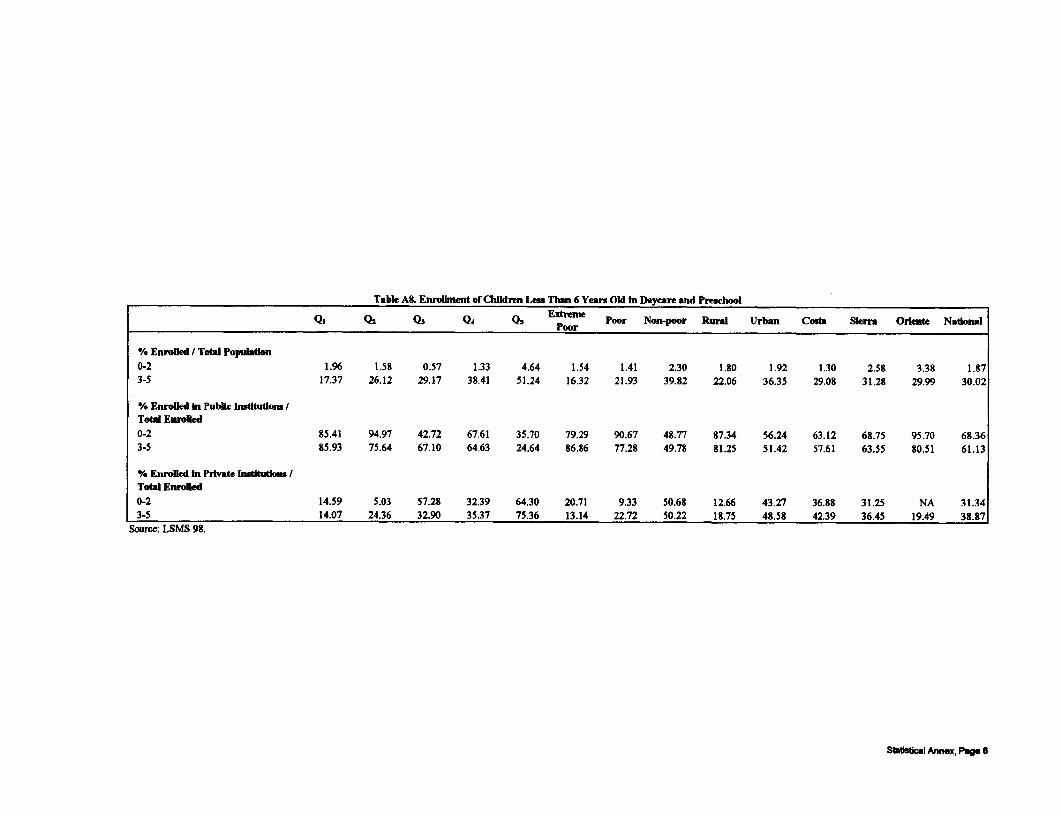
Table A. Enrolment of Chgdren Less Than 6 Years Old In Dayeare and Preschool
Qs Q2 Q3 Q4 Qs Extrem Poor Non-poor Ruanl Urban Costs Siem Oriente NadonalPoor
% Enroled / Totl Popultion0-2 1.96 1.58 0.57 1.33 4.64 1.54 1.41 2.30 1.80 1.92 1.30 2.58 3.38 1.873-5 17.37 26.12 29.17 38.41 51.24 16.32 21.93 39.82 22.06 36.35 29.08 31.28 29.99 30.02
% Enroled hn Public lIsditutlona /Total Enrolled0-2 85.41 94.97 42.72 67.61 35.70 79.29 90.67 48.77 87.34 56.24 63.12 68.75 95.70 68.363-5 85.93 75.64 67.10 64.63 24.64 86.86 77.28 49.78 81.25 51.42 57.61 63.55 80.51 61.13
% Enroled In Private Instkutions Totd Enroled0-2 14.59 5.03 57.28 32.39 64.30 20.71 9.33 50.68 12.66 43.27 36.88 31.25 NA 31.343-5 14.07 24.36 32.90 35.37 75.36 13.14 22.72 50.22 18.75 48.58 42.39 36.45 19.49 38.87
Soure: LSMS 98.
Sttdstical Annex, Pag 6
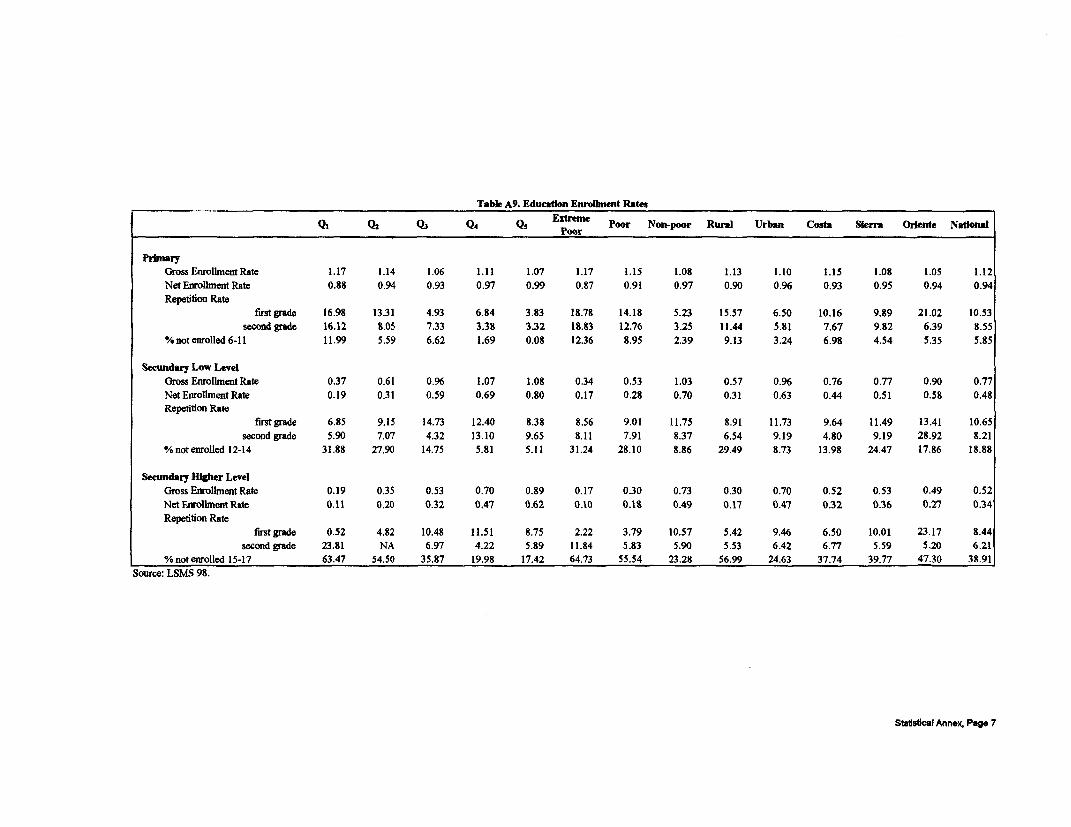
Tabk A9. Education Enrollment Rates
Qi Q2 QJ Q4 Q5 Exhtmene Poor Non-poor Ruual Urban Costa Sierra Oriente National
PrimaryGross EnrollmentRate 1.17 1.14 1.06 1.11 1.07 1.17 1.15 1.08 1.13 1.10 1.15 1.08 1.05 1.12
NetEnrollmentRate 0.88 0.94 0.93 0.97 0.99 0.87 0.91 0.97 0.90 0.96 0.93 0.95 0.94 0.94
Repetition Ratefirst grade 16.98 13.31 4.93 6.84 3.83 18.78 14.18 5.23 15.57 6.50 10.16 9.89 21.02 10.53
second grade 16.12 8.05 7.33 3.38 3.32 18.83 12.76 3.25 11.44 5.81 7.67 9.82 6.39 8.55
%notenrolled6-11 11.99 5.59 6.62 1.69 0.08 12.36 8.95 2.39 9.13 3.24 6.98 4.54 5.35 5.85
Secundary Low LevelGross EnrollmentRate 0.37 0.61 0.96 1.07 1.08 0.34 0.53 1.03 0.57 0.96 0.76 0.77 0.90 0.77
Net Enroliment Rate 0.19 0.31 0.59 0.69 0.80 0.17 0.28 0.70 0.31 0.63 0.44 0.51 0.58 0.48
Repetition Ratefirstgrade 6.85 9.15 14.73 12.40 8.38 8.56 9.01 11.75 8.91 11.73 9.64 11.49 13.41 10.65
second grade 5.90 7.07 4.32 13.10 9.65 8.11 7.91 8.37 6.54 9.19 4.80 9.19 28.92 8.21
%not enrolled 12-14 31.88 27.90 14.75 5.81 5.11 31.24 28.10 8.86 29.49 8.73 13.98 24.47 17.86 18.88
Secundary Higher LevelGross EnollmentRate 0.19 0.35 0.53 0.70 0.89 0.17 0.30 0.73 0.30 0.70 0.52 0.53 0.49 0.52
Net Enrollment Rate 0.11 0.20 0.32 0.47 0.62 0.10 0.18 0.49 0.17 0.47 0.32 0.36 0.27 0.34
Repetition Ratefirstgrade 0.52 4.82 10.48 11.51 8.75 2.22 3.79 10.57 5.42 9.46 6.50 10.01 23.17 8.44
second grade 23.81 NA 6.97 4.22 5.89 11.84 5.83 5.90 5.53 6.42 6.77 5.59 5.20 6.21
%notenrolled 15-17 63.47 54.50 35.87 19.98 17.42 64.73 55.54 23.28 56.99 24.63 37.74 39.77 47.30 38.91
Source: LSMS 98.
Stadstical Annex, Page 7
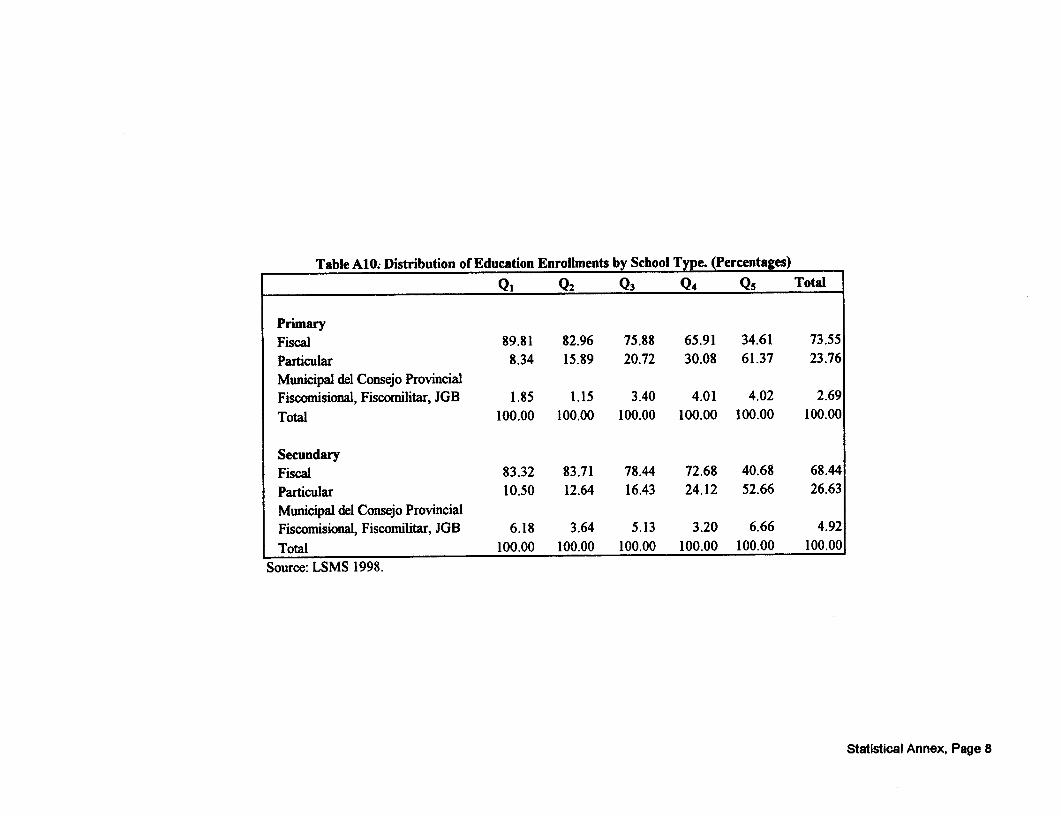
Table A10; Distribution of Education Enrollments by School Type. (Percentages)
Qi Q2 Q3 Q4 Q5 Total
PrimaryFiscal 89.81 82.96 75.88 65.91 34.61 73.55
Particular 8.34 15.89 20.72 30.08 61.37 23.76
Municipal del Consejo ProvincialFiscomisional, Fiscomilitar, JGB 1.85 1.15 3.40 4.01 4.02 2.69
Total 100.00 100.00 100.00 100.00 100.00 100.00
SecundaryFiscal 83.32 83.71 78.44 72.68 40.68 68.44
Particular 10.50 12.64 16.43 24.12 52.66 26.63
Municipal del Consejo ProvincialFiscomisional, Fiscomilitar, JGB 6.18 3.64 5.13 3.20 6.66 4.92
Total 100.00 100.00 100.00 100.00 100.00 100.00
Source: LSMS 1998.
Statistical Annex, Page 8

Table All. Monthly Education Expenditures by Households with Children between 6 and 17 YearsOld in Public Schools
Qi Q2 Q3 Q4 Qs
TotalPrimary 13,120 20,634 26,781 41,770 74,349Secundary Low Level 28,983 41,367 49,479 59,405 107,826Secundary High Level 56,608 57,583 58,195 87,905 159,359
TransportPrimary 937 2,132 2,405 4,064 6,927SecundaryLowLevel 3,510 6,279 8,431 6,912 13,215Secundary High Level 5,373 7,853 6,880 9,461 12,554
Text and educational materialPrimary 5,011 7,159 9,324 12,956 17,368Secundary Low Level 10,818 14,720 19,434 21,812 33,693Secundary High Level 23,376 20,525 21,680 27,864 61,534
Other (enrollments, uniforms..)Primary 7,171 11,343 15,052 24,751 50,055Secundary Low Level 14,656 20,368 21,613 30,682 60,918Secundary High Level 27,858 29,205 29,634 50,579 85,272
Consumption per capitaPrimary 106,469 199,145 295,651 448,245 815,011Secundary Low Level 123,722 204,159 301,544 452,088 793,677Secundary High Level 125,458 209,224 302,588 464,499 838,967
Per student educationalexpenditure / consumption per
Prinmary 12.32 10.36 9.06 9.32 9.12Secundary Low Level 23.43 20.26 16.41 13.14 13.59SecundaryHighLevel 45.12 27.52 19.23 18.92 18.99
Total household consumptionPrimary 845,522 1,437,782 1,850,573 2,589,409 4,365,905Secundary Low Level 1,018,731 1,528,933 1,995,391 2,606,158 4,474,248Secundary High Level 1,050,260 1,573,821 1,928,427 2,896,528 4,120,318
Per student educationalexpenditure / total household
Primary 1.55 1.44 1.45 1.61 1.70Secundary Low Level 2.85 2.71 2.48 2.28 2.41Secundary High Level 5.39 3.66 3.02 3.03 3.87
Note: Monthly Education Expenditures = Total expenditure in target level / number of children between 6-17enrolled in target level.
Source: LSMS 98.
Statistical Annex, Page 9

Tak A12 Moout Educ.tlm Expe_dkw hL HombA wibt CbiIdrm betwwe 6 _md 17 Yom Old in Pubic Seboob
Ql Qz Qs Q4 Qs PEiu- PoWt Ne-powr Rl Urba Cotd Siewm Orate Natloesi
TotlPriay 13,120 20,634 26,781 41.770 74,349 12,599 17,336 43,1m 17,780 38,485 21,004 37,766 24,246 28,559Scomdary Low Levwl 28,983 41,367 49,479 59,405 107,826 29,320 37,171 68,293 41,310 62,933 39,866 70,273 53,348 54,355Se-dary HihLvel 56,608 57,5U3 58,195 37,905 159,359 49,610 56,052 100,743 59,153 95,991 79,869 91,479 86,4S4 85,276
Tra_rtPrimay 937 2,132 2,405 4,064 6,927 591 1,495 4,210 1,542 3,649 760 4,901 1,902 2,[email protected] 3,510 6,279 8,431 6,912 13,215 2,763 5,091 9,306 5,127 8,975 1,917 13,496 6,473 7,412SecdayHlghLc-l 5,373 7,853 6,S80 9,461 12,554 4,368 6,266 10,053 7,25S 9,464 2,266 15,335 18,812 8,323
Text and labcaosi materiiPrimay 5,011 7,159 9,324 12,956 17,361 5,012 6,334 12,660 6,012 11,804 7,089 11,345 S,454 9,027SecwudayLowLewvl 10,818 14,720 19,434 21,812 33,693 11,909 13,679 24,081 15,539 22,047 14,740 24,129 16,076 19,423SecundryHi hLevel 23,376 20,525 21,680 27,S64 61,534 19,769 20,911 35,745 19,451 35,140 31,141 29,545 36,K60 30,577
Other (earoulnuat, utoeu...)Primary 7,171 11,343 15,052 24,751 50,055 6,995 9,507 26,908 10,226 23,032 13,155 21,520 13,890 16,893SewdaryLowLevel 14,656 20,368 21,613 30,632 60,913 14,64S 18,401 34,907 21,094 31,917 23,210 31,948 30,799 27,520Secudary ffigh Level 27,358 29,205 29,634 50,579 35,272 25,473 28,875 54,946 32,443 51,387 46,462 46,099 30,812 45,377
% Primrytrapot 7.14 10.33 8.9" 9.73 9.32 4.69 8.62 9.62 8.67 9.48 3.62 12.9S 7.S5 9.24texl 33.19 34.69 34.32 31.02 23.36 39.78 36.54 23.92 33.31 30.67 33.75 30.04 34.M7 31.61other 54.66 54.97 56.20 59.25 67.32 55.52 54.84 61.47 57.52 59.85 62.63 56.98 57.29 59.15
% SLLtfulsport IZII 15.18 17.04 11.63 12.26 9.42 13.70 13.63 12.26 14.26 4.81 19.21 12.13 13.64text 37.32 35.58 39.28 36.72 31.25 40.62 36.80 35.26 37.29 35.03 36.97 35.33 30.13 35.73oher 50.57 49.24 43.68 51.65 56.50 49.96 49.51 51.11 50.45 50.71 58.22 45.46 57.73 50.63
% SHLtansot 9.49 13.64 11.S2 10.76 7.8S 8.81 11.18 9.9S 12.27 9.S6 2.84 17.31 21.75 10.35te3d 41.30 35.65 37.25 31.70 38.61 39.J5 37.31 35.48 32.88 36.61 3S.99 32.30 42.62 35.86oder 49.21 50.72 50.92 57.54 53.51 51.35 51.51 54.54 54.85 53.53 58.17 50.39 35.63 53.80
Surc: LSMS 199S.
Statiai Ann,r Pop 10
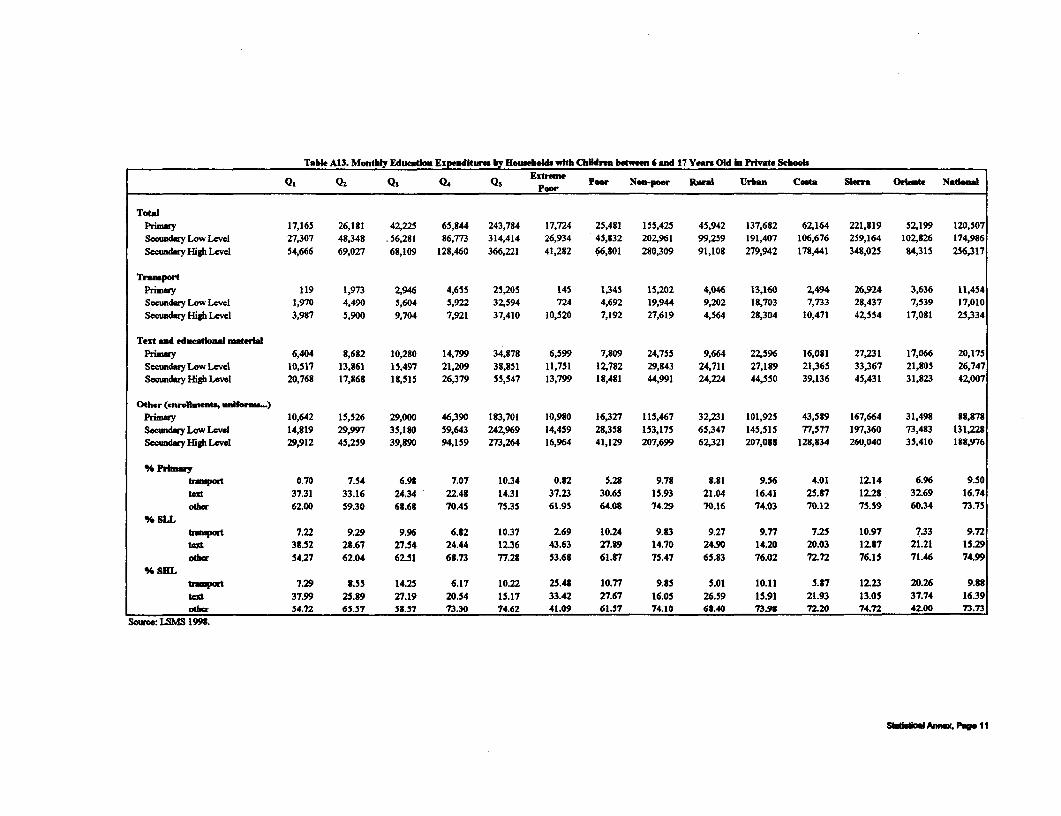
Table A13. Monthly Educaton Expenditures by HoueeWs wlkth Children between 6 and 17 Yean Old In Privte Seee
Ql Q, QsQs Q Q Extrme r Ne_per P Rural Uribn CostR Slerr Orite N _IenaPoor
TotalPrimazy 17,165 26,181 42,225 65,844 243,784 17,724 25,481 155,425 45,942 137,682 62,164 221,819 52,199 120,507Scoundry Low Level 27,307 48,348 .56,281 86,773 314,414 26,934 45,832 202,961 99,259 191,407 106,676 259,164 102,826 174,986SecundsiyHighLevel 54,666 69,027 68,109 128,460 366,221 41,282 66,801 280,309 91,108 279,942 178,441 348,025 84,315 256,317
TranportPrimay 119 1,973 2,946 4,655 25,205 145 1,345 15,202 4,044 13,160 2,494 26,924 3,636 11,454Seoundary Low Level 1,970 4,490 5,604 5,922 32,594 724 4,692 19,944 9,202 13,703 7,733 28,437 7,539 17,010Secundary High Level 3,987 5,900 9,704 7,921 37,410 10,520 7,192 27,619 4,564 28,304 10,471 42,554 17,081 25,334
Text and educalenal materblPrimay 6,404 8,682 10,280 14,799 34,878 6,599 7,809 24,755 9,664 22,596 16,081 27,231 17,066 20,175Secndary Low Level 10,517 13,861 15,497 21,209 38,851 11,751 12,782 29,S43 24,711 27,189 21,365 33,367 21,805 26,747Secwxtaryligh Level 20,768 17,868 18,515 26,379 55,547 13,799 18,481 44,991 24,224 44,550 39,136 45,431 31,823 42,007
Other (enrollents, unfe-)Primay 10,642 15,526 29,000 46,390 183,701 10,980 16,327 115,467 32,231 101,925 43,589 167,664 31,498 88,878SecundayLowLevel 14,819 29,997 35,180 59,643 242,969 14,459 28,358 153,175 65,347 145,515 77,577 197,360 73,483 131,228Secundary Higb Lavel 29,912 45,259 39,890 94,159 273,264 16,964 41,129 207,699 62,321 207,088 128,834 260,040 35,410 18,976
% Prii.aRpo-t 0.70 7.54 6.98 7.07 10.34 0.82 5.28 9.78 8.81 9.56 4.01 12.14 6.96 9.50
text 37.31 33.16 24.34 22.48 14.31 37.23 30.65 15.93 21.04 16.41 25.87 12.28 32.69 16.74odw 62.00 59.30 68.68 70.45 75.35 61.95 64.08 74.29 70.16 74.03 70.12 75.59 60.34 73.75
% SLLIraupoet 7.22 9.29 9.96 6.82 10.37 2.69 10.24 9.83 9.27 9.77 7.25 10.97 7.33 9.72tetl 38.52 28.67 27.54 24.U 12.36 43.63 27.89 14.70 24.90 14.20 20.03 12.87 21.21 15.29odher 54.27 62.04 62.51 68.73 77.28 53.68 61.87 75.47 65.83 76.02 72.72 76.15 71.46 74.99
% SHLtrAt 7.29 8.55 14.25 6.17 10.22 25.48 10.77 9.85 5.01 10.11 5.87 12.23 20.26 9.8Stext 37.99 25.89 27.19 20.54 15.17 33.42 27.67 16.05 26.59 15.91 21.93 13.05 37.74 16.39udier 54.72 65.57 58.57 73.30 74.62 41.09 61.57 74.10 68.40 73.98 72.20 74.72 42.00 73.73
Sowce:LSMS 1998.
S P10loM 1nn Page 1I

Table A14. MontMy Educatien Eipm 4dku by .uRel sde with Children between 4 and 17 Yeaw Old in Publi un Privte S dhoob
Qi Q, Q3 Q4 Qs Extrm POo Non-po Rurgl Urban Coeta Semn Oriente NatlenalPOor
TotalPrimay 13,494 21,517 30,091 49,077 176,324 13,070 18,467 85,385 21,122 73,204 33,030 78,557 27,070 52,137
See_aryLowLevel 28,816 42,116 50,824 66,658 215,315 29,081 38,247 112,692 49,199 103,755 57,738 116,981 56,308 84,724
SeoundaryHighLcvel 56,422 59,0S4 60,174 97,384 286,368 49,103 57,468 170,816 64,529 163,528 111,797 174,978 86,300 139,9S0
TrportPrimary 862 2,107 2,521 4,243 17,927 550 1,474 8,306 1,839 6,978 1,267 9,782 2,077 4,899
Secundary Low Lcvel 3,356 6,087 7,872 6,649 23,298 2,558 5,041 12,813 5,651 12,066 3,473 17,191 6,537 9,828
SeoundaryllighLevel 5,240 7,596 7,444 9,101 27,815 4,743 6,388 16,908 6,805 16,381 4,923 24,531 18,665 14,104
Text and educational materalPrimry 5,140 7,401 9,529 13,516 27,906 5,158 6,539 17,167 6,446 15,581 9,716 14,865 9,324 11,886
Secondary Low Level 10,7S8 14,628 18,656 21,652 36,377 11,893 13,567 25,980 16,762 23,681 16,512 26,940 16,418 21,267
Secundary High Lcvcl 23,127 20,177 21,048 27,517 57,858 19,406 20,591 39,353 20,254 38,595 33,731 34,716 36,432 34,232
Other (enrollments, unifeos-.)Primary 7,492 12,009 18,042 31,318 130,490 7,362 10,454 59,911 12,838 50,644 22,047 53,910 15,669 35,352
Secondary Low Level 14,672 21,401 24,297 38,356 155,641 14,629 19,639 73,899 26,785 68,008 37,753 72,850 33,353 53,629
SecndaryHighLcvel 28,055 31,311 31,682 60,766 200,695 24,954 30,489 114,555 37,469 108,552 73,142 115,731 31,203 91,644
% Primarytprt 6.38 9.79 8.38 8.65 10.17 4.21 7.98 9.73 8.71 9.53 3.84 12.45 7.67 9.40
text 38.09 34.40 31.67 27.54 15.83 39.46 35.41 20.11 30.52 21.28 29.42 18.92 34.44 22.80
other 55.53 55.81 59.96 63.81 74.01 56.33 56.61 70.17 60.78 69.18 66.75 68.63 57.88 67.81
% SLLtrant 11.65 14.45 15.49 9.98 10.82 8.80 13.18 11.37 11.49 11.63 6.01 14.70 11.61 11.60
text 37.44 34.73 36.71 32.48 16.89 40.90 35.47 23.05 34.07 22.82 28.60 23.03 29.16 25.10
Other 50.92 50.81 47.81 57.54 72.28 50.31 51.35 65.58 54.44 65.55 65.39 62.28 59.23 63.30
% SHLtrapot 9.29 IZ6 12.37 9.35 9.71 9.66 11.12 9.90 10.55 10.02 4.40 14.02 21.63 10.08
text 40.99 34.15 34.98 28.26 20.20 39.52 35.83 23.04 31.39 23.60 30.17 19.84 42.22 24.46
other 49.72 52.99 52.65 62.40 70.08 50.82 53.05 67.06 58.07 66.38 65.42 66.14 36.16 65.47
Soee: LSMS 1998.
S talicl Aamu, Pap 12
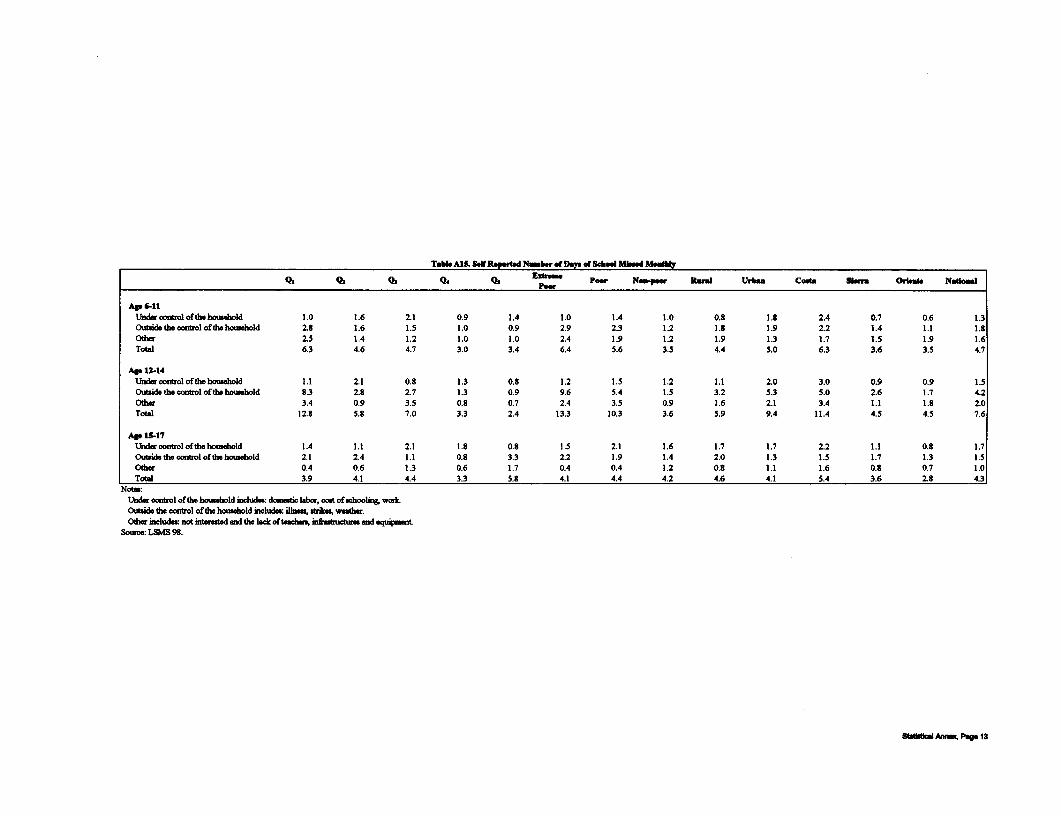
Table AIL Sef Repored Numbe of Days of Sol MNsse Mon"
Q, Q2 Qs Q Qs EQs Poor N _-p. Rol Urba_ CA SMerra Oleab Natlotal
Ae 6-11Ulnderoontolofthe howhold 1.0 1.6 2.1 0.9 1.4 1.0 1.4 1.0 O.S 1.8 2.4 0.7 0.6 1.3Oubiithocontcolofthehousehold 2.8 1.6 1.5 1.0 0.9 2.9 2.3 1.2 1.8 1.9 2.2 1.4 1.1 1.8O0I 2.5 1.4 1.2 1.0 1.0 2.4 1.9 1.2 1.9 1.3 1.7 1.5 1.9 1.6Total 6.3 4.6 4.7 3.0 3.4 6.4 5.6 3.5 4.4 5.0 6.3 3.6 3.5 4.7
Ae 12-14Undercontrolofthehousehold 1.1 2.1 0.8 1.3 0.8 1.2 1.5 1.2 1.1 2.0 3.0 0.9 0.9 1.5Ousidethecontrolofthehouohold 8.3 2.8 2.7 1.3 0.9 9.6 5.4 1.5 3.2 5.3 5.0 2.6 1.7 4.2Other 3.4 0.9 3.5 0.8 0.7 2.4 3.5 0.9 1.6 2.1 3.4 1.1 1.8 2.0Total 12.8 5.8 7.0 3.3 2.4 13.3 10.3 3.6 5.9 9.4 11.4 4.5 4.5 7.6
AV 18-17Underoontrolofthehousehold 1.4 1.1 2.1 1.8 0.8 1.5 2.1 1.6 1.7 1.7 2.2 1.1 0.8 1.7Outsidethecontrolofthehetoueold 2.1 2.4 1.1 0.8 3.3 2.2 1.9 1.4 2.0 1.3 1.5 1.7 1.3 1.5Other 0.4 0.6 1.3 0.6 1.7 0.4 0.4 1.2 0.8 1.1 1.6 0.8 0.7 1.0Total 3.9 4.1 4.4 3.3 5.8 4.1 4.4 4.2 4.6 4.1 5.4 3.6 2.8 4.3
NoteEUnder control of the houehld nclude: domestic labor, cost of schooling. workOutside the control of the houehold ncluds: ilhn, s,tie weter.Odtr includes: not inbteestd md the lack of u infirstructures and equiment
Source: LSMS 98.
SMb8cal Annf t Pap 13

Table A16. Chgdren's Economic and Educatinal Activity. Age Group 6-11. (Percentages)
Total Work and OyWork Total OnlyStudyNo Work nor Totalschool 0.1' Working OnlyStud
Girls 6.10 OA9 6.60 89.67 3.73 100.00
Boys 8.82 0.75 9.56 83.69 6.74 100.00
; Total 7.48 0.62 8.10 86.64 5.26 100.00
i Girls 9.69 1.12 10.81 83.26 5.93 100.00Boys 13.67 1.43 15.11 75.21 9.68 100.00
ii Total 11.73 1.28 13.01 79.13 7.86 100.00
j Girls 3.30 0.00 3.30 94.70 2.01 100.00
Boys 4.84 0.19 5.03 90.64 4.33 100.00
Total 4.07 0.09 4.17 92.66 3.17 100.00
lstQ. Work and OnlyWork Total OnlyStuy No Work nor TotalSchool Worling School
s Girls 9.07 1.76 10.83 82.72 6.45 100.00
Boys 12.04 2.08 14.12 72.54 13.34 100.00
E- TotlW 10.63 1.93 12.56 77.38 10.06 100.00
Girls 9.96 2.19 12.15 80.14 7.71 100.00
Boys 14.67 2.36 17.03 68.87 14.10 100.00
0 Total 12.40 2.28 14.68 74.31 11.02 100.00
3 Girls 5.37 0.00 5.37 93.38 1.25 100.00
Boys 2.59 1.08 3.67 85.73 10.60 100.00
Total 3.84 0.59 4.43 89.17 6.40 100.00
2d Q. Work and Ol Work Total Only Stdy No Work nor Totalschool Ou1' Workin ny td School
Girls 8.62 0.09 8.71 86.50 4.79 100.00
Boys 11.16 0.31 11.48 82.51 6.01 100.00
FI Total 9.87 0.20 10.07 84.54 5.39 100.00
'4 Girls 12.89 0.17 13.06 82.36 4.58 100.00Boys 12.42 0.55 12.97 81.70 5.33 100.00
i Total 12.65 0.36 13.01 82.03 4.96 100.00
; Girls 3.37 0.00 3.37 91.59 5.04 100.00
Boys 9.45 0.00 9.45 83.62 6.92 100.00Total 6.28 0.00 6.28 87.78 5.94 100.00
Source: LSMS 1998.
Statistical Annex, Pagel4

Table A17. Clhdren's Economic and Educational Activity. Age Group 12-14 (Percentages)
Total Work and OnlyWork Total Only Study No Work nor Totalschool Ol' Working School
Girls 20.84 0.41 31.25 59.17 9.57 100.00Boys 33A8 14.53 48.01 48.65 3.34 100.00
i Tota 27.26 12.51 39.76 53.83 6.41 100.00
i Girls 24.96 16.36 41.32 44.43 14.25 100.00Boys 44.43 25.20 69.62 27.14 3.24 100.00
0 Total 34.76 20.81 55.57 35.72 8.71 100.00
; Girls 16.82 4.62 21.45 73.54 5.01 100.00Boys 23.17 4.49 27.66 68.90 3.44 100.00
; Total 20.07 4.56 24.63 71.17 4.20 100.00
1stQ. okw nyWr Total OnyStd No Work nor Tb
or l rl Worldng School Tol
Girls 23.53 20.55 44.08 43.00 12.92 100.00Boys 35.27 27.42 62.69 34.12 3.20 100.00
| Total 30.06 24.37 54.43 38.06 7.51 100.00
2 Girls 25.86 24.28 50.15 35.73 14.12 100.00Bey 40.78 32.53 73.32 22.96 3.72 100.00
Ad Total 33.99 28.77 62.76 28.78 8.46 100.00
Girls 13.58 4.60 18.18 74.07 7.75 100.00ffi Boys 16.55 10.07 26.62 71.96 1.42 100.005 Total 15.36 7.89 23.25 72.80 3.95 100.00
2nd Q. Work and Only Work Total Ol,y Study No Work nor TohlSchool Working SchoolToa
Girls 20.18 13.97 34.16 50.80 15.04 100.00Boys 39.15 18.10 57.25 34.11 8.64 100.00
I Tota 29.50 16.00 45.51 42.60 11.90 100.00
S Girls 20.83 15.28 36.11 46.11 17.77 100.00Boys 46.00 26.21 72.21 23.87 3.92 100.00
A Total 32.68 20.43 53.11 35.64 11.25 100.00
Girls 18.93 IIA3 30.36 59.92 9.72 100.00i Boys 28.52 5.52 34.05 49.98 15.97 100.005 Total 23.99 8.32 32.31 54.68 13.02 100.00
Source: LSMS 1998.
Sbtstical Annex, Pape 15

Table Alg. Children's Economic and Educational Activity. Age Group 15-17. (Percentages)
Total Work and y Total Ol Std No Work nor TotalTotal School Work hinschlylWorldog OnyStd SchoolToa
,. Girls 18.69 21.76 40.45 42.78 16.78 100.00I Boys 31.50 32.48 63.98 29.24 6.78 100.00I. Total 25.47 27.44 52.92 35.61 11.48 100.00
j Girls 16.93 33.85 50.78 25.86 23.35 100.00Boys 32.49 50.92 83.41 10.69 5.91 100.00
i Total 24.97 42.67 67.65 18.02 14.34 100.00
Girls 20.14 11.71 31.85 56.84 11.30 100.00B BOys 30.74 18.51 49.25 43.31 7.44 100.00Total 25.87 15.38 41.25 49.53 9.22 100.00
lst Q. Work and Oy Work Total Only Study No Work nor TotalSchool Worhing School
@ Girls 14.34 41.68 56.03 18.13 25.84 100.00I Boys 20.07 53.55 73.62 19.99 6.39 100.00P Total 17.41 48.03 65.44 19.13 15.44 100.00
-4 Girls 11.81 44.62 56.43 15.83 27.74 100.00E Boys 19.37 69.41 88.78 5.61 5.61 100.00i Total 15.59 57.01 72.59 10.72 16.68 100.00
Girls 27.31 26.68 53.98 29.89 16.13 100.00Boys 21.93 11.49 . 33.42 58.12 8.46 100.00
; Total 23.77 16.68 40.45 48.47 11.08 100.00
2nd Q. Work nd Ol Work Total Only Study No Work nor TotalWcorkad OnyWr Working OnySuy school
-4 Girls 15.37 26.77 42.14 28.47 29.39 100.00I Boys 28.42 45.65 74.08 18.31 7.61 100.00P Total 22.86 37.60 60.46 22.64 16.90 100.00
Girls 14.55 36.83 51.37 17.67 30.95 100.00b Boys 27.25 54.16 81.41 13.21 5.39 100.00ii Total 22.23 47.31 69.54 14.97 15.49 100.00
Z Girls 16.38 14.41 30.80 41.73 27.47 100.00Boys 30.40 31.33 61.73 26.90 11.36 100.00Total 23.78 23.34 47.13 33.91 18.97 100.00
Source: LSMS 1998.
Stascal Annex, Pagel6
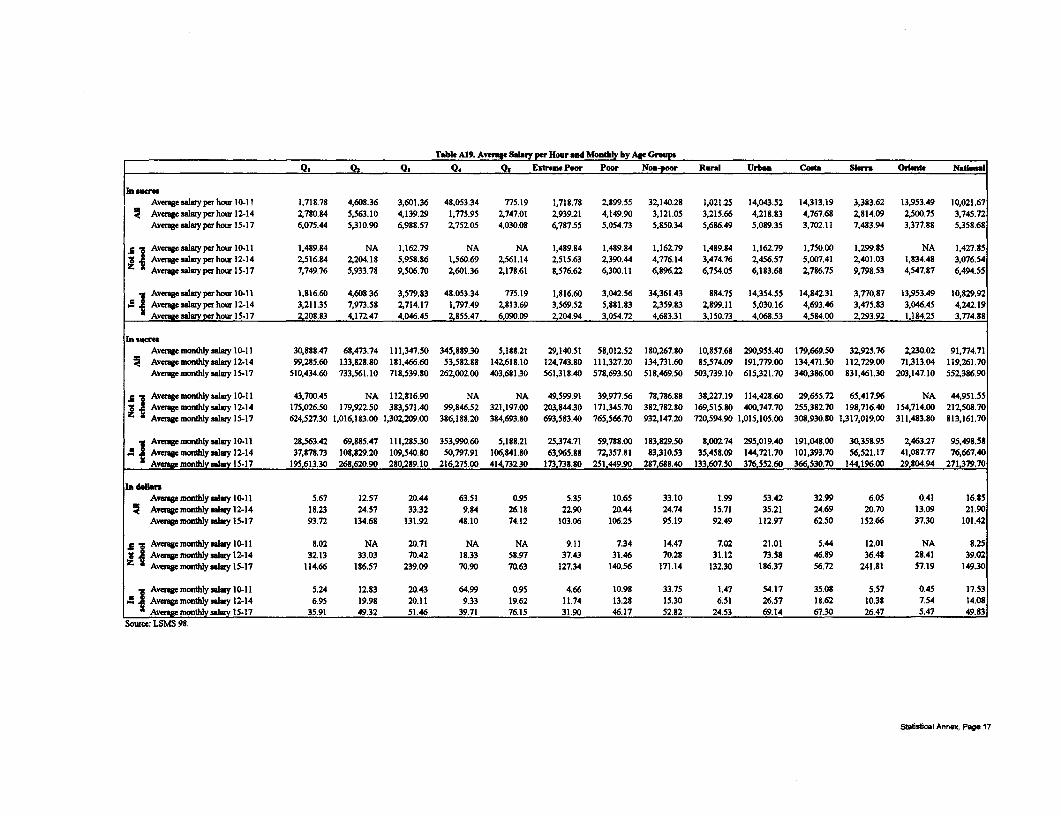
Table Al9. Averag Salary per Hour and Monthly by Age Groups
Q, QS Qs Q, Qs Extrm Poor Poor Non-poor Rural Urba Coaa Sem Orente National
In ueMrAverage salary per hour 10-11 1,718.7S 4,608.36 3,601.36 48,053.34 775.19 1,718.78 2,899.55 32,140.28 1,021.25 14,043.52 14,313.19 3,383.62 13,953.49 10,021.67
i AvenraesWlazryperhour 12-14 2,780.84 5,563.10 4,139.29 1,775.95 2,747.01 2,939.21 4,149.90 3,121.05 3,215.66 4,218.83 4,767.68 2,814.09 2,500.75 3,745.72Avage salary per hour 15-17 6,075.44 5,310.90 6,988.57 2,752.05 4,030.08 6,787.55 5,054.73 5,850.34 5,686.49 5,089.35 3,702.11 7,483.94 3,377.88 5,358.68
* AverageseluyperhourlO-II 1,489.84 NA 1,162.79 NA NA 1,489.84 1,489.84 1,162.79 1,489.84 1,162.79 1,750.00 1,299.85 NA 1,427.85I, Avewe salaryperhour 12-14 2,516.84 2,204.18 5,958.86 1,560.69 2,561.14 2,515.63 2,390.44 4,776.14 3,474.76 2,456.57 5,007.41 2,401.03 1,834.48 3,076.54Z Avege saiy per hour 15-17 7,749.76 5,933.78 9,506.70 2,601.36 2,178.61 8,576.62 6,300.11 6,896.22 6,754.05 6,183.68 2,786.75 9,798.53 4,547.87 6,494.55
I Average aryyperhour 1o-11 1,816.60 4,608.36 3,579.83 48.053.34 775.19 1,816.60 3,042.56 34,361.43 884.75 14,354.55 14,842.31 3,770.87 13,953.49 10,829.92A Average salayper hour 12-14 3,211.35 7,973.58 2,714.17 1,797.49 2,813.69 3,569.52 5,881.83 2,359.83 2,899.11 5,030.16 4,693.46 3,475.83 3,046.45 4,242.19
Avege salry per hour 15-17 2,208.83 4,172.47 4,046.45 2,855.47 6,090.09 2,204.94 3,054.72 4,683.31 3,150.73 4,068.53 4,584.00 2,293.92 1,184.25 3,774.88
In %arAveagemonthlysalwy 10-1 1 30,888.47 68,473.74 111,347.50 345,889.30 5,188.21 29,140.51 58,012.52 180,267.80 10,857.68 290.955.40 179,669.50 32,925.76 2,230.02 91,774.71
a Averagcmonthly slaly 12-14 99,285.60 133,828.80 181,466.60 53,582.88 142,618.10 124,743.80 111,327.20 134,731.60 85,574.09 191,779.00 134,471.50 112,729.00 71,313.04 119,261.70Averagemonthly salary 15-17 510,434.60 733,561.10 718,539.80 262,002.00 403,681.30 561,318.40 578,693.50 518,469.50 503,739.10 615,321.70 340,386.00 831,461.30 203,147.10 552,386.90
u Average monthly selmy 10-11 43,700.45 NA 112,816.90 NA NA 49,599.91 39,977.56 78,786.88 38,227.19 114,428.60 29,655.72 65,417.96 NA 44,951.55X Average monthly saliy 12-14 175,026.50 179,922.50 383,571.40 99,846.52 321,197.00 203,844.30 171,345.70 382,782.80 169,515.80 400,747.70 255,382.70 198,716.40 154,714.00 212,508.70
Averagemonthlysalary 15-17 624,527.30 1,016,183.00 1,302,209.00 386,188.20 384,693.80 693,583.40 765,566.70 932,147.20 720,594.90 1,015,105.00 308,930.80 1,317,019.00 311,483.80 813,161.70
Aveamgeonlysaly 10-11 28,563.42 69,885.47 111,285.30 353,990.60 5,18.21 25,374.71 59,788.00 183,829.50 8,002.74 295,019.40 191,048.00 30,358.95 2,463.27 95,498.58A Averagemontly lfy 12-14 37,878.73 108,829.20 109,540.80 50,797.91 106,84.80 63,965.88 72,357.81 83,310.53 35,458.09 144,721.70 101,393.70 56,521.17 41,087.77 76,667.40
Avergemnt lyaaly 15-17 195,613.30 268,620.90 280,289.10 216,275.00 414,732.30 173,738.80 251,449.90 287,688.40 133,607.50 376,552.60 366,530.70 144,196.00 29,804.94 271,379.70
Tn dolarAveagemohly slary 10-11 5.67 12.57 20.44 63.51 0.95 5.35 10.65 33.10 1.99 53.42 32.99 6.05 0.41 16.85
i Avagemotlyaay 12-14 18.23 24.57 33.32 9.84 26.18 22.90 20.44 24.74 15.71 35.21 24.69 20.70 13.09 21.90Avergenmonthlyalynyl5-17 93.72 134.68 131.92 48.10 74.12 103.06 106.25 95.19 92.49 112.97 62.50 152.66 37.30 101.42
Averagemondklylaluy 10I1 8.02 NA 20.71 NA NA 9.11 7.34 14.47 7.02 21.01 5.44 12.01 NA 8.25Ii Averge monly sWlary 12-14 32.13 33.03 70.42 18.33 58.97 37.43 31.46 70.28 31.12 73.58 46.89 36.48 28.41 39.02
Y Avefrgemonthly sabyl5-17 114.66 186.57 239.09 70.90 70.63 127.34 140.56 171.14 132.30 186.37 56.72 241.81 57.19 149.30
Averp mondtly sIwyy 10-11 5.24 12.83 20.43 64.99 0.95 4.66 10.98 33.75 1.47 54.17 35.08 5.57 0.45 17.53, Average monthly slay 12-14 6.95 19.98 20.11 9.33 19.62 11.74 13.28 15.30 6.51 26.57 18.62 10.38 7.54 14.08
a Averagemonthlvyalay 15-17 35.91 49.32 51.46 39.71 76.15 31.90 46.17 52.82 24.53 69.14 67.30 26.47 5.47 49.83Source: ISMS 98.
Stbsaical Annex, Page 17

Table A20. Average Hours Worked per Week
Qi Q2 Q Qs Extren Poor Nonfpoor Rural Urban Coas Skrm Oriente NationalPoorPO
AR worker10-11 20.0 23.1 27.3 24.8 25.1 19.2 22.9 22.9 20.3 29.0 26.5 21.2 13.4 22.8
12-14 31.1 29.5 27.2 27.7 32.0 31.2 30.2 28.6 28.7 31.9 29.8 30.1 25.9 29.7
15-17 39.3 37.9 38.0 38.0 41.7 38.7 39.1 38.4 36.7 41.4 39.2 38.5 36.3 38.8
Worldu _nd In the school10-11 17.8 23.1 25.7 24.3 25.1 17.0 22.1 21.6 19.1 28.4 26.5 19.4 12.9 21.9
12-14 26.1 26.1 23.4 26.6 26.5 25.1 26.0 25.3 24.2 28.5 29.2 23.1 21.3 25.8
15-17 36.1 31.7 32.7 34.4 33.8 34.8 34.9 32.6 30.1 36.2 37.3 28.7 22.2 33.6
Werldng and not In swhool10-11 31.8 20.1 64.5 50.0 NA 31.1 30.8 60.1 32.5 55.2 26.3 44.0 18.7 34.5
12-14 37.3 35.7 37.8 46.1 59.2 39.0 36.6 44.7 36.2 46.8 31.9 40.8 38.4 38.2
15-17 40.5 41.7 45.0 47.5 55.4 40.1 41.4 48.8 40.5 50.2 41.4 45.4 45.2 43.6
Only who bha a salry10-11 34.4 31.2 50.6 29.9 24.0 34.4 38.2 32.3 28.5 40.5 41.7 29.4 6.0 36.8
12-14 43.5 38.5 39.3 35.0 44.6 43.4 40.8 40.7 38.5 42.8 39.8 42.2 34.6 40.8
15-17 47.8 44.1 45.9 49.0 54.6 45.9 45.7 49.9 44.7 49.5 46.9 48.2 40.6 47.3
D.ea't have a abry10-11 18.3 20.9 18.4 23.6 25.2 17.1 19.6 21.3 19.7 21.2 21.5 20.0 13.5 20.0
12-14 27.0 23.5 21.2 25.1 20.8 26.3 25.7 22.3 26.0 20.1 23.9 25.3 23.5 24.7
15-17 31.4 29.3 24.9 27.3 29.3 32.0 30.3 27.0 30.6 24.4 29.4 27.3 34.3 28.7
Worldng and schoolWkh salary10-11 30.9 31.2 50.3 29.9 24.0 30.9 37.8 30.7 24.4 40.2 42.3 25.3 6.0 36.0
12-14 37.5 34.2 35.6 33.6 42.9 37.1 36.0 36.4 29.5 40.1 39.0 32.2 20.7 36.2
15-17 46.3 39.7 42.3 46.3 46.6 42.7 42.6 45.4 38.4 46.4 45.6 41.1 26.9 43.8
Wkthst sabry10-11 16.6 20.9 16.5 22.8 25.2 15.5 18.7 20.1 18.7 20.4 21.1 18.6 12.9 19.1
12-14 23.7 21.6 19.3 24.2 17.5 22.1 22.7 20.9 23.3 19.6 23.7 21.1 21.5 22.2
15-17 23.7 22.2 23.0 26.6 26.3 25.8 23.5 25.2 25.8 23.2 28.3 20.5 20.3 24.6
W eidn Nd not in choolWkh saary10-11 42.6 NA 54.0 NA NA 42.6 42.6 54.0 42.6 54.0 28.0 51.5 NA 44.8
12-14 47.2 44.6 44.1 48.7 64.5 47.7 45.8 50.0 45.9 48.7 42.5 44.5 51.5 47.0
15-17 48.4 46.6 49.0 52.9 61.8 47.1 47.6 54.0 47.3 52.9 48.2 51.4 48.0 49.8
Wll_t 10-11 29.0 20.1 72. 50.0 NA 27.7 28.1 62.6 30.4 56.0 26.0 41.1 18.7 31.7
12-14 32.1 27.7 30.1 44.2 50.0 33.4 31.1 35.5 31.6 31.6 24.6 34.8 31.1 31.6
15-17 33.8 34.2 30.9 32.1 40.2 33.9 33.7 34.7 34.2 31.5 31.1 35.1 43.8 33.9
Soume: LSM5 98.
Stbtica Anneo, PU 18

Table A21. Summary of Total Central Government Expenditures (Real 1995 Sucre$)
1995 1996 1997 199S 1999*
TOTAL CENTRAL GOVERNMENT EXPENDITURES FOR SOCIALSECTORS (EXCLUDING BONO SOLIDARIO) 2,106,811.3 2,283,103.1 1,990,249.6 2,114,972.2 1,946,935.4TOTAL CENTRAL GOVERNMENT EXPENDITURES FOR BONOSOLIDARIO - - - - 560,925.3TOTAL CENTRAL GOVERNMENT EXPENDITuRES FOR OTHER SOCIALPROGRAMS (CONAMU/CONSEJOS) - - - 11,4S7.3TOTALCENTRALGOVERNMENTEXPENDrrURES 10,83S,026.8 10,366,213.5 11,908,251.5 11,568,899.6 13,893,644.1
TOTAL CENTRAL GOVERNMENT EXPENDITURES (EXCLUDING DEBT) 6;229524-8 636d3404-3 6,062,110.5 3,027,930.9 6,616,912.9
PAYMENTS ON InERNAL AND EXTERNAL DEBT + AMORTIZATION 4,608,502.0 3,999,809.2 5,846,140.9 4,270,484.3 7,276,731.2
GROSS DOMESTIC PRODUCT 46,005,438.0 60,726,745.0 79,040,013.0 105,894,895.0 139,606,534.8
TOTAL GOVERNMENT EXPENDTURES AS A PERCENT OF GDP 23.56% 22.09% 24.55% 23.75% 34.67%TOTAL CENTRAL GOVERNMENT EXPENDITURES (EXCLUDING DEBT)AS A PERCENT OF GDP 13.54% 13.57% 12.50% 6.22% 16.51%
PAYMENTS ON INTERNAL AND EXTERNAL DEBT + AMORTIZATTON(AS REFLECTED IN MOF DATABASE) AS A PERCENT OF GDP 10.02% 8.53% 12.05% 8.77% 18.16%"1999 E.axn dftaopt "Cod'caIo" of iy 1M
C"sloadio: Wtdd BYS: 9Subsuua dt Prer y Coiid 9Mty oe FFwe
Table A22. Social Sectors as a percentage of GDPSECTOR 195_ 1996 1997 1998 1999
EDUCATION 3.11% 3.18% 2.S5% 3.1S% 3.06%SOCIAL WELFARE 0.37% 0.60% 0.27% 0.19% 0.77/oTRABAJO 0.04% 0.05% 0.05% 0.05% 0.05%SALUD 1.06% 1.03% 0.93% 0.92% 0.97%BONO SOLUDARIO - - - 1.40%OTHER SOCIAL PROGRAMS (CONAMU/CONSEJOS) - - - - 0.03%TOTAL SOCIAL SECTOR SPENDING AS A PERCENT OF GDP 4.58% 4.87% 4.10% 4.34% 6.29%*1.99 Exprai dw%aqwm9zCo-fiCade" Uofufly IM
Cslcn : Wwd*do
So.: _tasmia de Preasp.i y C_oobila4 Miisly of Fitt
Table A23. Central Government ExpendItures In Socal Sectors and AddIional Programs in 1999 (Millons of Real 1995 Sucre)SECTOR 1995 1996 1997 199 1999*
EDUCACION 1,429,697 1,494,139 1,384,731 1,550,419 1,228,090SOCIAL WELFARE 172,346 279,356 130,762 93,292 310,550TRABAJO 17,907 24,752 23,413 23,970 20,474SALUD 486,921 484,856 451,343 447,191 387,822BONO SOLIDARIO (INCLUYE COSTO SERVICIO TRANSACCION) - - - - 560,925OTBER** - - - - 11,487TOTAL 2,104871 2,283,103 1,990,250 2,114872 2,519,348PIB (MILLIONS OF REAL 1995 SUCRE) 46,005,438 46,916,888 48,502,781 41,701,499 40,075,808*/OFPIB(INREAL TERMS 199S) 4.5S% 4.S7% 4.10% 4.34% 6.29%1999 Eq s da bb a C -t A W cu 19S9
c<Wtiaw= Wrd BadS5.: Sulne_ata de Pr_eaVoe y CaOddids4 MOistry of Fe
Sistical Annex~ Page 19
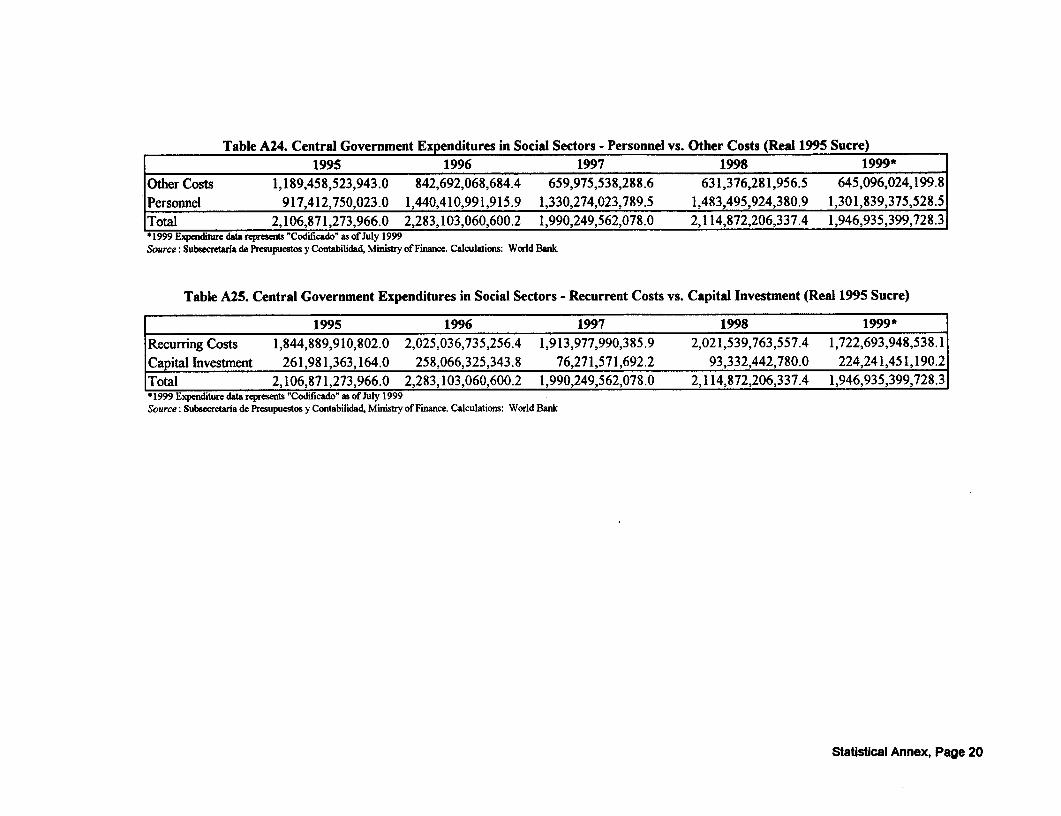
Table A24. Central Government Expenditures in Social Sectors - Personnel vs. Other Costs (Real 1995 Sucre)1995 1996 1997 1998 1999*
Other Costs 1,189,458,523,943.0 842,692,068,684.4 659,975,538,288.6 631,376,281,956.5 645,096,024,199.8Personnel 917,412,750,023.0 1,440,410,991,915.9 1,330,274,023,789.5 1,483,495,924,380.9 1,301,839,375,528.5Total 2,106,871,273,966.0 2,283,103,060,600.2 1,990,249,562,078.0 2,114,872,206,337.4 1,946,935,399,728.3*1999 Expenditure data represents "Codificado' as of July 1999Source: Subsecfetaria de Presupuestos y Contabilidad, Ministry of Finance. Calculations: World Bank
Table A25. Central Government Expenditures in Social Sectors - Recurrent Costs vs. Capital Investment (Real 1995 Sucre)
1995 1996 1997 1998 1999*Recurring Costs 1,844,889,910,802.0 2,025,036,735,256.4 1,913,977,990,385.9 2,021,539,763,557.4 1,722,693,948,538.1Capital Investment 261,981,363,164.0 258,066,325,343.8 76,271,571,692.2 93,332,442,780.0 224,241,451,190.2Total 2,106,871,273,966.0 2,283,103,060,600.2 1,990,249,562,078.0 2,114,872,206,337.4 1,946,935,399,728.3* 1999 Expenditure data represents "Codificado' as of July 1999Source: Subsecretarla de Presupuestos y Contabilidad, Ministry of Finance. Calculations: World Bank
Statistical Annex, Page 20
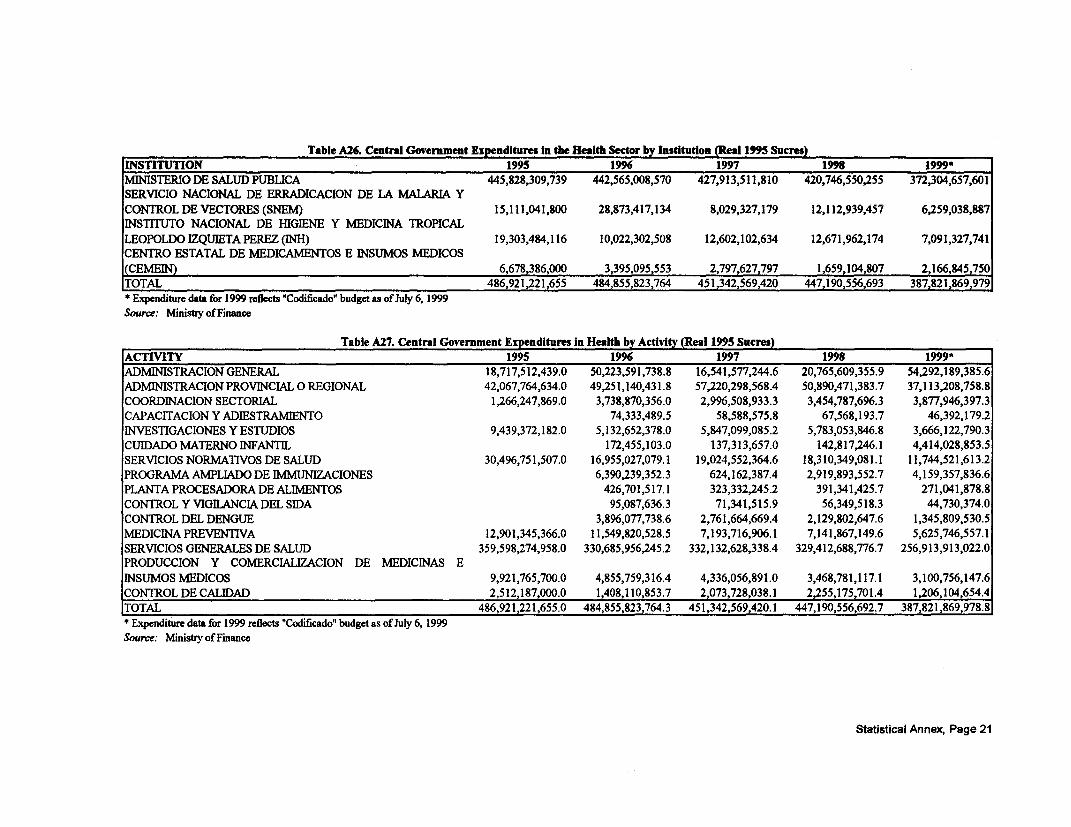
Table A26. Central Government Expenditures In the Health Sector by Institution (Real 195 Sucres)INSTITUTION 1995 1996 1997 18 1999*MINISTER1O DE SALUD PUBLICA 445,828,309,739 442,565,008,570 427,913,511,810 420,746,550,255 372,304,657,601SERVICIO NACIONAL DE ERRADICACION DE LA MALARIA YCONTROL DE VECTORES (SNEM) 15,111,041,800 28,873,417,134 8,029,327,179 12,112,939,457 6,259,038,887INSTITUTO NACIONAL DE HIGIENE Y MEDICINA TROPICALLEOPOLDO IZQUIETA PEREZ (INH) 19,303,484,116 10,022,302,508 12,602,102,634 12,671,962,174 7,091,327,741CENTRO ESTATAL DE MEDICAMENTOS E INSUMOS MEDICOS(CEMEIN) 6,678,386,000 3,395,095,553 2,797,627,797 1,659,104,807 2,166,845,750TOTAL 486,921,221,655 484,855,823,764 451,342,569,420 447,190,556,693 387,821,869,979* Expenditure data for 1999 reflects 'Codificado' budget as of July 6, 1999Source: Ministry of Finance
Table A27. Central Government Expenditures in Health by Activity (Real 1995 Sucres)ACTIVITY 1995 1996 1997 1998 1999*ADMINISTRACION GENERAL 18,717,512,439.0 50,223,591,738;8 16,541,577,244.6 20,765,609,355.9 54,292,189,385.6ADMINISTRACION PROVINCIAL 0 REGIONAL 42,067,764,634.0 49,251,140,431.8 57,220,298,568.4 50,890,471,383.7 37,113,208,758.8COORDINACION SECTORIAL 1,266,247,869.0 3,738,870,356.0 2,996,508,933.3 3,454,787,696.3 3,877,946,397.3CAPACITACION Y ADIESTRAMIENTO 74,333,489.5 58,588,575.8 67,568,193.7 46,392,179.2INVESTIGACIONES Y ESTUDIOS 9,439,372,182.0 5,132,652,378.0 5,847,099,085.2 5,783,053,846.8 3,666,122,790.3CUIDADO MATERNO INFANTIL 172,455,103.0 137,313,657.0 142,817,246.1 4,414,028,853.5SERVICIOS NORMATIVOS DE SALUD 30,496,751,507.0 16,955,027,079.1 19,024,552,364.6 18,310,349,081.1 11,744,521,613.2PROGRAMA AMPLIADO DE IMMUNIZACIONES 6,390,239,352.3 624,162,387.4 2,919,893,552.7 4,159,357,836.6PLANTA PROCESADORA DE ALIMENTOS 426,701,517.1 323,332,245.2 391,341,425.7 271,041,878.8CONTROL Y VIGILANCIA DEL SIDA 95,087,636.3 71,341,515.9 56,349,518.3 44,730,374.0CONTROL DEL DENGUE 3,896,077,738.6 2,761,664,669.4 2,129,802,647.6 1,345,809,530.5MEDICINA PREVENTlVA 12,901,345,366.0 11,549,820,528.5 7,193,716,906.1 7,141,867,149.6 5,625,746,557.1SERVICIOS GENERALES DE SALUD 359,598,274,958.0 330,685,956,245.2 332,132,628,338.4 329,412,688,776.7 256,913,913,022.0PRODUCCION Y COMERCIALIZACION DE MEDICINAS EINSUMOS MEDICOS 9,921,765,700.0 4,855,759,316.4 4,336,056,891.0 3,468,781,117.1 3,100,756,147.6CONTROL DE CALIDAD 2,512,187,000.0 1,408,110,853.7 2,073,728,038.1 2,255,175,701.4 1,206,104,654.4TOTAL 486,921,221,655.0 484,855,823,764.3 451,342,569,420.1 447,190,556,692.7 387,821,869,978.8* Expenditure data for 1999 reflects "Codificado" budget as of July 6, 1999Source: Ministry of Finance
Statistical Annex, Page 21

Table A28. Central Government Expenditures in the Health Sector by Personnel and Other Costs (Real 1995 Sucres)1995 1996 1997 1998 1999*
Other 127,590,142,562 126,131,200,682 108,313,097,237 134,590,550,539 148,735,540,501
Personnel 359,331,079,093 358,724,623,082 343,029,472,183 312,600,006,153 239,086,329,478
Total 486,921,221,655 484,855,823,764 451,342,569,420 447,190,556,693 387,821,869,979xpenaure dat for 199 refects 'Lodcao- budget as 01 July 6, 1999
Source: Ministry of Finance
Table A29. Central Government Expenditures in the Health Sector by Personnel and Other Costs(Percentage Sharing of Total Health Expenditures)
1995 1996 1997 1998 1999*
Other 26.20% 26.01% 24.00% 30.10% 38.35%
Personnel 73.80% 73.990/e 76.00%/e 69.90%/e 61.65%
Total 100.00% 100.00% 100.00% 100.00% 100.00%Expenditure data for 1999 rellects C-odilicado' budgd as o1 juiy 6, i999
Source: Ministry of Finance
Table A30. Central Government Expenditures in the Health Sector by Recurrent and Capital Costs (Real 1995 Sucres)1995 1996 1997 1998 1999*
Recurring Costs 419,570,694,760 439,119,258,116 436,596,317,187 412,099,719,616 323,015,736,935
Capital Investment 67,350,526,895 45,736,565,648 14,746,252,233 35,090,837,076 64,806,133,043
Total 486,921,221,655 484,855,823,764 451,342,569,420 447,190,556,693 387,821,869,979Experiditure data or 1999 retlects TCoawcasoo budget as of July 6, I99Y
Source: Ministry of Finanrc
Table A31. Central Government Expenditures in the Health Sector by Recurrent and Capital Costs(Percentage Sharing of Total Health Expenditures)
1995 1996 1997 1998 1999*
Recurring Costs 86.17% 90.57% 96.73% 92.15% 83.29%
Capital Investment 13.83% 9.43% 3.27% 7.85% 16.71%^
Total 100.00% 100.00% 100.00% 100.00% 100.00°%IExpenditure data tor 1999 reflecs "Codilicadov bulged as ot July 6,1999g
Source: Ministry of Finance
Statisitcal Annex, Page 22
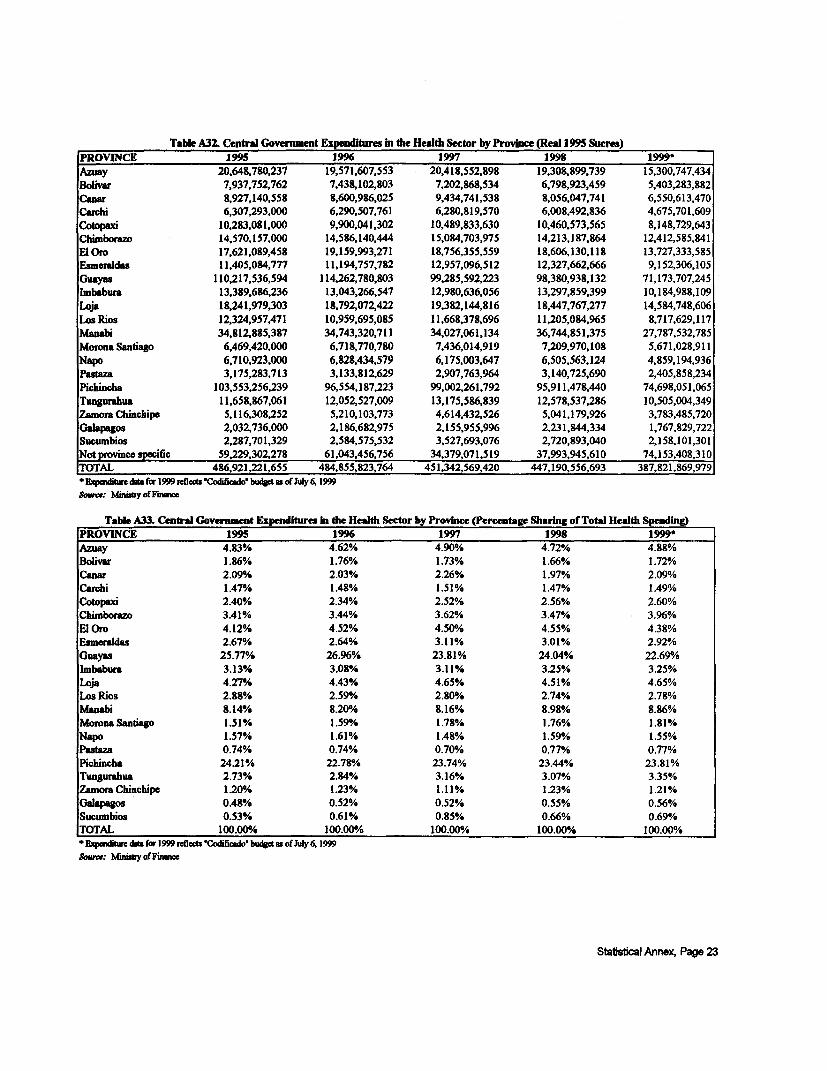
Table A32. Central Govenment Expenditues t the Health Sector by Provnce (Real 1995 Sucres)PRO-VINCE 1995 1996 1997 1998 1999*Azuay 20,648,780,237 19,571,607,553 20,418,552,898 19,308,899,739 15,300,747,434Bolivar 7,937,752,762 7,438,102,803 7,202,868,534 6,798,923,459 5,403,283,882Canar 8,927,140,558 8,600,986,025 9,434,741,538 8,056,047,741 6,550,613,470Carchi 6,307,293,000 6,290,507,761 6,280,819,570 6,008,492,836 4,675,701,609Cotopaxi 10,283,081,000 9,900,041,302 10,489,833,630 10,460,573,565 8,148,729,643Chimborazo 14,570,157,000 14,586,140,444 15,084,703,975 14,213,187,864 12,412,585,841E Oro 17,621,089,458 19,159,993,271 18,756,355,559 18,606,130.118 13,727,333,585Esmenadks 11,405,084,777 11,194,757,782 12,957,096,512 12,327,662,666 9,152,306,105Guasyas 110,217,536,594 114,262,780,803 99,285,592,223 98,380,938,132 71,173,707,245Imbebura 13,389,686,236 13,043,266,547 12,980,636,056 13,297,859,399 10,184,988,109Loi* 18,241,979,303 18,792,072,422 19,382,144,816 18,447,767,277 14,584,748,606Los Rios 12,324,957,471 10,959,695,085 11,668,378,696 11,205,084,965 8,717,629,117Manabi 34,812,885,387 34,743,320,711 34,027,061,134 36,744,851,375 27,787,532,785Morona Santiago 6,469,420,000 6,718,770,780 7,436,014,919 7,209,970,108 5,671,028,911Napo 6,710,923,000 6,828,434,579 6,175,003,647 6,505,563,124 4,859,194,936Pastaza 3,175,283,713 3,133,812,629 2,907,763,964 3,140,725,690 2,405,858,234Pichincha 103,553,256,239 96,554,187,223 99,002,261,792 95,911,478,440 74,698,051,065Tungurahua 11,658,867,061 12,052,527,009 13,175,586,839 12,578,537,286 10,505,004,349ZamoraChinchipe 5,116,308,252 5,210,103,773 4,614,432,526 5,041,179,926 3,783,485,720Galapagos 2,032,736,000 2,186,682,975 2,155,955,996 2,231,844,334 1,767,829,722Sucumbios 2,287,701,329 2,584,575,532 3,527,693,076 2,720,893,040 2,158,101,301Notprovince specific 59,229,302,278 61,043,456,756 34,379,071,519 37,993,945,610 74,153,408,310
TOTAL ~~~~~486,921,221,655 484,855,823,764 451,342,569,420 447,190,556,693 387,821,869,979* Expiditbwe d fcr 1999 reflect'CodiicdoW budg as ofuly 6, 1999Sawor: Miny ofrance
Table A33. Central Goverment Expenditures _i the Health Sector by Provice (Percentag Sharing of Total Health Spending)PROVINCE 1995 1996 1997 1998 1999*Azusy 4.83% 4.62% 4.90% 4.72% 4.88%/oBolivar 1.86% 1.76% 1.73% 1.66% 1.72%Canar 2.09% 2.03% 2.26% 1.97% 2.09%Carchi 1.47% 1.48% 1.51% 1.47% 1.49%Cotopaxi 2.40ff 2.34% 2.52% 2.56% 2.60%Chimborazo 3.41% 3.44% 3.62% 3.47% 3.96%El Oro 4.12% 4.52% 4.50ff. 4.55% 4.38%Esmcrldas 2.67% 2.64% 3.11% 3.01% 2.92%Guayas 25.77% 26.96% 23.81% 24.04% 22.69ffeImbaburm 3.13% 3.080% 3.11% 3.25% 3.25%Loja 4.27% 4.43% 4.65% 4.51% 4.65%Los Rios 2.88% 2.59%/ 2.80% 2.74% 2.78%Manabi 8.14% 8.20% 8.16% 8.98% 8.86%Morona Santiago 1.51% 1.59%A 1.78% 1.76% 1.81%NapW 1.57% 1.61% 1.48% 1.59% 1.55%Pastaza 0.74% 0.74% 0.700/o 0.77% 0.77%Pichincha 24.21% 22.78% 23.74% 23.44% 23.81%Tungurahus 2.73% 2.84% 3.16% 3.07% 3.35%ZamoraChinchipe 1.20LI 1.23% 1.11% 1.23% 1.21%Galapagos 0.48% 0.52% 0.52% 0.55% 0.56%Sucumbios 0.53% 0.61% 0.85% 0.66% 0.69/OTOTAL 100.00%/ 100.00% 100.00%/. 100.00% 100.00%* ExpT dMs for 1999 reflcts *Codficado' budg as of July 6, 1999son: Miy of Fuice
Stistical Annex, Page 23
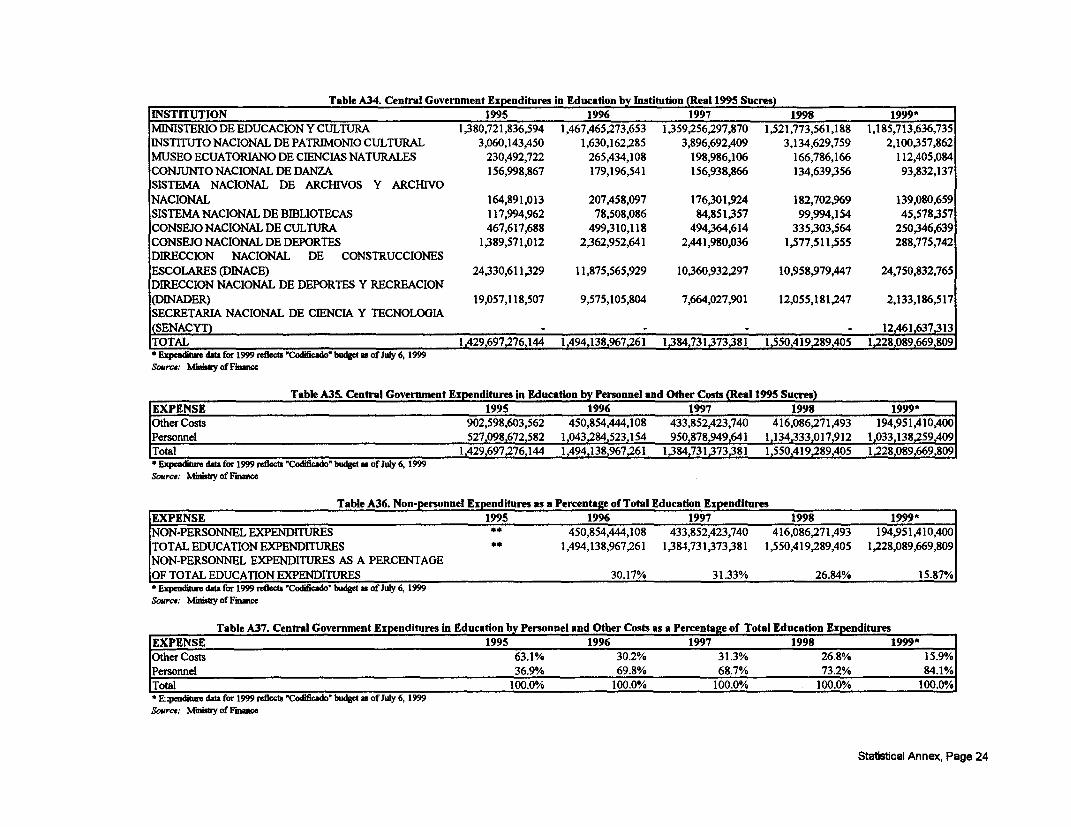
Table A34. Central Government Expenditures in Education by Institution (Real 1995 Sucres)
INSTITUTION 1995 1996 1997 1998 1999*
MINISTERIO DE EDUCACION Y CULTURA 1,380,721,836,594 1,467,465,273,653 1,359,256,297,870 1,521,773,561,188 1,185,713,636,735
INSTITUTO NACIONAL DE PATRIMONIO CULTURAL 3,060,143,450 1,630,162,285 3,896,692,409 3,134,629,759 2,100,357,862
MUSEO ECUATORTANO DE CIENCIAS NATURALES 230,492,722 265,434,108 198,986,106 166,786,166 112,405,084
CONJUNTO NACIONAL DE DANZA 156,998,867 179,196,541 156,938,866 134,639,356 93,832,137
SISTEMA NACIONAL DE ARCHIVOS Y ARCHIVO
NACIONAL 164,891,013 207,458,097 176,301,924 182,702,969 139,080,659
SISTEMA NACIONAL DE BTBLIOTECAS 117,994,962 78,508,086 84,851,357 99,994,154 45,578,357
CONSEJO NACIONAL DE CULTURA 467,617,688 499,310,118 494,364,614 335,303,564 250,346,639
CONSEJO NACIONAL DE DEPORTES 1,389,571,012 2,362,952,641 2,441,980,036 1,577,511,555 288,775,742
DIRECCION NACIONAL DE CONSTRUCCIONES
ESCOLARES (DINACE) 24,330,611,329 11,875,565,929 10,360,932,297 10,958,979,447 24,750,832,765
DIRECCION NACIONAL DE DEPORTES Y RECREACION
(DINADER) 19,057,118,507 9,575,105,804 7,664,027,901 12,055,181,247 2,133,186,517
SECRETARIA NACIONAL DE CIENCIA Y TECNOLOGIA(SENACYT) - ~ ~ ~ 12,461,637313
TOTAL 1,429,697 76,144 1,494,138.967,261 1,384,731,373,381 1,550,419,289,405 1,228.089,669,809
* Exp_enitue data for 9 reflects Codificado budget as of July 6,1999Source: Mity of Fuimace
Table A35. Central Government Expenditures in Education by Personnel and Other Costs (Real 1995 Sucres)
EXPENSE 1995 1996 1997 1998 1999*
Other Costs 902,598,603,562 450,854,444,108 433,852,423,740 416,086,271,493 194,951,410,400
Personnel 527,098,672,582 1,043,284,523,154 950,878,949,641 1,134,333,017,912 1,033,138,259,409
Total 1,429,697,276,144 1,494,138,967,261 1,384,731,373,381 1,550,419,289,405 1,228,089,669,809
* Expemditr da for 1999 reflects 'Codificado budget as of July 6, 1999Souce: Ministry of Fnnce
Table A36. Non-personnel Expenditures as a Percentage of Total Education Expenditures
EXPENSE 1995 1996 1997 1998 1999"
NON-PERSONNEL EXPENDITURES * 450,854,444,108 433,852,423,740 416,086,271,493 194,951,410,400
TOTAL EDUCATION EXPENDITURES 1,494,138,967,261 1,384,731,373,381 1,550,419,289,405 1,228,089,669,809
NON-PERSONNEL EXPENDITURES AS A PERCENTAGE
OF TOTAL EDUCATION EXPENDITURES 30.17% 31.33% 26.84% 15.87%
* Expendtur data for 1999 reflect Codifico" budget as of July 6, 1999Source: Ministry of Finance
Table A37. Central Government Expenditures in Education by Personnel and Other Costs as a Percentage of Total Education Expenditures
EXPENSE 1995 1996 1997 1998 1999*
Other Costs 63.1% 30.2% 31.3% 26.8% 15.9%
Personnel 36.9% 69.8% 68.7% 73.2% 84.1%
Total 100.0% 100.0% 100.0% 100.0% 100.0%
* E.pediture data for 1999 reflects "Codificado" budget a of July 6, 1999Source: Minisry of Finance
Statistical Annex, Page 24

Table A38. Central Government Expenditures In Education by Recurrent and Capital Investment (Real 1995 Sucres)1995 1996 1997 1998 1999*
Recurring Costs 1,316,837,933,988 1,378,987,727,403 1,342,149,092,222 1,500'322,936,372 i,153,343,346,57iCapital Investment 112,859,342,156 115,151,239,859 42,582,281,159 50,096,353,032 74,746,323,238Total 1,429,697,276,144 1,494,138,967,261 1,384,731,373,381 1,550,419,289,405 1,228,089,669,809Note: In 1995, Personnel expenses arm significantly lower than in the following years. This is because prior to 1996, the Ministry of Finance madetransfers directly to collkges and other educational institutions which included payments for salries in swh institutions. Therefore, in 1995, totalPersonnel expemes in the Ministry of Education appear to be lower than those in subsequent years.t Expenditure data for 1999 reflesb "Codificado" budget as of July 6, 1999Source: Ministry of Finance
Table A39. Cental Government Expenditures in Education by Recurrent and Capital Investment (Percentage Sharing).1995 1996 1997 1998 1999*
Recunng Costs 92.11% 92.29% 96.92% 96.77% 93.91%Capital hivestment 7.890/o 7.71% 3.08% 3.23% 6.090/oTotal 100.00% 100.00% 100.00% 100.00% 100.00%Note: In 1995, Personnl expemes are significantly lower than in the following years. This is because prior to 1996, the Ministry ofFinance madetransfers directly to colleges and other educational institution which included payments for alies in swh institutions. Therefore, in 1995, totalPersonncl expenw s in the Ministry of Education appear to be lowcr than those in sbsequent years.* Expenditure data for 1999 reflects "Codificado" budget a of July 6, 1999Source: Ministry ofFinance
Staftstcal Annex, Page 25

Tsb_ A4T . Cm" Gowems4 Egze_WMuW i Ed.cm by Adil (Red 199 Sam")
LEVEL ACTIVITY 19f5 199 If7 Im l99
ADMINISTRATON AND PLANNING 65860039018 58,060,675,417 47.463,691,407 47,491,264,141 31,732,404,070
GENERALADMINSTRATION 45678145495 41,546,241,967 381,2S6,409,359 40,97.290,168 27.924,775,655
SECMORLkL COORDINATION 19907264736 16,257,171.787 8,921766 6.276,784,262 3,618 32
PROGRAMINGANDPLANNING 274623787 257.261,663 235.677A281 227,193,711 189,2U1,584
PRIMARY EDUCATION 504,773.187,817 539,I23,741,936 48l,825,613,O 595M,9 81.876 532,039,176,587
BASIC HISPANIC EDUCATION 4U,337,714,934 515,871,058,5D5 459,166,W4,399 566,330,464,217 505,007,545,562
BASIC BILIGUAL EDUCATION 19X356,007,813 23,252,683.430 22.659.170.409 29,600,217,659 27,031,631,026
DIDACTIC MATERIAL PRODUCTION 79,465.000
SECONDARY EDUCATION SECONDARY EDUCATION 493,273,503,004 567,085,625,9 477,637,100,140 54,309,826,355 522,242,217,480
TOTAL PRIMARY AND SECONDARY EDUCATION 994,046,690,821 1,106,209,367,845 959,462,613,947 1,140,2A00231 1,05481.394,067
POST SECONDARY EDUCATIONIPED (Iidluto Ped wco)TI'S (IzliitTecico Sypjr)
OTHER 29,369,614,742 14,964,52,853 14,266,747,919 13,665.709.943 43,516,877,875
ILLITERATE CAMPAIGNS 8,113.374,742 7,205.019,735 8,107,792,069 6,412,722,593 21,604,474,51
EDUCATION INFRASTRUCIURE 21,256,240,WW 7,759,543,115 6.15B,955,B50 7,452,987,355 21,912,403,025
GHlCEREDUCATION 319,613,969,382 304,13l.660,755 34759.658,967 327,972,1,621 78,063,569,847
HIGHER EDUCATION 319,613,969.382 304,131,660,755 347,89,658,987 327,972,188,621 78,063.569,S47
BENIFITS ALL 16,806,962,181 10,772,700392 15,948,661,121 20,84,014,464 20.495.4239
SCIlFC AND lEQ1OOO1-AL DEV-OP - 12,461,637,313
mAZAY ' 39,95l,820
ARTFln AND CULTURALAcOvTE DM 3,542,206,130 3,827,341,925 3,555,853,057 3,042,335,332 3,187,549,475
CONSEmVA1II OFCLTtILIALHEACIE 3,094,143.450 1,630,162,285 3896.692,409 3,134,629,759 2,100357,862
MIISEUIJ*ADNDar)tRATI 230,492,722 265,434,108 198,9S6,106 166,786,166 112,405,084
CULTURAL DJ IC NAND DEVELOPIAWr 3.694,906,274 3,569,.f8,938 3l182,773,984 4.342,733,350 1,956,223,036
IDWEONAND DEVULOMDlT 6.045,213,605 1,480,293,136 5,114,355,565 10.162,529.858 637,292,359
URLAN ADEQUACY 200W000.000TOTAL 1,429,697,276,144 1,494,13S,967,261 1,384,731.3733SI 1,550,419,2S9,405 1.089.669,SDS
EVd. ~f. 1999 rds,a C.&liosis b.dW .. .fld6 1999
Tabb A41. C "l Gmrume E _zp.udw.. In Edmi a PmtIoGDP (Rom I"S surs)
_LVEL 199" 19 1"7 198 I".
CENTRAL GOVERNMENTEXPENDMIURES IN EDUCATION 1,429,697,276,144 1,494,138,967,261 1,384,731,373,31 1,550,419,289,405 1,228,0S9,669,809
GDP (REAL 1995 SUCRE) 46.005,438,000,000 46,916,8S7,S79,195 48,502,780,722,272 4S,701,49S.614,263 40,075,S0S,26S,649
REAL SPENDINGINEDUCATIONASAPERCENTOFGDP 3.11% 3.1S% 2S5% 3.1S% 3.06%
Table A42 Coral G_nammt Exendile lo Edaml_a as a percet eN.e.D*W Sp_dag (ROW IS Saem)
LEVEL 199S 1 1997 199 19f
CENTRAL GOVERNMENT EXPENDIURES IN EDUCATION 1,429,697,276,144 1,494,13Y,967,261 1,384,731,373381 1,550,419,289,405 1,228,089,669,8DS
TOTAL GOVERNMENTNON-DEBT SPENDING (REAL 1995 SUCRE) 6,229,524,817,479 6,366,404,348,175 6,062,110,537,232 7,298,415,253,747 6,616,912,54,0281
REAL SPENDING IN EDUCATION AS A PERCENT OF GDP 22.95% 23.47/. 22.84% 21.24X 18,56'A
Table A43. Par Stuen Speding (Real I9S Sam")I"S 199 19"7 1998
Pte.Pnmey and P&iuy 263,S01 275,328 235,618 291,990
Setonday 626.4 703,496 533,249 597,111
Table A44. Per S htdet Spadkig (Roa Temat Avwage 1995 Ex)p Rale )1995 199 I17 193
Pm-Pnrmay and Piay 102S867 107.362 91.877 113.859
lSecvduy 244.316 274.322 207.936 232.838'Epeaim dae* 199 .. -Cdfi.I' bs4. .fley6, 1999
-AVERA19 I", EXCAHNAWRATE SUCRElWS 264.49
Stabstkal Anne, Page 26

Table A45. Central Governnent Expenditures in Education by Province (Real 1995 Sucres)PROVINCE 1995 1996 1997 1998 1999*Azuay 79,945,274,406 79,244,648,488 80,882,833,286 97,752,699,061 63,722,928,372Bolivar 35,535,189,861 33,505,951,641 32,823,352,466 38,068,109,763 29,462,505,225Canar 25,650,489,476 26,525,062,511 24,506,156,938 28,263,333,023 26,482,476,097Carchi 22,548,216,635 22,602,248,889 21,093,362,977 24,619,489,961 21,959,294,323Cotopaxi 36,547,651,567 37,068,648,847 36,511,414,966 43,664,761,296 37,057,699,894Chimborazo 65,593,030,847 68,949,593,536 68,349,111,216 77,743,217,488 60,396,888,757El Oro 70,684,336,823 69,393,622,281 66,908,345,611 75,605,136,651 59,335,346,921Esmeraldas 61,921,457,530 65,049,864,507 60,291,881,704 67,332,233,463 52,966,188,055Guayas 250,633,675,494 262,008,056,945 242,838,506,356 261,318,827,063 184,094,655,141Imbabura 46,832,369,705 47,169,899,471 46,552,287,282 51,938,464,718 40,207,503,283Loja 86,921,263,766 86,252,851,429 83,658,854,844 94,828,861,862 74,314,119,926Los Rios 66,338,160,140 66,567,065,087 64,548,652,518 74,677,431,771 55,516,769,221Manabi 124,146,177,060 129,102,366,763 123,873,489,176 137,334,503,092 107,304,407,907Morona Santiago 16,390,909,062 17,905,541,346 16,349,679,786 19,477,413,102 18,524,609,495Napo 21,360,700,702 19,087,570,304 18,531,004,978 21,215,181,004 20,336,526,887Pasta 12,243,870,999 11,591,290,903 10,650,142,751 12,526,476,302 11,786,309,182Pichincha 243,445,252,953 245,739,038,948 245,727,223,646 264,638,813,213 179,168,622,159Tungurmhia 52,863,510,877 55,442,725,145 53,446,524,210 60,516,989,891 45,763,248,605Zamora Chinchipe 14,154,364,586 13,566,254,009 12,889,650,444 15,224,959,110 14,542,802,513Galapagos 3,492,515,396 5,136,380,517 4,368,064,449 6,252,533,509 7,814,190,325Sucumbios 9,920,106,759 11,575,907,908 9,730,562,247 11,584,030,544 11,539,036,473NOT PROVINCE SPEC 82,528,751,500 120,654,377,784 60,200,271,529 65,835,823,516 105,793,541,048Total 1,429,697,276,144 1,494,138,967,261 1,384,731,373,381 1,550,419,289,405 1,228,089,669,809* Expenditr daa for 1999 reflects Codificado& budget a of JUy 6, 1999Source: Ministy of Finance
Table A46. Allocation of Central Government Expenditures in Education by Province (Percentage Sharing)PROVINCE 1995 1996 1997 1998 1999*Azuay 5.93% 5.77% 6.11% 6.58% 5.68%Bolivar 2.64% 2.44% 2.48% 2.56% 2.63%Canar 1.90% 1.93% 1.85% 1.90% 2.36%Carchi 1.67% 1.65% 1.59% 1.66% 1.96%Cotopaxi 2.71% 2.70% 2.76% 2.94% 3.300/.Chimborazo 4.87% 5.02% 5.16% 5.24% 5.38%El Oro 5.25% 5.05% 5.05% 5.09% 5.29%/.Esmeraldas 4.60% 4.74% 4.55% 4.54% 4.72%Guayas 18.60% 19.08% 18.33% 17.60% 16.40%/Imbabura 3.48% 3.43% 3.51% 3.50% 3.58%Loja 6.45% 6.28% 6.32% 6.39°/. 6.62%Los Rios 4.92% 4.85% 4.87% 5.03% 4.95%Manabi 9.22% 9.40% 9.35% 9.25% 9.56%Morona Santiago 1.22% 1.30% 1.23% 1.31% 1.65%Napo 1.59%/o 1.39% 1.40%/ 1.43% 1.81%Pastaza 0.91% 0.84% 0.80%/. 0.84% 1.05%Pichincha 18.07% 17.89% 18.55% 17.83% 15.96%Tungurahua 3.92% 4.04% 4.04% 4.08% 4.08%Zamora Chinchipe 1.05% 0.99% 0.97% 1.03% 1.300/.Galapagos 026% 0.37% 0.33% OA2% 0.700/hSucumbios 0.74% 0.84% 0.73% 0.78% 1.03%Grand Total 100.00% 100.00%/ 100.00% 100.00% 100.000h* Exjendi daa for 1999 reflecb 'Codificado' budget a of July 6,1999Source: Ministy of F'mmce
Statistical Annex, Page 27

Tabe A47. Central Government Expenditures in the Labor Sector by Institutin (Real 1993 Sucres)INST]TUTION 1995 1996 1997 1998 1999*MINISTERIO DE TRABAJO Y RECURSOS HUMANOS 8,067,292,813 9,241,069,874 7,870,592,646 8,819,644,799 7,518,387,068SERVICIO ECUATORIANO DE CAPACITACIONPROFESIONAL (SECAP) 9,076,809,900 14,887,565,658 15,016,931,842 14,672,124,787 12,840,432,379INSTMITTO NACIONAL DE EMPLEO (INEM) 730,647,400 623,138,975 525,770,238 478,263,438 115,496,82UNIDAD EJECUTORA DEL PROGRAMA DEMICROEMPRESAS (UNEPROM) 31,947,000 - - -
TOTAL 17,906,697,113 24,751,774,507 23,413,294,725 23,970,033,024 20,474,316,273* Expenditure data for 1999 reflecots 'Codificado" budget as of July 6, 1999Source: Miniatry of Finance
Table A48. Central Government Expenditures in the Labor Sector by Activity (Real 1995 Sucres)
ACTIVITY 1995 1996 1997 1998 1999*ADMINISTRACION GENERAL 5,001,043,590 6,013,419,078 6,651,393,953 8,628,925,847 8,051,554,870COORDINACION SECTORIAL 129,950,000 257,581,572 152,568,344 285,054,553 323,381,707APOYO A LOS GOBIERNOS SECCIONALES 1,545,180,394 - - -
PROMOCION DEL EMPLEO Y DESARROLLO LABORAL 2,135,178,551 1,960,824,966 1,870,993,540 1,955,872,147 1,489,801,903ADMINISTRACION Y MEDIACION LABORAL 2,288,772,214 2,295,438,373 2,255,942,131 2,366,856,594 1,871,156,172FOMENTO A LA MICROEMPRESA 613,615,258 551,072,409 156,633,453 172,596,268 154,093,474FORMACION PROFESIONAL 7,738,137,500 12,128,257,714 12,325,763,304 10,560,727,615 8,584,328,147TOTAL 17,906,697,113 24,751,774,507 23,413,294,725 23,970,033,024 20,474,316,273* Expenditure data for 1999 reflcts "Codificado" budget as of July 6, 1999Source: Ministry ofFinance
Table A49. Central Government Expenditures in the Labor Sector by Personnel and Other Costs (Real 1995 Sucres)1995 1996 1997 1998 1999*
Other Costs 7,536,785,361 9,235,975,347 8,938,537,246 10,890,334,778 9,328,781,079
Personnel 10,369,911,752 15,515,799,159 14,474,757,479 13,079,698,245 11,145,535,194
Total 17,906,697,113 24,751,774,507 23,413,294,725 23,970,033,024 20,474,316,273* Expenditure data for 1999 reflects "Codificado" budget as of July 6, 1999Source: Ministry of Finance
Table A50. Central Government Expenditures in the Labor Sector by Personnel and Other Costs (Percentage Sharing)1995 1996 1997 1998 1999*
Other Costs 42.09% 37.31% 38.18% 45.43% 45.56%
Personnel 57.91% 62.690/% 61.82% 54.57% 54.44%oTotal 100.00% 100.00% 100.00% 100.00% 100.00%/* Expfndite daa for 1999 refleeb '"Codificado' budet as of July 6, 1999Source: Miniatry ofFinane
Statisical Annex, Page 28

Table ASI. Central Government Expenditures in the labor Sector by Recurrent and Capital Investment (Real 1995 Sucres)1995 l996 1997 1998 1999*
RECURRENT 12,494,804,620 23,218,017,900 22,706,985,370 22,393,016,878 20,235,365,404CAPITAL INVESTMENT 5,411,892,493 1,533,756,606 706,309,355 1,577,016,145 238,950,869Total 17,906,697,113 24,751,774,507 23,413,294,725 23,970,033,024 20,474,316,273* Expendit"re d for 1999 reflects "Codificado" budget as of July 6,1999Source: Minisby of Fine
Table A52. Central Government Expenditures in the Labor Sector by Recurrent and Capital Investment (Percentage Sharing)1995 1996 1997 1998 1999*
RECURRENT 69.78% 93.80% 96.98% 93.42% 98.83%
CAPITAL INVESTMENT 30.22% 6.20% 3.02% 6.58% 1.17%Total 100.00% 100.00% 100.00% 100.00% 100.00%* Expenditure data for 1999 reflects 'Codificado' budget as of July 6, 1999Source: Ministry of Fiiance
Statistical Annex, Page 29

Table A53. Central Government Expenditures in Social Welfare by Insttutiom (Real 1995 Sucres)INSTITUTION 1995 1996 1997 1998 1999^MINISTERIO DE BIENESTAR SOCIAL 171,311,088,874 279,356,495,068 130,762,324,553 93,292,327,216 300,282,564,402CORPORACION NACIONAL DE APOYO A LASUNIDADES POPULARES ECONOMICAS (CONAUPE) 1,034,990,180 0 0 0 0CONSEJO NACIONAL DE LAS NACIONALIDADES YPUEBLOS INDIGENAS DEL ECUADOR 0 0 0 0 9,406,919,451CONCEJO NACIONAL DE DISCAPACIDADES 0 0 0 0 860,059,815Total 172,346,079,054 279,356,495,068 130,762,324,553 93,292,327,216 310,549,543,668* Expenditure data for 1999 reflects 'Codificado' budget as of July 6, 1999Source: Ministy of Finance
Table AS4. Central Government Expenditures In Social Welfare by Personnel and Other Costs (Real 1995 Sucre)1995 1996 1997 1998 1999*
OTHER COSTS 151,732,992,458 256,470,448,548 108,871,480,066 69,809,125,146 292,080,292,220PERSONNEL 20,613,086,596 22,886,046,520 21,890,844,487 23,483,202,071 18,469,251,448Total 172,346,079,054 279,356,495,068 130,762,324,553 93,292,327,216 310,549,543,668* Expenditure data for 1999 reflects 'Codificado' budget as of July 6, 1999Source: Minisay of Finrice
Table A55. Central Govermment Expenditures in Socal Welfare by Personnel and Other Costs (Percentage Distribution)1995 1996 1997 1998 1999*
OTHER COSTS 88.04% 91.81% 83.26% 74.83% 94.05%PERSONNEL 11.96% 8.19% 16.74% 25.17% 5.95%Total 100.00% 100.00% 100.00% 100.00% 100.00%A* Expenditure data for 1999reflects 'Codificado' budgetas of July 6, 1999Source: Ministy of Firnce
Table A56. Central Govermnent Expenditures in Social Welfare by Personnel and Other Costs (Real 1995 Sucres)1995 1996 1997 1998 1999*
Recurrent 95,986,477,434 183,711,731,837 112,525,595,607 86,724,090,690 226,099,499,628Capital Investment 76,359,601,620 95,644,763,231 18,236,728,945 6,568,236,526 84,450,044,040Total 172,346,079,054 279,356,495,068 130,762,324,553 93,292,327,216 310,549,543,668* Expenditure data for 1999 reflects *Codificado' budget as of July 6, 1999Source: Ministry of Finonce
Table A57. Central Government Expenditures in Social Welfare by Personnel and Other Costs (Percentage Sharing)1995 19% 1997 1998 1999*
Recurrent 55.69% 65.76% 86.05% 92.96% 72.81%Capital Investrnent 44.31% 34.24% 13.95% 7.04% 27.190/Total 100.00% 100.00% 100.00% 100.00% 100.00%* Expenditure data for 1999 reflects 'Codificado' budget as of July 6, 1999Source: Ministy of Finance
Statisical Annex, Page 30

Table AS. Central Government Expenditures in Social Welfare by Province (Real 1995 Sucres)
PROVINCE 1995 1996 1997 1998 1999*National 166,276,091,940 277,160,990,231 127,948,220,907 90,649,401,991 302,484,089,730Azuay 176,210,000 80,333,413 77,434,967 57,819,606 35,157,746Bolivar 7,034,000 5,982,938 5,465,153 4,095,906 2,556,005Canar 575,115,963 396,487,688 861,808,485 475,784,840 3,009,952,818Carchi 31,886,000 27,110,190 24,763,169 248,511,031 11,584,122Cotopaxi 182,539,000 10,657,109 9,734,919 7,295,919 4,553,960Chimborazo 76,341,000 66,894,722 61,103,430 64,190,658 385,634,666El Oro 213,533,000 51,690,147 26,043,853 19,518,791 12,183,222Esmeraldas 352,382,000 31,685,084 29,021,889 88,310,329 55,121,464Guayas 508,564,637 194,308,972 288,173,094 304,324,153 231,673,259Imbabura 163,262,167 108,105,969 175,807,159 196,094,379 202,201,408Loja 686,616,167 414,403,242 404,300,607 576,912,238 3,745,227,016Los Rios 111,772,000 105,347,568 89,708,652 81,480,485 47,219,493Manabi 203,700,000 101,288,893 91,004,064 119,087,573 74,326,236Morona Santiago 49,450,000 39,077,872 31,639,253 20,565,838 14,168,259Napo 520,994,000 12,438,702 8,539,532 6,400,026 3,994,762Pastaza 44,674,000 3,973,431 6,243,873 4,679,524 2,920,861Pichincha 1,841,716,180 496,868,790 584,269,545 338,593,448 207,719,037Tungurahua 240,485,000 37,887,051 29,027,872 21,755,305 14,575,027Zamora Chinchipe 12,297,000 5,354,050 4,890,778 3,665,436 2,287,889Sucumbios 71,415,000 5,609,005 5,123,351 3,839,740 2,396,685Grand Total 172,346,079,054 279,356,495,068 130,762,324,553 93,292,327,216 310,549,543,668* Expaendi data for 1999 relocts Codificado' budget a of July 6,1999
Sowee: Minity ofvmmace
Statistical Annex, Page 31

Annex 2: Methodology Used for Deriving Estimates of Poverty
Suhas A. Parandekar and Wladymir BrborichNovember, 1999
This annex describes the methodology used to derive the poverty estimates presented inthe main text. Poverty is estimated on the basis of a consumption aggregate for the household. A"food poverty line" was defined as the amount of expenditures needed to buy a food basketwhich would yield 2,300 kilocalories per person per day. The poverty line is derived from thefood poverty line, based on the proportion of non-food expenditures reported by households onthe margin of the food poverty line.
The LSMS questionnaire for 1998 was not identical to the LSMS questionnaire for 1995 -specifically, a number of extra items were added on to the food part of the questionnaire for1998, and some changes were also made in relation to non-food expenditures. The strategyadopted for estimating poverty was to derive a food consumption basket on the basis of the 1998questionnaire. This basket, priced in 1998 prices derived from the LSMS 1998 questionnaireprovided the food poverty line for 1998. The same basket, priced in 1995 prices derived from theLSMS 1995 questionnaire provided the food poverty line for 1995. The computation of a povertyline for 1998 based on the food poverty line for 1998, was performed using the empiricallydetermined Engel coefficient - a value of 54.3% of expenses on food. The correspondingcoefficient for 1995 was 59.0% of expenses on food.
The following is a step-by-step account of the key steps in estimation of poverty:
Steps in Estimation of Poverty.
1 . The first step was the creation of an aggregate for food consumption. Food items wereselected from the 1998 questionnaire which were common with the food items in the 1995questionnaire. Information was recorded about the fortnightly consumption of each fooditem in grams and the nominal expenditure in Sucres.
2. Information about consumption in grams was converted to calorific consumption based oncalorific values provided by SIISE (Sistema Integrado de Indicadores del Sector Social)from Quito, Ecuador.
3. Consumption on non-food items was also recorded for each household in a manner whichmatched the non-food expenditures available from the 1995 LSMS data-set. Non-foodconsumption expenditure included the following items - a) educational expenditures, b)flow of services from ownership of durables, c) expenditure on electricity, energy forcooking and illumination, and trash removal d) imputed expenditures for water, d)imputed or actual household rent and f) miscellaneous non-food expenditures.
4. Nonfood expenditures were added to food expenditures to arrive at the consumptionaggregate The household per capita consumption aggregate was used as a variable to rankhouseholds from lowest consumption to highest consumption. Households belonging tothe second and third quintiles were selected in order to define a representative basketwhich would yield 2,236 calories per person per day. The representative basket was
chosen by scaling down the actual basket of the second and third quintiles, which yielded2,320 calories on average. Table 1 presents the calculation of the representative basket.
5. The representative basket presented as Table 1 was then priced for the six Region-Areacombinations (Regions of Costa, Sierra and Oriente, Area of Urban and Rural). Thisresulted in a list of six food poverty lines, one for each Region-Area combination.
6. The six different food poverty lines were combined together to arrive at a national foodpoverty line, using Region-Area populations as weights. The consumption aggregate wasthen deflated for geographical price differences, using as an index the ratio of the Region-Area poverty lines to the National Poverty Line. Poverty estimates are based on thisgeographically deflated price aggregate. Geographic price differences in non-food itemswere not accounted for, and the sub-aggregate for imputed water expenditures was notdeflated at all.
7. The ratio of food expenditures to non-food expenditures was calculated for a particulargroup of households. These household were those who spent on food expenditures theequivalent of the food poverty line. Since the food poverty line is one number, a band of +and - 25 % was taken around the marginal household. The logic of this approach is thathouseholds who are at this margin are only making essential non-food expenditures, andthe value of non-food expenditures should be included in a poverty basket of goods. TheEngel coefficient was 0.54 in 1998 and 0.59 in 1995. The higher Engel coefficient for1998 can be explained on the basis of higher inflation for non-food items as compared tofood items - a fact confirmed by an examination of price series data from INEC.
8. The food poverty line for 1998 was Sucres 67,152 per fortnight, and the poverty line wasSucres 126,535 per fortnight. In 1995, the food poverty line was Sucres 35,052 perfortnight, and the poverty line was Sucres 59,170 per fortnight.
9. The analysis carried out for 1998 was repeated as closely as possible for 1995, with theexception that instead of calculating a new food basket for 1995, the same food basket asthe one used for 1998 was priced in the 6 Region-Area price combinations for 1995. Carewas taken that differences in poverty measures did not come about due to differences inthe components of aggregates used for the 2 survey years. However, as some componentswere imputed estimates of consumption, what was replicated was the methodology usedfor imputation rather than the regression specification themselves - these imputationswere for rental of dwelling and imputation of water expenditures.
10. Future refinements of the poverty estimates need to measure the sensitivity of theconclusions to the assumptions which have been mentioned in this annex.
2

Table 1. Calculation of Representative Food Basket
FOODC'O NAME GM RAW CAL RAW GM SCAL CAL SCAL301 acelga 3.22 0.60 3.10 0.58302 ajo 4.96 6.55 4.7S 6.31303 alveia seca 5.82 18.08 5.61 17.42304 alveria tiema 6.92 2.77 6.67 2.67305 apiO 1.87 27.00 1.80 0.26306 cebolia blanca 14.07 5.24 13.56 5.05307 cebolIa paitena 27.39 16.88 26.39 16.27308 chochos 1.62 2.21 1.56 2.13309 choclos 21.72 12.21 20.93 11.77310 col 20.19 3.22 19.46 3.10311 coliflor 4.47 69.00 4.31 0.66312 culantroyperejil 5.91 1.77 5.70 1.71313 frejol seco 7.44 24.78 7.17 23.8S314 frejol tierno 7.95 3.68 7.66 3.55315 hab seca 2.44 6.64 2.35 6.40316 habatierna 6.81 2.35 6.56 2.26317 lechuga 9.26 0.85 8.92 0.82318 lenteia 9.47 29.49 9.13 2S.42319 melloco 5.79 2.78 5.58 2.68320 mote 3.43 4.12 3.31 3.97321 papas 89.64 57.85 86.38 55.75
= 322 pepiniio 8.85 0.90 8.53 0.87323 pimientos 2.53 0.56 2.44 0.54.324 rabano 1.43 0.24 1.38 0.23325 remolacha 8.20 2.67 7.90 2.57326 totnate rinon 24.61 5.27 23.72 5.08327 vainita 1.03 0.31 0.99 0.30328 yuca 40.73 39.16 39.25 37.74329 zanahoria 18.99 7.21 18.30 6.95_330 aguacate 7.91 4.77 7.62 4.60331 banano 67.73 43.89 65.27 42.30332 limon 20.71 4.05 19.96 3.90.333 mmdrina 1.84 0.56 1.77 0.54334 manzana 9.67 4.73 9.32 4.56_ 335 maracuya 8.83 0.86 8.51 0.83336 melon 1.55 0.24 1.49 0.23337 mors 2.76 1.31 2.66 1.26338 naranja 14.03 5.03 13.52 4.85339 naranjilla 8.08 2.68 7.79 2.5S.340 papaya 30.59 7.47 29.48 7.20341 piia 12.88 4.25 12.41 4.10342 platano maduro = 61.46 45.99 59.23 44.32.343 platanoverde 94.57 99.34 91.13 95.73.344 tomate de arbol 10.45 4.47 10.07 4.31.345 arroz 154.60 557.88 148.98 537.61:346 aroz de cebada 5.91 20.67 5.70 19.92:347 avena 9.03 35.01 8.70 33.74:348 fideos 20.96 74.37 20.20 71.67349 galletas 2.20 9.50 2.12 9.15:350 harin 16.66 59.61 16.05 57.44:351 machica 5.04 18.66 4.86 17.89:352 maiz, morocho., cangui . 7.89 7.31 7.60 7.04353 pan 52.56 159.81 50.65 154.00354 quinua 0.82 2.79 0.79 2.69355 camesuavederes 15.91 21.28 15.33 20.51357 otascames 5.28 8.48 5.09 8.17:158 visceras 0.81 1.21 0.78 1.17:159 embutidos 2.14 5.36 2.06 5.17:360 llo entero o prsas 25.06 37.60 24.15 36.23361 menudencias de pollo 2.74 3.40 2.64 3.28'362 aceite vegetal 23.18 204.83 22.34 197.39363 manteca vegetal 12.98 114.69 12.51 110.52:364 manteca de cerdo 2.20 18.83 2.12 18.15:165 leche liquids 91.63 51.58 88.30 49.71366 leche en polvo 1.30 5.01 1.25 4.83367 {iueao 13.47 42.64 12.98 41.09368 margarina o mantequilla 2.39 16.42 2.30 15.82369 hLuevos 21.39 29.13 20.61 2S.07:37C0 escado fresco 16.41 13.53 15.81 13.04:171 atun y sardinas 50.40 6.08 4.86 5.86379 Sal 20.25 0.00 19.51 0.00
2320.32 2236.00_ _ ali-ng Factor 1.04
3

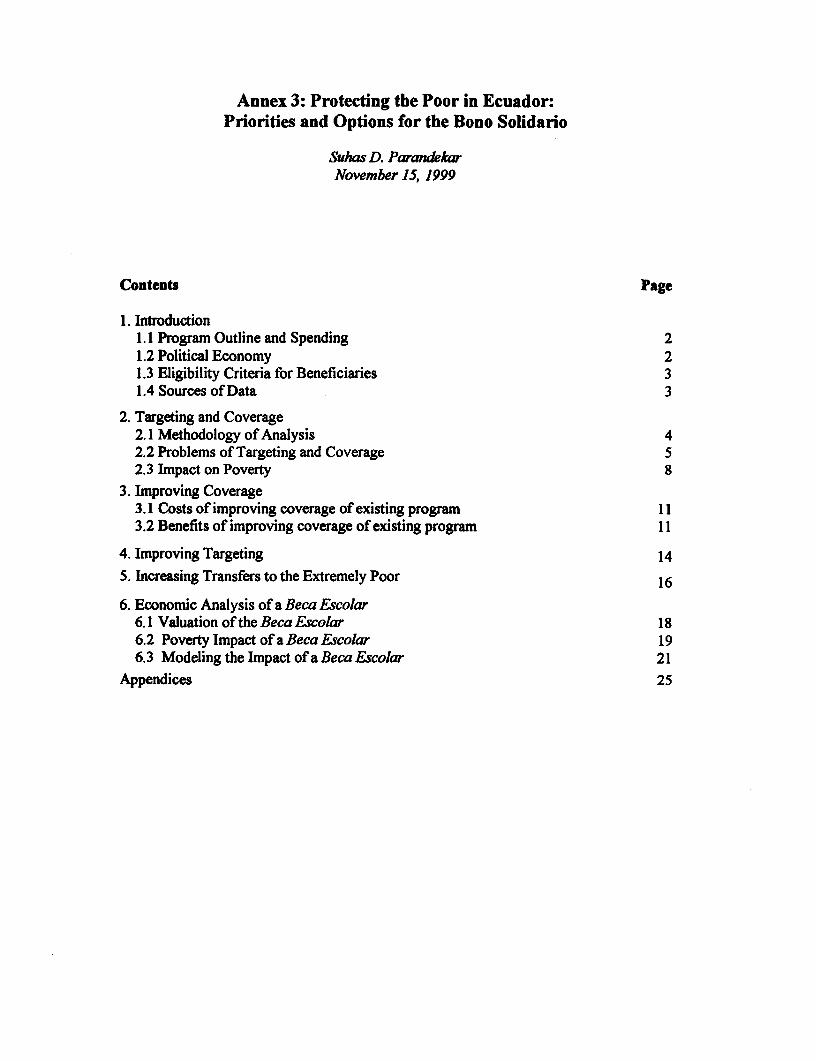
Annex 3: Protecting the Poor in Ecuador:Priorities and Options for the Bono Solidario
Suhas D. ParandekarNovember 15, 1999
Contents Page
1. Introduction1.1 Program Outline and Spending 21.2 Political Economy 21.3 Eligibility Criteria for Beneficiaries 31.4 Sources of Data 3
2. Targeting and Coverage2.1 Methodology of Analysis 42.2 Problems of Targeting and Coverage 52.3 Impact on Poverty 8
3. Improving Coverage3.1 Costs of improving coverage of existing program 113.2 Benefits of improving coverage of existing program 11
4. Improving Targeting 14
5. Increasing Transfers to the Extremely Poor 16
6. Economic Analysis of a Beca Escolar6.1 Valuation of the Beca Escolar 186.2 Poverty Impact of a Beca Escolar 196.3 Modeling the Impact of a Beca Escolar 21
Appendices 25
1. Introduction
1.1 Program Outline and Spending
The Government of Ecuador introduced an income transfer program for the poor inSeptember 1998 called the Bono de Solidaridad (or Bono Solidario in brief). The programprovides an approximate amount of 150,000 sucres per month to mothers from poor families andabout 75,000 sucres per month to poor old aged people.' The amount provided to individualhouseholds is small - at the time of the inception of the program, it cost about 150,000 sucresjust to meet the minimum calorific needs of one person for a month. Notwithstanding the smallunit benefit amount, the Bono Solidario program is the flagship program in Ecuador for SocialProtection. With approximately 1.3 million beneficiaries and a projected annual expenditure ofUS$180 million, the program represents nearly 8% of Central Government non-debt spendingand about 1.3% of Ecuador's GDP. The magnitude of the Bono can be gauged from the fact thatall Central Government Health expenditures form only 5.9% of total non-debt spending.2
1.2 Political Economv
The Bono program is important not only in terms of magnitude, but also in the context ofthe political economy in Ecuador over the past couple of years. In the September of 1998, theGovernment of Ecuador abolished general subsidies for cooking gas and electricity. The energysubsidies of approximately US$400 million per year constituted a big fiscal drain, and a numberof studies had indicated the regressive nature of these subsidies in terms of the incomedistribution in Ecuador.3 The general subsidies had been in existence for a long time, and eventhough the rich benefited more from the subsidies because of the higher energy consumption ofthe rich, the subsidies provided relief to the lower income groups as well, and the move toabolish the subsidies was met with significant public protest. The Bono program was presentedas the effort of the Government to protect the poor from the hardship associated with the increasein energy prices as well as general economic hardship. At the same time as the Governmentreduced politically popular expenditures on subsidies (from US$400 million of general subsidiesto US$200 million of targeted subsidies), it granted politically popular cash transfers to morethan one million Ecuadorians.
' The program also supports handicapped individuals, but the nain focus is on poor mothers and the old aged. At thecurrent exchange rate of 11,500 sucres to the U.S. Dollar, the Bono provides roughly $13 per month for mothers,and $6.50 per month for the aged.2 Source: Table 1: Social Sector Expenditures in Ecuador, 1999, in "Ecuador Social Sector Review: Summary ofPreliminary Findings", dated August 9, prepared by the World Bank in collaboration with the Government ofEcuador.3 See "Ecuador: Energy Pricing, Poverty and Social Mitigation", Report No. 1283 1-EC, UNDP and the WorldBank, 1994; "Ecuador Poverty Reporf', The World Bank, 1996; "Las Desigualdades de los subsidios: El Gasy LaElectricidad en El Ecuado,", Documentos de Trabajo No. 2, SIISE, Gobiemo del Ecuador, 1998.
2
1.3 Eligibility Criteria for Beneficiaries
The eligibility criteria for the Bono are fairly straightforward. The program is meant to betargeted to the poor, and amongst the poor, it seeks to reach the most disadvantaged - womenwithout a steady income who need to take care of young children, as well as old aged personswho have no access to any income source. The Executive Decree Number 129 of theGovernment of Ecuador established the following eligibility criteria for receiving the Bono.
A. Mothers
* Need to have at least one child 18 years of age* Family income of not more than Sucres 1 million* Do not have fixed salary income, nor does spouse have such fixed salary income
B. Old Aged
* Persons older than 65 years of age* Family Income of not more than Sucres 1 million* Do not have fixed salary income
C. Disabled
* Persons between 18 and 65 years of age* Disability of at least 70 %
Potential Recipients are self-selected into the program based on the approval of theirapplication form (see Appendix 1). At the inception of the program, there was no use of anyexternal validation of data on the application form, other than the fact that the local churchhandled applications. However, given evidence of widespread leakage to non-eligible persons,the government has recently experimented with various instruments for validation. Theseinstruments include criteria such as a high amount of electrical energy consumed, the ownershipof a car, or possession of a bank account as evidence to disqualify recipients. It is important tonote that the income eligibility is based on self-reported income, and that eligibility does nothave a reference to the family size or the number of children of the mother - in other words, abeneficiary with 7 children below the age threshold would receive the same amount of 150,000Sucresi per month as a mother with only one child.
1.4 Sources of Data for Analysis of the Bono Solidario
The analysis presented in this document is based primarily on the Encuesta Condicionesde Vida - Cuarta Ronda (ECV-IV), conducted by the Instituto Nacional de Estadisticasy Censos(INEC), the statistical agency of the Government of Ecuador. The ECV-IV data used for theanalysis is a high quality Household Survey data which forms part of the worldwide World Banksuppotted Living Standard Measurement Surveys (LSMS). Data analyzed here is from theSecond Trimester of the ECV-IV, carried out between the months of January and April 1999. Theanalysiis of the ECV-IV data has been carried out by the World Bank in collaboration with INEC,
3
the Consejo Nacional de Modernizaci6n del Estado (CONAM), and Sistema Integrado deIndicadores Sociales del Ecuador (SIISE).
2. Targeting and Coverage
2.1 Methodology of Analysis
Sampling: The effective sample size used in the analysis is 2466 individuals (1973mothers and 493 old aged persons) who belonged to 2054 households. Amongst the 2466individuals, 846 were recipients of the Bono. The probability proportional sampling approachutilized by the Bono allows us to use expansion factors which link the sample to the PopulationCensus of Ecuador. Utilization of the expansion factor enables us to extrapolate the samplenumbers to population totals - the total estimated number of 1,283,940 recipients closelymatches the actual number of recipients according to the database compiled by BANRED, S.A.the Bank which is entrusted with the actual payment of the Bono throughout Ecuador.
Assumptions: The ECV-IV collected data about the employment and income status ofindividuals, and it also determined whether or not individuals were beneficiaries of the BonoSolidario. The two main objects of the analysis are, therefore: a) Whether an individual waseligible to receive the Bono according to the conditions of eligibility laid out by the Government;b) Whether an individual was a recipient of the Bono. Also, the analysis presented hereexamines eligibility and receipt of the Bono according to the poverty status of the individual, andthe assumptions underlying poverty status are outlined below.
Assumptions regarding Eligibili: The demographic conditions for eligibility laid out inthe official decree are straightforward to implement in the statistical analysis of the ECV-IVdata, as is the condition about family labor income. However, the requirement that mothers andtheir spouses do not have a fixed income source is somewhat difficult to apply. One option, touse membership in the official social security system was not possible to use due to the presenceof a number of individuals who are not covered by the social security system due to tax evasionon the part of employers, as well as the absence of an explicit question in the household surveywhich asks about membership in the social security system. Given the data constraints and theambiguity of the term "fixed income", eligibility for purpose of analysis was determined on thebasis of the occupation of the individuals. The table in Appendix 2 denotes the occupationsselected as qualifying occupations on the basis of the occupations not being sources of "fixedincome".
Assumptions regarding Poverty Lines: Detailed calculations were performed forcalculating poverty lines utilizing the 1998 round of the LSMS data, the ECV-III. Due tosignificant price differences across geographic regions in Ecuador, an adjustment was made forsuch spatial price differentials. Also, given a high rate of inflation in the 1998-99 period, theinflation series provided by INEC was used to adjust for inflation. The poverty line calculationsfor 1998 were performed on the basis of a detailed consumption aggregate.4 As the consumption
4 The poverty lines and indigent lines are defined on a per capita basis. However, it is of interest to note that 36% ofthe population falls below the indigent line, a cut-off which corresponds to a total family income of 960,000 sucres,very nearly 1 million Sucres, the eligibility cut-off for the Bono.
4

aggregate was not available for the ECV-IV for 1999, the consumption aggregate was substitutedby an aggregate which represents total monetary income of the household. Annex 3 provides a) atable of the poverty lines used in the analysis b) Income quartile cut-offs, based on total incomeof the family and c) Income quartile cut-offs, based on per capita income of the family.
2.2 Problems of Targeting and Coverage
The analysis suggests that approximately 1.45 million mothers and old aged persons wereeligible to receive the Bono, with about 1.28 million actually receiving it. Just on the basis ofthese two numbers, one could derive a coverage rate of 88%. However, a more detailed analysissuggests that many who receive the Bono would not meet the eligibility criteria laid down by theGovernment, and that many eligible individuals do not receive the Bono.
Table 2.1 Targeting and Coverage: Absolute Numbers
Eligible Not Eligible Total
Bono Recipients 590,955 692,985 1,283,940
Bono Non-Recipients 856,442 1 417,795 2,274,237
Total 1,447,397 2,110,780 3,558,177
The absolute numbers are best understood in terms of the percentage of error due toundercoverage (i.e., how many of the eligible population is not covered, sometimes called a TypeI Error, after the statistical error of rejecting a true null hypothesis), and the error of leakage (i.e.,how imany of ineligible individuals receive the Bono, also called a Type II Error, after thestatistical error of accepting a false null hypothesis).
Table 2.2 Targeting and Coverage: The Two Errors
Eligible Not Eligible Total
Bono Recipients Type II Error 10000%
Bono Non- Type I ErrorRecipients 59.17%
TOTAL 100.00%
The program has different benefits and eligibility conditions for mothers and old agedpeople (see Section 1.3 above), and it is useful to examine the two groups separately to examinecost implications of the errors.5 If it were possible to clean up the system completely, eliminatingall leakages, only an extra $2 million would be needed to cover all the eligible persons. Of
s The figures presented in Table 2.3 below do not take account of administrative costs of the program, and the dollaramounts are calculated with an exchange rate of 10,000 Sucres to the U.S. Dollar.
5

course, it would neither be feasible nor desirable to meet such a zero-error scenario. Thenumbers in Table 2.3 do, however, provide an upper bound regarding the gains which arepossible by improving the accuracy in targeting and coverage.
6
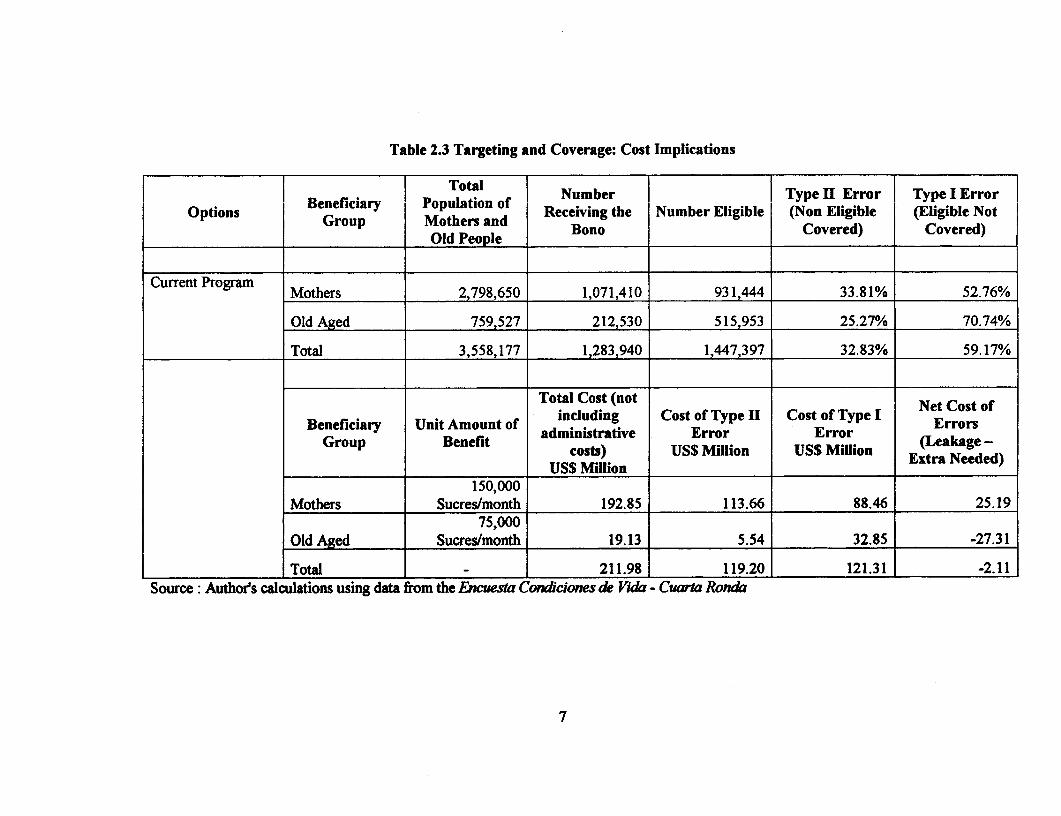
Table 2.3 Targeting and Coverage: Cost Implications
i l Total f Number I I Type I Error IType I ErrorOptions Group P ti an Receiving the Number Eligible (Non Eligible (Eligible Not
Group____ Molder Peopl Bono Covered) Covered)COrrenPeor
Cuffent Program Mothers 2,798,650 1,071,410 931,444 33.81% 52.76%
Old Aged 759,527 212,530 515,953 25.27% 70.74%
Total 3,558,177 1,283,940 1,447,397 32.83% 59.17%
Total Cost (notNeCotf
Beneficiary Unit Amount of including Cost of Type II Cost of Type I errosGroupBeneficiary UnitAmt of administrative Error Error ErrorsGroup Benefit costs) US$ Million US$ Million (Leak gee-
_____________ US$ Million Extra_____Needed)____
150,000Mothers Sucres/month 192.85 113.66 88.46 25.19
75,000Old Aged Sucres/month 19.13 5.54 32.85 -27.31
Total 211.98 119.20 121.31 -2.11Source Author's calculations using data from the Encuesta Condiciones de Vida - Cuarta Ronda
7
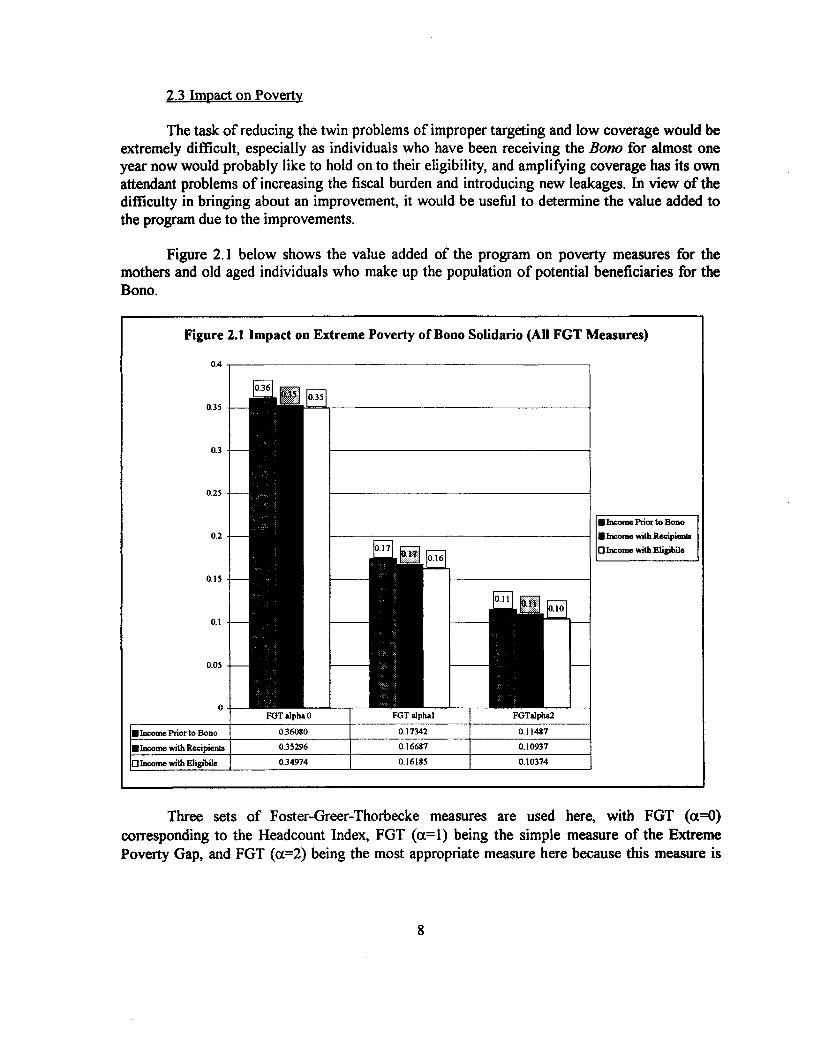
2.3 Impact on Poverty
The task of reducing the twin problems of improper targeting and low coverage would beextremely difficult, especially as individuals who have been receiving the Bono for almost oneyear now would probably like to hold on to their eligibility, and amplifying coverage has its ownattendant problems of increasing the fiscal burden and introducing new leakages. In view of thedifficulty in bringing about an improvement, it would be useful to determine the value added tothe program due to the improvements.
Figure 2.1 below shows the value added of the program on poverty measures for themothers and old aged individuals who make up the population of potential beneficiaries for theBono.
Figure 2.1 Impact on Extreme Poverty of Bono Solidario (All FGT Measures)
0.4
0.35 _0.35
0.35
0.25
* Income Prior to Bono
0.2 *ncome with Recipienis
0.17 ___ OIncome with Bligibile7 0.16
0.15
0.1
0.05
0 FGT alpha 0 FGT alphal FGTaIpha2
*Income Ptiorto Bono 0.36080 0.17342 0.11487
MIncorne with Recipients 0.35296 0.16687 0.10937
Olncome with Eligibile 0.34974 0.16185 0.10374
Three sets of Foster-Greer-Thorbecke measures are used here, with FGT (ac=O)corresponding to the Headcount Index, FGT (a=1) being the simple measure of the ExtremePoverty Gap, and FGT (a=2) being the most appropriate measure here because this measure is
8
most sensitive to the tail of the income distribution.6 Each poverty measure is computedseparately for three cases- a) With Income Distribution as it is prior to the Bono, b) With theIncome distribution being what it would be after the Bono is distributed according to the currentprogram, with Type I and Type II Errors unchanged, and c) With the Income Distribution beingwhat it would be if all eligible individuals received the Bono and there were no leakageproblems.
The primary reason for the Bono not having a major impact on poverty is the fact that theprogram is spread too thinly across the population. However, there do exist some extremely poorhouseholds for whom the Bono transfer is a significant amount. Figures 2.2 shows the foodexpenses of households with a mother receiving the Bono in comparison with the amount ofbenefit of the Bono, and an 'extreme poverty line', or the amount of food expenses required foran average family to meet the minimum calorific requirements. The graph shows that the Bono isa very small portion of an average recipient family's food budget. However, if the full amount ofthe Bono were used for food expenses, the proportion of households with food expenses belowthe 'extreme poverty line' would go down by 4 percentage points. The Bono clearly hasincentive related advantages as well. Eligibility for the Bono does not require an individual to beunemployed, and the small benefit implies negligible work disincentive effects.
6 See Appendix 4 for further details about the use of FGT measures for Poverty. FGT measures used here are forexteme poverty, defined as the expenditures required to meet basic munmum calorific energy requirements.
9
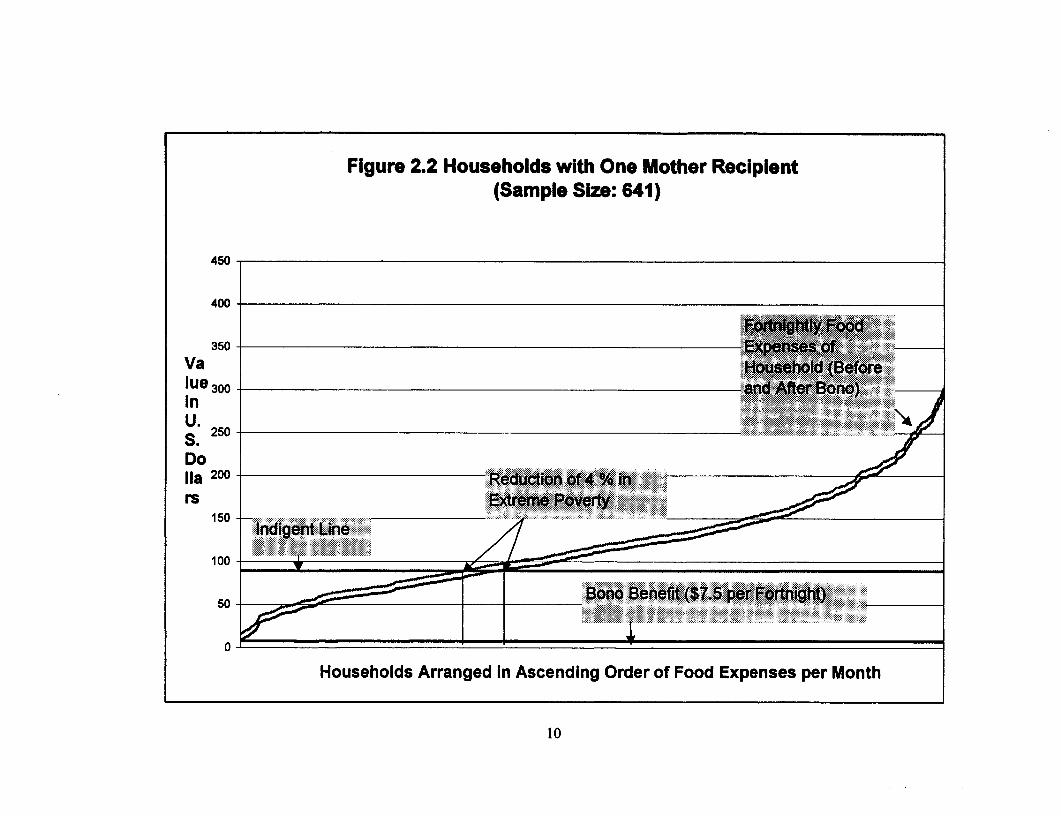
Figure 2.2 Households with One Mother Recipient(Sample Size: 641)
450
400
350-
Va11u3 0 0-In
S. 250-DoIla 200-
rs
100 -
50
Households Arranged In Ascending Order of Food Expenses per Month
10
3. Improving Coverage
3.1 Costs of improving coverage of existing program.
In sheer numbers, the problem of undercoverage seems immense - nearly 857,000eligible non-recipients, of whom 491,000 are mothers and 365,000 are old aged individuals. The57% - 43% break-up between eligible uncovered mothers and old aged individuals is in contrastswith the 64% - 36% break-up between eligible mothers and old-aged individuals. The evidencesuggests that the problem of undercoverage is higher for the old-aged as compared to mothers.Table 3.1 below details the distribution of the uncovered across urban and rural areas and acrossincome groups. The table shows that 59%/0 of the eligible uncovered are in rural areas, as opposedto 56% of all eligible individuals, and 43% of actual recipients who live in rural areas. Clearly,the problem of undercoverage is more acute in rural areas, though a significant number of urbaneligibles remain uncovered. The table also indicates that most of the uncovered eligible are theindigent poor. Amongst the nearly 1.1 million indigent eligibles, 58.54% or nearly 630,000individuals do not receive the Bono. The table also indicates that at current benefit rates, it wouldcost about US$90 million to cover all the indigent individuals presently not being covered. Theamount of US$90 million is approximately an increment of 42% to the existing spending ofUS$212 million (see Table 2.3 above). Large amounts of resources are needed to cover only theindigent among the uncovered because of the high rate of indigence - nearly 3/4ths of the eligibleuncovered are indigent, as shown in Table 3.1.
3.2 Benefits of improving coverage of existing program.
An insight into the link between poverty and the eligibility conditions is provided byeconometric modeling using a probit regression with a poverty index on the LHS and the set ofeligibility conditions on the RHS. If the eligibility conditions are important correlates of poverty,increasing the unit amount of the benefit within the existing program may be a useful approachto meet poverty reduction objectives. On the other hand, if the eligibility conditions are poorcorrelates of poverty, improving coverage may not yield the desired benefits even withsignificant increases in the per unit benefit.
Table 3.2 presents results from the probit regressions - the dependent variable is theprobability of being a member of the group of "Indigent Poor" or those who lack sufficientincome to meet the minimum calorific requirements. Results are presented separately for fourgroups made up of subsamples by urban and rural and old aged individuals and mothers. Notethat indigent poverty is defined here with careful attention to per capita income and the size ofthe family whereas the eligibility conditions for income just concern total family labor income,without regard to family size.
11
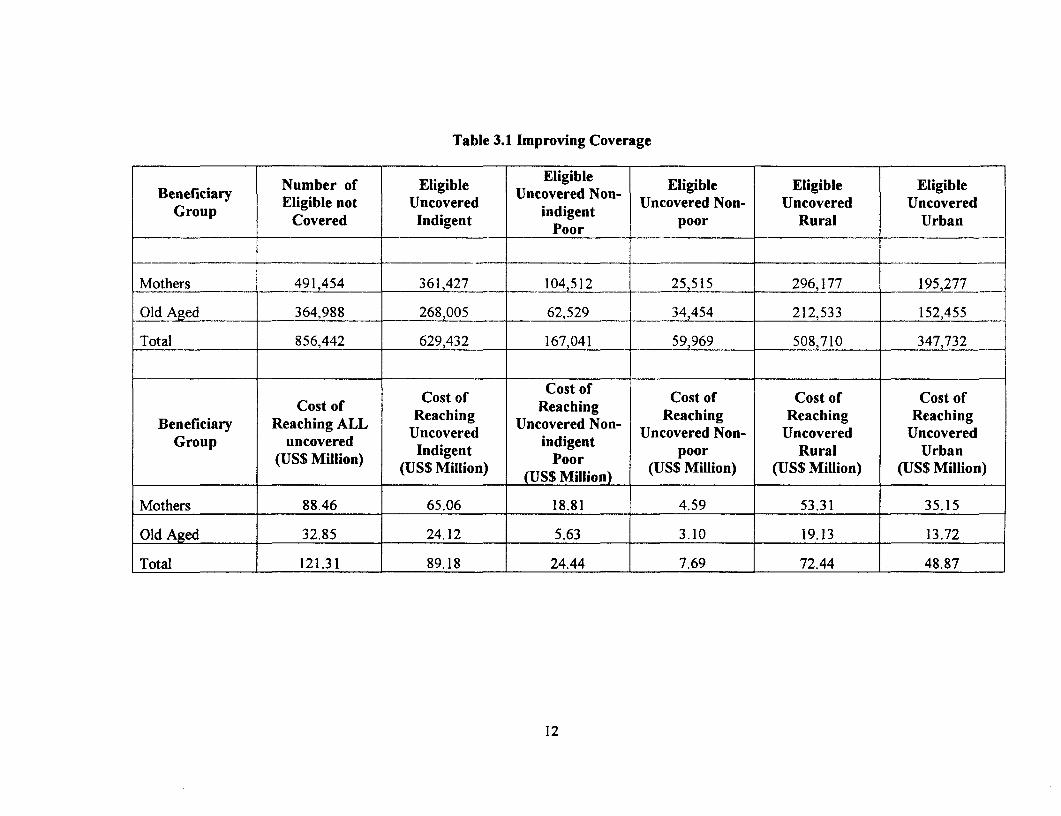
Table 3.1 Improving Coverage
Number of Eligible Eligible Eligible Eligible EligibleBeneficiary Eligible not Uncovered Uncovered Non- Uncovered Non- Uncovered Uncovered
Group Covered Indigent indigent poor Rural Urban_ _ _ _ _ _ _ _ _ _ _ _P o o r_ _ _ _ _ _ _ _ _ _ _ _ _ _ _ _ _ _ _ _ _
Mothers 491,454 361,427 104,512 25,515 296,177 195,277
Old Aged 364,988 268,005 62,529 34,454 212,533 152,455
Total 856,442 629,432 167,041 59,969 508,710 347,732
Cost of Cost of Cost of Cost of Cost ofCost of Reaching Reaching Reaching Reaching Reaching
Beneficiary Reaching ALL Uncovered ncovered Non- Uncovered Non- Uncovered UncoveredGroup Miliovr Indigent Poindigent poor Rural UrbanGroup unc iovr (US$ Million) (US$ Million) (US$ Million) (US$ Million) (US$ Million)
Mothers 88.46 65.06 18.81 4.59 53.31 35.15
Old Aged 32.85 24.12 5.63 3.10 19.13 13.72
Total 121.31 89.18 24.44 7.69 72.44 48.87
12

Table 3.2 Probit Regression Results: Eligibility and Indigent Poverty
MOTHERS OLD AGED
Eligibility Criteria Rural Urban Rural UrbanDependentVariable: Probability of being an Indigent Poor
_Marginal Effects (Evaluated at MeanIFamily incomebelow 1,000,000sucres 67.40% 50.39% 63.54% 65.91%
Does not have fixedemployment 22.75% 8.77% 5.38% 16.94%
Has child below 18years of age 22.48% 5.53% -
Spouse does nothave fixedemployment 14.67% 12.98%
The results from Table 3.2 show that the eligibility conditions bear a strong relationshipto the status of being indigent. Family Income would clearly be expected to have a strong impact,and is not a perfect predictor merely because indigent status is defined according to per capitaincome rather than family income. Interestingly, employment eligibility for mothers has a muchstronger impact in the rural areas, as does the presence of a child below the age of 18 years ofage. The probit regression results reported in Table 3.2 are preliminary, but do serve to indicatethe usefulness of improving coverage of the existing program with a focus on the indigent poor.
13
4. Improving Targeting
The task of improving targeting is a very delicate task, even though significant costsavings may be gained from improved targeting. Public opinion has a strong role in theformulation and implementation of public policy in Ecuador. The government often has had toamend previously declared policy due to general strikes and blockages, organized by groupswhich are not necessarily poor. Table 4.1 below presents an evaluation of the range acrosswhich targeting has proved to be feasible in Ecuador. The table shows that the Type II errorrates vary from a low of 22.26% (Urban Old-Aged) to a high of 42.84% (Mothers Rural). Thetable shows that significant cost savings are possible if rural error rates are brought down to therates for urban areas. The finding regarding greater targeting problems in rural areas matches theearlier finding that the problem of low coverage is more acute in rural areas. Lower coveragerates in rural areas can be explained by problems of higher transactions costs of supply as well asdemand in rural areas. Higher targeting errors in rural areas can likewise be explained by agreater information asymmetry problem in rural areas, which has a potentially important policyimplication.
The original design of the Bono involved local community organizations such as theChurch and Non-governmental Organizations (NGOs) in the application process for the Bono.While involving the community must definitely have been one of the factors leading to publicsupport of the Bono, local community involvement can potentially play a much bigger role incleaning up the rolls. Given the information asymmetry problem of determining the eligibility ofhouseholds, local community organizations can play a gatekeeping role in determining eligibilityfor the Bono. Such organizations would be very useful if they are given a particular cap on thenumber of Bonos to be made available for the community. In such a scheme, communities wouldbe faced with a distinct trade-off between the Bono being received by a non-poor and a poorhousehold, as every Bono to a non-poor household would mean one Bono less for a poorhousehold.
The Government of Ecuador is currently considering various alternatives to help improvetargeting. Some of these methods, such as disqualifying individuals who own cars or consumevery high amounts of electricity, are straightforward, and would help to eliminate the mostegregious errors of mis-targeting. The disparity between urban and rural targeting mistakesshown in Table 4.1 indicates the possibility that a strategy which works in the urban area maynot work in rural areas. The table also indicates that about 25% of leakages to non-eligibleindividuals may be a floor on the improvement efforts, and would need to be considered as suchin budgeting for improvements in targeting.
14

Table 4.1 Improving Targeting
Beneficiary Number of Number of Non- Elgible Covered Type Error Number of Non- Type HI Error
in Urban Areas in Rural Areas
Mothers 1,867,206 631,420 400,567 30.15% 230,853 42.84%
Old Aged 243,574 61,565 38,548 22.26% 23,017 32.68%
Total 2,110,780 692,985 439,115 29.24% 253,870 41.67%
Cost Savings if Cost Savings if Cost of Program Cost of ProgramAll Leakage All Leakage with Eligible with Eligible
Beneficiary Cost of Leakage Rates r educed Rates r educed Indigent Indigentto Rate for to Rate for Covered and Covered and
Group (US$ Million) Urban Old Aged Urban (29.24%) Leakage Rate of Leakage Rate of
(22.26%) 22.26% 29.24% (US$(US$ Million) (US$ Million) (US$ Million) Million)
Mothers 72.10 38.82 15.37 219.09 242.54
Old Aged 3.47 0.66 0.22 42.59 43.03
Total 75.57 39.49 15.58 261. 285.57
$ 49.7 Million $73.59 MillionAdditional as Additional ascompared to compared toExisting Existing ProgramProgram
15
5. Increasing Transfers to the Extremely Poor
The last option considered in this paper is the option of refocusing the Bono entirely onthe extremely poor. As the indigence rate (households with incomes below that necessary forminimum calorific intake) is as high as 36%, a focused approach would need to go beyond theindigent line. For purpose of this analysis, a cut-off of 500,000 sucres per month, or half theindigent line of 1 million sucres per month was used. This would bring the number ofbeneficiaries down from the current 1.3 million to about 645,000 beneficiaries. Maintaining thesame relationship between the amount per beneficiary for old aged and mothers (1:2), andmaintaining the total expenditure constant for the Bono program at US$212 million, the per unitbenefits could be raised from US$15 to US$36 for mothers, and from US$7.50 to US$18 for theold aged. If it would not be politically expedient to eliminate those who are receiving the Bonobut are not extremely poor, one option would be maintain the existing rolls at the current rate ofbenefits - the cost implications are indicated in the table. Even with a major increase in theamount of transfers to the extreme poor, there would not be a sizable impact on povertymeasures (FGT-2 would go down to 0.097). Preliminary analysis indicates that the reduction inpoverty would not be sharpened much even if a per capita transfer scheme were used within thesame budget envelope, so that larger families would receive more benefits. In conclusion, theresults indicate that some restructuring of the Bono may be needed to make it more effective as atransfer mechanism for the poorest families.
16
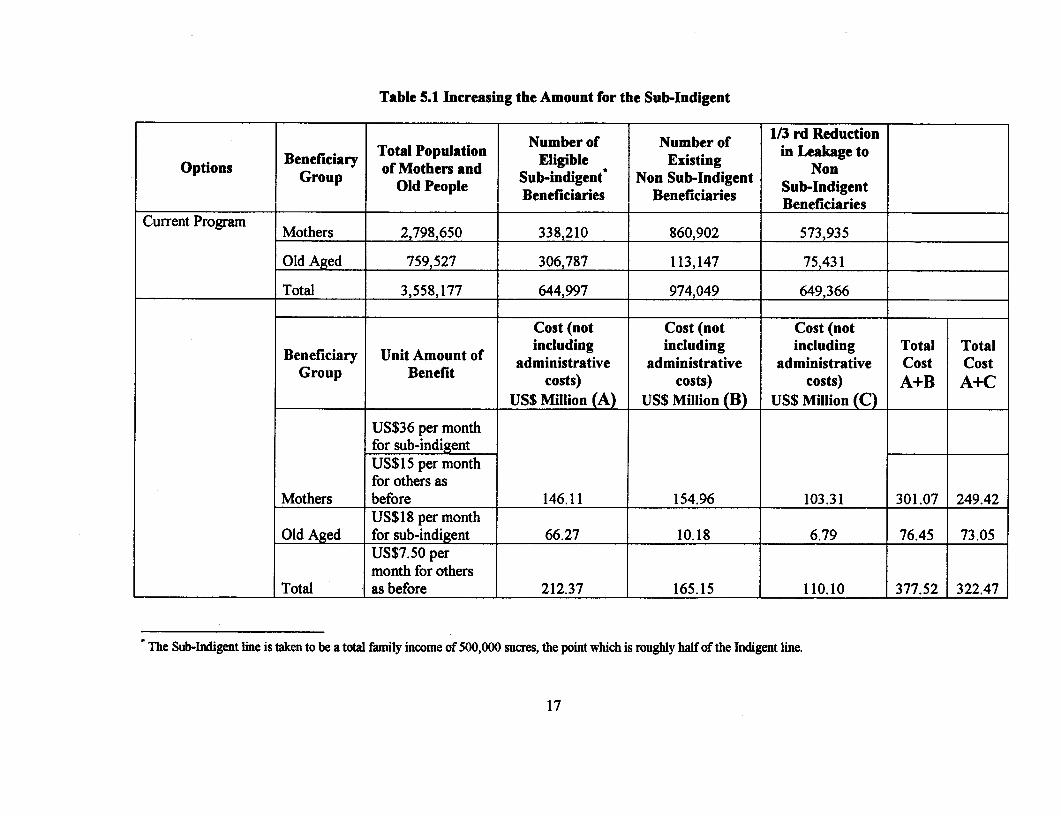
Table 5.1 Increasing the Amount for the Sub-Indigent
r ~~~~I 1 1/3 rd Reduction1
yTotal Population Number of Number of in rdaRge toOptions Beneficiary Tota Populationd Eligible Existing Non
Group Old People Sub-indigent* Non Sub-Indigent Sub-IndigentOld People Benericiaries Beneficianies Beneficiaries
Current Program Mothers 2,798,650 338,210 860,902 573,935
Old Aged 759,527 306,787 113,147 75,431
Total 3,558,177 644,997 974,049 649,366
Cost (not Cost (not Cost (notincluding including including Total Total
Beneficiary Unit Amount of administrative administrative administrative Cost CostGroup Benefit costs) costs) costs) A+B A+C
US$ Million (A) US$ Million (B) US$ Million (C)
US$36 per monthfor sub-indigentUS$15 per monthfor others as
Mothers before 146.11 154.96 103.31 301.07 249.42US$18 per month
Old Aged for sub-indigent 66.27 10.18 6.79 76.45 73.05US$7.50 permonth for others
Total as before 212.37 165.15 110.10 377.52 322.47
The Sub-Indigent line is taken to be a total family income of 500,000 sucres, the point which is roughly half of the Indigent line.
17

6. Economic Analysis of a Beca Escolar
Another option for the Bono is to introduce a complementary Beca Escolar for familieswith children aged 6 to 15 in primary school. This section provides an economic analysis of aBeca Escokhr program. It is made of three main components: (i) A description of themethodology used to derive the unit benefit amount, based on a computation of direct andindirect costs. (ii) An analysis of the potential impact of the Beca Escolar on poverty. (iii) Acost-benefit analysis, with the measured economic benefit being the increase in future earningsof children who will benefit from the Beca Escolar.
6.1 Valuation of the Beca Escolar. The unit cash transfer amount per beneficiary wouldneed to provide an adequate financial incentive - if the amount is set too low, incentives neededto bring about the desired behavior may not be forthcoming. On the other hand, if the value ofthe cash transfers were set too high, it would constitute a needless financial burden on thegovernment which could employ the additional resources in other priority areas.
A Beca Escolar would provide a stipend to mothers of primary school going children,conditional on the children attending at least 90% of classes. The Beca would be expected toimprove the attendance of children already enrolled, and protect the continued enrollment ofchildren who might otherwise drop out due to heightened financial stress on the family. Thecalculation of the value of a Beca Escolar is based on empirical estimates of the direct andindirect costs of primary schooling for the lowest quintile of the population.
Table 6.1 Direct Costs of Public Primary Schooling
Category Monthly Expenditure
Transportation 937 sucresTexts and Materials 5,011 sucresOther 3,171 sucresTOTAL 13, 120 sucresTotal in US Dollars $2.41
Source: Calculations from the Encuesta Condiciones de Vida, 1998
18

Table 6.2 Estimation of Indirect Costs of Schooling (US Dollar Equivalent)Cate_ory_ Decil e Dl Decile D2
Sample Sample,,,, .,,-, ,,, ,..Size Size
Prine Age Adult Men (Ages 21 - 45) 0.24 96 0.38 137Prime Age Adult Women (Ages 21 - 45) 0.23 92 0.34 76Children
Age 6 - 10 n.a.Age 11 n.a. 0.4 22Age 12 0.1 66 7 31Age 13 0.5 68 0.17 30Age 14 0.7 70 0.9 30Age 1.5 0.10 59 0.12 26Age 12-15 (Only Working) 0.3 60 0.9 102Age 1'2-15 Working and In Schoolb 0.9 28 0.16 40ME 580 292Working and In School 8 % 5 %Working and Not in School 7 % 5 %Not Working and In School 71 % 75 %Not W'orkin and Not in School 14 % 15 %
________ 597 312Working and In School 16 % 18 %Working and Not in School 12 % 9 %Not W'orking and In School 62 % 63 %Not W'orkig and Not in School 10% 10%
19 357 14 161
Source: Calculations from the Encuesta Condiciones de Vida, 1998
In order to compute the indirect costs of schooling, we use the following assumptions:-* Opportunity cost per hour = 6 to 7 centsD Hours per day (school, travel and study) = 6 hours daily* Effective attendance days required = 15 days per month
The opportunity cost assumption of 6 to 7 cents per hour is based on the difference in wagesbetween children only working and children working while continuing schooling. The rationaleis thalt the opportunity cost of children who gave up schooling in order to be able to workrepresents an estimate of the marginal value of the time spent at school. Other informationpresented in Table 6.2 provides contextual labor market data - for instance, the wage rates foradults show that the opportunity costs being used here for children's time is about a fifth to afourth of the adult wage rate. The monthly costs of schooling, including both direct and indirectcosts, would thus be in the range from $7.81 to $8.71 per month.
6.2 Poverty Impact of a Beca Escolar. The primary objective of the Beca would be toprotect the erosion of investment in human capital, with the ultimate impact on poverty comingthrough a higher level of educational attainment of beneficiaries. However, as an emergency
19
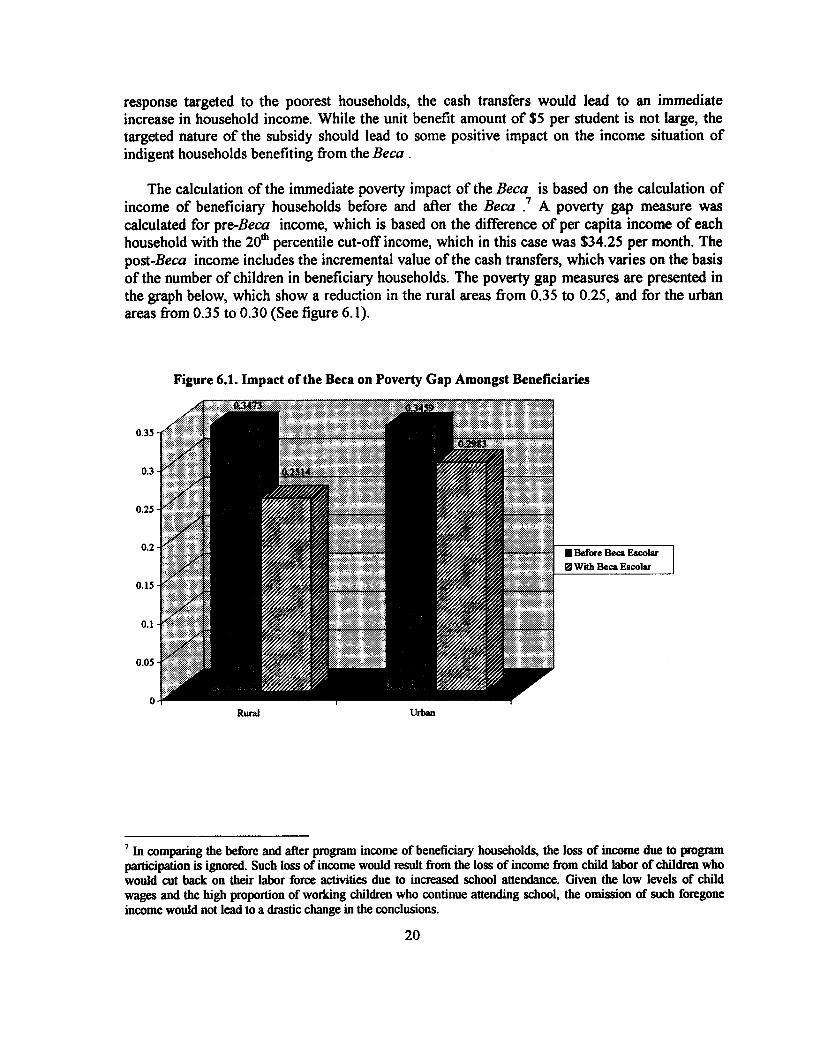
response targeted to the poorest households, the cash transfers would lead to an immediateincrease in household income. While the unit benefit amount of $5 per student is not large, thetargeted nature of the subsidy should lead to some positive impact on the income situation ofindigent households benefiting from the Beca .
The calculation of the immediate poverty impact of the Beca is based on the calculation ofincome of beneficiary households before and after the Beca .7 A poverty gap measure wascalculated for pre-Beca income, which is based on the difference of per capita income of eachhousehold with the 20t percentile cut-off income, which in this case was $34.25 per month. Thepost-Beca income includes the incremental value of the cash transfers, which varies on the basisof the number of children in beneficiary households. The poverty gap measures are presented inthe graph below, which show a reduction in the rural areas from 0.35 to 0.25, and for the urbanareas from 0.35 to 0.30 (See figure 6.1).
Figure 6.1. Impact of the Beca on Poverty Gap Amongst Beneficiaries
0.35 -
0.3 - _ E
0.25- _ E
Rundi Urban
' In companng the before and after program income of beneficiaiy households, the loss of income due to plrogramparticipation is ignored. Such loss of income would result from the loss of income from child labor of children whowould cut back: on their labor force activities due to increased school attendance. Given the low levels of childwages and the high proportion of working children who continue attending school, the omission of such foregoneincome would not lead to a drastic change in the conclusions.
20
6.3 Modeling the Impact of a Beca Escolar. Beneficiaries of the Beca would be expectedto get to a higher level of grade attainment. As a result of higher educational attainment,beneficiaries would experience increased earnings through their lifetime. Linking the future of an8-year child to the earnings increment which she would be able to capture after 20 years, as aresult of a $5 per month scholarship today, is fraught with great uncertainty. Estimation is basedon the premise that the parameters of the model are random variables with distributions based onempirically available data as well as plausible conjectures. The explicit accounting ofassumptions in this manner makes it tractable to model the complex interactions of interventionsto the ultimate future benefits.
The modeling strategy has essentially two elements. The first element consists of a set ofvariables, which are postulated to take on a specified probability distribution. Information aboutprogram intervention (such as the impact the program would have on the attendance rate) is saidto be a set of "assumption variables" modeled as random variables. These assumption variablesare then used to arrive at a final "forecast variable", which in the present case is the Net PresentValue of introducing the Beca for a three year period. The second element of the model is acomputer simulation which randomly samples different values for each of the assumptionvariables to arrive at a value for the forecast variable. The random sampling is repeated for alarge number of trials, thus giving a chance for a great number of possible parameter values to beused, leading to a simulated distribution of the forecast variable. In this case, the sample size oftrials was 10,000. The model has five inter-linked parts in a series which begins from immediateinterventions to the ultimate flow of benefits.
Part A: The Immediate Intervention Variables
The following assumptions are made regarding the impact of the Beca 8:
* The attendance rate in primary school, currently at 80%, would go up by a number which is auniformly distributed random variable, centered on an increase of 10 percentage points.
* The primary school enrollment rate among children age 6-15 in first income quintile,currently at 76% would go up by a number which is a uniformly distributed random variable,centered on an increase of 2 percentage points.
* The average age at first time enrollment in first grade, currently at 7.15 years, would godown by a number which is a uniformly distributed random variable, centered on a meandecrease of 0.37 years.
Part B: Intermediate Variables
The following assumptions are made regarding intermediate variables:
* The repetition rate in primary school, currently at 16.5 %, would go down by a numberwhich is based on a response variable of repetition to improved attendance. Computation is
sEmpirical estimates are based on data from the Encuesta de Condiciones de Vida, 1998, using data from the firstquintile defined by per capita income.
21
based on the conjecture that an average increase in attendance of 10% would lead to areduction in repetition by a uniformly distributed random variable, centered on a reduction of5 percentage points.
The drop-out rate in the first quintile is currently 11.39% - the drop-out is expected to fall byanother uniformly distributed random variable, with an average expected reduction in thedrop-out rate to 6.34 %, which is currently the drop-out rate for the second quintile.
Part C: Response Variables
The immediate interventions of the Beca (Increase in Enrollment and Attendance andReduction in Age at First Enrollment), acting directly as well as indirectly through theintermediate variables (Reduction in Repetition and Drop-Out) have an effect on the gradeattainment of beneficiary students. The responsiveness of grade attainment to each of theintervention variables is modeled as a series of random variables. Values of the responsevariables are based on plausible conjectures, using a wide distribution to account for manypossible values. The plausible conjectures were built using a set of thought experiments. Forinstance, if more children attend class more regularly, they would be expected to repeat classesless often and face a lower drop-out probability. If, in a class of 40 students, instead of eightstudents who never showed up in class for a single day in the school year, four showed up for alldays of class, thus increasing attendance by 10 percentage points, it would seem plausible thattwo of the eight erstwhile absentee students would actually be promoted to the next grade ratherthan 0 in the case of the absence of a policy intervention to increase attendance.
Part D: Final Variables
The grade attainment is expected to increase by a level which turns out, through the modelinteractions, to have a mean value of 0.16 grades (roughly 1/6th of a grade) for each year that theBeca Escolar program is active. With 6 grades constituting primary school, this estimatedincrement is intuitively reasonable as well, so that a Beca program which would last through allthe six years of primary school would result only in a year's average increase in the gradeattainment level.
Part E: Calculation of Net Present Value
The Net Present Value (NPV) of one extra year of primary schooling was computed usingdata about the increment in earnings due to primary schooling. The increment in the totalearnings stream through the working lifetime was discounted to the present value. The presentvalue of the direct and indirect costs of schooling were then netted out to give a total value ofapproximately $800 of lifetime increase in earnings for every additional grade of primary schoolattained. The simulation model itself uses a Weibull distribution for the expected increment inearnings, centered on a mean of $844.39.
The Net Present Value of one extra grade of attainment for one person is then multiplied bythe increment in grade attainment due to the program of each beneficiary, in turn multiplied by(i) the number of beneficiaries and (ii) the number of program years (3) to get at the value of the
22
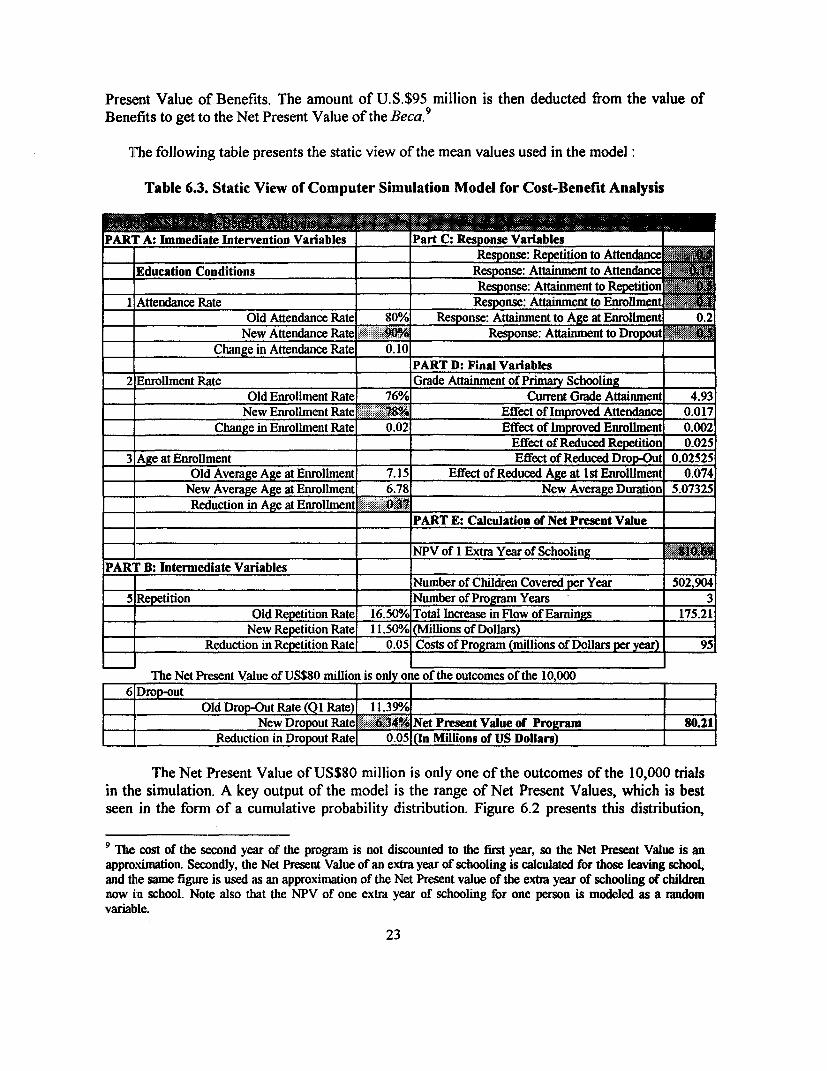
Present Value of Benefits. The amount of U.S.$95 million is then deducted from the value ofBenefits to get to the Net Present Value of the Beca.9
The following table presents the static view of the mean values used in the model:
Table 6.3. Static View of Computer Simulation Model for Cost-Benefit Analysis
PART A: Immediate Intervention Variables Part C: Response Vaniables= ~~~~~~~~~~~~~~~~Response: Repetition to Attendance
Education Conditions Response: Attainment to AttendanceResponse: Attainatent to Rptto
1 Attendance Rate Response: Attainment to EnrolmentOld Attendance Rate 80% Response: Attainment to Age at Enrollment 0.2
New Attendance Rate 90/ Response: Attainment to Dro uChange in Attendance Rate 0.10
PART D: Final Variables2 Enrollment Rate Grade Attainment of Primary Schooling
Old Enrollment Rate 76% Current Grade Attainment 4.93New Enrollment Rate .50 S% Effect of Improved Attendance 0.017
Change in Enrollment Rate 0.02 Effect of Improved Enrolmnent 0.002________________________ Effect of Reduced Repe=;o 0.025
3 Age at Enrollment Effect of Reduced Dro-Out 0.02525Old Average Age at Enrollment 7.15 Effect of Reduced Age at 1st Enrollment 0.074
New Average Age at Enrollment 6.78 New Averge Duration 5.07325Reduction in Age at Enrollment .OX
_____________________________ =_ PART E: Calculation of Net Present Value
I __________________________ _ I 1NPV of I Extra Year of SchoolingPART B: Intermediate Variables _
IlI Number of Children Covered per Year 502,9045 Repetition Number of Program Years 3
Old Repetition Rate 16.50% Total Increase in Flow of Earnings 175.21New Repetition Rate 11.500/o (Millions of Dollars)
Reduction in Repetition Rate 0.05 Costs of Program (millions of Dollars per year) 95
The Net Present Value of US$80 million is only one of the outcomes of the 10,0006 Drop-out
Old Drop-Out Rate ate) 11.39%0oNew Dropout Rate 4i34% Net Present Value of Program 80.21
Reduction in Dropout Rate 0.05 (In Millions of US Dollars) l_ l
The Net Present Value of US$80 million is only one of the outcomes of the 10,000 trialsin the simulation. A key output of the model is the range of Net Present Values, which is bestseen in the form of a cumulative probability distribution. Figure 6.2 presents this distribution,
9 The cost of the second year of the program is not discounted to the first year, so the Net Present Value is anapproximation. Secondly, the Net Present Value of an extra year of schooling is calculated for those leaving school,and the same figure is used as an approximation of the Net Present value of the extra year of schooling of childrennow in school. Note also that the NPV of one extra year of schooling for one person is modeled as a randomvariable.
23

and shows that even with the most pessimistic combination of scenarios, the program wouldhave a Net Present Value of US$28 million - with best possible outcomes, the Net Present Valuewould be as high as U$164 million.
Figure 6.2 Model Forecast about Program
Forecast: Net Present Value of Project
10,000 Trials Cumulative Chart 18 Outliers1.000 100
750 .- ...... ..-.... ......... -.... .... ........
Z, ~~~~~~~~~~~~~~~~-n
.250~~~0
30.00 60.00 90.00 120.00 150.00Millions ofU.S. Dollars
Another useful output of the model is a "Sensitivity Chart" which shows the contributionto the variance of the Net Present Value made by the various "assumption" variables (See figure6.3). To the extent that assumption variables can be directly influenced by policy interventions,information from the sensitivity chart can serve as a useful input in the implementation of a BecaEscolar.
Figure 6.3 Sensitivity Chart of Assumptions
Sensitivity Chart
Target Fomcast: Net Present Value of Beca Escolar Program
Response: Attainment to Attendanoe 25.6%
Response: Repetition to AUendance 21.1%
Respone: Afaiwnent to Repetition 15.3%
Response: Attainment to Dropout 14.6%
New Attendance Rate 9.2%
Reduction in Age at Enrollment 6.9%S
NPV of I Extra Year of Schooling 4.3%
New Enrollment Rate 1.5%
New Dropout Rate (Q2 Rate) 1.1%
Respon: Attainment to Enrollment 0.3%
0%/ 25% 50%/ 75% 100%
Measwud by Conriibution to Vafiance
24

APPENDIX I
APPLICATION FORM: SUBSIDY TO COUNTER POVERTY
1. Type of Subsidy Photograph ofApplicant
O Subsidy for Mother £O Subsidy for Old Aged (J
2. Personal Data of Mother / Beneficiary
0ULIL3UHU Number on Identification Card
Names:
Surname:
Place of Birth: _ Date of Birth: Day 00 Month OO Year OO
Number of Children: OO Date of Birth of Youngest Child: Day EOU Month OO Year OO
Number of Children Attending a Public School: OO
Marital Status: U Single O Married 0 Widowed U Divorced [ Common Law Union
3. Personal Data of Spouse (if applicable)
Names:
Surname:
Place of Birth: _ Date of Birth: Day FOU Month OO Year DD
4. Place of Residence
Province: Canton: Parroquia: Urban U Rural UlAddress:
Ownership Status of Dwelling Material of Construction Whether Household Posseses
U Own U Cane or Adobe DElectricity OWater UPhoneU Rented U WoodU Owned by Friends / Parents Ul Cement Fuel used for CookingU Is same as place of work U Mixed
25

El Other O Other ClGas OKerex OCoal EElectr.5. Labor Market Data
MOTHER/BENEFICIARY SPOUSE
Current Work StatusEl Employed
O EmployedO Unemployed O] UnemployedO Domestic Work O Domestic Work
Type of WorkEl Construction Worker
Ol Domestic WorkerO Factory Worker n Farmer / Cattle Workern Farmer / Cattle Worker El Business / Retail VendorO Business / Retail Vendor [1 ArtisanO Other El Other
Term of EmploymentEl Permanent
E PermanentE Temporary E Temporary
Monthly IncomeSucres: Sucres:
6. Declaration of Veracity
I declare, under oath, that the information on this application are true, and the same can beverified at any conveniently agreed time. In case that the data are found to be inaccurate, I wouldlose my eligibility for the Subsidy Program.
Date of Application:El E Day El E Month E E Year Signature or Thumb-imprint Signature of Witness
of Applicant
7. Data of Church where Application Filed
Name of Church: Address:Parroquia: Canton: Province:
8. Official Use Only ( Codification)
Date: Name of Codifier: Signature: Place:_Observations:
26
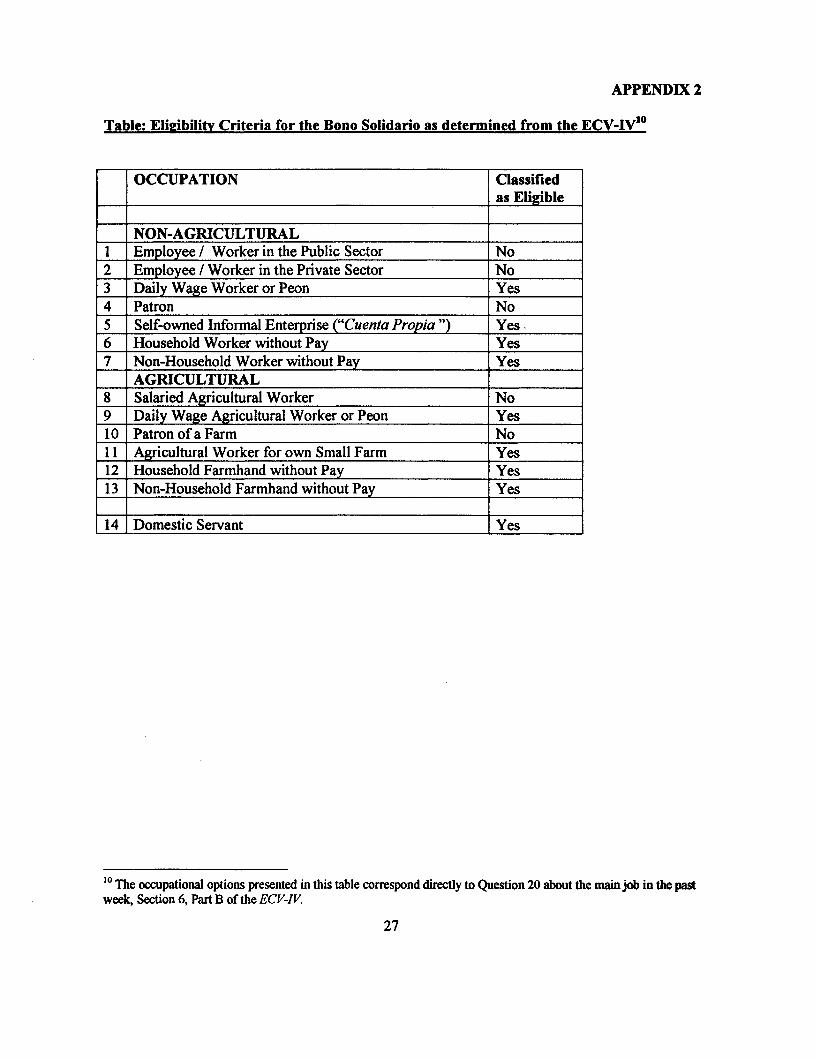
APPENDIX 2
Table: Elieibility Criteria for the Bono Solidario as determined from the ECV-IV'°
OCCUPATION ClassifiedI_________________________________________________ as Eligible
- NON-AGRICULTURAL1 Employee / Worker in the Public Sector No2 Employee / Worker in the Private Sector No3 Daily Wage Worker or Peon Yes4 Patron No5 Self-owned Informal Enterprise ("Cuenta Propia ") Yes6 Household Worker without Pay Yes7 Non-Household Worker without Pay Yes_ IAGRICULTURAL8 Salaried Agricultural Worker No9 Daily Wage Agricultural Worker or Peon Yes10 Patron of a Farm No11 _Agricultural Worker for own Small Farm Yes12 Household Farmhand without Pay Yes13 Non-Household Farmhand without Pay Yes
14 Domestic Servant Yes
'° The occupational options presented in this table correspond directly to Question 20 about the main job in the pastweek, Section 6, Part B of the ECV-IV.
27
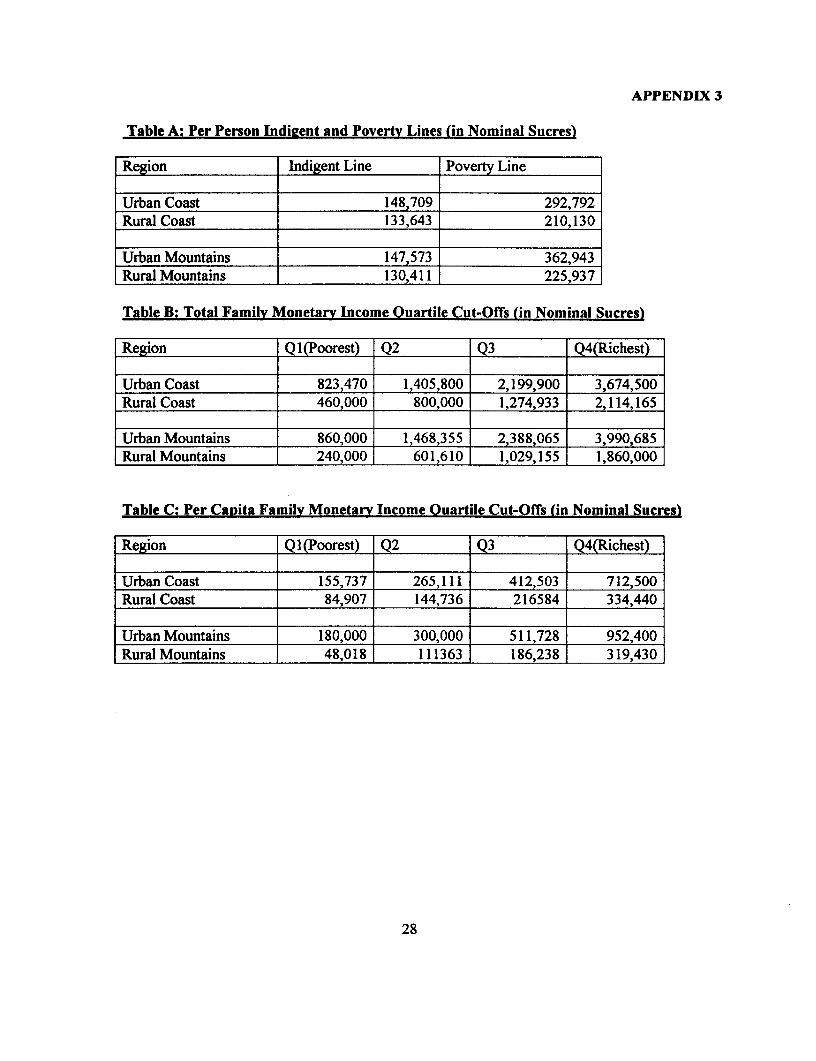
APPENDIX 3
Table A: Per Person Indieent and Poverty Lines (in Nominal Sucres)
Region Indigent Line Poverty Line
Urban Coast 148,709 292,792Rural Coast 133,643 210,130
Urban Mountains 147,573 362,943Rural Mountains 130,411 225,937
Table B: Total Family Monetary Income Ouartile Cut-Offs (in Nominal Sucres)
Region Ql(Poorest) Q2 Q3 Q4(Richest)
Urban Coast 823,470 1,405,800 2,199,900 3,674,500Rural Coast 460,000 800,000 1,274,933 2,114,165
Urban Mountains 860,000 1,468,355 2,388,065 3,990,685Rural Mountains | 240,000 601,610 1,029,155 1,860,000
Table C: Per Capita Family Monetary Income Ouartile Cut-Offs (in Nominal Sucres)
Region Q 1 (Poorest) Q2 Q3 Q4(Richest)
Urban Coast 155,737 265,111 412,503 712,500Rural Coast 84,907 144,736 216584 334,440
Urban Mountains 180,000 300,000 511,728 952,400Rural Mountains 48,018 111363 186,238 319,430
28

APPENDIX 4
Foster-Greer-Thorbecke Poverty Measures
The formula for the FGT poverty index is:
1 q_Z_Y a_Pa=-)i'
whereZ = poverty lineyi = income of the ith person
q = the number of poorn = the total population
The n people in the population are ranked by welfare from poorest to richest: i = (1, S.. q... n).The parameter a represents the sensitivity to the income distribution among the poor. Whena = 0, the FGT measure collapses to the Headcount ratio or the percentage of the populationthat is below the poverty line. This measure can give estimates of how many of the poor shouldbe served by poverty programs, but is insensitive to differences in the depth of poverty. Supposethe poverty line is $100. There are ten people in the economy and two are poor. The Headcountindex will give the same result (P0 = .2) if there are two people with incomes of $95 as it wouldwith two incomes of $5, yet clearly, in the latter case poverty is more severe.
When a = 1, the FGT index becomes the Poverty Gap, a measure of the depth of poverty. Thismeasures the total income shortfall as a percentage of the poverty line. Thus, in the case of thetwo poor people with incomes of $95, Pi = 0.01. With two poor people earning $5, P, would be0.19.
The drawback to the Poverty Gap measure is that it will estimate the poverty to be the samewhen one poor person has an income of $90 and the other an income of $10 as it would whenboth have an income of $50. Yet most people would agree that the suffering of the extremelypoor person with only $10 is worse than that of the poor person with $50 or $90. This isovercome for a > 1. Let us use a = 2. Then the first case gives P2 = 0.082 and the secondgives 0.025. The drawback to using a = 2 is that the measure is hard to interpret.
Source: from "Administering Targeted Social Programs in Latin America: From Platitudes toPractice", by Margaret E. Grosh, The World Bank, 1994, Box 3.1, p. 25
29

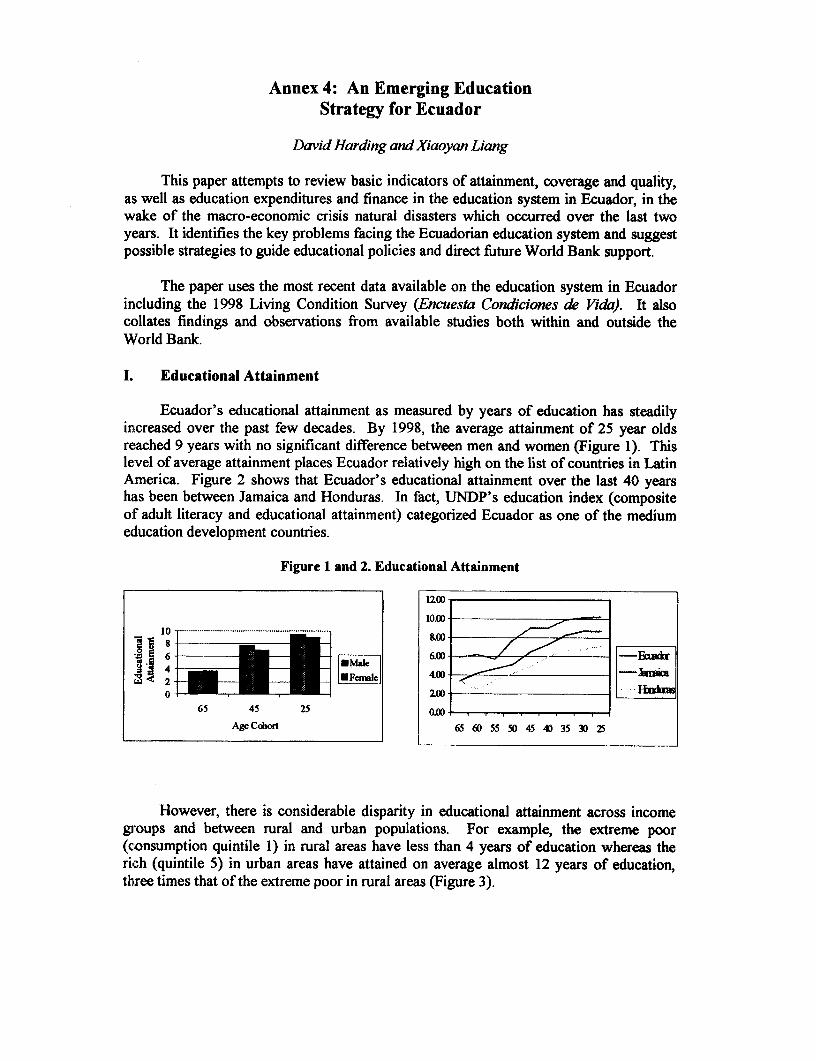
Annex 4: An Emerging EducationStrategy for Ecuador
David Harding and Xiaoyan Liang
This paper attempts to review basic indicators of attainment, coverage and quality,as well as education expenditures and finance in the education system in Ecuador, in thewake of the macro-economic crisis natural disasters which occurred over the last twoyears. It identifies the key problems facing the Ecuadorian education system and suggestpossible strategies to guide educational policies and direct future World Bank support.
The paper uses the most recent data available on the education system in Ecuadorincluding the 1998 Living Condition Survey (Encuesta Condiciones de Vida). It alsocollates findings and observations from available studies both within and outside theWorld Bank.
I. Educational Attainment
Ecuador's educational attainment as measured by years of education has steadilyincreased over the past few decades. By 1998, the average attainment of 25 year oldsreached 9 years with no significant difference between men and women (Figure 1). Thislevel of average attainment places Ecuador relatively high on the list of countries in LatinAmerica. Figure 2 shows that Ecuador's educational attainment over the last 40 yearshas been between Jamaica and Honduras. In fact, UNDP's education index (compositeof adult literacy and educational attainment) categorized Ecuador as one of the mediumeducation development countries.
Figure 1 and 2. Educational Attainment
120010.00
6~ 6.00Ed]
2 - Ij 400eAO0- 200
65 45 25 0.00
AgeCohoit 65 60 55 50 45 40 35 30 25
However, there is considerable disparity in educational attainment across incomegroups and between rural and urban populations. For example, the extreme poor(consumption quintile 1) in rural areas have less than 4 years of education whereas therich (quintile 5) in urban areas have attained on average almost 12 years of education,three times that of the extreme poor in rural areas (Figure 3).
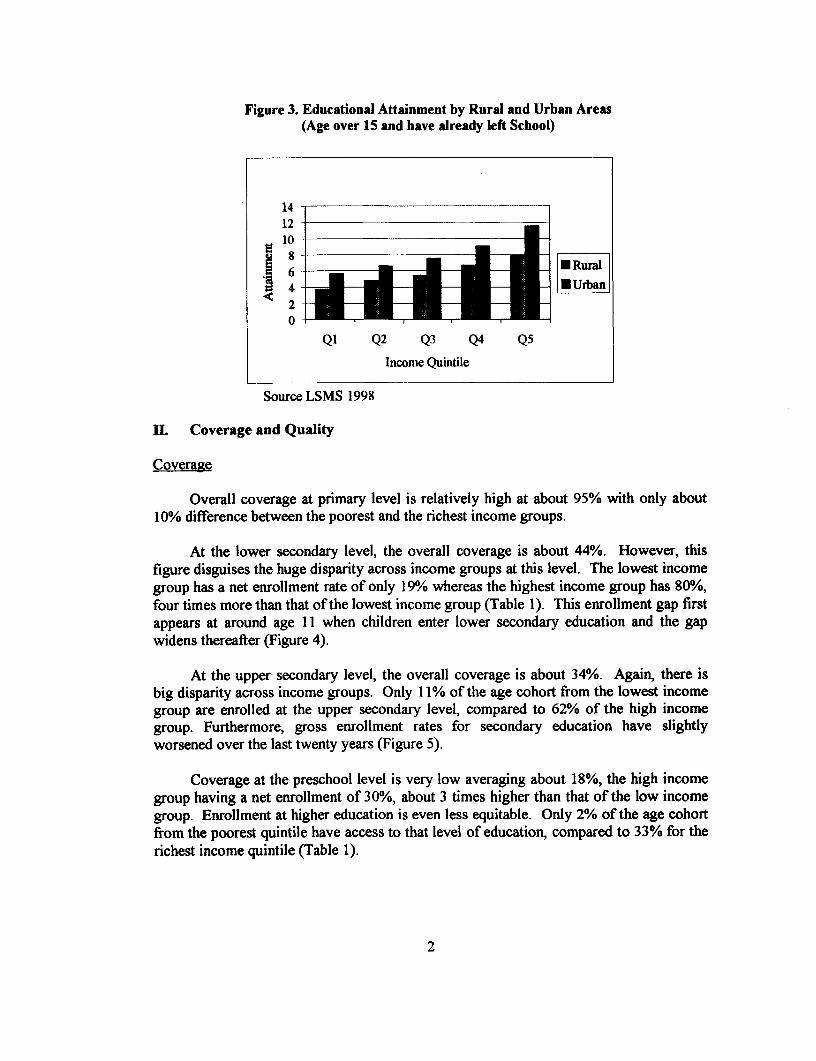
Figure 3. Educational Attainment by Rural and Urban Areas(Age over 15 and have already left School)
1412106
4 - 6 ~~~~~~~~~E Rural
4 O~~~~~~~~Urban
0Qi Q2 Q3 Q4 Q5
Income Quintile
Source LSMS 1998
H. Coverage and Quality
Coverage
Overall coverage at primary level is relatively high at about 95% with only about10% difference between the poorest and the richest income groups.
At the lower secondary level, the overall coverage is about 44%. However, thisfigure disguises the huge disparity across income groups at this level. The lowest incomegroup has a net enrollment rate of only 19% whereas the highest income group has 80%,four times more than that of the lowest income group (Table 1). This enrollment gap firstappears at around age 11 when children enter lower secondary education and the gapwidens thereafter (Figure 4).
At the upper secondary level, the overall coverage is about 34%. Again, there isbig disparity across income groups. Only 11% of the age cohort from the lowest incomegroup are enrolled at the upper secondary level, compared to 62% of the high incomegroup. Furthermore, gross enrollment rates for secondary education have slightlyworsened over the last twenty years (Figure 5).
Coverage at the preschool level is very low averaging about 18%, the high incomegroup having a net enrollment of 30%, about 3 times higher than that of the low incomegroup. Enrollment at higher education is even less equitable. Only 2% of the age cohortfrom the poorest quintile have access to that level of education, compared to 33% for therichest income quintile (Table 1).
2
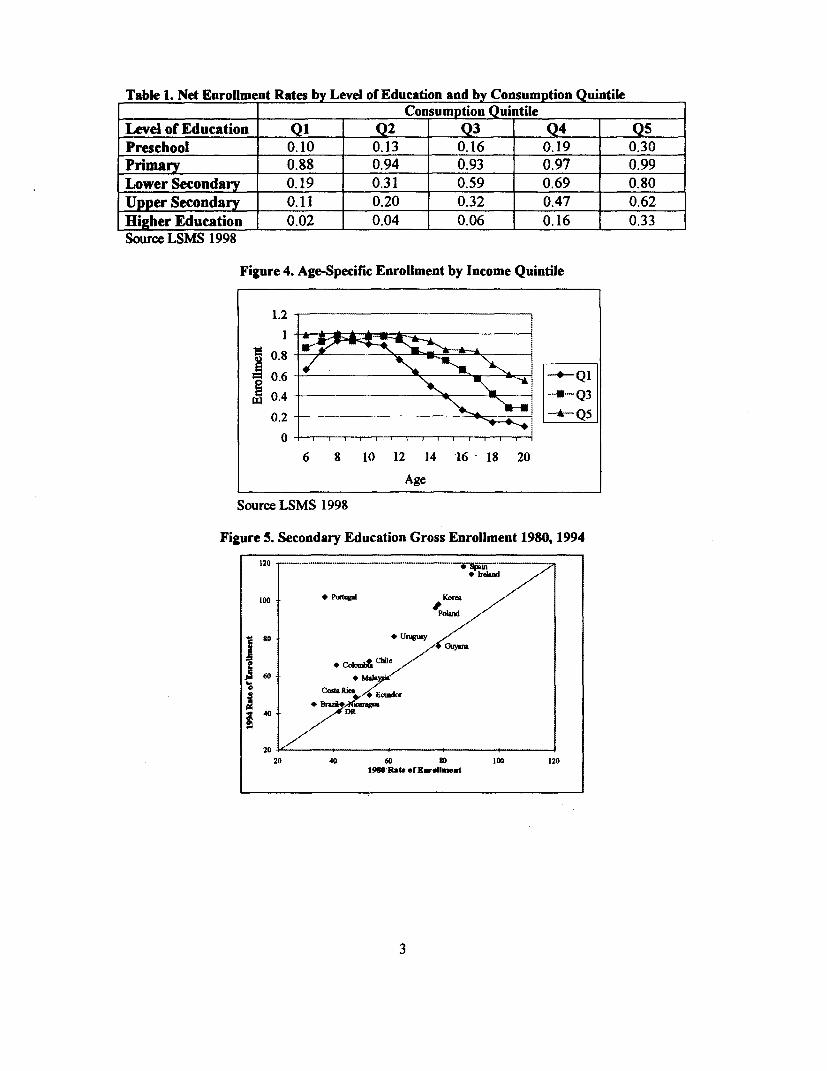
Table 1. Net Enrollment Rates by Level of Education and by Consumption QuintileConsumption Quintile
Level of Education QiL12 2 Q3 Q4 Q5Preschool 0.10 0.13 0.16 0.19 0.30Prima 0.88 0.94 0.93 0.97 0.99Lower Secondary 0.19 0.31 0.59 0.69 0.80Upper Secondary 0.11 0.20 0.32 0.47 0.62Higher Education 0.02 0.04 0.06 0.16 0.33Source LSMS 1998
Figure 4. Age-Specific Enrollment by Income Quintile
1.2-
0.8
0.6 -Qi0.I4 -. __
0.2 AQ50 6 8 10 12 14 16 18 20
Age
Source LSMS 1998
Figure 5. Secondary Education Gross Enrollment 1980, 1994120 ,,,,, ........ __ ...... -- ...... .' ..i' ....
100 Korea 7
80 * Urily ,o
60 *Ma1z,
40 DR
2020 40 60 so 100 120
19titl Rate ofErenw.t
3

At the primary level, there is no significant difference in coverage between ruraland urban groups. However, a significant gap emerges at the lower secondary level at theage of 11 and continues through to the high education level (Figure 6).
Figure 6. Age-Specific Enrollment by Urban and Rural Areas
Age-Specific Enrollment by Urban and Rural1.2 - -- .. ......................... ............ ........... ..... . ...........
M0.8 - 'm 0.6 - >> \+_, . + Urban
S 0.4 - _ _ _ _Rural
0.2 -U.
6 8 10 12 14 16 18 20Age
Source LSMS 1998
Why is attendance at lower secondary so low especially for the poor? To answerthis question, we use two methods. First, we look at the responses given to the question"why are you not enrolled in school"? Among children 11 to 15 years old, main reasonslisted for not attending school include cost (34%), not interested (19%), having to work(16%), lack of access to schools or teachers (10%), sickness (4%) and house work (3%).
Figure 7. Reasons for not Attending School (Ages 11-15)
40 34.73 530
20 5 6
1041 35 30
Z8u z
Source LSMS 1998
Second, we employ multivariate logistic regression method to investigate howfactors such as poverty, mother's education, location, and children's work status affecttheir probability of enrolling in a school. We found that the probability of enrollment atthe lower secondary schools among children 11 to 15 is significantly associated withbeing extreme poor, living in rural areas, mother's education, and whether or not thechild is working.
4

With everything else the same, the probability of enrollment for a child from anextreme poor household is only 700/o of a non-extreme-poor child; the enrollmentprobability of a working child is only 33% of a non-working child. On the contrary, withevery additional year of mother's education, the probability of enrollment increases by1.24 times; living in an urban area also increases the probability of enrolment by 1.74(Table 2).
Table 2. Predicting the Probability of Enrollment in Lower Secondary schoolsVariables B (S.E.) Exp (B)Mother's education 0.21 (0.02)*** 1.24Extreme poor -0.34 (0.13)** 0.71Female-headed households -0.23 (0.17) 0.80Indigenous 1.23 (0.25)*** 3.43Urban 0.56 (0.15)*** 1.74Costa region 0.22 (0.13) 1.25Sierra region 0.28 (0.21) 1.32Work -1.12 (0.13)*** 0.33Constant 0.62 (0.17)*** _Note: *** P<=0.001 **P<=0.01 * P<=0.05Source LSMS 1998
In other words, combining the findings from the two methods, we find that childrendo not attend lower secondary school mostly because of poverty and low maternaleducation hence lack of demand and stimulation at home. Lack of access in rural areas isalso a contributing factor.
Due to poverty many poor children have to work. Data show that substantialproportion of children between the ages of 10 to 17 are already participating in the laborforce. Figure 8 below shows that children from the lowest income group are much morelikely to be working than those from the high income group at all ages, contributingperhaps to why enrollment at secondary level of education is so low especially for thepoor.
Figure 8. Percentage of Children Participating in the Labor Force
% Children Participating in Labor Force80 . . . . . .
60
40 '-.-. -- AgelO-ll
20 Age 12-14
20 J-Age 15-17Ql Q2 Q3 Q4 Q5
Consumption Quintile
Source LSMS 1998
5
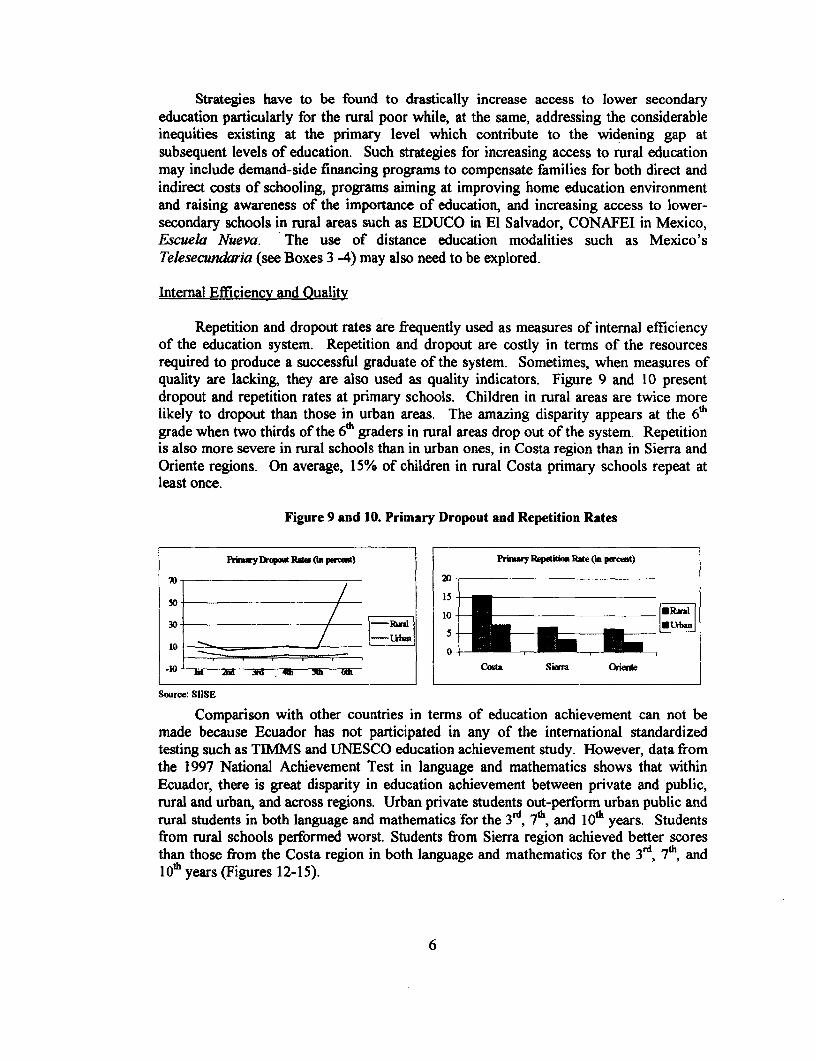
Strategies have to be found to drastically increase access to lower secondaryeducation particularly for the rural poor while, at the same, addressing the considerableinequities existing at the primary level which contribute to the widening gap atsubsequent levels of education. Such strategies for increasing access to rural educationmay include demand-side financing programs to compensate families for both direct andindirect costs of schooling, programs aiming at improving home education environmentand raising awareness of the importance of education, and increasing access to lower-secondary schools in rural areas such as EDUCO in El Salvador, CONAFEI in Mexico,Escuela Nueva. The use of distance education modalities such as Mexico'sTelesecundaria (see Boxes 3 -4) may also need to be explored.
Internal Efficiency and Quality
Repetition and dropout rates are frequently used as measures of internal efficiencyof the education system. Repetition and dropout are costly in terms of the resourcesrequired to produce a successful graduate of the system. Sometimes, when measures ofquality are lacking, they are also used as quality indicators. Figure 9 and 10 presentdropout and repetition rates at primary schools. Children in rural areas are twice morelikely to dropout than those in urban areas. The amazing disparity appears at the 6thgrade when two thirds of the 6h' graders in rural areas drop out of the system. Repetitionis also more severe in rural schools than in urban ones, in Costa region than in Sierra andOriente regions. On average, 15% of children in rural Costa primary schools repeat atleast once.
Figure 9 and 10. Primary Dropout and Repetition Rates
P-" Drpmt RPt. (f p-eit) Pr-wy ReWM- RPe (. percent)
70 - ~~~~~~~~~~~~~20-
50 / -__ _ _ _ 15
10 ~~~~~~~~~~~~~~~~0
Costa Sian 0Oiete
Source: SIISE
Comparison with other countries in terms of education achievement can not bemade because Ecuador has not participated in any of the international standardizedtesting such as TIMMS and UNESCO education achievement study. However, data fromthe 1997 National Achievement Test in language and mathematics shows that withinEcuador, there is great disparity in education achievement between private and public,rural and urban, and across regions. Urban private students out-perform urban public andrural students in both language and mathematics for the 3rd, 7*, and 1'& years. Studentsfrom rural schools performed worst. Students from Sierra region achieved better scoresthan those from the Costa region in both language and mathematics for the 3,rd 7th, and10'h years (Figures 12-15).
6
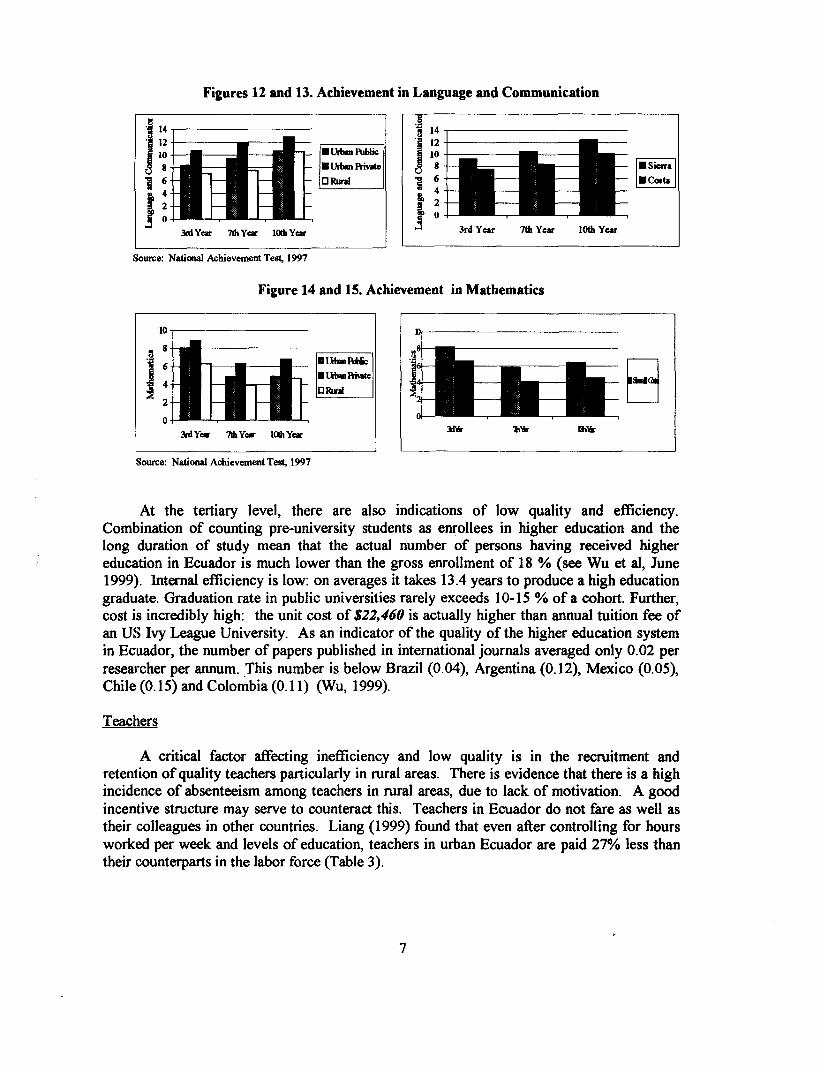
Figures 12 and 13. Achievement in Language and Communication
1 | _4 _ _14
E Ur__ ban P 8 - - | Uieahf~~~~~~~~~~ ua - - I0cotil ~ 1' 1'' a ]E62 -- ~ -O.- 0~~" - -
3fd Yew 7b Yew lObYea 3rd Year 7th Year 10th Year
Source: Nadional AchievementTest, 1997
Figure 14 and 15. Achievement in Mathematics
10~~~~~~~~~~~~~~~~O . -: , 'k _
IhEN _____ hr hrd Year 71h Yew Oi MYea 1*lllrkA
Source: National Achievement Test, 1997
At the tertiary level, there are also indications of low quality and efficiency.Combination of counting pre-university students as enrollees in higher education and thelong duration of study mean that the actual number of persons having received highereducation in Ecuador is much lower than the gross enrollment of 18 % (see Wu et al, June1999). Internal efficiency is low: on averages it takes 13.4 years to produce a high educationgraduate. Graduation rate in public universities rarely exceeds 10-15 % of a cohort. Further,cost is incredibly high: the unit cost of $22,460 is actually higher than annual tuition fee ofan US Ivy League University. As an indicator of the quality of the higher education systemin Ecuador, the number of papers published in international journals averaged only 0.02 perresearcher per annum. This number is below Brazil (0.04), Argentina (0.12), Mexico (0.05),Chile (0.15) and Colombia (0. 1 1) (Wu, 1999).
Teachers
A critical factor affecting inefficiency and low quality is in the recruitment andretention of quality teachers particularly in rural areas. There is evidence that there is a highincidence of absenteeism among teachers in rural areas, due to lack of motivation. A goodincentive structure may serve to counteract this. Teachers in Ecuador do not fare as well astheir colleagues in other countries. Liang (1999) found that even after controlling for hoursworked per week and levels of education, teachers in urban Ecuador are paid 27% less thantheir counterparts in the labor force (Table 3).
7
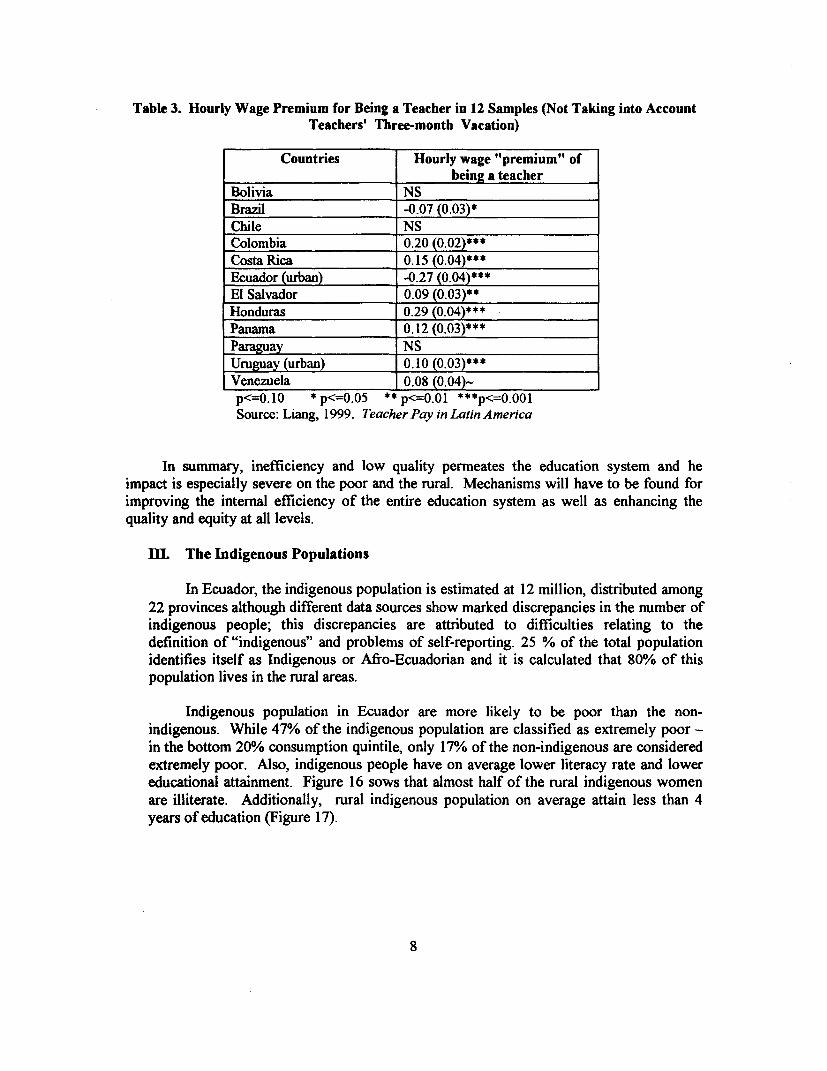
Table 3. Hourly Wage Premium for Being a Teacher in 12 Samples (Not Taking into AccountTeachers' Three-month Vacation)
Countries Hourly wage "premium" ofbeing a teacher
Bolivia NSBrazil -0.07 (0.03)*Chile NSColombia 0.20 (0.02)***CostaRica 0.15 (0.04)***Ecuador (urban) -0.27 (0.04)***El Salvador 0.09 (0.03)**Honduras 0.29 (0.04)***Panama 0.12 (0.03)***Paraguay NSUruguay (urban) 0.10 (0.03)***Venezuela 0.08 (0.04)-p<=O.10 *pp<=0.05 ** p<)0.01 ***p<=0.001Source: Liang, 1999. Teacher Pay in Latin America
In summary, inefficiency and low quality permeates the education system and heimpact is especially severe on the poor and the rural. Mechanisms will have to be found forimproving the internal efficiency of the entire education system as well as enhancing thequality and equity at all levels.
11., The Indigenous Populations
In Ecuador, the indigenous population is estimated at 12 million, distributed among22 provinces although different data sources show marked discrepancies in the number ofindigenous people; this discrepancies are attributed to difficulties relating to thedefinition of "indigenous" and problems of self-reporting. 25 % of the total populationidentifies itself as Indigenous or Afro-Ecuadorian and it is calculated that 80% of thispopulation lives in the rural areas.
Indigenous population in Ecuador are more likely to be poor than the non-indigenous. While 47% of the indigenous population are classified as extremely poor -in the bottom 2 0%/o consumption quintile, only 17% of the non-indigenous are consideredextremely poor. Also, indigenous people have on average lower literacy rate and lowereducational attainment. Figure 16 sows that almost half of the rural indigenous womenare illiterate. Additionally, rural indigenous population on average attain less than 4years of education (Figure 17).
8

Figure 17. Educational Attainment by Ethnicity
8
6 ~~~~~~~Urban
4 ~~~~~~Rumi
Indigenous Non-indigenous
Source: LSMS 1998
When looking at the enrollment rates in lower secondary schools, we found thatholding everything else constant, being indigenous means greater probability of enrollingin a lower secondary school than non-indigenous, more than 3 times greater. However,this does not mean that indigenous children on average have higher enrollment at thislevel. Using indigenous as the only explanatory variable for enrollment, we found asignificantly lower enrollment among indigenous population than non-indigenous. Thedisparity only disappears when we hold mother's education and poverty constant. Thisfinding indicates that the enrollment disparity between the indigenous and non-indigenous can be explained away by disparities in mother's education and poverty.Ulsually poor rural indigenous families have considerable financial difficulties in payingschool fees, materials and for transportation, thus contributing to the low participation inschools. Also, indigenous parents tend to have little or no formal education themselvesand the lack of stimulation and support at home is cited as a reason for low participationand poor performance of their children at school (Ivarsdotter, 1999). In fact, with thesame level of mother's education and poverty, the indigenous children (at least amongthose who are sampled) are 3.4 times more likely to enroll in a lower secondary school.
Such findings imply that policies aiming at improving the living standards ofindigenous population will help boost their children's enrollment. However, since a largeportion of the disparity can be attributed to inter-generational effect, it may take a fewgenerations before disparity will completely disappear, though programs aiming atimproving home educational environment such as community-based early childeducational programs may help alleviate the disparity.
9

There is evidence of labor market discrimination against the indigenous population. Thehousehold survey data show that the return to an additional year of education for theindigenous population is only 8%, as compared to 12% for the non-indigenouspopulation. Reasons for this "discrimination" are less clear. It could be that the qualityof education received by indigenous and non-indigenous groups differ, favoring the non-indigenous. Or it could be as simple as a ianguage factor since the indigenous groupeither don't speak Spanish ordon't speak it as well as the Box 1. Guatemala: Bilingual Educationnon-indigenous people. One possible strategy for bilingual education is to develop
the two languages to adequate proficiency level during
Bilingual Education primary schooling through simultaneous or parallel bilingualeducation programs. However, there are very few
A recent study developing countries except Guatemala, where thesimultaneous bilingual education model is used. The
commissioned by the IDB has experiment in Guatemala shows promising results not onlysuggested that one major because of the increase in students' enrolment andpriority for the indigenous and completion but also the achievements in both language andAfro-ecuadorean populations is academic subjects. The six-year bilingual school studentsaccess to bilingual education out-performed Spanish-only medium students significantly(Encalada et al., IIDB, 1999. in Mathematics and Social Studies, and at the same timeOven eh last yD r,19 they do not fall behind in Spanish language despite spending
Over the last ten years, a less time in the language ( Dutcher, 1995). Despite thesestrategy of intercultural and positive signs, many countries might be reluctant to adoptbilingual education has been this model. One major concern is the cost of this type ofimplemented. The National bilingual education. Many experimental programs show theDirectorate of Bilingual and cost higher than a nonnal programr... .However, theIntercultural Education has effectiveness of bilingual education programs should bemade a major effort to develop a explored further. The initial study on the cost effectiveness
of *. ~~~~of bilingual education in Guatemala shows very positivesystem of bilingual and indications in tenns of cost-savings (Patrinos & Velez,intercultural education with an 1996). Availability of competent bilingual teachers,appropriate pedagogy and affordability for development and production of bilingualadministration. learning materials, and acceptance and strong support for the
program from the minority communities are fundamentalDespite many achievements factors for their success.
neither the internal and external Source: Win Aung (1999)efficiency of the program isknown, nor its impact onimproving the student learning in indigenous communities, the relationship betweenbilingual education and productive work, and the perception of the communitiesconcerning the curriculum, teacher development, and the designation of educationalauthorities and their role in the development of the communities ). These programs needto be evaluated before large-scale implementation
Employing mother tongue instruction in the early years of schooling in othercountries in the region, has been shown to increase school effectiveness through higherlearning achievement thereby increasing the internal efficiency of the educational systemby producing lower dropout and repetition rates. While bilingual education isundoubtedly more expensive than traditional Spanish-only schooling, learning outcomesare often greater; greater learning outcomes are often reflected in lower repetition rateswhich, in turn, reduce the cost of schooling. Studies such as those of the bilingual
10

education program in Guatemala demonstrate that higher learning outcomes andimproved efficiency can more than offset the cost differential involved in bilingual;education. (see Box 1).
IV. Expenditure and Finance
Central Government Expenditure
Public financing for education in Ecuador comes almost exclusively from thecentral government. Public spending on education as a percentage of GDP has remainedrelatively steady (3.1%) over the last 5 years and has remained a priority within the socialsector (Figure 18). In 1995, the distribution of education spending is 35% for primary,35% for secondary, 23% for higher education, and another 7% for administration, literacycampaign and infrastructure. This composition of the education spending can betranslated into relatively high unit cost at the high education level (US$1300) and lowunit cost at the primary level (less than US$200) (Figure 19). The unit costs also haveremained rather steady over the last few years.
More than 99% of the education budget is allocated for recurrent costs. In bothprimary and secondary education, more than 99% of the recurrent budget is spent onteachers and other personnel, leaving less than 1% for non-salary expenditures oninstructional materials and other learning aids (Figure 20).
11
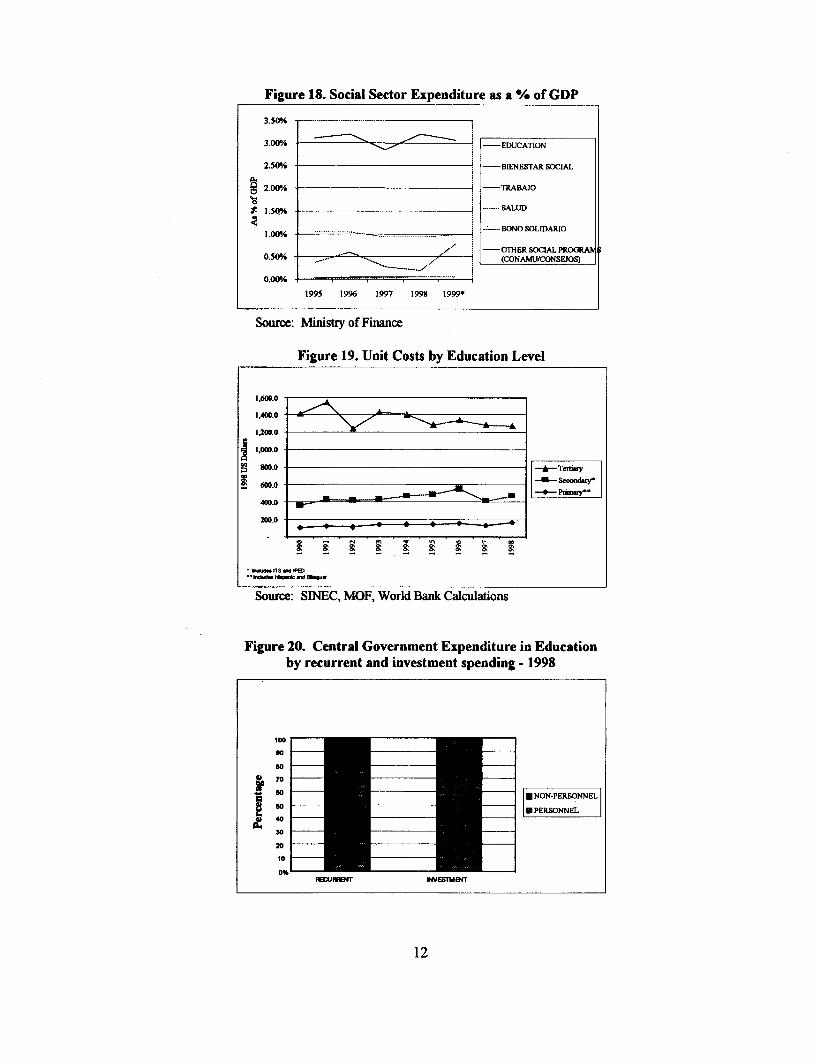
Figure 18. Social Sector Expenditure as a % of GDP
3.50% -... ............ . .__..
3.00% , EWCATION
2.50% -BIENESTAR SOCIAL
2.00% - TRABAO
1.50% -D
_________ _________ _______BONO SOLtDARIG1.00% . ............... ..............
30 .OTH. -allER SOCIAL PROGRA.0.50% - S ... ;._ ____s , (CONAMU/CONSEIOS)
0.00%
1995 1996 1997 1998 1999*
Source: Ministry of Finance
Figure 19. Unit Costs by Education Level
16000
1,400.0
1,200.0
1.000-
,n 800.0 - Ttwy
400.0
200.0I
k aN
Source: SINEC, MOF, World Bank Calculations
Figure 20. Central Government Expenditure in Educationby recurrent and investment spending - 1998
100
900
* 70
so = | NON-PERSONNEL
so 50 _ _* PERSONNEL
30
20
10
0%
FMUMW NVEETMM41
12
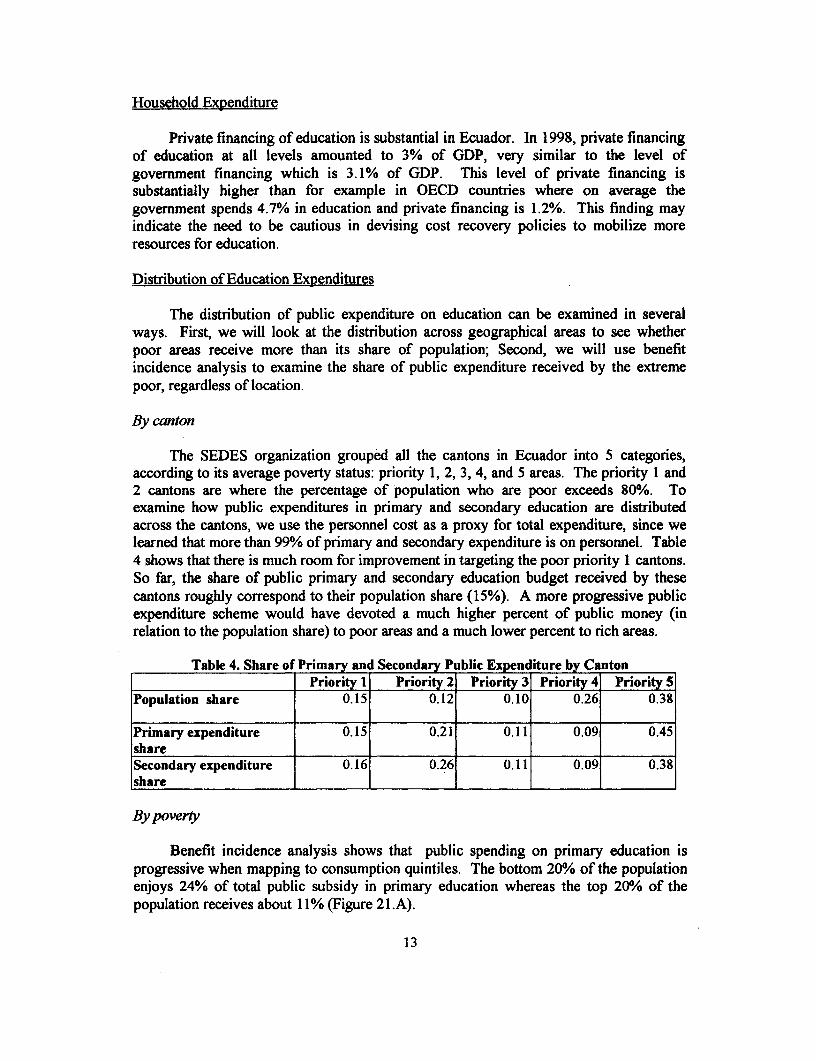
Household Expenditure
Private financing of education is substantial in Ecuador. In 1998, private financingof education at all levels amounted to 3% of GDP, very similar to the level ofgovernment financing which is 3.1% of GDP. This level of private financing issubstantially higher than for example in OECD countries where on average thegovernment spends 4.7% in education and private financing is 1.2%. This finding mayindicate the need to be cautious in devising cost recovery policies to mobilize moreresources for education.
Distribution of Education Expenditures
The distribution of public expenditure on education can be examined in severalways. First, we will look at the distribution across geographical areas to see whetherpoor areas receive more than its share of population; Second, we will use benefitincidence analysis to examine the share of public expenditure received by the extremepoor, regardless of location.
By canton
The SEDES organization grouped all the cantons in Ecuador into 5 categories,according to its average poverty status: priority 1, 2, 3, 4, and 5 areas. The priority 1 and2 cantons are where the percentage of population who are poor exceeds 80%. Toexamine how public expenditures in primary and secondary education are distributedacross the cantons, we use the personnel cost as a proxy for total expenditure, since welearned that more than 99% of primary and secondary expenditure is on personnel. Table4 shows that there is much room for improvement in targeting the poor priority 1 cantons.So far, the share of public primary and secondary education budget received by thesecantons roughly correspond to their population share (15%). A more progressive publicexpenditure scheme would have devoted a much higher percent of public money (inrelation to the population share) to poor areas and a much lower percent to rich areas.
Table 4. Share of Primary and Secondary Public Expen iture by CantonPriority 1 Priority 2 Priority 3 Priority 4 Priority 5
Population share 0.15 0.12 0.10 0.26 0.38
Primary expenditure 0.15 0.21 0.11 0.09 0.45share I__ __ _ I _ _ __
Secondary expenditure 0.16 0.26 0.11 0 0.0938sh are__ _ _ _ _ _ _ _ _ _ _ __ _ _ _ _ _ _ _ _ _ _ _ _ _ _
By poverty
Benefit incidence analysis shows that public spending on primary education isprogressive when mapping to consumption quintiles. The bottom 20% of the populationenjoys 24% of total public subsidy in primary education whereas the top 20% of thepopulation receives about 11% (Figure 21.A).
13

Figure 21: Distribution of Government and Private Spending on Primary Education(By Consumption Quintiles)
0.5
04
0.3
0.2 _-t
A B C
F13Z, d kw *l d -a4th *S I
Source: LSMS 1998.
However, public spending on all levels of education (including secondary and higheducation expenditures) is not distributed equitably. While the top 20% of the populationget 25% of public subsidy in all levels of education, the bottom 20% only gets 12%(Figure 22.A).
Figure 22. Distribution of Government and Private Spending on Education(By Consumption Quintiles)
0.50 |
0.40 -
0.30 _
0.20 1 __-
0.10 _
A B C
Dii3t 2d 03d 04h *541
Source: LSMS 1998.
Compared to Peru, Argentina, and Dominican Republic where the bottom 20% ofthe population receive respectively 21%, 26%, and 23% of public subsidies in all levelsof education, Ecuador's public financing across all levels of education is much lessprogressive (Table 5).
14
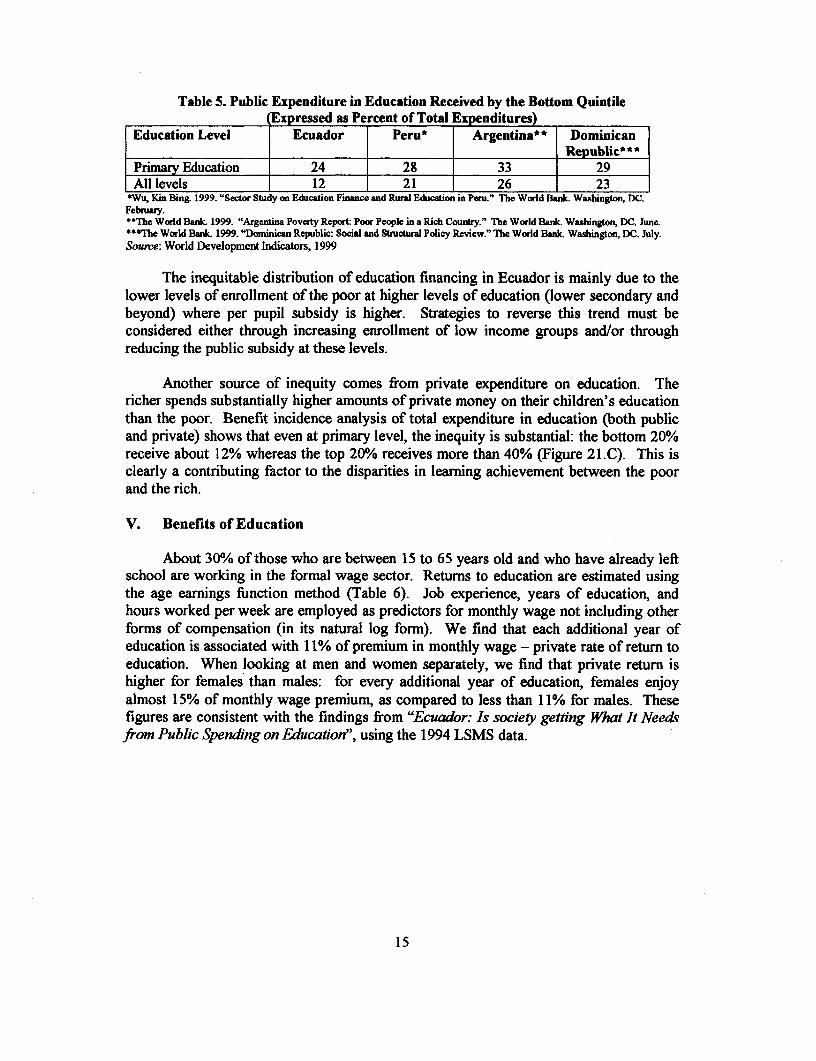
Table 5. Public Expenditure in Education Received by the Bottom QuintileI Expressed as Percent of Total E nditures)
Education Level Ecuador Peru* Argentina** Dominican_ I Republic***Primary Education 24 28 33 29All levels 12 21 26 23
*Wu, Kin Bing. 1999. "Sector Study on Education Finance and Rural Education in Peru." The World Bank. Washington, DC.Febnuary."The World Bark. 1999. "Argentina Poverty Report: Poor People in a Rich Country." The World Bank Washington DC. June.***The World Bank 1999. "Dominican Republic: Social and Struchiral Policy Review." The World Bark Washington, DC. July.Source: World Development Indicators, 1999
The inequitable distribution of education financing in Ecuador is mainly due to thelower levels of enrollment of the poor at higher levels of education (lower secondary andbeyond) where per pupil subsidy is higher. Strategies to reverse this trend must beconsidered either through increasing enrollment of low income groups and/or throughreducing the public subsidy at these levels.
Another source of inequity comes from private expenditure on education. Thericher spends substantially higher amounts of private money on their children's educationthan the poor. Benefit incidence analysis of total expenditure in education (both publicand private) shows that even at primary level, the inequity is substantial: the bottom 20%receive about 12% whereas the top 2 0%/o receives more than 40% (Figure 21.C). This isclearly a contributing factor to the disparities in learning achievement between the poorand the rich.
V. Benefits of Education
About 30% of those who are between 15 to 65 years old and who have already leftschool are working in the formal wage sector. Returns to education are estimated usingthe age earnings function method (Table 6). Job experience, years of education, andhours worked per week are employed as predictors for monthly wage not including otherforms of compensation (in its natural log form). We find that each additional year ofeducation is associated with 11% of premium in monthly wage - private rate of return toeducation. When looking at men and women separately, we find that private return ishigher for females than males: for every additional year of education, females enjoyalmost 15% of monthly wage premium, as compared to less than 11% for males. Thesefigures are consistent with the findings from "Ecuador: Is society getting What It Needsfrom Public Spending on Education", using the 1994 LSMS data.
15
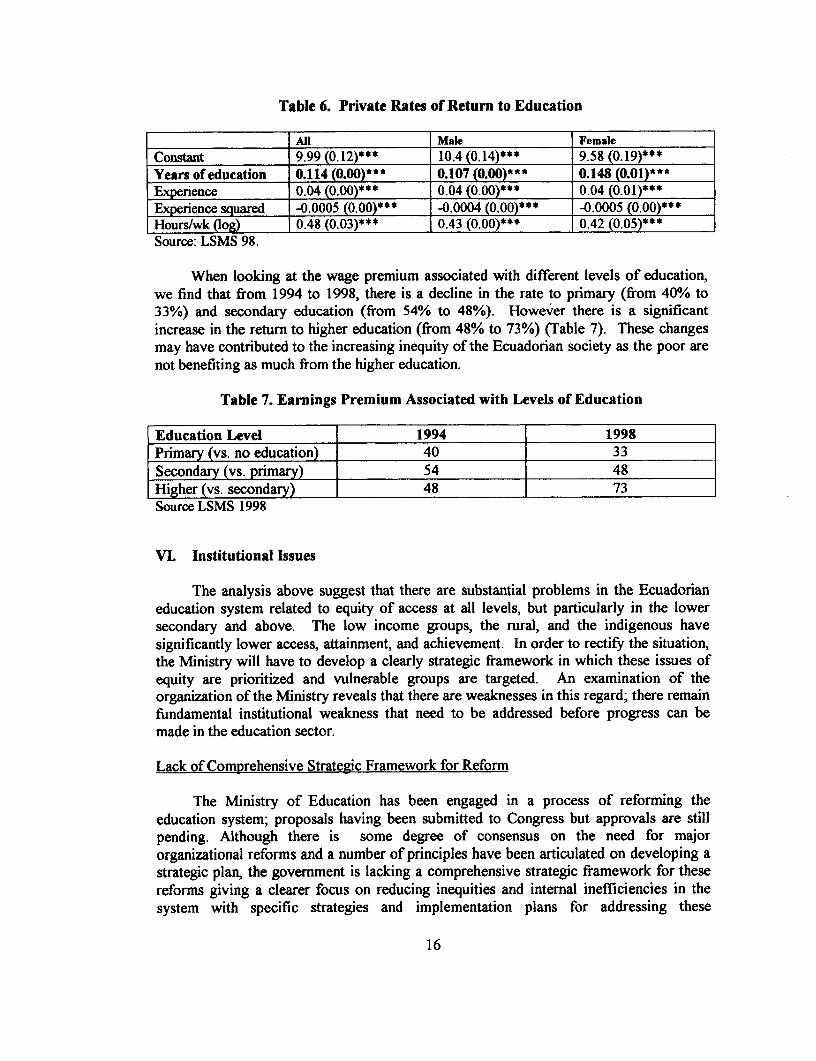
Table 6. Private Rates of Return to Education
________ ________ All Male Female
Constant 9.99 (0.12)*** 10.4 (0.14)*** 9.58 (0.19)***Years of education 0.114 (0.00)*** 0.107 (0.00)*** 0.148 (0.01)***Experience 0.04 (0.00)*** 0.04 (0.00)*** 0.04 (0.01)***Experience squared -0.0005 (0.00)*** -0.0004 (0.00)*** -0.0005 (0.00)***Hours/wk (log) 0.48 (0.03)*** 0.43 (0.00)*** 0.42 (0.05)***Source: LSMS 98.
When looking at the wage premium associated with different levels of education,we find that from 1994 to 1998, there is a decline in the rate to primary (from 40% to33%) and secondary education (from 54% to 48%). However there is a significantincrease in the return to higher education (from 48% to 73%) (Table 7). These changesmay have contributed to the increasing inequity of the Ecuadorian society as the poor arenot benefiting as much from the higher education.
Table 7. Earnings Premium Associated with Levels of Education
Education Level 1994 1998Primary (vs. no education) 40 33Secondary (vs. primary) 54 48Higher (vs. secondary) 48 73Source LSMS 1998
VI. Institutional Issues
The analysis above suggest that there are substantial problems in the Ecuadorianeducation system related to equity of access at all levels, but particularly in the lowersecondary and above. The low income groups, the rural, and the indigenous havesignificantly lower access, attainment, and achievement. In order to rectify the situation,the Ministry will have to develop a clearly strategic framework in which these issues ofequity are prioritized and vulnerable groups are targeted. An examination of theorganization of the Ministry reveals that there are weaknesses in this regard; there remainfundamental institutional weakness that need to be addressed before progress can bemade in the education sector.
Lack of Comprehensive Strategic Framework for Reform
The Ministry of Education has been engaged in a process of reforming theeducation system; proposals having been submitted to Congress but approvals are stillpending. Although there is some degree of consensus on the need for majororganizational reforms and a number of principles have been articulated on developing astrategic plan, the government is lacking a comprehensive strategic framework for thesereforms giving a clearer focus on reducing inequities and internal inefficiencies in thesystem with specific strategies and implementation plans for addressing these
16

dleficiencies. In line with the strategic framework, the capacity of MEC needs to bestrengthened for national level policy making, setting policies for the equitable andefficient resource distribution.
Lack of Accountability and Transparency
The education system is beset with problems that inhibit a rational allocation andutilization of public expenditures. The examples of budgeting and accounting, and thesupply and remuneration of teachers demonstrate the problems of the lack ofaccountability and transparency in the sector and the need for substantial reforms in thisarea.
Budgeting and Accounting
The current budgeting and accounting system, in particular, leads to a lack ofaccountability and transparency The problem is that no single entity is responsible forthe sector as a whole nor is there any entity that reviews the combined effect of thevarious subsectoral budget proposals or their intrasectoral distribution. Investmentproposals are vetted by the Planning Secretariat (SEGEPLAN) and then submitted to theMOF. Too many budgetary units exist with each secondary school have a line item in thenational budget. However, MOF is the only sector which has access to all the informationnecessary to make an analysis of intrasectoral allocations (although such an analysis isnot considered to be within the responsibilities of the MOF).
As a result, allocations tend to be the result of influence rather than sectoral policyand the complete information on budgetary allocations only emerges after the budget hasbeen sent to Congress for approval. The allocation of funds is made purely on the basisof previously budgeted levels (with allowances for salary increases, estimates of growthand inflation).
According to the system of decentralized responsibility, expenditure for primaryeducation is authorized and disbursed at the provincial level of the MEC. However, theeffect of this is that, instead of bringing the decision-making closer to the level of theschool and its needs, an additional level of bureaucracy is added to the process, resultingin cumbersome and inefficient processes. The need of the schools are not met and noschool can make decisions related to key decisions ( such as the selection of teachers)since all are taken by the Provincial Directorate.
MEC is never in possession of full information on education expenditure. Datafrom each secondary school and CEM is unprocessed at provincial or national level andforwarded to MOF. Therefore MEC is unable to compute, for example, a total publicwage bill for education.
Teacher Remuneration and Supply
The remuneration system for teachers is overly complex, non-transparent, andunrelated to teacher performance. The system consists of extra salaries, bonuses, andallowances which, in their complexity makes the system conducive to manipulation and
17
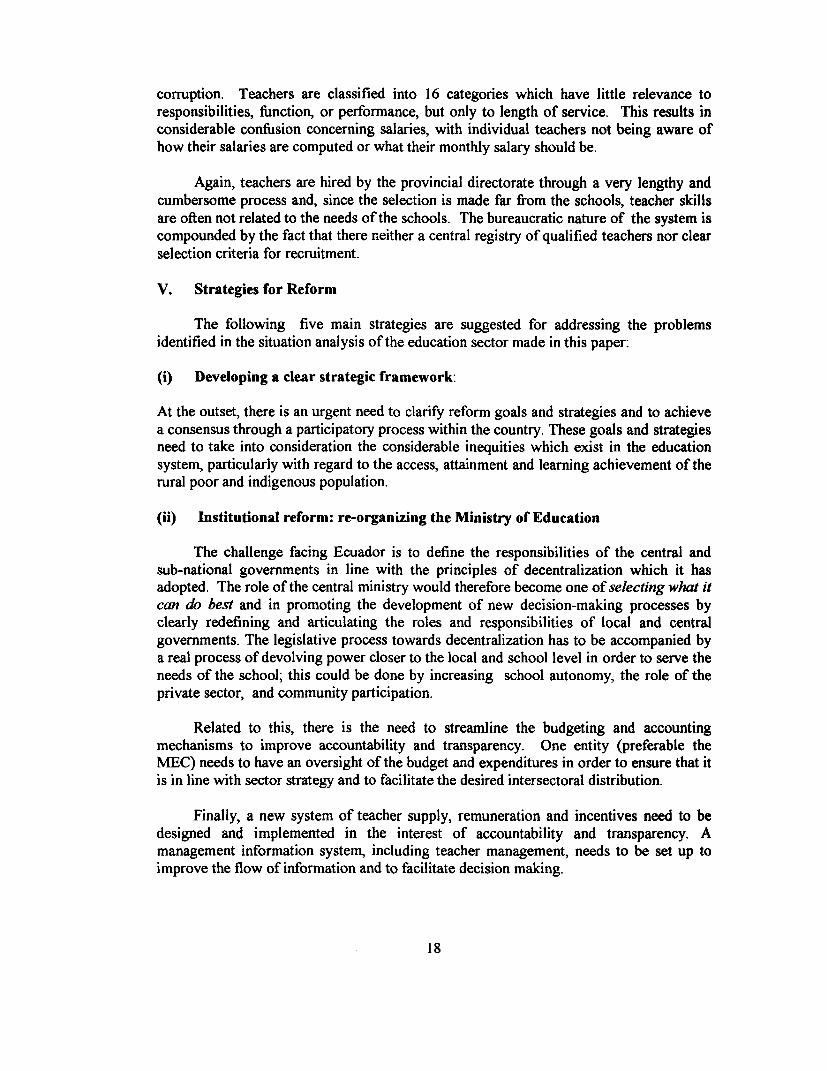
corruption. Teachers are classified into 16 categories which have little relevance toresponsibilities, function, or performance, but only to length of service. This results inconsiderable confusion concerning salaries, with individual teachers not being aware ofhow their salaries are computed or what their monthly salary should be.
Again, teachers are hired by the provincial directorate through a very lengthy andcumbersome process and, since the selection is made far from the schools, teacher skillsare often not related to the needs of the schools. The bureaucratic nature of the system iscompounded by the fact that there neither a central registry of qualified teachers nor clearselection criteria for recruitment.
V. Strategies for Reform
The following five main strategies are suggested for addressing the problemsidentified in the situation analysis of the education sector made in this paper:
(i) Developing a clear strategic framework:
At the outset, there is an urgent need to clarify reform goals and strategies and to achievea consensus through a participatory process within the country. These goals and strategiesneed to take into consideration the considerable inequities which exist in the educationsystem, particularly with regard to the access, attainment and learning achievement of therural poor and indigenous population.
(ii) Institutional reform: re-organizing the Ministry of Education
The challenge facing Ecuador is to define the responsibilities of the central andsub-national governments in line with the principles of decentralization which it hasadopted. The role of the central ministry would therefore become one of selecting what itcan do best and in promoting the development of new decision-making processes byclearly redefining and articulating the roles and responsibilities of local and centralgovernments. The legislative process towards decentralization has to be accompanied bya real process of devolving power closer to the local and school level in order to serve theneeds of the school; this could be done by increasing school autonomy, the role of theprivate sector, and community participation.
Related to this, there is the need to streamline the budgeting and accountingmechanisms to improve accountability and transparency. One entity (preferable theMEC) needs to have an oversight of the budget and expenditures in order to ensure that itis in line with sector strategy and to facilitate the desired intersectoral distribution.
Finally, a new system of teacher supply, remuneration and incentives need to bedesigned and implemented in the interest of accountability and transparency. Amanagement information system, including teacher management, needs to be set up toimprove the flow of information and to facilitate decision making.
18
(iii) Reducing the inequity in access to and quality of basic education,particularly for the rural poor.
According to the analysis made above, the following four interventions aresuggested for increasing the access and learning outcomes among the rural poor:
Early Childhood Education
Investments in early childhood care and education targeted on the rural poor andindigenous, in conjunction withparenting and caregiving Box 2. Colombia's Escuela Nueva:programs, can be a way to A Strategy for Reaching the Rural Poor
compensate for the deficits in the Based on its 1978 study detailing major weaknesses in the provision ofexperience, nutrition and health of rural basic education, the Government of Colombia gave top priority tothe children from these rural education and produced a ten-year rural education program whichhouseholds and prepare them for built heavily on the Escuela Nueva program. Escuela Nueva was created informal schooling. Approaches 1976 after a decade of experimentation and was supported at various timessuch as community-based forms by UNICEF, USAID, IDB and the World Bank.. By 1978 more than 500
such as community-based forms schools were involved and this gradually expanded under World Bankof day care, supporting and financing to 17, 948 schools by 1989, serving 800,000 students. Majoreducating parents will need to be characteristics of Escuela Nueva include: One or two teachers offering allbased on a thorough analysis of five years of primary education in one or two multi-grade classrooms;how children are supported and flexible promotion, special instructional materials for individual and groupcared for in the local cultural work and teachers' guides, curriculum relevant to rural community, schoolgovernment to ensure participation of students, parents, and community;context and an identification of study corners and class libraijes; self-monitoring mechanisms for students.the gaps which exist in such Rojas andd Castillo (1988), Psacharopoulos, Rojas, and Velez (1992), andsupport and care. McEwan (1995) have found that ES schools had significantly improved
student outcomes, reduced dropout rates among the rural poor, as well asBilingual Programs for student and community participation as measured by activities such as
adult education, agricultural extension, athletic competitions, healthIndigenous Education: campaigns and community celebrations. Social self-esteem and civic
behavior higher than in traditional schools. Moreover, EN schools haveThere is an urgent need to statistically significant effects on Spanish and mathematics achievement in
assess the impact of the System of third and Spanish in fifth grade. High benefits relative to cost (parentNacional Educacion Intercultural volunteerism reduces monetary outlays for building and construction andBilingue. Since the inception of contributes to gains in student achievement).
the bilingual education system in1988, there has been no evaluationof the achievements and problems to allow for the introduction of corrective action in thefuture. Such an evaluation needs to be independent of DINEIB and the Ministry ofEducation to guarantee objectivity and to recognize the opinion of primary stakeholderssuch as the children, teachers, directors, parents, community leaders, technical experts,and Ministry officials. Strategies of bilingual education may serve to increase learningoutcomes among the indigenous groups (see Box 1).
19

Demand-side financing
Box 3. El Salvador: EDUCO
A new vision of shared responsibility for meeting educational needs has had a profound impact on education inEl Salvador in the 1990s, resulting in significantly expanded coverage at the preschool and basic levels.Facing the daunting task of educational sector reforn, the Salvadoran Ministry of Education sought aninnovative and effective approach to expanding coverage in rural and marginalized areas. EDUCO("Education with the Participation of the Community") provided a model for that approach, creating aframework and processes for responsibility to be shared among government authorities, community NGOs,and parent associations. Originally initiated in 1991, EDUCO works to provide preschool and basic educationto rural and needy communities through a decentralized system of service provision, encouraging communityparticipation in the educational process. Program activities include teacher training, organization of parentsand teachers into community education associations (responsible for the management of educational resourcesat the local level), and development of didactic materials for parents and teacher guides. The program'sadministrative component has focused on design and actualization of legal and financial mechanisms whichenable educational sector decentralization.
The outcomes of EDUCO programs demonstrate both quantitative advances in coverage and qualitativeimprovements compared with traditional education. Since 1992, EDUCO has provided basic education for168,672 children, employed 3,871 teachers, and formed 1,700 community associations. The educationprovided in EDUCO communities is characterized by lower rates of teacher absenteeism, increased amount ofinstructional time, a higher average mathematics achievement test scores in first and second grades, andgreater parent involvement in the education of their children than in the traditional school system.Coordination of efforts at national, regionaL and local levels through EDUCO programs has significantlyimproved the education system in El Salvador, and today EDUCO continues to expand, spreading the benefitsof community involvement in the education to children who might never have had educational opportunitythrough the traditional system.
A high priority need to be assigned to developing demand-side financingmechanisms to attract and retain children in school. Interventions to reduce the directand indirect costs of education for the rural poor will need to be carefully targeted.Possible interventions could be in subsidizing families for lost earnings (opportunitycosts) through the provision of scholarships, and experimenting with flexible schoolcalendar school hours because of seasonal work obligations. Financial incentives couldbe given to parents to send children and keep them in school through the provision ofallowances accumulated as the child transfers from one grade or level to another. Suchinterventions would be targeted particularly at the very poor and/or indigenouspopulations who would be most vulnerable in the time of macroeconomic crisis and, asthe data above indicates, whose participation and achievement in school is most affected.Sources: Guido Bejar (1997) and Meza (1997).
20

Enhancing community involvement
Building on the experiences with the school network programs (CEMs), strategies needto be developed to developing a vision of shared responsibility for meeting the needs ofthe rural poor. The example of Educo (see Box 3) may serve to illustrate a particularstrategy targeted at the rural poor and marginalized areas in which parents, community,NGOs, and government work collaboratively to increase participation and quality in pre-school and basic education.
(iv) Increasing access/participation at lower secondary level especially in poorrural areas
Building on the experiences of decentralized programs in the rural and peri-urban areas,the government should explore strategies for making access to education more equitablefor the rural poor especially to increase access and achievement in lower secondaryschools. Again, effective strategies could be in the area of demand side financing such asgrants and allowances directed at the most poor. In a period of macro-economic crisis, theopportunity costs of having children in school are most felt in households with childrenof lower-secondary age and higher. The level of lower-secondary is where the gap inenrollment between the poor and non-poor is particularly noticeable and the disparitywidens from the age of 11 (see Figure 5 above) and this would seem to be the criticalstage for demand-side interventions of this kind.
A further strategy which could be explored is that of combining distance educationmodalities with conventional on-site education at the levels of lower-secondary andsecondary such as been successfully demonstrated with Telesecundaria in Mexico (seeBox 4). The use of distance education can be used to overcome the problems of access inremote areas as well as problems related to the supply and quality of teachers in suchareas.
21

(v) Reforming higher education:
Box 4. Mexico: TELESECUNDARIA:Increasing Access to Secondary Education for the Rural Poor
Telesecundaria provides a combination of distance and on-site secondary education for grades seven tonine in rural areas of Mexico where schools or teachers are in short supply and education is of poor quality.Educational television programming is broadcast through EDUSAT, Mexico's educational broadcastsystem, and transnitted through Solidaridad 1, a government satellite, to 13,785 schools in two sessionsdaily. A school can be equipped and wired to receive Telesecundaria broadcasts for a total cost ofUS$2,000. Technical adaptations are made where necessary. For example, 10 percent of Telesecundariaschools use solar power.
Telesecundaria schools are initiated at the request of local communities that demonstrate that 15 or moreprimary school graduates will participate and can identify a location for school facilities. The MexicanMinistry of Education then provides a teacher, a television set, a satellite dish, instructional program, andtextbooks. Today, 16 percent of secondary students in the country attend Telesecundaria programs insteadof traditional or technical schools.
Telesecundaria programs emphasize active learning and collaboration, parental participation, practicalapplication of lessons, and student presentations to their community. The cuniculum is designed to beadaptable to student needs, local context, and available resources. The teacher's guide provides descriptionsof possible limitations teachers may face given the availability of learning materials and tools, andsuggests alternatives and ways to overcome those limitations.
With support from the Wodd Bank, the Mexican Government has initiated both a high school (grades 10-12) and junior high school program for adults. In future, Telesecundaria schools may access the Internetvia Red Escolar, which began in 1997 as a computer technology project aimed at seventh to ninth graders.Telesecundaria has inspired similar educational technology projects in Costa Rica (1997), Panama (1995),and El Salvador (1998). A Telesecundaria program aimed at Latino communities in the United States isplanned for the summer of 1998.
Jose Calderon
Strategies are urgently needed to increase the internal efficiency, quality, relevanceand equity of the diverse HE programs in the country. In particular, a system need to bedeveloped for a system of performance-linked subsidies to higher education institutionsbased on quality, program relevance to the labor market and the efficiency of financialsupport mechanisms for encouraging the participation of students with limited economicmeans. In addition to this, the development of a system of information would enable thedissemination of data on standards and increase the accountability and transparency atthis level. Given the high degree of inequity which exists among the income groups foraccess to higher education (see Table 1), the increasing private rates of return for thislevel of education, and the vastly higher unit costs, cost recovery mechanisms should beexplored to release more funds from tertiary education to basic education in order toincreasing access, equity and quality.
22

Annex 5: Health in Ecuador
Patricio Marquezand
Edmundo Murrugarra
Health Status of the Ecuadorian Population. Health indicators of the Ecuadorianpopulation rank among the lowest in the Americas. Table 1 shows that infant mortalitywas 39.4 per one thousand births in Ecuador, higher than that of Chile (13), Costa Rica(11.8), Cuba (7.9), Colombia (24) or Venezuela (22).' The mortality rate of childrenunder 5 years old is 48.3 per thousand, larger than that observed in Chile (14.8), CostaRica (27.3), Cuba (10.7), Brazil (44.2), or Paraguay (47). The maternal mortality rate inEcuador is also high (159 per 100,000) compared to Chile (25), Costa Rica (29), Cuba(33), Venezuela (56), Brazil (119), and Colombia (87). Only Bolivia and Peru evidencesomewhat worse conditions in mortality rates and incidence of diseases, while Paraguayevidences weaker health infrastructure and services than Ecuador. The health profile ischaracterized by the coexistence of infectious and communicable diseases and non-cofmmunicable conditions and injuries. The poor suffer higher incidence rates in manytypes of diseases as a result of higher exposure to risk factors and limited access toeffective medical care.
Wide Gap in Access to Health Services. Access to health care is limited for about3 million Ecuadorians, or about 30% of the population. The Ministry of Health (MOH)provides regular access to about 45% of the population, and other public and charitableorganizations provide health care to another 5%. Formal health insurance coverage(public or private) is very low, particularly in comparison with other Latin Americancountries: the medical program of the Ecuadorian Social Security Institute (IESS) coversonly 10% of the population, the Peasant Health Insurance Program (Seguro SocialCampesino) reaches an additional 8%, and private health insurance companies and thearmed forces each cover 2.8% and 0.7%, respectively (see Table 2). Family members arenot generally covered through IESS, which is one of the reasons why health insurancecoverage is quite low in Ecuador. Another reason is the low rate of IESS coverage, 28%,among the economically active population. The Seguro Social Campesino covers about16% of the poorest quintile of the population. The IESS covers basically the top twoquintiles of the population, and a small fraction in other quintiles. Overall, 79°/0 of thepopulation is not covered by any health insurance in Ecuador.
l Health in the Americas (1998).

Table 1. Health Indkators for selected Latin Amercan Countries
Chile Cuba Costa Ecuador Bolivia Peru Colombia Venezuela Argentina Brazil ParaguayRica
Mortality rates
Infant (per 1,000 live births, l.b.) 13.0 7.9 11.8 39.4 59.0 43.0 24.0 22.0 20.9 39.8 36.0
Children 1-4 (per 1,000) 14.8 10.7 27.3 48.3 81.0 68.0 29.6 25.0 24.3 44.2 47.0
Maternal (per 100,000 l..b.) 25 33 29 159 390 265 87 56 44 114 123
Infrastructure (% pop)
Access to drinking water 85 92 100 70 61 70 80 79 65 69 39
Access to excretal disposal 98 90 100 57 46 74 66 72 75 67 32
Hospital beds (p/1,000 pop) 3.1 6.0 ... 1.6 1.4 1.8 0.8 2.3 4.6 3.5 1.5
Physicians per 10,000 pop 11.0 53.0 14.1 13.2 5.8 10.3 9.3 24.2 26.8 12.7 4.9
DiseasesTuberculosis incidence 10.3 7.6 16.0 60.4 91.5 112.8 24.5 - 16.4 27.6 18.0(per 100,000 pop)
Malaria pop. in risk areas, % - - 36.0 24.7 40.7 45.6 39.5 4.2 0.7 4.6 29.6
Source: Health in the Americas (1998). Notes: Mortality rates are from 1997, and maternal mortality from 1992-1997. Infiastructure indicators are from 1995 for all
countries. Tuberculosis information (BK+) is for 1996, and Malaria for 1997.
2
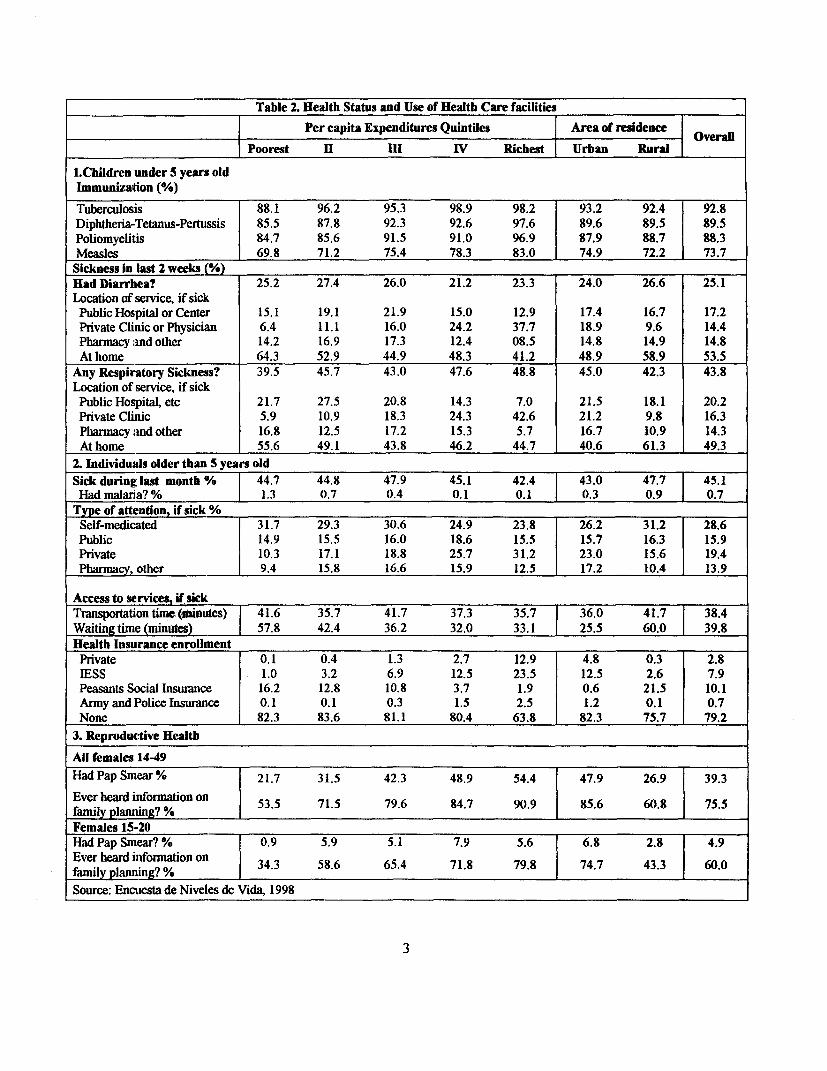
Table 2. Health Status and Use of Health Care facilities
Per capita Expenditures Quintiles Area of residence OveralPoorest n m IV Richest Urban Rural
1.Children under 5 years oldImmunization (%/*)
Tuberculosis 88.1 96.2 95.3 98.9 98.2 93.2 92.4 92.8Diphtheria-.Tetanus-Pertussis 85.5 87.8 92.3 92.6 97.6 89.6 89.5 89.5Poliomyelitis 84.7 85.6 91.5 91.0 96.9 87.9 88.7 88.3Measles 69.8 71.2 75.4 78.3 83.0 74.9 72.2 73.7Sickness in last 2 weeks (%)Had Diarrhea? 25.2 27.4 26.0 21.2 23.3 24.0 26.6 25.1Location of service, if sickPublic Hospital or Center 15.1 19.1 21.9 15.0 12.9 17.4 16.7 17.2Private Clinic orPhysician 6.4 11.1 16.0 24.2 37.7 18.9 9.6 14.4Pharmacy and other 14.2 16.9 17.3 12.4 08.5 14.8 14.9 14.8At home 64.3 52.9 44.9 48.3 41.2 48.9 58.9 53.5
Any Respiratory Sickness? 39.5 45.7 43.0 47.6 48.8 45.0 42.3 43.8Location of service, if sickPublic Hospitat etc 21.7 27.5 20.8 14.3 7.0 21.5 18.1 20.2Private Clinic 5.9 10.9 18.3 24.3 42.6 21.2 9.8 16.3Pharmacyand other 16.8 12.5 17.2 15.3 5.7 16.7 10.9 14.3At home 55.6 49.1 43.8 46.2 44.7 40.6 61.3 49.3
2. Individuals older than 5 years oldSick during last month % 44.7 44.8 47.9 45.1 42.4 43.0 47.7 | 45.1Had malaria?% J 1.3 0.7 0.4 0.1 0.1 j 0.3 0.9 f 0.7
Type of attention, if sick %_ _
Self-medicated 31.7 29.3 30.6 24.9 23.8 26.2 31.2 28.6Public 14.9 15.5 16.0 18.6 15.5 15.7 16.3 15.9Private 10.3 17.1 18.8 25.7 31.2 23.0 15.6 19.4Pharmacy, other 9.4 15.8 16.6 15.9 12.5 17.2 10.4 13.9
Access to services, if sickTransportation tiiiie(iniutes) | 41.6 35.7 41.7 37.3 35.7 1 36.0 41.7 38.4Waitingtime (minutes) _ 57.8 42.4 36.2 32.0 33.1 | 25.5 60.0 J 39.8Health Insurance enrollment_Private 0.1 0.4 1.3 2.7 12.9 4.8 0.3 2.8IESS 1.0 3.2 6.9 12.5 23.5 12.5 2.6 7.9Peasants Social Insurance 16.2 12.8 10.8 3.7 1.9 0.6 21.5 10.1ArmyandPoliceInsurance 0.1 0.1 0.3 1.5 2.5 1.2 0.1 0.7None 82.3 83.6 81.1 80.4 63.8 82.3 75.7 79.2
3. Reproductive Health
All females 14-49HadPapSmear% 21.7 31.5 42.3 48.9 54.4 47.9 26.9 39.3Ever heard information on 53.5 71.5 79.6 84.7 90.9 85.6 60.8 75.5family planning? %Females 15-20Had Pap Smear? % 0.9 5.9 5.1 7.9 5.6 6.8 2.8 4.9Ever heard information on I 34.3 58.6 65.4 71.8 79.8 74.7 43.3 60.0family planning? % I *_*_*_*Source: Enctesta de Niveles de Vida, 1998
3

Health Care Spending. In comparison with other Latin American countries, theproportion of GDP devoted to health care is among the lowest. Total health expendituresin the mid-1990s are estimated at about US$78 per capita, or 5.2 percent of GDP. Recentestimates indicate that direct household expenditures amount to 37% of overall healthspending--more than 70% for purchasing pharmaceuticals--while MOH spendingaccounts for 28% and EESS for 24%. The share of health care spending corresponding tothe MOH has significantly decreased since the mid-1980s: as a proportion of GDP, from1% to about 0.8%, and as a proportion of total government spending (excluding debt
Figure 1. Public Expenditure in HealthEcuador 1989-1999
6.5%
8.0%
5 .5%-
.0% -7..
4.5% -
i1Y89 1991 1993 1995 1997 1999
Soue: Cuentas NadonAles, Ecuador.
service), from 8.2% to 5.5% (see Figure 1). As a result, MOH real per capita spendinghas declined by approximately 40%.
While the general medical care program under IESS spends about US$87 peraffiliate, MOH must stretch its resources much further, allowing average per capitaspending of about US$20. The Ecuadofian poor suffer a disproportionally high incidenceof disease, causing a correspondingly disproportional spending of their income on healthcare; the urban poor spend an average of 12% of their total household expenditures inhealth care and the rural poor 170%, as opposed to less than 10% for the non-poor in both
areas.
MOH expenditures can be grouped in three categories: Operational; Equipment,Machinery and Infrastructure; and Transfers and Loans. Operational expenses represent85%-90%/ of health spending, while Equipment, Machinery and Infrastructure account for6.5%, and Transfers and Loans for about 5%.
Desegregated data shows that expenditures in medicines and other medical supplieshave decreased from 7. 1% of total MOH expenditures in 1993 to 0. 2% in 1996. Since
4
1993, personnel (not administrative) expenditures have remained around 64%. Thissuggests that expenditures in medicines and other medical supplies have been reduced inorder to keep up personnel expenditures, hence reducing the quality of care provided inpublic facilities and transferring their costs to the patients in form of user charges.
Access to Health Services Among the Poor. Access to private and public healthservices is limited for the poor. Table 2 describes the type of health care that sickindividuals are receiving by expenditure level and location of residence. While travelingtimes are not substantially longer for the poor and rural population, waiting times aremuch longer, raising important concerns about the quality of care provided. On average,rural individuals take 6 additional minutes to get to a health center, but then must wait anaverage of one hour compared to a 25 minutes wait for their urban counterparts.
Self-care and self-medication are widely common in Ecuador, especially for thepoor. Self-medication and health counseling at the pharmacy represent the most chosenhealth alternatives for the extreme poor in Ecuador (41% overall), and these practices arevery common in the treatment of children who suffer from diarrhea or respiratorysickness, representing 80% and 72% of the health care contacts, respectively, for theseillnesses. (see Table 2).
Important differences are observed in reproductive health practices and familyplanning information across socioeconomic levels. In the poorest population quintile,only one out of five women in reproductive age have ever had a Pap smear, while half ofthose in the richest two population quintiles have been given the test. The statistics on"'family planning information ever heard" indicates that only one-half of poorest femaleshave such exposure. These figures are even more dramatic among women between 14and 20 years old, which represents a latent problem to be addressed. These differencespartially reflect the reproductive health care practices in rural areas, and the differentaccess to information as a function of socioeconomic status.
Substantial differences in the ability to detect sickness are suggested from theuniform self-reported morbidity indicators across socioeconomic groups. As the poor andextreme poor are generally less educated they may tend to report lower morbidity rates,or to delay treatment due to financial constraints. In this sense, health status of the poor isnot only lower but also underestimated, and addressing this problem may help inreducing the costs of future necessary medical care.
Equity of Health Expenditures
Two types of evidence are provided to evaluate the equity of health expenditures.First, the incidence of public health benefits across population quintiles is examined.Then, a canton-level data set on public health expenditures is analyzed to examinewhether the government spends more in poorer cantones or in those with a larger fractionof indigenous rural population.
Health Expenditures Across Population Quintiles Evidence a RegressivePattern Using measures of spending patterns across population quintiles and the 1998
5
LSMS, the aggregate distribution of health spending across population quintiles is shownin Table 3. Each row indicates how each type of spending (private or public) is allocatedacross different quintiles. The private share is larger than the public share among thepoorest and richest population quintiles, suggesting that both groups rely on their ownresources to deal with health problems. The problems for the poorest quintile might beaccess (time, transportation, travel,) and cost (foregone wages and fees), while for therichest quintile the challenge might be making decisions on the basis of perceived qualityof health care.
Both public and private spending are highly unequal. Approximately 51% ofprivate spending and 38% of public health spending is done by the fifth quintile alone,and while public spending is perhaps somewhat less unequal, the resulting aggregatehealth spending is very unequal. The poorest 40% of the Ecuadorian population get lessthan 20% of national health spending, while the wealthiest 20% of the population getsabout 45% of these resources.
Table 3. Share of National Health Spending Across PCE QuintilesEcuador 1998
Poorest Q2 Q3 Q4 Richest
A. Public Spending 7.6% 11.6% 17.6% 25.1% 38.1%
B. Private Spending 9.0% 10.0% 11.0% 19.0% 51.0%
C. Aggregate spending 8.4% 10.7% 13.8% 21.6% 45.6%
Source: Gragnolati (1999) and ECV, 1998.
Limited Targeting of Public Health Expenditures to Poor Cantones Theallocation of public resources to finance MOH's operational expenditures does not haveany significant relation with the incidence of poverty across cantones. However, there issome evidence that those cantones with higher poverty incidence have also higher percapita health investment expenditures, but these items constitute only 11.5% on publicspending in health in 1998 (see Figure 2).
Recent Reform Measures.
Measures to Increase Effectiveness of Public Spending and Target the Poor.Many of the poor cannot wait for the long-term overhaul of the health system. Whilemost are able to bear the costs of basic health care for a period of time by using informalcredit arrangements or sacrificing other goods--often food--the current situation isunsustainable. If the deep cuts in the MOH budget are not redressed, access to basichealth services by the poor would be further curtailed. In the short term, in conjunctionwith a greater and sustained commitment of resources for the MOH, the effectiveness ofexisting levels of funding can be improved.
6
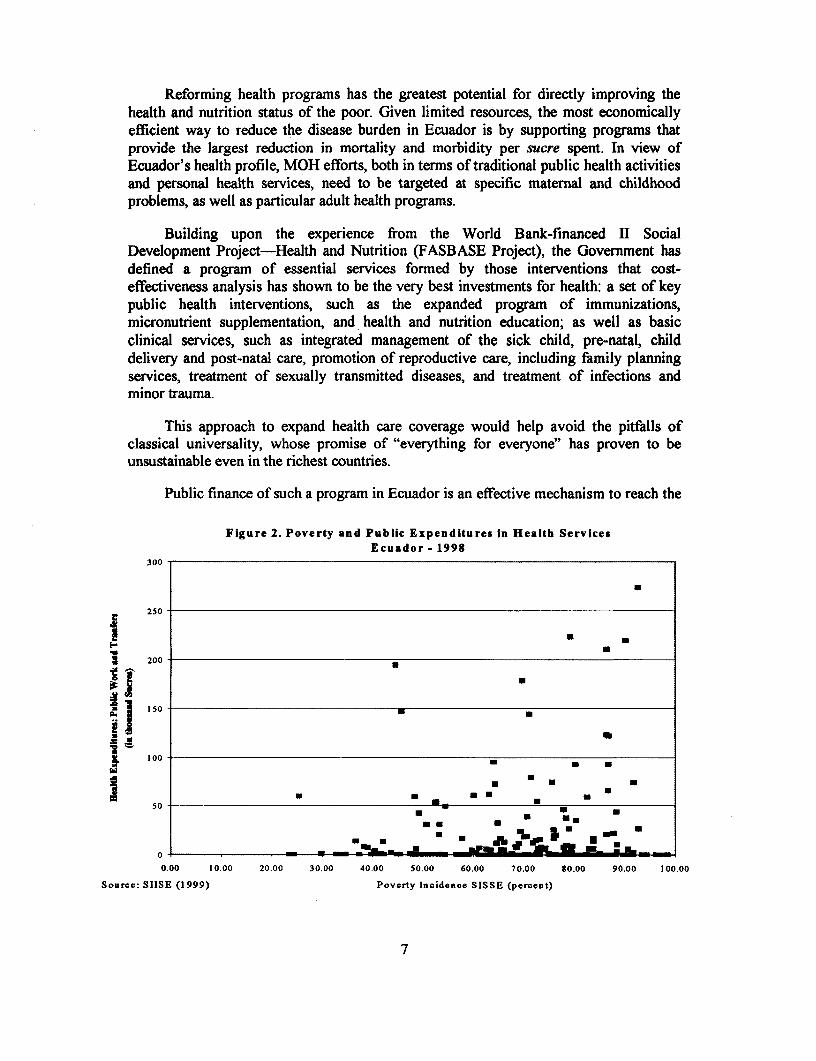
Reforming health programs has the greatest potential for directly improving thehealth and nutrition status of the poor. Given limited resources, the most economicallyefficient way to reduce the disease burden in Ecuador is by supporting programs thatprovide the largest reduction in mortality and morbidity per sucre spent. In view ofEcuador's health profile, MOH efforts, both in terms of traditional public health activitiesand personal health services, need to be targeted at specific maternal and childhoodproblems, as well as particular adult health programs.
Building upon the experience from the World Bank-financed II SocialI)evelopment Project-Health and Nutrition (FASBASE Project), the Government hasdefined a program of essential services formed by those interventions that cost-effectiveness analysis has shown to be the very best investments for health: a set of keypublic health interventions, such as the expanded program of immunizations,micronutrient supplementation, and health and nutrition education; as well as basicclinical services, such as integrated management of the sick child, pre-natal, childdelivery and post-natal care, promotion of reproductive care, including family planningservices, treatment of sexually transmitted diseases, and treatment of infections andrninor trauma.
This approach to expand health care coverage would help avoid the pitfalls ofclassical universality, whose promise of "everything for everyone" has proven to beunsustainable even in the richest countries.
Public finance of such a program in Ecuador is an effective mechanism to reach the
Figure 2. Poverty and Public Expenditures in Health ServicesEcuador - 1998
300
U
250
3 200 a
150 .
=A100 U , U
50
0 IL, -
0.00 10.00 20.00 30.00 40.00 50.00 60.00 70.00 80.00 90.00 100.00
Source: SIISE (1999) Poverty Incidenoe SISSE (percent)
7
poor since they are disproportionately affected by the disease burden of the conditionslisted above and, because of large family sizes (on average, 3.6 children per woman),they would benefit disproportionately from prenatal and post-natal care, child delivery,and childhood services. In addition, by giving MOH and other public programsexpenditure priority for a program of essential services targeted at risk groups, e.g.,pregnant women and their unborn, nursing mothers, infants and young children, thefoundations for all subsequent human capital formation in Ecuador can be built. Tomaximize the impact of this approach, efforts need to be concentrated on the poor regionsof the country.
Organizational Measures. A major change in the government view of the healthsector was stated in the new 1998 Constitution. It notes that the State guarantees thepromotion and protection of health through food safety, water supply and basicsanitation, and the permanent and uninterrupted access to health services, in accordancewith principles of equity, universality, solidarity, quality and efficiency. In addition,public health services will be provided only to those unable to pay for such services andno one would be denied emergency services. It is also stated that the National HealthSystem will be formed by public, autonomous, private and community-based entities andsuch system will operate in a deconcentrated, decentralized and participatory manner.
The centralized functions of MOH cover the regulation, control and delivery ofservices to the population in the prevention and cure of diseases. Consistent with theinstitutional framework set forth in the Health Code, the Municipalities Law givespowers to the Municipalities, within their jurisdictions, for regulating and deliveringwater for human consumption, and for sanitation, and, in coordination with the MOH, forregulating hygiene and other related health matters including the hygienic and healthyoperation of businesses dealing with food, and public buildings in general.
During the 1990s two complementary laws were enacted which provide anenabling framework for decentralization and implementation of the organizationalreforms in the health system: the 1993 Law of the Modernization of the State,Privatization, and Delivery of Public Services by the Private Sector and its Regulations;and the 1997 Decentralization and Social Participation Law. Under these legalinstruments, the Central Government transferred its powers and functions under thefollowing regimes:
* Decentralization, which consists of the delegation of political, economic,administrative and financial management powers and duties from the CentralGovernment to sub-national governments (provincial or municipal). Decentralizationis defined as "a transfer of functions to a functionally or geographically decentralizedentity, and such decentralization includes also the power to create new entities todischarge functions which were originally centrally assigned." Executive decrees arerequired for such decentralization.
* Deconcentration, which consists of the delegation of administrative and financialfunctions from the Central Government to its own dependencies. In this framework, theMinistries are required to delegate, within economic or geographic regions, and through
8

ministerial resolutions, its powers and responsibilities with the only specific requirementthat: (a) the geographic scope (boundaries) where the delegate will act be specificallymentioned in the legal framework; and (b) the prior approval by the Ministry of Financeand Public Credit of the budgetary transfers related thereto be granted.
In this sense, the Constitution posed a serious challenge for policy makers toactually reach these goals. The main components of the organizational reform supportedunder the World Bank-financed Modersa Project, can be described as political andadministrative decentralization, economic decentralization, and hospital autonomy.
Political and Administrative Decentralization. A major step in thedecentralization process has been the integration of public and private providers into theMIunicipal Integrated Health Care Networks (MHCN), which involve substantialcommunity participation. These networks have been managed by a Junta de Salud(-Iealth Board) that coordinates services and information among health providers in orderto guarantee essential interventions. The responsibilities of the Health Boards are: (i)development of a local health plan (including organization and financial arrangements);(ii) categorization and registration of health care users; (iii) development of new healthcare financing mechanisms (such as a local health fund); and, (iv) supporting themodernization of management structures and practices (information, quality assurancemiechanisms, human resources).
The following instruments have been essential for the public and privateintegration. First, the Health Boards have determined the scope of the basic healthpackage and specified its components according to the epidemiological characteristics ofthe region. The price of such package is then estimated following Cost Manualsgenerated in the Modersa project. The Health Board decides the volume of the requiredservice, i.e. number of people covered by such package, and incorporates privateproviders for the delivery of basic package interventions. This stage uses standardcontracts and procedures, which are also provided by the project, which clearly specifytype of payment, incentive schemes, and quality control mechanisms.
An example of the decentralization can be observed with the creation of theCentralized Health System in the Canton Tena, where substantial communityparticipation was observed (See Box 1).
9

Box 1. Centralized Health System in the Canton Tena
On November 7th, 1997 the Junta de Salud was established, having the Major as thePresident and the Director of the Health Area of Napo as the alternate President. Thestructure of the Junta includes a Health Assembly with political control, the Board withmanagement power, and the Technical Team with responsibilities on the execution. Thedecentralization required legal instruments as the Ministry-level agreement with theMunicipality of Tena, and an Ordenanza to delegate power to the Junta de Salud.
A first Plan was constructed based on the citizen's participation through CantonLevel Assemblies, Rural Workshops, Technical Workshops, Topic-specific agreementboards, consulting and opinion polls.
This Junta has four components: Healthy Lifestyles and Environments (involvingpromotion, prevention and community participation), Services Network (organization andenrollment of users, entitlement of services, hospital modernization, and consolidation ofthe fluvial-system), Support System (management, information and human resources)and the creation of the Fondo Local de Salud.
The functioning of the Fondo de Salud included the registration and categorizationof the population, the definition of the basic package and its cost, establishing a subsidyand co-payment system, the operational management of the Fondo, and contractingregistered providers.
An interesting innovation was observed in the subsidy and co-payment system,since there are six potential discount cases based on the socioeconomic evaluation: 0, 25,50, 80, 90 and 100%. For the Ecuadorian system as a whole only four cases are possible:0, 25 50 or 100% discount on the tariff. This is evidence that with enough entitledflexibility, local Juntas might be able to establish more precise categorization procedureswith appropriate discount schemes. These guarantee both cost-recovery and efficiencygains (in the sense of being able to discriminate on prices).
The management of the Fondo involves a Manager, a Medical Supervisor, afinancial-administrative head and a secretary. The seed-fund is composed of Modersa60%, local government 10%, co-payment 20% and central government and otherinstitutions 10% reaching about US$ 2.2 Million.
Source: Ministry of Public Health (1998)
Economic Decentralization and Hospital Autonomy. Recent decentralizationand state modernization laws have opened opportunities for reforming public hospitals.Although a large number of public hospitals require substantial improvements, the MOH,with support from the MODERSA Project, has also set up hospital autonomydemonstration models in various cities: in Quito, Enrique Garces Hospital and P.A.Suarez; in Cuenca, Vicente Corral Moscoso Hospital; in Guayaquil, El Nifno andGuayaquil Hospitals; and in Tena, Jose Maria Velasco Ibarra Hospital, followingspecified criteria, for eventual replication throughout the country. In the initial phase, the
10
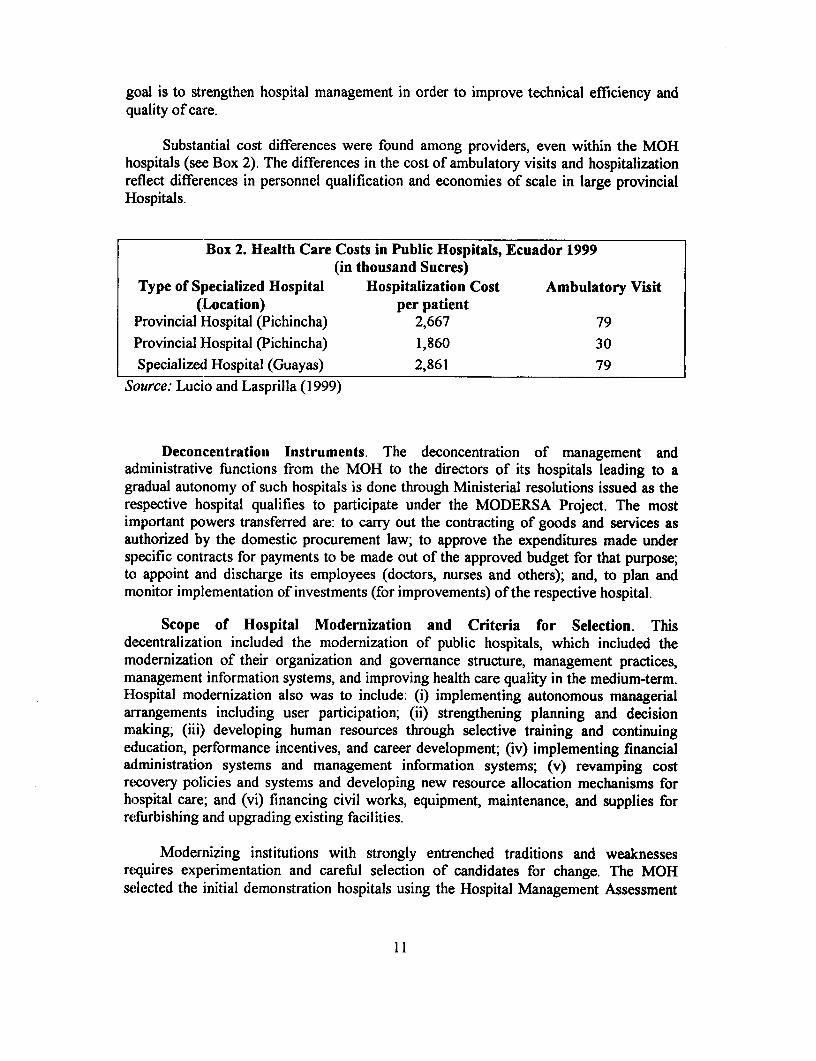
goal is to strengthen hospital management in order to improve technical efficiency andquality of care.
Substantial cost differences were found among providers, even within the MOHhospitals (see Box 2). The differences in the cost of ambulatory visits and hospitalizationreflect differences in personnel qualification and economies of scale in large provincialHospitals.
Box 2. Health Care Costs in Public Hospitals, Ecuador 1999(in thousand Sucres)
Type of Specialized Hospital Hospitalization Cost Ambulatory Visit(Location) per patient
Provincial Hospital (Pichincha) 2,667 79Provincial Hospital (Pichincha) 1,860 30Specialized Hospital (Guayas) 2,861 79
Source: Lucio and Lasprilla (1999)
Deconcentration Instruments. The deconcentration of management andaidministrative functions from the MOH to the directors of its hospitals leading to agradual autonomy of such hospitals is done through Ministerial resolutions issued as therespective hospital qualifies to participate under the MODERSA Project. The mostimnportant powers transferred are: to carry out the contracting of goods and services asauLthorized by the domestic procurement law; to approve the expenditures made underspecific contracts for payments to be made out of the approved budget for that purpose;to appoint and discharge its employees (doctors, nurses and others); and, to plan andmonitor implementation of investments (for improvements) of the respective hospital.
Scope of Hospital Modernization and Criteria for Selection. Thisdecentralization included the modemization of public hospitals, which included themodernization of their organization and govemance structure, management practices,management information systems, and improving health care quality in the medium-term.H[ospital modernization also was to include: (i) implementing autonomous managerialarrangements including user participation; (ii) strengthening planning and decisionmaking; (iii) developing human resources through selective training and continuingeducation, performance incentives, and career development; (iv) implementing financialadministration systems and management information systems; (v) revamping costrecovery policies and systems and developing new resource allocation mechanisms forhospital care; and (vi) financing civil works, equipment, maintenance, and supplies forrefurbishing and upgrading existing facilities.
Modernizing institutions with strongly entrenched traditions and weaknessesrequires experimentation and careful selection of candidates for change. The MOHselected the initial demonstration hospitals using the Hospital Management Assessment
11
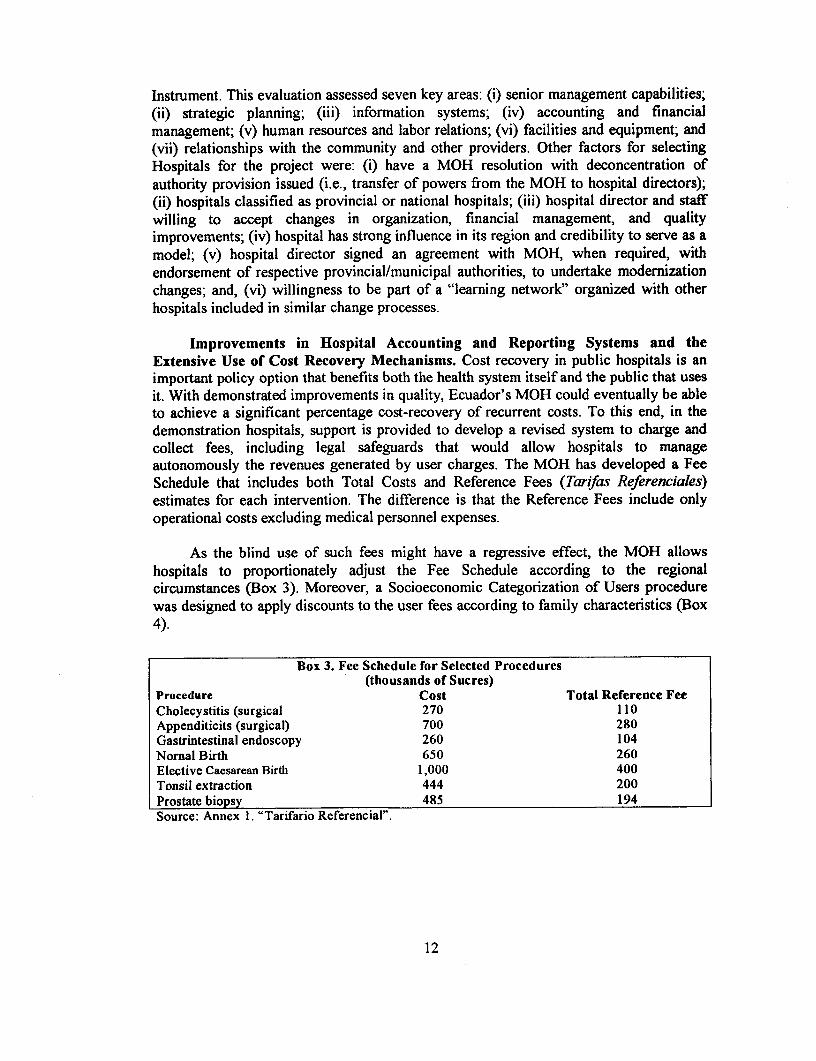
Instrument. This evaluation assessed seven key areas: (i) senior management capabilities;(ii) strategic planning; (iii) information systems; (iv) accounting and financialmanagement; (v) human resources and labor relations; (vi) facilities and equipment; and(vii) relationships with the community and other providers. Other factors for selectingHospitals for the project were: (i) have a MOH resolution with deconcentration ofauthority provision issued (i.e., transfer of powers from the MOH to hospital directors);(ii) hospitals classified as provincial or national hospitals; (iii) hospital director and staffwilling to accept changes in organization, financial management, and qualityimprovements; (iv) hospital has strong influence in its region and credibility to serve as amodel; (v) hospital director signed an agreement with MOH, when required, withendorsement of respective provincial/municipal authorities, to undertake modernizationchanges; and, (vi) willingness to be part of a "learning network" organized with otherhospitals included in similar change processes.
Improvements in Hospital Accounting and Reporting Systems and theExtensive Use of Cost Recovery Mechanisms. Cost recovery in public hospitals is animportant policy option that benefits both the health system itself and the public that usesit. With demonstrated improvements in quality, Ecuador's MOH could eventually be ableto achieve a significant percentage cost-recovery of recurrent costs. To this end, in thedemonstration hospitals, support is provided to develop a revised system to charge andcollect fees, including legal safeguards that would allow hospitals to manageautonomously the revenues generated by user charges. The MOH has developed a FeeSchedule that includes both Total Costs and Reference Fees (Tarifas Referenciales)estimates for each intervention. The difference is that the Reference Fees include onlyoperational costs excluding medical personnel expenses.
As the blind use of such fees might have a regressive effect, the MOH allowshospitals to proportionately adjust the Fee Schedule according to the regionalcircumstances (Box 3). Moreover, a Socioeconomic Categorization of Users procedurewas designed to apply discounts to the user fees according to family characteristics (Box4).
Box 3. Fee Schedule for Selected Procedures(thousands of Sucres)
Procedure Cost Total Reference FeeCholecystitis (surgical 270 110Appenditicits (surgical) 700 280Gastrintestinal endoscopy 260 104Nornal Birth 650 260Elective Caesarean Birth 1,000 400Tonsil extraction 444 200Prostate biopsy 485 194Source: Annex 1. "Tarifario Referencial".
12

Box 4. Socioeconomic Categorizationfor Health Care Users in Ecuador
In May of 1999 the Ecuadorian government adopted criteria to classify users of publichealth facilities. This categorization required information about the residence(urban/rural, transportation, owned dwelling, access to water, sewage, electricity andphone), education (household head, number of children attending school or university,type of school), household demographics (female headed, number of dependents,disability, chronic diseases), and, occupation and income (job location, householdincome, durable goods, financial assets). Questions on each item assigned "points" whichmay accumulate to a total ranging from 0 to 210 "points." Public subsidies were appliedas follows
Category Point Paid by User (%)
A Less than 50 Free service
B 50-100 25% of the Reference Fee
C 101-125 50/o ofthe Reference Fee
D 126-180 1 00% of the Reference Fee
E More than 180 100% of the Total Cost
Individuals holding a Bono Solidar:o are entitled to Category A. Individuals enrolled in apublic or private health insurance correspond to Category E.Source: 'Annex 2. Criterios para Categorizaci6n Socioecon6mica.' Acuerdo 1292 - Ministry of Public Health.
Promoting Allocative Efficiency in Hospitals. The current budgeting system inthe MOH hospitals does not promote allocative or technical efficiency (Lucio andLasprilla, 1999). Budgets are based on historical spending patterns and are not basedupon the output of the hospital. Changing the method of paying hospitals is one possibleway to improve both the technical and allocative efficiency of hospitals. To this end, theMODERSA Project is supporting: (i) development of a payment methodology; (ii)implementation of "shadow prices" to acquaint hospitals with reimbursement based uponoutput; and (iii) gradual implementation of new hospital financing methodology. Forexample, initially the payment rate would be set equal to total hospital budget divided bytotal number of discharges. All participating hospitals would receive the same paymentrate. The uniform payment rate would be used until it can be refined to include additionalfactors such as case mix, cost of living, and perhaps hospital-specific factors. Thepurpose of this initial payment rate would be to get hospitals accustomed to workingunder a per case administration payment system. It would not be used to actually payhospitals, but instead, it would be used to simulate what a hospital would receive under aper discharge basis. It would also allow time to refine the payment method.
13

Improving Hospital Governance. There is agreement among key stakeholders thatimportant hospital decisions should be made closer to the population served to improveflexibility and responsiveness to the specific needs of the diverse geographical areas andpopulation groups in the country. In order to improve decision making in hospitals, thefollowing measures have been implemented: (i) development of a decision-makingframework to support greater autonomy of selected public hospitals by redefining therelationship between MOH and the Provincial and Municipal Health Boards or Councils,autonomous health entities and individual hospitals, with respect to key hospitalgovernance decisions; (ii) implementation of one or more governance models that wouldallow regional authorities and local communities to share greater responsibility for thegovernance and management of demonstration hospitals; (iii) design and implementationof improved management processes supported by management information systems,including Total Quality Management (TQM) initiatives, that would support thestrengthening of cost accounting, performance improvement and measurement, andreporting systems in the demonstration hospitals; (iv) design and establishment ofhospital management educational programs that train individuals for positions as seniorhospitals and health system leaders, managers of clinical and administrative departments,and technical support staff; and, (v) strengthening of the educational programinfrastructure in hospital and health system management.
Human Resource Management. Overall, the MOH concentrates 23.2% of itslabor force in health services, the LESS 11.7%, and other private for-profit institutions 35%. Out of 16,000 physicians in Ecuador, the MOH and the IESS account for about 6,600physicians in the system compared to 6,000 in private health provider businesses (OPS,1999). The main problems observed in the human resource management are the lack oflabor incentives to provide a health service of improved quality, the inability of Hospitaldirectors to choose an appropriate labor mix between administrative and medicalpersonnel, and the lack of a career profile in the public sector (Lucio and Lasprilla, 1999).These problems are determining factors in the high tumover of qualified personnel, thepercentage share of public and private jobs, and other labor arrangement problems to beaddressed.
With support of the MODERSA project, the decentralization is encouraging output-based incentives--which still require legal instruments--that delegate power to hospitalsfor hiring, for management of layoffs, for decision-making on training, and forinformation systems to organize these decisions. As the project involves other public andprivate institutions, contracts with providers specify appropriate incentives andaccountabilities. The process is intended to move the incentive system from one based onfixed salaries and budgets to a scheme were risk is shared between providers and usersand salaries are subject to those risks (partial- and full-capitation).
The experience of Colinas del Norte suggest potential avenues for reform in thehuman resources management that need to be strengthen (see Box 5).
14

Box 5. A Public HMO: The Community System for IntegralHealth in Colinas del Norte
The Community System for Integral Health (Sistema Comunitario de Salud Integral, SICSI)in Colinas del Norte builds off of the Municipal Health Council model and seeks to improvethe incentive environment wherein health workers and service recipients interact. It targetsone neighborhood with about 2000 families north of Quito. The SICSI operates like a smallpublic health maintenance organization (HNO) in which families pay small monthly fees tobecome members of a clinic. Physicians are paid their usual monthly base salary plusbonuses for a) each new member family and b) each individual attended and servicerendered.
A physician in a project clinic continues to receive her basic monthly salary independent ofher productivity. For each new paying affiliated member family, she receives a monthlybonus of 0.1%. This encourages the physicians to help sell the program in the communitiesthey serve, and quite likely, to treat members better than non-members. In addition,physicians are paid for each service rendered, within certain limits. They receive s/1,250 perconsultation up to a limit of s/500,000 (or 400 consultations) per month. Finally, no morethan 40% of the additional pay for consultations may relate to morbidity, leaving 60%o for"public health" consultations.
Affiliated families pay about US$2.50 per month, for which they receive a comprehensivearray of health services including preventive care, pediatric care, and pre- and peri- natalcare. The local clinic is the main point of contact but has referral rights to the local hospital.By contrast, non-affiliated families continue to be served in the traditional manner; that is, asystem with co-payments for most services. In the first four months of the project, 700families have affiliated with the clinic, and about 400 of these families pay the monthly feeregularly. Families eligible for the Bono can affiliate without paying the fee (in the samemanner that if they are not affiliated they do not have to make most co-payments).
In addition to the encouragement of HMO-style efficiency incentives, another promisingdevelopment is the cooperation on related service provision (such as pre- and peri-natalcare) that the project has helped forge between the local clinics in the Area de Salud and thehospital geographically located within it.
Source: Gershberg (1999)
Measures to address the problem of inadequate health insurance coverage.Universal coverage is a basic goal of all health systems. In Ecuador, there is widespreadsupport for an increase in formal coverage through mandatory health insurance, underpublic and private schemes. This arrangement is ideal for a number of reasons. First,increasing health insurance coverage would reduce the burden of health spending onmany uninsured families who are poor or near-poor. Second, because the uninsured tendto delay treatment until they are quite ill and have no choice but to seek medical help, thisresults in higher family outlays than if the illness had been prevented or treated at anearlier stage; universal coverage would attempt to alleviate this problem. Third, undercurrent arrangements, there is no protection against catastrophic illness costs, which is thebasic purpose of health insurance. Fourth, health insurance enables solidarity and cross-
15

subsidization among beneficiaries. Fifth, the number of people relying on the MOH andother public programs, as the "insurers of last resort" will decrease, allowing for a moreequitable targeting of public spending on health.
Building upon the current legal framework, three scenarios have been discussed before:
* Scenario 1 achieves the greatest expansion of health insurance by extending IESScoverage to the 1.7 million dependents (400,000 adults and 1.3 million children) ofthe 1.1 million current LESS affiliates, as well as 1.2 million self-employedindividuals and 2.4 million of their family members (2.1 million children and 300,000adults). Within this scenario, health insurance under IESS would cover 57 percent ofthe Ecuadorian population, up from the 10 percent it currently covers, and togetherwith other existing sources of coverage (e.g., private health insurance, armed forces,Peasant Social Insurance), 67 percent of the population would be covered.
* The magnitude of this IESS expansion, even with 10 percent of dependents costsbeing absorbed by the dependents themselves (either through a monthly or annualpremium payment or through user fees), and with the self-employed financing 67percent of the cost of their coverage, would still require the IESS to increase thecompensation base that is assessed from the current 60 percent to 91 percent to raiseapproximately US$172 million. The resources from the MOH and other publicprograms would be used to fund services for the uninsured population (but theamount of spending per person would be more than 3.4 times higher in real termns thatcurrent spending levels, from US$17 to US$57). To achieve public spending peruninsured person equal to three-fourths the per capita spending level of IESS, MOH'sspending per uninsured population would have to rise from US$10 at present toUS$48 (assuming that resources from other public programs remain constant in realterms). As a result, the MOH would need to increase its spending by US$61 millionin real terms to reach this level of spending per uninsured person. This would requirea 38 percent increase in government funding and 10 percent cost recovery. MOHexpanded resources could be used to offer a more comprehensive program ofessential services than the one discussed above.
* Scenario 2 offers a less expansive coverage extension by including dependents ofcurrent LESS affiliates and the self-employed (but not their dependents). This wouldresult is 45 percent of the population receiving coverage, with 55 percent remaininguninsured (about 6 million persons). For IESS, this more limited expansion requiresmore limited funding--the proportion of the compensation base that would need to beassessed to fully fund the portion not paid for by the dependents and the self-employed is 82 percent. Given the sizable population for which the MOH and otherpublic programs retain responsibility, this scenario sets a more modest target forspending per uninsured person of one-third the spending level of IESS (from US$17to US$3 1). The MOH could achieve this goal with a 26 percent increase ingovernment funding (about US$30 million), along with 5 percent cost recovery.
* Scenario 3 offers the most limited coverage expansion, extending IESS coverage onlyto LESS dependents, and thus achieving 35 percent overall coverage (65 percent of the
16

population would be uninsured). This would require approximately US$85 millionfrom IESS if dependents financed 10 percent of their costs, and could be achieved byincreasing the compensation base that is assessed to 76 percent. While the peruninsured person spending target remains the same as that in Scenario 2 (one-thirdthe level of LESS per capita spending), public spending per uninsured person rises toUS$27 from US$17 at present. The required MOH fiunding increase from thegovernment to reach this level is higher because of the larger uninsured population.Even with 5 percent cost recovery in MOH facilities, the government funding forMOH would need to be increased by 34 percent over 1994 levels in real terms (aboutUS$39 million).
Table 4. Options For Health Insurance Reform
CURRENT SCENARIO 1 SCENARIO 2 SCENARIO 3Comprehensive Moderate Incremental
Population to be 10% 57% 35% 25%covered by IESS Current Current affiliates + Current Current
Affiliates Dependents; self- affiliates + affiliates +employed dependents; dependents
+ dependents self-employedSalary base for IESScontributions 60% 91% 84% 76%calculation
Approx. IESS per $117 $76 $92 $81capitaspending(1994US$)
Uninsured populationunder responsibility of 80% 33% 55% 65%MOH and other publicprograms
Public dollars spent per US$17 US$57 US$31 US$27uninsured person (94US$)
MOH costs - 10% 5% 5%recovery/communityfinancing needed
Approx. additional - US$44 MM US$30 MM US$39 MMgovernment fundingrequired for MOH(1994 US$)
Source: Mhrquez et al (1999).
17

The Urgency of Reforming the EESS. Given the major institutional weaknessesfound in the social security system, the expansion of health insurance coverage asenvisioned above would have to go hand in hand with a major restructuring of IESS,including the separation of its pension and medical schemes, and the identification ofalternative mechanisms to manage those schemes (e.g., the administrative and financialaspects of health insurance coverage would be handled by various institutions, whowould be separated from those that would actually deliver health care services).Moreover, private health insurance schemes would have the complementary role ofproviding coverage to those persons who desire and can afford to have access to abroader network of providers or additional services than those offered under IESS.
Strengthening Alliances for Health Improvements. Another area of lessattention is the health service to those poorer households that are mainly serviced byeither self-medication or by local pharmacists. While the reform may reach those alreadyserviced by public and private health providers, there is a need for designing innovativemechanisms to exploit the ubiquitous pharmacy network to reach the poorest households.Within the framework of the health reform, this may mainly consist of having the localpharmacies represented in the Health Boards, as well as establishing a network of trainedhealth consultants to improve the common self-diagnostic and self-medication practices.Another alternative is to exploit the work that the NGO have been doing on health. Thereare an important number of institutions that might be interested and probably able to actas intermediaries in health service provision.
Box 6. Social Organizations and Health
Social Organizations in Ecuador include Local NGOs, Popular Organizations, International NGOs,Church Organizations and Private Business organizations. While there is a large variation amongthese institutions in both the fraction of projects, is clear that the proportion of organization is muchlarger than the fraction of projects. This evidences either the relatively large cost of projects or thefact that several health-oriented NGOs are executing projects of different nature. For example, thereare 317 local NGOs related to health, but only 191 projects being executed.
Organizations and Projects related to Healthi Organizations Projects
NGOs 48.1 21.8Popular Org. 44.5 7.3International NGOs 50.0 13.6
Source: SIOS - ALTERNATIVA. Organizaciones Sociales de Desarrollo (1997)
18
References
Organizacion Panamericana de la Salud (1999) Ecuador. Perfil del Sistema de Serviciosde Salud Programa de Organizacion y Gestion de Sistemas y Servicios de Salud.
C:EPAR (1998) Cuentas nacionales de Gastos en Salud Ecuador - 1995. Informe Final.CEPAR-INEC-GESE-PATCO. June, Quito.
Gershberg, A. (1999) "Education and Health Decentralization in Ecuador: Practice, Plansand Prospects," October.
Gragnolati, M. (1999) Incidence Analysis of Social Expenditures and Public Subsidies inEcuador. Background paper for the Ecuador Social Expenditure Review. August.
INEC (1995) Encuesta de Manufactura y Mineria 1995.
Lucio, R. and E. Laprilla (1999) Costosy eficiencia de los Servicios de Salud en elEc-uador a 1999. Estudio preparado para el Banco InterAmericano de Reconstruccion yFomento. Quito, July, 1999.
Lasprilla, E. et al. (1997) Gastoy Financiamiento del Sector Salud- Ecuador 1996.Organizacion Panamericana de la Salud. Salud Publica: reflexiones y experiencias No. 4.Quito. October.
Lasprilla, E. et al. (1998) Equity in Health in LAC. Country studies: Ecuador. November.Unprocessed mimeo.
Maceira, D. (1996) Fragmentacion e Incentivos en los Sistema de Atencion de la Saluden America Latina y el Caribe. Banco Interamericano de Desarrollo. Oficina delEconomista Jefe. December.
Marquez, P. F. Sacoto and M. Molares-Halberg (1999) Organizational Innovations: TheLipchin of Health Sector Reform in Ecuador. Washington, D.C.
MSP (1998) Tena: En la Ruta de la Saludy el Bienestar. Propuesta de Creacion delSistema Descentralizado de Salud del Canton Tena. Mimeo.
MSP (1999) Ministerio de Salud Publica. Reglamento al DE 502. Anexo 1. TarifarioReferencial. Anexo 2. Criterios para Categorizacion SocioEconomica.
Musgrove, P. (1987) "The economic crisis and its impact on health and health care inLatin America and the Caribbean" in International Journal of Health Services, vol 17,pp.4 1 1-41.
Sr[SE (1999) Sistema Integrado de Indicadores Sociales del Ecuador. Version 1.0. CD-ROM.
19

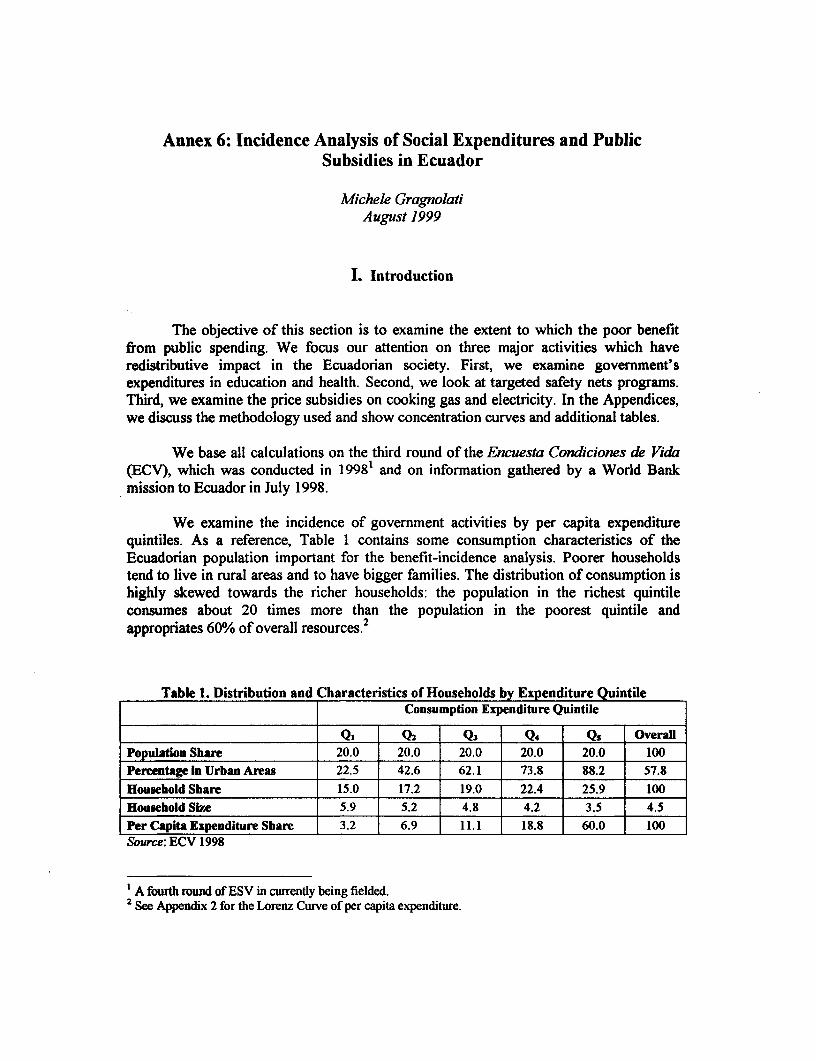
Annex 6: Incidence Analysis of Social Expenditures and PublicSubsidies in Ecuador
Michele GragnolatiAugust 1999
I. Introduction
The objective of this section is to examine the extent to which the poor benefitfrom public spending. We focus our attention on three major activities which haveredistributive impact in the Ecuadorian society. First, we examine government'sexpenditures in education and health. Second, we look at targeted safety nets programs.Third, we examine the price subsidies on cooking gas and electricity. In the Appendices,we discuss the methodology used and show concentration curves and additional tables.
We base all calculations on the third round of the Encuesta Condiciones de Vida(ECV), which was conducted in 19981 and on information gathered by a World Bankmission to Ecuador in July 1998.
We examine the incidence of government activities by per capita expenditurequintiles. As a reference, Table 1 contains some consumption characteristics of theEcuadorian population important for the benefit-incidence analysis. Poorer householdstend to live in rural areas and to have bigger families. The distribution of consumption ishighly skewed towards the richer households: the population in the richest quintileconsumes about 20 times more than the population in the poorest quintile and
2appropriates 60% of overall resources.
Table 1. Distribution and Characteristics of Households by Expenditure QuintileConsumption Expenditure Quintile
_________________________ _______ _ _Qi Q2 Q3 Q4 Qs OveralPopulation Share 20.0 20.0 20.0 20.0 20.0 100Percentage in Urban Areas 22.5 42.6 62.1 73.8 88.2 57.8Household Share 15.0 17.2 19.0 22.4 25.9 100Household Size 5.9 5.2 4.8 4.2 3.5 4.5Per Capita Expenditure Sbare 3.2 j 6.9 11.1 18.8 60.0 100Source: ECV 1998
A fourth round of ESV in currently being fielded.2 See Appendix 2 for the Lorenz Curve of per capita expenditure.
Because of the extremely unequal income distribution, it is not difficult for asubsidy to be progressive in the sense that its removal would worsen the overall incomedistribution in society. Rather, we evaluate the progressivity of public subsidies andexpenditures by looking at which part of society obtains the largest share as ourbenchmark is that the poor should be the major beneficiaries.3
3 See Appendix 1 for further discussion on the methodology and the definition of progressivity.
2

II. Social Expenditures
The provision of basic social services is an activity through which the governmentcan have a positive effect on the welfare of its people. Cost recovery of social services inEcuador is very low since public school tuition and health fees are either minimal orabsent. Social expenditures are hence financed by general taxation.
1. Education
Primary and secondary school in Ecuador last for six years each; university is fourto six years depending on the field. In addition, a one year pre-primary school(kindergarten) program is also available. Public primary schools are universally available.Secondary schools are available in cities and towns, but often not in the more remoterural areas. IJniversities are concentrated in the major cities.
Table 2 presents the unit subsidy that each child enrolled in public school receivesfi-om the government every year, by level of education.4 Because of the much fewernumber of enrollments in universities, the unit subsidy that a university student receivesis about five times higher than the subsidy received by a child at the beginning of theeducation career.
Table 2. Unit Subsidy by Level (US$)Unit Subsidy
Pre-primary Primary Secondary University Overall1998 117.9 117.9 274.1 552.3 159.4Source: SINECThe public education system is defined to include fiscaL fiscomisional and municipal schools.
Figure 1 reveals that overall public expenditure on education in Ecuador isregressive: the poorest 20% of the population receives only 11% of the government totalspending on public education, while the richest 20% receive 26% of governmentspending. This finding is driven by the combination of higher enrollment rates insecondary schools and universities among the richer Ecuadorians and high unit subsidiesper student in each of these levels. Public spending on primary schooling is progressivedue to the fact that school attendance is close to universal but many more richer familiessend their children to private schools.5 The more unequitable distribution is associatedwith university expenditures of which the poorest 40% of the population receive only 6%.
4 The statistics of the Ministry of Education treat expenditures in pre-primary and primary schooling as onecategory.5 See Appendix 2 for education net enrollment rates and concentration curves.
3

Figure 1. Share of Government Spending on Education
0.50
0.40
030
0.20
0.10
Pivprnary Pnlary Secondary Univenity AM
13 st 1312m *3rd *4th E5th
Source: SINEC, ECV
Three findings emerge from the analysis of ECV data, which need to be taken intoaccount to evaluate the role of public education as a socially equalizing force in Ecuador.
* The education process lasts longer for richer children . For example, the expectednumber of years spent in secondary school is six years and two years for children inthe richest quintile and children in the poorest quintile respectively. Thecorresponding figures for university education are 3.7 and 0.1 years.6
* At all education levels, enrollment rates in private schools are higher among childrenof richer households. If use of private schools translates into higher quality ofeducation and higher returns to education later in life, income inequality between therich and poor is likely to increase.
* Rich households spend more on the education of their children than poor households.Households incur out-of-pocket expenditures to gain access to and improve thebenefits of subsidized education. Private expenditures are indeed inequitable inEcuador. The lowest quintile receives only about 8% of total household investmentsin primary education, and the upper quintile as much as 55% 7
The end result is that rich children in Ecuador receive a longer and bettereducation, as compared to poor children.
6 See Table 6 in Appendix 2 for the expected number of years of enrollment in each education level.7 See Appendix 2 for the concentration curves of private spending on education.
4

2. Health
Although it has made notable progress in health in recent years, Ecuador still lagsbehind other Latin American countries. Between 1960 and 1995 life expectancy rosefrom 55 to 68 years, but in 1995 the infant mortality rate was 36 per thousand ascompared to 26 per thousand in Colombia and 12 per thousand in Chile.
The basic Ecuadorian health care system consists of the public system and privateproviders. In the public sector, the Ministry of Health (MSP) and the Social SecurityInstitute (IESS) are the main actors. Health care at all public institutions is nominally freeof charge, though users often have to pay for supplies, laboratory work, etc., especially inMSP facilities.
Use of health services is low: according to the 1998 ECV only 10% of thepopulation visited any health facility in the month prior to the interview. Because of thehistorically low and declining quality of the public sector, many people who visit healthfacilities rely on the private sector (45% of the visits are to private clinics). Even amongthe poorest groups, a considerable proportion attends private clinics (27%).s
Table 3. Unit Subsidy by Type of Public Health Care Facility (sucres/)
F I Hospital Unit Subsidy l1 Hospital | Centro de Salud | Subcentro de Salud
1999 268,348 11,814 9,511Source: MSP
The unit cost of a visit to a public hospital is more than 20 times higher than theunit cost of a visit to a smaller public health facility (centro de salud or subcentro desalua). To calculate the incidence of health expenditures, we use information from theECV about the last visit to a public health facility. Within public health care facilities, therich tend to use hospitals, while the poor are more likely to visit health sub-centers and, toa smaller extent, health centers. We find that public expenditure on public health carefacilities is regressive with only 8% of total spending arriving to the poorest 20% of thepopulation.
8 See Table 7 in Appendix 2.
5
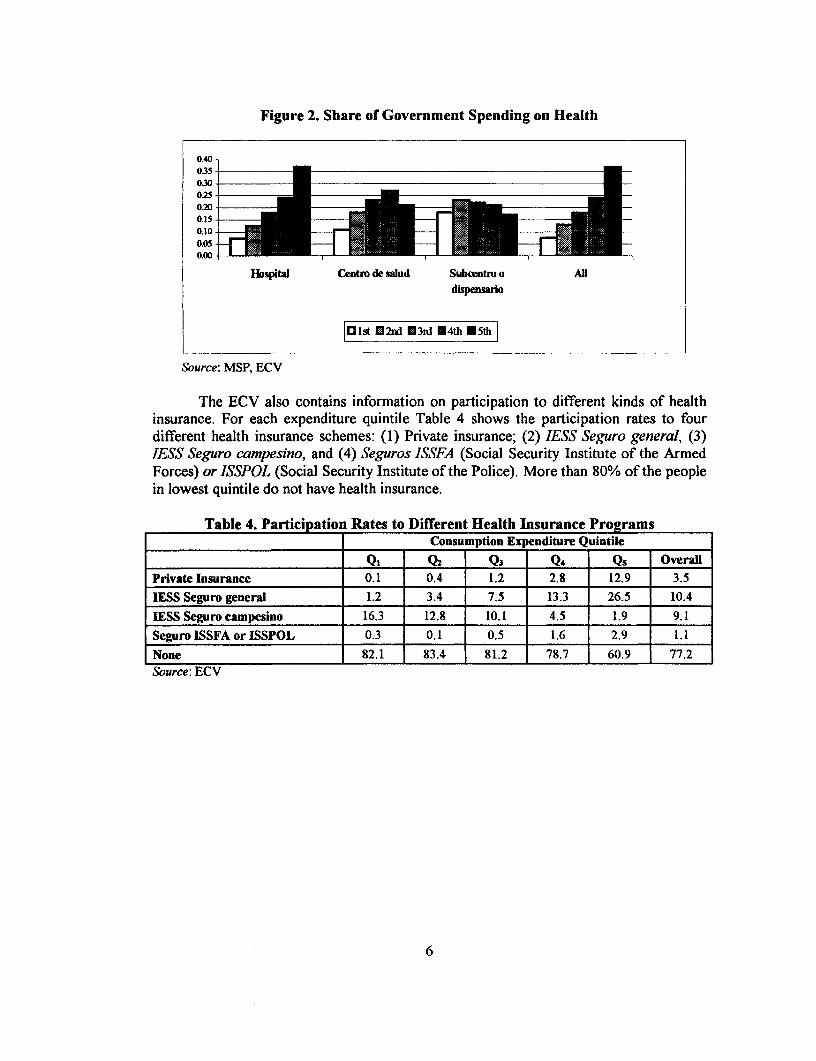
Figure 2. Share of Government Spending on Health
0.400350.30ols
0.100.050.00 1
Hoispital Centro de salud Subhntrm o Alldispensalio
1Elu 2st1 E3nd E4th 05th
Source: MSP, ECV
The ECV also contains information on participation to different kinds of healthinsurance. For each expenditure quintile Table 4 shows the participation rates to fourdifferent health insurance schemes: (1) Private insurance; (2) IESS Seguro general, (3)IESS Seguro campesino, and (4) Seguros ISSFA (Social Security Institute of the ArmedForces) or ISSPOL (Social Security Institute of the Police). More than 80% of the peoplein lowest quintile do not have health insurance.
Table 4. Participation Rates to Different Health Insurance Programs________ Consumption Expenditure Quintile
Qi Q2 | _Q3_ | Q4 | Qs OverallPrivate Insurance 0.1 0.4 1.2 2.8 12.9 3.5
IESS Seguro general 1.2 3.4 7.5 13.3 26.5 10.4
IESS Seguro campesino 16.3 12.8 10.1 4.5 1.9 9.1
Seguro ISSFA or ISSPOL 0.3 0.1 0.5 1.6 2.9 1.1
None 82.1 83.4 81.2 78.7 60.9 77.2Source: ECV
6

III. Safety Nets Programs
As part of its poverty alleviation strategy, the Government of Ecuador hasdeveloped a number of social programs that seek to expand access to or improve thequality of basic services. Most of the more recent social programs have explicitly statedobjectives of reaching the poor and targeting elements were built into their design.
3. Bono Solidario
The bono solidario was introduced in September 1998 to mitigate the negativeiimpact on the poor originating from the elimination of public subsidies on gas, fuel andelectricity. The bono consists of a cash transfer to poor mothers with children and topieople aged 65 and over. In April 1999 the transfers were increased to 150 and 75 sucresfor mothers and adults respectively, and were extended to the disabled population. Thebono solidario is the main social cash transfer program in place in Ecuador.
Figure 3. Share of Government Spending on Bono Solidario
50
45-
35-
30-
25-
20I
15-_I _105
5-
o-1 2 3 4 5
U 3QuintilcsI
Source: ECV
Overall, the bono solidario appears well targeted, at least with respect to othersocial programs. The poorest 40°Oo of the population receives 54% of the totaldisbursements (to both mothers and adults). The component to adults is especiallypirogressive: the poorest quintile receives 38.5% of the disbursement (results not shown).However, there is considerable leakage to people in the richer quintiles. In particular, thebono seems to be reaching urban areas disproportionately and its coverage in rural areasis much inferior than it should be to reach all the most vulnerable groups.
7

4. Colaci6n Escolar
The School Breakfast Program has been operated by the Ministry of Educationsince January 1990 with support of the World Food Program. The objectives of theprogram are to provide nutrition supplements to children in primary schools considered atrisk for their socioeconomic conditions as a stimulus to school participation and academicachievement. The Ministry of Education has recently launched a program of almuerzoescolar with similar objectives.
Figure 4. Share of Government Spending on Colacion Escolar
0.50
0.40
0.30
0.10
0.00 ~~~Olst 02nd E3rI E4th 05th
Source: ECV
The colaci6n escolar is well targeted and leakage to the richer quintiles is verysmall.
5. Alimentos Gratuitos
The Government of Health (MSP), the Ministry of Social Wellbeing (MBS) andthe National Institute of Children and the Family (INNFA) offer free food to childrenbelow school age.
8

Figure 5. Share of Government Spending on Alimentos Gratuitos by Source andIncome Quintile
0.700.60- 0.500.400.300.20-0.100.0 __
INNFA MSP MBS
1131t f2r, E3rd E4t E5th
Source: SINEC, ECV
The progressivity of programs of alimentos gratuitos varies across institutions.Programs from the Ministry of Health (MSP) are the best targeted: the poorest quintilebenefits of 61% of overall spending, while the richest quintile receives only 1%.
9

IV. Price Subsidies on Cooking Gas and Electricity
Traditionally, the government has given price subsidies to the consumers ofcooking gas and electricity by fixing the consumer price at a lower fair than theproduction cost. The cooking gas subsidy has been provided by setting the price ofcanisters at roughly one-fifth the combined production and distribution cost. Theelectricity subsidy has been provided as discounts in the unit household consumptioncharge, with higher percentage discounts applying to households with lower monthlyusage.
These subsidies were not only costly but also inappropriately targeted. Thebenefits from the price subsidies have been higher in urban areas, although the largestpoverty incidence is in rural areas, and have been enjoyed by all consumers, including therichest households. Moreover, neither subsidy reached Ecuador's poorest, i.e. those whodid not consume any cooking gas or electricity.
In 1998, the Government increased considerably the price of cooking gas andelectricity in order to eliminate the subsidies.9 However, the new price was fixed innominal sucres and the subsidy reappeared after the price of oil, the exchange rate and theinflation rate increased.
Price subsidies for cooking gas and electricity are highly regressive. Apart fromthe share of subsidy distributed for industrial use (7.0% and 25.0 % of the overall subsidyfor cooking gas and electricity respectively), subsidies for residential use benefitdisproportionately richer households, which consume both gas and electricity in largerquantities. Only 27% of the cooking gas subsidy and 24% of the electricity subsidy wereestimated to flow to the poorest four deciles of the population.
Figure 6. Share of Subsidies on Cooking Gas and Electricity (Residential Use)
0.40
0.30
0.20
0.10
0.00Cookin Gas Mmidty
101kst ln 3rd 4th Ef5th
Source: ECV 1998
9 These subsidies are currently estimated to be 1.1% (electricity) and 0.7% (cooking gas) of GDP (IMF1999).
10
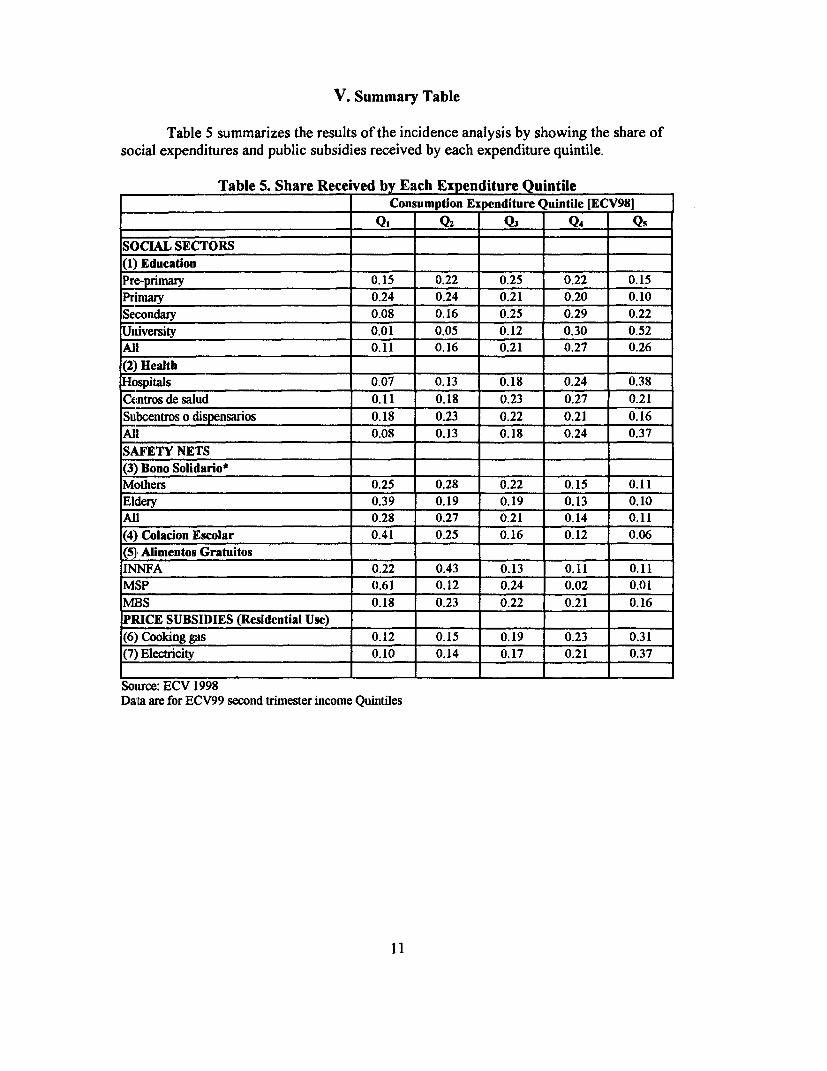
V. Summary Table
Table 5 summarizes the results of the incidence analysis by showing the share ofsocial expenditures and public subsidies received by each expenditure quintile.
Table 5. Share Received by Each Expenditure Quintile_______________________________ .Consumption Expenditure Quintile [ECV981= ____________________ __ _Qi Q2 Q3 Q4 QS
SOCLAL SECTORS(11) EducationPre-primary 0.15 0.22 0.25 0.22 0.15Primary 0.24 0.24 0.21 0.20 0.10econdary 0.08 0.16 0.25 0.29 0.22
University 0.01 0.05 0.12 0.30 0.52All 0.11 0.16 0.21 0.27 0.26(2) HealthHospitals 0.07 0.13 0.18 0.24 0.38Centros de salud 0.11 0.18 0.23 0.27 0.21Subcentros o dispensarios 0.18 0.23 0.22 0.21 0.16All 0.08 0.13 0.18 0.24 0.37SAFETY NETS _(3) Bono Solidario* _ _ _Mothers 0.25 0.28 0.22 0.15 0.11Eldery 0.39 0.19 0.19 0.13 0.10All 0.28 0.27 0.21 0.14 0.11(4) Colacion Escolar 0.41 0.25 0.16 0.12 0.06(5) Alimentos Gratuitos _ _INNFA 0.22 0.43 0.13 0.11 0.11MSP 0.61 0.12 0.24 0.02 0.01MBS 0.18 0.23 0.22 0.21 0.16PRICE SUBSIDIES (Residential Use) _____
(6) Cookinggas 0.12 0.15 0.19 0.23 0.31(7) Electricity 0.10 0.14 0.17 0.21 0.37
Source: ECV 1998Data are for ECV99 second trimester income Quintiles
11
VI. References
Demery L. (1997). Benefit Incidence Analysis. Poverty Reduction and EconomicManagement Network, The World Bank (unprocessed mimeo).
Parandekar S.D. (1998). Analysis of Private Expenditures on Education in Peru.(unprocessed mimeo).
International Monetary Fund (1999). Ecuador: Protecci6n Frente a la Crisis Econ6mica".(unprocessed mimeo).
Lucio R. and E. Lasprilla (1999). Costos y Eficiencia de los Servicios de Salud en elEcuador a 1999. (unprocessed mimeo).
World Bank (1996). Ecuador Poverty Report. Washington D.C..
World Bank (1997). Is Society Getting What it Needsfrom Public Spending onEducation? Issues in Efficiency and Equity. Washington D.C..
World Bank (1999). Poverty and Social Developments in Peru, 1994-199 7. WashingtonD.C..
12

Appendix 1Methodology
Estimating the benefit incidence of public spending involves three steps (Demery1997):
Step 1: Estimating unit subsidies
The unit cost of a service is defined as total government spending on a particularservice divided by the number of users of that service. Information comes fromgovernment statistics on different social services. Whenever the value of the unit subsidyis not available, we estimate the share of each type of service produced (distribution ofvolume produced) received by each income quintile instead of the share of actualexpenditures (distribution of value produced). The two coincide if the unit subsidy isfixed across the income distribution.
Step 2: Identifying users
Information on who uses the service is obtained from the 1998 and 1999 ECV.
Step 3: Aggregating users into groups.
To describe how the benefits from public spending are distributed across thepopulation, we aggregate individuals into expenditure quintiles (for the services providedto individuals) and we aggregate households into expenditure quintiles (for the servicesprovided to households). The ECV, which is modeled after the Living StandardsMeasurement Surveys, provides the information needed to calculate household per capitaexpenditure.
Concentration curves
Concentration curves show the cumulative proportion of social expenditure orsubsidy that is received by the cumulative proportion of the population ranked by percapita expenditure: The 450 diagonal is the line of "perfect equality", that is the line thatwould be obtained if each quintile received the same amount of social expenditure orpublic subsidy.
By comparing the concentration curves with the 450 diagonal, we can judge thetargeting to poorer groups. If the curve lies above the diagonal, it means that the poorestquintile gains more than 20% of the total subsidy (and the richest quintile, less than20%). Distributions below the diagonal signify poor targeting. We evaluate the'progressivity' or 'regressivity' of social expenditures and subsidies by estimating theshare that is received by the poorest rather than by comparing the distribution ofexpenditure and subsidies with the distribution of income.
13
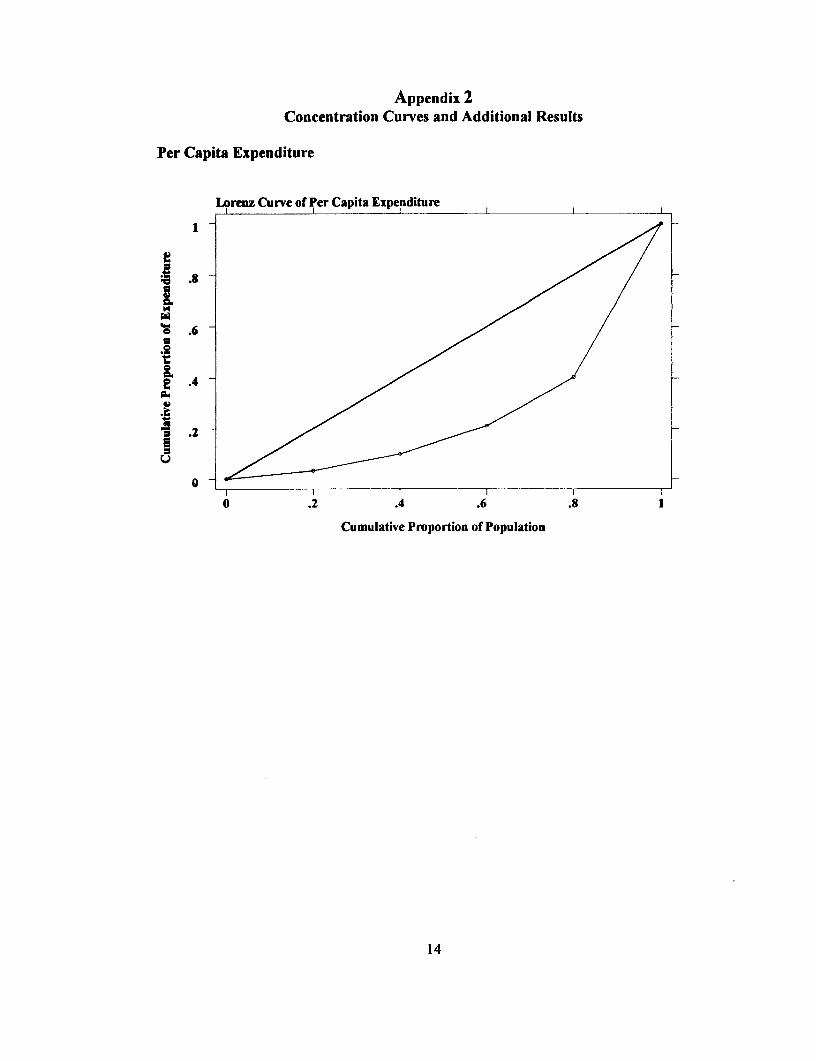
Appendix 2Concentration Curves and Additional Results
Per Capita Expenditure
Lorenz Curve of Per Capita Expenditure
.4 .
o.6
0
. .2 .4 .6 .8
Cumulative Proportion of Population
14
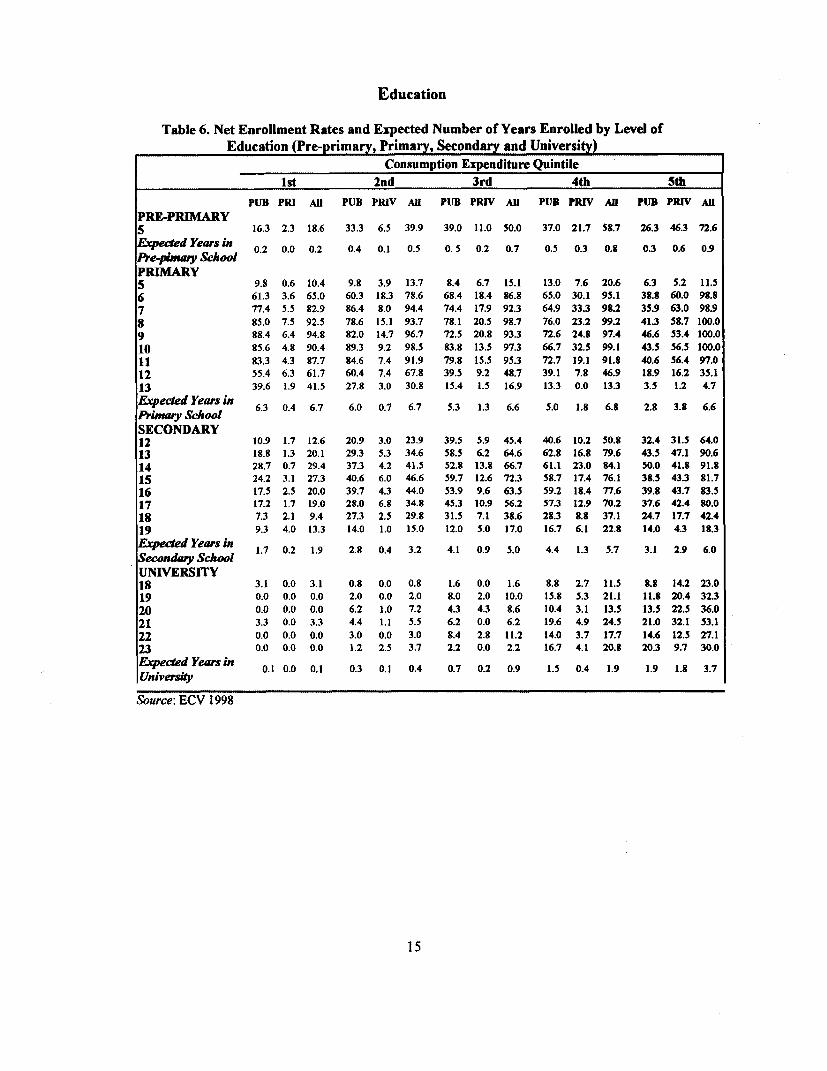
Education
Table 6. Net Enrollment Rates and Expected Number of Years Enrolled by Level ofEducation (Pre-primary, Primary, Secondary and University)
Consumption Expenditure Quintile1st 2nd 3rd 4th 5th
PUB PRI AU PUB PRIV All PUB PRIV An PUB PRIV AU PUB PRIV AUPRE-PRIMARY5 16.3 2.3 18.6 33.3 6.5 39.9 39.0 11.0 50.0 37.0 21.7 58.7 26.3 46.3 72.6
Expected Years in 0.2 0.0 0.2 0.4 0.1 0.5 0. 5 0.2 0.7 0.5 0.3 0.8 0.3 0.6 0.9Prepunary ScboolPRDMARY5 9.8 0.6 10.4 9.8 3.9 13.7 S.4 6.7 15.1 13.0 7.6 20.6 6.3 5.2 11.56 61.3 3.6 65.0 60.3 18.3 78.6 68.4 18.4 86.8 65.0 30.1 95.1 38.8 60.0 98.87 77.4 5.5 82.9 86.4 8.0 94.4 74.4 17.9 92.3 64.9 33.3 9S.2 35.9 63.0 98.98 85.0 7.5 92.5 78.6 15.1 93.7 78.1 20.5 98.7 76.0 23.2 99.2 41.3 58.7 100.09 88.4 6.4 94.8 82.0 14.7 96.7 72.5 20.8 93.3 72.6 24.8 97.4 46.6 53.4 100.010 85.6 4.8 90.4 89.3 9.2 98.5 83.8 13.5 97.3 66.7 32.5 99.1 43.5 56.5 100.011 83.3 4.3 87.7 84.6 7.4 91.9 79.8 15.5 95.3 72.7 19.1 91.8 40.6 56.4 97.012 55.4 6.3 61.7 60.4 7.4 67.8 39.5 9.2 48.7 39.1 7.8 46.9 18.9 16.2 35.113 39.6 1.9 41.5 27.8 3.0 30.8 15.4 1.5 16.9 13.3 0.0 13.3 3.5 1.2 4.7Expected Years in 6.3 0.4 6.7 6.0 0.7 6.7 5.3 1.3 6.6 5.0 1.8 6.8 2.8 3.8 6.6Prinmay SchoolSECONDARY12 10.9 1.7 12.6 20.9 3.0 23.9 39.5 5.9 45.4 40.6 10.2 50.8 32.4 31.5 64.013 18.8 1.3 20.1 29.3 5.3 34.6 58.5 6.2 64.6 62.8 16.S 79.6 43.5 47.1 90.614 28.7 0.7 29.4 37.3 4.2 41.5 52.8 13.8 66.7 61.1 23.0 84.1 50.0 41.8 91.815 24.2 3.1 27.3 40.6 6.0 46.6 59.7 12.6 72.3 58.7 17.4 76.1 38.5 43.3 81.716 17.5 2.5 20.0 39.7 4.3 44.0 53.9 9.6 63.5 59.2 18.4 77.6 39.8 43.7 83.517 17.2 1.7 19.0 28.0 6.8 34.8 45.3 10.9 56.2 57.3 12.9 70.2 37.6 42.4 80.018 7.3 2.1 9.4 27.3 2.5 29.8 31.5 7.1 38.6 28.3 8.8 37.1 24.7 17.7 42.419 9.3 4.0 13.3 14.0 1.0 15.0 12.0 5.0 17.0 16.7 6.1 22.8 14.0 4.3 18.3Expected Years in 1.7 0.2 1.9 2.8 0.4 3.2 4.1 0.9 5.0 4.4 1.3 5.7 3.1 2.9 6.0Secondary SchoolUNIVERSITY18 3.1 0.0 3.1 0.8 0.0 0.8 1.6 0.0 1.6 8.8 2.7 11.5 8.8 14.2 23.019 0.0 0.0 0.0 2.0 0.0 2.0 8.0 2.0 10.0 15.8 5.3 21.1 11.8 20.4 32.320 0.0 0.0 0.0 6.2 1.0 7.2 4.3 4.3 8.6 10.4 3.1 13.5 13.5 22.5 36.021 3.3 0.0 3.3 4.4 1.1 5.5 6.2 0.0 6.2 19.6 4.9 24.5 21.0 32.1 53.122 0.0 0.0 0.0 3.0 0.0 3.0 8.4 2.8 11.2 14.0 3.7 17.7 14.6 12.5 27.123 0.0 0.0 0.0 1.2 2.5 3.7 2.2 0.0 2.2 16.7 4.1 20.8 20.3 9.7 30.0Expeced Years in 0.1 0.0 0.1 0.3 0.1 0.4 0.7 0.2 0.9 1.5 0.4 1.9 1.9 1.8 3.7University
Source: ECV 1998
15

Concentration Curves of Public Spending by Education Level
1mI l Il
;Pmy A
; .8 - SeidaoSdy 0
N i y ... A///./
° .6
.4
e .2
n
v l I I FO .2 .4 .6 .8
Cumulative Proportion of Population
Concentration Curves: Private Expenditure on Education
1-=Pre.prwyO 0
Pimaiy A
Sdey 0
.8 .2 4a6i8
.6
U
1:6 ~ ~ ~ ~ ~ ~ ~~~1
.2
0
I T4
~~~~ .2 ~. 4 6.
Cumulative Proportion of Population
16
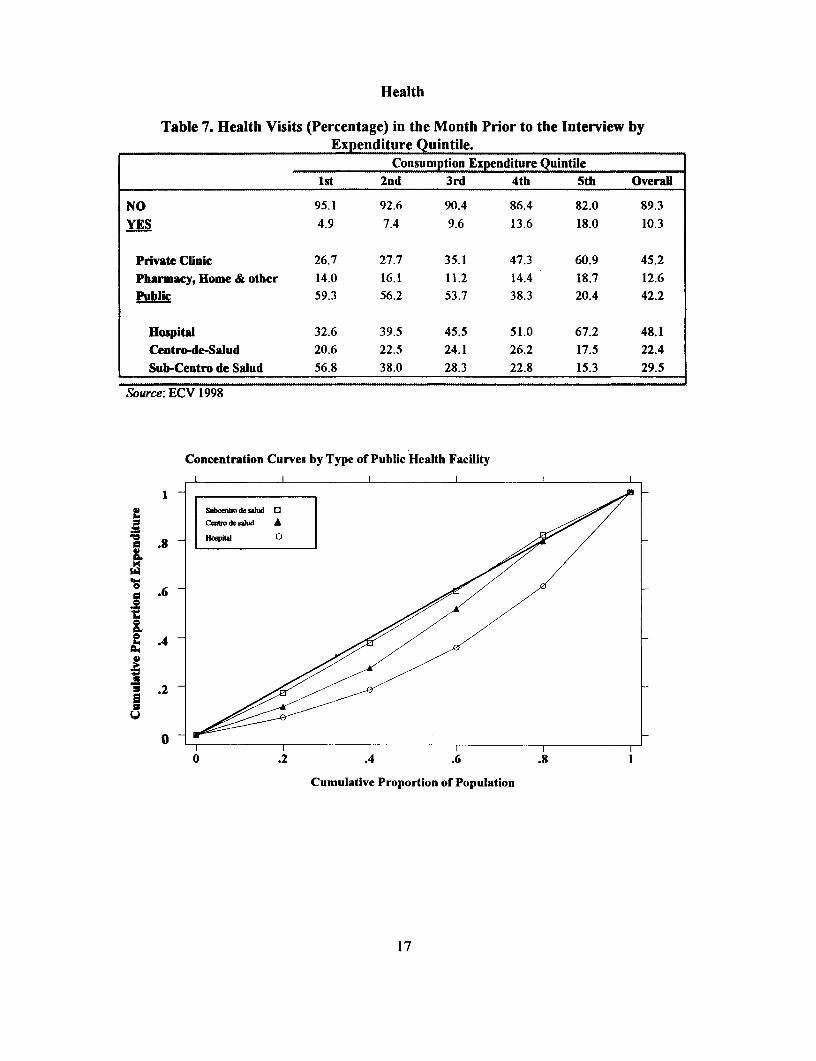
Health
Table 7. Health Visits (Percentage) in the Month Prior to the Interview byExpenditure Quintile.
Consumption Expenditure Quintile
1st 2nd 3rd 4th 5th Overall
NO 95.1 92.6 90.4 86.4 82.0 89.3
YES 4.9 7.4 9.6 13.6 18.0 10.3
Private Clinic 26.7 27.7 35.1 47.3 60.9 45.2
Pbarnmacy,Home & other 14.0 16.1 11.2 14.4 18.7 12.6
Public 59.3 56.2 53.7 38.3 20.4 42.2
Hospital 32.6 39.5 45.5 51.0 67.2 48.1
Centro-de-Salud 20.6 22.5 24.1 26.2 17.5 22.4
Sub-Centro de Salud 56.8 38.0 28.3 22.8 15.3 29.5
Source: ECV 1998
Concentration Curves by Type of Public Health Facility
:I I I I _
la 8 HospiI 0
~~~~~m1 ~ ~ ~ ~ ~ 1
:.6.4
.2
0
0 .2.4 .6 .81
Cumulative Proportion of Population
1 7
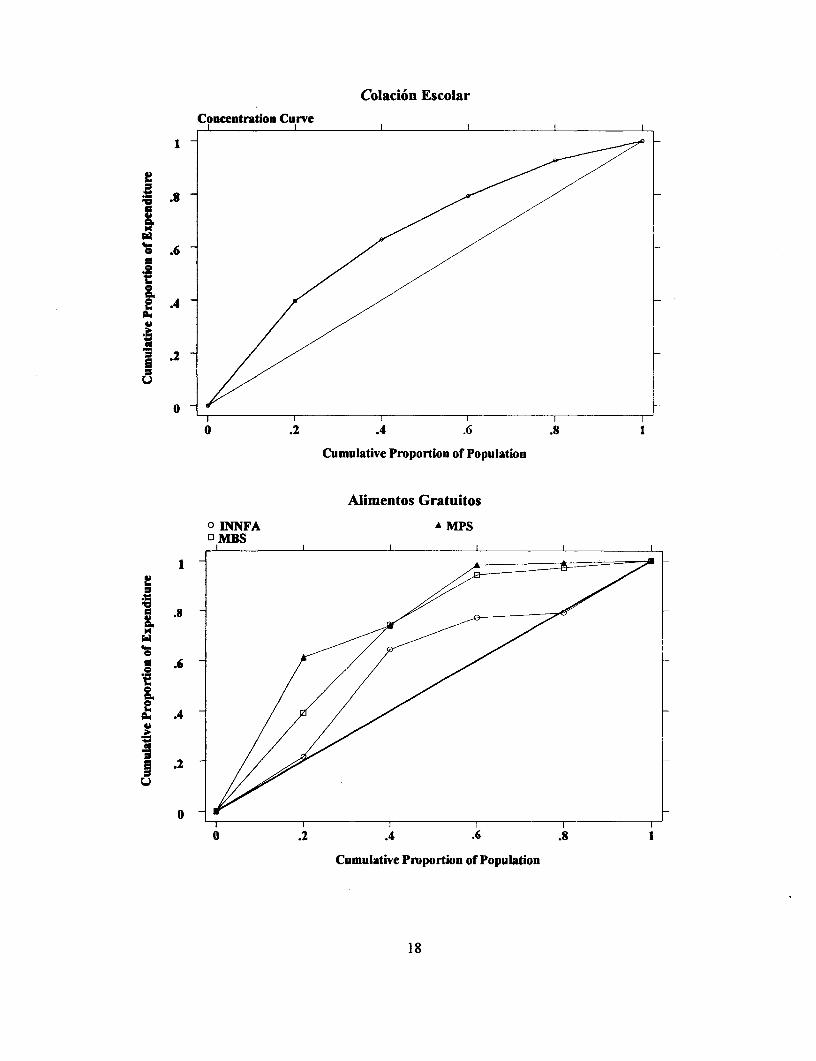
Colaci6n Escolar
Concentration Curve
LII 1X
I.-
*.2
0
.2 .4 .6.
Cumulative Proportion of Population
Alimentos Gratuitos
* EWNFA A MPS° MBS
A.
j.1
04
o .2 .4 .6 .8
Cumulative Proportion of Population
1~~~~~~~~~~~~~~

Annex 7. Employment Generation in Ecuador
Mari MinowaNovember 11, 1999
Table of Contents
L Crteria for Selecting Safety Net Programs .............................. 2
II Alternatives for Income Support and Employment Generation .3
A. Job Skills Training .3
B. Micro-Enterprise Development .3
C. Public Employment Programs .4
II Existing Programs of Employment Generation in Ecuador .6
A. Common Issues of Existing Programs .6
3. Review of Existing Programs .101. FISE ...................... 102. PRONADER ...................... 113. COPEFEN/CORPECUADOR ...................... 124. Ministry of Education ................... 135. Ministry of Health ................... 146. MIDUVI ................... 157. Municipal Governments ................... 15
Appendix 1. Characteristics of Public Works Programs in Selected CountriesAppendix 2. Impact Evaluation of Public Employment SchemesAppendix 3. Fondo de SolidaridadAppendix 4. COPEFEN: Summary of Funds Allocation and Transfer

Employment Generation in Ecuador
L Criteria for Selecting Safety Net Programs
The Government has various alternative tools of intervention for providing incomesupport and generating employment. They include, among others, programs such as foodstamps, cash transfers and vouchers, public employment, micro-enterprise and self-employment assistance, and job training targeted to the poor. Governments need toassess the merits and demerits of each alternative program before deciding to implementspecific interventions. The principal criteria for selecting among alternative measureswould include the following:
1) Administrative feasibility. This depends on the detailed design of the program,the level of resources available for administration, the existing administrative capacity ofthe implementing entity, and the degree of imperfection that can be tolerated;
2) Political feasibility. This depends on how the program is promoted to the public,how coalitions of supporters or detractors are built, and the relative power ofbeneficiaries, suppliers, and administrators;
3) Corresponding effects on the poverty strategy. How will a safety net programaffect, for example, the participants' labor supply, participation in other programs, andreceipt of private inter-household transfers, and how will those changes affect marketsand government finances? What will be the net effect on poverty reduction?
4) Potential for reaching the poor. Will the program reach significant number ofthe poor (coverage and exclusion error)? How much leakage of benefits will there be tothe non-poor (inclusion error)?
5) Tailoring the solution to the problem. The program choice should address thereal problem. Where the poor have suffered a loss of real wages rather than a loss ofjobs, for example, transfers to the working poor may be more relevant than creating jobs.In the current case of Ecuador, however, both the real income loss and significantlyincreased unemployment need to be addressed. It is also important to note theheterogeneity of the impact for different groups.
In times of economic crises, an additional important factor to consider is thespeed with which the program can be implemented to quickly deliver the much-neededprotection to the affected people. This objective of quick response can be achieved easierif the framework of a safety net program has already been set up, and can be flexiblyexpanded to respond to greater demands whenever necessary.
The primary issue in designing and implementing a safety net program is how todeliver, efficiently and effectively, program benefits to the targeted groups. Thus,designing a cost-effective targeting mechanism is also a crucial factor for the success ofa program.
2

In the following section, we will review the experiences of different types of incomesupport/employment generation programs in other countries, with the objective ofapplying the lessons learned from those experiences to the current conditions in Ecuador.
HI. Alternatives for Income Support and Employment Generation'
A. Job Skills Training
Publicly funded job skills training may improve trainees' skills andernployability. However, it can help the long-term unemployed and disadvantagedworkers find employment only when the economy is improving and demand for suchworkers is expanding. Impact evaluation studies have found that the cost-effectiveness ofthese programs is generally disappointing. The real rate of return of these trainingprograms is rarely positive, and they are no more successful than job search assistanceprograms in terms of post-program placement and wages, while they cost anywherebetween 2-4 times as much.
The evaluation studies also have found that short-term training is not an adequatetool for updating and upgrading skills of workers displaced from declining industries.Tr-aining for youth generally does not have a positive impact and improves neitheremployment prospects nor post-training earnings. Taking costs into account, the realrates of return of these programs both in the short- and the long terms have been found tobe usually negative.2 Evaluations do show that small-scale, tightly targeted on-the-jobtraining programs aimed at women and other disadvantaged groups among the long-termunemployed often offer the best returns among different types of training programs.However, when there is little prospect of finding employment after completing training,such programs are too costly and ineffective as tools of providing income support for thepoor.
B. Micro-Enterprise Development
Micro-enterprise development programs are usually taken up by only a smallfraction of the unemployed and are associated with high deadweight and displacementeffects. Evaluation of these programs in OECD countries found that the failure rate ofthese businesses is quite high in most cases, though businesses that are assisted throughmentoring and business counseling are more likely to succeed. As in the case of trainingfor the long-term unemployed, assistance targeted to particular groups, such as womenand older individuals, seems to have a greater likelihood of success.3
Nonetheless, as a tool for employment generation and/or income support in timesof economic crisis, micro-enterprise development assistance or micro-credit programs are
V very few countries in Latin America have legaDly or administratively enacted an unemploymentinsurance system. While unemployment insurance could be considered as part of a safety net, its role underthe current conditions in Ecuador is limited to providing modest income support for those new poor laid-offfrom formal sector employment There still remains a large segment of the poor who do not haveemployment contracts in the regulated sector.2 See Dar and Tzannatos (1998) for more details of evaluation results from OECD countries.3 Also see Dar and Tzannatos (1998).
3

not the most cost-effective option. It is true, on one hand, that these programs achieveeffective income transfer to the households that own businesses, and are likely to helpexpand both employment and incomes associated with the business. However, on theother hand, the productivity of resources will be lowest in a crisis period, since the firm'sincome and profitability depends on the overall level of economic activity.
C. Public Employment Programs
Public employment programs serve as a safety net, providing income transferand/or stabilization benefits to the poor, while at the same time using the beneficiaries'labor to build infrastructure for development. The program effectiveness depends on thebenefits, costs, and the way resources are raised to finance the program. The cost-benefitcalculation must take into account the wage income of the participants, the costs ofparticipation, and the foregone income from alternative sources. It must also take intoaccount the impact of the program on the labor market and the structure of wages. Oneimportant design feature of the program is to keep the wage level sufficiently low so thatthe poor are self-selected into the program. Stabilization benefits depend on the timing ofthe program, and may be high even when the transfer amount is small.
Unlike job training programs or micro-enterprise development support, publicemployment programs mainly provide current benefits (temporary income) and are poorinstruments as a permanent escape route from unemployment. Public employmentprograms are also expensive. As shown in Table 1, it costs 1.8 to 9.1 times the GDP percapita in these countries to create one temporary job through a public employmentprogram.
Despite its relatively high cost, however, a public employment program can be anattractive alternative as a short-term safety net intervention for the following reasons: (a)it simplifies targeting so long as the wage rate is appropriately set to ensure self-targetingto the most needy; (b) it is possible to create long-run benefits through assets created andmaintained by the participants; and (c) as work has social merit, it prevents welfaredependency and disincentive effects.
Table 1. Annual Cost of Job Creation through Public Employment Program
1. Cost/job (US$) 1401 ' 2120 2580 ' 786 ' 2700 5445 21222 .Cost/job (PPP) 7212 9759 14302 3620 9388 12100 106103. Per capita GDP (US$) 790 600 380 230 800 600 3904. Ratio (1/3) 1.77 3.53 6.79 3.42 3.38 9.08 5.44
Source: Dar and Tzannatos (1998).
In designing a public employment program, careful consideration needs be given tovarious key features of the program. The features of a good public employment programwould include the following:4
4 The list is taken from Ravallion, Martin, "Appraising Workfare Schemes," (??) 1998.
4

* The wage rate should be set at a level which is no higher than the prevailingmarket wage for unskilled manual labor in the setting in which the scheme isintroduced.
* Restrictions on eligibility should be avoided. The fact that one wants work at thiswage rate should ideally be the only requirement for eligibility.
* If rationing is required because demand for work exceeds the budget available at thewage set, then the program should be targeted to poor areas, as indicated by a crediblepoverty map. However, flexibility should be allowed in future budget allocations acrossareas, to reflect differences in demand for the scheme.
* The labor intensity (the share of the wage bill in total cost) should be higher than normalfor similar projects in the same setting. How much higher will depend on the relativeimportance attached to immediate income gains versus (income and other) gains to the poorfrom the assets created. This will vary from setting to setting.
* The projects should be targeted to poor areas, and should try to ensure that the assetscreated are of maximum value to poor people in those areas. Any exceptions - in which theassets largely benefit the non-poor - should require co-financing from the beneficiaries, andthis money should go back into the budget of the scheme.
* The performance of the program in reducing poverty should be monitored using carefulevaluations.
The wage level is the most important variable in program design. It is critical indetermining how well the program will be targeted to the poor. Maintaining the programwage at or below the level of the ruling market wage for unskilled labor in the local labormarket is the best way to ensure this. In doing so, some effort should be made todetermine the appropriate subsistence wage and the ruling market wage, and to find outhoow they relate to the legal minimum wage. Again, the wage rate should not be higherthani the market wage for unskilled manual labor in agriculture or the informal sectorduring a normal year in the setting in which the program is introduced.
For example, in the "Trabajar" program in Argentina, the wage rate was set at 2/3 ofthe average wage for the poorest decile in the Greater Buenos Aires area. The maximumwage allowed is the national minimum wage. Low wage rates ensure that: (a) there isself-targeting of the poor; (b) incentives are preserved for taking up regular work whenavailable; and (c) there is a wide coverage of the poor, given the available budget. Arigorous ex-post evaluation of the program found that the distribution of the benefit isdecidedly pro-poor, even after taking into account the foregone income of program
5participants.
Another example of a public employment program is the "Employment GuaranteeScheme" (EGS) in the Maharashtra state in India, which is often considered the mostsuccessful direct government effort at reducing absolute poverty in rural areas. If the
5 Jalan, Jyotsuna and Martin Ravallion, "Income Gains from Workfare: Estimates for Argentina's TrabajarProgram Using Matching Methods," World Bank, 1998.
5
"Trabajar" program is an example of workfare in a medium income country where theemphasis is more on the value added of assets created through the program, theMaharashtra EGS is a program which focused more on the labor intensity of sub-projectsand immediate income gains for the poor. Since the mid-1970s, the EGS has offeredemployment opportunities for unskilled workers who maintain rural infrastructurethrough small-scale irrigation and soil conservation projects, reforestation, and rural roadconstruction. The program has been found to be well targeted and to provide sizable nettransfers to the poor. However, a study has also found that a dramatic increase in theprogram wage in mid-1988 has made many of the poor worse off, as the budgetconstraint resulted in rationing of the benefit.6
(Appendix 1) presents the design features of selected workfare programs from LatinAmerica and other regions. (Appendix 2) summarizes results of the impact evaluationstudies for public employment programs in OECD countries.
m. Existing Programs of Employment Generation in Ecuador
A. Common Issues of Existing Programs
Currently, Ecuador has several public programs that could contribute togenerating temporary employment. The Emergency Social Investment Fund (Fondo deInversion Social Emergente, FISE) finances community social infrastructure projects.Special entities, COPEFEN and CORPECUADOR, have been created for reconstructionand rehabilitation of infrastructure affected by El Nifio. There are also infrastructurecomponents within the work of the Ministries of Education, Health, and Social Welfare,which could contribute to employment generation. Another obvious source of publicinfrastructure investment is the Ministry of Public Works, though their work tends to belarge scale and more capital-intensive rather than human-intensive. The Ministry ofUrban Development and Housing also invests a substantial amount in public housingconstruction. Finally, work carried out by municipal governments could also be used forbroad-based employment creation.
While these programs have potential for employment generation for the poor, theGovernment has not yet developed a well-defined strategy to organize these programsunder the explicit objective of public employment generation. If the institutionalinfrastructure of the existing programs were to be used for expanding public employmentin the short-run, a helpful next step may be to identify a designated super-entity withinthe Government which has the mandate and power to coordinate these various ministriesand other autonomous public entities, and to develop a scheme for generating temporaryemployment for the poor. In doing so, design features and institutional capacity of eachprogram need to be carefully assessed to determine necessary modifications.
For each of these programs, Table 2 summarizes the targeting mechanism, programcoverage, share of labor cost, estimated budget for FY99 and FY2000, and estimated unit
6 Ravallion, Martin, Gaurav Datt, and Shubham Chaudhuri, "Higher Wages for Relief Work Can MakeMany of the Poor Worse Off: Recent Evidence from Mabarashtra's Employment Guarantee Scheme,"World Bank, 1991.
6

cost of the employment created. We will review each program in more detail in thefollowing section. Here, we point to some common issues, identified while reviewingthese programs, that need to be addressed if these programs are to function as part of thesafety net for the unemployed and the poor. They include the following:
* Lack of Clear Targeting.
Some programs, notably FISE and the infrastructure components of the projectsfinanced by international lending institutions in the education and health sectors, haveexplicit selection/targeting criteria based on poverty indices. However, most of theexisting infrastructure programs do not have a well-established, poverty-based targetingmechanism. During 1999, much of the infrastructure investment has focused on thereconstruction and rehabilitation of buildings, roads, and bridges damaged by El Nino.The extent of damage, rather than any poverty indicator, has dictated the selection ofprojects. If these programs were to be used as instruments for a social safety net andincome support for the poor, it would be necessary to develop a suitable mechanism ofp]roject selection and beneficiary targeting.
* Budgetary Constraints Leading to Limited Coverage.
Delays in the availability of funds have negatively affected program implementation.Particularly for the reconstruction and rehabilitation of infrastructure damaged by ElNifio, there has been criticism for its slow progress, although part of the explanation maybe the initial planning work required. The same budgetary constraints limit the scope ofemployment generation in a short-run.
* Legal impediments for Efficient Program Implementation, Especially thePublic Sector Contracting Law.
Since the Public Sector Contracting Law (Ley de Contrataci6n Puiblica) applies tothe contracting of services in these infrastructure projects, administrative inefficiency inthe compliance of the law tends to cause significant delay in contract processing. Forthese infrastructure projects to serve as effective public employment generation tools, amore flexible and streamlined contracting process is needed. This may include raising ofthe threshold costs of contracts to allow direct contracting or direct invitation; waiving ofex-ante approval of the National Comptrollers Office for smaller contracts; ordecentralization of ex-ante approval authority to local governments. Certainly, the needfor speed of implementation has to be balanced with the need to ensure transparent, fairexecution of the program. However, the current situation, where the entire process of
7

Table 2. Assessment of the Existing Infrastructure Programs for Employment Generation
Program Targeting Mechanism Size/Coverage Share of Labor Cost Activity/Budget for Activity/Budget for Unit Cost of OneFY1999 FY2000 Workerday
FISE Based on poverty index (As of June 30, 1999) Labor cost share: 300%. Initial total budget: 428 Based on the investment US$20and prior benefits 1,039 contracts signed for billion sucres. Of which plan of FY99, USS40received, at the parroquial USS41.6 million. 47 billion sucres for million worth of signedcensus zone level. Pre- Of which, 585 projects operational costs, and 381 contracts will beallocation of funds at the completed a feasibility billion sucres for outstanding. 25% ofthecanton level, based on study, and 165 projects investment. Expect to total budget of USS40poverty index. under implementation. complete 1,000 projects million will be transferred
(worth USS40 million). to CORPECUADOR.Average project cost:USS40,000. Maximump_roject cost: USS250,000.
COPEFEN No explicit targeting Total investment costs of 30-35% depending on the (As of July 21, 1999) None. US$18mechanism exists. Funds US$167.7 million for size ofthe project. US$85 million has been (WB loan will close in the (COPEFEN-Municipalwere allocated to 1998 and 1999. (WB, transferred to end of 1999.) Governments)municipal governments, IDB, CAF loans and implementing entities.ministries, and other counterpart funds.) Remaining US$76 millionpublic entities, by a need to be transferred bydirectorate, consisting of Average project size: the end of 1999.the Vice president, USS15,000 for thosePresident' delegate, a implemented by municipaldelegate each from MOP, governments (42% of theMOF, and SEDES. total.)
CORPECUADOR No explicit targeting Average annual Yet unknown Unless the Currently, has US$30 Will receive 25% of the N/Amechanism exists. "Plan investment of US$200 master plan includes million (of which US$14 "Fondo de Solidaridad"Maestro" to be completed million is planned. smaller (tertiary or million transferred from allocation (Estimatedin August 1999. community) road COPEFEN). US$105 million).Division of labor: projects, the expected Additional source fundsCOPEFEN-rehabilitation, labor share is small. expected, but amountCORPECUADOR- unknown.reconstruction belowaltitude 1,000m, MOP-reconstruction abovealtitude 1,000m.
PRONADER Project areas selected Total costs for the rural 25-30% US$10.4 million. None. US$9.based on: (a) road component: US$24.5 (The WB financed projectconcentration of small million over 8 years will close in June 2000.)farmers; (b) high poverty (1991-1999).level; and (c) potential forviable productive Of the total of about 70activities. contracts signed for 1999,
only 7 are large contracts(US$250,000_or greater). ___
8

| Ministry of Health Reconstruction of basic The nrwect area cove 25-30%. USS6.2 miflionofbo. None, or rea-.inder ofthe US$20.health service about 2 million inhabitants WB financing and the supplemental loaninfrastructure. Rapid (i.e. about 20% ofthe Average wage for an counterpart funds. approved in 1999.initial diagnosis in areas population.) unskilled worker: 30,000 In addition, USS20selected for the FASBASE sucres/day (US$2.7/day). million supplemental loanproject, based on poverty Average project durationindicators. is about one montk.
MInistry of Educatlon Reconstruction of schools US$22.5 million for 40%. US$22.5 million for 1998 None. US$10.damaged by El Nino. school reconstruction and 1999. Of which Possible supplementalThe COPEFEN/DINACE during 1998-1999. For each contract, about USS18 million has been loan.study identified 1,700 35 laborers are hired. committed and US$12.5damaged schools. The average project size is Average project duration million has been disbursed
US$22,500. is 3 months. as of July 20.
School infrastructure as All contracts have been 25%/. (ITis labor cost US$10 million (?) N/A N/Apart of the regular activity. less than 200 million divides into: 30%/. forFunding per demand, after sucres (approx. professionals, 50% forsatisfying technical US$18,000) allowing skilled labor, and 20% forevaluation ofthe proposal. direct invitation. unskilled labor.)
Ministry of Public No explicit targeting 16 contracts have been 30% for rehabilitation of N/A N/A N/AWorks mechanism exits. signed for US$34 million primary roads.
During 1999, 75% of the during Phase , and 8total investment is for the additional contracts signed"reconstruction/rehabilitat during Phase II (sinceion" of infrastructure November 1998).damaged by El Nino.
Ministry of Urban N/A 93,000 worker*year for N/A N/A N/A USS25.Development and 170,000 housing unitsHousing reconstruction,
42,000 worker*year for100,000 housing unitsimprovement
Municipal Governments N/A Of total estimated revenue 30-35°/o. Roughly US$500 million N/A US$18.of about US$500 million in total. (COPEFEN-Municipalper year, at least US$162 Governments.)million, but most likelygreater amount, is spenton infrastructureinvestment.
Sources: Various interviews with, and data provided by, the program executing agencies.
9
hiring workers for a small social infrastructure project takes 6 months on average, needs to beimproved to allow faster responses.
For those projects funded by multilateral financing agencies, the law allows that the termsagreed with the lending agencies supercede those in the national law. This should help thecontracting of workers in emergency public employment projects funded by external financing.
* Inadequate Institutional Capacity.
Staff working on these programs could benefit from training in both their administrative andtechnical skills. Setting up clear and suitable project selection criteria and targeting mechanisms,for example, would require the technical assistance of an expert. Staff then will have to betrained to efficiently execute these mechanisms, including the management of an appropriateinformation management system for program monitoring.
B. Review of Existing Programs
In the short-run, during the remainder of 1999, effort should be made to maximize thetemporary public employment generated by the existing social programs. Considering thecurrent status of different programs, several among them can be identified as potential source ofemployment. In the following, we review these programs to assess whether they are suitable forprotection and expansion, and their expected impact on employment generation.
1. FISE
FISE is one of the few programs of temporary employment creation which has explicitselection criteria based on poverty indices. More specifically, funds are initially allocated at thecanton level based on the poverty index calculated from the 1995 household survey (LSMS) andthe 1990 Population Census. Furthermore, each parroquia (or in the case of large urbanparroquias, census zones consisting of 2,000 inhabitants) is classified into three categories ofurgency based on the "unsatisfied basic needs" index. While the basic principles of the selectioncriteria need not change, the poverty indices need to be updated with the results of the 1998household survey.
The Implementation Completion Report of the first phase of the FISE project maintainsthat employment generation for both skilled and unskilled workers in construction is the clearestquantifiable impact of the project. However, the Government has not monitored any quantitativemeasure of employment generated through the program. According to a rough calculation basedon the figures given by the program office (i.e. US$40 million annual program budget, 30%labor cost share, unskilled worker wage rate of US$30/week,) a total of 400,000 worker*weeksof employment are being generated through the program in 1999 (assuming that all the laborcosts are for unskilled labor).7 This implies that it costs the Government US$100 to provide one
7 According to the Central Bank data, there were about 280,000 unemployed workers in Cuenca, Guayaquil, andQuito in June 1999. Considering that the share of econonically active population of these three largest cities inEcuador is about 50% of the national total, we could very roughly estimate that there were 560,000 unemployed inEcuador as of June. This implies, therefore, that if all unskilled workers employed by the FISE projects worked
10
week of employment for an unskilled laborer. Or alternatively, the cost of creating oneworkler*day of temporary employment is US$20 (assuming a five-day-week).
During the previous years' operation, FISE has experienced some problems due toallegations of corruption. Since then, a new set of operational procedures and project selectioncriteria has been established, and the program's transparency has been improved. Oneimplementation problem that still remains is the long time (an average of about 6 months) thatthe process of project authorization requires due to various legal requirements and administrativeinefficiencies. If this problem can be alleviated, and the administrative capacity increased withmore emphasis on decentralizing program execution, then FISE will be a good instrument forexpanding public employment for the poor.
For the remainder of 1999, the Government's Emergency Social Program will maintainthe budget of about 108 million sucres for FISE, funded by the allocation from Fondo deSolidaridad and external financing.8
If economic and fiscal conditions allow an increase in funding for the FISE, this programcan be an important source of temporary public employment with the institutional infrastructurealready in place. To maximize the program's capacity in providing employment for the poor, theGovernment may consider: (a) increasing the budget allocation; (b) promoting and favoringprojects with higher labor intensity; and (c) simplifying the procedure of contract pre-authorization by Contraloria and Procuradoria to shorten the project authorization process.
2. PRONADER
The National Rural Development Program (PRONADER) is a Bank-funded project,which has been under implementation by the Ministry of Social Welfare since 1991. The projectis due to close in June 2000. Among other things, the program involves construction ofirrigation schemes, flood control and drainage schemes, construction and maintenance of ruralroads, and construction of small dams. For the fiscal year 1999, the program has an allocatedbudget of US$10.4 million for these infrastructure components, which roughly corresponds tothe undisbursed amount of the Bank loan (US$12.6 million as of June 30).
The particular projects to be funded by the program during 1999 have already beenselected. The program office reports that between the three components of the program (i.e.reconstruction and rehabilitation of irrigation system, rural roads, flood control and drainagesystems damaged by El Nino; Community Development Fund; and forestation components,) atotal of 1,134,328 laborer*days of employment are expected to be created. It is also reported thatthe program added a new condition this year that contractors employ local labor rather thanworkers from outside the community. Out of about 70 contracts to be carried out during 1999,only seven are large contracts greater than US$250,000, with the remainder mostly small
only for one week, then about 71% of the unemployed can be employed for one week through the FISE programduring 1999. Or alternatively, about 8,300 unemployed workers (1.5%) can work for 48 weeks.s For a summary description of Fondo de Solidaridad, see Appendix 3.
11
contracts lasting 60 to 90 days. From these figures, the unit cost of generating one worker*dayof employment can be calculated to be about US$9.
Since the project is completing this year, and the follow-up project prepared to befinanced by FAO (PROLOCAL) does not have any infrastructure component, the expectedimpact of PRONADER will be limited to the 1,134,328 worker*days of temporary employmentto be generated during 1999. The new program, PROLOCAL, will focus on human capitaldevelopment and investment in agricultural micro enterprises. It is planned that "mesas decofinanciamiento" be formed as a venue for community development planning jointly betweenPROLOCAL and FISE.
3. COPEFEN/CORPECUADOR
COPEFEN (Unidad Coordinadora del Fen6meno El Nino) was created in October 1997with the objective of coordinating the rehabilitation of social infrastructure and roads damagedby El Nino. COPEFEN coordinates the work of the Ministry of Public Works, FISE andmunicipal governments. The first phase of the program (October-December 1997) correspondedto the preparation and design of the program before serious damage took place; the second phase(January-October, 1998) to responses to emergencies during the rain and flooding; and the thirdphase (November 1998 to present) to the rehabilitation of damaged infrastructure.
The program has a total budget of US$167.7 million, of which US$146.7 million are tobe spent directly on infrastructure projects. The funding comes from the World Bank, and IDBloans, and Government counterpart funds. The funds have already been allocated and"committed" to municipal governments (42%), Ministries of Public Works (43%), Ministries ofAgriculture, Social Welfare, and Urban Development (3%), and other public entities (FISE,UNDP, CORPECUADOR, etc.) (12%). As of July 9, a total of US$84.2 million (57%) had beendisbursed to the recipient entities.9
CORPECUADOR was established in August, 1998 the final political decision of theAlarcon administration, one day before his departure from office. It is headed by the Vice-President of the Republic, and headquartered in Guayaquil. Its funding is expected to come fromthe export and sales tax of bananas and other tax revenues. However, no funding existed forCORPECUADOR during 1998, and an agreement was signed in December, 1998 for COPEFENto provide US$14 million to fund the activities of CORPECUADOR during 1999. They agreedon the division of labor, with COPEFEN responsible for "rehabilitation" and CORPECUADORresponsible for "reconstruction" of affected infrastructure.
With the US$14 million, CORPECUADOR was to finance reconstruction of 28 bridges(about US$10 million) housing (US$1 million,) and development of the "master plan" (US$3million). As of late July, six contracts for bridge reconstruction had been signed, and theremaining twenty-two contracts were being finalized. CORPECUADOR has been criticized forthe slow progress in its work, which is mainly due to the time spent on developing the "masterplan."
9 For a more detailed distribution of the funds, see Appendix 4.
12

In contrast, about 75% of the funds allocated by COPEFEN to municipal governments(total US$61.7 million) have been already disbursed with the work completed, and the remaining25% of the work is expected to be completed by the end of 1999 or earlier. The average size ofthe wvork executed by the municipal governments under COPEFEN is US$15,000, and the shareof labor cost is reported to be 33% on average. If we use the average wage of US$30/week forlaborers, each project generates 165 worker*weeks of temporary employment. The totalallocated cost of US$61.7 million would generate 678,700 worker*weeks of employment. Thisimplies that it costs US$91 for COPEFEN-municipal governments to create one week ofemployment for an unskilled laborer, or US$18 for one worker*day of employment.
As for the work carried out by CORPECUADOR, no data is yet available. However, wecannot expect a large impact on employment generation for the poor and the unskilled workers.The civil work under CORPECUADOR will focus on major reconstruction work with highcapital intensity, and will not be suitable for the heavy use of unskilled labor.
4. Ministry of Education
During 1999, the Ministry of Education plans to reconstruct and rehabilitate schoolinfrastructure damaged by El Nino. The Basic Education Project (EB/PRODEC) financed by theWorld Bank has US$22.5 million budgeted for the 1998-99 period for infrastructurerecornstruction in target areas.10 A joint study by COPEFEN and DINACE identified a total of1,700 primary schools damaged by El Nino in coastal areas, of which the EB/PRODEC willfinance the reconstruction/rehabilitation of 700 schools in rural areas.1 ' According to theprogram office, the share of labor cost in the total project cost is about 40%. Thus, US$9 millionwill be spent on the labor cost. The average size of a project is reported to be US$22,500 withabout 35 laborers hired for each project. The EB/PRODEC recommends to the contractor thatthey hire local unskilled labor, and this recommendation apparently has been followed in mostcases. In addition to some engineering work, the projects involve many labor-intensive tasks,such as water tank and septic tank installation, roof and ceiling replacement, and painting ofwalls. It takes oll average 3 months (or 13 weeks) from the signing of the contract to the deliveryof the work. Thus, the total budget of US$22.5 million would generate 455,000 worker*weeksof temporary employment for unskilled labor, translated into the unit cost of US$10 forgenerating one worker*day of employment.
In year 2000, the Ministry plans to construct and install 2,300 pre-fabricated classrooms,in collaboration with the municipal governments. The municipal governments will beresponsible for building slab foundation, on which the Ministry will mount the classroom. Eachpre-fabricated classroom is expected to take 10 workers one month to construct; thus the project
'° Of ithe total budgeted amount, US$18 million has been "committed," and US$12.5 has been actually spent as oflate July." Rehabilitation of other 1,000 schools in urban areas is financed by an IDB-funded project. In addition, FISE willfinance the reconstruction of 500 high schools (colegios) damnaged by El Nino.
13

will generate 23,000 worker*months, or 99,700 worker*weeks of temporary employment. Thecost of this work is to be funded by part of the fees charged to bounced checks.'2
For further reconstruction/rehabilitation work to continue during 2000, the Government will needto obtain additional external financing. Negotiation for a supplemental loan is currently underway with the World Bank.
5. Ministry of Health
The Ministry of Health has been funding the rehabilitation of health infrastructuredamaged by El Nino through the Bank-financed FASBASE project. The infrastructurecomponent of the project has been decentralized to sub-national units with financial andadministrative management capacity, such as parroquias or the headquarters of "areas desalud " While initially contracts were given to qualified contractors from outside the community,now most contracts are small and managed locally, with the condition that local labor be hired.
The selection of infrastructure projects under FASBASE has been based on demand, witha quick initial assessment of damages. The FASBASE office reports that it has taken only 8 to15 days, on average, from the identification of demand and submission of estimated project coststo the signing of a contract. This program has taken full advantage of the fact that programsfinanced by international lending agencies are exempt from the condition imposed by the PublicSector Contracting Law (Ley de Contrataci6n Puiblica). Thus, the time spent on preparing andobtainin3 approval for contracts has been apparently much shorter than with other programs suchas FISE.
To improve the targeting of the program to the poor and the most vulnerable groups, anew set of project selection criteria has been developed recently. Based on poverty indices, 300of the poorest parroqulas have been selected from 176 poor, or extremely poor, cantons.Additional criteria include: indigenous population; status of basic health service; availability ofqualified human resources; and areas in the frontier.
The World Bank financing of FASBASE will be completed in 1999. However, given thecurrent crisis and increased need for additional funding, the Bank has agreed to provide aSupplemental Loan of US$20.2 million. Of this amount, US$11.02 million will be spent oninfrastructure. Using the reported 30% as the share of labor cost in the total project cost, andUS$30/week as the average wage for unskilled workers, this additional funding would create92,000 worker*weeks, or 460,000 worker*day of temporary employment. The unit cost ofgenerating one worker*day of employment through the FASBASE infrastructure component iscalculated to be US$20.
12 This unique scheme was initiated in 1974 by the military. Initially, the collected money went to INNFA. Now,the Superintendencia de Bancos collects about US$6 to 7 million of bounced check fees every year, which is usedfor investment in school infrastructure and Ministry of Social Welfare programs.13 Since FISE is also externally financed, it, too, can be exempted from the law. However, the implementing unitof FISE seems to have been unable to benefit from this exemption.
14

6. MIIDUVI
According to the 1LO estimation, construction and/or reconstruction of 170,000 publichousing units would generate about 93,000 worker*years of employment, and additionalimprovement of 100,000 housing units would generate 42,000 worker*years of employment.'4Since the total cost of these investments is not available, we use the figures reported byCOPEFEN for its work with MIDUVI in constructing/rehabilitating housing, to calculate the unitcost of temporary employment generation. It is reported that US$4 million is budgeted for thereconstruction of 1,000 housing units, at an average cost of US$4,000 per unit, of whichUS$2,000 is for the housing infrastructure itself, and the other US$2,000 is for related basicservice infrastructure, such as water and sanitation. Thus, we can assume that US$680 millionand US$200 million are spent respectively for the above-mentioned reconstruction andimprovement. The unit cost of generating temporary public employment through this program iscalculated to be US$6,500 per worker*year, or US$126 per worker*week, or US$25 perworiker*day.
Although raising the labor intensity of these public housing projects could be considered,careful consideration needs to be made on the trade-off between employment generationobjectives and the quality of housing produced.
7. Municipal Governments
The Central Bank data show that duringl998 the total tax revenue for all municipalgovernments was US$78.6 million, of the equivalent of 0.4% of the GDP. In addition,muinicipal governments, received transfer of US$162.0 million from the central government,according to what is set forth in the "Ley Especial de Distribuci6n del 15%".1 With theadditional transfers of US$274 million from other sources, the total municipal governmentrevenue was US$514.6 million. 16
At the same time, the Central Bank data also show that the share of municipalgovernment expenditure-- including the transfers from the central government-- was only 12.1%of the total public expenditure in 1998, amounting to about US$549 million. Although therevenue and expenditure figures do not correspond exactly, they give us the magnitude of moneyspent by municipal governments.
Unfortunately, no data are available on the actual share of expenditure spent oninfrastructure projects. However, it should be noted that the "Ley Especial de Distribuci6n del159%' constrains that the transferred money be used only for investment, and not to cover current
14 OIT, OficiMa de Area y Equipo Tecnico para los Paises Andinos, "Propuestas de Politicas de Empleo paraEcuador a Corto y Mediano Plazo," julio 1999.'5 "La LeyEspecial de Distribuci6n del IS5' issued in March 1997 guarantees transfer of at least 15% of thecentral government budget to municipal governments.16 Figures are taken from Wiesner, Eduardo, "La Descentralizaci6n, el Ajuste Fiscal y el Desarrollo Municipal en elEcuador," Banco Interamericano de Desarrollo, BogotA, mayo 1999.
15

expenditure. Thus, we could assume that at least US$162 million (about one third of the totalexpenditure) was directed to infrastructure investment during 1998. This is a significant amountrelative to the budget size of other programs reviewed here.
Since municipal governments rely heavily on transfers, the current economic and fiscalcrisis, and the resulting arrears of the transfer payments, have caused a serious problem. Theexpected transfer under the "Ley de 15%" in 1999 is US$268 million, which amounts to 11% ofthe total central Government budget, or 76% of the revenue of the US$353 million expectedfrom financial transaction taxes during 1999.
In theory, the fiscal impact of decentralization should be neutral to the public sector as awhole. To the extent that institutional and political capacity exists, municipal governments cantake over from the national government execution of investment projects, and the process oftransfer need not be hindered by the fiscal crisis. In reality, however, many municipalgovernments still lack the institutional capacity to effectively carry out many of the taskscurrently performed by the national government. To help municipal governments playincreasingly important roles in executing investment projects (including temporary employmentgeneration through infrastructure projects,) we need to: (a) strengthen technical assistance forimproving their administrative, financial, and other technical capacities; and (b) set up anincentive system that encourages and rewards efficient use of transferred funds.
The development of municipal government capacity is a long-term goal. For the short-term, existing programs, such as FISE, COPEFEN, etc., should strengthen their collaborationwith selected municipal governments in promoting temporary public employment generation.
16

Appendix 1
Characteristics of Public Works Programs in Selected Countries
fiacd wit' WBhep mncia gvrnets:ovrmet with
?,?t'?5; .:?,:??'..,-''' .''-.f:"'"and expanded in 1997.),, mgiA0W&. Largely goverrmnent 60% WB, 30% state and Mostly the national??i.;.}-?>.,.->.-finan ced, wit Bhelp. municipa govenuments, govermnent witl
10% beneficiaries usually contribution of state andin labor and materials. municipal governments.
u.mb (May 1997-October 1998) (up to September 1998)Benefl?, iaries¢ t.'. . 300,000 workers 1.2 million workers
%ofPopu. . -. 18,000 projects approved (60-70% of workers indrought-affected areas
IT < 5>5, -; . jj C ? ;?.; ??> . . . ? ...........wanting work at theprogram wage rate.)
iomeand/or Other:-. None, except the selection Rural areas. Only oneElb ityCi i of sub-projects based on participant per household,
?; , ;??.?-w????.? .g=>ji .-.... ..poin ts system. and no other familyincome source.(About US$ 100.million/month.)
of E m o en .C r.eate _ _ _ __.-_ _ _ _ _ _ _ _ _ _ _
t -. Wage C(st to-... 0.20 Estimated 0.75
Program W age/Remarks 2/3 of the average wage About equal to the averagefor the poorest decile in wage for casual wageGBA. Max. wage = labor in norml year, and
.?.i' '''national minimum wage. close to the minimumwage. (Well above theshadow wage during the
____ ____ ____ ____ ___ drought)Tat;,,&.3Gr , ',,,.', Poor, unemployed workers Rural poor. Rural unemployed,
______________________ dro.e?t-affected workers.
Targeting Me ?hanism. Self targeting through low Geographic targeting at Geographical targetingwage rates. municipality and rural based on rainfall data.Sub-prjects are selected community levels. (Limited to rura areas.)through points system Community-ba ed Jobs are rationed based onwhich places an emphasis selection by the municipal income level and losses
.........?-.? ,.-,5,, on geographically council. due to droughttargeting poor areas. Project-based selection by
incentive structure andcost-sharing matrix.
Thgex.p .r., .... ., 50% o of participants from 930/oof disbursed funds No data available. Bur.? .... 5 the poorest decile of reached targeted observation suggests that
families. 80% from the beneficiaries (1995,) absolute rainfall data doespoorest quintile. improvement from 44% not reflect the importance
before program of relative rainfall.,,_. ..... _ .,,, ?:i, ,,, reformulation.
17
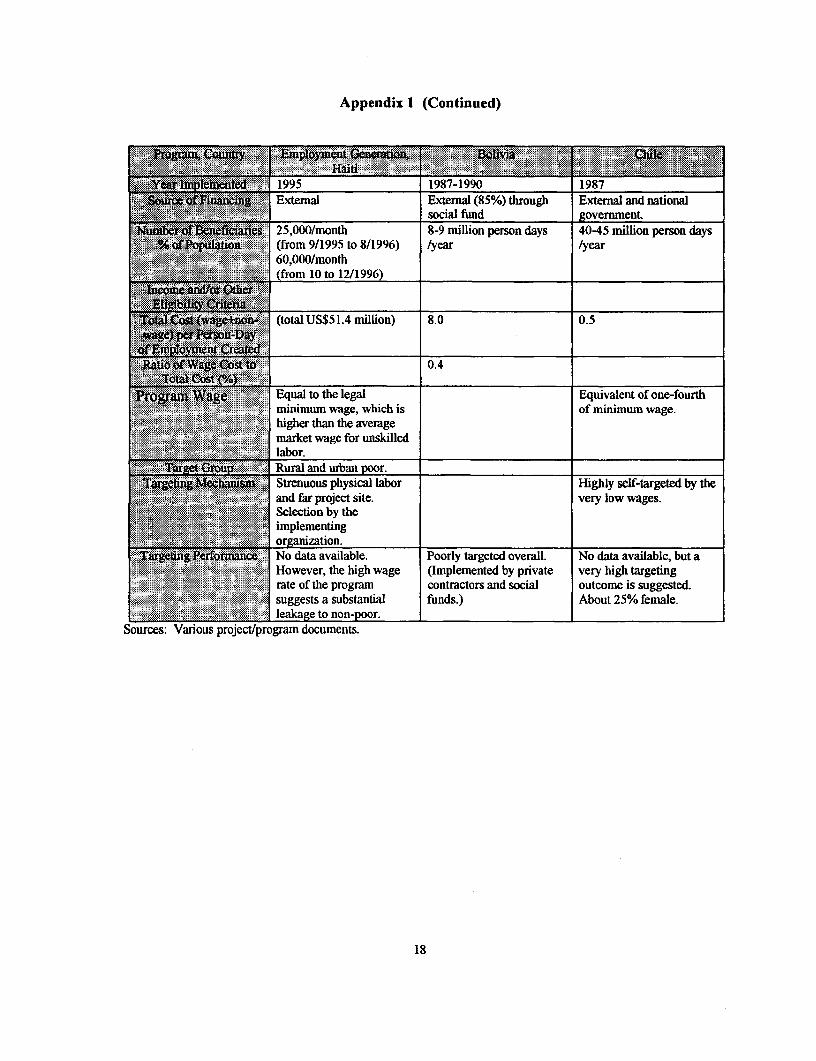
Appendix 1 (Continued)
Yea# ler~ented 1995 1987-1990 1987m *Finaxiduig External Exteral (85%) through Exteral and national
social fund governmentM3bErotBEnifieinries 25,000/month 8-9 million person days 40-45 million person days
. (from 9/1995 to 8/1996) /year /year60,000/month
=r~t4 Xost (wage |kou- (total US$51.4 million) 8.0 0.5
' gg WU
RatioofW4<Costt. 0.4
,B«Bgg--''S,'t,i,- Equal to the legal Equivalent of one-fourthminimum wage, which is of minimum wage.
g-g §$$ ~higher than the averagegg<g>gW ggsmarket wage for unskilled
j "STaretGi~ou Rural and urban por. _______
Strenuous physical labor Highly self-targeted by theand far project site. very low wages.Selection by the
implementing
<ge7gfB~ No data available. Poorly targeted overall. No data available, but aHowever, the high wage (Implemented by private very high targetingrte of the program contractors and social outcome is suggested.
suggests a substantial funds.) About 25% female.leakage to non-por. ___________
Sources: Various project/program documents.
18

Appendix 2Impact Evaluation of Public Employment Schemes
Ongoing schemes in Changing over time due to Individuals placed in short-term Quasi- Displacement effect in Long4erm evaluationSweden to provide short- large time period studied. employment in the constrictio, experimental construction sector is 690/o. using data from 1976 toterm employment and health and welfare sectors. Displacement effect in health 1990. At best,safety net to the and welfare is insignificant programs create nounemployed (Forslund displacement No dataand Krueger, 1994) on costs. No evidence
on value of assetscreated.
Providing short4erm Unemployment rate was Individuals placed in short-term Quasi- Positive impact on subsequentemployment to the fairly steady between 3-4%. employment. experimental employment and incomeunemployed in Austria m levels compared with controlthe early 1990s (Meager group.and Evans, 1998)
Short-term employment Denmark spent about 0.2% Individuals provided with short- Non- Likelihood of leaving Participants findingprovided to the of GDP on these programs. term employment as well as scientific unemployment peaks after subsequent jobs keptdisadvantaged in Unemployment rate around subsidized jobs. participation in tenporary them longer than non-Denmark in the late 1980s 7% jobs. However such effects participants.(Meager and Evans, 1998) are not strong enough to
compensate for reducedemployment impact duringperiod of scheme.
Unemployed individuals Unemployment rates over 15 Various temporary employment Quasi- After controlling for If these differencesprovided short-term percent. Expenditure on schemes provided. experimental unobserved differences, short- were not controlled for,employment in Ireland in these programs rose from tefm and long-term impacts on the short4ern and long-the mid 1980s (Breen, 0.09% of GDP in the mid employment are not term employment1991) 1980's to 0.25% by 1990. significant impacts are positive.
Unemployed individuals Unemployment rates rose Employment Action programs. Quasi- Reduced probability of gettingprovided temporary from 7% in 1990 to over experimental ajob after on e year (by oneemployment in the U.K 10°/ in 1993. percent), increased probabilityin the early 1990s after three years (by 4%)
19
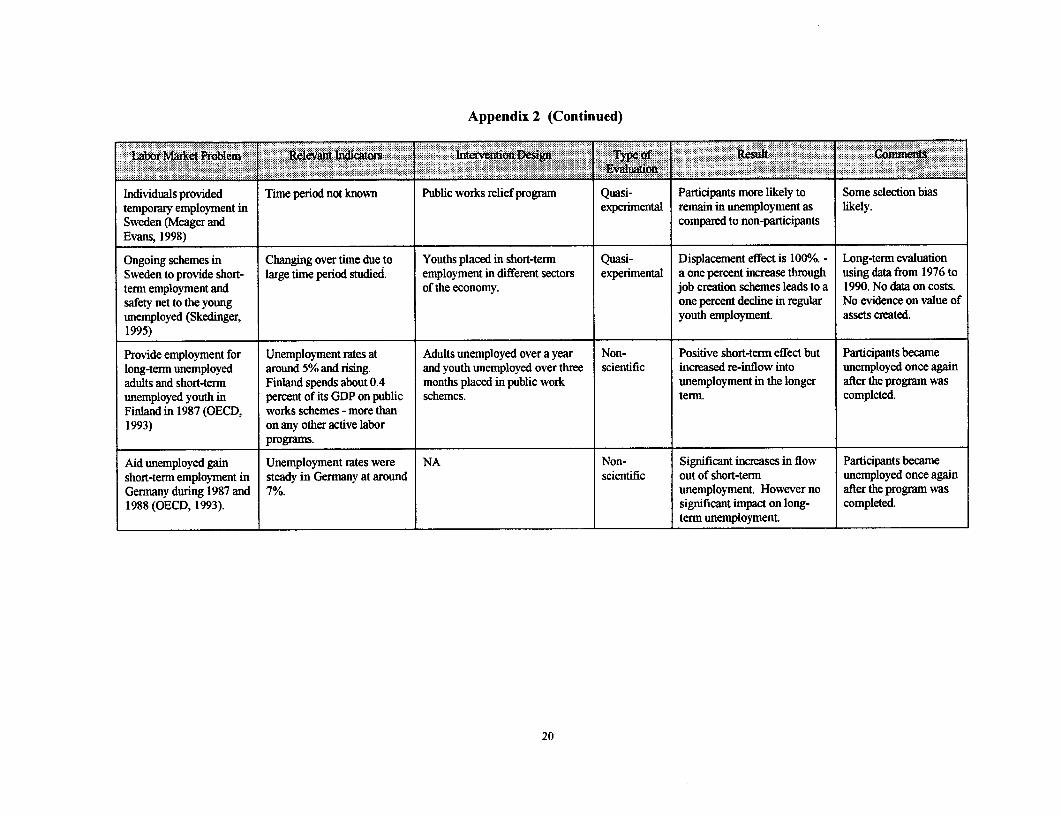
Appendix 2 (Continued)
.. :Eml ... 0 a .. . . . .. ,. ...
Individuals provided Time period not known Public works relief program Quasi- Participants more likely to Some selection biastemporary employment in experimental remain inunemployment as likely.Sweden (Meager and compared to non-participantsEvans, 1998)
Ongoing schemes in Changing over time due to Youths placed in short-term Quasi- Displacement effect is 1000/o. - Long-term evaluationSweden to provide short- large time period studied. employment in different sectors experimental a one percent increase through using data from 1976 toterm employment and of the economy. job creation schemes leads to a 1990. No data on costs.safety net to the young one percent decline in regular No evidence on value ofunemployed (Skedinger, youth employment assets created.1995)
Provide employment for Unemployment rates at Adults unemployed over a year Non- Positive short4erm effect but Participants becamelong-term unemployed around 5% and rising. and youth unemployed over three scientific increased re-inflow into unemployed once againadults and short-term Finland spends about 0.4 months placed in public work unemployment in the longer after the program wasunemployed youth in percent of its GDP on public schemes. term. completed.Finland in 1987 (OECD, works schemes - more than1993) on any other active labor
programs.
Aid unemployed gain Unemployment rates were NA Non- Significant increases in flow Participants becameshort-term employment in steady in Germany at around scientific out of short-term unemployed once againGermany during 1987 and 7%. unemployment. However no after the program was1988 (OECD, 1993). significant impact on long- completed.
term unemployment.
20

Appendix 2 (Continued)
Provide employment for Unemployment rates fell Long4erm unemployed provided Non-scientific Deadweight effect 15%/o andthe long-term unemployed from about 13 percent in the permanent jobs in the municipal substitution effect 15%in Holland in the late early 1980s to below 10 governments.1980's (OECD, 1993) percent by the end of the
decade. Holland spent lessthan 0.02 percent of GDP onthese programs.
Aid displaced and long- Employment had fallen by Individuals employed in public Quasi- Matched pairs estimates show Evaluation done in threeterm unemployed workers over 200/o during 1989-92. service employment including experimental that, as compared to a control counties. Using costto gain temporary Unemployment rate rose from maintenance of public facilities, group, participants are 50%/o less data along withemployment in Hungaiy in 0.5 in 1989 to 8% by 1992. assistance to social welfire likely to be in a normal job after effectiveness data shows1992-93 (O'Leary, 1995) agencies. participating in these programs. that these programs are
Earnings are not significantly extremely cost-different though. ineffective.
Assist displaced and long- Sharp rise in unemployment: Individuals employed in public Quasi- After participating in the Evaluation done in 10term unemployed workers from below one percent at the service employment including experimental program, individuals are 29% counties. Using cost datato gain temporary turn of the decade to 12 maintenance of public facilities, less likely to be employed in a along with effectivenessemployment in Hungary in percent by 1994. After filling assistance to social welfare normal job and earn $15/month data shows that thesethe mid 1990s (O'Leary, continuously for five years, agencies. less than those in the control programs are extremely1998(a)) real GDP started growing group. cost-ineffective.
slowly. Of spending on activeprograms - 15 pement spenton public works.
21

Appendix 2 (Continued)
Aid displaced and long- GDP started growing Individuals employed Quasi- After Evaluations done in 8 Polish voivods. Using cost dataterm unemployed workers slowly from 1994 but on projects organized experimental participating in along with effectiveness data shows that these programsto gain temporary unemployment rate rose by government agencies the program, are cost-ineffective.employment in Poland in from 0%/0 in 1989 to 16% including municipal individuals arethe mid 1990s (O'Leary, by 1994, though it has governments. 8% less likely1998(b)) declined since. In 1994, to be
35% of expenditures on employed in aactive labor programs was normal job.expended on public works. No significant
difference in22__ _ _ _ _ _ _ _ _ _ _ _ _ _ _ _eanings.
22

Appendix 3
Fondo de Solidaridad
The Solidarity Fund (Fondo de Solidaridad) was established in 1997 as a depository of all thefunds to be generated through privatization of public enterprises and concession fees collected from theprivate sector. While the book value of the public enterprises scheduled to be privatized (e.g.electricity and other utility, telecommunications) amounts to about US$4.2 billion, no fund has yetbeen generated, since none of the actual sales has been carried out yet. So far, the concession fees arethe sole source of the fund. The Solidarity Fund invests the collected resources in the financial market,and distributes only the returns from this investment to various social sector projects and programs.During 1998, the Fund received the first set of revenues, from which about US$42.5 million of interestearnings have been generated to be distributed during 1999. Since no privatization sale is foreseenduring 1999, the expected funds available for distribution during the next year 2000 will remain aboutthe same US$42.5 million.
The allocation of funds to different programs was determined by the Council, which consists of20 members. They include: five ministers, six additional representatives of the national government,and one representative each from the Provincial Council, the Municipal Council, and a citizen group.No explicit and objective selection criteria have yet been established for budget allocation. ThePresident of the Fund explained that to facilitate a quick and dynamic launch of the program, adecision was made for 1999 to distribute funds to those projects that are ready for implementation.However, he also acknowledges that there is a need for a clear system for prioritizing amongcompeting projects and programs, especially given that the resources of the Solidarity Fund aresupposed to be available not only for the public sector entities, but also for private, non-profitorganizations.
][n the table below, we summarize the total amount and the amount of resources alreadytransfenred as of August 6, 1999 through the inter-institutional fund transfer agreements already signedand the additional agreements to be signed during 1999.
Fondo de Solidaridad: Distribution of 1999 Budget by Institutional Agreement(million sucres)
-~~~~~~~~~~~~~~ 816199.o t
MDUVI 37,762 15,7831998 Budget 21,979 13,467School Meal (MEC) 25,000 5,000MEC Education Sector Program 13,000 3,000UCP-MFCEB/PRODEC (MEC-World Bank) 2,000 500Nuestros Nin'os (MBS-IDB) 5,000 500Free Maternity Services (MSP) 84,564 8,456CORPECUADOR 102,665 18,000
FISE 70,000MIDUVI - Sanitation and Housing 23,000MEG - T'extbooks 64,000Source: Solidaiy Fund.
23
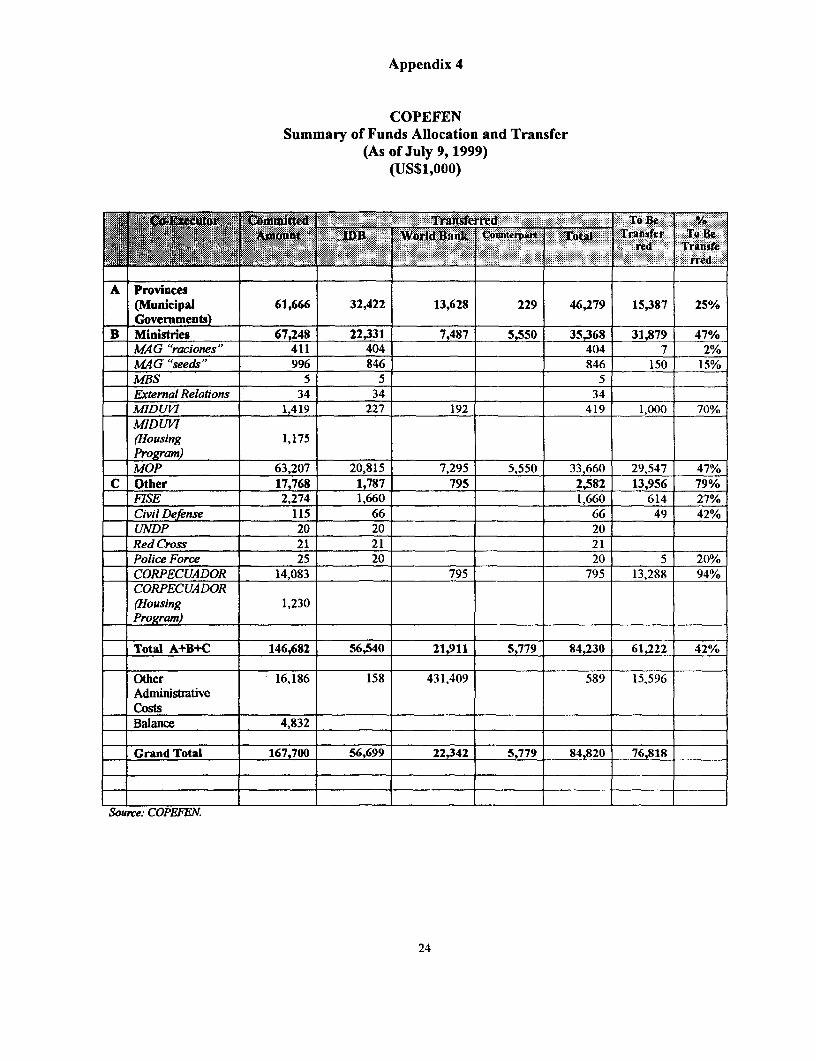
Appendix 4
COPEFENSummary of Funds Allocation and Transfer
(As of July 9, 1999)(US$1,000)
A Provinces(sMunicipal 61,666 32,422 13,628 229 46,279 15,387 25°/Governments)
B Ministries 67,248 22,331 7,487 _ 550 35,368 31,879 47%MAG "raciones" 411 404 404 7 2%MAG "seeds" 996 846 846 150 15%MBS 5 5External Relations 34 34 34-MIDV57 _ 1,419 227 192 419 1,000 70%MIDUV1(Housing 1,175Program)MOP 63,207 20,815 7,295 5,550 33,660 29,547 47%
C Other 17 768 1,787 795 , 2,582 13,956 79%FISE 2,274 1,660 1,660 614 27%Civil Defense 115 66 66 49 42%UNDP 20 20 20Red Cross 21 21 21Police Force 25 20 20 5 20%CORPECUADOR 14,083 795 795 13,288 94%CORPECUADOR(Housing 1,230Progam) _ __.
Total A+B+C 146,682 56,540 21,911 5,779 84,230 61,222 42%
Other - 16,186 158 431,409 589 15,596Administrativecosts _ __
Balance 4,832
Grand Total 167,700 56,699 22,342 5,779 84820 76,818
Source: COPEFEN.
24

Annex 8: Indigenous Education in Ecuador
Kristine M IvarsdotterNovember 1999
L Introduction
Ecuador is a comparatively small country, but with a cultural diversity that includesthirteen different ethnic groups and several sub-groups. Each ethnic group speaks their ownseparate language (except for the afro-chotenos and afro-esmeraldenos who speaks Spanish). Inaddition, the highland and lowland Quichuas also speak several distinct dialects. This rich andcomplex linguistic spectrum has not been reflected in the attempts to introduce a bilingualeducational system in Ecuador, but rather overlooked in an effort to concentrate on educationalprograms for mainly Quichua and Shuar speaking communities. Not until 1998 were theindigenous languages recognized in the legal constitution as official languages besides Spanish(Encalada et al, 1998). Figure 1 below shows the difference in the ability to read and writebetween indigenous and non-indigenous people as of 1995.
Figure 1: Illiteracy in Ecuador
rTAAS DE ANAALFARET6Mo|
w I N D I G i~~~~~~~~~o NIEAS
Source: Sistema Integrado de Indicadores Sociales-SIISE-yECV, INEC 1995
The conquest of Ecuador and the subsequent colonial era, is characterized by a closerelation between Spanish domination and the importance of the written word. Initially, sons ofthe indigenous elite were selected for education by the Spanish administration and during the16wt century the Dominican Schools became educational centers for the indigenous elite. Lateron, when the conquistadors realized that the indigenous people turned the ability to read andwrite into a political advantage and were communicating controversial letters between Lima andQuito, the Spanish administration intentionally closed off the indigenous people from furtherstudies and as a consequence, very few indigenous people learned to read and write during thefollowing 1 8th and 1911 centuries. Although the Spanish crown wished to integrate the indigenouspopulations into the Creole/Spanish state for peace-maintenance reasons, there was a strongresistamce among the local hacienda owners and other influential persons. This position was tohave severe consequences on the colonial administration of Ecuador because censuses,
numerations and registrations of taxes were all locally managed by indigenous administrators.Their ability to read and write was reduced by the resistance to education of indigenous peopleand, as a consequence the administrative system became mismanaged and contributed to thefragility of the political and social structures and eventually, to the breakdown of the colonialsystem.
With the withdrawal of Spanish governmental support for indigenous education, thechurch came to play a more important role. The church created centers for art and works and theresults were widely recognized as remarkable. Manual labor was very qualified and the school ofQuito became famous because of its high quality art production. Particularly the combination ofEuropean style and the skill and religious concepts which were applied by the indigenous artistsin the arts, gained great prestige.
Not until the 20'h century, did the indigenous people take on a stronger position andinitiate the process of acquiring the knowledge to read and write. With the assistance of religiousorganizations, the first indigenous schools were funded in the 1940s in the Province ofPichincha. These indigenous educational centers were established in Cayambe by indigenousleaders who were assisted by meztiso ladies from Quito. The Lauritas missionaries then followedup on this initiative and established indigenous schools in the Province of Imbabura. Indigenousteachers were responsible for the education and the schools functioned until the military coup in1963. According to Ramon (1993) in 1950 illiteracy was estimated at 48% on the national levelwhile for the indigenous people the estimate reached 80% with the remaining other 20% who"only knew how to read and write badly". During these years literacy campaigns were organizedby unions and NGOs such as the "Uni6n Nacional de Periodistas" (Journalist's Union) and the"Liga Alfabetizadora Ecuatoriana" (a NGO). From 1963 and onwards, still with the technicalsupport of UNP, the military government of Ecuador initiated illiteracy campaigns. "La Misi6nAndina", initially with funds from ILO, but later nationalized by the military government,worked with education in the Province of Chimborazo, Imbabura and Tungurahua. In the 1970'sthe Mission was integrated into the Ministry of Agriculture and disappeared. From 1952 anduntil 1981, when their activities were expelled by the government, the Summer Institute ofLinguistics operated linguistic/evangelical centers in the three regions of Ecuador. Although themajor purpose was to translate the bible into indigenous languages for the purpose of "civilizingthe Indians" and evangelization, they also carefully documented the indigenous linguisticheritage. An indigenous initiative was taken by the "Union de Nativos de la AmazoniaEcuatoriana (FCUNAE) in 1975 when this federation of amazonian communities organizedindigenous bilingual schools in about 50 communities. For lack of funds and local support theproject eventually disappeared.
In 1984 the Ecuadorean Government signed an agreement with the Federal Republic ofGermany in which the improvement of the bilingual education was the major objective. In 1988,during President Borja's administration, and based on a proposition by the Confederacion deNacionalidades Indigenas del Ecuador (CONAIE), a "Direccion Nacional de EducacionIntercultural Bilingue" was created within the Ministry of Education. The results of this effortshow that over the past ten years bilingual education exist in 16 out of 21 provinces with 1,681schools and 88 colleges (SINEC, DINEIB, 1998). Despite this apparent progress in the provisionof educational infrastructure and institutional capacity, the average years of education for
2

indigenous children nation-wide is only 2.5 while non-indigenous children spend an average of4.7 years in school (Retrato de Mujeres, 1998). Table 1 below shows the number of indigenousstudents enrolled in bilingual education according to ethnic identity.
Table 1: Indigenous Students in Bilingual SchoolsBy Ethnicity
ALUMNOS DEL NIVEL PRIMARIO EN ESCUELAS BIUNGUESSEGUN NACIONAUDADES INDIGENAS
NACIONAUDADES | TOTAL lINDIGENAS Total Hombres Mujeres
Quichus 59,869 30,626 29,243Shuar 10,775 5,538 5,237Hispanos 7,025 3,559 3,466ChacN 1,991 .1 150 841Achuar 898 471 427Awn 513 321 192Siona seooya 301 164 137Coan 281 154 127Afo-Ecuatorino 237 126 111Huammni 198 101 97Tsacidim 152 67 85Epar 4 2 2
iTOTAL 82,244 | 42,279 39,965
The purpose of this annex is to present a synthesis on indigenous education in Ecuadorwith an emphasis on some of the background and reasons that can explain why the efforts toimprove indigenous education still produce poor results.
IL Preparation for Schooling
The characteristics of an indigenous home- and the profile that makes it different from anon-indigenous home, are the cultural values that each ethnic group applies to their secular dailyliving. For example, while a meztiso home may concur with the national code for socialbehaviour, a Salasaca or Ashuar indigenous home will apply often completely different set ofvalues. With regard to education, the social- and cultural competence that the individual ethnichomes provide, play a significant role concerning the attitudes that parents and children taketowards learning, going to school and submit to the rules of the establishments that apply
3

Indigenous parents tend to have little or no formal education themselves and thereforecannot provide the guidance and stimulation necessary to orient their children in the educationalsystems provided by the national society. Nevertheless, it seems that indigenous families with atradition of formal education are also those that try to stimulate and support their children inorder for them to acquire a higher level of schooling and thereby decreasing the poverty potentialand reach a higher standard of living. Table 2 below shows that in the rural areas, the number ofindigenous students who never enroll in school is about four times higher than that of indigenousstudents in urban areas. The same, table shows that the number of indigenous students enrolled atthe three different levels of education, is much higher in urban areas than in rural areas."Indigenous" is defined by INEC (Instituto Nacional de Estadistica y Censos) as "a person in ahousehold where at least one person speaks quichua" (INEC, 1995, 1998).
4

Table 2: Number of Indigenous Children Enrolled in Schoolin Rural and Urban Areas
Poblaci6n d 6 aAos y mfs, sgOn Nivel de Instrucciony No MM", cub por Ebtna
Poblacl6n TotalNo Indigenas % Indigenas %
Area Urbana
Prinaria 974,429 18.0 19,247 17.8 993,676 18.0Secundaria 686,017 12.6 17,427 16.1 703,444 12.7SLoperior 262,218 48 3,613 3.3 265,831 4.8No se Matriculo 3,500,993 64.6 68,086 62.8 3,569,079 64.5
Total 5,423,657 100.0 108,373 100.0 5,532,030 100.0
Are Rural
Prirriria 710,329 19.7 98,253 24.6 808,582 20.2Secundaria 301,179 8.4 27,520 6.9 328,699 8.2Supenor 37,381 1.0 4,160 1.0 41,541 1.0No se Matricul6 2,556,674 70.9 269,5 67.5 2,826,206 70.6
Total 3,605,563 100.0 399,465 100.0 4,005,028 100.0
Total Naclonal
Prirraria 1,684,758 18.7 117,500 23.1 1,802,258 18.9Secuncdaria 987,196 10.9 44,947 8.9 1,032,143 10.8Spnarior 299,598 3.3 7,773 1.5 307,371 3.2No se MatricU6 6,057,666 67.1 337,618 66.5 6,395,284 67.1
Total 9,029,218 100.0 507,838 100.0 9,537,058 100.0
Source: Encuesta de Condiciones de Vida, 1998. INEC.
Indigenous families in general, rear their childrenr close to the parents or other closerelatives and thereby provide a warm and loving environment for the infant. However, becauseof the often harsh environment characterized by hard work for the entire family, as the childgrows up it will need to take on adult responsibilities often at a very early age. Two to three yearolds may carry newborns in order for the mother to work more freely in the field or in thecompound. Small children 3 years and up sell chewing-gum and flowers all day and long into thenight in the streets of Quito. The mental stimulation of these children whether they live in ruralor urban areas is limited to impressions from the surroundings. In the rural context this consistsof the natural environment of the home, the fields, the mountains or the forest and occasionally atrip to the nearby markets. In the urban context the city and the street life provides stimulation.Teleivision is regarded as a symbol of status and introduces news and ideas to the indigenous, butoften the quality of the program, as well as the quality of the image, is of very poor educationalvalue.
A study of the impact of school breakfast on the ability of learning and study results,shows that poor results in school are, not surprisingly, closely associated with low socio-economic levels of living (Tinajero y Ponce, 1996). For example, 95 % of the children thatparticipated in this study lived in low quality and high risk housing and the 11.1% of the mothersof these children could not read or write. For indigenous mothers, according to the same study,the level of illiteracy is even higher. It is important to note that in the Sierra and in the Oriente,
5

the period of food insecurity (October through March) coincides with the educational period.Children are enrolled in school in September and continue until July. The impact is particularlysignificant for indigenous children since their families have a lower economic capacity andbecause the family food reserves are often used for planting. For example, in Ecuador 77.75% ofthe indigenous population cannot afford the "Canasta de Bienes y Servicios"'1 compared to50.90/O of the non indigenous population (Encalada, Garcia y Ivarsdotter, 1998).
Stimulation towards formal education is very limited in most indigenous homes wherelearning is culturally defined and limited by the ability and will of the parents. In addition,poverty provokes other problems such as alcoholism and maltreatment of women and children.Table No. 2 above showed that 67.5% of indigenous children in rural areas and 62.8% ofindigenous children in urban areas do not enroll in school. Table 3 below shows their statedreasons for non-enrollment.
1 "La Canasta de Bienes y Servicios" is composed by the following categories of spending: foodand drinks, housing, health, education, transportation etc and was constructed by INEC - anofficial government institution concerned with socio-economic statistics.
6
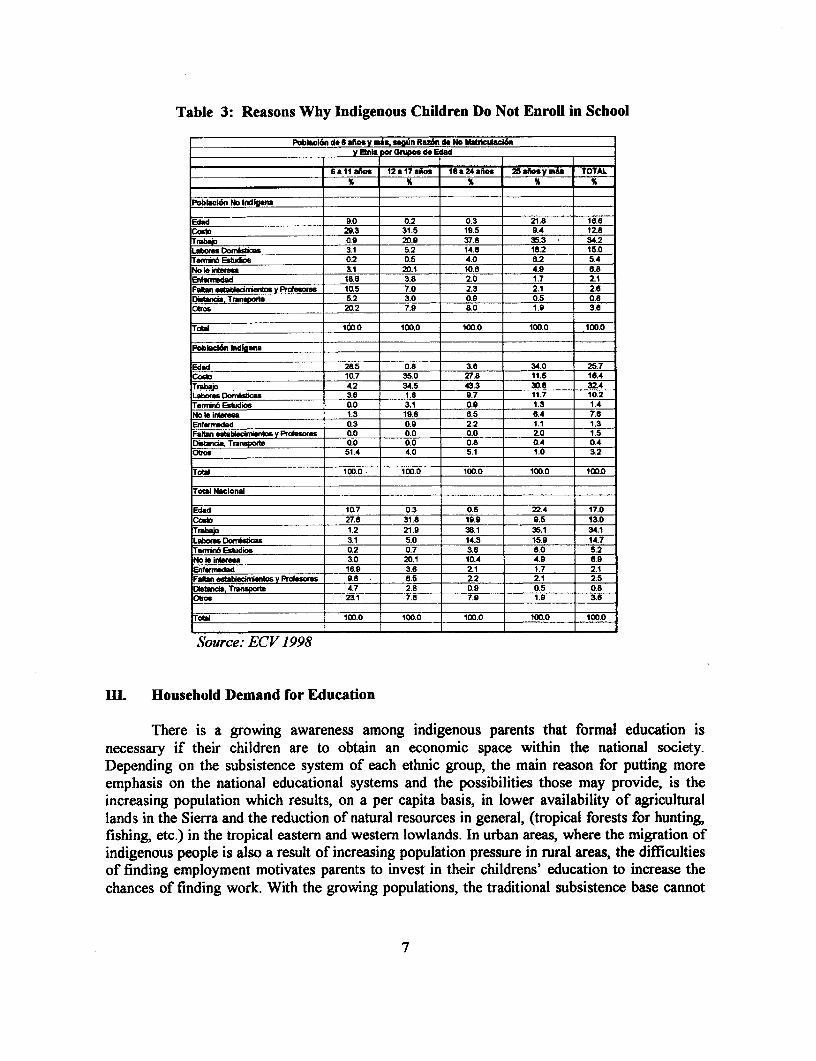
Table 3: Reasons Why Indigenous Children Do Not Enroll in School
Poblac6n do 6 silos y A, ugn Ra6n de No Maticiacl6nvkn 0rupos Edae
6alt aos 12a17aion lS24aaos 325aosy=Ms TOTAL
Poblacl6n No Indigen
Edad 9.0 0.2 0.3 21.8 168Coab 29.3 31.5 19.5 9.4 12.8Tibajo 0 9 20.9 37.8 35.3 34.2LOabo Don 3.1 5.2 14.8 11.2 15.0Termnf E4riios 0.2 3.5 4.0 362 5.4No b i*erwo 1.3 20.1 98.5 4.9 4.6Enfrwudad 0.s 3.8 2.2 1.7 21Falti sstableinisntos y Prdesore 10.5 7.0 0.3 201 1.Oistu,ia, Tnb 05.2 3.0 0.9 0.5 0.4Ot'os 20.2 7.9 8.0 1.9 3.2
Total 100.0 100.0 100.0 100.0 100.0
TolNcload nalnf na_
Edad 21. 0.3 a.5 34.4 725.
coob 1a__ __ __ __ 7. 31.8 19.9 91.5 1ia4
Tmaboo 4.2 34.5 4383 30.1 324Laborx s Donialcas 3. 5.0 4.3 1917 10.2Tenm*6 Estudios 0.2 3.1 0.8 1.3 1.4No I inresa 1.3 120. 1.5 4.4 7.9Enferrudad 1.9 3 0.9 2.1 1.1 1.3Faran abkPcWn os y Prdesores .0 0.0 0.0 Z 1.5Diswda, T4.nsporte 2. 8 4 0.98 0.4 0.8
Co.'D 23.1 7.8 7.9 1.9 3.6
Tot_ 100.0 100.0 10.0 100.0 10.0
Total N cbonal
Edad ~~~~~~107 0.3 0.5 22.4 17.0 SOurce:8 27.8 31.8 19.9 .5
Tmbo -1.2 = 21.9 3S.1 35.1 34.1Labome DonsW M. s.o 14.3 15.e 14.7H ehol E nddiol 0.2 r 7 c.8 8.0 5i2No th irc do 3 0 20.1 ec A 4.9 en.EnD nd 1oc 3o8 c n gi 1t 7 rs f p Fep i o daWenationtal y Prduaon s 9.y m a t 2 p l 1 tr5Dice n, Tonwspohc 4.7 o r 8 0.9 n 5 0.8low* 23.1 7.8 7.9 1.9 &.e
ToSi ~~~~~ ~ ~~~10D.0 1W0.0 1W0.0 1W0.0 100.0
Snource: ECV 1998
mH. Household Demand for Education
There is a growing awareness among indigenous parents that formal education isnecessary if their children are to obtain an economic space within the national society.Depending on the subsistence system of each ethnic group, the main reason for putting moreemphasis on the national educational systems and the possibilities those may provide, is theincreasing population which results, on a per capita basis, in lower availability of agriculturallands in the Sieffa and the reduction of natural resources in general, (tropical forests for hunting,fishing, etc.) in the tropical eastern and western lowlands. In urban areas, where the migration ofindigenous people is also a result of increasing population pressure in rural areas, the difficultiesof finding employment motivates parents to invest in their childrens' education to increase thechances of finding work. With the growing populations, the traditional subsistence base cannot
7

support more than a limited number and therefore sons and daughters are forced out of thetraditional boundaries and need to seek employments beyond the limits of their own society.
However, the fact an indigenous student has enrolled in an educational establishmentdoesn't assure his or her completion of the school year. Apart from illnesses, which is one oftwo major reasons for the indigenous child to stay away from school (the other being laborstrikes), other reasons include the fact that the parents lack financial means or that the childrenhave to work. (See Table 4).
Table 4: Reasons for Indigenous Children not Attending Classes
Poblacld de 6 afls y nis, sgin Raz6n de no Asltoncla a Clas-Y Ebdia por Grwos de Edad
6Ta 11 ~aA os - 12 a* 17 anls is11 a 24 aflos 25 aflos y MA$ - TO-TAL
Poblcimn No Ind cna
Ssrotiro 6.7 11.6 17.5 11.7 9.6ES*rmsdad 51.6 36.5 28.2 8.5 42.3Lab Dombgicas 2.2 3.4 0.9 4.3 2.6
Faro o HoeIga S.S 8.0 6.5 1.6 6.2Fdbadeainem 1.2 1.0 3.0 1.8 1.3
0.7 3.3 11.2 47.8 4.9No b inbea 1.7 3.4 3.1 0.0 2.3
Mal dima 20.2 17.6 12.5 3.1 17.7rohm 10.2 15.3 17.1 21.1 13.0
Totar 100.O 100.0 100.0 100.0 100.0
Pobleci6n hidpre
So refti 0.0 7.8 1.2 0.0 2.4
ErSemiedsd 24.1 14.6 46.2 45.2 22.6Lab. Dornesticas 3.2 2.4 1.9 16.8 3.3Pao o Fluolg 55.1 62.0 12.3 0.0 54.0
Fake rJe Dnero 1.0 0.0 0.0 0.0 - 0.6Trjoik 2.5 5.4 1.2 16.7 3.8
No Is intsrssa 1.6 1.2 0.0 0.0 1.4
MaI dima 0.9 0.0 I 0.0 0.0 0.5rosm 11.7 6.5 37.3- 21.3 il.3
Total 100.0 100.0 100.0 100.0 100.0
TrAbI Nacbnal
So re:iro s .9 11.2 16.9 10.9 8.8ErJfKdad 48.2 _ 34.2 29.0 10.9 40.2LaA r Domstdabs 2.3 3.3 1.0 5.1 2.7Paro o Huegs 11.7 13.6 6.7 1.5 11.3
Fals r do Dineon 1.2 0t9 2.9 1o 1.3Tr baio 0.9 3.5 10.7 45.8 4.8No t d intercsa 1c 7 3i 2 w9 0.0 2.2(Mai dirme 17.8 15.8 12.0 2.9 15.9
Otros ~~~ ~ ~~10.4 14.4 17.9 21.1 1.
ToXli 100.0 100.0 I 100.0 100.010.
Source: Encuesta de Condiciones de Vida, 1998. INEC.
According to Table 4, the major reasons why indigenous students do not, completesecondary school, go on to university levels or even enroll in primary school in the first place areto found in the socio-economic context in which the children grow up. With further studies itshould be possible to identify differences across ethnic groups, provinces and gender. However,
8
during the recent economic crisis, one finds that the following reasons contributed to low schoolattendance during this period of indigenous students (and most probably also to non-indigenouschildren) in both rural and urban areas:
Parents had fewer work opportunities, which resulted in reduced incomes. Thissituation lead to increased tension in the home (drinking, insecurity) and lessparental stimulation.
Parents could not contribute financially for transportation, material, school feesand maintenance of the school.
The educational system broke down for several weeks and in some provinces formonths. Teachers were not paid, supplies were not received, and the schools werenot opened.
The road network in the country was cut off intermitently and no publictransportation was available.
IV. Coverage and Quality of Indigenous Education
The access to bilingual education at the primary level is almost exclusively in the ruralareas. Only nine bilingual educational centers are found in the urban areas; four in Quito, four inRiobamba and one in Puyo (DINEIB, 1999). These are providing education on higher levelssuch as institutes and university. In Table 5 we find that for the Sierra, bilingual education isconcentrated to the provinces of Chimborazo, Cotopaxi and Imbabura while in the Oriente,bilingual centers are mainly found in the provinces of Napo, Morona and Pastaza.
9
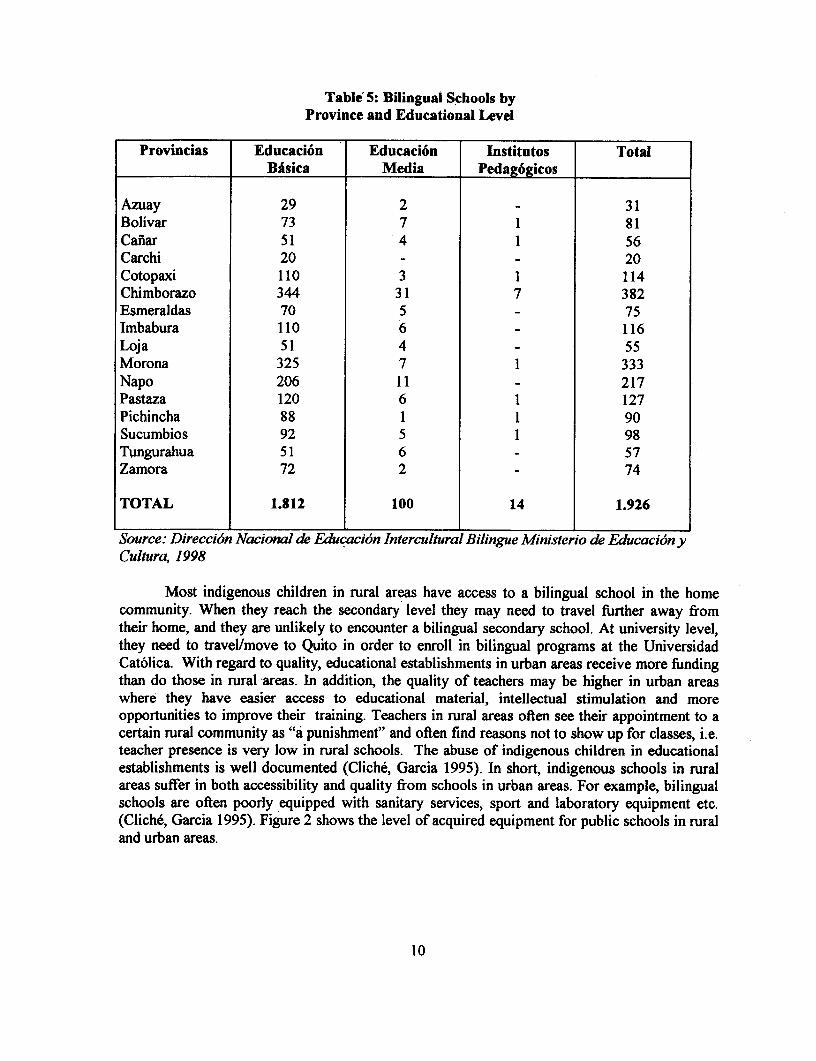
Table 5: Bilingual Schools byProvince and Educational Level
Provincias Educaci6n Educaci6n Institutos TotalBisica Media Pedag6gicos
Azuay 29 2 331Bolivar 73 7 1 81Caflar 51 4 1 56Carchi 20 - 20Cotopaxi 110 3 1 114Chimborazo 344 31 7 382Esmeraldas 70 5 - 75Imbabura 110 6 116Loja 51 4 55Morona 325 7 1 333Napo 206 11 - 217Pastaza 120 6 1 127Pichincha 88 1 1 90Sucumbios 92 5 1 98Tungurahua 51 6 - 57Zamora 72 2 - 74
TOTAL 1.812 100 14 1.926
Source: Direcci6n Nacional de Educaci6n Intercultural Bilingue Ministerio de Educaci6n yCultura, 1998
Most indigenous children in rural areas have access to a bilingual school in the homecommunity. When they reach the secondary level they may need to travel further away fromtheir home, and they are unlikely to encounter a bilingual secondary school. At university level,they need to travel/move to Quito in order to enroll in bilingual programs at the UniversidadCat6lica. With regard to quality, educational establishments in urban areas receive more fundingthan do those in rural areas. In addition, the quality of teachers may be higher in urban areaswhere they have easier access to educational material, intellectual stimulation and moreopportunities to improve their training. Teachers in rural areas often see their appointment to acertain rural community as "a punishment" and often find reasons not to show up for classes, i.e.teacher presence is very low in rural schools. The abuse of indigenous children in educationalestablishments is well documented (Cliche, Garcia 1995). In short, indigenous schools in ruralareas suffer in both accessibility and quality from schools in urban areas. For example, bilingualschools are often poorly equipped with sanitary services, sport and laboratory equipment etc.(Cliche, Garcia 1995). Figure 2 shows the level of acquired equipment for public schools in ruraland urban areas.
10

Figure 2: Equipment and Resources in Public Schools
EOtUPAMIENTO Y CURSOS DE ESCUMLASPUBLICAS
ESCUEILAS
PROIFESOREl _ or
PIORRMS
PUPIRE0
CANCHAS e _ _ _
ESO. CON AGUA
ESC CON ELECTRIC.
0 10 20 30 50 60 70 80 g0
|URBANA URURAL
Source: Sistema Integrado de Indicadores Sociales-SIISE- y ECV, INEC 1995
In indigenous schools we find the following set of problems (Cliche and Garcia 1995):
* Poor quality classrooms, lack of sanitary installations* Lack of education material in respective language, if available of poor qualityo Irrelevant curriculumo Lack of sport and laboratory equipment, lack of libraryo Teacher often from outside the community and not motivated* Teacher not bilingual and often resentful and abusive of local indigenous culture* Teacher not paid (by government or community) and therefore do not attend school* Low attendance of students because of poverty-related reasons
I[n urban areas we find bilingual education at the secondary and university level and a body ofindigenous students who are more motivated since they have to pay for transportation if theyremain living in the community or they have to pay for food and accommodation if they havemoved to the urban area.
Concerning regional variation, the majority of bilingual educational centers (Quichua-Spanish) is to be found in the Sierra (Provinces of Imbabura, Cotopaxi, Chimborazo) andBolivar) while others (Shuar/Achuar, Huao, Siona/Secoya) are found in the Oriente (Provinces ofNapo, Morona and Pastaza). In the Oriente, access to secondary and university level is virtuallynon--existent while students in the Sierra have easier access to higher education.
11
V. Provision and Governance
The best educational program offered by the Ecuadorian Government is probably the"Subprograma de Alfabetizacion Quichua" which began in 1978 at the "Instituto de Lenguas yLinguistica de PUCE. Between 1979 and 1986 it operated under the responsibility of "El centrode Investigaciones para La Educaci6n Indigena (CIEI). Material for literacy in Quichua, Secoya-Siona, Huao and Chachi was developed, and the program took on a national character since itregarded the mother language as the principal language while Spanish was regarded as the inter-cultural and inter-linking language. A master program in Quichua linguistics was offeredbetween 1974 and 1984 which was completed by several indigenous students.
In 1986, as a result of the above followed the "Programa de Auto-Educacion BilingueInter-Cultural" which was part of the "Corporaci6n Educativa MACAC". It was centered onsecondary education and still maintains the bilingual school "Atahualpa" in the Chaupilomacommunity in the Province of Pichincha. Other examples, schools, production of educationalmaterial etc, which came out of the Quichua programs can be found in the Province ofChimborazo.
With the agreement between the Ecuadorian government and GTZ in 1986, the "Proyectode Educaci6n Bilingue Intercultural" began working on curriculums, material in Quichua forprimary level education, capacitation and support of indigenous organization. A total of 53schools in seven provinces in the Sierra have been established under this project. Furthermore, 8primary schools were established in the Provinces of Napo and Pastaza under the "ProyectoAlternativo de Educaci6n de la CONFENIAE" (PAE-BIC).
Following the creation of DINEIB in 1988, the indigenous federation CONAIE signed anagreement on scientific collaboration with the Ministry of Education and Culture in 1989. This"Convenio de Cooperation Scientifica" specifies linguistic and pedagogical investigations to becarried out for the purpose of preparing material for alphabetization, post-alphabetization,progressive education etc in the awa, Quichua, Chachi, Tsachi and other languages. The Ministryof Education and Culture has also signed an agreement with the "Federaci6n Nacional deIndigenas Evangelicos" in order to produce material for social science and Spanish as a secondlanguage education.
Bilingual education through the means of radio communication is being provided byseveral missionary organizations. The best known is the "Sistema Radiof6nico Shuar(SERBISH) which is functioning since 1972 and offers primary as well as secondary educationamong the Ashuar and Shuar communities in Amazonia. The system was officially recognized in1979 and receives support from the Salesian Mission, the "Federaci6n Intercultural de CentrosShuar y Achuar" and from the Ministry of Education and Culture. Another example of bilingualeducation through radio communication is the Quichua adult alphabetization program called"Escuelas Radiofonicas Populares del Ecuador" (ERPE). This program began in 1964 on theinitiative by the bishop of Riobamba and is transmitted throughout the Provinces of Chimborazoand Pichincha.
12

It is evident that the missionary organizations in Ecuador take on a large portion of theresponsibility for bilingual education. Another example is the "Sistema de Escuelas Indigenas deCotopaxi (SEIC), which, although it doesn't function through the means of radio transmissions,has with the support of the Salesian Mission established bilingual schools in the Province ofCotopaxi. The mother tongue is used as the first language in the education programs andindigenous teachers from the involved communities have been educated.
Community based educational systems are not so common. However, the indigenousorganization "Fundaci6n Runacunapac Yachana Huasi" is working in the Province of Bolivar, inthe parroquia of Simiatug. Here the communities with the support of the foundation haveprepared a text book in quichua and a few, schools are offering primary education. Theindigenous teachers are educated at the "Instituto Simiatuccunapac Jatun Capari" which is apedagogical institute under the management of DINEIB.
Following the creation of the DINEIB within the Ministry of Education in 1988,the same government administration created, with funding from the Inter-AmericanDevelopment Bank (BID), the " Programa de Mejoramiento de la Calidad de la Educaci6nBasica (PROMECEB) in 1990. The major objectives of this project were to develop methods foreducation, administration and community participation. In 1999, still with BID funding, afollow-up project was prepared but which will function initially only in the rural areas. It iscalled "Redes de Amigas" and the principal objectives are to change the learning process tobeconme less rigid and more autonomous and oriented towards building self-esteem, creativenessand an awareness of the environment. The new approach of the present project also hopes tobuild on the interactive participation of students, families, other schools in the same zone,teachers and other leaders of communities.
In short, we find that during the past two decades the government has made an effort tosupport indigenous initiative towards a broader and culturally specific education and also that theNGO community, especially the church, is carrying the larger responsibility for theimpleimentation of various bilingual programs both in the Sierra and in Amazonas. For lack oftradition of formal education and for lack of financial means, indigenous communities are yet tobecome more involved in management of schools and in the education of their children.
VL Direcci6n Nacional de Educaci6n Intercultural Bilingue (DINEIB)
DINEIB is a "direcci6n" of the Ministry for Education and Culture and it is financedthrough the national government's budget. Apart from that, GTZ (the German developmentagency) occasionally provides sporadic funds. DNEIB is constituted by the followingadministrative and executing levels;
the implementing level is responsible for the directives of DINEIB and the control of theeducational bilingual system. It is composed of "Subdirecci6n Tecnica" with thefollowing divisions; "Division de Supervision Educativa", Division de Regimen Escolary de Refrendacion6 de Titulos"; "Divisi6n de Curriculo" y la "Division de Formaci6n";
13

Mejoramiento y Capacitaci6n Profesional" with the following sub-groups; "Formaci6nDocente Inicial", "Profesionalizaci6n y Capacitaci6n."
* the evaluating level is responsible for planification and follow-up of the system and forpropositions and recommendations to the central unit. The level is composed of severalunits; "Planificaci6n Integral del Sistema Educativo"; "Division de Planeamiento";"Departamento de Estadistica Nacional", "Mapas Comunitarios" and Asesoria Juridica yComunicaci6n Social".
* the administrative and financial level is responsible for the administrative support andfinancial resource distribution to the central, provincial and community implementingunits.
The operational and functional system of DINEIB is characterized by a structure of sub-organizations. There is the central unit which' responsibility it is to govern, plan, and control theintercultural and bilingual education. The provincial units have the responsibility to organize andapply the intercultural and bilingual education in the provinces, together with teachers andcommunities. At the community level, finally, one finds the community educational centerswhose responsibility it is to comply with the principles and objectives of DINEIB in order toimplement the educational activities in the indigenous communities.
Each provincial unit has a "Consejo Educativo" through which the teachers are selected. Thisis done through a "Concurso de Merecimientos y Oposici6n" which is managed by the nationalsupervisor and delegates from the central unit. In order to apply, the teachers must comply withcertain requirements, for example "Titulo de Normalistas" and the "Certificado de Bilinguismo".The fact that one still find teachers who are only monolingual is explained by recruitment beforethe introduction of the EIB system (Educaci6n Intercultural Bilingue). Teachers training isorganized and coordinated by DINEIB with the "Direcci6n Nacional de Capacitacion(DICAPED). This center also elaborates the specific curricula which are being applied in theELB. GTZ, also provides training opportunities as well as the "Proyecto de Mejoramiento deCalidad de la Educaci6n Basica (PROMECEB).
DINEIB is present in 16 provinces with a total of 4,067 teachers. On primary level 82, 244students participated in DINEIB's educational programs during the school year 1997-98 (no dataavailable for secondary level). Table 6 shows the number abd distribution of monolingual andbilingual teachers according to province. Table 7 shows the number and distribution of studentson primary level 1997-98 according to province.
14
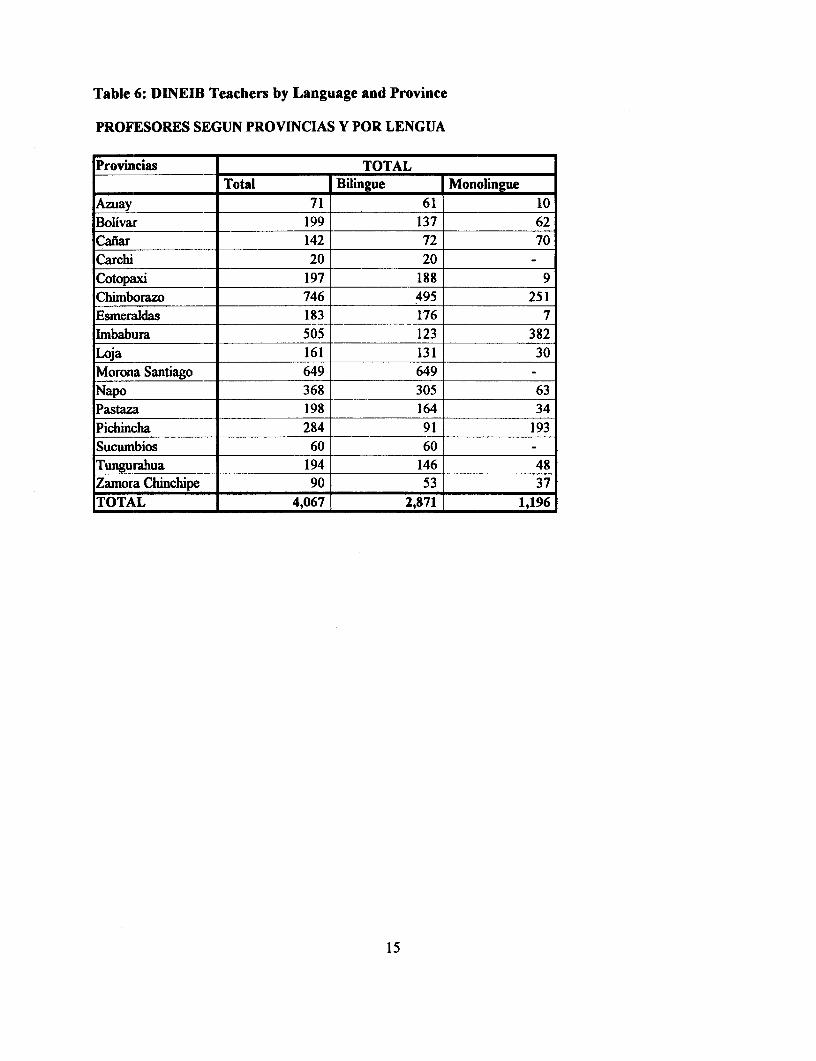
Table 6: DINEIB Teachers by Language and Province
PROFESORES SEGUN PROVINCIAS Y POR LENGUA
Provincias _ _ TOTAL ___________
Total Bilingue MonolingueAzuay 71 61 10Bolivar 199 137 62Cafiar 142 72 70Carchi 20 20Cotopaxi 197 188 9Chimborazo 746 495 251Esmeraldas 183 176 7Imnbabura 505 123 382Loja 161 131 30Morona Santiago 649 649Napo 368 305 63Pastaza 198 164 34Pichincha 284 91 193Sucumbios 60 60Tungurahua 194 146 48Zamora Chinchipe 90 53 37TOTAL 4,067 2,871 1,196
15

Table 7: Students in DINEIB Educational Centers 1997-98, Primary Level
ALUMNOS DEL NIVEL PRIMARIO EN ESCUELAS BIUNGUESARO LECTIVO 1997 - 1998
PROVINCIAS TOTAL I
l_____ _Y Total Hombres MujeresAzuay 1,435 754 681ovaw 3,283 1,731 1,552
CaiIar 2,971 1,461 1,510Cwchi 409 254 155Cotopaxd 5,178 2,670 2,508Chimborazo 19,518 9,958 9,560Esmeraidas 2,435 1,401 1,034Imbabua 10,072 5,065 5,007Loqa 2,373 1,242 1,131M4ona Santigo 9,952 5,095 4,857Napo 7,356 3,729 3,627Pastaza 2,911 1,481 1,430Pchinha 5,858 2,981 2,877Sucumbios 2,875 1,518 1,357Tungurahua 4,209 2,207 2,002Zamora Chkichpe 1,409 732 677
TOTAL 82,244 1 42,279 1 39,965
VIIL Consequences of Poor Education
Indigenous people have more access to bilingual education if they live in the centralprovinces of the Sierra or in the Amazonian provinces of Napo, Morona and Pastaza. If theymigrate to the urban centers, indigenous people have better access to higher levels of educationin general while bilingual education is limited. At the secondary and university levels bilingualeducation may be less important. Strengthening the sense of indigenous identity and community,while learning to read and write, is of crucial importance. Focusing on integration into theEcuadorian society through the achievement of work and careers, the indigenous peoplethemselves often downplay the importance of bilingual education on higher levels and statingthat mastering Spanish is the most important tool in reaching the goals they set for themselves.
The low quality and coverage of education contribute to poverty. Quality and access toschooling are highly correlated with income. Education thus contributes to a vicious circle of
16

poverty wherein the poor receive a low standard of education which contributes to the inabilityto raise themselves from poverty. To break out of this circle is more difficult for an indigenousperson than for a non-indigenous person.
There exists no information as to what extent indigenous children with secondaryeducatiion leave the indigenous community permanently. Most indigenous groups in Ecuadormaintain a very strong sense of ethnic identity, and it can therefore be assumed that whilestudying at secondary or university level, students leave the community if necessary for thepurpose of access to education. but they do return home regularly. Few indigenous people leavetheir communities permanently and a strong explanatory factor is the availability of work and jobopportunities. Among indigenous people, as well as non-indigenous people in Ecuador, there isa strong sense of solidarity within the nuclear and extended family. Therefore, any familymember, indigenous or non-indigenous, who leave the home for the purpose of work withinEcuador or in the exterior, will send money back to help support the life of family members leftbehind.
VII Lessons Learned and Good Practice
The intercultural/bilingual educational programs in Ecuador have succeeded to someextent to elevate the importance of the maternal/indigenous language in the various processes ofbuilding individual self-confidence, self and community identification, and not the least in thesocial and cultural continuity of the indigenous communities. First of all, in the bilingualprograms the respect for the maternal language is a basic principle which has been applied inseveral indigenous communities among which the Shuaras in the Oriente were the pioneers.Seconcdly, several indigenous communities have gone one step further and developed appropriatemethods for bilingualism where the maternal language is the principal and Spanish the secondlanguage. In this way, these communities learn to apply two sets of languages, one forcommunication within the indigenous community and one for the Meztiso and national society.Thirdly, and perhaps most importantly, the participation of the indigenous communities in theeducatilonal processes have not only taught them the value of the mother tongue and showedthem how to apply different languages in different social contexts, the process has also providedthem with opportunities to take responsibility for their own education in a participatory manner(personal communication with DINEIB). Below are a few examples where these lessons apply.
Cachi Alto is part of the "Sistema de Escuelas Indigenas de Cotopaxi (SEI). The center isin Latacunga and has more than 15 years of experience of bilingual education. In the communityof Cachi Alto, the parents are responsible for the selection, the follow-up, evaluation of theteachers and the development of the curriculum. Together with teachers, students and communityleaders the parents control the education system. Another example is the "Instituto Pedag6gicoIntercultural Bilingiie de Canelos" en la Provincia de Pastaza in which the quichua, shuaras andHuaorani communities participate. The bilingual institute in the Province of Morona enrollsmembers from shuar communities and provides programs which concentrates on agriculture,fishing and handicrafts for the tourism industry.
17
Other examples of successful bilingual centers which are mentioned by (DINEIB) are, inthe Oriente, the "Escuela Amauta Nanpi" in Puyo, in the Province of Pastaza and in the Sierrathe following, the school called "Ati Pillahuasu" in the community of Panecillo, ParroquiaQuichinche in Otavalo in the Province of Imbabura; the school called "Silvio Luis Haro" in thePeguche community, Parroquia Miguel Hegas in Otavalo, also in the province of Imbabura; theschool of "Inti Ran" in the Sanjaloma community in the Parroquia of Salasaca in the Province ofTungurahua.
18
IX. References
(Ecuador)
Anuario Estadistico de Educacion Intercultural Bilingue Ministerio de Educacion Cultura,Proyecto EBIVGTZ, DINEIB, 1998
Aulestia, Juan Alfonso. From the Voices of the Oppressed: Cultural and EducationalExperiences of Indigenous People in the Andean Region of Ecuador. 1990. Boston: Universityof Massachusetts.
Cliche, Paul and Fernando Garcia. 1995. Escuela e indianidad en las urbes ecuatorianas. Quito:EB/PRODEC.
Decreto Ejecutivo, Ministerio de Educacion y Cultura. 1992
De Vries, Lucie, et al. 1989. "Pueblos indios, estados y educaci6n." In Luis Enrique L6pez yRuth Moya, ed.. Congreso Internacional de Americanistas. Puno: Programa de Educaci6nBilingue de Puno; Quito: Proyecto de Educaci6n Bilingiue Intercultural del Ecuador; Lima:Programa de Educaci6n Rural Andina.
Encalada E, Garcia F. e Ivarsdotter, K. 1998. "La Participacion de los Pueblos Indigenas yNegros en el Desarrollo del Ecuador". Inter-American Development Bank, Quito
Malliquinga Chisaguano, Silverio. 1999. "Cultura, Politica y Ciudadania. La Interculturalidad"Federacion Ecuatoriana de Indigenas Evangelicos, Quito (BORRADOR)
Ministerio de Educacion y Cultura. 1999. Redes Amigas. Calidad en la educacion rural. UnidadCoordinadora de programas, Banco Interamericano de Desarrollo. Quito.
Moya, Ruth. 1994. Pueblos Indigenas y Educacion No 29-30. Ediciones Abya-Yala, Quito
Ramon Valarezo, Galo. 1993. El Retorno de los Runas, COMUNIDEC
Sancliez Parga, Jos6. 1988. Aprendizaje. conocimiento y comunicaci6n en la comunidad andina.Quito: CAAP.
Secretaria Tecnica del Frente Social, Gobierno de Ecuador and UNIFEM - Regi6n Andina. 1998Retrato de Muieres - Indicadores sociales sobre la situaci6n de las indigenas y campesinas del
Ecuador Rural. Quito.
(Sources for this work include: Sistema Integrado de Indicadores Sociales de Ecuador (SIISE),Sistema Estadistico, Sistema Nacional de Estadisticas Educativas - SINEC, Encuesta deCondiciones de Vida - ECV, 1995 initiated with support from the World Bank and InstitutoNacional de Estadisticas y Censos.)
19
Tinajero, Alfredo y Ponce, Maximo, "La Conquista de la Inteligencia",ESQUEL, PNUD, U. C. Guayaquil y Filanbanco,1996
Torres, Victor Hugo. 1992. La Escuela india : integraci6n o afirmaci6n etnica: la educaci6nindigena vista por sus propios actores. Quito: COMUNIDEC.
Yanez Cossio, Consuelo. 1995. La educaci6n indigena en el Ecuador: estudio introductorio.Quito: Instituto de Capacitaci6n Municipal; Ediciones de la Universidad Politecnica Salesiana.
Yanez Cossio, Consuelo y Lourdes Endara Tomaselli. 1990. Educaci6n bilingue intercultural:una experiencia educativa. Quito: Corporaci6n Educativa Macac, Editorial Abya Yala.
(In General)
Alb6, Xavier. 1998. Quechuas y aymaras. La Paz: Ministerio de Desarrollo Sostenible yPlanificaci6n, Viceministerio de Asuntos Indigenas y Pueblos Originarios, Programa Indigena-PNUD.
Alb6, Xavier. 1995. Bolivia plurilingue : guia para planificadores y educadores. La Paz:UNICEF, CIPCA.
Alb6, Xavier, et al. 1992. "El Quechua en debate: ideologia, normalizaci6n y enseiianza." InJuan Carlos Godenzzi, ed., Estudios y debates regionales andinos. Cusco: Centro de EstudiosRegionales Andinos "Bartolome de las Casas."
Alb6, Xavier. 1981. Idiomas. escuelas y radios en Bolivia. Sucre, Bolivia: ACLO-UNITAS.
Amadio, Massimo and Luis Enrique L6pez. 1993. Educaci6n bilingue intercultural en AmericaLatina: guia bibliogrifica. La Paz: CIPCA, UNICEF.
Barrera de Martinez, Susana. 1985. La educaci6n campesina : testimonio de un conflictocultural. UNICEF.
Cummings, S.M. and Stella Tamayo. Language and Education in Latin America: an Overview.1994. Washington, D.C.: The World Bank.
Govemment of Mexico. The Mexico National-Level Indigenous Peoples Profile. 1999.(http://www.oikos.unam.mx/perfiles/).
"Informe." 1986. Seminario sobre Politicas y Estrategias Educativo-culturales con PoblacionesIndigenas en Lima, Peru. Santiago de Chile: Organizaci6n de las Naciones Unidas para laEducaci6n, la Ciencia y la Cultura, Oficina Regional de Educaci6n para Am6rica Latina y elCaribe.
Larson, Mildred L. and Patricia M. Davis. 1981. Bilingual education : an experience in PeruvianAmazonia Washington, D.C.: Center for Applied Linguistics.
20
L6pez, Luis Enrique. 1995. La educaci6n en areas indigenas de AmericaLatina: apreciacionescomparativas desde la educaci6n bilingue intercultural. Guatemala: Centro de Estudios de laCultura Maya.
L6pez, Luis Enrique. 1995. Educaci6n bilingue intercultural y formaci6n de recursos humanos:lecciones para Bolivia desde la experiencia latinoamericana. Ginebra: Oficina Intemacional deEducaci6n, UNESCO.
"Los Consejos comunales de educaci6n y su propuesta educativa." 1996. I EncuentroComunidad Campesina - Universidad- realizado del 12 al 13 de junio de 1995. Cochabamba,Bolivia: Centro de Comunicaci6n y Desarrollo Andino (CENDA.)
Psacharopoulos, George and Harry Anthony Patrinos. Indigenous People and Poverty in LatinAmerica: An Empirical Analysis. 1994. Washington DC: The World Bank.
Sanchez Parga, Jose. 1990. Bibliografia sobre educaci6n Indigena-Campesina en AmericaLatina. Ottawa, Ont. : International Development Research Centre
Seminario sobre Politicas y Estrategias Educativo-Culturales con Poblaciones Indigen. 1985.
Toro, Beatriz, et al. 1979. Bases para un modelo pedag6gico : USEMI. una indigena deeducaci6n. Bogota: Libreria y Editorial Am6rica Latina.
Ziufiiga, Madeleine and Luis Enrique Lopez, et al. 1991. Educaci6n bilingue interculturalreflexiones y desafios. Lima: FOMCIENCIAS.
Z7iuiiga Castillo, Madeleine. 1988. Educaci6n bilingue : materiales de apoyo para la formaci6ndocente en educaci6n bilingue intercultura Santiago de Chile: UNESCO, OREALC.
Z7uniga, Madeleine, et al. 1987. Educaci6n en poblaciones indigenas : politicas y estrategias enAm6rica Latina. Santiago de Chile: UNESCO, OREALC.
21