report no. 63785-sd - world...
TRANSCRIPT

Report No. 63785-SD
Sudan: Issues in Urban Development
Phase 1 – Overview of the Urban Landscape
November 2011
Urban and Water Unit
Sustainable Development Department
Africa Region
Pub
lic D
iscl
osur
e A
utho
rized
Pub
lic D
iscl
osur
e A
utho
rized
Pub
lic D
iscl
osur
e A
utho
rized
Pub
lic D
iscl
osur
e A
utho
rized
Pub
lic D
iscl
osur
e A
utho
rized
Pub
lic D
iscl
osur
e A
utho
rized
Pub
lic D
iscl
osur
e A
utho
rized
Pub
lic D
iscl
osur
e A
utho
rized

2
Acknowledgements
This paper was prepared by Zara Sarzin and Barjor Mehta, and draws substantially on a background
paper prepared for the World Bank by Dr. Gamal Hamid, Deputy Dean and Head of the Planning and
Urban Design Department, Faculty of Architecture, University of Khartoum, Sudan.
The authors received valuable advice and comments from a World Bank peer review committee
consisting of Christine Kessides (ECSS6), Sylvie Debomy (LCSUW), and Sanjeev Ahluwalia (AFTPR).
The authors also wish to thank the following World Bank colleagues for providing assistance, helpful
comments and contributions: Ian Bannon (AFTCS), Alassane Sow, Isabel Soares, Azza Imam, Maisa
Osman Mukhtar Nurein (AFMSD), Greg Toulmin (AFCET), Bill Bataille, Gabriel Demombynes
(AFTP2), Jack W. Van Holst Pellekaan (IEGCR), Jeeva Perumalpillai-Essex (EASTS), Jaime Biderman
(IEGCS), Junaid Kamal Ahmad, Alex Bakalian, Roland White, Tesfaye Bekalu, Carolina Dominguez-
Torres, Solomon Alemu, Gunther Gutknecht, Jerry Chen, Marie Claire Li-Tin-Yue (AFTUW), Tatiana
Sviridova, Michael Lokshin (DECPI), Asif Faiz (SASDT), George Banjo (ECSS5), Nouma Dione
(CICAF), Negede Lewi, Tesfamichael Mitiku, Mohamed Beshir (AFTTR), Mohamed Osman Hussein
(AFTAR), Maisoun Badawi (AFTFE) and Akwii Anne Kennox (AFMJB).
The authors are also grateful to the insights, comments and contributions generously provided by Eng.
Sabiel A. Rasoul Ishag, Secretary General, National Council for Physical Development and Dr. Sharaf
Bannaga.
3
Contents
Acronyms and Abbreviations ..................................................................................................................... 5
I. Introduction ......................................................................................................................................... 6
II. Urbanization in Sudan...................................................................................................................... 7
A. Historical Evolution of the Spatial System in Sudan ................................................................... 7
B. Contemporary Demographic and Urbanization Trends ............................................................... 9
C. Population Growth in Nyala and Khartoum: Insights from Case Studies ................................. 19
D. Economic Contribution of Urban Areas .................................................................................... 29
E. Policy Implications .................................................................................................................... 31
III. Legal and Institutional Composition of Sudan‘s Urban areas ....................................................... 34
A. Constitutional and Legal Basis for Local Government.............................................................. 34
B. Framework for Local Government ............................................................................................ 36
C. Roles and Responsibilities for Service Delivery ....................................................................... 38
D. Local Government Financing .................................................................................................... 40
E. Urban Land and Housing ........................................................................................................... 41
F. Policy Implications .................................................................................................................... 44
IV. Conclusions and Recommendations .............................................................................................. 46
A. Priorities for the Urban and Local Government Sector ............................................................. 46
B. Options for Future World Bank Engagement ............................................................................ 47
ANNEX A: Khartoum Case Study ........................................................................................................... 49
A. Population Growth ..................................................................................................................... 49
B. Urban Poverty ............................................................................................................................ 51
C. Institutional Arrangements......................................................................................................... 51
D. Land, Housing and Urban Planning ........................................................................................... 54
E. Urban Infrastructure ................................................................................................................... 57
F. Municipal Finance ..................................................................................................................... 61
ANNEX B: Nyala Case Study .................................................................................................................. 63
A. Population Growth ..................................................................................................................... 63
B. Urban Economy ......................................................................................................................... 64
C. Institutional Arrangements......................................................................................................... 65
D. Land, Housing and Urban Planning ........................................................................................... 67
E. Urban Infrastructure ................................................................................................................... 69
F. Municipal Finance ..................................................................................................................... 72

4
Tables
Table 1: Population Density...................................................................................................................... 10 Table 2: Population, Population Growth Rate and Population Density by State...................................... 10 Table 3: Population of Sudan from 1956 to 2008 and Intercensal Growth Rates .................................... 12
Table 4: Estimates of Urban Population Growth ...................................................................................... 13 Table 5: City Population and Population Growth Rates ........................................................................... 14 Table 6: Components of Urban Population Growth in Sudan .................................................................. 15 Table 7: Estimated Numbers of IDPs by Location ................................................................................... 15 Table 8: Comparison of Population Growth Rates ................................................................................... 19
Table 9: A Framework for Urbanization Policies ..................................................................................... 32 Table 10: Constitutional Powers and Functions of National and State Governments .............................. 39 Table 11: Housing Classification System ................................................................................................. 44 Table 12: Population Growth in Greater Khartoum ................................................................................. 49
Table 13: Khartoum Projected Population Growth .................................................................................. 51 Table 14: Population of Khartoum State Localities .................................................................................. 52
Table 15: Roles and Responsibilities for Service Delivery in Khartoum ................................................. 53 Table 16: Khartoum Master Plans ............................................................................................................ 55
Table 17: Geographical Expansion of Greater Khartoum ........................................................................ 56 Table 18: State of Urban Infrastructure in Khartoum ............................................................................... 57 Table 19: 2009 Khartoum State Budget.................................................................................................... 61
Table 20: 2009 Budget for Khartoum Localities ...................................................................................... 62 Table 21: Population Growth in Nyala ..................................................................................................... 63
Table 22: Roles and Responsibilities for Service Delivery in Nyala ........................................................ 67 Table 23: Supply of Residential Plots in Nyala ........................................................................................ 68 Table 24: Land Utilization in Nyala, 1997 ............................................................................................... 69
Table 25: State of Urban Infrastructure in Nyala...................................................................................... 69
Boxes
Box 1: Density and Economic Growth ..................................................................................................... 11
Box 2: Large-Scale Regularization of Informal Settlements in Khartoum............................................... 17 Box 3: Chronology of Constitutional and Legislative Developments Shaping the Local Government
System in Sudan ........................................................................................................................................ 35

5
Figures
Figure 1: Urbanization and Economic Growth ......................................................................................... 11 Figure 2: Sudan Urban Hierarchy ............................................................................................................. 13 Figure 3: Consumption per person per month (SDG) ............................................................................... 20
Figure 4: Consumption per person per month (share in %) ...................................................................... 21 Figure 5: Poverty Incidence ...................................................................................................................... 21 Figure 6: Main Source of Livelihood (percentage population) ................................................................ 22 Figure 7: Main Source of Livelihood—Poor vs. Non Poor ...................................................................... 23 Figure 8: Access to Improved Drinking Water (percentage population) .................................................. 23
Figure 9: Time to Water Source (minutes) ............................................................................................... 24 Figure 10: Main Type of Toilet Facility (percentage population) ............................................................ 24 Figure 11: Solid Waste Disposal Methods (percentage population) ........................................................ 25 Figure 12: Energy Source for Lighting (percentage population) .............................................................. 25
Figure 13: Energy Source for Cooking (percentage population) .............................................................. 26 Figure 14: Housing Characteristics (percent of population) ..................................................................... 26
Figure 15: Tenure Status (percentage population) .................................................................................... 27 Figure 16: Literacy Rate (percentage population) .................................................................................... 27
Figure 17: Literacy Rate—Poor and Non Poor (percentage population) ................................................. 28 Figure 18: School Attendance (percentage population) ............................................................................ 28 Figure 19: GDP Growth by Sector............................................................................................................ 29
Figure 20: Organizational and Functional Structure of Localities (Khartoum) ........................................ 36 Figure 21: Institutional Arrangements in Khartoum ................................................................................. 53
Figure 22: Institutional Arrangements in Nyala ....................................................................................... 66
ACRONYMS AND ABBREVIATIONS
CPA Comprehensive Peace Agreement
GDP Gross Domestic Product
GoS Government of Sudan
IDP Internal Displaced Person/People
JAM Joint Assessment Mission
MDTF Multi-Donor Trust Fund
MPPPU Ministry of Physical Planning and Public Utilities
NBHS National Baseline Housing Survey
SDG Sudanese Pound
SPLA Sudan People‘s Liberation Army
SPLM Sudan People's Liberation Movement
WES Water and Environmental Sanitation Program

6
I. INTRODUCTION
1. This study responds to the need for information and analysis on the urban sector in Sudan,
to inform the Bank’s policy dialogue with the Government of Sudan (GoS) on urban and local
government issues, and to inform the design of future Bank assistance. Despite the growing
demographic weight of urban areas in Sudan and the importance of local government as a platform for
service delivery, there is fragmented knowledge of the urban sector in Sudan. In this context, the Bank
initiated an exercise to begin to document the key issues in urban and local government development
and to identify critical challenges and opportunities presented by Sudan's rapid urbanization. This work
seeks to answer questions such as: What are the urban demographics trends? What are the legal and
institutional arrangements for local government? How could local government be better supported to
enhance service delivery and respond adequately to the challenges posed by urbanization? What is the
situation with regard to urban infrastructure, services and land? And, how can urban areas better cope
with poverty?
2. The first phase of this analytical exercise, which is the focus of this report, develops an
overview of the urban landscape. The report is structured as follows: Section II describes the evolution
of the spatial system in Sudan and highlights key urbanization patterns and trends; Section III provides
an overview of the legal, institutional and financial composition of Sudan‘s urban areas; and Section 80
outlines the key policy issues and recommendations. The report also draws on in-depth case studies of
Nyala and Khartoum, which are included as Annexes to the report.
3. The depth of analysis is limited by the scarcity of accessible, reliable, and comprehensive
data on the urban sector. A significant impediment to the completion of a detailed analysis of urban
issues has been the scarcity of reliable data. Some detailed data was obtained from the 2009 National
Baseline Housing Survey (NBHS), from which urban and rural profiles of households were prepared.
However, it was not possible to obtain detailed data from the 2008 census, which would have enabled a
more thorough, quantitative analysis of demographic trends. Rather, analysis was limited to an
examination of summary data (―priority tables‖) from the census, the results of which have been
challenged by many researchers and population experts, particularly population statistics for Khartoum
and South Darfur. Moreover, the data from the case studies was scanty, particularly on municipal
budgets and plans. Further field work would be required to arrive at robust estimates of the share of
national expenditures at national, state and locality level, the level of fiscal transfers and own source
revenues, and the allocation of local expenditures; this report provides only a descriptive overview of
key issues pertaining to municipal planning and finances.

7
II. URBANIZATION IN SUDAN1
A. Historical Evolution of the Spatial System in Sudan
4. Several factors have shaped the evolution of the spatial system in the Sudan. Historically,
the key factors have included: (a) the distribution of natural resources; (b) intercontinental trade and
pilgrimage routes; (c) the evolution of administrative systems; (d) protracted periods of war and conflict;
(e) the development of transportation networks; (f) the development of industry and expansion of
export-oriented agriculture; and (g) the growth of oil revenues from the late 1990s.
5. The spatial development of Sudan corresponds with the distribution of natural resources,
including water and fertile land. Settlements developed along two main axes. The North-South axis
along the river Nile corridor and its main tributaries. And the East-West axis along the high-rainfall
savannah belt, extending from the Butana Plains in the east to Southern Kordofan in central Sudan.
6. Prior to the 18th century, urban settlements typically served as market towns for
agricultural hinterlands. Intercontinental trade and pilgrimage routes were essential to the prosperity
of these market towns. There were other towns that served as seats of administration for kingdoms and
sheikdoms (e.g. El Fasher, Shendi, Sennar and Old Dongola). While some market towns (e.g. Kobe, Goz
Ragab and Ed Debba) lost prominence in the 20th century as trade routes became less significant, the
majority continued to remain important urban areas. Many new villages and towns also emerged in this
period as a consequence of the proliferation of Muslim sub-sects (tariqa). Spiritual leaders of some sub-
sects relocated to new settlements away from their original sheikhs.
7. Today’s urban settlements are also a legacy of the administrative and military systems
established during the Ottoman Empire. From the mid-1820s until the mid-1870s, most of Sudan,
including the northern region, Gezira, Kordofan, the southern region and Darfur, was annexed to the
Ottoman Empire. Sennar was chosen as the seat of administration because of its central strategic
location. However due to frequent epidemics in Sennar, in 1833 the seat of administration was moved to
a newly created capital, Khartoum. Old market towns such as Dongola, Berber, El-Obeid and El Fasher
gained more prominence as new seats of provincial administration. New towns, such as Kassala,
Medani, Fashoda, Daym Zubair, and Gondokoro, developed around military garrisons and formed the
remainder of provincial capitals. The last three towns lie in the southern region which was incorporated
with the rest of the Sudan for the first time in 1871. In 1886 Khartoum was completely destroyed by the
Mahdist forces that defeated the Ottomans and moved the capital across the Nile to Omdurman, which
witnessed an influx of people who migrated to it from different parts of the country to join the Mahdist
army. By 1886 Omdurman had 150,000 people making it the largest city in Sudan at the time.
8. The expansion of railway networks was essential to linking and opening up the vast and
rich Sudanese lands to large-scale exploitation. In 1899 a railway linking Khartoum to Wadi Halfa in
the north, and consequently to Egypt, was completed and in 1906 a link was built from Atbara to the
port of Suakin. In 1909, a line through Gezira linking Khartoum to Kosti via Medani and Sennar was
built, and the same line was extended westward to El-Obeid in 1912. In 1924 yet another line was built
between Sennar, Kassala and Port Sudan. In this way the major network of railways was completed and
the towns along the railway line assumed more prominence.
1 Unless otherwise indicated, references in this section to ―Sudan‖ refer to both North and South Sudan combined.

8
9. Substantial changes in the urban system took place during the Anglo-Egyptian
colonization, from 1898 to 1955. The towns of Kassala, Medani, Sennar, El-Obeid, Wadi Halfa,
Berber, El Fasher, Dongola, Fashoda and Deim Zubair (renamed Bourouh) continued to serve as
provincial administrative centers, and as regional market towns. The first six towns became even more
important as trade depots after the construction of railroads. Furthermore, new towns were founded to
perform other functions. Beside Port Sudan, which became the principal sea port for the country, Atbara
was created to serve as the headquarters for the Sudan Railway Corporation. It became extremely
important and gradually displaced Berber as the principal center of trade in the northern region.
Khartoum North was another key town founded during this period as an industrial town. It has since
become the largest industrial center in Sudan. In the western region new towns (such as Kadogli, and
Rashad) were developed as administrative and commercial centers. Amongst the towns that developed
as a consequence of the railroads were El-Rahad, Um Ruwaba, Karima, and Abu Hamad.
10. Post-independence, the construction of major rail links continued to influence the spatial
development of the country. Although Sudan became completely independent in January 1956, the
three governments that ruled from 1956 until 1969 continued to implement projects started by the
colonial administration including the extension of railroads and expansion of commercial agriculture. In
1958 a railway line was extended from near El-Obeid to Nyala in the far west providing vital access to
Darfur.
11. The expansion of road networks has played a significant role in the spatial development of
the country. In the second half of the 1960s, Sudan‘s first highway was constructed. This 187 kilometer
highway links Khartoum, the main industrial and market center, with Gezira the production hub, and has
significantly influenced the growth of towns along its length (e.g. El-Kamlin, El-Masid and Hassaheisa).
Further highways have since been built. Undoubtedly, the most important highway completed since then
is Medani-Gedaref-Kassala-Port Sudan highway, which connects the key agricultural areas of Gezira,
Rahad, Khashm el-Girba, and Gedaref with Port Sudan. Completed in the late 1970s, and connected to
the Khartoum-Medani highway, this highway is still the principal artery in Sudan. Other important
highways completed since 1970 are the Medani-Sennar-Kosti highway, the Nyala-Kas-Zalingi highway
in Darfur, the Northern Artery (Shirian Al-Shamal) that links Khartoum with major cities in northern
Sudan through the northwestern desert. Another important highway is the Atbara-Haya-Port Sudan
highway that shortened the length of a trip between Khartoum and Port Sudan by about one third.
Today, the length of asphalt-paved highways in Sudan is about 4,340 kilometers (Central Bureau of
Statistics 2006). Apart from these asphalt-paved highways, several gravel highways have been built
since colonial time, with a total length of about 2876 kilometers. The impact of these highways on
urbanization and the spatial development of Sudan cannot be overemphasized. Nevertheless, the total
length of highways in Sudan is still insignificant when compared with its vast area. This has been one of
the major impediments to development and communication.
12. In addition, the construction of dams and the expansion of commercial agriculture has
fueled the growth of several urban settlements. In particular, five dams along the Nile (Sennar, Jebel
Aulia, Khashm el-Girba, Roseires and Merowi) and large-scale agricultural schemes (Gezira, Managil,
Rahad, Khashm el-Girba, Kenana, etc.) were established mostly in central and northern Sudan to grow
crops oriented for export and local consumption. These schemes were important in establishing new
human settlements and in re-distributing population by attracting tens of thousands of migrants and
seasonal labor. New towns such as El-Fau (headquarters of the Rahad Scheme), Kenana, New Halfa,
and Khashm el-Girba, etc. were added to the urban system as a consequence of these schemes.

9
13. The development of industry has been a further factor in the spatial development of Sudan.
The share of manufacturing in the Gross Domestic Product (GDP) increased from one percent in 1956 to
seven percent in 1966/67 to 13.7 percent in 1973/74. However, the geographic distribution of
manufacturing has not been evenly distributed over the country. Sixty-seven percent of the privately-
owned plants recorded by the Ministry of Industry in 1980 were located in Greater Khartoum and
another 13 percent were located in Gezira. This concentrated pattern of industry has affected the spatial
structure of Sudan by attracting people from rural areas to industrial centers.
14. The discovery of oil reserves and the growth of oil revenues from the late 1990s have
impacted the development of the oil-producing border region. Oil production in Sudan began in the
late 1990s. Exports grew rapidly from 1999, when an export pipeline running from central Sudan to Port
Sudan was completed. Whereas about 80 percent of Sudan‘s oil reserves are found in the South, the
country‘s refining and export infrastructure is concentrated in the North with refineries in Khartoum,
Port Sudan and El-Obeid, and export infrastructure in Port Sudan. The oil boom has also impacted the
development of the oil-producing border region, with investments in extraction and transportation
infrastructure. Oil-rich areas have also experienced displacement of local populations with the opening
of concessions for oil exploration (Norwegian Refugee Council 2005).
B. Contemporary Demographic and Urbanization Trends
15. Sudan’s population density is relatively low compared to other countries in the region. With
a population of 30.9 million people in 2008 (Central Bureau of Statistics 2009) spread over a large
territory, Sudan has a low population density of about 17 people per square kilometer, compared to 36
people per square kilometer for Sub-Saharan Africa, which is in turn low compared to other regions
(Table 1).
16. In addition, Sudan’s population is not uniformly distributed, with more than 70 percent of
the population living in roughly one-third of the total land area. Population density varies widely
across states (Table 2). Approximately 83 percent of the population is concentrated in a fertile central
band accounting for almost half of the land area of the country, encompassing most of the states of
Kassala, Khartoum, Al-Gezira, Gedaref, Sennar, Blue Nile, White Nile, Northern Kordofan, Southern
Kordofan and Western and Southern Darfur. Khartoum is the most densely populated state, with a
population density 15 times the average density for the country as a whole. And approximately 17
percent of the population lives in a barren northern band that includes the Northern, River Nile, Northern
Darfur, and the Red Sea States, and that accounts for over 50 percent of the land area of Sudan.
17. Empirical evidence shows that economic growth and density go together. Sudan can
overcome its low population density through agglomeration, which has potential benefits for both urban
and rural residents (Box 1).

10
Table 1: Population Density
Year
Estimated Population
(thousands) [1]
Population Density (population per sq. km)
Sudan [2] Sub-Saharan Africa [3] Africa
1950 9,190 4 8 7
1955 10,333 4 8 8
1960 11,683 5 9 9
1965 13,214 5 11 11
1970 15,039 6 12 12
1975 17,493 7 14 14
1980 20,509 8 16 16
1985 24,052 10 19 18
1990 27,091 11 21 21
1995 30,841 12 24 24
2000 34,904 14 28 27
2005 38,698 15 31 30
2010 43,192 17 36 34
2015 47,730 19 40 38
2020 52,309 21 45 42
2025 56,688 23 49 46
2030 60,995 24 54 50
2035 65,129 26 59 54
2040 69,018 28 63 58
2045 72,613 29 68 62
2050 75,884 30 72 66 Note: [1] Estimates as of 2008; [2] Figures for Sudan include both Sudan and South Sudan; [3] Excludes North African
Countries (i.e. Morocco, Algeria, Libya, Tunisia, Egypt and Djibouti)
Source: Population Division of the Department of Economic and Social Affairs of the United Nations Secretariat, World
Population Prospects: The 2008 Revision, http://esa.un.org/unpp.
Table 2: Population, Population Growth Rate and Population Density by State
State 1993 Census 2008 Census
Annual
Growth (%) Area (km2)
Density
(people/km2)
Khartoum 3,512,144 5,274,321 2.7% 22,142 238
Al-Gezira 2,715,605 3,575,280 1.8% 23,373 153
White Nile 1,227,024 1,730,588 2.3% 30,411 57
Kassala 1,234,562 1,789,806 2.5% 36,710 49
Sennar 977,650 1,285,058 1.8% 37,844 34
Southern Darfur 2,152,499 4,093,594 4.3% 127,300 32
Al-Gadarif 1,148,262 1,348,378 1.1% 75,263 18
Blue Nile 512,845 832,112 3.2% 45,844 18
Western Darfur 1,329,832 1,308,225 -0.1% 79,460 16
Northern Kordofan 1,944,000 2,920,992 2.7% 220,000 13
River Nile 781,583 1,120,441 2.4% 122,123 9
Southern Kordofan 1,379,000 1,406,404 0.1% 155,000 9
Northern Darfur 1,155,872 2,113,626 4.0% 296,420 7
Red Sea 684,271 1,396,110 4.8% 218,887 6
Northern 511,693 699,065 2.1% 348,765 2
Total Sudan 21,266,641 30,894,000 2.5% 1,840,687 17
Source: 2008 Priority Census Tables, Thomas Brinkhoff: City Population, http://www.citypopulation.de
11
Box 1: Density and Economic Growth
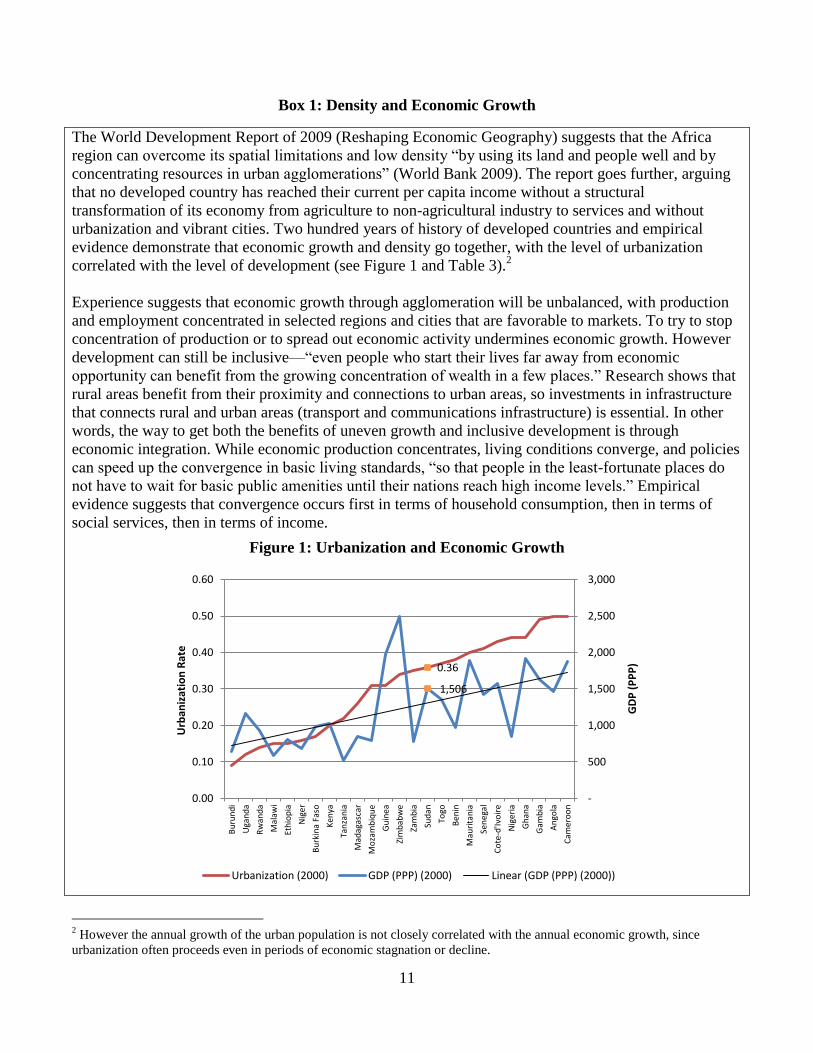
The World Development Report of 2009 (Reshaping Economic Geography) suggests that the Africa
region can overcome its spatial limitations and low density ―by using its land and people well and by
concentrating resources in urban agglomerations‖ (World Bank 2009). The report goes further, arguing
that no developed country has reached their current per capita income without a structural
transformation of its economy from agriculture to non-agricultural industry to services and without
urbanization and vibrant cities. Two hundred years of history of developed countries and empirical
evidence demonstrate that economic growth and density go together, with the level of urbanization
correlated with the level of development (see Figure 1 and Table 3).2
Experience suggests that economic growth through agglomeration will be unbalanced, with production
and employment concentrated in selected regions and cities that are favorable to markets. To try to stop
concentration of production or to spread out economic activity undermines economic growth. However
development can still be inclusive—―even people who start their lives far away from economic
opportunity can benefit from the growing concentration of wealth in a few places.‖ Research shows that
rural areas benefit from their proximity and connections to urban areas, so investments in infrastructure
that connects rural and urban areas (transport and communications infrastructure) is essential. In other
words, the way to get both the benefits of uneven growth and inclusive development is through
economic integration. While economic production concentrates, living conditions converge, and policies
can speed up the convergence in basic living standards, ―so that people in the least-fortunate places do
not have to wait for basic public amenities until their nations reach high income levels.‖ Empirical
evidence suggests that convergence occurs first in terms of household consumption, then in terms of
social services, then in terms of income.
Figure 1: Urbanization and Economic Growth
2 However the annual growth of the urban population is not closely correlated with the annual economic growth, since
urbanization often proceeds even in periods of economic stagnation or decline.
0.36
1,506
-
500
1,000
1,500
2,000
2,500
3,000
0.00
0.10
0.20
0.30
0.40
0.50
0.60
Bu
run
di
Uga
nd
a
Rw
and
a
Mal
awi
Eth
iop
ia
Nig
er
Bu
rkin
a Fa
so
Ken
ya
Tan
zan
ia
Mad
agas
car
Mo
zam
biq
ue
Gu
inea
Zim
bab
we
Zam
bia
Sud
an
Togo
Ben
in
Mau
rita
nia
Sen
egal
Co
te-d
'Ivo
ire
Nig
eria
Gh
ana
Gam
bia
An
gola
Cam
ero
on
GD
P (
PP
P)
Urb
aniz
atio
n R
ate
Urbanization (2000) GDP (PPP) (2000) Linear (GDP (PPP) (2000))

12
18. Consistent with trends across the Africa region, Sudan is urbanizing rapidly. According to
census data, the urban population grew from only 8.3 percent of the total population (854,000 people) in
1955/56 to approximately 24.5 percent (6.3 million people) in 1993 and 43 percent (16.8 million people)
in 2008 (Table 3). During the past decade, Sudan‘s urban population has grown at a rate of four percent
per annum, compared with 2.8 percent per annum for the population as a whole (Population Division of
the Department of Economic and Social Affairs of the United Nations Secretariat 2009).
Table 3: Population of Sudan from 1956 to 2008 and Intercensal Growth Rates
Census
Total
Population
(thousands)
Urban
Population
(thousands)
Percentage
Urban
Intercensal
Period
Total Annual
Growth Rate
(%)
Urban
Annual
Growth Rate
(%)
1955/56 10,263 854 8.3%
1973 14,819 2,606 17.6% 1955-73 2.13% 6.5%
1983 19,093 4,154 21.8% 1973-83 2.57% 4.7%
1993 25,588 6,275 24.5% 1983-93 2.88% 4.1%
2008 39,154 16,836 43% 1993-2008 2.84% 6.6% Source: 5
th Sudan Population and Housing Census (2008); UN-HABITAT State of African Cities (2008).
19. The urban population is expected to grow at more than twice the rate of the population as a
whole. Urbanization in the Sudan is expected to continue at a rapid rate according to UN population
projections (see Table 4). By 2030 it is estimated that 54.5 percent of the population (33 million people)
will be living in urban areas. The rapid rate of urbanization stands in contrast with the rest of the North
Africa sub-region3, where the majority of the population already lives in urban areas and where
urbanization has largely subsided in the last decade (UN-HABITAT 2010, 3).
20. Sudan’s urban hierarchy is characterized by one large primate city, eight cities with
populations greater than 200,000 people, and a long tail of smaller urban areas. The number of
urban areas with more than 100,00 people has increased from three in 1973, to seven in 1983, to nine in
1993 to 15 in 2003. The Greater Khartoum area (i.e. Omdurman, Khartoum and Khartoum North) is the
largest urban centre in Sudan with a population of 4.3 million people in 2008, accounting for over a
quarter of the urban population and a tenth of the total population. It is more than eight times the size of
the second largest city, Nyala. Together, the ten largest cities in the North accommodate 45 percent of
the urban population, and 22 percent of the total population (Figure 2).
3 Algeria, Egypt, the Libyan Arab Jamahiriya, Morocco, Sudan, Tunisia and Western Sahara.

13
Table 4: Estimates of Urban Population Growth
Year
Total
population
(thousands)
Urban
population
(thousands)
Percentage
urban (%) Period
Total
annual
growth
rate (%)
Urban
annual
growth
rate (%)
Rural
annual
growth
rate (%)
1950 9,190 627 6.8
1955 10,333 887 8.6 1950-1955 2.34 6.93 1.96
1960 11,683 1,256 10.7 1955-1960 2.46 6.95 1.98
1965 13,214 1,767 13.4 1960-1965 2.46 6.84 1.87
1970 15,039 2,485 16.5 1965-1970 2.59 6.82 1.85
1975 17,493 3,314 18.9 1970-1975 3.02 5.76 2.44
1980 20,509 4,093 20.0 1975-1980 3.18 4.23 2.93
1985 24,052 5,380 22.4 1980-1985 3.19 5.47 2.58
1990 27,091 7,211 26.6 1985-1990 2.38 5.86 1.25
1995 30,841 9,393 30.5 1990-1995 2.59 5.29 1.52
2000 34,904 11,661 33.4 1995-2000 2.47 4.32 1.61
2005 38,698 14,128 36.5 2000-2005 2.06 3.84 1.11
2010 43,192 17,322 40.1 2005-2010 2.20 4.08 1.03
2015 47,730 20,889 43.8 2010-2015 2.00 3.74 0.74
2020 52,309 24,804 47.4 2015-2020 1.83 3.44 0.49
2025 56,688 28,924 51.0 2020-2025 1.61 3.07 0.19
2030 60,995 33,267 54.5 2025-2030 1.46 2.8 -0.03
2035 65,129 37,754 58.0 2030-2035 1.31 2.53 -0.26
2040 69,018 42,322 61.3 2035-2040 1.16 2.28 -0.5
2045 72,613 46,886 64.6 2040-2045 1.02 2.05 -0.74
2050 75,884 51,365 67.7 2045-2050 0.88 1.82 -0.96 Source: Population Division of the Department of Economic and Social Affairs of the UN Secretariat, World Population
Prospects: The 2008 Revision and World Urbanization Prospects: The 2009 Revision, http://esa.un.org/wup2009/unup/.
Figure 2: Sudan Urban Hierarchy
Note: Includes only cities above 100,000 inhabitants, Source: Thomas Brinkhoff: City Population,
http://www.citypopulation.de
-
200,000
400,000
600,000
800,000
1,000,000
1,200,000
1,400,000
1,600,000
1,800,000
2,000,000
14
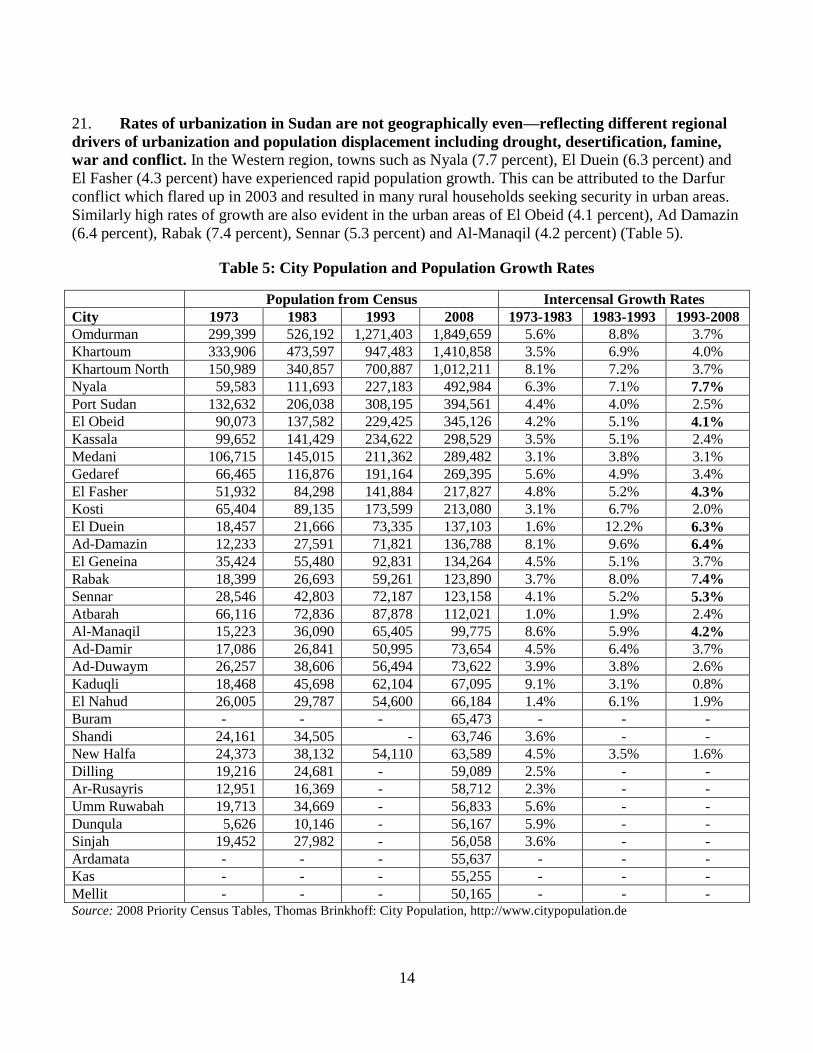
21. Rates of urbanization in Sudan are not geographically even—reflecting different regional
drivers of urbanization and population displacement including drought, desertification, famine,
war and conflict. In the Western region, towns such as Nyala (7.7 percent), El Duein (6.3 percent) and
El Fasher (4.3 percent) have experienced rapid population growth. This can be attributed to the Darfur
conflict which flared up in 2003 and resulted in many rural households seeking security in urban areas.
Similarly high rates of growth are also evident in the urban areas of El Obeid (4.1 percent), Ad Damazin
(6.4 percent), Rabak (7.4 percent), Sennar (5.3 percent) and Al-Manaqil (4.2 percent) (Table 5).
Table 5: City Population and Population Growth Rates
Population from Census Intercensal Growth Rates
City 1973 1983 1993 2008 1973-1983 1983-1993 1993-2008
Omdurman 299,399 526,192 1,271,403 1,849,659 5.6% 8.8% 3.7%
Khartoum 333,906 473,597 947,483 1,410,858 3.5% 6.9% 4.0%
Khartoum North 150,989 340,857 700,887 1,012,211 8.1% 7.2% 3.7%
Nyala 59,583 111,693 227,183 492,984 6.3% 7.1% 7.7%
Port Sudan 132,632 206,038 308,195 394,561 4.4% 4.0% 2.5%
El Obeid 90,073 137,582 229,425 345,126 4.2% 5.1% 4.1%
Kassala 99,652 141,429 234,622 298,529 3.5% 5.1% 2.4%
Medani 106,715 145,015 211,362 289,482 3.1% 3.8% 3.1%
Gedaref 66,465 116,876 191,164 269,395 5.6% 4.9% 3.4%
El Fasher 51,932 84,298 141,884 217,827 4.8% 5.2% 4.3%
Kosti 65,404 89,135 173,599 213,080 3.1% 6.7% 2.0%
El Duein 18,457 21,666 73,335 137,103 1.6% 12.2% 6.3%
Ad-Damazin 12,233 27,591 71,821 136,788 8.1% 9.6% 6.4%
El Geneina 35,424 55,480 92,831 134,264 4.5% 5.1% 3.7%
Rabak 18,399 26,693 59,261 123,890 3.7% 8.0% 7.4%
Sennar 28,546 42,803 72,187 123,158 4.1% 5.2% 5.3%
Atbarah 66,116 72,836 87,878 112,021 1.0% 1.9% 2.4%
Al-Manaqil 15,223 36,090 65,405 99,775 8.6% 5.9% 4.2%
Ad-Damir 17,086 26,841 50,995 73,654 4.5% 6.4% 3.7%
Ad-Duwaym 26,257 38,606 56,494 73,622 3.9% 3.8% 2.6%
Kaduqli 18,468 45,698 62,104 67,095 9.1% 3.1% 0.8%
El Nahud 26,005 29,787 54,600 66,184 1.4% 6.1% 1.9%
Buram - - - 65,473 - - -
Shandi 24,161 34,505 - 63,746 3.6% - -
New Halfa 24,373 38,132 54,110 63,589 4.5% 3.5% 1.6%
Dilling 19,216 24,681 - 59,089 2.5% - -
Ar-Rusayris 12,951 16,369 - 58,712 2.3% - -
Umm Ruwabah 19,713 34,669 - 56,833 5.6% - -
Dunqula 5,626 10,146 - 56,167 5.9% - -
Sinjah 19,452 27,982 - 56,058 3.6% - -
Ardamata - - - 55,637 - - -
Kas - - - 55,255 - - -
Mellit - - - 50,165 - - - Source: 2008 Priority Census Tables, Thomas Brinkhoff: City Population, http://www.citypopulation.de

15
22. Natural population increases account for the lion’s share of urban population growth in
Sudan. There are three sources of urban population growth by three sources: (a) natural population
increase among existing urban residents (births less deaths); (b) net migration; and (c) change of urban
settlement boundaries (i.e. reclassification of formerly rural areas as urban). In the case of Sudan, natural
population growth accounts for the majority of urban growth due to high fertility rates in Sudan (6.4
children per mother). Net migration to urban areas accounts for close to 40 percent of urban growth.
Changes in urban boundaries make a relatively small contribution to urban growth (about 5 percent)
(Table 6). Migration to urban areas can be attributed to strong pull factors in urban areas such as the
relative availability of jobs, services and security, coupled with the corresponding push factors in rural
areas (lack of opportunities, services and insecurity). Further, research suggests that rural and urban
boundaries are artificial distinctions to households in Africa, which often maintain footholds in both
rural and urban environments by ―distributing members across different spatial and economic activities
to diversify income sources and reduce risk‖ (Kessides 2006).
Table 6: Components of Urban Population Growth in Sudan
Intercensal Period
1955/56-1973 1973-1983 1983-1993 1993-2008
Natural Increase (%) 45 63 56
Not Available
Net Migration (%) 37 32 39
Change of Urban Boundaries (%) 18 5 5
Total (%) 100 100 100 Note: Figures include both Sudan and South Sudan
Source: Background Paper (Hamid 2009)
23. Major drivers of net migration are conflict, insecurity, drought and famine, which resulted
in large-scale population displacements. Drought and famine reached their peak in 1983/84
particularly in Northern Darfur, Northern Kordofan, White Nile and the Red Sea states where people
depend on rains for seasonal cultivation and livestock rearing and where many people still practice a
nomadic way of life.4 Sudan‘s numerous conflicts—in particular the protracted conflict between the
North and South, and the conflict in Darfur—have resulted in one of the largest internally displaced
populations in the world (Table 7)5.
Table 7: Estimated Numbers of IDPs by Location
Location January 2010 January 2011
Darfur 2.7 million 1.9 million
Khartoum 1.7 million 1.5 – 1.7 million plus unknown
number in other states of North
Transitional
areas
60,261 80,000
Eastern States 68,000(Kassala); (420,000 in Eastern States as of December 2008) Source: IDMC (2011)
4 In 1986, the ILO estimated that the number of people affected by droughts was 8.4 million people, of which 1.8 million
people were displaced. 5 Estimates of IDPs can vary wildly across published sources.

16
24. The protracted war in South Sudan resulted in large-scale population displacement to
Sudan. After Sudan gained Independence in 1956, an armed conflict broke out between the North and
South, ending in 1972. In 1983 a second wave of civil war began between the Khartoum government
and the Sudan People‘s Liberation Army (SPLA). It was brought to an end by the Comprehensive Peace
Agreement (CPA) of January 2005, which paved the way for self-governance and autonomy in Southern
Sudan. Urban areas experienced both inwards and outwards migration as a consequence of the war.
During some intervals, rural households moved to urban areas for greater physical security and access to
scarce food supplies and services, while at other times when urban areas in South Sudan were under
attack, urban households migrated to neighboring countries and to the North (Wakely 2005).
25. The conflict in the Darfur region resulted in massive destruction and large scale
displacement, which has significantly accelerated urbanization rates. Just as the conflict in South
Sudan was about to be settled, another conflict erupted in Darfur in 20036. The counter-insurgency was
pursued most vigorously from mid 2003 until early 2004, resulting in massive destruction and
displacement. Estimates suggest that by January 2009 as many as 2.7 million of Darfur‘s six million
population were internally displaced, and a further 2 million people were directly affected by conflict.
The numbers of displaced continues to increase as a consequence of direct attacks, insecurity and the
loss of livelihoods which makes it difficult for people to survive in their rural homes (Young 2009, 8). In
the first four months of 2010 a further 100,000 people newly displaced as a consequence of clashes
between rebel and government forces in Jebel Marra (IDMC 2010). The conflict-affected population of
Darfur includes IDPs in camp settings, IDPs in mixed IDP/host communities (rural and urban), and non-
displaced residents (rural and urban) (Young 2009). Most IDPs have taken refuge in large urban areas in
Darfur, such as El Fasher, Nyala and Al-Gineina, and many have moved eastwards to central Sudan and
to Greater Khartoum to settle in IDP camps and in informal settlements. In 2003, Darfur‘s urbanization
rate was relatively low (approximately 18 percent), but as a result of the conflict, Darfur‘s urban areas
have almost doubled in size, and the region is estimated to be 35 percent urbanized. Including the
numbers of displaced, the rate of urbanization is estimated at over 50 percent (de Waal, Making Sense of
Sudan: Do Darfur IDPs Have an Urban Future 2008) and possibly as high as 60 percent (UN-HABITAT
2009).
26. A large proportion of IDPs have settled in and around Khartoum. Estimates of the number
of IDPs in Khartoum vary widely—for example the SPLM maintain that that there are two million South
Sudanese in Khartoum, while only 500,000 are reported in the 2008 census. A 2008 survey conducted
by Tufts University and the Internal Displacement Monitoring Centre (IDMC) suggest that there were
between 1.3 and 1.7 million IDPs in Khartoum, mostly from the South. According to a GoS study of
IDPs in Khartoum released in April 2010, about 624,000 IDPs were living in Khartoum by the end of
2009, including those who had returned to the south but since returned to Khartoum after failing to re-
establish themselves in their places of origin, and an estimated 1.5 million IDPs had already integrated
in Khartoum over the previous 20 years (see Box 2) with 59 per cent of them (925,000) originating from
the south and the Three Areas (Abyei ,Blue Nile, Southern Kordofan). IDMC concludes that between
one and 1.3 million IDPs live outside the camps and resettlement areas, while some 300,000 to 400,000
live in IDP camps where they have been allocated plots, and some squat on privately owned land (IDMC
2010) (Box 2).
6 Two loosely allied rebel groups—the Sudan Liberation Movement (SPLM) and the Justice and Equality Movement
(JEM)—took up arms against government-supported militia groups, collectively known as the Janjaweed.

17
Box 2: Large-Scale Regularization of Informal Settlements in Khartoum
From 1991 to 2001 a large-scale planning, resettlement and regularization of informal and squatter
settlements was carried out by the state government in Khartoum. In 1987, three resettlement sites (Dar
Al Salam) were established outside Omdurman (30,000 plots), Khartoum North (10,000 plots) and
Khartoum (10,000 plots), and in 1990, a decision by the Council of Ministers was made to relocate
squatter settlements (recognizing land rights for squatters arriving prior to 1990) and to plan old
subdivisions and organize villages that had been consumed within the boundaries of Khartoum
metropolitan area. Settlements were planned, with rights of way established for roads, utilities and social
infrastructure. Villagers and eligible squatters were given titles to their existing plots where these were
incorporated into the urban plans, or given legal title to replacement plots for a nominal fee.
For old subdivisions (areas where property owners had titles and land registration numbers), land rights
were recognized and compensation paid for any loss of land or buildings, with disputes resolved through
judiciary courts. For residents of villages, replacement plots of 400 m2 in the vicinity of the village were
given to households affected by the planning measures however no compensation was given to
households that retained at least 200 m2 land area. The number of regularized plots totaled more than
150,000 across seventy villages in different parts of Khartoum Metropolitan area. Squatters able to
prove residence in the original settlement prior to 1983 were treated like villagers and given plots in
their original settlements if incorporated into the planned areas. Squatters who took up residence after
1983 were given replacement plots in third class resettlement areas (200 m2
plot in return for a nominal
fee), so long as they met certain criteria including that they were Sudanese, supporting a family, resident
of the settlement before 1990, earning a living and with no residence elsewhere in Khartoum State.
It is estimated that in 1991 approximately two thirds of Khartoum residents were living in informal
settlements (villages or squatter settlements) but today less than eight percent (8.6 percent including the
IDP camps) are in informal settlements. Services networks have been incrementally extended to re-
planned areas or resettlement sites over time—electricity connections are evident even in peripheral
areas, although water is still mainly provided informally by privately operated, donkey drawn water
carts. Over time there has also been a significant private investment by households in their properties—
increasingly structures are aligned to rights of way and utilize more permanent building materials.
Large, sprawling market areas such as the Libya market, and markets for second hand building
materials, have also developed in the vicinity of the resettlement areas. (Bannaga, Al-Shorouk: The
Organization of Villages in the State of Khartoum 2000)
While the planning and regularization of informal settlements has facilitated the large-scale integration
and consolidation of low income neighborhoods, villages and squatter settlements, the program has also
been criticized for forced removal of squatters, demolition of property, and relocation of squatters to
peripheral areas of the city. The program has also been criticized for being used as a political tool to
segregate opposition, particularly migrants and IDPs from Darfur and Southern Sudan (UN-HABITAT
2009).

18
27. Conflict induced displacement has resulted in a distinct form of urbanization and has led to
significant strains on infrastructure and services in the receiving urban areas. Unlike voluntary,
lifetime migrants who often relocate their resources with them when they migrate, displaced people
often flee their rural homelands and lose all their assets. Many IDPs have settled permanently in urban
areas where they expect to find income-generating activities. Others continue to live in IDP camps for
decades and become dependent on intermittent relief assistance and donor-funded services. In the Darfur
region, many IDPs were displaced from their villages from mid 2003 until early 2004, the most intense
period of the counter-insurgency, and have spent over five years in the camps. Since farming and
livestock rearing is virtually impossible due to limited access to land and lack of security, livelihood
strategies of IDPs in urban areas have shifted from agricultural-based livelihoods to urban livelihood
activities—often these livelihood activities, such as the sale of firewood, water selling or brick-making,
are ―inadequate, insecure and maladaptive‖ and result in the overexploitation of limited natural
resources such as water and timber (Young 2009). It is estimated that approximately one-third of IDP
camp residents in the Darfur region are fully integrated into urban economies and another third are
―partially integrated‖ (de Waal, Making Sense of Sudan: Do Darfur IDPs Have an Urban Future 2008).
Many pursue rural based livelihood but return to the camps to sleep at night; many households locate
some family members in the camps, while others pursue rural livelihoods, as a fallback option and to
benefit from assistance provided in the camps such as rations, health services and water (de Waal,
Making Sense of Sudan: Do Darfur IDPs Have an Urban Future 2008). Those that have settled in urban
areas are often worse off than camp residents as they do not benefit from the assistance provided to IDPs
in the camps.
28. It is likely that many IDPs will remain or settle permanently in urban areas. Consistent with
other conflict settings, seasonal returns from IDP camps in Darfur continue to use camps as a base to
safeguard assets. Additionally, other factors, including the breakdown of traditional livelihood and
social structures, increase the likelihood that many IDPs will choose to remain permanently in urban
areas. In fact, due to the protracted and large-scale nature of displacement, many IDP camps have
become de facto townships, with IDPs investing resources in creating permanent dwellings in camps
(United Nations 2010). Many IDPs would prefer to remain permanently in these camps ―in the hope that
they become urban neighborhoods as they did in Khartoum throughout the 1990s, when the city‘s rapid
growth engulfed the official IDP camps previously outside the urban areas‖ (IDMC 2010).
29. Another major challenge for cities and towns is the provision of new residential plots and
land for development that need to be created through an exercise of urban planning. The
protracted conflict in the Darfur region has undermined the already weak capacity of urban local
authorities and any serious urban planning efforts. As a consequence, the towns in the Darfur regions
that are hosting the largest shares of conflict-induced migrants and returnees (including Nyala, El Duein
and El Fasher) have limited capacity to cope with this growth. Existing master plans are out of date, and
based on population growth assumptions that failed to foresee the actual scale of displacement and urban
population growth.

19
C. Population Growth in Nyala and Khartoum: Insights from Case Studies
30. Case studies of Khartoum and Nyala were conducted to complement the broad analytical
and descriptive coverage of urbanization trends in the Sudan. Drawing on interviews conducted in
each of the cities, and supporting documentation, the case studies highlight the most important
challenges faced in each of the cities, and the cities‘ priorities, strategies and plans for responding to
these challenges.
31. In the post independence period from 1955/56 until 1973, both cities experienced very rapid
population growth—of a much higher order of magnitude in Nyala but from a smaller base. In
Nyala rapid growth might be attributed to the extension of the railway system to Nyala in the late 1950s,
which increased its importance as a commercial and trading hub, as well as droughts in the Sahel, as a
consequence of which, people sought livelihood opportunities in the cities. Between the 1973 and 1983
censuses, population growth in Khartoum exceeded five percent—and continued at a rapid pace of 8.8
percent in Nyala (Table 8).
32. Between the 1983 and 1993 censuses, population growth slowed dramatically in Nyala but
accelerated in Khartoum. The rapid growth in Khartoum can be attributed to the 1983-84 droughts and
the influx of migrants and IDPs seeking security and refuge from conflict following the resumption of
the North South War in 1983. The 1993 census indicated that Khartoum State received about 1.5 million
migrants accounting for 45 percent of all internal migrants in Sudan. This means that migrants
constituted about 43 percent of Khartoum State's population recorded in that census (about 3.5 million
people).
Table 8: Comparison of Population Growth Rates
Nyala Khartoum
Census
Population
('000)
Growth Rate
(p.a.)
Share of
Urban
Population*
Population
('000)
Growth Rate
(p.a.)
Share of
Urban
Population*
1955/56 12
1.4% 245
28.7%
1973 60 9.2% 2.3% 784 6.6% 30.1%
1983 144 8.8% 3.5% 1,343 5.4% 32.3%
1993 230 4.7% 3.7% 2,918 7.8% 46.5%
2008 630 6.7%
4,747 3.2%
Note: Share of urban population calculated based on national population figures that include both Sudan and South Sudan
Source: Background Paper (Hamid 2009)
33. Between 1993 and 2008, the population of Nyala grew rapidly, while growth in Khartoum
apparently slowed. In Nyala, the acceleration of growth might be attributed in part to the city‘s new
status (from 1995) as capital of the newly created South Darfur State, and accelerated migration from
Darfur region and Southern Sudan due to desertification. Additionally, from 2003 Nyala became
attractive as a refuge and safe haven for those displaced by the Darfur conflict. Some reports claim that
the population in Nyala exceeds 1.3 million people (1.6 million including those living in IDP camps),

20
suggesting that one in four Darfurians live in Nyala and its surrounding areas7 (de Waal, Making Sense
of Sudan: Do Darfur IDPs Have an Urban Future 2010).The Urban Profile: Poverty and Access to
Services in Urban Areas
34. With the increasing demographic and economic weight of Sudan’s urban areas it is helpful
to develop a profile of the urban population and to understand how this contrasts with the profile
of the rural population. The National Baseline Household Survey of 2009 provides some insight into
relative poverty, sources of livelihoods, access to services, and social development indicators between
urban and rural areas. The data reveals the extent to which there is an urban advantage in terms of access
to services such as improved water supply, improved sanitation and solid waste services, electricity and
housing quality.
35. Urban poverty rates in urban areas are half of those in rural areas. About 27 percent of the
urban dwellers live under the poverty line of US$2 per day, compared with 58 percent of rural dwellers.
Average consumption levels in urban areas (SDG197) are significantly higher than those in rural areas
(SDG 122) (Figure 3). These statistics reveal a significant urban advantage (lower poverty, higher
consumption levels), which is most likely due to: (a) better employment opportunities available in urban
areas, which increase incomes and capacity to pay for services; and (b) higher population densities
which reduce the per capita costs of service delivery. However, consumption patterns are not widely
different between urban and rural areas, with food accounting for approximately sixty percent of
consumption in both locations.
Figure 3: Consumption per person per month (SDG)
Source: National Baseline Household Survey (2009)
7 ―The majority of IDPs in Darfur were excluded from census and electoral processes. Most IDPs boycotted the census in
2008, and the results were rejected by all of Sudan‘s rebel groups, in part owing to their concerns about the exclusion of IDPs
and other conflict-affected communities, and about the counting as Sudanese citizens of foreign nationals who had been
allowed by the Sudanese authorities to settle on land from which Darfurians had fled.‖ (IDMC 2010)
0
20
40
60
80
100
120
140
160
180
200
Urban Rural Total
Other
Recreation
Housing
Personal Care
Transportation
Utilities
Clothing
Health
Education
Food

21
Figure 4: Consumption per person per month (share in %)
Source: National Baseline Household Survey (2009)
Figure 5: Poverty Incidence
Source: National Baseline Household Survey (2009)
0% 20% 40% 60% 80% 100%
Urban
Rural
Total Food
Education
Health
Clothing
Utilities
Transportation
Personal Care
Housing
Recreation
Other
Urban Rural Total
Incidence 26.5 57.6 46.5
0.0
10.0
20.0
30.0
40.0
50.0
60.0
70.0
80.0
90.0
100.0

22
36. The absolute numbers of urban poor are significant and likely to increase in line with
urbanization trends. The numbers of urban poor are significant—with about one in four urban
residents living below the poverty line. If poverty incidence rates remain static in urban areas, then as
Sudan continues to urbanize, the absolute numbers of urban poor will continue to increase. It could be
easier to address poverty in urban areas, since higher population densities allow for more cost-effective
expansion of infrastructure and services. However, physical proximity to social and infrastructure
services does not necessarily guarantee the urban poor access to or affordability of services. Urban
poverty is not simply due to people ―queuing for jobs and services‖, and since urban poor rely on cash
income for all goods and services, shocks tend to hit urban populations particularly hard (Kessides
2006).
37. Urban and rural populations have widely different livelihood profiles. In line with
expectations, urban residents are more involved in non-agricultural activities than rural residents (7
percent versus 57 percent). However, agricultural activities are not completely absent in urban areas.
Approximately half of urban residents derive their income from wages and salaries. Additionally, about
a quarter of urban residents are self employed and derive their income from owned business enterprises
(Figure 6). There are noticeable differences in livelihood profiles between the poor and non poor in both
urban and rural areas. The poor are more likely to be engaged in agricultural activities, while the non
poor are more likely to derive their income from wages and salaries.
Figure 6: Main Source of Livelihood (percentage population)
Source: National Baseline Household Survey (2009)
0% 20% 40% 60% 80% 100%
Urban
Rural
Total
Agriculture Wages and salaries Owned business enterprises Other

23
Figure 7: Main Source of Livelihood—Poor vs. Non Poor
Source: National Baseline Household Survey (2009)
38. Data also reveals wide differences between urban and rural areas in access to improved
drinking water, sanitation and solid waste collection services. On average urban residents benefit
from better water services than those available in rural areas (Figure 8). There are however more
substantial differences between urban and rural areas in terms of the time taken to travel to a water
source (Figure 9). There is a very substantial urban advantage when it comes to sanitation: more than 90
percent of the urban population has access to toilet facilities versus about 50 percent of the rural
population (Figure 10). There is also a substantial urban advantage with respect to solid waste disposal
(Figure 11).
Figure 8: Access to Improved Drinking Water (percentage population)
Source: National Baseline Household Survey (2009)
0% 20% 40% 60% 80% 100%
Urban-Poor
Urban-Non Poor
Rural-Poor
Rural-Non Poor
Total
Agriculture Wages and salaries Owned business enterprises Other
0%
10%
20%
30%
40%
50%
60%
70%
80%
90%
100%
Urban Rural Total
Improved Unimproved

24
Figure 9: Time to Water Source (minutes)
Source: National Baseline Household Survey (2009)
Figure 10: Main Type of Toilet Facility (percentage population)
Source: National Baseline Household Survey (2009)
0% 20% 40% 60% 80% 100%
Urban
Rural
Total
0 1-9 10-29 30-59 60+
0% 20% 40% 60% 80% 100%
Urban
Rural
Total
Flush toilet Pit latrine Bucket No toilet facility

25
Figure 11: Solid Waste Disposal Methods (percentage population)
Source: National Baseline Household Survey (2009)
39. There are wide differences between urban and rural areas in terms of electricity coverage. Three quarters of the urban population and only one quarter of the rural population use electricity as the
main source for lighting (Figure 12). Less than 20 percent of urban dweller use firewood for cooking
compared to more than 60 percent of rural dwellers (Figure 13).
Figure 12: Energy Source for Lighting (percentage population)
Source: National Baseline Household Survey (2009)
0% 20% 40% 60% 80% 100%
Urban
Rural
Total
Collection Composting Dumping or burning Other
0%
10%
20%
30%
40%
50%
60%
70%
80%
90%
100%
Urban Rural Total
Electricity Other No Lighting

26
Figure 13: Energy Source for Cooking (percentage population)
Source: National Baseline Household Survey (2009)
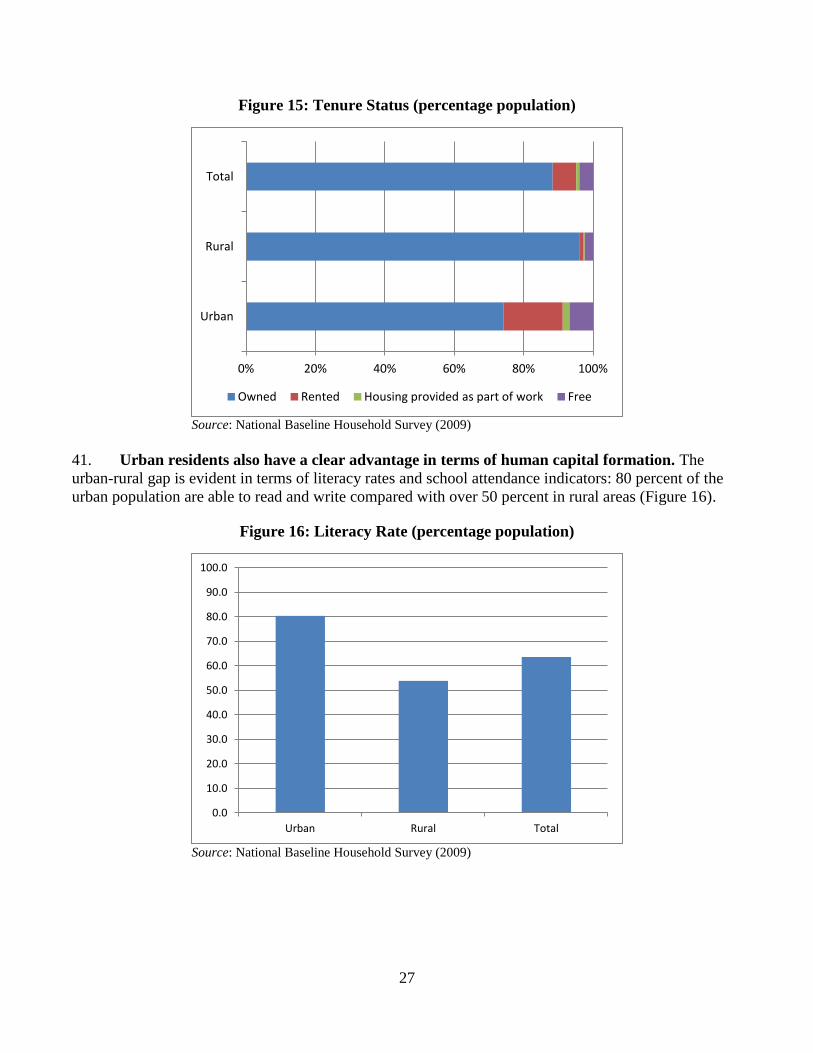
40. There are marked differences in housing quality and tenure status between urban and
rural areas. Urban households benefit from better housing quality than rural households: 40 percent of
the urban population lives in dwellings constructed with permanent materials, compared to only 11
percent of the rural population (Figure 14). Whereas almost all rural households own their own homes,
there is a significant proportion of the urban population that lives in rental properties (17 percent)
(Figure 15).
Figure 14: Housing Characteristics (percent of population)
Source: National Baseline Household Survey (2009)
0% 20% 40% 60% 80% 100%
Urban
Rural
Total
Firewood Charcoal Gas Other
0%
10%
20%
30%
40%
50%
60%
70%
80%
90%
100%
Urban Rural Total
Permanent materials Non-permanent materials Incomplete
27
Figure 15: Tenure Status (percentage population)
Source: National Baseline Household Survey (2009)
41. Urban residents also have a clear advantage in terms of human capital formation. The
urban-rural gap is evident in terms of literacy rates and school attendance indicators: 80 percent of the
urban population are able to read and write compared with over 50 percent in rural areas (Figure 16).
Figure 16: Literacy Rate (percentage population)
Source: National Baseline Household Survey (2009)
0% 20% 40% 60% 80% 100%
Urban
Rural
Total
Owned Rented Housing provided as part of work Free
0.0
10.0
20.0
30.0
40.0
50.0
60.0
70.0
80.0
90.0
100.0
Urban Rural Total

28
Figure 17: Literacy Rate—Poor and Non Poor (percentage population)
Source: National Baseline Household Survey (2009)
Figure 18: School Attendance (percentage population)
Source: National Baseline Household Survey (2009)
0.0
10.0
20.0
30.0
40.0
50.0
60.0
70.0
80.0
90.0
100.0
Urban-Poor Urban-Non Poor
Rural-Poor Rural-Non Poor
Total
0.0
10.0
20.0
30.0
40.0
50.0
60.0
70.0
80.0
90.0
100.0
Urban Rural Total

29
D. Economic Contribution of Urban Areas
42. Several factors help to explain Sudan’s economic performance and future prospects
including insecurity and political instability, the oil sector and the country’s debt burden. First,
conflict, insecurity and political instability have resulted in massive destruction and displacement, and
severely undermined the country‘s social and economic development. The signing of the CPA and the
recent ceasefire between the Sudanese government and the rebels in the Darfur region, present a window
of opportunity for Sudan to reap a peace dividend, and focus on future developmental and social
priorities. Second, while the oil sector only contributes modestly to overall economic output, it has a
significant impact on external and fiscal balances, accounting for about 93 percent of exports and 50
percent of domestic revenue in 2009 (for both North and South combined). And third, North and South
Sudan have significant external debt8, most of it in arrears, in the order of US$36 billion, which impedes
its ability to access concessional loans from international financial institutions. This significant debt
burden is not sustainable in the absence of debt relief.
43. Despite these challenges, real growth averaged over 7 percent per annum over the past decade
(higher than most countries in the region) and non-oil real growth averaged 6 percent. The global
financial crisis resulted in a sharp decline in oil receipts and as a consequence economic growth fell to
4.5 percent in 2009 from 7 percent in 2008, with non-oil growth declining by half to about 5 percent
(IMF 2010). Real GDP growth is projected to be in the 5-6 percent range during 2010–15, contingent on
strong non-oil growth (oil output is projected to be moderate) and with a medium-term focus on
increasing agricultural production (IMF 2010).
Figure 19: GDP Growth by Sector
Note: Data for North and South Sudan combined
Source: IMF Country Report No. 10/256
8 These debt problems can be traced back to the 1960s when the country embarked on a strategy of large-scale
industrialization, financed in part by foreign borrowing at non-concessional terms, and initially accompanied by government
regulation of the economy.

30
44. Industry and services—mainly based in urban areas—account for the lion’s share of
Sudan’s GDP and GDP growth. The economic contribution of urban areas in Sudan can only be
assessed indirectly since national accounts are not spatially disaggregated. A very rough approximation
can be made from the contribution of industry and services, which are typically based in urban areas.
For North and South combined, industry and services only account for roughly 20 percent of
employment, but generate more than two thirds of GDP (29.2 percent and 38.2 percent respectively in
2009). Three quarters of Sudan‘s industrial activities are concentrated in Khartoum alone (UN-
HABITAT 2010). In comparison, the agricultural sector9 accounts for about 80 percent of employment
in Sudan (North and South combined) contributes about a third of the country‘s economic output (32.6
percent in 2009) and is growing at roughly 2.5 percent annually over the past decade. Oil accounts for a
modest percentage (about 10 percent) of GDP, and oil production is expected to gradually decline below
current levels after 2013, necessitating efforts to reduce dependence on oil and to reduce vulnerability to
its price volatility (IMF 2010). While all sectors of the economy need to be mobilized to support
improved economic performance, arguably industry and services (sectors located mainly in urban areas)
should be a focus of national growth strategies because of their relatively strong historical performance.
45. However, Sudan’s cities and towns are not realizing their full productive potential. Arguably, the contribution of cities and towns in Sudan is not what it should or could be. Rapid rates of
urbanization coupled with weak institutions for urban management, weaknesses in land markets, poor
public transport and ineffective service provision limit the productivity of urban areas and choke
agglomeration. In middle and high income countries, even small cities and towns have reasonable levels
of infrastructure, educated human capital and other basic services to support production and innovation,
which is not the case in small Sudanese cities and towns. In middle and high income countries, large
cities (over one million inhabitants) with good urban management are the most productive, particularly
because they are able to match people to jobs. In contrast, large African cities such as Khartoum lack the
finances and local government capacity to meet the demands placed on them.10
46. Realizing the productive potential of urban areas in Sudan would benefit the residents in
both urban and rural locations. The development of urban areas is closely linked to the rural economy
through the exchange of labor, capital, goods, services, information and technology that benefit residents
in both locations. Recent research suggests a robust relationship between rural productivity and distance
from urban areas. Areas within two hours‘ travel time of cities of at least 100,000 people appear to have
diversified into nonagricultural activities (Dorosh, Wang and You 2008). Farmers closer to cities tend to
use better equipment and both more and higher-quality fertilizers and pesticides, resulting in clear gains
in productivity. The growth of urban markets is a key factor in raising the income of the rural population
in the associated hinterland. Recent research from India confirms the importance of urbanization in
reducing poverty in rural areas by leading to gains in productivity and incomes (Menon and Cali 2009).
9 Sudan‘s main agricultural products are cotton, wheat, sorghum, sugar cane, gum Arabic, and live stock. Prior to the rise of
the role of oil in Sudan, agriculture was the main source of foreign exchange earnings, mainly from cotton exports. In 2009,
agricultural exports accounted for 90 percent of all non-oil exports. 10
As a consequence, the growth of industry and services in the African region is based mainly on small-scale, informal
enterprises using low skills and low capital endowments, and operating mainly in response to domestic demand. Cities in
Africa are also an underutilized resource for stimulating agricultural intensification and evolution to higher value production
(Kessides 2006).
31
E. Policy Implications
47. Urbanization is an incontrovertible and irreversible trend—Sudan’s governments at
national and sub-national levels need to plan proactively for urban growth. Consistent with trends
across the Africa region, Sudan is urbanizing at a rapid rate, and it is estimated that the population will
continue to grow at more than twice the rate of the population as a whole so that by 2030 more than half
of the population11
will be living in urban areas. Rapid growth and the absolute numbers of new urban
residents present enormous challenges for urban management.
48. Despite its challenges, urbanization presents enormous opportunities for development and
policy makers need to facilitate density even if this looks counterintuitive in terms of spatial
balance. Empirical evidence shows that economic growth and density go together. No developed
country has achieved high per capita income without a structural transformation of their economy from
agriculture to industry and services, and without urbanization and productive urban areas. Urban areas
can support national development by facilitating trade and processing of rural products, diversifying
incomes, increasing productivity at the firm and industry levels via agglomeration economies, expanding
options for more affordable service delivery, broadening opportunities for human capital formation, and
promoting innovation and institutional change. In the case of Sudan, with its relatively low population
density, sustained economic growth and competitiveness in the longer term will ultimately depend on
the concentration of production and resources in urban agglomerations.
49. The contribution of urban areas to Sudan’s economic output is already significant—but the
full potential of Sudan’s cities has yet to be realized. While the agricultural sector remains important,
it is industry and services—mainly based in urban areas—that account for the lion‘s share of Sudan‘s
GDP and GDP growth for North and South combined. While all sectors of the economy need to be
mobilized to support improved economic performance, arguably industry and services (sectors located
mainly in urban areas) should be a focus of longer term growth strategies because of their relatively
strong historical performance. However, Sudan‘s cities and towns are not realizing their full productive
potential due to weak institutions for urban management, weaknesses in land markets, poor public
transport and inadequate service provision. Arguably, the most significant factor in realizing the
performance of cities, regardless of population size is the quality of urban management and institutions
for local government.
50. Economic growth through agglomeration will be unbalanced, but living standards will
ultimately converge, a process that can be accelerated by promoting the economic integration of
urban and rural areas. While economic growth through agglomeration will be unbalanced, with
production and employment concentrated in regions and cities that are favorable to markets, to stop the
concentration of production or to attempt to spread out economic activity would undermine economic
growth. Government can pursue policies that promote inclusiveness and accelerate the convergence
living standards by ensuring the economic integration of urban and rural areas. Similarly, government
should not adopt a deliberate approach to reduce the dominance of the largest cities—Khartoum, Nyala
and Port Sudan—since large cities are typically the most productive and most attractive to innovative
and information-intensive economic activities. However, basic support should also be provided to
11
North and South Sudan combined.
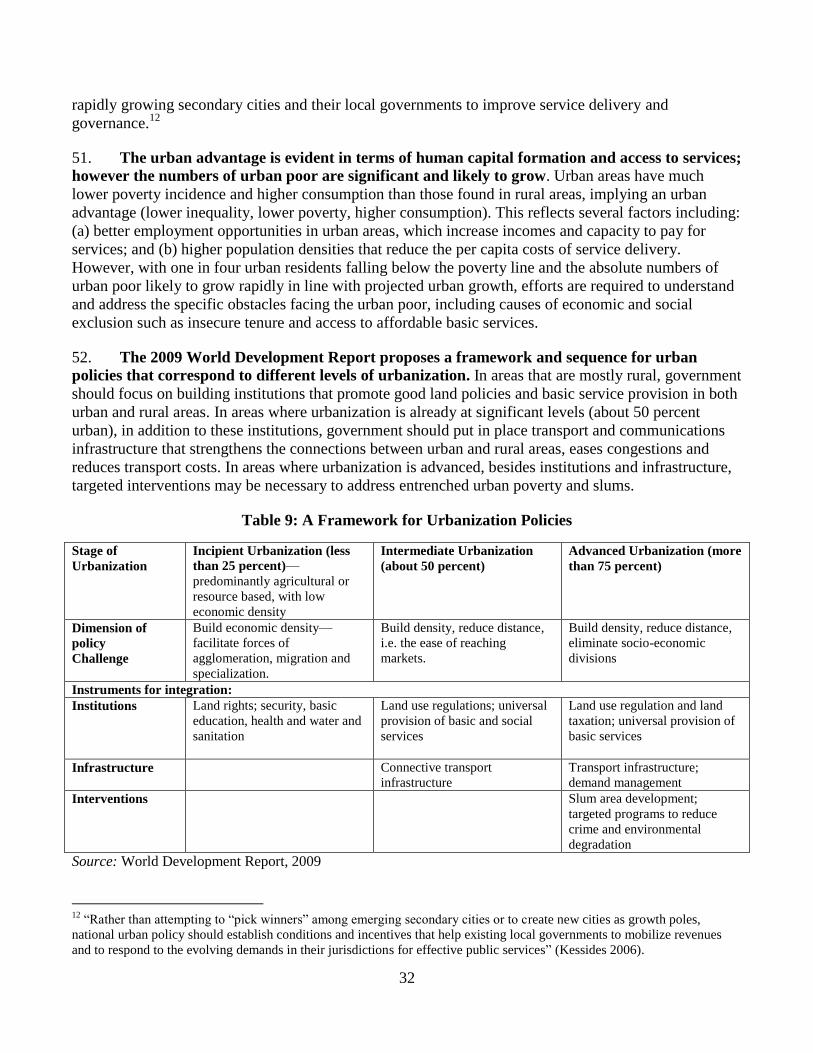
32
rapidly growing secondary cities and their local governments to improve service delivery and
governance.12
51. The urban advantage is evident in terms of human capital formation and access to services;
however the numbers of urban poor are significant and likely to grow. Urban areas have much
lower poverty incidence and higher consumption than those found in rural areas, implying an urban
advantage (lower inequality, lower poverty, higher consumption). This reflects several factors including:
(a) better employment opportunities in urban areas, which increase incomes and capacity to pay for
services; and (b) higher population densities that reduce the per capita costs of service delivery.
However, with one in four urban residents falling below the poverty line and the absolute numbers of
urban poor likely to grow rapidly in line with projected urban growth, efforts are required to understand
and address the specific obstacles facing the urban poor, including causes of economic and social
exclusion such as insecure tenure and access to affordable basic services.
52. The 2009 World Development Report proposes a framework and sequence for urban
policies that correspond to different levels of urbanization. In areas that are mostly rural, government
should focus on building institutions that promote good land policies and basic service provision in both
urban and rural areas. In areas where urbanization is already at significant levels (about 50 percent
urban), in addition to these institutions, government should put in place transport and communications
infrastructure that strengthens the connections between urban and rural areas, eases congestions and
reduces transport costs. In areas where urbanization is advanced, besides institutions and infrastructure,
targeted interventions may be necessary to address entrenched urban poverty and slums.
Table 9: A Framework for Urbanization Policies
Stage of
Urbanization
Incipient Urbanization (less
than 25 percent)—
predominantly agricultural or
resource based, with low
economic density
Intermediate Urbanization
(about 50 percent)
Advanced Urbanization (more
than 75 percent)
Dimension of
policy
Challenge
Build economic density—
facilitate forces of
agglomeration, migration and
specialization.
Build density, reduce distance,
i.e. the ease of reaching
markets.
Build density, reduce distance,
eliminate socio-economic
divisions
Instruments for integration:
Institutions Land rights; security, basic
education, health and water and
sanitation
Land use regulations; universal
provision of basic and social
services
Land use regulation and land
taxation; universal provision of
basic services
Infrastructure Connective transport
infrastructure
Transport infrastructure;
demand management
Interventions Slum area development;
targeted programs to reduce
crime and environmental
degradation
Source: World Development Report, 2009
12
―Rather than attempting to ―pick winners‖ among emerging secondary cities or to create new cities as growth poles,
national urban policy should establish conditions and incentives that help existing local governments to mobilize revenues
and to respond to the evolving demands in their jurisdictions for effective public services‖ (Kessides 2006).

33
53. In addition to building a strong platform for local service delivery and improving the
connectivity of urban and rural areas, attention needs to be given to the needs of the larger and
faster growing cities and towns. In areas where urbanization is still at an incipient stage, the emphasis
should be on expanding access to basic services in rural and urban areas, strengthening land tenure
security and promoting a fluid land market. This would entail supporting improvements in the
management and fiscal capacities of local government. In areas that are urbanizing more rapidly, ideally
there should be investments made in transport and other urban infrastructure to ensure that the
productivity gains from economic density are not offset by congestion costs. And in the large urban
areas (including Greater Khartoum, Nyala, Port Sudan, El-Obeid, Kassala, Medani and Gedaref) there is
a need for deeper institutional reform and capacity building for urban authorities, particularly in the
areas of land use regulation and property taxation, complemented with investments in urban transport
and mobility. Ideally, programs of institutional reform and infrastructure investment would be
complemented with spatially targeted interventions to address the social and economic division within
urban boundaries, particularly in informal settlements.

34
III. LEGAL AND INSTITUTIONAL COMPOSITION OF SUDAN’S URBAN AREAS
A. Constitutional and Legal Basis for Local Government
54. The constitutional and legal framework for decentralization in Sudan has evolved
iteratively over time. Over the past four decades there have been several legislative and constitutional
developments that have shaped the institutional framework for a decentralized system of government,
and within which urbanization has unfolded in Sudan (Box 3). At present the system is defined by the
Interim National Constitution and elaborated in individual state constitutions and local government acts.
55. The current constitutional framework, as set out in the Interim National Constitution,
affirms the principle of ―governance on the basis of a decentralized and democratic system‖. Following the signing in January 2005 of the CPA between the GoS and SPLM, which ended the war
between the North and the South, the Interim National Constitution of the Republic of Sudan was
enacted and entered into force in December 2005. The Interim National Constitution affirms the
principles of decentralization and local participation, in particular:
(a) A decentralized, democratic system of governance with three distinct levels of government:
(i) national level; (ii) state level (wilaya), which ―shall exercise authority at the state level
throughout the Sudan and render public services through the level closest to the people‖;
and (iii) local level (mahaliya) (Article 1, 4, 24).
(b) The autonomy of the national, and state governments, each with distinct constitutional
powers and functions (Article 25 26) and the cooperation, collaboration and communication
between all levels of government to ensure the fulfillment of their respective constitutional
obligations (Article 26).
(c) The role of the state to promote and empower local government—the organization of local
government conducted in accordance with the relevant state constitution (Article 178).
(d) Revenue sharing that reflects a commitment to devolution of powers and decentralization of
decision-making with regard to development, service delivery and governance (Article
185).
56. In practice, the federal system of governance in Sudan is still very centralized, with
decision making powers concentrated at the state level. The Interim National Constitution provides
for the election of the state governors and state legislatures13
, and for the appointment of the state
council of ministers by the state governor (Section 179). State governors wield significant political and
decision making powers, including the appointment of local government commissioners.
13
Elections were held for the first time in April, 2010, with elected governors taking office in May, 2010.
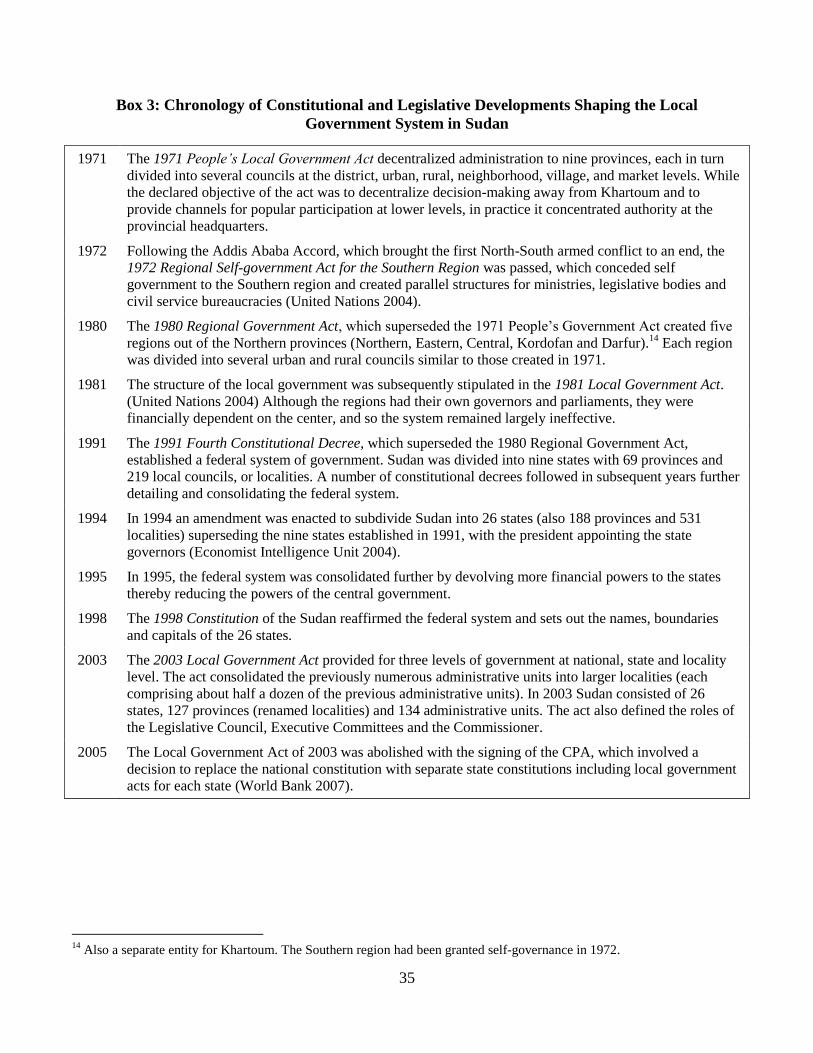
35
Box 3: Chronology of Constitutional and Legislative Developments Shaping the Local
Government System in Sudan
1971 The 1971 People’s Local Government Act decentralized administration to nine provinces, each in turn
divided into several councils at the district, urban, rural, neighborhood, village, and market levels. While
the declared objective of the act was to decentralize decision-making away from Khartoum and to
provide channels for popular participation at lower levels, in practice it concentrated authority at the
provincial headquarters.
1972 Following the Addis Ababa Accord, which brought the first North-South armed conflict to an end, the
1972 Regional Self-government Act for the Southern Region was passed, which conceded self
government to the Southern region and created parallel structures for ministries, legislative bodies and
civil service bureaucracies (United Nations 2004).
1980 The 1980 Regional Government Act, which superseded the 1971 People‘s Government Act created five
regions out of the Northern provinces (Northern, Eastern, Central, Kordofan and Darfur).14
Each region
was divided into several urban and rural councils similar to those created in 1971.
1981 The structure of the local government was subsequently stipulated in the 1981 Local Government Act.
(United Nations 2004) Although the regions had their own governors and parliaments, they were
financially dependent on the center, and so the system remained largely ineffective.
1991 The 1991 Fourth Constitutional Decree, which superseded the 1980 Regional Government Act,
established a federal system of government. Sudan was divided into nine states with 69 provinces and
219 local councils, or localities. A number of constitutional decrees followed in subsequent years further
detailing and consolidating the federal system.
1994 In 1994 an amendment was enacted to subdivide Sudan into 26 states (also 188 provinces and 531
localities) superseding the nine states established in 1991, with the president appointing the state
governors (Economist Intelligence Unit 2004).
1995 In 1995, the federal system was consolidated further by devolving more financial powers to the states
thereby reducing the powers of the central government.
1998 The 1998 Constitution of the Sudan reaffirmed the federal system and sets out the names, boundaries
and capitals of the 26 states.
2003 The 2003 Local Government Act provided for three levels of government at national, state and locality
level. The act consolidated the previously numerous administrative units into larger localities (each
comprising about half a dozen of the previous administrative units). In 2003 Sudan consisted of 26
states, 127 provinces (renamed localities) and 134 administrative units. The act also defined the roles of
the Legislative Council, Executive Committees and the Commissioner.
2005 The Local Government Act of 2003 was abolished with the signing of the CPA, which involved a
decision to replace the national constitution with separate state constitutions including local government
acts for each state (World Bank 2007).
14
Also a separate entity for Khartoum. The Southern region had been granted self-governance in 1972.
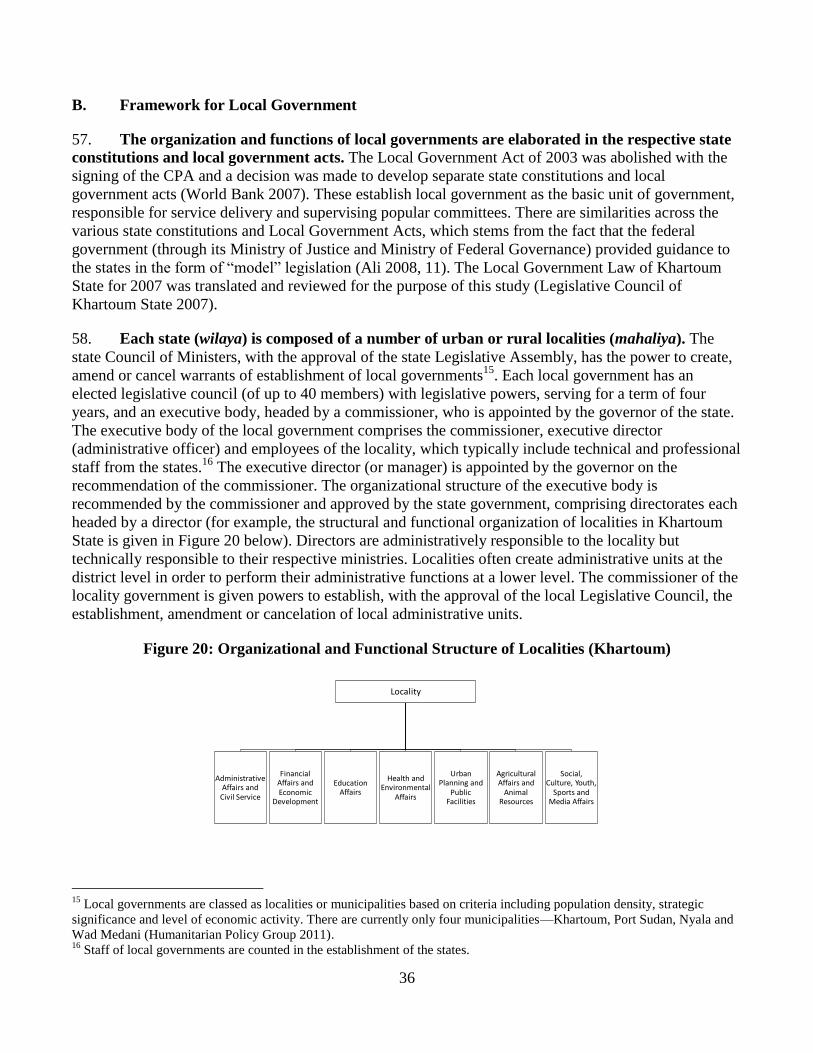
36
B. Framework for Local Government
57. The organization and functions of local governments are elaborated in the respective state
constitutions and local government acts. The Local Government Act of 2003 was abolished with the
signing of the CPA and a decision was made to develop separate state constitutions and local
government acts (World Bank 2007). These establish local government as the basic unit of government,
responsible for service delivery and supervising popular committees. There are similarities across the
various state constitutions and Local Government Acts, which stems from the fact that the federal
government (through its Ministry of Justice and Ministry of Federal Governance) provided guidance to
the states in the form of ―model‖ legislation (Ali 2008, 11). The Local Government Law of Khartoum
State for 2007 was translated and reviewed for the purpose of this study (Legislative Council of
Khartoum State 2007).
58. Each state (wilaya) is composed of a number of urban or rural localities (mahaliya). The
state Council of Ministers, with the approval of the state Legislative Assembly, has the power to create,
amend or cancel warrants of establishment of local governments15
. Each local government has an
elected legislative council (of up to 40 members) with legislative powers, serving for a term of four
years, and an executive body, headed by a commissioner, who is appointed by the governor of the state.
The executive body of the local government comprises the commissioner, executive director
(administrative officer) and employees of the locality, which typically include technical and professional
staff from the states.16
The executive director (or manager) is appointed by the governor on the
recommendation of the commissioner. The organizational structure of the executive body is
recommended by the commissioner and approved by the state government, comprising directorates each
headed by a director (for example, the structural and functional organization of localities in Khartoum
State is given in Figure 20 below). Directors are administratively responsible to the locality but
technically responsible to their respective ministries. Localities often create administrative units at the
district level in order to perform their administrative functions at a lower level. The commissioner of the
locality government is given powers to establish, with the approval of the local Legislative Council, the
establishment, amendment or cancelation of local administrative units.
Figure 20: Organizational and Functional Structure of Localities (Khartoum)
15
Local governments are classed as localities or municipalities based on criteria including population density, strategic
significance and level of economic activity. There are currently only four municipalities—Khartoum, Port Sudan, Nyala and
Wad Medani (Humanitarian Policy Group 2011). 16
Staff of local governments are counted in the establishment of the states.
Locality
Administrative Affairs and
Civil Service
Financial Affairs and Economic
Development
Education Affairs
Health and Environmental
Affairs
Urban Planning and
Public Facilities
Agricultural Affairs and
Animal Resources
Social, Culture, Youth,
Sports and Media Affairs

37
59. The locality is entrusted with a range of responsibilities—however significant service
delivery responsibilities are retained at state level, or assigned to specialized state and national
agencies. The law places special emphasis on the obligations of the localities to deal with issues of local
security, the performance of the popular committees and any other powers assigned to it by the state
government. Additional responsibilities are outlined in the annex to the local government law and
extend to areas of: (a) public administration and civil service; (b) financial affairs and economic
development; (c) buildings and public facilities planning; (d) agriculture and animal resource affairs; (e)
health and environmental affairs; (f) education, social, cultural, youth, sport and media; (g) legislation
and legal affairs; (h) public mobilization; and (i) security. However in most of these areas, localities are
required to perform functions according to state directives, to ―participate in‖ or ―contribute to‖ to state
activities, and to manage activities in coordination with parallel higher-level agencies at the state and
national levels. For example, the Ministry for Engineering Affairs at the state level is responsible for
building major roads and drains that cut across locality boundaries, and for preparing and coordinating
land use planning, while specialized state and national agencies are responsible for water and electricity.
The law provides for a Coordination Council for Local Government17
to be established in the state
Ministry of Local Government and Civil Service, with the powers to coordinate the activities of the
localities and to promote their performance.
60. In practice there is no real devolution of power and resources to the locality level, and
states exert significant control over the localities. The governor is responsible for appointing the
commissioners of the localities within their jurisdiction. In this way, accountability in the
―decentralized‖ system is upwards through the appointed commissioners and governors, rather than
downwards through the elected legislative In addition, employees of the locality typically include
technical and professional staff from the states. Localities conduct economic and development plans
according to state directives, and prepare budgets according to the directives in the state‘s budget. Real
power to allocate resources is retained by the states, which effectively control the budgets of the
localities (Joint Assessment Mission 2005). The Joint Assessment Mission (JAM) notes that ―although
the human resource capacity in several states is relatively strong, other states and localities are severely
under-resourced in terms of management capacity and financial resources. Even the more advanced
states and localities face challenges in modernizing their administrative systems and supporting the
delivery of basic social services to all their communities and citizens‖ (Joint Assessment Mission 2005).
61. At the community level, popular committees work in tandem with local government. Popular committees are bodies of volunteers who assist the locality in administering affairs at the
community level. They also assist the police in maintaining law and order. The popular committees
work in tandem with the localities, and are utilized to disseminate information, to collect charges and
fees, to distribute rationed goods (such as sugar and bread in the early 1990s) or zakat funds to needy
households. To finance their activities, popular committees depend primarily on funds raised locally,
either from fees on residency certificates, or from donations collected from local business or from
households. However, the popular committees are not executing agencies and have no implementation
mechanisms or equipment. Hence, their role is mostly limited to supervision and surveillance, gathering
or disseminating information, issuing certificates and mobilizing communities. Members of popular
committees are appointed either through elections or consensus (United Nations 2004). The popular
17
The Coordinating Council comprises the Minister of Local Government and Civil Service, Commissioners from each
locality, leaders of the Local Legislative Assemblies, the General Manager of the Ministry of Local Government and Civil
Service, and the Manager of the Department of Local Government in the Ministry.

38
committees are distinct from the tribal leadership of the area, or the ―native administration‖ as it has
been referred to since colonial times. Under colonial rule, the ―native administration‖ was mandated to
maintain law and order, tax assessment and collection, the protection of the environment and the
settlement of disputes through native courts. Today, the native administration does not participate in the
working of the locality councils or popular committees.
C. Roles and Responsibilities for Service Delivery
62. The allocation of service delivery mandates across national, state and local government is
described in Sudan’s national and state constitutions and local government legislation—however
the detailed delineation of roles and responsibilities remains unclear and decision making powers
are still highly centralized. The Interim National Constitution establishes the basic principles of
decentralization to states and local government and describes the responsibilities of GoS and the state
governments. The mandates of local government are elaborated in the various state constitutions and
local government acts. These constitutional and legal instruments give local governments wide ranging
mandates including responsibilities for local social and economic planning, basic services including
health and education, local works, public transport and roads, and local utilities. The prescribed
allocation of service delivery mandates across layers of local government (Table 10) show that there are
many duplicated and overlapping roles and responsibilities for service delivery at various tiers of
government. Moreover there is a lack of clarity around the allocation of different responsibilities relating
to each service delivery mandate, such as coordination, policy and strategy, human resource
management and development, financing, planning and budgeting, implementation, operations and
maintenance, accountability, and monitoring and evaluation. In practice, decision making powers are
still highly centralized and there is ad hoc deconcentration and delegation of responsibilities to states
and local governments. Service delivery responsibilities, as defined in the various local government acts,
are not fully devolved from states to localities.
63. Other agencies and ―special authorities‖ have mandates bearing on urban development
and service delivery. These include the National Electricity Corporation, responsible for generation,
transport and distribution of electricity. It manages a national grid that provides the central regions of
Sudan with electricity, but does not yet cover peripheral states such as Kordofan, Darfur, Northern and
the Red Sea. Those states have local networks supplied with locally generated electricity, which often
covers only small portions of each state. The Urban and the Rural Water Corporations, which have been
recently decentralized such that each state has its own corporation, are responsible for managing the
production and distribution of potable water. Judging by the examples of Khartoum and Nyala, only a
few districts in each state enjoy a regular supply of treated piped water. The vast majority of people in
urban and rural areas of Sudan still use untreated water that they draw either from bore holes or ponds.
Additional, there are ―special authorities‖ with powers delegated by state governors, that can have
mandates and jurisdictions that overlap with local authorities.

39
Table 10: Constitutional Powers and Functions of National and State Governments
Powers and Functions of the National
Government,
Source: Interim National Constitution,
Powers and Functions of the States
Source: Interim National Constitution
Powers and Functions of Localities
(Northern States)
Source: Local Government Law of
Khartoum State for 2007
National flag, emblem and anthem
Foreign affairs and international
representation, signing of international
treaties
State constitution
Statutes enacted under penal law power
Laws on agriculture in the state
Traditional and customary law
State flag and emblem
National defense, security, protection of
national borders, and states of emergency
National elections
National census, surveys and statistics
Issuance of national identity card
Nationality and naturalization, passports and
visas, immigration and aliens
State referenda
State statistics and surveys
Social welfare including pensions
Registration of marriage, divorce,
inheritance, births, deaths, adoption and
affiliations
Submission of recommendations on
organization and restriction of immigration.
Constitutional and national courts
National police and prisons
National civil service (setting , paying
salaries)
National public utilities
National institutions envisaged under the
peace agreement or constitution
State judiciary
State police, prisons and reformatory
institutions
State civil service
State public utilities
Local government
Local courts (with concerned authorities)
Human resources management and skills
development
Prepare locality‘s economic development
plan according to state directives.
Investment facilitation, promotion of
charitable, self-help and voluntary
organizations.
Locality budget (prepared according to state
directives), finance and procurement.
National economic policy and planning
National taxation and revenue raising
National budget
National debt and borrowing on public
credit
Central bank, incorporation of national
banks and issuing of paper money
Currency, coinage and exchange control
Bills of exchange and promissory notes
Customs, excise and export duties
State budget and finance
Taxation within the state in order to raise
revenue for the state
Borrowing on sole credit of the state
Weights, measures and standards, dates and
standards of time
Meteorology
Postal services
Civil aviation, maritime and shipment,
navigation, beacons
Airstrips excl. international and national
airports
National land and natural resources
Nile water commission, and management of
Nile waters, transboundary waters interstate
waters
State land and natural resources
Town and rural planning
State irrigation and embankments
Locality‘s land, leases and natural
resources.
Participation in urban and rural planning.
National museums and heritage sites Cultural matters within the state
Regulation of religious matters
State cultural and heritage sites, state
libraries, state museums
State archives, antiquities, monuments
Intellectual property rights Regulation of businesses, trade licenses
Pollution control
Regulation of trade licenses.

40
Powers and Functions of the National
Government,
Source: Interim National Constitution,
Powers and Functions of the States
Source: Interim National Constitution
Powers and Functions of Localities
(Northern States)
Source: Local Government Law of
Khartoum State for 2007
Quarrying regulations
Regulation of charities
Vehicle licensing
Firearms licensing
International and inter-state transport Local works and undertakings
Primary and secondary schools
Intrastate public transport and roads
Fire fighting and ambulance services
Recreation and sport within the state
Population policy and family planning
Works authorized or delegated by state or
national agencies.
Implementation of works, buildings and
projects of the localities.
Management of local public facilities,
including roads, parking, drainage, markets,
public parks, cemeteries, and
slaughterhouses.
Environmental health including supervision
of drinking water, vector control and public
cleaning.
Primary education
Locality‘s statistics on development and
service activities.
Public mobilization
National information, publications,
telecommunications regulations
State information, state publications and
state media
64. Insights from Case Studies. Khartoum and Nyala are the capitals of their respective states—and
therefore the seats of both the state and local governments. This dual role has given these cities, like
other state capitals, an advantage over other towns because state governments typically invest more in
their capital cities. Khartoum is also significantly the administrative and political center for GoS. The
institutional arrangements differ slightly in each city. Nyala city corresponds to the boundaries of the
Municipality of Nyala (the largest of twelve localities in Southern Darfur State). Each locality is headed
by a Commissioner, appointed by the Governor of the state, and has a Locality Council, which is the
legislative body of the locality. The Municipality of Nyala is further divided into four administrative
units (East, North, South and Central) with responsibilities for service delivery and tax collection within
their boundaries. In Greater Khartoum, the urban population is spread across seven localities—
Khartoum and Omdurman are completely urban, while the other localities have an urban core and a rural
hinterland. Each locality is headed by a Commissioner, appointed by the Governor of the state, and has a
local legislative council.
D. Local Government Financing
65. Local authorities have several sources of funding. The funding sources include property taxes,
sales taxes, forty percent of locally-generated income taxes, value-added tax, income from investments,
rents, licenses, permits, donations collected occasionally for specific purposes, and transfers from the
state government to resource poor localities. Furthermore, the locality has the power to raise additional
funds from its residents through specific charges, fees, taxes or rents or by land sales.
66. The state constitutions and local government acts typically provide for several local
revenue instruments including: (a) local rates; (b) animal tax and purchase charges (animal production
fees); (c) land and river transport fees; (d) local commercial, trading and health licenses; (e) local
service fees; (f) recreation tax; (g) stray animals charges; (h) renting of public parks, cafeterias, shops,
41
kushuks and local estates; (i) refuse collection fees; (j) village planning charges; (k) estate tax; (l) arable
land taxes; and (m) other local services charges. Local governments are also entitled to a known
percentage from state resources including animal taxes, advertisement fees, ground building license fees,
service revenues and veterinary inspection, slaughterhouse and local slaughter fees. In practice, many of
the taxes and charges are regulated and collected by the state authorities (Ali 2008, 19).
67. Revenue instruments are inadequate to meet all expenditure requirements. Revenue
mobilization is weak either because the locality has a thin resource base or because of inefficient
collection and tax evasion. In the absence of adequate and timely transfers from the states, localities with
inadequate resources usually fail to perform their functions or to pay the salaries of their employees.
Others often resort to auctioning of land and to aggressive levying of charges and fees in order to raise
funds to cover their operating costs. The Nyala and Khartoum case studies provide some examples and
indications of the volume of local government finance.
68. A major impediment to effective local service delivery is the lack of an equitable and
efficient intergovernmental fiscal system that reflects service delivery mandates. The current
intergovernmental fiscal system does not adequately support the equitable and efficient provision of
basic services at state and locality levels—localities‘ resources are insufficient relative to their
decentralized responsibilities and financing needs.18
In addition, the current transfer system relies on
negotiated transfers, and there is no transparent allocation system. Efforts are therefore required to
elaborate the intergovernmental fiscal arrangements, and to develop a fiscal decentralization strategy
that establishes the pool of resources to be distributed to state and local governments, as well as
predictable, transparent allocation formulae to address vertical and horizontal imbalances (Joint
Assessment Mission 2005).
69. Additionally, policies also need to be developed to promote own-source revenue
mobilization and improved revenue administration at the state and locality level. Local taxes are
not being collected according to the law and there is weak administration of existing taxes, including
reliance on neighborhood committees to determine tax liabilities and to collect revenues, lack of
adequate numbers of skilled staff, and a lack of information on the local tax base and taxpayers for each
revenue instrument (Joint Assessment Mission 2005).
E. Urban Land and Housing
70. All land that is not registered to specific owners is considered government-owned. Since
1906, various ordinances and acts have been passed establishing that land not registered to a specific
owner is the property or the government.19
In particular, the Unregistered Land Act of 1970 had far
18
While the states and localities have significant mandates for planning and service delivery, they work with limited budgets
and cannot deliver what is expected from them. Extension of service networks (especially water supply and electricity) is
impeded by high capital costs. In virtually all Sudanese towns, these essential services are extended to neighborhoods at a
high subsidy borne by the government. With insufficient budgets, the agencies in charge have great difficulties in extending
their services to all neighborhoods. Alternatively, households resort to makeshift solutions such as individual power
generators and water sold by vendors in spite of its relatively high cost and prospects of contamination. 19
These include: (a) the Land Settlement Ordinance of 1905 adopted by the British administration that determined that until
legal ownership had been established by a settlement, land ownership would be vested with the government—the colonial
laws also provided for compensation (alternative land or cash compensation); (b) the Land Settlement Act and Registration
Ordinance of 1925 that declared all lands without title as government-owned; (c) the Prescription and Limitation Ordinance
of 1928 that established that unregistered lands that had been occupied for less than ten years to be the property of the
42
reaching implications for customary land ownership, whether by individuals or by communities, since it
deemed any land not registered prior to the enactment of the law to be government-owned. In addition, it
included no provisions for the recognition, settlement, eventual registration or compensation for either
communities or individuals (Komey 2009). While the act has now been repealed, replaced by the Civil
Transaction Act of 1984, it still reflects current attitudes and practices regarding land (Bannaga 2010,
90, 93). In particular, unregistered land is still considered government-owned, and the government can
sell or lease land as it sees fit according to its plans and projects.
71. Responsibilities for urban planning and housing are divided between GoS, states and
localities—with the National Council for Physical Development taking overall responsibility for
urban planning. The Physical Planning and Land Disposal Act of 1994 outlines the institutional
arrangements for urban planning and land management. Under the act, the Federal Council of Physical
Planning and Land Disposal was established in 1995, with responsibility for national urban strategy.
More recently, the National Council for Physical Development was established—while this was
intended to replace the Federal Council of Physical Planning and Land Disposal, the new body is not
currently recognized under the 1994 Act. The National Council for Physical Development comprises: (a)
the states‘ ministers for physical planning; (b) representatives of various ministries and agencies
including the under secretaries of the Ministry of Finance, Ministry of Federal Chamber Governance,
Ministry of Investment and Ministry of Agriculture and the General Secretaries of the National Survey
Authority, Southern Sudan Physical Development Council; (c) the General Secretary to the Council, and
(d) five experts in the field of physical development. The Council would be responsible for developing
and monitoring the implementation of physical policies, strategies and plans covering both rural and
urban areas (subject to the assent of the minister‘s council), coordination and monitoring of planning
institutions at federal and state levels, and research. The Council would also be responsible for
reviewing state master plans before these are forwarded to the council of ministers for ratification, and
endorsing any changes to land uses ratified by the council of ministers. Within the federal Ministry of
Environment and Physical Development, there is a small technical team that acts as a General
Secretariat to the National Council for Physical Development.
72. The National Council for Physical Development is working on a 25-year National Physical
Development Strategy and National Structure Plan, which will cover the period from 2010 to 2035.
The terms of reference for this work, emphasize balanced development, referencing the experiences of
Egypt, Saudi Arabia, Libya and the Netherlands, and noting that previous national governments have
―adopted the colonial policies [which] contributed in concentrating the interest in the productive regions
and ignoring the relatively poor ones, [which] deepened the economic and social differentiation among
the big towns and the broad Sudanese rural areas at the one hand, which sharpened immigration to
urban.‖ The strong focus on balanced development, which reflects the perceived or real imbalance of
power and resources between Sudan‘s centre and its periphery, does not sufficiently account for the
demographic and economic weight of Sudan‘s urban areas, the country‘s rapid rate of urbanization, and
the fundamental importance of urban agglomeration for national economic growth and welfare.
government; (d) the Land Acquisition Act of 1930 that provided for the acquisition of land for public purposes; (e) the
Unregistered Land Act of 1970 that established that land not registered prior to the enactment of the Act, including all waste,
forest, occupied or unoccupied land, is the property of the government; (f) the Civil Transaction Act of 1984 and its
Amendment of 1990, which repealed the 1970 Unregistered Land Act, and includes provisions for the transfer and
inheritance of land rights and compensation for land expropriated by the government; and (g) the Physical Planning and Land
Disposal Act of 1994, which includes details on the expropriation of land for public interest and compensation.

43
73. Responsibilities for urban planning and development are also fragmented at state and
locality levels. For example, in Khartoum state, like in all other northern states, the Ministry of Physical
Planning is responsible for land, housing and urban planning issues, and is entrusted with government
land, which it subdivides and allocates for specific purposes—land is demarcated for various land uses
according to some form of planning (master plans, structure plans, piecemeal and ad-hoc planning).
Residential, commercial or industrial lands are parceled and then auctioned to developers or leased for a
defined rent and duration. Most of the land designated for residential uses is leased for a long period of
time and for a modest rent, with the objective of facilitating urban development and allocating land to
households or entrepreneurs who need it.
74. Some urban planning has been conducted in the two case study cities. In Nyala, a plan was
prepared covering the period 1998 to 2013, however its underlying assumptions and projections did not
anticipate the massive population displacements to Nyala caused by the conflict in the Darfur region.
Greater Khartoum has undergone several large-scale, long-range planning efforts, including a master
plan in 1958, a regional-cum-urban plan prepared in 1977, a structure plan financed by international
donors prepared in 1991 and a physical plan currently being finalized, all of which have proposed
scenarios for directing the future growth of Greater Khartoum. However, physical plans have not been
realized partly due to rapid increases in urban populations beyond assumptions implicit in the plans, as
well as due to lack of commitment or financing to actualize plans, and conflicts over land use.
75. The provision of infrastructure is undertaken by state or national agencies. In Khartoum
State, physical infrastructure (roads, bridges, water, sanitation and storm water drainage) is handled by a
newly-created Infrastructure Ministry. In residential areas, which constitute about 75 percent of land use
in urban areas of Sudan, the prevalent development model is ―site and services‖ whereby the land is
leased by the state government to households that satisfy certain criteria (e.g. household size, length of
residence in the area, income, profession etc.) for a length of time that ranges from 50 to 90 years. The
relevant government agencies provide the services, while the households hire architects and contractors
to build their homes. Households typically mobilize their own resources to develop their properties since
banks are reluctant to lend for this purpose. The state ministry responsible for housing also plays a small
role in the provision of housing for low-income residents, although the number of housing units
provided is small.
76. Residential areas in Sudanese cities are categorized into first, second and third class areas,
based on a classification system that dates from colonial times. Classes are distinguished by specified
criteria, namely income level of its residents, plot sizes, service and construction standards (Table 11).
According to this system, residential areas are classified into four classes: (a) first-class areas in which
land parcels typically range from 500-800 square meters, and up to 1,200 square meters; (b) second-
class areas where the plot areas range from 400 to 600 square meters; (c) third-class areas where the
plots range from 300 to 400 square meters; and (d) fourth-class areas where the plots are typically 200
square meters.20
A concomitant standard of construction is applied whereby houses in first-class areas
are required to adopt high construction standards and use permanent building materials, while these high
standards are relaxed as one moves down the classification system. Increasing urbanization and
proliferating urban growth, the threat to agricultural lands and the high cost of services forced the
planning authorities in the 1980s to reduce the average plot sizes to 400, 300 and 200 square meters in
20
In 1957, the fourth-class category was abolished—residents were required to build houses according to third-class
requirements in order to retain their plots.

44
first, second and third-class areas respectively. In practice, however, first-class areas often include plots
of 500 to 600 square meters, and 300 square meters became the typical plot in third-class areas. Fourth-
class areas have been introduced in some cities as temporary areas that carry renewable annual leases,
mostly to accommodate urgent cases such as squatters, IDPs, etc. The typical plot in those areas was 200
meters and the houses were constructed of perishable building materials, such as thatch, mud, etc. In
many cases, fourth-class areas were dismantled after their leases expired and the land was needed for
other land uses. The notable example of this was Fallata quarters in Khartoum, which survived for
several decades before its residents were relocated and the area was subdivided into a first-class area.
Table 11: Housing Classification System
Housing Areas
First-Class Second-class Third-class
Plot Size—Range (m2) 500-800 400-600 300-400
Pre-1980s Average Plot Size (m2) 800 500 400
Post-1980s Average Plot Size (m2) 400 300 200
Initial Length of Land Lease 50 30 20
Total Extensions of Land Lease 30 40 20
Applicable Housing Standards Permanent building
materials (e.g. concrete
and bricks), multi-
story, high service
standards
Permanent building
materials (e.g. stone or
bricks), medium
service standards
Average building
materials (e.g. mud),
mostly single-storey,
low service standards
77. The housing classification system was apparently introduced by the colonial administration
to mirror a social stratification system in which the society had been stratified into social classes: the
colonial administrators, wealthy merchants and senior officials, middle- and junior government officials,
and the ‗natives‘. The system persists until today with wealthy merchants and senior officials replacing
the colonial administrators in the first-class areas. The fourth-class areas have been virtually abolished
because they often yield sub-standard housing, although they are still practiced by some local
governments. The classification system reinforces social stratification based on class and doesn't take
into account family size or social mobility when the income level of some families change either
upwards or downwards. Furthermore, since the land and the services are provided at subsidized prices,
the system grants huge windfalls to people in first-class areas. In spite of these negative aspects, which
have been discussed in many forums, the system has not been changed.
F. Policy Implications
78. Lack of clarity around roles and responsibilities for service delivery and how these will
evolve over time. While the current constitutional and legal framework establishes the broad parameters
for devolved functions and responsibilities, it is necessary to further clarify the mandates for service
delivery at the various tiers of government and in particular, to elaborate the allocation of different
responsibilities relating to each service delivery mandate, such as coordination, policy and strategy,
human resource management and development, financing, planning and budgeting, implementation,
operations and maintenance, accountability, and monitoring and evaluation. Decision making powers are
still highly centralized and there is ad hoc deconcentration and delegation of responsibilities to states
and local governments.

45
79. Limited resources available for service delivery—and lack of clarity around
intergovernmental fiscal architecture. Intergovernmental fiscal arrangements are outlined in the
Interim National Constitution, state constitutions and local government acts, which provide for ―revenue
sharing that reflects a commitment to devolution of powers and decentralization of decision-making‖.
However, in practice, the revenue instruments and intergovernmental fiscal transfers allocated to states
and localities do not correspond with the legal allocation of service delivery mandates. Certainly,
devolution without the requisite resources will only set up local governments for failure. With regard to
own-source revenues and revenue sharing arrangements, there is a lack of clarity around: (i) the
allocation of revenue instruments between national, states and local governments including revenue
sharing arrangements, and as a result there are overlaps and conflicts between different levels of
government over revenue raising powers; (ii) definitions of the various tax bases; (iii) powers of the
various tiers of government to set or vary the tax rate applied to each tax base; and (iv) collection
modalities. With regard to intergovernmental fiscal transfers, decisions need to be made on the
principles underlying the allocation of grants to states and counties and the design of the grant
mechanisms. Efforts are therefore required to elaborate intergovernmental fiscal arrangements and
develop a fiscal decentralization strategy that addresses vertical and horizontal imbalances, incentivizes
performance, promotes own-source revenue mobilization and improves revenue administration at the
state and locality level.
80. Weak management and fiscal capacity of local government. The transfer of authority and
adequate resources to the local level is not the sole pre-requisite for better service delivery, which will
also depend on the efficiency with which expenditure assignments are executed. At present, there is very
limited capacity on the ground in terms of local government budgets, staff, administrative infrastructure
and equipment, and available capacity it unevenly spread. There is a need to build and strengthen the
functionality of local governments and improve their management and fiscal capacities in order to
establish a basic platform for service delivery. Core functions of local governments need to be built and
strengthened over time, in the areas of participatory development planning, own-source revenue
mobilization and administration, financial management (budgeting, accounting, reporting and auditing),
procurement, project management, monitoring and evaluation (M&E) and the development of
accountability mechanisms (including formal mechanisms through parliaments and councils, and
informal mechanisms at community level).

46
IV. CONCLUSIONS AND RECOMMENDATIONS
A. Priorities for the Urban and Local Government Sector
81. A specific urban policy and strategy is needed—one that proactively recognizes and
addresses Sudan’s rapid urbanization and the growing importance of cities and towns for national
growth and poverty reduction. Terms of reference have been drafted for a National Physical
Development Strategy and National Structure Plan, however its focus on ―balanced development‖ does
not sufficiently acknowledge the importance of urban density and agglomeration for Sudan‘s economic
growth and poverty reduction. As noted in the World Bank‘s Country Economic Memorandum,
―accelerated urbanization is likely to be a permanent phenomenon‖ and ―given the power of
agglomeration economies and returns to scale, this can be a driver of growth with sufficient focus on
reforms to increase the return on investment, including reforms to reduce administrative costs, provide
access to finance, and building adequate transport infrastructure.‖ A specific urban policy and strategy is
recommended, which would establish a framework to address the challenges and opportunities posed by
Sudan‘s rapid urbanization. Rather than emphasizing balanced development, the urban policy would
need to focus on how best to harness the forces that produce economic density (agglomeration,
migration and specialization) while pursuing policies that promote inclusiveness and accelerate the
convergence living standards by ensuring the economic integration of urban and rural areas.
82. The strategy should also differentiate between areas at different stages of development. In
areas where urbanization is still at an incipient stage, the emphasis should be on expanding access to
basic services in rural and urban areas, strengthening land tenure security and promoting a fluid land
market. In areas that are urbanizing more rapidly, ideally there should be investments in transport and
other infrastructure to ensure that the productivity gains from economic density are not offset by
congestion costs. And in the large urban areas (including Greater Khartoum, Nyala, Port Sudan, El-
Obeid, Kassala, Medani and Gedaref) there is a need for deeper institutional reform and capacity
building, particularly in the areas of land use regulation and property taxation, complimented with
investments in urban transport and mobility. Ideally, programs of institutional reform and infrastructure
investment would be complemented with spatially targeted interventions to address the social and
economic division within urban boundaries, particularly in informal settlements. The country‘s urban
policy and strategy also needs to recognize and take into account the distinct features conflict driven
displacement and its longer term implications. For example, in the Darfur region, where up to 50 percent
of the population is estimated to be living in or near urban areas or in the axes that link urban areas, an
urban policy and strategy needs to take into account the prospect that the majority of IDPs are unlikely
to return to their rural homes. A central pillar of the urban strategy needs to be the quality of institutions
for urban management, which is the most significant factor in realizing the performance of Sudan‘s
cities and towns.
83. There is also an imperative to delineate and clarify the roles and responsibilities for service
delivery, and to build and strengthen the functionality of local governments and improve their
governance, management and fiscal capacities. While the principles of decentralization and local
government are given prominence in the Interim National Constitution, state constitutions and local
government legislation, there is still a lack of clarity around the detailed roles and responsibilities of
local government with respect to the state and federal government. In practice, there is an ad hoc
deconcentration and delegation of responsibilities to states and local governments, with overlapping
mandates for guiding, planning and delivering services. In addition, states and local governments have
47
limited resources to meet their stated service delivery obligations, or to invest in expanding service
networks. These systemic problems influence the way in which urbanization unfolds in Sudan, and
undermines the potential benefits of urban agglomeration. Therefore, further work is required to clarify
roles and responsibilities at various levels of government, and to further elaborate intergovernmental
fiscal arrangements (including transfers, revenue sharing and local tax instruments) to ensure these
correspond with the allocation of service delivery mandates. Any fiscal decentralization strategy would
need to define the pool of resources to be distributed to state and local governments, as well as
allocation formulae to address vertical and horizontal imbalances. A program of institutional reform and
capacity building is also required to strengthen the capacity, responsiveness and efficiency of local
governments, which will be critical for effective service delivery and accountability to citizens.
84. To support the development of an urban strategy, further research on the urban sector and
better urban data is required to inform policymaking and priority setting in the urban sector. There is a need to support the collection and use of city level data for local policy making and
benchmarking, in order that variations in city performance can be better understood. It would be
beneficial to document the different needs of capital/primate cities in each region versus the more
numerous and rapidly growing secondary cities and towns. Existing data sources should also be mined,
notably through wider analysis of the urban dimensions of household surveys and population censuses.
Additionally, more study is needed to gauge the financial resources available to local governments and
to advocate for more adequate revenues so that these authorities can better fulfill their service delivery
mandates. (Kessides 2006) Further, efforts are required to understand and address the specific obstacles
facing the urban poor in Sudan, including causes of economic and social exclusion such as insecure
tenure and access to affordable basic services.
B. Options for Future World Bank Engagement
85. Immediate options for the Bank’s engagement in the urban sector are limited in the
absence of an IDA program in Sudan. Currently the Bank‘s engagement is primarily through a
US$265 multi-donor trust fund (MDTF) managed by the Bank to support the consolidation of peace and
recovery in war-affected areas of the North, based a five-year plan (2007-2011) prepared by GoS. The
trust fund was scheduled to close on June 30, 2011 but has been extended by one year to June 30, 2012.
The nature of the Bank‘s assistance in Sudan over the medium to longer term would be influenced by
several factors including: (a) the process and timeline for the full separation of South Sudan; (b)
scenarios for any apportioning of debt between North and South Sudan; (c) the likelihood and timeframe
for clearing arrears and possible debt relief21
; and (d) any future allocation of IDA funds.
86. Options for engagement on urban issues include: (a) further analytical work and technical
assistance (short-term); (b) the integration of key urban policy issues into any future policy matrix and
priority actions for debt relief under the Heavily Indebted Poor Country (HIPC) Initiative (medium-
term); and (c) financing for a local government or municipal development program (long-term).
(a) It is clear that Sudan has suffered from the absence of a policy dialogue on urban sector
issues, and there is a strong appetite for engaging with the Bank going forward. In the short
term, the Bank should support the dissemination of this Economic and Sector Work with the
objective of stimulating discussion on urban sector issues, identifying areas for further
21
Total external debt in nominal terms stood at US$35.7 billion at end-2009, with over US$30 billion in arrears.

48
research and analysis, and informing the preparation of the Physical Development Strategy
and National Structure Plan. A second phase of the Economic and Sector Work should be
supported, and consideration should also be given to provide targeted technical assistance,
for example to assist the Government with the preparation of a comprehensive urban policy
and strategy, or focused on the urban planning issues in areas such as the Darfur region
where there is significant displacement of people due to conflict.
(b) In the medium-term, if there is momentum towards debt relief, appropriate priority urban
and local government policy issues should be integrated into the design of the policy matrix
and prior actions for debt relief.
(c) In the longer term, if the Bank is in the position to provide support under IDA, the priority
would be for financing for a local government or municipal development program (ideally
covering both urban and rural localities) that would seek to strengthen the
intergovernmental fiscal system, build the management and fiscal capacities of local
governments for improved service delivery, and enhance the quality of governance for
improved voice and accountability. Given the growing demographic and economic weight
of Sudan‘s cities and towns, specific attention would need to be given to those local
governments responsible for rapidly growing urban or high density areas. Such a program
would support a discretionary grant to localities, allocated on the basis of a transparent,
equitable formula that could take into consideration a variety of parameters including
population, population density, poverty or access to service indicators. A system of
incentives would be established through a performance based system including minimum
access criteria, additional performance criteria for accessing greater resources, and an
annual assessment process. All participating localities would benefit from capacity building
to assist them in meeting the minimum access and performance criteria, and developing the
management and fiscal capacities to plan, budget for, implement, maintain and operate, and
account for development projects.

49
ANNEX A: KHARTOUM CASE STUDY
A. Population Growth
87. Greater Khartoum is the capital of Sudan and its industrial, commercial and service hub. Although Khartoum State is the most populous in Sudan (population of 5,274,321 according to the 2008
census) and has the largest urban center in Sudan, it is still vastly rural. Greater Khartoum constitutes
only about 6 percent of the total area of the state, but accommodates about 85 percent of the state's
population, about 4.7 million people. Greater Khartoum accounts for more than a tenth of Sudan‘s
population and more than half of the total urban population. Many researchers and population experts
challenge the population estimates that emerged from the 2008 census and unofficial estimates of
Greater Khartoum‘s population, including unregistered immigrants, are in the order of 6 or 7 million
people (de Waal, Making Sense of Sudan: Do Darfur IDPs Have an Urban Future 2008).
88. The high population growth of Greater Khartoum can be attributed to high fertility rates22
coupled with high rates of migration from rural areas and smaller urban areas. Greater Khartoum
witnessed rapid population growth unparalleled elsewhere in Sudan (Table 12).23
Khartoum has
benefited from greater investment and has enjoyed better infrastructure and services than the rest of the
country making it the unrivalled pole of attraction for migrants seeking livelihood opportunities,
services, security and other attractions of urban life. Migrants to Greater Khartoum are motivated by
both pull and push factors—the relatively better services and livelihood opportunities in the city, as well
as weakening rural economies as a consequence of falling returns to agriculture, droughts and insecurity.
In a survey of selected areas of greater Khartoum, excluding the IDP camps, migrants (including IDPs
and non-IDPs) were asked why they came to Khartoum; 69 percent came for work, 11 percent said they
were escaping conflict, and other said that they were seeking housing or land (6 percent), education (5
percent) or were joining family (5 percent). The survey also suggested that reasons for migrating to
Khartoum were significantly related to ethnicity—most Dinka came for reasons related to conflict, while
other ethnic groups were predominantly seeking livelihood opportunities.
Table 12: Population Growth in Greater Khartoum
Census Year Population ('000)
Annual Intercensal
Growth Rate
% of Total
Population
% of Total Urban
Population
1955-56 245
2.4 28.7
1973 784 6.6% 5.3 30.1
1983 1,343 5.4% 6.2 32.3
1993 2,91824
7.8% 11.7 46.5
2008 4,747 (official)
6-7 million (unofficial)
3.2% 11.4 N/A
22
Average of 6.8 children per woman in 1973, which dropped to 5.9 in 2006 according to the National Population Council. 23
Since the results of the last census released so far don't show the figures for urban areas, we have assumed the population
of Greater Khartoum to be 90 percent. It is noticeable that the average annual population growth of Greater Khartoum that
can be deducted from the results of the last census, which showed the total population of Khartoum State to be 5,274,321
persons, is very low (3.3 percent) compared to those deducted from the previous four censuses. This has lead many entities to
consider the results of the last census to be vastly underestimated. 24
This figure is also challenged by many researchers—unofficial estimates place the population in 1993 at 3.67 million
people.

50
89. Greater Khartoum has accommodated hundreds of thousands of migrants and IDPs in the
intercensal period from 1983 to 1993, which contributed significantly to its population growth
during that period. Migration from the South increased between 1985 and 1995 and then dropped off
after 2000. Migrants from Darfur have arrived in Khartoum in a continuous stream, with a slight
increase after 2000 (Jacobsen 2008). The 1993 census indicated that Khartoum State received about 1.5
million migrants accounting for 45 percent of all internal migrants in Sudan, implying that migrants
constituted about 43 percent of Khartoum State's population in 1993, about 3.5 million people. The 2006
household survey corroborates this figure, indicating that there were 3.4 internal migrants in Khartoum
State (of which 85 percent were male), of which 1.5 million migrated to Greater Khartoum (1.3 million
in IDP camps and slum areas at the periphery of the city). Other surveys suggest that in 2007, the
number of IDPs in the urban areas of Khartoum, outside the camps and resettlement areas, number in the
range of 1 – 1.2 million people, with an additional 0.3 to 0.4 million people living in IDP camps. These
figures suggest that internal migrants account for almost one quarter of the population of Greater
Khartoum. Of IDPs surveyed on their intentions, 65 percent stated that they wished to remain in
Khartoum (Jacobsen 2008). The large number of IDPs that settled in Greater Khartoum have affected its
physical structure—96 camps and informal settlements were recorded in Khartoum in 1991, housing
some 60 percent of its residents at that time. Since then most of these camps and settlements have been
regularized and integrated within the urban boundaries of Greater Khartoum. A 2008 survey of IDPs
indicate that they are distributed throughout Khartoum, with higher densities in poorer neighborhoods of
Jaba Awlia and Omdurman. (Jacobsen 2008)
90. The population of Khartoum is estimated to continue to grow at a rapid pace. While the
estimated rate of growth of the city‘s population will slow to around three percent per annum, the
absolute increases in population are significant—approximately 150,000 to 200,000 new urban residents
each year.
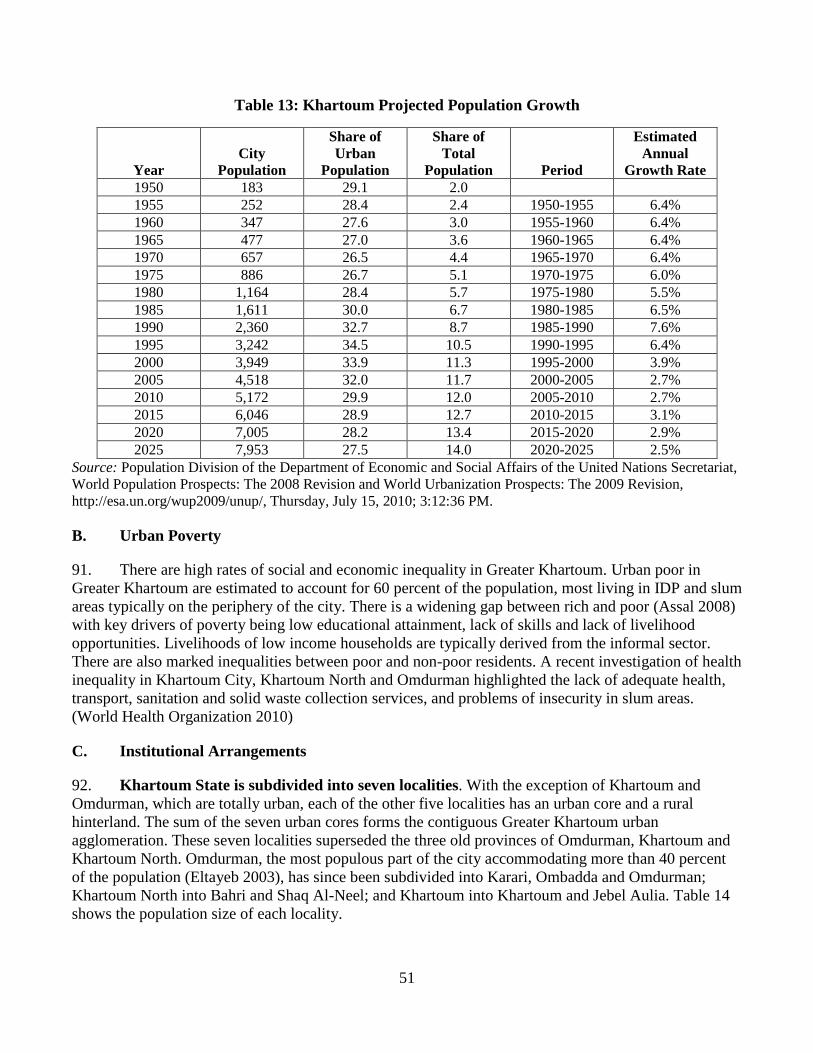
51
Table 13: Khartoum Projected Population Growth
Year
City
Population
Share of
Urban
Population
Share of
Total
Population Period
Estimated
Annual
Growth Rate
1950 183 29.1 2.0
1955 252 28.4 2.4 1950-1955 6.4%
1960 347 27.6 3.0 1955-1960 6.4%
1965 477 27.0 3.6 1960-1965 6.4%
1970 657 26.5 4.4 1965-1970 6.4%
1975 886 26.7 5.1 1970-1975 6.0%
1980 1,164 28.4 5.7 1975-1980 5.5%
1985 1,611 30.0 6.7 1980-1985 6.5%
1990 2,360 32.7 8.7 1985-1990 7.6%
1995 3,242 34.5 10.5 1990-1995 6.4%
2000 3,949 33.9 11.3 1995-2000 3.9%
2005 4,518 32.0 11.7 2000-2005 2.7%
2010 5,172 29.9 12.0 2005-2010 2.7%
2015 6,046 28.9 12.7 2010-2015 3.1%
2020 7,005 28.2 13.4 2015-2020 2.9%
2025 7,953 27.5 14.0 2020-2025 2.5%
Source: Population Division of the Department of Economic and Social Affairs of the United Nations Secretariat,
World Population Prospects: The 2008 Revision and World Urbanization Prospects: The 2009 Revision,
http://esa.un.org/wup2009/unup/, Thursday, July 15, 2010; 3:12:36 PM.
B. Urban Poverty
91. There are high rates of social and economic inequality in Greater Khartoum. Urban poor in
Greater Khartoum are estimated to account for 60 percent of the population, most living in IDP and slum
areas typically on the periphery of the city. There is a widening gap between rich and poor (Assal 2008)
with key drivers of poverty being low educational attainment, lack of skills and lack of livelihood
opportunities. Livelihoods of low income households are typically derived from the informal sector.
There are also marked inequalities between poor and non-poor residents. A recent investigation of health
inequality in Khartoum City, Khartoum North and Omdurman highlighted the lack of adequate health,
transport, sanitation and solid waste collection services, and problems of insecurity in slum areas.
(World Health Organization 2010)
C. Institutional Arrangements
92. Khartoum State is subdivided into seven localities. With the exception of Khartoum and
Omdurman, which are totally urban, each of the other five localities has an urban core and a rural
hinterland. The sum of the seven urban cores forms the contiguous Greater Khartoum urban
agglomeration. These seven localities superseded the three old provinces of Omdurman, Khartoum and
Khartoum North. Omdurman, the most populous part of the city accommodating more than 40 percent
of the population (Eltayeb 2003), has since been subdivided into Karari, Ombadda and Omdurman;
Khartoum North into Bahri and Shaq Al-Neel; and Khartoum into Khartoum and Jebel Aulia. Table 14
shows the population size of each locality.

52
Table 14: Population of Khartoum State Localities
Locality Area (sq. km.) 2008 Population
Omdurman 1. Karari
714,079
2. Ombadda
988,163
3. Omdurman
513,088
Khartoum North 4. Bahri
608,817
5. Sharq Al-Neel
868,147
Khartoum 6. Khartoum
639,598
7. Jebel Aulia
942,429
Total 22,060 5,274,321
93. Khartoum State operates at state and locality levels. The state is headed by a governor (wali)
appointed by the President, a cabinet of state ministers and a legislative council, with political, executive
and supervisory roles. At the locality level, each locality has its own local legislative council and is
headed by a commissioner (moa'tamad) appointed by the governor. Each locality might have various
administrative units, however these don‘t have any legal identity distinct from the locality.
94. It should be noted that the number of ministries in Khartoum State exceeds the average of six
ministries in other states (namely ministries of education, health, finance, physical planning, social and
cultural affairs, agriculture). This large number of ministries reflects the complexity of issues in
Khartoum, which necessitated creating separate ministries (e.g. ministry of infrastructure). Furthermore,
since Khartoum State includes the national capital, it is a highly contested state to which many political
parties and social groups lay claims. In many instances, ministries were created and offered to some of
those in response to their claims and to ensure their allegiances. Each ministry has a minister, appointed
by the governor, budget and staff that vary in their number and specialties. The responsibilities of each
ministry are spelled out in a decree that has been issued by the governor and passed by the state
legislature.
95. The localities' Commissioners are members of the state's Council of Ministers but they don't
have voting rights, and their absence doesn't affect the Cabinet's quorum. They are in charge of security
and service provision within their local jurisdictions. Each ministry has a local branch in each locality
through which services are delivered. Furthermore, national agencies such as the Urban Water
Corporation and the National Electricity Corporation have local offices at each locality through which
their services are coordinated and managed. The Moa'tamad liaises with the ministries and corporations
to ensure that services are delivered to his/her locality sufficiently and in a timely manner.
96. All staff in the locality with the exception of teachers are assigned from the state ministries. Staff
salaries are paid by the localities.
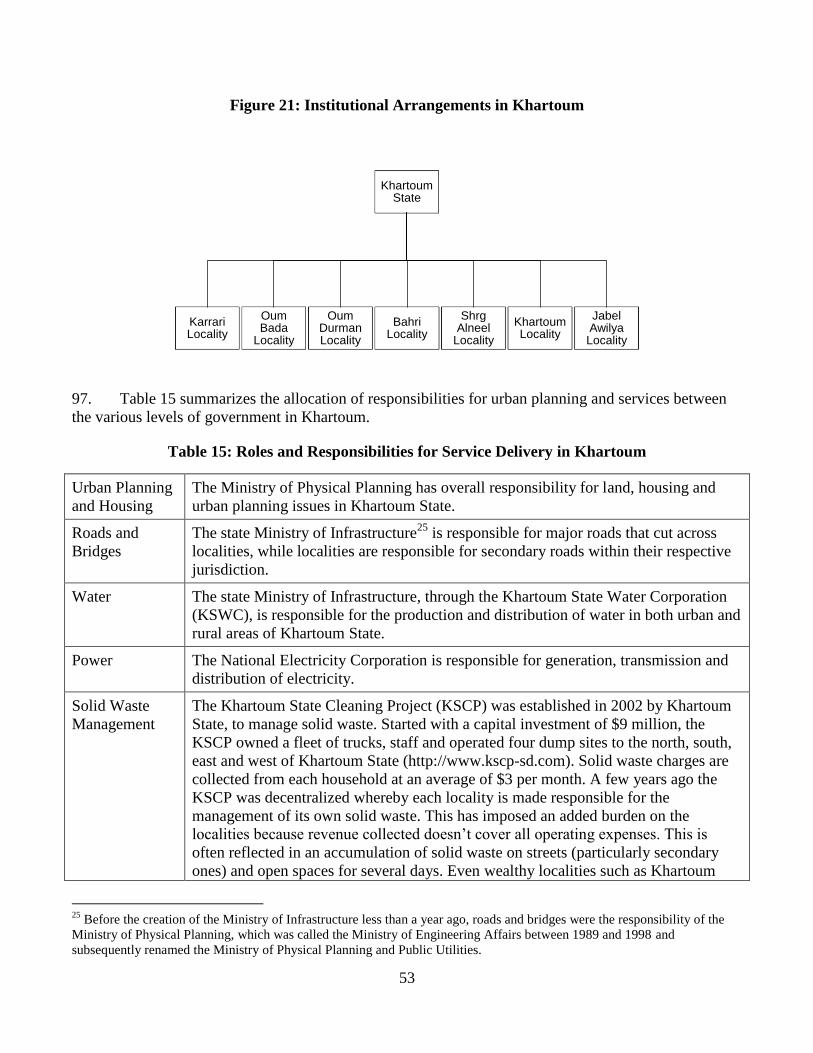
53
Figure 21: Institutional Arrangements in Khartoum
Khartoum State
KarrariLocality
OumBada
Locality
OumDurmanLocality
BahriLocality
ShrgAlneel
Locality
Khartoum Locality
JabelAwilyaLocality
97. Table 15 summarizes the allocation of responsibilities for urban planning and services between
the various levels of government in Khartoum.
Table 15: Roles and Responsibilities for Service Delivery in Khartoum
Urban Planning
and Housing
The Ministry of Physical Planning has overall responsibility for land, housing and
urban planning issues in Khartoum State.
Roads and
Bridges
The state Ministry of Infrastructure25
is responsible for major roads that cut across
localities, while localities are responsible for secondary roads within their respective
jurisdiction.
Water The state Ministry of Infrastructure, through the Khartoum State Water Corporation
(KSWC), is responsible for the production and distribution of water in both urban and
rural areas of Khartoum State.
Power The National Electricity Corporation is responsible for generation, transmission and
distribution of electricity.
Solid Waste
Management
The Khartoum State Cleaning Project (KSCP) was established in 2002 by Khartoum
State, to manage solid waste. Started with a capital investment of $9 million, the
KSCP owned a fleet of trucks, staff and operated four dump sites to the north, south,
east and west of Khartoum State (http://www.kscp-sd.com). Solid waste charges are
collected from each household at an average of $3 per month. A few years ago the
KSCP was decentralized whereby each locality is made responsible for the
management of its own solid waste. This has imposed an added burden on the
localities because revenue collected doesn‘t cover all operating expenses. This is
often reflected in an accumulation of solid waste on streets (particularly secondary
ones) and open spaces for several days. Even wealthy localities such as Khartoum
25
Before the creation of the Ministry of Infrastructure less than a year ago, roads and bridges were the responsibility of the
Ministry of Physical Planning, which was called the Ministry of Engineering Affairs between 1989 and 1998 and
subsequently renamed the Ministry of Physical Planning and Public Utilities.
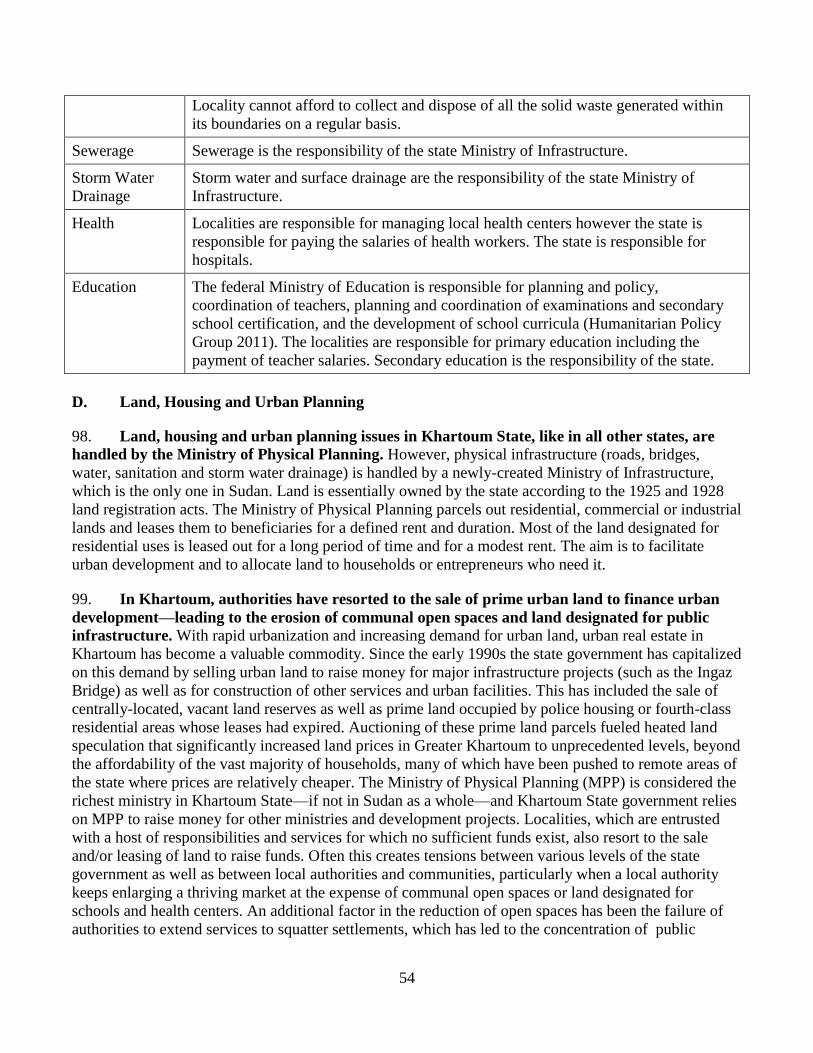
54
Locality cannot afford to collect and dispose of all the solid waste generated within
its boundaries on a regular basis.
Sewerage Sewerage is the responsibility of the state Ministry of Infrastructure.
Storm Water
Drainage
Storm water and surface drainage are the responsibility of the state Ministry of
Infrastructure.
Health Localities are responsible for managing local health centers however the state is
responsible for paying the salaries of health workers. The state is responsible for
hospitals.
Education The federal Ministry of Education is responsible for planning and policy,
coordination of teachers, planning and coordination of examinations and secondary
school certification, and the development of school curricula (Humanitarian Policy
Group 2011). The localities are responsible for primary education including the
payment of teacher salaries. Secondary education is the responsibility of the state.
D. Land, Housing and Urban Planning
98. Land, housing and urban planning issues in Khartoum State, like in all other states, are
handled by the Ministry of Physical Planning. However, physical infrastructure (roads, bridges,
water, sanitation and storm water drainage) is handled by a newly-created Ministry of Infrastructure,
which is the only one in Sudan. Land is essentially owned by the state according to the 1925 and 1928
land registration acts. The Ministry of Physical Planning parcels out residential, commercial or industrial
lands and leases them to beneficiaries for a defined rent and duration. Most of the land designated for
residential uses is leased out for a long period of time and for a modest rent. The aim is to facilitate
urban development and to allocate land to households or entrepreneurs who need it.
99. In Khartoum, authorities have resorted to the sale of prime urban land to finance urban
development—leading to the erosion of communal open spaces and land designated for public
infrastructure. With rapid urbanization and increasing demand for urban land, urban real estate in
Khartoum has become a valuable commodity. Since the early 1990s the state government has capitalized
on this demand by selling urban land to raise money for major infrastructure projects (such as the Ingaz
Bridge) as well as for construction of other services and urban facilities. This has included the sale of
centrally-located, vacant land reserves as well as prime land occupied by police housing or fourth-class
residential areas whose leases had expired. Auctioning of these prime land parcels fueled heated land
speculation that significantly increased land prices in Greater Khartoum to unprecedented levels, beyond
the affordability of the vast majority of households, many of which have been pushed to remote areas of
the state where prices are relatively cheaper. The Ministry of Physical Planning (MPP) is considered the
richest ministry in Khartoum State—if not in Sudan as a whole—and Khartoum State government relies
on MPP to raise money for other ministries and development projects. Localities, which are entrusted
with a host of responsibilities and services for which no sufficient funds exist, also resort to the sale
and/or leasing of land to raise funds. Often this creates tensions between various levels of the state
government as well as between local authorities and communities, particularly when a local authority
keeps enlarging a thriving market at the expense of communal open spaces or land designated for
schools and health centers. An additional factor in the reduction of open spaces has been the failure of
authorities to extend services to squatter settlements, which has led to the concentration of public

55
facilities (including schools, clinics and other social infrastructure) in the existing planned settlements
(so called old quarters), which service communities in both planned and squatter settlements.
100. The urban layout of Greater Khartoum is derived from British colonial practices, which
established a system of land use based on English, Egyptian and ―native‖ ownership. Greater
Khartoum consists of three main zones corresponding to the old provinces of Khartoum, Omdurman and
Khartoum North. Khartoum has historically been identified as a commercial hub, Khartoum North
associated with industry and Omdurman with cultural history (the site of the old Madhist capital) and
agricultural links (Humanitarian Policy Group 2011). Historically, certain areas of the city have been
associated with (or designated for) particular segments of the workforce (e.g. industrial laborer, military
and civil servants) (Humanitarian Policy Group 2011). The colonial system restricted ―native
ownership‖ in efforts to prevent the mass settlement of Sudanese in the city, and this hierarchy was
supported by a system of zoning based on first, second, third and fourth class areas, with different plot
sizes and housing classifications. This zoning system remains in place today and informs urban planning
practices.
101. Greater Khartoum has undergone several large-scale, long-range planning efforts, which
have proposed scenarios for directing growth. The most recent physical plan is currently being
finalized. Many of the recommendations implicit in these plans have not received adequate attention or
have been resisted. For example, the proposed relocation of Khartoum International Airport, the Military
Headquarters, and the main railway station and yard adjacent to Khartoum's CBD, all of which occupy
vast areas in prime locations that have been engulfed by residential and commercial areas and arguably
obstruct the smooth flow of traffic between various parts of Khartoum. Nevertheless, efforts to relocate
them, which started as soon as the first master plan was approved in the late 1950s, have been futile. The
weak capacity of planning institutions, lack of finance, political instability, rapid urbanization and the
growth of informal settlements have also impeded implementation of most of the master plans proposals
(UN-HABITAT 2009). For example, in 1978 a decision taken by the Central Town Planning Board to
double and triple plot sizes undermined the provision of infrastructure and services (UN-HABITAT
2009).
Table 16: Khartoum Master Plans
Timeframe Targeted
Population
Total
Area
Gross Density
(Population per
hectare)
Doxiadis (1958) 793,000 182 44 then altered to 15
MEFFIT (1977) 2.5 million 1,103 23
Doxiadis and Abdel Moneim
Mustafa and Partners (1991)
1991-2000 5.3 million 1,441 37
MEFFIT in partnership
CENTECS (Ongoing)
2007-2033 7 million 1,650 42
102. Rapid urban population growth has led to a rapid expansion and sprawl of the city. The
substantial horizontal expansion of Greater Khartoum (Table 17) has been driven by high population
growth, abundance of land, availability of cheap building materials and a government policy of
allocating a plot to every family (Eltayeb 2003). Rapid population growth is manifested in an
uncontrolled expansion fueled by planned new extensions, incorporation of villages and unauthorized
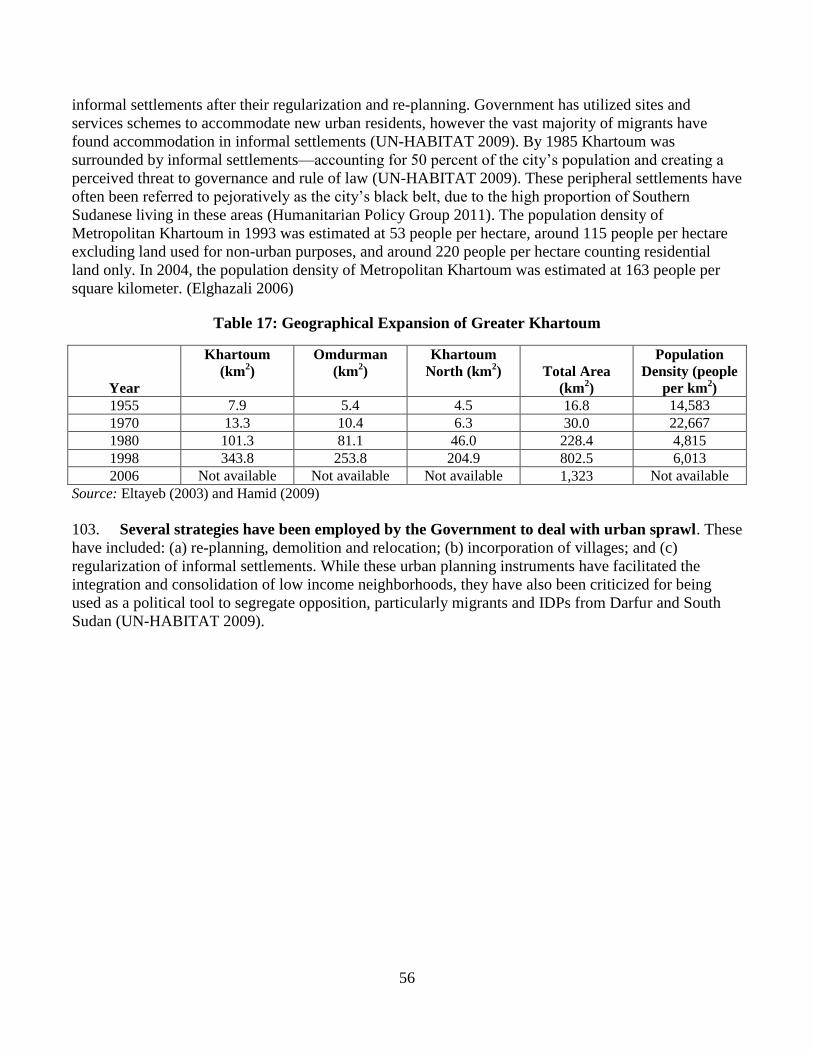
56
informal settlements after their regularization and re-planning. Government has utilized sites and
services schemes to accommodate new urban residents, however the vast majority of migrants have
found accommodation in informal settlements (UN-HABITAT 2009). By 1985 Khartoum was
surrounded by informal settlements—accounting for 50 percent of the city‘s population and creating a
perceived threat to governance and rule of law (UN-HABITAT 2009). These peripheral settlements have
often been referred to pejoratively as the city‘s black belt, due to the high proportion of Southern
Sudanese living in these areas (Humanitarian Policy Group 2011). The population density of
Metropolitan Khartoum in 1993 was estimated at 53 people per hectare, around 115 people per hectare
excluding land used for non-urban purposes, and around 220 people per hectare counting residential
land only. In 2004, the population density of Metropolitan Khartoum was estimated at 163 people per
square kilometer. (Elghazali 2006)
Table 17: Geographical Expansion of Greater Khartoum
Year
Khartoum
(km2)
Omdurman
(km2)
Khartoum
North (km2) Total Area
(km2)
Population
Density (people
per km2)
1955 7.9 5.4 4.5 16.8 14,583
1970 13.3 10.4 6.3 30.0 22,667
1980 101.3 81.1 46.0 228.4 4,815
1998 343.8 253.8 204.9 802.5 6,013
2006 Not available Not available Not available 1,323 Not available
Source: Eltayeb (2003) and Hamid (2009)
103. Several strategies have been employed by the Government to deal with urban sprawl. These
have included: (a) re-planning, demolition and relocation; (b) incorporation of villages; and (c)
regularization of informal settlements. While these urban planning instruments have facilitated the
integration and consolidation of low income neighborhoods, they have also been criticized for being
used as a political tool to segregate opposition, particularly migrants and IDPs from Darfur and South
Sudan (UN-HABITAT 2009).
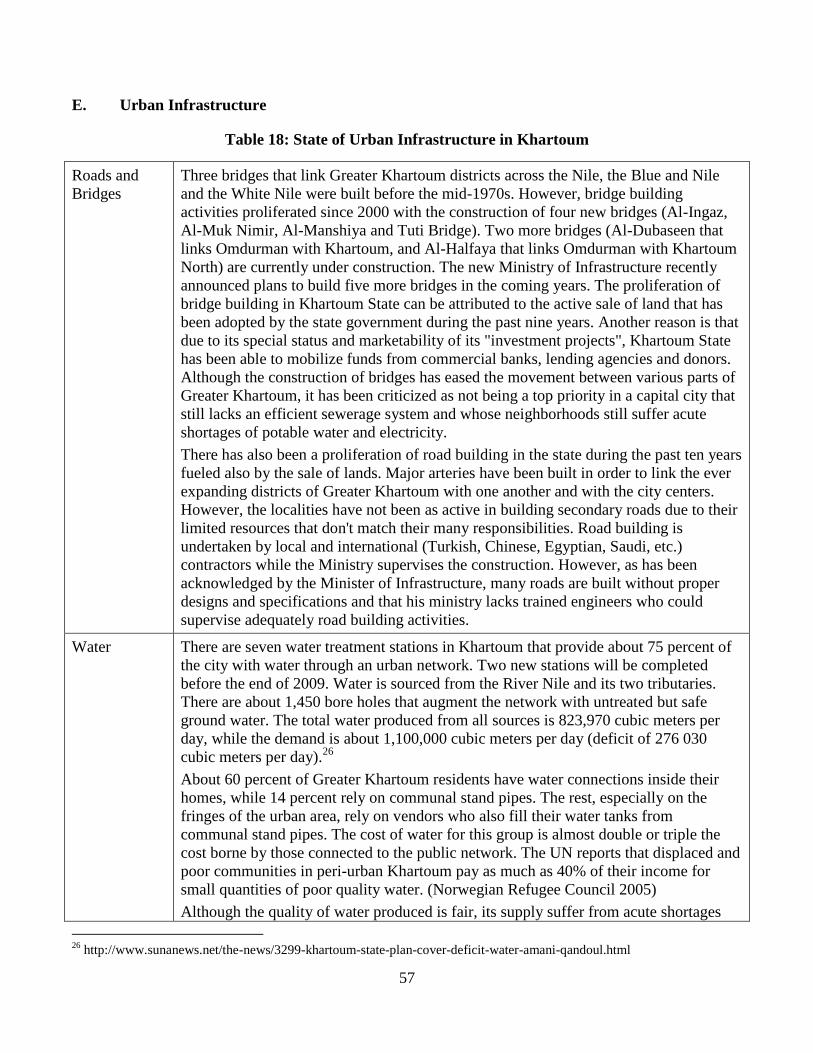
57
E. Urban Infrastructure
Table 18: State of Urban Infrastructure in Khartoum
Roads and
Bridges
Three bridges that link Greater Khartoum districts across the Nile, the Blue and Nile
and the White Nile were built before the mid-1970s. However, bridge building
activities proliferated since 2000 with the construction of four new bridges (Al-Ingaz,
Al-Muk Nimir, Al-Manshiya and Tuti Bridge). Two more bridges (Al-Dubaseen that
links Omdurman with Khartoum, and Al-Halfaya that links Omdurman with Khartoum
North) are currently under construction. The new Ministry of Infrastructure recently
announced plans to build five more bridges in the coming years. The proliferation of
bridge building in Khartoum State can be attributed to the active sale of land that has
been adopted by the state government during the past nine years. Another reason is that
due to its special status and marketability of its "investment projects", Khartoum State
has been able to mobilize funds from commercial banks, lending agencies and donors.
Although the construction of bridges has eased the movement between various parts of
Greater Khartoum, it has been criticized as not being a top priority in a capital city that
still lacks an efficient sewerage system and whose neighborhoods still suffer acute
shortages of potable water and electricity.
There has also been a proliferation of road building in the state during the past ten years
fueled also by the sale of lands. Major arteries have been built in order to link the ever
expanding districts of Greater Khartoum with one another and with the city centers.
However, the localities have not been as active in building secondary roads due to their
limited resources that don't match their many responsibilities. Road building is
undertaken by local and international (Turkish, Chinese, Egyptian, Saudi, etc.)
contractors while the Ministry supervises the construction. However, as has been
acknowledged by the Minister of Infrastructure, many roads are built without proper
designs and specifications and that his ministry lacks trained engineers who could
supervise adequately road building activities.
Water There are seven water treatment stations in Khartoum that provide about 75 percent of
the city with water through an urban network. Two new stations will be completed
before the end of 2009. Water is sourced from the River Nile and its two tributaries.
There are about 1,450 bore holes that augment the network with untreated but safe
ground water. The total water produced from all sources is 823,970 cubic meters per
day, while the demand is about 1,100,000 cubic meters per day (deficit of 276 030
cubic meters per day).26
About 60 percent of Greater Khartoum residents have water connections inside their
homes, while 14 percent rely on communal stand pipes. The rest, especially on the
fringes of the urban area, rely on vendors who also fill their water tanks from
communal stand pipes. The cost of water for this group is almost double or triple the
cost borne by those connected to the public network. The UN reports that displaced and
poor communities in peri-urban Khartoum pay as much as 40% of their income for
small quantities of poor quality water. (Norwegian Refugee Council 2005)
Although the quality of water produced is fair, its supply suffer from acute shortages
26
http://www.sunanews.net/the-news/3299-khartoum-state-plan-cover-deficit-water-amani-qandoul.html

58
caused by inadequate output of the treatment stations, shortage of funds and trained
manpower for periodic maintenance, frequent leakages from dilapidated water
networks, and frequent electric power outages that hinder the pumping stations and the
extraction and pumping of ground water. Serious water shortages during summer, when
the Nile water recedes, and during the river flooding months, when water purification is
severely stalled, are annual episodes that occupy the local and national media for
several months.
The summer of 2009 witnessed severe water shortages that left vast areas of the state
without water for several days. The State government responded by allocating SDG 70
million (about $28 million) as an emergency fund to rehabilitate existing water
treatment and supply facilities and to establish new ones. Among the justifications cited
by the KSWC for the serious water shortages was the cutoff of electric power from
water treatment and distribution facilities imposed by the National Electricity
Corporation (NEC) because KSWC failed to settle its outstanding electricity bills. This
led to a presidential decree prohibiting NEC from doing so. KSWC also attributed its
shortages of funds to government agencies, public schools, mosques, hospitals, etc. that
don't pay their water bills. According to KSWC, those dues amounted to SDG 3.6
million (about $1.4 million).
The acute shortage of potable water in vast areas of Greater Khartoum, and its
concomitant exorbitant prices for those who lack it, is one of the great ironies of
urbanization in Greater Khartoum, which is traversed by three major sources of fresh
water. Obviously, the state government needs to make potable water the top priority
and to invest heavily in new treatment plants and distribution networks.
Power A national grid transmits the electricity generated from four hydro-power stations and
numerous thermal power stations to urban and rural areas in Sudan including Khartoum
State. There are no estimates of how much of the total electricity generated is
consumed by Khartoum State but taking into consideration that it has the largest urban
agglomeration and the most industrial and commercial establishments in the country, it
would not be a great surprise if an accurate accounting of electricity consumption
reveals that it consumes at least 50 percent of total production.
In spite of that, there are vast areas of Greater Khartoum, especially new extensions and
informal settlements that are still not supplied with electricity by the NEC. The lucky
half who are connected to the national grid, the service suffer from frequent power
outages due to over-loading in some areas, dilapidated transformers, and overhead
cables and poles which expose them to severe weather conditions and accidents.
By introducing advance payment meters about 15 years ago, the NEC has been
successful in recovering the dues from most consumers—particularly in the domestic
and industrial sectors. Of late it started to cut off its services from government agencies
and public facilities (viz. schools, mosques, hospitals, etc.) that do not pay their bills
regularly in order to pressure them to pay.
Solid Waste
Management
The High Council for Environment and Natural Resources (HCENR) estimates that the
amount of waste generated by households in Khartoum in 2007 was 3.78
kilograms/household/day. This means on average about 3,000 – 4,000 tons of solid
waste is generated per day. Added to that is solid waste generated by industrial and

59
commercial establishments that can be estimated at 1,000 tons per day.
Sewerage A public sewer, established during 1954-1963, covers only Khartoum city center,
Khartoum 1, 2, 3 and Al-Amarat districts, and a small section of Khartoum North.
According to the Sudanese Environment Conservation Society 2006 Report, only 2.8
percent of houses in the state are connected to the municipal sewerage system. About
69 percent of households depend on on-site sewage disposal using pit latrines and soak-
away pits. Septic tanks are used by only 11 percent because of their high installation
and running expenses. The rest of the state population (about 17 percent of
households), particularly those living on the outskirts of the urban area, does not have
any sanitation facilities within their houses and defecate on vacant plots and/or on
nearby no-man's lands, thereby increasing the risk of spread of endemic diseases. The
extensive use of pit latrines, septic tanks and soak away pits could lead to
contamination of the ground water, which is a major source of potable water in the
state. Due to high capital costs, authorities have been reluctant to expand the sewerage
network. Financial and technical problems hindered the rehabilitation program of the
municipal sewerage network that was started in 1981 leaving the system overloaded
and prone to frequent overflows.
Storm Water
Drainage
Drainage of run-off rain water is one of the major challenges in Greater Khartoum.
Although the annual rain fall is not high (about 120 mm), which falls usually during
June to September, lack of proper drains results in accumulation of rain water on streets
and open spaces for several days and weeks. This facilitates the breeding of mosquitoes
and flies which lead to the spread of serious diseases such as malaria, diarrhea, etc.
The State is also prone to seasonal flooding of dry rivers (wadi) and natural ditches
(khor) that traverse the state and drain run-off rain water from surrounding plains to the
Nile. Due to hyper-urbanization in Greater Khartoum, some households have
informally erected their shelters on those wadis and khors which cause massive
destruction and loss of life and property when they overflow their boundaries.
Infamous man-made disasters due to flooding occurred in 1988, 1998 and 2006.
The rainy season of 2009 was one of the seasons that wrought havoc in Greater
Khartoum. According to the state government estimates, some 10,247 houses were
either totally or partially destroyed by the torrential rains that fell in late August.
Moreover, about 168 basic schools and 45 secondary schools were destroyed forcing
the Government to close down all schools for two weeks so as to protect students' lives.
Official reports put the death toll at 27 (Al-Sahafa, 5th September 2009, page 1).
Unofficial estimates cite a much higher figure of 74 deaths due to falling roofs and
walls, electric shocks, drowning, etc.
Each year Khartoum State spends millions of dollars on digging/cleaning/constructing
rain water drains. However, improper gradients, deficient designs and poor
construction render those drains ineffective. New paved roads are often constructed
without due attention to storm water drainage, thus they often act as embankments that
trap rain water causing it to accumulate and destroy houses. Incidents of communities
that cut through paved roads to facilitate drainage of accumulated rain waters abound in
Greater Khartoum. Khartoum State government acknowledged the failure of the
drainage system it has paid for and attributed that to the high cost of constructing
proper drains and to the lack of trained engineers within its Ministry of Infrastructure
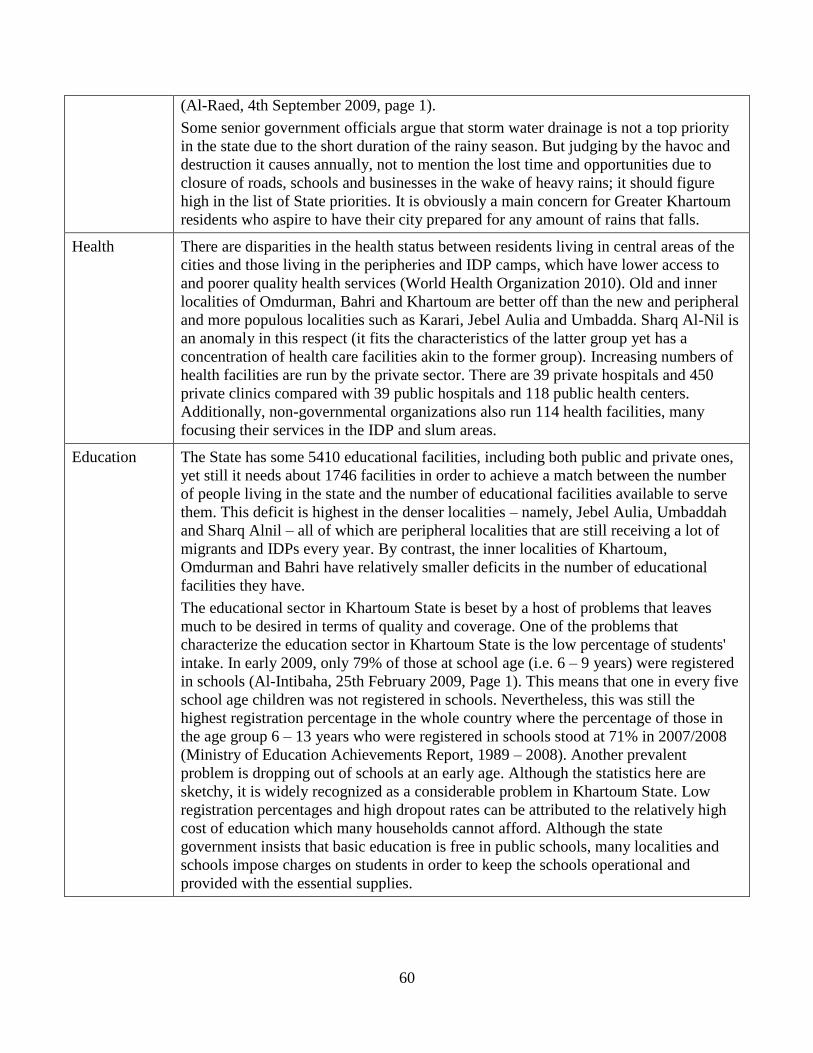
60
(Al-Raed, 4th September 2009, page 1).
Some senior government officials argue that storm water drainage is not a top priority
in the state due to the short duration of the rainy season. But judging by the havoc and
destruction it causes annually, not to mention the lost time and opportunities due to
closure of roads, schools and businesses in the wake of heavy rains; it should figure
high in the list of State priorities. It is obviously a main concern for Greater Khartoum
residents who aspire to have their city prepared for any amount of rains that falls.
Health There are disparities in the health status between residents living in central areas of the
cities and those living in the peripheries and IDP camps, which have lower access to
and poorer quality health services (World Health Organization 2010). Old and inner
localities of Omdurman, Bahri and Khartoum are better off than the new and peripheral
and more populous localities such as Karari, Jebel Aulia and Umbadda. Sharq Al-Nil is
an anomaly in this respect (it fits the characteristics of the latter group yet has a
concentration of health care facilities akin to the former group). Increasing numbers of
health facilities are run by the private sector. There are 39 private hospitals and 450
private clinics compared with 39 public hospitals and 118 public health centers.
Additionally, non-governmental organizations also run 114 health facilities, many
focusing their services in the IDP and slum areas.
Education The State has some 5410 educational facilities, including both public and private ones,
yet still it needs about 1746 facilities in order to achieve a match between the number
of people living in the state and the number of educational facilities available to serve
them. This deficit is highest in the denser localities – namely, Jebel Aulia, Umbaddah
and Sharq Alnil – all of which are peripheral localities that are still receiving a lot of
migrants and IDPs every year. By contrast, the inner localities of Khartoum,
Omdurman and Bahri have relatively smaller deficits in the number of educational
facilities they have.
The educational sector in Khartoum State is beset by a host of problems that leaves
much to be desired in terms of quality and coverage. One of the problems that
characterize the education sector in Khartoum State is the low percentage of students'
intake. In early 2009, only 79% of those at school age (i.e. 6 – 9 years) were registered
in schools (Al-Intibaha, 25th February 2009, Page 1). This means that one in every five
school age children was not registered in schools. Nevertheless, this was still the
highest registration percentage in the whole country where the percentage of those in
the age group 6 – 13 years who were registered in schools stood at 71% in 2007/2008
(Ministry of Education Achievements Report, 1989 – 2008). Another prevalent
problem is dropping out of schools at an early age. Although the statistics here are
sketchy, it is widely recognized as a considerable problem in Khartoum State. Low
registration percentages and high dropout rates can be attributed to the relatively high
cost of education which many households cannot afford. Although the state
government insists that basic education is free in public schools, many localities and
schools impose charges on students in order to keep the schools operational and
provided with the essential supplies.

61
F. Municipal Finance
104. The Khartoum State Constitution and Local Government Act specify the sources of revenue
available to the localities. The 2009 State budget, as passed by the state legislature and signed by the
governor on 28th December 2008 amounted to SDG 1,776,614,000 (about $808 million). A summary of
the state budget is presented in Table 19, and the locality budgets in Table 20.
105. At the locality level, sources of revenue include both transfers from the state and dues. For
example in Khartoum Locality, transfers account for a third of the locality revenues, while dues account
for two thirds of locality revenues. In Omdurman Locality transfers account for approximately forty
percent of local revenues. Dues include property taxes, service fees and business license fees.
Table 19: 2009 Khartoum State Budget
US$ = SDG 2.2 Ministries Localities Total
US$
Equivalent
Revenues 1,491,415 285,199 1,776,614 807,551,818
Municipalities Share (278,824) 278,824 -
Net Revenues 1,203,591 573,023 1,776,614 807,551,818
Expenditures
Chapter One (Salaries) 239,160 311,553 550,713 250,324,091
Chapter Two (Running Expenses) 268,842 85,319 354,161 160,982,273
Chapter Three (Reserves) 13,500 5,640 19,140 8,700,000
Chapter Four (Development Allocations) 652,089 153,366 805,455 366,115,909
Reserves 30,000 17,145 47,145 21,429,000
Total Expenditures 1,203,591 573,023 1,776,614 807,551,818
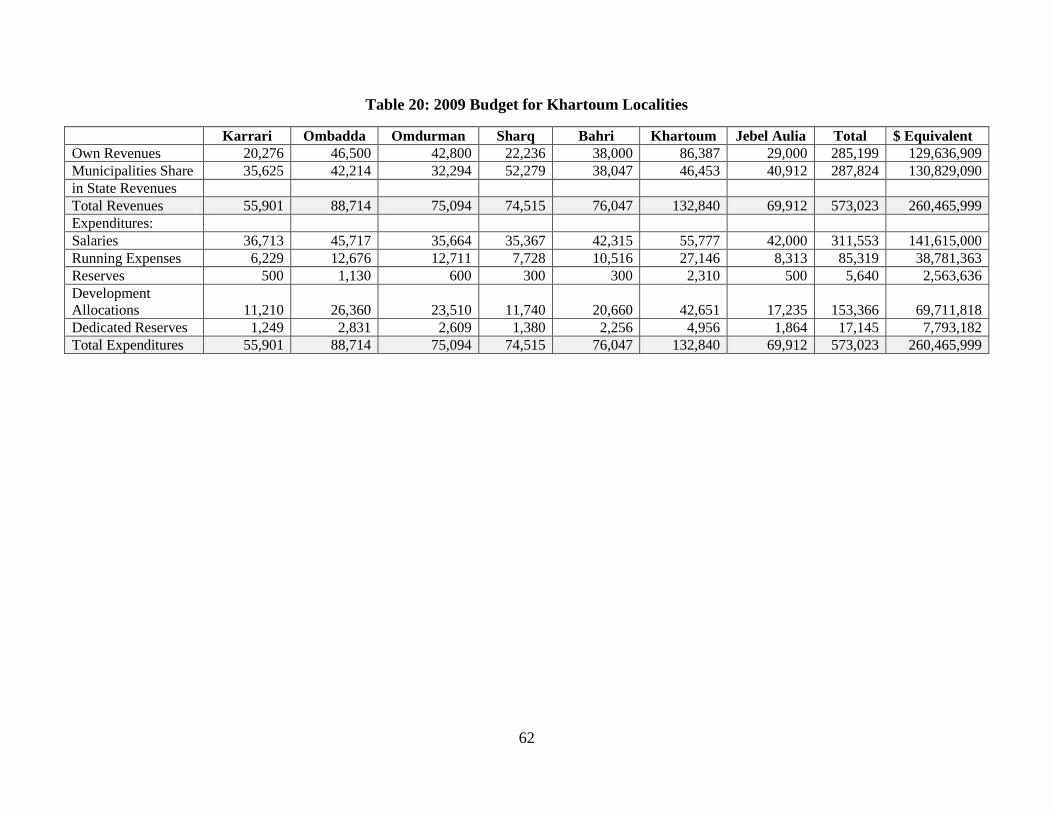
62
Table 20: 2009 Budget for Khartoum Localities
Karrari Ombadda Omdurman Sharq Bahri Khartoum Jebel Aulia Total $ Equivalent
Own Revenues 20,276 46,500 42,800 22,236 38,000 86,387 29,000 285,199 129,636,909
Municipalities Share 35,625 42,214 32,294 52,279 38,047 46,453 40,912 287,824 130,829,090
in State Revenues
Total Revenues 55,901 88,714 75,094 74,515 76,047 132,840 69,912 573,023 260,465,999
Expenditures:
Salaries 36,713 45,717 35,664 35,367 42,315 55,777 42,000 311,553 141,615,000
Running Expenses 6,229 12,676 12,711 7,728 10,516 27,146 8,313 85,319 38,781,363
Reserves 500 1,130 600 300 300 2,310 500 5,640 2,563,636
Development
Allocations 11,210 26,360 23,510 11,740 20,660 42,651 17,235 153,366 69,711,818
Dedicated Reserves 1,249 2,831 2,609 1,380 2,256 4,956 1,864 17,145 7,793,182
Total Expenditures 55,901 88,714 75,094 74,515 76,047 132,840 69,912 573,023 260,465,999

63
ANNEX B: NYALA CASE STUDY
A. Population Growth
106. Nyala’s growth derives from its importance as an economic, transport and administrative
hub. Nyala has always been an important hub for intercontinental trade and pilgrimage routes (with
routes to Chad, Central Africa Republic, Khartoum and South Sudan), enhanced significantly with the
extension of the railway line to Nyala in the 1950s. Nyala has also been a significant commercial and
service center for a thriving regional economy based on agriculture and animal husbandry. In 1995,
Nyala was selected as the capital of the newly founded Southern Darfur State, while Al Fashir
(previously the administrative capital of the Darfur region) became the capital of Northern Darfur State.
In addition to its geographical and strategic importance as an administrative, economic and transport
hub, several other factors have influenced Nyala‘s historical growth. Firstly, Nyala is endowed with
ample ground water that provides most of its population with a ready water supply. Secondly, prolonged
periods of drought that affected the African Sahel in the late 1960s, early 1970s and mid 1980s forced
thousands of people out of their homelands in search of food, water and alternative livelihood
opportunities—for many of them Nyala proved to be a viable refuge. And most recently, Nyala has been
a refuge for significant numbers of people affected and displaced by the protracted conflict in Darfur—
dramatically increasing the urban population.
107. The population of Nyala is growing at a rapid rate—approximately 6.7 percent per annum
from 1993 to 2008. Table 21 sets out the census population figures and intercensal growth rates for
Nyala. The most significant driver of recent growth is the protracted conflict in the Darfur region, which
has resulted in massive displacement of population from rural to urban areas. While the data suggests
that the population of Nyala is now 630,00027
, others claim that the population in Nyala exceeds 1.3
million people (1.6 million including those living in IDP camps), suggesting that one in four Darfurians
now live in Nyala and its surrounding areas (de Waal, Making Sense of Sudan: Do Darfur IDPs Have an
Urban Future 2008). Other reports suggest that roughly half of Darfurians live in and near major urban
areas or along the routes that link them (United Nations 2010), or that one third of Darfurians live in
rural areas, one third in urban areas, and one third displaced (Assal 2008).
Table 21: Population Growth in Nyala
Census Population (000's)
Annual Intercensal
Growth Rate
1955/56 12
1973 60 9.2%
1983 144 8.8%
1993 230 4.7%
2008 630 6.7%
108. Since 2003 Nyala has served as a safe haven for hundreds of thousands of internally-
displaced persons (IDPs) affected by the conflict in Darfur. In the fragile security situation of Darfur,
Nyala is better off than other urban areas because it is heavily guarded by the army. This relative
security makes it an attractive refuge for IDPs who feel threatened in their villages and small towns. The
27
The corresponding population figures for Al Fashir for the same five censuses were 28, 52, 84, 142, 504 respectively,
which indicate that since 1973 Nyala has outstripped Al Fashir as the largest and fastest growing city in Darfur.

64
city now accommodates three IDP camps (Diraij, Siraif, and Attash) that house an estimated 40,000
IDPs. A fourth camp, Kilma (or Kalma) attached to another locality is situated a few miles from Nyala
and accommodates about 150,000 people.28
Furthermore, thousands of IDPs have squatted on lands
within the urban limits belonging to other residents or to the government, and thousands of others have
joined their families and relatives in neighborhoods of Nyala. The influx of IDPs to Nyala has caused
severe strains on its fragile service networks, and many residential quarters and camps have no reliable
water supply, no sanitation facilities or solid waste disposal systems.
109. Government at national and state levels is keen to dissolve the IDP camps as soon as
possible—it is likely however that many IDPs will choose to remain. Authorities are presenting IDPs
with two options: either integrate fully into Nyala or return to their homelands. Last year about 900
households were allocated free plots and services in one of Nyala neighborhoods, intended as a model
for integration of IDPs with the host community. Since conflict persists in various parts of Darfur, IDPs
are reluctant to return home, and experience from elsewhere in the region suggests that a large
proportion of IDPs are likely to remain in Nyala. Although most IDPs live in camps and depend on
relief agencies many of them utilize markets of Nyala to shop and engage in small scale trade. Many
IDPs live within relatively short distances of their original homes, enabling them to maintain links and
engage in seasonal farming (Humanitarian Policy Group 2011).
110. Rapid urban population and continued insecurity coupled with poor infrastructure and
weak fiscal capacity presents enormous challenges for the state and locality governments. The
explosion of the urban population in Nyala has overwhelmed existing infrastructure and service
networks, and sharply increased demand for residential land. The sustained conflict has also had a
negative impact on the urban economy leading to the contraction of government revenues. Government
spending has also been diverted to security related expenditures and away from other priorities. As a
consequence, the challenges for Nyala and other urban areas in the Darfur region are enormous—how to
meet the rapidly increasing demands for services with declining funds available for investment in
expanding service networks.
B. Urban Economy
111. The urban economy of Nyala is intrinsically linked with the agricultural economy of South
Darfur state. Nyala‘s economy is linked to that of its agricultural hinterlands, providing a location for
the trade and processing of agricultural products such as groundnuts, millet, sorghum, gum Arabic,
sesame, kerkadeh and livestock. The protracted contract in the Darfur region has resulted in a massive
decline of agricultural and livestock production in South Darfur state, and has closed long-distance
livestock trading routes, which in turn has impacted agricultural markets in Nyala. Other trading routes
with neighboring countries have also been negatively impacted by insecurity and banditry. While the
conflict has seriously weakened certain sectors of the Darfur economy, it has artificially stimulated
others. For example, demand for construction materials (cement, bricks, metalwork, carpentry), some
food products (such as soft drinks), and rental vehicles has increased steeply with the growing presence
of international agencies in Nyala, transforming Nyala from a net exporter to a net importer of goods
(Humanitarian Policy Group 2011). The benefits of the boom in these sectors are not evenly spread. The
contraction of the economy is largely in the rural areas, while the urban economy remains more buoyant.
28
The UN-HABITAT report covers only three camps: Kalma (78,000 people ), Otash (14,000 people) and Derieg (13,000
people) (UN-HABITAT 2009).

65
As a consequence, the government has attempted to address decline in its tax base and revenues by
increasing taxes on enterprises in urban areas. One additional consequence of insecurity has been the
growth of peri-urban and urban agriculture (market gardening, dairy industry, and poultry raising), as
people relocate their farming activities from insecure rural areas to safer locations at the periphery of
towns. (Humanitarian Policy Group 2011)
C. Institutional Arrangements
112. As capital of Southern Darfur, Nyala is the seat of both state and local government
institutions. As the most populous of Southern Darfur‘s 12 localities and capital of Southern Darfur,
Nyala is the seat of the state government ministries, the governor's office, the state legislative assembly
and virtually all other state wide agencies and institutions. At the same time, it has its own local
government structure, headed by a commissioner. This dual role has given Nyala, like other state
capitals, an added advantage over other towns because state governments typically invest more in their
capital cities.
113. Political and decision making powers are concentrated in the office of the state governor
rather than the state ministries. The state government of South Darfur is composed of twelve
ministries: Education, Social Affairs, Health, Finance and Economy, Physical Planning and Public
Utilities, Local Government, State Affairs, Youth and Sports, Culture and Information, Animal
Resources, Agriculture and Irrigation, and the Humanitarian Aid Commission). After the 2006 Abuja
Peace Agreement signed by the national government and the rebel Sudan Liberation Movement (SLM),
new ministries and senior positions were created and assigned to SLM personnel. While in theory, the
state ministries, through the state ministry of finance, have the discretion to plan and prioritize
development projects, including those in urban areas, in reality it is the governor who sets policy and
establishes development priorities (Humanitarian Policy Group 2011). All legislation initiated and
passes by the state legislative council must be ratified by the governor (Humanitarian Policy Group
2011). With the imposition of emergency laws in the Darfur region in 2004, the discretionary powers of
the governor are even more pronounced (Humanitarian Policy Group 2011).
114. The institutional structure of the municipality corresponds with those elsewhere in the
country. Like other localities in Sudan, the Municipality of Nyala has a commissioner appointed by the
state governor usually from one of the state's strong ethnic or tribal groups. The municipality of Nyala
also has a locality council which is the legislative body of the locality. According to the local
government system, localities have the power to enact legislations and to impose fees and local taxes.
The municipality of Nyala has four administrative units: East, North, South and Central. Each unit has
its own offices responsible for service delivery and tax collection within its administrative boundaries.
Reports suggest that there are serious capacity issues at local government levels, which are exacerbated
by insufficient revenue to address the needs for infrastructure and social services (UN-HABITAT 2009).

66
Figure 22: Institutional Arrangements in Nyala
Southern Darfur State
Nyala Locality
Nyala East Administrative
Unit
Nyala North Administrative
Unit
Nyala South Administrative
Unit
Nyala Central Administrative
Unit
115. Popular committees operate as the lowest tier of the local government administration, with
some service delivery responsibilities. Below the municipal level, there are popular committees, with
elected membership, but approved by the government (Humanitarian Policy Group 2011). The
formation of popular committees is overseen by the commissioner, and the committees are subordinate
to the administrative unit. The popular committees are distinct from the tribal leadership of the area, or
the ―native administration‖ as it has been referred to since colonial times. Under colonial rule, the native
administration was mandated to maintain law and order, tax assessment and collection, the protection of
the environment and the settlement of disputes through native courts. Today, the native administration
does not participate in the working of the locality councils or popular committees.
116. The municipality is mandated to provide a range of services. It also takes on additional
responsibilities since it acts as an implementing organ for the state ministries. Each ministry has a local
office in the municipality, and sometimes even at the sub-locality level, to coordinate service delivery.
For example, the Ministry of Education is responsible for the academic and programmatic aspects of
education, while the locality is responsible for building, maintaining and equipping schools, and for
paying the salaries of teachers and supporting personnel. The Ministry of Education has a local office at
each of the 12 localities in the state, as well as a local office at the administrative unit level. The
municipality of Nyala is also responsible for solid waste management (for which it has set up an
autonomous company), sewage disposal, building and maintaining local roads and storm water drainage
system. It is also responsible for setting up and managing central and local markets from which it draws
a considerable portion of its revenues. Table 22 summarizes the allocation of responsibilities for urban
planning and services between the various levels of government in Nyala.

67
Table 22: Roles and Responsibilities for Service Delivery in Nyala
Urban Planning The Ministry of Physical Planning and Public Utilities (MPPPU) is responsible for
land administration including the demarcation and allocation of residential plots and
award of land leases (Humanitarian Policy Group 2011).
Roads and
Bridges
MPPPU is responsible for roads and bridges—including state highways, intra-locality
roads, bridges and local roads. The ministry is responsible for design and supervision
of projects, with construction carried out by qualified contractors. The municipality
also plays a role in building and maintaining local roads.
Water Nyala Water Corporation (NWC), a subsidiary of the national water corporation, is
responsible for water supply in Nyala.
The Water and Environmental Sanitation (WES) Program of the Public Water
Corporation, a partnership with UNICEF, plays a major role in water supply in the
IDP camps.
Where supply outstrips demand, small-traders are providing water in jerry cans
delivered by donkey carts.
Power Generation and distribution of electricity are still centralized functions managed by
the National Electricity Corporation. Its branch in Nyala, and in other towns, cannot
initiate any new projects without the consent and full financial support of the national
body.
Solid Waste
Management
The municipality of Nyala is responsible for solid waste management for which it has
set up an autonomous company.
Sewerage The municipality is responsible for sewage disposal.
WES plays a role in sanitation, particularly in the IDP camps.
Storm Water
Drainage
The municipality is responsible for building and maintaining local storm water drains.
Education The Ministry of Education is responsible for the academic and programmatic aspects
of education, while the municipality is responsible for building, maintaining and
equipping schools, and paying the salaries of teachers and supporting personnel.
D. Land, Housing and Urban Planning
117. The urban layout of Nyala has been shaped by natural features. A mountain that limits its
growth to the Northeast and Wadi Nyala, a dry river which splits the city into two parts. Wadi Nyala
flows intermittently for few hours during the rainy season bringing with it large quantities of water that
feed the underground aquifer, which provides most city residents with water. During these hours it
disrupts the movement of people and vehicles between the two parts of Nyala forcing them to use the
only bridge over the Wadi.
118. Nyala grew around a nucleus that was laid down by the British administrators in the early
1920s. That nucleus included an administrative center a small marketplace and Hai Al-Wadi, as a
residential area just north of the Wadi, for British administrators, senior officials and merchants, some of
whom were expatriates. A few settlements developed around it base primarily on tribal affiliations (e.g.
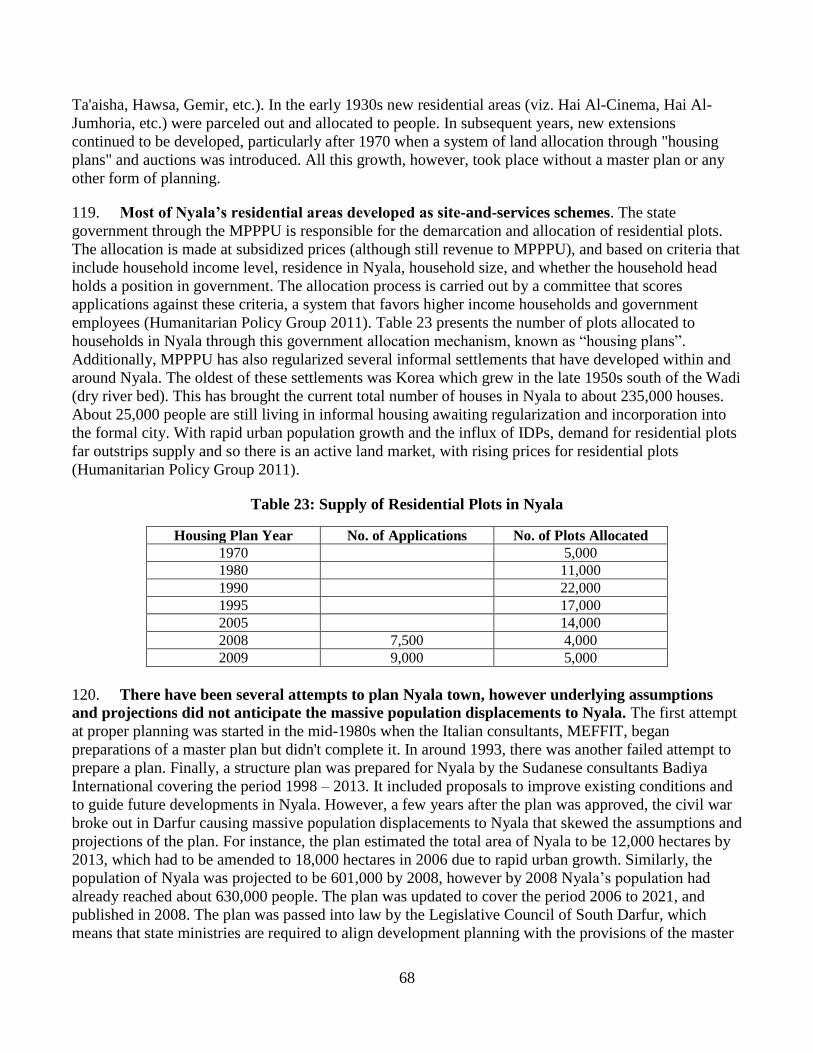
68
Ta'aisha, Hawsa, Gemir, etc.). In the early 1930s new residential areas (viz. Hai Al-Cinema, Hai Al-
Jumhoria, etc.) were parceled out and allocated to people. In subsequent years, new extensions
continued to be developed, particularly after 1970 when a system of land allocation through "housing
plans" and auctions was introduced. All this growth, however, took place without a master plan or any
other form of planning.
119. Most of Nyala’s residential areas developed as site-and-services schemes. The state
government through the MPPPU is responsible for the demarcation and allocation of residential plots.
The allocation is made at subsidized prices (although still revenue to MPPPU), and based on criteria that
include household income level, residence in Nyala, household size, and whether the household head
holds a position in government. The allocation process is carried out by a committee that scores
applications against these criteria, a system that favors higher income households and government
employees (Humanitarian Policy Group 2011). Table 23 presents the number of plots allocated to
households in Nyala through this government allocation mechanism, known as ―housing plans‖.
Additionally, MPPPU has also regularized several informal settlements that have developed within and
around Nyala. The oldest of these settlements was Korea which grew in the late 1950s south of the Wadi
(dry river bed). This has brought the current total number of houses in Nyala to about 235,000 houses.
About 25,000 people are still living in informal housing awaiting regularization and incorporation into
the formal city. With rapid urban population growth and the influx of IDPs, demand for residential plots
far outstrips supply and so there is an active land market, with rising prices for residential plots
(Humanitarian Policy Group 2011).
Table 23: Supply of Residential Plots in Nyala
Housing Plan Year No. of Applications No. of Plots Allocated
1970 5,000
1980 11,000
1990 22,000
1995 17,000
2005 14,000
2008 7,500 4,000
2009 9,000 5,000
120. There have been several attempts to plan Nyala town, however underlying assumptions
and projections did not anticipate the massive population displacements to Nyala. The first attempt
at proper planning was started in the mid-1980s when the Italian consultants, MEFFIT, began
preparations of a master plan but didn't complete it. In around 1993, there was another failed attempt to
prepare a plan. Finally, a structure plan was prepared for Nyala by the Sudanese consultants Badiya
International covering the period 1998 – 2013. It included proposals to improve existing conditions and
to guide future developments in Nyala. However, a few years after the plan was approved, the civil war
broke out in Darfur causing massive population displacements to Nyala that skewed the assumptions and
projections of the plan. For instance, the plan estimated the total area of Nyala to be 12,000 hectares by
2013, which had to be amended to 18,000 hectares in 2006 due to rapid urban growth. Similarly, the
population of Nyala was projected to be 601,000 by 2008, however by 2008 Nyala‘s population had
already reached about 630,000 people. The plan was updated to cover the period 2006 to 2021, and
published in 2008. The plan was passed into law by the Legislative Council of South Darfur, which
means that state ministries are required to align development planning with the provisions of the master

69
plan. The master plan is ambitious, including strategies to develop the centre of the current town into a
modern commercial and business district. The underlying assumptions of population growth still do not
take full account of the IDP population, assuming that the population of Nyala will grow to 804,000 in
2013 (Humanitarian Policy Group 2011), whereas estimates of the current population of Nyala range
from 1.3 to 1.6 million.
121. The majority of land in Nyala town is used for residential neighborhoods. The total built-up
area of Nyala in 1997 was about 2,642 hectares incorporating the land uses shown in Table 24. The table
confirms that residential use is the main land use in Nyala occupying a significant 73.3 percent of the
total area of Nyala. By contrast, commercial and industrial land uses occupy only 3 percent each. It is
worth noting that the area occupied by forests (7.2 percent) has been diminishing rapidly due to heavy
felling of trees by IDPs and others for brick kilns, firewood and charcoal.
Table 24: Land Utilization in Nyala, 1997
Land Use Area (ha) % of Total
Residential 1,934 74
Commercial 78 3
Industrial 77 3
Agricultural 353 13
Forests 191 7
Total 2,643 100
E. Urban Infrastructure
122. Even prior to the conflict in Darfur, the level of services in Nyala was inadequate. Rapid
urban population growth and the large influx of IDPs in Nyala has placed additional strains on existing
urban infrastructure and services. Services have deteriorated, and the erratic supply (particularly power
supply) has a negative impact on the urban economy. Table 25 summarizes the current state of
infrastructure in Nyala town.
Table 25: State of Urban Infrastructure in Nyala
State of Infrastructure
Roads and
Bridges
The total length of asphalted roads within Nyala is about 50 kilometers—primarily
roads in the central area of Nyala and main roads linking it to the airport and to major
districts. A further 30 kilometers of road construction is planned (Humanitarian Policy
Group 2011). Non asphalted compacted roads are approximately 150 kilometers in
length. MPPU lacks adequate funds for road maintenance.
There is only one bridge linking northern and southern Nyala across Wadi Nyala.
When the Wadi flows during the rainy season, it splits the city in two and impedes the
smooth traffic of people and goods. MPPPU has plans to build two more bridges over
the Wadi but lacks the financing to do so.
Water NWC has about 13,000 customers with individual connections—paying a flat rate of
70
SDG 15 per house (multi-storey buildings and commercial establishments pay SDG
25).29
The piped system is asbestos-ridden, and there are plans to replace it
(Humanitarian Policy Group 2011).
In areas not served by individual connections, NWC has installed about 27 communal
stands, concentrated in the center of town, from which people and water vendors can
fill up their utensils and tankers. There are also about 200 private wells (particularly in
the immediate vicinity of Wadi Nyala) from which water vendors fill up their tanks.
Water in Nyala is supplied from an underground aquifer (22 million cubic meters) fed
from Wadi Nyala, which collects rain water annually from a large basin that extends
several kilometers around Nyala. Some of the early water treatment plants established
by the British administration in the early 1950s are still functioning today—a typical
'plant' consisting of a borehole, a water pump that pumps water to an overhead tank
through a rudimentary filter. Water is treated in the tank by adding a few drops of a
disinfectant then is allowed to flow to supply various parts of the town.
Water is collected from 29 boreholes (24 of which are working), with a total network
capacity of 21,000 cubic meters per day (11,000 cubic meters per day in the dry
season). Estimated demand for water in Nyala has reached about 100,000 cubic meters
per day. A new project to dig 20 boreholes in the Baggara Reservoir, some 80
kilometers from Nyala, and to pump it to Nyala is nearing completion but beset by
problems (Humanitarian Policy Group 2011). This is expected to add about 40,000
cubic meters per day.
The old districts of Nyala (about 30 percent of the city) are served by a network of
asbestos pipes built in the mid 1960s. New districts are yet to be connected. About 30
percent of the water produced leaks out from the network. In December 2008 the state
government extended support to maintain and upgrade Nyala water supply network in
the form of new galvanized steel and PVC pipes and additional storage tanks.
NWC conducts regular tests of the water it produces and claims that the quality is good.
However, recent study of Nyala‘s drinking water showed that in all studied water
samples, the bacteria count was above permissible levels for drinking water
(Humanitarian Policy Group 2011).
Although most of the city uses pit latrines for sewage disposal, so far no contamination
of water has been reported.
Power There are currently four diesel power generators producing an average of 8 megawatts
while the demand in Nyala is about 10 megawatts since most industrial establishments
are not functioning for reasons other than power. Generation is dependent on diesel
generators which require frequent maintenance and continuous supply of fuel. Plans to
expand the grid have been passed by the state legislature, but would require funding
from the federal government (Humanitarian Policy Group 2011).
It is estimated that only about 30 percent of Nyala residents are served by the local
electricity network, with intermittent periods of power outages and even full black outs.
The cost of energy from the grid is very high—with minimum connection costs in the
order of SDG 220 (Humanitarian Policy Group 2011). The rest have to rely on
29
UN-HABITAT report says rates are SDG 21-28 per month for residential buildings, and SDG 75-150 pet month for
commercial and industrial buildings. (UN-HABITAT 2009)

71
generators or live without electricity all together.
Demand for energy in Nyala has increased rapidly with the growth in the urban
population and increase in market activity.
Solid Waste
Management
Nyala has an inefficient solid waste collection and disposal system. Since 2001, a
private company was contracted to handle solid waste management but households
were reluctant to pay for the service; the company couldn't continue its operations since
the local authorities couldn't subsidize it. Currently, a small percentage of the solid
waste produced in the city, particularly in the central area and the main market is
collected by the Municipality of Nyala; however, most of it is disposed of openly in the
peripheries of the city since no proper landfills exist. Given the lack of security in the
surrounding countryside, truck drivers dispose of the waste at the borders of the city,
often on farmlands owned by other people. The vast majority of the solid waste
produced in the rest of the city is disposed off in open spaces within the city, in the dry
river (wadi), or burned down in open pits posing severe health hazards to Nyala
residents.
Sewerage Nyala has no proper sewerage system. UN-HABITAT (2009) reports that over 60
percent of households in Nyala rely on pit latrines, 11 percent have flush toilets with a
septic tank system and 27 percent have no sanitation facilities. Because the water table
is rather shallow, soak away pits are not permitted inside Nyala. Therefore, those who
use holding tanks and aqua privies have to hire tankers to pump away their collected
sewage. The municipality has only one tanker which is not functioning properly
leaving this important service at the hands of private tank owners. Due to the lack of a
proper final disposal system, tank drivers dispose off their loads on open lands in the
outskirts of the city, often upstream of the aquifer. When the outskirts are not secure,
they are obliged to travel only short distances away from the peripheral neighborhoods.
In the central market place the problem of sewage disposal is even more acute because
there are only few public toilets that are used by thousands of people every day. The
sewage collected from those latrines has also to be pumped out, trucked outside the
city, and dumped off on vacant peripheral lands.
Contamination of ground water, which is the main source of potable water in Nyala, is
a real threat if no strict measures are enforced to ensure that proper mechanisms of
sewage disposal are used. The most potent solution seems be to install a proper
sewerage network even if its initial cost is prohibitive.
Storm Water
Drainage
The drainage system is inadequate and hazardous in the rainy season; due to the
pressures on residential land, squatters are occupying land at risk of flooding
(Humanitarian Policy Group 2011).
Health Nyala has ten hospitals, including public, private, military and police hospitals. One of
the hospitals is a specialized eye hospital. In addition, it has 12 health centers and 12
primary health care units, and about 43 private physicians' clinics. With the exception
of one neighborhood, all other neighborhoods in Nyala have at least one medical/health
care facility. The Central District of Nyala has the highest concentration of these
facilities. Quality of services varies substantially with most facilities lacking sufficient
numbers of trained personnel, equipment and drugs.

72
Education Nyala has 226 nursery schools, 308 primary schools, 106 secondary schools
(Humanitarian Policy Group 2011) and two secondary technical educational facilities.
Nyala also has a university (Nyala University), established in 1994, and a few private
colleges and institutes. Educational facilities are not distributed evenly in all parts of
Nyala. There are a number of neighborhoods that don't have schools because there
aren't sufficient budgets for school construction. Most schools (even public ones) are
built through communal self-help or through donations from donors. The vast majority
of private schools don't have premises that were designed to accommodate educational
buildings. Instead, they rent houses or any type of buildings and use them as schools.
Schools, particularly those close to IDP camps, are often overcrowded. The payment of
the salaries of teachers and support staff is often erratic.
F. Municipal Finance
123. Southern Darfur state is heavily dependent on transfers from the federal government for
the payment of salaries. The state relies heavily on transfers from the federal government to meet the
cost of salaries. Constitutional posts (commissioners, state ministers and legislative council members—
no more than 100 people), account for the bulk of the state wage bill leaving the minor share to pay civil
servants (Humanitarian Policy Group 2011). In theory, transfers are also meant to cover expenditures on
infrastructure and services, however in practice the level of transfers is inadequate. Rather, service
provision has to be funded through revenue raised at the state and locality levels, but revenue raising
efforts are constrained by several factors including (a) the contraction of the economy due to protracted
drought and conflict; and (b) the large number of IDPs, who require services but are not in the position
to pay fees and taxes. As a consequence the fiscal capacity of the state is very weak. A further problem
is the lack of predictability in the level and timing of transfers to the state government, which
undermines the planning and budget process at the state and locality levels (Humanitarian Policy Group
2011, 5). The majority of state expenditures—approximately 70 percent—is spent in Nyala
(Humanitarian Policy Group 2011).
124. The municipality of Nyala funds it’s expenditures through a combination of transfers and
own taxes. Nyala‘s total budget for 2009 amounted to SDG 32,800,000 (about $14.9 million), and
included the following revenue sources:
(a) Transfers. The state government contributes financing for major development projects in
Nyala. In 2009 transfers from the state government to the Municipality of Nyala amounted
to SDG 8,800,000 (about $4 million).
(b) Real estate tax. Real estate taxes are collected annually from each house and plot. Rates
vary depending on the class of housing—from first- to second to third-class housing areas.
For 2009 the tax per house was SDG 15, 12 and 7 (i.e. $6.80, $5.45 and $3.18) respectively.
Like other Sudanese cities, this tax is under-valued and doesn't generate substantial
revenues.
(c) Taxes on 'imported' goods and trans-national trade (taxation of truck parks). Since
Nyala is the major trade center of Southern Darfur, with a thriving cross-border trade with
neighboring land-locked African countries, the state government collects taxes and fees on
items that arrive in Nyala from other regions and countries. This is facilitated by the fact

73
that almost all trucks that arrive in the city are required to stop first at the Stock Exchange
yard where their loads are registered and corresponding fees collected. Likewise, all items
that arrive by train or planes (particularly cargo that arrives directly from Dubai and
Khartoum) are registered and charged certain fees. Similarly, the municipality collects taxes
and fees on agricultural produce, livestock and other products, such as gum Arabic, that are
collected from forests. On average about 2000 to 3000 trucks, 100 petrol tankers, 12 trains
arrive to Nyala every month, in addition to four planes every day.
(d) Business taxes. Nyala has about 560 businesses (called locally "investment projects"), such
as hotels, petrol stations, cold stores, private schools and clinics, etc. They range in size,
capital invested and revenue generated. In addition, there are about 15,000 commercial
establishments, such as wholesale, retail, grocery stores, kiosks, cafés, restaurants,
workshops, etc. Even micro-enterprises such as hawkers are charged a temporary license
fee. The license fees collected from those businesses vary depending on their size.
However, business people are reluctant to pay them because they believe that they are over-
valued and are not commensurate with the size of their businesses. In 2009 the business
taxes levied on whole sellers was SDG 205 (about $ 93.20), on retailers SDG 103 (about $
46.82), on restaurants SDG 45 (about $ 20.45) and on grocery stores SDG 62 (about $
28.18). It is not known however, how much did this business tax reap for the locality in
2009.
74
Works Cited Ali, Dr. Omer Awadalla. " Local Government in Sudan during the Interim Period – Inputs From
Switzerland." 2008.
Assal, Munzoul. "Urbanization and the future of Sudan." Making Sense of Sudan. 2008.
Bannaga, Sharaf Eldin Ibrahim. "Al-Shorouk: The Organization of Villages in the State of Khartoum."
2000.
—. Land Right of Use and Management Paradigm. Khartoum: Sudan Currency Printing Press, 2010.
Central Bureau of Statistics. "5th Sudan Population and Housing Census - 2008 Census Annexes." 2009.
de Waal, Alex. Making Sense of Sudan: Do Darfur IDPs Have an Urban Future. 2008.
http://blogs.ssrc.org/sudan/2009/03/31/do-darfurs-idps-have-an-urban-future/.
—. "Making Sense of Sudan: Do Darfur IDPs Have an Urban Future." 2010.
http://blogs.ssrc.org/sudan/2009/03/31/do-darfurs-idps-have-an-urban-future/.
Dorosh, P, H Wang, and L You. "Crop Production and Road Connectivity in Sub-Saharan Africa: A
Spatial Analysis." Washington, D.C., 2008.
Economist Intelligence Unit. "Sudan Country Profile 2004." 2004.
Elghazali, Burhan Eltayeb Bushra. Urban Intensification in Metropolitan Khartoum: Influential Factors,
Benefits and Applicability. PhD Thesis, Stokholm: KTH, Royal Institute of Technology, 2006.
Eltayeb, Galal Eldin. "The case of Khartoum, Sudan." 2003.
Hamid, Gamal M. "Overview of Urbanization Trends in the Sudan: Background Paper for Sudan Urban
ESW." 2009.
Humanitarian Policy Group. "City Limits: Urbanisation and Vulnerability in Sudan--Khartoum Case
Study." 2011.
Humanitarian Policy Group. "City limits: urbanization and vulnerability in Sudan: Nyala case study."
2011.
IDMC. 2011. http://www.internal-
displacement.org/idmc/website/countries.nsf/(httpEnvelopes)/0026B2F86813855FC1257570006185A0?
OpenDocument.
—. Estimates for the total number of IDPs for all of Sudan (as of January 2011). 2011.
http://www.internal-
displacement.org/idmc/website/countries.nsf/(httpEnvelopes)/0026B2F86813855FC1257570006185A0?
OpenDocument (accessed January 4, 2011).
—. iDMC. 2011. http://www.internal-
displacement.org/idmc/website/countries.nsf/(httpEnvelopes)/0026B2F86813855FC1257570006185A0?
OpenDocument.
IDMC. "Rising inter-tribal violence in the south and renewed clashes in Darfur cause new waves of
displacement." 2010.
IMF. IMF Country Report No. 10/256. IMF, 2010.
IMF. "Program Note." 2010.
Jacobsen, Karen. "Internal Displacement to Urban Areas: the Tufts-IDMC Profiling Study (Khartoum,
Sudan: Case 1)." 2008.
Joint Assessment Mission. "Volume III Cluster Reports." 2005.
Kessides, Christine. The Urban Transition in Sub-Saharan Africa. The Cities Alliance, 2006.
Komey, Guma Kunda. "Communal Land Rights, Identities and Conflicts in Sudan." 2009.
Legislative Council of Khartoum State. "State Law No. 9 of 2007." 2007.
Menon, Massimiliano, and Carlo Cali. Does Urbanisation Affect Rural Poverty? Evidence from Indian
Districts. Spatial Economics Research Center, 2009.

75
Norwegian Refugee Council. "Profile of Internal Displacement: Sudan." Geneva, 2005.
Population Division of the Department of Economic and Social Affairs of the United Nations
Secretariat. World Population Prospects: The 2008 Revision. 2009. http://esa.un.org/wup2009/unup/.
UN-HABITAT. Darfur: Profile of Nyala Town and Adjacent IDP Camps. United Nations, 2009.
UN-HABITAT. "The State of African Cities 2010." 2010.
UN-HABITAT. "Urban Sector Studies and Capacity Building for Khartoum State." 2009.
United Nations. "Background Note on Urbanization in Darfur: JSR Retreat." El Fasher, 2010.
United Nations. "Beyond Emergency Relief." 2010.
United Nations. "Republic of the Sudan Public Administration Profile." 2004.
Wakely, Careter, Clifford. "Southern Sudan Urban Appraisal Study." 2005.
Wold Bank. "The Urban Transition in Tanzania." Washington DC, 2009.
World Bank. "Assessment of Localities' Compliance with Minimum Qualifying Criteria and
Identification of their Capacity Needs in Northern Sudan." 2007.
World Bank. World Development Report: Moving Beyond Conflict and Fragility. Washington: World
Bank, 2011.
World Bank. "World Development Report: Reshaping Economic Geography." Washington, 2009.
World Health Organization. Urbanziation and Health: health Equity and Vulnerable Populations.
World Health Organization, 2010.
Young, Helen, Karen Jacobsen, and Abdal Monium Osman. Livelihoods, Migration and Conflict:
Discussion of Findings from Two Studies in West and North Darfur, 2006-2007. Medford: Feinstein
International Center, 2009.