report no contents acknowledgements executive summary chapter 1. introduction 21 chapter 2: methods...
TRANSCRIPT

Report No.4
Re
po
rt No
.4

ANTI-TUBERCULOSIS DRUG
RESISTANCE IN THE WORLD
Fourth Global Report
The WHO/IUATLD Global Project on Anti-tuberculosis
Drug Resistance Surveillance
2002-2007
WHO/HTM/TB/2008.394

2
© World Health Organization 2008
All rights reserved. Publications of the World Health Organization can be obtained from WHO
Press, World Health Organization, 20 Avenue Appia, 1211 Geneva 27, Switzerland (tel.: +41 22
791 3264; fax: +41 22 791 4857; e-mail: [email protected]). Requests for permission to
reproduce or translate WHO publications – whether for sale or for noncommercial distribution –
should be addressed to WHO Press, at the above address (fax: +41 22 791 4806; e-mail:
The designations employed and the presentation of the material in this publication do not imply
the expression of any opinion whatsoever on the part of the World Health Organization
concerning the legal status of any country, territory, city or area or of its authorities, or
concerning the delimitation of its frontiers or boundaries. Dotted lines on maps represent
approximate border lines for which there may not yet be full agreement.
The mention of specific companies or of certain manufacturers’ products does not imply that
they are endorsed or recommended by the World Health Organization in preference to others of a
similar nature that are not mentioned. Errors and omissions excepted, the names of proprietary
products are distinguished by initial capital letters.
All reasonable precautions have been taken by the World Health Organization to verify the
information contained in this publication. However, the published material is being distributed
without warranty of any kind, either expressed or implied. The responsibility for the
interpretation and use of the material lies with the reader. In no event shall the World Health
Organization be liable for damages arising from its use.

3
CONTENTS
Acknowledgements
Executive Summary
Chapter 1. Introduction........................................................................... 21
Chapter 2: Methods ................................................................................. 23
Chapter 3: Results ................................................................................... 35 Data reported to WHO between 2002 and 2007 ...................................................... 35
New Cases................................................................................................................. 36 Previously treated cases ............................................................................................ 39 Non MDR rifampicin resistance ............................................................................... 42 MDR-TB by WHO region ........................................................................................ 43 Age and Sex .............................................................................................................. 51 Drug resistance and HIV........................................................................................... 51 XDR-TB.................................................................................................................... 53
Data reported to WHO from 1994 to 2007 ............................................................... 56 Regional population weighted medians .................................................................... 57 Distribution of resistance within regions .................................................................. 60 Correlation of survey and routine surveillance data ................................................. 63
Trends ....................................................................................................................... 64 Estimates ................................................................................................................... 72 The Supranational Laboratory Network................................................................... 73
Chapter 4: Discussion .............................................................................. 78 Overview................................................................................................................... 78 Survey Methods ........................................................................................................ 79 Magnitude and trends................................................................................................ 81 XDR-TB.................................................................................................................... 83 Drug resistance and HIV........................................................................................... 85 Global estimates........................................................................................................ 87 The Supranational Reference Laboratory Network .................................................. 87 WHO regions ............................................................................................................ 90
Annex 1 - Resistance among new cases 1994-2007
Annex 2 - Resistance among previously treated cases 1994-2007
Annex 3 - Resistance among combined TB cases 1994-2007
Annex 4 - Survey methods for surveys conducted 1994-2007
Annex 5 - Laboratory methods for surveys conducted 1994-2007
Annex 6 - Trends in MDR and Any resistance among new cases (not available in white draft)
Annex 7 - Trends in MDR and Any resistance among all TB cases (not available in white draft)
Annex 8 - Estimates of MDR among new TB cases
Annex 9 - Estimates of MDR among previously treated TB cases
Annex 10 - Estimates of MDR among all TB cases
Annex 11 - Estimates of MDR by epidemiological region
4
CONTRIBUTORS:
WHO AFRICAN REGION: Côte d'Ivoire: Jacquemin Kouakou, Ethiopia: Daniel
Demisse,Getachew Eyob, Mekedes Gebeyehu, Wenimagene Getachew, Feven Girmachew,
Eshetu Lemma, Zerihun Taddesew, Jan van den Hombergh, Dick van Soolingen, Madagascar:
Rarivoson Benjamin, Ramarokoto Herimanana, Rwanda: Michel Gasana, John Gatabazi, Leen
Rigouts, Alaine Umubyeyi, Greet Vandebriel, Senegal: Fatoumata Ba,Henriette Cécile Diop,
United Republic of Tanzania: Saidi Egwaga.WHO REGION OF THE AMERICAS:
Argentina: Lucía Barrera, Maria Delfina Sequeira, Elsa Zerbini Canada: Edward Ellis, Victor
Gallant, Melissa Phypers, Derek Scholten, Joyce Wolfe, Costa Rica: Zeidy Mata A., Maria
Cecilia Matamoros, Cuba: María Josefa Llanes Cordero, Miguel Echemendía, Ernesto Montoro,
Dihadenys Lemus Molina, Guatemala: Licda Nancy Ayala Contreras, Edwin Antonio Quiñonez
Villatoro, Nicaragua: Luis Alberto Chacón, Alejandro A. Tardencilla Gutiérrez, Paraguay:
Juan Carlos Jara Rodríguez, Nilda Jimenez de Romero, Peru: Cesar Antonio Bonilla Asalde,
Luis Asencios Solis, Puerto Rico: Ada S. Martinez, Beverly Metchock, Valerie Robinson,
Uruguay: Carlos María Rivas-Chetto, Jorge Rodriguez-De Marco, USA: Sandy Althomsons,
Kenneth G. Castro, Beverly Metchock, Valerie Robison, Ryan Wallace,WHO EASTERN
MEDITERRANEAN REGION: Jordan: Said Abu Nadi, Khaled Yusra Rihani, Abu Rumman,
Lebanon: Georges Aaraj, Mtanios Saade, Morocco: Naima Ben Cheikh, Quafae Lahlou,
Oman: Hassan Al Tuhami, Qatar: Abdul Latif Al Khal, Syrian Arab Republic: Roula
Hammoud, Fadia Maamari, Yemen: Amin N. Al-Absi, WHO EUROPEAN REGION:
Andorra: Margarita Coll Armangue, Armenia:, Alvard Mirzoyan, Andrei Mosneaga, Vahan
Poghosyah, Austria: Alexandra Indra, Jean-Paul Klein, Azerbaijan: Rafik Abuzarov, Faik
Agayev, Ogtay Gozalov, Andrei Mosneaga, Belgium: Maryse Fauville-Dufaux, Francoise
Portaels, Leen Rigouts, Greet Vankersschaever, Maryse Wanlin, Bosnia & Herzegovina: Zehra
Dizdarevic, Mladen Duronjic, Hasan Zutic, Croatia: Aleksandar Simunovic, Vera Katalinic -
Jankovic, Czech Republic: Martha Havelkova, Ludek Trnka, Jiri Wallenfels, Denmark: Peter
Henrik Andersen, Zaza Kamper-Jorgensen, Estonia: Kai Kliiman, Tiina Kummik, Finland:
Merja Marjamäki, Petri Ruutu, France: Delphine Antoine, Marie Claire Paty, Jérome Robert,
Georgia: Archil Salakaia, Nino Lomtadze, Marina Janjgava, Rusudan Aspindzelashvili, Maia
Kipiani, Ucha Nanava, Germany: Bonita Brodhun, Walter Haas, Sabine Rüsch-Gerdes,
Iceland: Thorsteinn Blondal, Ingibjörg Hilmarsdotttir, Ireland: Noel Gibbons, Joan O'Donnell,

5
Israel: Daniel Chemtob, Italy: Daniela Cirillo, F Piana, Maria Grazia Pompa, Latvia: Janis
Leimans, Girts Skenders, Lithuania: Edita Davidaviciene, Anaida Sosnovska, Luxembourg:
Pierrette HUberty-Krau, François Schneider, Malta: Analita Pace Asciak, Netherlands: Connie
Erkens, Vincent Kuyvenhoven, Dick van Soolingen, Norway: Brita Askleand Winje, Turid
Mannsaker, Poland: Kazimierz Roszkowski, Maria Korzeniewska-Kosela, Zofia Zwolska,
Republic of Moldova: Valeriu Crudu, Nicolae Moraru, Dimitrii Sain,Silviu Sofronie, Romania:
Domnica Chiotan, Daniela Homorodean, Ioan Paul Stoicescu, Russian Federation: Michael V.
Nikiforov, Yekaterina Kakorina, Serbia: Gordana Radosavljevic Asic, Rukije Mehmeti,
Slovakia: Ivan Solovic, Juraj Trenkler, Slovenia: Manca Žolnir Dovc, Damjan Erzen, Jurij
Sorli, Spain: Odorina Tello Anchuela, Nuria Martín Casabona, Fernando Alcaide Fernandez de
la Vega, Elena Cruz Ferro, Luisa Pérez del Molino Bernal, Soledad Jimenez, Antonia Lezcano,
Julia Gonzalez Martin, Elena Rodriguez Valin, Asunción Vitoria, Sweden: Sven Hoffner,
Victoria Romanus, Switzerland: Peter Helbling, Ukraine: Iryna Dubrovina, Mykhailo
Golubchykov, Svetlana Lyepshina, Igor Raykhert, Yelena Yann, United Kingdom: Francis
Drobniewski, Jim McMenamin, Roland Salmon, Brian Smyth, John Watson, Uzbekistan:
Dilrabo Ulmasova WHO SOUTH-EAST ASIA REGION: India: L. S. Chauhan,
Ramachandran, MR Joseph, CN Paramasivan, B. Mahadev, P. Kumar, Indonesia: Carmelia
Basri, Paul Kelly, Myanmar: Win Maung, Ti Ti, CN Paramasivan Nepal: Pushpa Malla, Sri
Lanka: Chandra Sarukkali, Thailand: Sriprapa Nateniyom, Dhanida Rienthong, Somsak
Rienthong, WHO WESTERN PACIFIC REGION: Australia: Ivan Bastian, Krissa O'Neil,
Richard Lumb, John Walker, China: Wang Lixia, Liu Jianjun, Zhao Yanlin, Mei Jian, An
Yansheng, Ren Yulin, Xie Yanguang, China, Hong Kong SAR: Kai-man Kam, Cheuk-ming
Tam, Macao SAR, China: Chou Kuok Hei, Lao U Lei Fiji: William B. Kaitani, Guam: Cecilia
Teresa T. Arciaga, Japan: Satoru Miyake, Satoshi Mitarai, New Caledonia: Bernard Rouchon,
New Zealand: Kathryn Coley, Helen Heffernan, Leo McKnight, Alison Roberts, Ross Vaughan,
Northern Mariana Island: Richard Brostrom, Susan Schorr, Philippines: Nora Cruz, Noel
Macalalad, Remingo Olveda, Rosalind Vianzon, , Republic of Korea: Hwa Hyun Kim, Woojin
Lew, Singapore: Gary Ong, Raymond Lin Tzer Pin, Kyi Win Khin, Mar, Wang Yee Tang,
Solomon Islands: Noel Itogo, Vanuatu: Russel Tamata, Viet Nam: Dinhngocsy

6
GLOBAL NETWORK OF SUPRANATIONAL REFERENCE LABORATORIES
• Laboratoire de la Tuberculose, Institut Pasteur d'Algérie, Alger, ALGERIA
(Prof. Fadila Boulahbal)
• Mycobacteria Laboratory, National Institute of Infectious Diseases, ANLIS "Dr Carlos G.
Malbran," Buenos Aires, ARGENTINA (Dr. Lucia Barrera)
• Mycobacterium Reference Laboratory, Institute of Medical and Veterinary Science, Adelaide,
AUSTRALIA (Dr. Ivan Bastian, Dr. Richard Lumb)
• Queensland Mycobacterium Reference Laboratory, Brisbane, AUSTRALIA
(Dr. Chris Gilpin and Mr. David Dawson)
• Département de Microbiologie Unité de Mycobactériologie, Institut de Médecine Tropicale,
Antwerp, BELGIUM (Prof. Françoise Portaels, Dr. Armand Van Deun)
• Instituto de Salud Publica de Chile, Santiago, CHILE
(Dra. María Cecilia Riquelme Jaqke)
• National Institute of Public Health, Prague, CZECH REPUBLIC (Dr. Marta Havelková )
• Central Health Laboratory, Ministry opf Health and Population, Cairo, EGYPT
(Dr. Mushira Ismail)
• Institut Pasteur, Centre National de Référence des Mycobacteries, Paris, FRANCE (Dr.
Véronique Vincent)
• Kuratorium Tuberkulose in der Welt e.V.IML (Institut für Mikrobiologie und
Laboratoriumsdiagnostik) Gauting, GERMANY
(Prof. Knut Feldman, Dr. med. Harald Hoffmann)
• National Reference Center for Mycobacteria, Borstel, GERMANY
(Dr. Sabine Rüsch-Gerdes)
• TB Reference Laboratory Department of Health, SAR Hong Kong, CHINA
(Dr. Kai Man Kam)
• TB Research Centre (TRC), Indian Council of Medical Research, Chennai, INDIA (Dr.
Selvakumar, Dr. Ranjani Ramachandran)
• Istituto Superiore di Sanità Dipartimento di Malattie Infettive, Parassitarie e Immunomediate,
Rome, ITALY and Laboratory of Bacteriology & Medical Mycology and San Raffaele del
Monte Tabor Foundation (hSR), Milan, ITALY (Dr. Lanfranco Fattorini, Dr. Daniela Cirillo)

7
• Research Institute of Tuberculosis, Japan Anti-Tuberculosis Association, Tokyo, JAPAN (Dr.
Satoshi Mitarai)
• Korean Institute of Tuberculosis, Seoul, REPUBLIC OF KOREA (Dr. Woojin Lew)
• Departamento de Micobacterias, Instituto de Diagnostico y, Referencia Epidemiologicos
(INDRE), MEXICO (Dr. Susana Balandrano)
• National Institute of Public Health and the Environment (RIVM), Bilthoven,
NETHERLANDS (Dr. Dick van Soolingen)
• Centro de Tuberculose e Micobacterias (CTM), Instituto Nacional de Saude, Porto,
PORTUGAL (Dr. Maria Filomena Rodrigues)
• The Medical Research Council, TB Research Lead Programme, Pretoria, SOUTH AFRICA
(Dr. Karin Weyer)
• Servicio de Microbiologia Hospital Universitaris, Vall d'Hebron, Barcelona, SPAIN (Dr.
Nuria Martin-Casabona)
• Swedish Institute for Infectious Disease Control (SIDC), Solna, SWEDEN
(Dr. Sven Hoffner)
• National TB Reference Laboratory Center Tuberculosis Cluster, Bangkok,
THAILAND (Somsak Rienthong, Dhanida Rienthong)
• Health Protection Agency, National Mycobacterium Reference Unit, Department of Infectious
Diseases, UNITED KINGDOM (Dr. Francis Drobniewski)
• Centers for Disease Control and Prevention, Mycobacteriology/ Tuberculosis Laboratory,
Georgia, USA (Dr. Tom Shinnick, Dr. Beverly Metchock)
• Massachusetts State Laboratory, Massachusetts, USA (Dr. Alexander Sloutsky)

8
The report was written by: Abigail Wright, Matteo Zignol
The following WHO staff assisted in compiling, analysing and editing information:
WHO HQ Geneva: Abigail Wright, Matteo Zignol, Christopher Dye, Brian Williams, Mehran
Hosseini, Ana Bierrenbach, Salah Ottmani, Mohamed Aziz, Ernesto Jaramillo, Mario
Raviglione, Paul Nunn, Kathrin Thomas, Rosalie Edma, Fabio Scano, Karin Weyer, Louise
Baker, Diana Weil. WHO African Region: Oumou Bah-Sow (AFRO), Bah Keita (AFRO, West
Africa), Daniel Kibuga (AFRO), Motseng Makhetha (South Africa), Vainess Mfungwe (AFRO),
Wilfred Nkhoma (AFRO), Tom Sukwa (AFRO). WHO Region of the Americas: Raimond
Armengol (AMRO), Mirtha del Granado (AMRO), Rafael Lopez Olarte (AMRO), Pilar
Ramon-Pardo (AMRO), Rodolfo Rodriguez-Cruz (Brazil), Matías Villatoro (Brazil). WHO
Eastern Mediterranean Region: Samiha Baghdadi (EMRO), Ghada Muhjazi (EMRO), Akihiro
Seita (EMRO). WHO European Region: Evgeny Belilovsky (Russian Federation), Andrei
Dadu (EURO), Pierpaolo de Colombani (EURO), Irina Danilova (Russian Federation), Jean de
Dieu Iragena (Russian Federation) Lucica Ditiu (EURO), Wieslaw Jakubowiak (Russian
Federation), Kestutis Miskinis (Ukraine) Gombogaram Tsogt (Central Asia), Richard Zaleskis
(EURO). WHO South-East Asia Region: Mohammed Akhtar (Nepal), Erwin Cooreman
(Bangladesh), Puneet Dewan (SEARO), Hans Kluge (Myanmar), Nani Nair (SEARO),
Suvanand Sahu (India), Chawalit Tantinimitkul (Thailand), Fraser Wares (India), Supriya
Weerusavithana (Sri Lanka).WHO Western Pacific Region: Daniel Chin (China), Philippe
Glaziou (WPRO), Cornelia Hennig (China), Liu Yuhong (China), Pieter van Maaren (WPRO),
Masaki Ota (WPRO), Michael Voniatis (Philippines).

9
The International Union Against TB and Lung Disease (UNION), Paris, France: Hans
Rieder, Armand Van Deun, Sang Jae Kim
EuroTB , Paris, France: Fatima Aït-Belghiti, Hedwidge Bousquié, Isabelle Devaux, Dennis
Falzon, and Yao Kudjawu.
The primary aim of this report is to share survey and surveillance data on drug resistance in TB.
The data presented here are supplied largely by the programme managers who have led the work
on surveys, but also heads of reference laboratories as well as principle investigators that may
have been hired to assist the NTP with the study. We thank all of them, and their staff, for their
contributions. The WHO/IUATLD Global Project is carried out with the financial backing of
USAID and Eli Lilly and Company as part of the Lilly MDR-TB Partnership. Drug resistance
surveys were supported financially by the The Dutch government, The Global Fund, Japan
International Cooperation Agency (JICA), Kreditanstalt für Wiederaufbau (KfW
Entwicklungsbank), National TB Programmes, United States Agency for International
Development (USAID). The Supranational Reference Laboratory Network provided the external
quality assurance as well as technical support to many of the countries reporting. Technical
support for surveys was provided by CDC, JICA, KNCV, and WHO. Data for the European
Region were collected and validated jointly with EuroTB (Paris), a European TB surveillance
network funded by the European Commission.

10
EXECUTIVE SUMMARY
Background and methods
This is the fourth report of the WHO/IUATLD Global Project on Anti-Tuberculosis Drug
Resistance Surveillance. The three previous reports were published in 1997, 2000 and 2004 and
included data from 35, 58 and 77 countries, respectively. This report includes drug susceptibility
test (DST) results from 91,577 patients from 93 settings in 81 countries and 2 Special
Administrative Regions (SARs) of China collected between 2002 and 2006, and representing
over 35% of the global total of notified new smear-positive TB cases. It includes data from 33
countries that have never previously reported. New data are available from the following high
TB burden countries1: India, China, Russian Federation, Indonesia, Ethiopia, Philippines, Viet
Nam, Tanzania, Thailand, and Myanmar. Between 1994 and 2007 a total of 138 settings in 114
countries and 2 SARs of China had reported data to the Global Project.
Trend data (three or more data points) are available from 48 countries. The majority of trend data
are reported from low TB prevalence settings; however this report includes data from three
Baltic countries and 2 Russian Oblasts. Trend data were also available from 6 countries
conducting periodic or sentinel surveys (Cuba, Republic of Korea, Nepal, Peru, Thailand, and
Uruguay).
For the first time, thirty six countries reported data on age and sex of cases by any resistance and
multi-drug resistant TB2 (MDR-TB). Seven countries reported data disaggregated by human
immunodeficiency virus (HIV) status and drug resistance pattern. (Cuba, Donetsk Oblast,
Ukraine, Honduras, Latvia, Spain, Tomsk Oblast of the Russian Federation, and Uruguay).
Thirty four countries and two SARs of China reported data on second-line anti-TB drug
resistance among patient isolates identified as MDR-TB. This report focuses on MDR-TB since
these patients have significantly poorer outcomes that patients with drug susceptible TB.
1 The 22 high TB burden countries (HBCs) account for approximately 80% of the estimated number of new TB cases (all forms) arising each year. 2 Multi-drug resistant TB is defined as TB with resistance to isoniazid and rifampicin, the two most powerful first line drugs.

11
Data were included if they adhered to the principles of the global project which require accurate
representation of the population under evaluation, and external quality assurance conducted by a
Supranational Reference Laboratory (SRL). Although differentiation by treatment history is
required for data interpretation, we included data from some countries where this was not
possible. Data were obtained through routine or continuous surveillance of all TB cases (48
countries) or from specific surveys of sampled patients, as outlined in approved protocols (35
countries). Data were reported on a standard reporting form, either annually or at the completion
of the survey. Data on resistance to second-line anti-TB drugs were included if drug
susceptibility testing was conducted at a SRL or if the National Reference Laboratory (NRL)
reporting was participating in a quality assurance programme for first-line anti-TB drugs.
Currently there is no established system for international external quality assurance (EQA) for
second-line anti-TB drugs.
The Supranational Reference Laboratory Network (SRLN) was formed in 1994 to ensure optimal
performance of the laboratories participating in the Global Project. The network has expanded
since 2004 and now includes 26 laboratories in six WHO regions and is coordinated by the
Prince Léopold Institute of Tropical Medicine in Antwerp, Belgium. A panel of 30 pretested and
coded isolates is exchanged annually within the network, and the 14th round of proficiency
testing initiated in 2007 includes isolates with resistance to second-line anti-TB drugs. Results
will be available later in 2008.
RESULTS
Magnitude of drug resistant TB
New cases
Data on new cases in this phase of the project were available for 72 countries and 2 SARs of
China. DST results were available for 62 746 patients. The proportion of resistance to at least
one antituberculosis drug (any resistance) ranged from 0% in two Western European countries to
56.3% in Baku, Azerbaijan. The proportion of MDR ranged from 0% in eight countries to 22.3%
in Baku, Azerbaijan and 19.4% in the Republic of Moldova. Of the 20 settings surveyed with the
highest proportion of MDR-TB among new cases in the history of the project, 14 are located in
countries of the former Soviet Union and four are in China. Fifteen of the twenty settings with
the highest prevalence of resistance ever recorded have been reported in the most recent phase of

12
the project, 2002-2007. New data from countries of the Eastern Mediterranean showed that
MDR-TB among new cases was higher than previously estimated with the exception of Morocco
and Lebanon which showed 0.5% and 1.1%, respectively. MDR-TB among new cases was 5.4%,
and 2.9% in Jordan and Yemen, respectively. The Americas, Central Europe and Africa, reported
the lowest proportions of MDR-TB; with the notable exceptions of Peru, Rwanda, and
Guatemala, with 5.3%, 3.9%, and 3.0% MDR-TB among new cases respectively.
Previously treated cases
Data on previously treated cases were available for 66 countries and 2 SARs of China. In total,
DST results were available for 12 977 patients. Resistance to at least one anti-tuberculosis drug
(any resistance) ranged from 0% in three European countries to 85.9%, in Tashkent, Uzbekistan.
The highest proportions of MDR were reported in Tashkent, Uzbekistan (60.0%), and Baku,
Azerbaijan (55.8%). New data from Gujarat State, India, are the first reliable source of data on
previously treated cases in India and show 17.2% MDR-TB among this group.
Unknown and combined cases
36 countries reported data on cases with unknown treatment history. In most countries this
group of cases represented a small proportion of total cases; however, in nine countries, and one
city in Spain, this was either the majority or the only group reported. Australia, Fiji, Guam, New
Caledonia, Puerto Rico, Qatar, Solomon islands, Barcelona, Spain, and the USA.
Survey coverage and population weighted means
Based on available information from the duration of the Global Project, the most recent data
available from 114 countries and 2 SARs of China was weighted by the population in areas
surveyed, representing 2,509,545 TB cases, with the following results: Global population
weighted proportion of resistance among new cases: any resistance 17.0% (95% CLs, 13.6-20.4),
isoniazid resistance 10.3% (95% CLs, 8.4-12.1), and MDR 2.9% (95% CLs, 2.2-3.6). Global
population weighted proportion of resistance among previously treated cases: any resistance
35.0% (95% CLs, 24.1-45.8), isoniazid resistance 27.7% (95% CLs, 18.7-36.7), MDR 15.3%
(95% CLs, 9.6-21.1). Global population weighted proportion of resistance among all TB cases:

13
any resistance 20.0% (95% CLs, 16.1-23.9), isoniazid resistance 13.3% (95% CLs, 10.9-15.8),
and MDR 5.3% (95% CLs, 3.9-6.6)3.
Global Estimates
Based on drug resistance information from 114 countries and 2 SARs of China reporting to this
project, as well as 9 other epidemiological factors, the proportion of MDR among new,
previously treated and combined cases was estimated for countries with no survey information
available. The estimated proportion of MDR for all countries was then applied to estimated
incident TB cases. It is estimated that 489,139 (95% CLs, 455,093-614,215) cases emerged in
2006, and the global proportion of resistance among all cases is 4.8% (95% CLs, 4.6-6.0). China,
India, and the Russian Federation are estimated to carry the highest number of MDR cases.
China and India carry approximately 50% of the global burden and the Russian Federation a
further 7%.
Trends
Trends were evaluated in 47 countries with 3 or more data points. In low TB prevalence
countries conducting continuous surveillance, trends were determined in the group of total cases
reported. In countries conducting surveys, or where population of previously treated cases tested
changed over time4, trends were determined in new cases only.
Notably in the US and Hong Kong significant reduction of the burden of MDR in the population
continues. In both countries both TB notifications and MDR are declining, but MDR is
declining at a faster rate. In most central and western European countries where TB, particularly
drug resistant forms of TB, are imported, absolute numbers as well as proportions of MDR
among all cases are relatively stable. Both Peru and the Republic of Korea are showing increases
in MDR among new cases. Both countries showed steady declines in TB notification rates
followed by recent leveling off. In countries of the former Soviet Union there are two scenarios.
Two Baltic countries (Estonia, and Latvia) are showing a stable and flat trend in proportions of
MDR among new cases, Lithuania shows a gradual and significant increase but at a slow rate.
3 Population figures are based on data reported in 2005.

14
All three countries are showing a decreasing TB notification rate (5 to 8% reduction per year).
This is held in contrast to two Oblasts in the Russian Federation (Orel, and Tomsk) which are
showing an increase in the proportion of MDR among new cases, as well as increases in absolute
numbers. Notification rates are declining in both regions but at a slower rate than in the Baltic
countries.
Extensively drug resistant TB (XDR-TB)5
Thirty five countries and two special administrative regions were able to report data on XDR-TB
either through routine surveillance data or through drug resistance surveys. Quality assurance
for laboratory testing was variable across countries reporting6. Twenty five countries reported
routine surveillance data while ten countries reported from periodic surveys. Some countries
reported data aggregated over a three year period, and other countries reported over a one year
period. The numbers of MDR cases tested for the appropriate second-line anti-TB drugs are
used as a denominator. In total, data were reported on 4 012 MDR-TB cases, and among those
301 or 7.0% XDR-TB cases were detected. Twenty five countries that reported were European;
however three countries from the Americas and seven settings of the Western Pacific region also
reported data. Survey data was available from two African countries, Rwanda and preliminary
data from UR Tanzania, where no XDR-TB was found. No data were reported from the Eastern
Mediterranean region or from the South East Asian region, although surveys including second-
line anti-TB drug susceptibility testing are ongoing in both regions.
In general, absolute numbers of XDR-TB cases were low in Central and Western Europe, the
Americas and in the Asian countries that reported data. The proportion of XDR-TB among
MDR-TB in these settings varied from 0% in 11 countries to 30.0% in Japan. These countries
have a relatively low MDR-TB burden, so this represents few absolute cases. A more significant
problem lies in the countries of the former Soviet Union. Of the 9 countries that reported,
approximately 10% of all MDR-TB cases were XDR ranging from 4.0% in Armenia to almost
4 Proportion of resistance among new cases is considered a more robust indicator of recent transmission. Additional information regarding the previous history of treatment is required to determine trends of resistance in this population. 5 Extensively drug resistant TB (XDR-TB) is defined as TB with resistance to at least isoniazid and rifampicin and resistance to a fluoroquinolone, and a second line injectable agent. 6 Previous data reported data from South Africa following a different methodology are included in the maps and discussions but not in the analysis.

15
24.0% in Estonia; however these proportions represent a much larger absolute number of cases.
Recently released data from South Africa showed that of 996 or 5.6% of 17 615 MDR isolates
collected from 2004 through October of 2007 were XDR-TB. Proportions varied across
provinces with KwaZulu-Natal reporting 656 or 14% of 4701 MDR cases as XDR-TB. Selection
and testing practices varied across the country and over time; however all isolates correspond to
individual cases7. Since 2002 a total of 45 countries have reported at least one case globally.
Several other countries are in the process of completing DST.
HIV and MDR
Of the seven countries that reported data on drug resistance stratified by HIV status, only Latvia
and Donetsk Oblast, Ukraine reported large enough numbers to examine the relationship
between the two epidemics. Any resistance and MDR were significantly associated with HIV in
both Latvia and in Donetsk Oblast; however, HIV negative and HIV unknown were not
distinguished in Latvia. From the data reported in Latvia the proportion of MDR among HIV
positive cases was shown to be stable over time.
MDR-TB treatment programmes
By the end of 2007, 67 projects in 51 countries had been provided with second-line anti-TB
drugs through the Green Light Committee for a cumulative total of over 30 000 MDR-TB
patients. 23,256 cases of MDR-TB were notified in 2006 (8.7% of these cases were reported
from GLC projects) representing less than 5% of the global number of MDR-TB cases estimated
to have emerged in 2006. The average treatment success rate within GLC projects was 62%8
with Latvia reporting the best treatment success rate (69%). Globally, both the number of MDR-
TB patients treated as well as the projected numbers for MDR-TB cases to be treated in 2007 and
2008, as reported by National TB Programmes (NTPs)[1], are far below targets set out by the
Global XDR-TB Response Plan[2]
7 Data from a retrospective review of the National Health Laboratory Service of South Africa were presented at the IUATLD World Conference on Lung Health. 8-12 November 2007. Cape Town, South Africa. 8 Mirzayev F, Treatment outcomes from 9 projects approved by the Green Light Committee between 2000 and 2003. 38th World Conference on Lung Health. 8-12 November 2007. Cape Town, South Africa.

16
CONCLUSIONS
Magnitude of drug resistant TB
The population weighted mean of MDR-TB among all TB cases from the 114 countries and 2
SARs of China that have reported to the global project is 5.3% (95% CLs, 3.9-6.6), but ranges
from 0% in some western European countries to over 35% in some countries of the former
Soviet Union. In terms of proportion, the countries of the former Soviet Union are facing a
serious and widespread epidemic where the population weighted average of countries reporting
indicates that almost half of all TB cases are resistant to at least one drug and every fifth case of
TB will have MDR-TB. MDR-TB cases in this region have more extensive resistance patterns
including some of the highest proportions of XDR-TB.
Following countries of the former Soviet Union, provinces in China reported the highest
proportions of resistance, while Western Europe, followed by countries in Africa, reported the
lowest proportions of MDR-TB. It is important to note at least one country in all six WHO
regions has reported >3.0% MDR-TB among new cases.
Based on the most recent survey data from 114 countries and 2 SARs of China as well as 9 other
epidemiological factors we estimated the burden of incident MDR-TB for a further 69 countries
to develop a global estimate and to better establish the incident global burden of MDR-TB cases.
We estimate that 489,139 (95% CLs, 455,093-614,215) MDR-TB cases emerged in 2006, and
the global proportion of resistance among all TB cases is 4.6% (95% CLs, 4.6-6.0). China and
India are estimated to carry 50% of the global burden of cases, and the Russian Federation is
estimated to carry a further 7%.
Data from surveys in ten of 31 provinces in China over a ten year period indicate that drug
resistance is widespread and in terms of proportion ranked second to countries of the former
Soviet Union, but China has the highest burden of cases in the world. It is estimated that 130,548
(97,633-164-900) MDR-TB cases emerged in 2006 or over 25% of the global burden. The high
proportion of drug-resistant TB among new cases in China suggests a concerning level of
transmission of drug-resistant strains. It is estimated that over 1 in 10 cases of MDR TB that

17
emerged in 2006 globally occurred in patients in China without a history of prior anti-TB
treatment. Now that China has reached the global targets for case detection and treatment success
the rapid implementation of services for the diagnosis and treatment of MDR-TB is necessary to
ensure success of the TB control programme and control transmission of drug-resistant strains.
Careful monitoring of the trends of resistance in China should remain a priority.
Data from nine sites in India show that drug resistance among new cases is relatively low;
however, new data from Gujarat indicate that 17.2% MDR among retreatment cases is higher
than previously anticipated and it is estimated that 110,132 (79,975-142,386) MDR-TB cases
emerged in India in 2006, representing over 20% of the global burden. Although plans have been
developed for management of 5000 MDR-TB cases annually by 2010, insufficient laboratory
capacity is seen as the primary limitation in implementation of these plans.
Trends
The available trend data show a range of scenarios. The majority of low TB burden countries
reporting surveillance data showed stable proportions of resistance as well as absolute numbers
of cases. Trends in resistance in Hong Kong represent the best case scenario where MDR-TB is
falling faster than TB. Countries such as Peru and the Republic of Korea showed increasing
proportions in MDR-TB. Although both countries have shown a decline in overall TB
notifications, the decline has slowed in recent years. In Peru this may reflect weakening in basic
TB control including management of MDR-TB. The Republic of Korea has recently integrated
the private sector into a national surveillance network which may explain the recent leveling of
the TB notification rate. The reason for the increase in proportion of MDR-TB among new cases
is not yet clear.
The most important findings of this report however, are the trend data reported from the Baltic
countries and the Russian Federation where the MDR-TB epidemic is widespread. The Baltic
countries are showing a decline in TB notification rates with the proportion of MDR-TB held
relatively stable. The Baltic countries likely represent the best scenario for this region. The
surveyed oblasts of the Russian Federation show a different picture where TB notifications are
falling but at a much slower rate, and where the proportion as well as absolute numbers of MDR-
TB are significantly increasing, especially among new cases. The declining notifications in these

18
oblasts of the Russian Federation suggest that TB control is improving and susceptible TB cases
are being successfully treated, but it is likely that a large pool of chronic cases continues to fuel
the epidemic, reflected in the growing proportion of MDR-TB cases. The two oblasts that
reported are some of the best performing regions in the country. Commitment to TB control
seen in recent years, including new legislation updating the TB strategy, and the nationwide
implementation of TB control activities, including management of MDR-TB cases and the
upgrade of diagnostic services financed by the Global Fund and the World Bank, indicates
positive momentum, but efforts will have to be accelerated to impact what appears to be a
growing epidemic of drug resistant TB.
XDR-TB
XDR-TB is more expensive and difficult to treat than MDR-TB and outcomes for patients are
much worse9, therefore understanding the magnitude and distribution of XDR-TB is important.
Despite limitations in the quality assurance applied to laboratory testing, data from this report
indicate that XDR-TB is widespread with 45 countries having reported at least one case. The
high proportion of XDR-TB among MDR-TB as well as the large overall burden suggests a
significant problem within the countries of the former Soviet Union. Japan, and the Republic of
Korea in a previous study, have also shown a high proportion of XDR-TB among MDR. South
Africa reported a moderate proportion of XDR-TB among MDR-TB cases; however, the
underlying burden of MDR-TB is considerable and 44% of TB patients are estimated to be co
infected with HIV. Few representative data from Africa are available with the exception of
Rwanda and preliminary data from Tanzania, which showed no XDR-TB and very little second
line resistance among MDR-TB cases suggesting that second-line anti-TB drugs have not been
widely used in these two countries; however, risk populations should continue to be monitored.
XDR-TB is likely to emerge where second-line anti-TB drugs are widely and inappropriately
used; however transmission is not limited to these settings. Data were largely reported from high
income countries or with the assistance of a Supranational Laboratory, indicating that countries
require strengthened capacity to monitor second line resistance if we are to develop an accurate
understanding of the global magnitude and distribution.
9 Personal communication Vaira Leimane, National TB Programme, Latvia.

19
MDR and HIV
Despite the expansion of HIV testing and treatment globally, only seven countries were able to
report drug resistance data disaggregated by HIV status. The two countries with the most robust
data both showed a significant association between HIV and MDR-TB. Both of these countries
are situated in the former Soviet Union where diagnostic networks for both TB and HIV are
relatively well developed. This population level association is a great concern for countries
without accessible diagnostic networks in place, indicating that HIV infected patients will not
receive appropriate therapy quickly enough to avert mortality. It is important to note other
supporting evidence suggests that the association between HIV and MDR-TB may be more
closely related to environmental factors such as transmission in congregate settings rather than
biological factors[3]. Though this requires further investigation, it indicates that improving
infection control in congregate settings including health care facilities and prisons may be one of
the most critical components in addressing dual infection. The development of laboratory
networks to provide rapid diagnosis of resistance using molecular methods, particularly for HIV
infected patients, is of utmost importance.
Coverage and Methods
Survey coverage continues to expand with data from several additional high burden countries
and the reliability of surveillance data continues to improve; however, major gaps exist in
populations covered and epidemiological questions answered. Laboratory capacity remains the
largest obstacle, but other survey components also strain the capacity of most National TB
programmes (NTPs), resulting most importantly in the inability to determine trends in most high
burden countries. HIV testing continues to scale up, but has proven difficult to incorporate
where testing is not already a component of routine care. Second line testing is not available in
most countries. Newly available policy guidance will assist in the development of this capacity
in countries. However, SRLs will continue to play a very important role in providing this service
in the meantime. As part of the Global Plan to Stop TB all countries are committed to scaling up

20
diagnostic networks, but until culture and drug susceptibility testing are the standard of diagnosis
everywhere surveys will continue to be important to monitor resistance. Currently molecular
methods are being piloted in order to expand coverage and increase trends, but new survey
methods, such as continuous sentinel surveillance, must also be considered. Special studies must
supplement surveys in order to answer the questions about risk factors for acquisition and
transmission dynamics of drug resistance that routine surveillance can not.
TB Control and drug resistant TB [4]
Preventing the development of drug resistant TB should continue to be the top priority for all
countries; however, managing the MDR-TB cases that emerge is part of the Stop TB strategy and
should be a component of all TB programmes, however, for countries facing high proportions of
drug resistance, high burden countries carrying the largest absolute burden of MDR-TB, and
countries with a population heavily co infected with HIV, developing rapid detection and
management of drug resistant cases is of great urgency. Although by 2006, basic TB control has
expanded to 184 countries globally, the targets for number of MDR-TB cases detected and
treated have not been reached, and the latest information reported indicates that at the current
pace few countries will reach the targets outlined in the Global Plan to Stop TB.
If targets are to be achieved coordinated global efforts will be required to roll out the full
package of TB services as outlined by the Stop TB Strategy to prevent the further emergence of
MDR-TB. The enhancement of infection control measures to prevent transmission, the
expansion of high quality diagnostic services for timely detection of cases, and community
involvement to improve adherence are three priority areas that need more attention, but perhaps
most importantly, the development of treatment programmes into which patients can be enrolled
and treated successfully is the most fundamental.
In the two countries with the highest TB burden, China and India, 8% and 5% of TB cases are
estimated to have MDR-TB and will likely not respond to treatment they currently receive. In
countries of Eastern Europe 1 in 5 cases will have MDR-TB, signaling that new drugs are
urgently needed. The current pipeline is inadequate to respond to the pressing need.

21
Chapter 1. INTRODUCTION
The fourth report of the WHO/IUATLD Global Project on Anti-Tuberculosis Drug Resistance
Surveillance provides the latest data on the magnitude of drug resistance in 81 countries and 2
SARs of China collected between 2002 and 2007, as well as the most up to date trends from 47
countries collected over a thirteen year period.
The Global Project was initiated in 1994 in order to estimate the global burden of drug resistant
TB worldwide using standardized methodologies so that data could be compared across and
within regions. The Project was also begun to monitor trends in resistance, evaluate the
performance of TB control programmes and to advise on drug regimens. The report is published
every three years as most countries require between 12 and 18 months to complete a drug
resistance survey.
Until 2000, very few NTPs globally were managing drug resistant TB cases in the public sector,
and with the exception of high income countries and countries of the former Soviet Union
diagnosis of drug resistance in TB was largely unavailable. Following the roll out and successful
implementation of "DOTS-Plus" pilot projects for the management of drug resistant TB between
2000 and 2005, a new Stop TB Strategy was launched in 2006. The New Stop TB Strategy
includes the diagnosis and the management of drug resistant TB. The launch of the Stop TB
Strategy was followed by the Global Plan to Stop TB, 2006-2015 that provided targets for scale
up and budgets required for the implementation of the strategy. Now, through the Global Fund
and with the help of the Green Light Committee, most countries are initiating or scaling up the
diagnosis and management of drug resistant TB. Until diagnosis of drug resistance is routine,
surveys or surveillance systems will play an important role in determining the magnitude and
trends in drug resistant TB.
In terms of the initial goals of the Global Project, considerable progress has been made in
expanding coverage and estimating the global burden of MDR-TB as well as strengthening
laboratories, but the Project has not met several of its initial goals suggesting that it may be time

22
to review some of the project methods. There are still major geographic gaps for which there is
no information on the burden of drug resistant TB. Trend data from high burden countries are
few. Adjustment of regimens is limited not by available data, but by the availability of new
drugs. treatment. In addition, there is need for the monitoring of resistance to some of the key
second-line anti-TB drugs and a better understanding of epidemiological relationship between
drug resistance and HIV. Interim drug resistance surveillance guidelines were published in
2007, and a meeting planned in 2008 to review current methods in drug resistance surveillance
will provide key input for a revision of these technical guidelines.
This report is based on the analysis of a quarter of a million isolates collected since 1994, in 114
countries and 2 SARs of China, representing one half of all notified TB cases. The report
addresses the following areas:
The most recent profile of anti-tuberculosis drug resistance, looking at the latest data available
for the period 2002-2007; Dynamics of anti-tuberculosis drug resistance over time, or trends;
HIV and drug resistance; XDR-TB; The global means and distribution of resistance across and
within regions, looking at the most recent data for each country or geographical setting surveyed
since 1994; Estimates of the burden of MDR-TB by country and region; Results of proficiency
testing of laboratories over time.

23
Chapter 2. METHODS
The Global Project methodology for surveillance of drug resistance was developed by a
WHO/IUATLD working group in 1994, which published guidelines for surveillance of
resistance in tuberculosis, in 1994, that were updated in 1997 and 2003[5]. Further interim
guidelines have been published in 2007[6]. The methodology operates on three main principles:
(1) the survey must be based on a sample of TB patients representative of all cases in the
geographical setting under evaluation; (2) drug resistance must be clearly distinguished
according to the treatment history of the patient (i.e. never treated or previously treated) in order
to allow correct interpretation of the data; and (3) optimal laboratory performance of each
participating laboratory must be attained through engaging in a quality assurance programme,
including the international exchange of isolates of M. tuberculosis.
Definitions of drug resistance
DRUG RESISTANCE AMONG NEW CASES
Resistance among new cases is defined as the presence of resistant isolates of M. tuberculosis in
patients who, in response to direct questioning, deny having had any prior anti-TB treatment (for
as much as 1 month) and, in countries where adequate documentation is available, for whom
there is no evidence of such a history. Drug resistance among new cases is used to evaluate
recent transmission.
DRUG RESISTANCE AMONG PREVIOUSLY TREATED CASES
Resistance among previously treated cases is defined as the presence of resistant isolates of M.
tuberculosis in patients who, in response to direct questioning, admit having been treated for
tuberculosis for 1 month or more or, in countries where adequate documentation is available, in a
patient for whom there is evidence of such a history. In previous reports resistance among
previously treated patients was used as a proxy for acquired resistance; however, evidence shows
that this patient category is comprised of patients who have acquired resistance, have been
primarily infected with a resistant strain, subsequently and subsequently failed therapy, as well
as patients who have been re-infected. Therefore resistance among previously treated cases is not
a useful proxy for truly acquired resistance[7, 8].

24
COMBINED PROPORTION OF DRUG RESISTANCE
Combined proportion of drug resistance is the proportion of resistance in the population
surveyed regardless of prior treatment. Despite the importance of the distinction between drug
resistance among new and previously treated cases, 36 countries reported data on cases with
unknown treatment history. In most countries this group of cases represented a small proportion
of total cases; however, in nine countries, and one city in Spain this was the only group reported
or represented the majority of all cases (Australia, Fiji, Guam, New Caledonia, Puerto Rico,
Qatar, Solomon islands, Barcelona, Spain, and the USA).
Given the risk of misclassification due to reporting bias by patients or health staff, the combined
proportion of anti-TB drug resistance represents a better approximation to the level of drug
resistance in the community than the separate data for new and previously treated patients.
Combined figures represent data collected on new and previously treated cases as well as all
cases with an unknown treatment history.
EXTENSIVELY DRUG RESISTANT TB (XDR-TB)
XDR-TB is defined as TB with resistance to at least isoniazid and rifampicin as well further
resistance to a fluroquinolone and a second line injectable agent (amikacin, kanamycin, or
capreomycin).
Survey areas and sampling strategies
New surveillance or survey projects presented in this report were carried out between 2002 and
2007, with the exception of two surveys in India carried out in the districts of Hoogli, West
Bengal State, and Mayhurbhanj in Orissa State in 2001, and nationwide survey in Paraguay in
2001. Since 1999, the United Kingdom submits data to EuroTB in two ways – for England,
Wales and Northern Ireland together, either with or without Scotland. In this report Scotland is
included in data reported from the United Kingdom. Cuba, France, Italy, and Japan operate
sentinel networks for surveillance. All, with the exception of Italy, can be considered nationally
representative.
Trend data from Germany and from the United Kingdom are evaluated from 2001 because
surveillance methods changed in that year. Final data from UR Tanzania and Madagascar were

25
not available at the time of analysis for this report, and results should be considered preliminary.
Data from Senegal was still undergoing quality control of results.
Terminology
For the purposes of this report it is important to distinguish between surveys and surveillance.
Surveillance, in this report, refers to either continuous or sentinel surveillance. Continuous
surveillance is based on routine TB diagnosis including drug susceptibility testing provided to all
TB cases in the coverage area, and thus reflects the entire TB population – smear-positive,
smear-negative, extrapulmonary – regardless of treatment status. Sentinel surveillance of drug
resistance, in the context of this report, comprises reporting of DST results from all TB cases
from a (random or non-random) sample of sites. Sentinel surveillance reports annual data from
the same sites with the exception of Japan which conducts sentinel surveys every three years.
Surveys are periodic, and reflect the population of registered pulmonary smear-positive cases.
Depending on the area surveyed, a cluster sampling technique may be adopted, or all diagnostic
units included. While some countries, such as Botswana, repeat surveys every 3–5 years, for the
purposes of this report they are considered as repeated surveys and not surveillance.
Survey areas
In both survey and surveillance settings, the coverage area is usually the entire country, but in
some cases sub national units are surveyed. Large countries, such as China, India, the Russian
Federation, Brazil, Indonesia, and South Africa, tend to survey large administrative units (e.g.
province, state, district, or oblast). Some countries have opted to limit surveys or surveillance to
metropolitan areas, as in the case of Azerbaijan, Uzbekistan, and China. Several countries (e.g.
Cuba, France, Italy, and Japan) conduct sentinel surveillance and some other countries have
restricted surveys to sub national areas because of the remoteness of certain provinces or to avoid
conflict areas. Data for Denmark do not include Greenland and the Faroe Islands.
Calculation of sample size
Calculation of sample size for surveys follows the principles outlined in the WHO/IUATLD
Guidelines for the surveillance of resistance in tuberculosis[5]. Briefly, sample sizes are
calculated on the basis of the number of new sputum smear-positive cases registered in the

26
previous year and the expected proportion of rifampicin (RMP) resistance in new TB cases based
on previous studies or data available from the NTP. Separate sample sizes should be calculated
for new cases and previously treated cases. However, the number of sputum-positive previously
treated cases reported per year is usually small and, the intake period needed to achieve a
statistically adequate sample size is long. Therefore, most countries have obtained an estimate of
the drug resistance level among previously treated cases by including all previously treated cases
who present at centres during the intake period. While this may not provide a statistically
adequate sample size, it can nevertheless give a reasonable estimate of drug resistance among
previously treated cases. Surveys in Gujarat, India, Baku, Azerbaijan, Armenia, and Georgia
were designed with separate sample sizes for retreatment cases. In efforts to scale up diagnosis
and treatment of MDR-TB many countries plan to expand routine culture and DST to all
retreatment cases. Once fully implemented these data will provide routine estimates of drug
resistance in these populations.
Sampling methods
Sampling strategies for monitoring of drug resistance include:
▪ countrywide, continuous surveillance of the population;
▪ surveys with sampling of all diagnostic centres during a specified period;
▪ surveys with randomly selected clusters of patients;
▪ surveys with cluster sampling proportional to the number of cases notified by the diagnostic
centre.
Survey protocols
The quality of survey protocols has improved over the last ten years. The majority of protocols
reviewed in this phase of the project were very complete and included detailed budgets,
timelines, and plans for quality assurance at several levels. Most of the protocols reviewed were
submitted through a local Ethics Review Board or the Ethics review board of a technical partner
supporting the project.

27
Collection of data
Patient eligibility and registration
For surveys, all newly registered patients with smear-positive TB were eligible for inclusion,
including children, and foreign-born persons. In surveillance settings, all TB patients were
included. As in previous phases of the Global Project, HIV testing was not a mandatory
component of these surveys; however, it has increasingly been incorporated in survey settings.
Geographical settings that performed HIV testing as part of the survey were advised to follow
international guidelines on counselling and confidentiality. This report includes data from 93
settings in 81 countries and 2 SARs of China. Survey data were reported from 35 countries or
geographical settings and surveillance data from 48 countries or geographical settings.
Resistance to second-line anti-TB drugs
Thirty five countries and two special administrative regions reported data on second-line anti-TB
drug resistance among confirmed MDR-TB isolates identified in routine surveillance or in
surveys. A further five countries reported data on cohorts of known MDR-TB patients. Data
from laboratory registers from South Africa are reported but not included in any analyses.
HIV
Eight settings in seven countries reported data on drug resistance stratified by HIV status: Cuba,
Honduras, Latvia, the Russian Federation (Tomsk Oblast), Spain (Barcelona and Galicia),
Ukraine (Donetsk Oblast) and Uruguay. Data were reported stratified by positive and unknown
HIV status from Latvia and Galicia, Spain, and disaggregated by positive, negative and unknown
HIV status from the remaining settings. Four countries were not able to discriminate between
negative and unknown HIV status.
Age and Sex
Data on drug resistance stratified by sex and age groups was reported by 43 settings in 36
countries from all the six WHO Regions. Among these settings seven were able to report
information for more than one year.

28
Accuracy of information on prior TB treatment
It was recommended that re interview and double-checking of patient histories be undertaken in
survey settings to reduce the possibility of misclassification of previously treated cases. The
majority of countries cross checked patient history collected in the survey with medical records,
but fewer countries re-interviewed a percentage of patients.
Data management in individual countries
Since 1998, EuroTB, a project funded by the European Commission and based in Paris, France,
has undertaken continuous collection and verification of drug resistance surveillance data in
Western Europe and much of Central Europe. Since 2001, WHO and EuroTB have used a
common collection form. All the data for Western Europe and much of that for Central Europe
included in the present report were provided by EuroTB and conform to WHO/IUATLD Global
Project standards. Other countries conducting surveillance have provided data either directly to
WHO Headquarters or via WHO regional offices. All new data reported have been returned to
countries for verification before publication. In this phase of the Global Project, a fourth version
of WHO software, surveillance of drug resistance in tuberculosis (SDRTB 4.0), was used by
many countries conducting surveys for data entry, management, and analysis of survey data.10
However, most countries conducting continuous surveillance of drug resistance in all TB cases
use their own software. The Global Project requests that survey protocols include a description
of methods used for the quality assurance of data collection, entry, and analysis.
Bacteriological methods
In survey settings, sputum smear microscopy using the Ziehl-Neelsen technique was used for
diagnosis of TB and subsequent enrolment in the survey. In surveillance settings, a combination
of smear and culture was used for initial diagnosis. The majority of laboratories used
Löwenstein-Jensen (L-J) culture medium on which the specimen was inoculated after
decontamination with sodium hydroxide (2-4%) or 1% cetyl-pyridium chloride (CPC). Some
laboratories inoculated sodium hydroxide decontaminated specimen directly onto Ogawa
medium without centrifugation. Labs in high income countries generally used liquid medium or
10 Brenner E. Surveillance of drug resistance in tuberculosis software: SDRTB3. Geneva, World Health Organization Geneva. 2000.

29
agar based medium. Identification of isolates was based on the niacin production test, the nitrate
reduction test the para-nitrobenzoic (PNB) acid (500 mg/l) test[9], and the thiophene-2-
carboxylic acid hydrazide (TCH) (2mg/l) resistance test[10]. Some countries also used molecular
hybridization probes. Mycobacteria other than M. tuberculosis complex were excluded from the
analysis.
Drug susceptibility tests were performed using the simplified variant of the indirect proportion
method on L-J medium, the absolute concentration method, the resistance ratio method,[11, 12]
or the radiometric Bactec 460 or MGIT 960 method.11 The proportion method was most
frequently used in all phases of the Global Project. Resistance was expressed as the percentage of
colonies that grew on recommended critical concentrations of the drugs tested (i.e. 0.2 mg/l for
isoniazid (INH), 2 mg/l for ethambutol (EMB), 4 mg/l for dihydrostreptomycin sulfate (STR)
and 40 mg/l for rifampicin (RMP) when L-J medium is used). The criterion used for drug
resistance was growth of 1% or more of the bacterial population on media containing the critical
concentration of each drug. The results of the tests were recorded on standardized forms.
Proficiency testing and re-testing of a proportion of survey strains are two components of
external12 quality assurance of laboratories. Briefly, proficiency testing requires the exchange of
a panel of 20 (or more) pretested isolates between the SRL and the NRL. Results of this round
determine, in part, whether the performance of the laboratory is sufficiently high to conduct DST
for the survey or whether additional training is necessary. For re testing of survey strains, the
laboratory conducting the survey sends a percentage of both resistant and susceptible isolates to
the SRL for checking. The percentage of isolates sent for checking is determined before the
beginning of the survey. Adequate performance is defined as no more than one false-positive or
false-negative result for rifampicin or isoniazid and no more than two for streptomycin or
ethambutol. To date, the results of NRL proficiency testing have been evaluated by the
corresponding SRL and interventions have been based on the judgement of the SRL. In several
instances testing has been repeated to ensure acceptable performance and, in exceptional
11 Siddiqi SH. BACTEC 460TB system. Product and procedure manual, 1996. Becton Dickinson and Company, 1996. 12 In most cases, external quality control is international, as often the SRL is located outside of the country.

30
instances, surveys have been interrupted and data excluded because of significant discordance
between the NRL and the SRL.
Susceptibility testing for second-line anti-TB drugs was performed using a range of methods and
concentrations. Until 2007 there was limited international consensus on susceptibility testing for
second-line anti-TB drugs. At the time of this report WHO had published policy
recommendations for second line DST [13] and full technical guidelines are under development.
External quality assurance for second-line anti-TB drugs was also not available during the time
period of data collection. Starting in 2007 isolates with resistance to second-line anti-TB drugs
have been included in the panels exchanged within the network of SRLs and extended to a few
selected NRLs. Data on second line drug resistance were included if the country was
participating in annual external quality assurance for first-line anti-TB drugs or if isolates were
tested for second line resistance at a SRL. In general, countries conducting surveys sent MDR
isolates to SRLs for retesting and for DST for second-line anti-TB drugs.
HIV testing
All countries with the exception of the Ukraine reported routine HIV testing information used for
patient care. Information on methods used and quality assurance were not collected for this
report. In Donetsk Oblast, Ukraine a locally produced HIV enzyme-linked immunosorbent assay
(ELISA) test detecting HIV 1 and HIV 2 Ab (Diaprof Med, Kiev, Ukraine) was used for
screening. All positive results were confirmed by the Genscreen Plus HIV Ag-Ab (Bio-Rad
Laboratories, Steenvoorde, France).
Statistical procedures – data entry, checking and cleaning
With the exception of Western and Central European countries, all settings reported data and
other information about survey and surveillance methods through a standard data collection
form. The standard data collection form is used to compile aggregated survey results. Completed
forms were collected and reviewed at all levels of WHO, by country offices, regional offices and
at headquarters. All data in the form of annexed tables were returned to the country for a final
review before publication. All data are entered into a Microsoft Access database.

31
Statistical analysis
Analysis was conducted on drug resistance data for new cases, previously treated cases, and
combined proportions. The following patterns of drug resistance were highlighted: resistance to
any TB drug, MDR-TB, and any resistance to isoniazid, rifampicin streptomycin , and
ethambutol. XDR-TB was also highlighted where data were available. Descriptive statistics were
calculated in Stata (version 9.0; StataCorp). Arithmetic means, medians and ranges were
determined as summary statistics for new, previously treated, and combined cases, for individual
drugs and pertinent combinations. For geographical settings reporting more than a single data
point since the third report, only the latest data point was used for the estimation of point
proportion. All tests of significance were two-tailed and the alpha-error was kept at the 0.05 level
in all inference procedures. Ninety-five percent confidence intervals were calculated around the
proportions and the means. Box plots were developed to illustrate the distribution of the data
reported in WHO regions. Population weighted means from the last data point of all countries
reporting to the project are calculated to reflect the mean proportion of resistance by region
based on countries reporting data to the project. In the past unweighted medians were reported by
regions, but as expansion of surveys takes place within countries and increasing numbers of low
TB prevalence countries report data to the project, a population weighted mean was considered
more valuable for estimating proportions of resistance (see below).
Global data using the last data point from all countries that have reported
For maps, means and Global Project coverage estimates the last data point from all settings ever
reporting to the project were included. Global and regional means of resistance among new,
previously treated, and all TB cases were weighted by new smear positive, retreatment, and all
TB cases notified in the area surveyed in 2005[1], respectively. For surveys carried out on a sub
national level (states, provinces, oblasts), information representing only the population surveyed
is included where appropriate.
HIV, resistance to second-line anti-TB drugs, age and sex
If HIV, second line DST results, or age and sex data from a given setting was available from
more than one survey and one year the information was combined for the analysis. Information
from new and previously treated cases was also combined for analysis.

32
The association between HIV and drug resistant TB was evaluated through calculation of an
odds ratio to compare proportion of drug resistance in HIV infected and uninfected patients.
Statistical significance was tested using a Fisher's exact test.
For analysis of resistance to second-line anti-TB drugs the denominator used was MDR isolates
tested for resistance to at least one fluroquinolone and one injectable second-line anti-TB drug
(required to define XDR-TB). XDR-TB and fluroquinolone resistance are the two categories
reported.
The association between MDRTB and the variables sex and age groups was studied in a
multivariate logistic regression analysis. Statistical analyses were performed using Stata (version
9.0; StataCorp).
Dynamics of resistance over time
Analysis was conducted on proportion of drug resistance among new cases in survey settings
among new and combined cases in settings conducting routine surveillance. Only countries and
settings with three or more data points were included in this exercise. The following patterns of
drug resistance were highlighted: any drug resistance, MDR, and any INH resistance. For
settings that reported at least three data points, the trend was determined visually as ascending,
descending, flat, indeterminate. The relative increase or decrease was expressed as a proportion
Statistical significance of trends was determined through a logistic regression.
Estimates
A total of 183 countries and 2 SARs of China that account for nearly 100% of the world’s
population were included in the present analysis, which used data from the most recent national
surveys. For Brazil, Kenya, the Central African Republic, Sierra Leone, and Zimbabwe, the
surveys covered most, but not quite all, of the respective countries. For China, India, Italy,
Malaysia, Mexico, the Russian Federation, Spain, Turkmenistan, Uganda, Ukraine, and
Uzbekistan, the surveys were sub national. For these countries, the proportion of MDR-TB cases
was estimated as the mean of the results obtained from surveys conducted at the sub national
level weighted by the population of patients with TB as described above. For countries for which
data from repeated surveys were available, only the most recent data were included. MDR-TB

33
rates among new cases were available from 104 countries and 2 SARs of China. Among them 97
also reported data on MDR-TB rates among previously treated cases. A total of 10 countries
reported data on combined cases only. The estimated number of new TB cases globally and by
country was used to calculate the number of MDR-TB cases that occurred among new cases. To
estimate the number of previously treated cases, for each country we multiplied the ratio of
notified previously treated cases to notified new cases in 2006 by the total number of new cases
estimated to have occurred in the same year, therefore the total number of estimated case
includes estimated retreatment cases. Estimates were developed using a logistic regression model
described in detail elsewhere[14].
Validity of the findings
Surveillance and survey data are prone to errors that may to some extent invalidate the findings.
Those errors, or biases, may be related to the selection of subjects, the laboratory testing, the
data-gathering or the data analysis. Where cases are sampled only for a short period or in a
restricted geographical area, the sample may not be fully representative of the total eligible
population. Selection bias may also occur when only a particular subgroup of TB patients is
included in the sample.
Distinguishing accurately between new and previously treated cases is not always possible, as
this depends on the patients’ willingness to disclose a history of prior anti-TB treatment and on
the training and motivation of the staff. For various reasons, patients may be unaware of their
treatment antecedents, or prefer to conceal this information. Consequently, in some survey
settings, a certain number of previously treated cases may have been misclassified as new cases.
(Misclassification in the opposite direction is considered unlikely.) The impact of this
misclassification may result in an overestimation of the resistance rates among new cases; it is
difficult, however, to estimate the magnitude of this bias. It is important to mention that the
proportion of resistance will be biased only if the correctly classified and misclassified TB
patients have different risks for drug resistance.
Another bias, which is often not addressed in field studies, is the difference between the true
prevalence and the observed or “test” prevalence. That difference depends on the magnitude of
the true prevalence in the population, and the performance of the test under study conditions (i.e.

34
its sensitivity and specificity). In practice, no test is completely accurate. Therefore reported
prevalence will either over- or underestimate the true prevalence in the population. In general,
the sensitivity of specificity of isoniazid and rifampicin tends to be very high. It is more likely to
find test errors in tests for ethambutol and streptomycin. This is particularly true for the
evaluation of second-line anti-TB drugs where external quality assurance does not exist and
resistance to these drugs is relatively rare.
Some settings reported a small number of resistant cases, and a few settings reported a small
number of total cases examined. There were a number of possible reasons for these small
denominators in various participating geographical settings, ranging from small absolute
populations in some surveillance settings to feasibility problems in survey settings. This was
particularly true for previously treated cases. The resulting reported prevalences thus lack
stability and important variations are seen over time, though most of the variations are not
statistically significant. Where there were serious doubts concerning the representativeness of the
sample of previously treated cases, the data were not included in the final database.
It is also important to note that retreatment cases are a very heterogeneous group comprised of
patients who have relapsed, defaulted, been treated in the private sector, failed treatment once or
several times, and cases that have been re-infected. Thus, for optimal interpretation of survey
results it is important to disaggregate patients by treatment history as accurately as possible.
Very few settings have been able to do this due given the complexity of the interviews and the
review of medical history required.

35
Chapter 3. RESULTS
PHASE 4 OF THE GLOBAL PROJECT 2002-2007
Phase 4 of the Global Project provides the most recent data on anti-TB drug resistance, from 93
geographical settings in 81 countries and 2 SARs of China. Of these, 33 provided national or sub
national data that were never previously reported.
Subnational surveys, i.e. at the provincial, district, or city level, account for the discrepancy
between the number of geographical settings and the number of countries. Eight countries had
results for 20 sub national areas and two special administrative regions. Azerbaijan reported data
from Baku city. China reported data from one province, one Autonoumous Region two
municipalities and two special administrative regions (SAR); Heilongjiang province, Inner
Mongolia Autonomous Region, Beijing and Shanghai municipalities, and Hong Kong and
Macao Special Administrative regions. India reported data from one state and three districts;
Gujarat State, Ernakulam district within Kerala State, Hoogli district within West Bengal State,
and Mayhurbhanj District within Orissa State. Indonesia reported data from Mimika district, in
the Papua Province. The Russian Federation reported data from three of eighty-nine oblasts;
Mary El, Orel, and Tomsk. Spain reported data from two regions and one city; Aragon, Galicia,
and Barcelona. The Ukraine reported data from Donetsk Oblast, and Uzbekistan reported data
from Tashkent city.
Types of data
The most recent anti-TB drug resistance profile contains data from 93 settings in 83 countries:
• 66 countries and 2 SARs of China provided information on drug resistance among new,
previously treated and combined cases;
• 6 countries reported drug resistance information on new cases only;
Andorra, Luxembourg, and Malta did not detect any previously treated cases.
• 36 countries reported on cases with unknown treatment history. In most countries this group
of cases represented a small proportion of total cases; however, in nine countries, and one

36
region in Spain, this represented the majority or the only group reported. Australia, Fiji,
Guam, New Caledonia, Puerto Rico, Qatar, Solomon islands, Barcelona, Spain, and the USA
Drug resistance among new TB cases
Full details of the proportion of drug resistance among new cases for the period 1994-2006 are
given in Annex 1. This section of the report covers the latest data from countries reporting from
2002 to 2007. The median number of cases tested per setting in survey settings was 547 but
ranged from 101 new cases in Mimika district in the Papua province of Indonesia to 1619 new
cases in Viet Nam. The median number of new cases tested among the settings conducting
surveillance was 485, and ranged from 7 cases in Iceland to 3379 in the United Kingdom.
Any resistance among new cases
Seventy two countries and 2 SARs of China provided data on the prevalence of any drug
resistance among new cases of TB. The overall drug resistance ranged from 0% (Iceland13),
1.4% (95% CLs, 0.6-2.9) in Bosnia & Herzegovina and 1.5% (95% CLs, 0.6-2.9) in Sri Lanka to
49.2 (95% CLs, 44.4-54.3) in Georgia, 51.2 (95% CLs, 44.1-58.3) in Tashkent, Uzbekistan, and
56.3 (95% CLs, 50.2-62.9) in Baku City Azerbaijan, respectively. Thirteen settings reported
prevalence of resistance to any drug 30% or higher. (Figure 1. Any resistance among new cases).
13 Iceland has been excluded from further analyses because no resistance was detected in the latest data reported.

37
FIGURE 1: COUNTRIES/SETTINGS WITH PREVALENCE OF ANY RESISTANCE
HIGHER THAN 30% AMONG NEW CASES, 2002–2007
0 5 10 15 20 25 30 35 40 45 50 55 60 65 70
Viet Nam
Jordan
Guatemala
Inner Mongolia Autonom ous Region, China
Tomsk Oblast, RF
Latvia
Armenia
Heilongjiang Province, China
Donetsk Oblast, Ukraine
Republic of Moldova
Georgia
Tashkent, Uzbekistan
Baku City, Azerbaijan
MDR among new cases
Prevalence of MDR ranged from 0% (Andorra, Cuba, Luxembourg, Malta, Slovenia, Aragon,
Spain, and Uruguay) to 19.4% (95% CLs, 16.5-22.6) in the Republic of Moldova, and 22.3%
(95% CLs, 18.5-26.6) in Baku, Azerbaijan. Fourteen settings reported a prevalence of MDR
among new cases higher than 5.0% (Figure 2).

38
FIGURE 2: COUNTRIES/SETTINGS WITH MDR PREVALENCE HIGHER THAN 5.0%
AMONG NEW CASES 2002-2007
0 5 10 15 20 25 30
Georgia
Heilongjiang Province, China
Inner Mongolia Autonomous Region, China
Orel Oblast, RF
Armenia
Lithuania
Latvia
Mary El Oblast, RF
Estonia
Tashkent, Uzbekistan
Tomsk Oblast, RF
Donetsk Oblast, Ukraine
Republic of Moldova
Baku City, Azerbaijan
Any isoniazid resistance among new cases
Prevalence of isoniazid resistance (INH) ranged from 0% in Malta and Iceland, 0.6% (95% CLs,
0.0-3.3) in Cuba and 0.7% (95% CLs, 0.2-1.9) in Sri Lanka to 42.4% (95% CLs, 35.5-49.5) in
Tashkent, Uzbekistan, and 40.8% (95% CLs, 35.7-46.5) in Baku city, Azerbaijan. Sixteen
settings reported a prevalence of isoniazid resistance 15% or higher among new cases (Figure 3).

39
FIGURE 3: PREVALENCE OF ANY RESISTANCE TO INH, AMONG NEW CASES, 2002-
2007
0 5 10 15 20 25 30 35 40 45 50 55 60
Israel
Heilongjiang Province, China
Viet Nam
Orel Oblast, RF
Lithuania
Inner Mongolia Autonomous Region, China
Estonia
Georgia
Mary El Oblast, RF
Tomsk Oblast, RF
Armenia
Latvia
Donetsk Oblast, Ukraine
Republic of Moldova
Baku City, Azerbaijan
Tashkent, Uzbekistan
Drug resistance among previously treated TB cases
Data on the prevalence of drug resistance among previously treated cases were available for 66
countries and 2 SARs of China (Annex 2). The number of cases tested in settings conducting
routine surveillance ranged from 1 (Iceland) to 522 (Poland) with a median of 58 cases per
setting. The number of cases tested in settings conducting surveys ranged from 16 (Lebanon) to
1047 (Gujarat State, India) and 2054 cases in the Republic of Moldova14, with a median of 11015.
14 The sample of previously treated cases included in the survey from the Republic of Moldova includes a large proportion of cases that had been on treatment for more than month but were not classified as retreatment cases in the TB register.

40
Any resistance among previously treated cases
There was no resistance reported in Iceland, Israel, and Norway where the number of previously
treated cases was very small. In contrast, Baku, Azerbaijan and Tashkent, Uzbekistan showed
tremendously high prevalences of any resistance – 84.4% (95% CLs, 76.9-92.4) and 85.9% (95%
CLs, 76.6-92.5), respectively. In sixteen settings, prevalence of any resistance was reported as
50% or higher (Figure 4).
FIGURE 4: COUNTRIES/SETTINGS WITH A PREVALENCE OF ANY RESISTANCE
HIGHER THAN 50% AMONG PREVIOUSLY TREATED CASES, 2002-2007
0 10 20 30 40 50 60 70 80 90 100
Thailand
Latvia
Guatemala
Viet Nam
Lithuania
Estonia
Georgia
Heilongjiang Province, China
Inner Mongolia Autonomous Region, China
Donetsk Oblast, Ukraine
Republic of Moldova
Armenia
Lebanon
Jordan
Baku City, Azerbaijan
Tashkent, Uzbekistan
MDR among previously treated cases
No MDR was reported in Denmark, the Netherlands, New Zealand, Sri Lanka, or among the
preliminary data reported from UR Tanzania. Estonia reported 52.1% (95%CLs, 39.9-64.1%)
MDR-TB among previously treated cases, Baku, Azerbaijan, 55.8% (95% CLs, 49.7-62.4%) and

41
Tashkent, Uzbekistan reported 60.0% (95% CLs, 48.8-70.5) respectively. Lebanon reported
62.5% (95% CLs, 35.4-84.8),however only sixteen cases were included in the sample. The
Russian Federation reported data on retreatment cases in Orel Oblast only. Sixteen settings
reported MDR-TB 25% or higher among previously treated cases, (Figure 5).
FIGURE 5: COUNTRIES/SETTINGS WITH PREVALENCE OF MDR HIGHER THAN 30%
AMONG PREVIOUSLY TREATED CASES, 2002-2007
0 10 20 30 40 50 60 70 80
Guatemala
Georgia
Czech Republic
Heilongjiang Province, China
Thailand
Latvia
Oman
Jordan
Armenia
Inner Mongolia Autonomous Region, China
Donetsk Oblast, Ukraine
Lithuania
Republic of Moldova
Estonia
Baku City, Azerbaijan
Tashkent, Uzbekistan
Any isoniazid resistance among previously treated cases
Prevalence of isoniazid resistance ranged from 0% in Iceland, Israel, and Norway, 3.8% (95%
CLs, 1.0-9.5) in Singapore and 4.5% (95% CLs, 0.1-22.8) in Finland to 79.7% (95% CLs, 72.4-
87.5) in Baku city, Azerbaijan, and 81.2 (95% CLs, 71.2-88.8) in Tashkent, Uzbekistan. Fifteen
settings reported a prevalence of isoniazid resistance 30% or higher among previously treated
cases (Figure 6).

42
FIGURE 6: PREVALENCE OF ANY RESISTANCE TO INH AMONG PREVIOUSLY
TREATED CASES, 2002–2007
0 10 20 30 40 50 60 70 80
Guatemala
Gujarat State, India
Viet Nam
Thailand
Orel Oblast, RF
Georgia
Heilongjiang Province, China
Latvia
Inner Mongolia Autonomous Region, China
Jordan
Lithuania
Donetsk Oblast, Ukraine
Estonia
Republic of Moldova
Armenia
Drug resistance among all TB cases
Drug resistance among all TB cases is examined in detail in the trends section of this report for
countries conducting routine surveillance, and all data are available in Annex 3. In the majority
of survey settings the number of previously treated cases is small and does not reflect the
proportion of retreatment cases within the TB programme, therefore when estimating proportions
of resistance among combined cases proportions must be weighted by their population within the
programme generating very wide confidence intervals. Therefore, the only proportion examined
without distinguishing by treatment history is the proportion of non-MDR rifamipicin resistance.
Non-MDR rifampicin resistance is an important programmatic indicator that should be known if
screening for MDR-TB on the basis of rifampicin testing alone. Because rifampicin resistance
unaccompanied by isoniazid resistance is so rare it may also be good laboratory indicator. If non-

43
MDR-TB rifampicin resistance is greater than 3% this should be considered unusual and may
suggest errors in either rifampicin or isoniazid testing. Of the 93 settings that reported, 80%
reported less than 1% non-MDR rifampicin resistance. Only 3 settings reported non-MDR
rifampicin resistance above 3%.
TABLE 1: PREVALENCE OF NON-MDR RIFAMPICIN RESISTANCE AMONG ALL TB
CASES, 2002–200716
0.00% 30 settings0.1-1.0% 47 settings1.1-3.0% 13 settings
Donetsk Oblast, UkraineRepublic of MoldovaParaguayArmeniaBeijing Municipality, ChinaRomaniaErnakulam district, Kerala State, IndiaTomsk Oblast, RFGuatemalaLebanonEthiopiaShanghai Municipality, ChinaRep. Korea
>3.0% 3 settingsJordanHeilongjiang Province, ChinaInner Mongolia Autonomous Region, China
MDR among new and previously treated cases by region
The African region
Six countries reported from the African region. The median sample size was 471 new cases and
46 previously treated cases. MDR among new cases ranged from 0.7% (95% CLs, 0.2-1.8) in
Madagascar to 3.9% (95% CLs, 2.5-5.8) in Rwanda. Côte d'Ivoire did not survey previously
16 Data from countries and settings only reporting on new cases were also included in this analysis.

44
treated cases, and the preliminary data from UR Tanzania showed no MDR among previously
treated cases17.
FIGURE 7: PREVALENCE OF MDR-TB AMONG NEW AND PREVIOUSLY TREATED
CASES IN THE WHO AFRICAN REGION, 2002–2007
0 2 4 6 8 10 12 14 16 18 20
Côte d'Ivoire
Ethiopia
M adagascar
Rwanda
Senegal
UR Tanzania
The Americas region
Eleven countries reported from the Americas region18. The median sample size was 335 for new
cases and ranged from 169 new cases in Cuba to 1809 in Peru. The median sample size for
previously treated cases was 80. No MDR was found among new cases in Cuba or Uruguay.
Guatemala and Peru showed the highest proportion of MDR among new cases, 3.0 % (95% CLs,
1.8-4.6) and 5.3% (95% CLs, 4.2-6.4) respectively.
17 Data from Madagascar and UR Tanzania are preliminary and external quality assurance of laboratory testing was not complete at the time of this report. 18 The USA and Puerto Rico reported on combined cases only and are excluded from this analysis.

45
FIGURE 8: PREVALENCE OF MDR-TB AMONG NEW AND PREVIOUSLY TREATED
CASES IN THE WHO AMERICAS REGION, 2002–2007
0 5 10 15 20 25 30
Cuba
Uruguay
Nicaragua
Canada
Costa Rica
Honduras
P araguay
Argentina
Guatemala
P eru
The Eastern Mediterranean region
Five countries reported from the Eastern Mediterranean region. The median sample size was 264
for new cases and ranged from 111 new cases in Jordan to 1049 in Morocco. The median sample
size for previously treated cases was 42. MDR among new cases ranged from 0.5% (95% CLs,
0.2-1.1) in Morocco to 5.4 (95% CLs, 2.0-11.4), in Jordan.

46
FIGURE 9: PREVALENCE OF MDR-TB AMONG NEW AND PREVIOUSLY TREATED
CASES IN THE WHO EASTERN MEDITERRANEAN REGION, 2002–2007.
0 5 10 15 20 25 30 35 40 45 50 55 60 65
M orocco
Lebanon
Oman
Yemen
Jordan
The European region
Thirty eight countries reported data from the European region. Of the 30 countries, including
three settings in Spain, conducting routine nationwide surveillance the median of combined cases
tested was 483, and ranged from 8 in Iceland to 4800 in the UK. Both absolute numbers and
proportion of MDR-TB were highest in the Baltic countries.

47
FIGURE 10: TOTAL NUMBER OF MDR-TB CASES REPORTED IN EUROPEAN
COUNTRIES AND SETTINGS CONDUCTING ROUTINE SURVEILLANCE. FIGURE X:
PERCENTAGE OF MDR-TB AMONG ALL TB CASES REPORTED.
0.0
0.0
0.0
0.0
0.3
0.4
0.7
0.7
0.8
0.8
0.9
0.9
1.0
1.0
1.1
1.1
1.4
1.5
1.5
1.6
1.6
1.8
1.8
2.1
2.2
2.6
2.7
3.8
5.5
15.2
19.4
20.4
0 5 10 15 20 25 30
Andorra
Iceland
Luxembourg
Malta
Spain
Slovenia
Serbia
Spain
United Kingdom
Netherlands
Sw eden
Croatia
Finland
Bosnia & Herzegovina
Sw itzerland
Ireland
Norw ay
Belgium
Denmark
Poland
France
Spain
Portugal
Austria
Czech Republic
Slovakia
Germany
Italy
Israel
Latvia
Lithuania
Estonia
0
0
0
0
1
2
3
3
3
4
4
4
5
5
6
7
8
9
11
11
12
13
13
22
24
28
39
51
79
105
160
338
0 100 200 300 400
Andorra
Iceland
Luxembourg
Malta
Slovenia
Spain
Finland
Ireland
Norw ay
Spain
Spain
Sw eden
Sw itzerland
Denmark
Croatia
Netherlands
Slovakia
Serbia
Belgium
Bosnia & Herzegovina
Israel
Austria
Czech Republic
Italy
France
Portugal
United Kingdom
Poland
Estonia
Germany
Latvia
Lithuania
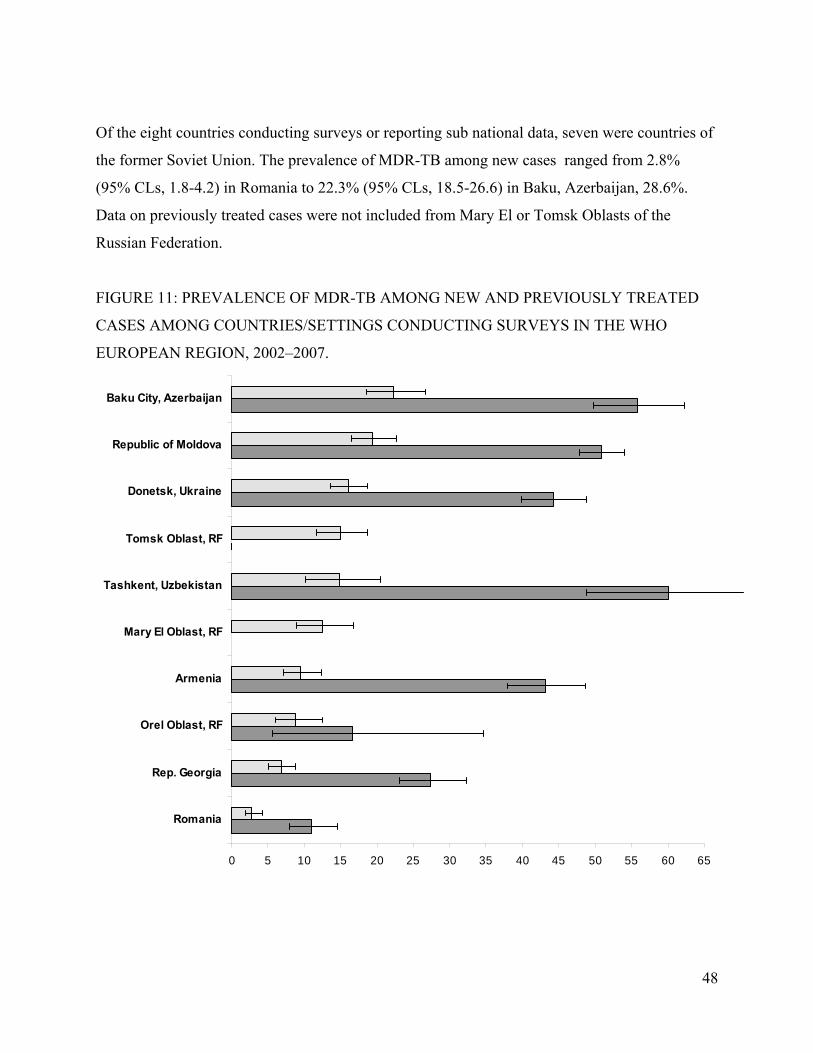
48
Of the eight countries conducting surveys or reporting sub national data, seven were countries of
the former Soviet Union. The prevalence of MDR-TB among new cases ranged from 2.8%
(95% CLs, 1.8-4.2) in Romania to 22.3% (95% CLs, 18.5-26.6) in Baku, Azerbaijan, 28.6%.
Data on previously treated cases were not included from Mary El or Tomsk Oblasts of the
Russian Federation.
FIGURE 11: PREVALENCE OF MDR-TB AMONG NEW AND PREVIOUSLY TREATED
CASES AMONG COUNTRIES/SETTINGS CONDUCTING SURVEYS IN THE WHO
EUROPEAN REGION, 2002–2007.
0 5 10 15 20 25 30 35 40 45 50 55 60 65
Romania
Rep. Georgia
Orel Oblast, RF
Armenia
Mary El Oblast, RF
Tashkent, Uzbekistan
Tomsk Oblast, RF
Donetsk, Ukraine
Republic of Moldova
Baku City, Azerbaijan

49
The South East Asian region
Six countries reported data from the South East Asia region. Of the six countries, including four
settings in India, the median number of new cases tested was 547, and ranged from 101 in
Mimika district in the Papua province of Indonesia, to 1571 new cases tested in Gujarat, India.
The median number of previously treated cases tested was 162. MDR-TB among new cases
ranged from 0.2 %(95% CLs, 0.0-1.0) in Sri Lanka, and 0.7% (95% CLs, 0.1-2.5) in
Mayhurbhanj District, Orissa State, India to 4.0% (95% CLs, 2.6-5.7) in Myanmar. India, Nepal
and Myanmar showed similar proportions of resistance among retreatment cases. Sri Lanka,
showed no resistance and Thailand showed 34.5% (95% CLs, 27.9-41.7) MDR among
previously treated cases.
FIGURE 12: PREVALENCE OF MDR-TB AMONG NEW AND PREVIOUSLY TREATED
CASES IN THE WHO SOUTH EAST ASIAN REGION, 2002–2007.
0 5 10 15 20 25 30 35 40
Sri Lanka
Mayhurbhanj District, OrissaState, India
Thailand
Ernakulam district, KeralaState, India
Mimika district, PapuaProvince, Indonesia
Gujarat State, India
Nepal
Hoogli district, West BengalState, India
Myanmar

50
The Western Pacific region
Seven countries and two special administrative regions19 (Hong Kong and Macao, SAR, China)
reported drug resistance data from the Western Pacific region. Of the six countries that reported
data distinguished by treatment history, including four settings in mainland China, the median
number of new cases tested was 1004, and ranged from 250 in New Zealand to 3271 in Hong
Kong, SAR, both countries conduct routine surveillance of all TB cases. The median number of
previously treated cases tested was 182. MDR-TB among new cases ranged from less than 1.0%
in Hong Kong, SAR, Japan, New Zealand, and Singapore, to 7.2% (95% CLs, 5.9-8.6) and 7.3%
(95% CLs, 5.6-9.4) in Heilongjiang, and Inner Mongolia Autonoumous region of China.
FIGURE 13: PREVALENCE OF MDR-TB AMONG NEW AND PREVIOUSLY TREATED
CASES IN THE WESTERN PACIFIC REGION, 2002–2007.
0 5 10 15 20 25 30 35 40 45 50
Singapore
New Zealand
Japan
Hong Kong SAR, China
Macao SAR, China
Beijing municipality, China
Rep. Korea
Viet Nam
Shanghai municipality, China
Philippines
Heilongjiang Province, China
Inner Mongolia Autonomous region, China

51
DRUG RESISTANT TB BY AGE AND SEX
Data on drug resistance stratified by sex and age groups was reported by 42 settings in 36
countries from all the 6 WHO Regions. Among these settings seven were able to report
information for more than one year. MDR-TB among combined cases was found to be associated
with male sex and with the younger age groups (25-44 years old) in most of the WHO regions.
DRUG RESISTANCE AND HIV
A total of 8 settings in seven countries reported data on drug resistance stratified by HIV status.
The settings that reported are Cuba, Honduras, Latvia, Tomsk Oblast of the Russian Federation,
Spain (Barcelona and Galicia), Ukraine (Donetsk Oblast) and Uruguay. Data were reported
stratified by positive and unknown HIV status from Latvia and Galicia, Spain, and disaggregated
by positive, negative and unknown HIV status from the remaining settings. The lack of
differentiation between HIV unknown and HIV negative weakened the analysis. If data on drug
resistance stratified by HIV status from a given setting was available from more than one survey
and one year the information was combined for the analysis. Information from new and
previously treated cases was also combined for analysis.
Due to the low number of HIV positive cases diagnosed with MDR-TB or with resistance to any
TB drug in the majority of the settings was not sufficiently powerful to examine an association
between HIV and drug resistant TB. The only two settings with large enough number of cases to
be able to examine the relationship between the two epidemics were Latvia and Donetsk Oblast,
Ukraine. HIV infection was significantly associated both to MDR-TB and any anti-TB drug
resistance in both Latvia and in Donetsk Oblast, Ukraine. Table 2 presents the number and
proportion of MDR and any resistance among patients with positive and unknown HIV status in
Latvia from 2001 to 2005.
19 Australia, Guam, Fiji, New Caledonia, and the Solomon islands reported on combined cases only and are excluded from this analysis.

52
TABLE 2: PREVALENCE OF MDR-TB AND ANY RESISTANCE AMONG HIV POSITIVE
TB CASES AND TB CASES WITH UNKNOWN HIV STATUS IN LATVIA, 2001–2005.
MDR Any resistance
DR in HIV
unknown
TB cases (%)
765/5,162
(14.8)
1,782/5,162
(34.5)
DR in HIV
positive
TB cases (%)
39/148
(26.4)
66/148
(44.6)
Odds Ratio
(95% CL)
2.1
(1.4 to 3.0)
1.5
(1.1 to 2.1)
p value < 0.01 < 0.05
In Donetsk Oblast, Ukraine, the drug resistance survey was linked to a TB/HIV survey. In this
study, positive HIV status was found to be an independent predictor for MDR-TB, in addition to
history of previous anti-TB treatment and history of imprisonment20.Table 2 presents the number
and proportion of MDR and any resistance among patients with positive and negative HIV status
in Donetsk Oblast, Ukraine, in 2006.
20 Lyepshina S. Association between multidrug-resistant tuberculosis and HIV status in the civilian and penitentiary sectors of Donetsk Oblast, Ukraine., 38th World Conference on Lung Health. 8-12 November, 2007, Cape Town, South Africa., Abstract Book

53
TABLE 3: PREVALENCE OF MDR-TB AND ANY RESISTANCE AMONG HIV POSITIVE
AND HIV NEGATIVE TB CASES IN DONETSK OBLAST, UKRAINE, 2006.
MDR Any resistance
DR in HIV
negative
TB cases (%)
272/1,143
(23.8)
551/1,143
(48.2)
DR in HIV
positive
TB cases (%)
97/307
(31.6)
173/307
(56.4)
Odds Ratio
(95% CL)
1.5
(1.1 to 2.0)
1.4
(1.1 to 1.8)
p value < 0.01 < 0.05
XDR-TB
Thirty-five countries and two special administrative regions were able to report data on XDR-TB
either through routine surveillance data or through drug resistance surveys. Twenty five
countries and two special administrative regions reported routine surveillance data while ten
countries reported from periodic surveys. Data on new and previously treated cases were
combined and data from multiple years were also combined if available. The denominator used
was MDR-TB cases tested for second-line anti-TB drugs that would allow the definition of
XDR-TB. Data from the national lab registers in South Africa are included although these data
are not considered nationally representative. A further five countries reported data from risk
groups. Nineteen countries have reported at least one case since 2001, although no denominators
are available. Four of these eighteen countries also reported surveillance data, but the XDR-TB
case identified was not found during the years for which surveillance data are reported. A total of
45 countries and 1 special administrative region have identified at least one case of XDR-TB
since 2002. Of the countries conducting routine surveillance; three countries and one oblast of
the Russian Federation reported between 25 and 58 cases over a four year period representing
between 6.6% (95% CLs, 4.5-9.2) of the MDR-TB burden in Tomsk, Oblast to 23.7% (95% CLs,

54
18.5-29.5) in Estonia. The United States reported seventeen cases over a six year period,
representing 1.9% (95% CLs, 1.1-3.1) of MDR-TB cases tested for second-line anti-TB drugs
during this period. Barcelona, Spain and the Czech Republic reported three and five cases
respectively over a four year period, representing 8.1% (95% CLs, 1.7-21.9), and 20.0% (95%
CLs, 6.8-40.7) of their MDR-TB cases. Eight countries conducting routine surveillance detected
between one and two cases of XDR-TB over a four year period. Australia, France, Ireland, the
Netherlands, Slovenia, Sweden reported one case, and Israel and Romania reported 2 cases
during this time period. Aragon, Spain reported one case in 2005. Eight countries reported no
XDR-TB cases over a four year period (Belgium, Croatia, Denmark, Norway, Poland,
Switzerland, Singapore, and the United Kingdom). Canada, China, Macao, SAR, and Galicia,
Spain, and New Zealand also reported no cases, but the reporting period was only one year. Of
the countries conducting surveys; the proportion of XDR-TB among MDR-TB ranged from
0.0% in Rwanda and Tanzania to 12.8% (95% CLs, 9.8-16.3) or 55/431 in Baku, Azerbaijan, and
15.0% (95% CLs, 3.2-37.9), or 3/20 in Donetsk Oblast, Ukraine. Table 4: indicates the country,
the source of the data, the number of MDR-TB cases tested, the years in which data were
reported and the confidence intervals.

55
TABLE 4: COUNTRIES REPORTING DATA ON XDR-TB 2002-2007
Country Source Region Year Method MDRMDR
tested FLQ FLQ%lower
CIupper
CI XDR XDR%lower
CIupper
CI
Representative survey or surveillance dataJapan Global Project, SRL Japan WPR 2002 sentinel 60 55 21 38.2 17 30.9
Estonia EuroTB EEUR 2003-2006 surveillance 248 245 0.0 58 23.7
Latvia Global Project EEUR 2003-2006 surveillance 712 688 0.0 53 7.7
Tomsk Oblast, RF Global Project, SRL Boston, USA EEUR 2003-2005 surveillance 468 458 33 7.2 30 6.6
Lithuania EuroTB EEUR 2003-2006 surveillance 656 173 0.0 25 14.5
USA National Tuberculosis Surveillance System AMR 2000-2006 surveillance 925 601 55 9.2 18 3.0
Hong Kong SAR, China Global Project, SRL Hong Kong, SAR WPR 2005 surveillance 41 41 12 29.3 6 14.6
Czech Republic EuroTB EUR 2003-2006 surveillance 38 25 0.0 5 20.0
Spain, Barcelona Global Project, SRL Spain EUR 2002-2005 surveillance 43 37 4 10.8 3 8.1
Romania EuroTB EUR 2003-2006 surveillance 50 44 0.0 2 4.5
Israel EuroTB EUR 2003-2006 surveillance 45 44 0.0 2 4.5
Ireland EuroTB EUR 2003-2006 surveillance 8 3 0.0 1 33.3
Slovenia EuroTB EUR 2003-2007 surveillance 3 3 0.0 1 33.3
Sweden EuroTB EUR 2003-2006 surveillance 18 0.0 1 5.6
Netherlands EuroTB EUR 2003-2006 surveillance 34 33 0.0 1 3.0
France EuroTB EUR 2003-2006 surveillance 152 149 0.0 1 0.7
Australia Global Project, SRLs Australia WPR 2002-2005 surveillance 43 43 4 9.3 1 2.3
Canada Global Project AMR 2005 surveillance 23 23 0 0.0 0 0.0
UK EuroTB EUR 2003-2006 surveillance 174 62 0.0 0 0.0
Belgium EuroTB EUR 2003-2006 surveillance 31 12 0.0 0 0.0
Switzerland EuroTB EUR 2003-2006 surveillance 25 22 0.0 0 0.0
Poland EuroTB EUR 2003-2006 surveillance 17 6 0.0 0 0.0
Norway EuroTB EUR 2003-2006 surveillance 11 11 0.0 0 0.0
Croatia EuroTB EUR 2003-2006 surveillance 5 1 0.0 0 0.0
Denmark EuroTB EUR 2003-2006 surveillance 5 5 0.0 0 0.0
Singapore Global Project WPR 2002-2005 surveillance 14 14 1 7.1 0 0.0
Macao SAR, China Global Project WPR 2005 surveillance 9 9 1 11.1 0 0.0New Zealand Global Project WPR 2005 surveillance 4 4 2 50.0 0 0.0
Spain, Galicia Global Project EUR 2006 surveillance 2 2 0 0.0 0 0.0
Baku, Azerbaijan Global Project, SRL Borstel, Germany EEUR 2007 survey 431 431 125 29.0 24.8 33.5 55 12.8 9.8 16.3
Armenia Global Project, SRL Borstel, Germany EEUR 2007 survey 199 199 15 7.5 4.3 12.1 8 4.0 1.8 7.8
Donetsk, Ukraine Global Project, SRL Gauting, Germany EEUR 2006 survey 379 20 3 15.0 3.2 37.9 3 15.0 3.2 37.9
Georgia Global Project, SRL Belgium EEUR 2006 survey 105 70 3 4.3 0.9 12.0 3 4.3 0.9 12.0
Republic of Moldova Global Project, SRL Borstel, Germany EUR 2006 survey 203 47 11 23.4 12.3 38.0 3 6.4 1.3 17.5
Argentina Global Project, SRL Argentina AMR 2005 survey 36 36 3 8.3 1.8 22.5 2 5.6 0.7 18.7
Republic of Korea Global Project WPR 2004 survey 110 110 13 11.8 0.1 19.3 2 1.8 0.0 6.4
Spain, Aragon Global Project EUR 2005 survey 4 4 1 25.0 0.6 80.6 1 25.0 0.6 80.6
Rwanda Global Project, SRL Belgium AFR 2005 survey 32 32 3 9.4 2.0 25.0 0 0.0 0.0 8.9
UR Tanzania Global Project, SRL Belgium AFR 2007 survey 6 6 0 0.0 0.0 39.3 0 0.0 0.0 39.3
Routine laboratory data (non nationally representative)
South Africa National Health Laboratory System AFR 2004-2007 retrospective review 17615 0.0 0.0 0.0 996 5.7 5.3 6.0
Risk groups and MDR-TB treatment programmes
Philippines Global Project, GLC program WPR 2005-2006 Confirmed MDR for Tx 293 149 50.9 45.0 56.7 10 3.4 1.6 6.2
DR Congo, Kinshasa Global Project, SRL Belgium AFR 2006-2007 Selection of CatI failures 59 1 1.7 0.0 9.1 0 0.0 0.0 5.0
Burundi Global Project, SRL Belgium AFR 2006-2007 Selection of CatII failures 23 0 0.0 0.0 12.2 0 0.0 0.0 12.2
Myanmar Global Project, SRL Belgium SEAR 2007 Selection of CatII failures 43 4 9.3 2.6 22.1 0 0.0 0.0 6.7
Bangladesh Global Project, Damien Foundation, SRL Belgium SEAR 2003-2006 Retreatment 300 31 10.3 7.1 14.3 3 1.0 0.2 2.9
Countries reporting at least one caseBrazil (1) AMR
Chile (1) AMR
Ecuador (1) AMR
Germany (1) EUR
Iran (2) EMR
Italy (3) EUR
Peru (1) AMR
Portugal (1) EUR
Vietnam NTP report WPR
Mozambique NTP report AFR
India (4) SEAR
Thailand NTP report SEAR
Mexico (1) SEAR
UK* (1) EUR
Poland* NTP report EUR
Norway* NTP report EUR
Canada* NTP report AMR
Botswana NTP report AFR
Nepal NTP report SEAR
* one case reported outside of surveillance data reported to EuroTB
4. Thomas A, Ramachandran R, Rehaman F, et al. Management of multi drug resistance tuberculosis in the field: Tuberculosis Research Centre experience. Indian J Tuberc 2007;54(3):117-24.
1. Emergence of Mycobacterium tuberculosis with Extensive Resistance to Second-Line Drugs – Worldwide, 2000–2004. MMWR 2006;55:301-3052. Masjedi MR, Farnia P, Sorooch S, et al. Extensively drug-resistant tuberculosis: 2 years of surveillance in Iran. Clin Infect Dis 2006;43(7):841-7.3. Migliori GB, Ortmann J, Girardi E, et al. Extensively drug-resistant tuberculosis, Italy and Germany. Emerg Infect Dis 2007;13(5):780-2.

56
DATA REPORTED TO THE GLOBAL PROJECT 1994-2007 AND ESTIMATED
GLOBAL AND REGIONAL MEANS OF RESISTANCE.
Since the start of the Global Project in 1994 data have been collected from 138 settings in 114
countries and 2 SARs of China worldwide. In order to estimate the global and regional means of
resistance and to examine the distribution of resistance within a region we have included data
since the beginning of the project and weighted them by the population they represent. Twenty
countries reported data before the year 2000. Data from these 114 countries and 2 SARs of
China represent 48% of the world's population and 46% of the total TB burden. Table 5: below
describes global and regional population coverage. The population weighted means described in
table 6 and shown in figures 14, 15, 16 and 17, correspond to these figures.
TABLE 5: POPULATION COVERAGE OF DRUG RESISTANCE DATA REPORTED TO
WHO 1994-2007.
Total populationTotal TB cases
Total ss+ TB cases
Total retreatment TB cases
Number of countries
AFR 370,004,932 908,305 360,124 106,025 2250% 72% 65% 84%
AMR 854,140,969 222,731 114,815 21,725 2196% 93% 92% 96%
EMR 208,660,622 58,023 26,483 1,581 839% 22% 23% 14%
EEU 66,639,802 99,990 30,855 23,241 1321% 29% 44% 31%
nonEEU 363,241,951 46,408 13,102 3,694 2764% 55% 51% 44%
SEAR 318,224,322 450,076 176,448 43,123 619% 23% 21% 17%
WPR 929,999,840 724,012 391,784 59,315 1953% 52% 58% 36%
Global 3,110,912,438 2,509,545 1,113,611 258,704 11648% 46% 46% 39% 55%

57
TABLE 6: WEIGHTED MEAN OF RESISTANCE TO FIRST-LINE ANTI-TB DRUG BY
TREATMENT HISTORY AND BY WHO REGION, 1994-2007. Global New Previous Combined AFR New Previous Combined AMR New Previous CombinedCountries 105 94 114 Countries 21 18 22 Countries 19 18 21Settings 127 109 138 Settings 21 18 22 Settings 19 18 21
Any H 10.3 27.7 13.3 Any H 6.7 16.9 8.3 Any H 7.9 20.1 9.9(8.4-12.1) (18.7-36.7) (10.9-15.8) (5.2-8.1) (8.8-25.0) (6.8-9.9) (5.6-10.3) (9.4-30.7) (7.0-12.9)
Any R 3.7 17.5 6.3 Any R 1.9 6.7 2.7 Any R 3.2 16.4 5.3(2.8-4.5) (11.1-23.9) (4.7-7.8) (1.2-2.6) (4.4-9.0) (1.6-3.8) (1.0-5.4) (4.5-28.2) (2.2-8.3)
Any S 10.9 20.1 12.6 Any S 6.9 9.7 8.3 Any S 9.0 14.9 9.6(8.0-13.7) (12.2-28.0) (9.3-16.0) (2.2-11.6) (6.3-13.2) (2.6-14.1) (3.1-14.9) (2.8-27.1) (3.5-15.6)
Any E 2.5 10.3 3.9 Any E 1.3 3.5 2.0 Any E 1.5 5.2 2.0(1.7-3.2) (5.0-15.6) (2.6-5.2) (0.6-2.0) (1.8-5.1) (0.9-3.0) (0.2-2.8) (0.0-10.8) (0.2-3.9)
Any res. 17.0 35.0 20.0 Any res. 11.4 21.4 13.8 Any res. 14.9 28.1 16.7(13.6-20.4) (24.1-45.8) (16.1-23.9) (6.4-16.5) (12.5-30.3) (8.0-19.5) (8.4-21.4) (12.4-43.7) (9.9-23.4)
MDR 2.9 15.3 5.3 MDR 1.5 5.8 2.2 MDR 2.2 13.2 4.0(2.2-3.6) (9.6-21.0) (3.9-6.6) (1.0-2.0) (3.9-7.7) (1.4-3.1) (0.6-3.8) (3.5-22.8) (1.7-6.3)
EMR New Previous Combined EEUR New Previous Combined nonEUR New Previous CombinedCountries 7 7 8 Countries 13 13 13 Countries 27 24 27Settings 7 7 8 Settings 16 15 16 Settings 28 25 29
Any H 6.3 40.3 9.9 Any H 25.6 52.2 38.3 Any H 5.2 13.9 6.2(2.5-10.1) (19.8-60.8) (3.2-16.7) (9.5-41.8) (30.4-74.0) (18.9-57.6) (4.0-6.4) (11.0-16.8) (5.2-7.2)
Any R 3.3 41.7 7.2 Any R 11.4 40.9 24.7 Any R 1.1 8.9 1.9(0.0-7.3) (18.3-65.1) (0.0-15.1) (5.6-17.1) (13.8-68.0) (10.1-39.2) (0.7-1.5) (6.8-11.0) (1.4-2.3)
Any S 10.1 42.2 13.3 Any S 28.8 52.6 40.7 Any S 4.0 9.7 4.4(0.8-19.5) (21.7-62.8) (1.5-25.1) (8.5-49.0) (20.7-84.6) (15.7-65.6) (1.9-6.0) (5.6-13.8) (2.1-6.7)
Any E 1.9 26.2 4.2 Any E 10.4 31.2 19.7 Any E 0.7 3.9 1.0(0.0-4.5) (12.0-40.3) (0.0-9.2) (0.9-20.0) (6.7-55.8) (3.7-35.7) (0.3-1.1) (2.0-5.8) (0.5-1.6)
Any res. 13.7 54.4 17.6 Any res. 35.8 62.8 48.8 Any res. 7.9 17.8 8.9(1.3-26.1) (26.5-82.3) (2.3-33.0) (15.8-55.7) (35.6-90.1) (25.3-72.2) (5.9-10.0) (14.4-21.3) (7.2-10.7)
MDR 2.0 35.3 5.4 MDR 10.0 37.7 22.6 MDR 0.9 7.7 1.5(0.0-4.3) (16.4-54.3) (0.5-10.4) (3.8-16.1) (12.3-63.0) (8.6-36.6) (0.5-1.2) (5.7-9.8) (1.1-2.0)
SEAR New Previous Combined WPR New Previous CombinedCountries 6 5 6 Countries 12 9 17Settings 13 6 14 Settings 23 20 28
Any H 10.3 36.8 15.7 Any H 13.3 34.9 16.5(6.9-13.7) (26.7-47.0) (10.5-20.9) (10.6-16.0) (28.3-41.4) (13.3-19.6)
Any R 3.4 19.3 6.9 Any R 5.0 26.6 8.3(2.4-4.4) (14.1-24.5) (4.8-9.0) (3.4-6.6) (20.2-32.9) (5.7-11.0)
Any S 8.9 21.7 11.7 Any S 14.6 26.3 16.2(5.9-11.8) (13.3-30.2) (7.5-16.0) (10.2-19.0) (17.2-35.4) (11.0-21.2)
Any E 3.0 13.8 4.7 Any E 3.0 13.8 4.5(0.7-5.4) (0.3-27.3) (2.2-7.2) (2.0-4.0) (10.2-17.3) (3.3-5.8)
Any res. 15.8 42.3 20.8 Any res. 22.0 46.5 25.3(11.6-20.0) (32.3-52.3) (14.2-27.4) (17.3-26.8) (37.7-55.2) (19.9-30.7)
MDR 2.8 18.8 6.3 MDR 3.9 21.6 6.7(1.9-3.6) (13.3-24.3) (4.2-8.4) (2.6-5.2) (16.8-26.4) (4.6-8.8)
95% CLs are given between brackets The weighted mean of resistance to individual drugs varied across WHO regions with the
proportion of resistance to every drug, as well as MDR-TB, highest in Eastern Europe and lowest
in Africa and Western and Central Europe. The global weighted mean of MDR was 2.9% (95%
CLs, 2.2-3.6) among new cases, 15.3% (95% CLs, 9.6-21.0) among previously treated cases and
5.3%(95% CLs, 3.9-6.7) among all TB cases.
Table 6: The relationship between resistance to specific drugs across regions and by history of
previous treatment was similar with the highest proportions of resistance to isoniazid and
streptomycin followed by rifampicin and ethambutol. This was true for all regions without

58
regard to treatment history with the exception of previously treated cases in the Eastern
Mediterranean region where rifampicin resistance was higher than isoniazid resistance. Figures
18, 19, and 20 shows the distribution of proportions of MDR-TB, any resistance, and isoniazid
resistance among combined cases within region .
FIGURE 14: WEIGHTED MEAN OF RESISTANCE TO SPECIFIC DRUGS AMONG NEW
CASES, BY WHO REGION, 1994-2007
0.0
5.0
10.0
15.0
20.0
25.0
30.0
Global AFR AM R EM R EUR (E) EUR (WC) SEAR WPR
streptomycin isoniazid rifampicin ethambutol

59
FIGURE 15: WEIGHTED MEAN OF RESISTANCE TO SPECIFIC DRUGS AMONG
PREVIOUSLY TREATED CASES, BY WHO REGION, 1994-2007
0.0
5.0
10.0
15.0
20.0
25.0
30.0
35.0
40.0
45.0
50.0
55.0
Global AFR AM R EM R EUR (E) EUR (WC) SEAR WPR
streptomycin isoniazid rifampicin ethambutol
FIGURE 16: WEIGHTED MEAN OF RESISTANCE TO SPECIFIC DRUGS AMONG ALL
TB CASES TREATED CASES, BY WHO REGION, 1994-2007
0.0
5.0
10.0
15.0
20.0
25.0
30.0
35.0
40.0
45.0
Global AFR AM R EM R EUR (E) EUR (WC) SEAR WPR
streptomycin isoniazid rifampicin ethambutol

60
FIGURE 17: WEIGHTED MEAN OF MDR-TB AMONG NEW, PREVIOUS TREATED AND
COMBINED TB CASES BY WHO REGION, 1994-2007
0.0
5.0
10.0
15.0
20.0
25.0
30.0
35.0
40.0
Global AFR AM R EM R EUR (E) EUR (WC) SEAR WPR
New Previous Combined
A box plot is one way of graphically depicting groups of numerical data through their five-
number summaries (the smallest observation, lower quartile (Q1), median, upper quartile (Q3),
and largest observation). A box plot also indicates which observations, if any, might be
considered outliers. Outliers may present valuable information about epidemiological clues or
data validity. Box plots are able to visually show different types of populations, without making
any assumptions of the underlying statistical distribution. The spacings between the different
parts of the box help indicate variance, skewness and identify outliers. Figure 18 shows the
distribution of MDR within regions. The widest distribution in the Eastern European region,
while the narrowest distribution is found in central and western Europe and the African region.
Box plots in figures 19 and 20, showing the distribution of any resistance and isoniazid
resistance also show the widest distribution in the Eastern European region; and the narrowest
distribution found in Central and Western Europe and in Africa, although not as narrow as the
distribution of MDR-TB.

61
FIGURE 18: BOX PLOT DISTRIBUTION OF MDR-TB AMONG COMBINED TB CASES
BY WHO REGION, 1994-2007
0.1
.2.3
.4
AFR AMR EMR EUR (E) EUR (WC) SEAR WPR
FIGURE 19: BOX PLOT DISTRIBUTION OF ANY RESISTANCE AMONG COMBINED
TB CASES BY WHO REGION, 1994-2007
0.2
.4.6
.8
AFR AMR EMR EUR (E) EUR (WC) SEAR WPR

62
FIGURE 20: BOX PLOT DISTRIBUTION OF ANY RESISTANCE TO INH AMONG
COMBINED TB CASES BY WHO REGION, 1994-2007
0.2
.4.6
AFR AMR EMR EUR (E) EUR (WC) SEAR WPR
Correlation between MDR cases in national registers and survey data
The proportion of MDR-TB reported in national registers of cases receiving DST were compared
to the proportion of MDR estimated through surveys. This was done to examine whether routine
data can be used to estimate the proportion of MDR-TB in the population. The only WHO region
that was significantly correlated was the European region suggesting that estimations of MDR-
TB are either based on routine data already, or can be in the future. Other regions are not
routinely testing for MDR-TB, and in these regions surveys will continue to play an important
role in estimating the MDR-TB burden.

63
FIGURE 21: CORRELATION OF DRUG RESISTANCE SURVEY DATA WITH ROUTINE
NOTIFICATION OF MDR-TB.
DYNAMICS OF DRUG RESISTANCE OVER TIME (1994-2007)
The Global Project has collected data from 114 countries and 2 SARs of China. The following
analysis includes data from all global reports, as well as data provided between the publication of
reports. It thus reflects both published and previously unpublished data. This analysis is limited
to countries reporting three data points or more. Trend information on MDR-TB and resistance
to any drug are available for countries reporting more than one year of information in Annexes 6
and 7. Fifty countries have reported three or more years of data, eight countries have reported on
two years and fifty eight countries have reported baseline data only. In countries conducting
surveillance on all TB cases trends are reported on both new and combined cases. In settings
0.00
0.01
0.10
1.000.00 0.01 0.10 1.00
0
AFR
0.00
0.01
0.10
1.000.00 0.01 0.10 1.00
0
AMR
0.01
0.10
1.000.00 0.01 0.10 1.00
0
EMR
0.00
0.01
0.10
1.000.00 0.01 0.10 1.00
0
EUR
0.001
0.010
0.100
1.0000.00 0.01 0.10 1.00
0
SEAR
0.001
0.010
0.100
1.0000.00 0.01 0.10 1.00
0
WPR

64
conducting surveys trends are reported on new cases only. Proportions of MDR-TB, isoniazid
resistance, and any resistance were examined.
TABLE 7: DATA POINTS AVAILABLE FOR TREND ANALYSIS BY WHO REGION,
1994-2007 Number of data points
WHO region 1 2 ≥3 Total
Africa 19 2 1 22Americas 12 3 6 21Eastern Mediterranea 6 0 2 8Europe 9 1 30 40South East Asia 4 0 2 6Western Pacific 8 2 9 19
58 8 50 116
Numbers and proportions of any resistant and MDR-TB for new and combined cases for all
settings reporting two data points or more are available in annexes 6 and 7.
Declining trends in resistance
The USA and Hong Kong, SAR, China reported significant decreasing trends MDR-TB among
all TB cases. Hong Kong, SAR, China also showed significant decreases in any resistance
among all cases and isoniazid resistance and MDR-TB among new cases. Both countries report
declining TB notifications. Denmark showed significant declines in any drug resistance in both
new and combined TB cases. Puerto Rico showed declining trends in any resistance and MDR-
TB among combined cases. Singapore showed a significant decrease in prevalence of MDR-TB
among all TB cases; however numbers were very small.

65
FIGURE 22: HONG KONG, SAR, CHINA 1994-2005
TB notification rate
0.00
0.01
0.02
0.03
0.04
1994 1996 1998 2000 2002 2004 2006
MDR-TB among all TB cases
Any INH resistance among all TB cases
Hong Kong, SAR 1995-2005
0.00
0.05
0.10
0.15
0.20
1994 1996 1998 2000 2002 2004 2006
0
25
50
75
100
125
150
1995 1997 1999 2001 2003 2005

66
FIGURE 23: USA, 1994-2005
USA 1994-2005
0
3
6
9
12
15
1994 1996 1998 2000 2002 2004 2006
TB notification rate
0.00
0.01
0.02
0.03
0.04
1993 1995 1997 1999 2001 2003 2005
MDR-TB among all TB casestested for INH and RMP
0.00
0.05
0.10
0.15
1993 1995 1997 1999 2001 2003 2005
INH resistance among all TB cases tested for INH and RMP
Stable trends in resistance
Several countries are showing either stable proportion of resistance over time or stable absolute
numbers of cases. Many low TB prevalence countries may show fluctuating trends in prevalence
of resistance because their overall burden of TB is low; however most of these countries report
small absolute numbers of MDR-TB per year, figure 24.
Countries of the Baltic region (Estonia, Latvia, and Lithuania) are showing relatively stable
trends in MDR-TB among new cases, with a slow but significant increase in MDR-TB among
new cases in Lithuania. The proportion of resistance remains high in these countries, ranging
from 9.8% (CLs, 8.2-11.7) in Lithuania to 13.2% (CLs, 9.7-17.5) in Estonia. These trends in
MDR-TB are coupled with declining TB notification rates in all three countries. Estonia has

67
shown the most rapid decline at about 8% per year, where the TB notification rate has declined
from 59 to 31 per 100 000 between 1998 and 2006. Latvia has shown a decline of about 6% per
year, from 91 TB cases per 100 000 in 1998 to 56 cases in 2006. The notification rate in
Lithuania has declined at a slower rate of just under 5.0% per year, from 79 per 100 000 in 1999
to 56 per 100 000 in 2006.

68
FIGURE 24: ABSOLUTE NUMBERS AND PROPORTIONS OF MDR-TB AMONG LOW TB
PREVALENCE COUNTRIES, 1994-2007
0
20
40
60
80
100
120
94 95 96 97 99 00 01 02 03 04 05
MD
R c
ases
0
1
2
3
4
5
6
7
8
9
10
% M
DR
Germany
0
20
40
60
80
100
94 95 96 97 99 00 01 02 03 04 05
MD
R c
ases
0
1
2
3
4
5
6
7
8
9
10
% M
DR
United Kingdom
0
20
40
60
80
100
94 95 96 97 98 99 00 01 02 03 04 05
MD
R c
ases
0
1
23
4
5
6
78
9
10
% M
DR
Canada
0
20
40
60
80
100
94 95 96 98 99 00 01 02 03 04 05
MD
R c
ases
0
1
2
3
4
5
6
7
8
9
10
% M
DR
Australia
0
20
40
60
80
100
94 95 96 97 98 99 00 02 03 04 05
MD
R c
ases
0
1
2
3
4
5
6
7
8
9
10
% M
DR
Cuba
0
20
40
60
80
100
94 95 96 97 99 00 01 02 03 04 05
MD
R ca
ses
0
1
2
3
4
5
6
7
8
9
10
% M
DR
France
0
20
40
60
80
100
94 95 96 97 99 00 01 02 03 04 05
MD
R c
ases
0
1
2
3
4
5
6
7
8
9
10
% M
DR
Portugal
0
20
40
60
80
100
94 95 96 97 98 99 00 01 02 03 04 05 06
MD
R c
ases
0
1
2
3
4
5
6
7
8
9
10
% M
DR
New Zealand

69
FIGURE 25: ABSOLUTE NUMBERS AND PROPORTIONS OF MDR-TB AMONG NEW TB
CASES IN THE BALTIC COUNTRIES, 1997-2007
5375
50 53 64 51 51 42
050
100150200250300350400450
1998 1999 2000 2001 2002 2003 2004 20050.00
0.05
0.10
0.15
0.20
0.25
0.30
0.35
1997 1999 2001 2003 2005
p=0.6213
71 86 83 99 95 80 114
91
0100200300400500600700800900
1000
1998 1999 2000 2001 2002 2003 2004 2005
64 61 75 84 86 104 12
7
0100200300400500600700800900
1000
1999 2000 2001 2002 2003 2004 2005
0.00
0.05
0.10
0.15
0.20
0.25
0.30
0.35
1997 1999 2001 2003 2005
p=0.0169
New cases tested, New MDR % MDR among new
0.00
0.05
0.10
0.15
0.20
0.25
0.30
0.35
1997 1999 2001 2003 2005
p=0.6213
0
10
20
30
40
50
60
70
1997 1999 2001 2003 2005 2007
Estonia
0102030405060708090
100
1997 1999 2001 2003 2005 2007
Latvia
0102030405060708090
100
1997 1999 2001 2003 2005
Lithuania
0.00
0.05
0.10
0.15
0.20
0.25
0.30
0.35
1997 1999 2001 2003 2005
p=0.3260
TB notification rate
Increasing trends in resistance
In contrast, to the stable proportions of MDR reported among new cases in the Baltic countries,
data reported to the global project from Orel and Tomsk Oblasts of the Russian Federation
indicate statistically significant increases in the proportion of MDR among new TB cases as well
as increases in absolute numbers of cases. Both regions showed increases in isoniazid resistance
though neither were statistically significant. Both regions are showing a slowly declining TB
notification rate. In Orel Oblast the TB notification rate has declined from 81 to 59 per 100 000
between 2000 and 2006, over 3% per year. Tomsk Oblast showed a steady decline by 1.3% per
year from 117 to 108 per 100 000 between 2000 and 2006. During this same time period TB
notification rates for the whole of the Russian Federation have remained stable.

70
FIGURE 26: ABSOLUTE NUMBERS AND PROPORTIONS OF MDR-TB AMONG NEW TB
CASES IN OBLASTS OF THE RUSSIAN FEDERATION, 1997-2007
0.00
0.05
0.10
0.15
0.20
0.25
0.30
0.35
1997 1999 2001 2003 2005
p=0.0068
0.00
0.05
0.10
0.15
0.20
0.25
0.30
0.35
1997 1999 2001 2003 2005
p=0.005527 48 57 7359 95
77
0
100
200
300
400
500
600
1999 2000 2001 2002 2003 2004 2005
TB notification rate
10 11 19 23 28
0
50100
150
200
250300
350
400
1999 2000 2001 2002 2003 2004 2005 20060
20
40
60
80
100
120
1998 2000 2002 2004 2006
Orel oblast
0
20
40
60
80
100
120
1998 2000 2002 2004 2006
Tomsk oblast
New DST, New MDR % MDR among new
The Republic of Korea and Peru have shown increasing trends in MDR-TB, Any resistance and
isoniazid resistance among new cases. Note that in Peru and the Republic of Korea data from
three and four periodic surveys have been reported respectively and confidence intervals are
wide, but nevertheless increases in isoniazid and any resistance were found to be statistically
significant in both settings21. The increase in MDR-TB was statistically significant in the
Republic of Korea. The Republic of Korea has shown a steadily declining TB notification rate
from 1994 until 2003. From 2004 the TB notification rate has increased slowly; however this is
likely due to expansion of the national surveillance system into the private sector. Similarly in
Peru the notification rate dropped from 172 per 100 000 in 1996 to 117 in 2003. From 2004
through 2006 the notification rate has stayed between 123 and 124 per 100 000.
21 At the time of this report Peru had not completed rechecking of laboratory results.
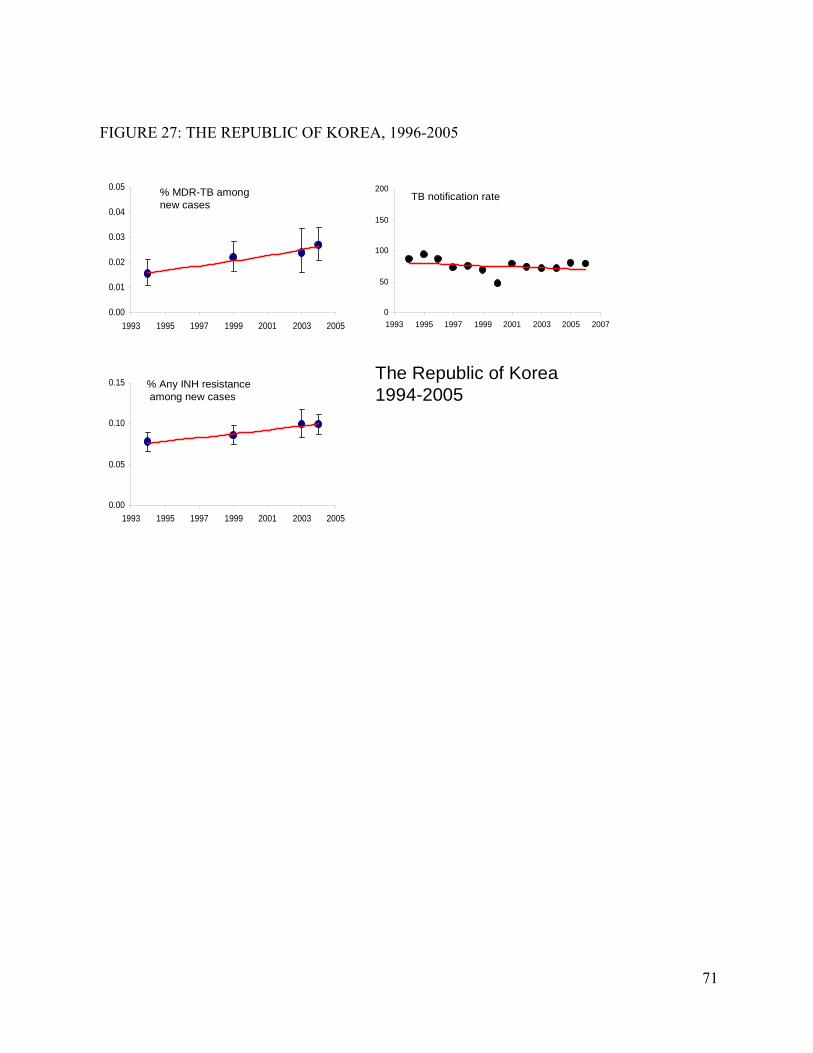
71
FIGURE 27: THE REPUBLIC OF KOREA, 1996-2005
The Republic of Korea 1994-2005
0.00
0.01
0.02
0.03
0.04
0.05
1993 1995 1997 1999 2001 2003 2005
% MDR-TB among new cases
0.00
0.05
0.10
0.15
1993 1995 1997 1999 2001 2003 2005
% Any INH resistanceamong new cases
0
50
100
150
200
1993 1995 1997 1999 2001 2003 2005 2007
TB notification rate

72
FIGURE 28: PERU, 1996-2005
0.00
0.01
0.02
0.03
0.04
0.05
0.06
0.07
1995 1997 1999 2001 2003 2005 2007
0.00
0.10
0.20
0.30
0.40
0.50
0.60
0.70
1995 1997 1999 2001 2003 2005 2007
% MDR-TB among new cases
% Any INH resistanceamong new cases
Peru 1996-2005
0
50
100
150
200
1995 1997 1999 2001 2003 2005 2007
TB notification rate
GLOBAL ESTIMATES OF MDR-TB
Based on drug resistance data reported from 114 countries and 2 SARs of China, we used a
model to estimate the proportion of MDR-TB among new, previously treated, and combined TB
cases for a further 69 countries and to develop a global estimated burden of incident MDR-TB
cases.
New cases
The total number of MDR-TB cases estimated to have occurred in 2006 among newly diagnosed
TB cases was 285,718 (95% CLs, 256,072-399,224), or 3.1% (95% CLs, 2.9-4.3) of the total
number of new TB cases estimated in 2006 in the 175 countries (9,123,922). The numbers and
proportions of MDR-TB among new cases by country are given in annex 8.
Previously treated cases
The total number of MDR-TB cases among previously treated cases was estimated to be 203,230
(95% CLs, 172,935-242,177) or 19.3% (95% CLs, 18.2-21.3) of the estimated number of

73
previously treated cases in 2006 in the 175 countries (1,052,145). Annex 9 gives the numbers
and proportions of MDR-TB among previously treated cases by country.
Total cases
The global estimated number of incident MDR-TB cases in 2006 is 489,139 (95% CLs, 455,093-
614,215) which is 4.8% (95% CLs, 4.6-6.0) of the total number of estimated incident TB cases in
2006 in 185 countries (10,229,315)22. Two high TB burden countries, China and India, are
estimated to have 240,680 cases (95% CLs, 177,608-307,286) which together account for 50%
of all estimated incident cases of MDR-TB. The distribution of all MDR-TB cases by country
can be found in annex 10. The numbers and proportions of MDR-TB among new, previously
treated, and all TB cases by epidemiological region can be found in annex 11.
Table 8. ESTIMATED NUMBERS AND PROPORTIONS OF MDR-TB AMONG ALL TB
CASES BY EPIDEMIOLOGICAL REGION23.
Regions No. of All TB
cases No. of MDR TB cases Low 95% CL High 95% CL % MDR TB
Low 95% CL
High 95% CL
Established Market Economies 105,795 1,317 1,147 1,557 1.2 1.1 1.5 Central Europe 50,502 1,201 623 3,694 2.4 1.3 7.2 Eastern Europe 416,316 80,057 71,893 97,623 19.2 18.0 22.2 Latin America 349,278 12,070 10,523 15,526 3.5 3.0 4.4 Eastern Mediterranean Region 601,225 25,475 15,737 73,132 4.2 2.6 11.9 Africa low HIV incidence 375,801 8,415 6,889 18,758 2.2 1.9 5.0 Africa high HIV incidence 2,656,422 58,296 48,718 118,506 2.2 1.9 4.5 South-east Asia 3,464,313 149,615 114,780 217,921 4.3 3.5 6.2 Western Pacific Region 2,173,333 152,694 119,886 188,014 7.0 6.1 8.1 Surveyed countries 7,953,603 408,325 361,264 464,069 5.1 4.7 5.7 Non surveyed countries 2,239,383 80,814 71,684 188,605 3.6 3.2 8.4 All countries (n=185) 10,192,986 489,139 455,093 614,215 4.8 4.6 6.0
23 The number of all estimated TB cases, includes estimated retreatment cases.

74
THE SUPRANATIONAL LABORATORY NETWORK
Performance, as measured by average sensitivity, specificity, efficiency and reproducibility of
proficiency testing results, of the Supranational Laboratory Network has been consistently good
over the last five years. On average, specificity, sensitivity, efficiency and reproducibility have
stayed between 98-100% for isoniazid, and between 98-100% for rifampicin resistance with the
exception of round 12 where the average specificity was 97%. Performance for ethambutol and
streptomycin testing was generally lower. The average sensitivity for ethambutol ranged from
92-96%. Specificity, efficiency and reproducibility generally stayed between 96-98%, except for
round 12 where the average reproducibility was 95%. Sensitivity, specificity, efficiency and
reproducibility for streptomycin testing generally stayed between 95-98% with the exception of
sensitivity in round 12 which was 92%. Network averages are shown in Table 9. Network
averages, while important to consider when looking at the overall performance of the network,
disguises variation within the network by round. Table 10 shows the variation within the network
for the 13th round of proficiency testing; however, in previous rounds at least one or two labs per
round showed sub-optimal performance. It is also important to note that because results are
determined judicially that strains with less than 80% concordance within the network are
excluded from standard evaluation, however these strains have been examined in subsequent
studies to determine the reason for borderline results. In rounds 9, 10, 11, 12 and 13, there were
nine, nine, seven, twelve and three strains excluded respectively, or approximately 7% (40/600)
of the total strains tested.

75
Table 9: AVERAGE PERFORMANCE OF .SRL NETWORK LABORATORIES OVER FIVE
ROUNDS OF PROFICIENCY TESTING.
# LABS isoniazid rifampicin ethambutol streptomycin
SENSITIVITY2002 round 9 20 99 100 95 962003 round 10 21 100 99 92 972004 round 11 23 100 100 96 992005 round 12 26 99 98 95 922006 round 13 26 100 100 93 98
SPECIFICITY2002 round 9 20 99 99 98 972003 round 10 21 99 98 99 982004 round 11 23 100 100 97 992005 round 12 26 98 97 97 952006 round 13 26 100 100 98 97
EFFICIENCY2002 round 9 20 99 100 96 962003 round 10 21 99 99 97 982004 round 11 23 100 100 97 992005 round 12 26 98 98 97 942006 round 13 26 100 100 97 98
REPRODUCIBILITY2002 round 9 20 100 100 96 982003 round 10 21 99 98 99 982004 round 11 23 99 100 97 1002005 round 12 26 100 98 95 982006 round 13 26 100 100 96 97

76
Table 10. PROFICIENCY TESTING ROUND 13 WITHIN THE SUPRANATIONAL
LABORATORY NETWORK.
Round 13Total participating labs: 26 Method used: No. of labs
1* Proportion method LJ 142* Proportion method agar 33* Bactec 460 34* Resistance ratio 15* Absolute conc. 26* MGIT 3
JUDICIAL RESULTS ONLY
Average100% 95-99% 90-94% 80-89% <80% score
SENSITIVITY 26 0 0 0 0 100%SPECIFICITY 26 0 0 0 0 100%PREDICTIVE VALUE RESISTANT 26 0 0 0 0 100%PREDICTIVE VALUE SUSCEPTIBLE 26 0 0 0 0 100%EFFICIENCY 26 0 0 0 0 100%REPRODUCIBILITY 26 0 0 0 0 100%
Average100% 95-99% 90-94% 80-89% <80% score
SENSITIVITY 26 0 0 0 0 100%SPECIFICITY 24 0 2 0 0 100%PREDICTIVE VALUE RESISTANT 24 0 2 0 0 99%PREDICTIVE VALUE SUSCEPTIBLE 26 0 0 0 0 100%EFFICIENCY 24 2 0 0 0 100%REPRODUCIBILITY 25 0 1 0 0 100%
Average100% 95-99% 90-94% 80-89% <80% score
SENSITIVITY 21 0 4 1 0 98%SPECIFICITY 20 0 4 0 2 97%PREDICTIVE VALUE RESISTANT 20 0 4 0 2 96%PREDICTIVE VALUE SUSCEPTIBLE 21 0 5 0 0 99%EFFICIENCY 15 9 0 2 0 98%REPRODUCIBILITY 20 0 5 0 1 97%
Average100% 95-99% 90-94% 80-89% <80% score
SENSITIVITY 18 0 0 5 3 93%SPECIFICITY 20 5 0 1 0 98%PREDICTIVE VALUE RESISTANT 20 0 0 5 1 96%PREDICTIVE VALUE SUSCEPTIBLE 18 5 2 1 0 97%EFFICIENCY 14 6 4 2 0 97%REPRODUCIBILITY 17 0 8 0 1 96%
No. of labs with results in the range of
No. of labs with results in the range of
STREPTOMYCINNo. of labs with results in the range of
ETHAMBUTOL
SUMMARY STATISTICS, DISCORDANT STRAINS EXCLUDED
ISONIAZIDNo. of labs with results in the range of
RIFAMPICIN

77
Table 11. LINKS WITHIN THE SUPRANATIONAL LABORATORY NETWORK Country WHO region Laboratory Routine
Algeria AFR Laboratoire de la Tuberculose, Institut Pasteur d'Algérie, Alger, Algeria Benin, Jordan, SyriaMauritania, Morocco
Argentina AMR Mycobacteria Laboratory, National Institute of Infectious Diseases ANLIS "Dr Carlos G. Malbran," Buenos Aires, Argentina
Brazil, Cuba, ParaguayUruguay, Venezuela
Australia WPRMycobacterium Reference Laboratory, Institute of Medical and Veterinary Science, Adelaide, Australia
Indonesia
Australia WPR Queensland Mycobacterium Reference Laboratory, Brisbane, Australia Eritrea, New Zealand,Kenya
Belgium EUR Département de Microbiologie, Unité de MycobactériologieInstitut de Médecine Tropicale, Antwerp, Belgium
Bangladesh, Benin, Brazil, Burundi, Cameroon, DR CongoRwanda, Senegal, Slovakia, Sudan, Tanzania, Zimbabwe
Chile AMR Instituto de Salud Publica de Chile, Santiago, Chile Bolivia, Colombia, Dominican Republic, Ecuador, Peru
Czech Republic EUR National Institute of Public Health, Prague, Czech Republic Slovakia
Egypt EMR Central Health Laboratory, Ministry opf Health and Population, Cairo, Egypt Jordan, Libya, Pakistan, Sudan, Syria, Yemen
France EUR Institut Pasteur, Centre National de Référencen des Mycobacteries, Paris, France Côte d'Ivoire, Central African Repoublic, GuineaLebanon, New Caledonia
Germany EUR Kuratorium Tuberkulose in der Welt e.V., IML (Institut für Mikrobiologie und Laboratoriumsdiagnostik) Gauting, Germany
Bhutan, Nepal,Tajikistan,Ukraine (Donetsk), Uzbekistan
Germany EUR National Reference Center for Mycobacteria, Borstel, Germany Austria, Armenia, Azerbaijan, Bosnia and Herzegovina,Croatia, Cyprus, Kazakhstan, Kyrgyzstan, Moldova, Nukus region (UZB and TKM), Serbia, SloveniaSl ki S th S d (MSF)China, Hong Kong SAR, WPR TB Reference Laboratory
Department of Health, SAR Hong Kong, ChinaProvincial surveys ChinaNationwide survey China
India SEAR TB Research Centre (TRC), Indian Council of Medical Research, Chennai, India Provincial surveys India, DPR Korea, Maldives, Sri Lanka
Italy EUR Istituto Superiore di Sanità Dipartimento di Malattie Infettive, Parassitarie e Immunomediate, Rome, Italy and Laboratory of Bacteriology & Medical Mycology andSan Raffaele del Monte Tabor Foundation (hSR), Milan, Italy
Albania, Bahrain, Bulgaria, Burkina Faso, Kosovo, Mozambique, Nigeria, Oman, Turkey,TFYR Macedonia, Qatar
Japan WPR Research Institute of TuberculosisJapan Anti-Tuberculosis Association, Tokyo, Japan
Cambodia, Mongolia, PhilippinesSingapore, Yemen
Korea WPR Korean Institute of Tuberculosis, Seoul, Korea Philippines
Mexico AMR Departamento de Micobacterias Instituto de Diagnostico yReferencia Epidemiologicos (INDRE), Mexico
Belize, Costa Rica, El Salvador, Guatemala, Nicaragua, Panama
Netherlands EUR National Institute of Public Health and the Environment (RIVM), Bilthoven, Netherlands Ethiopia, Poland, Viet Nam
Portugal EUR Centro de Tuberculose e Micobacterias (CTM)Instituto Nacional de Saude, Porto, Portugal
South Africa AFR The Medical Research Council, TB Research Lead ProgrammeOperational and Policy Research, Pretoria, South Africa
Lesotho, Malawi, Namibia, Zambia, Zimbabwe
Spain EUR Servicio de Microbiologia, Hospital Universitaris, Vall d'Hebron, Barcelona, Spain Provincial surveys Spain
Sweden EUR Swedish Institute for Infectious Disease Control (SIDC), Solna, Sweden Belarus, Estonia, Denmark, FinlandIceland, Islamic Republic of IranLatvia, Lithuania, Norway, RomaniaR i F d tiThailand SEA National TB Reference Laboratory Center
Tuberculosis Cluster, Bangkok, ThailandBangladesh, Indonesia, Myanmar
United Kingdom of Great Britain and Northern Ireland
EUR Health Protection Agency , National Mycobacterium Reference UnitDepartment of Infectious Diseases, United Kingdom
Belgium, France, HungaryIreland, Israel, Malta, Samara Oblast, Russian FederationSwitzerland, The Gambia, Seychelles
United States of America AMR Centers for Disease Control and Prevention, Mycobacteriology/ Tuberculosis Laboratory, Georgia, USA
Botswana, CAREC, Guyana, Haiti, Orel Oblast, Russian Federation, Mexico, Puerto RicoSurinam
United States of America AMR Massachusetts State Laboratory, Massachusetts, USA Peru, Tomsk Oblast, Russian Federation

78
Chapter 4. DISCUSSION
Overview
From 1994 through 2007, the Global Project has collected data from areas representing almost
50% of the world’s TB cases. While coverage of the project is increasing on the whole, with
notable expansion in both high TB burden countries and countries with high MDR-TB
prevalence, coverage varies widely. The number of countries submitting survey protocols
through national ethics committees has increased as well as the attention to quality assurance of
patient classification, laboratory results, and data entry.
The areas represented in this project are those with at least the minimum requirements to conduct
drug resistance surveys. Laboratory capacity remains the largest obstacle, but other operational
components required to conduct surveys also strain the capacity of most NTPs resulting most
importantly in the inability to determine trends in most high burden countries. HIV testing
continues to scale up, but has proven difficult to incorporate where testing and treatment are not
already an established component of routine care. DST to second-line anti-TB drugs is not
available in most countries. Newly available policy guidance will assist in developing capacity;
however SRLs will continue to play a very important role in providing second line testing of
selected isolates.
The primary success of the project has been its ability to collect comparative baseline data on
resistance to first-line anti-TB drugs from areas representing half of the world's TB population,
as well as the strengthening of laboratories through the Supranational Laboratory Network.
However the project, by in large, has not achieved its primary objective to measure trends in
drug resistance in high burden countries. As part of the Global Plan to Stop TB, 2006-2015 all
countries are committed to scaling up diagnostic networks, but as shown by the poor correlation
of survey data to routine reporting of MDR-TB in most regions, it is clear that until culture and
drug susceptibility testing are the standard of diagnosis everywhere surveys will continue to be
important to monitor resistance. However, based on observed operational difficulties in the
implementation of repeated surveys it may be time to re evaluate the survey methods we are
using, as well as coordinate supplementary research to answer the epidemiological questions that
routine drug resistance surveillance can not.

79
Survey methods
There are operational, technical, and methodological barriers to the implementation and
repetition of drug resistance surveys in most high burden countries. The foremost operational
barrier is the laboratory capacity. In addition to the laboratory, considerable human resources to
interview and verify patient classification are required, as well as extensive national and
international transport networks required to ship sputum specimens, cultures, and M. tuberculosis
isolates within and across national borders. Some desirable components of surveys such as,
larger sample sizes, better differentiation of sub-categories of previously treated cases, HIV
testing, and DST to second line drugs come at great additional expense and workload to the NTP.
For this reason surveys tend to be repeated infrequently.
Current survey methods are based on smear positive cases. This is done for operational reasons
because smear positive cases are more likely to result in a positive culture required for drug
susceptibility testing. Inclusion of smear negative TB cases may increase survey sample sizes by
up to ten times. Currently there is no evidence to suggest that smear negative cases may have
different proportions of resistance than smear positive cases, however HIV co infected TB cases
are more frequently smear negative and so exclusion of smear negative cases from surveys may
underestimate the proportion of resistance in HIV co infected populations. Current survey
methods are based on patients notified in the public sector, and do not attempt to evaluate
prevalent cases, chronic populations of patients, or patients in the private sector. There are
significant operational difficulties with designing such surveys within the context of routine
programmes, and the resulting information may not warrant the expense required. Additional
research may be useful to explore the prevalence of drug resistance in these three populations.
Another limitation of current methodology has been the ability to determine true acquired
resistance. Previous reports have suggested that resistance among previously treated cases may
be a useful proxy for acquired resistance. Previously treated cases are a heterogeneous group that
may also represent cases that were primarily infected with a resistant strain, failed therapy, and
acquired further resistance. Additional evidence suggests that previously treated cases also may
include patients re-infected with resistant isolates [7, 8, 15]. Without the ability to conduct repeat
drug susceptibility testing and without the use of molecular tools it is very difficult to determine
80
true acquired resistance. Risk factors for acquisition of resistance, particularly in HIV co infected
populations, warrant further research.
If surveillance coverage and determination of trends is to be scaled up in high burden countries
we need to simplify the process of surveys for NTPs. A study is currently ongoing in Tanzania to
validate rapid molecular methods against phenotypic methods in the context of drug resistance
surveys and assess feasibility. Because current knowledge regarding mutations causing
resistance is incomplete, the use of molecular methods alone would limit the amount of
information obtained to one or two drugs. However, a substantial advantage would be the
reduced lab capacity required and the transportation of non infectious material. Laboratory
testing could be carried out within or outside of the country.
When considering the number of drugs tested in routine surveys it is important to keep in mind
that presently the ability to adjust regimens for TB treatment is limited in most countries and the
majority of countries provide four primary regimens; category I for smear positive cases,
category III for smear negative cases, category II for retreatment cases, and category IV for
MDR-TB cases. In programmatic terms surveillance of rifampicin resistance, isoniazid resistance
(MDR-TB) and XDR-TB are the most critical trends to follow.
If rapid rifampicin and isoniazid testing could be used in the context of surveillance (and where
MDR-TB treatment programmes exist), patients identified with MDR-TB could be rapidly
enrolled into a treatment programme and further culture and drug susceptibility testing could be
undertaken to determine resistance to second line drugs. Another option where phenotypic
methods are used, could be to add a fluroquinolone and one or two second line injectable agents
to the panel of drugs tested, or replace streptomycin and ethambutol with a fluroquinolone and an
injectable agent. One option to enable better assessment of trends in drug resistance over time
might be to keep population based clusters open throughout the year. Patients would be classified
by treatment history on a routine basis. Sputum samples or smears could be transported to the
NRL for a period of time each year, or a determined number of cases per month where molecular
testing for rifampicin or rifampicin and isoniazid could be conducted. If a point of care test were
available, then this could simplify the process even further. All cases with rifampicin resistance
would be further screened for resistance to second line drugs and enrolled on treatment. These

81
sites could also develop capacity for programmatic management and be used for screening all
treatment failure cases and cases classified as high risk for drug resistance as outlined in the
Global Plan to Stop TB, 2006-2015.
It is important to distinguish population based surveys used for epidemiological purposes, and
surveys used for programmatic reasons, and studies designed to answer research questions. In
addition to epidemiological surveys, many countries are conducting two types of surveys to
answer relevant programmatic questions. Many countries are determining the proportion of
category I and category II failure cases that have MDR-TB in order to develop a case finding
strategy for MDR-TB cases. Many countries are also conducting second line DST on risk groups,
such as chronic cases, and known MDR-TB cases, in order to examine the extent of second-line
anti-TB drug resistance in these populations but also to inform MDR-TB treatment regimens,
where regimens are standardized. Transmission dynamics and acquisition of resistance are areas
that undoubtedly require further research, but are difficult to answer in the context of routine
surveillance in most settings. A subgroup on research for MDR-TB has recently been set up with
the Stop TB Working group on MDR-TB and it may play a key role in protocol development as
well as coordination and implementation of global research studies.
There are several possibilities for improving current surveillance mechanisms, utilizing both new
molecular tools, as well as modified survey methods. A meeting coordinated by WHO is
planned to take place in 2008 in order to evaluate current methods and develop recommendations
for revisions of the current surveillance strategies.
Magnitude and trends
Survey data indicate that proportions of resistance to any TB drug as well as MDR are lowest in
Western and Central Europe, followed by African countries and then the Americas. The Eastern
Mediterranean and South East Asian region show moderate proportions of resistance, followed
by the Western Pacific region. Eastern Europe continues to report the highest proportions of
resistance globally and for all first line drugs. There are important variations within regions,
particularly in the Eastern Mediterranean and the Western Pacific regions, as well as Europe
when the Western, Central and Eastern Europe are grouped together. Western and Central

82
Europe show little variation in resistance across the region. All WHO regions have reported
outliers.
Trends are showing that a range of scenarios exist. Rapid decreases in MDR-TB are reported
from Hong Kong, SAR, China and the United States. Thailand, limited data from Viet Nam, as
well as three Baltic countries and many low TB prevalence countries are showing stable trends in
MDR-TB. The Republic of Korea as well as Peru have shown increases in MDR-TB as well as a
slowing in the decline in the TB notification rates. In Peru, supporting data suggest weaknesses
in TB control. In Korea, the slowing in the decline of the notification rate has been attributed to
an expanding surveillance system that reaches the private sector. Meanwhile, case detection, and
success rates remain high, and the burden of TB is shifting to the older population, which is
inconsistent with the recent increase in MDR-TB among new TB cases. The two oblasts in the
Russian Federation are showing increases in the proportion of MDR-TB among new cases at a
very rapid rate, while the TB notification rate in these regions is falling slowly. Although the
global burden of MDR-TB can be estimated, it is not possible to estimate global trends in MDR-
TB, because of the few trends available from high burden countries.
The data reflect TB programmes at various stages of implementation; thus trends must be
interpreted in the context of additional relevant programme indicators. Programme improvement
can affect the prevalence of resistance in several ways. A better programme can result in the
reduction of the overall number of cases, particularly re-treated cases; however, difficult
(resistant) cases may persist. Thus, in some instances an increase in MDR proportion in a
population may reflect a stable number of MDR cases but a decrease in the overall re-treatment
population. Or it may be the result of successful treatment of susceptible cases, with insufficient
case management of MDR-TB cases. It is also possible that, as diagnostic systems improve,
coverage and reporting of culture and DST may result in increases in reported case numbers.
Improvement in laboratory proficiency, particularly the sensitivity and specificity of drug
susceptibility testing, may also affect the observed prevalence of resistance. The scenarios
outlined above highlight the importance of evaluating trends in prevalence of drug resistance
within the context of relevant programme developments.

83
XDR-TB
XDR-TB is more expensive and difficult to treat than MDR-TB and outcomes for patients are
much worse[16, 17], therefore understanding the magnitude and distribution of XDR-TB is
important.
Data included in this report are the first representative information available on XDR-TB,
however there are several limitations. The first is the insufficient quality assurance of drug
susceptibility testing for second-line drugs. A number of settings reported results that were
tested by a SRL, but this was not the case for the majority of settings. The second limitation is
that second-line drug susceptibility testing is not available in most countries. The cost of
shipping of isolates and the cost of second line testing is significant. Therefore, in most settings
only MDR-TB isolates were tested for resistance to second-line drugs. Even in countries where
second-line drug susceptibility testing is routinely conducted, usually only isolates with MDR-
TB or other extensive resistance patterns will receive DST to selected second-line drugs, which
limits our understanding of the emergence of second line resistance to all but the highest risk
cases, this may be particularly relevant for fluroquinolones which are widely used and an
important component of second-line anti-TB therapy.
Using MDR-TB cases tested for second-line drugs as a denominator is problematic in survey
settings where the number of MDR-TB cases detected in the nationwide survey sample may be
small and may not reflect the true proportion of XDR-TB among all MDR-TB cases.
Alternatively examining cases in MDR-TB treatment programmes may also be biased towards
chronic cases and may overestimate the proportion of XDR-TB among all MDR-TB cases.
The current recommendation in the context of surveys is to conduct second-line DST on the
sample MDR-TB cases detected in the survey, and to conduct separate programmatically
relevant surveys within MDR-TB treatment programmes or of risk groups such as treatment
failures.
Despite limitations in the quality assurance of laboratory testing, data from this report indicate
that XDR-TB is widespread with 45 countries having reported at least one case. The majority of
countries that reported were low TB burden countries, and reported very few cases, and therefore

84
do not give an indication of global magnitude. Japan, and the Republic of Korea in a previous
study, have shown a high proportion of XDR-TB among MDR, however these countries have a
small underlying population of MDR-TB cases. The sentinel system in Japan is hospital based
and previous data reported from Korea based on the national laboratory register representing
70% of cases in the country, may be biased towards the most ill patients and may be
overestimating the proportion of all MDR-TB cases that are XDR-TB. Data from a nationwide
survey in Korea, examining 110 MDR-TB patients showed a significantly lower prevalence of
XDR-TB among MDR-TB cases. Data on second line drug resistance are currently unavailable
from China, although there are plans to conduct second line DST on MDR-TB cases detected in
an ongoing nationwide survey. Second line DST from the nationwide survey in the Philippines
was not completed at the time of this publication; however, the resistance to fluoroquinolones in
the MDR-TB patients under treatment (50%) suggests further investigation is required. Although
the numbers are small, most of the data available from African countries reveal a low proportion
of XDR-TB among MDR-TB cases, although numbers are small. South Africa is the outlier in
the region. Although a moderate proportion of XDR-TB was reported, and there are known
biases related to the selection of cases for testing24, this constitutes a large burden of cases, the
majority being HIV infected. No countries from the Eastern Mediterranean region have yet
reported representative data on second-line drug resistance although studies are planned and
Morocco is having all MDR-TB isolates from the nationwide survey further tested. India has
conducted second-line DST in surveys in both Gujarat and Maharasthra, but data are not yet
available. Myanmar is surveying risk populations, but currently showing low proportions of
second-line drug resistance. Quinolones are widely available in this region and therefore
determining the extent of resistance to this class of drug is a priority as well as establishing cross
resistance between early and later generations of quinolones.
The high proportion of XDR-TB among MDR-TB, ranging from 4.0% to over 20% as well as
the large underlying burden of MDR-TB suggests a significant problem within the countries of
the former Soviet Union where drug resistance is widespread. Second-line drugs are locally
24 Data from a retrospective review of the National Health Laboratory Service of South Africa were presented at the IUATLD World Conference on Lung Health. 8-12 November 2007. Cape Town, South Africa.

85
available in most of the countries of the former Soviet Union and have been widely used for a
long period of time.
These data highlight the need to strengthen global capacity for both diagnosis and surveillance of
resistance to second-line drugs if the true magnitude and distribution of XDR-TB are to be
understood.
DRUG RESISTANCE AND HIV
There is a well documented association between TB and human immunodeficiency virus (HIV),
and although outbreaks of drug resistant forms of tuberculosis among HIV infected patients have
been widely documented in nosocomial and other congregate settings[18, 19], little information
is available about the association of HIV and drug resistant TB on a population level.[20-22] The
primary reason for the lack of information is that HIV and anti-TB drug susceptibility testing
have not been sufficiently accessible for joint surveys under routine conditions. The scale up of
HIV testing has opened up possibilities for joint surveys; however, in this report only seven
countries were able to provide drug susceptibility testing information disaggregated by HIV
status. In the majority of high TB burden settings either drug resistant TB or HIV, or both are
rare, and thus routine surveys may not capture a large enough number of either drug resistant TB
patients or HIV infected patients to examine an association with sufficient statistical power[3]. In
order to examine the association on a population level it may be necessary to sample both HIV
infected and uninfected TB patients separately.
There are two main reasons why drug resistant-TB may be associated with HIV and drug
resistant TB. Acquired rifamycin resistance has been associated with HIV infection among TB
patients under treatment and anti-TB drug malabsorption has been documented in patient cohorts
in settings of high HIV prevalence. In addition, HIV infected patients and drug resistant TB
patients may have similar risk factors such as history of hospitalization. It is also possible
although no data have shown that HIV infected patients may be more susceptible to infection
once exposed. The epidemiological impact of HIV on the epidemic of drug resistant TB is not
known, and may depend on several factors. HIV infected TB cases are more likely to be smear
negative, and delayed diagnosis of drug resistance as well as unavailability of treatment have led
to high death rates in people living with HIV. Both of these factors may suggest a lower rate of

86
transmission. However, HIV infected cases progress rapidly to disease, and in settings where
MDR-TB is prevalent, either in the general population, or in the local population such as a
hospital or a district, this may lead to rapid development of a pool of drug resistant TB patients,
or an outbreak.
The data reported from the majority of countries were not strong enough to examine an
association between HIV and drug resistance. However, the data available from Donetsk Oblast,
Ukraine, and Latvia indicated a significant association between HIV and MDR-TB. Additional
information on risk factors including history of hospitalization or imprisonment were not
available for this analysis, so the specific reasons for the association are not known. Both
countries have a high underlying prevalence of MDR-TB, as well as an emerging HIV epidemic,
that initially was concentrated among risk groups, but has now become more generalized.
Despite some of the weakness in these data and subsequent analysis, the association between
HIV and MDR-TB is concerning particularly given the implications for the clinical management
of these patients. As both countries have well developed diagnostic infrastructure continued
monitoring of the epidemic over time will be crucial in order to gain a better understanding of
how HIV may impact the epidemiology of drug resistance in the region.
Rapid progression to death in HIV-infected MDR-TB patients in both outbreaks and treatment
cohorts has been widely documented[18, 23]. Anti-retroviral treatment for HIV does appear to
benefit co-infected MDR-TB patients; however, co-management of treatment for both diseases is
very complicated. Currently, most TB control programmes in high burden countries do not have
the diagnostic infrastructure to either detect an outbreak nor the programmatic capacity to
manage an outbreak. Given the impact on mortality, outbreaks should be avoided at all cost. The
development of infection control measures in congregate settings as well as diagnostic screening
tools to rapidly identify drug resistant TB are a priority, for all countries, but particularly for
those with high prevalence of HIV or MDR-TB.
From a global perspective, routine diagnosis of both HIV and drug resistant TB should be scaled
up for patient benefit. Better surveillance data may help in developing an understanding of the
relationship between these epidemics; however, additional studies should be undertaken in
several settings in order to answer the questions surveys cannot.

87
Global Estimates
It is estimated that 489,139 (95% CLs, 455,093-614,215) cases emerged in 2006, and the global
proportion of resistance among all incident TB cases was 4.8% (95% CLs, 4.6-6.0). China and
India are estimated to carry 50% of the global burden, with the Russian Federation carrying a
further 7%. The difference between the estimated number of cases as well as proportions
published in 2004 and those published in this report can be accounted for, both by revisions in
underlying estimations of TB incidence as well as more recent survey and surveillance data. In
this report, as in previous publications, we have estimated the incidence and not the prevalence
of MDR-TB. An estimate of prevalence can be made by multiplying incidence by the average
duration of the disease. The duration of MDR-TB is not known, and likely variable depending on
diagnostics, treatment available, and HIV co infection; however, it is expected to be longer than
1.75 years, the current estimated duration for an episode of drug susceptible TB. Duration, in
general, is expected to be longer because most patients will receive some treatment, which may
not lead to cure, but rather contribute to prolongation of disease. A modelling exercise estimated
MDR-TB prevalence to be three times the annual MDR-TB incidence[[24]. If we assume that the
duration of the disease is between 2 and 3 years, the global prevalence of MDR-TB would range
from 1,000,000 to 1,500,000 cases.
SRLN
The SRLN currently comprises 26 laboratories in six regions that provide a wide range of
support to over 150 laboratories worldwide. The network has completed thirteen rounds of
proficiency testing since 1994; and cumulative results indicate an overall high performance of
the network. It is important to note that while overall performance of the network is good,
annually one to two laboratories within the network will show sub optimal performance. This
indicates the difficulty of executing high quality drug susceptibility testing year after year, and
also highlights the important of internal quality assurance.
Results are determined judicially, therefore it is important to note that through the course of
thirteen rounds of proficiency testing, "borderline" strains have been encountered, where up to
half the network has found these strains to be susceptible and the other half of the network have
found them to be resistant. Since round 9, care has been taken to exclude such strains from

88
panels by thorough pre-testing however, this has not always been possible. Therefore, strains
with less than 80% concordance within the network have been excluded from overall
performance measures in order not to distort judicial results. Over a five years period 40/600
strains, or approximately 7% of strains included in annual panels have been excluded. Although
it is acknowledged by the network that these strains are present in routine care of TB patients, it
was decided to examine them outside of annual proficiency testing in order to determine the
reasons for the results, but also to ensure reliable evaluation of national and other reference
laboratories that subsequently receive these panels. The study on borderline strains s been useful
to confirm that the most important factor explaining the variation of the results of panel testing is
the strain selection. Results of the borderline study are not yet published Currently there is no
established gold standard to replace the judicial system. One possible solution would be a
definition of "intermediary" resistant results; however, this would require testing at two
concentrations. Many high income countries will test drugs, at least isoniazid, at two
concentrations. However, this is not the case in most low income countries.
While DST for first-line anti-TB drugs has been thoroughly studied and consensus reached on
appropriate methodologies, surveys on current practices for second-line DST in the SRLN as
well as some multi-centre studies have indicated a range of methods, critical concentrations of
drugs, and critical proportions of resistance used in the drug susceptibility testing. To date no
study has systematically evaluated all available methods for testing, established critical
concentrations for all available second line drugs, nor evaluated a large number of clinical
isolates for microbiological and clinical end-points. Despite the absence of this critical
information, there was a clear and urgent need to provide guidance to countries engaging in
MDR-TB treatment programmes, and to develop mechanisms for external quality assurance of
DST for second-line drugs.
In July 2007 guidance was developed[13] for the selection of and testing for second line drugs.
Based on all available evidence or expert consensus where no evidence was available, a
hierarchy was developed recommending drug susceptibility testing based on both clinical
relevance as well as reliability of the test available. Rifampicin and isoniazid are prioritized,
followed by ethambutol, streptomycin and pyrazinamide, and then the second-line injectables
(amikacin, kanamycin, and capreomycin) and fluroquinolones. The policy guidance is available

89
and full technical guidelines for the drug susceptibility testing of second line drugs will be
available in March 2008. At the same time, the SRLN began to include isolates with second-line
drug resistance into the fourteenth round of proficiency testing for the SRLN and selected NRLs.
Results of this first exercise will be available in mid-2008.
It is widely acknowledged that newer, rapid phenotypic and genotypic DST methods hold
considerable promise for the rapid diagnosis of MDR-TB as well as opportunities for scaling up
surveillance of resistance, discussed previously. While several of these tests are in a validation
stage, many countries are already using some these methods to identify MDR-TB patients.
Currently, tests for rapid identification of second-line drug resistance are not yet available.
The SRLN continues to play a critical role in capacity strengthening of laboratories worldwide
and provides the backbone for surveillance activities. The Network is still largely supported by
host governments; however, an increasing number of countries are obtaining funding for services
provided by the SRLN through Global Fund grants. Inadequate laboratory capacity now presents
one of the greatest obstacles to achieving the targets set out in the Stop TB Global Plan. The
Subgroup on Laboratory Capacity Strengthening has become a more substantive movement, and
renamed the Global Laboratory Initiative with a secretariat based at WHO and engaging funding
agencies and all technical partners. Since 2007, the SRLN has been fully integrated into this
initiative. The main priority for the SRLN is expansion within regions in order to fulfill the
demand for reference laboratories and obtaining sustainable financing to continue to deliver
services to countries requiring assistance. All WHO regions are committed to expansion and
most have identified laboratories to be evaluated for integration into the SRLN.

90
WHO REGIONS
AFRICAN REGION
In the African region six countries have reported data since 2002, Côte d'Ivoire, Ethiopia,
Madagascar, Rwanda, Senegal, and UR Tanzania. Data from UR Tanzania and Madagascar are
considered preliminary. Rwanda was the outlier, reporting 3.9% (95% CLs, 2.5-5.8) MDR
among new cases. Senegal reported 2.1% (95% CLs, 0.7-4.9) among new cases, but all other
countries reported less than 2.0% MDR-TB. Since 1994, 22 of 46 African countries have
reported drug resistance data from areas representing 72% of all TB cases in the region. The
population weighted mean of MDR-TB based on countries reporting in the region is 1.5% (95%
CLs, 1.0-2.0) among new cases, 5.8% among previously treated cases (95% CLs, 3.9-7.7), and
2.2% (95% CLs, 1.4-3.1) among combined cases. The variation in resistance among countries
within the region is relatively narrow; however, roughly half of the data points used to look at the
distribution are at least five years old. It is possible that current survey methodology, which is
based on smear positive cases, may under represent HIV co infected TB cases who are more
likely to be smear negative. In addition, transmission dynamics of drug resistant TB in a heavily
HIV infected population are not well understood. These and other factors, described in detail in
the HIV and MDR section of this report, make estimation of the true burden of MDR-TB
difficult in high HIV prevalence settings. With the exception of Botswana, Mozambique, and
South Africa, HIV testing has not been a component of drug resistance surveys. However, as
routine HIV testing rapidly scales up in the region, from 11% of TB cases tested in 2005 to 22%
in 2006, HIV information will become a more routine component of anti-TB drug resistance
surveys. Based on available information it is estimated that there were 66,711 (95% CLs,
55,606-137,263) incident MDR-TB cases in the region in 2006, with almost 90% of these cases
emerging in high HIV prevalent settings.
The African region has the fewest settings for which trends can be identified. Only Botswana,
Sierra Leone, Côte d'Ivoire, and Mpumalanga Province, South Africa, have carried out repeat
surveys. In the surveys reported previously Botswana showed a significant increase in drug
resistance among new cases, and an increase, though not significant, in the proportion of MDR-
TB cases. A fourth survey is under way in Botswana, which will be very important to understand
the trends in drug resistance in this country, and other countries where HIV is prevalent. Côte

91
d'Ivoire showed a decrease in the proportion of MDR-TB cases between surveys but an increase
in resistance to streptomycin and ethambutol, and an increase in isoniazid monoresistance.
Survey methods remained the same between the surveys, and most of the MDR-TB cases
captured in the first survey had an identical resistance pattern suggesting that a cluster of cases
may be have been included. Further surveys are required to interpret trends in Côte d'Ivoire.
The low median proportions of drug resistance and limited trend data may underestimate the
importance of drug resistant TB in high HIV prevalence settings. A large outbreak of XDR-TB,
in an HIV infected population in the province of KwaZulu-Natal, South Africa was associated
with extremely high mortality[25] and highlighted the vulnerability of TB patients co-infected
with HIV. Detection of this outbreak was only possible because of the extensive laboratory
infrastructure available in the country. It is likely that similar outbreaks of drug resistance with
associated high mortality are taking place in other countries, but currently going undetected due
to insufficient laboratory capacity.
Botswana, Mauritania and Mozambique, have nationwide surveys under way and Angola,
Burundi, Lesotho, Malawi, Namibia, South Africa, Uganda, and Zambia have plans to initiate
nationwide surveys over the next year. Nigeria and DR Congo, plan to begin a survey covering
selected districts in their respective countries in 2008. All protocols stipulate second-line drug
susceptibility testing for MDR-TB isolates, and the majority of surveys are being financed
through Global Fund grants. Currently, Botswana and Swaziland are undertaking surveys of
high risk populations to examine the extent of first and second-line drug resistance; results
should be available in early 2008. DR Congo, Burundi and Rwanda[26-28], with the assistance
of a SRL, are routinely examining second line resistance among treatment failure cases and thus
far have detected limited second line resistance; however, samples are relatively small.
Mozambique, Malawi, Zambia, and Zimbabwe all have plans to conduct similar studies. South
Africa has recently conducted a review of their laboratory database and found that 996 or 5.6%
of 17 615 MDR isolates collected over a four year period were XDR-TB. Proportions varied
across provinces with KwaZulu-Natal reporting 656 or 14% of 4701 MDR cases as XDR-TB.
Selection and testing practices varied across the country and over time; however all isolates

92
correspond to individual cases25. UR Tanzania, with the support of a SRL, is evaluating the use
of rapid rifampicin testing for the purposes of surveillance. Data from this project will be
available in early 2008, and if shown to be comparable with phenotypic testing may be a useful
tool in the expansion of survey coverage in the region as well as trend analysis.
The most critical factor in addressing drug resistance in African countries is the lack of
laboratory infrastructure and transport networks that can provide rapid diagnosis. The Global
Plan to Stop TB 2006-2015 stipulates expansion of culture and DST to all retreatment cases and
to 90% of new cases that are at high risk of MDR-TB (i.e. contacts and treatment failures at 3
months). Most countries in the region are far from reaching this target. In 2006 it was reported
9% of retreatment cases received DST in the African region. Most countries have, at most, one
laboratory able to conduct culture and drug susceptibility testing in the public sector, let alone
DST for second line drugs. There are two SRLs in the region, one in Algeria and one in South
Africa; however the National Health Laboratory service of South Africa as well as laboratories
outside the region are playing an important role in providing quality assurance, as well as DST
for second line drugs. There are plans to upgrade national lab networks in most countries and the
identification and upgrade of at least three SRLs are planned for the region over the coming two
years. Reviews of existing laboratories have already begun. Pilot projects led by the Foundation
for Innovative New Diagnostics (FIND) and other partners are paving the way for the integration
of new and more rapid diagnostics in the region, and funding from the U.S. President's Plan for
Emergency AIDS relief (PEPFAR) and the Global Fund are filling critical gaps. However, if
labs are to scale up rapidly coordination of funding and technical agencies will be critical, as
well as concerted efforts to address the widespread constraints in human resource capacity in the
region.
Currently, Burkina Faso, DR Congo, Guinea, Kenya, Lesotho, Malawi, Rwanda and Uganda
have approved GLC projects. Mozambique has submitted an application which is under review.
Benin, Ethiopia, Mali, Namibia, UR Tanzania and Zambia have Global Fund approved grants for
the management of MDR-TB and have plans to apply to the GLC in 2008.
25 Data from a retrospective review of the National Health Laboratory Service of South Africa were presented at the IUATLD World Conference on Lung Health. 8-12 November 2007. Cape Town, South Africa.

93
REGION OF THE AMERICAS
In the Americas region eleven countries have reported data since 2002, including never
previously reported data from Costa Rica, Honduras, Guatemala (final data), and Paraguay.
Since 1994 twenty one countries have reported drug resistance data from areas representing 93%
of all TB cases in the region, but covering 48% of the countries. The population weighted mean
of MDR-TB based on all countries that have reported in the Americas is 2.2% (95% CLs, 0.6-
3.8) among new cases, 13.2% (95% CLs, 3.5-22.8) among previously treated cases, and 4.0%
(95% CLs, 1.7-6.3) among combined cases.
To a great extent, as found in previous reports, the prevalence of MDR is low in the region as a
whole; however, there are important outliers. In this report Guatemala reported 3.0% (95% CLs,
1.8-4.6), and Peru showed 5.3% (95% CLs, 4.2-6.4) among new TB cases. In the last report,
though in the same reporting period (2002), Ecuador showed 4.9% (95% CLs, 3.5-6.7) MDR-TB
among new cases.
In North America, Canada has shown low proportions of resistance and relatively steady trends
in resistance among both new and previously treated cases. TB case notification has decreased
since 1997 and in 2005, 23 MDR-TB cases were identified. The USA has shown decreases in
overall TB notifications as well as overall numbers of MDR-TB cases since 1995. The US
reported significant decreases in MDR among all TB cases. A total of 124 MDR-TB cases were
recorded in 2005.
Argentina showed a slight, but not statistically significant, increase in MDR-TB among new
cases from 1.8% (95% CLs, 0.9-3.0) in 1999 to 2.2 (95% CLs, 1.2-3.6) in 2005, and the TB
notification rate has steadily decreased over the past decade. Uruguay showed a decrease in
resistance to any drug, but this was not significant. The prevalence of any resistance remains low
in this country at 2.1% (95% CLs, 0.8-4.3) among new TB cases. Cuba continues to show low
prevalence of resistance in the population with MDR never reaching much above 2.0% among
all TB patients. Cuba was one of the few countries able to report on DST results disaggregated
both by HIV status, sub category of retreatment, and prison status[29]. Peru reported increases in
any resistance, isoniazid resistance and MDR-TB among new cases, though only the increase in

94
any resistance and isoniazid resistance were significant. MDR increased from 2.4% (95% CLs,
1.7-3.4) in 1996, to 5.3% (95% CLs, 4.2-6.4) in 2006. Peru showed a yearly reduction in the TB
notification rate between 1994 and 2002 of approximately 4 to 6%; however, since 2003 the
notification rate has slightly increased between 123 and 124 per 100 000. The recent rise in the
notification rate and the increase in drug resistance may likely be due weakness in management
of TB cases (both new and MDR-TB) in previous years as well as weakness in the entire health
system, particularly in the years 2003 and 2004. The GLC approved project has operated
primarily in Lima until expanded nationally as recently as 2006.
Currently a nationwide drug resistance survey, by state, is under way in Brazil and includes HIV
testing. A repeat survey in the Dominican Republic is also ongoing and will help better establish
the prevalence of MDR-TB, which was shown to be 6.6% among new TB cases in the first
survey over a decade ago. Mexico has started a nationwide survey in which HIV testing will be
incorporated. Panama also has plans for a nationwide survey. All surveys have plans to test
MDR-TB isolates for second line drug resistance at a SRL.
Currently there are five SRLs in the Americas region with plans to expand the network to one or
two additional labs over the next two years. This network provides annual proficiency testing
panels to almost all NRLs in the region. In addition to plans in many countries to upgrade
laboratory networks, there is increased demand for development of second line testing capacity.
It is estimated that there were 12,070 (95% CLs, 10,523-15, 526) incident MDR-TB cases in
Latin America in 2006. Peru is estimated to have 3,972 (95% CLs, 2,842-5,1892) incident cases,
while Ecuador and Brazil are estimated to have 1,483 (95% CLs, 1,034-1,998) and 1,464 (95%
CLs, 945-2,077) respectively. The Americas regions has the largest number of GLC approved
projects with programmes in Belize, Bolivia, Costa Rica, Dominican Republic, Ecuador,
Guatemala, Honduras, Haiti, Mexico, Nicaragua, Peru (nationwide), Paraguay, El Salvador,
Uruguay. Though not GLC approved, MDR-TB management is fully integrated in Brazil and the
laboratory network able to conduct culture and drug susceptibility testing is extensive. Treatment
success of MDR-TB patients reported from Brazil was 60% for the 2003 cohort.

95
EASTERN MEDITERRANEAN REGION
The Eastern Mediterranean region has made strong progress in survey coverage since 2002,
reporting data from six countries, including never previously reported data from Lebanon,
Jordan, nationwide survey data from Morocco, and Yemen. Since 1994 eight countries have
reported drug resistance data from areas representing 22% of all TB cases in the region, but
covering 36% of the countries in the region. The population weighted mean of MDR-TB based
on all countries that have reported in the Eastern Mediterranean region is 2.0% (95% CLs, 0.0-
4.3) among new cases, 35.3% (95% CLs, 16.4-54.3) among previously treated cases, and 5.4%
(95% CLs, 0.5-10.4) among combined cases. Based on available information it is estimated that
there were 25,475 (95% CLs, 15,737-73,132) incident MDR-TB cases in the region in 2006,
with almost 60% of these cases estimated to be in Pakistan.
Lebanon, Morocco, and Oman reported low proportions of MDR among new cases from 0.5%
(95% CLs, 0.2-1.1) in Morocco to 1.3% (95% CLs, 0.2-4.7) in Oman. Yemen reported a higher
proportion of resistance, 2.9% (95% CLs, 1.6-4.9) and Jordan reported 5.4% (95% CLs, 2.0-
11.4) MDR among new cases. Jordan, Lebanon, and Oman reported very high proportions of
resistance among retreated cases, though sample sizes were small and the confidence intervals
were wide. The high proportions of resistance found in Jordan are similar to what was reported
from the Islamic Republic of Iran in 1998. Jordan reports high success rates and low proportions
of retreatment cases suggesting that further evaluation should be done in order to confirm the
high proportion of MDR-TB found among new cases.
Trends are available only for the Gulf States of Oman and Qatar, both with small numbers of
total cases and low to moderate levels of resistance, much of which is imported. Trends are
difficult to interpret because of the small numbers of cases, though drug resistance does not
appear to be a problem in either of these countries. The extent of second line drug resistance is
not known in the region. The only available data have been reported from Iran, which showed
the existence of XDR-TB, but denominators were not available. Morocco plans to have MDR-
TB isolates collected from its nationwide survey tested for second line drug resistance.
The primary limiting factor to expanding survey coverage in the region is the high number of
countries currently addressing conflict situations. In many of these countries basic health

96
services must be prioritized over expansion of surveillance. The second limiting factor is the
poor laboratory infrastructure in many countries. Currently there is only one SRL in the region,
but one candidate SRL has been nominated and is undergoing evaluation, an there are plans for
identification of another candidate in the region in the next year.
Pakistan has widely expanded external quality assurance of microscopy laboratories and is in the
process of identifying a national reference laboratory which is a pre-requisite for nationwide
survey as well desirable for the successful implementation of a MDR-TB treatment programme
under the NTP. The Islamic Republic of Iran has been planning a second nationwide survey for
several years; however, to date the survey has not taken place. The Libyan Arab Jamahiriya,
Saudi Arabia, and Somalia will start preparation for drug resistance surveys in 2008. Sudan has
recently begun a survey.
Currently, Egypt, Jordan, Lebanon, the Syrian Arab Republic, and Tunisia, have approved GLC
projects. However; Djibouti, Egypt, Iraq, Morocco, and Sudan have Global Fund approved
grants for MDR-TB management which will result in GLC applications shortly.
EUROPEAN REGION
In the European region thirty-eight countries have reported data since 2002, including never
previously reported data from Armenia, Baku, Azerbaijan, Donetsk Oblast within Ukraine,
Georgia, the Republic of Moldova, Tashkent, Uzbekistan and three Oblasts in the Russian
Federation. Since 1994, 40 countries have reported drug resistance data from areas representing
35% of all TB cases in the region (31% of the cases in Eastern European countries, and 55% of
the cases in Central and Western European countries). The population weighted mean of MDR-
TB based on all countries that have reported in Central and Western Europe is .9% (95% CLs,
0.5-1.2) among new cases, 7.7% (95% CLs, 5.7-9.8) among previously treated cases, and 1.5%
(95% CLs, 1.1-2.0) among combined cases. The proportion of MDR-TB was significantly higher
in the Eastern European and Central Asian countries with the following population weighted
means; 10.0% MDR-TB (95% CLs, 3.8-16.1) among new cases, 37.7% (95% CLs, 12.3-63.0)
among previously treated cases, and 22.6% (95% CLs, 8.6-36.6) among combined cases.

97
Based on the important differences in epidemiology, Western and Central Europe are discussed
separately from Eastern Europe and Central Asia. Most Western and Central European countries
are reporting routine surveillance data. Both proportions and absolute numbers of drug resistant
cases remain low in most of Western and Central Europe. Germany reports the highest number
of MDR cases, recording approximately 100 cases per year. Most of the drug resistant cases
recorded are imported cases. Israel is an outlier, presenting the highest levels of resistance to all
drugs. However, the situation of this country is unique, because of the high levels of immigration
from areas of the former Soviet Union. Between 80% and 85% of TB patients in Israel are
foreign-born, mainly from Ethiopia and countries of the former Soviet Union. Therefore, most
MDR-TB cases in the country were likely to have been infected abroad before immigrating to
Israel26. A 1994 survey in Romania showed 2.4% MDR-TB among new cases, and 5.4% among
all TB cases. Given the burden of TB the country the absolute number of incident cases
estimated in 2006 was 1,546 (95% CLs, 1,047-2,138). Turkey has never carried out a nationwide
survey, although there are plans to do so. The number of cases estimated to have emerged in
2006 is 889 (95% CLs, 284-3,320). Importantly, almost all countries in Western and Central
Europe are now linked to a SRL and are participating in annual external quality assurance for
drug susceptibility testing.
Eastern Europe
Since the beginning of this project countries of Eastern Europe and Central Asia have reported
the highest proportions of resistance to anti-TB drugs. It has been speculated that one of the most
important factors in the resurgence of tuberculosis in the region and the emergence of the drug
resistance epidemic was the disintegration of the Union of Soviet Socialist Republics in 1991 and
the economic crisis that followed. This crisis resulted in interruptions in drug supply and overall
deterioration of the health sector which also had an impact on transmission of infection and
susceptibility to disease. The lack of standardized treatment regimens in many countries also
likely contributed to the development of drug resistance and there is extensive documentation of
spread of drug resistance throughout the prison sector. In this report, data reported from the
Georgia showed the lowest proportion of resistance in region at 6.8% (95% CLs, 5.1-8.8) among
26 Chemtob D. Multi and extensive drug-resistant tuberculosis burden in Israel, a country with immigration from high endemic areas. 4th Congress of the IUATLD, European Region, Riga, Latvia, June 2007, pp. 19.

98
new cases and has continued to use the systems developed for the survey to improve its routine
surveillance system.. Baku, Azerbaijan, as well as data from the Republic of Moldova showed
proportions of MDR-TB 20.0% and higher among new cases. Data from several of the countries
surveyed showed that between 4.0%,(Armenia) and 23.7% (Estonia) of MDR-TB cases were
XDR-TB. Donetsk Oblast, Ukraine conducted a joint drug resistance and HIV survey among TB
patients which showed a significant association between drug resistance and HIV. Currently it is
estimated that 80,057 (95% CLs, 71,893-97,623) MDR-TB cases emerged in Eastern Europe and
Central Asia in 2006.
Though most countries in the region conduct routine culture and drug susceptibility testing on
all, or at least the majority of TB cases notified, practices do not follow the criteria required for
inclusion in this report. These countries are not participating in annual quality assurance of
laboratory results, patients may not be classified according to treatment history, and culture and
DST coverage may not be sufficiently high. Nevertheless, the notification of MDR-TB cases
collected through annual reporting to WHO correlate well with survey data collected from the
region which indicates that relying on routine data collection for surveillance of drug resistance
will be possible in the future. In the meantime surveys are important to estimate the burden of
MDR-TB in these countries.
At this point in time robust trend information is only available from the Baltic countries and two
Oblasts in the Russian Federation. Trends in MDR-TB among new cases in the Baltic countries
appear to be relatively stable between 9.8% in Lithuania and 13.2% in Estonia with a slow
decrease indicated in Estonia and slow but significant increase in MDR-TB in Lithuania. The TB
notification rate is falling by between 5.0% (Lithuania) to 8.0% (Estonia) per year. Treatment
success of new smear positive case over the same period has been relatively stable around 70 to
74%, but falling slightly in Lithuania from 74 to 70% over the last four years. DOTS was
initiated in 1996, 1998, and 2000 in Latvia, Lithuania, and Estonia respectively, and "DOTS-
Plus" or treatment of drug resistant TB according to internationally accepted standards was
initiated in 1998, 2002, and 2005 in Latvia, Estonia and Lithuania. Success rates for patients
with MDR-TB in 2003 were highest in Latvia at 69%, but quite low in Lithuania at around 36%.

99
The TB scenario in the Baltics, especially in Latvia and Estonia, likely reflects improved TB
control over the past ten years including better management of MDR-TB with more rapid
diagnosis and infection control (particularly in hospitals). Economic growth and investment in
health has also very likely contributed to the decline in TB over this period. Absolute numbers of
chronic cases and defaulters have steadily declined in the years 2003 through 2006[30, 31].
All three countries struggle with social issues among TB patients, such as alcohol and drug abuse
as well as homelessness. This has been identified as a limiting factor in reduction of default and
failure rates. Social support must continue to be a key aspect in reduction of poor treatment
outcomes. Reduction in the proportion of MDR, if sustained in the Baltic countries, particularly
Latvia and Estonia may provide an important model for other countries in the region that
struggle with MDR-TB epidemics.
The scenario in the Russian Federation differs from the picture indicated in the Baltic countries.
TB notification rates for the whole of the Russian Federation have been relatively stable from
1997, (81/100 000) through 2006 (87/100 000), data from selected Oblasts where TB control has
been well implemented are showing declines in TB. In Orel Oblast the TB notification rate has
declined by over 3% per year for the last six years. Tomsk Oblast, showed a steady decline in TB
notification rate by 1.3% over the same period.
Trend data are currently available from two Oblasts in the Russian Federation (Tomsk, and
Orel). The data from these regions are considered reliable because culture and drug susceptibility
testing has been provided to 85-100% of the new TB cases over this time period, new and
previously treated cases are reliably differentiated, and there is evidence of good laboratory
performance over the period of data collection.
In addition, an exercise was undertaken to examine quarterly data from ten oblasts with the view
to use routine data as a basis for surveillance of drug resistance. Based on a validation exercise
to determine the population coverage of culture and DST as well as other quality indicators and
combined with external quality assurance results form the laboratory, data on new cases in the
civilian sector from Mary El Oblast were also included in this report. Data are representative
only for the populations covered and cannot be extrapolated to the whole of the country. The

100
exercise showed that the national reporting system and lab registers correlate very well for new
cases, therefore, as quality assured diagnostic coverage of the population expands; routine data
from additional regions in Russian Federation could be included in future reports27.
While overall notifications of TB in Orel and Tomsk Oblasts are declining, the trends in drug
resistance are showing important increases in the proportion ranging from an average 13.0% per
year increase in Tomsk to 32.0% increase per year in Orel. Absolute numbers of new TB cases
with MDR are also increasing. Both regions have strong and improving TB control programs, as
well as GLC approved MDR-TB management programmes. It is possible that while susceptible
cases are being successfully treated, a sufficient reduction in MDR-TB cases has not been
achieved leaving drug resistant cases as an increasing reservoir of TB transmission. Data
reported do not allow disaggregation of cases by place of origin or previous history of
hospitalization or imprisonment both of which may have an impact on trends in resistance in
these oblasts. Supporting the trend data reported from these oblasts, is a report jointly published
in 2006 by the Russian Ministry of Health and WHO28 which indicated an increase in MDR-TB
both in proportion and absolute numbers of cases and highlighted the variation in proportions of
resistance across oblasts indicating that up to 20% of new TB cases in Samara Oblast[32-34]
may have MDR-TB. According to this report approximately 40% of TB patients in the Russian
Federation were categorized as chronic cases in the national register. Although some of the
increase in numbers of MDR-TB cases in the national system may be due to better laboratory
detection, it is likely that this does not explain the size of the increase. The enormous pool of
chronic cases constitutes an important reservoir of transmission of MDR.
Over the past several years the Russian Federation has made important progress in addressing
TB including the implementation of World Bank and Global Fund projects. The revised TB
control strategy is being implemented in 85 of 88 regions and new TB treatment standards and
forms have been introduced. Currently 14 of 89 regions have approved GLC applications (and
27 According to official statistics, the prevalence of MDR-TB among new cases in the Russian Federation is 9.4%. These data do not currently conform to global project methodology and therefore have not been included in this report. 28 Tuberculosis in the Russian Federation, 2006. An analytical review of the main tuberculosis statistical indicators used in the Russian Federation, (Ministry of Health and Social Development of RF/FPHI/RIPP/CTRI/FSIN/WHO), Moscow, 2007. P.126

101
many more are in the pipeline). The country forecasts 3,200 MDR-TB will be enrolled on MDR-
TB treatment by 2008, as well as the designation of five Federal centres of excellence for the
treatment of MDR-TB in the civilian sector, and 8 in the penal system. The strengthening and
upgrading of laboratory services have been prioritized and 120 laboratories have been enrolled in
external quality assurance programmes. Despite the current momentum, the epidemiological
picture available from the Russian Federation suggests extraordinary measures to accelerate and
strengthen the implementation of the Stop TB strategy will be necessary if MDR-TB is to be
reduced in the population.
Commitment to TB control varies across the region, but in general progress has been made. A
regional laboratory task force has been developed to improve laboratory networks through newly
developed accreditation procedures, development of guidance on laboratory bio safety and
infection control, identification of additional SRLs specifically to serve this region, as well as
expansion of quality assurance practices and integration of new tools. Currently, all countries in
this sub region are linked to a SRL with the exception of Turkmenistan, and Bulgaria. Despite
progress, further efforts are needed to accelerate the roll out of GLC approved programmes to
treat the large burden of MDR-TB cases, as well as better supply and management of good
quality second-line anti-TB drugs, improved infection control, and continued improvement in
rapid detection of resistant cases.
Belarus, Bulgaria, Tajikistan, Turkmenistan are priority countries for drug resistance surveys,
Kazakhstan is repeating a nationwide survey, Kyrgyzstan is starting with a survey of Bishkek,
and Uzbekistan is planning an nationwide survey following the survey in Tashkent. .MDR-TB
treatment through the GLC mechanism is expanding with thirteen countries (including 14
regions in Russia) currently approved by the GLC. Partners are willing and coordinated to
improve community involvement and links to prisons, but additional investment will be needed
to scale up and meet the targets outlines in the Global Plan.
SOUTH-EAST ASIAN REGION
In the South East Asian region six countries reported data since 2002; India, Indonesia,
Myanmar, Nepal, Sri Lanka, and Thailand. India reported data from three districts and one state
and Indonesia reported data from one district. Of the countries reporting, Mayhurbhanj district in
102
Orissa State[35], India, Sri Lanka, and Thailand reported less than 2.0% MDR-TB among new
cases. Ernakulam district in Kerala State[36], Hoogli district in West Bengal State[35], and
Gujarat State, India as well as Mimika district, of Papua province in Indonesia and Nepal
reported between 2.0-3.0% MDR-TB among new cases. Myanmar was the outlier, reporting
3.9% (95% CLs, 2.6-5.7) MDR among new cases. Since 1994 six of eleven countries have
reported drug resistance data from areas representing 23% of all TB cases in the region, but
covering 55% of the countries in the region. The population weighted mean of MDR-TB based
on all countries that have reported in the South East Asian region is 2.8% (95% CLs, 1.9-3.6)
among new cases, 18.8% (95% CLs, 13.3-24.3) among previously treated cases, and 6.3% (95%
CLs, 4.2-8.4) among combined cases. Based on available information it is estimated that there
were 149,615 (95% CLs, 114,780-217,921) incident MDR-TB cases in the region in 2006, with
74% of these cases estimated to be in India.
Based on results from a nationwide survey in Myanmar[37] showing 3.9% (95% CLs, 2.6-5.7)
MDR-TB among new cases and 15.5% (95% CLs, 9.5-23.4) among retreatment cases it is
estimated that there were 4,251 (95% CLs, 2,648-6,187) incident MDR-TB cases in Myanmar in
2006. Myanmar has made good progress in TB control with case detection is reaching 61% and
treatment success reaching 86% and the proportion of retreatment cases comprises
approximately 5% of the notified cases. Despite resource constraints Myanmar is moving
quickly towards implementing management of MDR-TB under the NTP. Currently, there are
only two laboratories in the public sector providing culture and only one of these conducts DST;
however, plans are under way to extend DST capacity to the second laboratory. A second drug
resistance survey is ongoing as well as a survey of category II failure cases and chronics in order
to determine the extent of second line drug resistance in this population and to inform the
development of a treatment regimen. A GLC application has been approved.
The results from the recent survey in Gujarat State in India show low to moderate levels of
MDR-TB among new TB cases 2.4% (95% CLs, 1.7-3.2), and 17.2% (95% CLs, 14.8-19.9)
among retreatment cases. However, India reports that retreatment cases comprise 13.7% of
notified cases in the country, suggesting a considerable burden of MDR-TB in this population. It
is widely thought, though little documented, that a large number of registered retreatment cases
are reporting from the private sector. In general, the TB control programme is performing well.

103
The Revised National TB Control Programme has achieved population coverage of DOTS in all
districts in the country in 2006; case detection is about 61% and treatment success at 86%.
However plans for scaling up 24 inter-regional laboratories capable of culture and DST, attached
to 24 MDR-TB management sites capable of managing some 5000 cases per year are behind
schedule. Currently most MDR-TB is managed in an unregulated private sector with access to
second line drugs that are manufactured locally and of variable quality. XDR-TB has been
reported in the country[38] and results of second line testing from the state wide survey in
Gujarat and a survey nearly completed in Maharashtra will provide further evidence as to the
extent of second line resistance in the country.
A GLC application has been approved for two sites in the states of Andhra Pradesh, and
Haryana. Laboratory capacity is seen as the biggest bottleneck in the country's ability to respond
to MDR TB. There is consensus that the private sector, including private laboratories and
medical colleges, must be more involved, but accreditation under the public system as well as
formal linkages may take time. The concern is that unless MDR-TB management develops
rapidly in the public sector an increasing number of MDR-TB cases will be managed by the
unregulated private sector.
The data available from Mimika district of Papua province in Indonesia[39] show moderate
levels of resistance; however the sample for this survey was small and represented a very small
proportion of the population. Soon to be available data from a drug resistance survey in central
Java should provide a better estimate of drug resistance in Indonesia. A survey of treatment
failure cases is also under way to determine the extent of second line resistance in this
population. Case detection is just under the target of 70% and cure rates in the country are very
high. Indonesia, like Myanmar and India is struggling with the upgrade, expansion and quality
assurance of its laboratory network. A GLC application has been approved, but patients have not
yet been enrolled.
The new survey data available from Sri Lanka are showing exceptionally low proportions of
resistance. While these data have not yet been fully quality assured, other programmatic
indicators support this estimate. All treatment failures cases receive culture and DST and
identified MDR-TB cases are managed by the public sector. Sri Lanka is the only country in the

104
region routinely reporting MDR-TB cases. The success rate among MDR-TB cases is not
known, but the country has plans to submit an application to the GLC.
Nepal and Thailand are the only two countries reporting trend data in this report. The proportion
of MDR-TB among new cases in Nepal has fluctuated from a little over 1.0% to 3.0% in the four
surveys that have been conducted since 1996 making trends difficult to interpret. The current
estimate is 2.9% (95% CLs, 1.8-4.3) among new cases and 11.7% (95% CLs, 7.2-17.7) among
retreatment cases. Nepal has had a well functioning TB control programme for over a decade
and both case detection and treatment success remain high. Nepal has proven to be the leader in
MDR-TB control in the region establishing the first MDR-TB control programme in the public
sector and expanding it's coverage to 100% of the country by the end of 2006. Currently there is
one MDR-TB treatment centre and at least three to four sub-centres in all the five regions of the
country. Cure rates among registered MDR-TB cases for whom treatment outcomes are
available are 75%. Like other countries in the region the ability to expand MDR-TB services has
been limited by laboratory capacity however there are plans in place to expand the culture
network.
Thailand has also reported data from three surveys showing stable trends in resistance with
MDR-TB just under 2.0% among new TB cases. Data from a separate surveillance network with
roughly the same population coverage are showing similar proportions of resistance in the
population, however data from border regions with Myanmar are showing higher proportions of
resistance29. Unlike the other countries in the region Thailand has an extensive and well
developed laboratory network. Due the decentralized nature of laboratory services and an
abundance of private sector laboratories maintaining a high level of performance is one of the
major challenges of the NTP. The Thai NRL currently serves as a SRL for the region and is one
of a few labs in the region able to perform second line DST. Currently MDR-TB patients are
managed in the public sector, but practices do not conform to international guidelines.
29 Personal communication with Somsak and Dhanida Reinthong of the National Reference Laboratory, Bangkok, Thailand.

105
Although survey data are not included in this report Bangladesh, the Damien Foundation has
been monitoring drug resistance in a rural population of the country for the past ten years and
levels of drug resistance appear to be low[40] A NRL has recently been recognized and upgraded
and there are plans to conduct a nationwide survey in the coming year. A GLC application has
been approved. DPR Korea has developed plans to improve capacity of the NRL in order to
conduct culture and drug susceptibility testing. The primary obstacle to achieve this goal is the
lack of sustainable funding for the development and operation of the laboratory. DPR Korea
reports that retreatment cases comprise 18% of notified cases in the country, suggesting a
considerable burden of MDR-TB in this population indicating that drug resistance may be higher
than other countries in the region. 3,472 (95% CLs, 1,136-11,248) MDR-TB cases, were
estimated to have emerged in 2006 in DPR Korea or 6.8% of all cases (95% CLs, 2.3-21.7).
Additional assistance will be required to upgrade the NRL and to measure the burden of
resistance in this country.
The South East Asia region is home to four high burden countries. Though resistance in the
region is moderate the overall burden of MDR-TB is considerable. Important progress has been
made throughout the region in initiating plans for MDR-TB treatment and almost all countries in
the region have GLC applications approved or in the pipeline. However, with the exception of
Thailand all countries have identified laboratory capacity as their primary bottleneck to scaling
up diagnosis and treatment to reach the targets outlines in the Global Plan to Stop TB, 2006-
2015. In addition many countries in the region have growing private sectors that are currently
managing most of the MDR-TB cases in the region, and second line drugs are widely available
through the private sector. Coordinated efforts on behalf of NTPs as well as partners will be
required in order to solve the laboratory capacity shortage in the region.
WESTERN PACIFIC REGION
In the Western Pacific region fourteen countries and two special administrative regions reported
data since 2002, including data from one provinces, one special administrative region, and two
municipalities in China, the Philippines, and Viet Nam. Of the countries reporting, Fiji, Guam,
New Caledonia, New Zealand, the Northern Mariana Islands, Singapore, Solomon Islands,
Vanuatu, reported the fewest cases, between 0 and 3 cases of MDR-TB per year. Australia
reported 12 cases in 2005 and Macao SAR, China reported 9 cases of MDR-TB. Hong Kong,

106
SAR, China reported 41 MDR-TB cases in 2005 among all cases or 1.2% (95% CLs, 0.9-1.6)
and Japan, through its sentinel survey reported that 1.9% (95% CLs, 1.5-2.5) of all notified cases
were MDR-TB. China, the Philippines and Viet Nam reported higher proportions of resistance.
Since 1994 nineteen countries have reported drug resistance data from areas representing 52% of
all TB cases in the region, but covering 53% of the countries in the region. The population
weighted mean of MDR-TB based on all countries that have reported in the Western Pacific
region is 3.9% (95% CLs, 2.6-5.2) among new cases, 21.6% (95% CLs, 16.8-26.4) among
previously treated cases, and 6.7% (95% CLs, 4.6-8.8) among combined cases. Based on
available information it is estimated that there were 152,694 (95% CLs, 119,886-188,014)
incident MDR-TB cases in the region in 2006, with almost 85% of these cases estimated to be in
China.
Viet Nam reported 2.7% (95% CLs, 2.0-3.6) MDR-TB among new cases in their 2006 survey,
and 2.3% (95% CLs, 1.3-3.9) in a survey carried out a decade ago, which suggests that MDR-TB
has not significantly increased among new cases over this time period. Any resistance was
shown to have decreased, though not significantly. There were no results for retreatment cases in
the first survey, and the 2006 survey shows a considerable proportion of MDR-TB among
previously treated cases, 19.3% (95% CLs, 14.2-25.4). A survey in southern Viet Nam in 2001
also showed that any drug resistance had actually decreased since 1996 and there had been no
increase in MDR-TB[41].
The Philippines conducted its first nationwide survey in 2004 and showed 4.0% (95% CLs, 2.9-
5.5) MDR-TB among new cases and 20.9% (95% CLs, 14.3-29.0) among previously treated
cases. MDR-TB isolates from this survey are being further tested to second line drugs at the
SRL. Given the underlying high TB burden it is estimated that there were 11,848 (95% CLs,
7,428-17,106) incident MDR-TB in 2006. TB notifications in the country are stable and
treatment success is high. Importantly, the Philippines have had a long running GLC approved
programme for the management of MDR-TB patients that is now expanding. Treatment success

107
in this programme is high at 73% in the 2003 cohort. Based on data from the GLC programme30,
50.0% of the MDR-TB patients enrolled in the GLC programme were resistant to a
fluoroquinolone, and 3.4% (95% CLs, 1.6-6.1) were XDR-TB. The high proportion of resistance
to quinolones among MDR-TB cases is concerning and should be monitored in subsequent
surveys.
Since 1994 China has reported data on eight of 31 provinces, two major municipalities, and two
special administrative regions. Several other provincial surveys are under way as well as a
nationwide drug resistance survey that is due to be completed in 2008.
Data from surveys in Heilongjiang Province, Inner Mongolia Autonomous Region, and Beijing
and Shanghai municipalities are included in this report. These data support finding from previous
surveys in other provinces. Heilongjiang Province, and Inner Mongolia Autonomous Region
showed 7.2% (95% CLs, 5.9-8.6), and 7.3% (95% CLs, 5.6-9.4) MDR-TB among new cases
respectively. These proportions are similar to those reported from Liaoning province, also in
North Eastern China. Beijing and Shanghai reported lower proportions of resistance; 2.3% (95%
CLs, 1.5-3.4), and 3.9% (95% CLs, 2.6-5.6) respectively. This is one of the first reports of lower
proportions of drug resistance in urban settings. A nationwide survey, based on a random
selection of 70 clusters, representing counties or districts, is scheduled to complete in 2008.
Surveys in Chongqing, Hunan, and Xinjiang, provinces will be finalized shortly. Despite
reaching the global targets for case detection and cure, China has proportions of resistance that
are among the highest in the world, only second to rates found in countries of the former Soviet
Union. The plan for expansion of MDR-TB treatment under the NTP includes the launch pilot
projects in 31 prefectures in six provinces with plans to enroll 5,000 MDR-TB patients by 2009
and scale up to 50 prefectures in ten additional provinces, treating 10,000 MDR-TB patients by
2011. Though MDR-TB management guidelines, in line with international standards, have been
published and a GLC application has been approved China, is not on target to meet this goal.
30 Drug susceptibility testing data were reported from a local laboratory currently conducting external quality assurance for first line drugs, but second line results have not be rechecked by a Supranational Laboratory.

108
The extent of resistance to second line drugs is currently unknown; however the NRL is
developing capacity to conduct second line testing and MDR-TB isolates from the nationwide
survey will be evaluated. China has spent considerable time expanding quality assurance for
smear microscopy in the country and now has plans to upgrade culture and DST laboratories as
well as expand quality assurance for drug susceptibility testing.
Trends are available from Hong Kong, SAR, China and the Republic of Korea. Trends in
resistance to any drug, isoniazid, and MDR-TB continue to decline in Hong Kong, SAR,
China[42] at a faster rate than TB. The TB notification rate has decreased from 103 per 100,000
in 1996 to 81 per 100,000 in 2005. The Republic of Korea has conducted four nationwide
surveys. The surveys have shown a gradual but significant increase in MDR-TB[43], any
resistance and isoniazid resistance among new cases. The TB notification rate has declined since
1994, but been relatively stable for the past three years. The slowing in the decline in the overall
TB notification rate likely reflects the expansion of the routine registration of TB patients from
the private sector. The TB notification rate in the public sector alone continued to show a
decline for those same years. The last two drug resistance surveys were carried out one year
apart so future surveys will be important to better understand if this is a true increase in
population prevalence. The Korean Institute of Tuberculosis (KIT) which is National Reference
Laboratory as well as a Supranational Reference Laboratory, conducts nearly 70% of culture and
DST in the country for both the public and private sectors. Data reported in the CDC Morbidity
and Mortality Weekly Report[44] showing results of a global survey of Supranational
Laboratories showed that 15.4% of MDR-TB cases in Korea were XDR-TB. Because these data
were biased towards hospitalized patients in the private sector it is likely that it overestimated the
proportion of both MDR-TB among total isolates tested as well as MDR cases that are XDR-TB.
Data from the nationwide survey showed that only 1.8% of MDR-TB cases detected in the
survey had XDR-TB. Therefore, if culture and DST coverage are not complete, routine
laboratory investigations may be biased towards chronic cases and treatment failure.
Currently, information on resistance to second line drugs is limited. Australia, Hong Kong and
Macao, SAR, Japan, and the Republic of Korea are able to report data on second line drug
resistance routinely. The Philippines has been able to report data on a GLC cohort and Viet Nam
has identified one case. Thus, far the data are difficult to interpret. The proportion of XDR-TB

109
among MDR-TB was highest in Japan, 30.9% (95% CLs, 19.1-44.9), and Hong Kong, SAR,
14.6 (95% CLs, 13.7-16.1) respectively. Where absolute numbers of MDR-TB are low, XDR-TB
may not represent a significant obstacle for TB control. However, in high burden countries where
second line drugs are widely available such as China and the Philippines, further assessment of
resistance to second line drugs will be a critical component of designing the strategy for the
management of MDR-TB.
Currently, Cambodia, China, Micronesia, Mongolia, the Philippines, Samoa, and Viet Nam have
GLC approved programmes.
Similar to the South East Asian region the Western Pacific is also faced with limited capacity for
culture and drug susceptibility testing. China, Vietnam, and the Republic of Korea have
extensive culture networks in the public sector, but only China has a significant number of
laboratories able to conduct drug susceptibility testing. Quality assurance of DST as well as
links with the private sector may also prove critical in this region in order to build the capacity
necessary for the scale up outlined in the Global Plan. The Western Pacific region currently has
five very active SRLs and has plans to add one more over the next year.

110
References
1. Organization, W.H., Global tuberculosis control: surveillance, planning, financing. WHO Report 2008. World Health Organization Document, 2008. WHO/HTM/ TB/2008.393.
2. Organization, W.H., The Global MDR-TB & XDR-TB response Plan 2007-2008. World Health Organization Document, 2007. WHO/HTM/TB/2007.387.
3. Wells, C., et al., HIV infection and multidrug-resistant tuberculosis: the perfect storm. J Infect Dis, 2007. 196(Suppl 1): p. S86-107.
4. Alem n, M., et al., Mycobacterium tuberculosis triggers apoptosis in peripheral neutrophils involving toll-like receptor 2 and p38 mitogen protein kinase in tuberculosis patients. 2004. 72: p. 5150-5158.
5. Organization, W.H., Guidelines for the surveillance of drug resistance in tuberculosis. World Health Organization Document, 2003. WHO/TB/2003.320: p. 1-21.
6. Organization, W.H., Interim Recommendations for the Surveillance of Drug Resistance in Tuberculosis. World Health Organization Document, 2007. WHO/HTM/TB/2007.385.
7. Van Deun, A., et al., Evaluation of tuberculosis control by periodic or routine susceptibility testing in previously treated cases. Int.J.Tuberc.Lung Dis., 2001. 5: p. 329-338.
8. van Rie, A., et al., Classification of drug-resistant tuberculosis in an epidemic area. Lancet, 2000. 356: p. 22-25.
9. Organization, W.H., Laboratory services in tuberculosis control. Part III: Culture. 1 ed, ed. W.H. Organization. 1998, Geneva: World Health Organization. 1-95.
10. Vestal, A. and G. Kubica, Differential identification of mycobacteria. 3. Use of thiacetazone, thiophen-2-carboxylic acid hydrazide, and triphenyltetrazolium chloride. Scand J Respir Dis, 1967. 48(2): p. 142-8.
11. Canetti, G., et al., Mycobacteria: laboratory methods for testing drug sensitivity and resistance. 1963. 29: p. 565-578.
12. Canetti, G., et al., Advances in techniques of testing mycobacterial drug sensitivity, and the use of sensitivity tests in tuberculosis control programmes. 1969. 41: p. 21-43.
13. Organization, W.H., Interim Policy Guidance on Drug Susceptibility Testing (DST) of Second-line Anti-Tuberculosis Drugs. World Health Organization Document, 2008. WHO/HTM/ TB/2008.392.
14. Zignol, M., et al., Global incidence of multidrug-resistant tuberculosis. 2006. 194: p. 479-485.
15. Li, X., et al., Transmission of drug-resistant tuberculosis among treated patients in Shanghai, China. J Infect Dis, 2007. 195(6): p. 864-9.
16. Jeon, C., et al., Extensively drug-resistant tuberculosis in South Korea: risk factors and treatment outcomes among patients at a tertiary referral hospital. Clin Infect Dis, 2008. 46(1): p. 42-9.
17. Cox, H., et al., Multidrug-Resistant Tuberculosis Treatment Outcomes in Karakalpakstan, Uzbekistan: Treatment Complexity and XDR-TB among Treatment Failures. PLoS ONE, 2007. 2(11): p. e1126.
18. Edlin, B.R., et al., An outbreak of multidrug-resistant tuberculosis among hospitalized patients with the acquired immunodeficiency syndrome. 1992. 326: p. 1514-1521.
19. Moro, M.L., et al., An outbreak of multidrug-resistant tuberculosis involving HIV-infected patients of two hospitals in Milan, Italy. AIDS, 1998. 12: p. 1095-1102.

111
20. Kenyon, T.A., et al., Low levels of drug resistance amidst rapidly increasing tuberculosis and human immunodeficiency virus co-epidemics in Botswana. Int.J.Tuberc.Lung Dis., 1999. 3: p. 4-11.
21. Chum, H.J., et al., An epidemiological study of tuberculosis and HIV infection in Tanzania, 1991-1993. AIDS, 1996. 10: p. 299-309.
22. Mac-Arthur, A., Jr., et al., Characteristics of drug resistance and HIV among tuberculosis patients in Mozambique. Int.J.Tuberc.Lung Dis., 2001. 5: p. 894-902.
23. Gandhi, N.R., et al., Extensively drug-resistant tuberculosis as a cause of death in patients co-infected with tuberculosis in a rural area of South Africa. Lancet, 2006. 368: p. 1575-1580.
24. Blower, S.M. and T. Chou, Modeling the emergence of the 'hot zones': tuberculosis and the amplification dynamics of drug resistance. Nat Med, 2004. 10(10): p. 1111-6.
25. Gandhi, N.R., et al., Extensively drug-resistant tuberculosis as a cause of death in patients co-infected with tuberculosis and HIV in a rural area of South Africa. Lancet, 2006. 368(9547): p. 1575-80.
26. Umubyeyi, A., et al., Low levels of second-line drug resistance among multidrug-resistant Mycobacterium tuberculosis isolates from Rwanda. Int J Infect Dis, 2007.
27. Umubyeyi, A.N., et al., Limited fluoroquinolone resistance among Mycobacterium tuberculosis isolates from Rwanda: results of a national survey. J Antimicrob Chemother, 2007. 59(5): p. 1031-3.
28. Umubyeyi, A.N., et al., Results of a national survey on drug resistance among pulmonary tuberculosis patients in Rwanda. Int J Tuberc Lung Dis, 2007. 11(2): p. 189-94.
29. Montoro, E., et al., Drug-resistant tuberculosis in Cuba. Results of the three global projects. Tuberculosis (Edinb), 2006. 86(3-4): p. 319-23.
30. Blöndal, K., Barriers to reaching the targets for tuberculosis control: multidrug-resistant tuberculosis. Bull World Health Organ, 2007. 85(5): p. 387-90.
31. Leimane, V. and J. Leimans, Tuberculosis control in Latvia: itnegrated DOTS and DOTS-Plus programmes. Eurosurveillance, 2006. 11: p. 29-33.
32. Balabanova Ia, M., et al., [Analysis of risk factors of the occurrence of drug resistance in patients with tuberculosis from civil and penitentiary sectors in the Samara Region]. Probl Tuberk Bolezn Legk, 2005(5): p. 25-31.
33. Drobniewski, F., et al., Drug-resistant tuberculosis, clinical virulence, and the dominance of the Beijing strain family in Russia. JAMA, 2005. 293: p. 2726-2731.
34. Drobniewski, F.A., et al., Tuberculosis, HIV seroprevalence and intravenous drug abuse in prisoners. 2005. 26: p. 298-304.
35. Mahadev, B., et al., Surveillance of drug resistance to anti-tuberculosis drugs in districts of Hoogli in West Bengal and Mayurbhanj in Orissa. Indian J Tuberc., 2004. 52: p. 5-10.
36. Joseph, M., et al., Surveillance of anti-tuberculosis drug resistance in Ernakulam District, Kerala State, South India. Int J Tuberc Lung Dis, 2007. 11(4): p. 443-9.
37. Ti, T., et al., National anti-tuberculosis drug resistance survey, 2002, in Myanmar. Int J Tuberc Lung Dis, 2006. 10(10): p. 1111-6.
38. Thomas, A., et al., Management of multi drug resistance tuberculosis in the field: Tuberculosis Research Centre experience. Indian J Tuberc, 2007. 54(3): p. 117-24.
39. Kelly, P.M., et al., A community-based TB drug susceptibility study in Mimika District, Papua Province, Indonesia. Int J Tuberc Lung Dis, 2006. 10(2): p. 167-71.

112
40. Van Deun, A., et al., Drug resistance monitoring: combined rates may be the best indicator of programme performance. Int.J.Tuberc.Lung Dis., 2004. 8: p. 23-30.
41. Huong, N.T., et al., Antituberculosis drug resistance in the south of Vietnam: prevalence and trends. J Infect Dis, 2006. 194(9): p. 1226-32.
42. Kam, K.M. and C.W. Yip, Surveillance of Mycobacterium tuberculosis drug resistance in Hong Kong, 1986-1999, after the implementation of directly observed treatment. Int.J.Tuberc.Lung Dis., 2001. 5: p. 815-823.
43. Bai, G.H., et al., Trend of anti-tuberculosis drug resistance in Korea, 1994-2004. Int J Tuberc Lung Dis, 2007. 11(5): p. 571-6.
44. Emergence of Mycobacterium tuberculosis with extensive resistance to second-line drugs--worldwide, 2000-2004. MMWR Morb Mortal Wkly Rep, 2006. 55(11): p. 301-5.

113
Previous reportsNew data report 4Never previously reported
No data
The boundaries and names shown and the designations used on this map do not imply the expression of any opinion whatsoever on the part of the World Health Organization concerning the legal status of any country, territory, city or area or of its authorities, or concerning the delimitation of its frontiers or boundaries. Dotted lines on maps represent approximate border lines for
which there may not yet be full agreement. © WHO 2006. All rights reserved
* Sub-national coverage in India, China, Russia, Indonesia.
New data report 4
No dataPrevious reportsNew data report 4
No data
!! ! ! ! !
! ! ! ! ! ! ! !! ! ! ! ! ! ! !
! ! ! ! ! ! ! !! ! ! ! ! ! ! !! ! ! ! ! ! !! ! ! ! !
! !
! ! ! ! ! ! ! ! !! ! ! ! ! ! ! ! ! ! ! ! ! !! ! ! ! ! ! ! ! ! ! ! ! ! ! ! ! !
! ! ! ! ! ! ! ! ! ! ! ! ! ! ! ! ! ! ! !! ! ! ! ! ! ! ! ! ! ! ! ! ! ! ! ! ! !
! ! ! ! ! ! ! ! ! !! ! ! ! ! ! ! !
!! ! !
! ! ! !! ! ! !
! ! ! ! !! ! !
! ! ! !! ! ! ! ! !
! ! ! !!
!! !! !! !
! !! ! ! ! !! ! ! ! !
! ! !!
! !!
! !! ! ! !! ! ! ! !
! ! !! !
! ! ! ! !! ! ! ! ! !
! ! ! ! ! ! !! ! ! ! ! ! !
! ! ! ! ! ! ! !! ! ! ! ! ! ! !
! ! ! ! !!
!! ! ! ! !! ! ! ! ! !
! ! ! ! !! ! !
!
!! ! ! ! !
! ! ! ! ! ! ! !! ! ! ! ! ! !! ! ! ! !
! ! ! ! ! !! ! ! ! ! ! ! !
! ! ! ! ! ! ! !! ! ! ! ! ! ! !
! ! ! ! !
! !! !!!
! ! ! ! ! !! ! ! ! ! !! ! ! ! ! !
! ! ! !! ! !! ! ! !
!! ! !! ! !! ! !
! !! ! ! !! ! ! ! !! ! ! ! !! ! ! ! ! !! ! !
! !! ! ! !
! ! ! ! ! !! ! ! ! ! ! ! ! !! ! ! ! ! ! ! !
! ! ! ! ! ! !! ! ! ! ! !! ! ! ! ! ! !
! ! ! ! ! !
! ! !! ! !
! !
! !! ! ! !! ! ! !
! ! !
! ! !! ! !! ! !
! ! ! !! ! ! !
! ! ! ! ! ! !
!
!
! ! !! !!
!! ! !! ! !
! !! ! !
! !! ! ! ! ! ! ! !! ! ! ! ! ! ! ! ! !
! ! ! ! ! ! ! ! ! ! ! ! ! ! !! ! ! ! ! ! ! ! ! ! ! ! ! ! ! !! ! ! ! ! ! ! ! ! ! ! ! ! !
! !
! ! ! ! !! ! ! ! ! !! ! ! ! ! ! !! ! ! ! ! ! ! !
! ! ! ! ! ! !! ! ! !
! !
! !! ! ! ! ! !! ! ! ! ! !
! ! ! ! !! ! ! ! !! ! ! !
! ! !!
! !! ! ! !! ! ! ! !
! ! !! ! ! ! !
! ! ! ! ! ! ! !! ! ! ! ! ! ! ! !! ! ! ! ! ! ! ! !
! ! ! ! ! ! ! ! ! ! !! ! ! ! ! ! ! ! ! ! !
! ! ! ! ! ! ! ! ! ! ! ! ! !! ! ! ! ! ! ! ! ! ! ! ! ! ! ! ! ! ! !! ! ! ! ! ! ! ! ! ! ! ! ! ! ! ! ! ! !! ! ! ! ! ! ! ! ! ! ! ! ! ! ! ! ! ! !! ! ! ! ! ! ! ! ! ! ! ! ! ! ! ! ! ! !
! ! ! ! ! ! ! ! ! ! ! ! ! !! ! ! ! ! ! ! ! ! ! !! ! ! ! ! ! ! ! !
! ! ! !
! ! ! ! ! ! !! ! ! ! ! ! ! ! ! !! ! ! ! ! ! ! ! ! !! ! ! ! ! ! !
!
! ! ! !! ! ! ! !
! ! ! ! ! !! ! ! ! ! !
! ! ! ! ! ! ! !! ! ! ! ! ! ! !
! ! ! ! ! ! !! ! ! ! ! ! ! !! ! ! ! ! ! !
! ! ! ! ! !
Map 1: Global Project coverage 1994-2007

114
The boundaries and names shown and the designations used on this map do not imply the expression of any opinion whatsoever on the part of the World Health Organization concerning the legal status of any country, territory, city or area or of its authorities, or concerning the delimitation of its frontiers or boundaries. Dotted lines on maps represent approximate border lines for
which there may not yet be full agreement. © WHO 2006. All rights reserved
3 or more data points
No data
2 data pointsBaseline coverage
* Sub-national coverage in India, China, and Russia.
Map 2: Available trends 1994-2007

115
The boundaries and names shown and the designations used on this map do not imply the expression of any opinion whatsoever on the part of the World Health Organization concerning the legal status of any country, territory, city or area or of its authorities, or concerning the delimitation of its frontiers or boundaries. Dotted lines on maps represent approximate border lines for
which there may not yet be full agreement. © WHO 2006. All rights reserved
< 15%
> 35% 15 - 35%
No data
* Sub-national coverage in India, China, Russia, Indonesia.
Map 3. Any resistance among new cases 1994-

116
< 3%3-6 %> 6 %No data
The boundaries and names shown and the designations used on this map do not imply the expression of any opinion whatsoever on the part of the World Health Organization concerning the legal status of any country, territory, city or area or of its authorities, or concerning the delimitation of its frontiers or boundaries. Dotted lines on maps represent approximate border lines for
which there may not yet be full agreement. © WHO 2006. All rights reserved
* Sub-national coverage in India, China, Russia, Indonesia.
Map 4: MDR-TB among new TB cases 1994-2007

117
The boundaries and names shown and the designations used on this map do not imply the expression of any opinion whatsoever on the part of the World Health Organization concerning the legal status of any country, territory, city or area or of its authorities, or concerning the delimitation of its frontiers or boundaries. Dotted lines on maps represent approximate border lines for
which there may not yet be full agreement. © WHO 2006. All rights reserved
<15%15 - 30%
> 60%31 - 60%
* Sub-national coverage in India, China, Russia, Indonesia.
No data
Map 5: Any resistance among previously treated TB cases 1994-2007

118
< 6%6 - 20%20 - 40 %
No data>40 %
The boundaries and names shown and the designations used on this map do not imply the expression of any opinion whatsoever on the part of the World Health Organization concerning the legal status of any country, territory, city or area or of its authorities, or concerning the delimitation of its frontiers or boundaries. Dotted lines on maps represent approximate border lines for
which there may not yet be full agreement. © WHO 2006. All rights reserved
* Sub-national coverage in India, China, Russia, Indonesia.
Map 5: Any resistance among previously treated TB cases 1994-2007 Map 6: MDR-TB among previously treated TB cases 1994-2007

119
SRLUnder evaluation
Coordinating Centre
5 Americas
2 in African region
5 in Western Pacific
11 Europe
2 in South East Asia
1 Eastern Mediterranean
Map 7: The Supranantional Laboratory Network
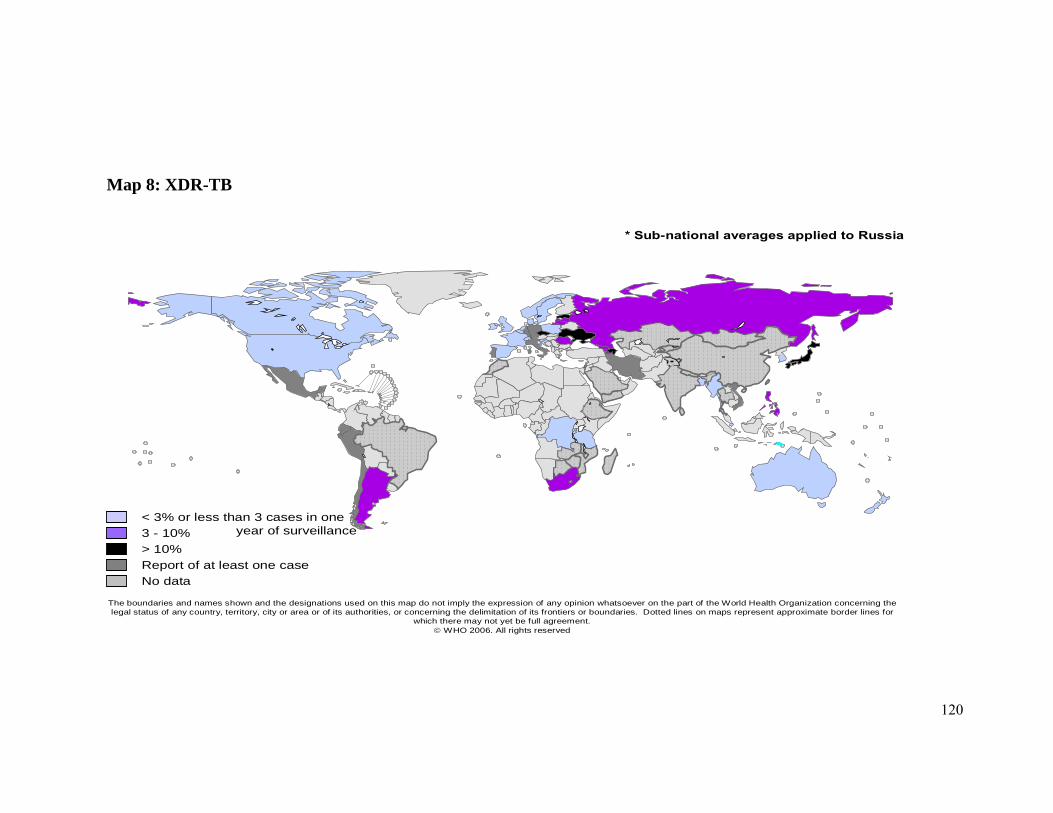
120
The boundaries and names shown and the designations used on this map do not imply the expression of any opinion whatsoever on the part of the World Health Organization concerning the legal status of any country, territory, city or area or of its authorities, or concerning the delimitation of its frontiers or boundaries. Dotted lines on maps represent approximate border lines for
which there may not yet be full agreement. © WHO 2006. All rights reserved
* Sub-national averages applied to Russia
< 3% or less than 3 cases in one year of surveillance3 - 10%
> 10%
No dataReport of at least one case
! ! ! ! !! ! ! ! ! ! ! !! ! ! ! ! ! ! !
! ! ! ! ! ! ! !! ! ! ! ! ! ! !! ! ! ! ! ! !! ! ! ! !
! !
! ! !! ! ! ! !
! ! !
!! !! !
! ! !! ! ! !
! ! ! ! ! ! !! ! ! ! ! ! ! ! !! ! ! ! ! ! ! ! ! ! !
! ! ! ! ! ! ! ! ! ! ! ! !! ! ! ! ! ! ! ! ! ! ! ! !! ! ! ! ! ! ! ! ! ! !
! ! ! !! ! !! ! !
! ! ! ! ! ! ! !! ! ! ! ! ! ! ! ! ! ! ! ! !! ! ! ! ! ! ! ! ! ! ! ! ! ! ! ! !
! ! ! ! ! ! ! ! ! ! ! ! ! ! ! ! ! ! ! !! ! ! ! ! ! ! ! ! ! ! ! ! ! ! ! ! ! !
! ! ! ! ! ! ! ! ! ! !! ! ! ! ! ! ! !
!! !! !
!! !
! ! ! ! !! ! ! ! !
! ! !!
! !! ! ! !! ! ! ! !
! ! ! !! ! !! !! ! ! ! !! ! ! ! ! !
! ! ! ! !! ! ! !
!
! !! ! ! !
! ! ! !! ! ! !
!
! !! !!!
! !! ! ! !! ! ! !
! ! !
!
! !! ! !! ! !! ! !! ! ! !
! !!
!!!
!! !!
!! ! ! !! ! ! !! ! ! !! !
! ! ! ! ! ! ! !! ! ! ! ! ! ! ! ! !
! ! ! ! ! ! ! ! ! ! ! ! ! ! !! ! ! ! ! ! ! ! ! ! ! ! ! ! ! !! ! ! ! ! ! ! ! ! ! ! ! !
! !
!! ! ! !! !
! ! ! !! ! ! ! !
! ! ! !! ! ! ! ! !
! ! ! ! ! ! !! ! ! ! !
! ! ! !! ! !
! !! ! ! !! ! ! ! !
! ! !! ! ! ! !
! ! ! ! ! ! ! !! ! ! ! ! ! ! ! !! ! ! ! ! ! ! ! !
! ! ! ! ! ! ! ! ! ! !! ! ! ! ! ! ! ! ! ! !
! ! ! ! ! ! ! ! ! ! ! ! ! !! ! ! ! ! ! ! ! ! ! ! ! ! ! ! ! ! ! !! ! ! ! ! ! ! ! ! ! ! ! ! ! ! ! ! ! !! ! ! ! ! ! ! ! ! ! ! ! ! ! ! ! ! ! !! ! ! ! ! ! ! ! ! ! ! ! ! ! ! ! ! ! !
! ! ! ! ! ! ! ! ! ! ! ! ! !! ! ! ! ! ! ! ! ! ! !! ! ! ! ! ! ! ! ! !
! ! ! !
! !! !
! ! ! ! ! ! ! !! ! ! ! ! ! ! ! ! ! ! !! ! ! ! ! ! ! ! ! ! !
! ! ! ! ! ! ! ! ! ! ! ! ! ! ! ! !! ! ! ! ! ! ! ! ! ! ! ! ! ! ! ! ! ! ! ! !
! ! ! ! ! ! ! ! ! ! ! ! ! ! ! ! ! ! ! ! ! !! ! ! ! ! ! ! ! ! ! ! ! ! ! ! ! ! ! ! ! !
! ! ! ! ! ! ! ! ! ! ! ! ! ! ! ! ! ! ! ! ! ! !! ! ! ! ! ! ! ! ! ! ! ! ! ! ! ! ! ! ! ! ! ! ! !! ! ! ! ! ! ! ! ! ! ! ! ! ! ! ! ! ! ! ! ! ! ! ! ! !
! ! ! ! ! ! ! ! ! ! ! ! ! ! ! ! ! ! ! ! ! ! ! ! ! !! ! ! ! ! ! ! ! ! ! ! ! ! ! ! ! ! !
! ! ! ! ! ! ! ! ! ! ! ! ! !! ! ! ! ! ! ! ! ! ! ! !
! ! ! ! ! !! ! !
!!
Map 8: XDR-TB

Annex 1. Notified prevalence of resistance to specific drugs among new TB cases tested for resistance to at least INH and RIF (1)R
egio
n
Countr
y
Sub-n
ational
Year
Meth
od
Patients
teste
d
Susceptible
%
Any
resis
tance
%
Any H
%
Any R
%
Any E
%
Any S
%
Mono
%
Mono H
%
Mono R
%
Mono E
%
Mono S
%
MD
R
% HR %
HR
E
%
HR
S
%
HR
ES
%
Poly
% HE % HS %
HE
S
% RE % RS %
RE
S
% ES %
AFR Algeria Countrywide 2001 Survey 518 486 93.8 32 6.2 16 3.1 6 1.2 0 0.0 27 5.2 21 4.1 5 1.0 0 0.0 0 0.0 16 3.1 6 1.2 0 0.0 0 0.0 6 1.2 0 0.0 5 1.0 0 0.0 5 1.0 0 0.0 0 0.0 0 0.0 0 0.0 0 0.0
AFR Benin Countrywide 1997 Survey 333 305 91.6 28 8.4 18 5.4 1 0.3 2 0.6 16 4.8 20 6.0 11 3.3 0 0.0 0 0.0 9 2.7 1 0.3 0 0.0 1 0.3 0 0.0 0 0.0 7 2.1 0 0.0 6 1.8 0 0.0 0 0.0 0 0.0 0 0.0 1 0.3
AFR Botswana Countrywide 2002 Survey 1182 1,059 89.6 123 10.4 53 4.5 24 2.0 15 1.3 82 6.9 86 7.3 22 1.9 10 0.8 2 0.2 52 4.4 10 0.8 3 0.3 2 0.2 3 0.3 2 0.2 27 2.3 2 0.2 15 1.3 4 0.3 0 0.0 3 0.3 1 0.1 2 0.2
AFR Central African Republic Bangui 1998 Survey 464 388 83.6 76 16.4 44 9.5 6 1.3 11 2.4 51 11.0 50 10.8 19 4.1 1 0.2 0 0.0 30 6.5 5 1.1 2 0.4 2 0.4 0 0.0 1 0.2 21 4.5 1 0.2 13 2.8 6 1.3 0 0.0 0 0.0 0 0.0 1 0.2
AFR Côte d'Ivoire Countrywide 2006 Survey 320 244 76.3 76 23.8 39 12.2 10 3.1 22 6.9 32 10.0 53 16.6 23 7.2 0 0.0 13 4.1 17 5.3 8 2.5 4 1.3 1 0.3 3 0.9 0 0.0 15 4.7 3 0.9 5 1.6 0 0.0 0 0.0 2 0.6 0 0.0 5 1.6
AFR DR Congo Kinshasa 1999 Survey combined only . . . . . . . . . . . . . . . . . . . . . . . .
AFR Ethiopia Countrywide 2005 Survey 804 588 73.1 216 26.9 62 7.7 22 2.7 19 2.4 187 23.3 165 20.5 16 2.0 8 1.0 1 0.1 140 17.4 13 1.6 3 0.4 0 0.0 1 0.1 9 1.1 38 4.7 1 0.1 28 3.5 4 0.5 0 0.0 1 0.1 0 0.0 4 0.5
AFR Gambia Countrywide 2000 Survey 210 201 95.7 9 4.3 5 2.4 2 1.0 0 0.0 3 1.4 8 3.8 4 1.9 1 0.5 0 0.0 3 1.4 1 0.5 1 0.5 0 0.0 0 0.0 0 0.0 0 0.0 0 0.0 0 0.0 0 0.0 0 0.0 0 0.0 0 0.0 0 0.0
AFR Guinea Sentinel sites 1998 Survey 539 460 85.3 79 14.7 50 9.3 4 0.7 3 0.6 51 9.5 53 9.8 24 4.5 1 0.2 0 0.0 28 5.2 3 0.6 1 0.2 0 0.0 2 0.4 0 0.0 23 4.3 2 0.4 20 3.7 1 0.2 0 0.0 0 0.0 0 0.0 0 0.0
AFR Kenya Nearly Countrywide 1995 Survey 445 417 93.7 28 6.3 28 6.3 0 0.0 0 0.0 4 0.9 24 5.4 24 5.4 0 0.0 0 0.0 0 0.0 0 0.0 0 0.0 0 0.0 0 0.0 0 0.0 4 0.9 0 0.0 4 0.9 0 0.0 0 0.0 0 0.0 0 0.0 0 0.0
AFR Lesotho Countrywide 1995 Survey 330 301 91.2 29 8.8 26 7.9 3 0.9 0 0.0 10 3.0 20 6.1 17 5.2 0 0.0 0 0.0 3 0.9 3 0.9 2 0.6 0 0.0 1 0.3 0 0.0 6 1.8 0 0.0 6 1.8 0 0.0 0 0.0 0 0.0 0 0.0 0 0.0
AFR Madagascar (2) Countrywide 2007 Survey 810 759 93.7 51 6.3 37 4.6 4 0.5 4 0.5 26 3.2 42 5.2 28 3.5 0 0.0 0 0.0 20 2.5 4 0.5 1 0.1 1 0.1 0 0.0 2 0.2 5 0.6 1 0.1 4 0.5 0 0.0 0 0.0 0 0.0 0 0.0 0 0.0
AFR Mozambique Countrywide 1999 Survey 1028 814 79.2 214 20.8 170 16.5 54 5.3 5 0.5 108 10.5 125 12.2 81 7.9 18 1.8 0 0.0 26 2.5 36 3.5 7 0.7 0 0.0 24 2.3 5 0.5 53 5.2 0 0.0 53 5.2 0 0.0 0 0.0 0 0.0 0 0.0 0 0.0
AFR Rwanda Countrywide 2005 Survey 616 552 89.6 64 10.4 38 6.2 24 3.9 32 5.2 46 7.5 33 5.4 7 1.1 0 0.0 10 1.6 16 2.6 24 3.9 1 0.2 0 0.0 2 0.3 21 3.4 7 1.1 0 0.0 6 1.0 1 0.2 0 0.0 0 0.0 0 0.0 0 0.0
AFR Senegal Countrywide 2006 Survey 237 212 89.5 25 10.5 10 4.2 5 2.1 8 3.4 18 7.6 18 7.6 3 1.3 0 0.0 3 1.3 12 5.1 5 2.1 0 0.0 1 0.4 1 0.4 3 1.3 2 0.8 0 0.0 1 0.4 1 0.4 0 0.0 0 0.0 0 0.0 0 0.0
AFR Sierra Leone Nearly Countrywide 1997 Survey 117 88 75.2 29 24.8 12 10.3 1 0.9 0 0.0 25 21.4 21 17.9 4 3.4 0 0.0 0 0.0 17 14.5 1 0.9 0 0.0 0 0.0 1 0.9 0 0.0 7 6.0 0 0.0 7 6.0 0 0.0 0 0.0 0 0.0 0 0.0 0 0.0
AFR South Africa Countrywide 2002 Survey 4243 3,906 92.1 337 7.9 249 5.9 91 2.1 38 0.9 178 4.2 197 4.6 109 2.6 14 0.3 0 0.0 74 1.7 77 1.8 21 0.5 10 0.2 26 0.6 20 0.5 63 1.5 5 0.1 55 1.3 3 0.1 0 0.0 0 0.0 0 0.0 0 0.0
AFR Swaziland Countrywide 1995 Survey 334 295 88.3 39 11.7 30 9.0 3 0.9 3 0.9 24 7.2 22 6.6 13 3.9 0 0.0 1 0.3 8 2.4 3 0.9 0 0.0 1 0.3 2 0.6 0 0.0 14 4.2 0 0.0 13 3.9 1 0.3 0 0.0 0 0.0 0 0.0 0 0.0
AFR Uganda 3 GLRA Zones * 1997 Survey 374 300 80.2 74 19.8 25 6.7 3 0.8 23 6.1 50 13.4 48 12.8 12 3.2 1 0.3 9 2.4 26 7.0 2 0.5 1 0.3 1 0.3 0 0.0 0 0.0 24 6.4 0 0.0 11 2.9 0 0.0 0 0.0 0 0.0 0 0.0 13 3.5
AFR UR Tanzania (2) Countrywide 2007 Survey 369 346 93.8 23 6.2 16 4.3 4 1.1 3 0.8 13 3.5 15 4.1 8 2.2 0 0.0 0 0.0 7 1.9 4 1.1 0 0.0 1 0.3 2 0.5 1 0.3 4 1.1 1 0.3 3 0.8 0 0.0 0 0.0 0 0.0 0 0.0 0 0.0
AFR Zambia Countrywide 2000 Survey 445 394 88.5 51 11.5 28 6.3 8 1.8 9 2.0 24 5.4 38 8.5 15 3.4 0 0.0 3 0.7 20 4.5 8 1.8 4 0.9 3 0.7 0 0.0 1 0.2 5 1.1 2 0.4 3 0.7 0 0.0 0 0.0 0 0.0 0 0.0 0 0.0
AFR Zimbabwe Nearly Countrywide 1995 Survey 676 654 96.7 22 3.3 22 3.3 13 1.9 4 0.6 5 0.7 9 1.3 9 1.3 0 0.0 0 0.0 0 0.0 13 1.9 8 1.2 0 0.0 1 0.1 4 0.6 0 0.0 0 0.0 0 0.0 0 0.0 0 0.0 0 0.0 0 0.0 0 0.0
AMR Argentina Countrywide 2005 Survey 683 615 90.0 68 10.0 39 5.7 16 2.3 4 0.6 44 6.4 43 6.3 14 2.0 1 0.1 1 0.1 27 4.0 15 2.2 7 1.0 1 0.1 5 0.7 2 0.3 10 1.5 0 0.0 10 1.5 0 0.0 0 0.0 0 0.0 0 0.0 0 0.0
AMR Bolivia Countrywide 1996 Survey 498 371 74.5 127 25.5 51 10.2 30 6.0 25 5.0 49 9.8 100 20.1 34 6.8 14 2.8 18 3.6 34 6.8 6 1.2 5 1.0 0 0.0 1 0.2 0 0.0 21 4.2 2 0.4 9 1.8 0 0.0 5 1.0 5 1.0 0 0.0 0 0.0
AMR Brazil Nearly Countrywide 1996 Survey 2095 1,915 91.4 180 8.6 124 5.9 23 1.1 3 0.1 76 3.6 135 6.4 79 3.8 4 0.2 2 0.1 50 2.4 19 0.9 18 0.9 0 0.0 1 0.0 0 0.0 26 1.2 1 0.0 25 1.2 0 0.0 0 0.0 0 0.0 0 0.0 0 0.0
AMR Canada Countrywide 2005 Surveillance 1087 957 88.0 130 12.0 89 8.2 15 1.4 15 1.4 62 5.7 98 9.0 57 5.2 2 0.2 5 0.5 34 3.1 13 1.2 2 0.2 1 0.1 5 0.5 5 0.5 19 1.7 1 0.1 15 1.4 3 0.3 0 0.0 0 0.0 0 0.0 0 0.0
AMR Chile Countrywide 2001 Survey 867 776 89.5 91 10.5 39 4.5 7 0.8 2 0.2 78 9.0 64 7.4 12 1.4 1 0.1 0 0.0 51 5.9 6 0.7 0 0.0 0 0.0 4 0.5 2 0.2 21 2.4 0 0.0 21 2.4 0 0.0 0 0.0 0 0.0 0 0.0 0 0.0
AMR Colombia Countrywide 2000 Survey 1087 918 84.5 169 15.5 103 9.5 18 1.7 9 0.8 125 11.5 102 9.4 37 3.4 1 0.1 3 0.3 61 5.6 16 1.5 1 0.1 2 0.2 11 1.0 2 0.2 51 4.7 0 0.0 48 4.4 2 0.2 0 0.0 1 0.1 0 0.0 0 0.0
AMR Costa Rica Countrywide 2006 Survey 263 244 92.8 19 7.2 9 3.4 5 1.9 13 4.9 0 0.0 7 2.7 5 1.9 1 0.4 9 3.4 0 0.0 4 1.5 0 0.0 4 1.5 0 0.0 0 0.0 8 3.0 0 0.0 0 0.0 0 0.0 0 0.0 0 0.0 0 0.0 0 0.0
AMR Cuba Countrywide 2005 Sentinel 169 157 92.9 12 7.1 1 0.6 1 0.6 0 0.0 11 6.5 11 6.5 0 0.0 1 0.6 0 0.0 10 5.9 0 0.0 0 0.0 0 0.0 0 0.0 0 0.0 1 0.6 0 0.0 1 0.6 0 0.0 0 0.0 0 0.0 0 0.0 0 0.0
AMR Dominican Republic Countrywide 1995 Survey 303 180 59.4 123 40.6 60 19.8 49 16.2 11 3.6 64 21.1 78 25.7 26 8.6 21 6.9 1 0.3 30 9.9 20 6.6 9 3.0 1 0.3 6 2.0 4 1.3 25 8.3 0 0.0 13 4.3 1 0.3 1 0.3 7 2.3 0 0.0 3 1.0
AMR Ecuador Countrywide 2002 Survey 812 649 79.9 163 20.1 89 11.0 59 7.3 10 1.2 92 11.3 99 12.2 29 3.6 15 1.8 2 0.2 53 6.5 40 4.9 20 2.5 4 0.5 14 1.7 2 0.2 24 3.0 0 0.0 20 2.5 0 0.0 1 0.1 2 0.2 1 0.1 0 0.0
AMR El Salvador Countrywide 2001 Survey 611 576 94.3 35 5.7 8 1.3 7 1.1 2 0.3 23 3.8 30 4.9 3 0.5 5 0.8 2 0.3 20 3.3 2 0.3 2 0.3 0 0.0 0 0.0 0 0.0 3 0.5 0 0.0 3 0.5 0 0.0 0 0.0 0 0.0 0 0.0 0 0.0
AMR Guatemala Countrywide 2002 Survey 668 435 65.1 233 34.9 72 10.8 28 4.2 52 7.8 193 28.9 156 23.4 8 1.2 5 0.7 23 3.4 120 18.0 20 3.0 2 0.3 1 0.1 7 1.0 10 1.5 57 8.5 1 0.1 37 5.5 6 0.9 0 0.0 2 0.3 1 0.1 10 1.5
AMR Honduras Countrywide 2004 Survey 457 402 88.0 55 12.0 27 5.9 10 2.2 8 1.8 38 8.3 39 8.5 11 2.4 2 0.4 0 0.0 26 5.7 8 1.8 1 0.2 2 0.4 0 0.0 5 1.1 8 1.8 1 0.2 7 1.5 0 0.0 0 0.0 0 0.0 0 0.0 0 0.0
AMR Mexico Baja California, Sinaloa, Oaxaca 1997 Survey 334 287 85.9 47 14.1 24 7.2 12 3.6 10 3.0 24 7.2 35 10.5 14 4.2 2 0.6 1 0.3 18 5.4 8 2.4 1 0.3 1 0.3 2 0.6 4 1.2 4 1.2 2 0.6 0 0.0 0 0.0 2 0.6 0 0.0 0 0.0 0 0.0
AMR Nicaragua Countrywide 2006 Survey 320 278 86.9 42 13.1 21 6.6 3 0.9 4 1.3 25 7.8 33 10.3 13 4.1 1 0.3 1 0.3 18 5.6 2 0.6 0 0.0 2 0.6 0 0.0 0 0.0 7 2.2 0 0.0 6 1.9 0 0.0 0 0.0 0 0.0 0 0.0 1 0.3
AMR Paraguay Countrywide 2001 Survey 235 209 88.9 26 11.1 15 6.4 8 3.4 6 2.6 12 5.1 16 6.8 7 3.0 3 1.3 0 0.0 6 2.6 5 2.1 1 0.4 2 0.9 1 0.4 1 0.4 5 2.1 1 0.4 2 0.9 0 0.0 0 0.0 0 0.0 0 0.0 2 0.9
AMR Peru Countrywide 2006 Survey 1809 1,389 76.8 420 23.2 209 11.6 105 5.8 36 2.0 342 18.9 254 14.0 45 2.5 9 0.5 0 0.0 200 11.1 95 5.3 17 0.9 6 0.3 45 2.5 27 1.5 71 3.9 1 0.1 67 3.7 1 0.1 0 0.0 1 0.1 0 0.0 1 0.1
AMR Puerto Rico Countrywide 2005 Surveillance combined only . . . . . . . . . . . . . . . . . . . . . . . .
AMR Uruguay Countrywide 2005 Survey 335 328 97.9 7 2.1 4 1.2 1 0.3 1 0.3 1 0.3 7 2.1 4 1.2 1 0.3 1 0.3 1 0.3 0 0.0 0 0.0 0 0.0 0 0.0 0 0.0 0 0.0 0 0.0 0 0.0 0 0.0 0 0.0 0 0.0 0 0.0 0 0.0
AMR USA Countrywide 2005 Surveillance combined only . . . . . . . . . . . . . . . . . . . . . . . .
AMR Venezuela Countrywide 1999 Survey 769 711 92.5 58 7.5 30 3.9 8 1.0 8 1.0 36 4.7 38 4.9 13 1.7 3 0.4 1 0.1 21 2.7 4 0.5 2 0.3 0 0.0 1 0.1 1 0.1 16 2.1 2 0.3 10 1.3 1 0.1 1 0.1 0 0.0 0 0.0 2 0.3
EMR Egypt Countrywide 2002 Survey 632 439 69.5 193 30.5 62 9.8 44 7.0 18 2.8 149 23.6 137 21.7 17 2.7 22 3.5 3 0.5 95 15.0 14 2.2 0 0.0 0 0.0 5 0.8 9 1.4 42 6.6 2 0.3 28 4.4 1 0.2 0 0.0 8 1.3 0 0.0 3 0.5
EMR Iran Countrywide 1998 Survey 666 560 84.1 106 15.9 65 9.8 41 6.2 31 4.7 65 9.8 54 8.1 18 2.7 6 0.9 2 0.3 28 4.2 33 5.0 8 1.2 1 0.2 6 0.9 18 2.7 19 2.9 5 0.8 8 1.2 1 0.2 1 0.2 1 0.2 0 0.0 3 0.5
EMR Jordan Countrywide 2004 Survey 111 75 67.6 36 32.4 10 9.0 13 11.7 11 9.9 25 22.5 23 20.7 1 0.9 4 3.6 2 1.8 16 14.4 6 5.4 1 0.9 1 0.9 1 0.9 3 2.7 7 6.3 1 0.9 1 0.9 1 0.9 1 0.9 1 0.9 1 0.9 1 0.9
EMR Lebanon Countrywide 2003 Survey 190 153 80.5 37 19.5 23 12.1 5 2.6 7 3.7 23 12.1 19 10.0 7 3.7 2 1.1 3 1.6 7 3.7 2 1.1 0 0.0 1 0.5 0 0.0 1 0.5 16 8.4 0 0.0 14 7.4 0 0.0 1 0.5 0 0.0 0 0.0 1 0.5
EMR Morocco Countrywide 2006 Survey 1049 976 93.0 73 7.0 43 4.1 8 0.8 2 0.2 56 5.3 43 4.1 14 1.3 2 0.2 0 0.0 27 2.6 5 0.5 1 0.1 0 0.0 3 0.3 1 0.1 25 2.4 0 0.0 23 2.2 1 0.1 0 0.0 1 0.1 0 0.0 0 0.0
EMR Oman Countrywide 2006 Surveillance 150 140 93.3 10 6.7 7 4.7 2 1.3 1 0.7 5 3.3 7 4.7 4 2.7 0 0.0 0 0.0 3 2.0 2 1.3 1 0.7 0 0.0 0 0.0 1 0.7 1 0.7 0 0.0 1 0.7 0 0.0 0 0.0 0 0.0 0 0.0 0 0.0
EMR Qatar Countrywide 2006 Surveillance combined only . . . . . . . . . . . . . . . . . . . . . . . .
EMR Yemen Countrywide 2004 Survey 510 461 90.4 49 9.6 20 3.9 15 2.9 15 2.9 40 7.8 33 6.5 4 0.8 0 0.0 2 0.4 27 5.3 15 2.9 1 0.2 1 0.2 2 0.4 11 2.2 1 0.2 1 0.2 0 0.0 0 0.0 0 0.0 0 0.0 0 0.0 0 0.0
EUR Andorra Countrywide 2005 Surveillance 9 8 88.9 1 11.1 1 11.1 0 0.0 0 0.0 1 11.1 0 0.0 0 0.0 0 0.0 0 0.0 0 0.0 0 0.0 0 0.0 0 0.0 0 0.0 0 0.0 1 11.1 0 0.0 1 11.1 0 0.0 0 0.0 0 0.0 0 0.0 0 0.0
EUR Armenia Countrywide 2007 Survey 552 345 62.5 207 37.5 150 27.2 60 10.9 24 4.3 160 29.0 90 16.3 34 6.2 7 1.3 1 0.2 48 8.7 52 9.4 4 0.7 0 0.0 37 6.7 11 2.0 65 11.8 1 0.2 52 9.4 11 2.0 0 0.0 1 0.2 0 0.0 0 0.0
EUR Austria Countrywide 2005 Surveillance 570 501 87.9 69 12.1 54 9.5 14 2.5 9 1.6 39 6.8 40 7.0 27 4.7 2 0.4 0 0.0 11 1.9 11 1.9 0 0.0 1 0.2 4 0.7 6 1.1 18 3.2 0 0.0 15 2.6 2 0.4 0 0.0 1 0.2 0 0.0 0 0.0
EUR Azerbaijan Baku City 2007 Survey 551 241 43.7 310 56.3 225 40.8 125 22.7 68 12.3 281 51.0 109 19.8 25 4.5 1 0.2 0 0.0 83 15.1 123 22.3 2 0.4 1 0.2 63 11.4 57 10.3 78 14.2 0 0.0 67 12.2 10 1.8 0 0.0 1 0.2 0 0.0 0 0.0
EUR Belgium Countrywide 2005 Surveillance 588 554 94.2 34 5.8 29 4.9 9 1.5 8 1.4 0 0.0 24 4.1 19 3.2 2 0.3 3 0.5 0 0.0 7 1.2 5 0.9 2 0.3 0 0.0 0 0.0 3 0.5 3 0.5 0 0.0 0 0.0 0 0.0 0 0.0 0 0.0 0 0.0
EUR Bosnia & Herzegovina Countrywide 2005 Surveillance 1035 1,020 98.6 15 1.4 8 0.8 7 0.7 3 0.3 4 0.4 10 1.0 3 0.3 3 0.3 1 0.1 3 0.3 4 0.4 3 0.3 0 0.0 0 0.0 1 0.1 1 0.1 1 0.1 0 0.0 0 0.0 0 0.0 0 0.0 0 0.0 0 0.0
EUR Croatia Countrywide 2005 Surveillance 586 569 97.1 17 2.9 12 2.0 6 1.0 3 0.5 8 1.4 10 1.7 8 1.4 0 0.0 0 0.0 2 0.3 3 0.5 0 0.0 1 0.2 2 0.3 0 0.0 4 0.7 0 0.0 1 0.2 0 0.0 0 0.0 1 0.2 2 0.3 0 0.0
EUR Czech Republic Countrywide 2005 Surveillance 562 519 92.3 43 7.7 21 3.7 8 1.4 4 0.7 34 6.0 29 5.2 8 1.4 0 0.0 1 0.2 20 3.6 7 1.2 0 0.0 0 0.0 4 0.7 3 0.5 7 1.2 0 0.0 6 1.1 0 0.0 0 0.0 1 0.2 0 0.0 0 0.0
EUR Denmark Countrywide 2005 Surveillance 307 290 94.5 17 5.5 15 4.9 5 1.6 6 2.0 0 0.0 12 3.9 10 3.3 0 0.0 2 0.7 0 0.0 5 1.6 1 0.3 4 1.3 0 0.0 0 0.0 0 0.0 0 0.0 0 0.0 0 0.0 0 0.0 0 0.0 0 0.0 0 0.0
EUR Estonia Countrywide 2005 Surveillance 316 225 71.2 91 28.8 65 20.6 42 13.3 42 13.3 83 26.3 34 10.8 8 2.5 0 0.0 0 0.0 26 8.2 42 13.3 0 0.0 0 0.0 3 0.9 39 12.3 15 4.7 0 0.0 12 3.8 3 0.9 0 0.0 0 0.0 0 0.0 0 0.0
EUR Finland Countrywide 2005 Surveillance 198 190 96.0 8 4.0 7 3.5 2 1.0 2 1.0 1 0.5 6 3.0 5 2.5 0 0.0 1 0.5 0 0.0 2 1.0 1 0.5 0 0.0 0 0.0 1 0.5 0 0.0 0 0.0 0 0.0 0 0.0 0 0.0 0 0.0 0 0.0 0 0.0
EUR France Countrywide 2005 Sentinel 1291 1,179 91.3 112 8.7 71 5.5 15 1.2 9 0.7 60 4.6 80 6.2 39 3.0 1 0.1 3 0.2 37 2.9 14 1.1 6 0.5 2 0.2 4 0.3 2 0.2 18 1.4 1 0.1 16 1.2 1 0.1 0 0.0 0 0.0 0 0.0 0 0.0
EUR Georgia Countrywide 2006 Survey 799 406 50.8 393 49.2 187 23.4 61 7.6 33 4.1 330 41.3 249 31.2 49 6.1 4 0.5 3 0.4 193 24.2 54 6.8 6 0.8 0 0.0 27 3.4 21 2.6 90 11.3 1 0.1 78 9.8 5 0.6 0 0.0 3 0.4 0 0.0 3 0.4
EUR Germany Countrywide 2005 Surveillance 3094 2,755 89.0 339 11.0 225 7.3 68 2.2 55 1.8 229 7.4 195 6.3 85 2.7 8 0.3 6 0.2 96 3.1 57 1.8 6 0.2 2 0.1 20 0.6 29 0.9 87 2.8 1 0.0 68 2.2 14 0.5 2 0.1 0 0.0 0 0.0 1 0.0
EUR Iceland Countrywide 2005 Surveillance 7 7 100 0 0.0 0 0.0 0 0.0 0 0.0 0 0.0 0 0.0 0 0.0 0 0.0 0 0.0 0 0.0 0 0.0 0 0.0 0 0.0 0 0.0 0 0.0 0 0.0 0 0.0 0 0.0 0 0.0 0 0.0 0 0.0 0 0.0 0 0.0
EUR Ireland Countrywide 2005 Surveillance 200 194 97.0 6 3.0 6 3.0 1 0.5 1 0.5 1 0.5 5 2.5 5 2.5 0 0.0 0 0.0 0 0.0 1 0.5 0 0.0 0 0.0 0 0.0 1 0.5 0 0.0 0 0.0 0 0.0 0 0.0 0 0.0 0 0.0 0 0.0 0 0.0
EUR Israel Countrywide 2005 Surveillance 211 165 78.2 46 21.8 32 15.2 12 5.7 13 6.2 41 19.4 15 7.1 2 0.9 0 0.0 1 0.5 12 5.7 12 5.7 1 0.5 1 0.5 2 0.9 8 3.8 19 9.0 0 0.0 16 7.6 2 0.9 0 0.0 0 0.0 0 0.0 1 0.5
EUR Italy Half of the country 2005 Surveillance 485 438 90.3 47 9.7 30 6.2 11 2.3 4 0.8 29 6.0 30 6.2 15 3.1 1 0.2 0 0.0 14 2.9 8 1.6 2 0.4 0 0.0 3 0.6 3 0.6 9 1.9 0 0.0 6 1.2 1 0.2 0 0.0 2 0.4 0 0.0 0 0.0
EUR Kazakhstan Countrywide 2001 Survey 359 154 42.9 205 57.1 153 42.6 56 15.6 89 24.8 185 51.5 50 13.9 11 3.1 1 0.3 3 0.8 35 9.7 51 14.2 2 0.6 0 0.0 17 4.7 32 8.9 104 29.0 2 0.6 50 13.9 39 10.9 1 0.3 0 0.0 3 0.8 9 2.5
EUR Latvia Countrywide 2005 Surveillance 873 560 64.1 313 35.9 270 30.9 94 10.8 92 10.5 273 31.3 80 9.2 37 4.2 0 0.0 1 0.1 42 4.8 94 10.8 1 0.1 1 0.1 10 1.1 82 9.4 139 15.9 0 0.0 131 15.0 8 0.9 0 0.0 0 0.0 0 0.0 0 0.0

Regio
n
Countr
y
Sub-n
ational
Year
Meth
od
Patients
teste
d
Susceptible
%
Any
resis
tance
%
Any H
%
Any R
%
Any E
%
Any S
%
Mono
%
Mono H
%
Mono R
%
Mono E
%
Mono S
%
MD
R
% HR %
HR
E
%
HR
S
%
HR
ES
%
Poly
% HE % HS %
HE
S
% RE % RS %
RE
S
% ES %
EUR Lithuania Countrywide 2005 Surveillance 1293 980 75.8 313 24.2 262 20.3 128 9.9 234 18.1 62 4.8 109 8.4 60 4.6 0 0.0 49 3.8 0 0.0 127 9.8 14 1.1 60 4.6 2 0.2 51 3.9 77 6.0 68 5.3 3 0.2 4 0.3 0 0.0 0 0.0 1 0.1 1 0.1
EUR Luxembourg Countrywide 2005 Surveillance 36 32 88.9 4 11.1 3 8.3 0 0.0 0 0.0 2 5.6 3 8.3 2 5.6 0 0.0 0 0.0 1 2.8 0 0.0 0 0.0 0 0.0 0 0.0 0 0.0 1 2.8 0 0.0 1 2.8 0 0.0 0 0.0 0 0.0 0 0.0 0 0.0
EUR Malta Countrywide 2005 Surveillance 11 9 81.8 2 18.2 0 0.0 0 0.0 0 0.0 2 18.2 2 18.2 0 0.0 0 0.0 0 0.0 2 18.2 0 0.0 0 0.0 0 0.0 0 0.0 0 0.0 0 0.0 0 0.0 0 0.0 0 0.0 0 0.0 0 0.0 0 0.0 0 0.0
EUR Netherlands Countrywide 2005 Surveillance 709 650 91.7 59 8.3 46 6.5 10 1.4 3 0.4 26 3.7 39 5.5 26 3.7 5 0.7 0 0.0 8 1.1 5 0.7 1 0.1 1 0.1 1 0.1 2 0.3 15 2.1 0 0.0 15 2.1 0 0.0 0 0.0 0 0.0 0 0.0 0 0.0
EUR Norway Countrywide 2005 Surveillance 193 150 77.7 43 22.3 20 10.4 3 1.6 4 2.1 31 16.1 32 16.6 9 4.7 0 0.0 3 1.6 20 10.4 3 1.6 0 0.0 0 0.0 3 1.6 0 0.0 8 4.1 0 0.0 7 3.6 1 0.5 0 0.0 0 0.0 0 0.0 0 0.0
EUR Poland Countrywide 2004 Surveillance 2716 2,564 94.4 152 5.6 91 3.4 15 0.6 4 0.1 76 2.8 125 4.6 65 2.4 6 0.2 2 0.1 52 1.9 8 0.3 3 0.1 0 0.0 3 0.1 2 0.1 19 0.7 0 0.0 18 0.7 0 0.0 0 0.0 1 0.0 0 0.0 0 0.0
EUR Portugal Countrywide 2005 Surveillance 1407 1,204 85.6 203 14.4 91 6.5 14 1.0 18 1.3 145 10.3 151 10.7 42 3.0 1 0.1 9 0.6 99 7.0 12 0.9 3 0.2 2 0.1 4 0.3 3 0.2 40 2.8 1 0.1 35 2.5 1 0.1 0 0.0 1 0.1 0 0.0 2 0.1
EUR Republic of Moldova Countrywide 2006 Surveillance 825 471 57.1 354 42.9 257 31.2 171 20.7 107 13.0 280 33.9 118 14.3 30 3.6 6 0.7 13 1.6 69 8.4 160 19.4 14 1.7 75 9.1 2 0.2 69 8.4 76 9.2 9 1.1 48 5.8 10 1.2 0 0.0 5 0.6 0 0.0 4 0.5
EUR Romania Countrywide 2004 Surveillance 849 727 85.6 122 14.4 71 8.4 41 4.8 19 2.2 64 7.5 76 9.0 31 3.7 13 1.5 2 0.2 30 3.5 24 2.8 9 1.1 2 0.2 4 0.5 9 1.1 22 2.6 1 0.1 13 1.5 2 0.2 0 0.0 3 0.4 1 0.1 2 0.2
EUR Russian Federation Ivanovo Oblast 2002 Surveillance 350 197 56.3 153 43.7 109 31.1 47 13.4 41 11.7 144 41.1 41 11.7 5 1.4 1 0.3 0 0.0 35 10.0 43 12.3 0 0.0 1 0.3 15 4.3 27 7.7 69 19.7 2 0.6 54 15.4 7 2.0 0 0.0 2 0.6 1 0.3 3 0.9
EUR Russian Federation Orel Oblast 2006 Surveillance 317 230 72.6 87 27.4 64 20.2 30 9.5 14 4.4 76 24.0 27 8.5 5 1.6 1 0.3 0 0.0 21 6.6 28 8.8 3 0.9 1 0.3 14 4.4 10 3.2 32 10.1 1 0.3 28 8.8 2 0.6 0 0.0 1 0.3 0 0.0 0 0.0
EUR Russian Federation Mary El oblast 2006 Surveillance 304 213 70.1 91 29.9 79 26.0 38 12.5 39 12.8 78 25.7 18 5.9 38 12.5 35 11.5
EUR Russian Federation Tomsk Oblast 2005 Surveillance 515 333 64.7 182 35.3 136 26.4 86 16.7 33 6.4 167 32.4 50 9.7 12 2.3 1 0.2 0 0.0 37 7.2 77 15.0 2 0.4 0 0.0 45 8.7 30 5.8 55 10.7 0 0.0 45 8.7 2 0.4 0 0.0 7 1.4 1 0.2 0 0.0
EUR Serbia Countrywide 2005 Surveillance 1112 1,079 97.0 33 3.0 9 0.8 9 0.8 7 0.6 22 2.0 23 2.1 3 0.3 3 0.3 0 0.0 17 1.5 4 0.4 2 0.2 1 0.1 0 0.0 1 0.1 6 0.5 2 0.2 0 0.0 0 0.0 0 0.0 1 0.1 1 0.1 2 0.2
EUR Slovakia Countrywide 2005 Surveillance 248 230 92.7 18 7.3 13 5.2 7 2.8 0 0.0 9 3.6 9 3.6 6 2.4 1 0.4 0 0.0 2 0.8 4 1.6 2 0.8 0 0.0 2 0.8 0 0.0 5 2.0 0 0.0 3 1.2 0 0.0 0 0.0 2 0.8 0 0.0 0 0.0
EUR Slovenia Countrywide 2005 Surveillance 217 207 95.4 10 4.6 7 3.2 0 0.0 0 0.0 4 1.8 9 4.1 6 2.8 0 0.0 0 0.0 3 1.4 0 0.0 0 0.0 0 0.0 0 0.0 0 0.0 1 0.5 0 0.0 1 0.5 0 0.0 0 0.0 0 0.0 0 0.0 0 0.0
EUR Spain Galicia 2005 Surveillance 566 529 93.5 37 6.5 20 3.5 1 0.2 0 0.0 22 3.9 31 5.5 14 2.5 0 0.0 0 0.0 17 3.0 1 0.2 1 0.2 0 0.0 0 0.0 0 0.0 5 0.9 0 0.0 5 0.9 0 0.0 0 0.0 0 0.0 0 0.0 0 0.0
EUR Spain Aragon 2005 Surveillance 200 187 93.5 13 6.5 11 5.5 1 0.5 1 0.5 2 1.0 11 5.5 9 4.5 1 0.5 0 0.0 1 0.5 0 0.0 0 0.0 0 0.0 0 0.0 0 0.0 2 1.0 1 0.5 1 0.5 0 0.0 0 0.0 0 0.0 0 0.0 0 0.0
EUR Spain Barcelona 2005 Surveillance combined only . . . . . . . . . . . . . . . . . . . . . . . .
EUR Sweden Countrywide 2005 Surveillance 425 373 87.8 52 12.2 42 9.9 3 0.7 2 0.5 9 2.1 50 11.8 40 9.4 1 0.2 1 0.2 8 1.9 2 0.5 1 0.2 0 0.0 0 0.0 1 0.2 0 0.0 0 0.0 0 0.0 0 0.0 0 0.0 0 0.0 0 0.0 0 0.0
EUR Switzerland Countrywide 2005 Surveillance 326 311 95.4 15 4.6 14 4.3 3 0.9 0 0.0 0 0.0 13 4.0 12 3.7 1 0.3 0 0.0 0 0.0 2 0.6 2 0.6 0 0.0 0 0.0 0 0.0 0 0.0 0 0.0 0 0.0 0 0.0 0 0.0 0 0.0 0 0.0 0 0.0
EUR Turkmenistan Dashoguz Velayat (Aral Sea Region) 2002 Survey 105 73 69.5 32 30.5 16 15.2 4 3.8 2 1.9 26 24.8 22 21.0 6 5.7 0 0.0 0 0.0 16 15.2 4 3.8 0 0.0 0 0.0 3 2.9 1 1.0 6 5.7 0 0.0 5 4.8 1 1.0 0 0.0 0 0.0 0 0.0 0 0.0
EUR Ukraine Donetsk 2006 Survey 1003 604 60.2 399 39.8 311 31.0 180 17.9 30 3.0 284 28.3 148 14.8 69 6.9 12 1.2 1 0.1 66 6.6 160 16.0 24 2.4 6 0.6 115 11.5 15 1.5 91 9.1 3 0.3 75 7.5 4 0.4 0 0.0 8 0.8 0 0.0 1 0.1
EUR United Kingdom Countrywide 2005 Surveillance 3428 3,183 92.9 245 7.1 230 6.7 34 1.0 13 0.4 3 0.1 217 6.3 202 5.9 11 0.3 3 0.1 1 0.0 23 0.7 16 0.5 7 0.2 0 0.0 0 0.0 5 0.1 3 0.1 2 0.1 0 0.0 0 0.0 0 0.0 0 0.0 0 0.0
EUR Uzbekistan Tashkent 2005 Survey 203 99 48.8 104 51.2 86 42.4 32 15.8 25 12.3 88 43.3 31 15.3 14 6.9 1 0.5 0 0.0 16 7.9 30 14.8 1 0.5 0 0.0 10 4.9 19 9.4 43 21.2 0 0.0 36 17.7 6 3.0 0 0.0 1 0.5 0 0.0 0 0.0
SEAR India Mayhurbhanj District, Orissa State 2001 Survey 282 267 94.7 15 5.3 7 2.5 2 0.7 1 0.4 11 3.9 11 3.9 3 1.1 0 0.0 0 0.0 8 2.8 2 0.7 1 0.4 0 0.0 0 0.0 1 0.4 2 0.7 0 0.0 2 0.7 0 0.0 0 0.0 0 0.0 0 0.0 0 0.0
SEAR India Wardha District, Maharashtra State 2001 Survey 197 158 80.2 39 19.8 30 15.2 1 0.5 2 1.0 15 7.6 30 15.2 21 10.7 0 0.0 0 0.0 9 4.6 1 0.5 1 0.5 0 0.0 0 0.0 0 0.0 8 4.1 2 1.0 6 3.0 0 0.0 0 0.0 0 0.0 0 0.0 0 0.0
SEAR India Delhi State 1995 Survey combined only . . . . . . . . . . . . . . . . . . . . . . . .
SEAR India Raichur District, Karnataka State 1999 Survey 278 217 78.1 61 21.9 52 18.7 7 2.5 9 3.2 20 7.2 43 15.5 34 12.2 0 0.0 0 0.0 9 3.2 7 2.5 2 0.7 2 0.7 1 0.4 2 0.7 11 4.0 3 1.1 6 2.2 2 0.7 0 0.0 0 0.0 0 0.0 0 0.0
SEAR India North Arcot District, Tamil Nadu State 1999 Survey 282 204 72.3 78 27.7 66 23.4 8 2.8 13 4.6 35 12.4 47 16.7 36 12.8 0 0.0 1 0.4 10 3.5 8 2.8 0 0.0 2 0.7 4 1.4 2 0.7 23 8.2 4 1.4 15 5.3 3 1.1 0 0.0 0 0.0 0 0.0 1 0.4
SEAR India Ernakulam district, Kerala State 2004 Survey 305 220 72.1 85 27.9 27 8.9 11 3.6 8 2.6 72 23.6 64 21.0 8 2.6 3 1.0 0 0.0 53 17.4 6 2.0 0 0.0 2 0.7 1 0.3 3 1.0 15 4.9 0 0.0 10 3.3 3 1.0 0 0.0 2 0.7 0 0.0 0 0.0
SEAR India Gujarat State 2006 Survey 1571 1,236 78.7 335 21.3 173 11.0 40 2.5 30 1.9 228 14.5 246 15.7 84 5.3 3 0.2 3 0.2 156 9.9 37 2.4 7 0.4 7 0.4 10 0.6 13 0.8 52 3.3 3 0.2 45 2.9 4 0.3 0 0.0 0 0.0 0 0.0 0 0.0
SEAR India Tamil Nadu State 1997 Survey 384 312 81.3 72 18.8 59 15.4 17 4.4 27 7.0 26 6.8 40 10.4 29 7.6 2 0.5 2 0.5 7 1.8 13 3.4 2 0.5 4 1.0 0 0.0 7 1.8 19 4.9 7 1.8 5 1.3 5 1.3 0 0.0 0 0.0 2 0.5 0 0.0
SEAR India Hoogli district, West Bengal State 2001 Survey 263 219 83.3 44 16.7 27 10.3 8 3.0 5 1.9 36 13.7 23 8.7 6 2.3 0 0.0 0 0.0 17 6.5 8 3.0 1 0.4 0 0.0 4 1.5 3 1.1 13 4.9 1 0.4 11 4.2 1 0.4 0 0.0 0 0.0 0 0.0 0 0.0
SEAR Indonesia Mimika district, Papua Province 2004 Survey 101 87 86.1 14 13.9 13 12.9 2 2.0 2 2.0 9 8.9 4 4.0 3 3.0 0 0.0 0 0.0 1 1.0 2 2.0 0 0.0 2 2.0 0 0.0 0 0.0 8 7.9 0 0.0 8 7.9 0 0.0 0 0.0 0 0.0 0 0.0 0 0.0
SEAR Myanmar Countrywide 2003 Survey 733 660 90.0 73 10.0 48 6.5 34 4.6 9 1.2 50 6.8 27 3.7 7 1.0 0 0.0 0 0.0 20 2.7 29 4.0 11 1.5 3 0.4 11 1.5 4 0.5 17 2.3 1 0.1 11 1.5 0 0.0 1 0.1 4 0.5 0 0.0 0 0.0
SEAR Nepal Countrywide 2007 Survey 766 653 85.2 113 14.8 64 8.4 22 2.9 29 3.8 82 10.7 70 9.1 21 2.7 0 0.0 4 0.5 45 5.9 22 2.9 1 0.1 3 0.4 4 0.5 14 1.8 21 2.7 2 0.3 13 1.7 6 0.8 0 0.0 0 0.0 0 0.0 0 0.0
SEAR Sri Lanka Countrywide 2006 Survey 561 553 98.6 8 1.4 4 0.7 3 0.5 1 0.2 4 0.7 6 1.1 2 0.4 2 0.4 0 0.0 2 0.4 1 0.2 0 0.0 0 0.0 0 0.0 1 0.2 1 0.2 0 0.0 1 0.2 0 0.0 0 0.0 0 0.0 0 0.0 0 0.0
SEAR Thailand Countrywide 2006 Survey 1150 970 84.3 180 15.7 111 9.7 30 2.6 20 1.7 91 7.9 132 11.5 65 5.7 10 0.9 5 0.4 52 4.5 19 1.7 3 0.3 3 0.3 6 0.5 7 0.6 29 2.5 3 0.3 23 2.0 1 0.1 0 0.0 1 0.1 0 0.0 1 0.1
WPR Australia Countrywide 2005 Surveillance combined only . . . . . . . . . . . . . . . . . . . . . . . .
WPR Cambodia Countrywide 2001 Survey 638 572 89.7 66 10.3 41 6.4 4 0.6 1 0.2 32 5.0 54 8.5 30 4.7 3 0.5 0 0.0 21 3.3 0 0.0 0 0.0 0 0.0 0 0.0 0 0.0 12 1.9 1 0.2 10 1.6 0 0.0 0 0.0 1 0.2 0 0.0 0 0.0
WPR China Guandong Province 1999 Survey 461 401 87.0 60 13.0 43 9.3 16 3.5 11 2.4 28 6.1 37 8.0 22 4.8 2 0.4 0 0.0 13 2.8 13 2.8 4 0.9 2 0.4 2 0.4 5 1.1 10 2.2 1 0.2 6 1.3 1 0.2 1 0.2 0 0.0 0 0.0 1 0.2
WPR China Beijing Municipality 2004 Survey 1043 856 82.1 187 17.9 91 8.7 44 4.2 43 4.1 95 9.1 113 10.8 35 3.4 11 1.1 14 1.3 53 5.1 24 2.3 15 1.4 1 0.1 5 0.5 3 0.3 50 4.8 11 1.1 21 2.0 0 0.0 5 0.5 4 0.4 0 0.0 9 0.9
WPR China Shandong Province 1997 Survey 1009 831 82.4 178 17.6 114 11.3 38 3.8 17 1.7 123 12.2 99 9.8 38 3.8 6 0.6 1 0.1 54 5.4 29 2.9 4 0.4 2 0.2 14 1.4 9 0.9 50 5.0 3 0.3 43 4.3 1 0.1 1 0.1 2 0.2 0 0.0 0 0.0
WPR China Henan Province 2001 Survey 1222 858 70.2 364 29.8 208 17.0 117 9.6 53 4.3 271 22.2 190 15.5 40 3.3 17 1.4 10 0.8 123 10.1 95 7.8 18 1.5 5 0.4 47 3.8 25 2.0 79 6.5 2 0.2 62 5.1 9 0.7 1 0.1 4 0.3 0 0.0 1 0.1
WPR China (3) Liaoning Province 1999 Survey 818 474 57.9 344 42.1 207 25.3 93 11.4 31 3.8 279 34.1 177 21.6 44 5.4 4 0.5 2 0.2 127 15.5 85 10.4 10 1.2 2 0.2 54 6.6 19 2.3 82 10.0 2 0.2 71 8.7 5 0.6 1 0.1 3 0.4 0 0.0 0 0.0
WPR China Heilongjiang Province 2005 Survey 1574 1,005 63.9 569 36.1 268 17.0 167 10.6 93 5.9 383 24.3 340 21.6 61 3.9 34 2.2 3 0.2 242 15.4 113 7.2 24 1.5 63 4.0 4 0.3 22 1.4 116 7.4 0 0.0 93 5.9 1 0.1 1 0.1 18 1.1 1 0.1 2 0.1
WPR China Hubei Province 1999 Survey 859 709 82.5 150 17.5 83 9.7 33 3.8 5 0.6 98 11.4 94 10.9 32 3.7 10 1.2 1 0.1 51 5.9 18 2.1 6 0.7 2 0.2 9 1.0 1 0.1 38 4.4 1 0.1 32 3.7 0 0.0 0 0.0 5 0.6 0 0.0 0 0.0
WPR China Zhejiang Province 1999 Survey 802 683 85.2 119 14.8 71 8.9 52 6.5 12 1.5 72 9.0 67 8.4 22 2.7 13 1.6 2 0.2 30 3.7 36 4.5 10 1.2 0 0.0 17 2.1 9 1.1 16 2.0 0 0.0 12 1.5 1 0.1 0 0.0 3 0.4 0 0.0 0 0.0
WPR China Shanghai Municipality 2005 Survey 764 646 84.6 118 15.4 85 11.1 37 4.8 23 3.0 62 8.1 57 7.5 25 3.3 6 0.8 0 0.0 26 3.4 30 3.9 7 0.9 17 2.2 1 0.1 5 0.7 31 4.1 1 0.1 29 3.8 0 0.0 0 0.0 1 0.1 0 0.0 0 0.0
WPR China Inner Mongolia Autonomous region 2002 Survey 806 524 65.0 282 35.0 164 20.3 79 9.8 72 8.9 172 21.3 148 18.4 40 5.0 13 1.6 5 0.6 90 11.2 59 7.3 13 1.6 29 3.6 4 0.5 13 1.6 75 9.3 9 1.1 44 5.5 12 1.5 1 0.1 6 0.7 0 0.0 3 0.4
WPR China, Hong Kong SAR Hong Kong 2005 Surveillance 3271 2,909 88.9 362 11.1 164 5.0 36 1.1 27 0.8 274 8.4 262 8.0 66 2.0 7 0.2 1 0.0 188 5.7 28 0.9 5 0.2 3 0.1 9 0.3 11 0.3 72 2.2 5 0.2 60 1.8 5 0.2 1 0.0 0 0.0 0 0.0 1 0.0
WPR China, Macao SAR Macao 2005 Surveillance 265 223 84.2 42 15.8 28 10.6 7 2.6 4 1.5 27 10.2 28 10.6 14 5.3 1 0.4 0 0.0 13 4.9 6 2.3 0 0.0 0 0.0 3 1.1 3 1.1 8 3.0 0 0.0 7 2.6 1 0.4 0 0.0 0 0.0 0 0.0 0 0.0
WPR Fiji Countrywide 2006 Surveillance combined only . . . . . . . . . . . . . . . . . . . . . . . .
WPR Guam Countrywide 2002 Survey combined only . . . . . . . . . . . . . . . . . . . . . . . .
WPR Japan Countrywide 2002 Surveillance 2705 2,472 91.4 233 8.6 77 2.8 28 1.0 23 0.9 188 7.0 184 6.8 33 1.2 5 0.2 2 0.1 144 5.3 19 0.7 2 0.1 3 0.1 3 0.1 11 0.4 30 1.1 0 0.0 21 0.8 4 0.1 0 0.0 2 0.1 2 0.1 1 0.0
WPR Malaysia Peninsular Malaysia 1997 Survey 1001 953 95.2 48 4.8 16 1.6 5 0.5 5 0.5 30 3.0 42 4.2 10 1.0 4 0.4 4 0.4 24 2.4 1 0.1 0 0.0 0 0.0 0 0.0 1 0.1 5 0.5 0 0.0 5 0.5 0 0.0 0 0.0 0 0.0 0 0.0 0 0.0
WPR Mongolia Countrywide 1999 Survey 405 286 70.6 119 29.4 62 15.3 5 1.2 7 1.7 98 24.2 74 18.3 18 4.4 1 0.2 0 0.0 55 13.6 4 1.0 1 0.2 0 0.0 1 0.2 2 0.5 41 10.1 1 0.2 36 8.9 3 0.7 0 0.0 0 0.0 0 0.0 1 0.2
WPR New Caledonia Countrywide 2005 Survey combined only . . . . . . . . . . . . . . . . . . . . . . . .
WPR New Zealand Countrywide 2006 Surveillance 250 224 89.6 26 10.4 17 6.8 1 0.4 1 0.4 18 7.2 17 6.8 8 3.2 0 0.0 0 0.0 9 3.6 1 0.4 0 0.0 0 0.0 0 0.0 1 0.4 8 3.2 0 0.0 8 3.2 0 0.0 0 0.0 0 0.0 0 0.0 0 0.0
WPR Northern Mariana Is Countrywide 2006 Surveillance 18 4 22.2 4 22.2 3 16.7 2 11.1 0 0.0 2 11.1 1 5.6 0 0.0 0 0.0 0 0.0 1 5.6 2 11.1 2 11.1 0 0.0 0 0.0 0 0.0 1 5.6 0 0.0 1 5.6 0 0.0 0 0.0 0 0.0 0 0.0 0 0.0
WPR Philippines Countrywide 2004 Survey 965 767 79.5 198 20.5 130 13.5 44 4.6 41 4.2 115 11.9 122 12.6 57 5.9 4 0.4 1 0.1 60 6.2 39 4.0 10 1.0 5 0.5 5 0.5 19 2.0 37 3.8 5 0.5 21 2.2 8 0.8 1 0.1 0 0.0 0 0.0 2 0.2
WPR Rep. Korea Countrywide 2004 Survey 2636 2,315 87.8 321 12.2 261 9.9 98 3.7 70 2.7 70 2.7 203 7.7 145 5.5 25 0.9 7 0.3 26 1.0 71 2.7 24 0.9 33 1.3 4 0.2 10 0.4 47 1.8 16 0.6 26 1.0 3 0.1 1 0.0 1 0.0 0 0.0 0 0.0
WPR Singapore Countrywide 2005 Surveillance 895 837 93.5 58 6.5 30 3.4 5 0.6 7 0.8 35 3.9 44 4.9 16 1.8 3 0.3 2 0.2 23 2.6 2 0.2 0 0.0 0 0.0 0 0.0 2 0.2 12 1.3 2 0.2 9 1.0 1 0.1 0 0.0 0 0.0 0 0.0 0 0.0
WPR Solomon Islands Countrywide 2004 Survey combined only . . . . . . . . . . . . . . . . . . . . . . . .
WPR Vanuatu Countrywide 2006 Surveillance 29 28 96.6 1 3.4 1 3.4 0 0.0 0 0.0 0 0.0 1 3.4 1 3.4 0 0.0 0 0.0 0 0.0 0 0.0 0 0.0 0 0.0 0 0.0 0 0.0 0 0.0 0 0.0 0 0.0 0 0.0 0 0.0 0 0.0 0 0.0 0 0.0
WPR Viet Nam Countrywide 2006 Survey 1619 1,122 69.3 497 30.7 310 19.1 53 3.3 42 2.6 375 23.2 291 18.0 114 7.0 5 0.3 3 0.2 169 10.4 44 2.7 0 0.0 0 0.0 20 1.2 24 1.5 162 10.0 0 0.0 143 8.8 9 0.6 0 0.0 4 0.2 0 0.0 6 0.4
(1) Several countries conducting routine diagnostic surveillance do not routinely test for streptomycin. Where this is the case the proportion tested is indicated in a footnote.
(2) Data from UR Tanzania and Madagascar are preliminary
(3) Based on patient re-interviews it is expected that between 20-30% of resistant cases may have been classified as new when in fact they had been treated previously. Therefore, MDR among new cases could be reduced from 10% to 8%. The reduction would be

Annex 2. Notified prevalence of resistance to specific drugs among previously treated TB cases tested for resistance to at least INH and RIF (1)Region
Country
Sub-national
Year
Method
Patients
tested
Susceptible
%
Any
resistance
%
Any H
%
Any R
%
Any E
%
Any S
%
Mono
%
Mono H
%
Mono R
%
Mono E
%
Mono S
%
MDR
% HR %
HRE
%
HRS
%
HRES
%
Poly
% HE % HS %
HES
% RE % RS %
RES
% ES %
AFR Algeria Countrywide 2001 Survey new only . . . . . . . . . . . . . . . . . . . . . . . .
AFR Benin Countrywide 1997 Survey new only . . . . . . . . . . . . . . . . . . . . . . . .
AFR Botswana Countrywide 2002 Survey 106 82 77.4 24 22.6 15 14.2 13 12.3 9 8.5 17 16.0 7 6.6 0 0.0 0 0.0 2 1.9 5 4.7 11 10.4 3 2.8 2 1.9 1 0.9 5 4.7 6 5.7 0 0.0 4 3.8 0 0.0 0 0.0 2 1.9 0 0.0 0 0.0
AFR Central African Republic Bangui 1998 Survey 33 21 63.6 12 36.4 10 30.3 7 21.2 6 18.2 4 12.1 4 12.1 3 9.1 0 0.0 0 0.0 1 3.0 6 18.2 0 0.0 3 9.1 2 6.1 1 3.0 2 6.1 1 3.0 0 0.0 0 0.0 1 3.0 0 0.0 0 0.0 0 0.0
AFR Côte d'Ivoire Countrywide 2006 Survey new only . . . . . . . . . . . . . . . . . . . . . . . .
AFR DR Congo Kinshasa 1999 Survey combined only . . . . . . . . . . . . . . . . . . . . . . . .
AFR Ethiopia Countrywide 2005 Survey 76 39 51.3 37 48.7 19 25.0 11 14.5 11 14.5 29 38.2 21 27.6 4 5.3 1 1.3 0 0.0 16 21.1 9 11.8 0 0.0 3 3.9 0 0.0 6 7.9 7 9.2 0 0.0 5 6.6 1 1.3 0 0.0 0 0.0 1 1.3 0 0.0
AFR Gambia Countrywide 2000 Survey 15 15 100.0 0 0.0 0 0.0 0 0.0 0 0.0 0 0.0 0 0.0 0 0.0 0 0.0 0 0.0 0 0.0 0 0.0 0 0.0 0 0.0 0 0.0 0 0.0 0 0.0 0 0.0 0 0.0 0 0.0 0 0.0 0 0.0 0 0.0 0 0.0
AFR Guinea Sentinel sites 1998 Survey 32 16 50.0 16 50.0 16 50.0 9 28.1 6 18.8 11 34.4 3 9.4 3 9.4 0 0.0 0 0.0 0 0.0 9 28.1 1 3.1 1 3.1 3 9.4 4 12.5 4 12.5 0 0.0 3 9.4 1 3.1 0 0.0 0 0.0 0 0.0 0 0.0
AFR Kenya Nearly Countrywide 1995 Survey 46 29 63.0 17 37.0 17 37.0 0 0.0 0 0.0 3 6.5 14 30.4 14 30.4 0 0.0 0 0.0 0 0.0 0 0.0 0 0.0 0 0.0 0 0.0 0 0.0 3 6.5 0 0.0 3 6.5 0 0.0 0 0.0 0 0.0 0 0.0 0 0.0
AFR Lesotho Countrywide 1995 Survey 53 35 66.0 18 34.0 16 30.2 3 5.7 2 3.8 9 17.0 11 20.8 9 17.0 0 0.0 0 0.0 2 3.8 3 5.7 0 0.0 0 0.0 2 3.8 1 1.9 4 7.5 0 0.0 3 5.7 1 1.9 0 0.0 0 0.0 0 0.0 0 0.0
AFR Madagascar (2) Countrywide 2007 Survey 51 45 88.2 6 11.8 5 9.8 3 5.9 0 0.0 2 3.9 2 3.9 2 3.9 0 0.0 0 0.0 0 0.0 2 3.9 2 3.9 0 0.0 0 0.0 0 0.0 2 3.9 0 0.0 1 2.0 0 0.0 0 0.0 1 2.0 0 0.0 0 0.0
AFR Mozambique Countrywide 1999 Survey 122 67 54.9 55 45.1 50 41.0 5 4.1 1 0.8 30 24.6 27 22.1 22 18.0 1 0.8 0 0.0 4 3.3 4 3.3 2 1.6 0 0.0 1 0.8 1 0.8 24 19.7 0 0.0 24 19.7 0 0.0 0 0.0 0 0.0 0 0.0 0 0.0
AFR Rwanda Countrywide 2005 Survey 85 66 77.6 19 22.4 9 10.6 9 10.6 10 11.8 16 18.8 10 11.8 0 0.0 1 1.2 2 2.4 7 8.2 8 9.4 0 0.0 0 0.0 0 0.0 8 9.4 1 1.2 0 0.0 1 1.2 0 0.0 0 0.0 0 0.0 0 0.0 0 0.0
AFR Senegal Countrywide 2006 Survey 42 29 69.0 13 31.0 10 23.8 7 16.7 7 16.7 12 28.6 4 9.5 1 2.4 0 0.0 0 0.0 3 7.1 7 16.7 0 0.0 0 0.0 1 2.4 6 14.3 2 4.8 0 0.0 1 2.4 1 2.4 0 0.0 0 0.0 0 0.0 0 0.0
AFR Sierra Leone Nearly Countrywide 1997 Survey 13 5 38.5 8 61.5 8 61.5 3 23.1 1 7.7 3 23.1 4 30.8 4 30.8 0 0.0 0 0.0 0 0.0 3 23.1 0 0.0 0 0.0 3 23.1 0 0.0 1 7.7 1 7.7 0 0.0 0 0.0 0 0.0 0 0.0 0 0.0 0 0.0
AFR South Africa Countrywide 2002 Survey 1465 1,235 84.3 230 15.7 173 11.8 116 7.9 41 2.8 120 8.2 97 6.6 41 2.8 17 1.2 1 0.1 38 2.6 98 6.7 38 2.6 9 0.6 26 1.8 25 1.7 35 2.4 3 0.2 29 2.0 2 0.1 1 0.1 0 0.0 0 0.0 0 0.0
AFR Swaziland Countrywide 1995 Survey 44 35 79.5 9 20.5 6 13.6 4 9.1 2 4.5 7 15.9 4 9.1 1 2.3 0 0.0 0 0.0 3 6.8 4 9.1 1 2.3 0 0.0 1 2.3 2 4.5 1 2.3 0 0.0 1 2.3 0 0.0 0 0.0 0 0.0 0 0.0 0 0.0
AFR Uganda 3 GLRA Zones * 1997 Survey 45 22 48.9 23 51.1 17 37.8 2 4.4 5 11.1 10 22.2 13 28.9 8 17.8 0 0.0 3 6.7 2 4.4 2 4.4 1 2.2 0 0.0 1 2.2 0 0.0 8 17.8 1 2.2 6 13.3 0 0.0 0 0.0 0 0.0 0 0.0 1 2.2
AFR UR Tanzania (2) Countrywide 2007 Survey 49 41 83.7 8 16.3 8 16.3 0 0.0 2 4.1 2 4.1 5 10.2 5 10.2 0 0.0 0 0.0 0 0.0 0 0.0 0 0.0 0 0.0 0 0.0 0 0.0 3 6.1 1 2.0 1 2.0 1 2.0 0 0.0 0 0.0 0 0.0 0 0.0
AFR Zambia Countrywide 2000 Survey 44 38 86.4 6 13.6 3 6.8 1 2.3 1 2.3 2 4.5 5 11.4 2 4.5 0 0.0 1 2.3 2 4.5 1 2.3 1 2.3 0 0.0 0 0.0 0 0.0 0 0.0 0 0.0 0 0.0 0 0.0 0 0.0 0 0.0 0 0.0 0 0.0
AFR Zimbabwe Nearly Countrywide 1995 Survey 36 31 86.1 5 13.9 5 13.9 3 8.3 0 0.0 1 2.8 2 5.6 2 5.6 0 0.0 0 0.0 0 0.0 3 8.3 2 5.6 0 0.0 1 2.8 0 0.0 0 0.0 0 0.0 0 0.0 0 0.0 0 0.0 0 0.0 0 0.0 0 0.0
AMR Argentina Countrywide 2005 Survey 136 102 75.0 34 25.0 25 18.4 25 18.4 7 5.1 17 12.5 11 8.1 2 1.5 4 2.9 0 0.0 5 3.7 21 15.4 8 5.9 3 2.2 6 4.4 4 2.9 2 1.5 0 0.0 2 1.5 0 0.0 0 0.0 0 0.0 0 0.0 0 0.0
AMR Bolivia Countrywide 1996 Survey 107 63 58.9 44 41.1 11 10.3 20 18.7 8 7.5 16 15.0 35 32.7 4 3.7 13 12.1 5 4.7 13 12.1 5 4.7 4 3.7 0 0.0 0 0.0 1 0.9 4 3.7 2 1.9 0 0.0 0 0.0 0 0.0 2 1.9 0 0.0 0 0.0
AMR Brazil Nearly Countrywide 1996 Survey 793 679 85.6 114 14.4 89 11.2 48 6.1 2 0.3 43 5.4 58 7.3 33 4.2 5 0.6 1 0.1 19 2.4 43 5.4 31 3.9 1 0.1 11 1.4 0 0.0 13 1.6 0 0.0 13 1.6 0 0.0 0 0.0 0 0.0 0 0.0 0 0.0
AMR Canada Countrywide 2005 Surveillance 88 74 84.1 14 15.9 11 12.5 10 11.4 6 6.8 8 9.1 4 4.5 1 1.1 1 1.1 0 0.0 2 2.3 9 10.2 2 2.3 2 2.3 1 1.1 4 4.5 1 1.1 0 0.0 1 1.1 0 0.0 0 0.0 0 0.0 0 0.0 0 0.0
AMR Chile Countrywide 2001 Survey 291 233 80.1 58 19.9 33 11.3 17 5.8 10 3.4 37 12.7 37 12.7 12 4.1 6 2.1 0 0.0 19 6.5 11 3.8 0 0.0 3 1.0 1 0.3 7 2.4 10 3.4 0 0.0 10 3.4 0 0.0 0 0.0 0 0.0 0 0.0 0 0.0
AMR Colombia Countrywide 2000 Survey new only . . . . . . . . . . . . . . . . . . . . . . . .
AMR Costa Rica Countrywide 2006 Survey 21 20 95.2 1 4.8 1 4.8 1 4.8 1 4.8 0 0.0 0 0.0 0 0.0 0 0.0 0 0.0 0 0.0 1 4.8 0 0.0 1 4.8 0 0.0 0 0.0 0 0.0 0 0.0 0 0.0 0 0.0 0 0.0 0 0.0 0 0.0 0 0.0
AMR Cuba Countrywide 2005 Sentinel 19 12 63.2 7 36.8 2 10.5 1 5.3 0 0.0 6 31.6 6 31.6 1 5.3 0 0.0 0 0.0 5 26.3 1 5.3 0 0.0 0 0.0 1 5.3 0 0.0 0 0.0 0 0.0 0 0.0 0 0.0 0 0.0 0 0.0 0 0.0 0 0.0
AMR Dominican Republic Countrywide 1995 Survey 117 56 47.9 61 52.1 43 36.8 37 31.6 15 12.8 30 25.6 26 22.2 12 10.3 10 8.5 0 0.0 4 3.4 23 19.7 3 2.6 3 2.6 10 8.5 7 6.0 12 10.3 2 1.7 4 3.4 2 1.7 1 0.9 3 2.6 0 0.0 0 0.0
AMR Ecuador Countrywide 2002 Survey 185 104 56.2 81 43.8 56 30.3 62 33.5 10 5.4 38 20.5 24 13.0 5 2.7 11 5.9 0 0.0 8 4.3 45 24.3 23 12.4 3 1.6 16 8.6 3 1.6 12 6.5 0 0.0 3 1.6 3 1.6 1 0.5 5 2.7 0 0.0 0 0.0
AMR El Salvador Countrywide 2001 Survey 100 78 78.0 22 22.0 12 12.0 13 13.0 3 3.0 9 9.0 12 12.0 3 3.0 5 5.0 1 1.0 3 3.0 7 7.0 3 3.0 1 1.0 2 2.0 1 1.0 3 3.0 0 0.0 2 2.0 0 0.0 0 0.0 1 1.0 0 0.0 0 0.0
AMR Guatemala Countrywide 2002 Survey 155 70 45.2 85 54.8 56 36.1 45 29.0 31 20.0 67 43.2 34 21.9 6 3.9 3 1.9 3 1.9 22 14.2 41 26.5 3 1.9 2 1.3 11 7.1 25 16.1 10 6.5 0 0.0 9 5.8 0 0.0 1 0.6 0 0.0 0 0.0 0 0.0
AMR Honduras Countrywide 2004 Survey 73 45 61.6 28 38.4 18 24.7 15 20.5 5 6.8 11 15.1 16 21.9 7 9.6 5 6.8 0 0.0 4 5.5 9 12.3 3 4.1 1 1.4 2 2.7 3 4.1 3 4.1 1 1.4 1 1.4 0 0.0 0 0.0 1 1.4 0 0.0 0 0.0
AMR Mexico Baja California, Sinaloa, Oaxaca 1997 Survey 107 63 58.9 44 41.1 35 32.7 30 28.0 15 14.0 20 18.7 16 15.0 11 10.3 2 1.9 0 0.0 3 2.8 24 22.4 9 8.4 2 1.9 1 0.9 12 11.2 4 3.7 0 0.0 0 0.0 0 0.0 0 0.0 3 2.8 1 0.9 0 0.0
AMR Nicaragua Countrywide 2006 Survey 103 66 64.1 37 35.9 30 29.1 9 8.7 9 8.7 21 20.4 18 17.5 11 10.7 1 1.0 1 1.0 5 4.9 8 7.8 1 1.0 1 1.0 1 1.0 5 4.9 11 10.7 1 1.0 9 8.7 1 1.0 0 0.0 0 0.0 0 0.0 0 0.0
AMR Paraguay Countrywide 2001 Survey 51 41 80.4 10 19.6 6 11.8 6 11.8 1 2.0 2 3.9 7 13.7 3 5.9 4 7.8 0 0.0 0 0.0 2 3.9 1 2.0 0 0.0 0 0.0 1 2.0 1 2.0 0 0.0 1 2.0 0 0.0 0 0.0 0 0.0 0 0.0 0 0.0
AMR Peru Countrywide 2006 Survey 360 210 58.3 150 41.7 109 30.3 95 26.4 33 9.2 107 29.7 52 14.4 13 3.6 8 2.2 0 0.0 31 8.6 85 23.6 18 5.0 4 1.1 37 10.3 26 7.2 13 3.6 0 0.0 10 2.8 1 0.3 0 0.0 0 0.0 2 0.6 0 0.0
AMR Puerto Rico Countrywide 2005 Surveillance combined only . . . . . . . . . . . . . . . . . . . . . . . .
AMR Uruguay Countrywide 2005 Survey 33 30 90.9 3 9.1 2 6.1 2 6.1 0 0.0 1 3.0 1 3.0 0 0.0 0 0.0 0 0.0 1 3.0 2 6.1 2 6.1 0 0.0 0 0.0 0 0.0 0 0.0 0 0.0 0 0.0 0 0.0 0 0.0 0 0.0 0 0.0 0 0.0
AMR USA Countrywide 2005 Surveillance combined only . . . . . . . . . . . . . . . . . . . . . . . .
AMR Venezuela Countrywide 1999 Survey 104 72 69.2 32 30.8 24 23.1 19 18.3 8 7.7 16 15.4 12 11.5 6 5.8 3 2.9 0 0.0 3 2.9 14 13.5 4 3.8 2 1.9 5 4.8 3 2.9 6 5.8 1 1.0 3 2.9 0 0.0 0 0.0 0 0.0 2 1.9 0 0.0
EMR Egypt Countrywide 2002 Survey 217 69 31.8 148 68.2 101 46.5 110 50.7 67 30.9 117 53.9 40 18.4 6 2.8 15 6.9 2 0.9 17 7.8 83 38.2 5 2.3 2 0.9 21 9.7 55 25.3 25 11.5 1 0.5 7 3.2 4 1.8 0 0.0 10 4.6 2 0.9 1 0.5
EMR Iran Countrywide 1998 Survey 56 24 42.9 32 57.1 28 50.0 28 50.0 18 32.1 22 39.3 4 7.1 1 1.8 0 0.0 0 0.0 3 5.4 27 48.2 7 12.5 2 3.6 2 3.6 16 28.6 1 1.8 0 0.0 0 0.0 0 0.0 0 0.0 1 1.8 0 0.0 0 0.0
EMR Jordan Countrywide 2004 Survey 30 5 16.7 25 83.3 17 56.7 14 46.7 11 36.7 21 70.0 5 16.7 0 0.0 0 0.0 0 0.0 5 16.7 12 40.0 2 6.7 2 6.7 1 3.3 7 23.3 8 26.7 0 0.0 4 13.3 1 3.3 0 0.0 2 6.7 0 0.0 1 3.3
EMR Lebanon Countrywide 2003 Survey 16 4 25.0 12 75.0 12 75.0 10 62.5 7 43.8 8 50.0 1 6.3 1 6.3 0 0.0 0 0.0 0 0.0 10 62.5 2 12.5 1 6.3 2 12.5 5 31.3 1 6.3 0 0.0 0 0.0 1 6.3 0 0.0 0 0.0 0 0.0 0 0.0
EMR Morocco Countrywide 2006 Survey 181 144 79.6 37 20.4 32 17.7 22 12.2 7 3.9 30 16.6 8 4.4 3 1.7 0 0.0 0 0.0 5 2.8 22 12.2 2 1.1 1 0.6 14 7.7 5 2.8 7 3.9 1 0.6 6 3.3 0 0.0 0 0.0 0 0.0 0 0.0 0 0.0
EMR Oman Countrywide 2006 Surveillance 14 8 57.1 6 42.9 5 35.7 5 35.7 5 35.7 6 42.9 1 7.1 0 0.0 0 0.0 0 0.0 1 7.1 5 35.7 0 0.0 0 0.0 0 0.0 5 35.7 0 0.0 0 0.0 0 0.0 0 0.0 0 0.0 0 0.0 0 0.0 0 0.0
EMR Qatar Countrywide 2006 Surveillance combined only . . . . . . . . . . . . . . . . . . . . . . . .
EMR Yemen Countrywide 2004 Survey 53 42 79.2 11 20.8 7 13.2 6 11.3 4 7.5 11 20.8 4 7.5 0 0.0 0 0.0 0 0.0 4 7.5 6 11.3 0 0.0 0 0.0 2 3.8 4 7.5 1 1.9 0 0.0 1 1.9 0 0.0 0 0.0 0 0.0 0 0.0 0 0.0
EUR Andorra Countrywide 2005 Surveillance 0 0 0 0 0 0 0 0 0 0 0 0 0 0 0 0 0 0 0 0 0 0 0 0 0
EUR Armenia Countrywide 2007 Survey 340 87 25.6 253 74.4 215 63.2 160 47.1 74 21.8 205 60.3 58 17.1 24 7.1 11 3.2 0 0.0 23 6.8 147 43.2 8 2.4 1 0.3 83 24.4 55 16.2 48 14.1 4 1.2 29 8.5 11 3.2 0 0.0 1 0.3 1 0.3 2 0.6
EUR Austria Countrywide 2005 Surveillance 16 14 87.5 2 12.5 2 12.5 2 12.5 1 6.3 1 6.3 0 0.0 0 0.0 0 0.0 0 0.0 0 0.0 2 12.5 1 6.3 0 0.0 0 0.0 1 6.3 0 0.0 0 0.0 0 0.0 0 0.0 0 0.0 0 0.0 0 0.0 0 0.0
EUR Azerbaijan Baku City 2007 Survey 552 86 15.6 466 84.4 440 79.7 309 56.0 171 31.0 416 75.4 61 11.1 36 6.5 0 0.0 0 0.0 25 4.5 308 55.8 11 2.0 2 0.4 142 25.7 153 27.7 97 17.6 1 0.2 80 14.5 15 2.7 0 0.0 1 0.2 0 0.0 0 0.0
EUR Belgium Countrywide 2005 Surveillance 41 37 90.2 4 9.8 4 9.8 3 7.3 3 7.3 0 0.0 1 2.4 1 2.4 0 0.0 0 0.0 0 0.0 3 7.3 0 0.0 3 7.3 0 0.0 0 0.0 0 0.0 0 0.0 0 0.0 0 0.0 0 0.0 0 0.0 0 0.0 0 0.0
EUR Bosnia & Herzegovina Countrywide 2005 Surveillance 106 80 75.5 26 24.5 14 13.2 14 13.2 5 4.7 9 8.5 15 14.2 5 4.7 5 4.7 1 0.9 4 3.8 7 6.6 4 3.8 0 0.0 1 0.9 2 1.9 4 3.8 1 0.9 1 0.9 0 0.0 1 0.9 1 0.9 0 0.0 0 0.0
EUR Croatia Countrywide 2005 Surveillance 61 56 91.8 5 8.2 3 4.9 3 4.9 3 4.9 5 8.2 2 3.3 0 0.0 0 0.0 0 0.0 2 3.3 3 4.9 0 0.0 0 0.0 0 0.0 3 4.9 0 0.0 0 0.0 0 0.0 0 0.0 0 0.0 0 0.0 0 0.0 0 0.0
EUR Czech Republic Countrywide 2005 Surveillance 20 12 60.0 8 40.0 7 35.0 6 30.0 5 25.0 8 40.0 1 5.0 0 0.0 0 0.0 0 0.0 1 5.0 6 30.0 0 0.0 0 0.0 1 5.0 5 25.0 1 5.0 0 0.0 1 5.0 0 0.0 0 0.0 0 0.0 0 0.0 0 0.0
EUR Denmark Countrywide 2005 Surveillance 18 14 77.8 4 22.2 3 16.7 0 0.0 1 5.6 0 0.0 4 22.2 3 16.7 0 0.0 1 5.6 0 0.0 0 0.0 0 0.0 0 0.0 0 0.0 0 0.0 0 0.0 0 0.0 0 0.0 0 0.0 0 0.0 0 0.0 0 0.0 0 0.0
EUR Estonia Countrywide 2005 Surveillance 71 26 36.6 45 63.4 43 60.6 37 52.1 35 49.3 41 57.7 5 7.0 3 4.2 0 0.0 0 0.0 2 2.8 37 52.1 0 0.0 1 1.4 2 2.8 34 47.9 3 4.2 0 0.0 3 4.2 0 0.0 0 0.0 0 0.0 0 0.0 0 0.0
EUR Finland Countrywide 2005 Surveillance 22 21 95.5 1 4.5 1 4.5 1 4.5 1 4.5 1 4.5 0 0.0 0 0.0 0 0.0 0 0.0 0 0.0 1 4.5 0 0.0 0 0.0 0 0.0 1 4.5 0 0.0 0 0.0 0 0.0 0 0.0 0 0.0 0 0.0 0 0.0 0 0.0
EUR France Countrywide 2005 Sentinel 112 88 78.6 24 21.4 16 14.3 9 8.0 3 2.7 16 14.3 13 11.6 5 4.5 1 0.9 0 0.0 7 6.3 8 7.1 2 1.8 0 0.0 3 2.7 3 2.7 3 2.7 0 0.0 3 2.7 0 0.0 0 0.0 0 0.0 0 0.0 0 0.0
EUR Georgia Countrywide 2006 Survey 515 175 34.0 340 66.0 243 47.2 147 28.5 56 10.9 299 58.1 123 23.9 28 5.4 4 0.8 0 0.0 91 17.7 141 27.4 6 1.2 2 0.4 83 16.1 50 9.7 76 14.8 1 0.2 70 13.6 3 0.6 0 0.0 2 0.4 0 0.0 0 0.0
EUR Germany Countrywide 2005 Surveillance 251 188 74.9 63 25.1 55 21.9 32 12.7 20 8.0 49 19.5 20 8.0 13 5.2 0 0.0 0 0.0 7 2.8 31 12.4 1 0.4 0 0.0 11 4.4 19 7.6 12 4.8 0 0.0 10 4.0 1 0.4 0 0.0 1 0.4 0 0.0 0 0.0
EUR Iceland Countrywide 2005 Surveillance 1 1 100.0 0 0.0 0 0.0 0 0.0 0 0.0 0 0.0 0 0.0 0 0.0 0 0.0 0 0.0 0 0.0 0 0.0 0 0.0 0 0.0 0 0.0 0 0.0 0 0.0 0 0.0 0 0.0 0 0.0 0 0.0 0 0.0 0 0.0 0 0.0
EUR Ireland Countrywide 2005 Surveillance 10 8 80.0 2 20.0 2 20.0 1 10.0 0 0.0 0 0.0 1 10.0 1 10.0 0 0.0 0 0.0 0 0.0 1 10.0 1 10.0 0 0.0 0 0.0 0 0.0 0 0.0 0 0.0 0 0.0 0 0.0 0 0.0 0 0.0 0 0.0 0 0.0
EUR Israel Countrywide 2005 Surveillance 3 3 100.0 0 0.0 0 0.0 0 0.0 0 0.0 0 0.0 0 0.0 0 0.0 0 0.0 0 0.0 0 0.0 0 0.0 0 0.0 0 0.0 0 0.0 0 0.0 0 0.0 0 0.0 0 0.0 0 0.0 0 0.0 0 0.0 0 0.0 0 0.0
EUR Italy Half of the country 2005 Surveillance 79 50 63.3 29 36.7 24 30.4 14 17.7 8 10.1 23 29.1 9 11.4 4 5.1 0 0.0 0 0.0 5 6.3 14 17.7 2 2.5 0 0.0 5 6.3 7 8.9 6 7.6 0 0.0 5 6.3 1 1.3 0 0.0 0 0.0 0 0.0 0 0.0
EUR Kazakhstan Countrywide 2001 Survey 319 57 17.9 262 82.1 216 67.7 196 61.4 173 54.2 246 77.1 26 8.2 3 0.9 1 0.3 4 1.3 18 5.6 180 56.4 6 1.9 1 0.3 39 12.2 134 42.0 56 17.6 0 0.0 18 5.6 15 4.7 1 0.3 4 1.3 10 3.1 8 2.5
EUR Latvia Countrywide 2005 Surveillance 182 86 47.3 96 52.7 90 49.5 66 36.3 63 34.6 93 51.1 9 4.9 3 1.6 0 0.0 0 0.0 6 3.3 66 36.3 0 0.0 0 0.0 8 4.4 58 31.9 21 11.5 0 0.0 16 8.8 5 2.7 0 0.0 0 0.0 0 0.0 0 0.0

Region
Country
Sub-national
Year
Method
Patients
tested
Susceptible
%
Any
resistance
%
Any H
%
Any R
%
Any E
%
Any S
%
Mono
%
Mono H
%
Mono R
%
Mono E
%
Mono S
%
MDR
% HR %
HRE
%
HRS
%
HRES
%
Poly
% HE % HS %
HES
% RE % RS %
RES
% ES %
EUR Lithuania Countrywide 2005 Surveillance 440 176 40.0 264 60.0 250 56.8 212 48.2 239 54.3 141 32.0 27 6.1 14 3.2 2 0.5 11 2.5 0 0.0 209 47.5 5 1.1 67 15.2 3 0.7 134 30.5 28 6.4 23 5.2 1 0.2 3 0.7 1 0.2 0 0.0 0 0.0 0 0.0
EUR Luxembourg Countrywide 2005 Surveillance 0 0 0 0 0 0 0 0 0 0 0 0 0 0 0 0 0 0 0 0 0 0 0 0 0
EUR Malta Countrywide 2005 Surveillance 0 0 0 0 0 0 0 0 0 0 0 0 0 0 0 0 0 0 0 0 0 0 0 0 0
EUR Netherlands Countrywide 2005 Surveillance 30 25 83.3 5 16.7 3 10.0 2 6.7 0 0.0 2 6.7 3 10.0 1 3.3 1 3.3 0 0.0 1 3.3 1 3.3 1 3.3 0 0.0 0 0.0 0 0.0 1 3.3 0 0.0 1 3.3 0 0.0 0 0.0 0 0.0 0 0.0 0 0.0
EUR Norway Countrywide 2005 Surveillance 8 8 100.0 0 0.0 0 0.0 0 0.0 0 0.0 0 0.0 0 0.0 0 0.0 0 0.0 0 0.0 0 0.0 0 0.0 0 0.0 0 0.0 0 0.0 0 0.0 0 0.0 0 0.0 0 0.0 0 0.0 0 0.0 0 0.0 0 0.0 0 0.0
EUR Poland Countrywide 2004 Surveillance 522 428 82.0 94 18.0 71 13.6 51 9.8 12 2.3 55 10.5 39 7.5 17 3.3 7 1.3 1 0.2 14 2.7 43 8.2 11 2.1 2 0.4 23 4.4 7 1.3 12 2.3 1 0.2 9 1.7 1 0.2 0 0.0 1 0.2 0 0.0 0 0.0
EUR Portugal Countrywide 2005 Surveillance 172 127 73.8 35 20.3 26 15.1 19 11.0 10 5.8 18 10.5 14 8.1 6 3.5 2 1.2 2 1.2 4 2.3 16 9.3 5 2.9 1 0.6 5 2.9 5 2.9 5 2.9 1 0.6 3 1.7 0 0.0 0 0.0 0 0.0 1 0.6 0 0.0
EUR Republic of Moldova Countrywide 2006 Surveillance 2054 605 29.5 1,449 70.5 1,259 61.3 1,108 53.9 607 29.6 1,167 56.8 199 9.7 59 2.9 23 1.1 32 1.6 85 4.1 1,044 50.8 137 6.7 407 19.8 12 0.6 488 23.8 206 10.0 14 0.7 107 5.2 35 1.7 5 0.2 24 1.2 12 0.6 9 0.4
EUR Romania Countrywide 2004 Surveillance 382 257 67.3 125 32.7 108 28.3 49 12.8 54 14.1 74 19.4 48 12.6 31 8.1 7 1.8 0 0.0 10 2.6 42 11.0 4 1.0 3 0.8 5 1.3 30 7.9 35 9.2 6 1.6 14 3.7 15 3.9 0 0.0 0 0.0 0 0.0 0 0.0
EUR Russian Federation Ivanovo Oblast 2002 Surveillance 155 28 18.1 127 81.9 116 74.8 93 60.0 68 43.9 120 77.4 10 6.5 1 0.6 2 1.3 1 0.6 6 3.9 90 58.1 2 1.3 0 0.0 28 18.1 60 38.7 27 17.4 1 0.6 19 12.3 5 3.2 0 0.0 1 0.6 0 0.0 1 0.6
EUR Russian Federation Orel Oblast 2006 Surveillance 30 16 53.3 14 46.7 14 46.7 5 16.7 6 20.0 11 36.7 2 6.7 2 6.7 0 0.0 0 0.0 0 0.0 5 16.7 0 0.0 0 0.0 1 3.3 4 13.3 7 23.3 1 3.3 5 16.7 1 3.3 0 0.0 0 0.0 0 0.0 0 0.0
EUR Russian Federation Mary El oblast 2006 Surveillance new only . . . . . . . . . . . . . . . . . . . . . . . .
EUR Russian Federation Tomsk Oblast 2005 Surveillance new only . . . . . . . . . . . . . . . . . . . . . . . .
EUR Serbia Countrywide 2005 Surveillance 121 107 88.4 14 11.6 7 5.8 8 6.6 6 5.0 6 5.0 7 5.8 2 1.7 1 0.8 1 0.8 3 2.5 5 4.1 0 0.0 2 1.7 2 1.7 1 0.8 2 1.7 0 0.0 0 0.0 0 0.0 2 1.7 0 0.0 0 0.0 0 0.0
EUR Slovakia Countrywide 2005 Surveillance 56 46 82.1 10 17.9 10 17.9 4 7.1 1 1.8 3 5.4 3 5.4 3 5.4 0 0.0 0 0.0 0 0.0 4 7.1 3 5.4 0 0.0 1 1.8 0 0.0 3 5.4 1 1.8 2 3.6 0 0.0 0 0.0 0 0.0 0 0.0 0 0.0
EUR Slovenia Countrywide 2005 Surveillance 28 24 85.7 4 14.3 3 10.7 1 3.6 1 3.6 3 10.7 2 7.1 1 3.6 0 0.0 0 0.0 1 3.6 1 3.6 0 0.0 0 0.0 1 3.6 0 0.0 1 3.6 0 0.0 0 0.0 1 3.6 0 0.0 0 0.0 0 0.0 0 0.0
EUR Spain Galicia 2005 Surveillance 68 59 86.8 9 13.2 5 7.4 1 1.5 1 1.5 6 8.8 6 8.8 2 2.9 0 0.0 1 1.5 3 4.4 1 1.5 0 0.0 0 0.0 1 1.5 0 0.0 2 2.9 0 0.0 2 2.9 0 0.0 0 0.0 0 0.0 0 0.0 0 0.0
EUR Spain Aragon 2005 Surveillance 26 21 80.8 5 19.2 5 19.2 4 15.4 2 7.7 2 7.7 1 3.8 1 3.8 0 0.0 0 0.0 0 0.0 4 15.4 2 7.7 0 0.0 0 0.0 2 7.7 0 0.0 0 0.0 0 0.0 0 0.0 0 0.0 0 0.0 0 0.0 0 0.0
EUR Spain Barcelona 2005 Surveillance combined only . . . . . . . . . . . . . . . . . . . . . . . .
EUR Sweden Countrywide 2005 Surveillance 17 13 76.5 4 23.5 4 23.5 2 11.8 1 5.9 0 0.0 2 11.8 2 11.8 0 0.0 0 0.0 0 0.0 2 11.8 1 5.9 1 5.9 0 0.0 0 0.0 0 0.0 0 0.0 0 0.0 0 0.0 0 0.0 0 0.0 0 0.0 0 0.0
EUR Switzerland Countrywide 2005 Surveillance 30 28 93.3 2 6.7 2 6.7 2 6.7 2 6.7 0 0.0 0 0.0 0 0.0 0 0.0 0 0.0 0 0.0 2 6.7 0 0.0 2 6.7 0 0.0 0 0.0 0 0.0 0 0.0 0 0.0 0 0.0 0 0.0 0 0.0 0 0.0 0 0.0
EUR Turkmenistan Dashoguz Velayat (Aral Sea Region) 2002 Survey 98 37 37.8 61 62.2 47 48.0 19 19.4 15 15.3 50 51.0 23 23.5 9 9.2 1 1.0 0 0.0 13 13.3 18 18.4 0 0.0 0 0.0 10 10.2 8 8.2 20 20.4 1 1.0 13 13.3 6 6.1 0 0.0 0 0.0 0 0.0 0 0.0
EUR Ukraine Donetsk 2006 Survey 494 147 29.8 347 70.2 298 60.3 241 48.8 40 8.1 253 51.2 67 13.6 32 6.5 8 1.6 0 0.0 27 5.5 219 44.3 48 9.7 5 1.0 136 27.5 30 6.1 61 12.3 1 0.2 42 8.5 4 0.8 0 0.0 14 2.8 0 0.0 0 0.0
EUR United Kingdom Countrywide 2005 Surveillance 271 246 90.8 25 9.2 23 8.5 9 3.3 2 0.7 0 0.0 18 6.6 16 5.9 2 0.7 0 0.0 0 0.0 7 2.6 5 1.8 2 0.7 0 0.0 0 0.0 0 0.0 0 0.0 0 0.0 0 0.0 0 0.0 0 0.0 0 0.0 0 0.0
EUR Uzbekistan Tashkent 2005 Survey 85 12 14.1 73 85.9 69 81.2 51 60.0 24 28.2 71 83.5 5 5.9 1 1.2 0 0.0 0 0.0 4 4.7 51 60.0 1 1.2 0 0.0 27 31.8 23 27.1 17 20.0 0 0.0 16 18.8 1 1.2 0 0.0 0 0.0 0 0.0 0 0.0
SEAR India Mayhurbhanj District, Orissa State 2001 Survey new only . . . . . . . . . . . . . . . . . . . . . . . .
SEAR India Wardha District, Maharashtra State 2001 Survey new only . . . . . . . . . . . . . . . . . . . . . . . .
SEAR India Delhi State 1995 Survey combined only . . . . . . . . . . . . . . . . . . . . . . . .
SEAR India Raichur District, Karnataka State 1999 Survey new only . . . . . . . . . . . . . . . . . . . . . . . .
SEAR India North Arcot District, Tamil Nadu State 1999 Survey new only . . . . . . . . . . . . . . . . . . . . . . . .
SEAR India Ernakulam district, Kerala State 2004 Survey new only . . . . . . . . . . . . . . . . . . . . . . . .
SEAR India Gujarat State 2006 Survey 1047 562 53.7 485 46.3 385 36.8 190 18.1 105 10.0 274 26.2 220 21.0 122 11.7 10 1.0 0 0.0 88 8.4 182 17.4 49 4.7 21 2.0 43 4.1 69 6.6 83 7.9 7 0.7 66 6.3 10 1.0 0 0.0 0 0.0 0 0.0 0 0.0
SEAR India Tamil Nadu State 1997 Survey new only . . . . . . . . . . . . . . . . . . . . . . . .
SEAR India Hoogli district, West Bengal State 2001 Survey new only . . . . . . . . . . . . . . . . . . . . . . . .
SEAR Indonesia Mimika district, Papua Province 2004 Survey new only . . . . . . . . . . . . . . . . . . . . . . . .
SEAR Myanmar Countrywide 2003 Survey 116 81 69.8 35 30.2 31 26.7 18 15.5 1 0.9 24 20.7 6 5.2 2 1.7 0 0.0 0 0.0 4 3.4 18 15.5 9 7.8 0 0.0 8 6.9 1 0.9 11 9.5 0 0.0 11 9.5 0 0.0 0 0.0 0 0.0 0 0.0 0 0.0
SEAR Nepal Countrywide 2007 Survey 162 121 74.7 41 25.3 37 22.8 19 11.7 14 8.6 31 19.1 10 6.2 6 3.7 0 0.0 0 0.0 4 2.5 19 11.7 3 1.9 1 0.6 4 2.5 11 6.8 12 7.4 0 0.0 10 6.2 2 1.2 0 0.0 0 0.0 0 0.0 0 0.0
SEAR Sri Lanka Countrywide 2006 Survey 34 31 91.2 3 8.8 2 5.9 0 0.0 0 0.0 1 2.9 3 8.8 2 5.9 0 0.0 0 0.0 1 2.9 0 0.0 0 0.0 0 0.0 0 0.0 0 0.0 0 0.0 0 0.0 0 0.0 0 0.0 0 0.0 0 0.0 0 0.0 0 0.0
SEAR Thailand Countrywide 2006 Survey 194 96 49.5 98 50.5 86 44.3 68 35.1 50 25.8 65 33.5 22 11.3 10 5.2 1 0.5 0 0.0 11 5.7 67 34.5 12 6.2 9 4.6 8 4.1 38 19.6 9 4.6 1 0.5 6 3.1 2 1.0 0 0.0 0 0.0 0 0.0 0 0.0
WPR Australia Countrywide 2005 Surveillance combined only . . . . . . . . . . . . . . . . . . . . . . . .
WPR Cambodia Countrywide 2001 Survey 96 79 82.3 17 17.7 16 16.7 3 3.1 0 0.0 7 7.3 10 10.4 9 9.4 0 0.0 0 0.0 1 1.0 3 3.1 1 1.0 0 0.0 2 2.1 0 0.0 4 4.2 0 0.0 4 4.2 0 0.0 0 0.0 0 0.0 0 0.0 0 0.0
WPR China Guandong Province 1999 Survey 63 39 61.9 24 38.1 15 23.8 14 22.2 9 14.3 13 20.6 9 14.3 2 3.2 1 1.6 0 0.0 6 9.5 11 17.5 4 6.3 3 4.8 0 0.0 4 6.3 4 6.3 0 0.0 1 1.6 1 1.6 1 1.6 1 1.6 0 0.0 0 0.0
WPR China Beijing Municipality 2004 Survey 154 100 64.9 54 35.1 38 24.7 23 14.9 14 9.1 33 21.4 17 11.0 7 4.5 2 1.3 0 0.0 8 5.2 18 11.7 6 3.9 2 1.3 7 4.5 3 1.9 19 12.3 3 1.9 8 5.2 2 1.3 1 0.6 2 1.3 0 0.0 3 1.9
WPR China Shandong Province 1997 Survey 220 110 50.0 110 50.0 89 40.5 51 23.2 23 10.5 76 34.5 35 15.9 21 9.5 1 0.5 0 0.0 13 5.9 43 19.5 7 3.2 4 1.8 16 7.3 16 7.3 32 14.5 1 0.5 22 10.0 2 0.9 0 0.0 7 3.2 0 0.0 0 0.0
WPR China Henan Province 2001 Survey 265 104 39.2 161 60.8 125 47.2 113 42.6 48 18.1 114 43.0 38 14.3 11 4.2 8 3.0 4 1.5 15 5.7 97 36.6 20 7.5 2 0.8 41 15.5 34 12.8 26 9.8 0 0.0 13 4.9 4 1.5 2 0.8 5 1.9 1 0.4 1 0.4
WPR China (3) Liaoning Province 1999 Survey 86 38 44.2 48 55.8 36 41.9 25 29.1 12 14.0 36 41.9 13 15.1 2 2.3 3 3.5 0 0.0 8 9.3 21 24.4 6 7.0 0 0.0 6 7.0 9 10.5 14 16.3 1 1.2 11 12.8 1 1.2 0 0.0 0 0.0 1 1.2 0 0.0
WPR China Heilongjiang Province 2005 Survey 421 137 32.5 284 67.5 202 48.0 170 40.4 103 24.5 136 32.3 101 24.0 37 8.8 24 5.7 0 0.0 40 9.5 128 30.4 25 5.9 58 13.8 6 1.4 39 9.3 55 13.1 3 0.7 32 7.6 2 0.5 1 0.2 17 4.0 0 0.0 0 0.0
WPR China Hubei Province 1999 Survey 238 132 55.5 106 44.5 79 33.2 64 26.9 21 8.8 61 25.6 32 13.4 13 5.5 4 1.7 0 0.0 15 6.3 52 21.8 19 8.0 5 2.1 18 7.6 10 4.2 22 9.2 1 0.4 11 4.6 2 0.8 3 1.3 5 2.1 0 0.0 0 0.0
WPR China Zhejiang Province 1999 Survey 140 57 40.7 83 59.3 62 44.3 63 45.0 25 17.9 39 27.9 26 18.6 10 7.1 9 6.4 1 0.7 6 4.3 49 35.0 20 14.3 1 0.7 10 7.1 18 12.9 8 5.7 1 0.7 0 0.0 2 1.4 2 1.4 3 2.1 0 0.0 0 0.0
WPR China Shanghai Municipality 2005 Survey 200 145 72.5 55 27.5 43 21.5 30 15.0 20 10.0 25 12.5 19 9.5 11 5.5 2 1.0 1 0.5 5 2.5 25 12.5 6 3.0 10 5.0 2 1.0 7 3.5 11 5.5 0 0.0 7 3.5 0 0.0 0 0.0 2 1.0 1 0.5 1 0.5
WPR China Inner Mongolia Autonomous region 2002 Survey 308 92 29.9 216 70.1 174 56.5 157 51.0 98 31.8 92 29.9 52 16.9 23 7.5 16 5.2 0 0.0 13 4.2 129 41.9 34 11.0 48 15.6 6 1.9 41 13.3 35 11.4 2 0.6 17 5.5 3 1.0 1 0.3 9 2.9 2 0.6 1 0.3
WPR China, Hong Kong SAR Hong Kong 2005 Surveillance 163 125 76.7 38 23.3 28 17.2 16 9.8 9 5.5 25 15.3 15 9.2 7 4.3 1 0.6 1 0.6 6 3.7 13 8.0 3 1.8 0 0.0 4 2.5 6 3.7 10 6.1 0 0.0 8 4.9 0 0.0 1 0.6 0 0.0 1 0.6 0 0.0
WPR China, Macao SAR Macao 2005 Surveillance 19 14 73.7 5 26.3 4 21.1 3 15.8 1 5.3 3 15.8 2 10.5 1 5.3 0 0.0 0 0.0 1 5.3 3 15.8 1 5.3 0 0.0 1 5.3 1 5.3 0 0.0 0 0.0 0 0.0 0 0.0 0 0.0 0 0.0 0 0.0 0 0.0
WPR Fiji Countrywide 2006 Surveillance combined only . . . . . . . . . . . . . . . . . . . . . . . .
WPR Guam Countrywide 2002 Survey combined only . . . . . . . . . . . . . . . . . . . . . . . .
WPR Japan Countrywide 2002 Surveillance 417 312 74.8 105 25.2 79 18.9 46 11.0 35 8.4 60 14.4 49 11.8 26 6.2 2 0.5 1 0.2 20 4.8 41 9.8 6 1.4 6 1.4 10 2.4 19 4.6 15 3.6 3 0.7 6 1.4 3 0.7 1 0.2 0 0.0 2 0.5 0 0.0
WPR Malaysia Peninsular Malaysia 1997 Survey 16 13 81.3 3 18.8 0 0.0 1 6.3 0 0.0 2 12.5 3 18.8 0 0.0 1 6.3 0 0.0 2 12.5 0 0.0 0 0.0 0 0.0 0 0.0 0 0.0 0 0.0 0 0.0 0 0.0 0 0.0 0 0.0 0 0.0 0 0.0 0 0.0
WPR Mongolia Countrywide 1999 Survey new only . . . . . . . . . . . . . . . . . . . . . . . .
WPR New Caledonia Countrywide 2005 Survey combined only . . . . . . . . . . . . . . . . . . . . . . . .
WPR New Zealand Countrywide 2006 Surveillance 16 15 93.8 1 6.3 1 6.3 0 0.0 0 0.0 0 0.0 1 6.3 1 6.3 0 0.0 0 0.0 0 0.0 0 0.0 0 0.0 0 0.0 0 0.0 0 0.0 0 0.0 0 0.0 0 0.0 0 0.0 0 0.0 0 0.0 0 0.0 0 0.0
WPR Northern Mariana Is Countrywide 2006 Surveillance new only . . . . . . . . . . . . . . . . . . . . . . . .
WPR Philippines Countrywide 2004 Survey 129 81 62.8 48 37.2 40 31.0 33 25.6 12 9.3 22 17.1 17 13.2 10 7.8 5 3.9 0 0.0 2 1.6 27 20.9 7 5.4 4 3.1 8 6.2 8 6.2 4 3.1 0 0.0 3 2.3 0 0.0 0 0.0 1 0.8 0 0.0 0 0.0
WPR Rep. Korea Countrywide 2004 Survey 278 201 72.3 77 27.7 67 24.1 47 16.9 27 9.7 16 5.8 29 10.4 20 7.2 7 2.5 0 0.0 2 0.7 39 14.0 14 5.0 16 5.8 4 1.4 5 1.8 9 3.2 4 1.4 3 1.1 1 0.4 0 0.0 0 0.0 1 0.4 0 0.0
WPR Singapore Countrywide 2005 Surveillance 105 94 89.5 11 10.5 4 3.8 3 2.9 1 1.0 7 6.7 9 8.6 2 1.9 2 1.9 0 0.0 5 4.8 1 1.0 0 0.0 0 0.0 0 0.0 1 1.0 1 1.0 0 0.0 1 1.0 0 0.0 0 0.0 0 0.0 0 0.0 0 0.0
WPR Solomon Islands Countrywide 2004 Survey combined only . . . . . . . . . . . . . . . . . . . . . . . .
WPR Vanuatu Countrywide 2006 Surveillance new only . . . . . . . . . . . . . . . . . . . . . . . .
WPR Viet Nam Countrywide 2006 Survey 207 85 41.1 122 58.9 90 43.5 44 21.3 30 14.5 105 50.7 38 18.4 8 3.9 2 1.0 2 1.0 26 12.6 40 19.3 5 2.4 0 0.0 15 7.2 20 9.7 44 21.3 0 0.0 34 16.4 8 3.9 0 0.0 2 1.0 0 0.0 0 0.0
(1) Several countries conducting routine diagnostic surveillance do not routinely test for streptomycin. Where this is the case the proportion tested is indicated in a footnote.
(2) Data from UR Tanzania and Madagascar are preliminary
(3) Based on patient re-interviews it is expected that between 20-30% of resistant cases may have been classified as new when in fact they had been treated previously. Therefore, MDR among new cases could be reduced from 10% to 8%. The reduction would be

Annex 3. Notified prevalence of resistance to specific drugs among all TB cases tested for resistance to at least INH and RIF (1)R
egio
n
Countr
y
Sub-n
ational
Year
Meth
od
Patients
teste
d
Susceptible
%
Any
resis
tance
%
Any H
%
Any R
%
Any E
%
Any S
%
Mono
%
Mono H
%
Mono R
%
Mono E
%
Mono S
%
MD
R
% HR %
HR
E
%
HR
S
%
HR
ES
%
Poly
% HE % HS %
HE
S
% RE % RS %
RE
S
% ES %
AFR Algeria Countrywide 2001 Survey new only . . . . . . . . . . . . . . . . . . . . . . . .
AFR Benin Countrywide 1997 Survey new only . . . . . . . . . . . . . . . . . . . . . . . .
AFR Botswana Countrywide 2002 Survey 1288 1,141 88.6 147 11.4 68 5.3 37 2.9 24 1.9 99 7.7 93 7.2 22 1.7 10 0.8 4 0.3 57 4.4 21 1.6 6 0.5 4 0.3 4 0.3 7 0.5 33 2.6 2 0.2 19 1.5 4 0.3 0 0.0 5 0.4 1 0.1 2 0.2
AFR Central African Republic Bangui 1998 Survey 497 409 82.3 88 17.7 54 10.9 13 2.6 17 3.4 55 11.1 54 10.9 22 4.4 1 0.2 0 0.0 31 6.2 11 2.2 2 0.4 5 1.0 2 0.4 2 0.4 23 4.6 2 0.4 13 2.6 6 1.2 1 0.2 0 0.0 0 0.0 1 0.2
AFR Côte d'Ivoire Countrywide 2006 Survey new only . . . . . . . . . . . . . . . . . . . . . . . .
AFR DR Congo Kinshasa 1999 Survey 710 433 61.0 277 39.0 163 23.0 44 6.2 109 15.4 200 28.2 131 18.5 31 4.4 1 0.1 36 5.1 63 8.9 41 5.8 2 0.3 4 0.6 5 0.7 30 4.2 105 14.8 3 0.4 66 9.3 22 3.1 0 0.0 0 0.0 2 0.3 12 1.7
AFR Ethiopia Countrywide 2005 Survey 880 627 71.3 253 28.8 81 9.2 33 3.8 30 3.4 216 24.5 186 21.1 20 2.3 9 1.0 1 0.1 156 17.7 22 2.5 3 0.3 3 0.3 1 0.1 15 1.7 45 5.1 1 0.1 33 3.8 5 0.6 0 0.0 1 0.1 1 0.1 4 0.5
AFR Gambia Countrywide 2000 Survey 225 216 96.0 9 4.0 5 2.2 2 0.9 0 0.0 3 1.3 8 3.6 4 1.8 1 0.4 0 0.0 3 1.3 1 0.4 1 0.4 0 0.0 0 0.0 0 0.0 0 0.0 0 0.0 0 0.0 0 0.0 0 0.0 0 0.0 0 0.0 0 0.0
AFR Guinea Sentinel sites 1998 Survey 571 476 83.4 95 16.6 66 11.6 13 2.3 9 1.6 62 10.9 56 9.8 27 4.7 1 0.2 0 0.0 28 4.9 12 2.1 2 0.4 1 0.2 5 0.9 4 0.7 27 4.7 2 0.4 23 4.0 2 0.4 0 0.0 0 0.0 0 0.0 0 0.0
AFR Kenya Nearly Countrywide 1995 Survey 491 446 90.8 45 9.2 45 9.2 0 0.0 0 0.0 7 1.4 38 7.7 38 7.7 0 0.0 0 0.0 0 0.0 0 0.0 0 0.0 0 0.0 0 0.0 0 0.0 7 1.4 0 0.0 7 1.4 0 0.0 0 0.0 0 0.0 0 0.0 0 0.0
AFR Lesotho Countrywide 1995 Survey 383 336 87.7 47 12.3 42 11.0 6 1.6 2 0.5 19 5.0 31 8.1 26 6.8 0 0.0 0 0.0 5 1.3 6 1.6 2 0.5 0 0.0 3 0.8 1 0.3 10 2.6 0 0.0 9 2.3 1 0.3 0 0.0 0 0.0 0 0.0 0 0.0
AFR Madagascar (2) Countrywide 2007 Survey 865 808 93.4 57 6.6 42 4.9 7 0.8 4 0.5 28 3.2 44 5.1 30 3.5 0 0.0 0 0.0 20 2.3 6 0.7 3 0.3 1 0.1 0 0.0 2 0.2 7 0.8 1 0.1 5 0.6 0 0.0 0 0.0 1 0.1 0 0.0 0 0.0
AFR Mozambique Countrywide 1999 Survey 1150 881 76.6 269 23.4 220 19.1 59 5.1 6 0.5 138 12.0 152 13.2 103 9.0 19 1.7 0 0.0 30 2.6 40 3.5 9 0.8 0 0.0 25 2.2 6 0.5 77 6.7 0 0.0 77 6.7 0 0.0 0 0.0 0 0.0 0 0.0 0 0.0
AFR Rwanda Countrywide 2005 Survey 701 618 88.2 83 11.8 47 6.7 33 4.7 42 6.0 62 8.8 43 6.1 7 1.0 1 0.1 12 1.7 23 3.3 32 4.6 1 0.1 0 0.0 2 0.3 29 4.1 8 1.1 0 0.0 7 1.0 1 0.1 0 0.0 0 0.0 0 0.0 0 0.0
AFR Senegal Countrywide 2006 Survey 279 241 86.4 38 13.6 20 7.2 12 4.3 15 5.4 30 10.8 22 7.9 4 1.4 0 0.0 3 1.1 15 5.4 12 4.3 0 0.0 1 0.4 2 0.7 9 3.2 4 1.4 0 0.0 2 0.7 2 0.7 0 0.0 0 0.0 0 0.0 0 0.0
AFR Sierra Leone Nearly Countrywide 1997 Survey 130 93 71.5 37 28.5 20 15.4 4 3.1 1 0.8 28 21.5 25 19.2 8 6.2 0 0.0 0 0.0 17 13.1 4 3.1 0 0.0 0 0.0 4 3.1 0 0.0 8 6.2 1 0.8 7 5.4 0 0.0 0 0.0 0 0.0 0 0.0 0 0.0
AFR South Africa Countrywide 2002 Survey 5708 5,141 90.1 567 9.9 422 7.4 207 3.6 79 1.4 298 5.2 294 5.2 150 2.6 31 0.5 1 0.0 112 2.0 175 3.1 59 1.0 19 0.3 52 0.9 45 0.8 98 1.7 8 0.1 84 1.5 5 0.1 1 0.0 0 0.0 0 0.0 0 0.0
AFR Swaziland Countrywide 1995 Survey 378 330 87.3 48 12.7 36 9.5 7 1.9 5 1.3 31 8.2 26 6.9 14 3.7 0 0.0 1 0.3 11 2.9 7 1.9 1 0.3 1 0.3 3 0.8 2 0.5 15 4.0 0 0.0 14 3.7 1 0.3 0 0.0 0 0.0 0 0.0 0 0.0
AFR Uganda 3 GLRA Zones * 1997 Survey 419 322 76.8 97 23.2 42 10.0 5 1.2 28 6.7 60 14.3 61 14.6 20 4.8 1 0.2 12 2.9 28 6.7 4 1.0 2 0.5 1 0.2 1 0.2 0 0.0 32 7.6 1 0.2 17 4.1 0 0.0 0 0.0 0 0.0 0 0.0 14 3.3
AFR UR Tanzania (2) Countrywide 2007 Survey 418 387 92.6 31 7.4 24 5.7 4 1.0 5 1.2 15 3.6 20 4.8 13 3.1 0 0.0 0 0.0 7 1.7 4 1.0 0 0.0 1 0.2 2 0.5 1 0.2 7 1.7 2 0.5 4 1.0 1 0.2 0 0.0 0 0.0 0 0.0 0 0.0
AFR Zambia Countrywide 2000 Survey 489 432 88.3 57 11.7 31 6.3 9 1.8 10 2.0 26 5.3 43 8.8 17 3.5 0 0.0 4 0.8 22 4.5 9 1.8 5 1.0 3 0.6 0 0.0 1 0.2 5 1.0 2 0.4 3 0.6 0 0.0 0 0.0 0 0.0 0 0.0 0 0.0
AFR Zimbabwe Nearly Countrywide 1995 Survey 712 685 96.2 27 3.8 27 3.8 16 2.2 4 0.6 6 0.8 11 1.5 11 1.5 0 0.0 0 0.0 0 0.0 16 2.2 10 1.4 0 0.0 2 0.3 4 0.6 0 0.0 0 0.0 0 0.0 0 0.0 0 0.0 0 0.0 0 0.0 0 0.0
AMR Argentina Countrywide 2005 Survey 819 717 87.5 102 12.5 64 7.8 41 5.0 11 1.3 61 7.4 54 6.6 16 2.0 5 0.6 1 0.1 32 3.9 36 4.4 15 1.8 4 0.5 11 1.3 6 0.7 12 1.5 0 0.0 12 1.5 0 0.0 0 0.0 0 0.0 0 0.0 0 0.0
AMR Bolivia Countrywide 1996 Survey 605 434 71.7 171 28.3 62 10.2 50 8.3 33 5.5 65 10.7 135 22.3 38 6.3 27 4.5 23 3.8 47 7.8 11 1.8 9 1.5 0 0.0 1 0.2 1 0.2 25 4.1 4 0.7 9 1.5 0 0.0 5 0.8 7 1.2 0 0.0 0 0.0
AMR Brazil Nearly Countrywide 1996 Survey 2888 2,594 89.8 294 10.2 213 7.4 71 2.5 5 0.2 119 4.1 193 6.7 112 3.9 9 0.3 3 0.1 69 2.4 62 2.1 49 1.7 1 0.0 12 0.4 0 0.0 39 1.4 1 0.0 38 1.3 0 0.0 0 0.0 0 0.0 0 0.0 0 0.0
AMR Canada Countrywide 2005 Surveillance 1203 1,057 87.9 146 12.1 102 8.5 26 2.2 22 1.8 72 6.0 102 8.5 58 4.8 3 0.2 5 0.4 36 3.0 23 1.9 4 0.3 3 0.2 6 0.5 10 0.8 21 1.7 1 0.1 17 1.4 3 0.2 0 0.0 0 0.0 0 0.0 0 0.0
AMR Chile Countrywide 2001 Survey 1158 1,009 87.1 149 12.9 72 6.2 24 2.1 12 1.0 115 9.9 101 8.7 24 2.1 7 0.6 0 0.0 70 6.0 17 1.5 0 0.0 3 0.3 5 0.4 9 0.8 31 2.7 0 0.0 31 2.7 0 0.0 0 0.0 0 0.0 0 0.0 0 0.0
AMR Colombia Countrywide 2000 Survey new only . . . . . . . . . . . . . . . . . . . . . . . .
AMR Costa Rica Countrywide 2006 Survey 284 264 93.0 20 7.0 10 3.5 6 2.1 14 4.9 0 0.0 7 2.5 5 1.8 1 0.4 9 3.2 0 0.0 5 1.8 0 0.0 5 1.8 0 0.0 0 0.0 8 2.8 0 0.0 0 0.0 0 0.0 0 0.0 0 0.0 0 0.0 0 0.0
AMR Cuba Countrywide 2005 Sentinel 198 177 89.4 21 10.6 3 1.5 2 1.0 0 0.0 19 9.6 19 9.6 1 0.5 1 0.5 0 0.0 17 8.6 1 0.5 0 0.0 0 0.0 1 0.5 0 0.0 1 0.5 0 0.0 1 0.5 0 0.0 0 0.0 0 0.0 0 0.0 0 0.0
AMR Dominican Republic Countrywide 1995 Survey 420 236 56.2 184 43.8 103 24.5 86 20.5 26 6.2 94 22.4 104 24.8 38 9.0 31 7.4 1 0.2 34 8.1 43 10.2 12 2.9 4 1.0 16 3.8 11 2.6 37 8.8 2 0.5 17 4.0 3 0.7 2 0.5 10 2.4 0 0.0 3 0.7
AMR Ecuador Countrywide 2002 Survey 997 753 75.5 244 24.5 145 14.5 121 12.1 20 2.0 130 13.0 123 12.3 34 3.4 26 2.6 2 0.2 61 6.1 85 8.5 43 4.3 7 0.7 30 3.0 5 0.5 36 3.6 0 0.0 23 2.3 3 0.3 2 0.2 7 0.7 1 0.1 0 0.0
AMR El Salvador Countrywide 2001 Survey 711 654 92.0 57 8.0 20 2.8 20 2.8 5 0.7 32 4.5 42 5.9 6 0.8 10 1.4 3 0.4 23 3.2 9 1.3 5 0.7 1 0.1 2 0.3 1 0.1 6 0.8 0 0.0 5 0.7 0 0.0 0 0.0 1 0.1 0 0.0 0 0.0
AMR Guatemala Countrywide 2002 Survey 823 505 61.4 318 38.6 128 15.6 73 8.9 83 10.1 260 31.6 190 23.1 14 1.7 8 1.0 26 3.2 142 17.3 61 7.4 5 0.6 3 0.4 18 2.2 35 4.3 67 8.1 1 0.1 46 5.6 6 0.7 1 0.1 2 0.2 1 0.1 10 1.2
AMR Honduras Countrywide 2004 Survey 530 447 84.3 83 15.7 45 8.5 25 4.7 13 2.5 49 9.2 55 10.4 18 3.4 7 1.3 0 0.0 30 5.7 17 3.2 4 0.8 3 0.6 2 0.4 8 1.5 11 2.1 2 0.4 8 1.5 0 0.0 0 0.0 1 0.2 0 0.0 0 0.0
AMR Mexico Baja California, Sinaloa, Oaxaca 1997 Survey 441 350 79.4 91 20.6 59 13.4 42 9.5 25 5.7 44 10.0 51 11.6 25 5.7 4 0.9 1 0.2 21 4.8 32 7.3 10 2.3 3 0.7 3 0.7 16 3.6 8 1.8 2 0.5 0 0.0 0 0.0 2 0.5 3 0.7 1 0.2 0 0.0
AMR Nicaragua Countrywide 2006 Survey 423 344 81.3 79 18.7 51 12.1 12 2.8 13 3.1 46 10.9 51 12.1 24 5.7 2 0.5 2 0.5 23 5.4 10 2.4 1 0.2 3 0.7 1 0.2 5 1.2 18 4.3 1 0.2 15 3.5 1 0.2 0 0.0 0 0.0 0 0.0 1 0.2
AMR Paraguay Countrywide 2001 Survey 286 250 87.4 36 12.6 21 7.3 14 4.9 7 2.4 14 4.9 23 8.0 10 3.5 7 2.4 0 0.0 6 2.1 7 2.4 2 0.7 2 0.7 1 0.3 2 0.7 6 2.1 1 0.3 3 1.0 0 0.0 0 0.0 0 0.0 0 0.0 2 0.7
AMR Peru Countrywide 2006 Survey 2169 1,599 73.7 570 26.3 318 14.7 200 9.2 69 3.2 449 20.7 306 14.1 58 2.7 17 0.8 0 0.0 231 10.7 180 8.3 35 1.6 10 0.5 82 3.8 53 2.4 84 3.9 1 0.0 77 3.6 2 0.1 0 0.0 1 0.0 2 0.1 1 0.0
AMR Puerto Rico Countrywide 2005 Surveillance 94 91 96.8 3 3.2 2 2.1 0 0.0 1 1.1 2 2.1 1 1.1 0 0.0 0 0.0 1 1.1 0 0.0 0 0.0 0 0.0 0 0.0 0 0.0 0 0.0 2 2.1 0 0.0 2 2.1 0 0.0 0 0.0 0 0.0 0 0.0 0 0.0
AMR Uruguay Countrywide 2005 Survey 368 358 97.3 10 2.7 6 1.6 3 0.8 1 0.3 2 0.5 8 2.2 4 1.1 1 0.3 1 0.3 2 0.5 2 0.5 2 0.5 0 0.0 0 0.0 0 0.0 0 0.0 0 0.0 0 0.0 0 0.0 0 0.0 0 0.0 0 0.0 0 0.0
AMR USA Countrywide 2005 Surveillance 10584 9,329 88.1 1,255 11.9 836 7.9 168 1.6 127 1.2 675 6.4 874 8.3 472 4.5 38 0.4 15 0.1 349 3.3 124 1.2 28 0.3 13 0.1 28 0.3 55 0.5 257 2.4 12 0.1 209 2.0 19 0.2 2 0.0 4 0.0 0 0.0 11 0.1
AMR Venezuela Countrywide 1999 Survey 873 783 89.7 90 10.3 54 6.2 27 3.1 16 1.8 52 6.0 50 5.7 19 2.2 6 0.7 1 0.1 24 2.7 18 2.1 6 0.7 2 0.2 6 0.7 4 0.5 22 2.5 3 0.3 13 1.5 1 0.1 1 0.1 0 0.0 2 0.2 2 0.2
EMR Egypt Countrywide 2002 Survey 849 508 59.8 341 40.2 163 19.2 154 18.1 85 10.0 266 31.3 177 20.8 23 2.7 37 4.4 5 0.6 112 13.2 97 11.4 5 0.6 2 0.2 26 3.1 64 7.5 67 7.9 3 0.4 35 4.1 5 0.6 0 0.0 18 2.1 2 0.2 4 0.5
EMR Iran Countrywide 1998 Survey 722 584 80.9 138 19.1 93 12.9 69 9.6 49 6.8 87 12.0 58 8.0 19 2.6 6 0.8 2 0.3 31 4.3 60 8.3 15 2.1 3 0.4 8 1.1 34 4.7 20 2.8 5 0.7 8 1.1 1 0.1 1 0.1 2 0.3 0 0.0 3 0.4
EMR Jordan Countrywide 2004 Survey 141 80 56.7 61 43.3 27 19.1 27 19.1 22 15.6 46 32.6 28 19.9 1 0.7 4 2.8 2 1.4 21 14.9 18 12.8 3 2.1 3 2.1 2 1.4 10 7.1 15 10.6 1 0.7 5 3.5 2 1.4 1 0.7 3 2.1 1 0.7 2 1.4
EMR Lebanon Countrywide 2003 Survey 206 157 76.2 49 23.8 35 17.0 15 7.3 14 6.8 31 15.0 20 9.7 8 3.9 2 1.0 3 1.5 7 3.4 12 5.8 2 1.0 2 1.0 2 1.0 6 2.9 17 8.3 0 0.0 14 6.8 1 0.5 1 0.5 0 0.0 0 0.0 1 0.5
EMR Morocco Countrywide 2006 Survey 1238 1,125 90.9 113 9.1 78 6.3 31 2.5 10 0.8 88 7.1 52 4.2 18 1.5 2 0.2 0 0.0 32 2.6 28 2.3 3 0.2 1 0.1 18 1.5 6 0.5 33 2.7 1 0.1 29 2.3 2 0.2 0 0.0 1 0.1 0 0.0 0 0.0
EMR Oman Countrywide 2006 Surveillance 164 148 90.2 16 9.8 12 7.3 7 4.3 6 3.7 11 6.7 8 4.9 4 2.4 0 0.0 0 0.0 4 2.4 7 4.3 1 0.6 0 0.0 0 0.0 6 3.7 1 0.6 0 0.0 1 0.6 0 0.0 0 0.0 0 0.0 0 0.0 0 0.0
EMR Qatar Countrywide 2006 Surveillance 278 250 89.9 28 10.1 25 9.0 3 1.1 1 0.4 5 1.8 22 7.9 18 6.5 0 0.0 1 0.4 3 1.1 3 1.1 2 0.7 0 0.0 1 0.4 0 0.0 3 1.1 2 0.7 1 0.4 0 0.0 0 0.0 0 0.0 0 0.0 0 0.0
EMR Yemen Countrywide 2004 Survey 563 503 89.3 60 10.7 27 4.8 21 3.7 19 3.4 51 9.1 37 6.6 4 0.7 0 0.0 2 0.4 31 5.5 21 3.7 1 0.2 1 0.2 4 0.7 15 2.7 2 0.4 1 0.2 1 0.2 0 0.0 0 0.0 0 0.0 0 0.0 0 0.0
EUR Andorra Countrywide 2005 Surveillance 9 8 88.9 1 11.1 1 11.1 0 0.0 0 0.0 1 11.1 0 0.0 0 0.0 0 0.0 0 0.0 0 0.0 0 0.0 0 0.0 0 0.0 0 0.0 0 0.0 1 11.1 0 0.0 1 11.1 0 0.0 0 0.0 0 0.0 0 0.0 0 0.0
EUR Armenia Countrywide 2007 Survey 892 432 48.4 460 51.6 365 40.9 220 24.7 98 11.0 365 40.9 148 16.6 58 6.5 18 2.0 1 0.1 71 8.0 199 22.3 12 1.3 1 0.1 120 13.5 66 7.4 113 12.7 5 0.6 81 9.1 22 2.5 0 0.0 2 0.2 1 0.1 2 0.2
EUR Austria Countrywide 2005 Surveillance 609 537 88.2 72 11.8 57 9.4 16 2.6 10 1.6 41 6.7 40 6.6 27 4.4 2 0.3 0 0.0 11 1.8 13 2.1 1 0.2 1 0.2 4 0.7 7 1.1 19 3.1 0 0.0 16 2.6 2 0.3 0 0.0 1 0.2 0 0.0 0 0.0
EUR Azerbaijan Baku City 2007 Survey 1103 327 29.6 776 70.4 665 60.3 434 39.3 239 21.7 697 63.2 170 15.4 61 5.5 1 0.1 0 0.0 108 9.8 431 39.1 13 1.2 3 0.3 205 18.6 210 19.0 175 15.9 1 0.1 147 13.3 25 2.3 0 0.0 2 0.2 0 0.0 0 0.0
EUR Belgium Countrywide 2005 Surveillance 758 710 93.7 48 6.3 42 5.5 13 1.7 14 1.8 0 0.0 33 4.4 27 3.6 2 0.3 4 0.5 0 0.0 11 1.5 5 0.7 6 0.8 0 0.0 0 0.0 4 0.5 4 0.5 0 0.0 0 0.0 0 0.0 0 0.0 0 0.0 0 0.0
EUR Bosnia & Herzegovina Countrywide 2005 Surveillance 1141 1,100 96.4 41 3.6 22 1.9 21 1.8 8 0.7 13 1.1 25 2.2 8 0.7 8 0.7 2 0.2 7 0.6 11 1.0 7 0.6 0 0.0 1 0.1 3 0.3 5 0.4 2 0.2 1 0.1 0 0.0 1 0.1 1 0.1 0 0.0 0 0.0
EUR Croatia Countrywide 2005 Surveillance 647 625 96.6 22 3.4 15 2.3 9 1.4 6 0.9 13 2.0 12 1.9 8 1.2 0 0.0 0 0.0 4 0.6 6 0.9 0 0.0 1 0.2 2 0.3 3 0.5 4 0.6 0 0.0 1 0.2 0 0.0 0 0.0 1 0.2 2 0.3 0 0.0
EUR Czech Republic Countrywide 2005 Surveillance 582 531 91.2 51 8.8 28 4.8 14 2.4 9 1.5 42 7.2 30 5.2 8 1.4 0 0.0 1 0.2 21 3.6 13 2.2 0 0.0 0 0.0 5 0.9 8 1.4 8 1.4 0 0.0 7 1.2 0 0.0 0 0.0 1 0.2 0 0.0 0 0.0
EUR Denmark Countrywide 2005 Surveillance 325 304 93.5 21 6.5 18 5.5 5 1.5 7 2.2 0 0.0 16 4.9 13 4.0 0 0.0 3 0.9 0 0.0 5 1.5 1 0.3 4 1.2 0 0.0 0 0.0 0 0.0 0 0.0 0 0.0 0 0.0 0 0.0 0 0.0 0 0.0 0 0.0
EUR Estonia Countrywide 2005 Surveillance 387 251 64.9 136 35.1 108 27.9 79 20.4 77 19.9 124 32.0 39 10.1 11 2.8 0 0.0 0 0.0 28 7.2 79 20.4 0 0.0 1 0.3 5 1.3 73 18.9 18 4.7 0 0.0 15 3.9 3 0.8 0 0.0 0 0.0 0 0.0 0 0.0
EUR Finland Countrywide 2005 Surveillance 315 301 95.6 14 4.4 11 3.5 4 1.3 4 1.3 3 1.0 10 3.2 7 2.2 1 0.3 1 0.3 1 0.3 3 1.0 1 0.3 0 0.0 0 0.0 2 0.6 1 0.3 1 0.3 0 0.0 0 0.0 0 0.0 0 0.0 0 0.0 0 0.0
EUR France Countrywide 2005 Sentinel 1501 1,358 90.5 143 9.5 94 6.3 26 1.7 13 0.9 80 5.3 96 6.4 47 3.1 2 0.1 3 0.2 44 2.9 24 1.6 8 0.5 2 0.1 8 0.5 6 0.4 23 1.5 1 0.1 21 1.4 1 0.1 0 0.0 0 0.0 0 0.0 0 0.0
EUR Georgia Countrywide 2006 Survey 1422 617 43.4 805 56.6 474 33.3 233 16.4 106 7.5 691 48.6 408 28.7 85 6.0 9 0.6 3 0.2 311 21.9 219 15.4 13 0.9 2 0.1 116 8.2 88 6.2 178 12.5 2 0.1 160 11.3 8 0.6 0 0.0 5 0.4 0 0.0 3 0.2
EUR Germany Countrywide 2005 Surveillance 3886 3,408 87.7 478 12.3 327 8.4 118 3.0 92 2.4 329 8.5 263 6.8 118 3.0 9 0.2 7 0.2 129 3.3 105 2.7 9 0.2 3 0.1 33 0.8 60 1.5 110 2.8 1 0.0 86 2.2 17 0.4 2 0.1 1 0.0 0 0.0 2 0.1
EUR Iceland Countrywide 2005 Surveillance 8 8 100.0 0 0.0 0 0.0 0 0.0 0 0.0 0 0.0 0 0.0 0 0.0 0 0.0 0 0.0 0 0.0 0 0.0 0 0.0 0 0.0 0 0.0 0 0.0 0 0.0 0 0.0 0 0.0 0 0.0 0 0.0 0 0.0 0 0.0 0 0.0
EUR Ireland Countrywide 2005 Surveillance 273 260 95.2 13 4.8 13 4.8 3 1.1 2 0.7 3 1.1 9 3.3 9 3.3 0 0.0 0 0.0 0 0.0 3 1.1 1 0.4 1 0.4 0 0.0 1 0.4 1 0.4 0 0.0 1 0.4 0 0.0 0 0.0 0 0.0 0 0.0 0 0.0
EUR Israel Countrywide 2005 Surveillance 217 171 78.8 46 21.2 32 14.7 12 5.5 13 6.0 41 18.9 15 6.9 2 0.9 0 0.0 1 0.5 12 5.5 12 5.5 1 0.5 1 0.5 2 0.9 8 3.7 19 8.8 0 0.0 16 7.4 2 0.9 0 0.0 0 0.0 0 0.0 1 0.5
EUR Italy Half of the country 2005 Surveillance 585 504 86.2 81 13.8 57 9.7 26 4.4 13 2.2 52 8.9 44 7.5 22 3.8 2 0.3 1 0.2 19 3.2 22 3.8 4 0.7 0 0.0 8 1.4 10 1.7 15 2.6 0 0.0 11 1.9 2 0.3 0 0.0 2 0.3 0 0.0 0 0.0
EUR Kazakhstan Countrywide 2001 Survey 678 211 31.1 467 68.9 369 54.4 252 37.2 262 38.6 431 63.6 76 11.2 14 2.1 2 0.3 7 1.0 53 7.8 231 34.1 8 1.2 1 0.1 56 8.3 166 24.5 160 23.6 2 0.3 68 10.0 54 8.0 2 0.3 4 0.6 13 1.9 17 2.5
EUR Latvia Countrywide 2005 Surveillance 1055 646 61.2 409 38.8 360 34.1 160 15.2 155 14.7 366 34.7 89 8.4 40 3.8 0 0.0 1 0.1 48 4.5 160 15.2 1 0.1 1 0.1 18 1.7 140 13.3 160 15.2 0 0.0 147 13.9 13 1.2 0 0.0 0 0.0 0 0.0 0 0.0

Regio
n
Countr
y
Sub-n
ational
Year
Meth
od
Patients
teste
d
Susceptible
%
Any
resis
tance
%
Any H
%
Any R
%
Any E
%
Any S
%
Mono
%
Mono H
%
Mono R
%
Mono E
%
Mono S
%
MD
R
% HR %
HR
E
%
HR
S
%
HR
ES
%
Poly
% HE % HS %
HE
S
% RE % RS %
RE
S
% ES %
EUR Lithuania Countrywide 2005 Surveillance 1739 1,159 66.6 580 33.4 514 29.6 342 19.7 475 27.3 204 11.7 137 7.9 74 4.3 2 0.1 61 3.5 0 0.0 338 19.4 20 1.2 127 7.3 5 0.3 186 10.7 105 6.0 91 5.2 4 0.2 7 0.4 1 0.1 0 0.0 1 0.1 1 0.1
EUR Luxembourg Countrywide 2005 Surveillance 37 33 89.2 4 10.8 3 8.1 0 0.0 0 0.0 2 5.4 3 8.1 2 5.4 0 0.0 0 0.0 1 2.7 0 0.0 0 0.0 0 0.0 0 0.0 0 0.0 1 2.7 0 0.0 1 2.7 0 0.0 0 0.0 0 0.0 0 0.0 0 0.0
EUR Malta Countrywide 2005 Surveillance 11 9 81.8 2 18.2 0 0.0 0 0.0 0 0.0 2 18.2 2 18.2 0 0.0 0 0.0 0 0.0 2 18.2 0 0.0 0 0.0 0 0.0 0 0.0 0 0.0 0 0.0 0 0.0 0 0.0 0 0.0 0 0.0 0 0.0 0 0.0 0 0.0
EUR Netherlands Countrywide 2005 Surveillance 841 767 91.2 74 8.8 55 6.5 13 1.5 3 0.4 35 4.2 49 5.8 30 3.6 6 0.7 0 0.0 13 1.5 7 0.8 2 0.2 1 0.1 2 0.2 2 0.2 18 2.1 0 0.0 18 2.1 0 0.0 0 0.0 0 0.0 0 0.0 0 0.0
EUR Norway Countrywide 2005 Surveillance 214 170 79.4 44 20.6 21 9.8 3 1.4 4 1.9 31 14.5 33 15.4 10 4.7 0 0.0 3 1.4 20 9.3 3 1.4 0 0.0 0 0.0 3 1.4 0 0.0 8 3.7 0 0.0 7 3.3 1 0.5 0 0.0 0 0.0 0 0.0 0 0.0
EUR Poland Countrywide 2004 Surveillance 3239 2,993 92.4 246 7.6 162 5.0 66 2.0 16 0.5 131 4.0 164 5.1 82 2.5 13 0.4 3 0.1 66 2.0 51 1.6 14 0.4 2 0.1 26 0.8 9 0.3 31 1.0 1 0.0 27 0.8 1 0.0 0 0.0 2 0.1 0 0.0 0 0.0
EUR Portugal Countrywide 2005 Surveillance 1579 1,331 84.3 238 15.1 117 7.4 33 2.1 28 1.8 163 10.3 165 10.4 48 3.0 3 0.2 11 0.7 103 6.5 28 1.8 8 0.5 3 0.2 9 0.6 8 0.5 45 2.8 2 0.1 38 2.4 1 0.1 0 0.0 1 0.1 1 0.1 2 0.1
EUR Republic of Moldova Countrywide 2006 Surveillance 2879 1,076 37.4 1,803 62.6 1,516 52.7 1,279 44.4 714 24.8 1,447 50.3 317 11.0 89 3.1 29 1.0 45 1.6 154 5.3 1,204 41.8 151 5.2 482 16.7 14 0.5 557 19.3 282 9.8 23 0.8 155 5.4 45 1.6 5 0.2 29 1.0 12 0.4 13 0.5
EUR Romania Countrywide 2004 Surveillance 1251 1,002 80.1 249 19.9 180 14.4 91 7.3 74 5.9 140 11.2 125 10.0 62 5.0 20 1.6 2 0.2 41 3.3 67 5.4 13 1.0 5 0.4 9 0.7 40 3.2 57 4.6 7 0.6 27 2.2 17 1.4 0 0.0 3 0.2 1 0.1 2 0.2
EUR Russian Federation Ivanovo Oblast 2002 Surveillance 505 225 44.6 280 55.4 225 44.6 140 27.7 109 21.6 264 52.3 51 10.1 6 1.2 3 0.6 1 0.2 41 8.1 133 26.3 2 0.4 1 0.2 43 8.5 87 17.2 96 19.0 3 0.6 73 14.5 12 2.4 0 0.0 3 0.6 1 0.2 4 0.8
EUR Russian Federation Orel Oblast 2006 Surveillance 347 246 70.9 101 29.1 78 22.5 35 10.1 20 5.8 87 25.1 29 8.4 7 2.0 1 0.3 0 0.0 21 6.1 33 9.5 3 0.9 1 0.3 15 4.3 14 4.0 39 11.2 2 0.6 33 9.5 3 0.9 0 0.0 1 0.3 0 0.0 0 0.0
EUR Russian Federation Mary El oblast 2006 Surveillance new only . . . . . . . . . . . . . . . . . . . . . . . .
EUR Russian Federation Tomsk Oblast 2005 Surveillance new only . . . . . . . . . . . . . . . . . . . . . . . .
EUR Serbia Countrywide 2005 Surveillance 1233 1,186 96.2 47 3.8 16 1.3 17 1.4 13 1.1 28 2.3 30 2.4 5 0.4 4 0.3 1 0.1 20 1.6 9 0.7 2 0.2 3 0.2 2 0.2 2 0.2 8 0.6 2 0.2 0 0.0 0 0.0 2 0.2 1 0.1 1 0.1 2 0.2
EUR Slovakia Countrywide 2005 Surveillance 311 282 90.7 29 9.3 23 7.4 11 3.5 1 0.3 13 4.2 13 4.2 9 2.9 1 0.3 0 0.0 3 1.0 8 2.6 5 1.6 0 0.0 3 1.0 0 0.0 8 2.6 1 0.3 5 1.6 0 0.0 0 0.0 2 0.6 0 0.0 0 0.0
EUR Slovenia Countrywide 2005 Surveillance 245 231 94.3 14 5.7 10 4.1 1 0.4 1 0.4 7 2.9 11 4.5 7 2.9 0 0.0 0 0.0 4 1.6 1 0.4 0 0.0 0 0.0 1 0.4 0 0.0 2 0.8 0 0.0 1 0.4 1 0.4 0 0.0 0 0.0 0 0.0 0 0.0
EUR Spain Galicia 2005 Surveillance 634 588 92.7 46 7.3 25 3.9 2 0.3 1 0.2 28 4.4 37 5.8 16 2.5 0 0.0 1 0.2 20 3.2 2 0.3 1 0.2 0 0.0 1 0.2 0 0.0 7 1.1 0 0.0 7 1.1 0 0.0 0 0.0 0 0.0 0 0.0 0 0.0
EUR Spain Aragon 2005 Surveillance 226 208 92.0 18 8.0 16 7.1 5 2.2 3 1.3 4 1.8 12 5.3 10 4.4 1 0.4 0 0.0 1 0.4 4 1.8 2 0.9 0 0.0 0 0.0 2 0.9 2 0.9 1 0.4 1 0.4 0 0.0 0 0.0 0 0.0 0 0.0 0 0.0
EUR Spain Barcelona 2005 Surveillance 538 485 90.1 53 9.9 28 5.2 5 0.9 1 0.2 33 6.1 42 7.8 17 3.2 1 0.2 0 0.0 24 4.5 4 0.7 2 0.4 0 0.0 1 0.2 1 0.2 7 1.3 0 0.0 7 1.3 0 0.0 0 0.0 0 0.0 0 0.0 0 0.0
EUR Sweden Countrywide 2005 Surveillance 442 386 87.3 56 12.7 46 10.4 5 1.1 3 0.7 9 2.0 52 11.8 42 9.5 1 0.2 1 0.2 8 1.8 4 0.9 2 0.5 1 0.2 0 0.0 1 0.2 0 0.0 0 0.0 0 0.0 0 0.0 0 0.0 0 0.0 0 0.0 0 0.0
EUR Switzerland Countrywide 2005 Surveillance 457 433 94.7 24 5.3 23 5.0 6 1.3 2 0.4 0 0.0 19 4.2 18 3.9 1 0.2 0 0.0 0 0.0 5 1.1 3 0.7 2 0.4 0 0.0 0 0.0 0 0.0 0 0.0 0 0.0 0 0.0 0 0.0 0 0.0 0 0.0 0 0.0
EUR Turkmenistan Dashoguz Velayat (Aral Sea Region) 2002 Survey 203 110 54.2 93 45.8 63 31.0 23 11.3 17 8.4 76 37.4 45 22.2 15 7.4 1 0.5 0 0.0 29 14.3 22 10.8 0 0.0 0 0.0 13 6.4 9 4.4 26 12.8 1 0.5 18 8.9 7 3.4 0 0.0 0 0.0 0 0.0 0 0.0
EUR Ukraine Donetsk 2006 Survey 1497 751 50.2 746 49.8 609 40.7 421 28.1 70 4.7 537 35.9 215 14.4 101 6.7 20 1.3 1 0.1 93 6.2 379 25.3 72 4.8 11 0.7 251 16.8 45 3.0 152 10.2 4 0.3 117 7.8 8 0.5 0 0.0 22 1.5 0 0.0 1 0.1
EUR United Kingdom Countrywide 2005 Surveillance 4800 4,459 92.9 341 7.1 322 6.7 54 1.1 16 0.3 3 0.1 297 6.2 278 5.8 15 0.3 3 0.1 1 0.0 39 0.8 29 0.6 10 0.2 0 0.0 0 0.0 5 0.1 3 0.1 2 0.0 0 0.0 0 0.0 0 0.0 0 0.0 0 0.0
EUR Uzbekistan Tashkent 2005 Survey 292 112 38.4 180 61.6 158 54.1 85 29.1 50 17.1 162 55.5 36 12.3 15 5.1 1 0.3 0 0.0 20 6.8 83 28.4 2 0.7 0 0.0 38 13.0 43 14.7 61 20.9 0 0.0 53 18.2 7 2.4 0 0.0 1 0.3 0 0.0 0 0.0
SEAR India Mayhurbhanj District, Orissa State 2001 Survey new only . . . . . . . . . . . . . . . . . . . . . . . .
SEAR India Wardha District, Maharashtra State 2001 Survey new only . . . . . . . . . . . . . . . . . . . . . . . .
SEAR India Delhi State 1995 Survey 2240 1,514 67.6 726 32.4 646 28.8 314 14.0 156 7.0 406 18.1 245 10.9 181 8.1 7 0.3 4 0.2 53 2.4 298 13.3 94 4.2 22 1.0 104 4.6 78 3.5 183 8.2 12 0.5 123 5.5 32 1.4 0 0.0 8 0.4 1 0.0 7 0.3
SEAR India Raichur District, Karnataka State 1999 Survey new only . . . . . . . . . . . . . . . . . . . . . . . .
SEAR India North Arcot District, Tamil Nadu State 1999 Survey new only . . . . . . . . . . . . . . . . . . . . . . . .
SEAR India Ernakulam district, Kerala State 2004 Survey new only . . . . . . . . . . . . . . . . . . . . . . . .
SEAR India Gujarat State 2006 Survey 2618 1,798 68.7 820 31.3 558 21.3 230 8.8 135 5.2 502 19.2 466 17.8 206 7.9 13 0.5 3 0.1 244 9.3 219 8.4 56 2.1 28 1.1 53 2.0 82 3.1 135 5.2 10 0.4 111 4.2 14 0.5 0 0.0 0 0.0 0 0.0 0 0.0
SEAR India Tamil Nadu State 1997 Survey new only . . . . . . . . . . . . . . . . . . . . . . . .
SEAR India Hoogli district, West Bengal State 2001 Survey new only . . . . . . . . . . . . . . . . . . . . . . . .
SEAR Indonesia Mimika district, Papua Province 2004 Survey new only . . . . . . . . . . . . . . . . . . . . . . . .
SEAR Myanmar Countrywide 2003 Survey 849 741 87.3 108 12.7 79 9.3 52 6.1 10 1.2 74 8.7 33 3.9 9 1.1 0 0.0 0 0.0 24 2.8 47 5.5 20 2.4 3 0.4 19 2.2 5 0.6 28 3.3 1 0.1 22 2.6 0 0.0 1 0.1 4 0.5 0 0.0 0 0.0
SEAR Nepal Countrywide 2007 Survey 930 776 83.4 154 16.6 101 10.9 41 4.4 43 4.6 113 12.2 80 8.6 27 2.9 0 0.0 4 0.4 49 5.3 41 4.4 4 0.4 4 0.4 8 0.9 25 2.7 33 3.5 2 0.2 23 2.5 8 0.9 0 0.0 0 0.0 0 0.0 0 0.0
SEAR Sri Lanka Countrywide 2006 Survey 624 613 98.2 11 1.8 6 1.0 3 0.5 1 0.2 5 0.8 9 1.4 4 0.6 2 0.3 0 0.0 3 0.5 1 0.2 0 0.0 0 0.0 0 0.0 1 0.2 1 0.2 0 0.0 1 0.2 0 0.0 0 0.0 0 0.0 0 0.0 0 0.0
SEAR Thailand Countrywide 2006 Survey 1344 1,066 79.3 278 20.7 197 14.7 98 7.3 70 5.2 156 11.6 154 11.5 75 5.6 11 0.8 5 0.4 63 4.7 86 6.4 15 1.1 12 0.9 14 1.0 45 3.3 38 2.8 4 0.3 29 2.2 3 0.2 0 0.0 1 0.1 0 0.0 1 0.1
WPR Australia Countrywide 2005 Surveillance 808 726 89.9 82 10.1 71 8.8 14 1.7 7 0.9 35 4.3 53 6.6 43 5.3 1 0.1 0 0.0 9 1.1 12 1.5 1 0.1 1 0.1 5 0.6 5 0.6 17 2.1 1 0.1 15 1.9 0 0.0 0 0.0 1 0.1 0 0.0 0 0.0
WPR Cambodia Countrywide 2001 Survey 734 651 88.7 83 11.3 57 7.8 7 1.0 1 0.1 39 5.3 64 8.7 39 5.3 3 0.4 0 0.0 22 3.0 3 0.4 1 0.1 0 0.0 2 0.3 0 0.0 16 2.2 1 0.1 14 1.9 0 0.0 0 0.0 1 0.1 0 0.0 0 0.0
WPR China Guandong Province 1999 Survey 524 440 84.0 84 16.0 58 11.1 30 5.7 20 3.8 41 7.8 46 8.8 24 4.6 3 0.6 0 0.0 19 3.6 24 4.6 8 1.5 5 1.0 2 0.4 9 1.7 14 2.7 1 0.2 7 1.3 2 0.4 2 0.4 1 0.2 0 0.0 1 0.2
WPR China Beijing Municipality 2004 Survey 1197 956 79.9 241 20.1 129 10.8 67 5.6 57 4.8 128 10.7 130 10.9 42 3.5 13 1.1 14 1.2 61 5.1 42 3.5 21 1.8 3 0.3 12 1.0 6 0.5 69 5.8 14 1.2 29 2.4 2 0.2 6 0.5 6 0.5 0 0.0 12 1.0
WPR China Shandong Province 1997 Survey 1229 941 76.6 288 23.4 203 16.5 89 7.2 40 3.3 199 16.2 134 10.9 59 4.8 7 0.6 1 0.1 67 5.5 72 5.9 11 0.9 6 0.5 30 2.4 25 2.0 82 6.7 4 0.3 65 5.3 3 0.2 1 0.1 9 0.7 0 0.0 0 0.0
WPR China Henan Province 2001 Survey 1487 962 64.7 525 35.3 333 22.4 230 15.5 101 6.8 385 25.9 228 15.3 51 3.4 25 1.7 14 0.9 138 9.3 192 12.9 38 2.6 7 0.5 88 5.9 59 4.0 105 7.1 2 0.1 75 5.0 13 0.9 3 0.2 9 0.6 1 0.1 2 0.1
WPR China (3) Liaoning Province 1999 Survey 904 512 56.6 392 43.4 243 26.9 118 13.1 43 4.8 315 34.8 190 21.0 46 5.1 7 0.8 2 0.2 135 14.9 106 11.7 16 1.8 2 0.2 60 6.6 28 3.1 96 10.6 3 0.3 82 9.1 6 0.7 1 0.1 3 0.3 1 0.1 0 0.0
WPR China Heilongjiang Province 2005 Survey 1995 1,142 57.2 853 42.8 470 23.6 337 16.9 196 9.8 519 26.0 441 22.1 98 4.9 58 2.9 3 0.2 282 14.1 241 12.1 49 2.5 121 6.1 10 0.5 61 3.1 171 8.6 3 0.2 125 6.3 3 0.2 2 0.1 35 1.8 1 0.1 2 0.1
WPR China Hubei Province 1999 Survey 1097 841 76.7 256 23.3 162 14.8 97 8.8 26 2.4 159 14.5 126 11.5 45 4.1 14 1.3 1 0.1 66 6.0 70 6.4 25 2.3 7 0.6 27 2.5 11 1.0 60 5.5 2 0.2 43 3.9 2 0.2 3 0.3 10 0.9 0 0.0 0 0.0
WPR China Zhejiang Province 1999 Survey 942 740 78.6 202 21.4 133 14.1 115 12.2 37 3.9 111 11.8 93 9.9 32 3.4 22 2.3 3 0.3 36 3.8 85 9.0 30 3.2 1 0.1 27 2.9 27 2.9 24 2.5 1 0.1 12 1.3 3 0.3 2 0.2 6 0.6 0 0.0 0 0.0
WPR China Shanghai Municipality 2005 Survey 964 791 82.1 173 17.9 128 13.3 67 7.0 43 4.5 87 9.0 76 7.9 36 3.7 8 0.8 1 0.1 31 3.2 55 5.7 13 1.3 27 2.8 3 0.3 12 1.2 42 4.4 1 0.1 36 3.7 0 0.0 0 0.0 3 0.3 1 0.1 1 0.1
WPR China Inner Mongolia Autonomous region 2002 Survey 1114 616 55.3 498 44.7 338 30.3 236 21.2 170 15.3 264 23.7 200 18.0 63 5.7 29 2.6 5 0.4 103 9.2 188 16.9 47 4.2 77 6.9 10 0.9 54 4.8 110 9.9 11 1.0 61 5.5 15 1.3 2 0.2 15 1.3 2 0.2 4 0.4
WPR China, Hong Kong SAR Hong Kong 2005 Surveillance 4350 3,873 89.0 477 11.0 228 5.2 57 1.3 36 0.8 353 8.1 336 7.7 92 2.1 12 0.3 2 0.0 230 5.3 41 0.9 8 0.2 3 0.1 13 0.3 17 0.4 100 2.3 5 0.1 85 2.0 5 0.1 2 0.0 1 0.0 1 0.0 1 0.0
WPR China, Macao SAR Macao 2005 Surveillance 284 237 83.5 47 16.5 32 11.3 10 3.5 5 1.8 30 10.6 30 10.6 15 5.3 1 0.4 0 0.0 14 4.9 9 3.2 1 0.4 0 0.0 4 1.4 4 1.4 8 2.8 0 0.0 7 2.5 1 0.4 0 0.0 0 0.0 0 0.0 0 0.0
WPR Fiji Countrywide 2006 Surveillance 38 38 100.0 0 0.0 0 0.0 0 0.0 0 0.0 0 0.0 0 0.0 0 0.0 0 0.0 0 0.0 0 0.0 0 0.0 0 0.0 0 0.0 0 0.0 0 0.0 0 0.0 0 0.0 0 0.0 0 0.0 0 0.0 0 0.0 0 0.0 0 0.0
WPR Guam Countrywide 2002 Survey 47 45 95.7 2 4.3 4 8.5 2 4.3 1 2.1 2 4.3 0 0.0 0 0.0 0 0.0 0 0.0 0 0.0 2 4.3 0 0.0 0 0.0 0 0.0 0 0.0 0 0.0 0 0.0 0 0.0 0 0.0 0 0.0 0 0.0 0 0.0 0 0.0
WPR Japan Countrywide 2002 Surveillance 3122 2,784 89.2 338 10.8 156 5.0 74 2.4 58 1.9 248 7.9 233 7.5 59 1.9 7 0.2 3 0.1 164 5.3 60 1.9 8 0.3 9 0.3 13 0.4 30 1.0 45 1.4 3 0.1 27 0.9 7 0.2 1 0.0 2 0.1 4 0.1 1 0.0
WPR Malaysia Peninsular Malaysia 1997 Survey 1017 966 95.0 51 5.0 16 1.6 6 0.6 5 0.5 32 3.1 45 4.4 10 1.0 5 0.5 4 0.4 26 2.6 1 0.1 0 0.0 0 0.0 0 0.0 1 0.1 5 0.5 0 0.0 5 0.5 0 0.0 0 0.0 0 0.0 0 0.0 0 0.0
WPR Mongolia Countrywide 1999 Survey new only . . . . . . . . . . . . . . . . . . . . . . . .
WPR New Caledonia Countrywide 2005 Survey 5 4 80.0 1 20.0 1 20.0 0 0.0 0 0.0 1 20.0 0 0.0 0 0.0 0 0.0 0 0.0 0 0.0 0 0.0 0 0.0 0 0.0 0 0.0 0 0.0 1 20.0 0 0.0 1 20.0 0 0.0 0 0.0 0 0.0 0 0.0 0 0.0
WPR New Zealand Countrywide 2006 Surveillance 266 239 89.8 27 10.2 18 6.8 1 0.4 1 0.4 18 6.8 18 6.8 9 3.4 0 0.0 0 0.0 9 3.4 1 0.4 0 0.0 0 0.0 0 0.0 1 0.4 8 3.0 0 0.0 8 3.0 0 0.0 0 0.0 0 0.0 0 0.0 0 0.0
WPR Northern Mariana Is Countrywide 2006 Surveillance new only . . . . . . . . . . . . . . . . . . . . . . . .
WPR Philippines Countrywide 2004 Survey 1094 848 77.5 246 22.5 170 15.5 77 7.0 53 4.8 137 12.5 139 12.7 67 6.1 9 0.8 1 0.1 62 5.7 66 6.0 17 1.6 9 0.8 13 1.2 27 2.5 41 3.7 5 0.5 24 2.2 8 0.7 1 0.1 1 0.1 0 0.0 2 0.2
WPR Rep. Korea Countrywide 2004 Survey 2914 2,516 86.3 398 13.7 328 11.3 145 5.0 97 3.3 86 3.0 232 8.0 165 5.7 32 1.1 7 0.2 28 1.0 110 3.8 38 1.3 49 1.7 8 0.3 15 0.5 56 1.9 20 0.7 29 1.0 4 0.1 1 0.0 1 0.0 1 0.0 0 0.0
WPR Singapore Countrywide 2005 Surveillance 1000 931 93.1 69 6.9 34 3.4 8 0.8 8 0.8 42 4.2 53 5.3 18 1.8 5 0.5 2 0.2 28 2.8 3 0.3 0 0.0 0 0.0 0 0.0 3 0.3 13 1.3 2 0.2 10 1.0 1 0.1 0 0.0 0 0.0 0 0.0 0 0.0
WPR Solomon Islands Countrywide 2004 Survey 84 84 100.0 0 0.0 0 0.0 0 0.0 0 0.0 0 0.0 0 0.0 0 0.0 0 0.0 0 0.0 0 0.0 0 0.0 0 0.0 0 0.0 0 0.0 0 0.0 0 0.0 0 0.0 0 0.0 0 0.0 0 0.0 0 0.0 0 0.0 0 0.0
WPR Vanuatu Countrywide 2006 Surveillance new only . . . . . . . . . . . . . . . . . . . . . . . .
WPR Viet Nam Countrywide 2006 Survey 1826 1,207 66.1 619 33.9 400 21.9 97 5.3 72 3.9 480 26.3 329 18.0 122 6.7 7 0.4 5 0.3 195 10.7 84 4.6 5 0.3 0 0.0 35 1.9 44 2.4 206 11.3 0 0.0 177 9.7 17 0.9 0 0.0 6 0.3 0 0.0 6 0.3
(1) Several countries conducting routine diagnostic surveillance do not routinely test for streptomycin. Where this is the case the proportion tested is indicated in a footnote.
(2) Data from UR Tanzania and Madagascar are preliminary
(3) Based on patient re-interviews it is expected that between 20-30% of resistant cases may have been classified as new when in fact they had been treated previously. Therefore, MDR among new cases could be reduced from 10% to 8%. The reduction would be

Annex 4. Survey methods 1994-2007
Region
Country
Sub-national
Year
Report
Population in area
surveyed
TB patients notified
in area surveyed
sm+ TB patients
notified in area
surveyed
Patients tested
Method
Survey duration
(months)
Medical record/ TB
register cross check
Patient interview
Re-interview
Sample target
complete
Software
AFR Algeria Countrywide 2001 3 32,853,798 21,501 8,654 713 Proportionate cluster 12 Structured questionaire Yes
AFR Benin Countrywide 1997 1 8,438,853 3,457 2,739 337 Proportionate cluster 24 No Yes
AFR Botswana Countrywide 2002 3 1,764,926 10,104 3,170 548 100% diagnostic units 8 Structured questionaire No Yes
AFR Central African Republic Bangui 1998 2 620,000 3,338 2,153 291 100% diagnostic units 3 No Yes
AFR Côte d'Ivoire Countrywide 2006 4 18,153,867 20,026 12,496 980 Proportionate cluster Structured questionaire Yes
AFR DR Congo Kinshasa 1999 3 18,207 10,710 1,338 Proportionate cluster Structured questionaire No
AFR Ethiopia Countrywide 2005 4 77,430,702 125,135 38,525 3,119 Proportionate cluster 12 Structured questionaire Slightly under target
AFR Gambia Countrywide 2000 3 1,517,079 2,120 1,127 166 100% diagnostic units 7 No Yes
AFR Guinea Sentinel sites 1998 2 7,164,893 7,000 3,362 120 Random cluster 10 No Yes
AFR Kenya Nearly Countrywide 1995 1 34,255,722 108,401 40,389 8,975 Proportionate cluster 5 No
AFR Lesotho Countrywide 1995 1 1,794,769 11,404 4,280 1,041 Proportionate cluster 18 No Yes
AFR Madagascar Countrywide 2007 4 18,605,921 19,475 13,056 1,498 Proportionate cluster 23 Yes Structured questionaire Yes Yes Epi Info
AFR Mozambique Countrywide 1999 2 19,792,295 33,718 17,877 1,886 Proportionate cluster 9 Structured questionaire No Yes
AFR Rwanda Countrywide 2005 4 9,037,690 7,680 4,166 831 100% diagnostic units 4 Yes Structured questionaire Yes Yes SPSS
AFR Senegal Countrywide 2006 4 11,658,172 10,120 6,722 920 Proportionate cluster 16 Yes Structured questionaire Yes Yes SDRTB4
AFR Sierra Leone Nearly Countrywide 1997 2 5,525,478 6,930 4,370 330 Random cluster 6 No Yes
AFR South Africa Countrywide 2002 3 47,431,829 302,467 125,460 60,588 Proportionate cluster 12 Structured questionaire No Yes
AFR Swaziland Countrywide 1995 1 1,032,438 8,864 2,187 470 Proportionate cluster 18 No Yes
AFR Uganda 3 GLRA Zones * 1997 2 9,919,700 16,000 5,405 5,405 Proportionate cluster 18 No Yes
AFR UR Tanzania Countrywide 2007 4 38,328,809 64,200 25,264 5,032 Proportionate cluster 16 Structured questionaire Yes Unfinished MS Excel and Epi Info
AFR Zambia Countrywide 2000 3 11,668,457 53,267 14,857 5,496 Proportionate cluster 14 Structured questionaire No Yes
AFR Zimbabwe Nearly Countrywide 1995 1 13,009,534 54,891 13,155 5,941 All diagnostic centers 30 Structured questionaire No Yes
AMR Argentina Countrywide 2005 4 38,747,148 11,242 4,709 809 Proportionate cluster 12 Yes Structured questionaire Yes Slightly under target SDRTB4 Epi Info
AMR Bolivia Countrywide 1996 1 9,182,015 9,973 6,278 772 Proportionate cluster 11 No Yes
AMR Brazil Nearly Countrywide 1996 1 186,404,913 87,223 42,093 9,637 Proportionate cluster 14
AMR Canada Countrywide 2005 4 32,268,243 1,616 433 103 All bacteriologically confirmed cases (100%) 12 Yes Routine Yes Yes Oracle and MS Access
AMR Chile Countrywide 2001 3 16,295,102 2,225 1,186 232 Proportionate cluster 6 Structured questionaire No Yes
AMR Colombia Countrywide 2000 3 45,600,244 10,360 6,870 443 Proportionate cluster 12 No Yes
AMR Costa Rica Countrywide 2006 4 4,327,228 560 330 45 100% diagnostic units 16 Yes Structured questionaire Yes No SDRTB4
AMR Cuba Countrywide 2005 4 11,269,400 781 467 49 Proportionate cluster 12 Yes Routine Yes Yes MS Excel
AMR Dominican Republic Countrywide 1995 1 8,894,907 5,312 2,949 729 Proportionate cluster 21 No Yes
AMR Ecuador Countrywide 2002 3 13,228,423 4,808 3,048 795 100% diagnostic units 18 Structured questionaire No Yes
AMR El Salvador Countrywide 2001 3 6,880,951 1,830 1,059 114 100% diagnostic units 12 Structured questionaire Yes
AMR Guatemala Countrywide 2002 4 12,599,059 3,861 2,420 159 Proportionate cluster 10 Structured questionaire Yes Yes MS Excel
AMR Honduras Countrywide 2004 3 7,204,723 3,333 2,069 181 Proportionate cluster 30 Yes Structured questionaire Yes Yes SDRTB4
AMR Mexico Baja California, Sinaloa, Oaxaca 1997 2 94,732,320 19,932 11,997 2,026 100% diagnostic units 7 No
AMR Nicaragua Countrywide 2006 4 - Proportionate cluster 17 Yes Structured questionaire Yes Yes SDRTB4 and Epi Info
AMR Paraguay Countrywide 2001 4 6,158,259 2,348 1,260 273 Proportionate cluster Structured questionaire Yes
AMR Peru Countrywide 2006 4 27,968,244 35,541 18,490 4,989 Proportionate cluster 8 Yes Structured questionaire Yes Yes SDRTB4 National surveillance system
AMR Puerto Rico Countrywide 2005 4 3,954,584 113 60 - All bacteriologically confirmed cases (100%) 12 No Not collected at National level No NA TIMS and SAS
AMR Uruguay Countrywide 2005 4 3,463,197 626 355 19 12 Structured questionaire Yes
AMR USA Countrywide 2005 4 298,212,895 14,097 5,089 All bacteriologically confirmed cases (100%) 12 Not collected at National level No NA TIMS and SAS
AMR Venezuela Countrywide 1999 3 26,749,114 6,950 3,653 350 Proportionate cluster 9 Structured questionaire No Yes
EMR Egypt Countrywide 2002 3 74,032,884 11,735 5,217 738 Proportionate cluster 12 Structured questionaire No Yes
EMR Iran Countrywide 1998 2 69,515,206 9,608 4,686 474 Random cluster 18 No Yes
EMR Jordan Countrywide 2004 4 5,702,776 371 86 10 100% diagnostic units 12 Yes Structured questionaire Yes Yes MS Excel
EMR Lebanon Countrywide 2003 4 3,576,818 391 131 4 100% diagnostic units 22 Yes Structured questionaire Yes Yes MS Excel
EMR Morocco Countrywide 2006 4 31,478,460 26,269 12,757 Proportionate cluster 22 Yes Structured questionaire Yes Yes Epi Info

Region
Country
Sub-national
Year
Report
Population in area
surveyed
TB patients notified
in area surveyed
sm+ TB patients
notified in area
surveyed
Patients tested
Method
Survey duration
(months)
Medical record/ TB
register cross check
Patient interview
Re-interview
Sample target
complete
Software
EMR Oman Countrywide 2006 4 2,566,981 261 131 4 All bacteriologically confirmed cases (100%) 12 Routine NA
EMR Qatar Countrywide 2006 4 812,842 325 96 - All bacteriologically confirmed cases (100%) 12 Yes Routine NA
EMR Yemen Countrywide 2004 4 20,974,655 9,063 3,379 351 100% diagnostic units 12 Structured questionaire MS Excel
EUR Andorra Countrywide 2005 4 67,151 10 5 - All bacteriologically confirmed cases (100%) 12 Routine NA
EUR Armenia Countrywide 2007 4 3,016,312 2,322 581 327 100% diagnostic units 13 Yes Structured questionaire Yes Yes
EUR Austria Countrywide 2005 4 8,189,444 954 234 26 All bacteriologically confirmed cases (100%) 12 Routine NA SDRTB4
EUR Azerbaijan Baku City 2007 4 1,827,500 3,960 781 - 100% diagnostic units 11 Yes Structured questionaire Yes Yes
EUR Belgium Countrywide 2005 4 10,419,049 1,144 380 68 All bacteriologically confirmed cases (100%) 12 Routine NA SDRTB4 and MS Excel
EUR Bosnia & Herzegovina Countrywide 2005 4 3,907,074 2,160 640 156 All bacteriologically confirmed cases (100%) 12 Routine NA
EUR Croatia Countrywide 2005 4 4,551,338 1,144 372 94 All bacteriologically confirmed cases (100%) 12 Routine NA
EUR Czech Republic Countrywide 2005 4 10,219,603 1,007 308 34 All bacteriologically confirmed cases (100%) 12 Routine NA
EUR Denmark Countrywide 2005 4 5,430,590 424 129 29 All bacteriologically confirmed cases (100%) 12 Routine NA
EUR Estonia Countrywide 2005 4 1,329,697 519 162 94 All bacteriologically confirmed cases (100%) 12 Routine NA
EUR Finland Countrywide 2005 4 5,249,060 361 130 22 All bacteriologically confirmed cases (100%) 12 Routine NA
EUR France Countrywide 2005 4 60,495,537 5,374 1,941 371 All bacteriologically confirmed cases (100%) 12 Routine NA
EUR Georgia Countrywide 2006 4 4,474,404 6,448 1,509 2,152 100% diagnostic units 12 Yes Structured questionaire Yes Yes
EUR Germany Countrywide 2005 4 82,689,210 6,045 1,379 493 All bacteriologically confirmed cases (100%) 12 Routine NA SDRTB3
EUR Iceland Countrywide 2005 4 294,561 11 2 1 All bacteriologically confirmed cases (100%) 12 Routine NA
EUR Ireland Countrywide 2005 4 4,147,901 461 130 40 All bacteriologically confirmed cases (100%) 12 Routine NA
EUR Israel Countrywide 2005 4 6,724,564 406 98 7 All bacteriologically confirmed cases (100%) 12 Routine NA
EUR Italy Half of the country 2005 4 - All bacteriologically confirmed cases (100%) 12 Routine NA
EUR Kazakhstan Countrywide 2001 3 14,825,105 31,187 6,911 8,884 100% diagnostic units 2 Structured questionaire No Yes
EUR Latvia Countrywide 2005 4 2,306,988 1,443 536 205 All bacteriologically confirmed cases (100%) 12 Routine NA
EUR Lithuania Countrywide 2005 4 3,431,033 2,574 964 460 All bacteriologically confirmed cases (100%) 12 Routine NA
EUR Luxembourg Countrywide 2005 4 464,904 37 14 - All bacteriologically confirmed cases (100%) 12 Routine NA
EUR Malta Countrywide 2005 4 401,630 23 5 1 All bacteriologically confirmed cases (100%) 12 Routine NA
EUR Netherlands Countrywide 2005 4 16,299,173 1,157 237 44 All bacteriologically confirmed cases (100%) 12 Routine NA
EUR Norway Countrywide 2005 4 4,620,275 290 48 14 All bacteriologically confirmed cases (100%) 12 Routine NA
EUR Poland Countrywide 2004 4 38,529,562 9,280 2,823 1,077 100% diagnostic units 12 Yes Routine Yes
EUR Portugal Countrywide 2005 4 10,494,502 3,536 1,302 350
EUR Republic of Moldova Countrywide 2006 4 4,205,747 6,278 1,696 1,777 100% diagnostic units 12 Yes Routine Yes Yes
EUR Romania Countrywide 2004 4 21,711,472 29,347 10,801 6,938 100% diagnostic units 12 Structured questionaire Yes
EUR Russian Federation Ivanovo Oblast 2002 3 1,114,925 1,363 684 All bacteriologically confirmed cases (100%) 12 No NA
EUR Russian Federation Orel Oblast 2006 4 842,351 486 286 - All bacteriologically confirmed cases (100%) 12 Routine NA
EUR Russian Federation Mary El oblast 2006 4 716,850 588 480 - All bacteriologically confirmed cases (100%) 12 Routine NA
EUR Russian Federation Tomsk Oblast 2005 4 1,036,500 990 968 215 All bacteriologically confirmed cases (100%) 12 Routine NA
EUR Serbia Countrywide 2005 4 - All bacteriologically confirmed cases (100%) 12 Routine NA
EUR Slovakia Countrywide 2005 4 5,400,908 760 162 108 All bacteriologically confirmed cases (100%) 12 Routine NA
EUR Slovenia Countrywide 2005 4 1,966,814 278 109 29 All bacteriologically confirmed cases (100%) 12 Routine NA MS Excel
EUR Spain Galicia 2005 4 2,750,985 1,053 361 96 All bacteriologically confirmed cases (100%) 12 Yes Structured questionaire Yes NA MS Access
EUR Spain Aragon 2005 4 1,230,090 255 121 26 All bacteriologically confirmed cases (100%) 12 Yes Structured questionaire No NA
EUR Spain Barcelona 2005 4 2,736,589 410 109 - All bacteriologically confirmed cases (100%) 12 Structured questionaire Yes NA
EUR Sweden Countrywide 2005 4 9,041,262 569 134 30 All bacteriologically confirmed cases (100%) 12 Routine NA
EUR Switzerland Countrywide 2005 4 7,252,331 626 108 118 All bacteriologically confirmed cases (100%) 12 Routine NA
EUR Turkmenistan Dashoguz Velayat (Aral Sea Region) 2002 3 1,141,900 1,300 366 425 100% diagnostic units 9 No Yes
EUR Ukraine Donetsk 2006 4 4,659,018 6,346 1,283 1,764 100% diagnostic units 12 Yes Structured questionaire Yes Yes (civilian only)
EUR United Kingdom Countrywide 2005 4 59,667,844 8,633 1,821 460 All bacteriologically confirmed cases (100%) 12 Routine NA
EUR Uzbekistan Tashkent 2005 4 4,839 2,847 - 100% diagnostic units 12 Structured questionaire Yes
SEAR India Mayhurbhanj District, Orissa State 2001 4 2,400,000 4,412 2,130 155 100% diagnostic units 9 Yes Structured questionaire Yes Slightly under target
SEAR India Wardha District, Maharashtra State 2001 3 1,300,000 1,826 726 183 100% diagnostic units 10 Structured questionaire No Yes MS Excel and SPSS

Region
Country
Sub-national
Year
Report
Population in area
surveyed
TB patients notified
in area surveyed
sm+ TB patients
notified in area
surveyed
Patients tested
Method
Survey duration
(months)
Medical record/ TB
register cross check
Patient interview
Re-interview
Sample target
complete
Software
SEAR India Delhi State 1995 1 16,000,000 45,717 12,703 6,008 100% diagnostic units 6 Structured questionaire No Yes
SEAR India Raichur District, Karnataka State 1999 3 1,800,000 3,047 1,289 492 100% diagnostic units 6 Structured questionaire No Yes
SEAR India North Arcot District, Tamil Nadu State 1999 3 5,664,823 5,600 2,000 952 100% diagnostic units 3 Structured questionaire No Yes
SEAR India Ernakulam district, Kerala State 2004 4 3,200,000 2,598 1,117 262 100% diagnostic units 4 Yes Structured questionaire Yes Yes
SEAR India Gujarat State 2006 4 54,900,000 77,087 30,289 15,986 Proportionate cluster 10 Yes Structured questionaire Yes Yes
SEAR India Tamil Nadu State 1997 2 64,800,000 92,725 37,254 7,602 Proportionate cluster 2 Structured questionaire No Yes
SEAR India Hoogli district, West Bengal State 2001 4 5,400,000 6,996 2,958 608 100% diagnostic units 11 Yes Structured questionaire Yes Slightly under target MS Excel, Access, and STATA
SEAR Indonesia Mimika district, Papua Province 2004 4 131,715 410 194 - 100% diagnostic units 10 Yes Structured questionaire Yes Yes Epi Info
SEAR Myanmar Countrywide 2003 4 50,519,492 107,991 36,541 5,597 Proportionate cluster 11 Yes Structured questionaire Yes Yes SDRTB and MS Access
SEAR Nepal Countrywide 2007 4 27,132,629 34,077 14,617 2,973 Proportionate cluster 12 Yes Structured questionaire Yes Yes
SEAR Sri Lanka Countrywide 2006 4 20,742,905 9,695 4,868 510 All bacteriologically confirmed cases (100%) 12 Structured questionaire Yes SDRTB4
SEAR Thailand Countrywide 2006 4 64,232,758 57,895 29,762 1,795 Proportionate cluster 19 Yes Structured questionaire Yes Yes
WPR Australia Countrywide 2005 4 20,155,129 1,072 244 31 All bacteriologically confirmed cases (100%) 12 No NA
WPR Cambodia Countrywide 2001 3 14,071,014 36,123 21,001 1,306 Proportionate cluster 7 Yes Structured questionaire No Yes
WPR China Guandong Province 1999 2 88,890,000 54,609 32,268 7,645 Proportionate cluster 12 Structured questionaire Yes MS Excel
WPR China Beijing Municipality 2004 4 15,380,000 2,866 1,015 433 100% diagnostic units 12 Yes Structured questionaire Yes Yes
WPR China Shandong Province 1997 2 92,840,000 38,880 30,234 5,443 Proportionate cluster 12 Structured questionaire Yes
WPR China Henan Province 2001 3 97,170,000 80,827 42,075 1,201 Proportionate cluster 12 Structured questionaire Yes
WPR China Liaoning Province 1999 3 42,280,000 23,390 12,013 1,465 Proportionate cluster 12 Structured questionaire Yes
WPR China Heilongjiang Province 2005 4 38,160,000 37,925 19,214 4,630 Proportionate cluster 12 No Structured questionaire Yes Yes SDRTB4
WPR China Hubei Province 1999 3 60,310,000 51,109 33,218 5,868 Proportionate cluster 10 Structured questionaire Yes
WPR China Zhejiang Province 1999 2 47,200,000 37,568 14,658 5,259 Proportionate cluster 12 Structured questionaire Yes SDRTB4
WPR China Shanghai Municipality 2005 4 17,780,000 7,224 3,123 942 100% diagnostic units 12 Structured questionaire Yes Yes
WPR China Inner Mongolia Autonomous region 2002 4 23,850,000 20,478 11,574 3,204 Proportionate cluster 13 Structured questionaire Yes Yes Visual Foxpro and MS Excel
WPR China, Hong Kong SAR Hong Kong 2005 4 - All bacteriologically confirmed cases (100%) 12 Routine Yes NA MS Access
WPR China, Macao SAR Macao 2005 4 460,162 415 136 31 All bacteriologically confirmed cases (100%) 12 Routine NA
WPR Fiji Countrywide 2006 4 - Random cluster 12
WPR Guam Countrywide 2002 4 - Random cluster MS Excel
WPR Japan Countrywide 2002 4 128,084,652 28,319 10,931 1,992 100% diagnostic units 11 Yes Routine Yes Yes
WPR Malaysia Peninsular Malaysia 1997 2 16,489,355 16,066 8,446 983 Proportionate cluster 17 No Yes
WPR Mongolia Countrywide 1999 3 2,646,487 4,743 1,868 341 100% diagnostic units 7 Structured questionaire No Yes
WPR New Caledonia Countrywide 2005 4 - Random cluster Yes SAS
WPR New Zealand Countrywide 2006 4 4,027,947 355 140 19 All bacteriologically confirmed cases (100%) 12 Yes Routine Yes NA
WPR Northern Mariana Is Countrywide 2006 4 - ll bacteriologically confirmed cases (100%) 12 Yes
WPR Philippines Countrywide 2004 4 83,054,478 137,100 81,647 3,957 Proportionate cluster 12 Structured questionaire Yes
WPR Rep. Korea Countrywide 2004 4 47,816,936 46,969 11,638 7,098 Proportionate cluster Routine National Surveillance system
WPR Singapore Countrywide 2005 4 4,325,539 1,469 552 153 All bacteriologically confirmed cases (100%) 12 Routine Yes NA
WPR Solomon Islands Countrywide 2004 4 477,742 397 169 5 Random cluster
WPR Vanuatu Countrywide 2006 4 211,367 81 35 8 Random cluster Yes
WPR Viet Nam Countrywide 2006 4 84,238,231 95,970 55,570 7,301 Proportionate cluster Structured questionaire

Annex 5. Laboratory methods 1994-2007
Reg
ion
Co
un
try
Su
b-n
ati
on
al
Year
Su
pra
nati
on
al
Lab
ora
tory
Cu
ltu
re m
eth
od
DS
T m
eth
od
Nu
mb
er
of
cu
ltu
re
lab
s u
sed
in
su
rvey
Nu
mb
er
of
DS
T
lab
s u
sed
in
su
rvey
H R E S
PZ
A
Km
Am
k
Cap
Cip
Ofl
% a
gre
em
en
t H
% a
gre
em
en
t R
Rech
eckin
g
AFR Algeria Countrywide 2001 Laboratoire de la Tuberculose, Institut Pasteur d'Algérie, Alger, ALGERIA Löwenstein-Jensen Proportion method 1 1 Yes
AFR Benin Countrywide 1997 Laboratoire de la Tuberculose, Institut Pasteur d'Algérie, Alger, ALGERIA Löwenstein-Jensen Proportion method Yes
AFR Botswana Countrywide 2002 Centers for Disease Control and Prevention, Mycobacteriology/ Tuberculosis Laboratory, Georgia, USA BACTEC 460 Resistance ratio method
AFR Central African Republic Bangui 1998 Institut Pasteur, Centre National de Référence des Mycobacteries, Paris, FRANCE Löwenstein-Jensen Proportion method
AFR Côte d'Ivoire Countrywide 2006 Institut Pasteur, Centre National de Référence des Mycobacteries, Paris, FRANCE Proportion method Yes
AFR DR Congo Kinshasa 1999 Département de MicrobiologieUnité de MycobactériologieInstitut de Médecine Tropicale, Antwerp, BELGIUM Yes
AFR Ethiopia Countrywide 2005 National Institute of Public Health and the Environment (RIVM), Bilthoven, NETHERLANDS Löwenstein-Jensen Proportion method 1 1 Yes
AFR Gambia Countrywide 2000 Health Protection Agency, National Mycobacterium Reference Unit, Department of Infectious Diseases, UNITED KINGDOM Löwenstein-Jensen and BACTEC 460 Resistance ratio method 1 1 Yes
AFR Guinea Sentinel sites 1998 Institut Pasteur, Centre National de Référence des Mycobacteries, Paris, FRANCE Löwenstein-Jensen Proportion method Yes
AFR Kenya Nearly Countrywide 1995 Health Protection Agency, National Mycobacterium Reference Unit, Department of Infectious Diseases, UNITED KINGDOM Löwenstein-Jensen Resistance ratio method
AFR Lesotho Countrywide 1995 The Medical Research Council, TB Research Lead Programme, Pretoria, SOUTH AFRICA Löwenstein-Jensen Proportion method
AFR Madagascar Countrywide 2007 Health Protection Agency, National Mycobacterium Reference Unit, Department of Infectious Diseases, UNITED KINGDOM Löwenstein-Jensen Proportion method 1 1 0.1 40.0 2.0 4.0 Yes
AFR Mozambique Countrywide 1999 Swedish Institute for Infectious Disease Control (SIDC), Solna, SWEDEN Löwenstein-Jensen Proportion method
AFR Rwanda Countrywide 2005 Département de MicrobiologieUnité de MycobactériologieInstitut de Médecine Tropicale, Antwerp, BELGIUM Various Proportion method 1 1 0.2 40.0 2.0 4.0 6 10 2 100 100 Yes
AFR Senegal Countrywide 2006 Département de MicrobiologieUnité de MycobactériologieInstitut de Médecine Tropicale, Antwerp, BELGIUM Löwenstein-Jensen Proportion method 1 1 0.2 40.0 2.0 4.0 Yes
AFR Sierra Leone Nearly Countrywide 1997 Armauer Hansen Institut, Würtzburg, GERMANY Löwenstein-Jensen Proportion method Yes
AFR South Africa Countrywide 2002 The Medical Research Council, TB Research Lead Programme, Pretoria, SOUTH AFRICA Löwenstein-Jensen Proportion method NA
AFR Swaziland Countrywide 1995 The Medical Research Council, TB Research Lead Programme, Pretoria, SOUTH AFRICA Löwenstein-Jensen Proportion method
AFR Uganda 3 GLRA Zones * 1997 Armauer Hansen Institut, Würtzburg, Germany Löwenstein-Jensen Proportion method Yes
AFR UR Tanzania Countrywide 2007 Département de MicrobiologieUnité de MycobactériologieInstitut de Médecine Tropicale, Antwerp, BELGIUM Löwenstein-Jensen Proportion method 1 1 1.0 40.0 2.0 5.0 100 100 Yes
AFR Zambia Countrywide 2000 The Medical Research Council, TB Research Lead Programme, Pretoria, SOUTH AFRICA Löwenstein-Jensen Proportion method
AFR Zimbabwe Nearly Countrywide 1995 National Reference Center for Mycobacteria, Borstel, GERMANY Löwenstein-Jensen Various
AMR Argentina Countrywide 2005 Mycobacteria Laboratory, National Institute of Infectious Diseases, ANLIS "Dr Carlos G. Malbran," Buenos Aires, ARGENTINA Löwenstein-Jensen and BACTEC 460 Proportion method 45 8 0.2 40.0 2.0 4.0 100 20 MIC 40 MIC 2 100 100 Yes
AMR Bolivia Countrywide 1996 Mycobacteria Laboratory, National Institute of Infectious Diseases, ANLIS "Dr Carlos G. Malbran," Buenos Aires, ARGENTINA Löwenstein-Jensen Proportion method Yes
AMR Brazil Nearly Countrywide 1996 Mycobacteria Laboratory, National Institute of Infectious Diseases, ANLIS "Dr Carlos G. Malbran," Buenos Aires, ARGENTINA Löwenstein-Jensen Proportion method
AMR Canada Countrywide 2005 Centers for Disease Control and Prevention, Mycobacteriology/ Tuberculosis Laboratory, Georgia, USA Various Proportion method 10 10 0.1 2.0 2.5 2.0 100.0 5.0 1.0 1.3 2 100 100 NA
AMR Chile Countrywide 2001 Instituto de Salud Publica de Chile, Santiago, CHILE Löwenstein-Jensen Proportion method NA
AMR Colombia Countrywide 2000 Instituto de Salud Publica de Chile, Santiago, CHILE Ogawa Proportion method Yes
AMR Costa Rica Countrywide 2006 Departamento de Micobacterias, Instituto de Diagnostico y, Referencia Epidemiologicos (INDRE), MEXICO Löwenstein-Jensen Proportion method 1 1 0.2 40.0 2.0 4.0 96 96 Yes
AMR Cuba Countrywide 2005 Mycobacteria Laboratory, National Institute of Infectious Diseases, ANLIS "Dr Carlos G. Malbran," Buenos Aires, ARGENTINA Löwenstein-Jensen Proportion method 46 1 0.2 40.0 2.0 4.0 100 100 NA
AMR Dominican Republic Countrywide 1995 Laboratory Centre for Disease Control, Ottawa, CANADA (historical) Löwenstein-Jensen Proportion method Yes
AMR Ecuador Countrywide 2002 Instituto de Salud Publica de Chile, Santiago, CHILE Löwenstein-Jensen Proportion method Yes
AMR El Salvador Countrywide 2001 Instituto de Salud Publica de Chile, Santiago, CHILE Löwenstein-Jensen Proportion method Yes
AMR Guatemala Countrywide 2002 Instituto de Salud Publica de Chile, Santiago, CHILE Löwenstein-Jensen Proportion method 8 1 0.2 40.0 2.0 4.0 99 100 Yes
AMR Honduras Countrywide 2004 Instituto de Salud Publica de Chile, Santiago, CHILE Löwenstein-Jensen Proportion method 4 1 0.2 40.0 2.0 4.0 96 100 Yes
AMR Mexico Baja California, Sinaloa, Oaxaca 1997 Centers for Disease Control and Prevention, Mycobacteriology/ Tuberculosis Laboratory, Georgia, USA Löwenstein-Jensen Proportion method
AMR Nicaragua Countrywide 2006 Instituto de Salud Publica de Chile, Santiago, CHILE Löwenstein-Jensen Proportion method 2 1 0.2 40.0 2.0 4.0 100 90 Yes
AMR Paraguay Countrywide 2001 Mycobacteria Laboratory, National Institute of Infectious Diseases, ANLIS "Dr Carlos G. Malbran," Buenos Aires, ARGENTINA Proportion method
AMR Peru Countrywide 2006 Instituto de Salud Publica de Chile, Santiago, CHILE Ogawa Proportion method 0.2 40.0 0.2 4.0 100 100 Yes
AMR Puerto Rico Countrywide 2005 Centers for Disease Control and Prevention, Mycobacteriology/ Tuberculosis Laboratory, Georgia, USA Various Various 5 4 10 2 NA
AMR Uruguay Countrywide 2005 Mycobacteria Laboratory, National Institute of Infectious Diseases, ANLIS "Dr Carlos G. Malbran," Buenos Aires, ARGENTINA Löwenstein-Jensen Proportion method 1 1 0.2 40.0 2.0 4.0 0.5 100 100
AMR USA Countrywide 2005 Centers for Disease Control and Prevention, Mycobacteriology/ Tuberculosis Laboratory, Georgia, USA Various Various 5 4 10 2 NA
AMR Venezuela Countrywide 1999 Instituto de Salud Publica de Chile, Santiago, CHILE Löwenstein-Jensen Proportion method
EMR Egypt Countrywide 2002 Laboratoire de la Tuberculose, Institut Pasteur d'Algérie, Alger, ALGERIA Löwenstein-Jensen Proportion method Yes
EMR Iran Countrywide 1998 Research Institute of Tuberculosis, Japan Anti-Tuberculosis Association, Tokyo, JAPAN Löwenstein-Jensen Proportion method No
EMR Jordan Countrywide 2004 Laboratoire de la Tuberculose, Institut Pasteur d'Algérie, Alger, ALGERIA Proportion method 1 1 0.2 40.0 2.0 4.0 73 93 Yes
EMR Lebanon Countrywide 2003 Institut Pasteur, Centre National de Référence des Mycobacteries, Paris, FRANCE Various Proportion method 1 1 0.1 2.0 2.5 2.0 100 100 Yes
EMR Morocco Countrywide 2006 Laboratoire de la Tuberculose, Institut Pasteur d'Algérie, Alger, ALGERIA Löwenstein-Jensen Proportion method 12 1 0.2 40.0 2.0 4.0 0.2 100 100 Yes
EMR Oman Countrywide 2006
Istituto Superiore di Sanità Dipartimento di Malattie Infettive, Parassitarie e Immunomediate, Rome, ITALY and
Laboratory of Bacteriology & Medical Mycology and San Raffaele del Monte Tabor Foundation (hSR), Milan, ITALY Proportion method 10 1 NA
EMR Qatar Countrywide 2006
Istituto Superiore di Sanità Dipartimento di Malattie Infettive, Parassitarie e Immunomediate, Rome, ITALY and
Laboratory of Bacteriology & Medical Mycology and San Raffaele del Monte Tabor Foundation (hSR), Milan, ITALY Proportion method 1 1 100 100 NA
EMR Yemen Countrywide 2004 Research Institute of Tuberculosis, Japan Anti-Tuberculosis Association, Tokyo, JAPAN Proportion method 4 1 Yes
EUR Andorra Countrywide 2005 1 0 NA
EUR Armenia Countrywide 2007 National Reference Center for Mycobacteria, Borstel, GERMANY Löwenstein-Jensen or Middlebrook Proportion method 1 1 100 100 Yes
EUR Austria Countrywide 2005 National Reference Center for Mycobacteria, Borstel, GERMANY 11 9 100 100 NA
EUR Azerbaijan Baku City 2007 National Reference Center for Mycobacteria, Borstel, GERMANY Proportion method 1 1 Yes
EUR Belgium Countrywide 2005 Health Protection Agency, National Mycobacterium Reference Unit, Department of Infectious Diseases, UNITED KINGDOM Proportion method 155 25 100 100 NA
EUR Bosnia & Herzegovina Countrywide 2005 National Reference Center for Mycobacteria, Borstel, GERMANY Proportion method 8 8 NA
EUR Croatia Countrywide 2005 National Reference Center for Mycobacteria, Borstel, GERMANY Proportion method 15 8 NA
EUR Czech Republic Countrywide 2005 National Institute of Public Health, Prague, CZECH REPUBLIC Proportion method 45 14 100 100 NA
EUR Denmark Countrywide 2005 Swedish Institute for Infectious Disease Control (SIDC), Solna, SWEDEN Proportion method 1 1 95 100 NA
EUR Estonia Countrywide 2005 Swedish Institute for Infectious Disease Control (SIDC), Solna, SWEDEN Absolute concentration method 3 2 90 95 NA
EUR Finland Countrywide 2005 Swedish Institute for Infectious Disease Control (SIDC), Solna, SWEDEN Proportion method 15 2 100 90 NA
EUR France Countrywide 2005 Health Protection Agency, National Mycobacterium Reference Unit, Department of Infectious Diseases, UNITED KINGDOM Proportion method 310 110 100 100 NA
EUR Georgia Countrywide 2006 Département de MicrobiologieUnité de MycobactériologieInstitut de Médecine Tropicale, Antwerp, Belgium Löwenstein-Jensen Absolute concentration method 1 1 0.2 40.0 2.0 4.0 100 100 Yes
EUR Germany Countrywide 2005 National Reference Center for Mycobacteria, Borstel, GERMANY Various Proportion method 200 63 NA
EUR Iceland Countrywide 2005 Swedish Institute for Infectious Disease Control (SIDC), Solna, SWEDEN Proportion method 1 0 NA
EUR Ireland Countrywide 2005 Health Protection Agency, National Mycobacterium Reference Unit, Department of Infectious Diseases, UNITED KINGDOM Proportion method 13 4 100 100 NA
EUR Israel Countrywide 2005 Health Protection Agency, National Mycobacterium Reference Unit, Department of Infectious Diseases, UNITED KINGDOM Proportion method 19 2 100 100 NA

Reg
ion
Co
un
try
Su
b-n
ati
on
al
Year
Su
pra
nati
on
al
Lab
ora
tory
Cu
ltu
re m
eth
od
DS
T m
eth
od
Nu
mb
er
of
cu
ltu
re
lab
s u
sed
in
su
rvey
Nu
mb
er
of
DS
T
lab
s u
sed
in
su
rvey
H R E S
PZ
A
Km
Am
k
Cap
Cip
Ofl
% a
gre
em
en
t H
% a
gre
em
en
t R
Rech
eckin
g
EUR Italy Half of the country 2005
Istituto Superiore di Sanità Dipartimento di Malattie Infettive, Parassitarie e Immunomediate, Rome, ITALY and
Laboratory of Bacteriology & Medical Mycology and San Raffaele del Monte Tabor Foundation (hSR), Milan, ITALY Proportion method 9 1 100 100 NA
EUR Kazakhstan Countrywide 2001 National Reference Center for Mycobacteria, Borstel, GERMANY Löwenstein-Jensen Absolute concentration method 100 100 Yes
EUR Latvia Countrywide 2005 Swedish Institute for Infectious Disease Control (SIDC), Solna, SWEDEN Absolute concentration method 9 1 95 100 NA
EUR Lithuania Countrywide 2005 Swedish Institute for Infectious Disease Control (SIDC), Solna, SWEDEN Absolute concentration method 5 5 100 95 NA
EUR Luxembourg Countrywide 2005 Proportion method 1 1 NA
EUR Malta Countrywide 2005 Health Protection Agency, National Mycobacterium Reference Unit, Department of Infectious Diseases, UNITED KINGDOM Proportion method 1 1 NA
EUR Netherlands Countrywide 2005 National Institute of Public Health and the Environment (RIVM), Bilthoven, NETHERLANDS 43 15 NA
EUR Norway Countrywide 2005 Swedish Institute for Infectious Disease Control (SIDC), Solna, SWEDEN Proportion method 13 3 NA
EUR Poland Countrywide 2004 National Institute of Public Health and the Environment (RIVM), Bilthoven, NETHERLANDS 72 72 NA
EUR Portugal Countrywide 2005
EUR Republic of Moldova Countrywide 2006 National Reference Center for Mycobacteria, Borstel, GERMANY Löwenstein-Jensen Absolute concentration method 4 4 1.0 40.0 2.0 5.0 30.0 30.0 2.0 2.0 95 95 Yes
EUR Romania Countrywide 2004 Swedish Institute for Infectious Disease Control (SIDC), Solna, SWEDEN 110 65 Yes
EUR Russian Federation Ivanovo Oblast 2002 Löwenstein-Jensen Proportion method
EUR Russian Federation Orel Oblast 2006 Swedish Institute for Infectious Disease Control (SIDC), Solna, SWEDEN Absolute concentration method 95 NA
EUR Russian Federation Mary El oblast 2006 Swedish Institute for Infectious Disease Control (SIDC), Solna, SWEDEN Absolute concentration method NA
EUR Russian Federation Tomsk Oblast 2005 Massachusetts State Laboratory, Massachusetts, USA Absolute concentration method 95 Yes
EUR Serbia Countrywide 2005 National Reference Center for Mycobacteria, Borstel, GERMANY Proportion method 45 10 NA
EUR Slovakia Countrywide 2005 National Reference Center for Mycobacteria, Borstel, GERMANY Proportion method 14 6 90 90 NA
EUR Slovenia Countrywide 2005 National Reference Center for Mycobacteria, Borstel, GERMANY Proportion method 5 1 100 100 NA
EUR Spain Galicia 2005 Servicio de Microbiologia Hospital Universitaris, Vall d'Hebron, Barcelona, SPAIN Various Proportion method 13 1 0.1 1.0 5.0 1.0 100 ug/ml 5 1 1.25 2 100 100 No
EUR Spain Aragon 2005 Servicio de Microbiologia Hospital Universitaris, Vall d'Hebron, Barcelona, SPAIN Various Proportion method 7 7 1 1 5.0 1 100 100 100 Yes
EUR Spain Barcelona 2005 Servicio de Microbiologia Hospital Universitaris, Vall d'Hebron, Barcelona, SPAIN Various Proportion method 3 3 100 100 NA
EUR Sweden Countrywide 2005 Swedish Institute for Infectious Disease Control (SIDC), Solna, SWEDEN Proportion method 5 5 100 100 NA
EUR Switzerland Countrywide 2005 Health Protection Agency, National Mycobacterium Reference Unit, Department of Infectious Diseases, UNITED KINGDOM Proportion method 28 28 100 100 NA
EUR Turkmenistan Dashoguz Velayat (Aral Sea Region) 2002 National Reference Center for Mycobacteria, Borstel, GERMANY Löwenstein-Jensen Absolute concentration method Yes
EUR Ukraine Donetsk 2006 Kuratorium Tuberkulose in der Welt e.V.IML (Institut für Mikrobiologie und Laboratoriumsdiagnostik) Gauting, GERMANY Löwenstein-Jensen, Finn- 2 Absolute concentration method 14 1 1 40.0 2.0 10.0 Yes
EUR United Kingdom Countrywide 2005 Health Protection Agency, National Mycobacterium Reference Unit, Department of Infectious Diseases, UNITED KINGDOM Resistance ratio method 268 10 NA
EUR Uzbekistan Tashkent 2005 Kuratorium Tuberkulose in der Welt e.V.IML (Institut für Mikrobiologie und Laboratoriumsdiagnostik) Gauting, GERMANY Absolute concentration method 1 1 Yes
SEAR India Mayhurbhanj District, Orissa State 2001 TB Research Centre (TRC), Indian Council of Medical Research, Chennai, INDIA Löwenstein-Jensen Proportion method 1 1 0.2 40.0 2.0 4.0 100 100 NA
SEAR India Wardha District, Maharashtra State 2001 TB Research Centre (TRC), Indian Council of Medical Research, Chennai, INDIA Löwenstein-Jensen Proportion method NA
SEAR India Delhi State 1995 Queensland Mycobacterium Reference Laboratory, Brisbane, AUSTRALIA Löwenstein-Jensen Proportion method NA
SEAR India Raichur District, Karnataka State 1999 TB Research Centre (TRC), Indian Council of Medical Research, Chennai, INDIA Löwenstein-Jensen Proportion method NA
SEAR India North Arcot District, Tamil Nadu State 1999 TB Research Centre (TRC), Indian Council of Medical Research, Chennai, INDIA Löwenstein-Jensen Proportion method NA
SEAR India Ernakulam district, Kerala State 2004 TB Research Centre (TRC), Indian Council of Medical Research, Chennai, INDIA Löwenstein-Jensen Proportion method 1 1 0.2 40.0 2.0 4.0 100 100 NA
SEAR India Gujarat State 2006 TB Research Centre (TRC), Indian Council of Medical Research, Chennai, INDIA Löwenstein-Jensen Proportion method 1 1 0.2 40.0 2.0 4.0 NA
SEAR India Tamil Nadu State 1997 Queensland Mycobacterium Reference Laboratory, Brisbane, AUSTRALIA Löwenstein-Jensen Resistance ratio method NA
SEAR India Hoogli district, West Bengal State 2001 TB Research Centre (TRC), Indian Council of Medical Research, Chennai, INDIA Löwenstein-Jensen Proportion method 1 1 0.2 40.0 2.0 4.0 100 100 NA
SEAR Indonesia Mimika district, Papua Province 2004 Mycobacterium Reference Laboratory, Institute of Medical and Veterinary Science, Adelaide, AUSTRALIA BACTEC 460 Proportion method 1 1 0.1, 0.4 2.0 2.5 2.0 100 1.0 2.5 1.0 100 100 Yes
SEAR Myanmar Countrywide 2003 TB Research Centre (TRC), Indian Council of Medical Research, Chennai, INDIA Löwenstein-Jensen and Ogawa Proportion method 1 1 0.2 40.0 2.0 4.0 100 95 Yes
SEAR Nepal Countrywide 2007 Kuratorium Tuberkulose in der Welt e.V.IML (Institut für Mikrobiologie und Laboratoriumsdiagnostik) Gauting, GERMANY Proportion method 1 1 0.2 40.0 2.0 4.0 Yes
SEAR Sri Lanka Countrywide 2006 TB Research Centre (TRC), Indian Council of Medical Research, Chennai, INDIA Proportion method 1 1 Planned
SEAR Thailand Countrywide 2006 Département de MicrobiologieUnité de MycobactériologieInstitut de Médecine Tropicale, Antwerp, BELGIUM Löwenstein-Jensen Proportion method 8 1 0.2 40.0 2.0 4.0 97 100 NA
WPR Australia Countrywide 2005 Mycobacterium Reference Laboratory, Institute of Medical and Veterinary Science, Adelaide, AUSTRALIA Various Proportion method 60 5 NA
WPR Cambodia Countrywide 2001 Research Institute of Tuberculosis, Japan Anti-Tuberculosis Association, Tokyo, JAPAN Various Proportion method Yes
WPR China Guandong Province 1999 Korean Institute of Tuberculosis, Seoul, REPUBLIC OF KOREA Löwenstein-Jensen Proportion method 40 1 No
WPR China Beijing Municipality 2004 TB Reference Laboratory Department of Health, SAR Hong Kong, CHINA Löwenstein-Jensen Proportion method 18 1 0.2 40.0 2.0 4.0 100 100 No
WPR China Shandong Province 1997 Korean Institute of Tuberculosis, Seoul, REPUBLIC OF KOREA Löwenstein-Jensen Proportion method 30 1 No
WPR China Henan Province 2001 Korean Institute of Tuberculosis, Seoul, REPUBLIC OF KOREA Löwenstein-Jensen Proportion method 30 1 No
WPR China Liaoning Province 1999 Korean Institute of Tuberculosis, Seoul, REPUBLIC OF KOREA Löwenstein-Jensen Proportion method 30 1 No
WPR China Heilongjiang Province 2005 TB Reference Laboratory Department of Health, SAR Hong Kong, CHINA Löwenstein-Jensen Proportion method 30 1 0.2 40.0 2.0 4.0 100 93 No
WPR China Hubei Province 1999 Korean Institute of Tuberculosis, Seoul, REPUBLIC OF KOREA Löwenstein-Jensen Proportion method 30 1 No
WPR China Zhejiang Province 1999 Korean Institute of Tuberculosis, Seoul, REPUBLIC OF KOREA Löwenstein-Jensen Proportion method 30 1 No
WPR China Shanghai Municipality 2005 TB Reference Laboratory Department of Health, SAR Hong Kong, CHINA Löwenstein-Jensen Proportion method 19 1 0.2 40.0 2.0 4.0 93 97 No
WPR China Inner Mongolia Autonomous region 2002 TB Reference Laboratory Department of Health, SAR Hong Kong, CHINA Löwenstein-Jensen Proportion method 30 1 0.2 40.0 2.0 4.0 93 97 No
WPR China, Hong Kong SAR Hong Kong 2005 TB Reference Laboratory Department of Health, SAR Hong Kong, CHINA Löwenstein-Jensen Absolute concentration method 1 1 0.2 32.0 2.8 16.0 50.0 16.0 8.0 32.0 2.4 100 100 NA
WPR China, Macao SAR Macao 2005 TB Reference Laboratory Department of Health, SAR Hong Kong, CHINA Löwenstein-Jensen and Bact/ALERT MP 1% Proportion Method-Bactec MGIT 960 1 1 0.1 1.0 5.0 1.0 NA
WPR Fiji Countrywide 2006 Queensland Mycobacterium Reference Laboratory, Brisbane, AUSTRALIA NA
WPR Guam Countrywide 2002
WPR Japan Countrywide 2002 Research Institute of Tuberculosis, Japan Anti-Tuberculosis Association, Tokyo, JAPAN MGIT and Ogawa Proportion method 0.2, 1.0 40.0 2.5 10.0 100 20 100 100 NA
WPR Malaysia Peninsular Malaysia 1997 Research Institute of Tuberculosis, Japan Anti-Tuberculosis Association, Tokyo, JAPAN Ogawa Absolute concentration method 1 1
WPR Mongolia Countrywide 1999 Research Institute of Tuberculosis, Japan Anti-Tuberculosis Association, Tokyo, JAPAN Various Proportion method 1 1 Yes
WPR New Caledonia Countrywide 2005 NA
WPR New Zealand Countrywide 2006 Queensland Mycobacterium Reference Laboratory, Brisbane, AUSTRALIA Various Proportion method 30 3 0.1, 0.4 1.0 5.0 1.0 100 1.0 2.5 1.0 NA
WPR Northern Mariana Is Countrywide 2006 Hawaii State Laboratory under Centers for Disease Control and Prevention, Mycobacteriology/ Tuberculosis Laboratory, Georgia, USA Löwenstein-Jensen Proportion method 1 1 NA
WPR Philippines Countrywide 2004 Research Institute of Tuberculosis, Japan Anti-Tuberculosis Association, Tokyo, JAPAN Proportion method Yes
WPR Rep. Korea Countrywide 2004 Korean Institute of Tuberculosis, Seoul, REPUBLIC OF KOREA Proportion method 12 1 NA
WPR Singapore Countrywide 2005 Various Proportion method 2 2 0.1, 1.0 1.0, 2.0 2.5, 5.02.0, 10.0 100 ug/ml 5.0 1.25 2.0 100 100 NA
WPR Solomon Islands Countrywide 2004
WPR Vanuatu Countrywide 2006 NA
WPR Viet Nam Countrywide 2006 National Institute of Public Health and the Environment (RIVM), Bilthoven, NETHERLANDS NA
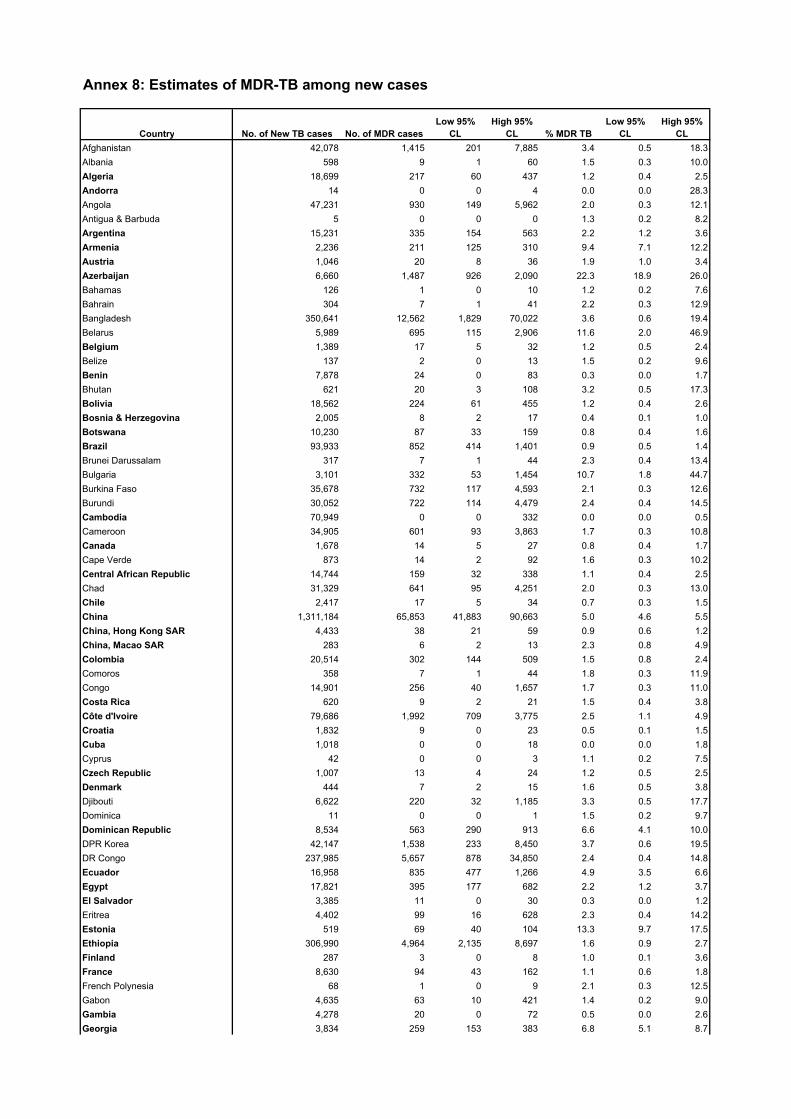
Annex 8: Estimates of MDR-TB among new cases
Country No. of New TB cases No. of MDR cases
Low 95%
CL
High 95%
CL % MDR TB
Low 95%
CL
High 95%
CL
Afghanistan 42,078 1,415 201 7,885 3.4 0.5 18.3
Albania 598 9 1 60 1.5 0.3 10.0
Algeria 18,699 217 60 437 1.2 0.4 2.5
Andorra 14 0 0 4 0.0 0.0 28.3
Angola 47,231 930 149 5,962 2.0 0.3 12.1
Antigua & Barbuda 5 0 0 0 1.3 0.2 8.2
Argentina 15,231 335 154 563 2.2 1.2 3.6
Armenia 2,236 211 125 310 9.4 7.1 12.2
Austria 1,046 20 8 36 1.9 1.0 3.4
Azerbaijan 6,660 1,487 926 2,090 22.3 18.9 26.0
Bahamas 126 1 0 10 1.2 0.2 7.6
Bahrain 304 7 1 41 2.2 0.3 12.9
Bangladesh 350,641 12,562 1,829 70,022 3.6 0.6 19.4
Belarus 5,989 695 115 2,906 11.6 2.0 46.9
Belgium 1,389 17 5 32 1.2 0.5 2.4
Belize 137 2 0 13 1.5 0.2 9.6
Benin 7,878 24 0 83 0.3 0.0 1.7
Bhutan 621 20 3 108 3.2 0.5 17.3
Bolivia 18,562 224 61 455 1.2 0.4 2.6
Bosnia & Herzegovina 2,005 8 2 17 0.4 0.1 1.0
Botswana 10,230 87 33 159 0.8 0.4 1.6
Brazil 93,933 852 414 1,401 0.9 0.5 1.4
Brunei Darussalam 317 7 1 44 2.3 0.4 13.4
Bulgaria 3,101 332 53 1,454 10.7 1.8 44.7
Burkina Faso 35,678 732 117 4,593 2.1 0.3 12.6
Burundi 30,052 722 114 4,479 2.4 0.4 14.5
Cambodia 70,949 0 0 332 0.0 0.0 0.5
Cameroon 34,905 601 93 3,863 1.7 0.3 10.8
Canada 1,678 14 5 27 0.8 0.4 1.7
Cape Verde 873 14 2 92 1.6 0.3 10.2
Central African Republic 14,744 159 32 338 1.1 0.4 2.5
Chad 31,329 641 95 4,251 2.0 0.3 13.0
Chile 2,417 17 5 34 0.7 0.3 1.5
China 1,311,184 65,853 41,883 90,663 5.0 4.6 5.5
China, Hong Kong SAR 4,433 38 21 59 0.9 0.6 1.2
China, Macao SAR 283 6 2 13 2.3 0.8 4.9
Colombia 20,514 302 144 509 1.5 0.8 2.4
Comoros 358 7 1 44 1.8 0.3 11.9
Congo 14,901 256 40 1,657 1.7 0.3 11.0
Costa Rica 620 9 2 21 1.5 0.4 3.8
Côte d'Ivoire 79,686 1,992 709 3,775 2.5 1.1 4.9
Croatia 1,832 9 0 23 0.5 0.1 1.5
Cuba 1,018 0 0 18 0.0 0.0 1.8
Cyprus 42 0 0 3 1.1 0.2 7.5
Czech Republic 1,007 13 4 24 1.2 0.5 2.5
Denmark 444 7 2 15 1.6 0.5 3.8
Djibouti 6,622 220 32 1,185 3.3 0.5 17.7
Dominica 11 0 0 1 1.5 0.2 9.7
Dominican Republic 8,534 563 290 913 6.6 4.1 10.0
DPR Korea 42,147 1,538 233 8,450 3.7 0.6 19.5
DR Congo 237,985 5,657 878 34,850 2.4 0.4 14.8
Ecuador 16,958 835 477 1,266 4.9 3.5 6.6
Egypt 17,821 395 177 682 2.2 1.2 3.7
El Salvador 3,385 11 0 30 0.3 0.0 1.2
Eritrea 4,402 99 16 628 2.3 0.4 14.2
Estonia 519 69 40 104 13.3 9.7 17.5
Ethiopia 306,990 4,964 2,135 8,697 1.6 0.9 2.7
Finland 287 3 0 8 1.0 0.1 3.6
France 8,630 94 43 162 1.1 0.6 1.8
French Polynesia 68 1 0 9 2.1 0.3 12.5
Gabon 4,635 63 10 421 1.4 0.2 9.0
Gambia 4,278 20 0 72 0.5 0.0 2.6
Georgia 3,834 259 153 383 6.8 5.1 8.7

Country No. of New TB cases No. of MDR cases
Low 95%
CL
High 95%
CL % MDR TB
Low 95%
CL
High 95%
CL
Germany 5,370 99 58 146 1.8 1.4 2.4
Ghana 46,693 898 143 5,534 1.9 0.3 12.0
Greece 2,009 22 3 149 1.1 0.2 7.4
Guatemala 10,277 308 155 503 3.0 1.8 4.6
Guinea 24,321 135 0 328 0.6 0.1 1.6
Guinea-Bissau 3,602 81 13 528 2.3 0.4 14.0
Guyana 1,215 21 3 140 1.7 0.3 11.2
Haiti 28,289 537 86 3,520 1.9 0.3 12.0
Honduras 5,322 93 33 176 1.8 0.8 3.4
Hungary 1,904 25 4 169 1.3 0.2 8.7
Iceland 13 0 0 4 0.0 0.0 34.8
India 1,932,852 54,806 33,723 78,291 2.8 2.3 3.4
Indonesia 534,439 10,583 0 28,811 2.0 0.2 7.0
Iran 15,678 777 428 1,204 5.0 3.4 6.9
Iraq 15,968 478 68 2,729 3.0 0.5 16.6
Ireland 555 3 0 10 0.5 0.0 2.8
Israel 521 30 13 52 5.7 3.0 9.7
Italy 4,393 72 25 137 1.6 0.7 3.2
Jamaica 197 3 0 19 1.4 0.2 9.1
Japan 28,330 199 99 328 0.7 0.4 1.1
Jordan 306 17 5 33 5.4 2.0 11.4
Kazakhstan 19,961 2,836 1,681 4,158 14.2 10.8 18.3
Kenya 132,578 0 0 890 0.0 0.0 0.7
Kiribati 348 11 2 61 3.2 0.5 17.6
Kuwait 667 13 2 79 1.9 0.3 11.5
Kyrgyzstan 6,454 949 154 3,580 14.7 2.6 53.4
Lao PDR 8,779 322 46 1,791 3.7 0.6 19.9
Latvia 1,312 141 87 201 10.8 8.8 13.0
Lebanon 452 5 0 13 1.1 0.1 3.8
Lesotho 12,670 115 0 278 0.9 0.2 2.6
Libyan Arab Jamahiriya 1,062 28 4 159 2.6 0.4 14.4
Lithuania 2,102 206 128 292 9.8 8.3 11.6
Luxembourg 57 0 0 5 0.0 0.0 8.0
Madagascar 47,469 234 45 517 0.5 0.1 1.3
Malawi 51,172 1,203 195 7,455 2.4 0.4 14.7
Malaysia 26,877 27 0 96 0.1 0.0 0.6
Maldives 136 4 1 21 2.9 0.4 15.6
Mali 33,460 680 108 4,413 2.0 0.3 12.7
Malta 25 0 0 6 0.0 0.0 25.9
Marshall Islands 127 4 1 21 2.9 0.4 16.1
Mauritius 284 4 1 25 1.3 0.2 8.7
Mexico 22,473 538 187 1,018 2.4 1.0 4.7
Micronesia 112 3 0 19 3.0 0.4 16.4
Mongolia 4,893 48 9 107 1.0 0.3 2.5
Morocco 28,776 137 28 288 0.5 0.2 1.1
Mozambique 92,971 3,256 1,829 5,018 3.5 2.5 4.8
Myanmar 82,687 3,271 1,797 5,065 4.0 2.7 5.6
Namibia 15,723 241 38 1,536 1.5 0.3 9.8
Nepal 48,772 1,401 736 2,239 2.9 1.8 4.3
Netherlands 1,249 9 2 18 0.7 0.2 1.6
New Zealand 352 1 0 5 0.4 0.0 2.2
Nicaragua 3,203 20 0 54 0.6 0.1 2.2
Niger 23,845 519 82 3,207 2.2 0.4 13.1
Nigeria 450,527 8,559 1,319 55,698 1.9 0.3 11.9
Norway 263 4 0 10 1.6 0.3 4.5
Oman 336 4 0 12 1.3 0.2 4.7
Pakistan 291,743 9,880 1,454 53,653 3.4 0.5 18.4
Palau 10 0 0 1 2.4 0.4 13.9
Panama 1,463 21 3 135 1.4 0.2 9.3
Papua New Guinea 15,473 563 82 3,142 3.6 0.6 20.0
Paraguay 4,267 91 19 193 2.1 0.7 4.9
Peru 44,815 2,353 1,446 3,375 5.3 4.3 6.4
Philippines 247,740 10,012 5,676 15,135 4.0 2.9 5.5
Poland 9,462 28 9 54 0.3 0.1 0.6
Portugal 3,382 29 12 50 0.9 0.4 1.5

Country No. of New TB cases No. of MDR cases
Low 95%
CL
High 95%
CL % MDR TB
Low 95%
CL
High 95%
CL
Rep. Korea 42,359 1,141 686 1,655 2.7 2.1 3.4
Republic of Moldova 5,551 1,077 684 1,504 19.4 16.7 22.3
Romania 27,533 778 416 1,242 2.8 1.8 4.2
Russian Federation 152,797 19,845 12,376 27,566 13.0 11.3 14.8
Rwanda 37,644 1,467 768 2,324 3.9 2.5 5.7
Saint Lucia 28 0 0 3 1.5 0.2 9.4
Samoa 36 1 0 6 3.0 0.5 16.8
Saudi Arabia 10,631 232 33 1,362 2.2 0.3 12.6
Senegal 32,638 689 141 1,452 2.1 0.7 4.9
Serbia 3,183 11 2 26 0.4 0.1 0.9
Seychelles 28 0 0 3 1.3 0.2 8.9
Sierra Leone 29,690 254 0 886 0.9 0.0 4.7
Singapore 1,128 3 0 7 0.2 0.0 0.8
Slovakia 829 13 3 30 1.6 0.4 4.1
Slovenia 261 0 0 4 0.0 0.0 1.4
Somalia 18,444 328 52 2,118 1.8 0.3 11.2
South Africa 453,929 8,238 4,952 11,848 1.8 1.4 2.3
Spain 13,180 17 0 62 0.1 0.0 0.7
Sri Lanka 11,620 21 0 75 0.2 0.0 1.0
St Vincent & Grenadines 35 1 0 4 1.7 0.3 10.8
Sudan 91,331 1,696 265 10,681 1.9 0.3 11.7
Swaziland 13,097 118 0 281 0.9 0.2 2.6
Sweden 549 3 0 7 0.5 0.1 1.7
Switzerland 500 3 0 8 0.6 0.1 2.2
Syrian Arab Republic 6,251 192 27 1,050 3.1 0.5 16.6
Tajikistan 13,532 2,164 359 7,855 16.0 2.8 55.1
TFYR Macedonia 596 9 1 61 1.6 0.3 9.9
Thailand 90,252 1,491 752 2,423 1.7 1.0 2.6
Timor-Leste 6,187 211 31 1,186 3.4 0.5 18.7
Togo 24,922 506 79 3,295 2.0 0.3 12.8
Tonga 24 1 0 4 3.1 0.5 17.4
Tunisia 2,520 68 10 382 2.7 0.4 15.0
Turkey 21,752 303 48 2,026 1.4 0.2 9.0
Turkmenistan 3,175 121 24 269 3.8 1.0 9.5
Uganda 106,037 567 0 1,547 0.5 0.1 1.9
Ukraine 49,308 7,866 4,948 11,029 16.0 13.7 18.4
United Arab Emirates 681 16 2 91 2.3 0.4 12.9
United Kingdom 9,358 63 33 101 0.7 0.4 1.0
UR Tanzania 123,140 1,335 256 2,997 1.1 0.3 2.8
Uruguay 910 0 0 8 0.0 0.0 0.9
Uzbekistan 32,778 4,844 2,707 7,477 14.8 10.2 20.4
Venezuela 11,271 59 11 130 0.5 0.1 1.3
Viet Nam 148,918 4,047 2,341 6,056 2.7 2.0 3.6
West Bank and Gaza Strip 790 25 4 137 3.1 0.5 17.4
Yemen 16,985 500 234 850 2.9 1.7 4.8
Zambia 64,632 1,162 388 2,199 1.8 0.8 3.5
Zimbabwe 85,015 1,635 722 2,828 1.9 1.0 3.3

Annex 9: Estimates of MDR-TB among previously treated cases
Country
No. of Previously
treated TB cases No. of MDR cases
Low 95%
CL
High 95%
CL % MDR TB
Low 95%
CL
High 95%
CL
Afghanistan 1,957 724 159 1,619 37.0 8.7 76.2
Albania 45 5 1 18 10.3 2.0 39.5
Algeria 617 60 11 242 9.8 1.9 37.7
Andorra 1 0 0 1 10.4 2.1 40.5
Angola 5,463 735 142 2,643 13.5 2.6 46.5
Antigua & Barbuda 0 0 0 0 10.6 2.1 40.7
Argentina 829 128 67 206 15.4 9.8 22.6
Armenia 394 170 109 235 43.2 37.9 48.7
Austria 22 3 0 7 12.5 1.6 38.3
Azerbaijan 1,631 910 588 1,245 55.8 51.5 60.0
Bahamas 13 1 0 5 9.4 1.9 37.6
Bahrain 12 4 1 10 36.5 8.8 75.0
Bangladesh 10,492 2,022 407 6,266 19.3 4.2 57.8
Belarus 997 401 95 847 40.2 10.2 78.4
Belgium 112 8 0 19 7.3 1.5 19.9
Belize 16 2 0 6 9.8 2.0 39.0
Benin 719 66 12 269 9.2 1.8 37.2
Bhutan 41 8 2 25 19.9 4.3 58.6
Bolivia 1,514 71 15 147 4.7 1.5 10.6
Bosnia & Herzegovina 134 9 3 17 6.6 2.7 13.1
Botswana 428 44 18 79 10.4 5.3 17.8
Brazil 11,287 612 355 921 5.4 4.0 7.2
Brunei Darussalam 20 4 1 12 19.5 4.3 57.4
Bulgaria 316 119 28 262 37.8 9.2 76.6
Burkina Faso 4,566 439 80 1,852 9.6 1.8 38.4
Burundi 1,042 94 17 384 9.0 1.8 36.2
Cambodia 2,956 92 0 221 3.1 0.6 8.9
Cameroon 2,182 185 32 757 8.5 1.6 34.6
Canada 150 11 3 22 7.5 2.8 15.6
Cape Verde 83 8 2 33 10.2 2.0 39.0
Central African Republic 1,409 256 79 487 18.2 7.0 35.5
Chad 1,731 167 31 676 9.6 1.9 38.5
Chile 182 7 3 12 3.8 1.9 6.7
China 252,863 64,694 41,304 88,232 25.6 23.7 27.5
China, Hong Kong SAR 540 43 19 75 8.0 4.3 13.3
China, Macao SAR 27 4 0 10 15.8 3.4 39.6
Colombia 825 80 15 334 9.7 1.9 38.9
Comoros 23 2 0 9 10.1 1.9 39.2
Congo 733 64 12 268 8.8 1.7 36.1
Costa Rica 53 3 0 9 4.8 0.1 23.8
Côte d'Ivoire 4,761 411 76 1,722 8.6 1.7 35.2
Croatia 189 9 0 22 4.9 1.0 13.7
Cuba 70 4 0 13 5.3 0.1 26.0
Cyprus 1 0 0 0 9.6 1.9 37.7
Czech Republic 34 10 3 19 30.0 11.9 54.3
Denmark 46 0 0 7 0.0 0.0 15.3
Djibouti 648 229 51 526 35.4 8.8 74.5
Dominica 1 0 0 0 10.6 2.1 40.3
Dominican Republic 1,204 237 126 372 19.7 12.9 28.0
DPR Korea 8,634 1,933 391 5,611 22.4 4.8 61.4
DR Congo 15,195 1,387 268 5,594 9.1 1.9 36.1
Ecuador 2,661 647 380 955 24.3 18.3 31.2
Egypt 1,483 567 358 800 38.2 31.8 45.1
El Salvador 298 21 6 41 7.0 2.9 13.9
Eritrea 284 27 5 113 9.7 1.9 38.1
Estonia 114 59 36 86 52.1 39.9 64.1
Ethiopia 7,271 861 342 1,576 11.8 5.6 21.3
Finland 19 1 0 3 4.5 0.1 22.8
France 625 45 16 83 7.1 3.1 13.6
French Polynesia 8 2 0 5 18.8 3.9 57.5
Gabon 426 35 6 147 8.2 1.5 33.2
Gambia 248 0 0 45 0.0 0.0 18.1
Georgia 1,435 393 247 551 27.4 23.6 31.4

Country
No. of Previously
treated TB cases No. of MDR cases
Low 95%
CL
High 95%
CL % MDR TB
Low 95%
CL
High 95%
CL
Germany 456 56 32 87 12.4 8.5 17.1
Ghana 2,094 192 34 770 9.2 1.7 36.3
Greece 218 22 4 91 10.3 2.1 40.1
Guatemala 471 125 74 185 26.5 19.7 34.1
Guinea 1,648 464 193 806 28.1 13.7 46.7
Guinea-Bissau 282 27 5 112 9.7 2.0 38.3
Guyana 110 10 2 44 9.4 1.9 38.1
Haiti 638 57 10 237 9.0 1.7 36.0
Honduras 304 37 15 69 12.3 5.8 22.1
Hungary 386 45 8 172 11.6 2.3 42.5
Iceland 1 0 0 1 0.0 0.0 95.0
India 321,200 55,326 34,714 77,769 17.2 15.0 19.7
Indonesia 8,264 1,559 315 4,898 18.9 4.2 56.6
Iran 833 402 236 593 48.2 34.7 62.0
Iraq 1,295 492 112 1,074 38.0 9.5 77.0
Ireland 28 3 0 10 10.0 0.3 44.5
Israel 4 0 0 3 0.0 0.0 63.2
Italy 256 45 21 76 17.7 10.0 27.9
Jamaica 11 1 0 4 8.1 1.6 34.1
Japan 1,253 123 70 186 9.8 7.1 13.1
Jordan 8 3 2 5 40.0 22.7 59.4
Kazakhstan 6,686 3,773 2,388 5,225 56.4 50.8 61.9
Kenya 13,012 0 0 820 0.0 0.0 6.3
Kiribati 5 1 0 3 18.9 4.0 56.9
Kuwait 9 3 1 7 36.5 8.8 75.7
Kyrgyzstan 1,048 419 99 872 40.0 9.9 78.2
Lao PDR 393 76 16 241 19.4 4.0 58.1
Latvia 211 77 47 108 36.3 29.3 43.7
Lebanon 10 6 3 10 62.5 35.4 84.8
Lesotho 1,859 105 0 246 5.7 1.2 15.7
Libyan Arab Jamahiriya 14 5 1 12 38.7 9.7 77.3
Lithuania 461 219 139 301 47.5 42.8 52.3
Luxembourg 3 0 0 1 9.8 2.0 39.0
Madagascar 3,921 154 0 421 3.9 0.5 13.5
Malawi 2,829 160 28 786 5.6 1.1 25.9
Malaysia 1,707 0 0 291 0.0 0.0 17.1
Maldives 7 1 0 4 19.3 4.1 57.3
Mali 768 76 14 301 9.9 2.0 38.2
Malta 1 0 0 1 9.8 1.9 38.5
Marshall Islands 8 2 0 5 21.3 4.7 60.8
Mauritius 10 1 0 4 9.5 1.9 37.5
Mexico 4,640 1,041 571 1,612 22.4 14.9 31.5
Micronesia 13 3 1 8 21.0 4.6 60.5
Mongolia 332 68 13 204 20.5 4.3 59.6
Morocco 1,101 134 70 214 12.2 7.8 17.8
Mozambique 4,975 163 31 356 3.3 0.9 8.2
Myanmar 6,312 979 499 1,573 15.5 9.5 23.4
Namibia 1,432 101 18 457 7.1 1.3 30.0
Nepal 4,439 521 260 848 11.7 7.2 17.7
Netherlands 46 2 0 5 3.3 0.1 17.2
New Zealand 21 0 0 4 0.0 0.0 17.1
Nicaragua 403 31 11 58 7.8 3.4 14.7
Niger 2,260 231 43 914 10.2 2.1 38.9
Nigeria 28,209 2,612 456 11,193 9.3 1.7 36.9
Norway 16 0 0 5 0.0 0.0 31.2
Oman 5 2 1 3 35.7 12.8 64.9
Pakistan 14,675 5,353 1,136 11,803 36.5 8.7 75.3
Palau 2 0 0 1 20.3 4.5 59.8
Panama 252 26 5 102 10.2 2.0 39.6
Papua New Guinea 1,804 352 66 1,082 19.5 4.1 58.6
Paraguay 452 18 0 48 3.9 0.5 13.5
Peru 6,855 1,619 996 2,321 23.6 19.3 28.3
Philippines 8,771 1,836 1,007 2,810 20.9 14.3 29.0
Poland 1,198 99 56 148 8.2 6.0 10.9
Portugal 380 35 17 59 9.3 5.4 14.7

Country
No. of Previously
treated TB cases No. of MDR cases
Low 95%
CL
High 95%
CL % MDR TB
Low 95%
CL
High 95%
CL
Rep. Korea 7,471 1,048 605 1,559 14.0 10.2 18.7
Republic of Moldova 1,886 959 611 1,298 50.8 48.6 53.0
Romania 6,985 768 440 1,158 11.0 8.0 14.6
Russian Federation 33,283 16,192 10,265 22,900 48.6 41.2 56.1
Rwanda 2,719 256 91 473 9.4 4.2 17.7
Saint Lucia 4 0 0 2 11.1 2.2 42.1
Samoa 5 1 0 3 21.1 4.6 60.4
Saudi Arabia 393 143 33 320 36.4 8.5 75.9
Senegal 3,723 621 214 1,182 16.7 7.0 31.4
Serbia 351 15 3 30 4.1 1.4 9.4
Seychelles 2 0 0 1 11.5 2.3 42.8
Sierra Leone 1,204 278 0 605 23.1 5.0 53.8
Singapore 149 1 0 5 1.0 0.0 5.2
Slovakia 113 8 2 18 7.1 2.0 17.3
Slovenia 17 1 0 2 3.6 0.1 18.3
Somalia 859 84 16 330 9.8 1.9 38.3
South Africa 86,642 5,796 3,542 8,303 6.7 5.5 8.1
Spain 715 30 6 69 4.3 1.2 10.5
Sri Lanka 610 0 0 53 0.0 0.0 8.7
St Vincent & Grenadines 4 1 0 2 14.7 3.0 49.5
Sudan 6,972 681 120 2,736 9.8 1.9 37.5
Swaziland 1,438 131 27 282 9.1 2.5 21.7
Sweden 12 1 0 4 11.8 1.5 36.4
Switzerland 50 3 0 9 6.7 0.8 22.1
Syrian Arab Republic 259 95 23 209 36.8 9.1 76.0
Tajikistan 2,454 1,040 254 2,127 42.4 11.0 80.1
TFYR Macedonia 84 10 2 37 11.4 2.3 42.3
Thailand 3,887 1,342 839 1,916 34.5 27.9 41.7
Timor-Leste 73 14 3 43 18.8 3.9 55.7
Togo 1,781 162 28 665 9.1 1.7 36.8
Tonga 2 0 0 1 20.3 4.3 59.1
Tunisia 43 16 4 35 36.1 8.8 74.9
Turkey 5,520 586 108 2,428 10.6 2.1 41.5
Turkmenistan 715 131 65 211 18.4 11.3 27.5
Uganda 6,061 269 0 713 4.4 0.5 15.1
Ukraine 12,549 5,563 3,547 7,697 44.3 39.9 48.8
United Arab Emirates 32 12 3 26 36.7 8.9 75.4
United Kingdom 418 11 3 21 2.6 1.0 5.2
UR Tanzania 9,932 0 0 589 0.0 0.0 5.9
Uruguay 76 5 0 12 6.1 0.7 20.2
Uzbekistan 8,309 4,985 3,094 7,059 60.0 48.8 70.5
Venezuela 683 92 44 157 13.5 7.6 21.6
Viet Nam 12,287 2,374 1,378 3,535 19.3 14.2 25.4
West Bank and Gaza Strip 30 11 3 25 36.8 10.2 77.1
Yemen 648 73 22 145 11.3 4.3 23.0
Zambia 7,394 168 0 586 2.3 0.1 12.0
Zimbabwe 9,906 826 0 1,966 8.3 1.8 22.5

Annex 10: Estimates of MDR-TB among all TB cases
Country No. of All TB cases No. of MDR cases
Low 95%
CL
High 95%
CL % MDR TB
Low 95%
CL
High 95%
CL
Afghanistan 44,035 2,139 671 8,802 4.9 1.6 19.5
Albania 643 14 4 67 2.1 0.7 10.3
Algeria 19,316 277 105 561 1.4 0.6 2.8
Andorra 15 0 0 0 0.7 0.1 3.4
Angola 52,694 1,665 547 7,144 3.2 1.1 13.1
Antigua & Barbuda 5 0 0 0 1.3 0.7 9.1
Argentina 16,060 463 267 699 2.9 1.8 4.1
Armenia 2,630 381 273 501 14.5 11.6 18.0
Australia 1,414 21 11 36 1.5 0.8 2.6
Austria 1,068 23 10 39 2.1 1.0 3.4
Azerbaijan 8,291 2,397 1,744 3,074 28.9 25.1 33.2
Bahamas 139 3 1 12 1.9 0.7 8.5
Bahrain 316 11 4 43 3.5 1.1 13.4
Bangladesh 361,133 14,583 3,566 72,744 4.0 1.0 19.3
Belarus 6,986 1,096 371 3,272 15.7 5.4 46.5
Belgium 1,501 25 10 43 1.6 0.7 2.8
Belize 153 4 1 15 2.3 0.8 10.2
Benin 8,597 90 18 304 1.0 0.2 3.7
Bhutan 662 28 8 119 4.2 1.3 17.5
Bolivia 20,076 294 117 526 1.5 0.6 2.5
Bosnia & Herzegovina 2,139 17 7 29 0.8 0.3 1.4
Botswana 10,658 131 69 206 1.2 0.7 1.9
Brazil 105,220 1,464 945 2,077 1.4 1.0 1.9
Brunei Darussalam 337 11 3 47 3.3 1.1 13.8
Bulgaria 3,417 451 143 1,563 13.2 4.2 44.1
Burkina Faso 40,244 1,170 369 5,402 2.9 1.0 13.1
Burundi 31,094 815 199 4,725 2.6 0.7 15.1
Cambodia 73,905 92 0 221 0.1 0.0 0.3
Cameroon 37,087 786 227 4,036 2.1 0.6 11.0
Canada 1,828 25 12 42 1.4 0.7 2.3
Cape Verde 956 22 7 102 2.3 0.8 10.7
Central African Republic 16,153 415 188 703 2.6 1.2 4.5
Chad 33,060 807 230 4,297 2.4 0.7 13.3
Chile 2,599 24 10 42 0.9 0.4 1.5
China 1,564,047 130,548 97,633 164,900 8.3 7.0 10.2
China, Hong Kong SAR 4,973 81 51 117 1.6 1.1 2.4
China, Macao SAR 310 11 4 19 3.4 1.4 6.1
Colombia 21,339 382 202 690 1.8 1.1 3.2
Comoros 381 9 3 45 2.3 0.7 11.9
Congo 15,634 321 90 1,737 2.1 0.6 11.0
Costa Rica 673 12 2 25 1.8 0.4 3.5
Côte d'Ivoire 84,447 2,403 1,033 4,574 2.8 1.3 5.2
Croatia 2,021 19 5 36 0.9 0.3 1.8
Cuba 1,088 4 0 13 0.3 0.0 1.2
Cyprus 43 1 0 3 1.3 0.4 7.6
Czech Republic 1,041 23 11 37 2.2 1.1 3.6
Denmark 490 7 1 15 1.5 0.3 2.9
Djibouti 7,270 449 150 1,489 6.2 2.1 20.1
Dominica 12 0 0 1 2.2 0.8 10.2
Dominican Republic 9,738 800 496 1,162 8.2 5.7 11.1
DPR Korea 50,781 3,472 1,136 11,248 6.8 2.3 21.4
DR Congo 253,180 7,044 2,030 36,534 2.8 0.8 14.5
Ecuador 19,619 1,483 1,034 1,998 7.6 5.8 9.8
Egypt 19,304 962 646 1,315 5.0 3.4 7.0
El Salvador 3,683 32 12 58 0.9 0.3 1.6
Eritrea 4,686 127 36 681 2.7 0.8 14.1
Estonia 633 128 91 172 20.3 15.9 25.7
Ethiopia 314,261 5,825 2,992 9,689 1.9 1.0 2.8
Fiji 186 0 0 17 0.0 0.0 9.3
Finland 306 4 0 9 1.2 0.0 2.8
France 9,255 138 76 214 1.5 0.9 2.2
French Polynesia 76 3 1 10 3.9 1.3 13.6
Gabon 5,061 98 31 460 1.9 0.6 9.1

Country No. of All TB cases No. of MDR cases
Low 95%
CL
High 95%
CL % MDR TB
Low 95%
CL
High 95%
CL
Gambia 4,526 20 0 72 0.5 0.0 1.4
Georgia 5,269 652 467 847 12.4 9.9 15.4
Germany 5,826 155 107 210 2.7 2.1 3.5
Ghana 48,787 1,090 288 6,169 2.2 0.6 12.1
Greece 2,227 45 15 186 2.0 0.7 8.5
Guam 69 3 0 10 4.3 0.5 14.5
Guatemala 10,748 432 269 633 4.0 2.7 5.5
Guinea 25,969 599 287 978 2.3 1.1 4.1
Guinea-Bissau 3,884 109 32 545 2.8 0.8 13.9
Guyana 1,325 31 10 152 2.4 0.8 11.3
Haiti 28,927 594 139 3,515 2.1 0.5 11.9
Honduras 5,626 131 63 218 2.3 1.2 3.6
Hungary 2,290 69 23 258 3.0 1.0 11.1
Iceland 14 0 0 0 0.0 0.0 0.0
India 2,254,052 110,132 79,975 142,386 4.9 3.9 6.2
Indonesia 542,703 12,142 753 30,388 2.2 0.1 5.3
Iran 16,511 1,178 788 1,642 7.1 5.3 9.5
Iraq 17,263 969 334 3,246 5.6 2.0 18.6
Ireland 583 6 0 15 1.0 0.0 2.5
Israel 525 30 13 52 5.6 2.8 8.9
Italy 4,649 118 62 188 2.5 1.4 3.9
Jamaica 208 4 1 20 1.8 0.5 9.4
Japan 29,583 322 206 462 1.1 0.7 1.5
Jordan 314 20 8 36 6.3 2.6 10.8
Kazakhstan 26,647 6,608 4,806 8,534 24.8 20.0 30.4
Kenya 145,590 0 0 0 0.0 0.0 0.0
Kiribati 353 12 2 66 3.4 0.7 18.1
Kuwait 676 16 4 79 2.4 0.7 11.6
Kyrgyzstan 7,502 1,368 443 4,026 18.2 6.2 51.5
Lao PDR 9,172 398 106 1,837 4.3 1.2 19.8
Latvia 1,523 218 156 284 14.3 11.9 17.3
Lebanon 462 11 5 20 2.4 1.0 4.3
Lesotho 14,529 220 66 427 1.5 0.5 2.9
Libyan Arab Jamahiriya 1,076 33 8 166 3.1 0.8 15.2
Lithuania 2,563 425 313 545 16.6 13.6 20.5
Luxembourg 60 0 0 1 0.5 0.1 2.3
Madagascar 51,390 388 104 740 0.8 0.2 1.5
Malawi 54,001 1,362 341 7,663 2.5 0.7 14.4
Malaysia 28,584 27 0 95 0.1 0.0 0.3
Maldives 143 5 2 24 3.7 1.1 16.4
Mali 34,228 756 177 4,363 2.2 0.5 12.8
Malta 26 0 0 1 0.4 0.1 2.3
Marshall Islands 135 5 2 24 4.0 1.3 16.7
Mauritius 294 5 1 26 1.6 0.5 8.6
Mexico 27,113 1,579 960 2,301 5.8 3.6 8.7
Micronesia 125 6 2 22 4.8 1.7 17.7
Mongolia 5,225 116 42 263 2.2 0.8 5.3
Morocco 29,877 271 141 446 0.9 0.5 1.5
Mozambique 97,946 3,419 1,987 5,168 3.5 2.5 4.6
Myanmar 88,999 4,251 2,648 6,187 4.8 3.4 6.3
Namibia 17,155 342 103 1,716 2.0 0.6 9.8
Nepal 53,211 1,921 1,195 2,822 3.6 2.4 4.9
Netherlands 1,295 10 3 21 0.8 0.3 1.5
New Caledonia 74 0 0 39 0.0 0.0 52.2
New Zealand 373 1 0 5 0.4 0.0 1.1
Nicaragua 3,606 51 19 93 1.4 0.5 2.6
Niger 26,105 750 233 3,667 2.9 0.9 13.5
Nigeria 478,736 11,171 3,254 58,081 2.3 0.7 12.0
Northern Mariana Is 66 3 0 0 4.5 0.0 0.0
Norway 279 4 0 10 1.5 0.0 3.4
Oman 341 6 1 14 1.8 0.3 4.0
Pakistan 306,418 15,233 4,752 59,884 5.0 1.6 19.4
Palau 12 1 0 2 5.4 1.7 16.5
Panama 1,715 47 16 188 2.7 0.9 11.0
Papua New Guinea 17,277 915 285 3,560 5.3 1.7 20.1

Country No. of All TB cases No. of MDR cases
Low 95%
CL
High 95%
CL % MDR TB
Low 95%
CL
High 95%
CL
Paraguay 4,719 109 34 212 2.3 0.8 4.2
Peru 51,670 3,972 2,842 5,192 7.7 6.3 9.4
Philippines 256,511 11,848 7,428 17,106 4.6 3.4 5.9
Poland 10,660 127 81 181 1.2 0.8 1.8
Portugal 3,762 64 38 96 1.7 1.1 2.5
Puerto Rico 206 0 0 0 0.0 0.0 0.0
Qatar 493 5 1 15 1.1 0.2 3.1
Rep. Korea 49,830 2,189 1,541 2,914 4.4 3.4 5.7
Republic of Moldova 7,437 2,035 1,504 2,581 27.4 23.8 31.4
Romania 34,518 1,546 1,047 2,138 4.5 3.3 5.9
Russian Federation 186,080 36,037 28,992 50,258 19.4 17.1 24.6
Rwanda 40,363 1,723 1,000 2,617 4.3 2.8 5.8
Saint Lucia 32 1 0 4 2.7 0.9 11.1
Samoa 41 2 1 8 5.2 1.8 18.6
Saudi Arabia 11,024 375 124 1,540 3.4 1.1 13.6
Senegal 36,361 1,309 587 2,225 3.6 1.6 6.0
Serbia 3,534 26 10 47 0.7 0.3 1.3
Seychelles 30 1 0 3 2.0 0.6 9.2
Sierra Leone 30,894 532 81 1,228 1.7 0.3 3.9
Singapore 1,277 4 0 9 0.3 0.0 0.7
Slovakia 942 21 7 40 2.3 0.8 4.1
Slovenia 278 1 0 2 0.2 0.0 0.8
Solomon Islands 664 0 0 29 0.0 0.0 4.3
Somalia 19,303 412 113 2,229 2.1 0.6 11.3
South Africa 540,571 14,034 10,019 18,409 2.6 2.1 3.2
Spain 13,895 48 8 102 0.3 0.1 0.7
Sri Lanka 12,230 21 0 75 0.2 0.0 0.5
St Vincent & Grenadines 39 1 0 5 3.1 1.1 12.2
Sudan 98,303 2,377 752 12,040 2.4 0.8 11.9
Swaziland 14,535 248 79 462 1.7 0.5 3.2
Sweden 561 4 1 9 0.7 0.1 1.6
Switzerland 550 6 1 14 1.2 0.3 2.5
Syrian Arab Republic 6,510 287 90 1,195 4.4 1.4 17.8
Tajikistan 15,986 3,204 1,072 8,916 20.0 6.8 53.9
TFYR Macedonia 680 19 6 79 2.8 0.9 11.4
Thailand 94,139 2,834 1,920 3,926 3.0 2.1 4.2
Timor-Leste 6,260 225 46 1,192 3.6 0.7 18.5
Togo 26,703 667 190 3,449 2.5 0.7 12.6
Tonga 26 1 0 5 4.5 1.4 17.6
Tunisia 2,563 84 22 413 3.3 0.9 15.7
Turkey 27,272 889 284 3,320 3.3 1.1 12.3
Turkmenistan 3,890 252 125 411 6.5 3.3 10.2
Uganda 112,098 836 120 1,858 0.7 0.1 1.6
Ukraine 61,857 13,429 9,810 17,150 21.7 18.8 25.1
United Arab Emirates 713 27 9 104 3.8 1.3 14.2
United Kingdom 9,776 74 42 113 0.8 0.5 1.0
UR Tanzania 133,072 1,335 240 2,942 1.0 0.2 2.0
Uruguay 986 5 0 13 0.5 0.0 1.4
USA 13,616 159 133 190 1.2 1.0 1.4
Uzbekistan 41,087 9,829 6,891 13,073 23.9 18.4 30.3
Vanuatu 130 0 0 0 0.0 0.0 0.0
Venezuela 11,954 151 76 244 1.3 0.6 2.1
Viet Nam 161,205 6,421 4,402 8,760 4.0 3.0 5.1
West Bank and Gaza Strip 820 36 11 151 4.3 1.4 18.2
Yemen 17,633 573 299 923 3.2 1.9 4.8
Zambia 72,026 1,330 494 2,442 1.8 0.8 3.1
Zimbabwe 94,921 2,460 1,190 4,053 2.6 1.4 4.1

Annex 11: Estimates of MDR-TB by epidemiological region
Regions No. of New TB cases
No. of MDR TB
cases Low 95% CL High 95% CL % MDR TB
Low 95%
CL
High 95%
CL
Established Market Economies 85,729 724 573 942 0.8 0.7 1.1
Central Europe 42,464 416 166 2,170 1.0 0.4 5.0
Eastern Europe 336,842 43,878 35,881 54,877 13.0 11.8 15.3
Latin America 315,216 7,196 5,850 10,360 2.3 1.9 3.3
Eastern Mediterranean Region 569,446 16,430 8,137 64,077 2.9 1.5 11.1
Africa low HIV incidence 350,671 5,311 3,705 14,948 1.5 1.1 4.3
Africa high HIV incidence 2,440,270 43,767 33,907 102,418 1.8 1.4 4.2
South-east Asia 3,100,354 85,908 58,085 148,884 2.8 2.1 4.7
Western Pacific Region 1,882,930 82,087 57,531 107,804 4.4 3.9 4.8
Surveyed countries (n=105) 7,029,716 228,367 190,128 267,943 3.2 2.9 3.6
Non surveyed countries (n=70) 2,094,206 57,351 45,599 164,828 2.7 2.2 7.7
All countries (n=175) 9,123,922 285,718 256,072 399,224 3.1 2.9 4.3
Regions
No. of Previously
treated TB cases
No. of MDR TB
cases Low 95% CL High 95% CL % MDR TB
Low 95%
CL
High 95%
CL
Established Market Economies 5,036 413 330 528 8.2 6.8 10.2
Central Europe 8,038 785 303 2,625 9.8 3.9 31.3
Eastern Europe 79,474 36,179 29,216 43,769 45.5 41.8 49.4
Latin America 33,856 4,873 4,001 5,937 14.4 12.4 16.9
Eastern Mediterranean Region 31,286 9,040 4,733 15,901 28.9 15.5 48.9
Africa low HIV incidence 25,130 3,105 2,169 5,527 12.4 8.9 21.4
Africa high HIV incidence 216,152 14,528 11,004 24,886 6.7 5.4 11.4
South-east Asia 363,959 63,707 43,416 87,495 17.5 15.4 20.2
Western Pacific Region 289,214 70,601 47,134 94,543 24.4 22.7 26.1
Surveyed countries (n=96) 906,968 179,767 146,915 212,012 19.8 18.4 21.3
Non surveyed countries (n=79) 145,177 23,463 19,117 39,326 16.2 13.1 26.3
All countries (n=175) 1,052,145 203,230 172,935 242,177 19.3 18.2 21.3
Regions No. of All TB cases
No. of MDR TB
cases Low 95% CL High 95% CL % MDR TB
Low 95%
CL
High 95%
CL
Established Market Economies 105,795 1,317 1,147 1,557 1.2 1.1 1.5
Central Europe 50,502 1,201 623 3,694 2.4 1.3 7.2
Eastern Europe 416,316 80,057 71,893 97,623 19.2 18.0 22.2
Latin America 349,278 12,070 10,523 15,526 3.5 3.0 4.4
Eastern Mediterranean Region 601,225 25,475 15,737 73,132 4.2 2.6 11.9
Africa low HIV incidence 375,801 8,415 6,889 18,758 2.2 1.9 5.0
Africa high HIV incidence 2,656,422 58,296 48,718 118,506 2.2 1.9 4.5
South-east Asia 3,464,313 149,615 114,780 217,921 4.3 3.5 6.2
Western Pacific Region 2,173,333 152,694 119,886 188,014 7.0 6.1 8.1
Surveyed countries 7,953,603 408,325 361,264 464,069 5.1 4.7 5.7
Non surveyed countries 2,239,383 80,814 71,684 188,605 3.6 3.2 8.4
All countries (n=185) 10,192,986 489,139 455,093 614,215 4.8 4.6 6.0