report of findings irish civil service customer ... · irish civil service customer satisfaction...
TRANSCRIPT

1 © 2017 Ipsos MRBI 16-089559-Civil Service CSS 2017
Irish Civil Service Customer Satisfaction Survey 2017TARIK LAHER
Director
RACHEL MULCAHY
Associate Director
REPORT OF FINDINGS
© 2017 Ipsos MRBI All rights reserved. Contains Ipsos' Confidential and Proprietary information and may not be disclosed or reproduced without the prior written consent of Ipsos.

2 © 2017 Ipsos MRBI 16-089559-Civil Service CSS 2017
Contents
• Background, Objectives & Methodology
• Research Context
Introduction
• Civil Service Contact
• Satisfaction with Service
• Openness to Online Services
• General Perceptions of the Civil Service
• Access to Language Services
Research Findings
• Research Conclusions
Summary of Key Findings
• Respondent Profile
Appendix
3 © 2017 Ipsos MRBI 16-089559-Civil Service CSS 2017
Introduction
4 © 2017 Ipsos MRBI 16-089559-Civil Service CSS 2017
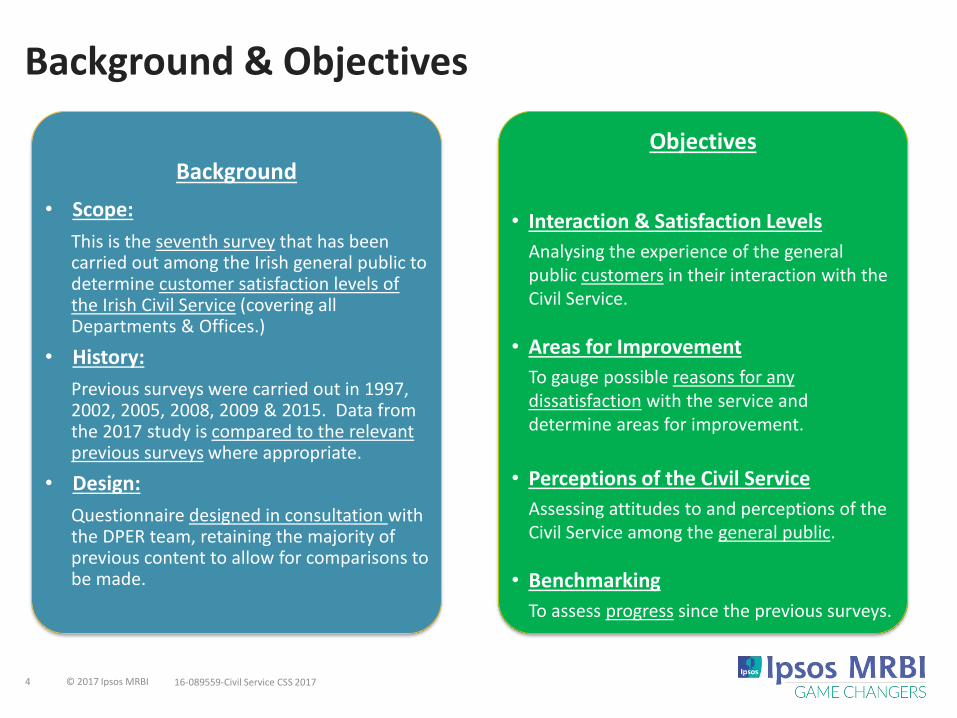
Objectives
• Interaction & Satisfaction Levels
Analysing the experience of the general public customers in their interaction with the Civil Service.
• Areas for Improvement
To gauge possible reasons for any dissatisfaction with the service and determine areas for improvement.
• Perceptions of the Civil Service
Assessing attitudes to and perceptions of the Civil Service among the general public.
• Benchmarking
To assess progress since the previous surveys.
Background
• Scope:
This is the seventh survey that has been carried out among the Irish general public to determine customer satisfaction levels of the Irish Civil Service (covering all Departments & Offices.)
• History:
Previous surveys were carried out in 1997, 2002, 2005, 2008, 2009 & 2015. Data from the 2017 study is compared to the relevant previous surveys where appropriate.
• Design:
Questionnaire designed in consultation with the DPER team, retaining the majority of previous content to allow for comparisons to be made.
Background & Objectives

5 © 2017 Ipsos MRBI 16-089559-Civil Service CSS 2017
Research Methodology
• Quantitative face-to-face survey
• Nationally representative sample of the general public
• 2,027 interviews were completed to allow for greater data interrogation
• Respondents were adults aged 18+
• Fieldwork during January – February 2017
‒ Fieldwork for the 2015 survey was carried out in January & February 2015.
‒ Fieldwork for the 2009 survey was carried out in September & October 2009.
• Interviewing was conducted at 170 sampling points in the Republic of Ireland
- 3,440 Electoral Divisions (ED’s) in Ireland provided the basis for the sampling frame
- Using a random systematic selection process 170 ED’s were selected spread across the entire country
- At each sampling point a random address was selected using the GeoDirectory database
• Quotas were applied to ensure the sample was representative of:
‒ age ‒ gender‒ region‒ social class
• The highest quality control standards were adhered to and met by all Ipsos MRBI interviewers
6 © 2017 Ipsos MRBI 16-089559-Civil Service CSS 2017
Research Context– Drawing on Ipsos MRBI Data
7 © 2017 Ipsos MRBI 16-089559-Civil Service CSS 2017
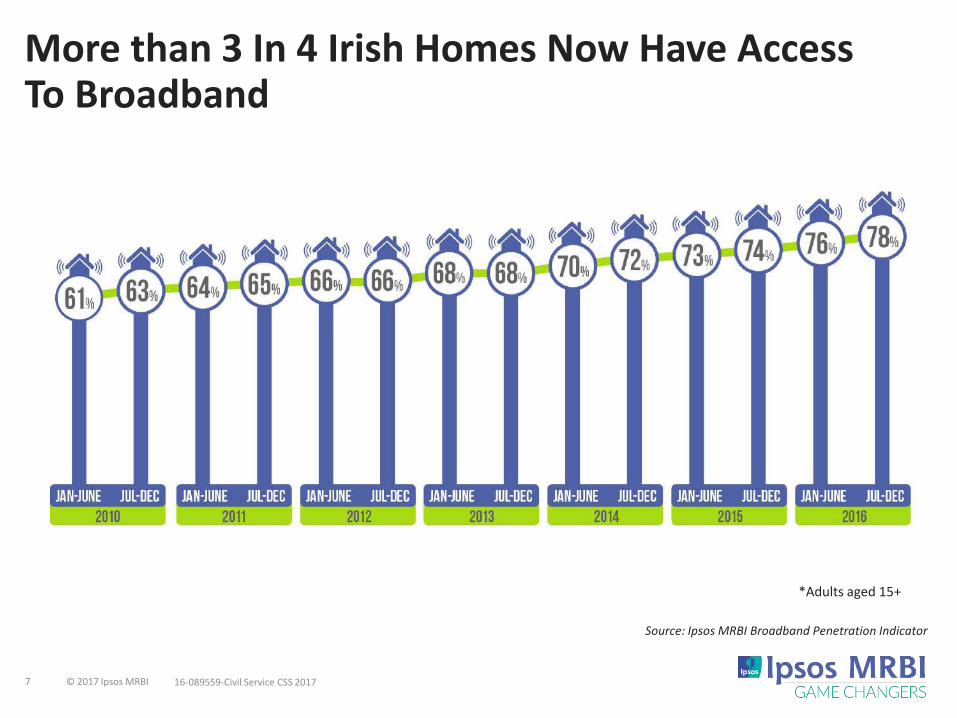
More than 3 In 4 Irish Homes Now Have Access To Broadband
Source: Ipsos MRBI Broadband Penetration Indicator
*Adults aged 15+

8 © 2017 Ipsos MRBI 16-089559-Civil Service CSS 2017
Three in Four Consumers* Now Own A Smartphone
Source: Ipsos MRBI Smartphone Ownership Indicator
*Adults aged 15+
9 © 2017 Ipsos MRBI 16-089559-Civil Service CSS 2017
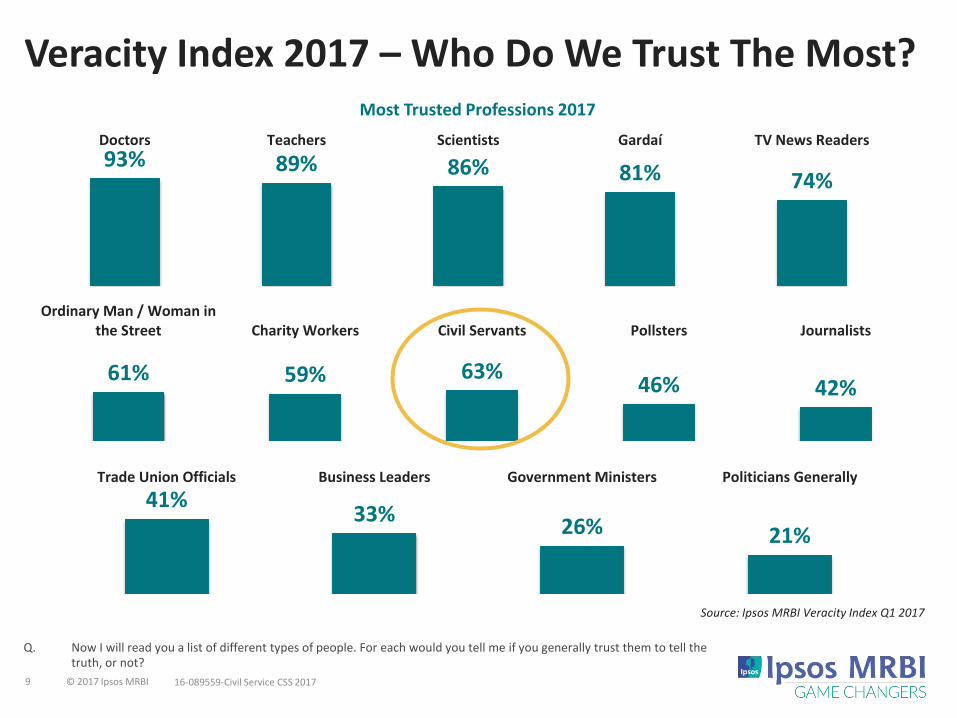
Veracity Index 2017 – Who Do We Trust The Most?
Q. Now I will read you a list of different types of people. For each would you tell me if you generally trust them to tell the truth, or not?
93% 89% 86% 81% 74%
Doctors Teachers Scientists Gardaí TV News Readers
61% 59% 63%46% 42%
Ordinary Man / Woman inthe Street Charity Workers Civil Servants Pollsters Journalists
41%33%
26% 21%
Trade Union Officials Business Leaders Government Ministers Politicians Generally
Source: Ipsos MRBI Veracity Index Q1 2017
Most Trusted Professions 2017
10 © 2017 Ipsos MRBI 16-089559-Civil Service CSS 2017
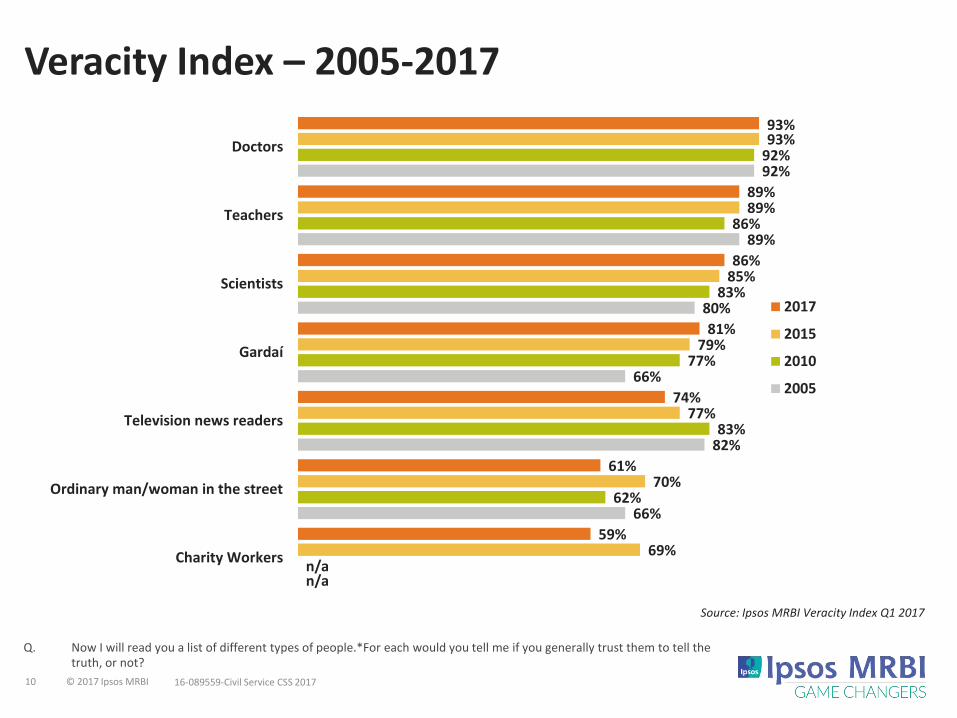
Veracity Index – 2005-2017
Q. Now I will read you a list of different types of people.*For each would you tell me if you generally trust them to tell the truth, or not?
93%
89%
86%
81%
74%
61%
59%
93%
89%
85%
79%
77%
70%
69%
92%
86%
83%
77%
83%
62%
n/a
92%
89%
80%
66%
82%
66%
n/a
Doctors
Teachers
Scientists
Gardaí
Television news readers
Ordinary man/woman in the street
Charity Workers
2017
2015
2010
2005
Source: Ipsos MRBI Veracity Index Q1 2017
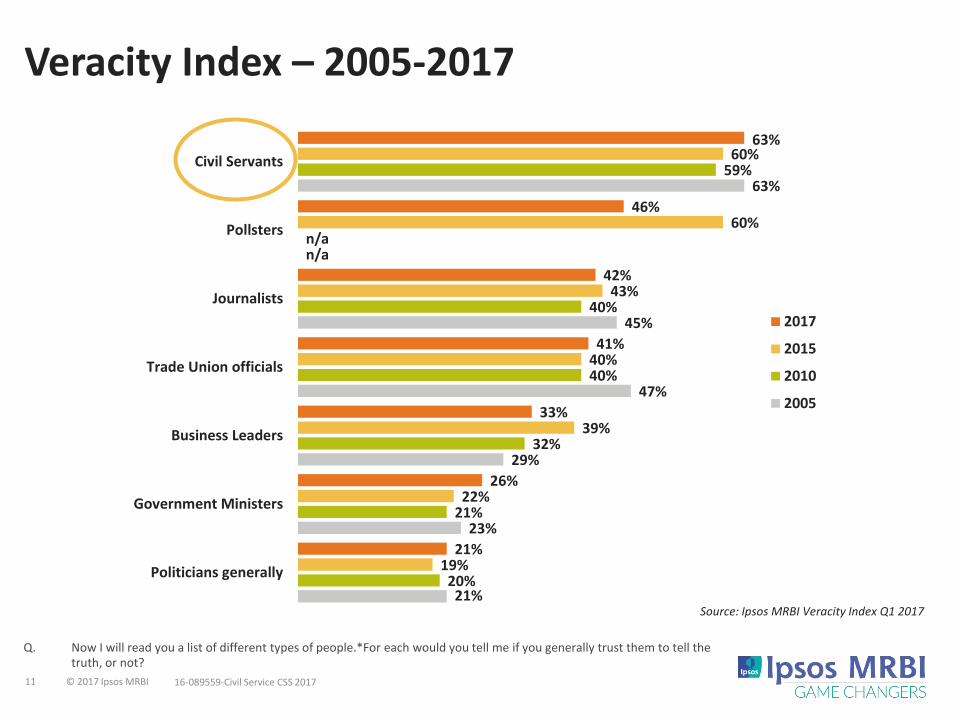
11 © 2017 Ipsos MRBI 16-089559-Civil Service CSS 2017
Q. Now I will read you a list of different types of people.*For each would you tell me if you generally trust them to tell the truth, or not?
63%
46%
42%
41%
33%
26%
21%
60%
60%
43%
40%
39%
22%
19%
59%
n/a
40%
40%
32%
21%
20%
63%
n/a
45%
47%
29%
23%
21%
Civil Servants
Pollsters
Journalists
Trade Union officials
Business Leaders
Government Ministers
Politicians generally
2017
2015
2010
2005
Source: Ipsos MRBI Veracity Index Q1 2017
Veracity Index – 2005-2017
12 © 2017 Ipsos MRBI 16-089559-Civil Service CSS 2017
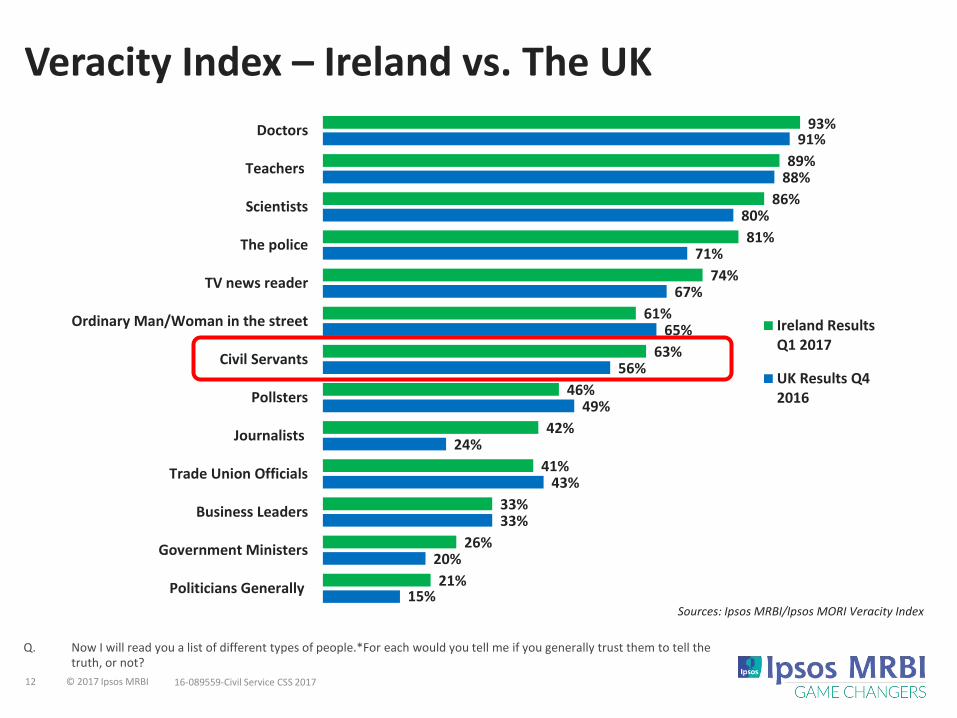
Veracity Index – Ireland vs. The UK
Q. Now I will read you a list of different types of people.*For each would you tell me if you generally trust them to tell the truth, or not?
93%
89%
86%
81%
74%
61%
63%
46%
42%
41%
33%
26%
21%
91%
88%
80%
71%
67%
65%
56%
49%
24%
43%
33%
20%
15%
Doctors
Teachers
Scientists
The police
TV news reader
Ordinary Man/Woman in the street
Civil Servants
Pollsters
Journalists
Trade Union Officials
Business Leaders
Government Ministers
Politicians Generally
Ireland ResultsQ1 2017
UK Results Q42016
Sources: Ipsos MRBI/Ipsos MORI Veracity Index
13 © 2017 Ipsos MRBI 16-089559-Civil Service CSS 2017
Research Findings

14 © 2017 Ipsos MRBI 16-089559-Civil Service CSS 2017
Research Highlights 2017 (I)
Overall contact levels have declined somewhat for most Departments/Offices.
Overall satisfaction levels for service delivery and outcome are highest recorded to date, with both measures exceeding 80% for the first time.
Customer contact via e-mail and online channels is rising, though telephone and face-to-face continue to be important channels.
Satisfaction with almost all aspects of service delivery have increased marginally, with staff interactions continuing to be rated positively.
Advocacy levels have increased overall, particularly among customers.
Civil Service perceptions of efficiency, trust, independence and equality have increased, with some marginal decline in negative sentiment.
15 © 2017 Ipsos MRBI 16-089559-Civil Service CSS 2017
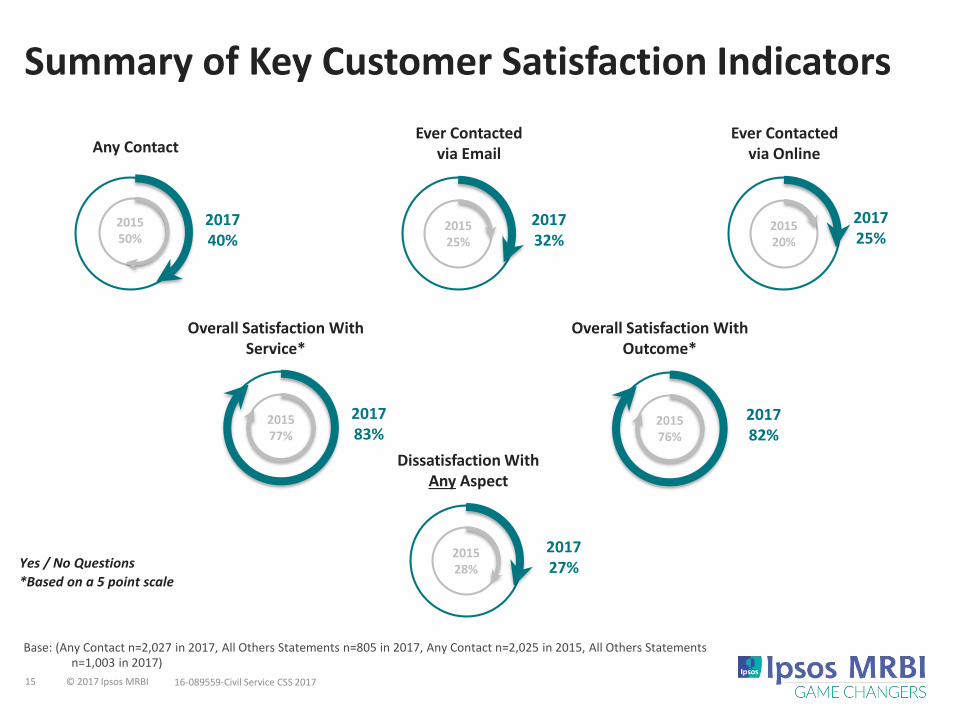
Summary of Key Customer Satisfaction Indicators
Base: (Any Contact n=2,027 in 2017, All Others Statements n=805 in 2017, Any Contact n=2,025 in 2015, All Others Statements n=1,003 in 2017)
Any Contact
201740%
201550%
Ever Contacted via Email
Ever Contacted via Online
201725%
Overall Satisfaction With Outcome*
Dissatisfaction With Any Aspect
Overall Satisfaction With Service*
201732%
201525%
201520%
201783%
201577%
201727%
201528%
201782%
201576%
*Based on a 5 point scale
Yes / No Questions

16 © 2017 Ipsos MRBI 16-089559-Civil Service CSS 2017
Research Highlights 2017 (II)
Elements of dissatisfaction around the customer experience are consistent with 2015 and can be summarised as follows;
1. Speed: A perception that the overall process was too slow, or being kept waiting and/or on hold on the phone.
2. Efficiency: Dealing with multiple staff, or lack of communication among staff, or lack of staff on duty.
3. Outcome: A disappointing outcome, or an issue that was not resolved.
4. Non-response: Lack of a response to a query submitted.

17 © 2017 Ipsos MRBI 16-089559-Civil Service CSS 2017
Civil Service Contact
18 © 2017 Ipsos MRBI 16-089559-Civil Service CSS 2017
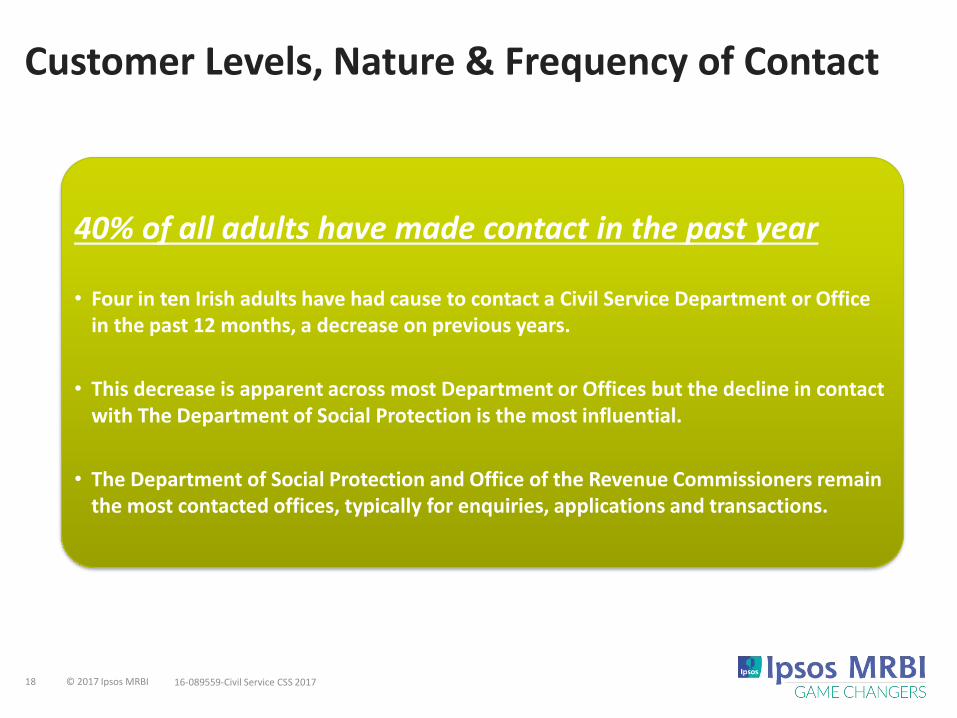
Customer Levels, Nature & Frequency of Contact
40% of all adults have made contact in the past year
• Four in ten Irish adults have had cause to contact a Civil Service Department or Office in the past 12 months, a decrease on previous years.
• This decrease is apparent across most Department or Offices but the decline in contact with The Department of Social Protection is the most influential.
• The Department of Social Protection and Office of the Revenue Commissioners remain the most contacted offices, typically for enquiries, applications and transactions.

19 © 2017 Ipsos MRBI 16-089559-Civil Service CSS 2017
Any Contact With Govt. Departments/Offices In Past 12 Months
Base: All Respondents (n=2,027 in 2017, n=2,025 in 2015, n=2,007 in 2009, n=1,226 in 2005)
46%49% 50%
40%
1
2005 2009 2015 2017
Detailed explanation given to each respondent to ensure comprehension of what did and did not constitute contact with the Civil Service.
Specific exclusions clarified, e.g. the following does not constitute interaction:motortax.ie, HSE, post offices for social welfare payments, An Garda Siochána, annual statements from Revenue
Definition of Civil Service provided and all relevant Departments & Offices read out.
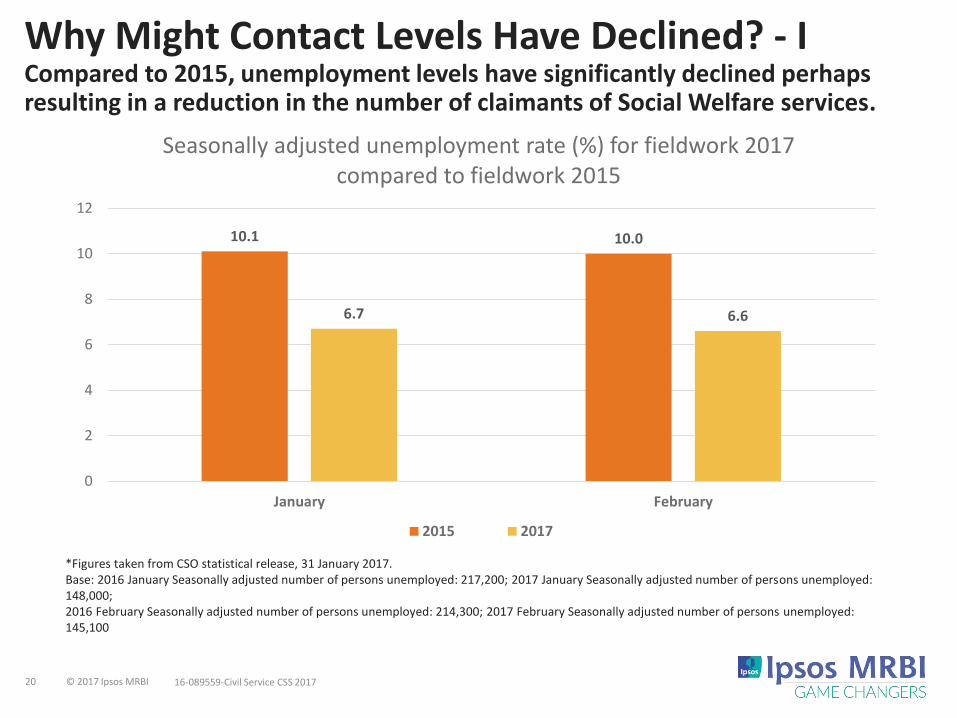
20 © 2017 Ipsos MRBI 16-089559-Civil Service CSS 2017
Why Might Contact Levels Have Declined? - ICompared to 2015, unemployment levels have significantly declined perhaps resulting in a reduction in the number of claimants of Social Welfare services.
10.1 10.0
6.7 6.6
0
2
4
6
8
10
12
January February
Seasonally adjusted unemployment rate (%) for fieldwork 2017 compared to fieldwork 2015
2015 2017
*Figures taken from CSO statistical release, 31 January 2017.Base: 2016 January Seasonally adjusted number of persons unemployed: 217,200; 2017 January Seasonally adjusted number of persons unemployed: 148,000; 2016 February Seasonally adjusted number of persons unemployed: 214,300; 2017 February Seasonally adjusted number of persons unemployed: 145,100

21 © 2017 Ipsos MRBI 16-089559-Civil Service CSS 2017
Why Might Contact Levels Have Declined? – IICompared to 2015, contact levels across most Departments or Offices are down.
2015 2017 Difference
% % %
Social Protection 20 16 - 4 ↓
Office of the Revenue Commissioners
15 14 -1 ↓
Passport Office (new in 2017) n/a 8 +8 ↑
Department of Health 7 5 -2 ↓
Department of Agriculture 5 4 -1 ↓
Department of Education & Skills 5 4 -1 ↓
Department of Jobs, Enterprise & Innovation
3 2 -1 ↓
Department of Transport, Tourism & Sport
3 2 -1 ↓
Property Registration Authority 6 2 -4 ↓
Department of Foreign Affairs 4 1 -3 ↓

22 © 2017 Ipsos MRBI 16-089559-Civil Service CSS 2017
50%
20%
15%
N/A
7%
4%
5%
5%
3%
2%
3%
6%
Any Contact With Govt. Departments/Offices In Past 12 Months
Base: All Respondents (n=2,027 in 2017, n=2,025 in 2015)
40%
16%
14%
8%
5%
4%
4%
4%
2%
2%
2%
2%
Any Contact
Dept of Social Protection
Office of the Revenue Commissioners
*Passport Office
Dept of Health
**Dept of Housing, Planning, Community and Local Government
Dept of Education & Skills
Dept of Agriculture, Food and the Marine
Dept of Transport, Tourism & Sport
Dept of Children & Youth Affairs
Dept of Jobs, Enterprise & Innovation
Property Registration Authority
All other contacts at 1% or less in 2017
2017 2015*
*Comparison to relevant equivalent Department/Office
Note:*New in 2017, formerly part of Dept. of Foreign Affairs & Trade**Dept. of the Environment, Community & Local Government in 2009 / 2005
24 © 2017 Ipsos MRBI 16-089559-Civil Service CSS 2017
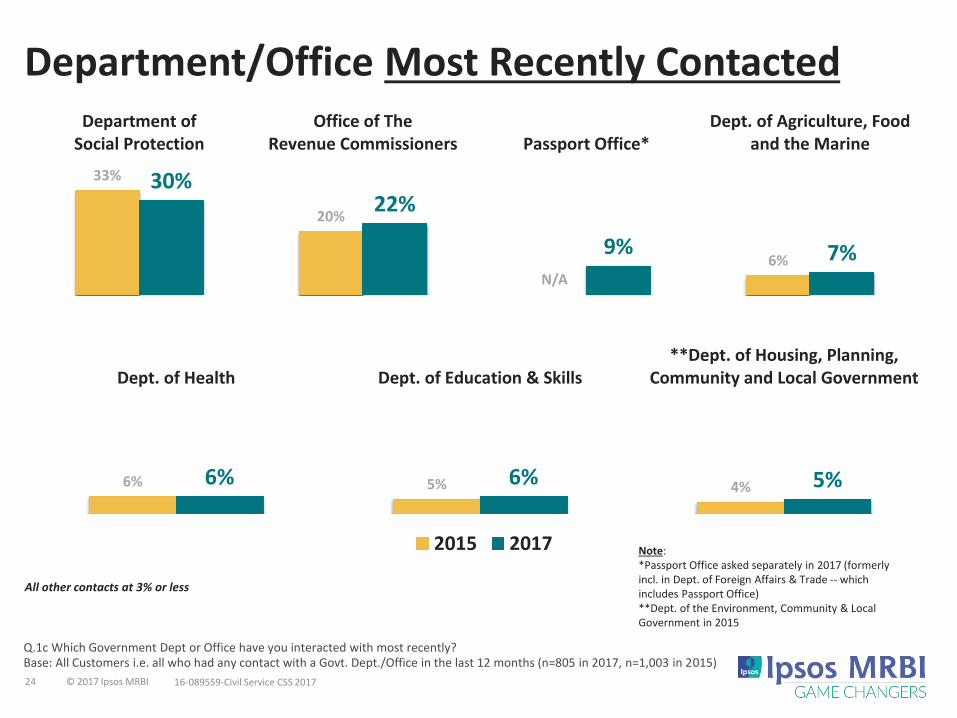
Department/Office Most Recently Contacted
Q.1c Which Government Dept or Office have you interacted with most recently? Base: All Customers i.e. all who had any contact with a Govt. Dept./Office in the last 12 months (n=805 in 2017, n=1,003 in 2015)
All other contacts at 3% or less
33%
20%
N/A6%
30%22%
9% 7%
Department ofSocial Protection
Office of TheRevenue Commissioners Passport Office*
Dept. of Agriculture, Foodand the Marine
6% 5% 4%6% 6% 5%
Dept. of Health Dept. of Education & Skills**Dept. of Housing, Planning,
Community and Local Government
2015 2017 Note:*Passport Office asked separately in 2017 (formerly incl. in Dept. of Foreign Affairs & Trade -- which includes Passport Office)**Dept. of the Environment, Community & Local Government in 2015

25 © 2017 Ipsos MRBI 16-089559-Civil Service CSS 2017
Nature of Most Recent Contact
Q.2 Thinking about your most recent interaction with a Civil Service Dept. or Office, which of the following best describes thenature of this contact?
Base: All Customers i.e. all who had any contact with a Govt. Dept./Office in the last 12 months (n=805 in 2017, n=1,003 in 2015)
Enquiry about a particular service / entitlement / application
201726%2015
25%
Seeking general information
201723%2015
22%
Carrying out a transaction
201714%2015
11%
201717%
201511%
Resolving an issue / Querying the meaning / accuracy in documents received
20179%
201510%
Seeking payment / collecting allowance
20176%
20159%
Requesting a form
20173%2015
2%
Other
20174%2015
3%
Providing information
26 © 2017 Ipsos MRBI 16-089559-Civil Service CSS 2017
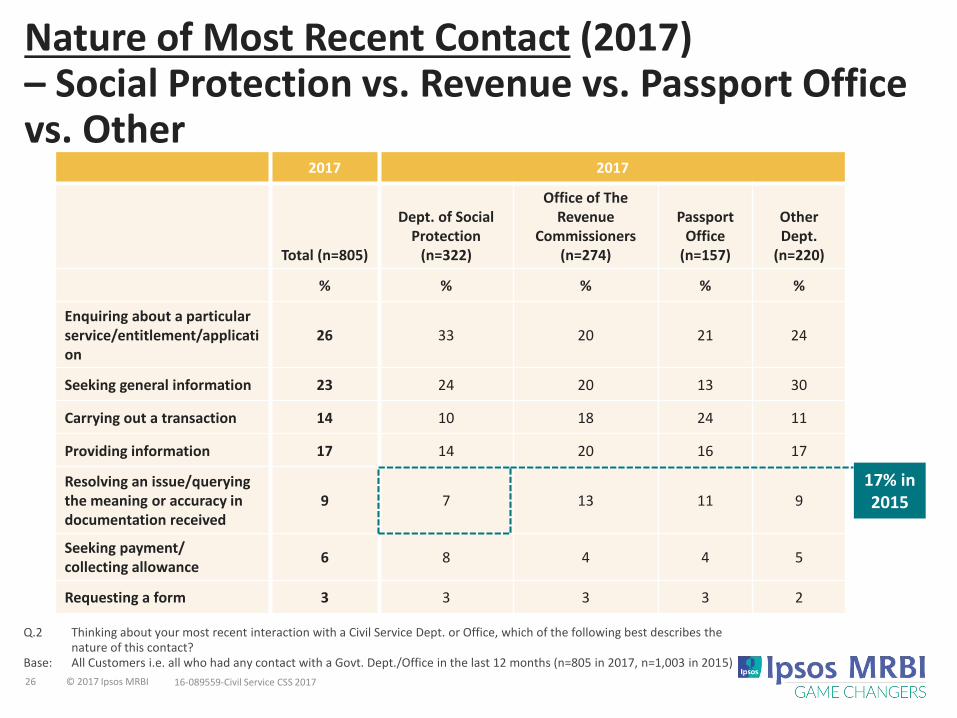
Nature of Most Recent Contact (2017) – Social Protection vs. Revenue vs. Passport Office vs. Other
2017 2017
Total (n=805)
Dept. of Social Protection
(n=322)
Office of The Revenue
Commissioners (n=274)
Passport Office
(n=157)
Other Dept.
(n=220)
% % % % %
Enquiring about a particular service/entitlement/application
26 33 20 21 24
Seeking general information 23 24 20 13 30
Carrying out a transaction 14 10 18 24 11
Providing information 17 14 20 16 17
Resolving an issue/querying the meaning or accuracy in documentation received
9 7 13 11 9
Seeking payment/collecting allowance
6 8 4 4 5
Requesting a form 3 3 3 3 2
Q.2 Thinking about your most recent interaction with a Civil Service Dept. or Office, which of the following best describes thenature of this contact?
Base: All Customers i.e. all who had any contact with a Govt. Dept./Office in the last 12 months (n=805 in 2017, n=1,003 in 2015)
17% in 2015

27 © 2017 Ipsos MRBI 16-089559-Civil Service CSS 2017
Method of Contact
Telephone remains the most used channel, but electronic channels continue to show growth
• Although contact by phone is still the most common channel, the use of contact via online and e-mail continues to increase.
• The channels being used vary by Department/Office (and by type of service required).
• A preference remains for phone and face-to-face contact for some, across all age groups.
29 © 2017 Ipsos MRBI 16-089559-Civil Service CSS 2017
42%
29%
12%
9%
7%
1%
44%
31%
9%
8%
7%
n/a
41%
41%
12%
2%
4%
n/a
57%
25%
11%
4%
2%
n/a
By phone
In person
In writing
Through e-mail
Online via a PC/laptop
Online via a mobile device/tablet
2017
2015
2009
2005
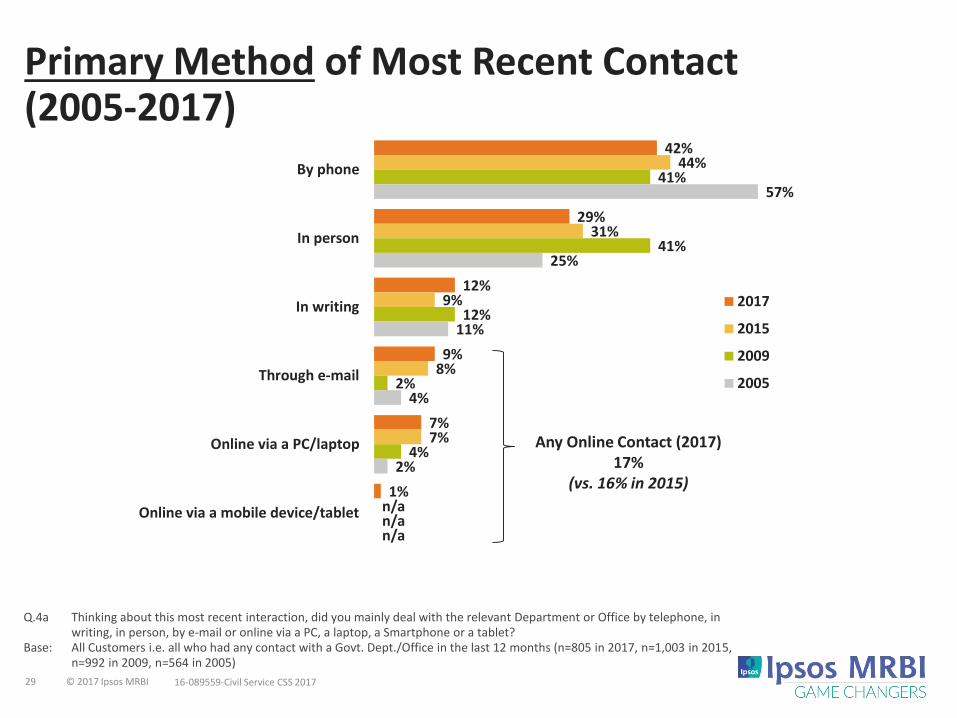
Primary Method of Most Recent Contact (2005-2017)
Q.4a Thinking about this most recent interaction, did you mainly deal with the relevant Department or Office by telephone, in writing, in person, by e-mail or online via a PC, a laptop, a Smartphone or a tablet?
Base: All Customers i.e. all who had any contact with a Govt. Dept./Office in the last 12 months (n=805 in 2017, n=1,003 in 2015, n=992 in 2009, n=564 in 2005)
Any Online Contact (2017) 17%
(vs. 16% in 2015)

30 © 2017 Ipsos MRBI 16-089559-Civil Service CSS 2017
Primary Method of Most Recent Contact (2017) – Social Protection vs. Revenue vs. Passport Office vs. Other
Q.4a Thinking about this most recent interaction, did you mainly deal with the relevant Department or Office by telephone, in writing, in person, by e-mail or online via a PC, a laptop, a Smartphone or a tablet?
Base: All Customers i.e. all who had any contact with a Govt. Dept./Office in the last 12 months (n=805 in 2017, n=1,003 in 2015)
2017 2017
Total (n=805)
Dept. of Social
Protection (n=322)
Office of The Revenue
Commissioners (n=274)
Passport Office
(n=157)Other Dept.
(n=220)
% % % % %
By Phone 42 37 49 28 50
In Person 29 48 18 25 18
In Writing 12 8 7 24 12
Through Email 9 4 14 11 13
Online via a PC / Laptop 7 2 12 11 7
Online via a Smartphone / tablet
1 * 1 1 1
Net Online with Email 17 7 27 23 21
32 © 2017 Ipsos MRBI 16-089559-Civil Service CSS 2017
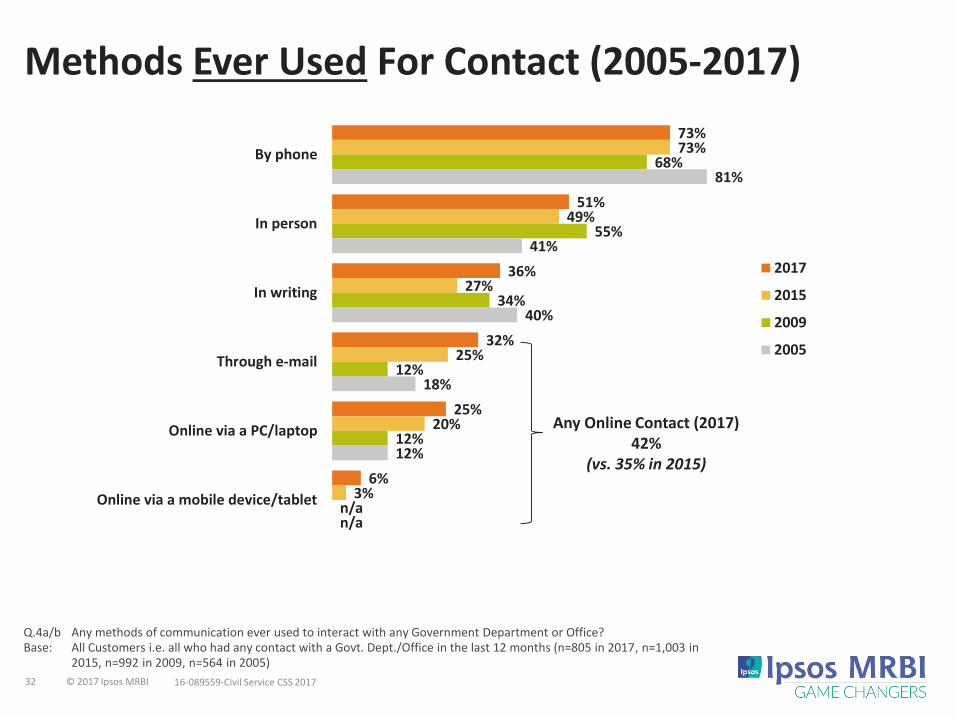
Methods Ever Used For Contact (2005-2017)
Q.4a/b Any methods of communication ever used to interact with any Government Department or Office?Base: All Customers i.e. all who had any contact with a Govt. Dept./Office in the last 12 months (n=805 in 2017, n=1,003 in
2015, n=992 in 2009, n=564 in 2005)
73%
51%
36%
32%
25%
6%
73%
49%
27%
25%
20%
3%
68%
55%
34%
12%
12%
n/a
81%
41%
40%
18%
12%
n/a
By phone
In person
In writing
Through e-mail
Online via a PC/laptop
Online via a mobile device/tablet
2017
2015
2009
2005
Any Online Contact (2017) 42%
(vs. 35% in 2015)
34 © 2017 Ipsos MRBI 16-089559-Civil Service CSS 2017
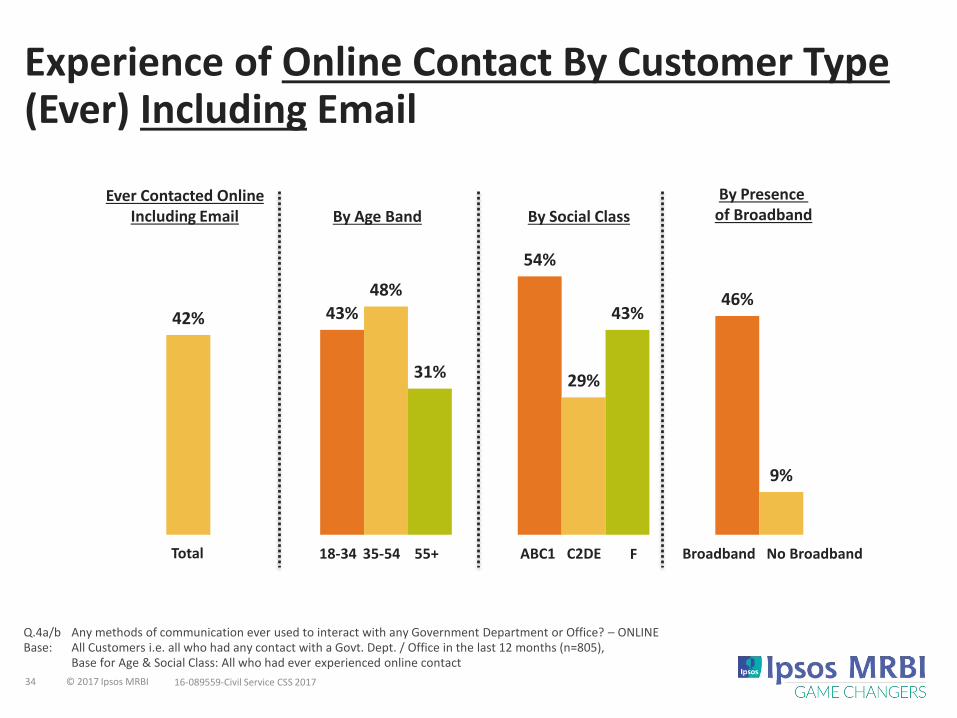
43%
54%
46%42%
48%
29%
9%
31%
43%
Experience of Online Contact By Customer Type(Ever) Including Email
Q.4a/b Any methods of communication ever used to interact with any Government Department or Office? – ONLINE Base: All Customers i.e. all who had any contact with a Govt. Dept. / Office in the last 12 months (n=805),
Base for Age & Social Class: All who had ever experienced online contact
18-34 35-54 55+ ABC1 C2DE
By Age BandEver Contacted Online
Including Email By Social Class
Total F
By Presence of Broadband
Broadband No Broadband

36 © 2017 Ipsos MRBI 16-089559-Civil Service CSS 2017
Reasons For Not Interacting Online
Q.4c Was there any reason in particular why you did not interact with a Government Department or Office online? (Spontaneous, Unprompted)
Base: All who have not interacted with a Govt. Dept. / Office online (n=588) in 2017, All who have not interacted with a Govt. Dept. / Office online (n=795) in 2015
11%
17%
2%
2%
2%
4%
5%
6%
8%
10%
24%
27%
N/S
Don't know
*No need
*Difficult website interface
*Phone/in person more direct/quicker response
The service didn't exist
I wasn't aware it was available online
Limited internet access
Prefer written interaction
Unfamiliar with the internet
Prefer face-to-face interaction
Prefer phone interaction
All others < 1%
* New code opened
27%
24%
14%
7%
6%
2%
2%
N/A
N/A
N/A
2%
26%
2015*
37 © 2017 Ipsos MRBI 16-089559-Civil Service CSS 2017
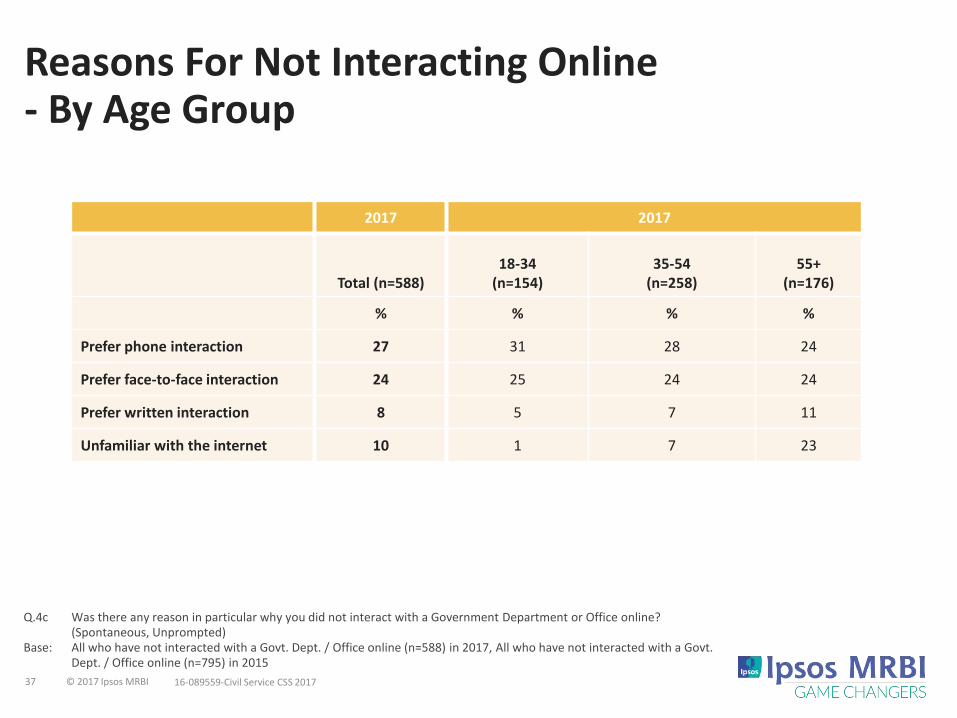
Reasons For Not Interacting Online- By Age Group
Q.4c Was there any reason in particular why you did not interact with a Government Department or Office online? (Spontaneous, Unprompted)
Base: All who have not interacted with a Govt. Dept. / Office online (n=588) in 2017, All who have not interacted with a Govt. Dept. / Office online (n=795) in 2015
2017 2017
Total (n=588)18-34
(n=154)35-54
(n=258)55+
(n=176)
% % % %
Prefer phone interaction 27 31 28 24
Prefer face-to-face interaction 24 25 24 24
Prefer written interaction 8 5 7 11
Unfamiliar with the internet 10 1 7 23

38 © 2017 Ipsos MRBI 16-089559-Civil Service CSS 2017
Satisfaction with Service
39 © 2017 Ipsos MRBI 16-089559-Civil Service CSS 2017
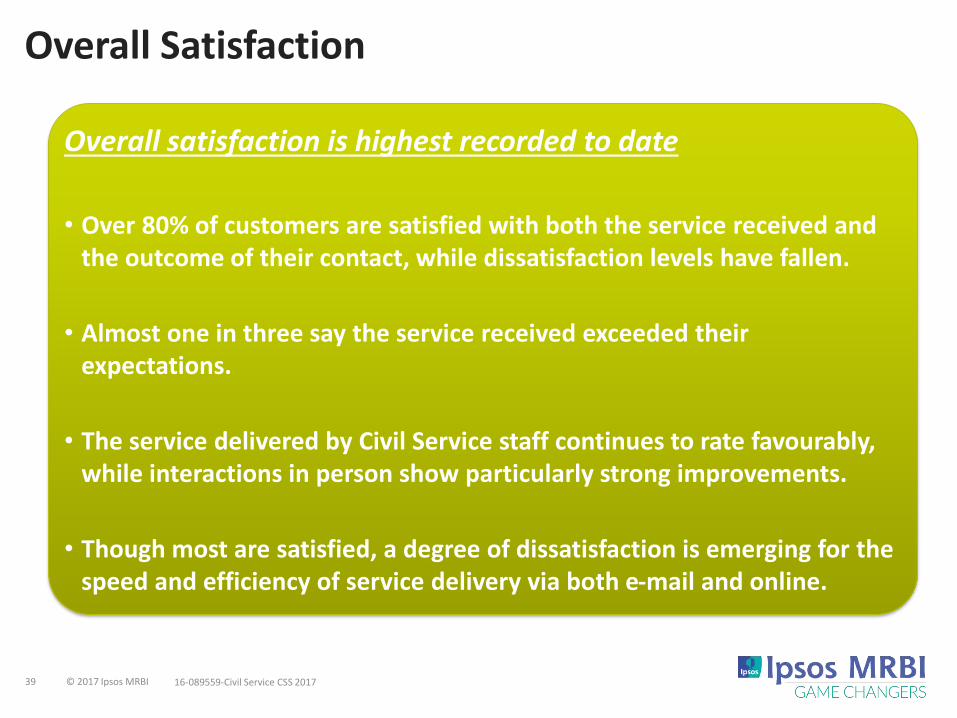
Overall Satisfaction
Overall satisfaction is highest recorded to date
• Over 80% of customers are satisfied with both the service received and the outcome of their contact, while dissatisfaction levels have fallen.
• Almost one in three say the service received exceeded their expectations.
• The service delivered by Civil Service staff continues to rate favourably, while interactions in person show particularly strong improvements.
• Though most are satisfied, a degree of dissatisfaction is emerging for the speed and efficiency of service delivery via both e-mail and online.
40 © 2017 Ipsos MRBI 16-089559-Civil Service CSS 2017
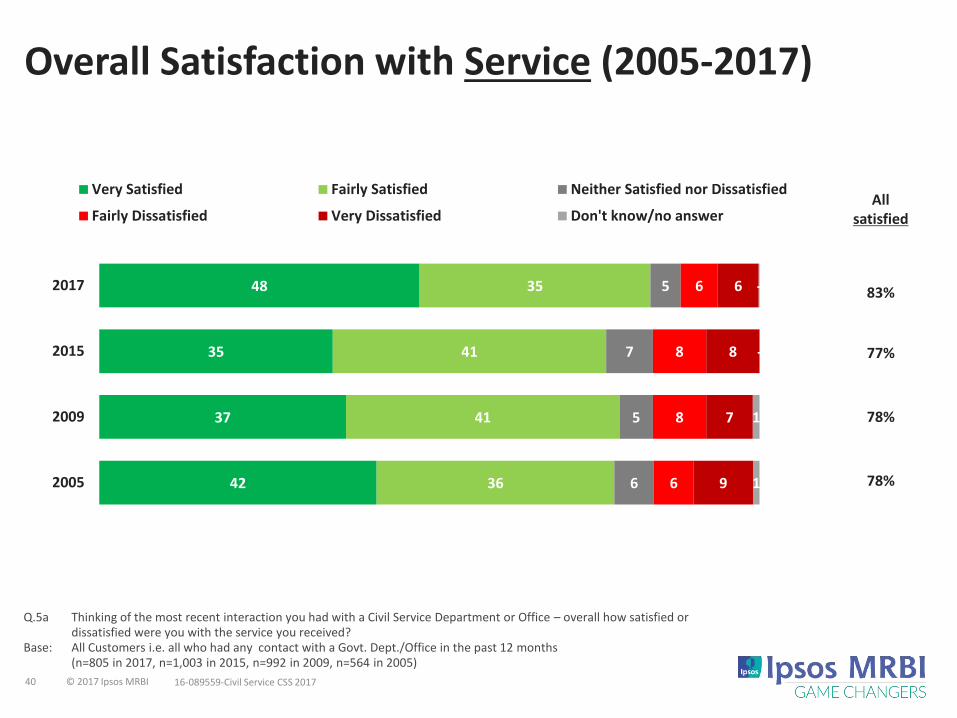
Overall Satisfaction with Service (2005-2017)
Q.5a Thinking of the most recent interaction you had with a Civil Service Department or Office – overall how satisfied or dissatisfied were you with the service you received?
Base: All Customers i.e. all who had any contact with a Govt. Dept./Office in the past 12 months (n=805 in 2017, n=1,003 in 2015, n=992 in 2009, n=564 in 2005)
48
35
37
42
35
41
41
36
5
7
5
6
6
8
8
6
6
8
7
9
-
-
1
1
2017
2015
2009
2005
Very Satisfied Fairly Satisfied Neither Satisfied nor Dissatisfied
Fairly Dissatisfied Very Dissatisfied Don't know/no answer
78%
78%
Allsatisfied
77%
83%
41 © 2017 Ipsos MRBI 16-089559-Civil Service CSS 2017
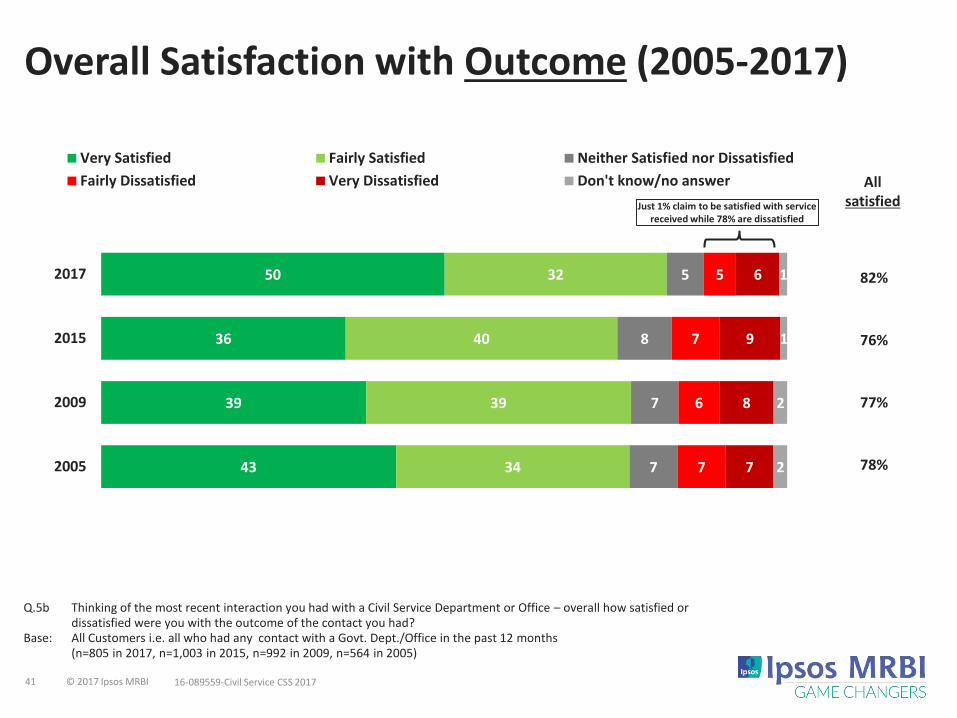
Overall Satisfaction with Outcome (2005-2017)
Q.5b Thinking of the most recent interaction you had with a Civil Service Department or Office – overall how satisfied or dissatisfied were you with the outcome of the contact you had?
Base: All Customers i.e. all who had any contact with a Govt. Dept./Office in the past 12 months (n=805 in 2017, n=1,003 in 2015, n=992 in 2009, n=564 in 2005)
50
36
39
43
32
40
39
34
5
8
7
7
5
7
6
7
6
9
8
7
1
1
2
2
2017
2015
2009
2005
Very Satisfied Fairly Satisfied Neither Satisfied nor Dissatisfied
Fairly Dissatisfied Very Dissatisfied Don't know/no answer
Just 1% claim to be satisfied with service received while 78% are dissatisfied
77%
78%
Allsatisfied
76%
82%
42 © 2017 Ipsos MRBI 16-089559-Civil Service CSS 2017
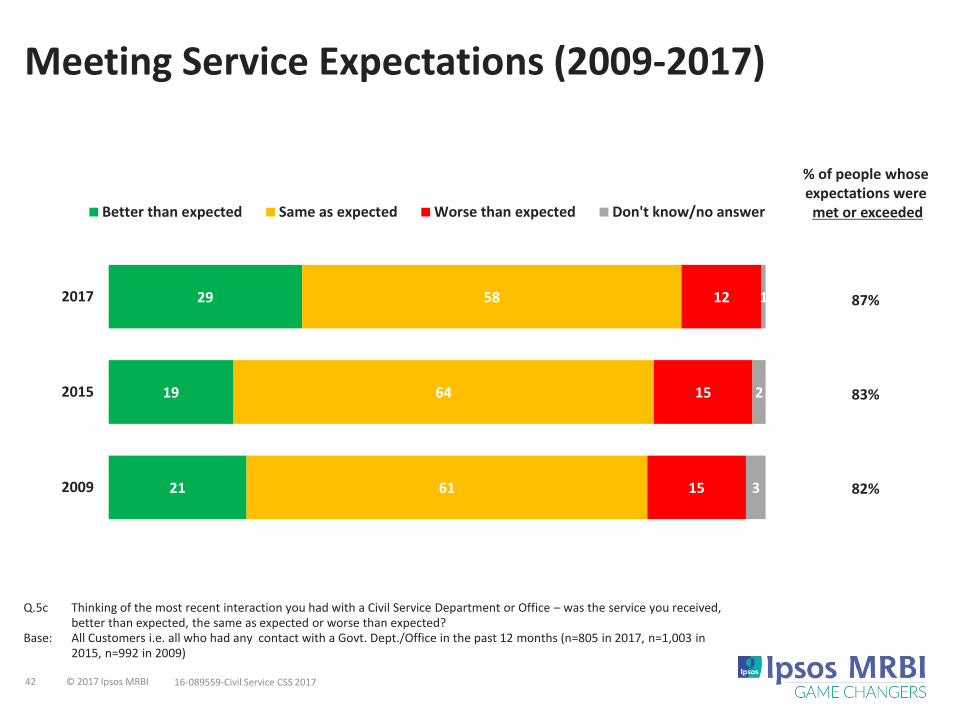
29
19
21
58
64
61
12
15
15
1
2
3
2017
2015
2009
Better than expected Same as expected Worse than expected Don't know/no answer
Meeting Service Expectations (2009-2017)
Q.5c Thinking of the most recent interaction you had with a Civil Service Department or Office – was the service you received, better than expected, the same as expected or worse than expected?
Base: All Customers i.e. all who had any contact with a Govt. Dept./Office in the past 12 months (n=805 in 2017, n=1,003 in 2015, n=992 in 2009)
82%
% of people whose expectations were met or exceeded
83%
87%

43 © 2017 Ipsos MRBI 16-089559-Civil Service CSS 2017
Satisfaction With Service By Phone – Summary
Q.6 Thinking of the most recent contact you had by phone, please tell me how satisfied or dissatisfied you were with the following?Base: All Customers i.e. all who had any contact with a Govt. Dept./Office by phone in the past 12 months (excluding don’t know / no answer)
Ease of finding the telephone number
Helpfulness of staff
Knowledge of staff
Quality of advice/ information received
Manner in which staff explained issues/ provided information
Speed/efficiency with which query was dealt with
Speed with which phone was answered
Amount of time left holding
% Net Satisfied
Telephone menu/automated telephone services Voicemail service
201784%
201582%
201781%
201577%
201751%
201548%
201751%
201543%
201783%
201579%
201783%
201579%
201781%
201576%
201773%
201568%
201761%
201559%
201752%
201545%
46 © 2017 Ipsos MRBI 16-089559-Civil Service CSS 2017
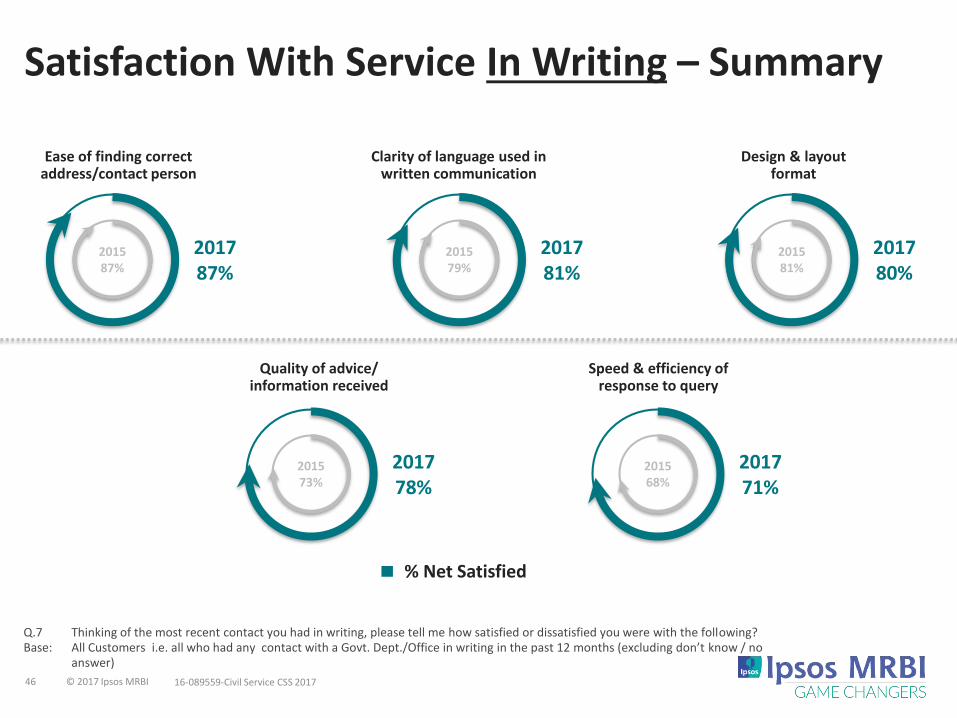
Satisfaction With Service In Writing – Summary
Q.7 Thinking of the most recent contact you had in writing, please tell me how satisfied or dissatisfied you were with the following? Base: All Customers i.e. all who had any contact with a Govt. Dept./Office in writing in the past 12 months (excluding don’t know / no
answer)
Ease of finding correct address/contact person
Clarity of language used in written communication
Design & layoutformat
% Net Satisfied
Quality of advice/ information received
Speed & efficiency of response to query
201787%
201587%
201781%
201579%
201780%
201581%
201778%
201573%
201771%
201568%
48 © 2017 Ipsos MRBI 16-089559-Civil Service CSS 2017
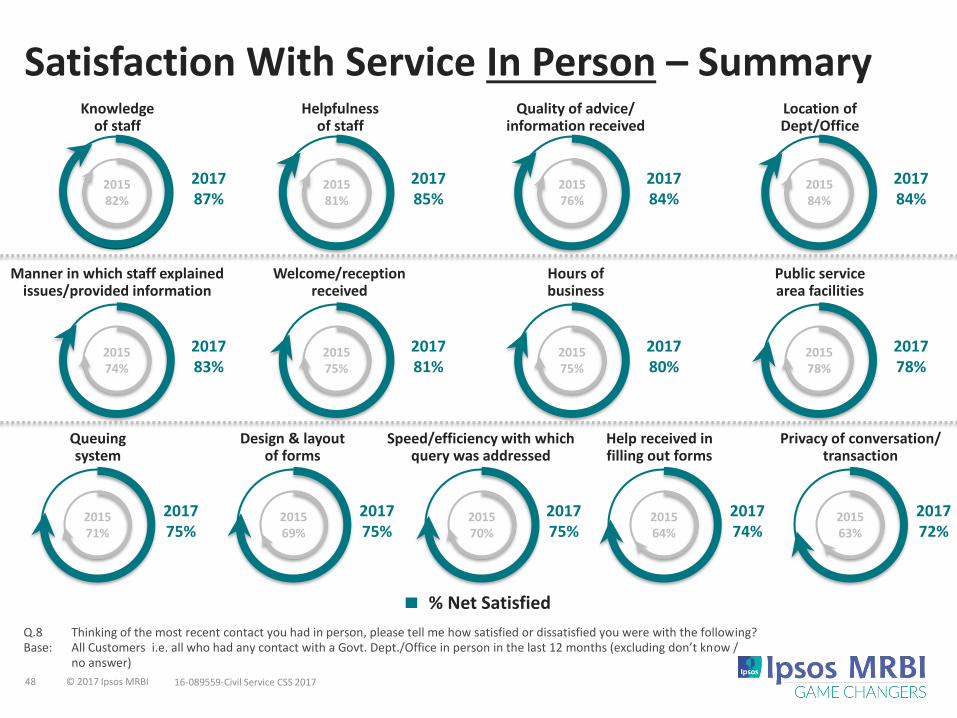
Satisfaction With Service In Person – Summary
Q.8 Thinking of the most recent contact you had in person, please tell me how satisfied or dissatisfied you were with the following?Base: All Customers i.e. all who had any contact with a Govt. Dept./Office in person in the last 12 months (excluding don’t know /
no answer)
Knowledge of staff
Helpfulness of staff
Quality of advice/ information received
Location of Dept/Office
Manner in which staff explained issues/provided information
Welcome/receptionreceived
Hours of business
Public service area facilities
% Net Satisfied
Speed/efficiency with which query was addressed
Privacy of conversation/ transaction
Queuing system
Design & layoutof forms
Help received infilling out forms
201783%
201574%
201775%
201571%
201775%
201569%
201775%
201570%
201774%
201564%
201772%
201563%
201781%
201575%
201780%
201575%
201778%
201578%
201787%
201582%
201785%
201581%
201784%
201576%
201784%
201584%

51 © 2017 Ipsos MRBI 16-089559-Civil Service CSS 2017
Satisfaction With Service By E-mail – Summary
Q.9 Thinking of the most recent contact you had through e-mail, please tell me how satisfied or dissatisfied you were with the following?Base: All Customers i.e. all who had any contact with a Govt. Dept./Office by e-mail in the last 12 months (excluding don’t know /
no answer)
Ease of finding correct e-mail address/contact
Clarity of language used in e-mail
Quality of advice/information received
% Net Satisfied
Speed/efficiency of response to query
201783%
201595%
201788%
201590%
201782%
201584%
201776%
201582%
53 © 2017 Ipsos MRBI 16-089559-Civil Service CSS 2017
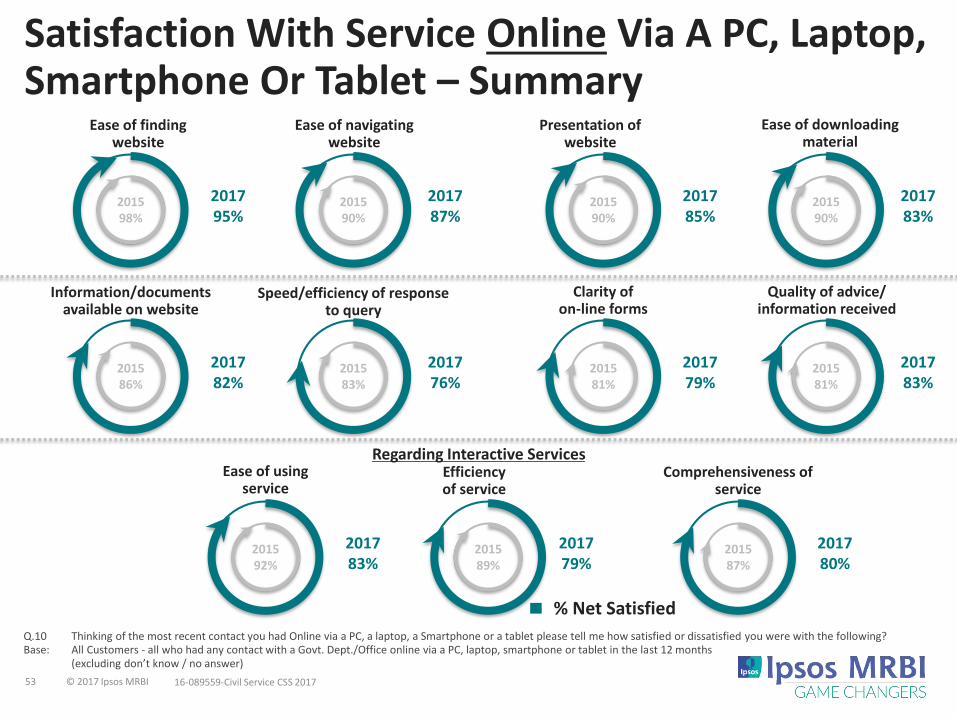
Ease of using service
Information/documents available on website
Presentation of website
Satisfaction With Service Online Via A PC, Laptop, Smartphone Or Tablet – Summary
Q.10 Thinking of the most recent contact you had Online via a PC, a laptop, a Smartphone or a tablet please tell me how satisfied or dissatisfied you were with the following?Base: All Customers - all who had any contact with a Govt. Dept./Office online via a PC, laptop, smartphone or tablet in the last 12 months
(excluding don’t know / no answer)
Ease of finding website
Ease of navigating website
Ease of downloading material
Efficiencyof service
Comprehensiveness of service
% Net Satisfied
Speed/efficiency of response to query
Clarity of on-line forms
Quality of advice/information received
Regarding Interactive Services
201795%
201598%
201787%
201590%
201785%
201590%
201783%
201590%
201782%
201586%
201776%
201583%
201779%
201581%
201783%
201581%
201783%
201592%
201779%
201589%
201780%
201587%
56 © 2017 Ipsos MRBI 16-089559-Civil Service CSS 2017
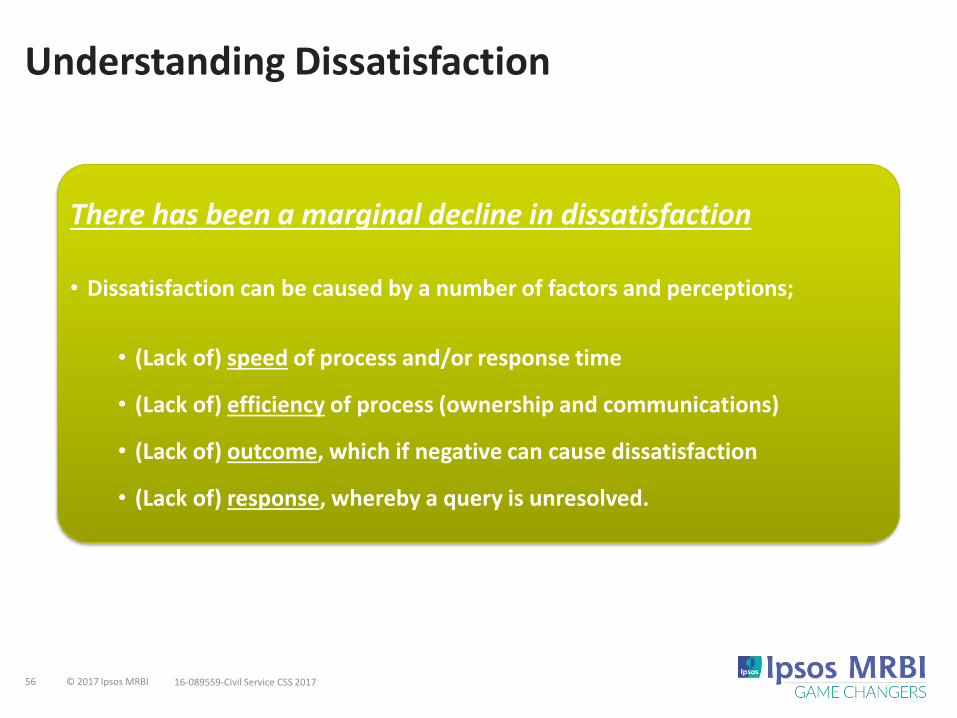
Understanding Dissatisfaction
There has been a marginal decline in dissatisfaction
• Dissatisfaction can be caused by a number of factors and perceptions;
• (Lack of) speed of process and/or response time
• (Lack of) efficiency of process (ownership and communications)
• (Lack of) outcome, which if negative can cause dissatisfaction
• (Lack of) response, whereby a query is unresolved.

57 © 2017 Ipsos MRBI 16-089559-Civil Service CSS 2017
Dissatisfaction with Any Aspect of The Service / Contact (2009-2017)
Q.11 Have you been very or fairly dissatisfied with any aspect of service / contact you received from a Civil Service Department or office in the past 12 months?
Base: All Customers i.e. all who had any contact with a Govt. Dept. or Office in the past 12 months (n=805 in 2017, n=1,003 in 2015, n=992 in 2009)
27%
28%
31%
72%
71%
67%
2017
2015
2009
Yes No
This question was introduced in 2009 to fully explore any aspect of dissatisfaction that may
have been present and was asked of all customers, regardless of overall satisfaction.
58 © 2017 Ipsos MRBI 16-089559-Civil Service CSS 2017
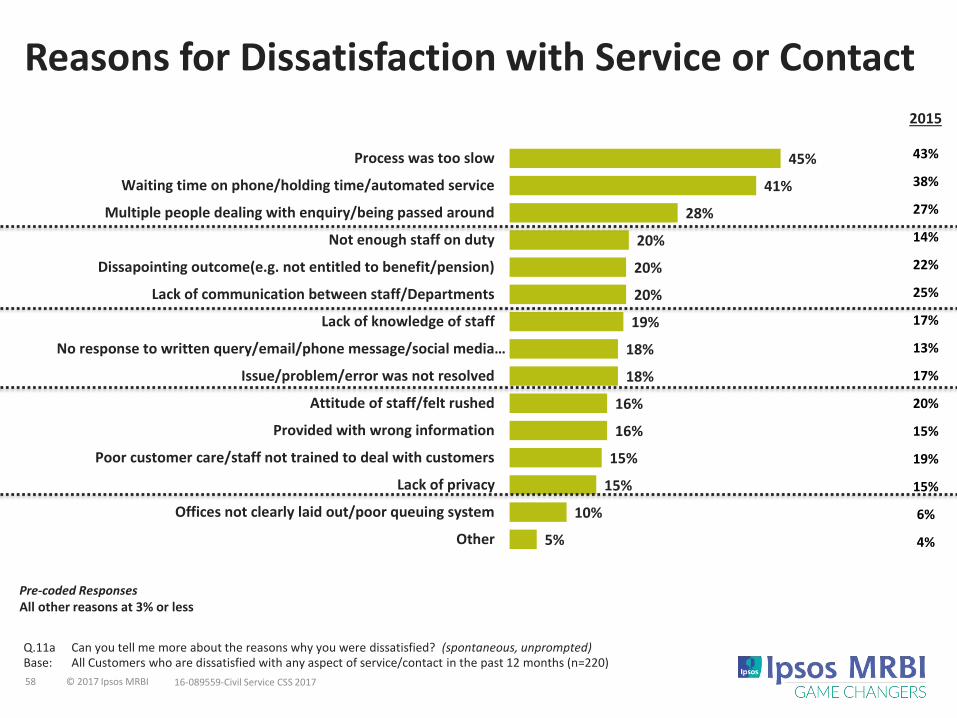
2015
43%
38%
27%
14%
22%
25%
17%
13%
17%
20%
15%
19%
15%
6%
4%
Reasons for Dissatisfaction with Service or Contact
Q.11a Can you tell me more about the reasons why you were dissatisfied? (spontaneous, unprompted)Base: All Customers who are dissatisfied with any aspect of service/contact in the past 12 months (n=220)
45%
41%
28%
20%
20%
20%
19%
18%
18%
16%
16%
15%
15%
10%
5%
Process was too slow
Waiting time on phone/holding time/automated service
Multiple people dealing with enquiry/being passed around
Not enough staff on duty
Dissapointing outcome(e.g. not entitled to benefit/pension)
Lack of communication between staff/Departments
Lack of knowledge of staff
No response to written query/email/phone message/social media…
Issue/problem/error was not resolved
Attitude of staff/felt rushed
Provided with wrong information
Poor customer care/staff not trained to deal with customers
Lack of privacy
Offices not clearly laid out/poor queuing system
Other
Pre-coded ResponsesAll other reasons at 3% or less
59 © 2017 Ipsos MRBI 16-089559-Civil Service CSS 2017
Openness to Online Services
60 © 2017 Ipsos MRBI 16-089559-Civil Service CSS 2017
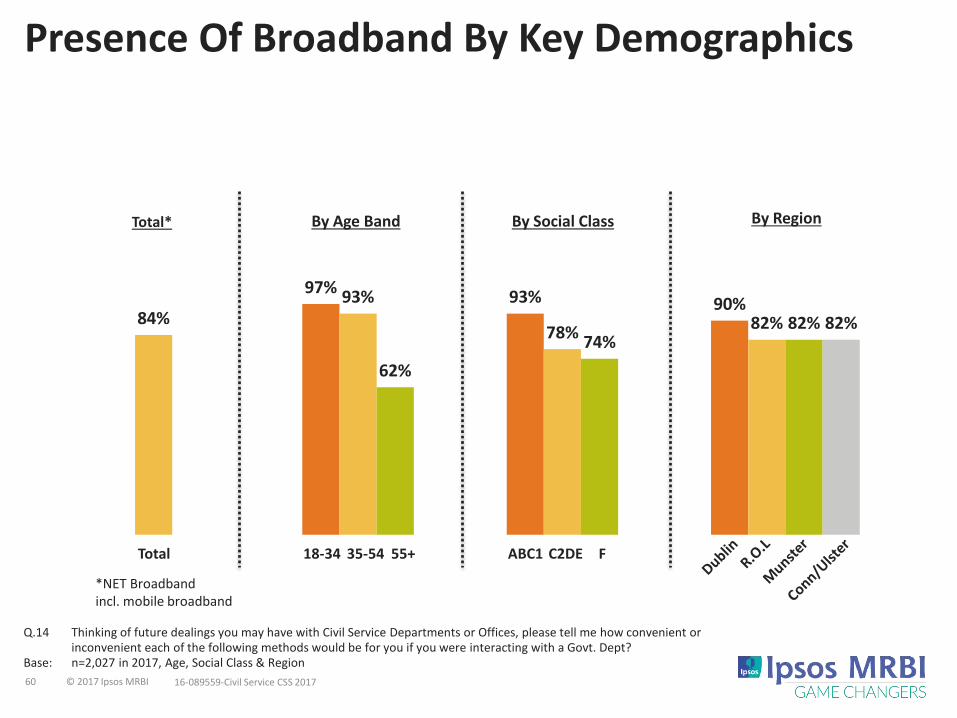
Presence Of Broadband By Key Demographics
Q.14 Thinking of future dealings you may have with Civil Service Departments or Offices, please tell me how convenient or inconvenient each of the following methods would be for you if you were interacting with a Govt. Dept?
Base: n=2,027 in 2017, Age, Social Class & Region
97%93% 90%
84%93%
78%82%
62%
74%82% 82%
Total*
18-34 35-54 55+ ABC1 C2DETotal F
By Age Band By Social Class By Region
*NET Broadband incl. mobile broadband

61 © 2017 Ipsos MRBI 16-089559-Civil Service CSS 2017
Presence Of Smartphone By Key Demographics
Q.14 Thinking of future dealings you may have with Civil Service Departments or Offices, please tell me how convenient or inconvenient each of the following methods would be for you if you were interacting with a Govt. Dept?
Base: n=2,027 in 2017, Age, Social Class & Region
95%87%
82%78%
89%
74%79%
50%57%
80%
69%
Total
18-34 35-54 55+ ABC1 C2DETotal* F
By Age Band By Social Class By Region
*Adults aged 18+
62 © 2017 Ipsos MRBI 16-089559-Civil Service CSS 2017
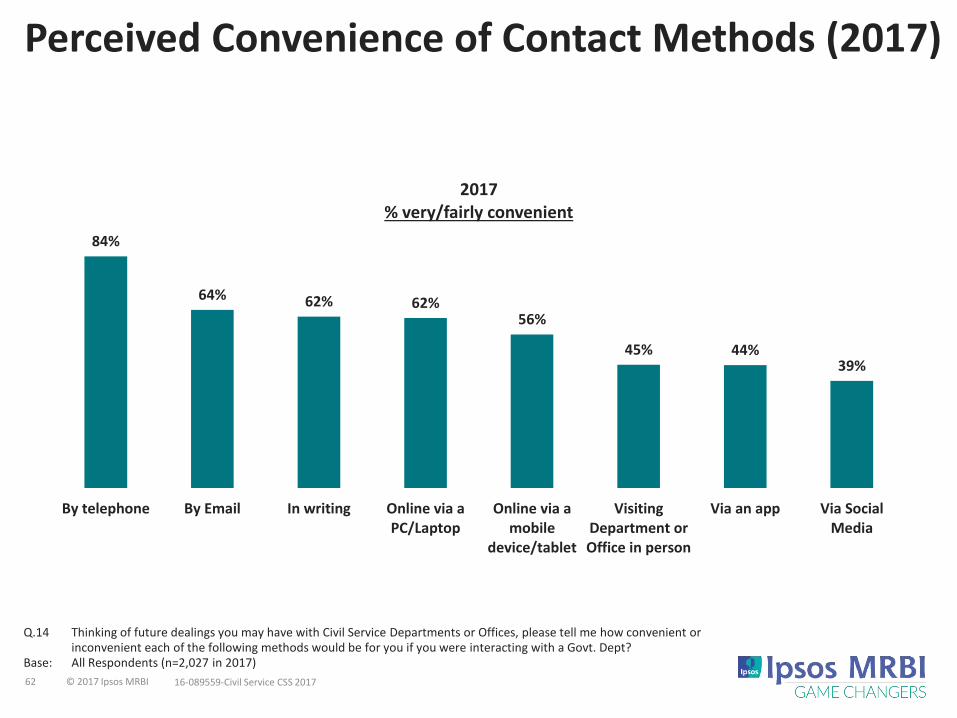
Perceived Convenience of Contact Methods (2017)
Q.14 Thinking of future dealings you may have with Civil Service Departments or Offices, please tell me how convenient or inconvenient each of the following methods would be for you if you were interacting with a Govt. Dept?
Base: All Respondents (n=2,027 in 2017)
84%
64% 62% 62%56%
45% 44%39%
By telephone By Email In writing Online via aPC/Laptop
Online via amobile
device/tablet
VisitingDepartment orOffice in person
Via an app Via SocialMedia
2017% very/fairly convenient

63 © 2017 Ipsos MRBI 16-089559-Civil Service CSS 2017
Perceived Convenience of Contact Methods (2002-2017)
Q.14 Thinking of future dealings you may have with Civil Service Departments or Offices, please tell me how convenient or inconvenient each of the following methods would be for you if you were interacting with a Govt. Dept?
Base: All respondents (n=2,027 in 2017, n=2,025 in 2015, n=2,007 in 2009, n=2,002 in 2008, n=1,226 in 2005, n=1,001 in 2002)
80%86% 84%
78% 83% 84%
67%72%
66% 63% 64%
62%
27%
47%51%
48%
60%
64%
25%
46%50%
48%
58%
62%
46%
56%
37%44% 45%
50%51% 45%
34%
44%
29%
39%
0%
20%
40%
60%
80%
100%
2002 2005 2008 2009 2015 2017
By Telephone In Writing
By E-mail Online via a PC/laptop
Online via a mobile device/tablet Visiting Dept/Office in person
Via an app Via Social Media
% very/fairly convenient
64 © 2017 Ipsos MRBI 16-089559-Civil Service CSS 2017
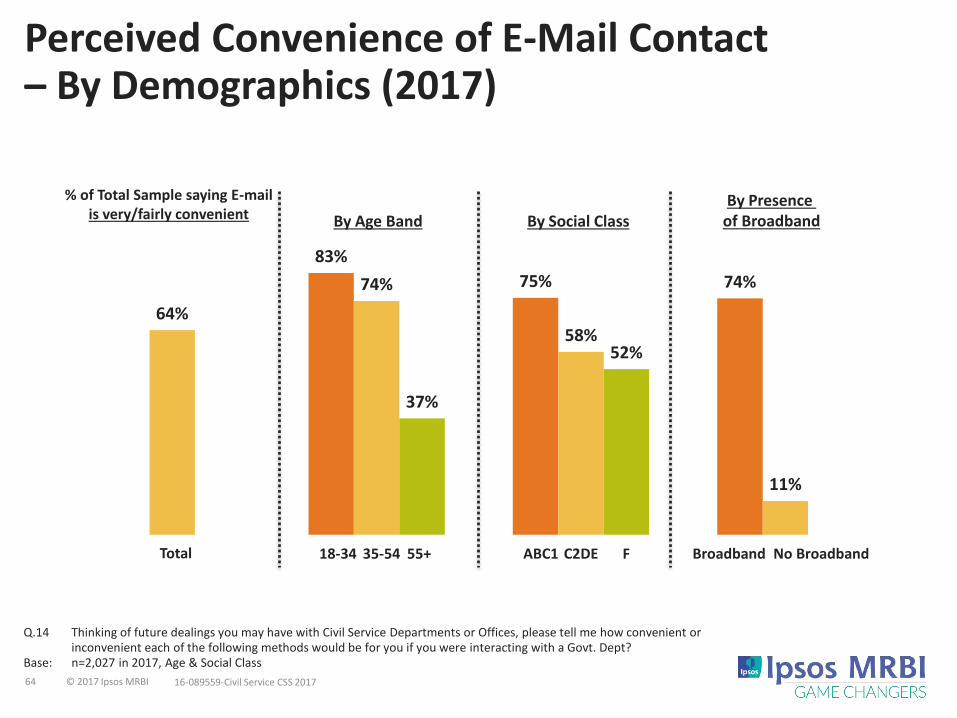
Perceived Convenience of E-Mail Contact – By Demographics (2017)
Q.14 Thinking of future dealings you may have with Civil Service Departments or Offices, please tell me how convenient or inconvenient each of the following methods would be for you if you were interacting with a Govt. Dept?
Base: n=2,027 in 2017, Age & Social Class
83%
75% 74%
64%
74%
58%
11%
37%
52%
% of Total Sample saying E-mailis very/fairly convenient
18-34 35-54 55+ ABC1 C2DETotal F Broadband No Broadband
By Age Band By Social ClassBy Presence
of Broadband
65 © 2017 Ipsos MRBI 16-089559-Civil Service CSS 2017
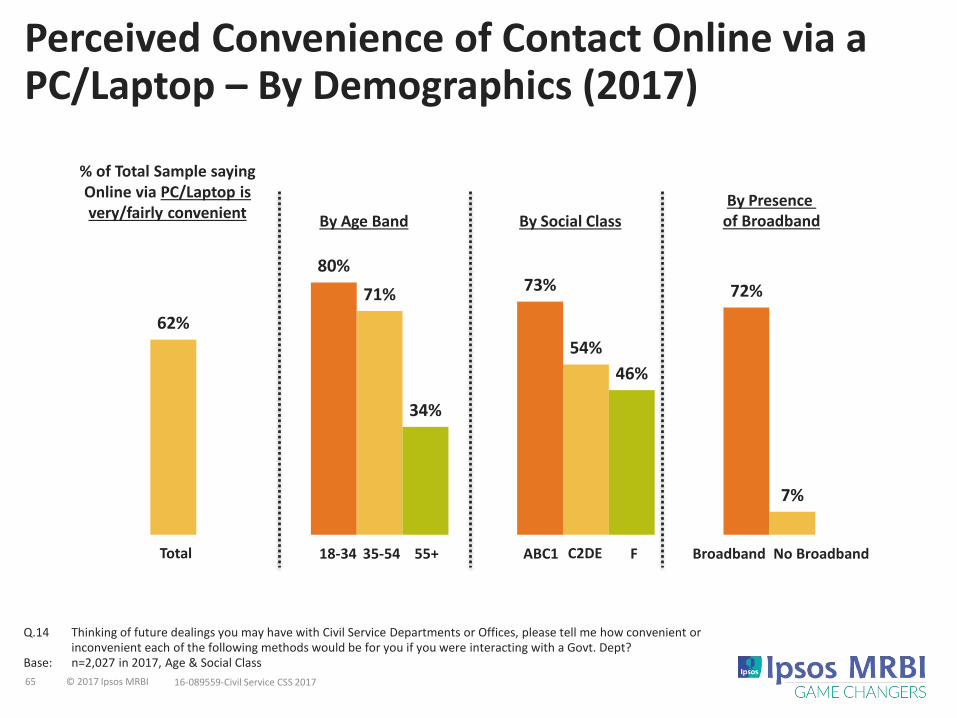
Perceived Convenience of Contact Online via a PC/Laptop – By Demographics (2017)
Q.14 Thinking of future dealings you may have with Civil Service Departments or Offices, please tell me how convenient or inconvenient each of the following methods would be for you if you were interacting with a Govt. Dept?
Base: n=2,027 in 2017, Age & Social Class
80%73% 72%
62%
71%
54%
7%
34%
46%
% of Total Sample saying Online via PC/Laptop is very/fairly convenient
18-34 35-54 55+ ABC1 C2DETotal F Broadband No Broadband
By Age Band By Social ClassBy Presence
of Broadband
66 © 2017 Ipsos MRBI 16-089559-Civil Service CSS 2017
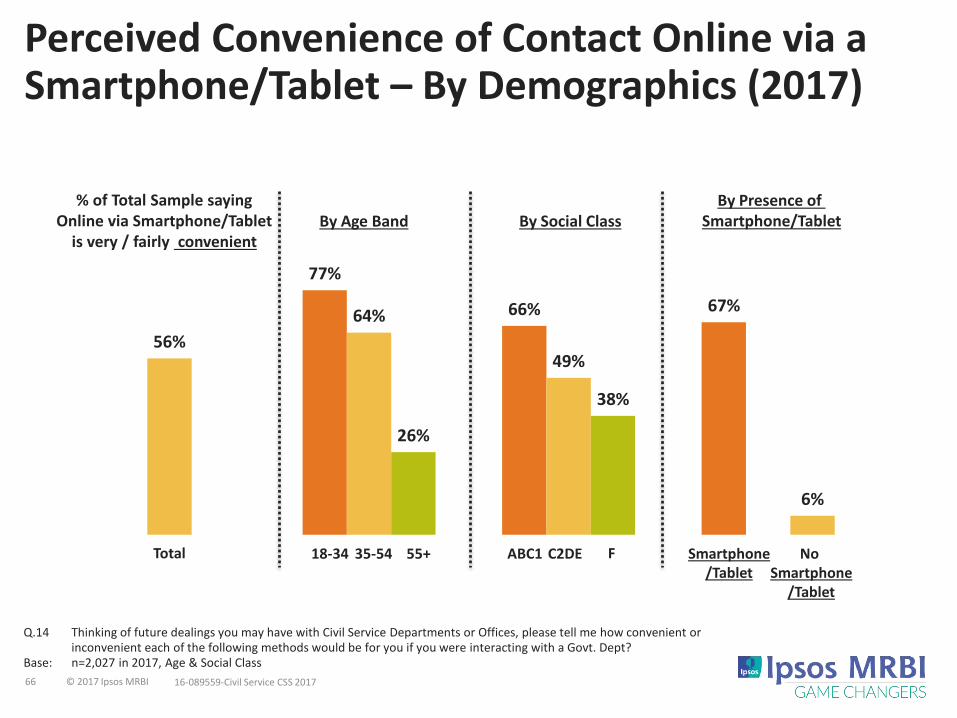
Perceived Convenience of Contact Online via a Smartphone/Tablet – By Demographics (2017)
Q.14 Thinking of future dealings you may have with Civil Service Departments or Offices, please tell me how convenient or inconvenient each of the following methods would be for you if you were interacting with a Govt. Dept?
Base: n=2,027 in 2017, Age & Social Class
77%
66% 67%
56%
64%
49%
26%
38%
6%
% of Total Sample saying Online via Smartphone/Tablet
is very / fairly convenient
18-34 35-54 55+ ABC1 C2DETotal F Smartphone/Tablet
No Smartphone
/Tablet
By Age Band By Social ClassBy Presence of
Smartphone/Tablet

67 © 2017 Ipsos MRBI 16-089559-Civil Service CSS 2017
Perceived Convenience of Contact Via an App – By Demographics (2017)
Q.14 Thinking of future dealings you may have with Civil Service Departments or Offices, please tell me how convenient or inconvenient each of the following methods would be for you if you were interacting with a Govt. Dept?
Base: n=2,027 in 2017, Age & Social Class
69%
54% 54%
44%51%
39%
15%
24%
4%
18-34 35-54 55+ ABC1 C2DETotal F
% of Total Sample saying an App is very/fairly convenient By Age Band By Social Class
Smartphone/Tablet
NoSmartphone
/Tablet
By Presence of Smartphone/Tablet
68 © 2017 Ipsos MRBI 16-089559-Civil Service CSS 2017
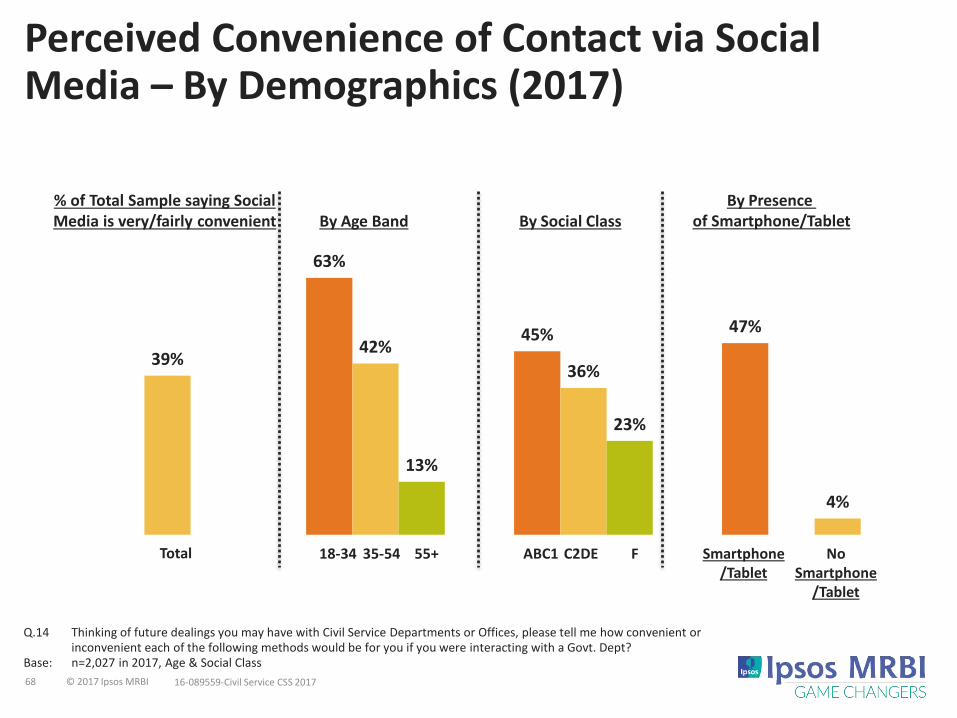
Perceived Convenience of Contact via Social Media – By Demographics (2017)
Q.14 Thinking of future dealings you may have with Civil Service Departments or Offices, please tell me how convenient or inconvenient each of the following methods would be for you if you were interacting with a Govt. Dept?
Base: n=2,027 in 2017, Age & Social Class
63%
45% 47%
39%42%
36%
13%
23%
4%
18-34 35-54 55+ ABC1 C2DE
By Age Band By Social Class
Total F
% of Total Sample saying Social Media is very/fairly convenient
Smartphone/Tablet
NoSmartphone
/Tablet
By Presence of Smartphone/Tablet

69 © 2017 Ipsos MRBI 16-089559-Civil Service CSS 2017
2015
38%
31%
25%
3%
19%
2%
11%
17%
2%
4%
1%
1%
2%
Reasons for Perceived Inconvenience of Interacting Online (2017 - 2015)
Q.14a Why would it be inconvenient for you to interact with a Government Department using certain forms of technology such as online (via a PC, a laptop, a Smartphone or a tablet), Apps or Social Media? (Spontaneous, Unprompted, Multicode)
Base: (n=731 in 2017)
3%
2%
2%
3%
3%
9%
11%
12%
18%
23%
30%
30%
38%
Other
Don't Know
The service didn't exist
Difficult website interface
I wasn't aware it was available online
Limited internet access
Prefer written interaction
Don't have a tablet/Smartphone
Concerns about confidentiality
Dislike social media
Prefer face to face interaction
Prefer phone interaction
Unfamiliar with the internet
All other mentions ≤ 2%

70 © 2017 Ipsos MRBI 16-089559-Civil Service CSS 2017
Reasons for Perceived Inconvenience of Interacting Online (By Age)
Q.14a Why would it be inconvenient for you to interact with a Government Department using certain forms of technology such as online (via a PC, a laptop, a Smartphone or a tablet), Apps or Social Media? (Spontaneous, Unprompted, Multicode)
Base: (n=731 in 2017)
2017 2017
Total (n=731)18-34(n=89)
35-54(n=240)
55+(n=402)
% % % %
Unfamiliar with the internet 38 8 18 56
Prefer phone interaction 30 30 26 32
Prefer face to face interaction 30 25 27 33
Dislike social media 23 18 32 20
Concerns about confidentiality 18 27 27 10
Don't have a tablet/Smartphone 12 9 8 16
Prefer written interaction 11 10 9 12
Limited internet access 9 10 8 10
71 © 2017 Ipsos MRBI 16-089559-Civil Service CSS 2017
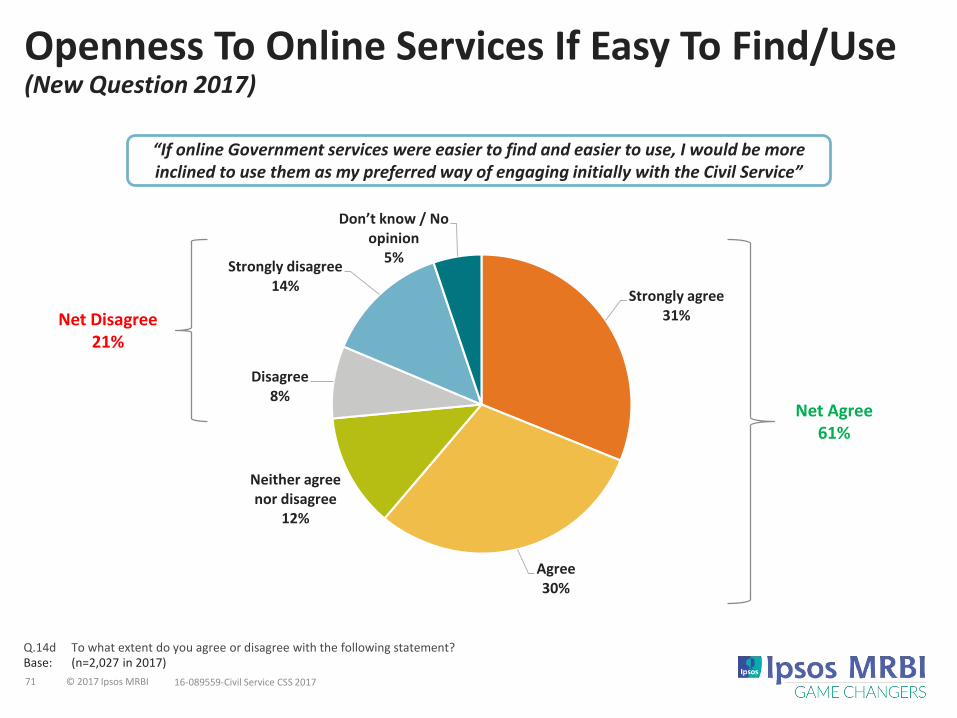
Q.14d To what extent do you agree or disagree with the following statement? Base: (n=2,027 in 2017)
Strongly agree31%
Agree30%
Neither agree nor disagree
12%
Disagree8%
Strongly disagree14%
Don’t know / No opinion
5%
“If online Government services were easier to find and easier to use, I would be more inclined to use them as my preferred way of engaging initially with the Civil Service”
Openness To Online Services If Easy To Find/Use(New Question 2017)
Net Agree61%
Net Disagree21%

72 © 2017 Ipsos MRBI 16-089559-Civil Service CSS 2017
Q.14d To what extent do you agree or disagree with the following statement? Base: (n=2,027 in 2017)
76%70% 69%
27%
61%
69%
55%
18%
37%
51%
% Net Agree
18-3435-54 55+ ABC1C2DETotal F
By Age Band By Social ClassBy Presence
of Broadband
“If online Government services were easier to find and easier to use, I would be more inclined to use them as my preferred way of engaging initially with the Civil Service”
Openness To Online Services If Easy To Find/Use(New Question 2017)
Of Those Who
Currently Perceive Online as
Inconvenient
Total
73 © 2017 Ipsos MRBI 16-089559-Civil Service CSS 2017
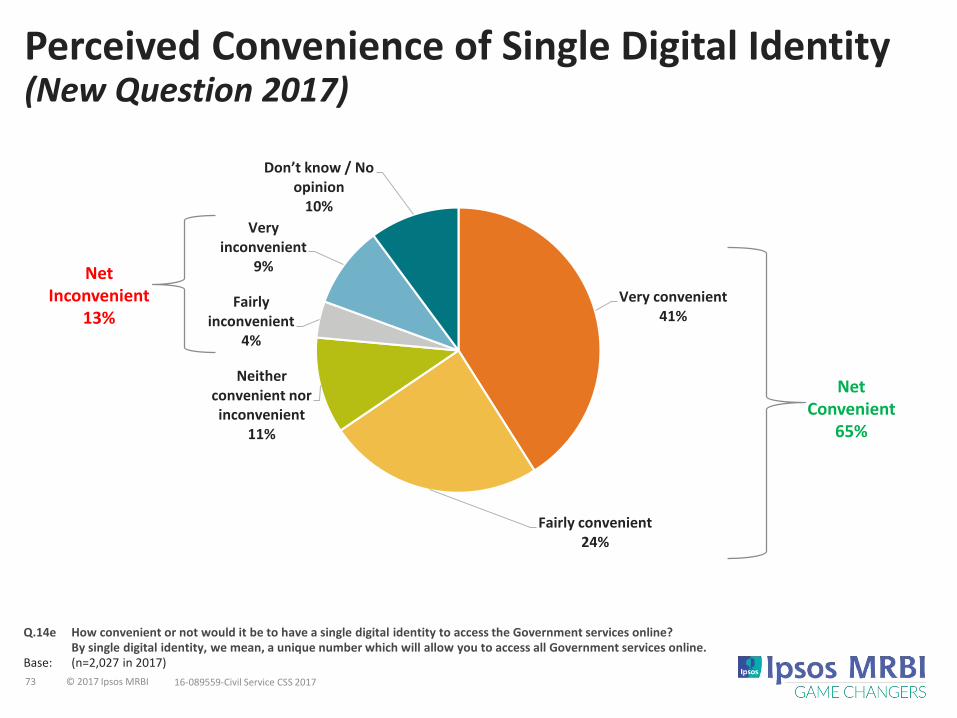
Q.14e How convenient or not would it be to have a single digital identity to access the Government services online? By single digital identity, we mean, a unique number which will allow you to access all Government services online.
Base: (n=2,027 in 2017)
Very convenient 41%
Fairly convenient 24%
Neither convenient nor inconvenient
11%
Fairly inconvenient
4%
Very inconvenient
9%
Don’t know / No opinion
10%
Perceived Convenience of Single Digital Identity(New Question 2017)
Net Convenient
65%
Net Inconvenient
13%

74 © 2017 Ipsos MRBI 16-089559-Civil Service CSS 2017
82%
74% 74%
65%
74%
60%
21%
40%
49%
% Net Convenient
18-34 35-54 55+ ABC1 C2DETotal F Broadband No Broadband
By Age Band By Social ClassBy Presence
of Broadband
Q.14e How convenient or not would it be to have a single digital identity to access the Government Services online? Base: (n=2,027 in 2017)
Perceived Convenience of Single Digital Identity(New Question 2017)
75 © 2017 Ipsos MRBI 16-089559-Civil Service CSS 2017
Civil Service General Perceptions
76 © 2017 Ipsos MRBI 16-089559-Civil Service CSS 2017
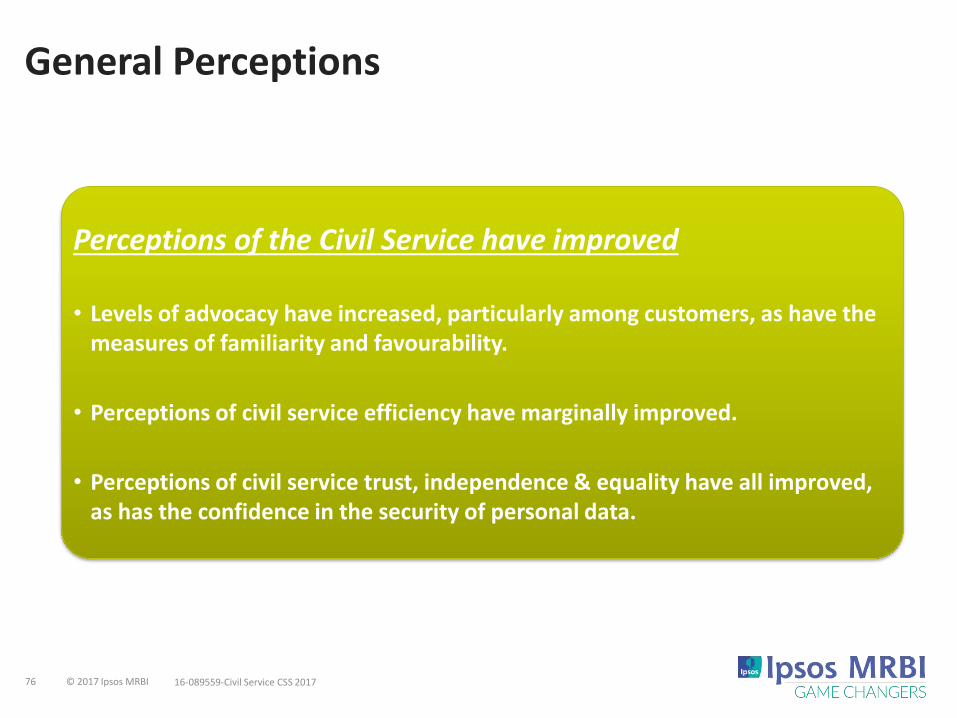
General Perceptions
Perceptions of the Civil Service have improved
• Levels of advocacy have increased, particularly among customers, as have the measures of familiarity and favourability.
• Perceptions of civil service efficiency have marginally improved.
• Perceptions of civil service trust, independence & equality have all improved, as has the confidence in the security of personal data.
77 © 2017 Ipsos MRBI 16-089559-Civil Service CSS 2017
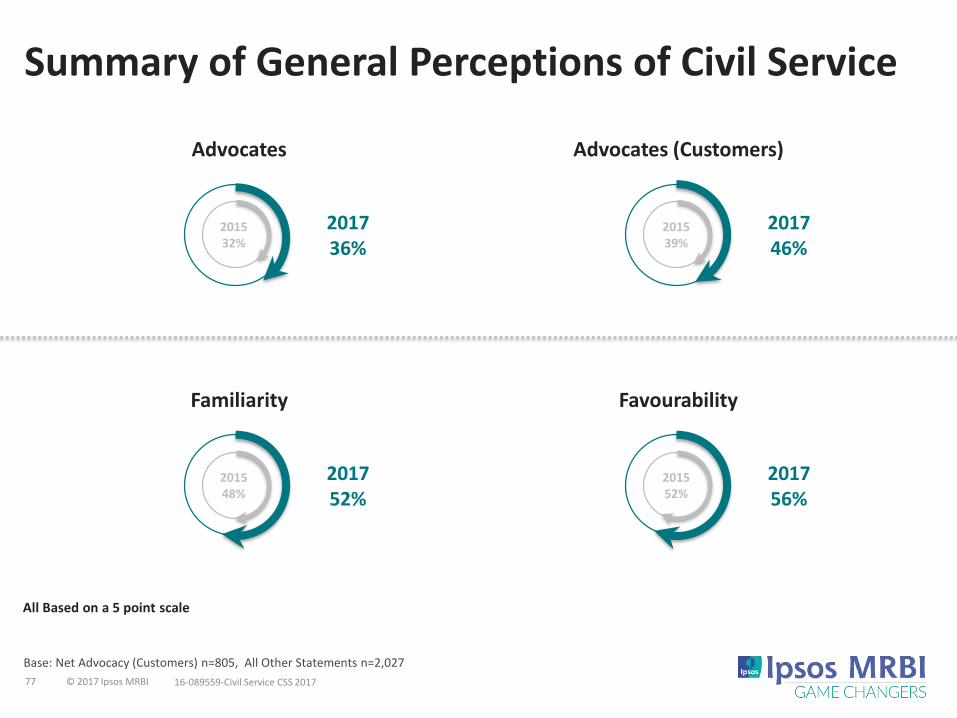
Summary of General Perceptions of Civil Service
Base: Net Advocacy (Customers) n=805, All Other Statements n=2,027
Advocates Advocates (Customers)
201532%
201736%
201539%
201746%
Familiarity Favourability
201548%
201752%
201552%
201756%
All Based on a 5 point scale

78 © 2017 Ipsos MRBI 16-089559-Civil Service CSS 2017
Advocacy Towards Civil Service (2005-2017)All Respondents
Q.22 Taking into account your own experiences or impressions, which of these phrases best describes the way you would speak of the Civil Service to other people?
Base: All respondents (n=2,027 in 2017, n=2,025 in 2015, n=2,007 in 2009, n=1,226 in 2005)
7%
5%
6%
3%
28%
27%
22%
29%
46%
47%
46%
50%
10%
14%
16%
12%
3%
3%
5%
4%
5%
4%
5%
2%
2017
2015
2009
2005
Would speak highly without being asked Would speak highly if I am asked Would be neutral
Would be critical if I am asked Would be critical without being asked No opinion/no answer
28%
32%
21%
16%
% Critics% Advocates
32% 17%
36% 13%

79 © 2017 Ipsos MRBI 16-089559-Civil Service CSS 2017
Advocacy Towards Civil Service (2015-2017) Customers vs. Non-Customers
Q.22 Taking into account your own experiences or impressions, which of these phrases best describes the way you would speak of the Civil Service to other people?
Base: All Customers (n=805 in 2017, n=1,003 in 2015, n=992 in 2009) & All Non-Customers (n=1,222 in 2017, n=1,022 in 2015, n=1,015 in 2009)
11%
7%
5%
4%
35%
32%
24%
22%
37%
40%
53%
54%
11%
15%
10%
13%
4%
4%
2%
2%
2%
2%
6%
5%
2017
2015
2017
2015
Would speak highly without being asked Would speak highly if I am asked Would be neutral
Would be critical if I am asked Would be critical without being asked No opinion/no answer
% Critics% Advocates
Customers
Non-Customers
39% 19%
26% 15%
46% 15%
29% 12%
80 © 2017 Ipsos MRBI 16-089559-Civil Service CSS 2017
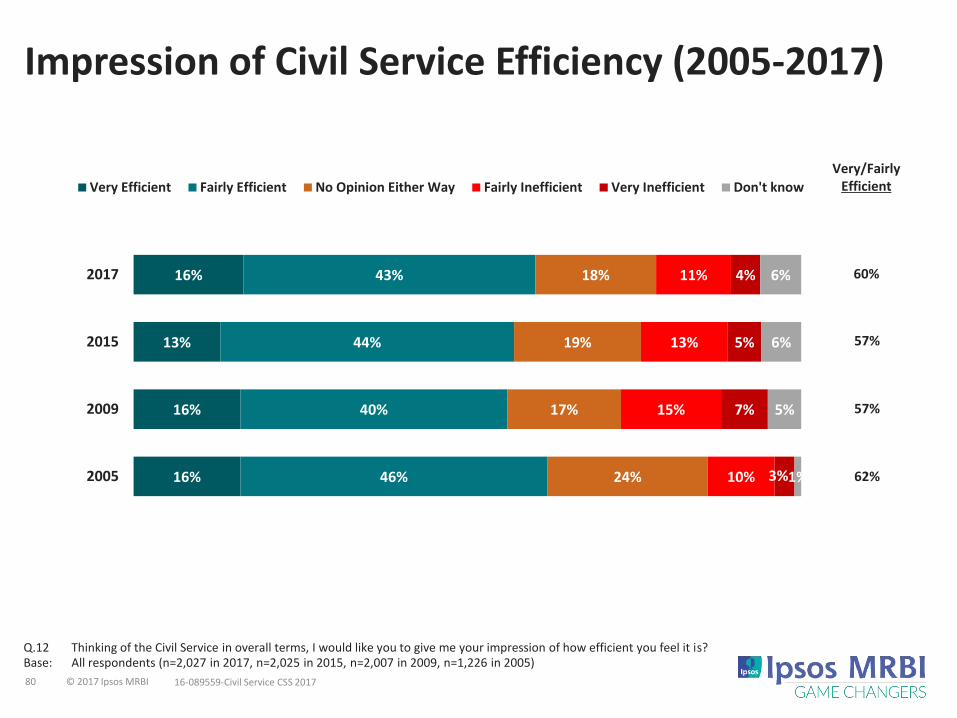
Impression of Civil Service Efficiency (2005-2017)
Q.12 Thinking of the Civil Service in overall terms, I would like you to give me your impression of how efficient you feel it is? Base: All respondents (n=2,027 in 2017, n=2,025 in 2015, n=2,007 in 2009, n=1,226 in 2005)
16%
13%
16%
16%
43%
44%
40%
46%
18%
19%
17%
24%
11%
13%
15%
10%
4%
5%
7%
3%
6%
6%
5%
1%
2017
2015
2009
2005
Very Efficient Fairly Efficient No Opinion Either Way Fairly Inefficient Very Inefficient Don't know
Very/FairlyEfficient
57%
62%
57%
60%
81 © 2017 Ipsos MRBI 16-089559-Civil Service CSS 2017
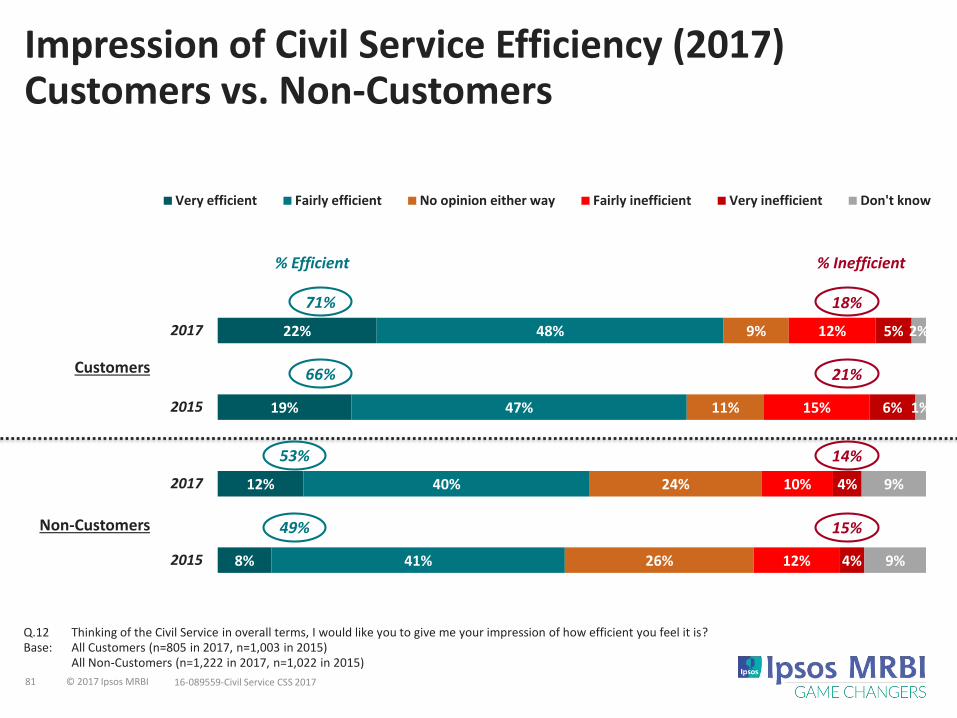
Impression of Civil Service Efficiency (2017)Customers vs. Non-Customers
Q.12 Thinking of the Civil Service in overall terms, I would like you to give me your impression of how efficient you feel it is? Base: All Customers (n=805 in 2017, n=1,003 in 2015)
All Non-Customers (n=1,222 in 2017, n=1,022 in 2015)
22%
19%
12%
8%
48%
47%
40%
41%
9%
11%
24%
26%
12%
15%
10%
12%
5%
6%
4%
4%
2%
1%
9%
9%
2017
2015
2017
2015
Very efficient Fairly efficient No opinion either way Fairly inefficient Very inefficient Don't know
Customers
Non-Customers
% Inefficient% Efficient
66% 21%
49% 15%
71% 18%
53% 14%
82 © 2017 Ipsos MRBI 16-089559-Civil Service CSS 2017
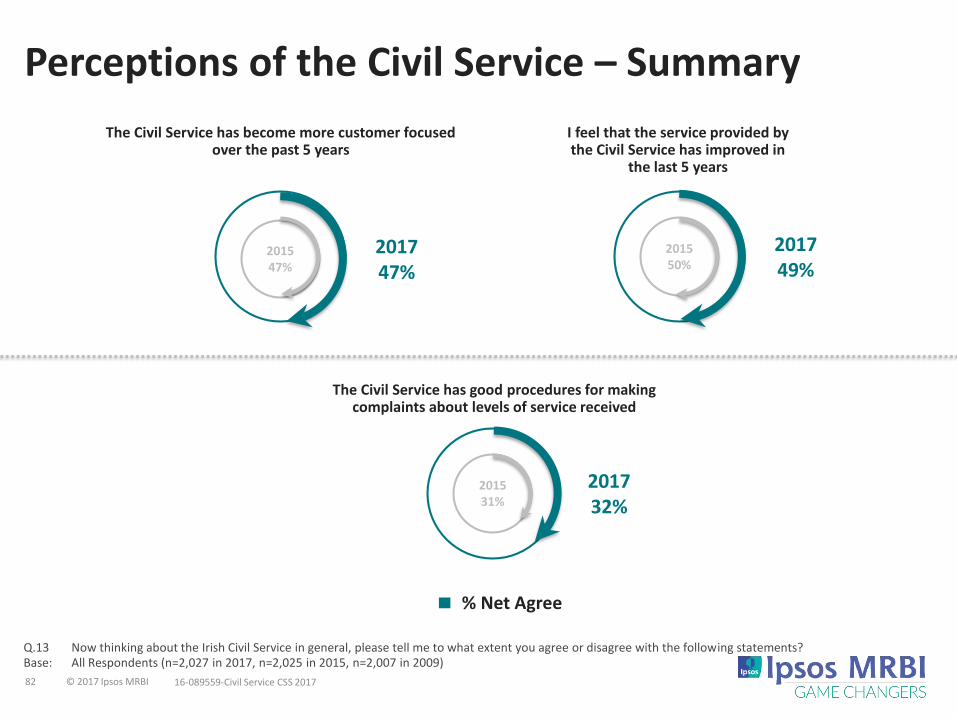
Q.13 Now thinking about the Irish Civil Service in general, please tell me to what extent you agree or disagree with the following statements? Base: All Respondents (n=2,027 in 2017, n=2,025 in 2015, n=2,007 in 2009)
Perceptions of the Civil Service – Summary
I feel that the service provided by the Civil Service has improved in
the last 5 years
% Net Agree
The Civil Service has become more customer focused over the past 5 years
The Civil Service has good procedures for making complaints about levels of service received
201749%
201550%
201747%
201547%
201732%
201531%

83 © 2017 Ipsos MRBI 16-089559-Civil Service CSS 2017
Civil Service Perceptions (I) (2015-2017)
Q.13 Now thinking about the Irish Civil Service in general, please tell me to what extent you agree or disagree with the following statements? Base: All Respondents (n=2,027 in 2017, n=2,025 in 2015, n=2,007 in 2009)
10%
8%
10%
9%
6%
4%
39%
42%
36%
38%
26%
27%
20%
18%
20%
17%
20%
21%
10%
11%
12%
15%
10%
12%
4%
5%
4%
6%
7%
6%
16%
15%
17%
15%
30%
28%
2017
2015
2017
2015
2017
2015
Strongly Agree Agree Neither Agree nor Disagree Disagree Strongly Disagree Don't know
AllAgree
I feel that the service provided by the Civil Service has improved in the last 5 years
The Civil Service has become more customer focused over the past 5 years
The Civil Service has good procedures for making complaints about levels of service
received
49%
50%
47%
47%
32%
31%
84 © 2017 Ipsos MRBI 16-089559-Civil Service CSS 2017
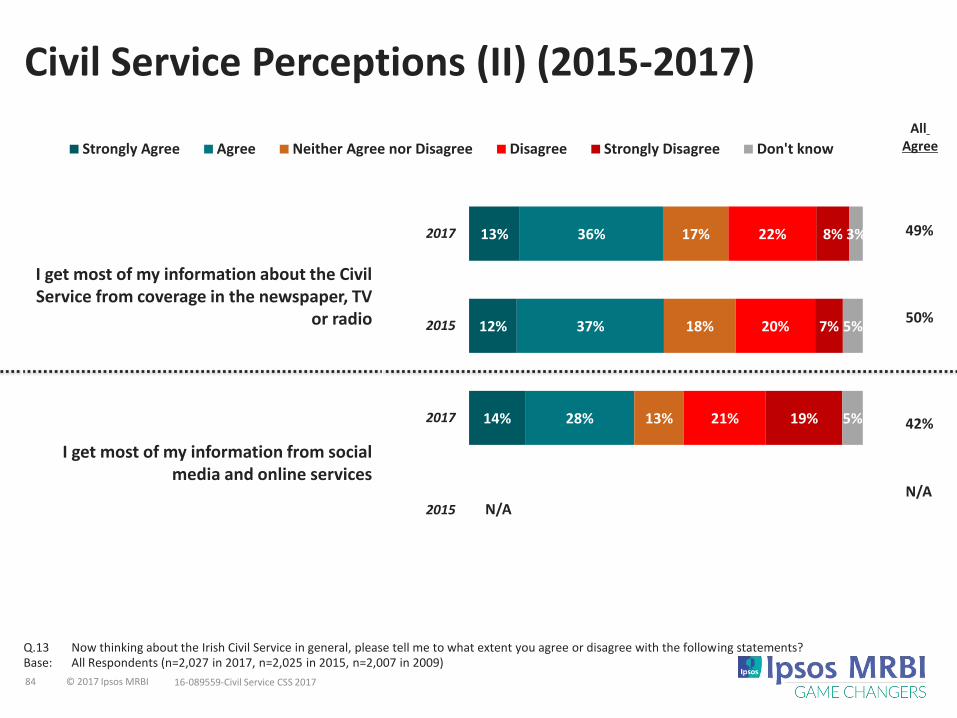
Civil Service Perceptions (II) (2015-2017)
Q.13 Now thinking about the Irish Civil Service in general, please tell me to what extent you agree or disagree with the following statements? Base: All Respondents (n=2,027 in 2017, n=2,025 in 2015, n=2,007 in 2009)
13%
12%
14%
N/A
36%
37%
28%
17%
18%
13%
22%
20%
21%
8%
7%
19%
3%
5%
5%
2017
2015
2017
2015
Strongly Agree Agree Neither Agree nor Disagree Disagree Strongly Disagree Don't know
AllAgree
49%
50%
42%
N/A
I get most of my information about the Civil Service from coverage in the newspaper, TV
or radio
I get most of my information from social media and online services
85 © 2017 Ipsos MRBI 16-089559-Civil Service CSS 2017
25%
28%
13%
14%
14%
14%
12%
13%
34%
35%
26%
31%
23%
26%
26%
26%
16%
14%
18%
18%
27%
27%
17%
18%
12%
12%
27%
23%
15%
15%
28%
28%
3%
2%
8%
6%
5%
3%
8%
7%
9%
9%
8%
8%
15%
15%
9%
8%
2017
2015
2017
2015
2017
2015
2017
2015
Strongly Agree Agree Neither Agree nor Disagree Disagree Strongly Disagree Don't know
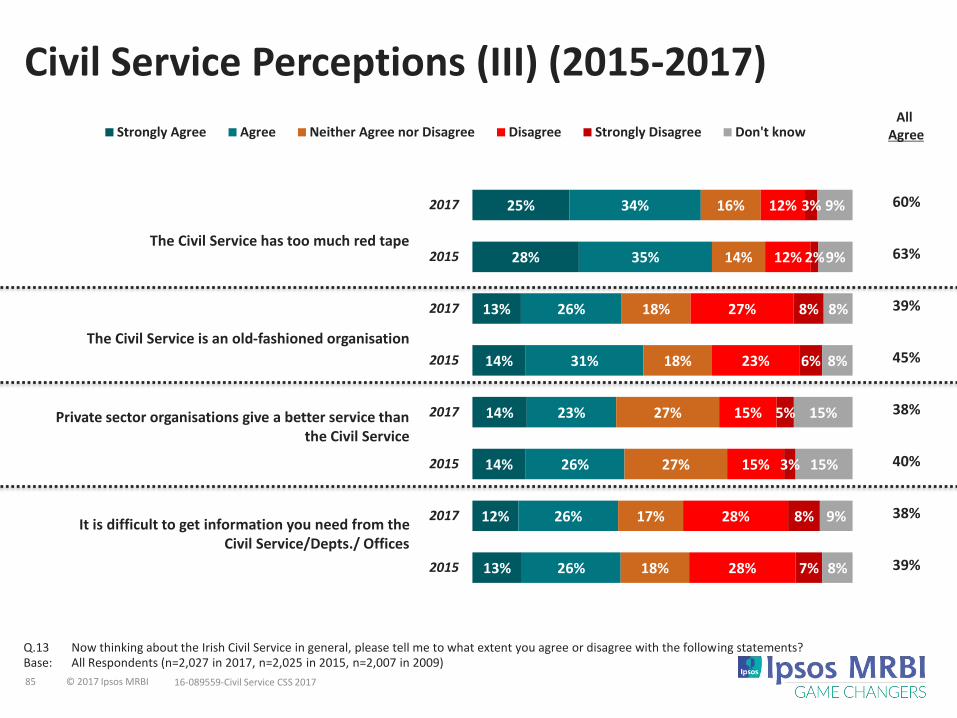
The Civil Service has too much red tape
The Civil Service is an old-fashioned organisation
Private sector organisations give a better service than the Civil Service
It is difficult to get information you need from the Civil Service/Depts./ Offices
60%
63%
39%
45%
38%
40%
38%
39%
Civil Service Perceptions (III) (2015-2017)
Q.13 Now thinking about the Irish Civil Service in general, please tell me to what extent you agree or disagree with the following statements? Base: All Respondents (n=2,027 in 2017, n=2,025 in 2015, n=2,007 in 2009)
All Agree

86 © 2017 Ipsos MRBI 16-089559-Civil Service CSS 2017
11%
9%
12%
9%
45%
43%
45%
41%
19%
19%
20%
21%
10%
13%
9%
13%
5%
6%
4%
6%
11%
11%
8%
10%
2017
2015
2017
2015
Strongly Agree Agree Neither Agree nor Disagree Disagree Strongly Disagree Don’t Know / No Opinion
56%
52%
58%
50%
The Civil Service deals with people in a fair and equal way
The Civil Service is independent and Trustworthy
Perceptions of Trust, Independence & Equality (2015-2017)
Q.13 Now thinking about the Irish Civil Service in general, please tell me to what extent you agree or disagree with the following statements?
Base: All Respondents (n=2,027 in 2017, n=2,025 in 2015)
NetAgree
87 © 2017 Ipsos MRBI 16-089559-Civil Service CSS 2017
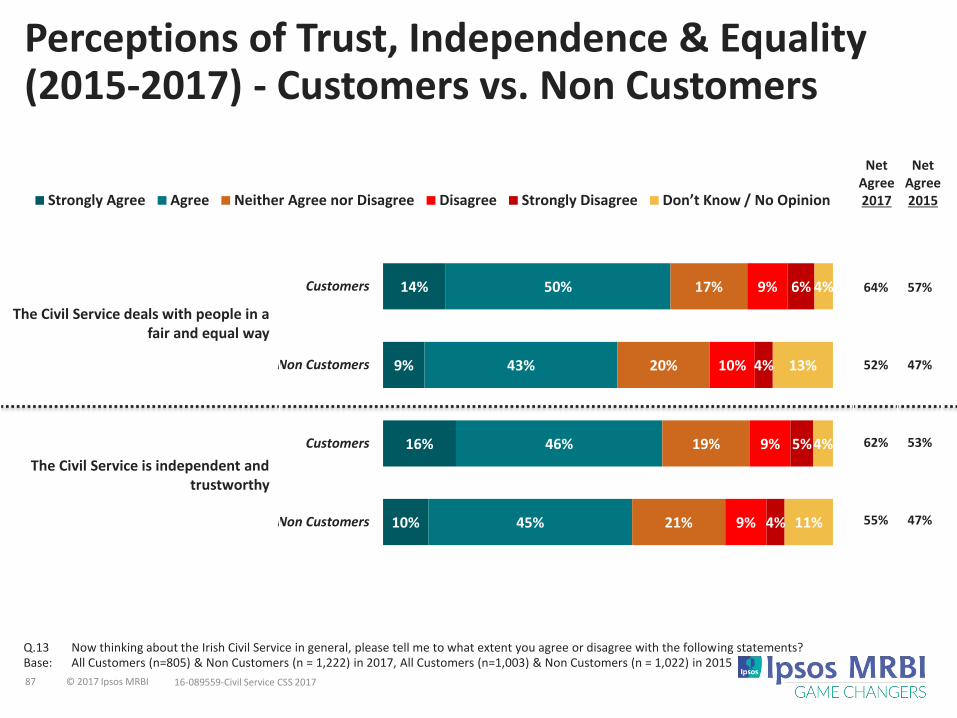
Perceptions of Trust, Independence & Equality (2015-2017) - Customers vs. Non Customers
Q.13 Now thinking about the Irish Civil Service in general, please tell me to what extent you agree or disagree with the following statements? Base: All Customers (n=805) & Non Customers (n = 1,222) in 2017, All Customers (n=1,003) & Non Customers (n = 1,022) in 2015
14%
9%
16%
10%
50%
43%
46%
45%
17%
20%
19%
21%
9%
10%
9%
9%
6%
4%
5%
4%
4%
13%
4%
11%
Customers
Non Customers
Customers
Non Customers
Strongly Agree Agree Neither Agree nor Disagree Disagree Strongly Disagree Don’t Know / No Opinion
NetAgree2017
NetAgree2015
The Civil Service deals with people in a fair and equal way
The Civil Service is independent and trustworthy
64% 57%
52% 47%
62% 53%
55% 47%
88 © 2017 Ipsos MRBI 16-089559-Civil Service CSS 2017
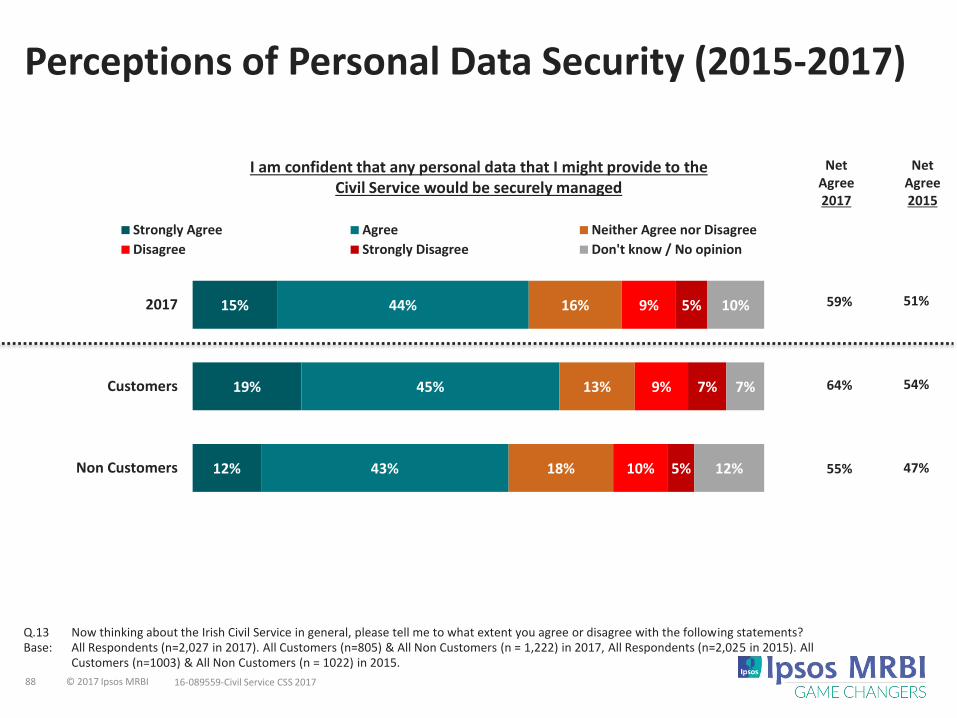
Perceptions of Personal Data Security (2015-2017)
Q.13 Now thinking about the Irish Civil Service in general, please tell me to what extent you agree or disagree with the following statements? Base: All Respondents (n=2,027 in 2017). All Customers (n=805) & All Non Customers (n = 1,222) in 2017, All Respondents (n=2,025 in 2015). All
Customers (n=1003) & All Non Customers (n = 1022) in 2015.
15%
19%
12%
44%
45%
43%
16%
13%
18%
9%
9%
10%
5%
7%
5%
10%
7%
12%
2017
Customers
Non Customers
Strongly Agree Agree Neither Agree nor Disagree
Disagree Strongly Disagree Don't know / No opinion
64%
55%
59%
I am confident that any personal data that I might provide to the Civil Service would be securely managed
NetAgree2017
NetAgree2015
54%
47%
51%
89 © 2017 Ipsos MRBI 16-089559-Civil Service CSS 2017
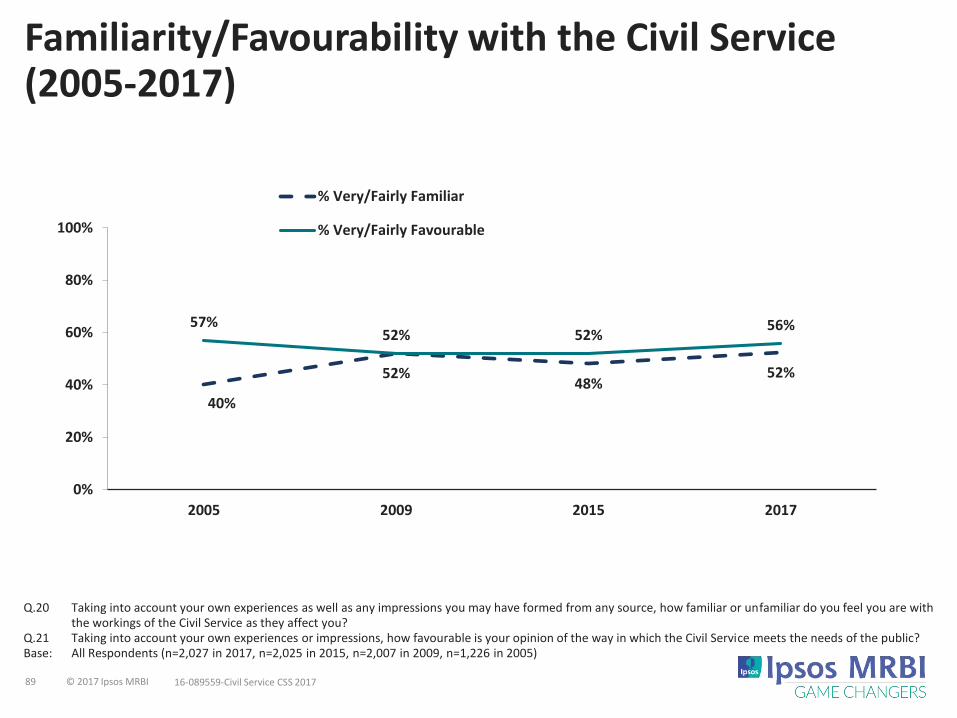
Familiarity/Favourability with the Civil Service (2005-2017)
Q.20 Taking into account your own experiences as well as any impressions you may have formed from any source, how familiar or unfamiliar do you feel you are with the workings of the Civil Service as they affect you?
Q.21 Taking into account your own experiences or impressions, how favourable is your opinion of the way in which the Civil Service meets the needs of the public?Base: All Respondents (n=2,027 in 2017, n=2,025 in 2015, n=2,007 in 2009, n=1,226 in 2005)
40%
52%48%
52%
57%52% 52%
56%
0%
20%
40%
60%
80%
100%
2005 2009 2015 2017
% Very/Fairly Familiar
% Very/Fairly Favourable
90 © 2017 Ipsos MRBI 16-089559-Civil Service CSS 2017
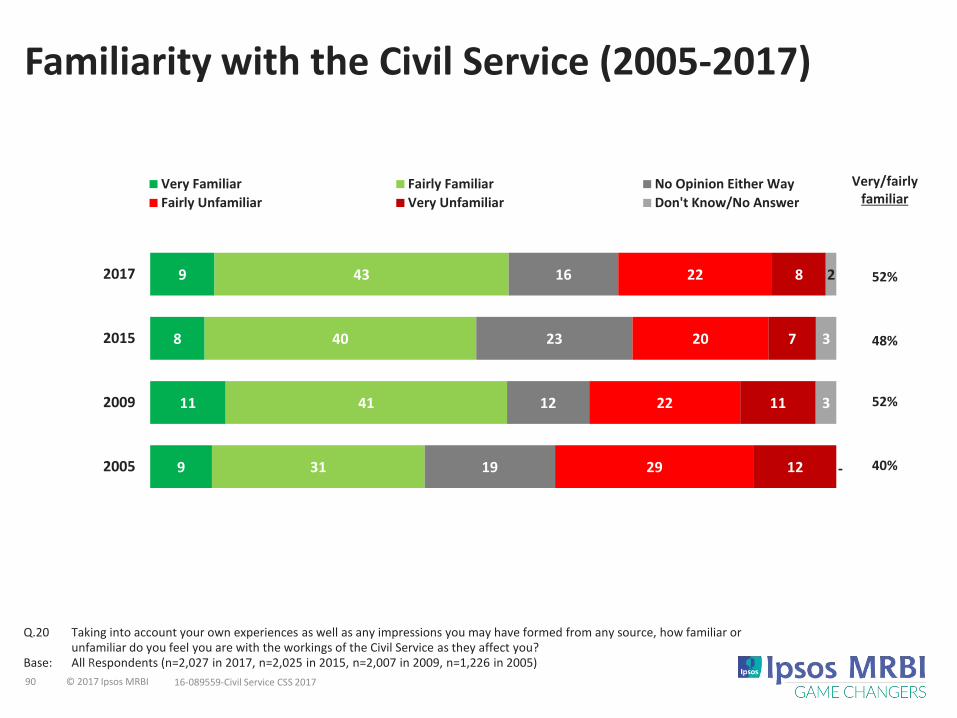
Familiarity with the Civil Service (2005-2017)
Q.20 Taking into account your own experiences as well as any impressions you may have formed from any source, how familiar or unfamiliar do you feel you are with the workings of the Civil Service as they affect you?
Base: All Respondents (n=2,027 in 2017, n=2,025 in 2015, n=2,007 in 2009, n=1,226 in 2005)
9
8
11
9
43
40
41
31
16
23
12
19
22
20
22
29
8
7
11
12
2
3
3
-
2017
2015
2009
2005
Very Familiar Fairly Familiar No Opinion Either Way
Fairly Unfamiliar Very Unfamiliar Don't Know/No Answer
Very/fairlyfamiliar
48%
40%
52%
52%
91 © 2017 Ipsos MRBI 16-089559-Civil Service CSS 2017
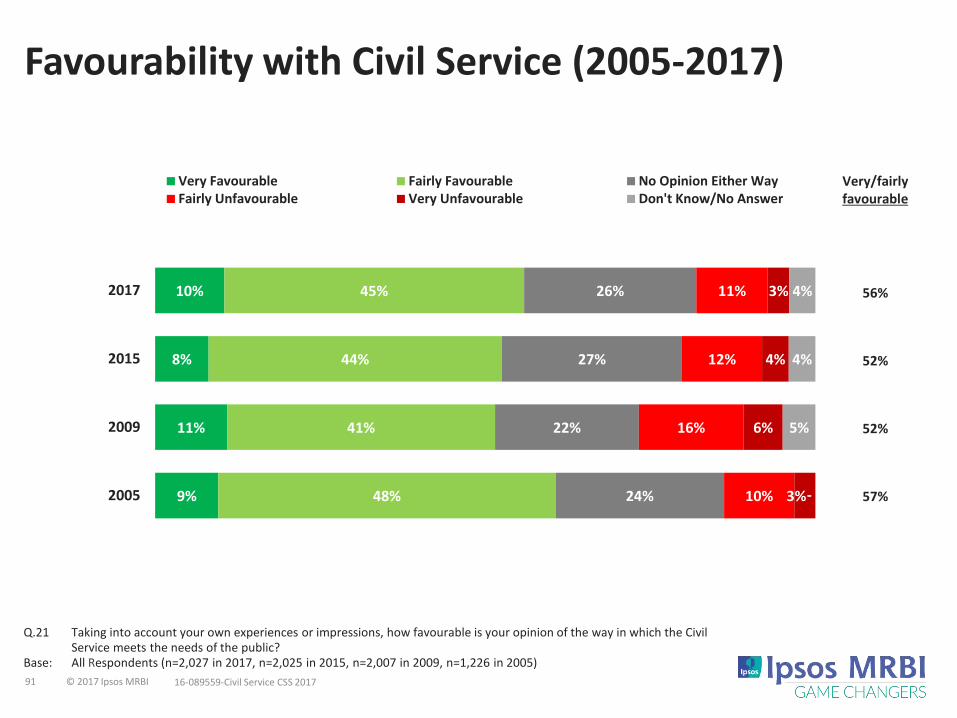
Favourability with Civil Service (2005-2017)
Q.21 Taking into account your own experiences or impressions, how favourable is your opinion of the way in which the Civil Service meets the needs of the public?
Base: All Respondents (n=2,027 in 2017, n=2,025 in 2015, n=2,007 in 2009, n=1,226 in 2005)
Very/fairlyfavourable
52%
57%
52%
10%
8%
11%
9%
45%
44%
41%
48%
26%
27%
22%
24%
11%
12%
16%
10%
3%
4%
6%
3%
4%
4%
5%
-
2017
2015
2009
2005
Very Favourable Fairly Favourable No Opinion Either WayFairly Unfavourable Very Unfavourable Don't Know/No Answer
56%

92 © 2017 Ipsos MRBI 16-089559-Civil Service CSS 2017
Favourability with Civil Service (2017)Customers vs. Non Customers
Q.21 Taking into account your own experiences or impressions, how favourable is your opinion of the way in which the Civil Service meets the needs of the public?
Base: All respondents (n=2,027 in 2017). All Customers (n=805) & All Non Customers (n = 1,222) in 2017.
10%
16%
7%
45%
50%
42%
26%
17%
32%
11%
12%
10%
3%
4%
3%
4%
2%
5%
Total Sample
Customers
Non Customers
Very Favourable Fairly Favourable
Neither Favourable nor Unfavourable Fairly UnfavourableVery Favourable /
Favourable
65%
49%
56%
93 © 2017 Ipsos MRBI 16-089559-Civil Service CSS 2017
Ratings of Access to Language Services
94 © 2017 Ipsos MRBI 16-089559-Civil Service CSS 2017
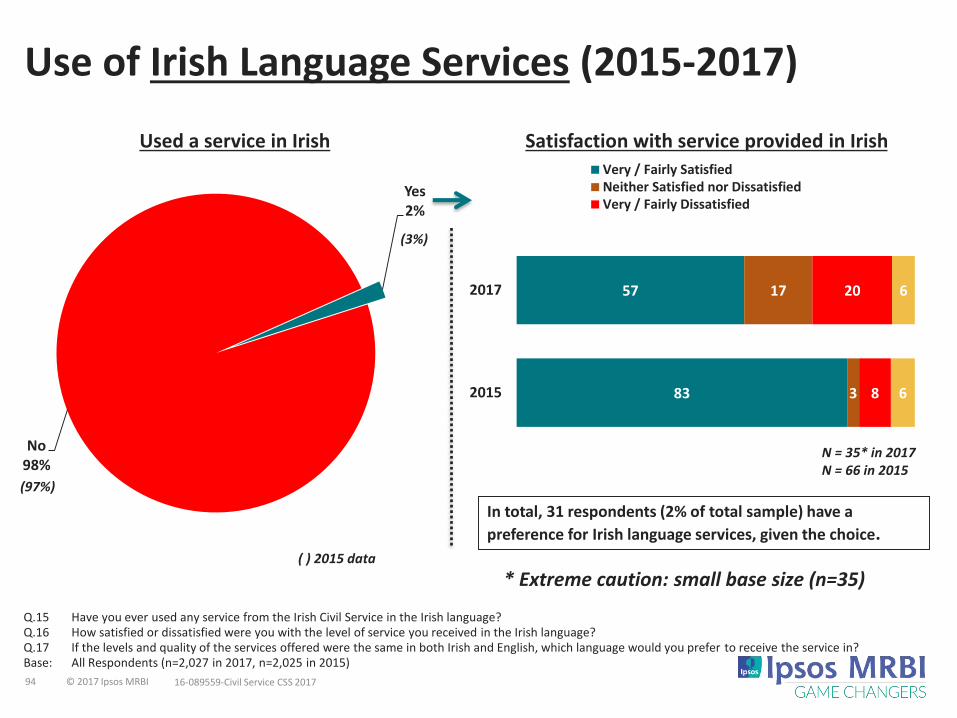
Use of Irish Language Services (2015-2017)
Q.15 Have you ever used any service from the Irish Civil Service in the Irish language?Q.16 How satisfied or dissatisfied were you with the level of service you received in the Irish language? Q.17 If the levels and quality of the services offered were the same in both Irish and English, which language would you prefer to receive the service in?Base: All Respondents (n=2,027 in 2017, n=2,025 in 2015)
Yes2%
No98%
(3%)
(97%)
( ) 2015 data
57
83
17
3
20
8
6
6
2017
2015
Very / Fairly SatisfiedNeither Satisfied nor DissatisfiedVery / Fairly Dissatisfied
Used a service in Irish Satisfaction with service provided in Irish
N = 35* in 2017N = 66 in 2015
In total, 31 respondents (2% of total sample) have a
preference for Irish language services, given the choice.
* Extreme caution: small base size (n=35)
95 © 2017 Ipsos MRBI 16-089559-Civil Service CSS 2017
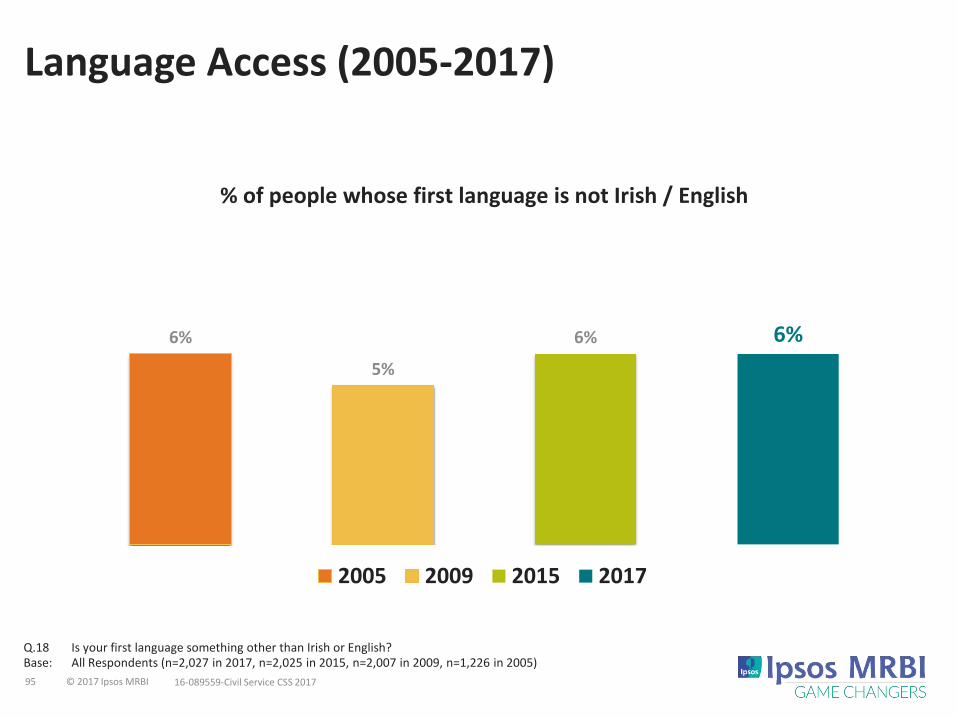
Language Access (2005-2017)
Q.18 Is your first language something other than Irish or English? Base: All Respondents (n=2,027 in 2017, n=2,025 in 2015, n=2,007 in 2009, n=1,226 in 2005)
6%
5%
6% 6%
% of people whose first language is not Irish / English
2005 2009 2015 2017
96 © 2017 Ipsos MRBI 16-089559-Civil Service CSS 2017
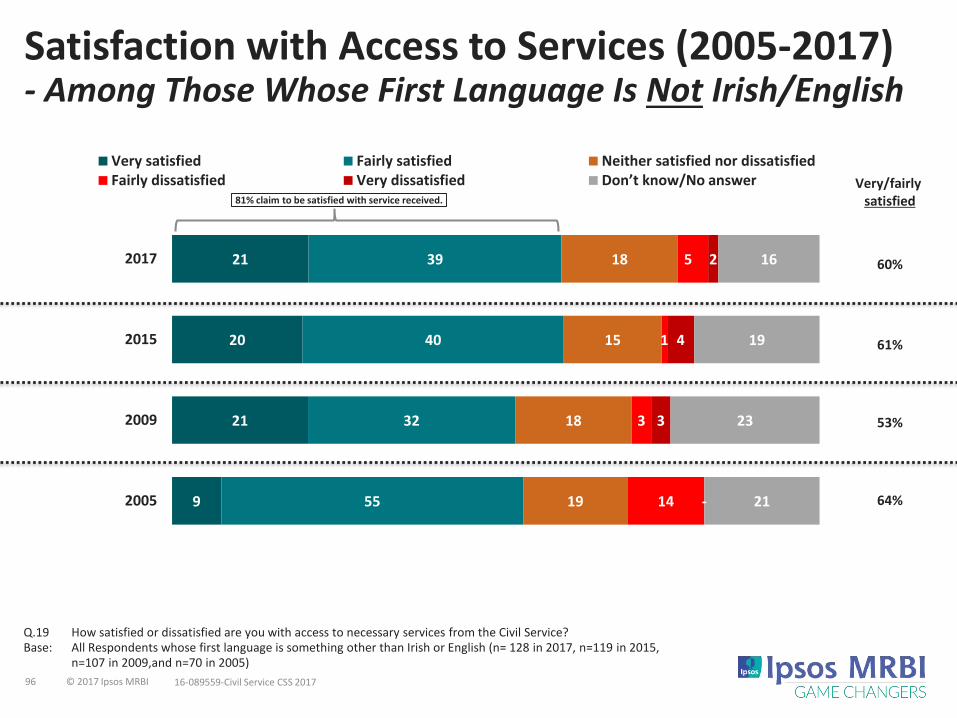
Satisfaction with Access to Services (2005-2017)- Among Those Whose First Language Is Not Irish/English
Q.19 How satisfied or dissatisfied are you with access to necessary services from the Civil Service?Base: All Respondents whose first language is something other than Irish or English (n= 128 in 2017, n=119 in 2015,
n=107 in 2009,and n=70 in 2005)
21
20
21
9
39
40
32
55
18
15
18
19
5
1
3
14
2
4
3
-
16
19
23
21
2017
2015
2009
2005
Very satisfied Fairly satisfied Neither satisfied nor dissatisfiedFairly dissatisfied Very dissatisfied Don’t know/No answer
81% claim to be satisfied with service received.
Very/fairly satisfied
53%
64%
61%
60%

97 © 2017 Ipsos MRBI 16-089559-Civil Service CSS 2017
Key Findings & Conclusions

98 © 2017 Ipsos MRBI 16-089559-Civil Service CSS 2017
Summary of Key FindingsFour in ten Irish adults have made contact in the past yearContact levels have declined across most Departments and Offices, notably in Social Protection perhaps caused by falling unemployment, though it and the Office of the Revenue Commissioners remains the most contacted offices.
Electronic channels continue their growth, though telephone remains the mainstayAlthough contact by phone is still the most common channel, contact via online and e-mail continues to increase. However, a preference for traditional channels is still there, across all age groups.
Customer satisfaction records its best performance to dateSatisfaction with both service (83%) and outcome (82%) have increased by six points each, with the service exceeding expectations in almost one in three cases. Staff continue to be integral to a positive experience.
There has been a marginal decline in dissatisfaction, though its causes remain consistentDissatisfaction is typically caused by one of the following; lack of speed, perceived inefficiency, a negative outcome or non-response.
Levels of advocacy and confidence continue to climbThose that would speak highly of the Civil Service has increased, particularly among customers, as have perceptions of overall efficiency. Confidence in the security of personal data has also improved.
General perceptions of the Civil Service are stable but broadly positiveMeasures of familiarity and favourability have increased, while perceptions of trust, independence and equality in the civil service have all improved.

99 © 2017 Ipsos MRBI 16-089559-Civil Service CSS 2017
Research Conclusions
Analysing the Civil Service at a Macro-LevelThis study was designed to examine the Civil Service at a macro level only. While it delivers robust analysis at an overall level for the entirety of the Civil Service, it is not suitable to conduct any detailed sub-analysis by individual Department or Office. In order to examine customer experiences at any Department or Office, a bespoke survey for that entity would be required and many organisations already undertake their own such surveys.
Both the Reasons and Modes of Contact Differ By Department/OfficeThe reason for contact and consequently the most appropriate channel through which to make contact will vary across the Civil Service. For example, online channel is used more by customers of the Office of the Revenue Commissioners that those using the Department of Social Protection. Understanding the suitability of a channel to the service being delivered remains an important consideration.
Maintaining the strong performance in satisfaction will be challenging While key indicators such as overall satisfaction and delivering on expectations remained relatively unchanged from 2009 to 2015, they have now increased. While any organisation will always strive to improve, this will now be even more challenging to maintain in future surveys given that satisfaction levels now exceed 80%.

100 © 2017 Ipsos MRBI 16-089559-Civil Service CSS 2017
Contacts
Tarik LaherDirector
+353 1 4389012
Rachel MulcahyAssociate Director
+353 1 4389023