report of the 4th committee on the supply of lawyers may 2013
TRANSCRIPT

REPORT OF THE 4TH COMMITTEE ON THE SUPPLY OF LAWYERS
MAY 2013

REPORT OF THE 4TH COMMITTEE ON THE SUPPLY OF LAWYERS
TABLE OF CONTENTS
EXECUTIVE SUMMARY ........................................................................................................ I - VI
FINAL REPORT ......................................................................................................................... 1 - 39
ANNEX A: WORKING GROUPS OF THE 4TH COMMITTEE
ANNEX B: METHODOLOGY TO DETERMINE UK LAW SCHOOL RANKINGS
ANNEX B (APPENDIX 1): BACKGROUND OF RANKING PUBLICATIONS
ANNEX B (APPENDIX 2): DETAILED RANKINGS OF UK LAW SCHOOLS FROM 2011-2013
ANNEX C: KEY STATISTICAL FINDINGS OF MINLAW’S STUDY ON THE SUPPLY AND DEMAND OF LEGAL PROFESSIONALS IN SINGAPORE
ANNEX C (APPENDIX 1): ASSUMPTIONS USED IN THE STUDY

EXECUTIVE SUMMARY

I
EXECUTIVE SUMMARY
1. On 6 March 2012, the Minister for Law announced in Parliament that he had appointed Justice V K Rajah, Judge of Appeal, Supreme Court of Singapore, to chair the 4th Committee on the Supply of Lawyers (“the 4th Committee”) to “review the supply of Singapore legal professionals to meet the legal and business needs of Singapore”. The 4th Committee continues the work of previous Committees which have periodically reviewed the state of the legal profession in Singapore in the context of projected future demand.
2. The 4th Committee examined the factors affecting the supply of and demand for lawyers in Singapore, taking into account the needs of the legal sector, local and overseas sources of supply of law graduates and attrition. The Committee’s three primary observations are:
(a) The demand for lawyers practising cross-border and local commercial/corporate law can, with a slight calibrated increase, be met through the supply of lawyers from our local law schools as well as Singapore citizens and Singapore Permanent Residents who are law graduates from Overseas Scheduled Universities (“OSUs”);
(b) There is at present a shortage of lawyers who practise community law1. If no measures are taken to address this, the shortage will be exacerbated; and
(c) It would be desirable if the attrition rate of legal professionals could be reduced, especially for lawyers in private practice.
3. The 4th Committee has made 6 recommendations:
(a) Increase the annual undergraduate law intake of Singapore Management University (“SMU”) from 120 to 180 students over 3 years;
(b) Establish a 3rd law school with a focus on training prospective lawyers keen on practising community law;
(c) Review and refresh the list of OSUs every 5 years;
(d) Recognise double-degree programmes offered by OSUs, subject to their meeting specific criteria;
(e) Retain the existing policies relating to the minimum degree classification (of at least a lower second-class degree or equivalent) for law graduates from OSUs and the non-recognition of external law degrees; and
1 This refers to lawyers who service the needs of the community by practising criminal law and family law.

II
(f) Consider modifying practices in National University of Singapore Law School and SMU Law School (collectively, “the 2 existing local law schools”) as well as law firms to address the problem of attrition.
Recommendation 1: Increase the annual LLB intake of SMU Law School from 120 to 180 students over 3 years
4. The 4th Committee is of the view that SMU Law School’s annual LLB intake should be increased from the present 120 (±10%) students to 180 (±10%) over 3 years.
5. This will ensure that any future or unexpected increase in demand for lawyers to handle cross-border and local commercial/corporate work (particularly if Singapore’s legal sector is further liberalised in the future) can be adequately met by locally-qualified lawyers.
Recommendation 2: Establish a 3rd law school
6. The 4th Committee proposes the establishment of a 3rd law school with a focus on training prospective lawyers keen on practising community law. The 3rd law school should be hosted by a suitable local tertiary institution.
7. The 3rd law school could offer part-time as well as full-time LLB programmes for undergraduates and graduate students or both, depending on the resources of its host institution.
8. It is also proposed that subject to the operational and financial capacity of the 3rd law school, its initial annual intake should be in the region of 75 students. Preference ought to be given to candidates who demonstrate a genuine interest in the practice of community law. The school should aim to take in mainly working adults such as paralegals, social workers or law enforcement officers, as well as maintain a restricted number of places for “A-Level” students who have a strong interest in practising community law.
9. Graduates of the 3rd law school must meet the minimum requirements for admission to the Singapore Bar (similar to law graduates from the 2 existing local law schools), and will be required to attend and pass the Part B Bar Course and Examination as well as fulfil all other prescribed requirements.
10. The 4th Committee proposes that the 3rd law school should also administer a conversion course and examination for persons with external law degrees or law degrees from non-OSUs to enable them to qualify for admission to the Singapore Bar.
Recommendation 3: Regular reviews of the list of OSUs
11. The 4th Committee is of the view that it is necessary to update and refresh the list of OSUs so that it can better fulfil its present function as a qualitative sieve.

III
12. The list of OSUs should be reviewed every 5 years by the Singapore Institute of Legal Education (“SILE”), and once each review is done, SILE’s recommendations to MinLaw should be publicly announced.
13. The 4th Committee also proposes to retain the present policy of non-recognition of a law degree obtained by studying in the satellite campus of an OSU, but conferred by the parent campus of the OSU, for the purposes of admission to the Singapore Bar. The present policy of non-recognition of “twinning” programmes should also be retained.
Recommendation 4: Recognition of double-degree programmes from OSUs
14. It is increasingly prevalent in both local and overseas universities for undergraduates to be enrolled in double-degree programmes. The 4th Committee is of the view that such double-degree programmes provide a useful counterpoint to traditional legal education and have the potential to aid in the development of better skill-sets for today’s multi-disciplinary legal environment.
15. The 4th Committee proposes that double-degree programmes from OSUs should be recognised, subject to their meeting the same criteria imposed for full-time law degrees such as:
(a) The double-degree programme must have been conducted by an OSU;
(b) The degree holder must have obtained a specified minimum degree classification and/or cohort ranking; and
(c) Certain compulsory subjects must have been included in the course of study.
Recommendation 5: Retain existing policies of minimum degree classification for law graduates from OSUs and exclusion of external law degrees
16. The 4th Committee recommends that the minimum degree classification of obtaining at least a lower second-class degree or equivalent be retained for law graduates from OSUs in order to be regarded as a “qualified person” for the purposes of admission to the Singapore Bar.
17. The 4th Committee also recommends that the current position of non-recognition of external law degrees should be retained.
Recommendation 6: Consider modifying practices in the 2 existing local law schools and law firms
18. The 4th Committee is of the view that education is the key to addressing the problem of attrition. In order to address this problem and start the process of shifting engrained mindsets, the 4th Committee recommends a two-pronged approach of modifying practices in the 2 existing local law schools and law firms, where the following 4 key

IV
stakeholders will be engaged on issues which affect attrition rates and the well-being of legal professionals:
(a) Law students and would-be law students;
(b) The faculties of the 2 existing local law schools;
(c) The management of law firms; and
(d) Junior lawyers.
19. The 4th Committee makes 2 recommendations for the 2 existing local law schools to consider:
(a) Targeted selection in the admissions process
i. The 4th Committee recommends that the 2 existing local law schools undertake a more targeted selection of law school applicants to increase the likelihood that those who are admitted will remain in practice.
(b) Early preparation for the realities of practice
i. The 4th Committee believes that to lower the attrition rate, it would be helpful to prepare young law graduates early for the realities of practice before they enter the legal market. It is therefore imperative that law students are given a realistic view of what practice is like as part of their law school experience.
ii. The following proposals were discussed as possible recommendations that the 2 existing local law schools could adopt (or continue to support):
(a) Support and expand clinical legal programmes currently offered;
(b) Increase the involvement of practitioners in teaching, which will allow law students to get a more rounded and practical grounding on problem-solving;
(c) Organise sharing sessions with practitioners;
(d) Set up a centralised and more structured system for internships; and
(e) Actively incorporate pro bono activities as part of the law school curriculum.
V
20. Besides recommending changes to the practices of the 2 existing local law schools, the 4th Committee also sees the importance of addressing work-life balance concerns in law firms. The 4th Committee makes 2 main recommendations in this regard:
(a) Provide flexibility in legal practice
i. Law firms are encouraged to redesign work to accommodate flexible schedules so that part-time work can become a much more viable alternative for lawyers starting a family or assuming caregiving roles.
ii. The 4th Committee urges law firms to consider implementing a rotation policy for trainees so as to increase exposure and aid young lawyers in making an informed decision when they subsequently decide to specialise.
iii. The 4th Committee recommends that law firms be open to designing different career advancement tracks such that lawyers who are able and willing to continue working should not be discouraged from staying with the firm simply because they do not make the cut for partnership.
(b) Provide greater support and welfare
i. The 4th Committee recommends considering the viability of encouraging the growth of legal work outside the existing structures of conventional legal practice. Some of these possibilities are:
(a) The creation of an online marketplace run by the Law Society for practitioners who wish to take on ad hoc or locum assignments; and
(b) “In-sourcing” arrangements such as the model used by Advent Balance, which hires lawyers from a wide range of backgrounds so as to provide clients with flexible solutions for routine legal work which need not be handled by traditional law firms.
ii. Law firms are encouraged to equip partners and lawyers in private practice with tools to create a better working environment.
iii. Within the profession, programmes similar to Resilience@law at The College of Law in Australia2 could be introduced to help legal professionals cope better with work or personal pressures.
2 See http://www.collaw.ac.nz/Research-and-Resources/Resilience-at-Law/ for more information.

VI
iv. Profession-linked welfare schemes such as health insurance, retirement planning and other profession-linked benefits could be introduced for lawyers and/or in-house counsel through the Law Society, the Singapore Academy of Law or the Singapore Corporate Counsel Association.
Conclusion
21. The 4th Committee seeks to address the shortage of lawyers via a balanced, multi-pronged approach: creating local sources of supply specially designed to address areas where the shortage of lawyers is most greatly felt; enlarging yet maintaining the quality of the foreign supply of lawyers; and promoting policies to reduce the attrition rate of legal professionals (especially practising lawyers).
22. The recommendations proposed are premised upon a cautious and incremental implementation process. Regular review mechanisms should also be built into the major recommendations above to ensure that the changes implemented will be responsive to the ever-changing needs and challenges facing the legal profession in the years to come.

FINAL REPORT

REPORT OF THE 4TH COMMITTEE ON THE SUPPLY OF LAWYERS
TABLE OF CONTENTS
1 INTRODUCTION ....................................................................................................................... 1
(A) Terms of reference ................................................................................................................. 1
(B) Background ........................................................................................................................... 2
(C) History ................................................................................................................................... 3
2 LOCAL SUPPLY REVIEW ........................................................................................................ 5
(A) Overview ............................................................................................................................... 5 (I) The Legal Professional-to-Population Ratio (LPPR) in Singapore ................... 5 (II) Adequacy of supply of lawyers for cross-border and local
commercial/corporate work .................................................................................. 6 (III) Lack of lawyers practising community law ......................................................... 7
(B) Increase in intake of SMU Law students ....................................................................... 11
(C) Creation of a third law school ......................................................................................... 12 (I) The criteria for admission ..................................................................................... 12 (II) The pedagogical details ........................................................................................ 13 (III) Quality control ....................................................................................................... 13 (IV) Benefit for persons with external law degrees or law degrees from non-
OSUs ........................................................................................................................ 14 (V) Plans for implementation ..................................................................................... 14
3 FOREIGN SUPPLY REVIEW .................................................................................................. 16
(A) Overview ............................................................................................................................. 16 (I) Requirements for admission ................................................................................ 16 (II) Number of graduates from overseas universities ............................................. 16
(B) Refreshing the list of OSUs .............................................................................................. 19 (I) Regular reviews of the list of OSUs .................................................................... 19 (II) Satellite campuses .................................................................................................. 21 (III) “Twinning” programmes ..................................................................................... 22
(C) Recognition of double-degree programmes from OSUs ............................................... 23
(D) Retention of a minimum degree classification .............................................................. 23
(E) Exclusion of external law degrees .................................................................................... 24
4 ATTRITION REVIEW ............................................................................................................. 26
(A) Overview ............................................................................................................................. 26 (I) Determining the attrition rate of legal professionals in Singapore ................ 26 (II) Possible factors contributing to attrition ............................................................ 29

(B) Modifying practices in the 2 existing local law schools .............................................. 30 (I) Targeted selection in the admissions process .................................................... 30 (II) Early preparation for the realities of practice .................................................... 31
(C) Modifying practices in law firms .................................................................................... 34 (I) Providing flexibility in legal practice .................................................................. 35 (II) Providing greater support and welfare .............................................................. 36
5 CONCLUSION .......................................................................................................................... 38
ANNEX A: WORKING GROUPS OF THE 4TH COMMITTEE
ANNEX B: METHODOLOGY TO DETERMINE UK LAW SCHOOL RANKINGS
ANNEX B (APPENDIX 1): BACKGROUND OF RANKING PUBLICATIONS
ANNEX B (APPENDIX 2): DETAILED RANKINGS OF UK LAW SCHOOLS FROM 2011-2013
ANNEX C: KEY STATISTICAL FINDINGS OF MINLAW’S STUDY ON THE SUPPLY AND DEMAND OF LEGAL PROFESSIONALS IN SINGAPORE
ANNEX C (APPENDIX 1): ASSUMPTIONS USED IN THE STUDY

1
1 INTRODUCTION
(A) Terms of reference
1.1 On 6 March 2012, the Minister for Law announced in Parliament that he had appointed Justice V K Rajah, Judge of Appeal, Supreme Court of Singapore, to chair the 4th Committee on the Supply of Lawyers (“the 4th Committee”) to “review the supply of Singapore legal professionals to meet the legal and business needs of Singapore”. The 4th Committee continues the work of previous Committees which have periodically reviewed the state of the legal profession in Singapore in the context of projected future demand.
1.2 In addition to Justice Rajah, who served as the chairperson, the 4th Committee comprised the following members:3
(a) Mr Aedit Abdullah SC, Chief Prosecutor (the Attorney-General’s Chambers (“AGC”));
(b) Professor Simon Chesterman, Dean of National University of Singapore (“NUS”) Law School (“NUS Law”);
(c) Mr Daryl Chew, Associate (Shearman and Sterling LLP);
(d) Mr Goh Yihan, Assistant Professor of Law (NUS Law);
(e) Mr Hri Kumar SC, Director (Drew & Napier LLC);
(f) Ms Angeline Lee, President of Singapore Corporate Counsel Association;
(g) Mr Andrew Lim, Partner (Allen & Gledhill LLP);
(h) Ms Ong Puay See, Director (the Monetary Authority of Singapore (“MAS”));
(i) Mr Alvin Tan, Assistant Managing Director (the Economic Development Board (“EDB”));
(j) Ms Valerie Thean, Deputy Secretary (the Ministry of Law (“MinLaw”));
(k) Mr Wong Meng Meng SC, President of the Law Society of Singapore (“the Law Society”) 2010–2012;
3 The members are named in alphabetical order based on their last names. The Secretariat to the 4th Committee comprised Mr Andrew Cheah (MinLaw), Ms Lum Pooi Fun (MinLaw), Mr Tan Zhongshan (Supreme Court), Mr Koo Zhi Xuan (Supreme Court), Mr Jonathan Yap (Supreme Court), Ms Chua Minyi (MinLaw), Mr Kelvin Caleb (MinLaw) and Ms Gloria Lim (MinLaw).

2
(l) Mr Yap Wai Ming, Director (Stamford Law Corporation); and
(m) Professor Yeo Tiong Min SC, Dean of Singapore Management University (“SMU”) Law School (“SMU Law”).
1.3 The 4th Committee appointed 4 working groups, each of which was tasked with 1 of the following focus areas: Demand, Supply of lawyers from local universities (“Local Supply”), Supply of lawyers from overseas universities (“Foreign Supply”) and Attrition. The persons who served in these working groups are listed in Annex A.
(B) Background
1.4 The working groups undertook an extensive review of the status quo in evaluating and formulating recommendations for each focus area. The 4th Committee also canvassed the opinions of a broad range of stakeholders so as to obtain a higher resolution overview of the economic milieu within which the legal services industry will operate over the foreseeable future.4
1.5 After considering the various likely requirements for legal services over the next 10 years, it became apparent to the 4th Committee that if present trends continue, there will be a pressing shortage of lawyers who serve the needs of the community by practising criminal law and family law (“community law”). Left unattended over time, this will affect access to justice for the average citizen and will in turn raise fundamental questions about the proper administration of justice. A legal system which is priced beyond the means of the average citizen loses its credibility for effectiveness and fairness. Accordingly, the 4th Committee’s recommendations are significantly focused on addressing the shortage of lawyers in the area of community law. This report will address the following issues:
(a) The calibrated increase in the local supply of legal professionals, including:
(i) The graduated increase in SMU’s intake of LLB students over 3 years; and
(ii) The creation of a third law school.
(b) The review of various sources of foreign supply of legal professionals, including:
(i) Refreshing, based on objective data, the list of Overseas Scheduled Universities (“OSUs”), ie, the overseas universities currently in the schedule of approved overseas universities
4 The agencies consulted included the following: EDB, the Maritime Port Authority, MinLaw’s Intellectual Property Policy Division, the Ministry of Trade and Industry and MAS.

3
whose law degrees are recognised for the purposes of admission to the Singapore Bar (“the Schedule”);
(ii) Recognising double-degree programmes offered by OSUs; and
(iii) Retaining the existing policies relating to the minimum degree classification and the non-recognition of external law degrees.
(c) Potential strategies to reduce attrition within the profession, such as:
(i) Involving practitioners in the admissions and teaching process at local law schools so as to inform potential and/or present law students of the realities of legal practice;
(ii) Introducing programmes to help law students prepare early for the realities of legal practice;
(iii) Promoting work-life balance by encouraging more flexible modalities of legal practice;
(iv) Exploring ways to provide legal professionals with better support to cope with work and personal pressures; and
(v) Exploring innovations which could offer alternatives for practitioners who do not find the existing structures of conventional legal practice conducive.
(C) History
1.6 The 1st Committee on the Supply of Lawyers (“the 1st Committee”), which was appointed in September 1992, recommended a suite of measures to meet the overriding objective of averting a projected excess in the supply of lawyers. These measures included a reduction in the intake of law students into NUS Law, which was then the only law school in Singapore. The Schedule proposed by the 1st Committee listed 15 UK universities and did not feature overseas universities from any other country. An accompanying condition – viz, that law graduates from the 15 UK universities on the Schedule would have to obtain at least upper second-class (or equivalent) degrees to qualify for admission to the Singapore Bar – was also recommended by the 1st Committee.
1.7 In 2001, the 2nd Committee on the Supply of Lawyers (“the 2nd Committee”) found that there was a shortage of lawyers in Singapore, coupled with a projected increase in demand for legal services over the next decade. It therefore recommended an increase in the annual intake of law students into NUS Law and an increase in the number of UK OSUs listed in the Schedule from 15 to 19. Pursuant to the 2nd Committee’s recommendations, 4 Australian universities and 2 New Zealand universities were also added to the list of OSUs.

4
1.8 Despite the efforts of the 2nd Committee, the 3rd Committee on the Supply of Lawyers (“the 3rd Committee”) observed in 2005 that there was “an acute shortage of practising lawyers due to the inability of the legal profession to replace its own population during the years 2000 to 2005”.5 The 3rd Committee recommended that the Government should consider the feasibility of setting up a second law school in Singapore to produce an additional 90 law graduates annually. It was also recommended that admission to the Singapore Bar be extended to law graduates from OSUs holding degrees classified as lower second-class or equivalent (eg, falling within the top 70% of the cohort). These recommendations were crafted in accordance with a joint study by the Ministry of Manpower (“MOM”) and the Ministry of Trade and Industry (“MTI”): viz, the “Joint MOM-MTI Study on Demand and Supply of Legal Professionals, 2006–2015”. After considering the joint study, the 3rd Committee recommended that the legal services sector should raise the legal professional-to-population ratio (“LPPR”) from 1.27 per 1,000 people in 2006 to 1.43 per 1,000 people by 2015.6
5 Report of the 3rd Committee, Executive Summary at [3].
6 Id at [10]; although it should be noted that this was based on a projected population of 5.07 million in 2015, whereas the population as at 2012 had already reached 5.31 million.

5
2 LOCAL SUPPLY REVIEW
(A) Overview
(I) The Legal Professional-to-Population Ratio (LPPR) in Singapore
2.1 Singapore’s LPPR rose marginally from 1.27 to 1.31 per 1,000 people between 2006 and 2012. By comparison, the 3rd Committee had set an LPPR target of 1.43 per 1,000 people by 2015. Evidently, we are still far from achieving this target and the growth trajectory since 2005 offers little basis for optimism. Furthermore, it is projected that the demand for legal professionals7 will rise to 10,011 legal professionals in 2020 from a supply of 6,909 legal professionals in 2012. This shortfall is primarily due to 2 factors: (a) growth in demand for legal services, which has outpaced the 3rd Committee’s projections; and (b) attrition of the existing ranks of legal professionals, which has been greater than expected.
2.2 A comparison of the lawyer-to-population ratios between Singapore and major commercial hubs as well as some small States with common law systems also indicates that, on the whole, the number of lawyers in Singapore remains insufficient:8
Comparison of Lawyer-to-Population Ratios
Area Number of practising lawyers
Population Lawyers per 1,000 people
Singapore 4,432 (fused) 5,312,400 0.83
Hong Kong 1,155 (barristers) + 7,152 (solicitors) =
8,307
7,154,600 1.16
London, UK 1,219 (barristers) + 20,352 (solicitors) =
21,571
8,174,100 2.64
New Zealand 1,414 (barristers) + 10,591 (solicitors) =
12,005
4,464,195 2.69
Victoria, Australia
1,927 (barristers) + 15,862 (solicitors) =
17,789
5,649,100 3.15
7 The yardstick of “legal professionals” was adopted by the 3rd Committee, and comprises advocates and solicitors called to the Singapore Bar, corporate or in-house counsel, officers in the Singapore Legal Service, foreign lawyers in Singapore, the Judiciary and law academics.
8 Figures for Singapore, New Zealand and Victoria, Australia, are accurate as at Mar 2013. Other figures are accurate as at 2012.

6
Comparison of Lawyer-to-Population Ratios
New South Wales,
Australia
2,198 (barristers) + 25,493 (solicitors) =
27,691
7,314,100 3.79
Israel 52,142 (fused) 7,441,700 7.01
New York, USA
163,798 19,570,261 8.37
2.3 The LPPR is a useful metric because it is most directly correlated with the availability of lawyers for potential end-users.9 In particular, the LPPR offers a general indication of the overall relative scarcity of legal representation in Singapore when compared to other commercial centres. It is axiomatic that access to justice contains both qualitative and quantitative elements, and as such, the ready availability of competent legal advisors is a sine qua non of any robust legal system. A higher density of lawyers will also have a moderating impact on the high cost of legal representation, which constitutes the major hurdle between citizens and the practical pursuit of justice. The need for reform in this area is echoed by the sentiments of The Honourable the Chief Justice, Sundaresh Menon, at the inaugural Litigation Conference on 31 January 2013 – “It is cold comfort to those who seek justice to say we have a great legal system, if it is priced out of their reach.”
(II) Adequacy of supply of lawyers for cross-border and local commercial/corporate work
2.4 In an age of specialisation, law firms generally service specific markets and communities. It is therefore common for the larger and medium-sized firms to service institutional clients (such as large corporations) and high-net-worth individuals in relation to matters involving cross-border and local commercial/corporate law.
2.5 Present shortage: The large firms do not suffer from a shortage of lawyers in relation to cross-border and local commercial/corporate law, as their market and spending power have generally allowed them to attract as many lawyers and trainees as they need. On the other hand, medium-sized firms are experiencing a slight shortage of lawyers in this area.10 Based on an informal survey conducted by MinLaw,11 it was observed that each medium-sized firm
9 This is in contrast to methodologies which focus on the economic value of legal services, eg, the 3rd Committee also looked at the contribution of legal services to national Gross Domestic Product (GDP).
10 MinLaw, Study on The Supply and Demand of Legal Professionals in Singapore (Revised April 2012), Annex C page 11.
11 The purpose of the survey was to provide a wide snapshot of the legal industry by collecting key information such as firms’ expenditure, practice areas, manpower profiles and hiring requirements. However, it should be

7
wished to hire an average of 3 more lawyers.12 The 4th Committee was of the opinion that this was a reasonable estimate. Given that there were 97 medium-sized law firms as at June 2012,13 the current shortage of lawyers in the area of cross-border and local commercial/corporate law can be estimated to be around 291 (3 x 97) lawyers. In percentage terms, the estimated present shortage stands at 11%.14
2.6 Projected supply increase: The 4th Committee is of the view that the 11% shortage in cross-border and local commercial/corporate law practitioners can be adequately covered by the projected increase in the number of SMU Law students as well as in the number of Singapore citizens and Singapore Permanent Residents (collectively referred to hereafter as “Singaporeans” in this Report) studying law abroad. As will be recommended below (at [2.17]–[2.19]), SMU Law should increase its annual intake from the current figure of 120 to 180 over the next 3 years. This will translate into an estimated 16.7% increase in the annual supply of local graduates from NUS Law and SMU Law combined.15 Local supply will also be complemented by an average of 323 Singaporean (as just defined above) law graduates from OSUs each year, about 80% of whom are expected to return to Singapore to seek admission to the local Bar (see [3.5] below).
2.7 For these reasons, the prospective inflow of lawyers is expected to be adequate to cover the present shortage of cross-border and local commercial/corporate law practitioners in medium-sized law firms.
(III) Lack of lawyers practising community law
2.8 In contrast, it appears that the small firms, which generally practise a greater amount of community law, are much more under-populated.
2.9 Demand growth: The key driver of the increase in demand for community law practitioners is population growth. Barring any change in the litigiousness of society and/or other social norms or conditions, it would be
highlighted that the survey returns were based on a very small base of 57 law firms (of which 29 were medium-sized firms).
12 One of the questions in the survey was designed to find out how many more lawyers firms wished to hire, assuming supply was available (this can also be interpreted as the existing shortfall in manpower). Among the 8 medium-sized firms (ie, those with 6 to 30 lawyers per firm) that responded to this question and reported a shortfall, the average number of additional lawyers which they wished to hire was 3 per firm.
13 This figure was derived using the Supreme Court’s data on the number of Practising Certificate holders in each law firm as at June 2012.
14 This figure, which is calculated by dividing 291 by 2,692 (the number of Singapore practitioners in large and medium-sized firms), is used as a proxy for the demand for lawyers doing cross-border and local commercial/corporate work, even though some medium-sized firms might also have a sizeable community law practice.
15 This is calculated by dividing the projected increase in the annual supply of SMU Law graduates (60) by the present annual supply of graduates from both NUS Law and SMU Law (240 + 120 = 360).

8
reasonable to expect that on average, each individual would continue to consume approximately the same amount of community law services. It follows that the growth in demand for legal professionals practising community law would be positively and closely correlated with the growth in Singapore’s resident population.
2.10 This reasoning is generally supported by evidence showing a positive and close correlation between population size and the Subordinate Courts’ caseload (including criminal, civil, family and juvenile cases), as displayed in the table below. Between 2005 and 2010, the Subordinate Courts’ overall caseload increased from 333,280 cases in 2005 to a high of 378,454 cases in 2010, but the relationship between the overall caseload and population size held steady at around 63–78 cases per 1,000 people. Looking specifically at criminal cases over the same period as a subset of the Subordinate Courts’ caseload, the number of criminal cases was likewise positively correlated with population size. As the criminal caseload increased from 225,380 cases in 2005 to 277,221 cases in 2010, the criminal caseload-to-population ratio held steady at around 45–55 cases per 1,000 people.
Year Subordinate Courts’ Caseload Population
Size (in ‘000s)
Criminal cases per 1,000 people
Total cases per 1,000 people
Criminal Justice Division
Civil Justice Division
Family and Juvenile Justice Division
Total
2005 225,380 88,770 19,130 333,280 4,266 52.8 78.1 2006 206,000 90,020 19,000 315,020 4,401 46.8 71.6 2007 249,540 86,150 18,150 353,840 4,589 54.4 77.1 2008 261,690 73,839 20,550 356,079 4,839 54.1 73.6 2009 265,391 84,814 21,861 372,066 4,988 53.2 74.6 2010 277,221 79,848 21,385 378,454 5,077 54.6 74.5 2011 234,138 73,205 20,407 327,750 5,184 45.2 63.2
Notes:
• The figures above are taken from the caseload profiles in the Subordinate Courts’ annual reports.
• The figures above omit the number of “enforcement proceedings”, for which data was only available from 2005 to 2007.
• The caseload of the Criminal Justice Division includes charges mentioned in the Criminal Mentions Court, regulatory offences mentioned in the Departmental and Statutory Board Mentions Courts, cases in the Traffic Court, cases in the Coroner’s Court and Magistrate’s Complaints.
• The data for 2011 is preliminary.
2.11 Supply shortage: While the demand for community law services will continue to increase as our population increases, the supply of community law practitioners has not been able to keep pace. In fact, there is already at

9
present a critical shortage of lawyers practising community law, particularly where criminal law is concerned.
2.12 In order to estimate the shortage of community law practitioners, the Subordinate Courts’ statistics on the number of Litigant-in-Person (“LIP”) cases at the pre-trial conference (“PTC”) stage handled by the Centralised PTC Court (Court 17) and the Community Courts (Courts 19 and 20) for criminal cases from 2009 to 2011 were used as a basis for calculation,16 as displayed in the table below.17
Year 2009 2010 2011
At PTC Stage
Centralised PTC Court (Court 17)
Total no. of cases 5,955 5,627 4,573
Total no. of LIP cases 2,347 2,104 1,692
% of LIP cases 39% 37% 37%
Community Courts (Courts 19 and 20)
Total no. of cases 2,003 1,609 1,372
Total no. of LIP cases 1,080 874 854
% of LIP cases 54% 54% 62%
Total
Total no. of cases (“(A)”) 7,958 7,236 5,945
Total no. of LIP cases (“(B)”) 3,427 2,978 2,546
% of LIP cases 43% 41% 43%
Analysis
Total no. of represented cases (“(C)”) = (A) – (B) 4,531 4,258 3,399
No. of community law practitioners (“(D)”) 1,198 1,208 1,213
16 The 4th Committee notes that while some LIP cases cannot be attributed to the unavailability of legal representation, the statistics on such cases represent the best available proxy of the shortage of community law practitioners in small law firms and/or the costs needed to secure legal representation in such cases.
17 The 4th Committee recognises that the Subordinate Courts’ LIP caseload for Courts 17, 19 and 20 does not represent the total LIP caseload. For instance, data from the Mentions and Specialised Courts for criminal cases (Court 26) has not been included. Nevertheless, due to a lack of data, only the LIP caseloads for Courts 17, 19 and 20 have been used as a proxy to estimate the shortage of community law practitioners.

10
Year 2009 2010 2011
Estimated no. of LIP cases that would benefit from legal representation (assuming 50% of LIP cases would benefit) (“(E)”) = (B)/2 1,714 1,489 1,273
No. of additional community law practitioners required to represent the cases in (E) (“(F)”) = (D)/(C)*(E) 453 423 454
% more community law practitioners required than current supply (“(G)”) = (F)/(D) 38% 35% 37%
Data source: Subordinate Courts
2.13 As can be seen, the Subordinate Courts consistently reported a high percentage of LIPs for the period 2009–2011. By dividing the number of community law practitioners ((D)) by the number of non-LIP criminal cases ((C)) in each of these 3 years (ie, (D)/(C)), a fraction of the number of community law practitioners required to handle each non-LIP criminal case was obtained. On the assumption that to handle x% more cases would equivalently require x% more lawyers, the 4th Committee applied this fraction to the number of LIP cases that might benefit from legal representation ((E)),18 and thereby obtained an estimate of the number of additional community law practitioners required to handle those LIP cases in absolute and also percentage terms (see (F) and (G) respectively). Taking the average of the percentage figure ((G)) for the period 2009–2011, the 4th Committee was of the view that an approximately 37% expansion in the supply of community law practitioners as at 2011, or an addition of 454 lawyers to the estimated 1,213 lawyers practising community law, was necessary to represent 50% of the LIP cases as at 2011.
2.14 It was also brought to the 4th Committee’s attention that many of the lawyers now practising community law are fairly senior and are likely to leave the profession in the near future. This is especially the case where criminal law practitioners are concerned. Most lawyers who currently appear in court for criminal cases are in their 40s or 50s or beyond, with some in their late 30s, but few in their 20s. One likely reason for this inverse age pyramid is that
18 It was estimated that 50% of the LIP cases for the period 2009–2011 might benefit from legal representation. The Subordinate Courts’ statistics for this 3-year period showed that many LIP criminal cases were resolved in court through pleas of guilt as opposed to by trial, and that some of the accused persons in those cases might in fact have benefited from legal representation in the follow ways: (a) the accused might not have pleaded guilty if he had been properly advised; or (b) the accused might still have pleaded guilty, but was more likely to have obtained a lighter sentence had a lawyer mitigated for him.
11
many of the criminal lawyers currently in practice were admitted to the Singapore Bar after obtaining external law degrees, and their ranks have not been replenished since the withdrawal of recognition of such law degrees in 1993.
2.15 Problems caused: It is anticipated that the shortage of community law practitioners will remain acute in the future if no measures are taken to address this problem. This will have an adverse impact on access to justice for the average man in the street. The quality of representation may suffer because of the smaller number of practitioners in this area of the law, the resultant reduction in competition as well as the increased time pressures faced by community law practitioners. Further, the costs of securing legal representation in relation to community law matters may also increase.
2.16 The 4th Committee therefore believes that there is a pressing need to address the medium- to long-term shortage of lawyers in this area. The law functions as an important safety valve for disgruntled individuals. At all levels of society, effective access to the law and the assurance of an acceptable standard of legal representation help to lubricate and regulate commerce and social behaviour. The failure to address the shortage of community law practitioners may have an irreversible adverse effect on societal health and the credibility of our legal system. This will also be exacerbated by the projected increase in our population in the years to come.19
(B) Increase in intake of SMU Law students
2.17 The 4th Committee recognises that it would be ideal if both NUS Law and SMU Law are able to produce more law graduates annually in order to meet overall demand. However, NUS Law presently takes in 240 (±10%) LLB students per year and is already operating at its optimum capacity. The dean of NUS Law highlighted that there are financial, spatial and pedagogical constraints on further expansion, with the primary constraints being pedagogical and the desire to avoid sacrificing quality for the sake of quantity. It was therefore agreed that NUS Law’s annual LLB intake should be maintained at 240 (±10%) per year.
2.18 SMU Law presently takes in 120 (±10%) LLB students per year. The dean of SMU Law was of the opinion that SMU Law would be able to expand the number of LLB places by 60 to a total of 180 (±10%) per year over the next 3 years. He stated, however, that further expansion beyond 180 (±10%) LLB places per year would not be optimal as it would be significantly more
19 See the recently debated Population White Paper (http://population.sg) endorsed by Parliament on 8 Feb 2013.

12
difficult to provide quality legal education, particularly given that SMU is a small university which teaches through seminars with no lectures.
2.19 In conclusion, the 4th Committee, having considered the views of the deans of both law schools, is of the view that SMU Law’s annual LLB intake should be increased from the present 120 (±10%) students to 180 (±10%) over 3 years. This will ensure that any future or unexpected increase in demand for legal professionals by large and medium-sized law firms (particularly if Singapore’s legal sector is further liberalised in the future) can be adequately met by locally-qualified lawyers.
(C) Creation of a third law school
2.20 While the increase in the number of SMU Law graduates and the foreign supply of lawyers is a positive sign, the 4th Committee is not optimistic that a significant number of graduates from NUS Law, SMU Law or OSUs will be inclined to practise community law. This is because only the top students in each cohort gain entry to NUS Law and SMU Law, while those who study law abroad are usually put to substantial financial expense. Anecdotally, most of these individuals do not find that the practice of community law meets their professional aspirations. This is likely to be the principal reason why small law firms, which generally practise primarily in the field of community law, have reported difficulties in recruiting young lawyers.
2.21 The 4th Committee therefore proposes the creation of a third law school with a focus on training prospective lawyers keen on practising community law. The 4th Committee agrees with the observation in MinLaw’s ”Study on The Supply and Demand of Legal Professionals in Singapore” (revised April 2012) that “[a] targeted approach may be more effective to address sub-sector shortages”.20 Given the clear need to have a core of lawyers practising community law, the 4th Committee proposes that there is a need to boost not just the general supply of lawyers, but also, and in particular, the supply of lawyers geared towards the practice of community law.
(I) The criteria for admission
2.22 In respect of admission to the third law school, the 4th Committee proposes that preference be given to candidates who demonstrate a genuine interest in the practice of community law. It is envisaged that working adults (such as paralegals, social workers and law enforcement officers) will comprise the bulk of the admissions to the third law school. However, to cater to “A-level” students who have demonstrated a strong interest in the practice of community law, such students may be admitted into the third law school, but their numbers should be restricted.
20 MinLaw, Study on The Supply and Demand of Legal Professionals in Singapore (Revised April 2012), Annex C page 11.

13
(II) The pedagogical details
2.23 The 4th Committee proposes that the third law school offer part-time as well as full-time LLB programmes for undergraduates and graduate students, or both, depending on the resources of its host institution. This is to accommodate students who are working concurrently while studying.
2.24 To ensure that the quality of the graduates of the third law school matches that of NUS Law and SMU Law graduates, the 4th Committee proposes that the duration of the LLB course at the third law school should be 4 years if taken on a full-time basis, and at least 5 years if taken on a part-time basis. At the same time, however, the third law school should have the flexibility of exempting some of its more qualified or experienced students from certain modules where appropriate. For example, a paralegal who has worked in a law firm for a few years may be exempted from some very basic modules which an “A-level” student might be required to attend.
2.25 As the raison d’être of the third law school is to train prospective lawyers keen on practising community law, its curriculum should naturally focus on community law, incorporating elements of practical/vocational training. This law school should therefore have a smaller range of substantive law subjects compared to NUS Law and SMU Law in order to focus on subjects relating to the domestic legal needs of Singapore, such as community law.
(III) Quality control
2.26 The 4th Committee is adamant that students at the third law school must also receive such instruction as would enable them to meet the minimum requirements for admission to the Singapore Bar (ie, subjects such as land law and company law should be compulsory, although they may not always be relevant in community law cases). Stringent standards in curriculum design and admissions criteria should be set to ensure that graduates of the third law school can perform credibly on key indicators such as the Part B Bar Course and Examination subsequently. This will better assure the public that the LLB programme offered by the third law school is a credible but differentiated programme from the more conventional LLB programmes offered by NUS Law and SMU Law, rather than a second-class pathway relative to NUS Law’s and SMU Law’s respective LLB programmes. Similar to graduates from NUS Law and SMU Law, graduates from the third law school must achieve at least a lower second-class degree in order to qualify for admission to the Singapore Bar.
2.27 It follows that graduates of the third law school would also have to attend and pass the Part B Bar Course and Examination, which would provide a further check to ensure that they possess the requisite level of competence to practise as advocates and solicitors of the Singapore Bar. However, graduates from the third law school should be exempted from passing the Part A
14
Conversion Bar Examination because, unlike graduates from OSUs, they should already have sufficient grounding in Singapore law.
(IV) Benefit for persons with external law degrees or law degrees from non-OSUs
2.28 The 4th Committee also recognises that there are currently a large number of persons with external law degrees or law degrees from non-OSUs, many of whom may presently be working in the legal industry as paralegals or in similar jobs. It is recommended that the third law school provide in due course a conversion course consisting of vocational training and/or specialised modules for these persons so as to enable them to become fully-fledged lawyers. Concerns about the quality of external law degrees or law degrees from non-OSUs can be adequately addressed through the structure and content of the conversion course. The third law school should consider the following:
(a) Whether the admissions criteria for the conversion course should be an upper second-class or a lower second-class law degree. The 4th Committee recommends that the admissions criteria for conversion course applicants should, in the initial years, be an upper second-class law degree primarily to ensure that the third law school’s resources are not overwhelmed at the outset, when a surge of applicants is expected. In due course, the third law school, in consultation with the relevant stakeholders, could consider whether to lower the admissions criteria in the light of its experience and available resources; and
(b) Whether, due to resource constraints, to limit in the initial years the range of external law degrees which qualify a person to apply for the conversion course (eg, to only University of London (“UOL”) external law degrees).
2.29 The 4th Committee recognises that it is not necessarily the case that persons with external law degrees or law degrees from non-OSUs go on to practise community law. However, experience has shown that a large number of lawyers in small law firms (which predominantly practise in this area of the law) have external law degrees or non-OSU law degrees. Thus, it is hoped that some lawyers admitted to the Singapore Bar through this route will go on to practise community law, particularly those who are working in law firms which have been practising community law for some time.
(V) Plans for implementation
2.30 The 4th Committee proposes that the third law school be hosted by a suitable local tertiary institution that can best meet the objectives described above. This will have to be worked out in greater detail between MinLaw and the Ministry of Education.

15
2.31 The 4th Committee is pleased to note that NUS Law and SMU Law have helpfully offered the assistance of their faculty members, who could be employed on a part-time basis by the third law school to conduct particular courses. This would be especially helpful during the early years of the third law school when the core of its academic faculty is not yet established.
2.32 It is also proposed that, subject to the operational and financial capabilities of the third law school, its initial annual intake should be in the region of 75 students. The intake can be increased gradually after a period of assessment.
2.33 Moving forward, the third law school may also wish to consider tie-ups with foreign law schools which have an established track record in practical training. This will allow the third law school to tap on valuable experience, and also encourage greater cross-border understanding of different legal pedagogies in areas relevant to the practice of community law.
16
3 FOREIGN SUPPLY REVIEW
(A) Overview
(I) Requirements for admission
3.1 Currently, overseas-trained law graduates who seek admission to the Singapore Bar must have obtained a law degree of at least a lower second-class (or equivalent) from one of the 35 OSUs listed in the Schedule. They must also:
(a) Pass the Part A Conversion Bar Examination and complete 6 months of “relevant legal training”; and thereafter
(b) Complete the Part B Bar Course and Examination, followed by 6 months of “practice training” in a Singapore law practice.
3.2 In addition, law graduates who obtain their law degrees (of at least the minimum degree qualification) from OSUs must be Singaporeans (as defined at [2.6] above, ie, either Singapore citizens or Singapore Permanent Residents) in order to qualify for admission.
(II) Number of graduates from overseas universities
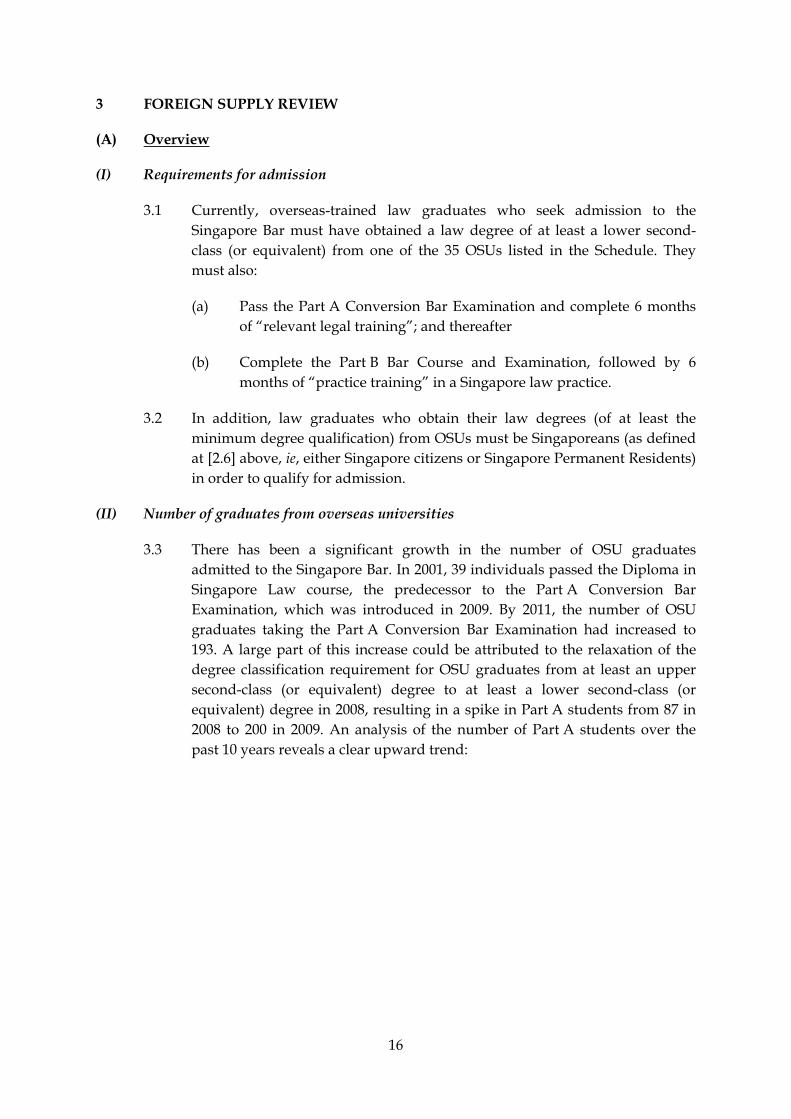
3.3 There has been a significant growth in the number of OSU graduates admitted to the Singapore Bar. In 2001, 39 individuals passed the Diploma in Singapore Law course, the predecessor to the Part A Conversion Bar Examination, which was introduced in 2009. By 2011, the number of OSU graduates taking the Part A Conversion Bar Examination had increased to 193. A large part of this increase could be attributed to the relaxation of the degree classification requirement for OSU graduates from at least an upper second-class (or equivalent) degree to at least a lower second-class (or equivalent) degree in 2008, resulting in a spike in Part A students from 87 in 2008 to 200 in 2009. An analysis of the number of Part A students over the past 10 years reveals a clear upward trend:

17
3.4 As tabulated below, there are now around 729 Singaporean (as defined at [2.6] above) undergraduates pursuing LLBs in the 19 UK OSUs listed in the Schedule.21 The distribution of these 729 undergraduates suggests a possible growth in the supply of Singaporean law graduates from UK OSUs in the coming years, on the assumption that most of these graduates return to Singapore after graduation – 153 Singaporean law students were admitted to UK OSUs in 2010 and are expected to graduate in 2013; 279 were admitted in 2011; and 297 were admitted in 2012. This represents almost a doubling in the number of Singaporean students studying law at UK OSUs, and notably, this body of students almost equals the combined number of NUS Law and SMU Law graduates per year.22
21 This is based on data provided by the UK Singapore Law Students Society (UKSLSS), accurate as at July 2012. Graduate students pursuing LLBs are not included due to a lack of data, but what data is available suggests that the number of graduate LLB students is low and likely to be fewer than 20. As a comparison, the size of NUS’s undergraduate LLB student body as at September 2011 was 900, with another 42 pursuing graduate LLBs. NUS’s 4-year LLB programme is treated as equivalent to the LLB programme offered by UK OSUs, which typically lasts for 3 years.
22 At present, there are around 360 NUS Law and SMU Law graduates each year.
0
50
100
150
200
250
2003 2004 2005 2006 2007 2008 2009 2010 2011 2012DipSing/Pt APLC/Pt B

18
UK OSU
Singaporean undergraduate students taking an internal LLB
Total Expected year of Graduation:
2012
Expected year of Graduation:
2013
Expected year of Graduation:
2014
Birmingham 8 0 1 7
Bristol 90 19 28 43
Cambridge 20 8 7 5
Durham 29 9 7 13
Exeter 20 2 8 10
King’s College London (“KCL”)
78 16 38 24
Leeds 26 4 11 11
Leicester 16 6 7 3
Liverpool 37 8 11 18
London School of Economics and Political Science
(“LSE”)
44 10 15 19
Manchester 66 13 18 35
Nottingham 72 12 33 27
Oxford 40 9 17 14
Queen Mary, UOL (“Queen
Mary”)
7 2 5 –
Sheffield 14 3 5 6
Southampton 32 8 13 11
SOAS, UOL (“SOAS”)
10 2 1 7
University College London
(“UCL”)
84 17 39 28
Warwick 43 7 20 16
TOTAL 729 153 279 297
3.5 Further, based on rough estimates, there are currently approximately 300 Singaporean undergraduate law students pursuing law degrees in Australian OSUs and another 20 in New Zealand OSUs,23 in addition to the 729 studying
23 This is based on approximate estimates obtained from Contact Singapore, accurate as at March 2012. Data on the number of Singaporeans studying law in OSUs in the USA is unavailable, but numbers are likely to be low.

19
in UK OSUs. This makes a total of approximately 1,050 Singaporean undergraduate law students currently studying at OSUs. Taking into account the different lengths of study for law degrees in each of these countries, a rough projection of the size of each graduating cohort from OSUs over the next 3 years is as follows: (a) 233 in 2013; (b) 359 in 2014; and (c) 377 in 2015.24 Not all of these graduating students will return to Singapore for admission to the local Bar, but past experience and evidence suggests that approximately 80% of them will return to practise law in Singapore.25 This is a significant source of supply, which shows every indication of expanding in the future, particularly if the cost of an overseas legal education becomes more affordable to Singaporeans.
(B) Refreshing the list of OSUs
(I) Regular reviews of the list of OSUs
3.6 The initial list of 15 UK OSUs in the Schedule was drawn up by the 1st Committee with the express intention of constraining the number of UK-educated law graduates to 50 per year.26 The 1st Committee’s Report does not reveal the precise selection criteria utilised, only going so far as to state that “[t]he sheer number of law schools available in England compels us to make choices among them, and in so doing, we should not be understood nor construed to be doing anything more than addressing a need to limit the number”.27
3.7 The list of UK OSUs has yet to undergo a major revision apart from the inclusion of 4 additional UK universities pursuant to the 2nd Committee’s recommendations.
3.8 The list of OSUs in the Schedule continues to represent the lynchpin of the present regulatory scheme for law graduates who receive their law degrees overseas. Although this list was introduced by the 1st Committee as a quantitative scythe to reduce the number of new entrants to Singapore’s legal market, it now operates as a qualitative sieve which offers the public in Singapore a general assurance of the competence of overseas-trained law graduates. The 4th Committee is of the view that it is necessary to update and
24 The formula is: (a) for UK OSUs, 162, 279 and 297 respectively for the years 2013–2015; (b) for Australian OSUs, 300/4 years = 75; and (c) for NZ OSUs, 20/4 years = 5. To take 2015 as an example, the total is 297 + 75 + 5 = 377.
25 On the assumption that the 2011 OSU cohort was of a similar size as the 2013 OSU cohort of 233 students, it can be inferred from the fact that since 193 students sat for the Part A Conversion Bar Examination in 2011, 40 students from the 2011 OSU cohort did not return to Singapore for that examination. This means that out of the 233 students in the 2011 OSU cohort, 83% returned to practise in Singapore. As a rough estimate, therefore, the attrition rate of Singaporean OSU law graduates returning to Singapore to practise is around 20%, ie, around 80% will go on to apply for admission to the Singapore Bar.
26 Report on the Legal Profession, April 1993 at [6.21].
27 Report on the Legal Profession, April 1993 at [5.12].

20
refresh this list so that it can better fulfil its present function as a qualitative sieve.
3.9 The 4th Committee took particular note of the growing number of Singaporean law graduates from UK OSUs (see [3.4] above). If left unchecked, there could be concerns that the increase in absolute numbers will be accompanied by a widening disparity in the fitness of UK OSU law graduates for the rigours of practice. To this end, the 4th Committee recommends that the current list of UK OSUs in the Schedule should be reviewed and updated to better reflect the current rankings of UK law schools. This will serve to realign the function of the list of OSUs in the Schedule as the first-level guarantee of quality. In summary, it is recommended that:
(a) The current list of UK OSUs in the Schedule should be reviewed and updated;
(b) A basket of updated UK law school rankings based on recent data should be used as an objective basis for reviewing and updating the current list of UK OSUs in the Schedule; and
(c) The list of UK OSUs in the Schedule should be reviewed every 5 years by the Singapore Institute of Legal Education (“SILE”).
3.10 As a matter of due process, the 4th Committee further recommends that at each 5-year review:
(a) SILE should write to the 10 lowest-ranked UK universities on the prevailing list of UK OSUs in the Schedule, particularly those falling outside of the top 15 universities in the basket of updated law UK school rankings. These 10 lowest-ranked UK universities may – subject to reviewing all the representations – be considered for exclusion from the updated list of UK OSUs; and
(b) SILE should also write to a target group of about 6 UK universities, from which a smaller group of universities can be picked for addition to the Schedule as OSUs.
3.11 SILE’s recommendations to MinLaw should then be publicly announced.
3.12 As a more objective and transparent means of ascertaining which UK universities should be included as OSUs in the Schedule, the 4th Committee recommends 3 publicly available rankings from reputable UK broadsheets. These are: (a) The Times Good University Guide; (b) The Guardian University Guide; and (c) the Complete University Guide.28 In order to minimise the risk
28 Formerly produced in association with The Daily Telegraph.

21
of error, a comparative approach should be adopted both laterally between the 3 rankings, and longitudinally over a period of 3 years. The full methodology employed and the research compiled by the Working Group on Foreign Supply is contained in Annex B.
3.13 It should be highlighted that due consideration must be given to Singaporean law students studying in those UK OSUs which are dropped from the list of UK OSUs during each 5-year review, in that such students who are enrolled or can prove that they have secured a place in any of the omitted UK OSUs at the time the updated list of UK OSUs is publicly announced should not be adversely affected by the change. The impact of the review would primarily be an improvement in the calibre of UK OSU law graduates due to higher entry grade requirements and a better quality of university education. It is expected that future law students who would otherwise have gone to any of the UK universities removed from the list of UK OSUs in the Schedule would instead attend other UK OSUs retained in or added to that list; as such, there will not be a significant drop in the number of law graduates from UK OSUs, and any eventual drop would be solely a secondary effect of intentional quality control.
3.14 The recommendations which we have made at [3.9]–[3.13] above in relation to 5-yearly reviews of the list of UK OSUs in the Schedule should likewise apply, with the appropriate modifications, to the non-UK OSUs listed in the Schedule. The only exception would be in respect of those non-UK OSUs whose law degrees Singapore is required to recognise pursuant to Free Trade Agreements (“FTAs”).29
(II) Satellite campuses
3.15 In its consideration of the list of OSUs in the Schedule, the 4th Committee based its deliberations on the premise that admission to the Singapore Bar by way of obtaining a law degree from an OSU requires the degree holder to have undergone and completed his full-time degree programme in the parent campus of the OSU, ie, the campus located in the parent country of the OSU as specified in the Schedule. This requires that a person seeking admission to the Singapore Bar by studying in an OSU would have to study in the parent campus of the OSU concerned and not a satellite campus (ie, an overseas branch). Even if the degree obtained in the satellite campus is conferred by the parent campus of the OSU, recognition of the degree for the purposes of admission to the Singapore Bar should still be withheld as such a degree
29 There are currently 14 non-UK OSUs whose law degrees Singapore is required to recognise pursuant to FTAs. 10 of these non-UK OSUs are in Australia (namely, (Monash University, University of Melbourne, University of New South Wales, University of Sydney, Australian National University, Flinders University, University of Queensland, University of Western Australia, University of Tasmania and Murdoch University), and the remaining 4 are in the USA (namely, Columbia University, Harvard University, New York University and University of Michigan).

22
would not have been obtained through full-time study while being resident in the OSU’s parent campus. This is consistent with the 4th Committee’s understanding of how the Schedule currently functions, and no changes are proposed to this.
(III) “Twinning” programmes
3.16 “Twinning” programmes arise from the partnership of 2 universities or institutions. A student generally spends some time at each university studying the curriculum of the more renowned university, and is awarded a full degree qualification from the more renowned university. Examples include “3+0” and “2+1” degrees, which signify, respectively, 3 or 2 years spent in the less renowned university, and 0 or 1 year spent in the more renowned university. A large number of “twinning” programmes are offered in Malaysia. Some private institutions in Singapore also offer such programmes.
3.17 At the inception of the original list of 15 OSUs in the Schedule (all of which were UK universities), the 1st Committee was careful to stress that institutions would not be permitted to gain back-door entry to the list via “twinning” programmes with those 15 OSUs.30 The concerns cited by the 1st Committee included “difficult problems in relation to the quality of the students, the entry qualifications as well as the quality of teaching standards. Moreover, ‘twinning’ programmes are likely to undermine our recommended ceilings [for the supply of law graduates].”
3.18 The 4th Committee has re-examined “twinning” programmes and concur that they should not be recognised for the purposes of admission to the Singapore Bar. There remain complex problems with the quality of “twinning” programmes, with some courses being taught largely at satellite campuses despite latching onto the brand-name of a more reputable institution. This concern is also reflected by the present requirement that the law degree obtained from any OSU must have a duration of at least 3 academic years. While it is possible that some ”twinning” programmes may hold up to scrutiny, it is extremely difficult for any certifying body to be certain about the exact content of the legal education provided under a “twinning” programme. There is no straightforward way to set a standard by which “twinning” programmes can be assessed. As such, it is recommended that the present policy of non-recognition of “twinning” programmes for the purposes of admission to the Singapore Bar should be retained.
30 Report on the Legal Profession, April 1993 at [5.14].

23
(C) Recognition of double-degree programmes from OSUs
3.19 It is increasingly prevalent in both local and overseas universities for undergraduates to be enrolled in double-degree programmes, in which they spend a proportion of their course studying law and the remainder studying a complementary discipline such as business, accountancy or economics.
3.20 The 4th Committee is of the view that such double-degree programmes provide a useful counterpoint to traditional legal education and have the potential to aid in the development of better skill-sets for today’s multi-disciplinary legal environment. At the wider level, double-degree programmes also inject greater diversity into the legal eco-system, which will contribute towards raising the quality of the Singapore Bar. The 4th Committee is therefore keen on leveraging upon these benefits, whilst implementing certain controls at the same time to ensure that graduates with double-degrees from OSUs have received a firm legal grounding.
3.21 Any requirements imposed for the admission of OSU double-degree holders to the Singapore Bar must at least be as stringent as those currently in place for full-time law degree holders. The 4th Committee proposes the following for consideration:
(a) Imposing a clear set of criteria which OSU double-degree holders must meet in order to qualify for admission to the Singapore Bar, such as any or all of the following:
(i) The double-degree programme must have been conducted by an OSU;
(ii) The degree holder must have obtained a specified minimum degree classification and/or cohort ranking; and
(iii) Certain compulsory subjects must have been included in the course of study.
(b) Double-degree holders who do not meet the criteria in (a) may still avail themselves of a limited discretion which MinLaw has to grant exemptions, subject to prescribed conditions.
(D) Retention of a minimum degree classification
3.22 In the light of the qualitative regulation which will introduced by the regular review and updating of the list of OSUs in the Schedule, the 4th Committee recommends the retention of the requirement, introduced in 2009, that law graduates pursuing full-time LLBs or JDs in OSUs obtain at least a lower second-class degree or equivalent in order to be regarded as a ”qualified person” for the purposes of admission to the Singapore Bar.

24
(E) Exclusion of external law degrees
3.23 External law degrees used to be a popular means for aspiring lawyers to obtain a qualification which enabled them to be called to the Singapore Bar. At the time, a large number of students were either registered in or studying for UOL external law degrees – the figure cited as at November 1992 was 1,750 students, which was “probably higher than the combined number of full-time students both in NUS and overseas universities for the same period”.31
3.24 Having studied the issue, the 1st Committee took the view that the holder of an external law degree could not be compared to the holder of an LLB degree from NUS Law (the only law school in Singapore at that time),32 and that the key disadvantage of an external law degree was the lack of an “intellectual environment which conduces to a deeper and better understanding of the law and its role in society”.33 Accordingly, it was recommended that external law degrees should no longer be recognised for the purposes of admission to the Singapore Bar.
3.25 In a recent letter of representation which UOL sent to the 4th Committee, UOL sought to address the concerns expressed by the 1st Committee in regard to external law degrees by citing “quality control” measures ranging from assurances of the reasonable duration of its external law degree programmes, improvements in the rigour of such programmes and enhancements in student resources and student support, to the use of Singaporean partner education institutions and online portals to provide an intellectual environment for external law degree students. UOL divulged that there are currently around 700 students in Singapore studying for its external law degree; and that the general overall trend of the results for its external law degree students worldwide (numbering around 1,500 a year) was that less than 10% were awarded upper second- or first-class degrees. UOL suggested that this was testament to the high standards of its external LLB programme, and that students pursuing that programme would have obtained the same degree classification had they studied for an internal UOL law degree.
3.26 Notwithstanding UOL’s representations, the 4th Committee notes that the chronic problem of a lack of a rigorous intellectual environment remains where external law degrees are concerned. The recommended increase in the intake of SMU Law students as well as the creation of a third law school with an emphasis on community law will also largely obviate the need to recognise external law degrees as a means of shoring up the supply of lawyers in Singapore. Moreover, it has also been recommended above (at [2.28]) that the third law school could provide for a conversion course which
31 Id at [2.18].
32 Id at [5.19].
33 Id at [5.20].

25
offers persons with external law degrees or law degrees from non-OSUs a route to be called to the Singapore Bar. As such, the 4th Committee recommends that the current position of non-recognition of external law degrees should be retained.

26
4 ATTRITION REVIEW
(A) Overview
4.1 While it is important to ensure that the local and foreign supply of lawyers is increased to meet the demand for legal services, the 4th Committee is also of the view that considerable attention should be directed towards reducing the attrition rate of legal professionals in Singapore. This is because it is always more economically efficient to ensure that legal professionals are retained, rather than to have to train legal professionals from scratch.
(I) Determining the attrition rate of legal professionals in Singapore
4.2 In determining the attrition rate of legal professionals in Singapore, the 4th Committee was in broad agreement with the definition of ”legal professionals” employed by the 3rd Committee, which included ‘‘not only practising lawyers, but also in-house counsel, legal service officers, the judiciary and law academics in Singapore’’. The 4th Committee shared the 3rd Committee’s view that the number of lawyers holding practising certificates (“PCs”) was only a subset of the larger pool of legal professionals who provided a broader array of legal services.
4.3 Therefore, ”legal professionals” in Singapore would be individuals actively engaged in legal work in Singapore as follows:
(a) Advocates and Solicitors of the Singapore Bar who are in private practice (referred to broadly as ”Singapore practitioners in private practice”);
(b) Foreign lawyers registered with AGC (“foreign lawyers”);
(c) Singapore-qualified in-house counsel (eg, those working in corporations or multi-national companies);
(d) Officers in the Singapore Legal Service (“the Legal Service”);
(e) Singapore-qualified legal counsel working in Government Ministries and Statutory Boards (“SBs”); and
(f) Singapore-qualified legal academics.
4.4 Using data on PC holders from the last 2 years, as well as membership data from the Singapore Academy of Law (“SAL”) and foreign lawyer registrations with AGC, the 4th Committee relied on 2 charts to draw some preliminary conclusions, which will be elaborated below.
4.5 The first chart directly below presents a snapshot of legal professionals in Singapore based on data from the Supreme Court, AGC and SAL. It attempts to break down legal professionals in Singapore into various constituent elements, namely: (a) foreign lawyers; (b) Singapore practitioners in private

34 The nuprofessio
0
1,000
2,000
3,000
4,000
5,000
6,000
7,000
8,000
pracMin
Figure 1: Co
4.6 A fe
(a)
(b)
4.7 Theposbroa
umber of corpon as corporate
633
3,383
796
319
2007
Co
Foreign In‐houseLegal Se
ctice; (c) in-nistries and
omposition of
ew observat
Across professSingapoand
The reswork ocorpora
e second chat-qualificatiader catego
porate counsee counsel. Thi
72
3,47
8910332
200
ompositi
Lawyerse counselervice Officers
-house coun SBs; and (e
f the legal pr
tions can be
all cohortionals in ore Bar and
st of the legoutside of ate counsel.
art directly ion experieory of legal
l is based on s figure does n
0
743
31030
08 2
ion of Le
27
nsel; (d) offe) academia
rofession
e gleaned fr
ts, it can Singapore
d foreign law
gal professiprivate pr
below is dence (“PQE” profession
the number onot include co
923
3,611
987106368
2009
egal Profe
SLe
icers in the .34
rom this dat
be deducee (namely, wyers) cont
ionals in Siractice, wi
erived from”) of practis
nals). The ch
of active SALorporate couns
1,080
3,737
1,07610
397
2010
essionals
ingapore Pracegal Academi
Legal Serv
ta:
d that 73– lawyers tinue to be
ngapore arth the ma
m data in 20ing lawyers hart is to be
L members whsel who are fo
1,164
3,879
1,1508
434
2011
s in Singa
ctitioners in Prcs
vice or Gove
–76% of thadmitted
in private p
re engaged ajority wor
011 and 201 (as opposee read muc
ho have indicoreigners.
1,258
3,836
1,226110
480
2012(As at Ju
apore
rivate Practice
ernment
he legal to the
practice;
in legal king as
2 on the ed to the ch like a
cated their
109
ly)
e

0
100
200
300
400
500
600
0
3rdCo
mmittee
popyearcorrtowbars2011yearPQEat th
Figu
4.8 Thelawin ththe Combetwfor stablawanewhia law
0 2 4 6
D
3rdCo
mmittee
2nd Co
mmittee
pulation pyrrs that havresponds to
wards the lefs towards th1 and 2012 rs’ PQE in E in 2012), he various s
ure 2: Demog
e attrition rwyers from t
he wavy gr right-handmmittee thaween the 2n
each cohobilises after
wyer’s careecdotal accoile the oddswyer for at
8 10 12 14
Demographic
Law Grad
2012
Attrition
1st Co
mmittee
ramid, withve elapsed o 1 cohort, wft of the grahe right. By (eg, compa2011 with tthe 4th Comstages of the
graphic profi
rate of lawthe previousreen line towd vertical at in the inind and 5th yert for the the 10th ye
er, when thounts of laws of a lawye least 10 yea
4 16 18 20
profile of pra
duates in this c
rate in 2012
28
h the horizo since adm
with the moaph and they comparingaring the bluthe red bar
mmittee waseir careers.
file of lawyers
wyers from s year’s cohwards the taxis. It th
itial 10 yearear of practcorrespond
ear, and remhe attrition wyers leaver remaininars are virtu
22 24 26 2
acticing lawye
cohort
ontal axis comission to tost junior lawe most senig the sizes ue bar corr corresponds able to es
s from indivi
each cohohort who artop of the c
herefore aprs of practictice, with anding years. mains stabl rate picks
ving practicng in practicually certain
8 30 32 34
ers by years p
Part A / DipSi
2011
orrespondinthe Singapwyers repreor lawyers of individuesponding
ding to lawytimate the o
idual cohorts
ort, as a pee still practichart, whichpears quitece, the attrin average a The attritie until the up again. e mostly in
ce if he has n.
36 38 40 42
post‐admissio
ng in this coho
ng to the nupore Bar. Eesented by represented
ual cohorts b to lawyers
wyers with 2outflow of
s
ercentage otising law, ih is plottede clear to ition rate isattrition ratetion rate gr twilight ye This corron the initia already wo
2 44 46 48
on
ort
Attrition
umber of Each bar
the bars d by the between with 20
21 years’ lawyers
of those s shown
d against the 4th highest e of 14% radually ears of a oborates al years, orked as
‐10%
0%
10%
20%
n Rate
29
(II) Possible factors contributing to attrition
4.9 The 4th Committee has identified 3 main factors causing or contributing to attrition amongst legal professionals today:
(a) Unsustainable work practices;
(b) The unsuitability of the individual legal professional for legal work; and
(c) Structural problems within law firms.
(a) Unsustainable work practices
4.10 Based on an informal survey of a group of lawyers conducted by the Working Group on Attrition,35 about 71% of respondents who left practice said that the most significant challenge they faced in practice was stress due to the pace of work and workload. Several complained of “long hours”, “lack of social life” and “difficulty in balancing work and family life”. A substantially similar result was reached based on a similar survey of some law firms on the reasons why some of their lawyers left private practice, with the top-ranked reason being the claim that there was a lack of “work-life balance”.
(b) The unsuitability of the individual legal professional for legal work
4.11 The 4th Committee is of the view that a contributing factor as to why some legal professionals quit the profession altogether could be the misalignment between the aptitudes of the particular individual concerned and the nature and demands of legal practice. Most legal professionals today had to decide whether to enter law school at the tender age of 19 to 21. The 4th Committee was generally of the view that many of these young students, albeit bright and capable, might not be fully aware of the nature and demands of the legal profession. When they eventually graduate and realise that their aptitudes and/or interests do not align themselves to the nature and demands of legal practice, many of these young legal professionals may quit the profession and pursue other lines of work.
(c) Structural problems within law firms
4.12 The 4th Committee observed that law firms in Singapore continue to adhere to a traditional pyramidal structure, whereby only a small proportion of each intake of lawyers will find a place in the senior levels of practice. Some law firms even actively encourage lawyers who do not make the cut for partnership to leave. This “up-or-out” paradigm is thus a major contributing
35 The Working Group issued a survey to a random sampling of small, medium and large local and foreign law firms. A sample size of 17 firms (8 large, 8 medium and 1 small), which currently employ a composite total of 1,411 lawyers, was achieved. Altogether, 15 Singapore law practices and 2 foreign law practices participated in the survey. A similar survey was administered to a sampling of 35 individual lawyers.

30
factor to the high turnover rate of lawyers in their junior years. In response to this trend, many law firms are forced to rely on lateral recruitment (ie, recruitment from other law firms). A negative corollary of this is that law firms have no incentive to devote equal resources for the long-term development of their trainees and associates. As a lawyer today is more aware of such problems affecting his or her perceived career prospects, this is again a likely push factor which accounts for why many lawyers leave mostly “in the initial years, while the odds of a lawyer remaining in practice if he has already worked as a lawyer for at least 10 years are virtually certain” (see above at [4.8]). The overall result of the combination of these factors is that of a high attrition rate of junior lawyers.
4.13 The 4th Committee is of the view that education is the key to addressing the problem of attrition. In order to address this problem and start the process of shifting engrained mindsets, the 4th Committee recommends a two-pronged approach where the following 4 key stakeholders will be engaged on issues which affect attrition rates and the well-being of legal professionals:
(a) Law students and would-be law students;
(b) The faculties of law schools;
(c) The management of law firms; and
(d) Junior lawyers.
(B) Modifying practices in the 2 existing local law schools
(I) Targeted selection in the admissions process
4.14 As observed earlier, the majority of lawyers who leave the profession are young lawyers with up to 1–8 years of PQE, with a large proportion being those with less than 5 years of PQE. The 4th Committee is of the view that many of these lawyers were either dissatisfied with the type of legal practice they were engaged in, or were not sufficiently prepared psychologically or emotionally to accept the rigours and realities of private practice.
4.15 To address this problem, the 4th Committee recommends that the 2 existing local law schools, NUS Law and SMU Law (collectively, “the 2 local law schools”), undertake a more targeted selection of law school applicants to increase the likelihood that those who are admitted will remain in practice.
4.16 This would entail streamlining the law school admissions process to factor in the likelihood of candidates “staying the course”. This could take the form of, educating prospective applicants at an early stage on the realities of practice, formulating targeted interview questions and deciphering applicants’ perceived alternatives. The 2 local law schools might also consider taking a cue from the rigorous selection process of the NUS Medical School.

31
4.17 Another possibility which the 2 local law schools can consider is to increase the involvement of experienced practitioners in the admissions process. These experienced practitioners will be able to provide fresh input as to whether an applicant is likely to “stay the course”.
4.18 The 4th Committee is, however, not oblivious to the problems besetting the “targeted selection” of law school applicants. It is acknowledged that however well-structured the selection process may be, the eventual impact may ultimately be limited. While the 4th Committee is of the view that admissions interviews could focus more on the character, motivations and personalities of applicants, the 4th Committee also recognises that there are 3 major limiting factors: (a) interviewers are not trained psychologists; (b) applicants tend to adopt a certain outlook during interviews once they find out what interviewers are looking for; and (c) motivations can change with time. It was also observed, anecdotally, that many applicants do not usually have a particular reason for applying to law school. At the same time, it is important that the changes in the admissions process should not prejudice applicants who do have strong reasons for pursuing a law degree even if these are unrelated to a career in private practice, such as those who are keen to be bankers, corporate counsel or public sector officers. Since the major problems of attrition arise during the initial years of practice, it may not always be realistic to attempt to divine in an admissions interview whether a particular applicant will definitely remain in practice a decade later. For these reasons, this recommendation may only have limited effect and will have to be accompanied by other measures such as those proffered below.
(II) Early preparation for the realities of practice
4.19 The 4th Committee believes that to lower the attrition rate, it would be helpful to prepare young law graduates early for the realities of practice before they enter the legal market. It is therefore imperative that law students are given a realistic view of what practice is like as part of their law school experience. This can be achieved through sufficient exposure to law firms via internships and programmes that may be offered in law school. The following proposals were discussed as possible recommendations that the 2 local law schools could adopt (or continue to support).
(a) Clinical legal education
4.20 NUS Law has recently introduced a module called “The Law Clinic” as an elective subject in the 3rd or 4th year, with additional clinical legal programmes in development. In “The Law Clinic”, students develop both client management skills and legal skills in context by assisting in live cases under the close supervision of lawyers. This module is at present limited to only 15 students per semester. Academic credits are awarded for students who satisfactorily complete the module.

32
4.21 SMU Law’s “Asian Rule of Law Programme” similarly permits a small group of students to assist with “direct impact litigation projects” in the region. The skills imparted through directed research instruction and simulations are tested in the context of real-world advocacy and help to strengthen core legal skills such as legal research, legal writing and legal analysis. Students participating in this programme have worked in collaboration with students and professors from Yale University and University of California, Berkeley.
4.22 It was brought to the 4th Committee’s attention that it is difficult to teach such clinical legal programmes well, and it is not easy to attract teachers with the necessary practical experience at the normal range of salaries paid by Singapore universities. Further, the 4th Committee observed that it would be difficult to ensure consistent grading, given that academic credits would be awarded. One way of overcoming this problem is to hire full-time faculty staff to supervise clinical legal programmes. The deans of NUS Law and SMU Law have estimated that 1 full-time faculty member dedicated to such programmes can oversee about 60 to 70 students. This is because clinical legal programmes require a small class size of about 15 students per class in order to function effectively, as large sizes would make it extremely difficult for the instructor/supervisor to manage. A further concern is the need to ensure the existence of sufficient academic rigour in clinical legal programmes. While there are trusted external parties who can be partners in clinical legal programmes, such as AGC or the Law Society, these parties have limited resources.
4.23 To build upon and improve the current offerings, the 4th Committee recommends that the existing clinical legal programmes at the 2 local law schools should be supported and expanded, drawing on the example of the Mills Legal Clinic at Stanford Law School, where legal clinics are diverse and cater to a wide range of students’ interests. Clinical legal education at Stanford Law School includes assisting charities in corporate work such as governance advice and contract drafting, criminal prosecution and defence, organisation and transactional work, intellectual property and innovation, and assisting with writing amicus briefs and legal submissions for international human rights and environmental litigation. Stanford professors and students agree that these clinics help to “prepare every student for the real-world challenges, responsibilities, and rewards of a career – any career – in law. At the same time, it helps instil in students a fundamental commitment to a lifetime engagement with public service and pro bono activities. In addition, it is one of the ways we give back to our community”.36
36 See http://www.law.stanford.edu/areas-of-interest/clinical-legal-education and http://stanfordlawyer.
law.stanford.edu/category/stanford-lawyer/clinic-news/ for more information.

33
(b) Increased involvement of practitioners in teaching
4.24 The 4th Committee is of the view that an increased involvement of practitioners in teaching will allow law students to get a more rounded and practical problem-solving grounding in order to prepare them for the next step in their legal career. This will better prepare law graduates for the modern legal world, where an understanding of finance, marketing and management, coupled with the ability to think creatively, can be as important as a strong academic grounding in the law. Practitioners can be involved either by actually teaching courses or by being afforded a channel to express their views on the syllabi employed in specific courses. While such views need not be binding on the law schools, it remains important to put them up for consideration as the vast majority of law students will become practitioners.
(c) Sharing sessions with practitioners
4.25 Anecdotal feedback from some young associates at a law firm indicates that career fairs which have recently been introduced by the 2 local law schools are helpful because they provide a platform for a more candid discussion between, on the one hand, law students and, on the other hand, legal professionals, thereby exposing law students to the rigours and realities of legal practice from an early stage. Both the 2 local law schools are therefore encouraged to continue to facilitate access and build networks through which law students can have candid discussions with legal professionals.
(d) Structured internships
4.26 SMU Law currently mandates that each student undergoes 10 weeks of compulsory internship during the holidays as a precondition to graduation.
4.27 NUS Law does not favour making internship compulsory because in its view, making internship compulsory will mean that students who are not interested will do it simply out of obligation, thereby diminishing the value of the internship for both these students and the law firms they are attached to. Therefore, NUS Law’s preference is to make it easier for interested students to go for internships in a more structured manner, without making it compulsory.
4.28 It was also brought to the 4th Committee’s attention that students may come away with an unrealistic idea of what practice is like because internships are generally viewed as public relations exercises by law firms.
4.29 Nevertheless, the 4th Committee suggests that a more structured internship programme could be developed by the 2 local law schools, similar to the industrial attachments required in other disciplines. It is also recognised that a minimum period of 4 to 5 weeks is necessary for an internship experience to be meaningful. One possibility would be to break up the end-of-academic

34
year vacation into different blocks so that the scheduling of internships would be easier. To achieve this, a more centralised system for the allocation and management of internships would be necessary. This would help in disseminating information between all law students and law firms.
4.30 The 4th Committee therefore recommends that the 2 local law schools should work together with the Law Society to set up a centralised and more structured system for internships.
(e) Pro bono activities
4.31 The 4th Committee agrees that incorporating pro bono activities as part of the law school curriculum would be a good way of inculcating an ethos within the legal profession of contributing to society. Other top universities such as Harvard Law School have pro bono clinics as part of their curriculum.
4.32 Incorporating pro bono activities as part of the law school curriculum would help to develop a pro bono culture within the legal fraternity as a whole in 2 main ways. It would expose students to the realities of practice in community law, and also equip them with the necessary skills and relationships to do pro bono work on a continued basis after graduation.
4.33 The 4th Committee therefore recommends that the 2 local law schools should actively incorporate pro bono activities as part of their curriculum. One possibility is to implement a more structured programme, where all students from the 2 local law schools are required to do pro bono work (either through the Law Society or MinLaw) at least once before graduating. Another possibility is to have a module (eg, law clinics) that focuses on getting small groups of students involved in pro bono work.
4.34 The 4th Committee is of the view that such pro bono activities should, as far as possible, be made mandatory in the 2 local law schools notwithstanding the creation of the third law school. This will better prepare graduates of the 2 local law schools to discharge their mandatory pro bono obligations in practice. It should be kept in mind that the needs in the area of community law cannot and should not rest entirely on the shoulders of the third law school or its graduates. There would still exist a pressing need for graduates of the 2 local law schools to engage in the practice of community law, and pro bono obligations serve as an important opportunity for them to do so. Having more legal professionals involved in pro bono activities would also help to keep the costs of community law matters reasonable, and it is hoped that this will help to improve access to justice for the average man in the street (see above at [2.15]).
(C) Modifying practices in law firms
4.35 Besides recommending changes to the 2 local law schools, the 4th Committee also sees the importance of addressing work-life balance concerns in law

35
firms in order to stem the attrition of young lawyers with between 1 to 8 years of PQE. The 4th Committee therefore makes 2 main recommendations to law firms which will be elaborated below: (a) provide flexibility in legal practice; and (b) provide greater support and welfare.
(I) Providing flexibility in legal practice
(a) Encouraging more part-time work
4.36 The 4th Committee believes that a work culture that is more conducive to part-time work would allow parents and caregivers who have left legal practice to rejoin the profession. Based on the same survey conducted at [4.10] above, it was brought to the 4th Committee’s attention that women were more likely to leave private practice compared to men.37 One likely reason for this is because of the desire to start a family or the need to assume caregiving roles. Law firms are thus encouraged to redesign work to accommodate flexible schedules, so that part-time work can become a much more viable alternative for lawyers starting a family or assuming caregiving roles. At the same time, the 4th Committee is aware of the practical reality that schedules are primarily driven by client expectations. As such, redesigning work will inevitably have to entail the management of such expectations.
(b) Rotation policy for trainees
4.37 The 4th Committee urges law firms to consider implementing a rotation policy for trainees so as to increase exposure and aid young lawyers in making an informed decision when they subsequently decide to specialise. Such a requirement could be implemented as part of the conditions of a training contract. This will reduce the mismatch of expectations between law firms and their trainees, so that attrition arising from lawyers trapped in unsuitable or unfulfilling specialisations may be alleviated. Allowing young lawyers to choose an area of law which fits them better will also lead to a higher likelihood of lawyers finding fulfilment in their chosen field of expertise and staying within the profession.
(c) Different career advancement tracks
4.38 The 4th Committee recommends that law firms be open to designing different career advancement tracks such that lawyers who are able and willing to continue working should not be discouraged from staying with the firm simply because they do not make the cut for partnership.
37 Of the total number of lawyers who resigned from their law firms but remained within the legal profession, 56%, 72% and 67% in 2009, 2010 and 2011 respectively were women. Of the total number of lawyers who resigned from their law firms and left the legal profession altogether, 48%, 64% and 64% in 2009, 2010 and 2011 respectively were women.

36
(d) Practising outside a traditional legal practice
4.39 Besides recommending changes to the practices in law firms, the 4th Committee also urges MinLaw to consider the viability of encouraging the growth of legal work outside the existing structures of conventional legal practice. Some of these possibilities are:
(a) The creation of an online marketplace run by the Law Society for practitioners who wish to take on ad hoc or locum assignments; and
(b) “In-sourcing” arrangements such as the model used by Advent Balance,38 which hires lawyers from a wide range of backgrounds so as to provide clients with flexible solutions for routine legal work which need not be handled by traditional law firms.
(II) Providing greater support and welfare
(a) Creating a better working environment
4.40 The 4th Committee recommends that law firms equip partners and lawyers in private practice with tools to create a better working environment. There is certainly room for partners of law firms to improve resource management and retention, which may be done by equipping them with appropriate skills. Law firms could be encouraged or given tangible incentives to invest in the development of mentorship and coaching systems, where mentors in the legal industry are identified to offer personal career guidance to lawyers. Likewise, a credible feedback mechanism should also be developed within law firms to encourage lawyers to ventilate their concerns early so that these can be appropriately addressed, if possible. One example which was raised was the formation within law firms of practice-based working groups, comprised entirely of associates, to brainstorm and discuss areas that the law firm concerned can improve upon, with an associate spokesperson compiling and presenting the associates’ feedback as well as the proposed solutions for improvement to the firm’s partners. These mechanisms and systems can be developed by the law firms themselves, or under the auspices of SAL, the Law Society or agencies (such as SPRING Singapore) which look into productivity and manpower issues.
(b) Collaborative efforts to manage workplace stress
4.41 Within the profession, programmes similar to Resilience@law at The College of Law in Australia39 could be introduced to help legal professionals cope better with work or personal pressures. Resilience@law is a collaboration between 5 major Australian law firms and The College of Law to raise
38 See http://www.adventbalance.com for more information.
39 See http://www.collaw.ac.nz/Research-and-Resources/Resilience-at-Law/ for more information.

37
awareness and understanding of the nature and impact of stress, depression and anxiety across the legal profession. The stated aim is “to make a lasting contribution by developing a learning approach for people at each stage of their legal careers – from graduate lawyers through to partners”. Law firms in Singapore are encouraged to collaborate in drawing up similar programmes. It is hoped that this will help to reduce avoidable attrition stemming from unaddressed workplace stresses.
(c) Greater welfare schemes
4.42 Welfare schemes such as health insurance, retirement planning and benefits could be introduced for lawyers and/or in-house counsel through the Law Society, SAL or the Singapore Corporate Counsel Association. To create support schemes for lawyers and encourage retention, these bodies could provide membership-linked health insurance schemes (with investment options), financial planning for retirement, etc. Profession-linked benefits could provide practising lawyers with long-term social and financial incentive to remain in the legal profession in spite of lifestyle changes. Additionally, the Law Society and SAL could promote greater collegiality among their members by organising more social activities.

38
5 CONCLUSION
5.1 In conclusion, the 4th Committee seeks to address the shortage of lawyers via a balanced, multi-pronged approach: creating local sources of supply specially designed to address areas where the shortage of lawyers is most greatly felt; enlarging yet maintaining the quality of the foreign supply of lawyers; and promoting policies to reduce the attrition rate of legal professionals (especially practising lawyers).
5.2 The recommendations proposed are premised upon a cautious and incremental implementation process. Periodical review mechanisms should also be built into the major recommendations above to ensure that the changes implemented will be responsive to the ever-changing needs and challenges facing the legal profession in the years to come.
The 4th Committee is pleased to submit this Report for consideration.
Dated this 22 day of May 2013.
.


Annex A
A-1
Working Groups of the 4th Committee
1 DEMAND
(a) Mr Aedit Abdullah SC (AGC) (Co-Chair) (b) Mr Yap Wai Ming (Stamford Law Corporation) (Co-Chair) (c) Mr Goh Yihan (NUS) (d) Mr Alvin Tan (EDB) (e) Mr Hamidul Haq (Rajah & Tann LLP) (f) Ms Kuah Boon Theng (Legal Clinic LLC) (g) Mr Lim Seng Siew (Ong Tay & Partners Law Corporation) (h) Mr Lok Vi Ming SC (Rodyk & Davidson LLP) (i) Ms Pek Siok Lan (Temasek International Pte Ltd) (j) Mr Adrian Peh (Yeo, Leong & Peh LLC) (k) Ms Stephanie Yuen-Thio (TSMP Law Corporation)
Secretariat:
• Mr Andrew Cheah (MinLaw) • Ms Lum Pooi Fun (MinLaw)
2 LOCAL SUPPLY
(a) Mr Hri Kumar SC (Drew & Napier LLC) (Chair) (b) Professor Simon Chesterman (NUS) (c) Ms Valerie Thean (MinLaw) (d) Professor Yeo Tiong Min SC (SMU) (e) Mr Andy Leck (Baker & McKenzie) (f) Mr Mahdev Mohan (SMU) (g) Mr Sivananthan Sivagnanaratnam (Creative Technologies Pte Ltd)
Secretariat:
• Mr Tan Zhongshan (Supreme Court) • Mr Koo Zhi Xuan (Supreme Court)
3 FOREIGN SUPPLY
(a) Mr Wong Meng Meng SC (Law Society) (Chair) (b) Ms Ong Puay See (MAS) (c) Ms Valerie Thean (MinLaw) (d) Mr Low Kah Keong (WongPartnership LLP) (e) Mr Gary Pryke (Drew & Napier LLC)

Annex A
A-2
(f) Mr Kelvin Wong (Allen & Gledhill LLP)
Secretariat:
• Ms Gloria Lim (MinLaw) • Mr Andrew Cheah (MinLaw) • Mr Jonathan Yap (Supreme Court)
4 ATTRITION
(a) Ms Angeline Lee (Singapore Corporate Counsel Association) (Chair) (b) Mr Daryl Chew (Shearman & Sterling LLP) (c) Mr Andrew Lim (Allen & Gledhill LLP) (d) Mr Adrian Chan (Lee & Lee) (e) Mr Antony Lee (HSBC) (f) Ms Dawn Tan (Nicholas & Tan Partnership LLP) (g) Ms Wan Wai Yee (SMU) (h) Mr Wendell Wong (Drew & Napier LLC)
Secretariat:
• Ms Gloria Lim (MinLaw) • Ms Chua Minyi (MinLaw) • Mr Kelvin Caleb (MinLaw)

Annex B
B-1
Methodology to Determine UK Law School Rankings
1 The 4th Committee has taken every effort to devise a fair and thorough methodology to determine the relative standings of UK law schools from England, Wales and Northern Ireland, although inevitable limitations must be acknowledged. This ranking process is meant to serve the purpose of determining the top UK universities under the review to be conducted by SILE, which would then be included as UK OSUs in the Schedule. 2 The methodology involves the use of 3 publicly available rankings of UK law schools compiled by UK institutions – The Guardian University Guide (“The Guardian Guide”), The Times Good University Guide (“The Times Guide”) and the Complete University Guide (“the CUG”). The details and background on how the rankings in each of these publications are constructed is contained in Appendix 1 to this annex.40 For each of these publications, the 3 most recent rankings released (ie, the rankings for the period 2011–2013) were taken into consideration.41 This allows a longer-term view of the quality of a university, which cannot be captured in a single year’s ranking, to be taken into account for assessment. It also minimises error due to yearly fluctuations, and places value on consistency in quality through maintaining good rankings over the years.
3 The broad methodology is summarised as follows:
a. For the rankings published in The Guardian Guide, The Times Guide and the CUG, ranking data for 2011, 2012 and 2013 was collected. b. All the Scottish universities were removed from the 2011-2013 rankings in the 3 publications so that only universities from England, Wales and Northern Ireland were included in the rankings. Each of the universities was then re-ranked among the English, Welsh and Northern Irish universities, and was taken into consideration in our analysis provided it fell into one of the following categories (see Appendix 2 to this Annex for the collated rankings):
40 The 4th Committee considered two other ranking publications (namely, The Times Higher Education University Guide and the Quacquarelli Symonds World University Rankings), but found them unsuitable as the former did not maintain a ranking of law schools, while there were issues with the accuracy and reliability of the latter.
41 Ideally, 5 years’ worth of data should have been used, but data more than 3 years back (ie, for 2010 and 2009) was not easily available. The 4th Committee hence proceeded to use the data from the past 3 years as it was felt that the omission of data for 2009 and 2010, while not desirable, was not crucial to the analysis. However, future Committees could consider utilising a larger set of data spanning a greater number of years if available.

Annex B
B-2
i. Universities ranked among the top 25 in any one of the publications in 2013;42 and
ii. UK OSUs, including those outside the top 25 in all the publications in 2013.
c. Each of the 9 computed rankings for each university (ie, for each year within each publication for the period 2011–2013) was then taken into consideration to derive an overall composite score for each university. The universities were then ranked according to this composite score to yield the final rankings which SILE may use for its selection of the top UK universities to be included in the list of UK OSUs in the Schedule.
4 In the third step of the methodology described in para 3(c) above, the 4th Committee conceived of 2 ways of calculating the composite scores. Both methods were adopted to ensure sufficient robustness in the conclusion and lead to similar rankings of the top UK universities to be included in the list of UK OSUs in the Schedule. The 2 methods are documented in detail in Section (A) below for completeness, and as an illustration and reference for SILE and future Committees on the Supply of Lawyers. 5 The results and final rankings of the universities are contained in Section (B) below.
(A) The “Equal-Weighted Average” and the “Weighted Average” Methods 6 The first method which the 4th Committee considered involved taking a plain average of a university’s rankings over the period 2011–2013 within each publication, and then averaging the rankings across the 3 publications to give that university’s composite score. This is termed the “Equal-Weighted Average” method as it gives equal weight to a university’s rankings in all 3 publications, regardless of the year of the ranking. 7 As an illustration of this method, consider the following rankings of Queen Mary, which has a composite score of 6.7 under the “Equal-Weighted Average” method:
Publication 2013 2012 2011 “Equal-Weighted Average” The Guardian Guide 5 4 3 (5+4+3)/3 = 4 The Times Guide 7 7 6 (7+7+6)/3 = 6.7 The CUG 14 7 7 (14+7+7)/3 = 9.3
Composite Score (4+6.7+9.3)/3 = 6.7 Table B1: Illustration of “Equal-Weighted Average” Method
42 The one exception is the University of York’s Law School, which was not included in our analysis. It was ranked 5th by The Guardian Guide in 2013, but was not ranked in that guide (nor in The Times Guide and the CUG) in 2012 and 2011.

Annex B
B-3
8 The other method which the 4th Committee considered was the “Weighted Average” method, in which greater weight or importance was placed on a university’s rankings in more recent years in the derivation of that university’s composite score. The weight placed on the rankings in the years 2013:2012:2011 was in the ratio 3:2:1 (or 50%, 33.3% and 16.7% respectively in percentage terms), ie, greatest weight was placed on the most recent ranking in 2013, and least weight was placed on the 2011 ranking. 9 As an illustration of this method, consider the following rankings of Queen Mary, which has a composite score of 7.2 under the “Weighted Average” method:
Publication Year (Weight)
“Weighted Average” 2013 (50%)
2012 (33.3%)
2011 (16.7%)
The Guardian Guide 5 4 3 (50% x 5) + (33.3% x 4) +
(16.7% x 3) = 4.3 The Times Guide 7 7 6 (50% x 7) + (33.3% x 7) +
(16.7% x 6) = 6.8
The CUG 14 7 7 (50% x 14) + (33.3% x 7) + (16.7% x 7) = 10.5
Composite Score (4.3+6.8+10.5)/3 = 7.2 Table B2: Illustration of “Weighted Average” Method
10 There are merits to each of the above methods, both of which deserve due consideration. The “Equal-Weighted Average” method places equal emphasis on a university’s performance throughout the period 2011–2013, and hence, that university’s historical performance (which may have contributed to its “reputation”) is given equal importance as its most recent year’s performance. This ensures that even if minor fluctuations occur in a university’s most recent ranking, its overall results would not be substantially affected as equal consideration is given to its rankings in all 3 years. 11 In contrast, the merit of the “Weighted Average” method is that it places greater emphasis on the recent rankings of a university, and recognises recent performance as a better indicator of the present quality of that university than rankings further back in the past. This is intuitive as the standards of universities change over time, and one view is that we should not evaluate the present quality of a university based on rankings released a number of years ago, when that university’s standing may in fact have changed substantially since then; any such change would be reflected in the university’s more recent rankings.
12 Using the above example of Queen Mary, it can be seen that the “Equal-Weighted Average” method gives it a better (ie, higher) composite score and ranking than the “Weighted Average” method. This is because the university has been performing less well in recent years, and more weight is placed on these recent poor rankings under the “Weighted Average” method, resulting in a lower composite score and rank. Hence, if it is assessed that a university is on a downward trend and that its more recent rankings

Annex B
B-4
accurately capture a true deterioration in standards, then the “Weighted Average” method would be right in “penalising” that university.
13 However, if it is assessed that a university’s poorer performance in 2013 (as compared to its performance in 2012 and 2011) is not indicative of its long-term standing and quality, then the “Equal-Weighted Average” method would be right in according equal weight to that university’s rankings in all 3 years, hence granting Queen Mary in the example above a higher composite score and rank.
14 Given the merits of both approaches, the 4th Committee used both methods in its analysis to obtain a robust result.
(B) Composite Rankings of UK Universities
15 Tables B3 and B4 below show the rankings of UK universities under the “Equal-Weighted Average” method and the “Weighted Average” method respectively. Both methods yield roughly similar rankings for the top UK universities. The detailed rankings of each UK university over the period 2011–2013 in each publication and its “Equal-Weighted Average” and “Weighted Average” scores can be found in Appendix 2 to this Annex.
Composite Rank University
“Equal-Weighted Average” Score Composite
Score The Guardian
Guide
The CUG
The Times Guide
1 Oxford 1.33 2.00 1.00 1.44 2 Cambridge 2.00 1.67 2.00 1.89 3 LSE 4.33 2.67 3.33 3.44 4 UCL 3.67 3.67 3.67 3.67 5 Queen Mary 4.00 9.33 6.67 6.67 6 Durham 9.67 5.33 6.33 7.11 6 Nottingham 10.67 5.67 5.00 7.11 8 KCL 7.67 8.33 10.0 8.67 9 Newcastle 8.67 13.00 9.33 10.33
10 Warwick 8.00 14.00 14.00 12.00 11 Bristol 15.33 9.00 13.00 12.44 12 Birmingham 15.33 12.00 10.33 12.56 13 Lancaster 11.33 12.33 15.00 12.89 14 Reading 20.33 12.33 9.33 14.00 15 Southampton 15.67 14.00 16.00 15.22 16 SOAS 8.33 17.00 21.33 15.56 17 Leicester 15.00 18.00 14.67 15.89 18 Exeter 15.67 17.67 16.00 16.44 19 Sussex 16.67 16.67 18.00 17.11 20 Kent 21.00 23.67 19.33 21.33 Manchester 25.67 18.00 23.00 22.22 Leeds 26.00 20.33 21.33 22.56 Cardiff 24.33 24.00 19.67 22.67 University of East Anglia 23.67 26.67 22.67 24.33 Queen’s, Belfast 29.00 22.00 25.33 25.44 Sheffield 37.00 23.33 25.67 28.67 Buckingham 20.67 39.67 29.00 29.78

Annex B
B-5
Liverpool 35.00 27.67 27.67 30.11 Hull 40.00 27.00 25.67 30.89 Brunel 39.67 26.33 29.00 31.67 Surrey 34.00 29.67 38.00 33.89 Glamorgan 42.33 47.00 43.33 44.22 Bournemouth 37.67 54.67 60.67 51.00 Anglia Ruskin 45.33 69.00 73.33 62.56
Table B3: Rankings According to “Equal-Weighted Average” Method 16 Table B4 below shows the results under the “Weighted Average” method:
Composite Rank University
“Weighted Average” Score Composite
Score The
Guardian Guide
The CUG
The Times Guide
1 Oxford 1.33 2.17 1.00 1.50 2 Cambridge 2.17 1.50 2.00 1.89 3 LSE 3.67 2.50 3.17 3.11 4 UCL 3.67 3.83 3.83 3.78 5 Durham 8.00 5.17 6.17 6.44 6 Nottingham 10.67 5.83 5.00 7.17 7 Queen Mary 4.33 10.50 6.83 7.22 8 KCL 8.17 8.00 10.00 8.72 9 Newcastle 8.83 14.17 9.17 10.72
10 Warwick 7.67 13.67 13.17 11.50 11 Lancaster 11.17 12.00 14.00 12.39 11 Reading 18.33 10.17 8.67 12.39 13 Bristol 15.67 9.17 13.67 12.83 14 Birmingham 16.33 11.83 11.00 13.06 15 Southampton 15.33 14.17 16.67 15.39 16 SOAS 9.17 17.33 20.50 15.72 17 Leicester 14.67 19.00 16.00 16.56 18 Sussex 16.00 16.67 17.50 16.72 19 Exeter 17.00 17.33 16.83 17.06 20 Cardiff 23.33 22.33 18.33 21.33 Kent 20.83 23.67 19.67 21.39 Leeds 26.33 20.83 20.33 22.50 Manchester 26.67 18.83 23.50 23.00 Queen’s, Belfast 24.83 21.33 24.67 23.50 University of East Anglia 24.50 26.50 23.83 24.94 Sheffield 36.33 23.67 25.33 28.44 Buckingham 21.50 40.83 28.83 30.39 Liverpool 36.67 27.50 29.17 31.11 Hull 40.50 27.83 26.00 31.44 Brunel 39.50 27.00 29.00 31.83 Surrey 31.33 29.67 38.17 33.06 Glamorgan 43.00 47.17 40.50 43.56 Bournemouth 44.67 54.00 62.67 53.78 Anglia Ruskin 36.67 70.17 73.50 60.11
Table B4: Rankings According to “Weighted Average” Method

Appendix 1 to Annex B
Appendix 1 to Annex B – Page 1
Background of Ranking Publications
Table B1-1: Summary of Factors used in Ranking Publications
1. THE CUG
(A) Background 1.1 The CUG is compiled by Mayfield University Consultants (“Mayfield”). Mayfield was founded in 1997 to compile, first, the University League Tables and then the GUG together with The Times until 2007, when their collaboration ended. Its team comprises current and former university administrators who specialise in the compilation of UK academic league tables. The data used in the CUG is all derived from public domain sources such as the Higher Education Statistics Agency (“HESA”) or the Research Assessment Exercise conducted by the higher education funding councils. The CUG has been produced in association with either The Daily Telegraph or The Independent since 2007.
(B) Methodology 1.2 The Subject League Tables in the CUG are calculated using 4 measures: • Student satisfaction;
Ranking Criteria The Guardian Guide The Times Guide The CUG
Student satisfaction (all 3 use the UK National Student Survey (“the National Student Survey”))
Yes. Yes. Yes.
Research quality Yes. Yes. Yes.
Entry standards Yes. Yes. Yes.
Graduate prospects / career after 6 months Yes. Yes. Yes.
Spending per student
Yes. The Guardian looks at spending per subject per student as well as academic spending in general per student.
Yes. The Times looks at facilities spending as well as library and computing spending.
Yes. Broken down into academic services spending and facilities spending.
Value-added score
Yes. This is unique to The Guardian. It compares students’ individual degree results with their entry qualifications.
No. No.
Student-to-staff ratio Yes. Yes. Yes. Honours No. Yes. Yes. Completion No Yes. Yes.
Appendix 1 to Annex B
Appendix 1 to Annex B – Page 2
• Research assessment; • Entry standards; and • Graduate prospects.
1.3 Student satisfaction is a measure of the views of students on the teaching quality at the university concerned. The data comes from the National Student Survey, which is a survey of final-year students. The CUG warned of possible bias in the data which it used since student satisfaction is a measure of subjective student opinion and not a direct measure of quality. One example which the CUG cited was possible bias due to the effect of prior expectations. 1.4 Research assessment measures the average quality of research in the university concerned. The data comes from the Research Assessment Exercise undertaken by 3 higher education funding councils (namely, the Higher Education Funding Council for England, the Scottish Higher Education Funding Council and the Higher Education Funding Council for Wales). Each department of the university concerned was assessed on the proportion of research undertaken in each of 4 categories on a scale of 1 to 4. The quality of research in each category was then assessed on a scale of 1 to 4, and a “grade point average” was assigned and then averaged according to the number of staff in each department. Research intensity was also measured by calculating the proportion of staff undertaking research that contributed to the research quality rating. The CUG warned that since universities could decide which staff’s research they wanted to submit for assessment purposes, universities might omit otherwise good researchers in order to get the best possible quality profile. 1.5 Entry standards measure the average Universities and Colleges Admissions Service (“UCAS”) tariff score of new students. The data comes from HESA. Each student’s examination results are converted to a numerical score and added up before being averaged. The CUG warned that entry standards might be depressed at some universities which have an “access policy” such as affirmative action.
1.6 Graduate prospects measure the employability of a university’s graduates. The data comes from HESA. The total number of graduates who take up employment or further studies is divided by the total number of graduates employed at a known destination expressed as a percentage. Only employment in an area that normally recruits graduates is taken into account.
1.7 All 4 measures are given equal weight in the CUG. In order to qualify for inclusion, a university has to have data for at least 2 of the 4 measures. In some cases where no data was available, the final score was calculated based on the data which the CUG had. For the measure “graduate prospects”, 2 years of data were used to make the data more reliable.
2. THE GUARDIAN GUIDE
(A) Background 2.1 The Guardian Guide is published by the UK newspaper, The Guardian, one of the biggest newspapers in the UK. The guide is compiled by consultancy firm

Appendix 1 to Annex B
Appendix 1 to Annex B – Page 3
Intelligent Metrix on behalf of The Guardian using data collected by HESA and the National Student Survey.
(B) Methodology 2.2 The Guardian Guide uses 8 indicators of performance to measure and rank universities in each subject that they teach. The 8 indicators and their respective weightings are as follows: 2.3 Teaching (10%) is assessed using data from the National Student Survey, with final-year first-degree students being asked the extent to which they agreed with 4 positive statements regarding their experience of teaching in the department overseeing the subject concerned.
2.4 Assessment and feedback (10%) refers to students’ perception of how their efforts were assessed and how helpful any feedback was. The data was also taken from the National Student Survey.
2.5 Overall satisfaction (5%) refers to students’ overall satisfaction with the quality of the course. The data is likewise taken from the National Student Survey.
2.6 Value-added scores (15%) are calculated based on a student’s entry qualifications and the degree classification which that student receives at graduation. A probability of achieving a certain degree classification is given to each student based on his entry qualifications. If a student earns a good degree classification despite having a low probability of attaining such a degree classification, he scores higher points. 2.7 Student-to-staff ratio (15%) compares the number of staff teaching a subject with the number of students studying it, with a low student-to-staff ratio treated positively for ranking purposes. Only staff who spend a significant portion of their time teaching are counted; this includes researchers who also teach, but excludes those who do research only.
2.8 Expenditure per student (15%) measures the amount spent by the university concerned on each subject taught divided by the number of students taking the subject in question, plus the amount which that university spends on academic services (eg, library and computing facilities) divided by its total number of students. It excludes spending on academic staff.
2.9 Entry scores (15%) measures the entry qualifications of students by using the total UCAS tariff scores of first-year first-degree full-time students taking the various subjects taught by the university concerned and averaging these tariff scores by the total number of first-year first-degree full-time students.
2.10 Career prospects (15%) measure the employability of graduates by looking at the proportion of graduates who find graduate-level employment or study full-time within 6 months of graduation.
2.11 Universities are only included in The Guardian Guide if no more than 2 of the above indicators are missing and if the department overseeing the subject concerned

Appendix 1 to Annex B
Appendix 1 to Annex B – Page 4
teaches at least 35 full-time undergraduates. The above indicators are all assigned standardised scores.
3. THE TIMES GUIDE
(A) Background 3.1 The Times Guide is published by The Times newspaper. It has been published since 1992.
(B) Methodology 3.2 The Times Guide does not explain how its subject rankings are calculated. However, it uses 8 measures to rank universities overall. The 8 measures are: 3.3 Student satisfaction scores are calculated based on the views of final-year students expressed in the National Student Survey. The scores cover 6 aspects: teaching, assessment and feedback, academic support, organisation and management, learning resources and personal development as well as overall satisfaction. The scores are then averaged.
3.4 Research quality is measured using data from the Research Assessment Exercise conducted by the higher education funding councils. Work rated 4* (world-leading) is weighted a factor of 3, and work rated 3* (internationally excellent), a factor of 1. Research rated 2* or 1* is not given any score. Academic staffing data from HESA is used to estimate the number of staff in each university whose research is eligible to be taken into account for assessment purposes. 3.5 Entry standards are measured based on data from HESA. They consist of the average UCAS tariff score of new students under 21 who took “A”- and “AS”-levels, Highers, Advanced Highers and equivalent qualifications. 3.6 Student-to-staff ratio measures the average number of students to each member of academic staff, excluding those members of staff who do purely research. 3.7 Services and facilities spending is assessed based on data from HESA, averaged over 2 years. It measures the amount spent by the university concerned on each student in respect of facilities, including library and computing resources. 3.8 Completion measures the percentage of students expected to finish their studies (or transfer to another institution), as published in HESA’s performance indicators for each university. 3.9 Good honours measures the percentage of graduates achieving a first- or an upper second-class degree. The data is taken from HESA. 3.10 Graduate prospects measure the percentage of graduates who take up graduate-level employment or pursue further studies within 6 months of graduation. The data comes from HESA.

Appendix 2 to Annex B
Appendix 2 to Annex B – Page 1
Detailed Rankings of UK Law Schools from 2011–2013 (The Guardian Guide) University
Rank “Equal-Weighted Average” Score
“Weighted Average” Score 2013 2012 2011
Oxford 1 2 1 1.33 1.33 LSE 2 5 6 4.33 3.67 Cambridge 3 1 2 2.00 2.17 UCL 4 3 4 3.67 3.67 Queen Mary 5 4 3 4.00 4.33 Durham 6 7 16 9.67 8.00 Warwick 7 8 9 8.00 7.67 KCL 8 10 5 7.67 8.17 Newcastle 9 9 8 8.67 8.83 Nottingham 10 12 10 10.67 10.67 Lancaster 11 11 12 11.33 11.17 SOAS 12 6 7 8.33 9.17 Southampton 13 19 15 15.67 15.33 Sussex 14 18 18 16.67 16.00 Leicester 15 13 17 15.00 14.67 Bristol 16 16 14 15.33 15.67 Queen’s, Belfast 17 27 44 29.00 24.83 Reading 17 15 29 20.33 18.33 Birmingham 19 14 13 15.33 16.33 Exeter 19 17 11 15.67 17.00 Kent 21 20 22 21.00 20.83 Cardiff 22 23 28 24.33 23.33 Buckingham 23 21 18 20.67 21.50 Anglia Ruskin 24 36 76 45.33 36.67 University of East Anglia 25 26 20 23.67 24.50 Surrey 26 34 42 34.00 31.33 Leeds 29 22 27 26.00 26.33 Manchester 30 23 24 25.67 26.67 Liverpool 34 47 24 35.00 36.67 Sheffield 37 33 41 37.00 36.33 Anglia Ruskin 24 36 76 45.33 36.67 Glamorgan 53 25 49 42.33 43.00 Bournemouth 63 29 21 37.67 44.67 Thames Valley - - 23 - - Hull 39 45 36 40.00 40.50 Brunel 31 56 32 39.67 39.50
Table B2-1: Rankings of UK Law Schools by The Guardian Guide
(The CUG) University
Rank “Equal-Weighted Average” Score
“Weighted Average” Score 2013 2012 2011
Cambridge 1 2 2 1.67 1.50 Oxford 2 3 1 2.00 2.17 LSE 3 1 4 2.67 2.50 UCL 4 4 3 3.67 3.83 Durham 5 5 6 5.33 5.17 Nottingham 6 6 5 5.67 5.83

Appendix 2 to Annex B
Appendix 2 to Annex B – Page 2
KCL 7 9 9 8.33 8.00 Reading 8 8 21 12.33 10.17 Bristol 9 10 8 9.00 9.17 Birmingham 10 15 11 12.00 11.83 Lancaster 11 13 13 12.33 12.00 Warwick 12 16 14 14.00 13.67 Southampton 13 17 12 14.00 14.17 Queen Mary 14 7 7 9.33 10.50 Exeter 15 21 17 17.67 17.33 Sussex 16 18 16 16.67 16.67 Newcastle 17 12 10 13.00 14.17 Queen’s, Belfast 18 26 22 22.00 21.33 Cardiff 19 24 29 24.00 22.33 Manchester 20 19 15 18.00 18.83 SOAS 21 11 19 17.33 17.33 Leeds 22 20 19 20.33 20.83 Leicester 23 14 17 18.00 19.00 Kent 24 23 24 23.67 23.67 Sheffield 25 22 23 23.33 23.67 Liverpool 26 30 27 27.67 27.50 University of East Anglia 27 25 28 26.67 26.50 Surrey 30 29 30 29.67 29.67 Buckingham 46 34 39 39.67 40.83 Anglia Ruskin 74 66 67 69.00 70.17 Glamorgan 51 40 50 47.00 47.17 Bournemouth 53 54 57 54.67 54.00 Thames Valley - - 79 - - Hull 29 28 24 27.00 27.83 Brunel 28 27 24 26.33 27.00
Table B2-2: Rankings of UK Law Schools by the CUG
(The Times Guide) University
Rank “Equal-Weighted Average” Score
“Weighted Average” Score 2013 2012 2011
Oxford 1 1 1 1.00 1.00 Cambridge 2 2 2 2.00 2.00 LSE 3 3 4 3.33 3.17 UCL 4 4 3 3.67 3.83 Nottingham 5 5 5 5.00 5.00 Durham 6 6 7 6.33 6.17 Queen Mary 7 7 6 6.67 6.83 Reading 8 8 12 9.33 8.67 KCL 9 12 9 10.00 10.00 Newcastle 9 9 10 9.33 9.17 Warwick 11 15 16 14.00 13.17 Birmingham 12 11 8 10.33 11.00 Lancaster 12 15 18 15.00 14.00 Cardiff 14 23 22 19.67 18.33 Bristol 15 13 11 13.00 13.67 Sussex 16 19 19 18.00 17.50 Southampton 17 18 13 16.00 16.67 Exeter 18 17 13 16.00 16.83

Appendix 2 to Annex B
Appendix 2 to Annex B – Page 3
Kent 19 22 17 19.33 19.67 Leeds 19 20 25 21.33 20.33 Leicester 21 10 13 14.67 16.00 Queen’s, Belfast 22 28 26 25.33 24.67 SOAS 23 13 28 21.33 20.50 Manchester 24 24 21 23.00 23.50 Sheffield 25 25 27 25.67 25.33 University of East Anglia 27 21 20 22.67 23.83 Buckingham 30 26 31 29.00 28.83 Liverpool 31 30 22 27.67 29.17 Surrey 39 37 38 38.67 38.17 Anglia Ruskin 75 71 74 73.33 73.50 Glamorgan 39 35 56 43.33 40.50 Bournemouth 68 58 56 60.67 62.67 Thames Valley – – – – – Hull 26 27 24 25.67 26.00 Brunel 29 29 29 29.00 29.00
Table B2-3: Rankings of UK Law Schools by The Times Guide

Annex C
C-1
Key Statistical Findings of MinLaw’s Study on the Supply and Demand of Legal Professionals in Singapore
Executive Summary
1 This Annex summarises the key statistical findings of MinLaw’s study on the supply and demand of legal professionals in Singapore (“the Study”). The Study was completed in January 2012 and subsequently revised in April 2012. The views of MTI and MOM were also sought for the Study.43
2 The Study builds on the work of the 3 previous Committees on the Supply of Lawyers, and seeks to project the supply of and demand for legal professionals and the subset of practising lawyers over a 10-year period to 2020. It develops an economic model, which builds upon growth projections for the different sectors of the economy that contribute to the demand for legal services, to provide insight into the key factors influencing the market for legal professionals and lawyers as well as to conduct scenario analysis.
3 On the supply side, the main sources are local law students, Singaporean OSU law graduates who sit for the Part A Conversion Bar Examination (“Part A candidates”) and foreign lawyers. The main uncertainty affecting supply is the degree of attrition due to the outflow of lawyers from practice. The Study projects that there will be about 5,636–7,101 lawyers in 2020 (depending on projected attrition rates).
4 On the demand side, the main sources are population growth and the growth of other economic sectors. Key uncertainties in demand projections include the rate of growth of productivity and legal services exports. Factoring in different sets of assumptions, the projected demand for legal services in 2020 will call for 5,865–8,887 lawyers.
5 Together, the demand and supply projections point to a range of outcomes, from a surplus of 1,236 lawyers in 2020 to a shortage of 3,251 lawyers. In a moderate scenario, the Study anticipates a supply of 6,369 lawyers in 2020, representing a shortage of 500 lawyers from the 6,869 required to meet the projected demand for legal services. There may be a case for policy intervention to increase supply so as to better match demand.
* * * * *
43 The data used in the Study included statistics provided by AGC, SAL, SILE and the Supreme Court.

Annex C
C-2
Aim of the Study
1 The Study discusses the broad supply and demand situation for legal professionals as well as the subset of lawyers in Singapore.
Definition of “legal professionals” and “lawyers”
2 The Study relies on the same definition of “legal professionals” as that used by the 3rd Committee. Besides lawyers holding PCs, in-house counsel, Legal Service officers, members of the Judiciary and law academics in Singapore are also included in the definition of “legal professionals”. The term “lawyers”, when used by itself in the Study, refers to lawyers holding PCs and foreign lawyers registered with AGC.
Methodology of the Study
3 The market for legal professionals in Singapore is closely linked to the supply of and demand for the legal services that these workers provide. Therefore, the Study considered the sources of demand for legal services to model the market for legal professionals. A graphical representation of the model used for the Study is illustrated by Figure 1. In line with the 3rd Committee’s report, the Study utilised data from 2005 to 2010 to project 10 years forward to 2020.
Figure 1: Model of Demand for and Supply of Legal Professionals and Legal Services

Annex C
C-3
4 The 3rd Committee’s report used 2 measures to project the demand for legal professionals: (a) the LPPR; and (b) the contribution by legal services to Singapore’s GDP (Gross Domestic Product). Based on these measures, a targeted benchmark and the requisite number of legal professionals to meet the benchmark were decided upon. This model was not based on projected demand as it had no economic basis, and was instead a subjective opinion of where Singapore should be in “x” years’ time.
Forecasting
5 The Study uses trend analysis to predict the future demand for and supply of legal professionals, lawyers and legal services. The limitations of such an analysis are in addressing discontinuities that may arise as a result of policy changes or shifts in the external environment, and the reliability of historical data in making extrapolations. Where such limitations exist, the Study has relied on deductive reasoning to make the forward projections.
Projections of Supply of Lawyers and Legal Professionals
6 The major components of the supply of lawyers and legal professionals are local law students, Part A candidates and foreign lawyers, while the main source of uncertainty in the supply projections arises from attrition due to the outflow of lawyers from practice. Details of these components can be found in Appendix 1 to this Annex.
7 By aggregating the projections of the supply of legal professionals, the estimated stock of legal professionals can be expected to increase by 41% from 6,928 in 2010 to 9,771 in 2020 (see Figure 2 below). Within this stock of legal professionals, because of the intra-profession movement of lawyers out of practice, the number of lawyers in 2020 may vary between 5,636 and 7,101, and may make up between 58% and 73% of the pool of legal professionals respectively – a fairly broad range that likely spans the gamut of probable outcomes.

Annex C
C-4
Figure 2: Projected Supply and Composition of Legal Professionals
8 The Study represents the range of supply projections via the following mini-scenarios, labelled 1 to 3 below:
Supply of Legal Professionals in 2020: 9,771 Supply Mini-scenario
Construct Number of lawyers in 2020
1 (High lawyer supply)
No change in proportion of lawyers among active SAL members
7,101
2 (Moderate lawyer supply)
Proportion of active SAL active members who leave practice decreases by 1 percentage point annually
6,369
3 (Low lawyer supply)
Proportion of active SAL members who leave practice decreases by 2 percentage points annually
5,636
Table 1: Projections for Supply of Legal Services (in terms of number of Lawyers)
Key Variables of Demand for Legal Services
9 The main sources of demand for legal services are population growth and the growth of other economic sectors. Within the timeframe of the Study, the expected variance in these sources of demand is relatively small. Details of these components can be found in Appendix 1 to this Annex.
10 In the analysis, it was found that the model and the projected outcomes – whether a surplus or a shortage of lawyers and legal professionals would exist in 2020 – were highly sensitive to several key factors, such as the rate of growth of productivity and legal services exports. To highlight the sensitivity of the model to these factors, these factors were incorporated into several mini-scenarios for the demand projections.
5,4255,7396,0596,5796,615
6,9287,2847,6998,009
8,3508,5718,8459,0109,2779,524
9,771
0
2,000
4,000
6,000
8,000
10,000
12,000
14,000
2005 2006 2007 2008 2009 2010 2011 2012 2013 2014 2015 2016 2017 2018 2019 2020
Supply and Composition of the Legal Profession
Foreign Lawyers PC HoldersOther Active SAL Members Number of WaiversActive legal professionals

Annex C
C-5
Projected export growth
11 In the Study, the average economic supply-side real growth rate was estimated at 3% for the period 2011–2020, and was based on the assumption that the domestic demand for legal services would grow at this rate. By allowing demand for legal services exports to grow at a different rate from domestic demand for legal services and varying the projections accordingly, a range of growth rates for the overall legal services market was derived.
12 Three estimates of the rate of real growth of legal services exports were used: (a) 3%; (b) 6%; and (c) 12%.44 These give rise to overall real growth rates of the legal services sector of 3%, 3.7%, and 5.7% respectively. Given a moderate 6% growth rate for legal services exports, the share of such exports as a proportion of the total demand for legal services would increase from 22.3% in 2010 to 27.7% in 2020. This is a reasonable projection given the efforts to liberalise Singapore’s legal sector and tap on the global demand for legal services. (See Figure 3 below for the graph of growth in the value added by legal services (“VA from legal services”), assuming a 6% growth rate for legal services exports, a 3% growth rate for domestic legal services and a 2% growth rate for productivity; and Table 2 below for the overall legal services growth rate under different export growth assumptions.)
Figure 3: Total VA from Legal Services in Singapore
44 The Study believes, however, that the real growth in the export of legal services will likely be stronger than the domestic growth in legal services, but perhaps at a slightly lower rate than the 8.8% annual nominal growth experienced from 2005–2009 due to the moderated global economic outlook in the coming years. The Study considers a 6% growth in exported legal services to be the most likely medium-term projection.
$951
$1,217
$1,635
$235
$350
$626
$1,186
$1,566
$2,261
19.8% 22.3%27.7%
0.0%
10.0%
20.0%
30.0%
40.0%
50.0%
60.0%
70.0%
80.0%
90.0%
100.0%
$0
$500
$1,000
$1,500
$2,000
$2,500
2005 2006 2007 2008 2009 2010 2011 2012 2013 2014 2015 2016 2017 2018 2019 2020
VA from Legal Services (at 2009 prices)
VA from Export of Legal Services (6% annual growth rate)VA from Domestic Consumption of Legal Services (3% annual growth)Total VA from Demand of Legal ServicesExports as % of Total VA
In Million

Annex C
C-6
Growth rate of legal services exports 3% 6% 12%
Overall legal services growth rate 3% 3.7% 5.7%
Range of growth rates from 2010–2020 3% 3.6–3.9% 5–6.4%
Proportion of legal services exported in 2020 22.3% 27.7% 39.9%
Table 2: Relationship between growth in legal services exports and overall legal services growth rate
Productivity
13 The key link between manpower and output is productivity. With greater productivity, fewer legal professionals are required to supply a given amount of legal services. The relationship between manpower and output can be represented by the formula below:
(1 + % Change in VA) = (1 + % Change in productivity)45 x (1+ % Change in workforce)
14 This means that for any given projected degree of growth in VA from legal services, any increase in productivity would lead to a decrease in the number of legal professionals needed to generate the same output. By dividing changes in productivity into projections of the size of the legal sector, the demand for legal services in terms of legal professionals rather than monetary value can be obtained, which is easier to work with intuitively, given that the existing policy levers are for legal professional numbers. The Study found that the projections of supply shortages or surplus were highly sensitive to forecasts of productivity. For example, if productivity gains averaged just 3% and if the growth rate of legal services exports equalled the domestic demand growth rate of 3% per annum, then no additional lawyers would be required to accommodate the increase in demand. 15 Using the same method that the 3rd Committee employed to estimate productivity growth rates, average productivity growth rates of between 1% and 3% for the period 2010–2020 were obtained and assessed to be a reasonable range that reflected the range of possible outcomes.46 In order to cover a broader range of outcomes, the lowest productivity growth estimate of 1% annually was paired with the fastest rate of growth in VA from legal services
45 Includes increases in productivity due to accumulation of capital resources.
46 The 3rd Committee used implicit assumptions of productivity growth rates. Based on the projections of the number of lawyers required in the various scenarios, the Study concluded that in the scenario where growth in VA from legal services was estimated at 5.5%, the implied productivity growth rate would be 2.5%; in the scenario where growth in VA from legal services was projected at 14.8%, the implied productivity growth rate would be 6.4%. These implied productivity growth rates were effectively a fraction of the corresponding projections for growth in VA from legal services: the higher the projected VA growth rate, the higher the implied productivity growth in that scenario. From Table 2, given the projections for the growth in VA from legal services of between 3% and 5.7%, applying the same ratios gives implied productivity growth rates of between 1% and 3%.

Annex C
C-7
of 5.7%, and the highest productivity growth estimate of 3% annually was paired with the slowest rate of growth in VA from legal services of 3%.
Projections of Demand for Legal Services and Lawyers
Assessment of current gap
16 The model used in the Study provides an estimate of the relative growth of the supply of and demand for lawyers over the forecast period. Whether there will be a projected supply gap or surplus in 10 years’ time depends on an assessment of whether a gap or a surplus currently exists in the present market. 17 As at 2010, the market might not have been and probably was not in equilibrium. The Study assessed that the labour market as a whole47 was experiencing a relative shortage of lawyers. The unemployment rate of law graduates was consistently lower, sometimes significantly lower, than the unemployment rates of all other degree holders (see Figure 4 below). There was also anecdotal feedback pointing to a current shortage of lawyers, and using data from a survey conducted of law firms in 2010, the Study observed that about 23% of the law firms in Singapore wished to hire more lawyers.48 Based on data from the same survey, the Study was able to go further and aggregate the hiring gaps from law firms of different sizes, and estimated that the supply gap in 2010 was about 936 lawyers.49 This will form the data set that will be used in the various scenarios.
47 This reflects all employment opportunities available to law graduates, and not only opportunities in the field of law.
48 On average, firms which reported a shortfall in hiring wished to hire about 1–3 more lawyers per firm.
49 This is the number of additional lawyers that medium-sized firms indicated they would like to hire. The Study notes that large firms and sole proprietorships were generally able to hire their desired number of lawyers.

Annex C
C-8
Figure 4: Unemployment Rates by Tertiary Qualification
18 The range of demand projections via the following mini-scenarios, labelled A to C below, can be represented as follows:
Table 3: Projections for Demand for Legal Services (in terms of number of Lawyers)
Constructing Scenarios for Supply of and Demand for Lawyers
19 The 2 sets of mini-scenarios were combined – A to C for demand (see Table 3 above), and 1 to 3 for supply (see Table 1 above) – to obtain a total of 9 possible scenarios (see Table 4 below, as well as Figures 5 and 6 below). The net effect (assuming a current shortage of lawyers) is a broad range of possible outcomes in 2020, ranging from a shortage of 3,251 lawyers (scenario A3) to a surplus of 1,236 lawyers (scenario C1); these projections bracket the range of probable outcomes.
0
2
4
6
8
10
12
2000 2001 2002 2003 2004 2005 2006 2007 2008 2009 2010 2011
Une
mploy
men
t Rate (%
)Unemployment Rates by Tertiary Qualification
All residents All Degree HoldersLaw Humanities & Social SciencesMass Comm & Information Sciences Business & Administration
Demand Mini-scenario Annual growth rates for legal services
Lawyers needed in 2020
Lawyers needed in 2020 (with supply gap of 936 lawyers in 2010)
A (High demand)
Productivity: 1% Exports: 12% Domestic: 3%
7,469 8,887
B (Moderate demand)
Productivity: 2% Exports: 6% Domestic: 3%
5,765 6,869
C (Low demand)
Productivity: 3% Exports: 3% Domestic: 3%
4,929 5,865

Annex C
C-9
Projections of Net Lawyer Surplus in 2020
Demand for Lawyers (current shortage assumed)
A (8,887)
B (6,869)
C (5,865)
Supp
ly o
f Law
yers
1 (7,101) -1,785 +233 +1,236
2 (6,369) -2,518 -500 +504
3 (5,636) -3,251 -1,233 -229
Table 4: Manpower scenarios in 2020 under various supply and demand projections
Figure 5: Supply of and Demand for Lawyers (Equilibrium at 2010)
4,9295,765
7,469
4,929
7,101
6,3695,636
6,928
9,771
0
2,000
4,000
6,000
8,000
10,000
12,000
2005 2006 2007 2008 2009 2010 2011 2012 2013 2014 2015 2016 2017 2018 2019 2020
Supply of and Demand for Lawyers(Equilibrium at 2010)
Projected Demand for Lawyers (Growth: 3% Exports, 3% Domestic, 3% Productivity Rate)
Projected Demand for Lawyers (Growth: 6% Exports, 3% Domestic, 2% Productivity Rate)
Projected Demand for Lawyers (Growth: 12% Exports, 3% Domestic, 1% Productivity Rate)
Supply of Lawyers ‐ % of Active SAL Members who are PC holders are maintained
Supply of Lawyers ‐ % of Active SAL Members who are PC holders decrease at 1% per year
Supply of Lawyers ‐ % of Active SAL Members who are PC holders decrease at 2% per year
Supply of Legal Professionals
No of lawyers

Annex C
C-10
Figure 6: Supply of and Demand for Lawyers (With Supply Gap in 2010)
Key Statistical Conclusions
20 The Study is of the view that whether intervention to calibrate the supply of legal professionals is necessary hinges most significantly on the estimates of: (a) the rate of growth of legal services exports; and (b) the rate of productivity growth in the legal services sector. Within the pool of lawyers, a critical factor is the projected “leakage” of lawyers out of practice. 21 In a scenario with moderate demand growth50 and moderate attrition of practising lawyers,51 the Study projects that the growth in the supply of lawyers to 6,369 (out of a pool of 9,771 legal professionals) in 2020 will fall short of the demand for 6,869 lawyers.
50 Moderate demand growth refers to a 2% productivity growth rate, a 3% domestic growth rate and a 6% export growth rate in the legal services sector.
51 Moderate attrition of practising lawyers refers to an annual movement of 1% of PC holders from practice into other types of legal work.
5,865
5,865
6,869
8,887
4,929
7,101
6,3695,636
6,928
9,771
0
2,000
4,000
6,000
8,000
10,000
12,000
2005 2006 2007 2008 2009 2010 2011 2012 2013 2014 2015 2016 2017 2018 2019 2020
Supply of and Demand for Lawyers (With Supply Gap in 2010)
Projected Demand for Lawyers (Growth: 3% Exports, 3% Domestic, 3% Productivity Rate)
Projected Demand for Lawyers (Growth: 6% Exports, 3% Domestic, 2% Productivity Rate)
Projected Demand for Lawyers (Growth: 12% Exports, 3% Domestic, 1% Productivity Rate)
Supply of Lawyers ‐ % of Active SAL Members who are PC holders are maintained
Supply of Lawyers ‐ % of Active SAL Members who are PC holders decrease at 1% per year
Supply of Lawyers ‐ % of Active SAL Members who are PC holders decrease at 2% per year
Supply of Legal Professionals
No of lawyers

Annex C
C-11
22 The Study also explored alternative, extreme scenarios. In an optimistic scenario, it is possible that the supply of lawyers could increase to 7,101 by 2020, assuming no change in the proportion of legal professionals choosing practice over other types of legal work. When coupled with lower-end estimates of demand growth which call for 5,865 lawyers by 2020,52 a surplus of 1,236 lawyers results. 23 In the other extreme, demand growth which calls for 8,887 lawyers by 2020 could outstrip a dwindling supply of lawyers of 5,636 in 2020, worsening the current shortage from an estimated 936 in 2010 to 3,251 in 2020.53 24 The Study provides an overview of the spread of possible outcomes for the legal profession and deals with supply-side intervention considerations. Supply-side interventions in the market for legal professionals generally take the form of manpower planning through enrolment targets and quotas that affect the overall supply of legal professionals, and the introduction of foreign lawyers, which is driven by the market. In view of the long time lag necessitated by industrial policy54 intervention, any inferred supply gap cannot be closed through looking at enrolment targets and quotas alone in the short to medium term. 25 Further, profession-wide manpower planning does not address the misallocation of legal talent across different areas of practice. Alterations in the overall flow of lawyers have limited utility in addressing shortages in any particular sub-sector. For example, findings from the Legal Census 2009 indicate that manpower shortage is not equally distributed among law firms of different sizes: medium-sized law firms experienced an acute shortfall in hiring from 2008 to 2009, whereas large law firms did not. A possible explanation is that large law firms may be in a better position to offer potential employees a range of higher-value corporate deals, training opportunities and networks. As such, the Study concludes that a targeted approach may be more effective to address sub-sector shortages.
52 Assuming productivity growth of 3%, and growth of legal services exports at the national average growth rate of 3%.
53 Assuming productivity growth of 1% and growth of legal services exports of 12%.
54 “Industrial policy” refers to government policy used to guide the total strategic effort of a country and influence the development of different sectors in the economy. This may be in the form of supply-side interventions such as manpower planning through enrolment targets and quotas that affect the overall supply of legal professionals.

Appendix 1 to Annex C
Appendix 1 to Annex C- Page 1
Assumptions used in the Study
1 In the course of the Study, some assumptions and forecasts had to be made to derive meaningful results. These, and the process by which they were derived, are documented below.
Assumptions used in Supply Projections of Legal Professionals
2 NUS Law and SMU Law Graduates. NUS Law and SMU Law undergraduate admissions, and also NUS graduate LLB admissions were taken into account in ascertaining the likely supply of legal professionals. The Study forecasted that these would remain at the same levels over the period 2011–2020. To derive the output of law graduates, the Study assumed that there would be a 5% attrition rate (within the course of study). The Study did not consider the output from post-graduate law programmes (eg, LLM programmes) as this could result in double-counting post-graduate students who had also obtained their LLB degrees in Singapore.
3 Law Graduates from OSUs. Law graduates from OSUs have to pass the Part A Conversion Bar Examination to qualify for admission to the Singapore Bar. There was a sharp spike in the number of successful Part A candidates from 87 in 2008 to 200 in 2009. This declined to 177 in 2010. In the forecast till 2020, the Study extrapolated a gradually slowing decline that would eventually reach a steady state of about 140 annually.
4 New SAL Members. Although the number of graduating law students and the number of new SAL members in a particular year do not always correspond due to some graduates choosing to join SAL at a later stage, the numbers are probably correlated over the long run. New SAL members are modelled as the output from NUS Law, SMU Law and OSUs, minus an attrition rate of 15% between graduating and registering with SAL.
5 The projected 15% attrition rate between graduating and registering with SAL is taken to be the average of the attrition rates from 2001 to 2010 as there is no clear trend. Those lawyers who do not join SAL are assumed to have left the law and become engaged in non-law related work.
6 SAL Members. There are several types of SAL members: Ordinary members, SAL members on waiver, SAL associate members and associate students. Assuming that lawyers retire at 65 on average, the Study projected that at least 10% of these lawyers – or about 75 a year – would retire in each year leading up to 2015. Thereafter, the Study provided for 100 retirements a year. The data on the distribution of lawyers by age was obtained from the 3rd Committee’s report and extrapolated to 2010.

Appendix 1 to Annex C
Appendix 1 to Annex C- Page 2
7 Members on Waiver. The projected number of SAL members on waiver was obtained by projecting the trend of SAL members on waiver as a percentage of the total number of SAL members. This percentage has been gradually rising, and the Study extrapolated the trend (gradually increasing but at a decreasing rate) from 27% in 2010 to 30% in 2020. Excluding members on waiver gives rise to the classification of “Active SAL Members (excluding waivers)”. 8 SAL Associate Members and Associate Students. The number of SAL associate members and associate students was estimated for 2011 using data from 2000 to 2010, and then held at a constant level for the period 2011–2020 as there was no discernible trend in the numbers.
9 SAL Ordinary Members. SAL ordinary members comprise PC holders and corporate counsel.
10 Foreign Lawyers. The stock of foreign lawyers has been steadily increasing over the years. Given the emphasis on liberalising Singapore’s legal sector and positioning Singapore as a legal hub, the Study extrapolated an increasing trend for the period 2011–2020.
11 Active SAL Members – Stock of Legal Professionals. This is the final measure of legal professionals that is used. It is obtained by summing all the above categories. A summary is shown below.
Inflow/Outflow Comments
SMU Law and NUS Law Graduates
Attrition within undergraduate studies: 5%. Estimate based on historical trends. This reflects law students who drop out of or fail their law degrees.
+ Law Graduates from OSUs
–
= New SAL Members Attrition between graduating and joining SAL: 15%. Estimate based on historical trends. This reflects law graduates who leave the law altogether.
- Retiring SAL Members Attrition of SAL members leaving SAL altogether (ie, retirement): 75 per year (2010–2015), 100 per year (2016–2020). Estimated based on analysis of age composition of SAL members.
- SAL Members on Waiver
30% of SAL members are projected to be on waiver in 2020. Estimate based on extrapolating a slight increase in the current proportion (ie, 27%). This reflects legal professionals who choose to leave the law altogether.
= Active SAL Members – - SAL Associate
Members and Associate Students
–

Appendix 1 to Annex C
Appendix 1 to Annex C- Page 3
= Adjusted SAL Members
–
+ Foreign Lawyers – = Total Supply of Legal
Professionals –
Table 5: Calculation of the Supply of Legal Professionals
Assumptions used in Supply Projections of Lawyers
12 In addition to the supply of legal professionals, the Study also separately looked specifically at the supply of lawyers – ie, PC holders and foreign lawyers. In the analysis of the stock of lawyers (ie, legal professionals holding PCs), who are a subset of the stock of legal professionals, these additional assumptions were used.
13 Extrapolation of supply of PC Holders. In the 3 scenarios analysing the supply of and demand for PC holders, the number of PC holders was extrapolated by manipulating the number of PC holders as a percentage of all active SAL members. Over the period 2004–2010, this percentage was 66%. The 3 scenarios involved:
a. % of active SAL members who are PC holders is maintained at 64%;
b. % of active SAL members who are PC holders decreases at 1% per year to 57% in 2020. This represents a moderate increase in the proportion of lawyers becoming corporate counsel; and
c. % of active SAL members who are PC holders decreases at 2% per year to 48% in 2020. This represents a drastic increase in the proportion of lawyers becoming corporate counsel.
Assumptions used in Demand Projections
14 Ideally, the Study should have explicitly considered each sector of the economy differently, and should have imposed different growth rates of their VA according to their growth prospects and targets. It would be instructive to consider both the aggregate demand for legal services, as well as the segmented demand for areas of practice outside of the “permitted areas”, ie, the portion of the market that is still closed economically or “ring-fenced”, corresponding to the more “domestic” areas of practice.
15 However, as the required data was not available, the Study used the figure of the total VA from legal services (corrected for imports) to obtain a proxy for the aggregate demand for legal services. This aggregate demand was segmented according to overseas and domestic demand – ie, overseas demand for legal services exports, and domestic demand for legal services.
16 Overseas Demand – VA from Exports of Legal Services. VA from legal services exports was extrapolated according to 3 different projected annual growth rates for these exports of 3%, 6%

Appendix 1 to Annex C
Appendix 1 to Annex C- Page 4
and 12% respectively in the scenario analysis. These figures represent different growth rates of overseas demand for domestically-produced legal services.
17 Domestic Demand – VA from Domestically-Consumed Legal Services. VA from domestically-consumed legal services was obtained by subtracting VA from legal services exports (which are consumed overseas) from VA from legal services, and then adding imports of legal services (which represent unmet domestic demand). The annual growth rate of this was taken to be 3% as the medium-term estimate of Singapore’s economic growth.
18 The sum of the 2 above components gave a proxy for the aggregate demand for legal services in Singapore, which the Study was then able to project and compare to the supply projections.
19 Productivity Gains. The Study also factored in productivity gains in the legal industry ranging from 1% to 3% in the various scenarios.
Other Assumptions used in the Study
20 Where data was provided over a 12-month period that did not coincide with a calendar year, the data was treated as data for the year which covered the majority of the data points.
21 All figures used were nominal (taken at current market prices) due to the lack of suitable deflators.