report of the board and financial statements - · pdf filecircle limited circle house ... 30...
TRANSCRIPT

You can view our policies, publications and your tenant handbook
on our website. If you would like this document in large print, audio,
Braille, an alternative format or different language contact us on
020 7447 3035.
Circle Limited
Circle House
1-3 Highbury Station Road
London N1 1SE
Tel: 020 7288 4000
Minicom: 020 7288 4007
www.circle.org.uk
Follow us on twitter.com/circlehousing
Printed by award winning printer SPM Print who hold the environmental accreditation ISO 14001 and are FSC certified. The material used is Chromomat which is 15% recycled and the inks used are all vegetable oil based.
Report of the Board and Financial Statements Year ended 31 March 2011
Industrial & Provident Societies Registration No. 27604RTenant Services Authority Registration No. LH4046

01 02Circle Anglia Group Annual Report and Financial Statements 2010 / 11
The day-to-day activity of Circle is carried out by Executive Directors on behalf of the Board.
Board Members
As at 31 March 2011 the Board of Circle Anglia Limited comprised:
Sir Robin Young Group Chair and independent member
Mark Rogers Group Chief Executive
Robert Burgin Independent member
Martin Shaw OBE Independent member
Jane Clarkson JP Independent member
Murray Foster South Anglia Housing Limited
Baroness Jones of Whitchurch Circle 33 Housing Trust Limited
Simon Braid Independent member - appointed 1 June 2010
Tania Brisby Independent member - appointed 29 March 2011
Jane Gurney-Read Circle Living Limited - appointed 1 January 2011
Brenda Reynolds Roddons Housing Association – appointed 1 January 2011
The following served as Board members, but resigned during the year to 31 March 2011:
Alan Catterick Mole Valley Housing Association - resigned 1 January 2011
Nicola Lucking Wherry Housing Association - resigned 30 June 2010
Michael Webber Russet Homes Limited - resigned 30 September 2010
Group Executive Officers
Mark Rogers Group Chief Executive
Calum Mercer Executive Director (Finance)
Andy Doylend Executive Director (Operations)
David Williams Executive Director (Strategy and New Business) – resigned 28 April 2011
Sarah Trota Executive Director (People and Business Transformation)
Contents02 Board members and Group executive officers
03-04 Stock profile
05-06 Chairman’s and Chief Executive’s introduction
07-14 Operating and financial review
15-20 Financial review
21-22 Board statement on the system of internal control
24 Statement of Board’s responsibilities
25 Report of the independent auditors
26-27 Group and Association income and expenditure accounts
28-29 Group and Association balance sheets
30 Group cashflow statement
31-78 Notes to the financial statements

03 04Circle Anglia Group Annual Report and Financial Statements 2010 / 11
TT
IS
C
S
CH
H
1
2
3 8
4
11
1014 16
18
1715
13
12
976
5
19
20
21 22
23
25
24
Stock profileA. Mercian Housing AssociationOwns and manages 3,400 properties in the greater Birmingham area
B. Rockingham ForestWorking together with Rockingham Forest Housing Association to provide new homes in Northamptonshire
C. Roddons Housing AssociationManaging nearly 3,800 properties including 14 sheltered schemes in Cambridgeshire
D. Wherry Housing AssociationOwns and manages over 7,000 homes in Norfolk, Suffolk, Lincolnshire and Cambridgeshire
E. South Anglia HousingOwns and manages over 7,000 homes across 26 local authorities in Hertfordshire, Bedfordshire and Essex
F. Circle 33, Merton Priory Homes and Old Ford
Circle 33 owns over 15,000 homes across London and in 48 local authority areas
Merton Priory Homes manages and owns over 9,000 properties in South West London
Old Ford Housing Association manages and owns over 5,000 properties in East London - Tower Hamlets and Havering
G. Mole Valley Housing AssociationManages 3,800 homes including 17 sheltered schemes in Surrey
H. Russet Manages over 6,600 properties in Kent
A
F
D
B
G H
E
C
1. Ealing2. Harrow3. Brent4. Hammersmith5. Barnet6. Kensington & Chelsea7. Westminster8. Camden9. City10. Islington11. Haringey12. Enfield13. Hackney14. Tower Hamlets15. Waltham Forest16. Newham17. Redbridge18. Barking & Dagenham19. Havering20. Merton21. Wandsworth22. Lambeth23. Southwark24. Lewisham25. Croydon
03 04

05 06Circle Anglia Group Annual Report and Financial Statements 2010 / 11
Following our six years of fast expansion it has been really important to us to set our strategy and focus for the future. This will ensure that we are offering the best service to our customers, offering the best value for money, and are set up in the best way to do this.
We are now more than twice the size we were when we came into being in 2005 thanks to mergers, stock transfers and organic growth. In new areas of growth we continue to prosper too – our telecare provider, Invicta, now has nearly 100,000 customers.
Reinforcing our dedication to reaching as many people as we can, enhancing Life Chances has been embedded as our mission. This mission is clear and will remain. Whatever the economic and political circumstances, we will provide our customers with the best homes, services and care and support while building sustainable and cohesive communities. Together with my Board, I am committed to supporting our management team to deliver to those most in need of our services.
Sir Robin YoungChairman
We are living in times of complex economic and external environments. It is imperative that we become even more rigorous in our approach and squeeze every penny to deliver the best possible service to more customers. We have brought down our operating cost by £4m in the last year alone, and have clear plans in place to improve on this. While the growth figure may seem impressive, now is the time to make our size work for us. This year we have got out business transformation programme underway. We have a new procurement team in place, to ensure that we have the best deal in place for every partner. Alongside this we are reviewing our whole repairs and maintenance strategy and as
well as saving more than £100million over ten years believe that our new approach will make us the best in the sector for customer loyalty. Circle is determined to be nimble and ready to adapt so that we can help more people reach their potential.
It’s been important for me to be involved in government and sector discussions about the new direction in policy. At the core of our conversations has been the desire to make sure that we have the freedom and flexibility to put our customers first and to maintain our financial stability.
Without doubt one of our biggest achievements last year was a financial one. We raised £124 million through a Bond Tap in November, and were the first housing group to go to investors
following the Comprehensive Spending Review. Our
treasury team was awarded a special commendation
at the Association of Corporate Treasurers deal of the year for their fantastic work on this.
The Bond Tap means we can invest in regenerating our communities, enhancing the value so we can enhance the lives of current and future residents.
It also shows that we have a good reputation for being a financially strong organisation that remains focussed on its social purpose. This is really important because we can only continue to help people if we have the money to back our plans up.
The demand for social housing and support services remains high and will continue to grow. Our regeneration plans to will not only enhance the lives of our residents, but the wider community and increase value so that we can invest more back in. I thank all of our partners for your support in our vision, and look forward to working with you in the years ahead.
Mark RogersGroup CEO
Introduction from the Chair Introduction from the CEO
“Enhancing Life Chances has been truly embedded as our mission”
“We’ve been making sure that
our customers are at the heart of every decision we make”
It’s been a strong year for us with good customer satisfaction results and robust finances. Our new partners Merton Priory Homes and Mercian have been successfully integrated into the Group and we have forged ahead with major regeneration programmes making an incredible difference to the communities we work in. In the Spring we changed our name to Circle, to reflect our national reach and high number of homes in London.
This has been an unprecedented year of change for housing. From the way new affordable homes will be delivered, to the announcement of reforms to welfare benefit and a further change of regulatory approach.

07 08Circle Anglia Group Annual Report and Financial Statements 2010 / 11
Principal ActivitiesCircle Anglia Limited Circle Anglia Limited is a Registered Provider (RP) of social housing, which trades as Circle Housing Group. Its principal activities are to enhance the Life Chances of our customers, mainly through the ownership, management and development of social and other housing, as well as the provision of care and support and other services.
About our housing stock
Circle provides a wide range of affordable housing choices – including general needs, supported and sheltered – together with care and support packages that enable more vulnerable residents to maintain their tenancies and lead more independent lives. We have created a commercial approach to development to help fund an increased affordable housing programme, with income from a combination of grant, use of our own resources and profits from property disposals. This includes developing properties for private sale, shared ownership and market rent, providing leasehold management services and including commercial premises as part of some mixed tenure schemes.
We provide homes in over 90 local authority areas, but with 70% of the properties within 13 local authority areas.
The partners who are part of the Group are as follows:
Circle 33 Housing Trustprovides homes in North and East London. The main Local Authorities are Islington, Waltham Forest, Haringey, Hackney and Camden.
Old Ford Housing Associationthe transfer in 2008 from Tower Hamlets Council of the Parkside Estate and the Mardyke Estate (now renamed Orchard Village) from Havering Council.
South Anglia Housing Associationprovides homes in Hertfordshire, Bedfordshire and Essex and was originally formed from the stock transfer of East Hertfordshire Council.
Wherry Housing Associationwas formed from the transfer of housing from Broadland District Council and now provides homes in Norfolk, Suffolk, Cambridgeshire, Lincolnshire and Northamptonshire.
Roddons Housing Associationprovides homes in Fenland in Cambridgeshire and was a stock transfer in 2008.
Mole Valley Housing Associationis a stock transfer organisation providing homes in Mole Valley in Surrey. It became a partner in the Group in 2008.
Russet Homesalso joined the Group in 2008 and provides homes in Tonbridge and Malling in Kent.
Mercian Housing Associationjoined the group on 1 October 2009 providing homes in the West Midlands. Key Local Authorities include Birmingham, Walsall, Coventry and Nuneaton and Bedworth.
Merton Priory Homeswas formed form a stock transfer from Merton Council on 22 March 2010 when it joined the Group. It provides homes in Wimbledon, Mitcham and Morden in South West London.
Circle Living is the Group’s commercial service par tner, providing proper ty management services for the Groups’ homeownership and intermediate homes.
Invicta Telecareis the largest independent provider of Telecare services in the UK, delivering a real lifeline and peace of mind to over 95,000 people, helping them to remain living independently in their own homes.
Circle Supportsupports a wide range of needs in our Sheltered and Supported housing services, Tenancy Sustainment services, Family Mediation and in our Alone in London service which helps young people under the age of 26 to solve housing problems and learn to live independent lives.
Operating and financial review
Housing Stock Owned
0
5,000
10,000
15,000
20,000
25,000
£00
0s
30,000
35,000
40,000
45,000
50,000
General Needs Supported Housing Shared Ownership Other Social Housing Non Social Housing
Type
2009
2010
2011
23%14%
42%12%
9%42%
27%14%
38%11%
10%
76%
6%
10%4%4%
2010 201082%
5%5%
5%3%
2011 2011
Social Housing
Supoprting People Contract Income
First Tranche Sales
Other Social Housing Activities
Non Social Housing Activities
Management
Service charges
Maintenance and repairs
Depreciation And Impairments
Other costs
Loan Repayment Profile £M
1.3
25.6
354.5
1,226.5Within 1 year
Between 1 and 5 years
Between 5 and 10 years
Over 10 years
2011 2010 2009
Social housing rented 50,540 50,218 41,022
Shared ownership 3,947 3,829 2,830
Keyworker 289 245 250
Leaseholder 5,499 5,441 2,565
Staff accommodation 65 66 34
Non-social rented 2,672 2,312 1,116
Other non-social 84 163 248
Garages 1,532 1,541 1,541
Total stock owned 64,628 63,815 49,606
Accommodation managed on behalf of others 291 552 199
Less stock owned but not managed (3,541) (4,555) (4,687)
Total stock managed 61,378 59,812 45,118
Properties owned by Leamington Waterfront LLP are shown as properties under construction and Your Lifespace Limited is shown as completed properties in stock and work in progress (Note 13).
Circle’s management stock profile at 31 March 2011 is disclosed below:
9 10Circle Anglia Group Annual Report and Financial Statements 2010 / 11
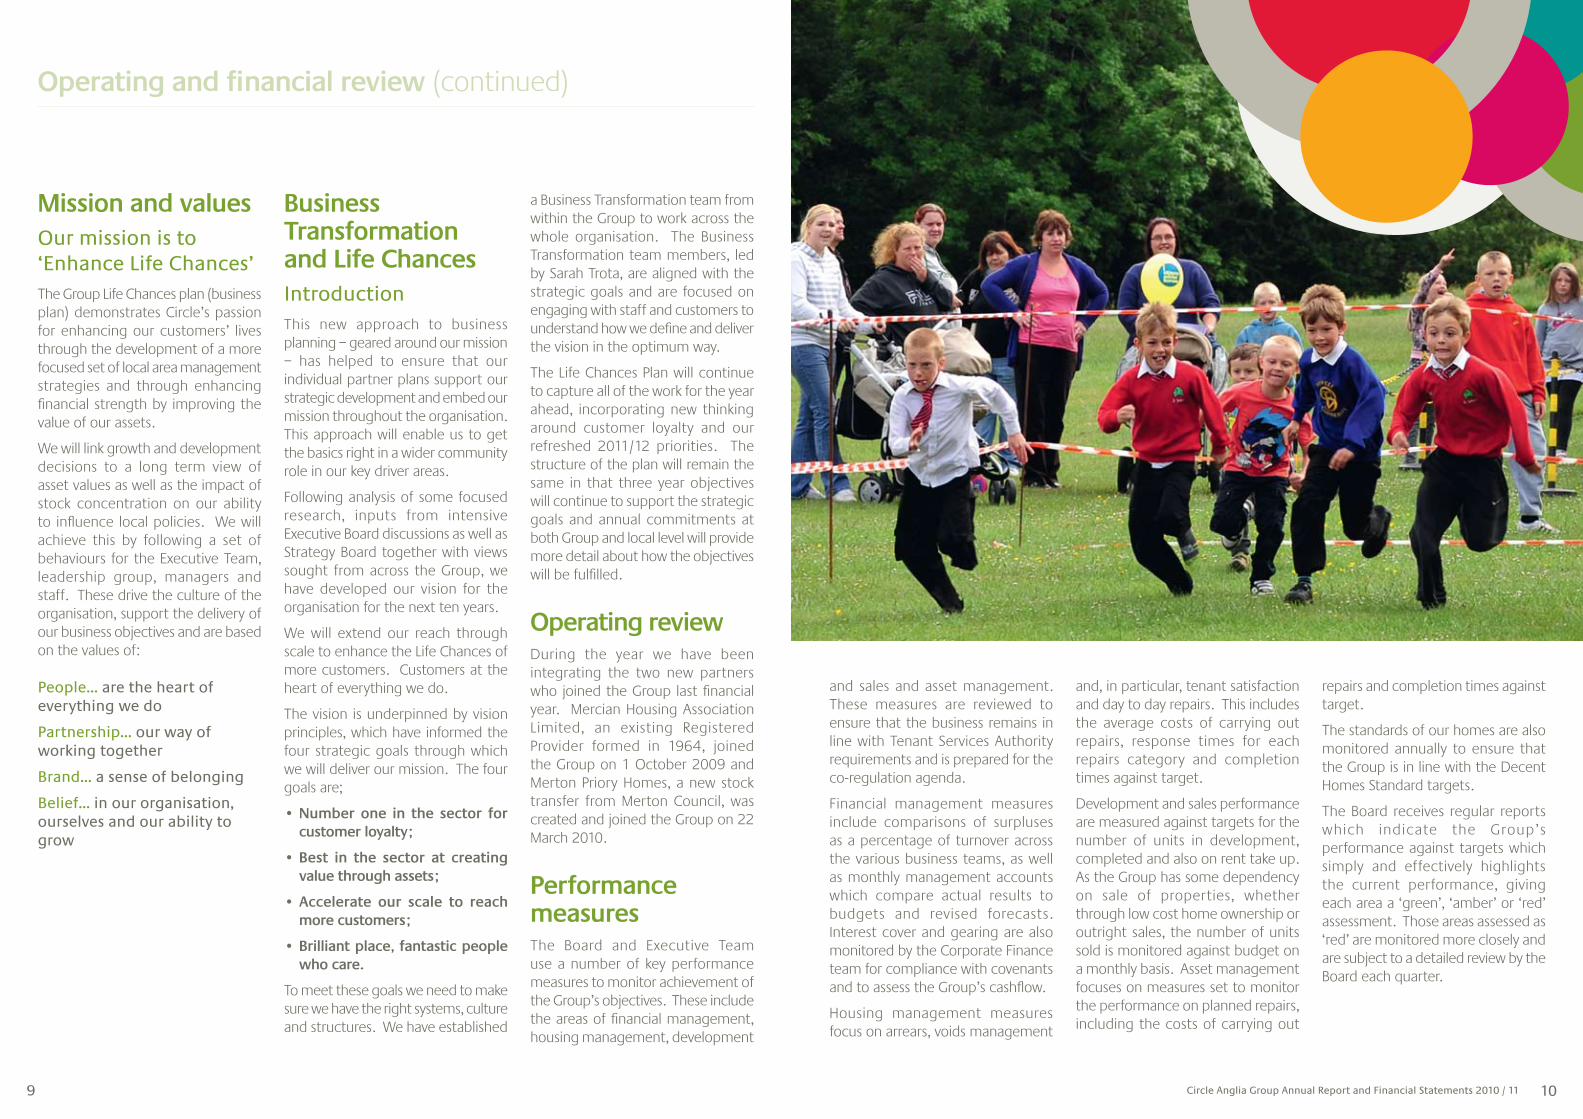
Mission and valuesOur mission is to ‘Enhance Life Chances’The Group Life Chances plan (business plan) demonstrates Circle’s passion for enhancing our customers’ lives through the development of a more focused set of local area management strategies and through enhancing financial strength by improving the value of our assets.
We will link growth and development decisions to a long term view of asset values as well as the impact of stock concentration on our ability to influence local policies. We will achieve this by following a set of behaviours for the Executive Team, leadership group, managers and staff. These drive the culture of the organisation, support the delivery of our business objectives and are based on the values of:
People… are the heart of everything we do
Partnership... our way of working together
Brand... a sense of belonging
Belief… in our organisation, ourselves and our ability to grow
Business Transformation and Life ChancesIntroductionThis new approach to business planning – geared around our mission – has helped to ensure that our individual partner plans support our strategic development and embed our mission throughout the organisation. This approach will enable us to get the basics right in a wider community role in our key driver areas.
Following analysis of some focused research, inputs from intensive Executive Board discussions as well as Strategy Board together with views sought from across the Group, we have developed our vision for the organisation for the next ten years.
We will extend our reach through scale to enhance the Life Chances of more customers. Customers at the heart of everything we do.
The vision is underpinned by vision principles, which have informed the four strategic goals through which we will deliver our mission. The four goals are;
• Number one in the sector for customer loyalty;
• Best in the sector at creating value through assets;
• Accelerate our scale to reach more customers;
• Brilliant place, fantastic people who care.
To meet these goals we need to make sure we have the right systems, culture and structures. We have established
a Business Transformation team from within the Group to work across the whole organisation. The Business Transformation team members, led by Sarah Trota, are aligned with the strategic goals and are focused on engaging with staff and customers to understand how we define and deliver the vision in the optimum way.
The Life Chances Plan will continue to capture all of the work for the year ahead, incorporating new thinking around customer loyalty and our refreshed 2011/12 priorities. The structure of the plan will remain the same in that three year objectives will continue to support the strategic goals and annual commitments at both Group and local level will provide more detail about how the objectives will be fulfilled.
Operating reviewDuring the year we have been integrating the two new partners who joined the Group last financial year. Mercian Housing Association Limited, an existing Registered Provider formed in 1964, joined the Group on 1 October 2009 and Merton Priory Homes, a new stock transfer from Merton Council, was created and joined the Group on 22 March 2010.
Performance measuresThe Board and Executive Team use a number of key performance measures to monitor achievement of the Group’s objectives. These include the areas of financial management, housing management, development
and sales and asset management. These measures are reviewed to ensure that the business remains in line with Tenant Services Authority requirements and is prepared for the co-regulation agenda.
Financial management measures include comparisons of surpluses as a percentage of turnover across the various business teams, as well as monthly management accounts which compare actual results to budgets and revised forecasts. Interest cover and gearing are also monitored by the Corporate Finance team for compliance with covenants and to assess the Group’s cashflow.
Housing management measures focus on arrears, voids management
and, in particular, tenant satisfaction and day to day repairs. This includes the average costs of carrying out repairs, response times for each repairs category and completion times against target.
Development and sales performance are measured against targets for the number of units in development, completed and also on rent take up. As the Group has some dependency on sale of properties, whether through low cost home ownership or outright sales, the number of units sold is monitored against budget on a monthly basis. Asset management focuses on measures set to monitor the performance on planned repairs, including the costs of carrying out
repairs and completion times against target.
The standards of our homes are also monitored annually to ensure that the Group is in line with the Decent Homes Standard targets.
The Board receives regular reports which indicate the Group’s performance against targets which simply and effectively highlights the current performance, giving each area a ‘green’, ‘amber’ or ‘red’ assessment. Those areas assessed as ‘red’ are monitored more closely and are subject to a detailed review by the Board each quarter.
Operating and financial review (continued)

11 12Circle Anglia Group Annual Report and Financial Statements 2010 / 11
As shown in the table, the majority of KPIs have improved from last year as steady progress has been maintained across the Group.
Operating costs per unit owned have decreased form £3,028 in 2009/10 to £2,956 in 2010/11 which equates to a cost saving of £4.6 million. Over the same time period, the operating margin of the RPs (excluding Merton Priory Homes) has improved from 32% to 35%.
Building new homesCircle is a preferred development partner of the Homes and Communities Agency (HCA). The Group outperformed its 2010/11 targets creating 954 new homes in the year, including 211 for other housing associations. There were 2,911 properties in development at the year end.
The Group is in discussions with the HCA in respect of the Affordable Rent proposals, which will result in additional development opportunities being funded through rental income generated from Affordable Rents charged at up to 80% of market rent levels. Detailed plans have been drawn up and the impact on the long-term financial plan and on affordability for potential customers have been presented and agreed by the Board. Further work on the implementation of the Affordable Rent tenure is underway with the first lettings expected to be taking place after September 2011.
The development of new properties for social use is supported by grants and the sale of properties developed for outright sale and low cost shared ownership. The difficulties in the housing and mortgage markets and the potential impact on the development programme have been considered as part of the normal financial planning process. This includes stress testing the financial plans to ensure that they can cope with significantly lower volumes of sale as well as house prices falls. This results in adjustments to the development programme such as changing the timing of developments and the mix of tenures (for example intermediate or market rent) which have reduced expected sales proceeds.
2010/11 2009/10
Rent collected as % of rent due 100.3% 99.8%
Current tenants arrears as % of rent roll 3.3% 3.3%
Average weekly gross rent £73 - £101 £72 - £100
Average re-let turnaround times (days) 15.6 – 36.9 17.3 – 39.7
Dwellings vacant and available for let 0.3% 0.6%
Dwellings vacant but unavailable for rent 0.5% 0.7%
Emergency repairs completed in target 98.2% 97.7%
Urgent repairs completed in target 98.0% 96.6%
Routine repairs completed in target 96.4% 93.2%
Average SAP rating 63 – 78 61 – 80
% of homes failing Decent Homes Standard 3.9% 8.3%
% of tenants satisfied with overall service 81.5% 82.0%
Note: The ranges in the table reflect the results of the individual RPs
Value for MoneyOur aim is to deliver excellence in all of our services to drive up customer satisfaction with an eye on continuous improvement through targeting, monitoring and feedback. This will ensure that we can prioritise and make best use of our resources at all times and re-invest savings from each service area to deliver more or
better and thereby enhance the Life Chances of our residents. We are committed to achieving good value for money and central to this is that there should be no diminution of quality of our service delivery.
To further embed the culture of value for money throughout the group we have introduced VfM reviews in each business and are implementing
registers to capture the achievements. In order for us to more successfully deliver value for money, we will have a robust methodology for reviewing reliable and timely data for each defined service area. We will be able to undertake frequent internal benchmarking exercises amongst our nine RPs, which will be used to inform action plans for improvement.
The following table shows the operating performance of the nine partner RPs that make up the direct housing management operations of Circle.
Operating and financial review (continued)
Corporate Social ResponsibilityOur approach to corporate social responsibility plays an important part in the way the Group conducts its business. We aim to conduct ourselves in a professional, fair, ethical, legal and sustainable manner in our relationships with all stakeholders, including employees, customers, suppliers, business partners, the community and other stakeholders in the housing sector. We encourage our suppliers to implement a similar approach.
Our charitable foundation, Circle Anglia Foundation Limited, reflects our commitment to making an impact in communities in which we operate at a grass roots level. All profits from the commercial parts of the business are invested into the Foundation.
The Group has adopted a sustainability action plan which outlines what Circle is doing to provide sustainable, desirable and affordable homes. It also shows how we are addressing the issues of increasing energy prices and rising environmental standards.
Investment in housing stockThe Group had previously identified and planned the work required to ensure that all tenanted properties meet the Government’s Decent Homes Standard by December 2010 and this target was achieved. The exceptions to this are the more recent stock transfers where extended deadlines have been agreed. Plans are in place in Mole Valley, Parkside (part of Old Ford) and Merton Priory Homes to fulfil this.
Circle brought forward the timing of stock surveys to ensure up to date information was held on the Group’s properties. This helps the planning of reactive and planned maintenance works and ensures that there is sufficient provision within financial plans to deliver the required improvements. A programme of refreshing this data is being instigated to ensure that the Group continues to understand the requirements for its properties.

13 14Circle Anglia Group Annual Report and Financial Statements 2010 / 11
Main influences and risksThe key influences on the Group’s operating and financial performance are as follows:
• Meet ing customer serv ice aspirations, which include measuring and improving performance against Audit Commission Key Lines of Enquiry and involving our residents.
• The requirement to provide value for money, including general needs rents which comply with the Tenant Services Authority (TSA) rent restructuring agenda, demonstrat ing cont inuous improvement in output per unit cost across the Group.
• The impact of economic uncertainty and housing market difficulties on the availability and terms of funding for RPs and for those seeking mortgages and the potential impact on the financial plans of the Group that lending restrictions would result in.
• The provision of an effective maintenance service to all of the RPs including meeting the defined Decent Homes Standards by the agreed deadlines.
• The impact of cuts at Local Authority level on our support and care services and our community programmes that help us in our mission of Enhancing Life Chances.
The Group reviews its risks on a regular basis and has in place a risk management strategy which provides a guide for Board members and managers on the Group’s approach
to risk management, and a Group Risk Map is maintained. Through the process of regular review those risks which present the greatest threats to the Group are identified and reported to the Group Audit Committee.
Risk management supports the achievement of business objectives by:
• Enhancing the qual i ty of decision-making, planning and prioritisation.
• Contributing to effective allocation of resources.
• Protecting and enhancing the Group’s assets and its reputation.
• Providing a Business Assurance framework to demonstrate the effective management of risk and operation of controls.
Other risks that are most likely to influence future performance are:
• Economic factors that could influence the viability of the Group e.g. higher interest and borrowing costs, VAT increases, falling sales values.
• The fu l l impact of the Comprehensive Spending Review and subsequent changes to rent regimes are still uncertain. The full impact of welfare benefit reforms will also need to be monitored and managed as our tenants face ongoing financial pressures.
• A significant part of the Group’s development programme is in relation to low cost shared ownership homes. A further downturn in the market may impact on the demand for these properties and on the price that can be achieved.
• Expertise and accurate research is required to ensure that schemes developed are viable and meet the needs of the community within which they are located.
• The ability to drive the intended savings and increase in customer satisfaction through planned changes to our procurement and repairs & maintenance delivery mechanisms.
Operating and financial review (continued)

15 16Circle Anglia Group Annual Report and Financial Statements 2010 / 11
Group turnover excluding joint ventures has increased by 12.7% (2010:12.7%) Cost of sales and operating costs have increased by 10.7% (2010: 0.6%) primarily as a result of increased maintenance costs.
The accounts for 2010/11 include full year results for Merton Priory Homes and Mercian Housing Association whereas the prior year includes only 9 days for Merton Priory Homes and six months for Mercian.
Social housing turnover has grown by 22.0% (2010: 11.8%) to £264.8 million (2010: £217.1 million).
The operating surplus from social housing activities before depreciation and impairment has increased by 28.3% (2010: 115.7%).
Income of £16.5 million (2010: £28.5 million) and operating costs of £15.7 million (2010: £27.6 million) in respect of first tranche sales are included in the results for the year.
Supporting People contract income has declined to £16.7 million (2010: £18.0 million), which delivered a small surplus of £0.6 million (2010: £0.9 million). The small surplus remains a particularly good performance
considering the continual pressure to deliver significant cuts faced by contracting authorities.
Like many other social housing providers, Circle develops properties for outright sale and shared ownership. The profits on this activity are used to cross subsidise our social housing development programme. A surplus of £4.9 million (2010: £6.0 million) is included in the results for the year.
The Group has a surplus of £28.1 million (2010: £12.4 million).
Group balance sheet
2011 2010 £m £m
Housing properties at cost 1,937.2 1,851.8
Other tangible fixed assets 74.4 63.7
Goodwill 9.6 0.2
Investments 4.6 1.2
Share of joint venture assets less liabilities - -
Net current assets/(liabilities) 1.7 (10.6)
Debtors – due after one year 259.8 316.5
Creditors – due after one year (1,910.7) (1,858.9)
Other long term liabilities (13.2) (36.3)
Provisions - (3.3)
Minority interests (1.2) (1.2)
Reserves (362.2) (323.1)
Financial review
Group income and expenditure
Turnover 322.8 290.8
Less: share of joint ventures turnover - (4.3)
Group turnover 322.8 286.5
Cost of sales (22.5) (52.8)
Operating costs (after exceptional pension credits) (210.8) (166.0)
Operating surplus 89.5 67.7
Share of operating deficit of joint ventures (0.2) (0.4)
Surplus on sale of assets 4.9 6.0
Impairment of JVs 8.9 (8.9)
Impairment of goodwill (4.5) -
Movement in specific work in progress provision 0.2 -
Negative goodwill - 18.3
Net interest charge (70.5) (69.8)
Taxation (0.2) (0.5)
Surplus after taxation for the year 28.1 12.4
Minority interests - -
Surplus for the year after minority interests 28.1 12.4
Group financial highlights
2011 2010 £m £m
Where does our income come from?
Housing Stock Owned
0
5,000
10,000
15,000
20,000
25,000
£00
0s
30,000
35,000
40,000
45,000
50,000
General Needs Supported Housing Shared Ownership Other Social Housing Non Social Housing
Type
2009
2010
2011
23%14%
42%12%
9%42%
27%14%
38%11%
10%
76%
6%
10%4%4%
2010 201082%
5%5%
5%3%
2011 2011
Social Housing
Supoprting People Contract Income
First Tranche Sales
Other Social Housing Activities
Non Social Housing Activities
Management
Service charges
Maintenance and repairs
Depreciation And Impairments
Other costs
Loan Repayment Profile £M
1.3
25.6
354.5
1,226.5Within 1 year
Between 1 and 5 years
Between 5 and 10 years
Over 10 years
Social Housing Costs
Housing Stock Owned
0
5,000
10,000
15,000
20,000
25,000
£00
0s
30,000
35,000
40,000
45,000
50,000
General Needs Supported Housing Shared Ownership Other Social Housing Non Social Housing
Type
2009
2010
2011
23%14%
42%12%
9%42%
27%14%
38%11%
10%
76%
6%
10%4%4%
2010 201082%
5%5%
5%3%
2011 2011
Social Housing
Supoprting People Contract Income
First Tranche Sales
Other Social Housing Activities
Non Social Housing Activities
Management
Service charges
Maintenance and repairs
Depreciation And Impairments
Other costs
Loan Repayment Profile £M
1.3
25.6
354.5
1,226.5Within 1 year
Between 1 and 5 years
Between 5 and 10 years
Over 10 years

17 18Circle Anglia Group Annual Report and Financial Statements 2010 / 11
Loan Breakage CostsInterest costs include £5.9 million (2010: £4.7 million) of loan breakage costs. A £20 million loan with HACO (tying up £120 million of security) was bought back and cancelled in the year with a resulting £8.1 million of loan breakage costs being incurred; this was partially offset by the write back of a provision made last year to cancel a UK Rents loan held by Mercian. The decision was taken not to break this loan as it was deemed not to be cost effective.
Housing propertiesAs at 31 March 2011, the Group owned 64,628 housing properties (2010: 63,815).
The Board appointed professional valuers to value the Group’s housing properties as at 31 March 2011. Our investment in housing properties this year was funded by a mixture of social housing grant, loan finance and working capital. The valuation, on the basis of existing use as social housing, of properties owned by us was £2,441.6 million. (2010: £2,174.1 million).
At the end of March 2011 capital commitments for new developments amounted to £92.1 million (2010: £162.7 million), which will be funded by a combination of grant from public bodies and private finance loans.
The total development and capital improvement activity during the year spent £101.6 million net of grants (2010: £198.9 million) to meet growth and quality home improvement targets; these major investments continue to strengthen the financial performance of the Group.
Accounting policiesThe Group’s principal accounting policies are set out on pages 29 to 34 of the financial statements. The policies that are most critical to the financial results relate to accounting for housing properties and include: accounting for major capital project repairs and maintenance costs, capitalisation of interest and development administration costs, deduction of capital grant from the cost of assets, housing property depreciation, and treatment of shared ownership properties first tranche sales.
Capital structure & treasury managementThe Group Treasury Policy sets out the controls and parameters for treasury activities across the Group and is approved annually by the Management Board. In compiling these policies, good practice from the CIPFA Code of Practice for Treasury Management in Public Services as well as Treasury Management Policy Statements and Good Practice Notes issued by the Tenant Services Authority has been recognised.
The objective is to ensure that the Group has sufficient funding in place to finance operations and investments for a minimum of three years.
The Group’s borrowing requirements are based on a prudent approach to business planning which includes sensitivity testing to ensure that they can cope with major changes in circumstances without breaching investor covenants. This includes
testing different scenarios of property sales prices, volumes of sales and differing levels of inflation and interest rates.
Loan StructureThe Group operates centralised funding arrangements through a treasury vehicle (Circle Anglia Treasury Limited) and a public debt issuance company (Circle Anglia Social Housing Plc). Debt issued by Circle Anglia Social Housing Plc is passed to Circle Anglia Treasury Limited as loans, which in turn provides funding when required to Circle 33 Housing Association, Old Ford Housing Association, Wherry Housing Association, South Anglia Housing Association, Roddons Housing Association, Mole Valley Housing Association, Mercian Housing Association, Merton Priory Homes and Russet Homes – or the ‘Guarantor Group’.
This flexible structure allows for greater depth in the funding market for the Group and allows each of the Guarantors to leverage on the strength of the Group to provide investment in areas that will provide sustainable social benefits and Enhance Life Chances.
Mercian Housing Association, Merton Priory Homes, and Russet Homes acceded to the Guarantor Group in the course of the year. Mercian Housing Association retained some of its pre-existing external loan facilities totalling £28.7 million (drawn: £28.7 million).
During the year, the Group refinanced a total of £261 million (2010: £88
Financial review (continued)
ImpairmentsAn impairment review was carried out at 31 March 2011 for the housing properties and impairments of £10.7 million have been recognised in the accounts. The majority of this charge (£8.7 million) relates to properties at Thetford which were leased to the United States Air Force Europe, but the lease has not been renewed. The impairment represents the difference between the historic cost of the site and the lowest of the professional valuations received. (2010: a credit of £1.5 million was recognised as a result of changes to the mix of tenure in certain schemes and improved sales values, previous years impairments of £2.9 million were reversed).
Leamington Waterfront LLPDuring the year agreement was reached with RBS to refinance Leamington Waterfront. The arrangement resulted in the Joint Venture partner (Gladedale) making a further £2 million contribution to and the waiver of their interest in the development. Gladedale sold its 50% share to Your Lifespace (49.9%) and Circle Anglia Limited (0.1%) for £1. Leamington then became a wholly owned subsidiary of the Group. As a result of this the £8.9 million impairment of the Joint Venture has been reversed.
The entity is now in a position to continue with the development and will complete the planned 251 units. A fair value assessment of the development WIP was carried out
which determined that the carrying value of £24.2 million was estimated to be worth £10.2 million. The fair value adjustments result in a net liability of £14.1 million so goodwill of £14.1 million arose. The goodwill arising on acquisition has been reviewed for impairment and a prudent view was taken of the future trading results of the development. As a result of the review, an impairment of £4.5 million has been recognised in the Income and Expenditure Account.
PensionsThe Government’s change in the inflationary measure for pensions from RPI to CPI has, in most cases, resulted in the requirement to recognise the reduction in pension liability in the Income and Expenditure Account. This amounts to £8.8 million, covering nine pension schemes.
Underlying surplus before exceptional items was £31.3 million (2010: £8.8 million). This represents 9.7% (2010: 2.9%) of turnover. The adjustments can be seen in the table below.
Surplus for the year after minority interest 28.1 12.4
Adjustments for exceptional items:
Negative goodwill - (18.3)
Impairments 10.7 (1.4)
Impairment of investment in joint venture (8.9) 8.9
Impairment of goodwill 4.5 -
Movement in specific work in progress provision (0.2) -
Sales and leasebacks - 0.6
Top up pension contributions re new partner - 1.9
Adjustment of pension valuation basis (8.8) -
Loan breakage costs 5.9 4.7
Underlying surplus for the year before exceptional items 31.3 8.8
2011 2010 £m £m

19 20Circle Anglia Group Annual Report and Financial Statements 2010 / 11
Cash flowsThe consolidated cash flows show that the Group generated cash of £81.1 million (2010: £94.4 million) from operations (excluding property sales, gift aid and interest) and return on investments. The loan service costs of £83.9 million net (2010: £59.8 million) and £183.4 million (2010: £268.0 million) of expenditure on new development schemes and capital works to existing stock were funded by a social housing grant of £50.2 million (2010: £167.6 million), proceeds from property sales of £25.4 million (2010: £35.8 million), reductions in cash holdings and net drawdown of loans.
InvestmentsThe Group invests in a diverse range of activities and uses the returns from these to increase the amount that can be reinvested in social housing and the communities the Group operates in. The importance of these returns and the need to generate them increases with the cuts in public spending, uncertainty in the UK property market and greater need in the communities we operate in.
The Group has invested in Landericus, a fund created with two partners to invest in residential property in Germany. The total amount invested in Landericus at the end of the year was £16.7 million (2010: £16.7 million). Landericus owns 919 properties (2010: 747) with a value of £47.4 million (2010: £34.8 million), in North Rhine Westphalia, Berlin, Bremen, Halle and Frankfurt, Landericus made a surplus for the year of £0.7 million (2010: £0.4 million).
Going concernAfter making enquiries, the Board has reasonable expectation that the Group has adequate resources to continue in operational existence for the foreseeable future. For this reason they continue to adopt the going concern basis in preparing the Group’s financial statements. The Group maintained its top rating for viability from the Tenant Services Authority and its Aa3 rating from Moodys, a credit rating agency.
Statement of complianceIn presenting the Operating and Financial Review on pages 5 to 11, the Board has endeavoured to follow the principles regarding the purpose, audience, timeframe, reliability, comparability, financial and non-financial measures as set out in SORP 2010 exposure draft.
Financial review (continued)
Credit RatingThe Group subscribes to Moody’s Investor Service for its official credit rating. As at 31 March 2011, the Group’s assigned long-term credit rating was:
Rating Agency Rating Outlook Category
Moody’s Aa3 Stable Investment Grade
As a long-term business, the Group attaches significant importance to maintaining an investment grade credit rating, in order to sustain effective operations.
The Group’s objective is to consistently maintain a ‘Aa’ investment grade rating.
million), taking its total loan facilities to £2,075.1million (2010: £1,985.3 million), all of which were fully secured (2010: £1,838.9 million).
Maturity dates of loan facilities are staged to ensure that large proportions of debt do not mature in the same year, and therefore the Group should not be subject to any significant degree of financing risk.
The weighted average maturity of debt across the group is 27 years. The weighted average cost of debt at the end of the year was 4.6%.
Interest rate risk managementThe Group’s current strategy is to mitigate the risk of breaching covenants due to movements in interest and inflation rates, whilst ensuring the maximum enterprise value generated for the organisation. Circle Housing Group uses a combination of embedded and free-standing instruments to hedge against adverse movements in interest rates and inflation. As at 31 March 2011, 91% of the Group’s debt had been hedged for the next six months, and an average of 72% over the next five years.
Loan facilitiesAs at 31 March 2011, the Group had committed long-term loan facilities of £2,075.1 million (2010: £1,985.3 million) of which £467.2 million was un-drawn (2010: £437.9 million). £395 million of the total facilities are revolving loan facilities (2010: £415 million) that convert to long term facilities on maturity. Of these, £180.1 million are currently utilised (2010: £210.1 million).
Compliance with loan covenantsLoan covenants are primarily interest cover and gearing ratio and are monitored monthly, and reported annually to finance providers. For the year to 31 March 2011, the interest cover and gearing ratio were in compliance with the loan covenants. Interest cover (including impairments and property sales) in the Guarantor Group was 176.9% (2010: 119.0%) and gearing was 49.8% (2010: 51.0%).
Mercian Housing Association has separate loan covenants relating to its external debt and was also in compliance with these for the year to 31 March 2011.
The following table shows the Group’s Loan Repayment Profile:
Within one year 1.3
Between one and five years 25.6
Between five and ten years 354.5
Over ten years 1,226.5
Total 1,607.9
2011 £m
Housing Stock Owned
0
5,000
10,000
15,000
20,000
25,000
£00
0s
30,000
35,000
40,000
45,000
50,000
General Needs Supported Housing Shared Ownership Other Social Housing Non Social Housing
Type
2009
2010
2011
23%14%
42%12%
9%42%
27%14%
38%11%
10%
76%
6%
10%4%4%
2010 201082%
5%5%
5%3%
2011 2011
Social Housing
Supoprting People Contract Income
First Tranche Sales
Other Social Housing Activities
Non Social Housing Activities
Management
Service charges
Maintenance and repairs
Depreciation And Impairments
Other costs
Loan Repayment Profile £M
1.3
25.6
354.5
1,226.5Within 1 year
Between 1 and 5 years
Between 5 and 10 years
Over 10 years

21 22Circle Anglia Group Annual Report and Financial Statements 2010 / 11
Internal assurance activitiesControl and risk self–assessments (CRSA) are under taken by management. Staff and line managers review their own risks with assistance from the risk management team and by building their own control assessment. This is designed to promote accountability by all staff and not to rely upon functions such as risk management to monitor potential risks. The system is supportive and designed to instil a greater understanding of risk and assurance to all employees.
Internal auditsCircle Housing Group’s internal auditors are used to ensure a robust risk management approach is applied across the Group in order to reduce the risks to an acceptable level for the Board. It is important to stress that internal audit are not responsible for the design and construction of control systems but undertake an objective role in order to review them appropriately at a later date. The in house internal auditor undertakes this responsibility on behalf of Circle Housing Group and is supported by Grant Thornton, an external resource. This ensures an objective review, audit and follow up process. Value has been added to the internal audit function due to continued support and presence of the in house internal auditor. Audit activities have clear terms of reference which
are regularly reviewed and updated with relevant business and regulatory requirements.
External audit assuranceThe Group’s objectives and strategies as well as the related business risks are made clear to external auditors so they can gain an understanding of the overall structure and governance of the Group.
Risk management and governanceThe Tenant Services Authority (TSA) has confirmed that Circle has retained the top financial viability ratings. A key factor for the TSA was the way the Group dealt with risk and governance, which it had described as exemplary. They also noted that Circle was the only Group with a Director of Performance Management. Risk management activities are used to highlight and mitigate undesirable events from occurring such as fraudulent activity. The Group maintains a zero tolerance policy on fraud. Clear lines of responsibility are established throughout the Group for coordinating risk management activities and reporting on key risks identified and considered by the board. Risk is managed at strategic, operational and project levels.
ConclusionThe Board acknowledges that its responsibility applies to the complete range of risks and controls within the Group’s activities and to ensuring that necessary remedial action is put into operation.
On behalf of the Group Management Board, the Group Audit and Risk Committee has reviewed the annual reports of the Group Chief Executive and those of the Internal Audit and Risk Management functions.
The Committee has considered the effectiveness of the system of internal control in existence in the Group for the year ended 31st March 2011. In conclusion, the system of controls in place during the financial year was appropriate for an organisation of Circle Housing Group’s size and complexity and that as a result of the information received over the year the Board could conclude that there was an effective system of internal control in existence throughout Circle Housing Group. No weaknesses were found in internal controls which resulted in material losses, contingencies, or uncertainties which require disclosure.
Board Statement on the effectiveness of the System of Internal Control
The Group Management Board acknowledges i t s u l t imate responsibility for ensuring that the Group and its Partners has in place a system of controls that is appropriate to the various business environments in which it operates and for the review of the effectiveness of that system during the year. These internal controls are designed to identify and manage rather than eliminate risks which may prevent the Group from achieving its objectives.
The system is designed to give reasonable rather than absolute assurance with respect to:
• the reliability of information used within the organisation or for publication;
• the maintenance of proper accounting and management records; and
• the safeguarding of assets against unauthorised use or disposition.
The process followed to identify, evaluate and manage significant risks faced by the Group is ongoing, has been in place during the past financial year and is reported regularly to the Group Management Board. The risk management and control processes are not a separate annual exercise but are a continuous function and embedded across the Group by documenting and collating evidence to support good practice and compliance.

23 24Circle Anglia Group Annual Report and Financial Statements 2010 / 11
Statement of Board’s responsibilities in respect of the Board’s report and the financial statementsThe Board is responsible for preparing the Board’s Report and the financial statements in accordance with applicable law and regulations.
Industrial and Provident Society law requires the Board to prepare financial statements for each financial year. Under those regulations the Board have elected to prepare the financial statements in accordance with UK Accounting Standards.
The financial statements are required by law to give a true and fair view of the state of affairs of the Association and of the surplus or deficit for that period.
In preparing these f inancial statements, the Board is required to:
• select suitable accounting policies and then apply them consistently;
• make judgments and estimates that are reasonable and prudent;
• state whether applicable UK Accounting Standards and the Statement of Recommended Practice have been followed, subject to any material departures disclosed and explained in the financial statements; and
• prepare the financial statements on the going concern basis unless it is inappropriate to presume that the association will continue in business.
The Board is responsible for keeping proper accounting records that disclose with reasonable accuracy at any time the financial position of the Association and enable them to ensure that its financial statements comply with the Industrial & Provident Societies Acts 1965 to 2003, the Housing Act 1996 and the Accounting Requirements for Registered Social Landlords General Determination 2006. The Board has general responsibility for taking such steps as are reasonably open to it to safeguard the assets of the Association and to prevent and detect fraud and other irregularities.
The Board is responsible for the maintenance and integrity of the corporate and financial information included on the association’s website. Legislation in the UK governing the preparation and dissemination of financial statements may differ from legislation in other jurisdictions.
Disclosure of information to auditorsThe Board members who held office at the date of approval of this Board’s report confirm that, so far as they are each aware, there is no relevant audit information of which the Association’s auditors are unaware; and each Board member has taken all the steps that they ought to have taken as a Board member to make themselves aware of any relevant audit information and to establish that the Association’s auditors are aware of that information.
AuditorsA resolution is to be proposed at the Annual General Meeting for the re-appointment of KPMG LLP as auditors of the company.
By order of the Board
A Firman

25 26Circle Anglia Group Annual Report and Financial Statements 2010 / 11
Board is responsible for the preparation of financial statements which give a true and fair view. Our responsibility is to audit, and express an opinion on, the financial statements in accordance with applicable law and International Standards on Auditing (UK and Ireland). Those standards require us to comply with the Auditing Practices Board’s (APB’s) Ethical Standards for Auditors.
Scope of the audit of the financial statementsA description of the scope of an audit of financial statements is provided on the APB’s website at www.frc.org.uk/apb/scope/private.cfm.
Opinion on financial statementsIn our opinion the financial statements:
• give a true and fair view, in accordance with UK Generally Accepted Accounting Practice, of the state of affairs of the Group and Association as at 31 March 2011 and of the Group and Associations surplus for the year then ended; and
• have been properly prepared in accordance with the Industrial and Provident Societies Acts 1965 to 2003 and the Industrial and Provident Societies (Group Accounts) Regulations 1969, the Housing and Regeneration Act 2008
Group income and expenditure account for the year ended 31 March 2011
Group 2011 2010 Note £m £m £m
Turnover: continuing activities 3
Group and share of joint ventures 322.8 290.8
Less share of joint ventures turnover - (4.3)
Group turnover 322.8 286.5
Cost of sales 3 (22.5) (52.8)
Operating costs before exceptional items (219.6)
Exceptional pension credit 8.8
Operating Costs 3 (210.8) (166.0)
Operating surplus: continuing activities 3 89.5 67.7
Share of operating deficit of joint ventures (0.2) (0.4)
Surplus on sale of fixed assets – housing properties 6 4.9 6.0
Impairment of JVs 8.9 (8.9)
Impairment of goodwill 27 (4.5) -
Movement in specific work in progress provision 0.2 -
Negative goodwill - 18.3
Interest receivable and other income 7 1.8 4.2
Interest payable and similar charges 8 (72.3) (74.0)
Surplus on ordinary activities before taxation 28.3 12.9
Tax charge on surplus on operating activities 10 (0.2) (0.5)
Surplus for the financial year after taxation 28.1 12.4
Minority interests - -
Surplus for the financial year after minority interests 28.1 12.4
Independent auditor’s report to the members of Circle Anglia Limited
We have audited the financial statements of Circle Anglia Limited for the year ended 31 March 2011 which comprise the Group and Association Income and Expenditure Account, the Group Statement of Total Recognised Surpluses and Deficits, the Group and Association Balance Sheet, the Group Cash flow and the related notes. The financial reporting framework that has been applied in their preparation is applicable law and UK Accounting Standards (UK Generally Accepted Accounting Practice).
This report is made solely to the association’s members, as a body, in accordance with section 128 of the Housing and Regeneration Act 2008 and section 9 of the Friendly and Industrial and Provident Societies Act 1968. Our audit work has been undertaken so that we might state to the association’s members those matters we are required to state to them in an auditor’s report and for no other purpose. To the fullest extent permitted by law, we do not accept or assume responsibility to anyone other than the association and the association’s members, as a body, for our audit work, for this report, or for the opinions we have formed.
Respective responsibilities of the Board and auditorAs more fully explained in the Statement of Board’s Responsibilities set out on page 22, the association’s
and the Accounting Requirements for Registered Social Landlords General Determination 2006.
Matters on which we are required to report by exceptionWe have nothing to report in respect of the following matters where the Industrial and Provident Societies Acts 1965 to 2003 and the Industrial and Provident Societies (Group Accounts) Regulations 1969 require us to report to you if, in our opinion:
• a satisfactory system of control over transactions has not been maintained; or
• the Association has not kept proper accounting records; or
• the financial statements are not in agreement with the books of account; or
• we have not received all the information and explanations we need for our audit.
Chris Wilson(Senior Statutory Auditor)
for and on behalf of KPMG LLP, Statutory AuditorChartered Accountants1 Forest Gate, Brighton Road,Crawley, West Sussex, RH11 9PT
Statement of total Group recognised surpluses and deficits for the year ended 31 March 2011
Reported surplus for the financial year 28.1 12.4
Actuarial gain/(loss) recognised in the pension scheme net
of deferred tax and exceptional pension credit 30 13.2 (23.0)
Total recognised surpluses/(deficit) for the year 41.3 (10.6)
Prior year adjustment re reversal of revaluation reserve - (365.9)
Total recognised surplus/(deficit) for the year 41.3 (376.5)
Group 2011 2010
Note £m £m

27 28Circle Anglia Group Annual Report and Financial Statements 2010 / 11
Group balance sheet for the year ended 31 March 2011 2011 2010
Note £m £m
Association income and expenditure account for the year ended 31 March 2011
Turnover: continuing activities 3 42.4 39.5
Operating costs before exceptional items (45.1)
Exceptional pension credit 3.8
Operating costs 3 (41.3) (38.0)
Operating surplus: continuing activities 3 1.1 1.5
Interest receivable and other income 7 0.2 0.4
Interest payable and similar charges 8 (1.3) (1.4)
Surplus on ordinary activities before taxation - 0.5
Tax charge on surplus on operating activities 10 - (0.5)
Surplus for the financial year after taxation - -
Association 2011 2010
Note £m £m £m
Statement of total Association recognised surpluses and deficits for the year ended 31 March 2011
Surplus for the financial year - -
Actuarial gain / (loss) recognised in the pension
scheme net of deferred tax 30 2.2 (9.3)
Total recognised surplus / (deficit) since the last annual report 2.2 (9.3)
Association 2011 2010
Note £m £m
Tangible fixed assets Housing properties at cost 11 1,937.2 1,851.8Other tangible fixed assets 11 74.4 63.7Goodwill 9.6 0.2Investments 12 4.6 1.2Investments in joint venture: Share of gross assets 12 0.1 0.1Share of gross liabilities 12 (0.1) (0.1)Fixed asset investments: Investment – loans 12 13.0 30.9Grant received 12 (13.0) (30.9)Investment in property under the Homebuy Scheme: Grant investment 13.7 14.1Social housing grant (13.7) (14.1)
2,025.8 1,916.9
Current assets Stock and work in progress 13 62.0 54.2Debtors due within one year 14 95.7 78.2 157.7 132.4
Investments 15 - 12.7Cash at bank and in hand 6.9 32.7 164.6 177.8
Creditors: Amounts falling due within one year 16 (162.9) (188.4)Net current assets / (liabilities) 1.7 (10.6)
Assets less current liabilities 2,027.5 1,906.3Other debtors – amounts falling due after one year 14 259.8 316.5
Total assets less current liabilities 2,287.3 2,222.8
Creditors: Amounts falling due after more than one year 17 1,910.7 1,858.9Provisions 31 - 3.3
Long term pension liability 30 13.2 36.3 1,923.9 1,898.5
Capital and reserves: Non-equity share capital 32 - -Designated reserves 33 6.3 6.3Revenue reserves 33 355.9 316.8Minority interests 1.2 1.2 363.4 324.3
Consolidated funds 2,287.3 2,222.8
The financial statements were approved by the Board on 20 July 2011 and signed on its behalf by:
Board Member Board Member Secretary

29 30Circle Anglia Group Annual Report and Financial Statements 2010 / 11
Association balance sheet for the year ended 31 March 2011
Tangible fixed assets Other tangible fixed assets 11 6.9 7.2Investments 12 0.9 1.1 7.8 8.3
Current assets Debtors due after one year 14 2.3 7.5Debtors due within one year 14 8.6 13.1 10.9 20.6 Cash at bank and in hand - 0.3 10.9 20.9 Creditors: Amounts falling due within one year 16 (12.0) (16.3) Net current (liabilities) / assets (1.1) 4.6
Total assets less current liabilities 6.7 12.9 Creditors: Amounts falling due after more than one year 17 10.4 13.1Long term pension liability 30 5.7 11.4 16.1 24.5 Capital and reserves: Non-equity share capital 32 - -Revenue reserve 34 (9.4) (11.6)
6.7 12.9
Group cash flow statement for the year ended 31 March 2011
2011 2010
Note £m £m
2011 2010
Note £m £m
Net cash inflow from operating activities 24 102.6 94.4
Returns on investments and servicing of finance
Dividends received from joint ventures - 1.2
Interest received 1.8 4.3
Interest paid (85.7) (65.3)
Net cashflow from returns on investment and servicing activities (83.9) (59.8)
Taxation paid
Corporation tax paid (0.3) (0.3)
Capital expenditure
Purchase and construction of housing properties (183.4) (268.0)
Social housing grants received 50.2 167.6
Sale of housing properties 25.4 35.8
Purchase of other fixed assets (16.3) (19.1)
Net cashflow from capital expenditure (124.1) (83.7)
Acquisitions and disposals
Cash acquired on acquisition of subsidiaries - 11.7
Share issue to minority interest - 0.3
Net cashflow from acquisitions and disposals - 12.0
Cash outflow before management of liquid resources and financing (105.7) (37.4)
Management of liquid resources
Cash withdrawn from money market deposit accounts 25/26 12.7 14.1
Cash received from the sale of Bond investment 4.5 -
17.2 14.1
Financing
Housing loans received net of payments 25/26 65.8 42.8
(Decrease) / increase in cash 25/26 (22.7) 19.5
The financial statements were approved by the Board on 20 July 2011 and signed on its behalf by:
Board Member Board Member Secretary

31 32Circle Anglia Group Annual Report and Financial Statements 2010 / 11
1. Legal statusThe Association is incorporated under the Industrial and Provident Societies Act 1965 and is also a Registered Provider under the Housing Act 1996.
2. Accounting policies
The directors believe it is appropriate to prepare the financial statements on a going concern basis, having reviewed the financial forecast. The financial statements have been prepared in accordance with applicable Accounting Standards in the United Kingdom, the Statement of Recommended Practice for Registered Social Landlords update 2010 and the Accounting Requirements for Registered Social Landlords General Determination 2006. of our own resources and profits from property disposals. This includes developing properties for private sale, shared ownership and market rent, providing leasehold management services and including commercial premises as part of some mixed tenure schemes.
A summary of the more important accounting policies, which have been consistently applied, are set out below: -
(a) Basis of accountingThe financial statements have been prepared under the historical cost convention, on an accruals basis.
(b) Basis of consolidationThe Group financial statements incorporate the financial statements of the Group’s parent, Circle Anglia Limited, and its subsidiaries.
(c) TurnoverTurnover represents gross rental income receivable during the period net of voids, fees, management fees, direct works income, supporting people income, first tranche sales of shared ownership and other sundry sources.
(d) Interest payableInterest payable is charged to the income and expenditure account in the year, except where it is capitalised on funds borrowed to finance developments. This occurs to the extent that it accrues in respect of the period of development if it represents either:
• interest on borrowings specifically f inancing the development programme after deduction of interest on Social Housing Grant (SHG) in advance; or
• interest on borrowings of the Association as a whole after deduction of interest on SHG in advance to the extent that they can be deemed to be financing the development programme.
(e) TaxationThe charge for taxation is based on the result for the period and takes into account deferred taxation because of timing differences between the treatment of certain items for taxation and accounting purposes. No provision has been made for any taxation that would arise if the fixed assets were disposed of at the values included in the Financial Statements, since it is not intended to reduce significantly the size of housing stock and hence cause a material taxation liability to crystallise.
(f) Deferred taxExcept where otherwise required by accounting standards, full provision without discounting is made for all timing differences which have arisen but not reversed at the balance sheet date.
(g) Value added tax (VAT)The Group is VAT registered in the name of Circle Anglia Limited, but the majority of its income, being rents, is exempt for VAT purposes and this gives rise to a partial exemption calculation. Expenditure for non-taxable activities is therefore shown inclusive of VAT and the input VAT recovered is credited against operating costs. Expenditure on taxable activities is shown exclusive of VAT.
Notes to the financial statements for the year ended 31 March 2011
(h) Housing propertiesThe Group operates a full component accounting policy in relation to the capitalisation and depreciation of its completed housing property stock.
The estimated useful economic life for each component has been arrived at based on the Group’s current experience of component replacement with the useful economic life of 29 years for Other Components being a weighted average figure. The Group will continue to monitor and review the useful economic lives of all components and make revisions where sustained material changes arise.
Improvements are works, which result in an increase in the net rental income, such as a reduction in future maintenance costs, or result in a significant extension of the useful economic life of the property in the business. Only the direct overhead costs associated with new developments or improvements are capitalised.
Hous ing p roper t i e s under construction are stated at cost less capital development grants and are transferred to “Completed Schemes” once they are available for letting. No depreciation is provided on housing properties under construction.
Direct costs involved with administering development activities are capitalised to the extent that they are directly attributable to the development process and in bringing the properties into their intended use.
Shared Ownership housing stock is also included in fixed assets. Under the terms of tenancy agreements tenants have the right to purchase additional shares in these properties at an appropriate share of the open market valuation.
Homebuy – Investments and the associated grant under the Homebuy scheme are held within the balance sheet as fixed asset investments.
(i) Shared ownership properties
Shared ownership properties are split proportionately between current and fixed assets based on the element relating to their expected first tranche sales. The first tranche proportion is classed as a current asset and related sales proceeds are included in turnover with the remainder classed as a fixed asset. In mixed tenure schemes which have included shared ownership, any subsidy expected from first tranche sales to pay for non shared ownership costs is credited to these costs.
Component Useful Economic Life
Structure 100
Roof 60 (pitched) 15 (flat)
Windows 30
Kitchen 20
Bathroom 30
Central heating (ex-Boiler) 30
Boiler 15
Electric system 35
Lifts 15
Other components (capitalised housing property costs not included above) 29
All housing properties are split between their land and structure costs and a specific set of major components which require periodic replacement. Refurbishment or replacement of such
major components is capitalised and depreciated over the estimated useful life of the component as follows:
33 34Circle Anglia Group Annual Report and Financial Statements 2010 / 11
(p) Stock transfersWhere opportunities for the regeneration of local authority housing stock arise after transfer requests from tenants and residents, the Association may seek to maximise the resources available for regeneration schemes by entering into VAT shelter arrangements. In these circumstances, the underlying substance of the transactions is reflected in the accounts on a gross basis. The obligation to the local authorities is shown as long term debtors and the obligation to contactors under the refurbishment contracts is shown in long term creditors. Amounts due within one year under the arrangements are classified within current assets and liabilities.
(q) Lease obligationsWhere assets are financed by leasing arrangements that give rights approximating to ownership, they are classified as finance leases and are treated as if they have been purchased outright. The amount capitalised is the present value of the minimum lease payment due during the term of the lease. The corresponding leasing commitments are shown as obligations to the lessor. Rentals paid under operating leases (including those paid under ‘Temporary Market Rent Housing’ leases) are charged to the Income and Expenditure account on an accruals basis.
(r) InvestmentsInvestments are valued at the lower of cost and net realisable value. Fixed asset investments represent amounts falling due from borrowers on varying types of loan agreement and includes amounts in respect of Property Appreciation Loans (PAL). Such loans can include repayment periods in excess of sixty years.
(s) Deferred indexationThe Group has entered into loan arrangements for specific schemes where interest payments are deferred at the beginning of the repayment period or where the principal outstanding is subject to annual indexation. Where the Group has entered into corresponding agreements with third parties (usually local authorities) to guarantee the payment of any deficits arising on these schemes, the amount of the deferral or indexation is treated as an asset.
(t) Deferred incomeDeferred income comprises both premiums on leases which are released over the life of the lease and other income received which is carried forward over the lives of the assets concerned.
(u) Finance costsLoan origination fees in respect of the issue of new loan facilities whose draw down is certain, are deferred and written off to the Income and Expenditure account over the expected life of the loan. Loan origination fees in respect of the refinancing of existing debt or in respect of undrawn facilities whose draw down is uncertain, are written off directly to the Income and Expenditure Account.
(v) Joint arrangements The Group has entered into two contractual arrangements that under FRS9 are classed as ‘a joint arrangement that is not an entity’. Accordingly the Group has accounted for its assets, liabilities and cash flows in respect of those arrangements, measured according to the terms of the agreements governing the arrangements, and in line with the Group’s accounting policies.
(n) Other grantsThese include grants from local authorities and other organisations. The capital costs of housing properties are stated net of grants receivable on these properties. Grants in respect of revenue expenditure are credited to the income and expenditure account in the same period as the expenditure to which they relate.
Grants received to enable loan funds to be established are credited to deferred income upon receipt. Upon lending to borrowers, the grants are transferred to fixed asset investments where they are netted off the amount owed by the borrower.
Grants received to enable loan funds to be established are shown as a deduction from the cost of fixed asset investments on the balance sheet (see note 7). This is a departure from the rules under Schedule 4 of the Companies Act 1985, which requires the grants to be recorded as deferred income. Given the nature of these grants, the Board is of the opinion that the accounting policy that has been adopted is appropriate in order to present a true and fair view.
(o) Sale and leasebackProperties held under sale and leaseback arrangements under which the Group retains the risks and rewards of ownership are included within housing properties at cost and valued on the same basis as all other completed housing properties. The Group recognises the substance of such financing arrangements as long-term loans. The associated finance charge is calculated on the carrying value of the loan outstanding.
Notes to the financial statements for the year ended 31 March 2011 (continued)
(j) Properties for sale and stock
Shared ownership first tranche sales, completed properties for outright sales and property under construction are valued at the lower of cost and net realisable value. Cost comprises land and building cost. Net realisable value is based on estimated sales price after allowing further costs of completion and disposal.
The remainder of shared ownership sales cost is classed as a fixed asset. Shared ownership first tranche sales proceeds form part of turnover and the cost of these sales include any subsidy used to fund the non shared ownership cost of the same mixed tenure scheme.
(k) Depreciation of housing properties
Freehold land is not depreciated. Depreciation is charged so as to write down the net book value of housing properties to their estimated residual value, on a straight line basis, over their estimated useful economic lives in the business. The depreciable amount is assessed on an annual basis and is arrived at on the basis of original cost, less SHG and other grants, less residual value (being the actual or estimated open market value of the land at the date of purchase). The Group’s housing properties are depreciated over an economic useful life of 100 years. Completed shared ownership properties are not depreciated. Additionally, component replacements have been depreciated over useful lives of between 15 and 60 years.
(l) ImpairmentHouses which are depreciated over a period in excess of 50 years are, in accordance with FRS 11 and the SORP, subject to impairment reviews annually. Other assets are reviewed for impairment if there is an indication that impairment may have occurred.
Where there is evidence of impairment, fixed assets are written down to recoverable amount and any such write down would be charged to operating surplus.
(m) Social housing grant
Social Housing Grant (SHG) is receivable from the Homes and Communities Agency and is utilised to reduce the capital costs of housing properties.
SHG due from the Homes and Communities Agency or received in advance is included as a current asset or liability. SHG received in respect of revenue expenditure is credited to the income and expenditure account in the same period as the expenditure to which it relates.
SHG received in advance for the development of properties under the agreement with Tower Hamlets Housing Action Trust is shown under current liabilities.
SHG is subordinated in respect of loans on agreement with the Homes and Communities Agency. SHG released on sale of a property may be repayable but is normally available to be recycled and is credited to a Recycled Capital Grant Fund or Disposal Proceed Fund and included in the balance sheet under creditors.

35 36Circle Anglia Group Annual Report and Financial Statements 2010 / 11
(y) Designated and other restricted reserves
Where funding has been received from bodies other than the Homes and Communities Agency, amounts have been set aside in respect of major repairs and the replacement of furniture and fittings, in accordance with individual funding arrangements.
Sinking funds to cover the cost of major works are held on trust where required for leaseholders. Annual contributions from leaseholders are based on independent qualified Chartered Surveyors’ review of stock condition surveys and a programme of planned works. The contributions are set aside to a designated reserve.
(z) Negative goodwill Negative goodwill arising on the acquisition of subsidiaries represents the excess of fair value of the identifiable net assets acquired over the fair value of the consideration given and is taken immediately to the income and expenditure account.
(aa) GoodwillGoodwill arising on the acquisition of subsidiaries is initially measured at cost over the net fair value of the identifiable assets, liabilities and contingent liabilities. Following initial recognition, goodwill is measured at cost less any accumulated impairment losses. Goodwill is tested for impairment annually, or more frequently if events or changes in circumstances indicate that the carrying amount may be impaired. Any impairment is recognised immediately in the Income Statement.
(w) Foreign currenciesTransactions in foreign currencies are recorded using the rate of exchange ruling at the date of the transaction. Monetary assets and liabilities denominated in foreign currencies are translated using the contracted rate or the rate of exchange ruling at the Balance Sheet date and the gains or losses on translation are included in the Income and Expenditure Account.
Where foreign currency borrowings have been used to finance, or provide a hedge against, group equity investments in foreign enterprises, exchange gains or losses on the borrowings, which would otherwise have been taken to the Income and Expenditure Account, are offset as reserve movements against exchange differences arising on the re-translation of the net investments. This policy is applied to the extent that
• in any accounting period, the exchange gains and losses arising on foreign currency borrowings are offset only to the extent of the exchange differences arising on the net investments in foreign enterprises; and
• the foreign currency borrowings, whose exchange gains or losses are used in the offset process, do not exceed, in aggregate, the total amount of cash that the net investments are expected to be able to generate.
(x) PensionsThe Group participates in several defined benefit pension scheme which provide benefits based on final pensionable pay. The assets of the schemes are held separately from those of the Group, being invested in independently managed superannuation funds.
Pension scheme assets are measured using market values. Pension scheme liabilities are measured using a projected unit method and discounted at the current rate of return on a high quality corporate bond of equivalent term and currency to the liability. In accordance with FRS17, the pension scheme surplus (to the extent that it is recoverable) or deficit is recognised in full. The movement in the scheme surplus/deficit is split between operating charges, finance items and, in the Statement of Total Recognised Surpluses and Deficits, actuarial gains and losses.
Pension costs are assessed in accordance with the advice of independent qualified actuaries. Costs include the regular cost of providing benefits which, it is intended, should remain a substantially level percentage of the current and expected future earnings of the employees covered. Variations from the regular pension costs are spread evenly through the Income and Expenditure Account over the average remaining service lives of the current employees.
Certain employees have opted to take out separate arrangements under various defined contribution schemes which they have chosen. The assets of such schemes are also
separate from those of the Group, being invested by independent fund managers. Contributions by the Group are charged to the Income and Expenditure Account for the year in which they are payable to the schemes.
The Group participates in the Social Housing Pension Scheme (the Scheme). The Scheme is funded and is contracted-out of the State Pension scheme.
It is not possible in the normal course of events to identify on a consistent and reasonable basis the share of underlying assets and liabilities belonging to individual participating employers. This is because the Scheme is a multi employer scheme where the Scheme assets are co-mingled for investment purposes, and benefits are paid for total Scheme assets. Accordingly, due to the nature of the Scheme, the accounting charge for the period under FRS 17 represents the employer contribution payable.
The Group participates in several stakeholder pension schemes to provide retirement benefits for eligible employees of the Group. Contributions to the Stakeholder Pension Schemes are calculated as a percentage of pensionable salary and are charged to the Income and Expenditure Account. The schemes are not contracted out of the State Earnings Related Pension Scheme. Monthly contributions from each member are invested in the Standard Life Corporate Plan in accordance with the wishes of each member.
Notes to the financial statements for the year ended 31 March 2011 (continued)

37 38Circle Anglia Group Annual Report and Financial Statements 2010 / 11
Association – continuing activities 2011 2010 Operating Cost of Operating Operating surplus Turnover sales costs surplus Turnover (deficit) £m £m £m £m £m £m
Social housing lettings 42.4 - (41.3) 1.1 39.5 1.5
Notes to the financial statements for the year ended 31 March 2011 (continued)
Group – continuing activities
3. Turnover, other costs, operating costs and operating surplus
2011 2010 Operating Cost of Operating Operating surplus Turnover sales costs surplus Turnover (deficit) £m £m £m £m £m £m
Following the Government’s change from RPI to CPI as the inflationary measure for future pension increases, gains have arisen as a result of CPI being traditionally lower then RPI. The gain of £8.8 million is shown in the Income and Expenditure Account as an exceptional pension credit.
Social housing lettings 264.8 - (175.9) 88.9 217.1 70.4
Other social housing activities
Supporting people contract income 16.7 (0.9) (15.2) 0.6 18.0 0.9
Development services 0.1 - (0.1) - 0.1 -
Management services 1.5 - (1.3) 0.2 1.1 0.4
Community regeneration 1.0 - (2.5) (1.5) 1.1 (1.1)
First tranche sales 16.5 (15.7) - 0.8 28.5 0.9
Other 12.3 (5.9) (10.1) (3.7) 10.4 (8.9)
Exceptional pension credit - - 8.8 8.8 - -
48.1 (22.5) (20.4) 5.2 59.2 (7.8)
Non-social housing activities
Lettings 9.9 - (14.5) (4.6) 10.2 5.1
322.8 (22.5) (210.8) 89.5 286.5 67.7
Particulars of income and expenditure from social housing lettings
Group General Temporary needs Supported social Shared 2011 2010 housing housing housing ownership Lease Total Total £m £m £m £m £m £m £m
Rent receivable net of
identifiable service charges 202.5 19.6 5.3 9.9 8.0 245.3 205.5
Charges for support services - 0.3 - - - 0.3 -
Service charges receivable 11.5 4.8 0.1 2.6 3.3 22.3 15.5
Gross rents receivable 214.0 24.7 5.4 12.5 11.3 267.9 221.0
Less: rent losses from voids (2.5) (0.7) (0.5) (0.1) (0.1) (3.9) (4.3)
Net rents receivable 211.5 24.0 4.9 12.4 11.2 264.0 216.7
Other revenue grants 0.5 0.1 - - 0.2 0.8 0.4 Turnover from social housing lettings 212.0 24.1 4.9 12.4 11.4 264.8 217.1

39 40Circle Anglia Group Annual Report and Financial Statements 2010 / 11
Particulars of income and expenditure from social housing lettings
3. Turnover, other costs, operating costs and operating surplus continued...
Group General Temporary needs Supported social Shared 2011 2010 housing housing housing ownership Lease Total Total £m £m £m £m £m £m £m
Management (23.6) (9.4) (0.7) (2.9) (4.2) (40.8) (38.9)
Services (15.9) (5.5) (0.1) (1.2) (2.6) (25.3) (20.4)
Routine maintenance (37.5) (3.0) (0.2) (0.4) (2.7) (43.8) (25.6)
Planned maintenance (25.0) (2.9) (0.1) (0.4) (1.6) (30.0) (30.4)
Bad debts (1.5) (0.2) 0.1 - (0.2) (1.8) (1.3)
Property lease charges - - (1.7) - - (1.7) (1.9)
Depreciation of
housing properties (16.8) (1.7) (0.1) - - (18.6) (17.7)
Impairment of
housing properties - - - (2.0) - (2.0) 1.5
Other costs (8.9) (0.9) (0.1) (0.4) (1.6) (11.9) (12.0)
Operating costs on
social housing lettings (129.2) (23.6) (2.9) (7.3) (12.9) (175.9) (146.7)
Operating surplus on social housing lettings 82.8 0.5 2.0 5.1 (1.5) 88.9 70.4
In order to reflect the allocation of resources to particular functions, some indirect operating costs previously included above in management have this year been apportioned against direct operating costs, e.g. service charge expenditure and maintenance. For comparative purposes, the figures for the year ended 31 March 2010 have been re-stated on a similar basis.
Notes to the financial statements for the year ended 31 March 2011 (continued)
At the end of the year accommodation in management for each class of accommodation was as follows: Group 2011 2010
No. No.
Social housing
General housing 45,132 44,967
Supported housing and housing for older people 5,408 5,251
Shared ownership 3,947 3,829
Keyworker 289 245
Leaseholders 5,499 5,441
Staff accommodation 65 66
Total social housing owned 60,340 59,799
Non-social housing
Market rented 1,755 1,592
Garages 1,532 1,541
Leaseholders 496 499
Other non-social 505 384
Total non-social housing owned 4,288 4,016
Total housing owned 64,628 63,815
Accommodation managed for others 291 552
Stock owned but not managed (3,541) (4,555)
Total managed 61,378 59,812
Accommodation in development at the year end 1,677 1,988
4. Accommodation in management and development
Note: Market rented properties includes 919 properties (2010: 747) owned by Landericus.
Properties owned by Leamington Waterfront LLP are shown as properties under construction and Your Lifespace Limited are shown as completed properties in stock and work in progress (Note 13)
41 42Circle Anglia Group Annual Report and Financial Statements 2010 / 11
This is arrived at after charging: Group Association 2011 2010 2011 2010 £m £m £m £m
Depreciation of housing properties 21.6 18.2 - -
Impairment of housing properties 10.7 (1.5) - -
Depreciation of other tangible fixed assets 4.3 3.7 2.9 1.9
Operating lease rentals 4.2 3.9 2.2 1.4
Current and past service costs 2.8 1.4 0.4 0.3
Exceptional pension credit 8.8 - 3.8 -
Foreign exchange loss - 0.4 - -
Auditors’ remuneration: (including VAT)
- for audit services 0.3 0.3 - -
- for non-audit services 0.5 0.1 - -
5. Operating surplus
Group Association 2011 2010 2011 2010 £m £m £m £m
Interest receivable on bank deposits 0.8 2.2 - -
Other interest earned 0.1 0.8 - -
Interest receivable from unlisted investments 0.9 - - -
Dividend from joint ventures - 1.2 - -
Interest from subsidiaries - - 0.2 0.4
1.8 4.2 0.2 0.4
7. Interest receivable and other income
6. Surplus on sale of fixed assets – housing properties Group 2011 2010 £m £m
Sales proceeds 17.0 12.5
Cost of sales (12.1) (6.5)
4.9 6.0
Cost of sales includes fees incurred in addition to the asset carrying value.
Notes to the financial statements for the year ended 31 March 2011 (continued)
Interest on loans 24.4 31.2 - -
Interest on bonds 22.3 19.9 - -
Loan breakage costs - net 5.9 4.7 - -
Other interest payable 2.4 2.0 - -
Interest payable on derivatives 21.1 20.0 - -
Other finance costs – pension FRS 17 0.8 1.2 0.3 -
Finance charges re finance leases 0.1 0.4 - -
RCGF/DPF - 0.1 - -
Interest to subsidiaries - - 1.0 1.4
77.0 79.5 1.3 1.4
Interest payable capitalised on Housing
Properties under construction (4.7) (5.5) - -
72.3 74.0 1.3 1.4
Capitalisation rate used to determine the
finance costs capitalised during the period 4.40% 4.22% - -
8. Interest payable and similar charges
Group Association 2011 2010 2011 2010 £m £m £m £m

43 44Circle Anglia Group Annual Report and Financial Statements 2010 / 11
Average monthly number of employees (FTE)
Administration 359 331 294 236
Care 522 513 - -
Developing or selling housing stock 36 60 26 39
Managing or maintaining housing stock 1,051 824 11 15
1,968 1,728 331 290
Staff Costs:
Wages and salaries 58.9 51.0 14.1 12.7
Social security costs 5.6 4.9 1.5 1.3
Other pension costs 4.1 3.6 1.0 1.0
68.6 59.5 16.6 15.0
9. Employees
Circle Support employs the majority of their staff directly. With the exception of Circle Support, and Anglia Maintenance Services Limited’s non-salary based employees, all other employees within the Group are employed by Circle Anglia Limited. The resulting employment costs attributable to each Association/Company are recharged via the Service Level Agreement (SLA).
Group Association 2011 2010 2011 2010 £m £m £m £m
Group Association 2011 2010 2011 2010 £m £m £m £m
During the year, Board members and Executive Officers received emoluments (including pension contributions and benefits in kind) totalling £1,320,059 (2010: £1,422,403). Expenses paid during the year to the Board and committee members amounted to £20,276 (2010: £16,076).
The emoluments of the highest paid director, the Chief Executive, excluding pension contributions, were
£235,106 (2010: £229,465). Pension contributions paid into a defined contribution scheme on behalf of the Chief Executive were £56,375 (2010: £56,375).
At 31 March 2011, there were 11 members of staff whose annual pay exceeded £100,000.
The executive officers, including the Chief Executive, participate in the pension scheme on the same terms as all other eligible staff.
Board members and Executive Officers
Notes to the financial statements for the year ended 31 March 2011 (continued)
Remuneration in the year to the non-executive Management Board members of Circle is shown as follows:
(1) Chair of the Remuneration and Succession Committee
(2) Chair of the Audit and Risk Committee
2011 2010 Fees Expenses Total Total
Sir Robin Young 25,000 336 25,336 10,309
Robert Burgin 12,000 879 12,879 12,555
Martin Shaw OBE (1) 12,000 - 12,000 12,000
Jane Clarkson JP 12,000 1,829 13,829 15,127
Murray Foster 12,000 2,931 14,931 12,000
Baroness Jones of Whitchurch 14,100 314 14,414 14,100
Simon Braid (2) 10,000 1,132 11,132 -
Tania Brisby - - - -
Jane Gurney-Read 3,313 1,060 4,373 -
Brenda Reynolds 3,500 201 3,701 -
103,913 8,682 112,595 76,091
Former non-executive management Board members:
Alan Catterick 9,000 582 9,582 12,387
Nicola Lucking 3,000 629 3,629 12,000
Michael Webber 5,956 - 5,956 12,000
17,956 1,211 19,167 36,387
Total 121,869 9,893 131,762 112,478

45 46Circle Anglia Group Annual Report and Financial Statements 2010 / 11
UK corporation tax charge on surpluses for the year 0.3 0.4 - 0.4
Adjustment in respect of prior years (0.1) 0.2 (0.1) 0.2
Total current tax charge 0.2 0.6 (0.1) 0.6
Deferred tax
Net origination and reversal of timing differences (excluding pension charge) (0.1) (0.1) - -
Deferred tax on pension charge 0.1 - 0.1 (0.1)
Total deferred tax charge - (0.1) 0.1 (0.1)
Tax charge on surpluses for the year 0.2 0.5 - 0.5
10. Tax on surplus on ordinary activities
Group Association 2011 2010 2011 2010 Current Tax £m £m £m £m
Surplus on ordinary activities before tax 28.3 12.4 0.1 0.5
Surplus on ordinary activities multiplied by standard rate of corporation tax in the UK of 28% (2010: 28%) 7.9 3.4 - 0.1
Timing differences on exceptional pension credits (1.2) - (1.0) -
Surpluses of charitable entities not subject to corporation tax (8.9) (1.1) - -
Depreciation in excess of capital allowances 0.4 0.2 0.5 0.1
Other non-deductible expenditure, net of allowable capital costs 4.6 (4.1) 0.1 0.3
Other timing differences (3.3) - - -
Losses carried forward - 2.0 - -
Utilisation of losses 0.8 - 0.5 (0.1)
Adjustments in respect of prior years (0.1) 0.2 (0.1) 0.2
Total current tax charge 0.2 0.6 - 0.6
Group Association 2011 2010 2011 2010 Current year tax reconciliation £m £m £m £m
Notes to the financial statements for the year ended 31 March 2011 (continued)
Group – housing properties11. Tangible fixed assets
Completed Properties Housing Properties Under Construction
Housing Shared Housing Shared properties ownership properties ownership held for housing held for housing letting properties letting properties Total £m £m £m £m £m
Cost
As at 1 April 2010 2,793.1 278.9 152.4 56.1 3,280.5
Movements in the year
Additions:
- Spend in new 2010/2011 WIP schemes - - 2.7 1.3 4.0
- Works in existing properties / schemes 73.3 8.5 75.1 22.5 179.4
Capitalised interest - - 2.3 1.1 3.4
Agency schemes transferred to stock - - (29.2) (0.5) (29.7)
Schemes completed in the year 94.8 19.9 (94.8) (19.9) -
Re-classification 2.3 - 6.5 (7.8) 1.0
Disposals (9.2) (12.5) - - (21.7)
Impairments (8.7) (1.3) - (0.7) (10.7)
Asset write-offs (0.2) - (0.4) (0.6) (1.2)
Transfers from WIP (1.8) - 4.9 2.4 5.5
As at 31 March 2011 2,943.6 293.5 119.5 53.9 3,410.5
Social housing grant
As at 1 April 2010 (1,115.2) (76.3) (96.5) (38.7) (1,326.7)
Additions:
- New schemes - - (5.8) (0.8) (6.6)
- Existing properties / schemes (6.3) 0.2 (35.4) (2.1) (43.6)
Agency schemes transferred to stock - - 26.0 0.6 26.6
Schemes completed in the year (39.9) (3.2) 35.7 7.4 -
Re-classification 17.1 - (17.9) (0.2) (1.0)
Disposals 1.5 0.2 - - 1.7
As at 31 March 2011 (1,142.8) (79.1) (93.9) (33.8) (1,349.6)
Depreciation
As at 1 April 2010 (99.8) (2.2) - - (102.0)
Charged in the year (22.2) - - - (22.2)
Released on disposal 0.4 0.1 - - 0.5
As at 31 March 2011 (121.6) (2.1) - - (123.7)
Net book value as at 31 March 2011 1,679.2 212.3 25.6 20.1 1,937.2
As at 31 March 2010 1,578.1 200.4 55.9 17.4 1,851.8
47 48Circle Anglia Group Annual Report and Financial Statements 2010 / 11
Works to existing properties The amount spent on existing properties during the year is as follows:
Capitalised in fixed assets 81.8 73.7
Expensed in the income and expenditure account 57.3 51.1
139.1 124.8
2011 2010 £m £m
On 31 March 2011, the Group’s housing properties were valued by FPD Savills Consulting, an independent firm of Chartered Surveyors, based on their full valuation at 31 March 2009 and updated for the following:
• Changes in stock numbers during the year
• Average rental increases
• Any significant variances in the expenditure profile
In determining these valuations valuers made use of discounted cash flow methodology and the following assumptions were made:
Future rent increases Retail Price Index plus 0.5% long-term
Real discount rates 4.5% - 7.0%
Valuations EUV-SH £2,441,576,000
Included in the total net book value of £1,937.2 million is £0.5 million (2010: £1.2 million) in respect of assets held under finance lease contracts. Depreciation for the year on these assets was £nil (2010: £nil).
Notes to the financial statements for the year ended 31 March 2011 (continued)
Tangible fixed assets - other
Cost
As at 1 April 2010 34.9 22.2 13.4 21.4 0.1 92.0
Additions - 12.7 1.2 2.4 - 16.3
Reclassification (34.8) 34.8 (0.1) - - (0.1)
Disposals (0.1) - - (0.5) - (0.6)
Transfers to assets under construction - 0.4 (1.2) (0.2) - (1.0)
As at 31 March 2011 - 70.1 13.3 23.1 0.1 106.6
Depreciation
As at 1 April 2010 - (5.2) (8.5) (14.5) (0.1) (28.3)
Charge for year - (0.2) (1.4) (3.1) - (4.7)
Disposals - - - 0.4 - 0.4
Transfers - - 0.2 0.2 - 0.4
As at 31 March 2011 - (5.4) (9.7) (17.0) (0.1) (32.2)
Net Book Value
As at 31 March 2011 - 64.7 3.6 6.1 - 74.4
As at 31 March 2010 35.0 17.0 4.8 6.9 - 63.7
Group Leasehold/ Furniture, freehold fixtures & Computer Motor Properties offices fittings equipment vehicles Total £m £m £m £m £m £m
11. Tangible fixed assets (continued)

49 50Circle Anglia Group Annual Report and Financial Statements 2010 / 11
Tangible fixed assets - other
Association Leasehold/ Furniture, Computer freehold offices fixtures & fittings equipment Total £m £m £m £m
Cost
As at 1 April 2010 - 3.9 8.3 12.2
Additions during year - 0.5 2.0 2.5
Transfer 0.4 (0.4) 0.1 0.1
As at 31 March 2011 0.4 4.0 10.4 14.8
Depreciation
As at 1 April 2010 - (1.4) (3.6) (5.0)
Charge for year - (0.7) (2.2) (2.9)
As at 31 March 2011 - (2.1) (5.8) (7.9)
Net Book Value
As at 31 March 2011 0.4 1.9 4.6 6.9
As at 31 March 2010 - 2.5 4.7 7.2
Notes to the financial statements for the year ended 31 March 2011 (continued)
Circle Thirty Three Housing Trust Limited 100 3 - 3 - -
Wherry Housing Association Limited 100 3 - 3 - -
South Anglia Housing Limited 100 3 - 3 - -
Anglia Maintenance Services Limited 100 - 3 - - -
Old Ford Housing Association 100 - 3 3 - -
Mole Valley Housing Association 100 3 - 3 - -
Roddons Housing Association 100 3 - 3 - -
Russet Housing Association Limited 100 3 - 3 - -
Invicta Telecare Limited 100 - 3 - - -
Circle Anglia Treasury Limited 100 - 3 - - -
Circle Anglia Social Housing plc 100 - 3 - - -
Circle Care and Support Limited 100 - 3 - 3 -
(formerly EPIC Trust)
Your Lifespace Limited 100 - 3 - - -
Circle Anglia Foundation Limited 100 - 3 - 3 -
Circle Living Limited 100 - 3 - - -
Old Ford Homes Limited 100 - 3 - - -
Thackeray Mews Limited 62 - 3 - - -
Landericus Limited * 92.9 - 3 - - -
Mercian Housing Association Limited 100 3 - 3 - -
Art Homes Limited 100 - 3 - - 3Zenith Developments Limited 100 - 3 - - -
Merton Priory Homes Limited 100 3 - 3 - -
Leamington Waterfront LLP 100 - 3 - - -
Investments in subsidiaries
Registered % Share Registrar with Financial Capital Friendly Companies Housing Charity Services Owned Societies Registrar Corporation Commision Authority
12. Investments11. Tangible fixed assets (continued)

51 52Circle Anglia Group Annual Report and Financial Statements 2010 / 11
Included in investments are:
Investments comprise a long term loan of £10,000, a loan to UK Rents (No1) plc of £110,060 representing 2% of the securitisation loan which is withheld by UK Rents (No1) plc as a cash reserve under the terms of the loan agreement, and the market value of £4,410,863 (2010: £974,113) comprising of gilt edged stock, cash and other Housing Association debenture stocks which are held in
accordance with the terms of the issue of 7% Secured Bonds (Haven Funding (32) plc). The Association can only draw on the Haven Funding (32) plc investment on maturity of the loan.
During the year Invicta Telecare Limited was sold by Circle Anglia Limited to Circle Living Limited.
All of the above are participants in the Group Borrowing Facility with the exception of Circle Anglia Social Housing plc, Circle Living Limited, Circle Care and Support Limited (formerly EPIC Trust Limited), Anglia Maintenance Services Limited, Your Lifespace Limited, Circle Anglia Foundation Limited, Invicta Telecare Limited, Art Homes Limited, Zenith Developments Limited, ºOld Ford Homes Limited, Landericus Limited,
Thackeray Mews Limited and Leamington Waterfront LLP.
The subsidiaries are all incorporated in the United Kingdom apart from Landericus Limited which is a Guernsey registered company.
* Landericus Limited is the parent Company of the following (owning 100% of each); Landericus Property Holding S.a.r.l, Landericus Property Alpha S.a.r.l, Landericus Property Beta S.a.r.l, Landericus Property Delta
S.a.r.l, Landericus Property Gamma S.a.r.l, Landericus Property Epsilon S.a.rl, Landericus Property Zeta S.a.r.l, Landericus Property Eta S.a.r.l.
Procedure Agreements exist between Circle Anglia Limited and the subsidiaries covering the respective obligations of all parties.
Group Association 2011 2010 2011 2010 £m £m £m £m
Cost of shares - Circle Anglia Social Housing Plc - - 0.1 0.1
Cost of shares – Invicta Telecare Limited - - - 0.2
Costs of acquiring Mercian Housing Association - - 0.8 0.8
Listed investments 4.4 1.0 - -
Unlisted investments 0.2 0.2 - -
4.6 1.2 0.9 1.1
Notes to the financial statements for the year ended 31 March 2011 (continued)
Operating surplus/(deficit) and total assets less current liabilities of the principal subsidiary undertakings at 31 March 2011: Total assets less Surplus/ (deficit) current liabilities 2011 2010 2011 2010 £m £m £m £m
Anglia Maintenance Services Limited 1.5 (0.7) 0.2 (0.5)
Circle Anglia Foundation Limited - - 0.5 0.4
Circle Anglia Treasury Limited - - 1,585.6 1,338.3
Circle Anglia Social Housing Plc - - 414.1 275.1
Circle Living Limited 0.2 - 0.3 -
Circle Thirty Three Housing Trust Limited 3.5 (10.2) 108.3 126.1
Circle Care & Support (formerly Epic Trust) 0.4 0.5 2.3 2.0
Your Lifespace Limited 1.3 (10.0) (6.6) (4.8)
Old Ford Homes Limited - 0.1 0.4 0.4
Old Ford Housing Association (0.8) (0.9) 28.3 43.5
South Anglia Housing Limited (1.2) (0.8) (4.5) (3.2)
Wherry Housing Association Limited 1.3 0.2 2.0 0.6
Mole Valley Housing Association 4.6 3.4 52.2 60.3
Roddons Housing Association 2.1 0.4 30.8 30.2
Russet Housing Association 11.4 10.4 24.0 160.6
Invicta Telecare Limited 1.1 (0.1) 0.6 0.3
Thackeray Mews Limited - - - -
Landericus Limited 0.7 0.4 49.9 36.7
Mercian Housing Association Limited - (4.8) 36.6 72.3
Art Homes Limited (0.1) - 1.6 4.1
Zenith Developments Limited 0.1 (0.1) 0.2 0.1
Merton Priory Homes Limited 10.7 (2.6) 187.5 207.7
Leamington Waterfront LLP 8.3 - (0.2) -
45.1 (14.8) 2,514.1 2,350.2
12. Investments (continued)

53 54Circle Anglia Group Annual Report and Financial Statements 2010 / 11
Investment joint ventures
Class and Country of Principal Percentage of Parent Incorporation Activity Shares Held Company
Associated undertakings - joint ventures
Tredegar Development England Development 50% Old Ford
Company Limited of property 1 £1 Ordinary B Homes
Share Limited
T3B Development Company Limited England Development 50% Old Ford of property 1 £1 Ordinary B Homes
Share Limited
Wideacre Lifespace Scott LLP England and Development 50% Your
Wales of property 1 £1 Ordinary B Lifespace
Share Limited
Wideacre Lifespace Saffron LLP England and Development 50% Your
Wales of property 1 £1 Ordinary B Lifespace
Share Limited
Associated undertakings - associates
Key London Alliance England and Development 25% Circle 33
Wales of property Housing
Trust Limited
The total of the Group’s loss before taxation from interests in associates and joint ventures was £204,000 (2010: loss before taxation £5,411,000).
The amounts included in respect of joint ventures and associates comprise the following:
Joint Ventures Total Associate Total 2011 2010 2011 2010 £m £m £m £m
Share of turnover - 4.3 - 0.1
Share of assets
- Share of current assets 0.1 0.1 - -
Share of liabilities
- Due within one year (0.1) (0.1) - -
Share of net liabilities - - - -
Notes to the financial statements for the year ended 31 March 2011 (continued)
Warehouse stores and work in progress are held by Anglia Maintenance Services Limited and Roddons Housing Association Limited.
Stock of housing properties comprises acquisition and development expenditure on shared ownership properties first tranche. Capitalised development interest charged to stock during the year is £1,323,000 (2010: £282,000).
Parts and warehouse stores 0.1 0.1
Work in progress 0.1 0.1
Completed properties 23.9 33.6
Properties under construction 37.9 20.4
62.0 54.2
Fixed asset investments represent amounts falling due from borrowers on varying types of loan agreement and includes amounts in respect of Property Appreciation Loans (PAL). Such loans can include repayment periods in excess of sixty years.
Grants received to enable loan funds to be established are credited to deferred income upon receipt. Upon lending to borrowers, the grants are transferred to fixed asset investments where they are netted off the amount owed by the borrower.
Group 2011 2010 £m £m
13. Stock and work in progress
12. Investments (continued)Investments – loans
Loans 13.0 30.9
Grants (13.0) (30.9)
- -
Group 2011 2010 £m £m

55 56Circle Anglia Group Annual Report and Financial Statements 2010 / 11
14. Debtors
Due after more than one year:
Amount due from subsidiaries - - 2.3 7.5
Stock transfer – future works 259.8 316.5 - -
Total debtors - due after more than one year 259.8 316.5 2.3 7.5
Due within one year:
Rent and service charges receivable 19.9 19.2 - -
Less: Provision for bad and doubtful debts (8.3) (7.7) - -
11.6 11.5 - -
Amounts due from subsidiary undertakings - - 6.3 11.3
Stock transfer – future works 64.4 44.1 - -
Other debtors 12.1 15.9 1.5 1.1
Prepayments and accrued income 7.5 5.8 0.8 0.6
Deferred taxation 0.1 0.1 - 0.1
Deferred interest indexation - - - -
Other taxation & social security - 0.8 - -
84.1 66.7 8.6 13.1
Total debtors - due within one year 95.7 78.2 8.6 13.1
Group Association 2011 2010 2011 2010 £m £m £m £m
16. Creditors: Amounts falling due within one year
Bank overdrafts are secured by a fixed and/or floating charge over the assets of the relevant subsidiaries.
Bank overdraft (note 19) 6.5 9.6 - -
Bank loans and borrowings (note 19) 2.9 23.2 - -
9.4 32.8 - -
Trade creditors 6.5 21.2 0.5 1.2
Capital creditors 5.6 1.6 - -
Rent and service charge received in advance 6.3 5.6 - -
Amount owed to Group undertakings - - 7.5 10.7
Recycled capital grant fund (note 18) 2.6 4.1 - -
Disposal proceeds fund (note 18) 1.6 3.6 - -
Corporation Tax 0.3 0.4 - 0.4
Other taxation and social security 1.7 1.6 1.6 1.5
Other creditors 3.5 11.0 0.6 0.7
Stock transfer – future works 64.3 44.1 - -
Accruals and deferred income 61.1 62.4 1.8 1.8
Total creditors - due within one year 162.9 188.4 12.0 16.3
Group Association 2011 2010 2011 2010 £m £m £m £m
15. Current asset investments
The collateral deposits represent a cash deposit that the Group has to place with a derivative counterparty when the fair value of a derivative or portfolio of derivatives exceeds an agreed amount.
Short term investments - 0.9 - -
Money market deposits – collateral - 1.4 - -
Money market deposits - 10.4 - -
- 12.7 - -
Group Association 2011 2010 2011 2010 £m £m £m £m
Notes to the financial statements for the year ended 31 March 2011 (continued)

57 58Circle Anglia Group Annual Report and Financial Statements 2010 / 11
17. Creditors: amounts falling due after more than one year
18. Reconciliation of RCGF and DPF balances
19. Debt analysis
The £10.8 million Orchardbrook loan was repaid during the course of the year and irrecoverable notices of prepayment have been issued for £23.3 million of fixed debt held in the Registered Providers, which were refinanced by loans from Circle Anglia Treasury Limited.Of the total loans above £1,526.3 million (2010: £1,329.9 million) was drawn from committed facilities of £1,992.4 million (2010: £1,683.0 million), arranged through the Group’s borrowing vehicle, Circle Anglia Treasury Limited, of which £385.0 million (2010: £275 million)
is represented by the Bond issue through Circle Anglia Social Housing Plc.Circle Anglia Treasury Limited directly funds the borrowing requirements of the charitable RPs within the Group. £51.1 million (2010: £103.3 million) of facilities still reside within the charitable RPs (£0.7 million finance lease in Wherry Housing Association, £21.7 million in historic bonds and loans in Circle 33 Housing Trust, £28.7 million in Mercian Housing Association). Under the facilities, the loans which
are repayable at various dates through to 2048 and are secured by fixed charges over the completed housing properties of the participating Group members and a series of cross guarantees. The weighted average utilised facility life is 9 years and the weighted average rate of interest charged was 4.58% (2010: 4.6%). The weighted average facility expiry is 27 years.
The obligations under finance leases and hire purchase contracts represent outstanding capital on leasing commitments linked to deferred mortgages.
The provisions for stock transfer works relates to the costs of the works programme to be undertaken on stock transferred from the local authority and reflects legally binding obligation to undertake works under refurbishment contracts. The amounts are broken down between amounts due in less than one year and amounts due after more than one year.
Bank loans and borrowings (note 19) 1,641.6 1,528.8 - -Obligations under finance leases (note 19) 1.1 1.4 - - 1,642.7 1,530.2 - - Recycled Capital Grant Fund (note 18) 2.5 4.4 - -Disposal Proceeds Fund (note 18) 2.6 2.2 - -Amounts owed to Group undertakings - - 10.4 13.1Other creditors 0.3 0.6 - -Financial deferred income 1.0 1.1 - -Other deferred Income 1.7 3.9 - -Stock transfer – future works 259.9 316.5 - -
Total creditors - due after more than one year 1,910.7 1,858.9 10.4 13.1
As at 1 April 2010 8.5 5.8 Inputs to reserve: - Grants recycled (0.1) 1.7- New build (3.3) (3.3)As at 31 March 2011 5.1 4.2 Amount due for repayment to the Homes and Communities Agency - due within 1 year 2.6 1.6 - due within 2–3 years 2.5 2.6
As at 31 March 2011 5.1 4.2
Due within one year
Bank overdraft 6.5 9.6 - -
Bank loans 2.9 12.4 - -
Orchardbrook loans - 10.8 - -
9.4 32.8 - -
Due after more than one year
Bank loans 1,264.0 1,258.8 - -
Bonds 377.6 270.0 - -
Obligations under finance leases 1.1 1.4 - -
1,642.7 1,530.2 - -
1,652.1 1,563.0 - -
Within one year 9.4 32.8 - -
Between one and two years 4.6 1.0 - -
Between two and five years 27.0 11.0 - -
After five years 1,611.1 1,518.2 - -
1,652.1 1,563.0 - -
RCGF DPF £m £m
Group Association 2011 2010 2011 2010 £m £m £m £m
Group Association 2011 2010 2011 2010 £m £m £m £m
Housing and non - housing loans Group Association 2011 2010 2011 2010 £m £m £m £m
Notes to the financial statements for the year ended 31 March 2011 (continued)

59 60Circle Anglia Group Annual Report and Financial Statements 2010 / 11
19. Debt analysis (continued)Landericus has separate borrowings of £30.6 million (34.2 million). Included within the debt are fair value amounts of £15.7 million relating to the acquisition of Mercian Housing Association and £20.9 million relating to the acquisition of Russet Homes
Limited. The fair value adjustments represent the difference between the book value and the fair value at the date of the acquisitions and this is the price the loans are carried at in the accounts. Also included within the debt are
Bond premium of £4.4 million and interest of £0.4 million on the finance lease.The following tables show the maturity and margins on the principle borrowings:
Maturity of debt
Maturity of borrowings
Maturity of facilities
Funding Group Non Funding Group
Loans falling Loans falling due after due after Short term more than Short term more than Group borrowings one year Total borrowings one year Total Total £m £m £m £m £m £m £m
Revolver - 180.1 180.1 - - - 180.1
Term 0.7 996.5 997.2 0.4 30.2 30.6 1,027.8
Bond 0.1 397.5 397.6 - - - 397.6
Other 0.1 1.6 1.7 - - - 1.7
Finance Lease - 0.7 0.7 - - - 0.7
0.9 1,576.4 1,577.3 0.4 30.2 30.6 1,607.9
Unamortised
arrangement fees (0.4) (9.1) (9.5) (0.1) (0.3) (0.4) (9.9)
Maturity of debt as
at 31 March 2011 0.5 1,567.3 1,567.8 0.3 29.9 30.2 1,598.0
Maturity of debt as
at 31 March 2010 17.7 1,305.4 1,323.1 12.4 188.6 201.0 1,524.1
Revolver - 180.1 180.1
Term 1.1 1,026.7 1,027.8
Bond 0.1 397.5 397.6
Other 0.1 1.6 1.7
Finance Lease - 0.7 0.7
1.3 1,606.6 1,607.9
Unamortised arrangement fees (0.5) (9.4) (9.9)
Maturity of debt as at 31 March 2011 0.8 1,597.2 1,598.0
Maturity of debt as at 31 March 2010 30.1 1,494.0 1,524.1
Group Short term Loans falling due borrowings after more than Total £m one year £m £m
Revolver - 0.4 4.8 389.8 395.0
Term 1.1 2.4 16.8 1,241.7 1,262.0
Bond 0.1 0.1 0.5 415.0 415.7
Other 0.1 0.1 0.4 1.1 1.7
Finance Lease - - - 0.7 0.7
Maturity of debt as at 31 March 2011 1.3 3.0 22.5 2,048.3 2,075.1
Maturity of debt as at 31 March 2010 37.8 1.0 11.0 1,935.5 1,985.3
Group Between Between Within one one and one and After five year two years two years years Total £m £m £m £m £m
Revolver - 0.4 4.8 174.9 180.1
Term 1.1 2.4 16.8 1,007.5 1,027.8
Bond 0.1 0.1 0.5 396.9 397.6
Other 0.1 0.1 0.4 1.1 1.7
Finance Lease - - - 0.7 0.7
1.3 3.0 22.5 1,581.1 1,607.9
Unamortised arrangement fees (0.5) (0.5) (1.2) (7.7) (9.9)
Maturity of debt as at 31 March 2011 0.8 2.5 21.3 1,573.4 1,598.0
Maturity of debt as at 31 March 2010 30.1 0.7 10.2 1,483.1 1,524.1
Group Between Between Within one one and one and After five year two years two years years Total £m £m £m £m £m
Notes to the financial statements for the year ended 31 March 2011 (continued)

61 62Circle Anglia Group Annual Report and Financial Statements 2010 / 11
19. Debt analysis (continued) 20. Financing deferred income
21. Deferred tax
22. Financial commitments
Interest rate analysis
Currency and interest rate analysis of debt
Group Fixed Floating Fixed interest Time fixed Total rate rate rate rate debt £m £m £m % in Years
Group Fixed Floating Fixed interest Time fixed Total rate rate rate rate debt £m £m £m % in Years
Revolver 180.1 142.6 37.5 4.1% 14
Term 1,027.8 - 1,027.8 4.3% 12
Bond 397.6 - 397.6 7.4% 26
Other 1.7 - 1.7 5.2% 11
Finance Lease 0.7 - 0.7 10.5% 16
As at 31 March 2011 1,607.9 142.6 1,465.3 5.1% 16
As at 31 March 2010 1,532.0 92.2 1,439.8 7.0% 23
Cash
Deposits (41.6) - (41.6) 8.9% 17
Collateral Deposits (1.5) (1.5) - 0.0% 0
Cash and Deposits (43.1) (1.5) (41.6) 8.5% 16
Net Borrowings 1,564.8 141.1 1,423.7 5.1% 16
Sterling 1,577.3 133.7 1,443.6 5.1% 16
Euro 30.6 8.9 21.7 5.0% 9
As at 31 March 2011 1,607.9 142.6 1,465.3 5.1% 16
As at 31 March 2010 1,532.0 131.2 1,400.8 4.6% 19
The above numbers are based on the notional amount and do not include any adjustments for the issue premium to the amount of debt or effective interest rate.
As at 1 April - 0.2
Released in the year - (0.2)
Transferred to creditors less than one year - -
As at 31 March - -
Total - -
Expenditure contracted but not provided in the accounts 92.1 78.7Expenditure authorised by the Board, but not contracted - 84.0
As at 31 March 92.1 162.7
Deferred tax relating to gift aid paid post year-end - - - -
Provision for deferred taxation - - - -
Provision as at 1 April 0.1 - - -
Deferred tax credit for period (note 10) - 0.1 - -
Deferred tax asset as at 31 March 0.1 0.1 - -
Deferred income Group 2011 2010 £m £m
Capital expenditure Group 2011 2010 £m £m
Group Association 2011 2010 2011 2010 £m £m £m £m
Notes to the financial statements for the year ended 31 March 2011 (continued)
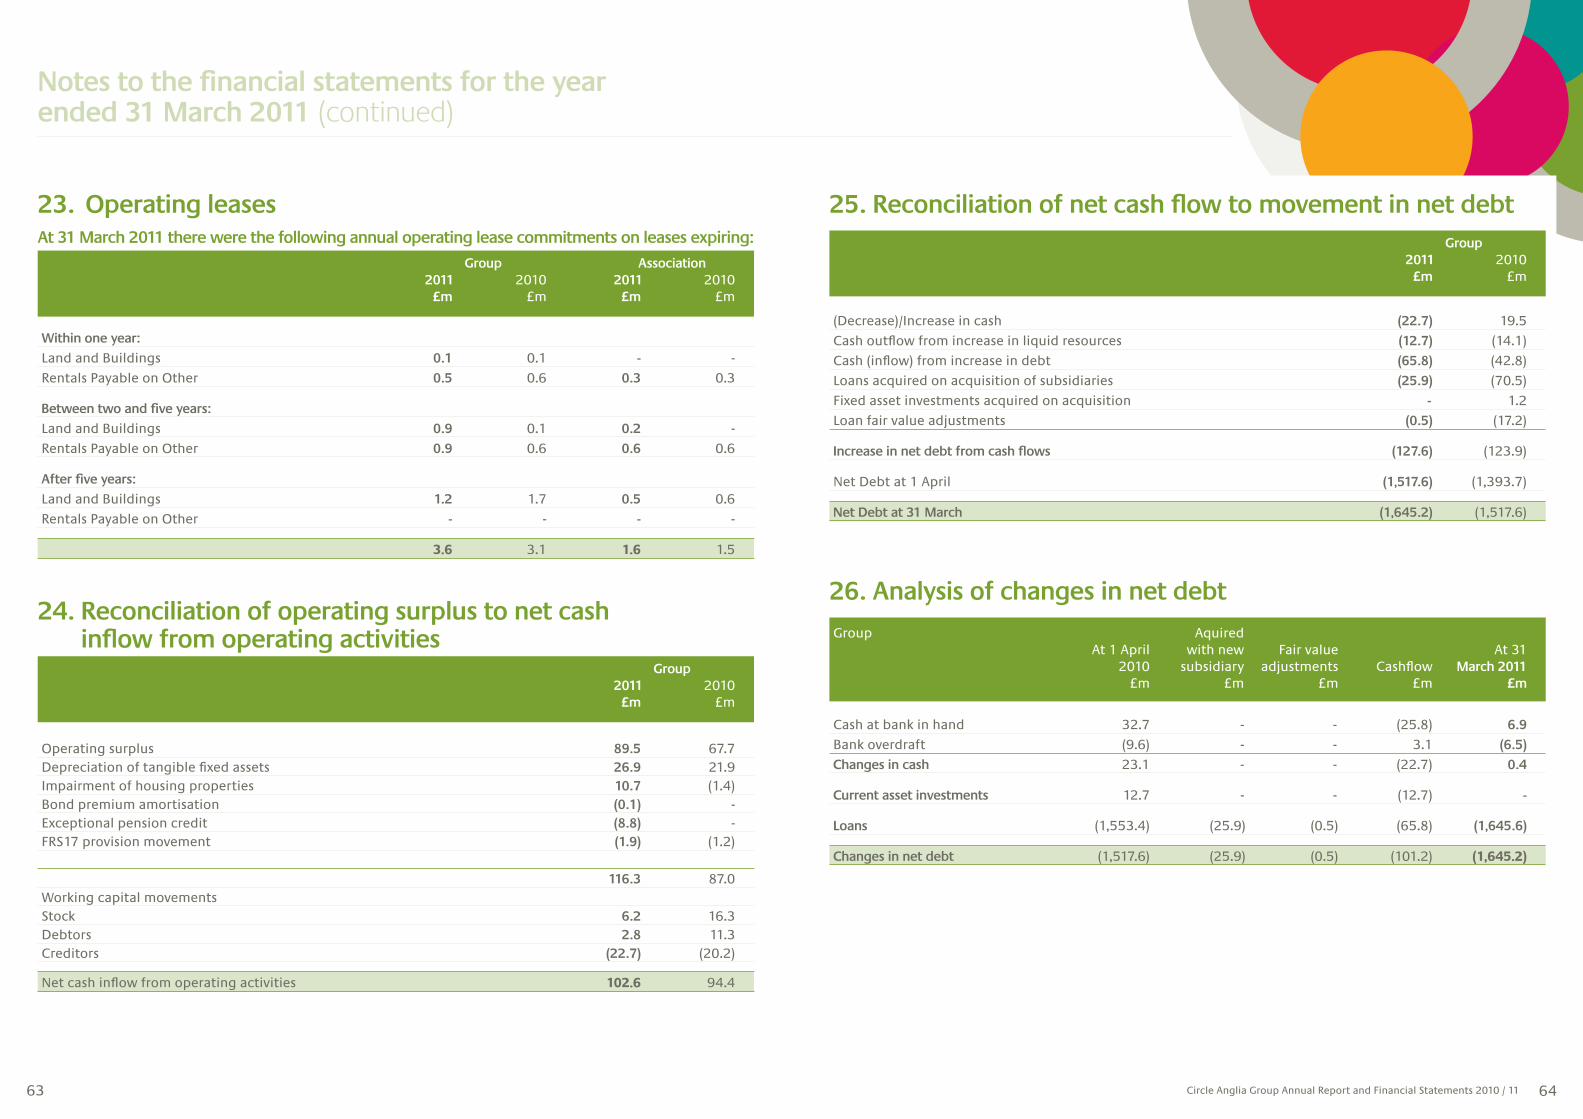
63 64Circle Anglia Group Annual Report and Financial Statements 2010 / 11
23. Operating leases
24. Reconciliation of operating surplus to net cash inflow from operating activities
At 31 March 2011 there were the following annual operating lease commitments on leases expiring:
Operating surplus 89.5 67.7Depreciation of tangible fixed assets 26.9 21.9Impairment of housing properties 10.7 (1.4)Bond premium amortisation (0.1) -Exceptional pension credit (8.8) -FRS17 provision movement (1.9) (1.2) 116.3 87.0Working capital movements Stock 6.2 16.3Debtors 2.8 11.3Creditors (22.7) (20.2)
Net cash inflow from operating activities 102.6 94.4
Within one year:
Land and Buildings 0.1 0.1 - -
Rentals Payable on Other 0.5 0.6 0.3 0.3
Between two and five years:
Land and Buildings 0.9 0.1 0.2 -
Rentals Payable on Other 0.9 0.6 0.6 0.6
After five years:
Land and Buildings 1.2 1.7 0.5 0.6
Rentals Payable on Other - - - -
3.6 3.1 1.6 1.5
25. Reconciliation of net cash flow to movement in net debt
26. Analysis of changes in net debt
Group Association 2011 2010 2011 2010 £m £m £m £m
Group 2011 2010 £m £m
Group 2011 2010 £m £m
Group Aquired At 1 April with new Fair value At 31 2010 subsidiary adjustments Cashflow March 2011 £m £m £m £m £m
Cash at bank in hand 32.7 - - (25.8) 6.9
Bank overdraft (9.6) - - 3.1 (6.5)
Changes in cash 23.1 - - (22.7) 0.4
Current asset investments 12.7 - - (12.7) -
Loans (1,553.4) (25.9) (0.5) (65.8) (1,645.6)
Changes in net debt (1,517.6) (25.9) (0.5) (101.2) (1,645.2)
(Decrease)/Increase in cash (22.7) 19.5
Cash outflow from increase in liquid resources (12.7) (14.1)
Cash (inflow) from increase in debt (65.8) (42.8)
Loans acquired on acquisition of subsidiaries (25.9) (70.5)
Fixed asset investments acquired on acquisition - 1.2
Loan fair value adjustments (0.5) (17.2)
Increase in net debt from cash flows (127.6) (123.9)
Net Debt at 1 April (1,517.6) (1,393.7)
Net Debt at 31 March (1,645.2) (1,517.6)
Notes to the financial statements for the year ended 31 March 2011 (continued)

65 66Circle Anglia Group Annual Report and Financial Statements 2010 / 11
28. Contingent liabilities
29. Contingent asset
Goodwill arising on acquisition of subsidiary 14.1Impairment of goodwill (4.5)
Goodwill recognised in the accounts 9.6
£m
The goodwill arising on acquisition has been reviewed for impairment and a prudent view was taken of the future trading results of the development. As a result of the review, an impairment of £4.5 million has been recognised in the Income and Expenditure Account.
Circle Thirty Three Housing Trust Limited is contracted to two performance bonds, one for £250,000 with Lewisham Borough Council and one for £78,840 with the London Borough of Islington. These have been set up to compensate the relevant District Council for the cost of finding a new contractor in the event of the Group’s non-performance. No events
have occurred which would result in the crystallisation of this bond.Wherry Housing Association has guaranteed the commitment of office leases taken out by Circle Anglia Limited, which are subject to annual payments of £167,000 (plus VAT) until 2016.Circle Support is contracted to a
financial guarantee for £37,000 with the London Borough of Camden for pension liabilities for staff that have been transferred under the Transfer of Undertakings (Protection of Employment) arrangements. No event has occurred that would result in the crystallisation of this guarantee.
During the year Art Homes Ltd administered Property Appreciation Loans (PAL) which contain a clause entitling the Company to an additional repayment in excess of the loan balance if the market value of the property used as security for the loan
increases during the duration of the loan. Due to the varying nature and uncertainty of the property market and the uncertainty in relation to potential crystallisation dates, it is not practicable to estimate the potential financial effect of the contingent
asset on the financial statements.No provision has been made in the financial statements for any additional repayments that may become due as a result of the above clause.
27. Acquisition of subsidiary undertaking
Work in progress 24.2 10.2Creditors (0.1) (0.1)Loans (25.9) (24.2)Net assets acquired (14.1)Consideration -
Goodwill arising on acquisition (14.1)
Fair value of net assets acquired Cost Fair Value £m £m
On 19 January 2011, Your Lifespace Limited and Circle Anglia Limited acquired the remaining 50% of the joint venture Leamington Waterfront LLP. The goodwill will be amortised over the trade out period matched against sales activity, which is planned to be 5.5 years
30. P
ensi
on o
blig
atio
ns
a) D
efine
d co
ntrib
utio
n sc
hem
es
Mem
bers
of t
he G
roup
als
o pa
rtic
ipat
e in
a n
umbe
r of
defi
ned
cont
ribut
ion
sche
mes
adm
inis
tere
d by
sev
eral
pen
sion
pro
vide
rs in
resp
ect
of c
erta
in
empl
oyee
s. T
he t
otal
of a
ll em
ploy
er p
ensi
on c
osts
in re
spec
t of
the
yea
r en
ded
31 M
arch
201
1 is
sho
wn
in t
he e
mpl
oyee
s no
te.
b) D
efine
d be
nefit
sch
emes
M
embe
rs o
f the
Gro
up o
pera
te a
num
ber
of d
efine
d be
nefit
pen
sion
sch
emes
, as
sum
mar
ised
bel
ow:
Not
e: D
etai
ls o
f al
l of
the
fund
s ca
n be
fou
nd in
th
e in
divi
dual
sta
tuto
ry a
ccou
nts.
Oth
er re
pres
ents
fo
ur P
ensi
on fu
nds
for C
ircle
Sup
port
and
Old
For
d ea
ch w
ith f
ewer
tha
n 10
mem
bers
and
the
refo
re
cons
ider
ed t
o be
bel
ow t
he m
ater
ialit
y le
vel
for
repo
rtin
g in
the
cons
olid
ated
acc
ount
s. T
he P
ensio
n
Fund
s ar
e:-
Islin
gto
n C
oun
cil
(Circ
le S
upp
ort
), Lo
ndon
Bor
oug
h of
Cam
den
(C
ircle
Sup
por
t),
Lond
on B
orou
gh o
f To
wer
Ham
lets
(Old
For
d) a
nd
Lond
on P
ensi
ons
Fund
Aut
horit
y (O
ld F
ord)
.
The
follo
win
g de
fined
ben
efit
sche
mes
hav
e 10
or
few
er a
ctiv
e m
embe
rs a
nd th
eref
ore
have
not
bee
n di
sclo
sed
on g
roun
ds o
f mat
eria
lity;
Nat
iona
l Hea
lth
Serv
ice
Pens
ion
Sche
me,
Soc
ial
Hou
sing
Pen
sion
Sc
hem
e.
Sch
eme
Su
rrey
Co
un
ty
Cam
bri
dg
esh
ire
Lo
nd
on
No
rfo
lk C
ou
nty
C
ou
nci
l C
ou
nty
Co
un
cil
Ken
t C
ou
nty
B
oro
ug
h
Sup
eran
nu
atio
n
Sup
eran
nu
atio
n
Sup
eran
nu
atio
n
Co
un
cil
of
Mer
ton
Fun
d
Fun
d
Fun
d
Pen
sio
n F
un
d
Pen
sio
ns
Fun
d
Oth
er
Tota
ls
Gro
up
Mem
ber
C
ircl
e A
ng
lia
Mo
le V
alle
y Ro
dd
on
s
M
erto
n
See
An
glia
M
ain
ten
ance
H
ou
sin
g
Ho
usi
ng
In
vict
a
Russ
et
Prio
ry
No
te
Lim
ited
Se
rvic
es
Ass
oci
atio
n
Ass
oci
atio
n
Tele
care
H
om
es
Ho
mes
b
elo
w
Gro
up s
umm
ary
Cu
rren
t n
um
ber
o
f em
plo
yees
in
the
sch
eme
60
5
3
39
7
9
171
61
15
0
14
627
Sch
eme
defi
cit
at
31 M
arch
201
1
(7.9
) (0
.7)
(0.4
) (0
.9)
(1.0
) (4
.3)
(0.1
) (0
.6)
(15.
9)
Def
erre
d t
ax a
sset
2
.2
0.2
-
- 0
.3
- -
- 2.
7
Net
sch
eme
defi
cit
at 3
1 M
arch
201
1
(5.7
) (0
.5)
(0.4
) (0
.9)
(0.7
) (4
.3)
(0.1
) (0
.6)
(13.
2)
Notes to the financial statements for the year ended 31 March 2011 (continued)

67 68Circle Anglia Group Annual Report and Financial Statements 2010 / 11
30. Pension obligations (continued)
Inflation 2.7 - 2.8% 3.3 - 3.9%Pension increase rate 2.7 - 2.9% 3.3 - 3.9%Salary increase rate 4.5 - 5.1% 5.1 - 5.4%Expected return on assets 6.7 - 7.0% 6.8 - 7.3%Discount rate 5.5% 5.5 - 5.6%
Equities 7.4 - 7.9% 7.5 - 8.0%Bonds 4.9 - 5.5% 5.0%Gilts 4.4% 4.5%Other Bonds 5.1 - 5.5% 5.2 - 5.5%Property 5.4 - 6.5% 5.5 - 7.3%Cash 0.5 - 4.6% 0.5 - 5.5%Target return portfolio 4.5% 4.5%Alternative assets 6.4% 6.5 - 7.5%
Equities 48.5 44.5Bonds 5.9 5.9Gilts 2.8 2.0Other Bonds 2.7 2.8Property 5.7 4.7Cash 1.7 2.6Target return portfolio 0.1 0.1Alternative assets 0.1 0.2
67.4 62.8
Current pensioner aged 65 19.8 - 21.9 23.0 - 24.0Future retiree upon reaching 65 21.9 - 23.9 24.9 - 26.5
2011 2010
2011 2010
Males Females in years in years
Total market value of assets 67.4 62.8Present value of scheme liabilities (83.0) (104.7) (15.6) (41.9)Present value of unfunded liabilities (0.3) (0.4) Scheme deficit (15.9) (42.3)Related deferred tax asset 2.7 6.0
Net pension liability (13.2) (36.3)
2011 2010 £m £m
Deficit in schemes at beginning of the year (42.3) (14.1)Opening balance of new entities at point of entrance - (4.9)Movement in year: Current service cost (2.7) (1.2)Settlements and curtailments - (0.2)Contributions by the employer 4.7 2.4Interest cost (5.3) (3.9)Expected return on assets 4.5 2.6Exceptional pension credit 9.9 -Actuarial gains/(losses) 15.3 (23.0)
Deficit in schemes at the end of the year (15.9) (42.3)
2011 2010 £m £m
2011 2010 £m £m
The assumptions relating to longevity underlying the pension liabilities at the balance sheet date are based on standard actuarial mortality tables and include an allowance for future improvements in longevity. The assumptions are equivalent to expecting a 65 year old to live for a number of years as follows:
The fair value of the assets held by the pension scheme and the expected rate of return for each asset is as follows:
Long term expected rates of return:
Fair Value:
The net pension deficit at the year end comprised the following:
The net pension deficit at the year end comprised the following:
Group summary (continued) Principal actuarial assumptions at the year end were as follows:
Group summary (continued)
Notes to the financial statements for the year ended 31 March 2011 (continued)

69 70Circle Anglia Group Annual Report and Financial Statements 2010 / 11
As at 1 April (105.1) (67.0)Current service cost (2.7) (1.1)Interest cost (5.3) (3.9)Contributions by members (0.9) (0.6)Settlements and curtailments - (0.2)Actuarial gains/(losses) 8.6 (34.1)Exceptional pension credit 9.9 -Estimated benefit paid 2.2 1.8
As at 31 March (83.3) (105.1)
As at 1 April 62.8 47.8Expected return on assets 4.5 2.6Contributions by the employer 4.7 2.4Contributions by members 0.9 0.6Actuarial (losses)/gains (3.3) 11.2Estimated benefits paid (2.2) (1.8)
As at 31 March 67.4 62.8
Equities 71.9% 70.9%Bonds 8.7% 9.4%Gilts 4.2% 3.2%Other Bonds 4.1% 4.5%Property 8.4% 7.5%Cash 2.5% 4.0%Target return portfolio 0.1% 0.2%Alternative assets 0.1% 0.3%
Current service cost 2.7 1.1Settlements and curtailments 0.1 0.2Exceptional pension credit (8.8) -
Total operating (credit)/charge (6.0) 1.3
Expected return on pension scheme assets 4.5 2.6Interest on pension scheme liabilities (5.3) (3.8)
Net cost (0.8) (1.2)
Analysis of the amount charged to operating surplus 2011 2010 £m £m
Analysis of the amount credited to other finance income 2011 2010 £m £m
2011 2010 £m £m
2011 2010 £m £m
2011 2010
Movement in the fair value of the plan assets:
The major categories of plan assets as a percentage of total plan assets are as follows:
Group summary (continued) Movement in the present value of defined benefit obligation:
History of plan The history of the plan for the current and prior periods is as follows:
History of experience gains and losses
Group summary (continued)
Present value of scheme liabilities (83.3) (105.1) (52.8) (52.9) (50.3)
Fair value of scheme assets 67.4 62.8 38.7 46.1 39.6
Deficit (15.9) (42.3) (14.1) (6.8) (10.7)
2011 2010 2009 2008 2007 £m £m £m £m £m
Experience adjustments on scheme liabilities 8.0 0.0 0.00 (0.8) 0.6Percentage of year end scheme liabilities 9.62% 0.00% 0.00% (1.51)% 1.19%Experience adjustments on scheme assets (2.7) 11.0 (13.1) (5.5) (0.3)Percentage of year end scheme assets (4.01)% 17.52% (33.85)% (11.93)% (0.76)%Total amount recognised in the Statement of Total Recognised Surpluses and Deficits 16.4 (23.1) (7.5) 2.3 3.9Percentage of year end scheme liabilities 19.69% (21.98)% (14.20)% 4.35% 7.75%
2011 2010 2009 2008 2007 £m/% £m/% £m/% £m/% £m/%
30. Pension obligations (continued)
The Group expects the employer’s contribution for the year ended 31 March 2012 to be approximately £3.2 million.
Notes to the financial statements for the year ended 31 March 2011 (continued)

71 72Circle Anglia Group Annual Report and Financial Statements 2010 / 11
Equities 7.5% 7.8%Bonds 4.9% 5.0%Property 5.5% 5.8%Cash 4.6% 5.5%
Inflation 2.8% 3.8%Pension increase rate 3.8% 3.8%Salary increase rate 5.1% 5.3%Expected return on assets 6.7% 6.9%Discount rate 5.5% 5.5%
Total market value of assets 19.7 20.3Present value of scheme liabilities (27.3) (35.8) (7.6) (15.5)Present value of unfunded liabilities (0.3) (0.3) Scheme deficit (7.9) (15.8)Related deferred tax asset 2.2 4.4
Net pension liability (5.7) (11.4)
Equities 13.5 13.6Bonds 3.3 3.4Property 2.2 2.0Cash 0.6 1.3
19.6 20.3
Deficit at the beginning of the year (15.8) (6.2)Current service costs (0.4) (0.2)Contributions paid 0.5 0.5Expected return on employer assets 1.5 1.0Past service costs 3.8 -Interest cost (1.8) (1.5)Settlements and curtailments - (0.1)Actuarial gain/(loss) 4.3 (9.3)
Deficit at the end of the year (7.9) (15.8)
As at 1 April (36.1) (21.6)Current service cost (0.4) (0.2)Interest cost (1.8) (1.5)Contributions by members (0.1) (0.2)Settlements and curtailments (0.1) (0.1)Actuarial gains/(losses) 6.2 (13.1)Past service costs 3.8 -Estimated benefit paid 0.9 0.6
As at 31 March (27.6) (36.1)
Current pensioner aged 65 21.2 23.4Future retiree upon reaching 65 23.6 25.8
The Norfolk County Council Superannuation FundThe Association operates a defined benefit scheme for employees, the assets of which are held in a separate trustee administered fund, the Norfolk County Council Superannuation Fund. The actuarial liabilities in relation to the scheme are subject to triennial valuation by independent actuaries. An actuarial valuation was carried out as at 31 March 2007 using the projected unit method. The overall expected rate of return is calculated by weighting the individual rates in accordance with the anticipated balance in the plan’s investment portfolio.
The assumptions relating to longevity underlying the pension liabilities at the balance sheet date are based on standard actuarial mortality tables and include an allowance for future improvements in longevity. The assumptions are equivalent to expecting a 65 year old to live for a number of years as follows:
The fair value of the assets held by the pension scheme and the expected rate of return for each asset is as follows:
Long term expected rates of return:
Fair Value
Movement in deficit in the year:
Movement in the present value of defined benefit obligation:
Principal actuarial assumptions at the year end were as follows:
The net pension deficit at the year end comprised the following:
Circle Anglia Limited30. Pension obligations (continued)
2011 2010
2011 2010
2011 2010 £m £m
2011 2010 £m £m
2011 2010 £m £m
2011 2010 £m £m
Males Females in years in years
Notes to the financial statements for the year ended 31 March 2011 (continued)
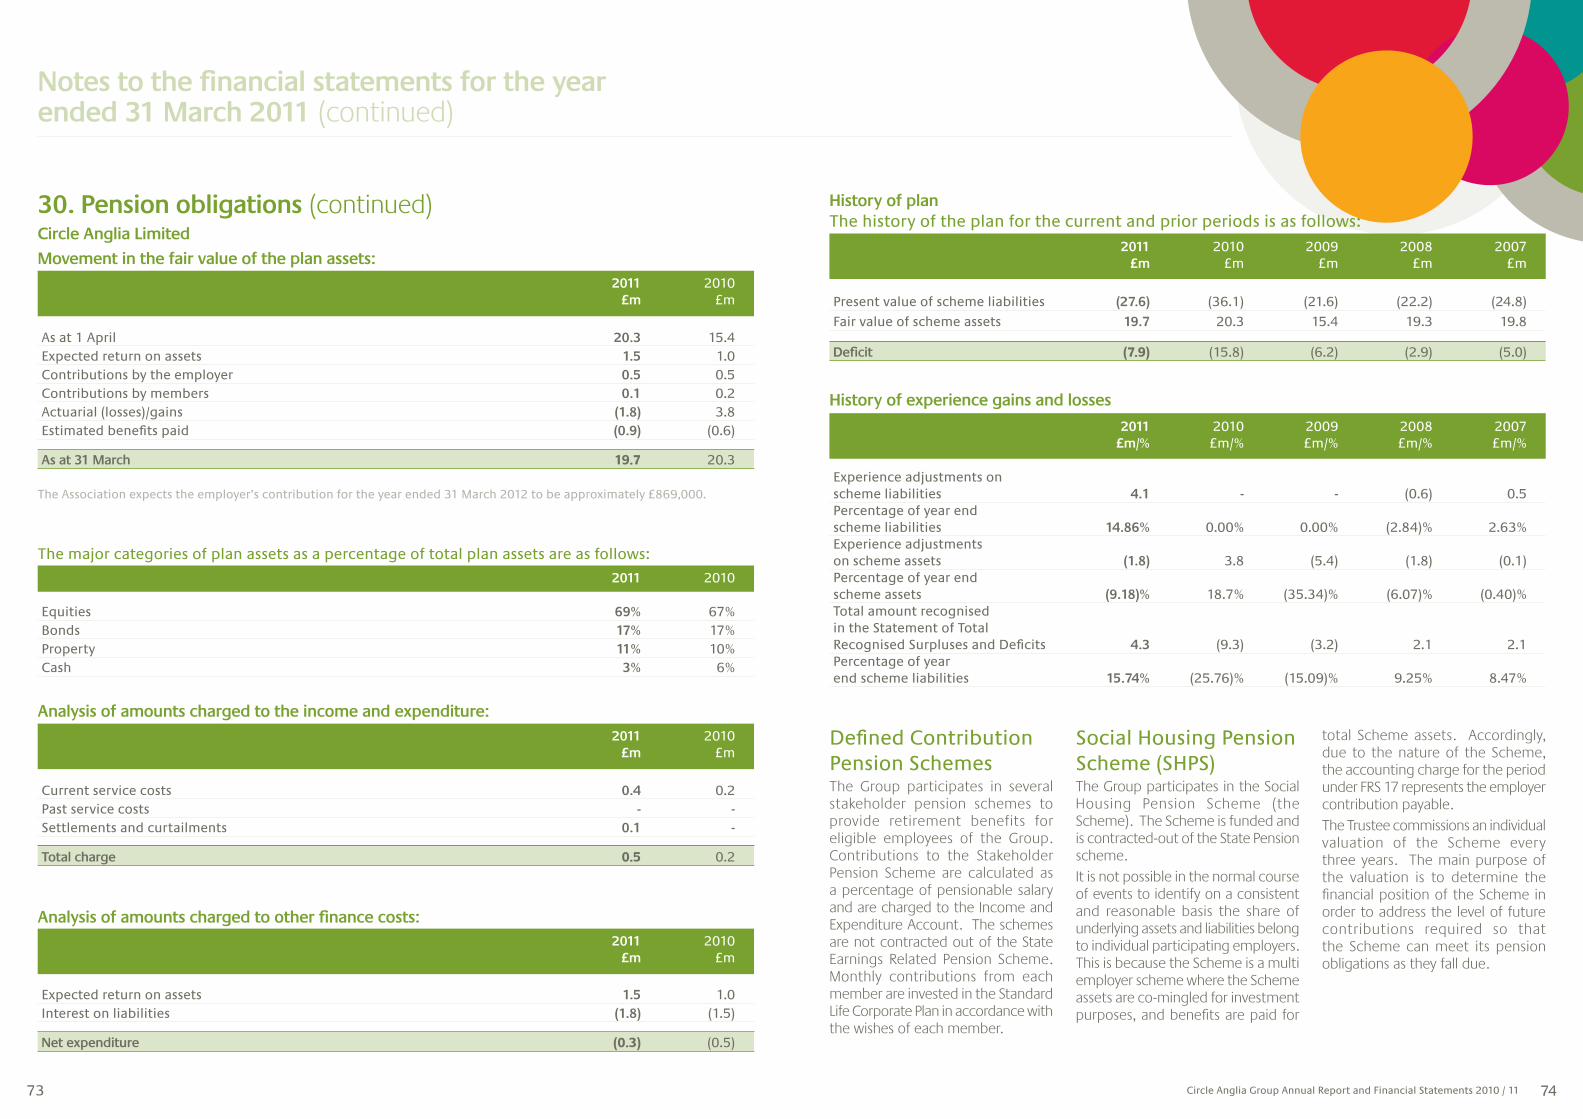
73 74Circle Anglia Group Annual Report and Financial Statements 2010 / 11
Equities 69% 67%Bonds 17% 17%Property 11% 10%Cash 3% 6%
2011 2010
As at 1 April 20.3 15.4Expected return on assets 1.5 1.0Contributions by the employer 0.5 0.5Contributions by members 0.1 0.2Actuarial (losses)/gains (1.8) 3.8Estimated benefits paid (0.9) (0.6)
As at 31 March 19.7 20.3
Current service costs 0.4 0.2Past service costs - -Settlements and curtailments 0.1 -
Total charge 0.5 0.2
Expected return on assets 1.5 1.0Interest on liabilities (1.8) (1.5)
Net expenditure (0.3) (0.5)
Movement in the fair value of the plan assets:
The major categories of plan assets as a percentage of total plan assets are as follows:
Analysis of amounts charged to the income and expenditure:
Analysis of amounts charged to other finance costs:
The Association expects the employer’s contribution for the year ended 31 March 2012 to be approximately £869,000.
2011 2010
2011 2010 £m £m
2011 2010 £m £m
2011 2010 £m £m
Defined Contribution Pension SchemesThe Group participates in several stakeholder pension schemes to provide retirement benefits for eligible employees of the Group. Contributions to the Stakeholder Pension Scheme are calculated as a percentage of pensionable salary and are charged to the Income and Expenditure Account. The schemes are not contracted out of the State Earnings Related Pension Scheme. Monthly contributions from each member are invested in the Standard Life Corporate Plan in accordance with the wishes of each member.
Social Housing Pension Scheme (SHPS)The Group participates in the Social Housing Pension Scheme (the Scheme). The Scheme is funded and is contracted-out of the State Pension scheme.It is not possible in the normal course of events to identify on a consistent and reasonable basis the share of underlying assets and liabilities belong to individual participating employers. This is because the Scheme is a multi employer scheme where the Scheme assets are co-mingled for investment purposes, and benefits are paid for
total Scheme assets. Accordingly, due to the nature of the Scheme, the accounting charge for the period under FRS 17 represents the employer contribution payable.The Trustee commissions an individual valuation of the Scheme every three years. The main purpose of the valuation is to determine the financial position of the Scheme in order to address the level of future contributions required so that the Scheme can meet its pension obligations as they fall due.
The history of the plan for the current and prior periods is as follows:History of plan
History of experience gains and losses
Present value of scheme liabilities (27.6) (36.1) (21.6) (22.2) (24.8)
Fair value of scheme assets 19.7 20.3 15.4 19.3 19.8
Deficit (7.9) (15.8) (6.2) (2.9) (5.0)
Experience adjustments on scheme liabilities 4.1 - - (0.6) 0.5Percentage of year end scheme liabilities 14.86% 0.00% 0.00% (2.84)% 2.63%Experience adjustments on scheme assets (1.8) 3.8 (5.4) (1.8) (0.1)Percentage of year end scheme assets (9.18)% 18.7% (35.34)% (6.07)% (0.40)%Total amount recognised in the Statement of Total Recognised Surpluses and Deficits 4.3 (9.3) (3.2) 2.1 2.1Percentage of year end scheme liabilities 15.74% (25.76)% (15.09)% 9.25% 8.47%
2011 2010 2009 2008 2007 £m/% £m/% £m/% £m/% £m/%
2011 2010 2009 2008 2007 £m £m £m £m £m
Notes to the financial statements for the year ended 31 March 2011 (continued)
Circle Anglia Limited
30. Pension obligations (continued)

75 76Circle Anglia Group Annual Report and Financial Statements 2010 / 11
The last formal valuation of the Scheme was performed as at 30 September 2008 by a professionally qualified Actuary using the Projected Unit Method. The market value of the Scheme’s assets at the valuation date was £1,527 million. The valuation revealed a shortfall of assets compared with the value of the liabilities of £663 million, equivalent to a past service funding level of 69.7%.The Scheme Actuary has prepared an
Actuarial Report that provides an approximate update on the funding position of the Scheme as at 30 September 2010. Such a report is required by legislation for years in which a full actuarial valuation is not carried out. The funding update revealed an increase in the assets of the Scheme to £1,985 million and indicated an increase in the shortfall of assets compared to liabilities to approximately £497
31. Provisions
Provision relating to investments - 3.3
- 3.3
2011 2010 £m £m
million, equivalent to a past service funding level of 80.0%.The next triennial formal valuation of the Scheme is due as at 30 September 2011. The results of the valuation will be available in the autumn of 2012.
33. Reserves
32. Non equity share capital
Shares of £1 each issued and fully paid As at 1 April 9 11Shares issued during the year 4 1Shares surrendered during the year (3) (3)
As at 31 March 10 9
With the exception of the Chief Executive Officer, each member of the Board of Management holds a non-equity share of £1 in the Association. The shares carry the right to vote at meetings of members on the basis of one share, one vote. They do not carry any right to a dividend, to any redemption value or to any distribution on winding up.
Group
As at 1 April 2010 0.7 0.5 5.1 316.8 323.1
Surplus for the year - - - 28.1 28.1
Transfer between reserves (0.1) - 0.1 - -
Surplus on exchange rates 0.2 0.2Pension actuarial gain net of deferred tax and exceptional pension credit - - - 13.2 13.2
Fair value adjustments from Leamington (JV to subsidiary) - - - (2.0) (2.0)
AMS 2010 WIP adjustment (0.4) (0.4)
As at 31 March 2011 0.6 0.5 5.2 355.9 362.2
Designated reserves Major Other repairs Improvements designated Revenue reserve Reserve reserves reserve Total £m £m £m £m £m
Major repairs reserves and improvements reserves represent the amount of accumulated surpluses put aside to fund major repairs and improvements expenditure on Group
properties, and as such are not freely available for general use. Other designated reserves represent the amounts for leaseholder sinking funds and supported housing and
general needs scheme upgrades.The revenue reserve is used towards funding the day-to-day operations of the Group
Social Housing Pension Scheme (SHPS) (continued)
Association 2011 2010 £ £
Notes to the financial statements for the year ended 31 March 2011 (continued)
30. Pension obligations (continued)

77 78Circle Anglia Group Annual Report and Financial Statements 2010 / 11
34. Reconciliation of movement in group and association funds
At 1 April (See note 33) 323.1 497.2 (11.6) (4.9)
Surplus / (deficit) for the financial year 28.1 12.4 - -
Surplus/(deficit) on exchange rates 0.2 (0.6) - -
Opening deficit on pension scheme - (3.9) - -
Prior year adjustments - (162.8) - -
Net actuarial gains/(losses) net of deferred tax
and exceptional pension credit 13.2 (19.2) 2.2 (6.7)
AMS 2010 WIP adjustment (0.4) - - -
Fair value adjustments from Leamington (JV to subsidiary) (2.0) - - -
Closing funds 362.2 323.1 (9.4) (11.6)
Group Association 2011 2010 2011 2010 £m £m £m £m
Notes to the financial statements for the year ended 31 March 2011 (continued)