report of the registrar of medical schemes 1998 reports/microsoft word - final... · 1998 report of...
TRANSCRIPT

REPORT OF THE REGISTRAR OF MEDICAL SCHEMES
1998
1998 REPORT OF THE REGISTRAR OF MEDICAL SCHEMES
Registrar of Medical Schemes
Page:1
REPORT OF THE REGISTRAR OF MEDICAL SCHEMES 1998 ADDRESSES Physical Address: 1267 Pretorius Street Hadefields Block E Hatfield Pretoria Postal Address: Private Bag X34 Hatfield 0028 Telephone: (012) 431 0500 Telefax: (012) 430 7644 Internet: http://www.medicalschemes.com
1998 REPORT OF THE REGISTRAR OF MEDICAL SCHEMES
Registrar of Medical Schemes
Page:2
CONTENTS
REPORT BY THE REGISTRAR OF MEDICAL SCHEMES 3
1.1 OPERATIONAL AND ADMINISTRATIVE ACTIVITIES 3 1.2 REGULATORY DEVELOPMENTS 4 1.3 GENERAL INFORMATION 5
RESULTS 8
2.1 FINANCIAL SUMMARY 8 2.2 MEMBERSHIP 9 2.3 BENEFITS PAID 10 2.4 REVIEW OF OVERALL BUSINESS 13
SCHEDULES OF RESULTS 16
CONSOLIDATED BALANCE SHEET ANNEXURE A 16 CONSOLIDATED INCOME STATEMENT ANNEXURE B 17 CONSOLIDATED MEMBERSHIP ANALYSIS ANNEXURE C 18 ANALYSIS OF ALL BENEFITS PAID ANNEXURE D 19 ANALYSIS OF RISK BENEFITS PAID ANNEXURE E 20 ANALYSIS OF SAVINGS BENEFITS PAID ANNEXURE F 21 DETAILED FINANCIAL RESULTS: REGISTERED SCHEMES ANNEXURE G 22 DETAILED FINANCIAL RESULTS: EXEMPTED SCHEMES ANNEXURE H 27 DETAILED FINANCIAL INFORMATION: REGISTERED SCHEMES ANNEXURE I 28 DETAILED FINANCIAL INFORMATION: EXEMPTED SCHEMES ANNEXURE J 33 EXPLANATORY NOTES TO THE ANNEXURES 34
1998 REPORT OF THE REGISTRAR OF MEDICAL SCHEMES
Registrar of Medical Schemes
Page:3
REPORT BY THE REGISTRAR OF MEDICAL SCHEMES
1.1 OPERATIONAL AND ADMINISTRATIVE ACTIVITIES COUNCIL FOR MEDICAL SCHEMES
The Council for Medical Schemes is a statutory body established by the Medical Schemes Act to serve both the interests of the public and of members of medical schemes. The Registrar of Medical Schemes is the Executive Officer of the Council. The functions of the Council are: ❐ to protect the interest of members of medical schemes with regard to medical schemes matters
at all times; ❐ to control and co-ordinate the activities of medical schemes; ❐ to advise the Minister on matters concerning medical schemes; ❐ to investigate complaints and settle disputes in relation to the affairs of registered medical
schemes; and ❐ to perform other prescribed functions.
The Council consisted, during the reporting period, of the following members:
Prof. N Padayachee Chairperson Dr J E Cornell Elected Deputy Chairperson Mr D M Brennan Dr B A Brink Mr B T Brooks Dr S Gulube Mr S J Kgamphe Mr A M Leveton Dr G Martin Mr P T Masobe Ms D L Pearmain Dr S M Pillay Mr R Sono Dr C O M Setsubi Mr R B Speedie
❐ The Council met on five occasions and the Executive Committee of Council met on ten occasions to carry out its responsibilities.
❐ A large amount of Council's time during this period went into consideration of the new Medical Schemes Bill. Council provided the Minister with a detailed report on its comments on the Bill. Council supported the underlying principles of non discrimination and community rating contained in the Bill and emphasised the need to improve governance over medical schemes.
1998 REPORT OF THE REGISTRAR OF MEDICAL SCHEMES
Registrar of Medical Schemes
Page:4
THE OFFICE OF THE REGISTRAR
The Registrar is the Executive Officer of Council and is at the head of its operations. The Registrar and
his staff are responsible for:
❐ the registration of medical schemes and amendments to their rules, in a manner which complies with the provisions of the Medical Schemes Act, and the regulations framed there under as well as resolutions adopted by the Council from time to time.
❐ financial supervision of registered schemes. This included the collection of statistical
information, audited financial statements and annual reports from both registered and exempted medical schemes. In addition, various schemes are required to report to the Registrar with a view to monitor their financial soundness.
❐ advising the public, management of medical schemes, employers and others on matters relating
to medical schemes and the Act.
❐ monitoring the legislation and providing recommendations for regulatory improvement 1.2 REGULATORY DEVELOPMENTS
The Medical Schemes Bill was published during 1998 for general comment. The parliamentary process was completed during this period and the Act was published in December 1998. The Medical Schemes Act, 1998, Act No 131 of 1998 replaced the former Act and came into operation on 2 February 1999.
The Act introduces a new approach to governance, regulation and supervision of medical schemes and related activities. The Act seeks to provide greater protection to the public and to enhance access to private health care cover within a community rated environment.
The new Act clearly delineates the business of a medical scheme and is complemented in this regard by the amendments to Insurance legislation. The Act also requires that all entities that carry out the business of a medical scheme should be required to register under the Act.
The Act will improve substantially the governance and financial supervision of medical schemes. It will require that schemes maintain a solvency margin of 25%. Medical schemes will also be required to diversify their assets in order to minimize risk. Schemes are prohibited from holding equity in any administration company and any participating employer.
Provision is made for accreditation of medical scheme administrators, managed care organisations and other intermediaries.
1998 REPORT OF THE REGISTRAR OF MEDICAL SCHEMES
Registrar of Medical Schemes
Page:5
1.3 GENERAL INFORMATION LIQUIDATION
The following medical scheme was liquidated during the period under review: Medilife Medical Scheme w.e.f 1 September 1997. East Coast Medical Plan applied for voluntary liquidation during 1998. GF Group Medical Scheme Stability Medical Scheme
REGISTRATION, NAME CHANGES AND AMALGAMATION OF MEDICAL SCHEMES The following medical schemes were registered during the period under review: Anglovaal Group Medical Scheme w.e.f. 1 August 1997; Aumed Medical Scheme w.e.f. 1 December 1997; CSIR Medical Scheme w.e.f. 1 April 1997;
CU Health Medical Scheme w.e.f. 01 May 1998; Engen Medical Benefit Fund w.e.f. 1 September 1997; JCI Medical Scheme w.e.f. 28 August 1998; Medgold Medical Scheme w.e.f. 1 January 1997; Minemed Medical Scheme w.e.f. 1 January 1997;
Provia Medical Scheme w.e.f. 1 October 1998 ( Registered on 17 Septemer 1998); Ingwe Health Plan w.e.f. 1 November 1999; and
Foschini Group Medical Aid Scheme w.e.f. 1 January 1999 (Registered on 18 November 1998.
The following name changes were registered during the period under review:
Aiken and Peat Medical Aid Society to KPMG Medical Aid Society;
1998 REPORT OF THE REGISTRAR OF MEDICAL SCHEMES
Registrar of Medical Schemes
Page:6
Bonmed Mediese Skema to Malasela Group Medical Scheme; Carlton Paper Medical Plan to Pharos Medical Scheme (PIMAS); Genmed Medical Scheme to Billmed Medical Scheme; Makro SA Medical Aid Society to Massmart Health Plan; Masters Builders and Allied Traders Association for the OFS Goldfields Area Benefit Fund to Free
State Medical Scheme; Mines Benefit Society to Cawmed Medical Scheme; Ferromed to Kopano Healthcare; Grinaker Electronics Medical Aid Scheme to Grintek Medical Aid Scheme; Group Five & Everite Healthcare Plan to G5MED; Momentum Health Medical Scheme to Discovery Health Medical Scheme; Kap Investments Medical Aid Society to Moremed Medical Scheme; AAC Mines Medical Scheme to Anglogold Medical Scheme; and CU Health Medical Scheme to Resolution Health Medical Scheme.
The following schemes amalgamated or transferred their business as indicated during the period under review:
Vrystaat Munisipale Mediese Skema with Munimed w.e.f. 1 January 1998; Morcop Medical Aid Society with Tiger Oats Medical Scheme w. e. f. 1 January 1998; SACTA Medical Aid Society with Protea Medical Aid Society w.e.f. 1 January 1998; Protea Assurance Staff Medical Aid Society (PASMAS) with Mutual & Federal Medical Aid Fund
w.e.f . I January 1998;
Consolidated Employers’ Medical Aid Society (CEMAS) with Medical Expenses Distribution Society (MEDS) w.e.f 1 January 1998;
Bloemmed Medical Society with Northern Medical Society w.e.f 1 July 1998; Senmed Benefit Plan (an option within Alliance Benefit Society) with Finmed Medical Scheme
w.e.f 1 July 1998;
1998 REPORT OF THE REGISTRAR OF MEDICAL SCHEMES
Registrar of Medical Schemes
Page:7
South Atlantic Corporation Medical Aid Society (SACMAS) with Anglovaal Group Medical Scheme w.e.f. 1 May 1998;
Trimed with Ferromed w.e.f. 1 July 1998;
Reunert Medical Scheme with Discovery Health Medical Scheme; and
Goldfields Medical Aid Society with Meddent Medical Scheme.
The registration of Mercantile & General, Helpmed and Malasela Medical Scheme were withdrawn with effect from 1 January 1998 as they ceased to operate.
Membership of international associations
The Council is a member of the International Federation of Health Funds. The Federation held its biennial conference in South Africa during 1998.
ANALYSIS OF AUDITED FINANCIAL STATEMENTS AND STATUTORY RETURNS
The audited financial statements of medical schemes for the 1998 financial year has been analysed and the results are reflected in the annexures attached to this report.
CONCLUSION
I wish to record my appreciation for the co-operation received from the Council, the Executive Committee of Council, medical schemes, administrators of schemes, the various professions, the Financial Services Board and my colleagues for their assistance, goodwill and dedication during this period.
REGISTRAR OF MEDICAL SCHEMES
1998 REPORT OF THE REGISTRAR OF MEDICAL SCHEMES
Registrar of Medical Schemes
Page:8
RESULTS
2.1 FINANCIAL SUMMARY
Financial statements prepared in accordance with the SAICA Audit and Accounting Guide on Medical Funds: ❐ shall present the state of affairs and the business of the medical scheme and the results thereof
at the end of the financial year and the surplus or deficiency of the medical scheme for the financial year.
❐ shall at all times maintain its business in a financially sound condition by having assets, providing for its liabilities and generally conducting its business so as to be in a position to meet its liabilities at all times.
❐ include a trustees' report containing relevant information indicating whether or not the resources of the medical scheme have been applied economically, efficiently and effectively.
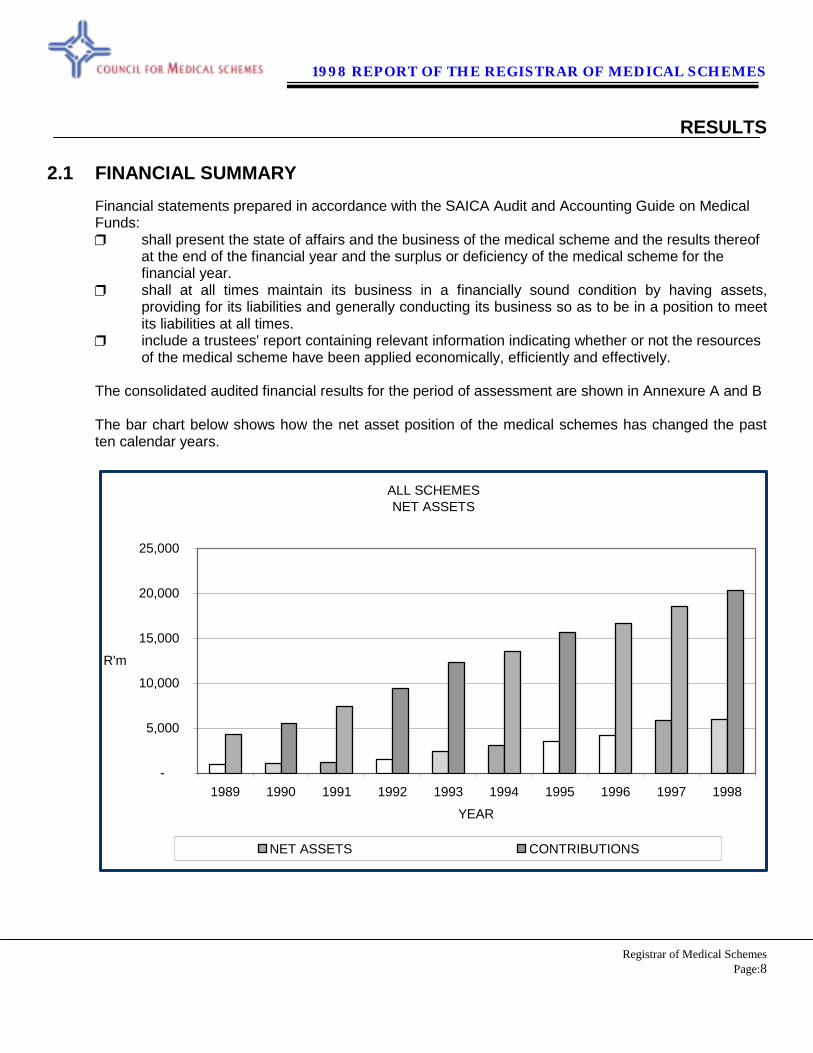
The consolidated audited financial results for the period of assessment are shown in Annexure A and B The bar chart below shows how the net asset position of the medical schemes has changed the past ten calendar years.
ALL SCHEMESNET ASSETS
-
5,000
10,000
15,000
20,000
25,000
1989 1990 1991 1992 1993 1994 1995 1996 1997 1998YEAR
R'm
NET ASSETS CONTRIBUTIONS
1998 REPORT OF THE REGISTRAR OF MEDICAL SCHEMES
Registrar of Medical Schemes
Page:9
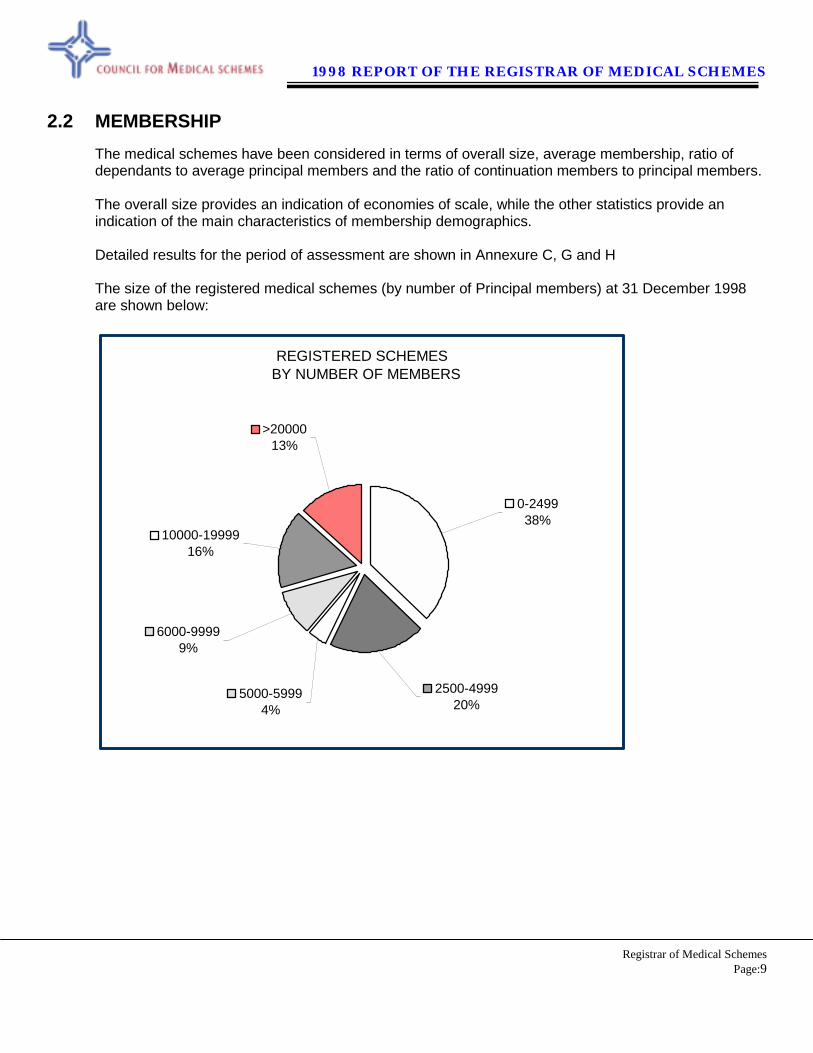
2.2 MEMBERSHIP
The medical schemes have been considered in terms of overall size, average membership, ratio of dependants to average principal members and the ratio of continuation members to principal members.
The overall size provides an indication of economies of scale, while the other statistics provide an indication of the main characteristics of membership demographics.
Detailed results for the period of assessment are shown in Annexure C, G and H The size of the registered medical schemes (by number of Principal members) at 31 December 1998 are shown below:
REGISTERED SCHEMES BY NUMBER OF MEMBERS
>2000013%
10000-1999916%
6000-99999%
5000-59994%
2500-499920%
0-249938%
1998 REPORT OF THE REGISTRAR OF MEDICAL SCHEMES
Registrar of Medical Schemes
Page:10
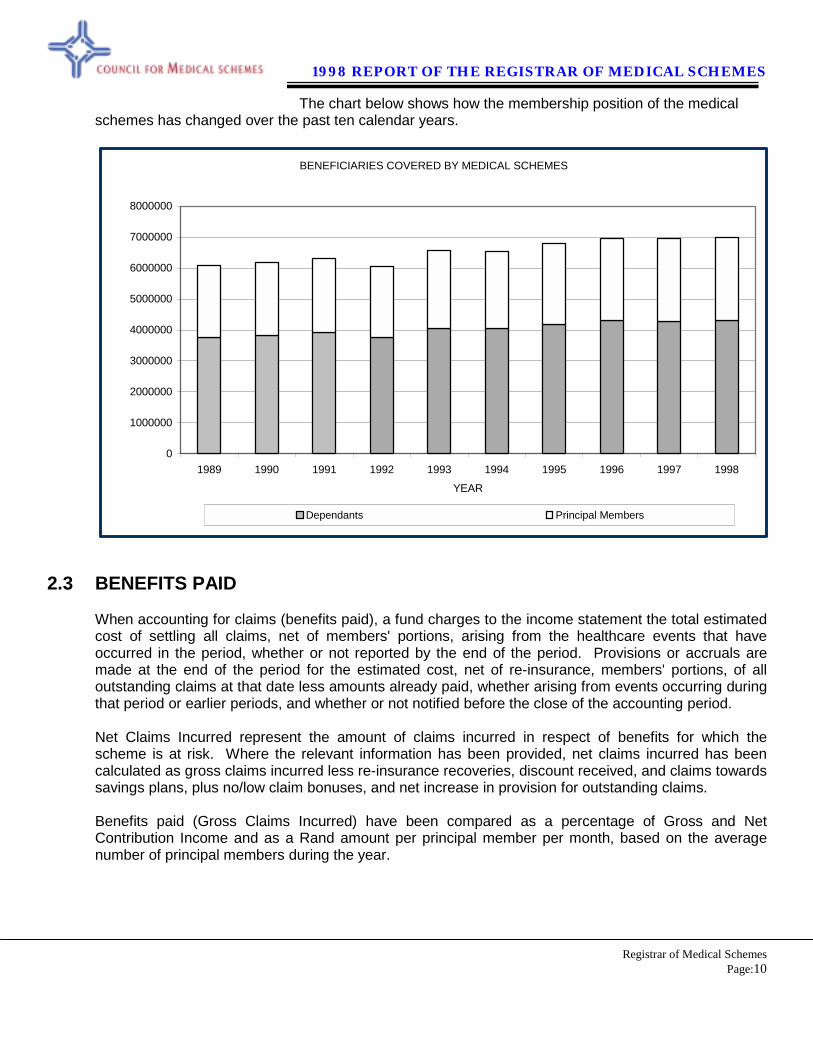
The chart below shows how the membership position of the medical schemes has changed over the past ten calendar years.
BENEFICIARIES COVERED BY MEDICAL SCHEMES
0
1000000
2000000
3000000
4000000
5000000
6000000
7000000
8000000
1989 1990 1991 1992 1993 1994 1995 1996 1997 1998YEAR
Dependants Principal Members
2.3 BENEFITS PAID When accounting for claims (benefits paid), a fund charges to the income statement the total estimated cost of settling all claims, net of members' portions, arising from the healthcare events that have occurred in the period, whether or not reported by the end of the period. Provisions or accruals are made at the end of the period for the estimated cost, net of re-insurance, members' portions, of all outstanding claims at that date less amounts already paid, whether arising from events occurring during that period or earlier periods, and whether or not notified before the close of the accounting period. Net Claims Incurred represent the amount of claims incurred in respect of benefits for which the scheme is at risk. Where the relevant information has been provided, net claims incurred has been calculated as gross claims incurred less re-insurance recoveries, discount received, and claims towards savings plans, plus no/low claim bonuses, and net increase in provision for outstanding claims. Benefits paid (Gross Claims Incurred) have been compared as a percentage of Gross and Net Contribution Income and as a Rand amount per principal member per month, based on the average number of principal members during the year.
1998 REPORT OF THE REGISTRAR OF MEDICAL SCHEMES
Registrar of Medical Schemes
Page:11
Detailed information for the period of assessment is shown in Annexure D, G and H. The benefits paid are in respect of both that for which the scheme is at risk and not at risk.
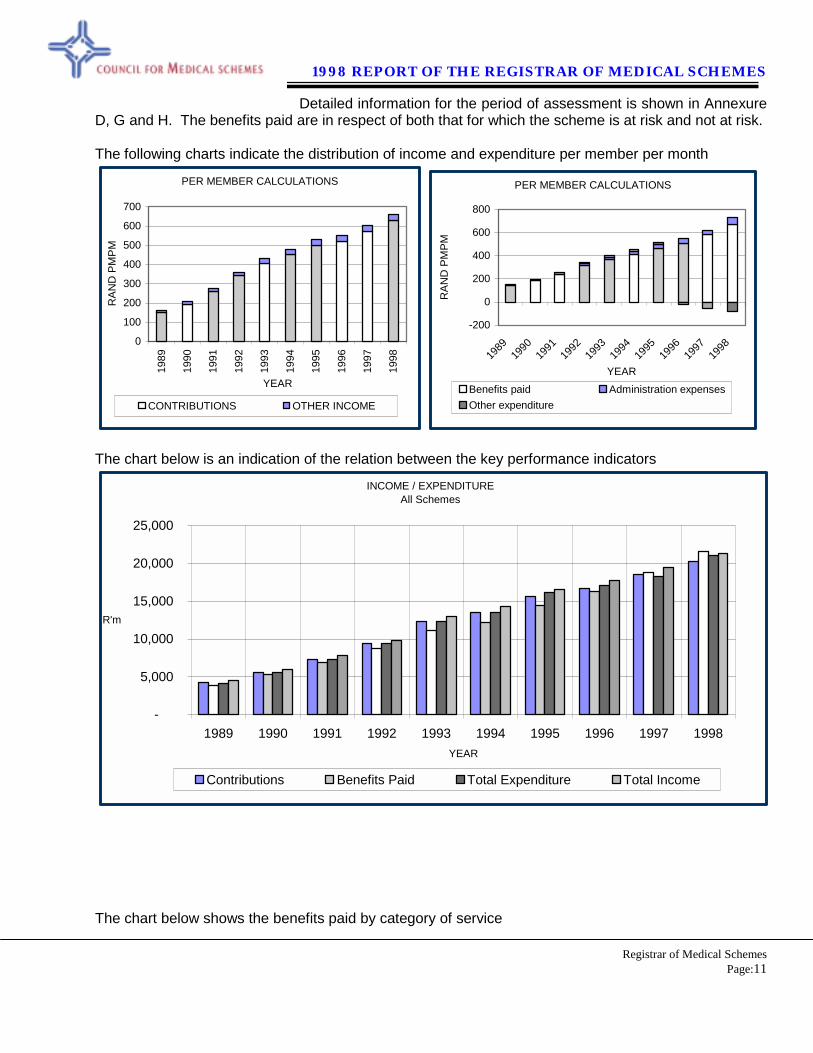
The following charts indicate the distribution of income and expenditure per member per month
PER MEMBER CALCULATIONS
0
100
200
300
400
500
600
700
1989
1990
1991
1992
1993
1994
1995
1996
1997
1998
YEAR
RAN
D P
MPM
CONTRIBUTIONS OTHER INCOME
PER MEMBER CALCULATIONS
-200
0
200
400
600
800
1989
1990
1991
1992
1993
1994
1995
1996
1997
1998
YEAR
RAN
D P
MPM
Benefits paid Administration expensesOther expenditure
The chart below is an indication of the relation between the key performance indicators
INCOME / EXPENDITUREAll Schemes
-
5,000
10,000
15,000
20,000
25,000
1989 1990 1991 1992 1993 1994 1995 1996 1997 1998YEAR
R'm
Contributions Benefits Paid Total Expenditure Total Income
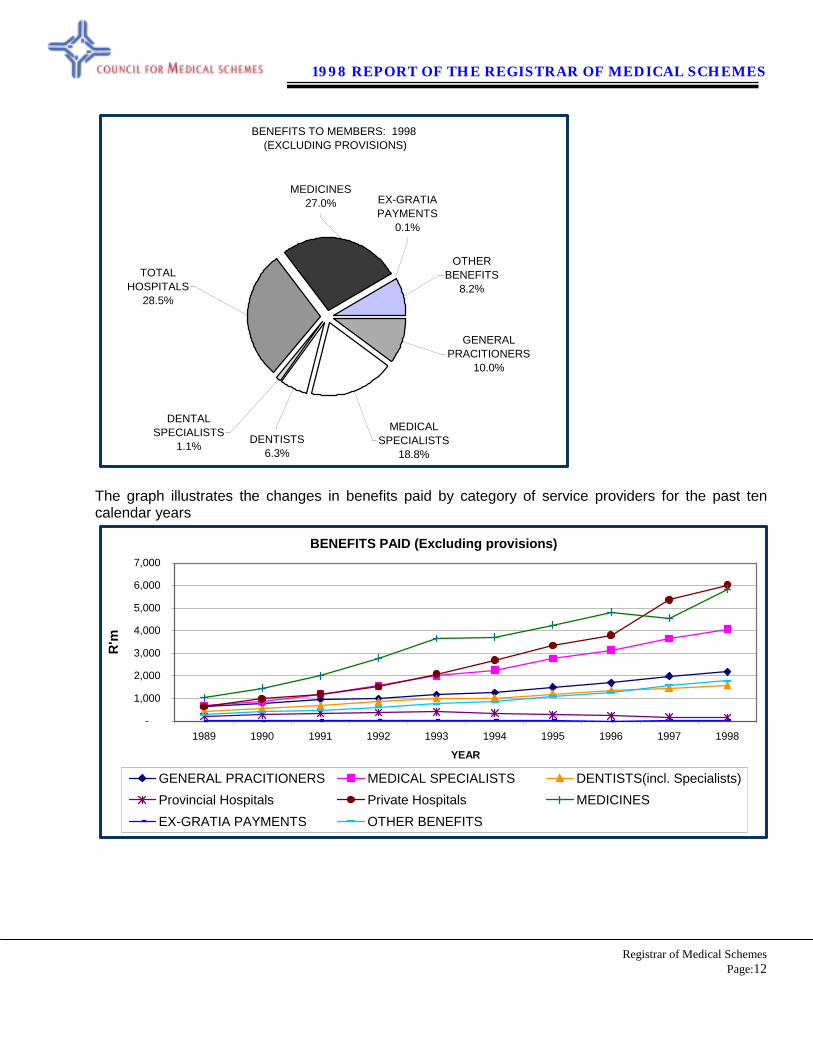
The chart below shows the benefits paid by category of service
1998 REPORT OF THE REGISTRAR OF MEDICAL SCHEMES
Registrar of Medical Schemes
Page:12
BENEFITS TO MEMBERS: 1998 (EXCLUDING PROVISIONS)
OTHER BENEFITS
8.2%
EX-GRATIA PAYMENTS
0.1%
MEDICINES27.0%
TOTAL HOSPITALS
28.5%
DENTAL SPECIALISTS
1.1% DENTISTS6.3%
MEDICAL SPECIALISTS
18.8%
GENERAL PRACITIONERS
10.0%
The graph illustrates the changes in benefits paid by category of service providers for the past ten calendar years
BENEFITS PAID (Excluding provisions)
-
1,000
2,000
3,000
4,000
5,000
6,000
7,000
1989 1990 1991 1992 1993 1994 1995 1996 1997 1998
YEAR
R'm
GENERAL PRACITIONERS MEDICAL SPECIALISTS DENTISTS(incl. Specialists)Provincial Hospitals Private Hospitals MEDICINESEX-GRATIA PAYMENTS OTHER BENEFITS
1998 REPORT OF THE REGISTRAR OF MEDICAL SCHEMES
Registrar of Medical Schemes
Page:13
2.4 REVIEW OF OVERALL BUSINESS
Medical schemes are accounted for on an accrual basis. Financial statements prepared in accordance with the SAICA Audit and Accounting Guide on Medical Funds separately identify contributions and claims in respect of benefits for which the scheme is not at risk. A medical scheme may either employ administration staff (i.e. a self-administered scheme) or appoint a professional administrator to administer the scheme. In some instances, the administration functions are performed by other medical schemes to achieve economies of scale. Where the relevant information has been provided, administration expenses do not include Health Care Management expenses. The Operating Profit/(Loss) is the result for which the scheme is at risk for the current accounting period, including any adjustments arising from previous outstanding claims provisions and other related estimates, and results of re-insurance arrangements, but excluding investment income and profits and losses on the sale of assets. Net Contribution Income represents the amount of contribution income in respect of benefits for which the scheme is at risk. Where the relevant information has been provided, Net Contribution Income has been calculated as Gross Contribution Income less re-insurance premiums, contributions towards savings plans and pre-funding plans, and any other contributions in respect of benefits for which the scheme is not at risk. Where the relevant information has been provided, Net Claims Incurred has been calculated as Gross Claims Incurred less re-insurance recoveries, and discounts received. It is inclusive of any change in provisions for outstanding claims and any no/low claim bonuses that have accrued. The Operating Result is therefore sensitive to the particular method and assumptions used when calculating the provision for outstanding claims. Since the information provided generally contains consolidated results for all benefits options of each scheme, the results shown in this report will not indicate the performance of a particular benefit option of a scheme. Total income includes operating income and investment income. The Accumulated Funds of a scheme will increase/(decrease) during the period of assessment by an amount equal to total income less total expenditure, adjusted for any transfers to/from specific reserves. The net assets of a scheme include accumulated funds, asset revaluation reserves, other reserves set aside for specific purposes and any long term liability. The solvency of each scheme have been measured by calculating the ratio of accumulated funds at the end of the period of assessment to Net Contribution Income during the period of assessment. The accumulated funds shown do not include reserves set aside for specific purposes, provided that these reserves have been separately identified.
1998 REPORT OF THE REGISTRAR OF MEDICAL SCHEMES
Registrar of Medical Schemes
Page:14
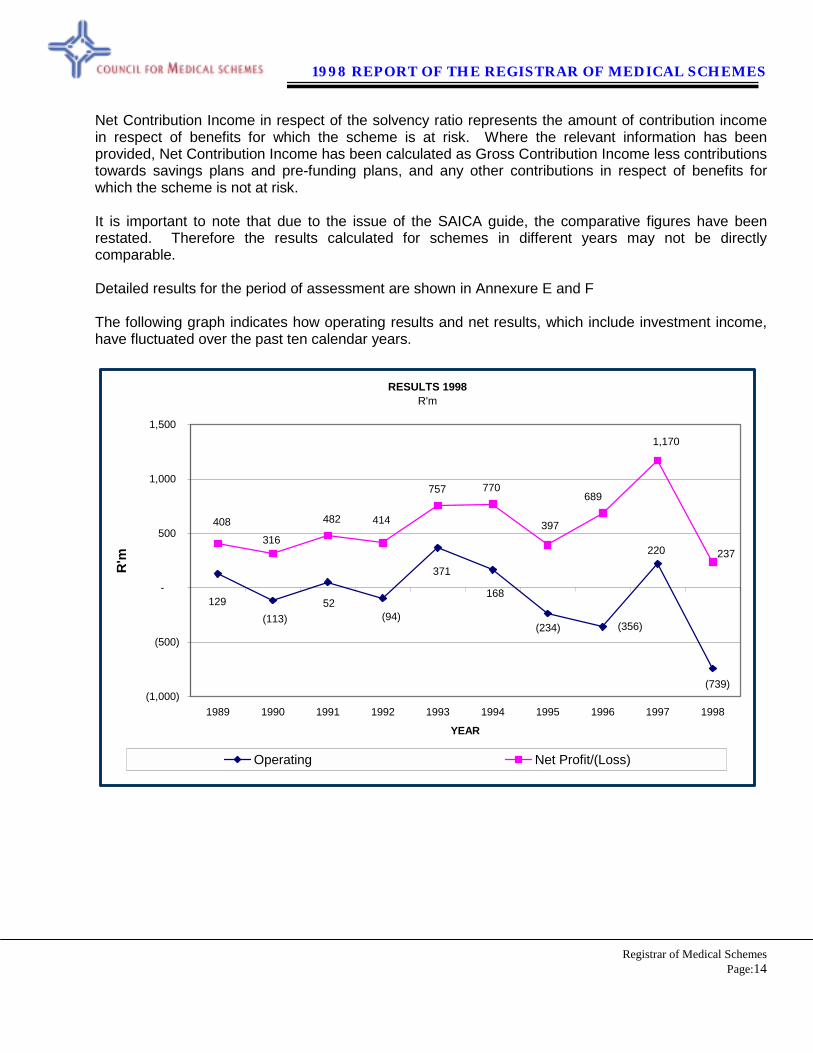
Net Contribution Income in respect of the solvency ratio represents the amount of contribution income in respect of benefits for which the scheme is at risk. Where the relevant information has been provided, Net Contribution Income has been calculated as Gross Contribution Income less contributions towards savings plans and pre-funding plans, and any other contributions in respect of benefits for which the scheme is not at risk. It is important to note that due to the issue of the SAICA guide, the comparative figures have been restated. Therefore the results calculated for schemes in different years may not be directly comparable. Detailed results for the period of assessment are shown in Annexure E and F The following graph indicates how operating results and net results, which include investment income, have fluctuated over the past ten calendar years.
RESULTS 1998R'm
(356)
220
(739)
(234)
168
371
(94) 52
(113) 129
316 397
770
414
689
1,170
482 408
757
237
(1,000)
(500)
-
500
1,000
1,500
1989 1990 1991 1992 1993 1994 1995 1996 1997 1998
YEAR
R'm
Operating Net Profit/(Loss)
1998 REPORT OF THE REGISTRAR OF MEDICAL SCHEMES
Registrar of Medical Schemes
Page:15
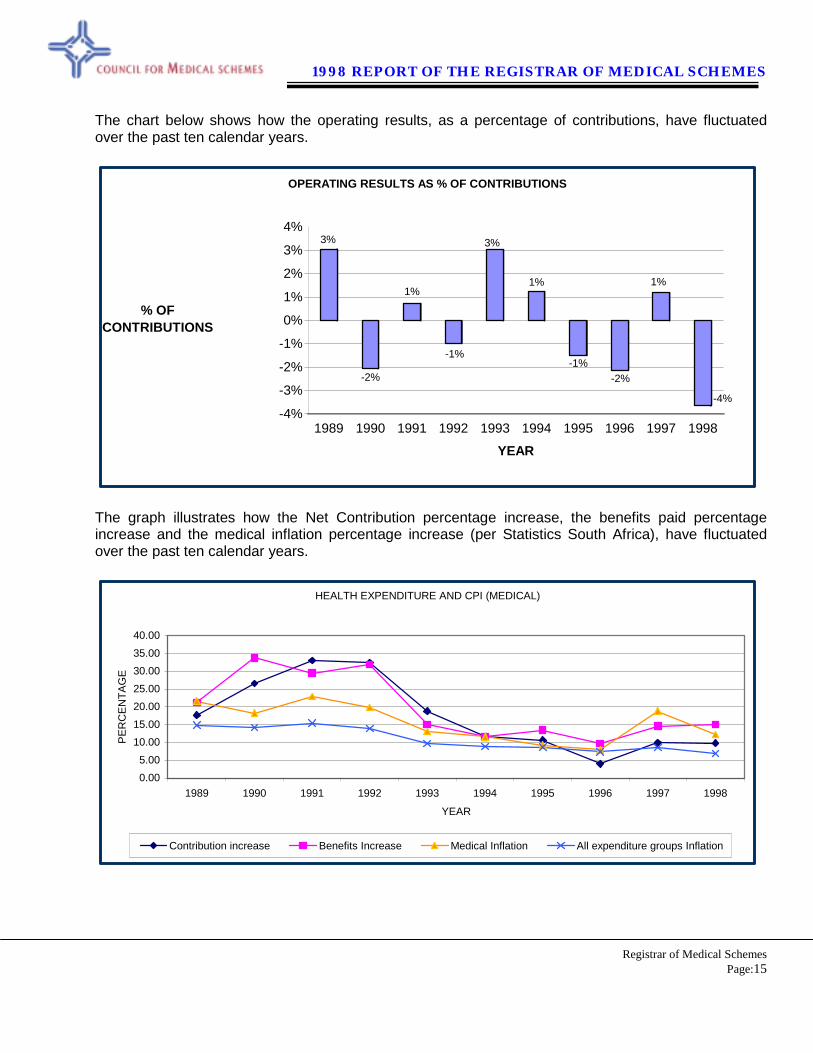
The chart below shows how the operating results, as a percentage of contributions, have fluctuated over the past ten calendar years.
3%
-2%
1%
-1%
3%
1%
-1%-2%
1%
-4%-4%
-3%
-2%
-1%
0%
1%
2%
3%
4%
% OF CONTRIBUTIONS
1989 1990 1991 1992 1993 1994 1995 1996 1997 1998
YEAR
OPERATING RESULTS AS % OF CONTRIBUTIONS
The graph illustrates how the Net Contribution percentage increase, the benefits paid percentage increase and the medical inflation percentage increase (per Statistics South Africa), have fluctuated over the past ten calendar years.
HEALTH EXPENDITURE AND CPI (MEDICAL)
0.005.00
10.0015.0020.0025.0030.0035.0040.00
1989 1990 1991 1992 1993 1994 1995 1996 1997 1998
YEAR
PER
CEN
TAG
E
Contribution increase Benefits Increase Medical Inflation All expenditure groups Inflation
1998 REPORT OF THE REGISTRAR OF MEDICAL SCHEMES
Registrar of Medical Schemes
Page:16
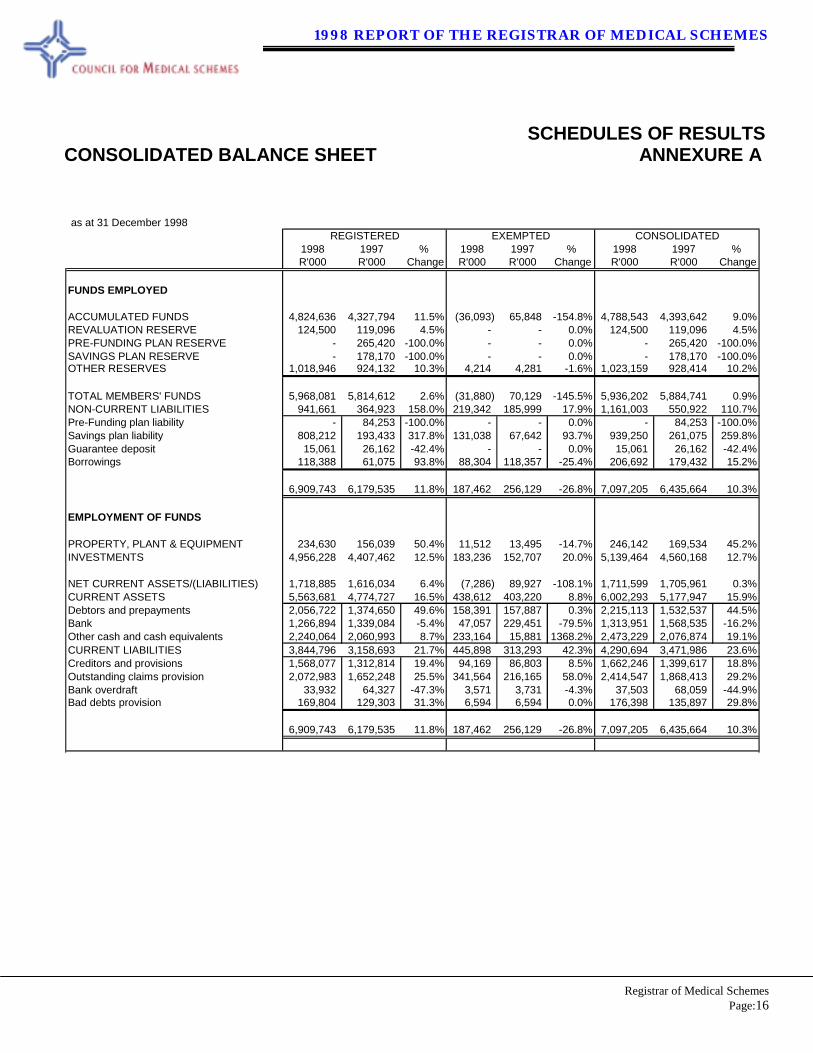
SCHEDULES OF RESULTS CONSOLIDATED BALANCE SHEET ANNEXURE A
as at 31 December 1998REGISTERED EXEMPTED CONSOLIDATED
1998 1997 % 1998 1997 % 1998 1997 %R'000 R'000 Change R'000 R'000 Change R'000 R'000 Change
FUNDS EMPLOYED
ACCUMULATED FUNDS 4,824,636 4,327,794 11.5% (36,093) 65,848 -154.8% 4,788,543 4,393,642 9.0%REVALUATION RESERVE 124,500 119,096 4.5% - - 0.0% 124,500 119,096 4.5%PRE-FUNDING PLAN RESERVE - 265,420 -100.0% - - 0.0% - 265,420 -100.0%SAVINGS PLAN RESERVE - 178,170 -100.0% - - 0.0% - 178,170 -100.0%OTHER RESERVES 1,018,946 924,132 10.3% 4,214 4,281 -1.6% 1,023,159 928,414 10.2%
TOTAL MEMBERS' FUNDS 5,968,081 5,814,612 2.6% (31,880) 70,129 -145.5% 5,936,202 5,884,741 0.9%NON-CURRENT LIABILITIES 941,661 364,923 158.0% 219,342 185,999 17.9% 1,161,003 550,922 110.7%Pre-Funding plan liability - 84,253 -100.0% - - 0.0% - 84,253 -100.0%Savings plan liability 808,212 193,433 317.8% 131,038 67,642 93.7% 939,250 261,075 259.8%Guarantee deposit 15,061 26,162 -42.4% - - 0.0% 15,061 26,162 -42.4%Borrowings 118,388 61,075 93.8% 88,304 118,357 -25.4% 206,692 179,432 15.2%
6,909,743 6,179,535 11.8% 187,462 256,129 -26.8% 7,097,205 6,435,664 10.3%
EMPLOYMENT OF FUNDS
PROPERTY, PLANT & EQUIPMENT 234,630 156,039 50.4% 11,512 13,495 -14.7% 246,142 169,534 45.2%INVESTMENTS 4,956,228 4,407,462 12.5% 183,236 152,707 20.0% 5,139,464 4,560,168 12.7%
NET CURRENT ASSETS/(LIABILITIES) 1,718,885 1,616,034 6.4% (7,286) 89,927 -108.1% 1,711,599 1,705,961 0.3%CURRENT ASSETS 5,563,681 4,774,727 16.5% 438,612 403,220 8.8% 6,002,293 5,177,947 15.9%Debtors and prepayments 2,056,722 1,374,650 49.6% 158,391 157,887 0.3% 2,215,113 1,532,537 44.5%Bank 1,266,894 1,339,084 -5.4% 47,057 229,451 -79.5% 1,313,951 1,568,535 -16.2%Other cash and cash equivalents 2,240,064 2,060,993 8.7% 233,164 15,881 1368.2% 2,473,229 2,076,874 19.1%CURRENT LIABILITIES 3,844,796 3,158,693 21.7% 445,898 313,293 42.3% 4,290,694 3,471,986 23.6%Creditors and provisions 1,568,077 1,312,814 19.4% 94,169 86,803 8.5% 1,662,246 1,399,617 18.8%Outstanding claims provision 2,072,983 1,652,248 25.5% 341,564 216,165 58.0% 2,414,547 1,868,413 29.2%Bank overdraft 33,932 64,327 -47.3% 3,571 3,731 -4.3% 37,503 68,059 -44.9%Bad debts provision 169,804 129,303 31.3% 6,594 6,594 0.0% 176,398 135,897 29.8%
6,909,743 6,179,535 11.8% 187,462 256,129 -26.8% 7,097,205 6,435,664 10.3%

1998 REPORT OF THE REGISTRAR OF MEDICAL SCHEMES
Registrar of Medical Schemes
Page:17
CONSOLIDATED INCOME STATEMENT ANNEXURE B
for the year ended 31 December 1998REGISTERED EXEMPTED CONSOLIDATED Average PMPM Average PBPM
1998 1997 % 1998 1997 % 1998 1997 % 1998 1997 % 1998 1997 %R,000 R,000 Change R,000 R,000 Change R,000 R,000 Change R R Change R R Change
INCOMENet contribution income 17,401,466 15,570,860 11.8% 2,931,037 2,929,831 0.0% 20,332,503 18,500,692 9.9% 637 580 9.9% 245 223 9.9%
EXPENDITURE 17,946,863 15,484,441 15.9% 3,124,976 2,796,059 11.8% 21,071,839 18,280,500 15.3% 660 573 15.3% 254 220 15.3%Net claims incurred 15,989,849 14,097,849 13.4% 2,886,414 2,601,960 10.9% 18,876,263 16,699,809 13.0% 591 523 13.0% 228 201 13.0%Own facility costs 105,335 104,621 0.7% 9,438 - 100.0% 114,774 104,621 9.7% 4 3 9.7% 1 1 9.7%Bad debts written off 23,438 22,357 4.8% 15 36 -59.2% 23,453 22,394 4.7% 1 1 4.7% 0 0 4.7%Increase/Decrease in provision for bad debts 56,354 22,003 156.1% - 5,594 -100.0% 56,354 27,597 104.2% 2 1 104.2% 1 0 104.2%Healthcare management expenses 311,044 144,321 115.5% 33,727 26,024 29.6% 344,771 170,345 102.4% 11 5 102.4% 4 2 102.4%Administration expenses 1,460,843 1,093,289 33.6% 195,382 162,444 20.3% 1,656,225 1,255,733 31.9% 52 39 31.9% 20 15 31.9%
OPERATING INCOME/(LOSS) (545,397) 86,419 -731.1% (193,939) 133,773 -245.0% (739,336) 220,192 -435.8% -23 7 -435.8% -9 3 -435.8%NET INVESTMENT INCOME 864,644 733,549 17.9% 88,442 47,280 87.1% 953,087 780,829 22.1% 30 24 22.1% 11 9 22.1%PROFIT/(LOSS) ON SALE OF INVESTMENTS 10,945 62,035 -82.4% 262 - 100.0% 11,207 62,035 -81.9% 0 2 -81.9% 0 1 -81.9%ADJUSTMENT TO MARKET/TRUSTEES' VALUE OF INVESTMENTS (75,041) (1,735) -4225.6% (1,540) (2,520) 38.9% (76,581) (4,254) -1700.0% -2 -0 -1700.0% -1 -0 -1700.0%OTHER INCOME/(LOSS) 50,874 109,794 -53.7% 37,386 965 3774.8% 88,260 110,759 -20.3% 3 3 -20.3% 1 1 -20.3%
NET PROFIT/(LOSS) for the year 306,025 990,062 -69.1% (69,388) 179,498 -138.7% 236,637 1,169,560 -79.8% 7 37 -79.8% 3 14 -79.8%TRANSFER TO/(FROM) RESERVES 171,983 (113,181) 252.0% (32,553) - 100.0% 139,430 (113,181) 223.2% 4 -4 223.2% 2 -1 223.2%
ACCUMULATED FUNDS for the year 478,008 876,881 -45.5% (101,941) 179,498 -156.8% 376,066 1,056,379 -64.4% 12 33 -64.4% 5 13 -64.4%ACCUMULATED FUNDS at the beginning of the year 4,346,628 3,450,912 26.0% 65,848 (113,650) 157.9% 4,412,476 3,337,263 32.2% 0.0% 0.0%As previously reported 4,327,794 3,450,912 25.4% 65,848 (113,650) 157.9% 4,393,642 3,337,263 31.7% 105 -100.0% 40 -100.0%Prior year adjustment 18,835 - 100.0% - - 0.0% 18,835 100.0% 0.0% 0.0%
ACCUMULATED FUNDS at the end of the year 4,824,636 4,327,794 11.5% (36,093) 65,848 -154.8% 4,788,543 4,393,642 9.0% 12 33 -64.4% 5 13 -64.4%
1998 REPORT OF THE REGISTRAR OF MEDICAL SCHEMES
Registrar of Medical Schemes
Page:18
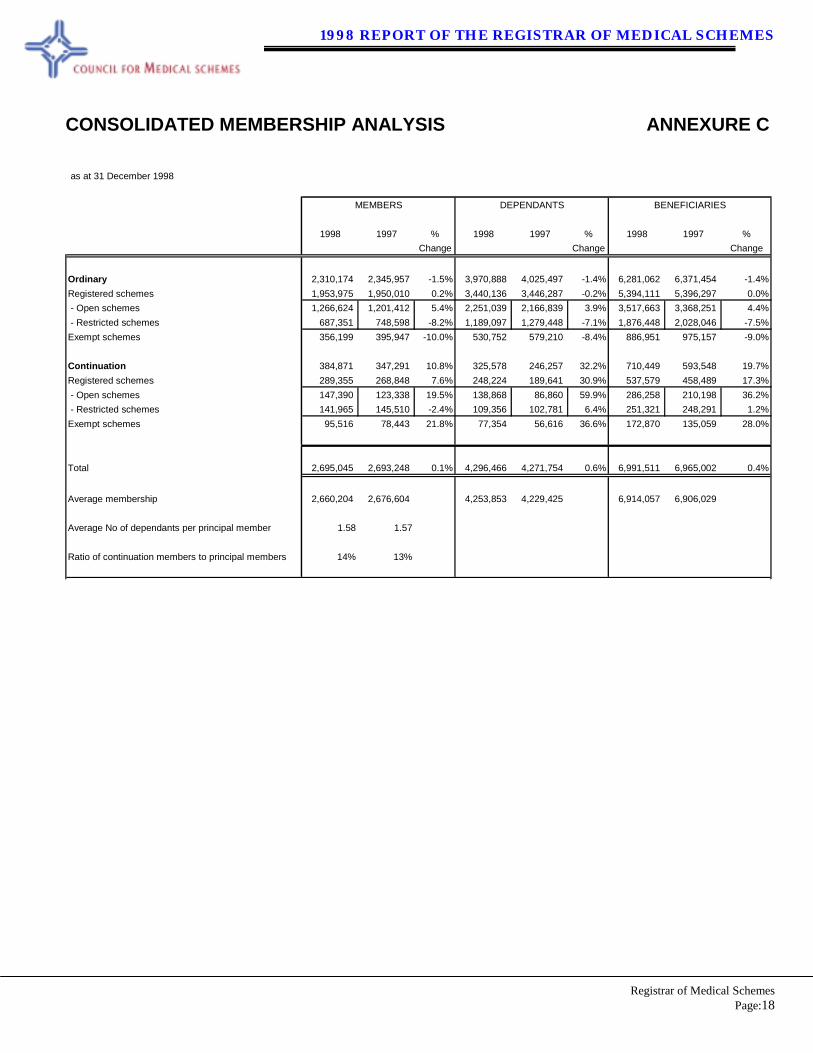
CONSOLIDATED MEMBERSHIP ANALYSIS ANNEXURE C
as at 31 December 1998
MEMBERS DEPENDANTS BENEFICIARIES
1998 1997 % 1998 1997 % 1998 1997 %Change Change Change
Ordinary 2,310,174 2,345,957 -1.5% 3,970,888 4,025,497 -1.4% 6,281,062 6,371,454 -1.4%Registered schemes 1,953,975 1,950,010 0.2% 3,440,136 3,446,287 -0.2% 5,394,111 5,396,297 0.0% - Open schemes 1,266,624 1,201,412 5.4% 2,251,039 2,166,839 3.9% 3,517,663 3,368,251 4.4% - Restricted schemes 687,351 748,598 -8.2% 1,189,097 1,279,448 -7.1% 1,876,448 2,028,046 -7.5%Exempt schemes 356,199 395,947 -10.0% 530,752 579,210 -8.4% 886,951 975,157 -9.0%
Continuation 384,871 347,291 10.8% 325,578 246,257 32.2% 710,449 593,548 19.7%Registered schemes 289,355 268,848 7.6% 248,224 189,641 30.9% 537,579 458,489 17.3% - Open schemes 147,390 123,338 19.5% 138,868 86,860 59.9% 286,258 210,198 36.2% - Restricted schemes 141,965 145,510 -2.4% 109,356 102,781 6.4% 251,321 248,291 1.2%Exempt schemes 95,516 78,443 21.8% 77,354 56,616 36.6% 172,870 135,059 28.0%
Total 2,695,045 2,693,248 0.1% 4,296,466 4,271,754 0.6% 6,991,511 6,965,002 0.4%
Average membership 2,660,204 2,676,604 4,253,853 4,229,425 6,914,057 6,906,029
Average No of dependants per principal member 1.58 1.57
Ratio of continuation members to principal members 14% 13%
1998 REPORT OF THE REGISTRAR OF MEDICAL SCHEMES
Registrar of Medical Schemes
Page:19
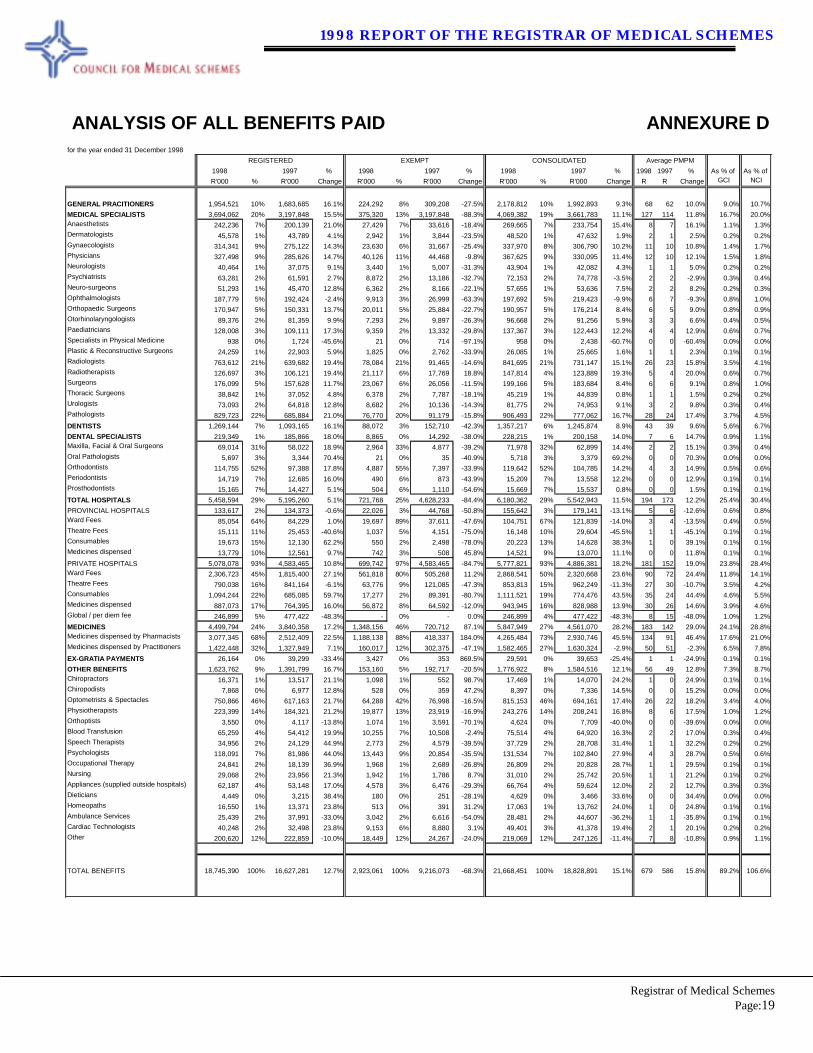
ANALYSIS OF ALL BENEFITS PAID ANNEXURE D
for the year ended 31 December 1998Average PMPM
1998 1997 % 1998 1997 % 1998 1997 % 1998 1997 % As % of As % of R'000 % R'000 Change R'000 % R'000 Change R'000 % R'000 Change R R Change GCI NCI
GENERAL PRACITIONERS 1,954,521 10% 1,683,685 16.1% 224,292 8% 309,208 -27.5% 2,178,812 10% 1,992,893 9.3% 68 62 10.0% 9.0% 10.7%MEDICAL SPECIALISTS 3,694,062 20% 3,197,848 15.5% 375,320 13% 3,197,848 -88.3% 4,069,382 19% 3,661,783 11.1% 127 114 11.8% 16.7% 20.0%Anaesthetists 242,236 7% 200,139 21.0% 27,429 7% 33,616 -18.4% 269,665 7% 233,754 15.4% 8 7 16.1% 1.1% 1.3%Dermatologists 45,578 1% 43,789 4.1% 2,942 1% 3,844 -23.5% 48,520 1% 47,632 1.9% 2 1 2.5% 0.2% 0.2%Gynaecologists 314,341 9% 275,122 14.3% 23,630 6% 31,667 -25.4% 337,970 8% 306,790 10.2% 11 10 10.8% 1.4% 1.7%Physicians 327,498 9% 285,626 14.7% 40,126 11% 44,468 -9.8% 367,625 9% 330,095 11.4% 12 10 12.1% 1.5% 1.8%Neurologists 40,464 1% 37,075 9.1% 3,440 1% 5,007 -31.3% 43,904 1% 42,082 4.3% 1 1 5.0% 0.2% 0.2%Psychiatrists 63,281 2% 61,591 2.7% 8,872 2% 13,186 -32.7% 72,153 2% 74,778 -3.5% 2 2 -2.9% 0.3% 0.4%Neuro-surgeons 51,293 1% 45,470 12.8% 6,362 2% 8,166 -22.1% 57,655 1% 53,636 7.5% 2 2 8.2% 0.2% 0.3%Ophthalmologists 187,779 5% 192,424 -2.4% 9,913 3% 26,999 -63.3% 197,692 5% 219,423 -9.9% 6 7 -9.3% 0.8% 1.0%Orthopaedic Surgeons 170,947 5% 150,331 13.7% 20,011 5% 25,884 -22.7% 190,957 5% 176,214 8.4% 6 5 9.0% 0.8% 0.9%Otorhinolaryngologists 89,376 2% 81,359 9.9% 7,293 2% 9,897 -26.3% 96,668 2% 91,256 5.9% 3 3 6.6% 0.4% 0.5%Paediatricians 128,008 3% 109,111 17.3% 9,359 2% 13,332 -29.8% 137,367 3% 122,443 12.2% 4 4 12.9% 0.6% 0.7%Specialists in Physical Medicine 938 0% 1,724 -45.6% 21 0% 714 -97.1% 958 0% 2,438 -60.7% 0 0 -60.4% 0.0% 0.0%Plastic & Reconstructive Surgeons 24,259 1% 22,903 5.9% 1,825 0% 2,762 -33.9% 26,085 1% 25,665 1.6% 1 1 2.3% 0.1% 0.1%Radiologists 763,612 21% 639,682 19.4% 78,084 21% 91,465 -14.6% 841,695 21% 731,147 15.1% 26 23 15.8% 3.5% 4.1%Radiotherapists 126,697 3% 106,121 19.4% 21,117 6% 17,769 18.8% 147,814 4% 123,889 19.3% 5 4 20.0% 0.6% 0.7%Surgeons 176,099 5% 157,628 11.7% 23,067 6% 26,056 -11.5% 199,166 5% 183,684 8.4% 6 6 9.1% 0.8% 1.0%Thoracic Surgeons 38,842 1% 37,052 4.8% 6,378 2% 7,787 -18.1% 45,219 1% 44,839 0.8% 1 1 1.5% 0.2% 0.2%Urologists 73,093 2% 64,818 12.8% 8,682 2% 10,136 -14.3% 81,775 2% 74,953 9.1% 3 2 9.8% 0.3% 0.4%Pathologists 829,723 22% 685,884 21.0% 76,770 20% 91,179 -15.8% 906,493 22% 777,062 16.7% 28 24 17.4% 3.7% 4.5%DENTISTS 1,269,144 7% 1,093,165 16.1% 88,072 3% 152,710 -42.3% 1,357,217 6% 1,245,874 8.9% 43 39 9.6% 5.6% 6.7%DENTAL SPECIALISTS 219,349 1% 185,866 18.0% 8,865 0% 14,292 -38.0% 228,215 1% 200,158 14.0% 7 6 14.7% 0.9% 1.1%Maxilla, Facial & Oral Surgeons 69,014 31% 58,022 18.9% 2,964 33% 4,877 -39.2% 71,978 32% 62,899 14.4% 2 2 15.1% 0.3% 0.4%Oral Pathologists 5,697 3% 3,344 70.4% 21 0% 35 -40.9% 5,718 3% 3,379 69.2% 0 0 70.3% 0.0% 0.0%Orthodontists 114,755 52% 97,388 17.8% 4,887 55% 7,397 -33.9% 119,642 52% 104,785 14.2% 4 3 14.9% 0.5% 0.6%Periodontists 14,719 7% 12,685 16.0% 490 6% 873 -43.9% 15,209 7% 13,558 12.2% 0 0 12.9% 0.1% 0.1%Prosthodontists 15,165 7% 14,427 5.1% 504 6% 1,110 -54.6% 15,669 7% 15,537 0.8% 0 0 1.5% 0.1% 0.1%TOTAL HOSPITALS 5,458,594 29% 5,195,260 5.1% 721,768 25% 4,628,233 -84.4% 6,180,362 29% 5,542,943 11.5% 194 173 12.2% 25.4% 30.4%PROVINCIAL HOSPITALS 133,617 2% 134,373 -0.6% 22,026 3% 44,768 -50.8% 155,642 3% 179,141 -13.1% 5 6 -12.6% 0.6% 0.8%Ward Fees 85,054 64% 84,229 1.0% 19,697 89% 37,611 -47.6% 104,751 67% 121,839 -14.0% 3 4 -13.5% 0.4% 0.5%Theatre Fees 15,111 11% 25,453 -40.6% 1,037 5% 4,151 -75.0% 16,148 10% 29,604 -45.5% 1 1 -45.1% 0.1% 0.1%Consumables 19,673 15% 12,130 62.2% 550 2% 2,498 -78.0% 20,223 13% 14,628 38.3% 1 0 39.1% 0.1% 0.1%Medicines dispensed 13,779 10% 12,561 9.7% 742 3% 508 45.8% 14,521 9% 13,070 11.1% 0 0 11.8% 0.1% 0.1%PRIVATE HOSPITALS 5,078,078 93% 4,583,465 10.8% 699,742 97% 4,583,465 -84.7% 5,777,821 93% 4,886,381 18.2% 181 152 19.0% 23.8% 28.4%Ward Fees 2,306,723 45% 1,815,400 27.1% 561,818 80% 505,268 11.2% 2,868,541 50% 2,320,668 23.6% 90 72 24.4% 11.8% 14.1%Theatre Fees 790,038 16% 841,164 -6.1% 63,776 9% 121,085 -47.3% 853,813 15% 962,249 -11.3% 27 30 -10.7% 3.5% 4.2%Consumables 1,094,244 22% 685,085 59.7% 17,277 2% 89,391 -80.7% 1,111,521 19% 774,476 43.5% 35 24 44.4% 4.6% 5.5%Medicines dispensed 887,073 17% 764,395 16.0% 56,872 8% 64,592 -12.0% 943,945 16% 828,988 13.9% 30 26 14.6% 3.9% 4.6%Global / per diem fee 246,899 5% 477,422 -48.3% - 0% - 0.0% 246,899 4% 477,422 -48.3% 8 15 -48.0% 1.0% 1.2%MEDICINES 4,499,794 24% 3,840,358 17.2% 1,348,156 46% 720,712 87.1% 5,847,949 27% 4,561,070 28.2% 183 142 29.0% 24.1% 28.8%Medicines dispensed by Pharmacists 3,077,345 68% 2,512,409 22.5% 1,188,138 88% 418,337 184.0% 4,265,484 73% 2,930,746 45.5% 134 91 46.4% 17.6% 21.0%Medicines dispensed by Practitioners 1,422,448 32% 1,327,949 7.1% 160,017 12% 302,375 -47.1% 1,582,465 27% 1,630,324 -2.9% 50 51 -2.3% 6.5% 7.8%EX-GRATIA PAYMENTS 26,164 0% 39,299 -33.4% 3,427 0% 353 869.5% 29,591 0% 39,653 -25.4% 1 1 -24.9% 0.1% 0.1%OTHER BENEFITS 1,623,762 9% 1,391,799 16.7% 153,160 5% 192,717 -20.5% 1,776,922 8% 1,584,516 12.1% 56 49 12.8% 7.3% 8.7%Chiropractors 16,371 1% 13,517 21.1% 1,098 1% 552 98.7% 17,469 1% 14,070 24.2% 1 0 24.9% 0.1% 0.1%Chiropodists 7,868 0% 6,977 12.8% 528 0% 359 47.2% 8,397 0% 7,336 14.5% 0 0 15.2% 0.0% 0.0%Optometrists & Spectacles 750,866 46% 617,163 21.7% 64,288 42% 76,998 -16.5% 815,153 46% 694,161 17.4% 26 22 18.2% 3.4% 4.0%Physiotherapists 223,399 14% 184,321 21.2% 19,877 13% 23,919 -16.9% 243,276 14% 208,241 16.8% 8 6 17.5% 1.0% 1.2%Orthoptists 3,550 0% 4,117 -13.8% 1,074 1% 3,591 -70.1% 4,624 0% 7,709 -40.0% 0 0 -39.6% 0.0% 0.0%Blood Transfusion 65,259 4% 54,412 19.9% 10,255 7% 10,508 -2.4% 75,514 4% 64,920 16.3% 2 2 17.0% 0.3% 0.4%Speech Therapists 34,956 2% 24,129 44.9% 2,773 2% 4,579 -39.5% 37,729 2% 28,708 31.4% 1 1 32.2% 0.2% 0.2%Psychologists 118,091 7% 81,986 44.0% 13,443 9% 20,854 -35.5% 131,534 7% 102,840 27.9% 4 3 28.7% 0.5% 0.6%Occupational Therapy 24,841 2% 18,139 36.9% 1,968 1% 2,689 -26.8% 26,809 2% 20,828 28.7% 1 1 29.5% 0.1% 0.1%Nursing 29,068 2% 23,956 21.3% 1,942 1% 1,786 8.7% 31,010 2% 25,742 20.5% 1 1 21.2% 0.1% 0.2%Appliances (supplied outside hospitals) 62,187 4% 53,148 17.0% 4,578 3% 6,476 -29.3% 66,764 4% 59,624 12.0% 2 2 12.7% 0.3% 0.3%Dieticians 4,449 0% 3,215 38.4% 180 0% 251 -28.1% 4,629 0% 3,466 33.6% 0 0 34.4% 0.0% 0.0%Homeopaths 16,550 1% 13,371 23.8% 513 0% 391 31.2% 17,063 1% 13,762 24.0% 1 0 24.8% 0.1% 0.1%Ambulance Services 25,439 2% 37,991 -33.0% 3,042 2% 6,616 -54.0% 28,481 2% 44,607 -36.2% 1 1 -35.8% 0.1% 0.1%Cardiac Technologists 40,248 2% 32,498 23.8% 9,153 6% 8,880 3.1% 49,401 3% 41,378 19.4% 2 1 20.1% 0.2% 0.2%Other 200,620 12% 222,859 -10.0% 18,449 12% 24,267 -24.0% 219,069 12% 247,126 -11.4% 7 8 -10.8% 0.9% 1.1%
TOTAL BENEFITS 18,745,390 100% 16,627,281 12.7% 2,923,061 100% 9,216,073 -68.3% 21,668,451 100% 18,828,891 15.1% 679 586 15.8% 89.2% 106.6%
CONSOLIDATEDEXEMPTREGISTERED
1998 REPORT OF THE REGISTRAR OF MEDICAL SCHEMES
Registrar of Medical Schemes
Page:20
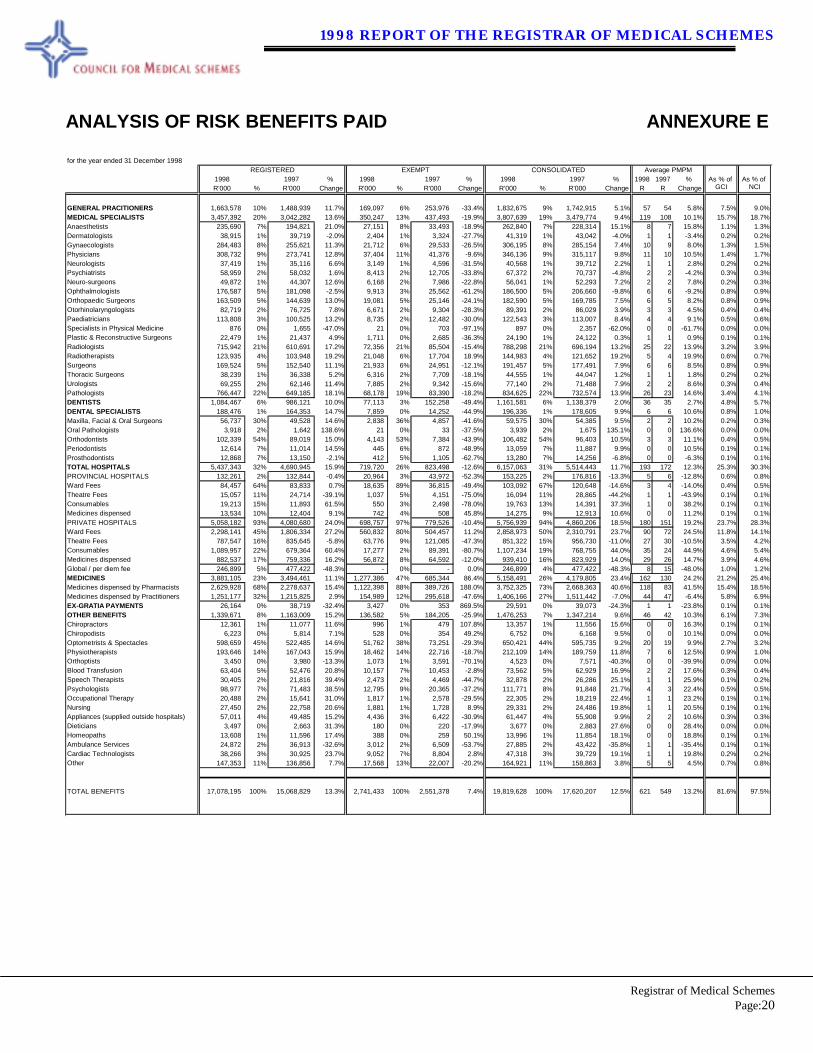
ANALYSIS OF RISK BENEFITS PAID ANNEXURE E
for the year ended 31 December 1998Average PMPM
1998 1997 % 1998 1997 % 1998 1997 % 1998 1997 % As % of As % of R'000 % R'000 Change R'000 % R'000 Change R'000 % R'000 Change R R Change GCI NCI
GENERAL PRACITIONERS 1,663,578 10% 1,488,939 11.7% 169,097 6% 253,976 -33.4% 1,832,675 9% 1,742,915 5.1% 57 54 5.8% 7.5% 9.0%MEDICAL SPECIALISTS 3,457,392 20% 3,042,282 13.6% 350,247 13% 437,493 -19.9% 3,807,639 19% 3,479,774 9.4% 119 108 10.1% 15.7% 18.7%Anaesthetists 235,690 7% 194,821 21.0% 27,151 8% 33,493 -18.9% 262,840 7% 228,314 15.1% 8 7 15.8% 1.1% 1.3%Dermatologists 38,915 1% 39,719 -2.0% 2,404 1% 3,324 -27.7% 41,319 1% 43,042 -4.0% 1 1 -3.4% 0.2% 0.2%Gynaecologists 284,483 8% 255,621 11.3% 21,712 6% 29,533 -26.5% 306,195 8% 285,154 7.4% 10 9 8.0% 1.3% 1.5%Physicians 308,732 9% 273,741 12.8% 37,404 11% 41,376 -9.6% 346,136 9% 315,117 9.8% 11 10 10.5% 1.4% 1.7%Neurologists 37,419 1% 35,116 6.6% 3,149 1% 4,596 -31.5% 40,568 1% 39,712 2.2% 1 1 2.8% 0.2% 0.2%Psychiatrists 58,959 2% 58,032 1.6% 8,413 2% 12,705 -33.8% 67,372 2% 70,737 -4.8% 2 2 -4.2% 0.3% 0.3%Neuro-surgeons 49,872 1% 44,307 12.6% 6,168 2% 7,986 -22.8% 56,041 1% 52,293 7.2% 2 2 7.8% 0.2% 0.3%Ophthalmologists 176,587 5% 181,098 -2.5% 9,913 3% 25,562 -61.2% 186,500 5% 206,660 -9.8% 6 6 -9.2% 0.8% 0.9%Orthopaedic Surgeons 163,509 5% 144,639 13.0% 19,081 5% 25,146 -24.1% 182,590 5% 169,785 7.5% 6 5 8.2% 0.8% 0.9%Otorhinolaryngologists 82,719 2% 76,725 7.8% 6,671 2% 9,304 -28.3% 89,391 2% 86,029 3.9% 3 3 4.5% 0.4% 0.4%Paediatricians 113,808 3% 100,525 13.2% 8,735 2% 12,482 -30.0% 122,543 3% 113,007 8.4% 4 4 9.1% 0.5% 0.6%Specialists in Physical Medicine 876 0% 1,655 -47.0% 21 0% 703 -97.1% 897 0% 2,357 -62.0% 0 0 -61.7% 0.0% 0.0%Plastic & Reconstructive Surgeons 22,479 1% 21,437 4.9% 1,711 0% 2,685 -36.3% 24,190 1% 24,122 0.3% 1 1 0.9% 0.1% 0.1%Radiologists 715,942 21% 610,691 17.2% 72,356 21% 85,504 -15.4% 788,298 21% 696,194 13.2% 25 22 13.9% 3.2% 3.9%Radiotherapists 123,935 4% 103,948 19.2% 21,048 6% 17,704 18.9% 144,983 4% 121,652 19.2% 5 4 19.9% 0.6% 0.7%Surgeons 169,524 5% 152,540 11.1% 21,933 6% 24,951 -12.1% 191,457 5% 177,491 7.9% 6 6 8.5% 0.8% 0.9%Thoracic Surgeons 38,239 1% 36,338 5.2% 6,316 2% 7,709 -18.1% 44,555 1% 44,047 1.2% 1 1 1.8% 0.2% 0.2%Urologists 69,255 2% 62,146 11.4% 7,885 2% 9,342 -15.6% 77,140 2% 71,488 7.9% 2 2 8.6% 0.3% 0.4%Pathologists 766,447 22% 649,185 18.1% 68,178 19% 83,390 -18.2% 834,625 22% 732,574 13.9% 26 23 14.6% 3.4% 4.1%DENTISTS 1,084,467 6% 986,121 10.0% 77,113 3% 152,258 -49.4% 1,161,581 6% 1,138,379 2.0% 36 35 2.7% 4.8% 5.7%DENTAL SPECIALISTS 188,476 1% 164,353 14.7% 7,859 0% 14,252 -44.9% 196,336 1% 178,605 9.9% 6 6 10.6% 0.8% 1.0%Maxilla, Facial & Oral Surgeons 56,737 30% 49,528 14.6% 2,838 36% 4,857 -41.6% 59,575 30% 54,385 9.5% 2 2 10.2% 0.2% 0.3%Oral Pathologists 3,918 2% 1,642 138.6% 21 0% 33 -37.5% 3,939 2% 1,675 135.1% 0 0 136.6% 0.0% 0.0%Orthodontists 102,339 54% 89,019 15.0% 4,143 53% 7,384 -43.9% 106,482 54% 96,403 10.5% 3 3 11.1% 0.4% 0.5%Periodontists 12,614 7% 11,014 14.5% 445 6% 872 -48.9% 13,059 7% 11,887 9.9% 0 0 10.5% 0.1% 0.1%Prosthodontists 12,868 7% 13,150 -2.1% 412 5% 1,105 -62.7% 13,280 7% 14,256 -6.8% 0 0 -6.3% 0.1% 0.1%TOTAL HOSPITALS 5,437,343 32% 4,690,945 15.9% 719,720 26% 823,498 -12.6% 6,157,063 31% 5,514,443 11.7% 193 172 12.3% 25.3% 30.3%PROVINCIAL HOSPITALS 132,261 2% 132,844 -0.4% 20,964 3% 43,972 -52.3% 153,225 2% 176,816 -13.3% 5 6 -12.8% 0.6% 0.8%Ward Fees 84,457 64% 83,833 0.7% 18,635 89% 36,815 -49.4% 103,092 67% 120,648 -14.6% 3 4 -14.0% 0.4% 0.5%Theatre Fees 15,057 11% 24,714 -39.1% 1,037 5% 4,151 -75.0% 16,094 11% 28,865 -44.2% 1 1 -43.9% 0.1% 0.1%Consumables 19,213 15% 11,893 61.5% 550 3% 2,498 -78.0% 19,763 13% 14,391 37.3% 1 0 38.2% 0.1% 0.1%Medicines dispensed 13,534 10% 12,404 9.1% 742 4% 508 45.8% 14,275 9% 12,913 10.6% 0 0 11.2% 0.1% 0.1%PRIVATE HOSPITALS 5,058,182 93% 4,080,680 24.0% 698,757 97% 779,526 -10.4% 5,756,939 94% 4,860,206 18.5% 180 151 19.2% 23.7% 28.3%Ward Fees 2,298,141 45% 1,806,334 27.2% 560,832 80% 504,457 11.2% 2,858,973 50% 2,310,791 23.7% 90 72 24.5% 11.8% 14.1%Theatre Fees 787,547 16% 835,645 -5.8% 63,776 9% 121,085 -47.3% 851,322 15% 956,730 -11.0% 27 30 -10.5% 3.5% 4.2%Consumables 1,089,957 22% 679,364 60.4% 17,277 2% 89,391 -80.7% 1,107,234 19% 768,755 44.0% 35 24 44.9% 4.6% 5.4%Medicines dispensed 882,537 17% 759,336 16.2% 56,872 8% 64,592 -12.0% 939,410 16% 823,929 14.0% 29 26 14.7% 3.9% 4.6%Global / per diem fee 246,899 5% 477,422 -48.3% - 0% - 0.0% 246,899 4% 477,422 -48.3% 8 15 -48.0% 1.0% 1.2%MEDICINES 3,881,105 23% 3,494,461 11.1% 1,277,386 47% 685,344 86.4% 5,158,491 26% 4,179,805 23.4% 162 130 24.2% 21.2% 25.4%Medicines dispensed by Pharmacists 2,629,928 68% 2,278,637 15.4% 1,122,398 88% 389,726 188.0% 3,752,325 73% 2,668,363 40.6% 118 83 41.5% 15.4% 18.5%Medicines dispensed by Practitioners 1,251,177 32% 1,215,825 2.9% 154,989 12% 295,618 -47.6% 1,406,166 27% 1,511,442 -7.0% 44 47 -6.4% 5.8% 6.9%EX-GRATIA PAYMENTS 26,164 0% 38,719 -32.4% 3,427 0% 353 869.5% 29,591 0% 39,073 -24.3% 1 1 -23.8% 0.1% 0.1%OTHER BENEFITS 1,339,671 8% 1,163,009 15.2% 136,582 5% 184,205 -25.9% 1,476,253 7% 1,347,214 9.6% 46 42 10.3% 6.1% 7.3%Chiropractors 12,361 1% 11,077 11.6% 996 1% 479 107.8% 13,357 1% 11,556 15.6% 0 0 16.3% 0.1% 0.1%Chiropodists 6,223 0% 5,814 7.1% 528 0% 354 49.2% 6,752 0% 6,168 9.5% 0 0 10.1% 0.0% 0.0%Optometrists & Spectacles 598,659 45% 522,485 14.6% 51,762 38% 73,251 -29.3% 650,421 44% 595,735 9.2% 20 19 9.9% 2.7% 3.2%Physiotherapists 193,646 14% 167,043 15.9% 18,462 14% 22,716 -18.7% 212,109 14% 189,759 11.8% 7 6 12.5% 0.9% 1.0%Orthoptists 3,450 0% 3,980 -13.3% 1,073 1% 3,591 -70.1% 4,523 0% 7,571 -40.3% 0 0 -39.9% 0.0% 0.0%Blood Transfusion 63,404 5% 52,476 20.8% 10,157 7% 10,453 -2.8% 73,562 5% 62,929 16.9% 2 2 17.6% 0.3% 0.4%Speech Therapists 30,405 2% 21,816 39.4% 2,473 2% 4,469 -44.7% 32,878 2% 26,286 25.1% 1 1 25.9% 0.1% 0.2%Psychologists 98,977 7% 71,483 38.5% 12,795 9% 20,365 -37.2% 111,771 8% 91,848 21.7% 4 3 22.4% 0.5% 0.5%Occupational Therapy 20,488 2% 15,641 31.0% 1,817 1% 2,578 -29.5% 22,305 2% 18,219 22.4% 1 1 23.2% 0.1% 0.1%Nursing 27,450 2% 22,758 20.6% 1,881 1% 1,728 8.9% 29,331 2% 24,486 19.8% 1 1 20.5% 0.1% 0.1%Appliances (supplied outside hospitals) 57,011 4% 49,485 15.2% 4,436 3% 6,422 -30.9% 61,447 4% 55,908 9.9% 2 2 10.6% 0.3% 0.3%Dieticians 3,497 0% 2,663 31.3% 180 0% 220 -17.9% 3,677 0% 2,883 27.6% 0 0 28.4% 0.0% 0.0%Homeopaths 13,608 1% 11,596 17.4% 388 0% 259 50.1% 13,996 1% 11,854 18.1% 0 0 18.8% 0.1% 0.1%Ambulance Services 24,872 2% 36,913 -32.6% 3,012 2% 6,509 -53.7% 27,885 2% 43,422 -35.8% 1 1 -35.4% 0.1% 0.1%Cardiac Technologists 38,266 3% 30,925 23.7% 9,052 7% 8,804 2.8% 47,318 3% 39,729 19.1% 1 1 19.8% 0.2% 0.2%Other 147,353 11% 136,856 7.7% 17,568 13% 22,007 -20.2% 164,921 11% 158,863 3.8% 5 5 4.5% 0.7% 0.8%
TOTAL BENEFITS 17,078,195 100% 15,068,829 13.3% 2,741,433 100% 2,551,378 7.4% 19,819,628 100% 17,620,207 12.5% 621 549 13.2% 81.6% 97.5%
REGISTERED EXEMPT CONSOLIDATED

1998 REPORT OF THE REGISTRAR OF MEDICAL SCHEMES
Registrar of Medical Schemes
Page:21
ANALYSIS OF SAVINGS BENEFITS PAID ANNEXURE F
for the year ended 31 December 1998Average PMPM
1998 1997 % 1998 1997 % 1998 1997 % 1998 1997 % As % of As % of R'000 % R'000 Change R'000 % R'000 Change R'000 % R'000 Change R R Change GCI NCI
GENERAL PRACITIONERS 290,943 17% 194,746 49.4% 55,195 30% 55,232 -0.1% 346,138 19% 249,978 38.5% 11 8 39.3% 1.4% 1.7%MEDICAL SPECIALISTS 236,670 14% 155,567 52.1% 25,073 14% 26,442 -5.2% 261,743 14% 182,009 43.8% 8 6 44.7% 1.1% 1.3%Anaesthetists 6,546 3% 5,318 23.1% 278 1% 123 126.6% 6,825 3% 5,441 25.4% 0 0 26.2% 0.0% 0.0%Dermatologists 6,663 3% 4,070 63.7% 538 2% 520 3.5% 7,201 3% 4,590 56.9% 0 0 57.8% 0.0% 0.0%Gynaecologists 29,858 13% 19,502 53.1% 1,918 8% 2,134 -10.2% 31,775 12% 21,636 46.9% 1 1 47.8% 0.1% 0.2%Physicians 18,766 8% 11,885 57.9% 2,722 11% 3,093 -12.0% 21,489 8% 14,978 43.5% 1 0 44.4% 0.1% 0.1%Neurologists 3,045 1% 1,959 55.4% 291 1% 411 -29.1% 3,336 1% 2,370 40.8% 0 0 41.6% 0.0% 0.0%Psychiatrists 4,321 2% 3,560 21.4% 460 2% 481 -4.5% 4,781 2% 4,041 18.3% 0 0 19.0% 0.0% 0.0%Neuro-surgeons 1,421 1% 1,163 22.2% 193 1% 181 7.0% 1,614 1% 1,343 20.1% 0 0 20.9% 0.0% 0.0%Ophthalmologists 11,192 5% 11,326 -1.2% - 0% 1,438 -100.0% 11,192 4% 12,764 -12.3% 0 0 -11.8% 0.0% 0.1%Orthopaedic Surgeons 7,437 3% 5,691 30.7% 930 4% 738 26.1% 8,368 3% 6,429 30.2% 0 0 31.0% 0.0% 0.0%Otorhinolaryngologists 6,656 3% 4,635 43.6% 621 2% 593 4.8% 7,278 3% 5,227 39.2% 0 0 40.1% 0.0% 0.0%Paediatricians 14,200 6% 8,586 65.4% 624 2% 850 -26.6% 14,824 6% 9,436 57.1% 0 0 58.1% 0.1% 0.1%Specialists in Physical Medicine 62 0% 69 -10.6% - 0% 11 -100.0% 62 0% 80 -23.3% 0 0 -22.8% 0.0% 0.0%Plastic & Reconstructive Surgeons 1,780 1% 1,467 21.4% 115 0% 77 49.5% 1,895 1% 1,543 22.8% 0 0 23.6% 0.0% 0.0%Radiologists 47,670 20% 28,991 64.4% 5,727 23% 5,961 -3.9% 53,397 20% 34,953 52.8% 2 1 53.7% 0.2% 0.3%Radiotherapists 2,762 1% 2,173 27.1% 69 0% 64 7.6% 2,831 1% 2,238 26.5% 0 0 27.3% 0.0% 0.0%Surgeons 6,575 3% 5,088 29.2% 1,134 5% 1,106 2.6% 7,709 3% 6,193 24.5% 0 0 25.2% 0.0% 0.0%Thoracic Surgeons 602 0% 714 -15.6% 62 0% 79 -21.2% 664 0% 793 -16.2% 0 0 -15.7% 0.0% 0.0%Urologists 3,839 2% 2,672 43.7% 797 3% 794 0.4% 4,636 2% 3,466 33.8% 0 0 34.6% 0.0% 0.0%Pathologists 63,276 27% 36,699 72.4% 8,592 34% 7,789 10.3% 71,868 27% 44,488 61.5% 2 1 62.5% 0.3% 0.4%DENTISTS 184,677 11% 107,044 72.5% 10,959 6% 452 2324.6% 195,636 11% 107,496 82.0% 6 3 83.1% 0.8% 1.0%DENTAL SPECIALISTS 30,873 2% 21,513 43.5% 1,006 1% 40 2414.4% 31,879 2% 21,553 47.9% 1 1 48.8% 0.1% 0.2%Maxilla, Facial & Oral Surgeons 12,277 40% 8,495 44.5% 126 12% 20 531.7% 12,403 39% 8,515 45.7% 0 0 46.6% 0.1% 0.1%Oral Pathologists 1,778 6% 1,702 4.5% - 0% 2 -100.0% 1,778 6% 1,703 4.4% 0 0 5.1% 0.0% 0.0%Orthodontists 12,416 40% 8,370 48.3% 744 74% 13 5712.4% 13,160 41% 8,382 57.0% 0 0 58.0% 0.1% 0.1%Periodontists 2,105 7% 1,671 26.0% 44 4% 0 10944.6% 2,149 7% 1,671 28.6% 0 0 29.4% 0.0% 0.0%Prosthodontists 2,297 7% 1,277 79.9% 92 9% 5 1723.5% 2,389 7% 1,282 86.4% 0 0 87.5% 0.0% 0.0%TOTAL HOSPITALS 21,252 1% 26,893 -21.0% 2,048 1% 1,607 27.4% 23,299 1% 28,500 -18.2% 1 1 -17.7% 0.1% 0.1%PROVINCIAL HOSPITALS 1,356 6% 1,529 -11.4% 1,062 52% 796 33.4% 2,418 10% 2,325 4.0% 0 0 4.6% 0.0% 0.0%Ward Fees 596 44% 396 50.7% 1,062 100% 796 33.4% 1,658 69% 1,192 39.2% 0 0 40.0% 0.0% 0.0%Theatre Fees 54 4% 739 -92.7% - 0% - 0.0% 54 2% 739 -92.7% 0 0 -92.6% 0.0% 0.0%Consumables 459 34% 237 94.1% - 0% - 0.0% 459 19% 237 94.1% 0 0 95.3% 0.0% 0.0%Medicines dispensed 245 18% 157 55.9% - 0% - 0.0% 245 10% 157 55.9% 0 0 56.8% 0.0% 0.0%PRIVATE HOSPITALS 19,896 94% 25,364 -21.6% 986 48% 811 21.5% 20,882 90% 26,175 -20.2% 1 1 -19.7% 0.1% 0.1%Ward Fees 8,582 43% 9,066 -5.3% 986 100% 811 21.5% 9,567 46% 9,877 -3.1% 0 0 -2.5% 0.0% 0.0%Theatre Fees 2,491 13% 5,519 -54.9% - 0% - 0.0% 2,491 12% 5,519 -54.9% 0 0 -54.6% 0.0% 0.0%Consumables 4,288 22% 5,721 -25.0% - 0% - 0.0% 4,288 21% 5,721 -25.0% 0 0 -24.6% 0.0% 0.0%Medicines dispensed 4,536 23% 5,059 -10.3% - 0% - 0.0% 4,536 22% 5,059 -10.3% 0 0 -9.8% 0.0% 0.0%Global / per diem fee - 0% - 0.0% - 0% - 0.0% - 0% - 0.0% 0 0 0.0% 0.0% 0.0%MEDICINES 618,689 37% 345,897 78.9% 70,769 39% 35,368 100.1% 689,458 37% 381,265 80.8% 22 12 81.9% 2.8% 3.4%Medicines dispensed by Pharmacists 447,418 72% 233,773 91.4% 65,741 93% 28,611 129.8% 513,159 74% 262,384 95.6% 16 8 96.8% 2.1% 2.5%Medicines dispensed by Practitioners 171,271 28% 112,124 52.8% 5,029 7% 6,757 -25.6% 176,300 26% 118,881 48.3% 6 4 49.2% 0.7% 0.9%EX-GRATIA PAYMENTS - 0% 580 -100.0% - 0% - 0.0% - 0% 580 -100.0% 0 0 -100.0% 0.0% 0.0%OTHER BENEFITS 284,091 17% 228,790 24.2% 16,578 9% 8,512 94.8% 300,669 16% 237,302 26.7% 9 7 27.5% 1.2% 1.5%Chiropractors 4,010 1% 2,440 64.3% 102 1% 73 39.6% 4,112 1% 2,514 63.6% 0 0 64.6% 0.0% 0.0%Chiropodists 1,645 1% 1,163 41.4% - 0% 5 -100.0% 1,645 1% 1,168 40.8% 0 0 41.7% 0.0% 0.0%Optometrists & Spectacles 152,207 54% 94,678 60.8% 12,526 76% 3,748 234.2% 164,733 55% 98,426 67.4% 5 3 68.4% 0.7% 0.8%Physiotherapists 29,753 10% 17,278 72.2% 1,415 9% 1,203 17.6% 31,167 10% 18,482 68.6% 1 1 69.7% 0.1% 0.2%Orthoptists 100 0% 137 -27.1% 1 0% 1 36.6% 101 0% 138 -26.7% 0 0 -26.2% 0.0% 0.0%Blood Transfusion 1,855 1% 1,937 -4.2% 97 1% 55 77.0% 1,953 1% 1,992 -2.0% 0 0 -1.4% 0.0% 0.0%Speech Therapists 4,551 2% 2,313 96.8% 299 2% 110 171.7% 4,851 2% 2,423 100.2% 0 0 101.4% 0.0% 0.0%Psychologists 19,114 7% 10,503 82.0% 649 4% 489 32.8% 19,763 7% 10,991 79.8% 1 0 80.9% 0.1% 0.1%Occupational Therapy 4,353 2% 2,498 74.2% 151 1% 111 36.2% 4,504 1% 2,609 72.6% 0 0 73.7% 0.0% 0.0%Nursing 1,618 1% 1,199 35.0% 60 0% 58 4.2% 1,678 1% 1,256 33.6% 0 0 34.4% 0.0% 0.0%Appliances (supplied outside hospitals) 5,176 2% 3,663 41.3% 142 1% 53 165.2% 5,318 2% 3,716 43.1% 0 0 44.0% 0.0% 0.0%Dieticians 951 0% 552 72.4% - 0% 31 -100.0% 951 0% 583 63.2% 0 0 64.2% 0.0% 0.0%Homeopaths 2,942 1% 1,775 65.7% 125 1% 133 -5.5% 3,067 1% 1,908 60.8% 0 0 61.8% 0.0% 0.0%Ambulance Services 566 0% 1,078 -47.5% 29 0% 107 -72.5% 596 0% 1,185 -49.7% 0 0 -49.4% 0.0% 0.0%Cardiac Technologists 1,982 1% 1,573 26.0% 101 1% 76 33.4% 2,083 1% 1,649 26.4% 0 0 27.2% 0.0% 0.0%Other 53,267 19% 86,003 -38.1% 881 5% 2,260 -61.0% 54,148 18% 88,263 -38.7% 2 3 -38.3% 0.2% 0.3%
TOTAL BENEFITS 1,667,195 100% 1,081,030 54.2% 181,628 100% 127,653 42.3% 1,848,823 100% 1,208,683 53.0% 58 38 53.9% 7.6% 9.1%
REGISTERED EXEMPT CONSOLIDATED
1998 REPORT OF THE REGISTRAR OF MEDICAL SCHEMES
Registrar of Medical Schemes
Page:22
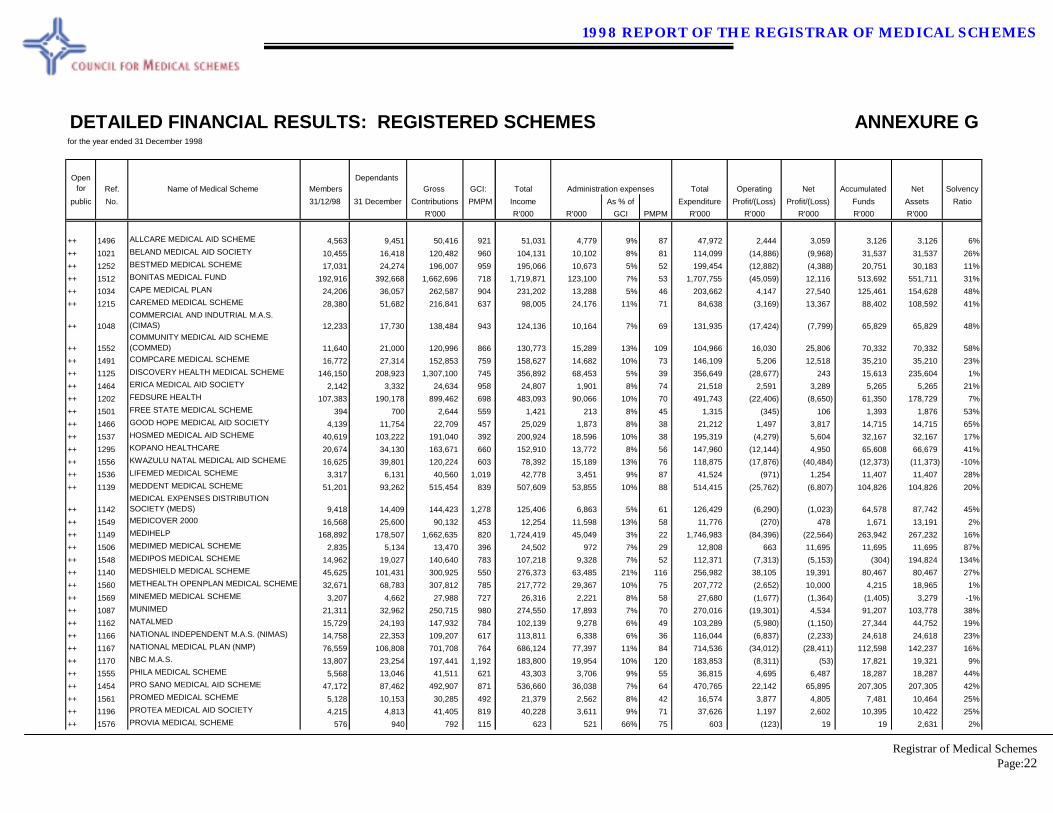
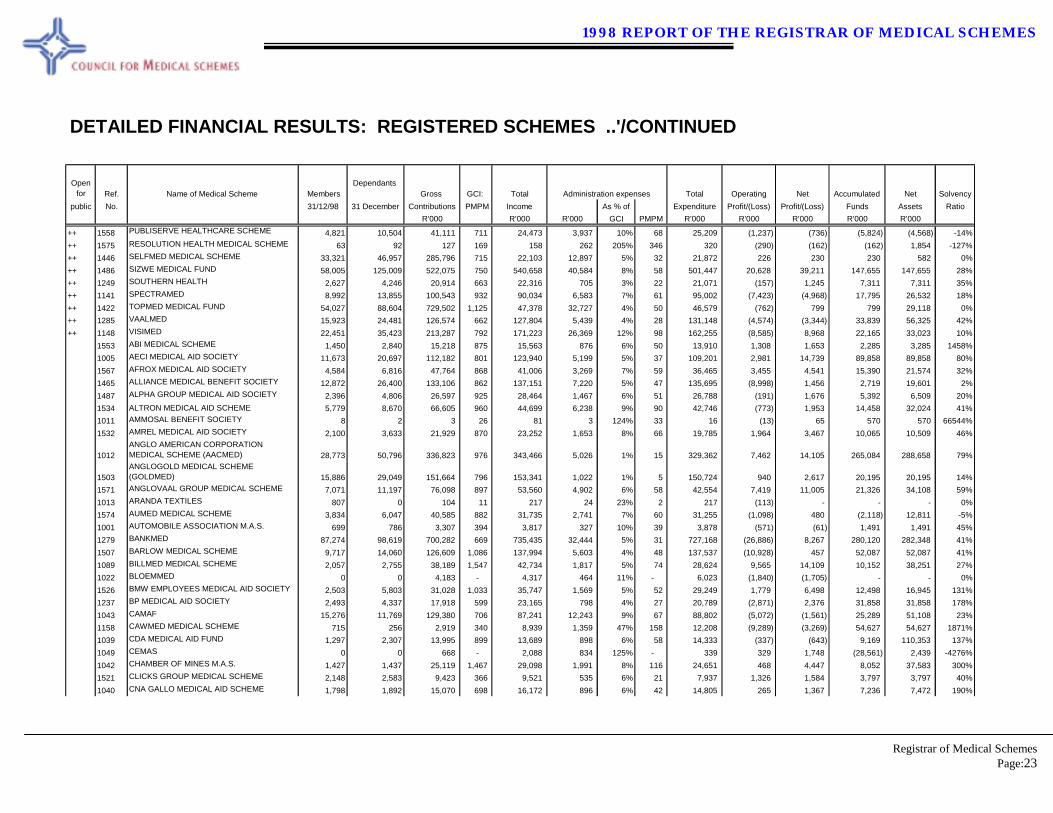
DETAILED FINANCIAL RESULTS: REGISTERED SCHEMES ANNEXURE G for the year ended 31 December 1998
Open for Ref. Name of Medical Scheme Members
DependantsGross GCI: Total Administration expenses Total Operating Net Accumulated Net Solvency
public No. 31/12/98 31 December Contributions PMPM Income As % of Expenditure Profit/(Loss) Profit/(Loss) Funds Assets RatioR'000 R'000 R'000 GCI PMPM R'000 R'000 R'000 R'000 R'000
++ 1496 ALLCARE MEDICAL AID SCHEME 4,563 9,451 50,416 921 51,031 4,779 9% 87 47,972 2,444 3,059 3,126 3,126 6%++ 1021 BELAND MEDICAL AID SOCIETY 10,455 16,418 120,482 960 104,131 10,102 8% 81 114,099 (14,886) (9,968) 31,537 31,537 26%++ 1252 BESTMED MEDICAL SCHEME 17,031 24,274 196,007 959 195,066 10,673 5% 52 199,454 (12,882) (4,388) 20,751 30,183 11%++ 1512 BONITAS MEDICAL FUND 192,916 392,668 1,662,696 718 1,719,871 123,100 7% 53 1,707,755 (45,059) 12,116 513,692 551,711 31%++ 1034 CAPE MEDICAL PLAN 24,206 36,057 262,587 904 231,202 13,288 5% 46 203,662 4,147 27,540 125,461 154,628 48%++ 1215 CAREMED MEDICAL SCHEME 28,380 51,682 216,841 637 98,005 24,176 11% 71 84,638 (3,169) 13,367 88,402 108,592 41%
++ 1048 COMMERCIAL AND INDUTRIAL M.A.S. (CIMAS) 12,233 17,730 138,484 943 124,136 10,164 7% 69 131,935 (17,424) (7,799) 65,829 65,829 48%
++ 1552 COMMUNITY MEDICAL AID SCHEME (COMMED) 11,640 21,000 120,996 866 130,773 15,289 13% 109 104,966 16,030 25,806 70,332 70,332 58%
++ 1491 COMPCARE MEDICAL SCHEME 16,772 27,314 152,853 759 158,627 14,682 10% 73 146,109 5,206 12,518 35,210 35,210 23%++ 1125 DISCOVERY HEALTH MEDICAL SCHEME 146,150 208,923 1,307,100 745 356,892 68,453 5% 39 356,649 (28,677) 243 15,613 235,604 1%++ 1464 ERICA MEDICAL AID SOCIETY 2,142 3,332 24,634 958 24,807 1,901 8% 74 21,518 2,591 3,289 5,265 5,265 21%++ 1202 FEDSURE HEALTH 107,383 190,178 899,462 698 483,093 90,066 10% 70 491,743 (22,406) (8,650) 61,350 178,729 7%++ 1501 FREE STATE MEDICAL SCHEME 394 700 2,644 559 1,421 213 8% 45 1,315 (345) 106 1,393 1,876 53%++ 1466 GOOD HOPE MEDICAL AID SOCIETY 4,139 11,754 22,709 457 25,029 1,873 8% 38 21,212 1,497 3,817 14,715 14,715 65%++ 1537 HOSMED MEDICAL AID SCHEME 40,619 103,222 191,040 392 200,924 18,596 10% 38 195,319 (4,279) 5,604 32,167 32,167 17%++ 1295 KOPANO HEALTHCARE 20,674 34,130 163,671 660 152,910 13,772 8% 56 147,960 (12,144) 4,950 65,608 66,679 41%++ 1556 KWAZULU NATAL MEDICAL AID SCHEME 16,625 39,801 120,224 603 78,392 15,189 13% 76 118,875 (17,876) (40,484) (12,373) (11,373) -10%++ 1536 LIFEMED MEDICAL SCHEME 3,317 6,131 40,560 1,019 42,778 3,451 9% 87 41,524 (971) 1,254 11,407 11,407 28%++ 1139 MEDDENT MEDICAL SCHEME 51,201 93,262 515,454 839 507,609 53,855 10% 88 514,415 (25,762) (6,807) 104,826 104,826 20%
++ 1142 MEDICAL EXPENSES DISTRIBUTION SOCIETY (MEDS) 9,418 14,409 144,423 1,278 125,406 6,863 5% 61 126,429 (6,290) (1,023) 64,578 87,742 45%
++ 1549 MEDICOVER 2000 16,568 25,600 90,132 453 12,254 11,598 13% 58 11,776 (270) 478 1,671 13,191 2%++ 1149 MEDIHELP 168,892 178,507 1,662,635 820 1,724,419 45,049 3% 22 1,746,983 (84,396) (22,564) 263,942 267,232 16%++ 1506 MEDIMED MEDICAL SCHEME 2,835 5,134 13,470 396 24,502 972 7% 29 12,808 663 11,695 11,695 11,695 87%++ 1548 MEDIPOS MEDICAL SCHEME 14,962 19,027 140,640 783 107,218 9,328 7% 52 112,371 (7,313) (5,153) (304) 194,824 134%++ 1140 MEDSHIELD MEDICAL SCHEME 45,625 101,431 300,925 550 276,373 63,485 21% 116 256,982 38,105 19,391 80,467 80,467 27%++ 1560 METHEALTH OPENPLAN MEDICAL SCHEME 32,671 68,783 307,812 785 217,772 29,367 10% 75 207,772 (2,652) 10,000 4,215 18,965 1%++ 1569 MINEMED MEDICAL SCHEME 3,207 4,662 27,988 727 26,316 2,221 8% 58 27,680 (1,677) (1,364) (1,405) 3,279 -1%++ 1087 MUNIMED 21,311 32,962 250,715 980 274,550 17,893 7% 70 270,016 (19,301) 4,534 91,207 103,778 38%++ 1162 NATALMED 15,729 24,193 147,932 784 102,139 9,278 6% 49 103,289 (5,980) (1,150) 27,344 44,752 19%++ 1166 NATIONAL INDEPENDENT M.A.S. (NIMAS) 14,758 22,353 109,207 617 113,811 6,338 6% 36 116,044 (6,837) (2,233) 24,618 24,618 23%++ 1167 NATIONAL MEDICAL PLAN (NMP) 76,559 106,808 701,708 764 686,124 77,397 11% 84 714,536 (34,012) (28,411) 112,598 142,237 16%++ 1170 NBC M.A.S. 13,807 23,254 197,441 1,192 183,800 19,954 10% 120 183,853 (8,311) (53) 17,821 19,321 9%++ 1555 PHILA MEDICAL SCHEME 5,568 13,046 41,511 621 43,303 3,706 9% 55 36,815 4,695 6,487 18,287 18,287 44%++ 1454 PRO SANO MEDICAL AID SCHEME 47,172 87,462 492,907 871 536,660 36,038 7% 64 470,765 22,142 65,895 207,305 207,305 42%++ 1561 PROMED MEDICAL SCHEME 5,128 10,153 30,285 492 21,379 2,562 8% 42 16,574 3,877 4,805 7,481 10,464 25%++ 1196 PROTEA MEDICAL AID SOCIETY 4,215 4,813 41,405 819 40,228 3,611 9% 71 37,626 1,197 2,602 10,395 10,422 25%++ 1576 PROVIA MEDICAL SCHEME 576 940 792 115 623 521 66% 75 603 (123) 19 19 2,631 2%
1998 REPORT OF THE REGISTRAR OF MEDICAL SCHEMES
Registrar of Medical Schemes
Page:23
DETAILED FINANCIAL RESULTS: REGISTERED SCHEMES ..'/CONTINUED
Open
for Ref. Name of Medical Scheme MembersDependants
Gross GCI: Total Administration expenses Total Operating Net Accumulated Net Solvencypublic No. 31/12/98 31 December Contributions PMPM Income As % of Expenditure Profit/(Loss) Profit/(Loss) Funds Assets Ratio
R'000 R'000 R'000 GCI PMPM R'000 R'000 R'000 R'000 R'000
++ 1558 PUBLISERVE HEALTHCARE SCHEME 4,821 10,504 41,111 711 24,473 3,937 10% 68 25,209 (1,237) (736) (5,824) (4,568) -14%++ 1575 RESOLUTION HEALTH MEDICAL SCHEME 63 92 127 169 158 262 205% 346 320 (290) (162) (162) 1,854 -127%++ 1446 SELFMED MEDICAL SCHEME 33,321 46,957 285,796 715 22,103 12,897 5% 32 21,872 226 230 230 582 0%++ 1486 SIZWE MEDICAL FUND 58,005 125,009 522,075 750 540,658 40,584 8% 58 501,447 20,628 39,211 147,655 147,655 28%++ 1249 SOUTHERN HEALTH 2,627 4,246 20,914 663 22,316 705 3% 22 21,071 (157) 1,245 7,311 7,311 35%++ 1141 SPECTRAMED 8,992 13,855 100,543 932 90,034 6,583 7% 61 95,002 (7,423) (4,968) 17,795 26,532 18%++ 1422 TOPMED MEDICAL FUND 54,027 88,604 729,502 1,125 47,378 32,727 4% 50 46,579 (762) 799 799 29,118 0%++ 1285 VAALMED 15,923 24,481 126,574 662 127,804 5,439 4% 28 131,148 (4,574) (3,344) 33,839 56,325 42%++ 1148 VISIMED 22,451 35,423 213,287 792 171,223 26,369 12% 98 162,255 (8,585) 8,968 22,165 33,023 10%
1553 ABI MEDICAL SCHEME 1,450 2,840 15,218 875 15,563 876 6% 50 13,910 1,308 1,653 2,285 3,285 1458%1005 AECI MEDICAL AID SOCIETY 11,673 20,697 112,182 801 123,940 5,199 5% 37 109,201 2,981 14,739 89,858 89,858 80%1567 AFROX MEDICAL AID SOCIETY 4,584 6,816 47,764 868 41,006 3,269 7% 59 36,465 3,455 4,541 15,390 21,574 32%1465 ALLIANCE MEDICAL BENEFIT SOCIETY 12,872 26,400 133,106 862 137,151 7,220 5% 47 135,695 (8,998) 1,456 2,719 19,601 2%1487 ALPHA GROUP MEDICAL AID SOCIETY 2,396 4,806 26,597 925 28,464 1,467 6% 51 26,788 (191) 1,676 5,392 6,509 20%1534 ALTRON MEDICAL AID SCHEME 5,779 8,670 66,605 960 44,699 6,238 9% 90 42,746 (773) 1,953 14,458 32,024 41%1011 AMMOSAL BENEFIT SOCIETY 8 2 3 26 81 3 124% 33 16 (13) 65 570 570 66544%1532 AMREL MEDICAL AID SOCIETY 2,100 3,633 21,929 870 23,252 1,653 8% 66 19,785 1,964 3,467 10,065 10,509 46%
1012 ANGLO AMERICAN CORPORATION MEDICAL SCHEME (AACMED) 28,773 50,796 336,823 976 343,466 5,026 1% 15 329,362 7,462 14,105 265,084 288,658 79%
1503 ANGLOGOLD MEDICAL SCHEME (GOLDMED) 15,886 29,049 151,664 796 153,341 1,022 1% 5 150,724 940 2,617 20,195 20,195 14%
1571 ANGLOVAAL GROUP MEDICAL SCHEME 7,071 11,197 76,098 897 53,560 4,902 6% 58 42,554 7,419 11,005 21,326 34,108 59%1013 ARANDA TEXTILES 807 0 104 11 217 24 23% 2 217 (113) - - - 0%1574 AUMED MEDICAL SCHEME 3,834 6,047 40,585 882 31,735 2,741 7% 60 31,255 (1,098) 480 (2,118) 12,811 -5%1001 AUTOMOBILE ASSOCIATION M.A.S. 699 786 3,307 394 3,817 327 10% 39 3,878 (571) (61) 1,491 1,491 45%1279 BANKMED 87,274 98,619 700,282 669 735,435 32,444 5% 31 727,168 (26,886) 8,267 280,120 282,348 41%1507 BARLOW MEDICAL SCHEME 9,717 14,060 126,609 1,086 137,994 5,603 4% 48 137,537 (10,928) 457 52,087 52,087 41%1089 BILLMED MEDICAL SCHEME 2,057 2,755 38,189 1,547 42,734 1,817 5% 74 28,624 9,565 14,109 10,152 38,251 27%1022 BLOEMMED 0 0 4,183 - 4,317 464 11% - 6,023 (1,840) (1,705) - - 0%1526 BMW EMPLOYEES MEDICAL AID SOCIETY 2,503 5,803 31,028 1,033 35,747 1,569 5% 52 29,249 1,779 6,498 12,498 16,945 131%1237 BP MEDICAL AID SOCIETY 2,493 4,337 17,918 599 23,165 798 4% 27 20,789 (2,871) 2,376 31,858 31,858 178%1043 CAMAF 15,276 11,769 129,380 706 87,241 12,243 9% 67 88,802 (5,072) (1,561) 25,289 51,108 23%1158 CAWMED MEDICAL SCHEME 715 256 2,919 340 8,939 1,359 47% 158 12,208 (9,289) (3,269) 54,627 54,627 1871%1039 CDA MEDICAL AID FUND 1,297 2,307 13,995 899 13,689 898 6% 58 14,333 (337) (643) 9,169 110,353 137%1049 CEMAS 0 0 668 - 2,088 834 125% - 339 329 1,748 (28,561) 2,439 -4276%1042 CHAMBER OF MINES M.A.S. 1,427 1,437 25,119 1,467 29,098 1,991 8% 116 24,651 468 4,447 8,052 37,583 300%1521 CLICKS GROUP MEDICAL SCHEME 2,148 2,583 9,423 366 9,521 535 6% 21 7,937 1,326 1,584 3,797 3,797 40%1040 CNA GALLO MEDICAL AID SCHEME 1,798 1,892 15,070 698 16,172 896 6% 42 14,805 265 1,367 7,236 7,472 190%
1998 REPORT OF THE REGISTRAR OF MEDICAL SCHEMES
Registrar of Medical Schemes
Page:24
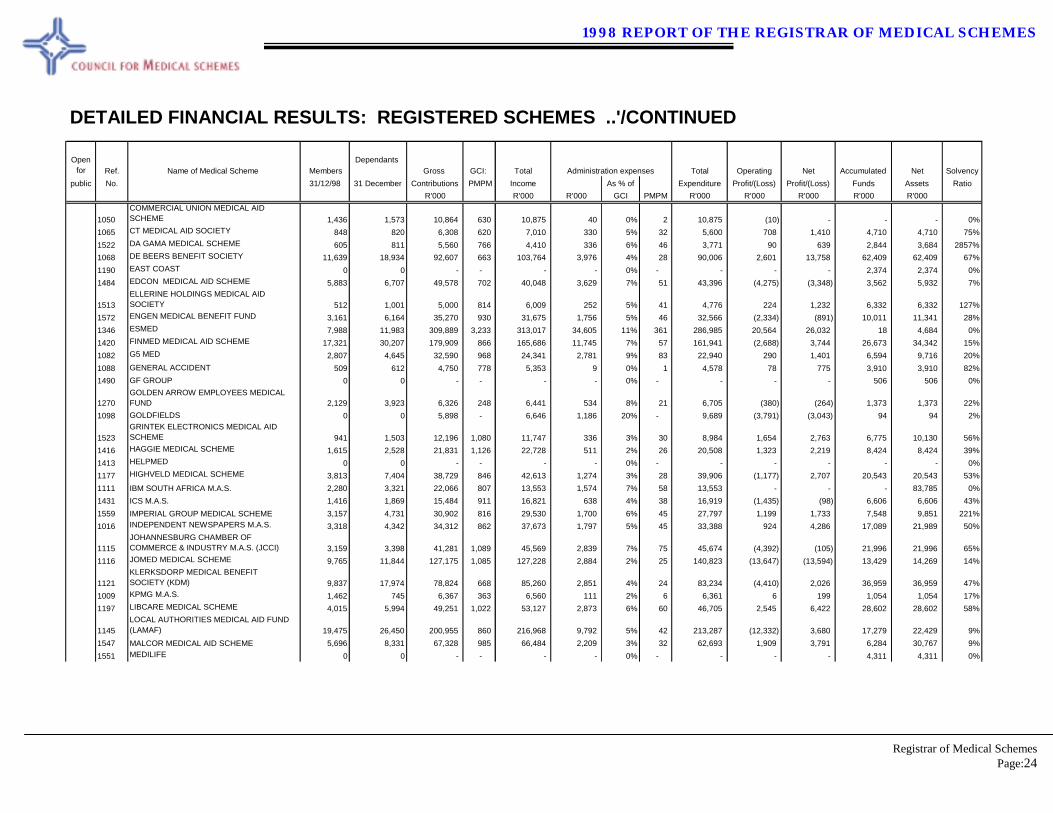
DETAILED FINANCIAL RESULTS: REGISTERED SCHEMES ..'/CONTINUED
Open
for Ref. Name of Medical Scheme MembersDependants
Gross GCI: Total Administration expenses Total Operating Net Accumulated Net Solvencypublic No. 31/12/98 31 December Contributions PMPM Income As % of Expenditure Profit/(Loss) Profit/(Loss) Funds Assets Ratio
R'000 R'000 R'000 GCI PMPM R'000 R'000 R'000 R'000 R'000
1050 COMMERCIAL UNION MEDICAL AID SCHEME 1,436 1,573 10,864 630 10,875 40 0% 2 10,875 (10) - - - 0%
1065 CT MEDICAL AID SOCIETY 848 820 6,308 620 7,010 330 5% 32 5,600 708 1,410 4,710 4,710 75%1522 DA GAMA MEDICAL SCHEME 605 811 5,560 766 4,410 336 6% 46 3,771 90 639 2,844 3,684 2857%1068 DE BEERS BENEFIT SOCIETY 11,639 18,934 92,607 663 103,764 3,976 4% 28 90,006 2,601 13,758 62,409 62,409 67%1190 EAST COAST 0 0 - - - - 0% - - - - 2,374 2,374 0%1484 EDCON MEDICAL AID SCHEME 5,883 6,707 49,578 702 40,048 3,629 7% 51 43,396 (4,275) (3,348) 3,562 5,932 7%
1513 ELLERINE HOLDINGS MEDICAL AID SOCIETY 512 1,001 5,000 814 6,009 252 5% 41 4,776 224 1,232 6,332 6,332 127%
1572 ENGEN MEDICAL BENEFIT FUND 3,161 6,164 35,270 930 31,675 1,756 5% 46 32,566 (2,334) (891) 10,011 11,341 28%1346 ESMED 7,988 11,983 309,889 3,233 313,017 34,605 11% 361 286,985 20,564 26,032 18 4,684 0%1420 FINMED MEDICAL AID SCHEME 17,321 30,207 179,909 866 165,686 11,745 7% 57 161,941 (2,688) 3,744 26,673 34,342 15%1082 G5 MED 2,807 4,645 32,590 968 24,341 2,781 9% 83 22,940 290 1,401 6,594 9,716 20%1088 GENERAL ACCIDENT 509 612 4,750 778 5,353 9 0% 1 4,578 78 775 3,910 3,910 82%1490 GF GROUP 0 0 - - - - 0% - - - - 506 506 0%
1270 GOLDEN ARROW EMPLOYEES MEDICAL FUND 2,129 3,923 6,326 248 6,441 534 8% 21 6,705 (380) (264) 1,373 1,373 22%
1098 GOLDFIELDS 0 0 5,898 - 6,646 1,186 20% - 9,689 (3,791) (3,043) 94 94 2%
1523 GRINTEK ELECTRONICS MEDICAL AID SCHEME 941 1,503 12,196 1,080 11,747 336 3% 30 8,984 1,654 2,763 6,775 10,130 56%
1416 HAGGIE MEDICAL SCHEME 1,615 2,528 21,831 1,126 22,728 511 2% 26 20,508 1,323 2,219 8,424 8,424 39%1413 HELPMED 0 0 - - - - 0% - - - - - - 0%1177 HIGHVELD MEDICAL SCHEME 3,813 7,404 38,729 846 42,613 1,274 3% 28 39,906 (1,177) 2,707 20,543 20,543 53%1111 IBM SOUTH AFRICA M.A.S. 2,280 3,321 22,066 807 13,553 1,574 7% 58 13,553 - - - 83,785 0%1431 ICS M.A.S. 1,416 1,869 15,484 911 16,821 638 4% 38 16,919 (1,435) (98) 6,606 6,606 43%1559 IMPERIAL GROUP MEDICAL SCHEME 3,157 4,731 30,902 816 29,530 1,700 6% 45 27,797 1,199 1,733 7,548 9,851 221%1016 INDEPENDENT NEWSPAPERS M.A.S. 3,318 4,342 34,312 862 37,673 1,797 5% 45 33,388 924 4,286 17,089 21,989 50%
1115 JOHANNESBURG CHAMBER OF COMMERCE & INDUSTRY M.A.S. (JCCI) 3,159 3,398 41,281 1,089 45,569 2,839 7% 75 45,674 (4,392) (105) 21,996 21,996 65%
1116 JOMED MEDICAL SCHEME 9,765 11,844 127,175 1,085 127,228 2,884 2% 25 140,823 (13,647) (13,594) 13,429 14,269 14%
1121 KLERKSDORP MEDICAL BENEFIT SOCIETY (KDM) 9,837 17,974 78,824 668 85,260 2,851 4% 24 83,234 (4,410) 2,026 36,959 36,959 47%
1009 KPMG M.A.S. 1,462 745 6,367 363 6,560 111 2% 6 6,361 6 199 1,054 1,054 17%1197 LIBCARE MEDICAL SCHEME 4,015 5,994 49,251 1,022 53,127 2,873 6% 60 46,705 2,545 6,422 28,602 28,602 58%
1145 LOCAL AUTHORITIES MEDICAL AID FUND (LAMAF) 19,475 26,450 200,955 860 216,968 9,792 5% 42 213,287 (12,332) 3,680 17,279 22,429 9%
1547 MALCOR MEDICAL AID SCHEME 5,696 8,331 67,328 985 66,484 2,209 3% 32 62,693 1,909 3,791 6,284 30,767 9%1551 MEDILIFE 0 0 - - - - 0% - - - - 4,311 4,311 0%
1998 REPORT OF THE REGISTRAR OF MEDICAL SCHEMES
Registrar of Medical Schemes
Page:25
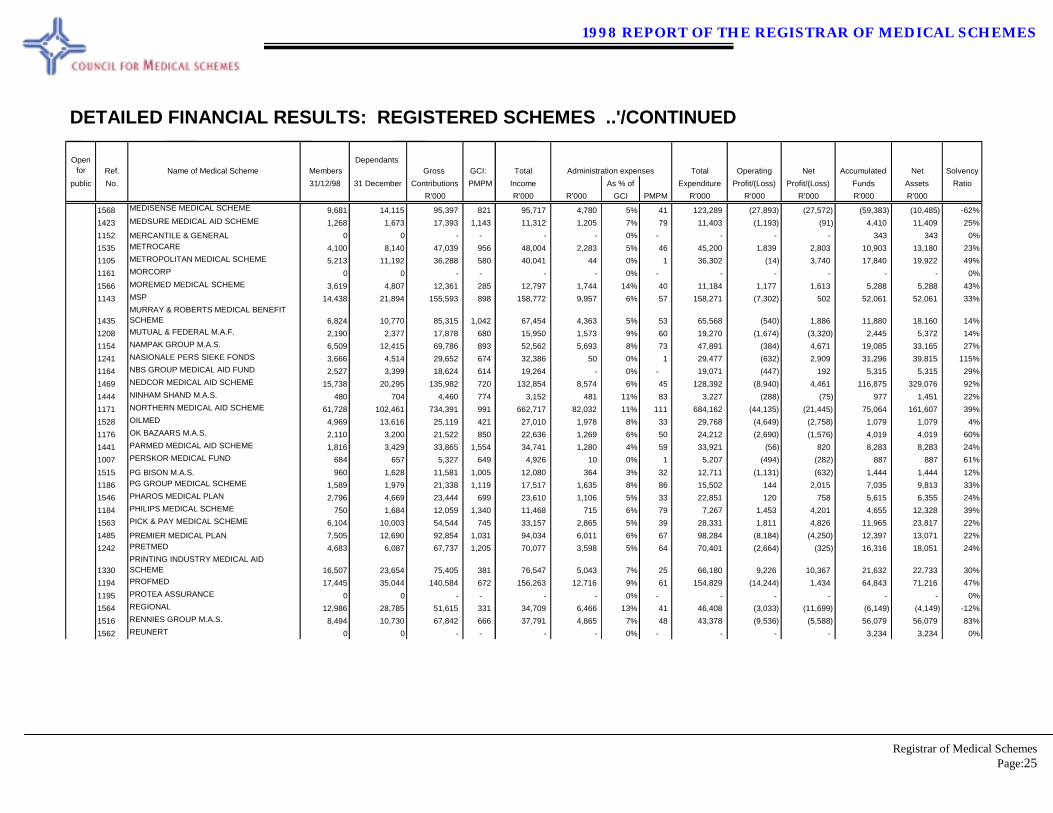
DETAILED FINANCIAL RESULTS: REGISTERED SCHEMES ..'/CONTINUED
Open
for Ref. Name of Medical Scheme MembersDependants
Gross GCI: Total Administration expenses Total Operating Net Accumulated Net Solvencypublic No. 31/12/98 31 December Contributions PMPM Income As % of Expenditure Profit/(Loss) Profit/(Loss) Funds Assets Ratio
R'000 R'000 R'000 GCI PMPM R'000 R'000 R'000 R'000 R'000
1568 MEDISENSE MEDICAL SCHEME 9,681 14,115 95,397 821 95,717 4,780 5% 41 123,289 (27,893) (27,572) (59,383) (10,485) -62%1423 MEDSURE MEDICAL AID SCHEME 1,268 1,673 17,393 1,143 11,312 1,205 7% 79 11,403 (1,193) (91) 4,410 11,409 25%1152 MERCANTILE & GENERAL 0 0 - - - - 0% - - - - 343 343 0%1535 METROCARE 4,100 8,140 47,039 956 48,004 2,283 5% 46 45,200 1,839 2,803 10,903 13,180 23%1105 METROPOLITAN MEDICAL SCHEME 5,213 11,192 36,288 580 40,041 44 0% 1 36,302 (14) 3,740 17,840 19,922 49%1161 MORCORP 0 0 - - - - 0% - - - - - - 0%1566 MOREMED MEDICAL SCHEME 3,619 4,807 12,361 285 12,797 1,744 14% 40 11,184 1,177 1,613 5,288 5,288 43%1143 MSP 14,438 21,894 155,593 898 158,772 9,957 6% 57 158,271 (7,302) 502 52,061 52,061 33%
1435 MURRAY & ROBERTS MEDICAL BENEFIT SCHEME 6,824 10,770 85,315 1,042 67,454 4,363 5% 53 65,568 (540) 1,886 11,880 18,160 14%
1208 MUTUAL & FEDERAL M.A.F. 2,190 2,377 17,878 680 15,950 1,573 9% 60 19,270 (1,674) (3,320) 2,445 5,372 14%1154 NAMPAK GROUP M.A.S. 6,509 12,415 69,786 893 52,562 5,693 8% 73 47,891 (384) 4,671 19,085 33,165 27%1241 NASIONALE PERS SIEKE FONDS 3,666 4,514 29,652 674 32,386 50 0% 1 29,477 (632) 2,909 31,296 39,815 115%1164 NBS GROUP MEDICAL AID FUND 2,527 3,399 18,624 614 19,264 - 0% - 19,071 (447) 192 5,315 5,315 29%1469 NEDCOR MEDICAL AID SCHEME 15,738 20,295 135,982 720 132,854 8,574 6% 45 128,392 (8,940) 4,461 116,875 329,076 92%1444 NINHAM SHAND M.A.S. 480 704 4,460 774 3,152 481 11% 83 3,227 (288) (75) 977 1,451 22%1171 NORTHERN MEDICAL AID SCHEME 61,728 102,461 734,391 991 662,717 82,032 11% 111 684,162 (44,135) (21,445) 75,064 161,607 39%1528 OILMED 4,969 13,616 25,119 421 27,010 1,978 8% 33 29,768 (4,649) (2,758) 1,079 1,079 4%1176 OK BAZAARS M.A.S. 2,110 3,200 21,522 850 22,636 1,269 6% 50 24,212 (2,690) (1,576) 4,019 4,019 60%1441 PARMED MEDICAL AID SCHEME 1,816 3,429 33,865 1,554 34,741 1,280 4% 59 33,921 (56) 820 8,283 8,283 24%1007 PERSKOR MEDICAL FUND 684 657 5,327 649 4,926 10 0% 1 5,207 (494) (282) 887 887 61%1515 PG BISON M.A.S. 960 1,628 11,581 1,005 12,080 364 3% 32 12,711 (1,131) (632) 1,444 1,444 12%1186 PG GROUP MEDICAL SCHEME 1,589 1,979 21,338 1,119 17,517 1,635 8% 86 15,502 144 2,015 7,035 9,813 33%1546 PHAROS MEDICAL PLAN 2,796 4,669 23,444 699 23,610 1,106 5% 33 22,851 120 758 5,615 6,355 24%1184 PHILIPS MEDICAL SCHEME 750 1,684 12,059 1,340 11,468 715 6% 79 7,267 1,453 4,201 4,655 12,328 39%1563 PICK & PAY MEDICAL SCHEME 6,104 10,003 54,544 745 33,157 2,865 5% 39 28,331 1,811 4,826 11,965 23,817 22%1485 PREMIER MEDICAL PLAN 7,505 12,690 92,854 1,031 94,034 6,011 6% 67 98,284 (8,184) (4,250) 12,397 13,071 22%1242 PRETMED 4,683 6,087 67,737 1,205 70,077 3,598 5% 64 70,401 (2,664) (325) 16,316 18,051 24%
1330 PRINTING INDUSTRY MEDICAL AID SCHEME 16,507 23,654 75,405 381 76,547 5,043 7% 25 66,180 9,226 10,367 21,632 22,733 30%
1194 PROFMED 17,445 35,044 140,584 672 156,263 12,716 9% 61 154,829 (14,244) 1,434 64,843 71,216 47%1195 PROTEA ASSURANCE 0 0 - - - - 0% - - - - - - 0%1564 REGIONAL 12,986 28,785 51,615 331 34,709 6,466 13% 41 46,408 (3,033) (11,699) (6,149) (4,149) -12%1516 RENNIES GROUP M.A.S. 8,494 10,730 67,842 666 37,791 4,865 7% 48 43,378 (9,536) (5,588) 56,079 56,079 83%1562 REUNERT 0 0 - - - - 0% - - - - 3,234 3,234 0%
1998 REPORT OF THE REGISTRAR OF MEDICAL SCHEMES
Registrar of Medical Schemes
Page:26
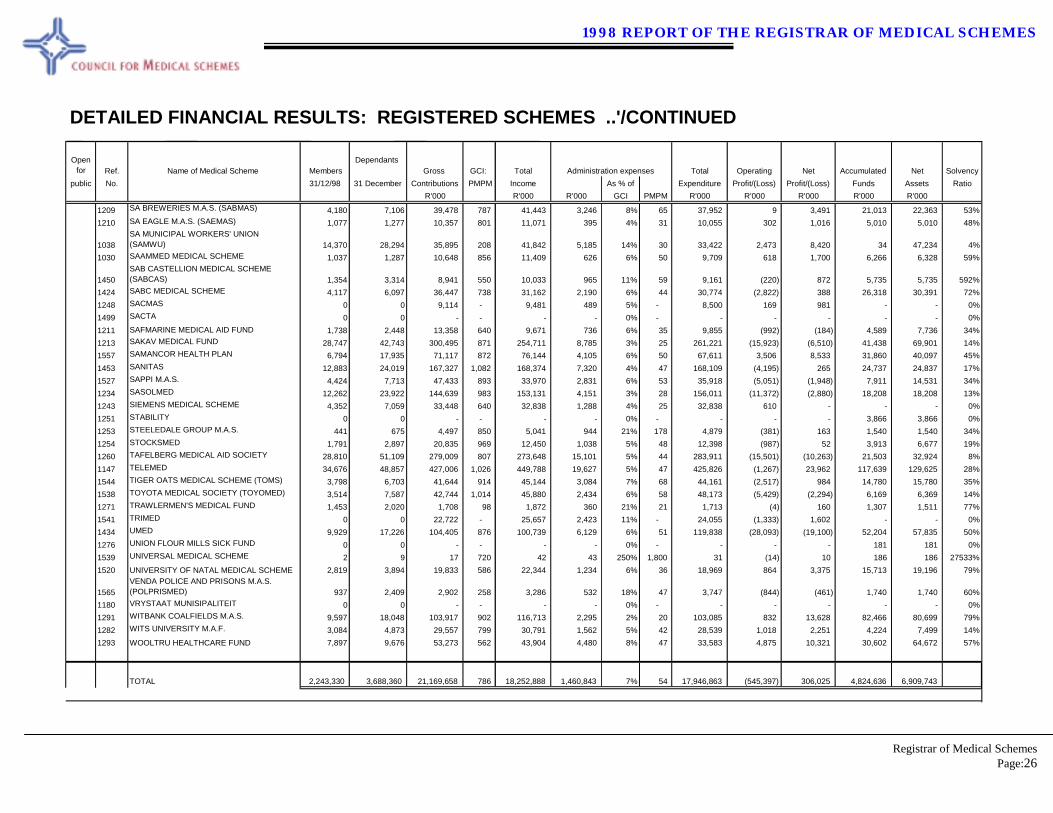
DETAILED FINANCIAL RESULTS: REGISTERED SCHEMES ..'/CONTINUED
Open for Ref. Name of Medical Scheme Members
DependantsGross GCI: Total Administration expenses Total Operating Net Accumulated Net Solvency
public No. 31/12/98 31 December Contributions PMPM Income As % of Expenditure Profit/(Loss) Profit/(Loss) Funds Assets RatioR'000 R'000 R'000 GCI PMPM R'000 R'000 R'000 R'000 R'000
1209 SA BREWERIES M.A.S. (SABMAS) 4,180 7,106 39,478 787 41,443 3,246 8% 65 37,952 9 3,491 21,013 22,363 53%1210 SA EAGLE M.A.S. (SAEMAS) 1,077 1,277 10,357 801 11,071 395 4% 31 10,055 302 1,016 5,010 5,010 48%
1038 SA MUNICIPAL WORKERS' UNION (SAMWU) 14,370 28,294 35,895 208 41,842 5,185 14% 30 33,422 2,473 8,420 34 47,234 4%
1030 SAAMMED MEDICAL SCHEME 1,037 1,287 10,648 856 11,409 626 6% 50 9,709 618 1,700 6,266 6,328 59%
1450 SAB CASTELLION MEDICAL SCHEME (SABCAS) 1,354 3,314 8,941 550 10,033 965 11% 59 9,161 (220) 872 5,735 5,735 592%
1424 SABC MEDICAL SCHEME 4,117 6,097 36,447 738 31,162 2,190 6% 44 30,774 (2,822) 388 26,318 30,391 72%1248 SACMAS 0 0 9,114 - 9,481 489 5% - 8,500 169 981 - - 0%1499 SACTA 0 0 - - - - 0% - - - - - - 0%1211 SAFMARINE MEDICAL AID FUND 1,738 2,448 13,358 640 9,671 736 6% 35 9,855 (992) (184) 4,589 7,736 34%1213 SAKAV MEDICAL FUND 28,747 42,743 300,495 871 254,711 8,785 3% 25 261,221 (15,923) (6,510) 41,438 69,901 14%1557 SAMANCOR HEALTH PLAN 6,794 17,935 71,117 872 76,144 4,105 6% 50 67,611 3,506 8,533 31,860 40,097 45%1453 SANITAS 12,883 24,019 167,327 1,082 168,374 7,320 4% 47 168,109 (4,195) 265 24,737 24,837 17%1527 SAPPI M.A.S. 4,424 7,713 47,433 893 33,970 2,831 6% 53 35,918 (5,051) (1,948) 7,911 14,531 34%1234 SASOLMED 12,262 23,922 144,639 983 153,131 4,151 3% 28 156,011 (11,372) (2,880) 18,208 18,208 13%1243 SIEMENS MEDICAL SCHEME 4,352 7,059 33,448 640 32,838 1,288 4% 25 32,838 610 - - - 0%1251 STABILITY 0 0 - - - - 0% - - - - 3,866 3,866 0%1253 STEELEDALE GROUP M.A.S. 441 675 4,497 850 5,041 944 21% 178 4,879 (381) 163 1,540 1,540 34%1254 STOCKSMED 1,791 2,897 20,835 969 12,450 1,038 5% 48 12,398 (987) 52 3,913 6,677 19%1260 TAFELBERG MEDICAL AID SOCIETY 28,810 51,109 279,009 807 273,648 15,101 5% 44 283,911 (15,501) (10,263) 21,503 32,924 8%1147 TELEMED 34,676 48,857 427,006 1,026 449,788 19,627 5% 47 425,826 (1,267) 23,962 117,639 129,625 28%1544 TIGER OATS MEDICAL SCHEME (TOMS) 3,798 6,703 41,644 914 45,144 3,084 7% 68 44,161 (2,517) 984 14,780 15,780 35%1538 TOYOTA MEDICAL SOCIETY (TOYOMED) 3,514 7,587 42,744 1,014 45,880 2,434 6% 58 48,173 (5,429) (2,294) 6,169 6,369 14%1271 TRAWLERMEN'S MEDICAL FUND 1,453 2,020 1,708 98 1,872 360 21% 21 1,713 (4) 160 1,307 1,511 77%1541 TRIMED 0 0 22,722 - 25,657 2,423 11% - 24,055 (1,333) 1,602 - - 0%1434 UMED 9,929 17,226 104,405 876 100,739 6,129 6% 51 119,838 (28,093) (19,100) 52,204 57,835 50%1276 UNION FLOUR MILLS SICK FUND 0 0 - - - - 0% - - - - 181 181 0%1539 UNIVERSAL MEDICAL SCHEME 2 9 17 720 42 43 250% 1,800 31 (14) 10 186 186 27533%1520 UNIVERSITY OF NATAL MEDICAL SCHEME 2,819 3,894 19,833 586 22,344 1,234 6% 36 18,969 864 3,375 15,713 19,196 79%
1565 VENDA POLICE AND PRISONS M.A.S. (POLPRISMED) 937 2,409 2,902 258 3,286 532 18% 47 3,747 (844) (461) 1,740 1,740 60%
1180 VRYSTAAT MUNISIPALITEIT 0 0 - - - - 0% - - - - - - 0%1291 WITBANK COALFIELDS M.A.S. 9,597 18,048 103,917 902 116,713 2,295 2% 20 103,085 832 13,628 82,466 80,699 79%1282 WITS UNIVERSITY M.A.F. 3,084 4,873 29,557 799 30,791 1,562 5% 42 28,539 1,018 2,251 4,224 7,499 14%1293 WOOLTRU HEALTHCARE FUND 7,897 9,676 53,273 562 43,904 4,480 8% 47 33,583 4,875 10,321 30,602 64,672 57%
TOTAL 2,243,330 3,688,360 21,169,658 786 18,252,888 1,460,843 7% 54 17,946,863 (545,397) 306,025 4,824,636 6,909,743
1998 REPORT OF THE REGISTRAR OF MEDICAL SCHEMES
Registrar of Medical Schemes
Page:27
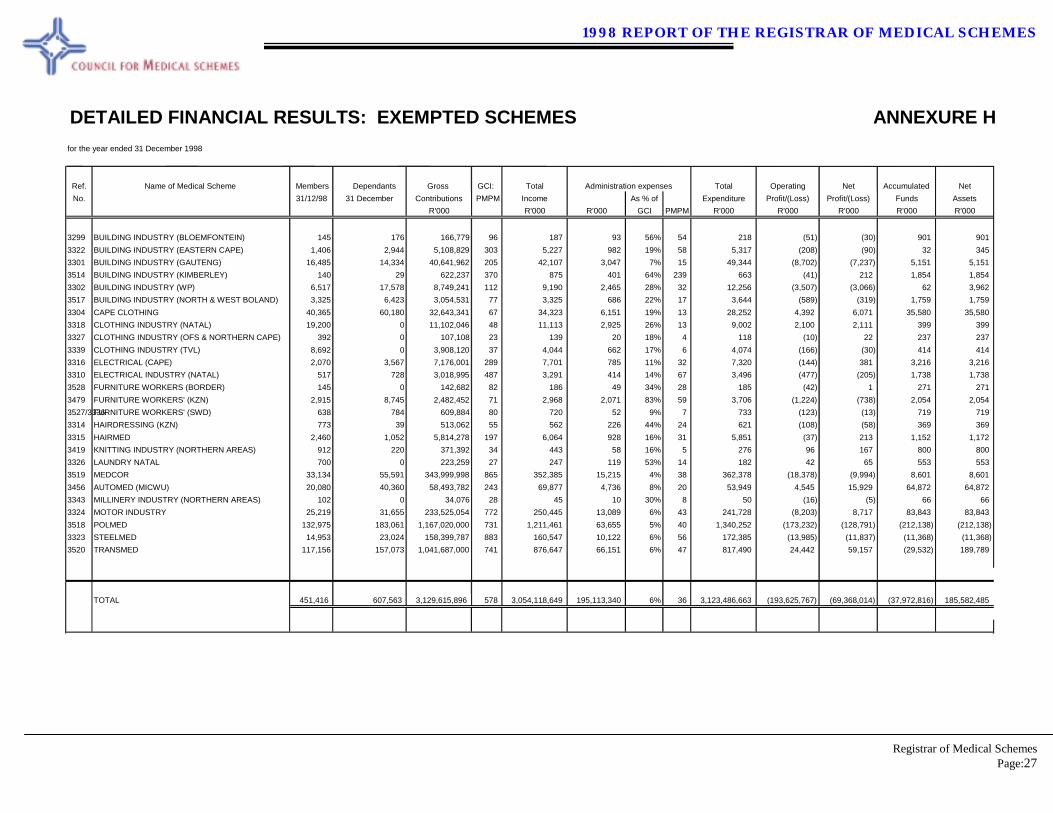
DETAILED FINANCIAL RESULTS: EXEMPTED SCHEMES ANNEXURE H
for the year ended 31 December 1998
Ref. Name of Medical Scheme Members Dependants Gross GCI: Total Administration expenses Total Operating Net Accumulated NetNo. 31/12/98 31 December Contributions PMPM Income As % of Expenditure Profit/(Loss) Profit/(Loss) Funds Assets
R'000 R'000 R'000 GCI PMPM R'000 R'000 R'000 R'000 R'000
3299 BUILDING INDUSTRY (BLOEMFONTEIN) 145 176 166,779 96 187 93 56% 54 218 (51) (30) 901 901 3322 BUILDING INDUSTRY (EASTERN CAPE) 1,406 2,944 5,108,829 303 5,227 982 19% 58 5,317 (208) (90) 32 345 3301 BUILDING INDUSTRY (GAUTENG) 16,485 14,334 40,641,962 205 42,107 3,047 7% 15 49,344 (8,702) (7,237) 5,151 5,151 3514 BUILDING INDUSTRY (KIMBERLEY) 140 29 622,237 370 875 401 64% 239 663 (41) 212 1,854 1,854 3302 BUILDING INDUSTRY (WP) 6,517 17,578 8,749,241 112 9,190 2,465 28% 32 12,256 (3,507) (3,066) 62 3,962 3517 BUILDING INDUSTRY (NORTH & WEST BOLAND) 3,325 6,423 3,054,531 77 3,325 686 22% 17 3,644 (589) (319) 1,759 1,759 3304 CAPE CLOTHING 40,365 60,180 32,643,341 67 34,323 6,151 19% 13 28,252 4,392 6,071 35,580 35,580 3318 CLOTHING INDUSTRY (NATAL) 19,200 0 11,102,046 48 11,113 2,925 26% 13 9,002 2,100 2,111 399 399 3327 CLOTHING INDUSTRY (OFS & NORTHERN CAPE) 392 0 107,108 23 139 20 18% 4 118 (10) 22 237 237 3339 CLOTHING INDUSTRY (TVL) 8,692 0 3,908,120 37 4,044 662 17% 6 4,074 (166) (30) 414 414 3316 ELECTRICAL (CAPE) 2,070 3,567 7,176,001 289 7,701 785 11% 32 7,320 (144) 381 3,216 3,216 3310 ELECTRICAL INDUSTRY (NATAL) 517 728 3,018,995 487 3,291 414 14% 67 3,496 (477) (205) 1,738 1,738 3528 FURNITURE WORKERS (BORDER) 145 0 142,682 82 186 49 34% 28 185 (42) 1 271 271 3479 FURNITURE WORKERS' (KZN) 2,915 8,745 2,482,452 71 2,968 2,071 83% 59 3,706 (1,224) (738) 2,054 2,054 3527/3336 FURNITURE WORKERS' (SWD) 638 784 609,884 80 720 52 9% 7 733 (123) (13) 719 719 3314 HAIRDRESSING (KZN) 773 39 513,062 55 562 226 44% 24 621 (108) (58) 369 369 3315 HAIRMED 2,460 1,052 5,814,278 197 6,064 928 16% 31 5,851 (37) 213 1,152 1,172 3419 KNITTING INDUSTRY (NORTHERN AREAS) 912 220 371,392 34 443 58 16% 5 276 96 167 800 800 3326 LAUNDRY NATAL 700 0 223,259 27 247 119 53% 14 182 42 65 553 553 3519 MEDCOR 33,134 55,591 343,999,998 865 352,385 15,215 4% 38 362,378 (18,378) (9,994) 8,601 8,601 3456 AUTOMED (MICWU) 20,080 40,360 58,493,782 243 69,877 4,736 8% 20 53,949 4,545 15,929 64,872 64,872 3343 MILLINERY INDUSTRY (NORTHERN AREAS) 102 0 34,076 28 45 10 30% 8 50 (16) (5) 66 66 3324 MOTOR INDUSTRY 25,219 31,655 233,525,054 772 250,445 13,089 6% 43 241,728 (8,203) 8,717 83,843 83,843 3518 POLMED 132,975 183,061 1,167,020,000 731 1,211,461 63,655 5% 40 1,340,252 (173,232) (128,791) (212,138) (212,138) 3323 STEELMED 14,953 23,024 158,399,787 883 160,547 10,122 6% 56 172,385 (13,985) (11,837) (11,368) (11,368) 3520 TRANSMED 117,156 157,073 1,041,687,000 741 876,647 66,151 6% 47 817,490 24,442 59,157 (29,532) 189,789
TOTAL 451,416 607,563 3,129,615,896 578 3,054,118,649 195,113,340 6% 36 3,123,486,663 (193,625,767) (69,368,014) (37,972,816) 185,582,485
1998 REPORT OF THE REGISTRAR OF MEDICAL SCHEMES
Registrar of Medical Schemes
Page:28
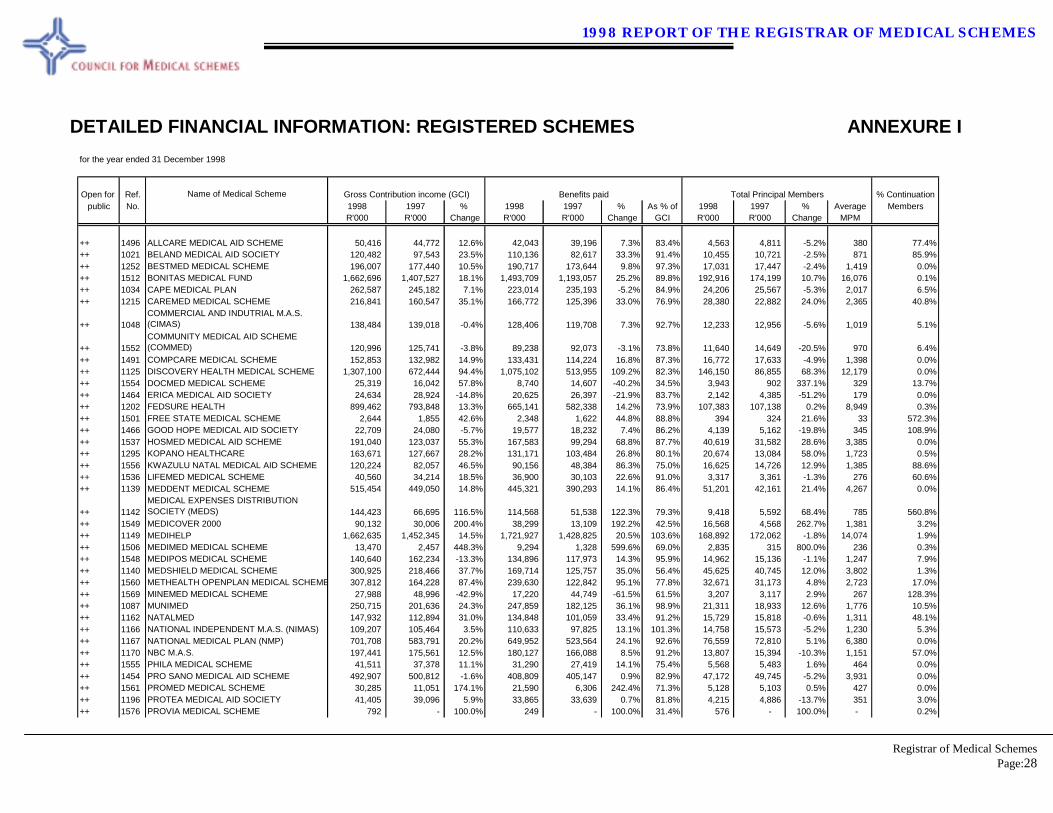
DETAILED FINANCIAL INFORMATION: REGISTERED SCHEMES ANNEXURE I
for the year ended 31 December 1998
Open for Ref. Name of Medical Scheme Gross Contribution income (GCI) Benefits paid Total Principal Members % Continuationpublic No. 1998 1997 % 1998 1997 % As % of 1998 1997 % Average Members
R'000 R'000 Change R'000 R'000 Change GCI R'000 R'000 Change MPM
++ 1496 ALLCARE MEDICAL AID SCHEME 50,416 44,772 12.6% 42,043 39,196 7.3% 83.4% 4,563 4,811 -5.2% 380 77.4%++ 1021 BELAND MEDICAL AID SOCIETY 120,482 97,543 23.5% 110,136 82,617 33.3% 91.4% 10,455 10,721 -2.5% 871 85.9%++ 1252 BESTMED MEDICAL SCHEME 196,007 177,440 10.5% 190,717 173,644 9.8% 97.3% 17,031 17,447 -2.4% 1,419 0.0%++ 1512 BONITAS MEDICAL FUND 1,662,696 1,407,527 18.1% 1,493,709 1,193,057 25.2% 89.8% 192,916 174,199 10.7% 16,076 0.1%++ 1034 CAPE MEDICAL PLAN 262,587 245,182 7.1% 223,014 235,193 -5.2% 84.9% 24,206 25,567 -5.3% 2,017 6.5%++ 1215 CAREMED MEDICAL SCHEME 216,841 160,547 35.1% 166,772 125,396 33.0% 76.9% 28,380 22,882 24.0% 2,365 40.8%
++ 1048COMMERCIAL AND INDUTRIAL M.A.S. (CIMAS) 138,484 139,018 -0.4% 128,406 119,708 7.3% 92.7% 12,233 12,956 -5.6% 1,019 5.1%
++ 1552COMMUNITY MEDICAL AID SCHEME (COMMED) 120,996 125,741 -3.8% 89,238 92,073 -3.1% 73.8% 11,640 14,649 -20.5% 970 6.4%
++ 1491 COMPCARE MEDICAL SCHEME 152,853 132,982 14.9% 133,431 114,224 16.8% 87.3% 16,772 17,633 -4.9% 1,398 0.0%++ 1125 DISCOVERY HEALTH MEDICAL SCHEME 1,307,100 672,444 94.4% 1,075,102 513,955 109.2% 82.3% 146,150 86,855 68.3% 12,179 0.0%++ 1554 DOCMED MEDICAL SCHEME 25,319 16,042 57.8% 8,740 14,607 -40.2% 34.5% 3,943 902 337.1% 329 13.7%++ 1464 ERICA MEDICAL AID SOCIETY 24,634 28,924 -14.8% 20,625 26,397 -21.9% 83.7% 2,142 4,385 -51.2% 179 0.0%++ 1202 FEDSURE HEALTH 899,462 793,848 13.3% 665,141 582,338 14.2% 73.9% 107,383 107,138 0.2% 8,949 0.3%++ 1501 FREE STATE MEDICAL SCHEME 2,644 1,855 42.6% 2,348 1,622 44.8% 88.8% 394 324 21.6% 33 572.3%++ 1466 GOOD HOPE MEDICAL AID SOCIETY 22,709 24,080 -5.7% 19,577 18,232 7.4% 86.2% 4,139 5,162 -19.8% 345 108.9%++ 1537 HOSMED MEDICAL AID SCHEME 191,040 123,037 55.3% 167,583 99,294 68.8% 87.7% 40,619 31,582 28.6% 3,385 0.0%++ 1295 KOPANO HEALTHCARE 163,671 127,667 28.2% 131,171 103,484 26.8% 80.1% 20,674 13,084 58.0% 1,723 0.5%++ 1556 KWAZULU NATAL MEDICAL AID SCHEME 120,224 82,057 46.5% 90,156 48,384 86.3% 75.0% 16,625 14,726 12.9% 1,385 88.6%++ 1536 LIFEMED MEDICAL SCHEME 40,560 34,214 18.5% 36,900 30,103 22.6% 91.0% 3,317 3,361 -1.3% 276 60.6%++ 1139 MEDDENT MEDICAL SCHEME 515,454 449,050 14.8% 445,321 390,293 14.1% 86.4% 51,201 42,161 21.4% 4,267 0.0%
++ 1142MEDICAL EXPENSES DISTRIBUTION SOCIETY (MEDS) 144,423 66,695 116.5% 114,568 51,538 122.3% 79.3% 9,418 5,592 68.4% 785 560.8%
++ 1549 MEDICOVER 2000 90,132 30,006 200.4% 38,299 13,109 192.2% 42.5% 16,568 4,568 262.7% 1,381 3.2%++ 1149 MEDIHELP 1,662,635 1,452,345 14.5% 1,721,927 1,428,825 20.5% 103.6% 168,892 172,062 -1.8% 14,074 1.9%++ 1506 MEDIMED MEDICAL SCHEME 13,470 2,457 448.3% 9,294 1,328 599.6% 69.0% 2,835 315 800.0% 236 0.3%++ 1548 MEDIPOS MEDICAL SCHEME 140,640 162,234 -13.3% 134,896 117,973 14.3% 95.9% 14,962 15,136 -1.1% 1,247 7.9%++ 1140 MEDSHIELD MEDICAL SCHEME 300,925 218,466 37.7% 169,714 125,757 35.0% 56.4% 45,625 40,745 12.0% 3,802 1.3%++ 1560 METHEALTH OPENPLAN MEDICAL SCHEME 307,812 164,228 87.4% 239,630 122,842 95.1% 77.8% 32,671 31,173 4.8% 2,723 17.0%++ 1569 MINEMED MEDICAL SCHEME 27,988 48,996 -42.9% 17,220 44,749 -61.5% 61.5% 3,207 3,117 2.9% 267 128.3%++ 1087 MUNIMED 250,715 201,636 24.3% 247,859 182,125 36.1% 98.9% 21,311 18,933 12.6% 1,776 10.5%++ 1162 NATALMED 147,932 112,894 31.0% 134,848 101,059 33.4% 91.2% 15,729 15,818 -0.6% 1,311 48.1%++ 1166 NATIONAL INDEPENDENT M.A.S. (NIMAS) 109,207 105,464 3.5% 110,633 97,825 13.1% 101.3% 14,758 15,573 -5.2% 1,230 5.3%++ 1167 NATIONAL MEDICAL PLAN (NMP) 701,708 583,791 20.2% 649,952 523,564 24.1% 92.6% 76,559 72,810 5.1% 6,380 0.0%++ 1170 NBC M.A.S. 197,441 175,561 12.5% 180,127 166,088 8.5% 91.2% 13,807 15,394 -10.3% 1,151 57.0%++ 1555 PHILA MEDICAL SCHEME 41,511 37,378 11.1% 31,290 27,419 14.1% 75.4% 5,568 5,483 1.6% 464 0.0%++ 1454 PRO SANO MEDICAL AID SCHEME 492,907 500,812 -1.6% 408,809 405,147 0.9% 82.9% 47,172 49,745 -5.2% 3,931 0.0%++ 1561 PROMED MEDICAL SCHEME 30,285 11,051 174.1% 21,590 6,306 242.4% 71.3% 5,128 5,103 0.5% 427 0.0%++ 1196 PROTEA MEDICAL AID SOCIETY 41,405 39,096 5.9% 33,865 33,639 0.7% 81.8% 4,215 4,886 -13.7% 351 3.0%++ 1576 PROVIA MEDICAL SCHEME 792 - 100.0% 249 - 100.0% 31.4% 576 - 100.0% - 0.2%
1998 REPORT OF THE REGISTRAR OF MEDICAL SCHEMES
Registrar of Medical Schemes
Page:29
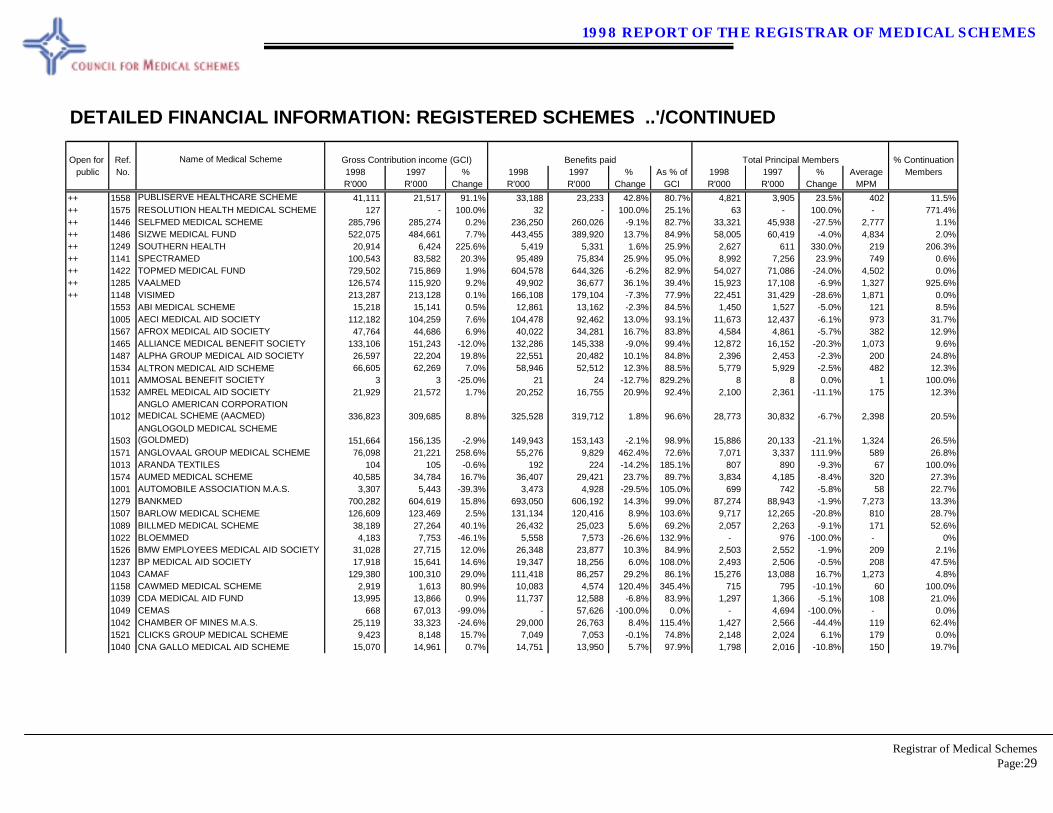
DETAILED FINANCIAL INFORMATION: REGISTERED SCHEMES ..'/CONTINUED
Open for Ref. Name of Medical Scheme Gross Contribution income (GCI) Benefits paid Total Principal Members % Continuationpublic No. 1998 1997 % 1998 1997 % As % of 1998 1997 % Average Members
R'000 R'000 Change R'000 R'000 Change GCI R'000 R'000 Change MPM++ 1558 PUBLISERVE HEALTHCARE SCHEME 41,111 21,517 91.1% 33,188 23,233 42.8% 80.7% 4,821 3,905 23.5% 402 11.5%++ 1575 RESOLUTION HEALTH MEDICAL SCHEME 127 - 100.0% 32 - 100.0% 25.1% 63 - 100.0% - 771.4%++ 1446 SELFMED MEDICAL SCHEME 285,796 285,274 0.2% 236,250 260,026 -9.1% 82.7% 33,321 45,938 -27.5% 2,777 1.1%++ 1486 SIZWE MEDICAL FUND 522,075 484,661 7.7% 443,455 389,920 13.7% 84.9% 58,005 60,419 -4.0% 4,834 2.0%++ 1249 SOUTHERN HEALTH 20,914 6,424 225.6% 5,419 5,331 1.6% 25.9% 2,627 611 330.0% 219 206.3%++ 1141 SPECTRAMED 100,543 83,582 20.3% 95,489 75,834 25.9% 95.0% 8,992 7,256 23.9% 749 0.6%++ 1422 TOPMED MEDICAL FUND 729,502 715,869 1.9% 604,578 644,326 -6.2% 82.9% 54,027 71,086 -24.0% 4,502 0.0%++ 1285 VAALMED 126,574 115,920 9.2% 49,902 36,677 36.1% 39.4% 15,923 17,108 -6.9% 1,327 925.6%++ 1148 VISIMED 213,287 213,128 0.1% 166,108 179,104 -7.3% 77.9% 22,451 31,429 -28.6% 1,871 0.0%
1553 ABI MEDICAL SCHEME 15,218 15,141 0.5% 12,861 13,162 -2.3% 84.5% 1,450 1,527 -5.0% 121 8.5%1005 AECI MEDICAL AID SOCIETY 112,182 104,259 7.6% 104,478 92,462 13.0% 93.1% 11,673 12,437 -6.1% 973 31.7%1567 AFROX MEDICAL AID SOCIETY 47,764 44,686 6.9% 40,022 34,281 16.7% 83.8% 4,584 4,861 -5.7% 382 12.9%1465 ALLIANCE MEDICAL BENEFIT SOCIETY 133,106 151,243 -12.0% 132,286 145,338 -9.0% 99.4% 12,872 16,152 -20.3% 1,073 9.6%1487 ALPHA GROUP MEDICAL AID SOCIETY 26,597 22,204 19.8% 22,551 20,482 10.1% 84.8% 2,396 2,453 -2.3% 200 24.8%1534 ALTRON MEDICAL AID SCHEME 66,605 62,269 7.0% 58,946 52,512 12.3% 88.5% 5,779 5,929 -2.5% 482 12.3%1011 AMMOSAL BENEFIT SOCIETY 3 3 -25.0% 21 24 -12.7% 829.2% 8 8 0.0% 1 100.0%1532 AMREL MEDICAL AID SOCIETY 21,929 21,572 1.7% 20,252 16,755 20.9% 92.4% 2,100 2,361 -11.1% 175 12.3%
1012ANGLO AMERICAN CORPORATION MEDICAL SCHEME (AACMED) 336,823 309,685 8.8% 325,528 319,712 1.8% 96.6% 28,773 30,832 -6.7% 2,398 20.5%
1503ANGLOGOLD MEDICAL SCHEME (GOLDMED) 151,664 156,135 -2.9% 149,943 153,143 -2.1% 98.9% 15,886 20,133 -21.1% 1,324 26.5%
1571 ANGLOVAAL GROUP MEDICAL SCHEME 76,098 21,221 258.6% 55,276 9,829 462.4% 72.6% 7,071 3,337 111.9% 589 26.8%1013 ARANDA TEXTILES 104 105 -0.6% 192 224 -14.2% 185.1% 807 890 -9.3% 67 100.0%1574 AUMED MEDICAL SCHEME 40,585 34,784 16.7% 36,407 29,421 23.7% 89.7% 3,834 4,185 -8.4% 320 27.3%1001 AUTOMOBILE ASSOCIATION M.A.S. 3,307 5,443 -39.3% 3,473 4,928 -29.5% 105.0% 699 742 -5.8% 58 22.7%1279 BANKMED 700,282 604,619 15.8% 693,050 606,192 14.3% 99.0% 87,274 88,943 -1.9% 7,273 13.3%1507 BARLOW MEDICAL SCHEME 126,609 123,469 2.5% 131,134 120,416 8.9% 103.6% 9,717 12,265 -20.8% 810 28.7%1089 BILLMED MEDICAL SCHEME 38,189 27,264 40.1% 26,432 25,023 5.6% 69.2% 2,057 2,263 -9.1% 171 52.6%1022 BLOEMMED 4,183 7,753 -46.1% 5,558 7,573 -26.6% 132.9% - 976 -100.0% - 0%1526 BMW EMPLOYEES MEDICAL AID SOCIETY 31,028 27,715 12.0% 26,348 23,877 10.3% 84.9% 2,503 2,552 -1.9% 209 2.1%1237 BP MEDICAL AID SOCIETY 17,918 15,641 14.6% 19,347 18,256 6.0% 108.0% 2,493 2,506 -0.5% 208 47.5%1043 CAMAF 129,380 100,310 29.0% 111,418 86,257 29.2% 86.1% 15,276 13,088 16.7% 1,273 4.8%1158 CAWMED MEDICAL SCHEME 2,919 1,613 80.9% 10,083 4,574 120.4% 345.4% 715 795 -10.1% 60 100.0%1039 CDA MEDICAL AID FUND 13,995 13,866 0.9% 11,737 12,588 -6.8% 83.9% 1,297 1,366 -5.1% 108 21.0%1049 CEMAS 668 67,013 -99.0% - 57,626 -100.0% 0.0% - 4,694 -100.0% - 0.0%1042 CHAMBER OF MINES M.A.S. 25,119 33,323 -24.6% 29,000 26,763 8.4% 115.4% 1,427 2,566 -44.4% 119 62.4%1521 CLICKS GROUP MEDICAL SCHEME 9,423 8,148 15.7% 7,049 7,053 -0.1% 74.8% 2,148 2,024 6.1% 179 0.0%1040 CNA GALLO MEDICAL AID SCHEME 15,070 14,961 0.7% 14,751 13,950 5.7% 97.9% 1,798 2,016 -10.8% 150 19.7%
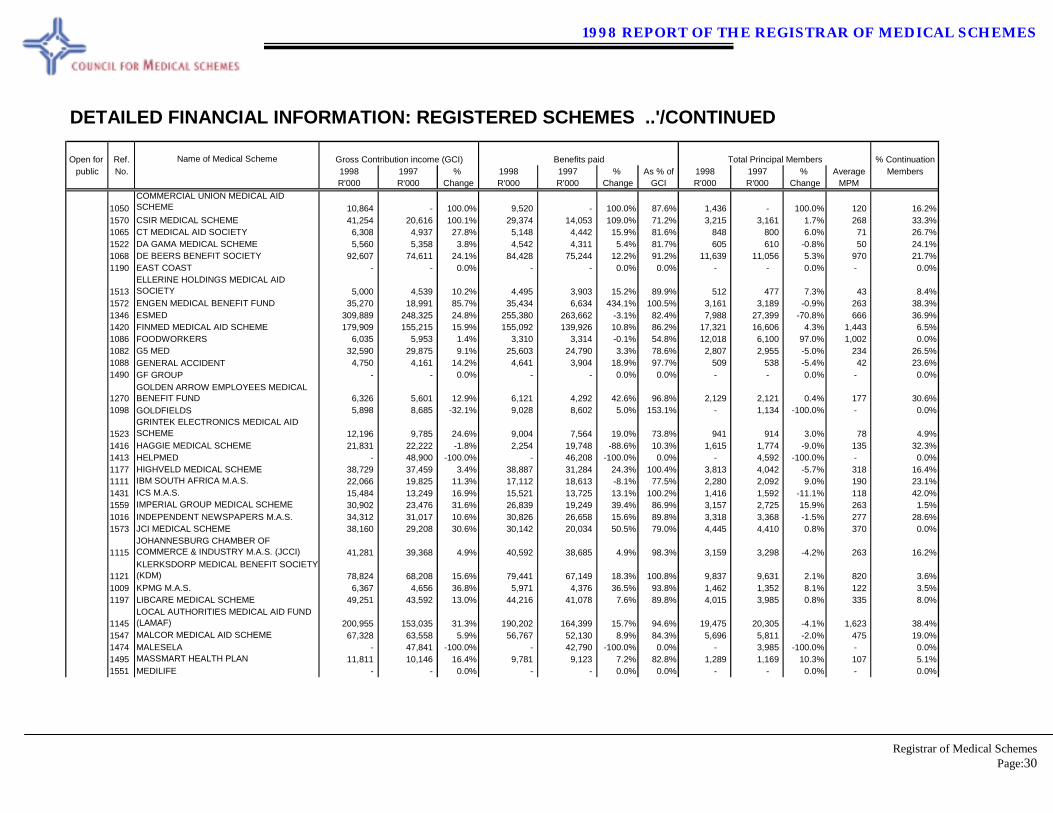
1998 REPORT OF THE REGISTRAR OF MEDICAL SCHEMES
Registrar of Medical Schemes
Page:30
DETAILED FINANCIAL INFORMATION: REGISTERED SCHEMES ..'/CONTINUED
Open for Ref. Name of Medical Scheme Gross Contribution income (GCI) Benefits paid Total Principal Members % Continuationpublic No. 1998 1997 % 1998 1997 % As % of 1998 1997 % Average Members
R'000 R'000 Change R'000 R'000 Change GCI R'000 R'000 Change MPM
1050COMMERCIAL UNION MEDICAL AID SCHEME 10,864 - 100.0% 9,520 - 100.0% 87.6% 1,436 - 100.0% 120 16.2%
1570 CSIR MEDICAL SCHEME 41,254 20,616 100.1% 29,374 14,053 109.0% 71.2% 3,215 3,161 1.7% 268 33.3%1065 CT MEDICAL AID SOCIETY 6,308 4,937 27.8% 5,148 4,442 15.9% 81.6% 848 800 6.0% 71 26.7%1522 DA GAMA MEDICAL SCHEME 5,560 5,358 3.8% 4,542 4,311 5.4% 81.7% 605 610 -0.8% 50 24.1%1068 DE BEERS BENEFIT SOCIETY 92,607 74,611 24.1% 84,428 75,244 12.2% 91.2% 11,639 11,056 5.3% 970 21.7%1190 EAST COAST - - 0.0% - - 0.0% 0.0% - - 0.0% - 0.0%
1513ELLERINE HOLDINGS MEDICAL AID SOCIETY 5,000 4,539 10.2% 4,495 3,903 15.2% 89.9% 512 477 7.3% 43 8.4%
1572 ENGEN MEDICAL BENEFIT FUND 35,270 18,991 85.7% 35,434 6,634 434.1% 100.5% 3,161 3,189 -0.9% 263 38.3%1346 ESMED 309,889 248,325 24.8% 255,380 263,662 -3.1% 82.4% 7,988 27,399 -70.8% 666 36.9%1420 FINMED MEDICAL AID SCHEME 179,909 155,215 15.9% 155,092 139,926 10.8% 86.2% 17,321 16,606 4.3% 1,443 6.5%1086 FOODWORKERS 6,035 5,953 1.4% 3,310 3,314 -0.1% 54.8% 12,018 6,100 97.0% 1,002 0.0%1082 G5 MED 32,590 29,875 9.1% 25,603 24,790 3.3% 78.6% 2,807 2,955 -5.0% 234 26.5%1088 GENERAL ACCIDENT 4,750 4,161 14.2% 4,641 3,904 18.9% 97.7% 509 538 -5.4% 42 23.6%1490 GF GROUP - - 0.0% - - 0.0% 0.0% - - 0.0% - 0.0%
1270GOLDEN ARROW EMPLOYEES MEDICAL BENEFIT FUND 6,326 5,601 12.9% 6,121 4,292 42.6% 96.8% 2,129 2,121 0.4% 177 30.6%
1098 GOLDFIELDS 5,898 8,685 -32.1% 9,028 8,602 5.0% 153.1% - 1,134 -100.0% - 0.0%
1523GRINTEK ELECTRONICS MEDICAL AID SCHEME 12,196 9,785 24.6% 9,004 7,564 19.0% 73.8% 941 914 3.0% 78 4.9%
1416 HAGGIE MEDICAL SCHEME 21,831 22,222 -1.8% 2,254 19,748 -88.6% 10.3% 1,615 1,774 -9.0% 135 32.3%1413 HELPMED - 48,900 -100.0% - 46,208 -100.0% 0.0% - 4,592 -100.0% - 0.0%1177 HIGHVELD MEDICAL SCHEME 38,729 37,459 3.4% 38,887 31,284 24.3% 100.4% 3,813 4,042 -5.7% 318 16.4%1111 IBM SOUTH AFRICA M.A.S. 22,066 19,825 11.3% 17,112 18,613 -8.1% 77.5% 2,280 2,092 9.0% 190 23.1%1431 ICS M.A.S. 15,484 13,249 16.9% 15,521 13,725 13.1% 100.2% 1,416 1,592 -11.1% 118 42.0%1559 IMPERIAL GROUP MEDICAL SCHEME 30,902 23,476 31.6% 26,839 19,249 39.4% 86.9% 3,157 2,725 15.9% 263 1.5%1016 INDEPENDENT NEWSPAPERS M.A.S. 34,312 31,017 10.6% 30,826 26,658 15.6% 89.8% 3,318 3,368 -1.5% 277 28.6%1573 JCI MEDICAL SCHEME 38,160 29,208 30.6% 30,142 20,034 50.5% 79.0% 4,445 4,410 0.8% 370 0.0%
1115JOHANNESBURG CHAMBER OF COMMERCE & INDUSTRY M.A.S. (JCCI) 41,281 39,368 4.9% 40,592 38,685 4.9% 98.3% 3,159 3,298 -4.2% 263 16.2%
1121KLERKSDORP MEDICAL BENEFIT SOCIETY (KDM) 78,824 68,208 15.6% 79,441 67,149 18.3% 100.8% 9,837 9,631 2.1% 820 3.6%
1009 KPMG M.A.S. 6,367 4,656 36.8% 5,971 4,376 36.5% 93.8% 1,462 1,352 8.1% 122 3.5%1197 LIBCARE MEDICAL SCHEME 49,251 43,592 13.0% 44,216 41,078 7.6% 89.8% 4,015 3,985 0.8% 335 8.0%
1145LOCAL AUTHORITIES MEDICAL AID FUND (LAMAF) 200,955 153,035 31.3% 190,202 164,399 15.7% 94.6% 19,475 20,305 -4.1% 1,623 38.4%
1547 MALCOR MEDICAL AID SCHEME 67,328 63,558 5.9% 56,767 52,130 8.9% 84.3% 5,696 5,811 -2.0% 475 19.0%1474 MALESELA - 47,841 -100.0% - 42,790 -100.0% 0.0% - 3,985 -100.0% - 0.0%1495 MASSMART HEALTH PLAN 11,811 10,146 16.4% 9,781 9,123 7.2% 82.8% 1,289 1,169 10.3% 107 5.1%1551 MEDILIFE - - 0.0% - - 0.0% 0.0% - - 0.0% - 0.0%
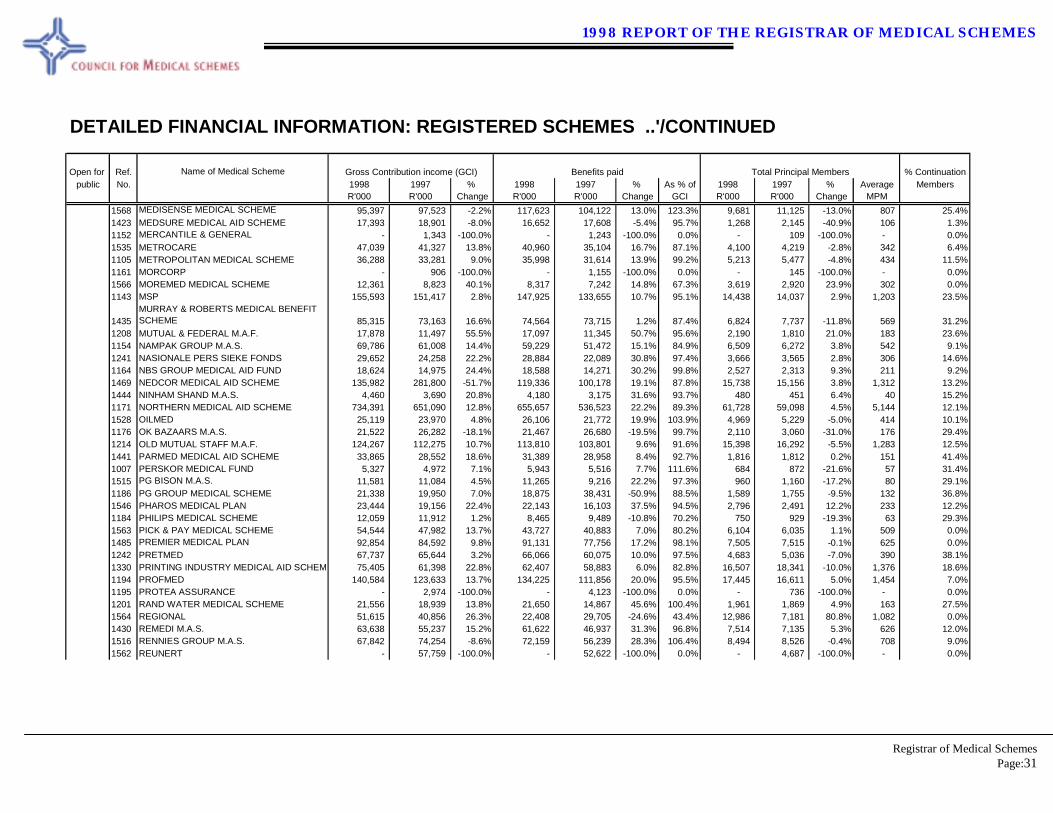
1998 REPORT OF THE REGISTRAR OF MEDICAL SCHEMES
Registrar of Medical Schemes
Page:31
DETAILED FINANCIAL INFORMATION: REGISTERED SCHEMES ..'/CONTINUED
Open for Ref. Name of Medical Scheme Gross Contribution income (GCI) Benefits paid Total Principal Members % Continuationpublic No. 1998 1997 % 1998 1997 % As % of 1998 1997 % Average Members
R'000 R'000 Change R'000 R'000 Change GCI R'000 R'000 Change MPM1568 MEDISENSE MEDICAL SCHEME 95,397 97,523 -2.2% 117,623 104,122 13.0% 123.3% 9,681 11,125 -13.0% 807 25.4%1423 MEDSURE MEDICAL AID SCHEME 17,393 18,901 -8.0% 16,652 17,608 -5.4% 95.7% 1,268 2,145 -40.9% 106 1.3%1152 MERCANTILE & GENERAL - 1,343 -100.0% - 1,243 -100.0% 0.0% - 109 -100.0% - 0.0%1535 METROCARE 47,039 41,327 13.8% 40,960 35,104 16.7% 87.1% 4,100 4,219 -2.8% 342 6.4%1105 METROPOLITAN MEDICAL SCHEME 36,288 33,281 9.0% 35,998 31,614 13.9% 99.2% 5,213 5,477 -4.8% 434 11.5%1161 MORCORP - 906 -100.0% - 1,155 -100.0% 0.0% - 145 -100.0% - 0.0%1566 MOREMED MEDICAL SCHEME 12,361 8,823 40.1% 8,317 7,242 14.8% 67.3% 3,619 2,920 23.9% 302 0.0%1143 MSP 155,593 151,417 2.8% 147,925 133,655 10.7% 95.1% 14,438 14,037 2.9% 1,203 23.5%
1435MURRAY & ROBERTS MEDICAL BENEFIT SCHEME 85,315 73,163 16.6% 74,564 73,715 1.2% 87.4% 6,824 7,737 -11.8% 569 31.2%
1208 MUTUAL & FEDERAL M.A.F. 17,878 11,497 55.5% 17,097 11,345 50.7% 95.6% 2,190 1,810 21.0% 183 23.6%1154 NAMPAK GROUP M.A.S. 69,786 61,008 14.4% 59,229 51,472 15.1% 84.9% 6,509 6,272 3.8% 542 9.1%1241 NASIONALE PERS SIEKE FONDS 29,652 24,258 22.2% 28,884 22,089 30.8% 97.4% 3,666 3,565 2.8% 306 14.6%1164 NBS GROUP MEDICAL AID FUND 18,624 14,975 24.4% 18,588 14,271 30.2% 99.8% 2,527 2,313 9.3% 211 9.2%1469 NEDCOR MEDICAL AID SCHEME 135,982 281,800 -51.7% 119,336 100,178 19.1% 87.8% 15,738 15,156 3.8% 1,312 13.2%1444 NINHAM SHAND M.A.S. 4,460 3,690 20.8% 4,180 3,175 31.6% 93.7% 480 451 6.4% 40 15.2%1171 NORTHERN MEDICAL AID SCHEME 734,391 651,090 12.8% 655,657 536,523 22.2% 89.3% 61,728 59,098 4.5% 5,144 12.1%1528 OILMED 25,119 23,970 4.8% 26,106 21,772 19.9% 103.9% 4,969 5,229 -5.0% 414 10.1%1176 OK BAZAARS M.A.S. 21,522 26,282 -18.1% 21,467 26,680 -19.5% 99.7% 2,110 3,060 -31.0% 176 29.4%1214 OLD MUTUAL STAFF M.A.F. 124,267 112,275 10.7% 113,810 103,801 9.6% 91.6% 15,398 16,292 -5.5% 1,283 12.5%1441 PARMED MEDICAL AID SCHEME 33,865 28,552 18.6% 31,389 28,958 8.4% 92.7% 1,816 1,812 0.2% 151 41.4%1007 PERSKOR MEDICAL FUND 5,327 4,972 7.1% 5,943 5,516 7.7% 111.6% 684 872 -21.6% 57 31.4%1515 PG BISON M.A.S. 11,581 11,084 4.5% 11,265 9,216 22.2% 97.3% 960 1,160 -17.2% 80 29.1%1186 PG GROUP MEDICAL SCHEME 21,338 19,950 7.0% 18,875 38,431 -50.9% 88.5% 1,589 1,755 -9.5% 132 36.8%1546 PHAROS MEDICAL PLAN 23,444 19,156 22.4% 22,143 16,103 37.5% 94.5% 2,796 2,491 12.2% 233 12.2%1184 PHILIPS MEDICAL SCHEME 12,059 11,912 1.2% 8,465 9,489 -10.8% 70.2% 750 929 -19.3% 63 29.3%1563 PICK & PAY MEDICAL SCHEME 54,544 47,982 13.7% 43,727 40,883 7.0% 80.2% 6,104 6,035 1.1% 509 0.0%1485 PREMIER MEDICAL PLAN 92,854 84,592 9.8% 91,131 77,756 17.2% 98.1% 7,505 7,515 -0.1% 625 0.0%1242 PRETMED 67,737 65,644 3.2% 66,066 60,075 10.0% 97.5% 4,683 5,036 -7.0% 390 38.1%1330 PRINTING INDUSTRY MEDICAL AID SCHEME 75,405 61,398 22.8% 62,407 58,883 6.0% 82.8% 16,507 18,341 -10.0% 1,376 18.6%1194 PROFMED 140,584 123,633 13.7% 134,225 111,856 20.0% 95.5% 17,445 16,611 5.0% 1,454 7.0%1195 PROTEA ASSURANCE - 2,974 -100.0% - 4,123 -100.0% 0.0% - 736 -100.0% - 0.0%1201 RAND WATER MEDICAL SCHEME 21,556 18,939 13.8% 21,650 14,867 45.6% 100.4% 1,961 1,869 4.9% 163 27.5%1564 REGIONAL 51,615 40,856 26.3% 22,408 29,705 -24.6% 43.4% 12,986 7,181 80.8% 1,082 0.0%1430 REMEDI M.A.S. 63,638 55,237 15.2% 61,622 46,937 31.3% 96.8% 7,514 7,135 5.3% 626 12.0%1516 RENNIES GROUP M.A.S. 67,842 74,254 -8.6% 72,159 56,239 28.3% 106.4% 8,494 8,526 -0.4% 708 9.0%1562 REUNERT - 57,759 -100.0% - 52,622 -100.0% 0.0% - 4,687 -100.0% - 0.0%

1998 REPORT OF THE REGISTRAR OF MEDICAL SCHEMES
Registrar of Medical Schemes
Page:32
DETAILED FINANCIAL INFORMATION: REGISTERED SCHEMES ..'/CONTINUED
Open for Ref. Name of Medical Scheme Gross Contribution income (GCI) Benefits paid Total Principal Members % Continuationpublic No. 1998 1997 % 1998 1997 % As % of 1998 1997 % Average Members
R'000 R'000 Change R'000 R'000 Change GCI R'000 R'000 Change MPM1209 SA BREWERIES M.A.S. (SABMAS) 39,478 38,503 2.5% 35,690 28,962 23.2% 90.4% 4,180 4,131 1.2% 348 16.1%1210 SA EAGLE M.A.S. (SAEMAS) 10,357 9,227 12.2% 10,000 9,286 7.7% 96.6% 1,077 1,080 -0.3% 90 100.0%
1038SA MUNICIPAL WORKERS' UNION (SAMWU) 35,895 36,260 -1.0% 27,701 25,204 9.9% 77.2% 14,370 14,748 -2.6% 1,198 21.3%
1030 SAAMMED MEDICAL SCHEME 10,648 10,184 4.6% 9,408 8,824 6.6% 88.4% 1,037 1,087 -4.6% 86 12.2%
1450SAB CASTELLION MEDICAL SCHEME (SABCAS) 8,941 10,545 -15.2% 7,815 8,024 -2.6% 87.4% 1,354 1,494 -9.4% 113 7.2%
1424 SABC MEDICAL SCHEME 36,447 37,508 -2.8% 36,637 39,237 -6.6% 100.5% 4,117 3,952 4.2% 343 28.2%1248 SACMAS 9,114 20,404 -55.3% 7,595 17,739 -57.2% 83.3% - 2,444 -100.0% - 0.0%1499 SACTA - 2,494 -100.0% - 2,247 -100.0% 0.0% - 287 -100.0% - 0.0%1211 SAFMARINE MEDICAL AID FUND 13,358 12,274 8.8% 13,037 11,660 11.8% 97.6% 1,738 1,667 4.3% 145 21.7%1213 SAKAV MEDICAL FUND 300,495 265,620 13.1% 285,085 249,124 14.4% 94.9% 28,747 29,172 -1.5% 2,396 19.8%1453 SANITAS 167,327 152,235 9.9% 153,970 139,719 10.2% 92.0% 12,883 14,241 -9.5% 1,074 28.2%1527 SAPPI M.A.S. 47,433 42,343 12.0% 48,913 38,431 27.3% 103.1% 4,424 4,647 -4.8% 369 23.0%1234 SASOLMED 144,639 131,855 9.7% 148,190 122,402 21.1% 102.5% 12,262 12,301 -0.3% 1,022 15.5%1531 SEWENDEDAG-AVENTISTE M.A.F. 1,123 996 12.7% 1,123 996 12.7% 100.0% 590 594 -0.7% 49 16.3%1243 SIEMENS MEDICAL SCHEME 33,448 32,674 2.4% 26,978 32,144 -16.1% 80.7% 4,352 4,316 0.8% 363 12.2%1251 STABILITY - 53,951 -100.0% - 47,426 -100.0% 0.0% - 4,274 -100.0% - 0.0%1253 STEELEDALE GROUP M.A.S. 4,497 4,156 8.2% 3,816 3,582 6.5% 84.8% 441 448 -1.6% 37 17.9%1254 STOCKSMED 20,835 18,371 13.4% 16,232 17,089 -5.0% 77.9% 1,791 1,722 4.0% 149 6.0%1260 TAFELBERG MEDICAL AID SOCIETY 279,009 262,106 6.4% 259,755 252,869 2.7% 93.1% 28,810 31,637 -8.9% 2,401 2.5%1147 TELEMED 427,006 445,824 -4.2% 391,492 376,340 4.0% 91.7% 34,676 34,210 1.4% 2,890 25.6%1544 TIGER OATS MEDICAL SCHEME (TOMS) 41,644 44,179 -5.7% 39,170 36,361 7.7% 94.1% 3,798 3,907 -2.8% 317 16.1%1538 TOYOTA MEDICAL SOCIETY (TOYOMED) 42,744 40,773 4.8% 45,573 39,414 15.6% 106.6% 3,514 3,582 -1.9% 293 8.2%1271 TRAWLERMEN'S MEDICAL FUND 1,708 1,629 4.9% 1,310 1,066 22.8% 76.7% 1,453 1,573 -7.6% 121 0.3%1541 TRIMED 22,722 43,281 -47.5% 21,222 35,206 -39.7% 93.4% - 8,617 -100.0% - 0.0%1434 UMED 104,405 103,847 0.5% 124,557 104,736 18.9% 119.3% 9,929 10,917 -9.1% 827 29.6%1276 UNION FLOUR MILLS SICK FUND - - 0.0% - - 0.0% 0.0% - - 0.0% - 0.0%1539 UNIVERSAL MEDICAL SCHEME 17 17 0.0% (12) 18 -166.1% -69.0% 2 2 0.0% 0 0.0%
1520 UNIVERSITY OF NATAL MEDICAL SCHEME 19,833 18,722 5.9% 17,546 15,619 12.3% 88.5% 2,819 2,836 -0.6% 235 28.6%
1565VENDA POLICE AND PRISONS M.A.S. (POLPRISMED) 2,902 2,637 10.1% 2,519 2,532 -0.5% 86.8% 937 1,061 -11.7% 78 0.2%
1180 VRYSTAAT MUNISIPALITEIT - 21,575 -100.0% - 19,033 -100.0% 0.0% - 2,370 -100.0% - 0.0%1291 WITBANK COALFIELDS M.A.S. 103,917 88,296 17.7% 97,763 79,558 22.9% 94.1% 9,597 8,713 10.1% 800 16.0%1282 WITS UNIVERSITY M.A.F. 29,557 25,811 14.5% 25,123 23,008 9.2% 85.0% 3,084 3,135 -1.6% 257 19.9%1293 WOOLTRU HEALTHCARE FUND 53,273 40,934 30.1% 41,660 31,020 34.3% 78.2% 7,897 7,457 5.9% 658 10.6%
TOTAL 21,169,666 18,586,647 13.9% 18,745,398 16,149,868 16.1% 88.5% 2,251,322 2,226,846 1.1% 187,610 17.4%
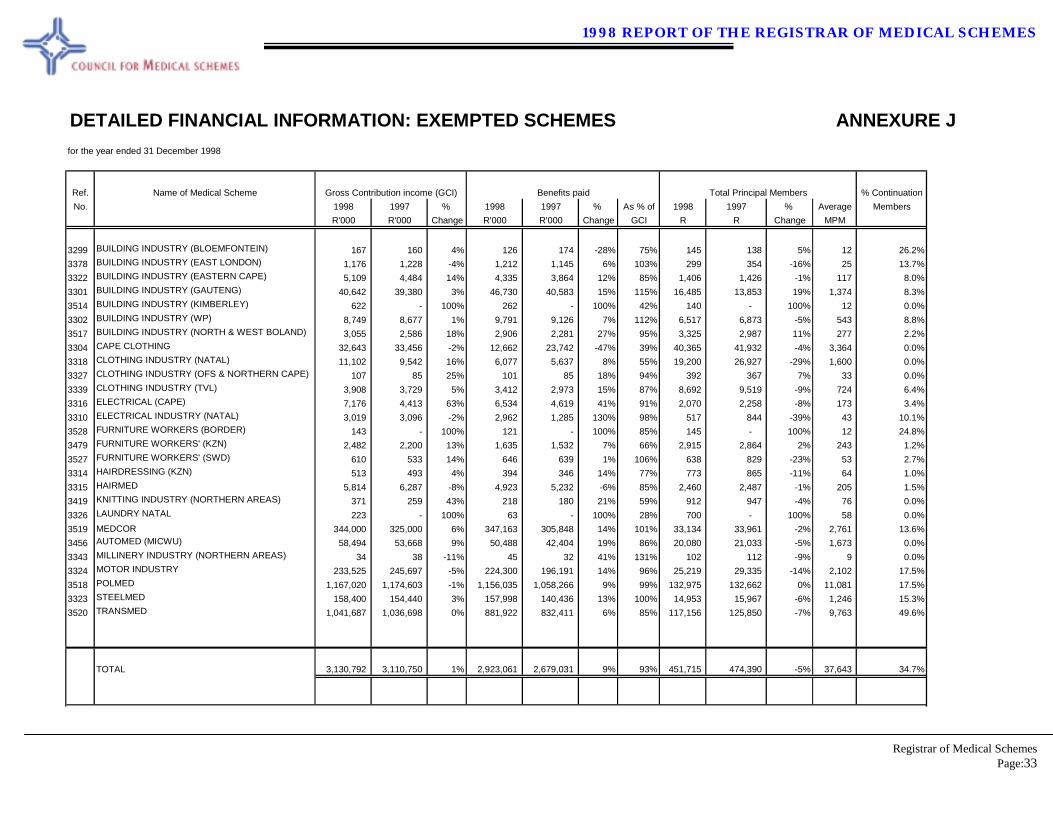
1998 REPORT OF THE REGISTRAR OF MEDICAL SCHEMES
Registrar of Medical Schemes
Page:33
DETAILED FINANCIAL INFORMATION: EXEMPTED SCHEMES ANNEXURE J for the year ended 31 December 1998
Ref. Name of Medical Scheme Gross Contribution income (GCI) Benefits paid Total Principal Members % ContinuationNo. 1998 1997 % 1998 1997 % As % of 1998 1997 % Average Members
R'000 R'000 Change R'000 R'000 Change GCI R R Change MPM
3299 BUILDING INDUSTRY (BLOEMFONTEIN) 167 160 4% 126 174 -28% 75% 145 138 5% 12 26.2%3378 BUILDING INDUSTRY (EAST LONDON) 1,176 1,228 -4% 1,212 1,145 6% 103% 299 354 -16% 25 13.7%3322 BUILDING INDUSTRY (EASTERN CAPE) 5,109 4,484 14% 4,335 3,864 12% 85% 1,406 1,426 -1% 117 8.0%3301 BUILDING INDUSTRY (GAUTENG) 40,642 39,380 3% 46,730 40,583 15% 115% 16,485 13,853 19% 1,374 8.3%3514 BUILDING INDUSTRY (KIMBERLEY) 622 - 100% 262 - 100% 42% 140 - 100% 12 0.0%3302 BUILDING INDUSTRY (WP) 8,749 8,677 1% 9,791 9,126 7% 112% 6,517 6,873 -5% 543 8.8%3517 BUILDING INDUSTRY (NORTH & WEST BOLAND) 3,055 2,586 18% 2,906 2,281 27% 95% 3,325 2,987 11% 277 2.2%3304 CAPE CLOTHING 32,643 33,456 -2% 12,662 23,742 -47% 39% 40,365 41,932 -4% 3,364 0.0%3318 CLOTHING INDUSTRY (NATAL) 11,102 9,542 16% 6,077 5,637 8% 55% 19,200 26,927 -29% 1,600 0.0%3327 CLOTHING INDUSTRY (OFS & NORTHERN CAPE) 107 85 25% 101 85 18% 94% 392 367 7% 33 0.0%3339 CLOTHING INDUSTRY (TVL) 3,908 3,729 5% 3,412 2,973 15% 87% 8,692 9,519 -9% 724 6.4%3316 ELECTRICAL (CAPE) 7,176 4,413 63% 6,534 4,619 41% 91% 2,070 2,258 -8% 173 3.4%3310 ELECTRICAL INDUSTRY (NATAL) 3,019 3,096 -2% 2,962 1,285 130% 98% 517 844 -39% 43 10.1%3528 FURNITURE WORKERS (BORDER) 143 - 100% 121 - 100% 85% 145 - 100% 12 24.8%3479 FURNITURE WORKERS' (KZN) 2,482 2,200 13% 1,635 1,532 7% 66% 2,915 2,864 2% 243 1.2%3527 FURNITURE WORKERS' (SWD) 610 533 14% 646 639 1% 106% 638 829 -23% 53 2.7%3314 HAIRDRESSING (KZN) 513 493 4% 394 346 14% 77% 773 865 -11% 64 1.0%3315 HAIRMED 5,814 6,287 -8% 4,923 5,232 -6% 85% 2,460 2,487 -1% 205 1.5%3419 KNITTING INDUSTRY (NORTHERN AREAS) 371 259 43% 218 180 21% 59% 912 947 -4% 76 0.0%3326 LAUNDRY NATAL 223 - 100% 63 - 100% 28% 700 - 100% 58 0.0%3519 MEDCOR 344,000 325,000 6% 347,163 305,848 14% 101% 33,134 33,961 -2% 2,761 13.6%3456 AUTOMED (MICWU) 58,494 53,668 9% 50,488 42,404 19% 86% 20,080 21,033 -5% 1,673 0.0%3343 MILLINERY INDUSTRY (NORTHERN AREAS) 34 38 -11% 45 32 41% 131% 102 112 -9% 9 0.0%3324 MOTOR INDUSTRY 233,525 245,697 -5% 224,300 196,191 14% 96% 25,219 29,335 -14% 2,102 17.5%3518 POLMED 1,167,020 1,174,603 -1% 1,156,035 1,058,266 9% 99% 132,975 132,662 0% 11,081 17.5%3323 STEELMED 158,400 154,440 3% 157,998 140,436 13% 100% 14,953 15,967 -6% 1,246 15.3%3520 TRANSMED 1,041,687 1,036,698 0% 881,922 832,411 6% 85% 117,156 125,850 -7% 9,763 49.6%
TOTAL 3,130,792 3,110,750 1% 2,923,061 2,679,031 9% 93% 451,715 474,390 -5% 37,643 34.7%
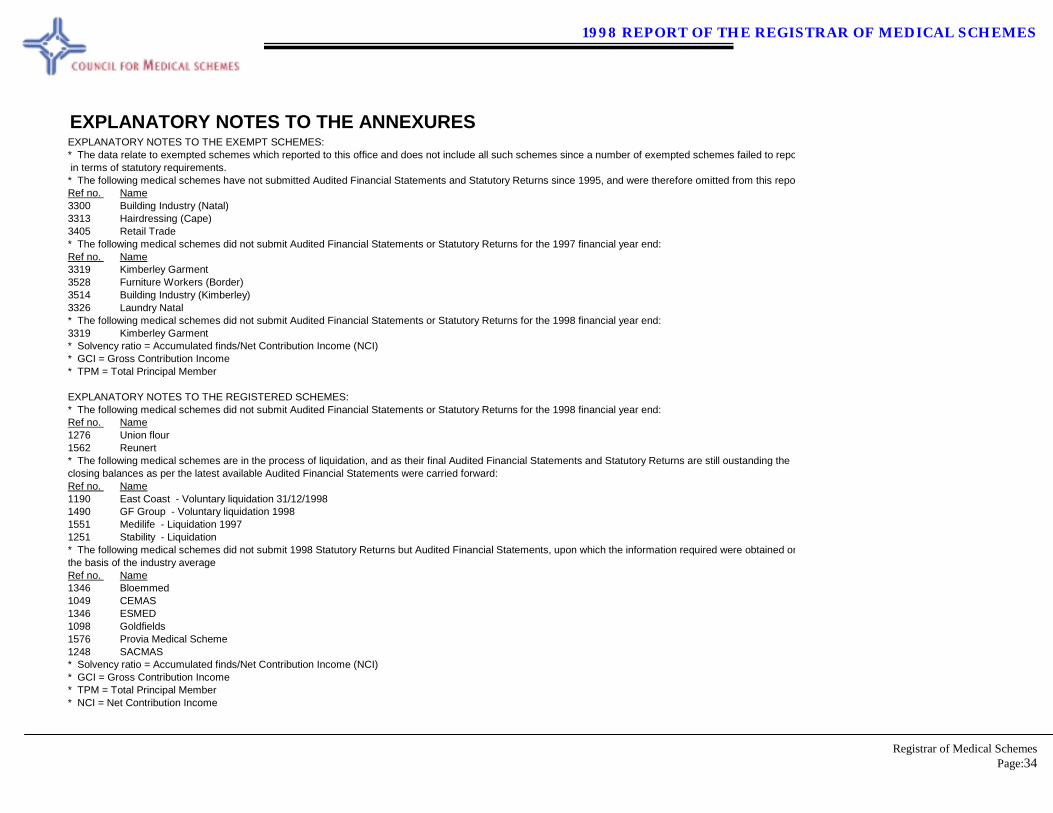
1998 REPORT OF THE REGISTRAR OF MEDICAL SCHEMES
Registrar of Medical Schemes
Page:34
EXPLANATORY NOTES TO THE ANNEXURES EXPLANATORY NOTES TO THE EXEMPT SCHEMES:* The data relate to exempted schemes which reported to this office and does not include all such schemes since a number of exempted schemes failed to repo in terms of statutory requirements.* The following medical schemes have not submitted Audited Financial Statements and Statutory Returns since 1995, and were therefore omitted from this repoRef no. Name3300 Building Industry (Natal)3313 Hairdressing (Cape)3405 Retail Trade* The following medical schemes did not submit Audited Financial Statements or Statutory Returns for the 1997 financial year end:Ref no. Name3319 Kimberley Garment 3528 Furniture Workers (Border)3514 Building Industry (Kimberley)3326 Laundry Natal* The following medical schemes did not submit Audited Financial Statements or Statutory Returns for the 1998 financial year end:3319 Kimberley Garment * Solvency ratio = Accumulated finds/Net Contribution Income (NCI)* GCI = Gross Contribution Income* TPM = Total Principal Member
EXPLANATORY NOTES TO THE REGISTERED SCHEMES:* The following medical schemes did not submit Audited Financial Statements or Statutory Returns for the 1998 financial year end:Ref no. Name1276 Union flour1562 Reunert* The following medical schemes are in the process of liquidation, and as their final Audited Financial Statements and Statutory Returns are still oustanding the closing balances as per the latest available Audited Financial Statements were carried forward:Ref no. Name1190 East Coast - Voluntary liquidation 31/12/19981490 GF Group - Voluntary liquidation 19981551 Medilife - Liquidation 19971251 Stability - Liquidation* The following medical schemes did not submit 1998 Statutory Returns but Audited Financial Statements, upon which the information required were obtained onthe basis of the industry averageRef no. Name1346 Bloemmed1049 CEMAS1346 ESMED1098 Goldfields1576 Provia Medical Scheme1248 SACMAS* Solvency ratio = Accumulated finds/Net Contribution Income (NCI)* GCI = Gross Contribution Income* TPM = Total Principal Member* NCI = Net Contribution Income