report of the united nations scientific ... of the united nations scientific committee on the...
TRANSCRIPT

REPORT OF THE UNITED NATIONS
SCIENTIFIC COMMITTEE ON THE
EFFECTS OF ATO~IIC RADIATION
GENERAL ASSEMBLY
OFFICIAL RECORDS : TWENTY-FIRST SESSION
SUPPLEMENT No. 14 (A/ 6314)
UNITED NATIONS
GENERAL ASSIEMBL Y
OFFICIAL RECORDS : TWENTY-FIRST SESSION
SUPPLEMENT No. 14 (A/6314)
....,...,, .. t·•' ,, .. 'II:;>• ..
<I/ 7 7 UNITED NATIONS
New York, 1966

Annex B
ENVIRONMENTAL CONTAMINATION
CONTENTS
l. Aul.BORNE AND DEPOSITED ARTIFICIAL RADIO-
ACTIVITY ••.•••••...••.•••...••.•••••• • • •
Introduction .............................. . Atmospheric injections .................... .
Tropospheric tests ....................... . Underground tests ....................... . Stratospheric injection of plutonium-238 ..
Inventories ............................... . Stratosphere ............................ . Troposphere ........................... . Deposition on land ...................... . Deposition in the oceans ................. .
Concentrations of strontium-90 in surface water .............................. .
Concentrations in deep water ........... . Comparison of terrestrial and oceanic
fall-out ............................ . Conclusions .......................... .
Summary ................................ .
I!. . .l\.RTIFICIAL RADIO-ACTIVITY IN FOOD AND
TISSlJES ..............................• · .. Strontium-90 and strontium-89 ............ .
Food chain mechanisms ................. . Metabolism in man ...................... . Levels of strontium-90 in food .......... . Strontium-90 in human bone ........... .
Geographical distribution and time trends
Paragraplr.s
1-66 1-& 9-17 9-12 13
14-17 18-61 18-24 25-29 30-38 39-41
42-45 46-51
52-59 60-61 62-66
67-125 67-95 67 68-74 75-82 83-85 86-88
L Airborne and deposited artificial radio-activity INTRODUCTION
1. There have been no major weapons tests between the end of 1962 and the date of the present report (June 1966). The atmospheric tests in central Asia in October 1964 and in May 1965 and the several accidental releases from low-yield underground tests that have occurred are known to have contributed negligibly to human exposure. Data on an additional Asian test explosion in May 1966 are still not sufficient to permit complete evaluation.
2. Fall-out. however, still provides the major contribution to radio-active contamination of the environment. The purpose of the present report is to update the evaluations of fall-out from the earlier major series of tests made bv the Committee in 19641 and of the doses to which man has been thereby committed.
3. The cessation of injections of fission products into the stratosphere since the end of 1962 has facilitated the study of the transport mechanisms of nuclear debris and of the depletion process of the stratospheric reservoir that the Committee had discussed at some length in its 1962 and 1964 reports.1 · 2 The reader is referred to these reports for a general outline of the problems oi transfer and distribution of radio-activity injected into the atmosphere.
4. There have been indications that fall-out over the oceans may be greater than on equivalent land sur-
44
Quantitative relationships between deposition of strontium-90 and dietary levels ... .
Caesium-137 ............................. . Food chain mechanisms ................. . Metabolism in man .................... . Levels oi caesium-137 in food ........... . Levels of caesium-137 in man ........... . Quantitative relationships between deposition
of caesiurn-137 and contamination oi milk Quantitative relationships between deposition
of caesium-137 and human body burden Iodine-131 ................................ . Other nucEdes ............................ . Radio-nuclides in the respiratory tract ..... .
!II. DOSES FROM EXTERNAL AND INTERNAL COK·
TAMINATION .••.•••••••••.••••••••••...•.
Introduction .............................. . External dose rates ....................... . Internal doses ............................ .
Strontiurn-90 ........................... . Caesium-137 ............................ . Strontium-89, barium-140 and iodine-131 .. Carbon-14 .............................. .
Conclusions ............................... .
TABLES ...•..•.............••.••..••.•••.••
REFERENCES ..•..•.............•......•.••.
89-95 96-117 96-101
102-107 108-110 111-114
115
116-117 118 119-122 123-125
126-151 126-129 130-137 138-147 138-143 144-145 146 147 148-151
Paae 70 86
faces. This is a new subject and is therefore treated in some detail in this report.
5. Space activities can also be a potential source of accidental contamination. as shown by the unplanned re-entry into the atmosphere of a spacecraft carrying a power source containing Pu238• As a consequence of the burning up of this device, Pu238 was released into the atmosphere. Its distribution will be dealt with later.
6. Local contamination took place in Spain in January 1966 when, as a result of an air collision between an aircraft carrying nuclear weapons and a refuelling plane. fissionable materials were scattered over a limited area by the unexploded devices.3
7. Industrial, medical and research applications of nuclear technology contribute only to a very limited extent to environmental contamination and to the attendant exposure of populations. Some gaseous wastes are discharged in limited amounts directly into the atmosphere from reactors and fuel reprocessing plants, while. as discussed in the 1962 report. some low activity liquid wastes are diluted in sea and rivers during normal operations.
8. Doses to the world population from either accidental or controlled releases of wastes have been negligible so far in comparison with those due to nuclear explosions, particularly those carried out above ground. Vlhile it is realized that. if large-scale atmospheric testing is not resumed, other sources of contamination
•

from the peaceful uses of atomic energy may in the future contribute comparatively more to environmental contamination, the present review will mainly be devoted to contamination from nuclear e..xplosions.
ATMOSPHERIC INJECTIO)<S
Tropospheric tests
9. Two fission devices were exploded above ground in central Asia on 16 October 1964 and on 14 May 1965. The debris of the first device reached Ja pan two days after the e.xplosion. was detected in North America and Europe about one week later and persisted in some locations for about three weeks. Most of the debris was limited to the band from 20°N to S0°N by the time it reached 80°W.4-21
10. Short-lived fission products such as Sr89, Zr9is.
p31, Ba-La.Ho and Ce141 were identified at several sampling sites and 2-10 mCi/km:! of short-lived debris were deposited in the United States of America during October-December 1964.22 Half removal times from the troposphere of five to over twenty days were reported for barium-140.4• 17• 23 The first evidence of BaH0 at Gracefield. New Zealand (41°S 175°E), was found in the monthly sample of December 1964. six to ten weeks following the detonation.24
11. According to preliminary data, debris of the second nuclear device, detonated on 14 May 1965, followed tropospheric pathways similar to those followed by debris from the first test and with comparable activity concentrations. Traces of short-lived activity were detected in the United States and elsewhere eight to twelve days after the shot.16· 17· 20• 25•30 Relatively high concentrations of N p239 and some activity due to U 237 were observed a few days after each detonation in Japan19• ~ 1 as well as in high altitude samples collected by Indian aircraft.16
12. These two explosions were estimated to have contributed about 2 per cent of the long-lived activity in the troposphere that was measured in the monthly samples immediately following each e.xplosion. The contribution became practically insignificant thereafter.17
Underground tests
13. Some accidental releases of fission products into the troposphere occurred from at least three lowyield underground tests since :March 1964.17• 20• 31-38 A relative enrichment of volatile radio-isotopes and their radio-active daughters in surface air was expected.3~• 30
• 40 The contribution of these events to the radiation
doses received by the world population is negligible. Doses in the proximity of the vented tests are not known with any precision.
Stratospheric injection of plutonitttn-238
14. The only stratospheric injection of radio-active material since December 1962 has consisted of the 17,000 Ci Pu238 (alpha emitter. half-life eighty-six years) from a radio-isotope power source (SNAP-9A) which burned up on 21 April 1964 above the Indian Ocean upon re-entry of a spacecraft into the atmosphere. The nuclide was probably released at an altitude of about 50 km. mainly in the form of submicron particles.41-44 Pu238 from this burn-up was first detected in high altitude balloon samples collected at 33 km and 34 ° S in August 1964, and was also found at 28 km and 34°5 in September 1964.4:1• 46 In the northern hemisphere (35°N) Pu238 was first identified in
45
samples collected at an altitude of 33 km in January 1965.H By June 1965, it was found in samples from altitudes exceeding 28 km, at 35°N and higher northern la ti tu des. 47
15. By May 1965, the Pu238 attributable to the SNAP-9A power source had descended into the lower stratosphere of the southern hemisphere. None was detectable in the lower stratosphere of the northern hemisphere by June 1965.4M 0
120,00011"'T'"-.-...--.--.--r----.--..----.---.---.----.,.........,........, ........... km
~------ :: 25
80,000
I-UJ UJ u.. 20
UJ 0 :::> !:: ... -' -<
40,000
10
20,000 s
o ....... "'-:-..__,__.__....__.__..___.__..___.___,,--''-'_,..... o 9fP 60" 30" r:P 300 6(JO 9(1>
NORTH SOUTH
Figure 1. Global atmospheric distribution of Pu238, SeptemberN ovember 196564 (pCijl,000 kg air)
16. Figure 1 shows the global atmospheric distribution of SNAP-9A Pu238 a year and a half after its injection, in units of 1 X 10--a pCijkg air.64 Integrating the concentration pattern obtaining one year after the injection indicates that about 104 Ci Pu23B (approximately 60 per cent of the total) were then present in the stratosphere between 22 and 36 km. 48 Part of the unaccounted for 7 X 10³ Ci were probably still above 36 km in the southern hemisphere. Data available so far«· 47
• 48• li-0, 51 confirm the general trend predicted by Harley42 and Machta43 concerning Pu238 concentrations expected in the atmosphere. These predictions were based on the information gathered from the follow-up of the radio-active tracers Rh102 and Cd10 9
that were introduced into the stratosphere by high altitude explosions at about 17°N and 43 km in August 1958. and at 17°N and 400 km in July 1962, respectively.42, 43, 48, :10, 112
17. Average concentrations of Pu238 oxide of the order of 10-5 pCi/m3 are e.xpected to persist in surface air during 1965 to 1968.50 corresponding to about one alpha disintegration due to Pu238 per month per m3 •
This is well below the detection limit of most sampling stations; however, concentrations ten times as great may be reached at some locations. Further predictions should await additional data.

I N\"ENTORIES
Stratosphere
18. Stratospheric sampling by aircraft between the tropopause and 21 Ian was continued during 1964 and 1965.49, 5l, 53.50 Higher altitudes up to 35 km were sampled by balloons.eti·60 Because of sampling li.mitations the inventories obtained from these data by interpolation and integration may not be better than ± 25 per cent.61
19. Recent data refer mainly to C1\ Sr90 and Cs13;
which are relevant to population dose estimates, as well as to certain tracer elements such as Cd109
, :Mn54 or Pu23s the movement and distribution of which might contribute to our understanding of stratospheric motions.
20. The distribution of Sr90 in the stratosphere during January 1964 and January 1965 is shown in figures 2 and 3. The corresponding distribution of C14
is shown in figures 4 and 5. Integration of the distributions show51• 112 that the stratospheric burden of Sr00
decreased from about 4 + 1 MCi in January 1964 to about 1.6 : 0.4 MCi by January 1965, while the C14
e.xcess in the stratosphere decreased from about 25 ± 5 X 10²; atoms to 15 ± 3 X 1027 within the same period.
[j 60,000 ... .... ... c ::> !::: .... ..J <
100
AUSE50~' -~::tri ... : ............
' ' ',
·--·-
o......__.__._......___.,_.....___.,_......__.___.__..___.__.__._......,
25
20
15
10
5
0 90" 6lJO 300 00 30" 60" 90"
NORTH SOUTH
Figure 2. Distribution of SrDO in the stratosphere. January 196464 (dpm SrD0/1,000 SCF)a
1 1 dpm/1,000 SCF = 13 pCi/1,000 kg air.
21. The mean residence time of particulate radioactive debris in the stratosphere. as derived by integration of the results of the stratospheric sampling network for Sr90, was aprroximately fourteen months during 1963 to 1964.51• 6 The mean residence time of C140 2 in the stratosphere was about twenty-five months during the same period51 (about seventeen months for the northern stratosphere alone). These differences in residence times. as well as the different distributions of these two nuclides in the str~tosphere, may reflect the facts that some settling of particulates may take place in the atmosphere and that tropospheric air. rich in C140~ relatfre to Sr90 , re-enters the stratosphere.64
46
...... w w .... I w Q :::i I-I..J et
km 120,ooo ........ ..-...--....--r--....--....--ir--.-r--r--r11111
35
80,000
3(
25
-.... __ .. 20
15
10
5
0 ILL..L...L.......L--3L0-.-1---1-~0"L--....L--'--~3~0°:--"'__.~6~0=0~90°
NORTH SOUTH
Figure 3. Distribution of SrBO in the stratosphere, January 196502 (dpm Srll0/1,000 SCF)a
• 1 dpm/I,000 SCF = 13 pCi/1,000 kg air.
100,000
80,000
...... w 60,000 w
~~-5-0_0 ___ 2_0 ..... 0
25
20
.... I
w Q :::i
.............. 15 I-j:: ..J et
10
20,000 5
o ....... _._....._.....__.___,,__....___,.___.__.__...._._.___.-1....J...110 90• so• 30• oo 30° so 0 90•
NORTH SOUTH
Figure 4. Distribution of 04 in the stratosphere. January 196464 (105 atoms of excess 04/g air)
22. Provisional results since October 1964 of total gamma counts on high altitude samples. when expressed in activity per unit standard volume of air. suggested some accumulation of nuclear debris above 20 km at equatorial latitudes.5i• 58 Balloon samples taken during the period January-April 1965, at 9°N and 20 km also contained activity per unit standard volume of air about two to three times higher than samples collected at 31 °, 45° and 65°N at similar altitudes.80 No final results are available yet from the few samples taken by aircraft in the lower stratosphere at equatorial latitudes during the first half of 1965.

>
.... w w .... I w c ::> ....
~
30°
NORTH 30°
SOUTH
25
20
............ 15
10
5
Figure 5. Distribution of CH in the stratosphere, January 19656!? (105 atoms of e.""<cess CH/g air)
23. These findings are summarized in figure 3, which reveals two regions of high activity concentrations, one at about l0°N and the other at about 65°N, some 7 km above the tropopause. However, the ma.ximum concentrations above equatorial regions as shown in the figure, rather than reflecting the actual stratospheric distribution of the nuclear debris, are an artifact due to the unit chosen to express concentrations (SCF-1 ).
24. Figure 6 depicts the same data as figure 3, but expresses concentrations in terms of activity per actual volume of space rather than per unit mass (standard volume) of air.64 The concentration gradients become steeper above altitudes where the maximum concentrations occur and less steep at lower altitudes. The apparent piling up of activity over the equator is much
30°
NORTH 30°
SOUTH
25
20
15
10
5
I 0 60° 90°
Figure 6. Distributior. of Sr:Jfl in the st:-atosphere. January 196564 (dpm SrfiO/l,000 ambient cubic feet)a
• 1 dpm/l,000 cubic feet = 15.9 pCi/1,000 m'.
47
less pronounced. This type of presentation gives a more direct picture of the activity distribution but does not permit simple calculations of the movement and mixing of air masses. Figure 7 is the corresponding figure for C14 concentrations in the stratosphere using the same data as those in figure 5.
Troposphere
25. Strontimn-90. Figure 8 shows the average Sr90
concentrations in surface air at the United States western hemisphere stations.1• 62• 6~ Average Sr90 concentrations for the fourteen stations sampled in the northern hemisphere ranged from about 15 pCijl.000 m3 to 70 pCi/1,000 m3 in 1963, from about 7 pCijl,000 m3 to 50 pCi/1,000 m3 in 1964 and continued to decline in 1965. The decrease in Sr90 concentrations in the northern hemisphere during 1964 and 1965 is compatible with a fourteen-month mean residence time in the stratosphere.
26. The average concentrations in surface air at seven stations of the southern hemisphere were lower than those encountered in the northern hemisphere by a factor of ten to twenty during 1963 and ranged from about 1.5 to 4 pCifl,000 m3• They ranged from about 2 pCijl,000 m3 to 5 pCijl,000 m3 in 1964 and declined during the first half of 1965. Air concentrations throughout the first half of 1965 were about five times lower than the values for the northern hemisphere.66
27. An isopleth representation of Sr90 concentrations in surface air as a function of latitude is shown in figure 9, which was derived from results at twenty western hemisphere stations for the years 1963-1965.67 The data from Chacaltaya, Peru (16°S 68°W). were not included, because the altitude of this station ( 5,200 m) is such that the results cannot be considered as representative of the surface air concentrations at this latitude. An approach to symmetry between the concentration patterns in each hemisphere is evident >vhen a six-month shift is allowed for between hemispheres.
.... ltJ UJ LJ. I
ltJ c ::> .... i= __J et
km 120,000-~-.-~.....--,.....;.....,....-..--....... -....--.---r--.--r.......,,
35
100,000
5------------ 30
10----------= 25
20
15
"° 10
5
llL1-L_1-..L-1.._L-.....L-L--L--1.~L--.l.-l~O 30° 0° 30° eo0 90°
NORTH SOUTH
Figure 7. Distribution of excess CH in the ~trato~phere. January 196564 (105 atoms CH/Q.8 litres ambient air)

I.. 20 ..... ~~~~ ..... ~~~~"""T~~~~--r~~~~~~~~~~ ........ ~~~~""""I~~~~--,,...-~~~~.., 20
- Northern hemisphere - Southern he,.;,isphere
·c; ... 0 10 .. C> I..
'ii E
8 missing Tdata
, I \i
5
1958 1959 1960 1961 196'.2 1963 1964 1965
Fig1we 8. Average Sr90 concentrations in surface air (80°W), 1958-196565
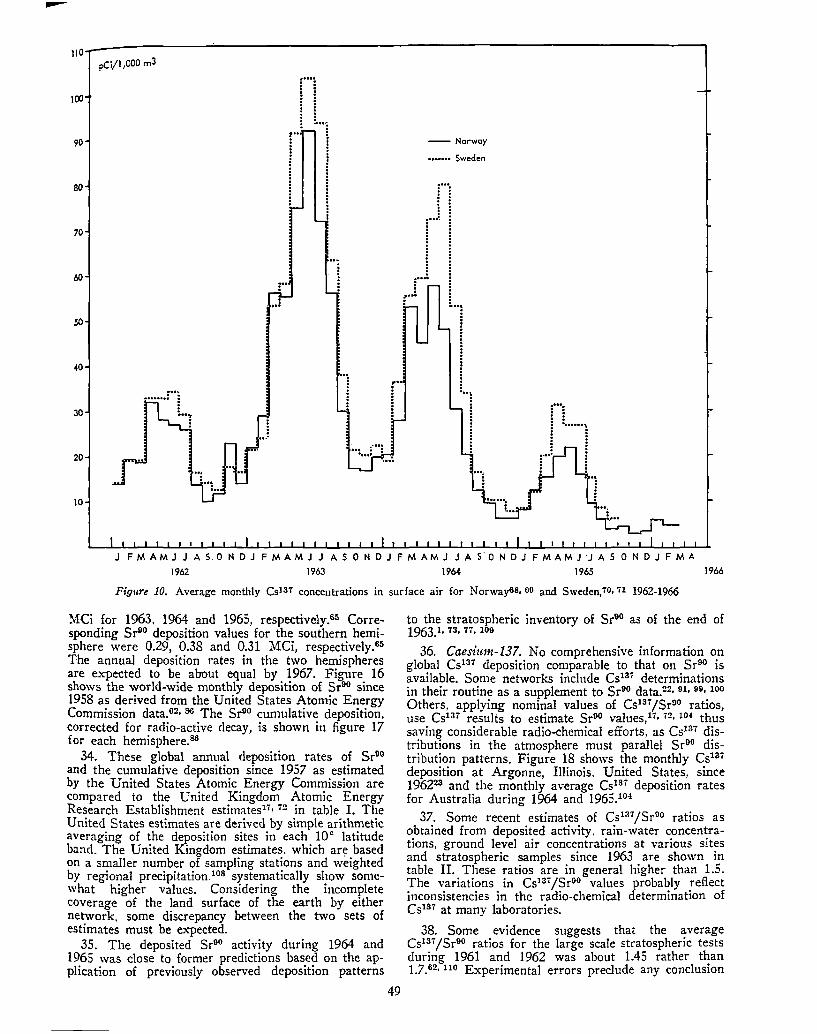
28. Caesi.mn-137. Figure 10 shows the average monthly Cs137 concentrations in surface air in Norway68· 69 and Sweden70· 71 since January 1962. Cs137 concentrations in the United Kingdom17• 72 and at Argonne, Illinois. United States,23• 73• 74 are shown in figure 11. The spring maxima and autumn minima evident in figures 8 and 9 are also obvious in figures 10 and 11. Cs137 concentrations were highest at Argonne and of comparable magnitude in Norway, Sweden and the United Kingdom. A decrease in concentrations during 1964 and 1965 as compared to 1963 levels is evident. Measurements in India show similar trends. 15, 76
29. Carbon-14. Excess C14 concentrations in the troposphere for each hemisphere are shown in figure 12 for the years 1956-1965.G2 Concentrations in both hemispheres tend to equalize, and they follow closely earlier predictions.1• 77 Over-all average values of excess C14 concentration in the troposphere for 1963 were 60 per cent above the natural level of 74 X 105 atoms C14
per gramme of air'8 that obtained before nuclear tests were conducted. The e.xcess of artificial ea continued to increase until mid-1964. Average excess values were about 85 per cent for 1964 and 1965.62• 7s-s1
Deposition on land 30. Samples of deposited activity have been collected
in the period under review at more than 200 sites scat-
I.Li 0 ::;)
I--I-
< ...J
N
7r:P
6rP
5ff'
400
300
200
10"
200
30"
J=MAMJJASONDJFM
1963
tered throughout a large part of the land area of the earth's surface.16-19, 22, s1, 6~-10, 12, ;s, s2-1os Total beta activities and deposition rates of Sr90, Cs137 and other radio-nuclides have been systematically analysed.
31. Stro11ti1m1-90. The monthly Sr90 deposition in New York City since 1954106 and in Buenos Aires since 1959102 are given in figures 13 and 14, respectively, as examples of rates of deposition in the northern and southern hemispheres. As the rainfall throughout 1964 and 1965 was exceptionally low in the New York area, deposited Sr90 levels after August 1964 were somewhat lower than predicted on the basis of a normal precipitation pattern.101
32. An isopleth representation of global Sr90 deposition rates per month from 60°S to 80°N for the period 1963-1965 is shown in figure 15, based on the sampling network operated by the United States Atomic Energy Commission.65• 86 The deposition pattern follows closely the surface air concentrations shown in figure 9. Sr90 peak deposition values were encountered in the period April-July 1963 between 40°N and 60°N. Comparable values were encountered during the period April-June 1964 at the same latitudes.
33. A general decrease in the yearly deposition rates for the northern hemisphere has been evident since 1963, total Sr90 depositions being 2.32, 1.47 and 0.69
MJJASONDJFMAMJJASOND
1964 19:55
Figure 9. Isopleth representation of SrDO concentrations in surface air, 1963-196565, 67 (dpm Sr90/1,000 m3)
48
110 peifl ,000 m3
100
90
80
70
40
30
20
10
..... . . ! ! : : : : ~ !
r: ~ .. l
I ! :
-- Norway
._ ..... Sweden
J FM AM J J A S. 0 N D J FM AM J J A S 0 N D J F M AM J J A S 0 N D J FM AM J ·J A S 0 N D J F MA
1962 1963 1964 1965 1966
Figure 10. Average monthly Csl37 concentrations in surface air for Norway6S. oo and Sweden,70, 71 1962-1966
MCi for 1963. 1964 and 1965, respectively.65 Corresponding Sr90 deposition values for the southern hemisphere were 0.29, 0.38 and 0.31 MCi, respectively.65
The annual deposition rates in the two hemispheres are expected to be about equal by 1967. Figure 16 shows the world-wide monthly deposition of Sr90 since 1958 as derived from the United States Atomic Energy Commission data.62• 86 The Sr90 cumulative deposition, corrected for radio-active decay, is shown in figure 17 for each hemisphere.86
34. These global annual deposition rates of Sr90
and the cumulative deposition since 1957 as estimated by the United States Atomic Energy Commission are compared to the United Kingdom Atomic Energy Research Establishment estimates17• 72 in table I. The United States estimates are derived by simple arithmetic averaging of the deposition sites in each 10° latitude band. The United Kingdom estimates. which are based on a smaller number of sampling stations and weighted by regional precipitation,108 systematically show somewhat higher values. Considering the incomplete coverage of the land surface of the earth by either network. some discrepancy between the two sets of estimates must be expected.
35. The deposited Sr90 activity during 1964 and 1965 was close to former predictions based on the application of previously observed deposition patterns
49
to the stratospheric inventory of Sr00 as of the end of 1963.1, 73, 77, 109
36. Caesimn-137. No comprehensive information on global Cs137 deposition comparable to that on Sr90 is available. Some networks include Cs137 determinations in their routine as a supplement to Sr90 data.22. 9l, 99• 100
Others, applying nominal values of Cs131 /Sr90 ratios, use Cs131 results to estimate Sr90 values, 11• 72• lO-i thus saving considerable radio-chemical efforts, as Cs137 distributions in the atmosphere must parallel Sr90 distribution patterns. Figure 18 shows the monthly Cs137
deposition at Argonne, Illinois. United States, since 196223 and the monthly average Cs137 deposition rates for Australia during 1964 and 1965.104
37. Some recent estimates of Cs131/Sr90 ratios as obtained from deposited activity. rain-water concentrations, ground level air concentrations at various sites and stratospheric samples since 1963 are shown in table II. These ratios are in general higher than 1.5. The variations in Cs137 /Sr00 values probably reflect inconsistencies in the radio-chemical determination of Cs131 at many laboratories.
38. Some evidence suggests that the average Cs137 /Sr90 ratios for the large scale stratospheric tests during 1961 and 1962 was about 1.45 rather than 1.7.62• 110 Experimental errors preclude any conclusion

as to a shift in Cs137 /Srfl0 ratios towards lower values since 1963.
Depositwn in the oceans 39. Deposition of Sr90 in the oceans is mainly of
importance in relation to the inventory of Sr90• The
170
160
150
1.C.O
130
120
110
100
90
80
70
60
50
30
20
10
pCl/1,000 m3
... , : : ! ! ! ! : : I ! . . . . ! : .. . . . . . . i ! : i :·.. '-••:
: : . . ! ! i : ! : i ! i : . . i ! : I ! ! ! i i : : :
i I . . : ! i i ....... . . . . . : ~ ... . . . . . . . . . .
I ; : : . . . . : i
f ! I : ~ I : : . . i : n i 1
i i ... , ! : : I : t
,... i :··~ ~ ! ! i ii: : • I ,- ~ ~ i i . ' : • f,
,..... : 1', . : ... ~! I i ! · ! ! i ! I 1 .l .1
.! : ! f-· i,!l
! .i r- : :.· l : !, i ! , .... : : i ! : I j :
~·i ·1 I
! ,...! : : ........... -
dilution of Sr90 and other fall-out products by the large volume of the ocean at present suggests minimal doses to man.
40. The oceans cover 70 per cent of the earth's surface, and sampling them presents a different, and •
, ... ! f : ' r' I
i ! ! ! ! i ! i
l f i i
! ! i
Chllton, United Kingdom
Ar90"ne, Illinois, United States
...
i i :
'\
, .... : t ....
JFMAMJJASONOJFMAMJJASONDJ.FMAMJJA ONDJFMAMJJASONDJFMA 1962 1963 1964 1965
Figure 11. :Monthly Csl3; concentrations in surface air for Chilton. United Kingdom,17, 72 and Argonne, Illinois, States,!!3. 78, 74 1962-1966
50
1966 United

~ :; E ,_ g ~
~ -§ c QI ... i a.
100
90
80
70
60
so
40
30
20
JO ----,,.,.-"--_...-__ .,,.,,.. /
//
.,....,.,.... Southern hemisphere _.,...
/
7 /
/ I I I I I I I I I I
I I
I /
_,,.--· --
o'-:-:::7T7:":=+:-=::~:--:-+---lf---t-~-t-~+-~1--_J 1956 1957 1958 1959 1960 1961 1962 1963 1964 1965
from some points of view. a more difficult problem than sampling the continents. The depth of the oceans, averaging almost 4.000 metres. and the movement of water are major complicating factors.
41. The radio-chemical analysis of SrllO in ocean water is difficult, particularly the analysis of samples from great depths, since levels are low and large amounts of reagents are required. Blank samples are frequently found to show detectable levels, often of the same order as the measured values.111-117 This increases the uncertainty of measurement and has cast doubt on some of the results for deep water.
Concentrations of strontium-90 in surface water
' Taking as normal the alr concentration in 1954 (74 X 10" atoms of o• per gra=c of air).""
42. The Sr90 concentration of surface water in the seas and oceans as reported by various investigators has varied greatly as a function of both geography and time. Figures 19 to 22 summarize most of the reported surface water Sr90 results through 1961. The variation of Sr90 concentrations with latitude in the oceans and certain seas for 1960 and 1961 clearly illustrates that, even under the best circumstances. as in the southern Atlantic and Indian Oceans, the values have a variability of at least a factor of two. Pacific Ocean values have even greater variability, probably reflecting "hot spots"
C'I E.
-" ... .. 0..
~ '-"' "' ..
·;:: "' .~
~
Figure 12. Tropospheric inventory of carbon-1464
3
2
0 1963
Figare 13. Monthly deposition of Sr9G in New York City, 1954-1966106
51
1964 1965 1966

o.a.
0.7.
0.6.
"' c 0.5 ff.<!... .. "'
<.n ~ 0.4 l'V
0.3.
0.2 ..
J I' MA M J J A S 0 N D' J FM A M J J A. S 0 .N 0 1 J FM AM J J A S 0 N 0 1 J F MAM J J A S O N pi J F M0
A.M. J J" A S 0 N pi J FM AM J J A S 0 N DI J" FM AM. J J A. S 0 ND
1959 1960 1961 1962 1963 1964 1965
Figure 14. Monthly deposition of Sr90 in Buenos Aires, Argentina, 1959-1965215
r -

30°
400
sD° s,_....-=~L-...___._~___.___,'--..__~_.___._+-1~'--.l.---'--'--'----'~L-.l.---'--'---3.-+-'1--.l.---'--'-..L..l..---'~L-.l.---'--'--L---'~
JFMAMJJASONDJ FMAMJJASONDJFMAMJJASONO 1963 1964 1965
Figure 15. Sr90 deposition integrated according to zonal belts as a function of time, 1963-196565 (mCi/km2 per month)
due to greater local fall-out.325• 326• 338•3.U For inventory purposes, however, only data from the north Atlantic Ocean have been considered.
43. From the data used in these graphs, Popov and Patin tabulated the average concentrations of Sr00 for 1960 and 1961 shown in table III. Very few measurements have been reported after 1%1 e..'<cept from the north Atlantic Ocean.112• 113• 115• 118 These (table IV) indicate an increasing trend of Sr00 concentrations in surface water until the end of 1964. The data from the first half of 1965 suggest that the level of Sr90 in this region has started to decline.
44. For the western Pacific Ocean in the vicinitv of Japan. surface water in the years 1963 and i964 averaged about 0.43 pCi/litre and ranged from 0.25 to 0.53,119 while, for the eastern region of the Pacific Ocean, concentrations from about 0.04 pCi/Iitre112 in 1963 to 0.5 pCijlitre in 1965111 were reported.
45. The now well documented latitudinal variation of deposition of Sr00 on land (figure 15) is not observable in surface ocean water. However, in table III and figures 19 to 21 the generally higher values for the northern hemisphere presumably reflect the fact that
.c
~ ... q) c..
0,1
0 o:-,_ 0.01
Vl
most nuclear tests have so far been carried out in the northern hemisphere.120.128
Concentrations in deep water 46. Measurements of fission product concentrations
are consistent with more rapid contamination of deeper water with strontium-90111, 113, 111, no, 121-123, 129, 130
than some investigators believed possible.112• 118• 131
Bowen et al. lJ.3, 115• 120 found mid-depth ( 1,000 to 3,000 metres) concentrations of Sr90 in the Atlantic Ocean consistent with the flow rates of intermediate depth currents derived from hydrographic considerations. Belyaev et al.130 used observed turbulent diffusion coefficients and mean current velocities to solve the complete transport equation. The calculated distribution of Sr00 with depth in the Atlantic Ocean was found to be in agreement with observed data.325• 327• 33s.au
47. Ozmidov and Popov122 pointed out the slower increase of Sr90 concentration with time in the north Atlantic Ocean surface water compared to that on adjacent land and concluded that these data indicated intense vertical turnover of ocean water above and below the thermocline.
...... ~.. ·:-.. · ... : ....
0,001 I I I J MM J S N J MM J S N JM M J S N JM M·J S N J MM J S N JM M J S N J MM. j S N J M.M J S N
1958 1959 1960 1961 1962 1963 1964 1965
Figure 16. Hemispheric deposition rates of Sr90, 1958-196565, 86
53

I O
9
8
7
6
= °"
.....
-0
4
TOTAL WORLO NORTH ERH HEM I SPHERE ............. .
SOUTHEP.N HEMISPHERE·-·-·-
..•··· ~······ ..
......... ··•··
/ ...... ··· :
l :
i
..•. //
, ......... ~·······-················ •• l···
. .. ·····••
._, :E 3 /,../'-- ··---··- ····----·····--·
.-----· 2
,,,_ _ .................... ..
·--·-----· ·-·-·-·-·
.---·-· --·-·-·-· ·-·-·-·-·
-------·-------·-
0 I 9 S 5 I 9 5 6 I 9 5 7 I 9 5 8 I 9 5 9 I 9 6 0 I 9 6 I I 9 6 2 I 9 6 3 1 9 6 4 I 9 6 S
Fig11re 17. Cumulative Sr90 deposit, 1955-196565, 86 (corrected for radio-active decay)
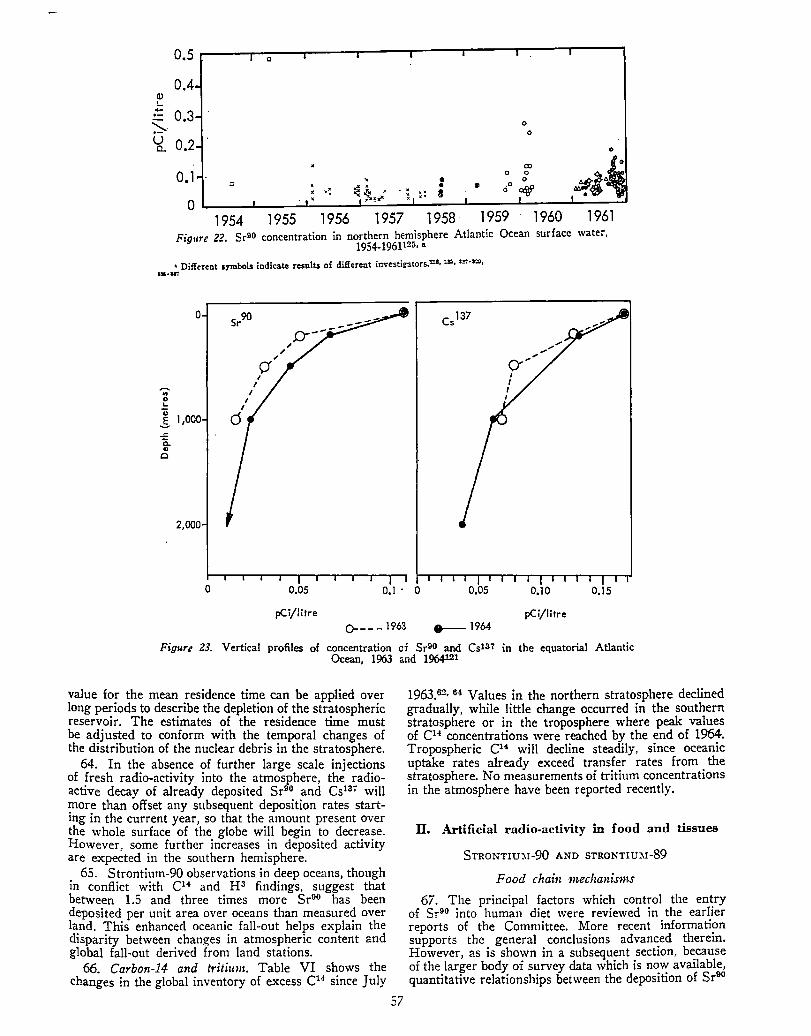
48. In 1962, north Atlantic water samples at depths from 1,000 to 3.000 metres or more had Sr90 concentrations averaging about 0.03 pCi/litre with values ranging from 0.01 to 0.07.113 Equatorial Atlantic samples from similar depths averaged about 0.04 pCi/litre in 1963.113 Figure 23 illustrates average profiles of Cs137
and Sr00 for the equatorial Atlantic Ocean in 1963 and 1964.
49. Broecker112 reported much lower values for mid-1963, generally less than 0.01 pCi/litre, for deep water from both the Atlantic and Pacific Oceans. This lack of agreement in deep water samples probably relates to the problem of corrections for blank samples.
50. The dating of deep water samples by natural pre-test radio-carbon shows a very slow rate of exchange between deep and surface water which is incompatible with the appearance of Sr90 in the deep ocean. Ostlund,139 moreover, found water with little or no tritium in certain areas of the deep Atlantic Ocean where Bowen detected appreciable amounts of Sr90•
51. Several investigators111• 119• 120· 132 have also reported measurements of other nuclides from atomic explosions. such as Cs137, Zr95, Nb95, Ce144, Ru1os, Ru106 and Pm147 . at considerable depths in the oceans. It must be recognized, however, that the mechanism of transport of some of these nuclides may be different from that of Sr90•
Comparison of terrestrial and oceanic fall-out 52. Several investigators111, n:>, 120-12-!, 129, 133·13S found
that deposition of Sr90 in the oceans was higher than on the adjacent land bodies, generally by a factor of between 1.5 and 5 per unit area. Karol et al .. 1u studying
54
1960-1961 data in 10° latitude bands, found ocean/land deposition ratios ranging from 1 to 8, with the average for the entire 70°N to 30° S region being about 2.
53. Integration of observed Sr90 values in the mixed layer down to the thermocline yields a value for accumulated Sr90 deposited which is approximately the same as that expected from observations on land. Accordingly, in so far as the presence of Sr90 in water below the thermocline can be demonstrated, the fall-out over the oceans must be greater than that measured over land.
54. Enhanced Sr90 deposition over the ocean compared with land areas would help to explain the disparity between the change in atmospheric content, and that in land fall-out. The annual reduction in the observed atmospheric content of Sr90 is found to be 1.5 times the total world-wide deposition estimated from land-based stations since 1963.63, 64, iu. 124, 137
55. Calculation shows that this corresponds to a deposition factor over the oceans, per unit area, of about 1.8 times that which has been estimated over land. It must be remembered that our knowledge of deposition over the entire land surface is far from complete, little information being available, for example, regarding heavily forested areas. Heavier deposition in. such regions could partially explain the apparent discrepancy.
56. Chesselet et al.132• 138 measured concentrations of Zr95 + Nb95, Ru103 and Ru106 in waters of the western Mediterranean and the Bay of Biscay in late 1963 by in situ gamma spectrometry. Comparing the results of these measurements with observations made simultaneously at continental sea shore stations. they concluded that the deposition had been two to seven times greater over the oceans.
" . ..

10.8
rnCijkm2
6
5
3
2-
---- Argonne, Illinois, Uni~ed Stoles
.............. Australia
:••o; : : ................ ~ ~ ..
. ~··-: : •••• : ••• ,,. ...... ..-!'
J F MAM J J A S 0 N D J FM AM J J A-5 0 N D J FM AM J J J A S 0 ND J F MA 1962 1963 1964 1965 1966
Figure 18. Monthly deposition of Csl37 at Argonne, Illinois, United States. for 1962-1966,23 and the average monthly deposition of CslS7 in Australia for 1964-1965104
SS

I
0.6-
0.5
0.4 " ~ s. 0.3 Ii,
0,2
0.1 00
~ 0
0
0 0 0
0
0 0 0 0
0 o0
oo 0 8
O oO oo oooo o °a:>
O· 0 0 0 0 0 00
•
0 0 0 oo&,
0
0 0
• ..
0 0
0
0 0
0
0 SOo 400 200
South
400 North
Figure 19. Sr90 concentration in Pacific Ocean surface water in 1960 and 1961125, n
()0 20°
• Different symbols indicate results of different investigators.11l1, 3.2S, ._.,.
0.5
0.4'
\!) 0.3 t.. ..... ·-~ u 0.2 a..
0.1. 0 Q Q Q
Q ... • ... •• f " g •" 0 " • ..... .. 60° 40° 20° 00
South
showed that, in almost all latitudes tested, the concentration of artificial radioactivity is lower above the sea than above the land.
Conclusions
60. The presence of Sr90 in the deep waters of the oceans and seas appears to be confirmed by several investigators, although the low levels of the radioactivity may in some cases preclude the accuracy in the radio-chemical analyses that would be necessary for unambiguous interpretation. Other information, such as C14 and H 8 measurements, is in conflict with this.
61. On balance, it appears that more Sr90 has been deposited over oceans than over land per unit area. The precise amount of the excess has not yet been determined but the average ratio of ocean deposition per unit area to that measured on land may be between 1.5 and 3. The mechanisms which bring about this
Baltic Sea
Black Sea r·-1 I (
A I I . I I L1> I.· o' I I
I I I I
It. I I I I
0 l I I I I IQ I
0 "" I I ,. I I
G Gy I I
~ a . __ .; , <> "'f oO
G c><>
. ~\J· 0 4 ~· 0 ..
Q j 1~ o 00 •o 0 0
o<> tP . • .. 20° 40° 60° 80°
North Figure 20. Sr90 concentration in Atlantic Ocean surface water in 1960 and 1961125, a
• Different aymbols indicate results of different invcstigators,llB• 1110, .,. ... ,
57. Broecker et al.134 utilized the Sr90 concentration of shallow water on the Bahama Banks which was also dated by its content of artificial C14• These parameters permitted a comparison of fall-out in that region with land sites. The data suggested that fall-out 011 the Bahama Banks was not systematically higher than that observed on land masses in the same latitude belt. The sensitivity of this experiment, however, could not distinguish differences of less than about a factor of two.
58. Machta et al. 140 studied the Sr90 distribution in Lake Michigan and found that the deposition over this large lake was not higher than that extrapolated from nearby land stations. The relevance of this observation will depend upon many factors such as absorption by sediments and general similarity to ocean conditions.
59. Karol et al.124 have shown that neither higher concentration of Sr90 in oceanic rain342• 343 nor higher precipitation are likely mechanisms of enhanced deposition over the ocean. since no increased deposition was observed on island stations. confirming the conclusion reported in the 1964 report. They suggest that the major mechanism is related to the air-sea interface, and consists of "scrubbing" of the surface air by sea-water spray and salt particles. and of irreversible absorption of the aerosol by the water surface. These conclusions were tested by comparing Sr90 and other radio-nuclides in surface air taken over land and sea areas. The result
56
.~ 0.2
s '{ 0,1
00 •o
Q 0
0
0
0 0
o ci Ooo o 0 0 c oo 0
o o o oo c g =-oo oo : 0 0 0 c130
0
60° 400 20° o0 20° South North
Fig11re 21. Sr90 concentration in Indian Ocean surface water in 1960 and 1961125, a
• Different symb<>ls indicate results of different investigat01's.l.l!B, ._ ...
enhanced oceanic deposition are not clear. but evidence suggests that it is related to phenomena at sea-air interface rather than to precipitation.
Sm.orARY
62. Table V shows the changes in the global Sr90
inventory since 1960. The estimate of cumulative deposition is based on the assumption that deposition per unit area is the same over oceans as that measured on land.
63. The obsen1ed stratospheric mean residence time of fourteen months for particulate radio-activity in the years 1963-1965 is shorter than the assumed value of twenty-four months used in the 1964 report. No single
0.5
0.4 Cl) !....
0.3 ~· u 0.2 a..
0.1
c
c • •
0
0
Q)
0 0 0
0
l( lt~ · S ~! a 00 elf}'
0 1954 1955 1956 1957 1958 1959 1960 1961
Fig11re 22. Sr90 concentration in northern hemisphere Atlantic Ocean surface water, 1954-1961125, a
• Different symbols indicate results of different investigators.:na• ""· •r.-r.o, Ul•l.fT
~ .. 0 ...
0
ii .§. 1,000
-" 0.. ., 0
2,000
Sr90
d
I I
I
c;f I
I
, , , ;:r--
0 o.os 0,1 . 0 o.os 0.10 0,15
pCi/litre pCi/litre 0---- 1963 e--1964
Figure 23. Vertical profiles of concentration of Sr90 and Csl37 in the equatorial Atlantic Ocean, 1963 and 1964121
value for the mean residence time can be applied over long periods to describe the depletion of the stratospheric reservoir. The estimates of the residence time must be adjusted to conform with the temporal changes of the distribution of the nuclear debris in the stratosphere.
64. In the absence of further large scale injections of fresh radio-activity into the atmosphere, the radioactive decay of already deposited Sr90 and Cs137 will more than offset any subsequent deposition rates starting in the current year, so that the amount present over the whole surface of the globe will begin to decrease. However, some further increases in deposited activity are expected in the southern hemisphere.
65. Strontium-90 observations in deep oceans, though in conflict with C14 and IP findings. suggest that between 1.5 and three times more Sr90 has been deposited per unit area over oceans than measured over land. This enhanced oceanic fall-out helps explain the disparity between changes in atmospheric content and global fall-out derived from land stations.
66. Carbon-14 and tritium. Table VI shows the changes in the global inventory of excess C14 since July
57
1963.62• 64 Values in the northern stratosphere declined gradually, while little change occurred in the southern stratosphere or in the troposphere where peak values of C14 concentrations were reached by the end of 1964. Tropospheric C14 will decline steadily, since oceanic uptake rates already exceed transfer rates from the stratosphere. No measurements of tritium concentrations in the atmosphere have been reported recently.
II. Artificial radio-activity in food and tissues
STRONTIUM-90 AND STRONTIUM-89
Food chain -mechanisms
67. The principal factors which control the entry of Sr90 into human diet were reviewed in the earlier reports of the Committee. More recent information supports the general conclusions advanced therein. However, as is shown in a subsequent section, because of the larger body of survey data which is now available, quantitative relationships between the deposition of Sr90

and dietary levels can now be predicted somewhat more confidently.
Metabolism in man 68. Attempts have been made to explain in kinetic
terms the discrimination between strontium and calcium in metabolic processes. The experiments of Walser and Robinson141 and of Marcus and Wasserman1
{2
show that the degree of discrimination against strontium during its tubular re-absorption from the glomerular ultra-filtrate is inversely related to the efficiency of calcium re-absorption. A similar relationship holds with regard to absorption of both elements from the gastrointestinal tract. Quantitative analysis of the data suggests that the ion transfer across the relevant biological membrane is in both cases a first order process and that a constant ratio obtains between the rates of absorption of calcium and strontium.
69. It follows from these experiments and from theoretical considerations that the body /diet ORn must vary slightly with the efficiency of calcium absorption in the gastro-intestinal tract and be higher when a greater fraction of calcium is absorbed. In early infancy, however, the limited discrimination between calcium and strontium is due not only to high absorption efficiency but also to the lack of difference in the absorption rates of both elements in the gut.
70. Average values, however, are little affected by individual variations and an average OR of 0.25 will still be used in this report, since:
(a) Recent studies,143• 144 carried out in apparent metabolic steady-state (using stable Sr /Ca ratios in bone and diet) have yielded OR values very close to 0.25;
( b) Higher OR values in the first year of life1411 are offset by additional discrimination at the placental barrier during foetal life and by a very rapid turnover of bone mineral in early infancy ( 1964 report, annex A, paragraphs 94-97).
71. Investigations of the metabolism of strontium in child:ren and adolescents (one to nineteen years old) are m progress. Preliminary results indicate that no changes in the over-all estin1ate of the bone/diet OR used to calculate dose commitments from Sr90 are warranted.
72. Analysis of recent data from various countries on the empirical relationship
Sr90/Ca infant bone (0-1 year) Sr90/Ca milk
shows that the values reported cluster around onequarter (tables VIII and X) .
73. Marei et al.146 on the basis of extensive investigations established a relationship between the Sr90/Ca ratios in human teeth and in the skeleton in all age groups. The
Sr90 /Ca teeth Sr90 /Ca skeleton
ratio was higher in infancy and childhood than in adults (table VII), and remained relatively constant over a period of two to three years. The authors concluded. that te~th may . be used for monitoring Sr90 levels m man, if the ratios between dental and skeletal values are corrected for age and changes in time.
. Sr/OJ. sample " OR = obsei:ved ratio = ____ _:__
Sr/Ca precursor
58
74. The distribution of Sr90 and calcium in skeletons of adults in 1963 was re-examined in a recent study.141
The
Sr90 /Ca single bone Sr90 /Ca total skeleton
ratios were as follows: vertebrae/skeleton= 1.7; rib/skeleton= 1.0; femur shaft/skeleton= 0.4. These results are in essential agreement with data reported earlier ,14s.15o showing that changes in these ratios over the last three to four years did not exceed some 20 per cent.
Levels of strontium-90 in foods
75. The levels of Sr90 in milk in the period 1963-1965 are presented in table VIII. In the northern hemisphere the Sr90 /Ca ratios in milk in 1964 remained roughly at the level of 1963, when yearly mean values are compared. In 1965 a significant decline was observed which amounted, on the average, to about 20-30 per cent of the 1964 values (based on results of widespread, systematic studies). Time trends in milk concentrations of Sr90 in a few countries are shown in figure 24.
76. In the temperate zone of the southern hemisphere (Argentina, Australia, New Zealand), the absolute levels of Sr90 in milk were lower by a factor of three to four than those in the northern temperate zone. They were similar, however, to the levels reported from equatorial regions, reflecting roughly the latitudinal distribution of past fall-out levels in both hemispheres. The time trends in the two hemispheres were somewhat different: the increase in concentrations in the southern hemisphere continued from 1963 to 1964, but the yearly average levels remained unchanged in 1965.
77. In some areas, such as the Faroe Islands, Iceland, western Norway and the mountainous regions of many countries, the levels of Sr-90 in milk were significantly higher than the average values typical for most of the northern temperate zone. As already indicated in previous reports, these elevated concentrations of Sr90 in milk are mainly due to high rainfall and poor pastures.
78. The levels of Sr8D in milk declined in 1964 below detection limits. In the summer of 1965, transient levels of this nuclide in milk were reported1111, 1112 from some countries of the northern hemisphere following the atmospheric nuclear test conducted in May of that J:ea:. A~ 0e levels declined again below detection hm1ts w1thm three to four months, Sr89 will not be further considered in this report.
79. ~nfoT?Jation oi; ~he average Sr90/Ca ratios of total diets is more hm1ted than for milk but seems t? disclose similar time trends and geographical distribution. The available information is presented in table IX.
80. New information on Sr-90 levels in total diet and in milk shows that the
Sr90 /Ca total diet Sr90 /Ca milk
ratio has remained at about 1.5 in the United States, western Europe, Argentina and Australia (tables VIII and IX). Information now aYailable from the USSR indicates that this ratio ranged from 2 to 3 in 1963 and 1964: this result is similar to that found in Poland from 1961 to 1963. These higher ratios found in the USSR and in Poland are due to greater consumption of whole-meal cereal products.

..--
00. ············- Canada
---- Denmark
.- ·-~, New Zealand ,_., I . i \ . \
i· I . ' .
50 ··-·-·- Norway
- -- United Kingdom
.............. United States
.40 • . I ., t'~~{ l~···· \ _[i \"···~·-7·\·····-.. ...
30
' \ • ...--• ,* •••••... .•A•• ~ ' .... .. __.. \\ ... ·-' ···· ....•...... ···· ·. ~·\ ......... .. 20 · .. · ... .. ... _ .... .. .... ......
~ .,,..- . -. .. 1· ~............ ··.. ......___ , ' ~ ~ .. , . . ' ·· ... .. .---·- .. ------"":· ······· / "" ~.-.--.·.,.,-r·-·
10 --- 1..-· /.. v
~ ..../;' ,.. .. ......... -.................. ~ / ..... ---~ .. .,,,,,. .. ""t' /'
~...:::=-;. ~-_/ .1,.. -~·' . - ~,_.,
------·-· 1960 1961 1962 1963 1964 1965
Figure 24. SrllO in milk (time trends). Quarterly averages from country-wide surveys, 1960-1965
81. The relative constancy of the ratio
Sr90/Ca diet Sr90/Ca milk
1
at least for a few years, supports the conclusion reached in the 1962 report that in many areas the Sr110/Ca ratio in total diet can be reasonably inferred from analyses of milk.
82. Studies in Argentina,145 Austria,153 the United States1M and the United Kingdom155 have shown that the Sr90 /Ca ratio in the diets of infants who w~re not breast-fed in the first year of life falls between the values determined for milk and those for a typical adult's diet. As the ratio of Sr90 /Ca in human milk equals about one-tenth of the adult diet, the effective contamination of infant food depends very much on the extent of breast feeding.
Strontimn-90 in human bone
83. Levels of Sr90 in human bone in 1963, 1964 and 1965 are presented in table X.
84. The age distribution of the Sr90 /Ca ratios in human bone remained essentially unaltered from that previously reviewed. The highest levels are still encountered in the zero to one or in the one-year-old age group (figure 25).
85. The data for adults are reported in table X, both in original values and as normalized skeletal averages, calculated by applying the normalization factors given in paragraph 74. In the years of high fall-out rate. the average skeletal levels in adults were lower by a factor of four to ten than the highest values in young infants. This difference is expected to diminish with decreasing dietary levels of Sr90, because the skeletal contaminations in infants will change faster than in adults. and trends in these two age categories may be in opposite directions.
59
Geographical distribution and time trends
86. In the northern hemisphere, bone levels were higher by a factor of two to four than those reported from Argentina and Australia. There was a tendency for a marked increase in bone levels in all age groups from 1963 to 1964, the highest relative increase being in youngest infants. In the zero to one-year-old age group, the increase amounted on the average to some 30 per cent over the 1963 values, as compared to the factor of two or three by which the latter rose above tl:e 1962 values. Although only limited results are available for 1965, it may be provisionally concluded that, in the zero to one-year-old age group, levels may have reached their peak in 1964 and started decreasing in 1965. In the one-year-old age group, bone levels in 1965 seemed either the same as or slightly higher than in 1964. As expected, levels in adults are still increasing.
87. On the basis of available data, it seems that in the southern hemisphere, in the period under review, the time trends of Sr90 levels in human bone were not markedly different from those in the northern temperate zone.
88. The frequency distribution of the Sr90 /Ca ratios in adult bone-where levels are age-independent-has been repeatedly studied and recent data156• ui7 confirmed earlier findings,158• 159 indicating that the distribution was positively skewed and might be described as lognormal. If data from individual locations are considered, the probability that the Sr90 /Ca ratio in a single sample will exceed the mean value by a factor of three is of the order of 1 per cent.
Q 11antitative relationships bel"UJeen deposition of strontium-90 and dietary levels
89. In earlier reports of the Committee, fall-out rates and accumulated soil deposits of Sr90 were related to the concentrations of this nuclide in foodstuffs to

2. 1956 1957
• :. ....
4 1958 1959
3
2
• • • 0
0 u 3 1960 1961 Ol
6-- 2 °' L. Vl
u Q.
5 1962
4
3
2
0
• . __, 5 10 15 20A 5 10 15 20A
Age in years Age in years
9
8
7
6 0 u 5 Ol
6' 4 °' L. Vl
3 G a..
2
5 JO 15 20A Age in years
Figure 25. s.reo concentrations in bone, plotted according to age (A= adult): United Kbgdom results, 1956-1964272
predict future levels of contamination. The basic equation applied with respect to milk was:
C = P~d + p,-Fr, where
C =yearly average Sr90/Ca ratio in milk,
F 11 = total accumulated deposit of Sr90 in soil in mCi/km2
,
60
Fr= yearly fall-out rate of Srll0 in mCi/km2 in give year,
Pd and Pr = proportionality factors also called "soi and "rate" factors.
Although data from many parts of the world rema meagre, it is now possible in a number of countries derive soil and rate factors for milk by appropria regression analysis.

90. In some extensive regions, factors such as stored fodder for cattle justify the introduction of a third term in the equation which takes into account the contribution to milk levels of Sr90 which was deposited when crops and grass were growing in the second half of the previous year. The inclusion of this "lag-rate factor" may lead to a significant improvement in the prediction of year to year trends, especially \Vhen the rate of fall-out is changing markedly.112• 160 However, the separate evaluation of rate and lag-rate factors is not necessary for the calculation of dose-commitment.
91. An analysis of survey results from Argentina, Australia, Canada, Denmark, Germany, Japan, New Zealand, the United Kingdom and the United States indicates that the averages of the rate and soil factors for milk fall within the range of 0.8 to 1.0 and 0.2 to 0.3, respectively. These values do not differ sufficiently from those formerly estimated (0.8 and 0.3) to necessitate a revision of the proportionality factors previously adopted for milk nor for the three major types of total diets consumed by the world's population (1962 report, anne.x F, par~o-raphs 108-119).
92. In a number of countries, the annual average levels of Sr90 in diet, and especially in milk, have hitherto agreed satisfactorily with those predicted from the proportionality factors. While this encourages confidence in the use of this procedure, it must be borne in mind that assessments of the situation many years hence is subject to considerable uncertainty. This is so largely because absorption by plant roots is usually greater from the upper layers of soil where so far the levels of Sr90 have been highest. When downward penetration of Sr90 leads to its more uniform distribution throughout the rooting zone, lower values of the soil factors are to be expected. However, there is at present no basis for predicting how the soil factors will change with time in the majority of areas.
93. Because at the present time Sr90 is more concentrated in the upper layers of soil in permanent pastures than in the ploughed land on which other crops are grown, the decrease in the soil factor for milk is expected to be larger than for other foodstuffs. This should lead to a gradual increase in the ratio of
Sr90 /Ca diet Sr90 /Ca milk
which will approach the relationship obtaining for stable strontium and calcium.
94. A further problem in predicting absorption from the soil in the distant future arises from uncertainties as to the fraction of the total Sr90 in the soil which will be removed annually by crops or lost from the rooting zone by leaching. The Committee previously assumed that those processes might decrease the content of the soil by about 2 per cent per annum. leading to a total decrease of 4.5 per cent per year when radioactive decay is taken into account. It is recognized that this figure will lead to an under-estimate of the losses in many countries, but the data are insufficient to justify its revision.
95. Because it is e.xpected that the soil factor for total diet \Vill decrease with time and that the rate of loss of Sr90 from the soil may be greater than 2 per cent per year, estiniates of the integrated quantities of Sr90
which will enter diet over long periods, based upon the methods adopted here, should be regarded as upper limits.
61
CAESIU~-137
Food chain mechanisms
96. Cs137 which is deposited from the atmosphere is retained on vegetation in a manner similar to Sr90,
but the two nuclides contrast markedly in their behaviour in soil. In mineral soils which contain appreciable quantities of clay and moderate or low quantities of organic matter, the entrapment of Cs137 in the clay lattice structure causes it to be little absorbed by plants.161 The process of fixation may not be complete until several years have passed; thereafter, Cs137 may be absorbed to not more than about one-fortieth of the extent of Sr90•162 In contrast, when soils contain much organic matter, and especially when their clay content is low, Cs137 enters plants considerably more freely.111a-105
97. Soils in which organic matter is present in large concentrations throughout the entire rooting depth are mainly important in moist. temperate regions; this circumstance appears to explain, at least partially, why the average levels of Cs137 in diet from northern regions, e.g. Scandinavia, exceed those in lower latitudes.161 A more transient effect of organic matters occurs commonly in the permanent pastures of temperate regions. Appreciable quantities of organic matter form in the superficial soil layers, and, until Cs137 has penetrated into the underlying mineral soil, it is readily absorbed by plants; enhanced uptake due to this cause has been shown to continue for one to two years in these circumstances.161• 163 In the 1964 report, it was noted that Cs137 may also readily enter plants when soils are lateritic in type.
98. In its 1964 report, the Committee discussed a special food chain mechanism, whereby in some populations living in subarctic regions unusually high activities of Cs137 are transferred to man from lichens through reindeer or caribou meat. Results of a detailed dietary study of Finnish Lapps which became available recently166 show that about 75 per cent of their total intake of Cs137 comes from reindeer meat and meat products, while fish and milk contribute about 11-12 per cent each. It has since become evident that other nuclides in fall-out, such as Na22 and Feli5, or of natw-al origin (Pb210 and Po210), also show unusually high levels because of similar mechanisms of transfer.16
1-172
99. Lichens constitute the main fodder of reindeer and caribou during the winter season. In the summer, however, almost only grass and herbaceous plants are consumed. The Cs137 body burden of the animals therefore shows a marked seasonal variation, particularly some years after the peak deposition, when Cs137 levels in the grass have decreased while the levels in the lichens remain high.
100. Lichens on which these animals graze entrap almost all the Cs137 deposited per unit area of ground. It has been shown that the levels in grazing animals have increased up to 1965 in proportion to the lichen levels which are closely related to accumulated deposit of Cs137 (table XI). The levels are expected to decrease during the coming years when the fall-out rate will not be sufficient to compensate for the Cs137 loss due to grazing and possible wash-out. A number of estimates of the total elimination rate have been published,173"176 and although there is a wide divergence between these estimates, it seems likely that at least some 5-10 per cent of the Cs137 is eliminated annually.
101. Other mechanisms have also been shown to cause elevated levels of Cs137 in foodstuffs in northern

latitudes. Unusually high levels (10 or more nCi Cs137/
kg) have been reported in fresh ·water fish from some Scandinavian lakes.176•178 This has been attributed to the low mineral content of the water which enhances the absorption of Cs137 and other fission products. Similarly. aquatic plants which are sometimes important in the diet of cattle in these areas contain higher levels of Cs137 than normal pasture species.179
lit[ etabolism in man
102. Investigations of the metabolism of caesium in pregnant women and in new-born children180 have shown that the turnover of this element becomes accelerated in the course of pregnancy, with a resulting biological half-life of the order of about thirty to seventy days as contrasted with the usual value in adults of seventy to 140 days. There seems to be no placental barrier for Cs137 in its movement to the foetus, for new-born children revealed practically the same Cs137
/
weight ratio as their mothers. 103. That the Cs137 turnover is generally faster in
iniants than in adults has been further confirmed. suggesting a biological half-life in the first month of life of only seven to ten days ("Wilson and Spiers, quoted by Vennart181), or twenty-one to twenty-five days.180
Both the lower intake and the faster turnover of Cs137
in children explain that they show lower levels than adults, as has already been indicated in the 1964 report. This obsen•ation was recently confirmed by radiochemical analysis of skeletal muscles obtained from human beings of all age groups.182 The levels of Cs137
per gramme of potassium were lowest in still-born and rose with age, reaching the highest values in adults.
104. Newly reported data on the biological half-life, characterizing the long-term retention of caesium in adults,183•188 fall in line with the information already reviewed in the 1964 report (table XII). The remarkably shorter average half-life in the inhabitants of some Scandinavian countries has been tentatively explained by elevated potassium intakes189 which may lead to faster turnover of both caesium and potassium in the body.
105. The distribution of Cs137 in human tissues was studied by Nay et al.100 who showed that concentrations in compact bone and bone marrow were lower by a factor of twenty than in skeletal muscle. This implies a dose rate from internal Cs137 to bone marrow, to osteocytes and to cells lining the marrow cavities. two to three times lower than to muscular tissue. Although the data are preliminary. refer only to compact bone and may reflect a non-steady-state situation, they suggest that the dose commitment to bone marrow and bone-lining cells due to internal Cs137 radiation may have been somewhat over-estimated in the 1964 report. However. the evidence is not conducing enough to
· warrant a re-evaluation of the dose-rate factors in estimating dose commitments. The changes \vould in any case have a trivial effect on the total dose commitment because of the relatively low contribution of internal Cs137 irradiation.
106. The frequency distribution of the Cs187 concentration in human tissues (muscles) was studied by Ellett and Browne111n and appeared to be non-normal with positive skewness. By fitting a particular form of gamma function to their data, the authors estimated that the probability that an individual might e..-..;:ceed the population average in a given locality by a factor of three was 1.5 X 10-s.
62
107. Static and dynamic distribution studies were conducted by Yamagata et al.192 on caesium in human blood. When the dietary Cs137 levels changed slowly with time, the concentrations in blood reflected the total body contents of Cs137• Whole blood samples collected from urban areas in the Far East and the Pacific region ~ave estimates of body burden ranging from 56 pCi/g K m Rangoon, Burma. to 110 pCijg K in Manila, the Philippines, in April 1966.193
Levels of caesium-137 in food
108. Concentrations of Cs137 in milk in the northern hemisphere (table XIII) in 1964 were essentially the same or only slightly higher than in 1963. In 1965, average values were-with only a few exceptionsmarkedly lower. Time trends are presented in figure 26. In the southern hemisphere, the 1964 yearly average le\iels rose over those observed in 1963 and remained unchanged in 1965. However, quarterly values in New Zealand and Australia (figure 26) showed a clear decrease in concentrations at the end of 1965.
109. Time trends in the total dietary content of Cs137 were basically similar to those for milk, but the dat~ are more limited, especially with regard to the 196:> levels (table XIV). There is, however, a wellestablished correlation between the Cs137 contents in beef and milk. the ratio of the concentrations
pCijkg meat pCijl milk
averaging ,.._, 4194-196 (figure 27). Since meat and milk together are the main dietary sources of Cs137. it is evident that trends in dietary contamination can be adequately inferred from the monitoring of milk alone.
llO. Cs137 levels of up to about 100 nCi/kg were measured in reindeer meat during the winter of 1964 and 1965. According to Liden,174 the proportionality factor of Cs137 in fresh lichen to that in fresh reindeer meat in northern Sweden averaged 4.9 : 0.4.
Levels of caesium-137 in man 111. Levels of Cs137 in man continued to increase
in the n.orthern hemisphere until mid- or late 1964, and declmed thereafter. In early 1966 the levels were reduced by about 30-40 per cent as compared to the peak values in 1964. As shown in table XV and figure 28, the ratio between the lowest (Japan) and the highest (France) values reported from the northern temperate zone was between 1 : 2 and 1 : 3 (with the exception of Norway where unusually high levels of rainfall and particular grazing conditions prevail).
112. In the southern hemisphere (southern Australia), the levels rose until late 1965 and appear to have been declining since. The highest levels reached in Australia were lower by about a factor of three when compared with the average 1964 peak levels in normal areas of the northern temperate zone (figure 28).
113. As already discussed in the 1964 report (owing to the factors mentioned in paragraph 111), the levels in Norway, in particular on tl1e western coast, were much higher than those usuallv encountered in these latitudes. •
114. The levels of Cs13 ~ in man also rose until 1965 in the majority of those areas where this nuclide follows the lichen-reindeer-man food chain. e.g. Finnish Lapland. Swedish Lapland and the far north of the USSR. Some decrease was. however. reported in Alaska. For reasons explained in par~oraph 100 it was ex-

pCi/litre
500
400
300
200
100
pCijkg
1,500
1,000
500
-..--. Australia
Canada
Denmark
11111 Sl New Zealand
Sweden
United Kingdom
United States
-·---·~ .. --- -·-· 1960 1961 1962 1963 1964 1965
Figure 26. Csl37 in milk (time trends). Quarterly average values from country-wide surveys, 1960-1965
1962 1963
x: the monthly average concentration of Csl37 in meat (beeO
o = calculatec meat octivity derived by multiplying the
concentrations of Cs 137 in milk in the preceding month by 4.3
On the ordinate - concentration of Cs 137 in pCijkg
0 n the abscissa - ea lender year
.. .· .... "·•«"
l'
1964 1965 1966
Figure 27. Relationship between concentrati.:m of Cs137 in beef and milk in Sweden, 1962-19663«
63
Year
pected113• iu that levels in man in those areas in 1966 would be the same as. or slightly lower than, in 1965. This is supported by the data for Finnish Lapps (table XV), which show a slight decrease in Cs137 body levels (by 5-10 per cent) from April 1965 to March and April 1966.
Quantitative relationships between deposition of caesium-137 and con~amination of milk
115. The relationships between fall-out rates and the cumulative total of Cs13i in soil. on the one hand. and the contamination of milk on the other, have been further studied in the United Kingdom160 and in Sweden.194 In the United Kingdom, it has been shown that levels of Cs137 in milk hitherto have depended predominantly on the current rate of deposition and on that observed in the last half of the previous year. Estimates based on tracer experiments indicate that the cumulative deposit in soil has not so far contributed more than about 1 per cent of the total Cs137 in milk. Thus, under conditions which have prevailed hitherto, absorption from the cumulative deposit can be ignored. In Sweden, it appears that the transfer of Cs13; to milk from the deposit in the current and previous years is about twice194 that estimated in the United Kingdom.160
Quantit.ative relationships between deposition of caesium-137 and Jmnia.n body burden
116. In the 1964 report, an empirical relationship between rates of deposition of fall-out and Cs13; in man was used in calculating dose commitments. The Cs13; /K ratio ( Q) in human beings was related to the current yearly fall-out and to the deposition over the preceding two years by a formula:
Q = PrFr + P2cF2c, where
Q = yearly average concentration of Cs137 in man in pCi Cs137/gK,
Fr =fall-out rate of Cs137 in a given 12-month period in mCi/km2,
F2• =total Cs137 accumulated over the previous two years in mCi/km2,
P, and P2c =proportionality factors.
117. The proportionality factors have been revised, using the sunTey results now available from Belgium, Germany. Sweden. the United Kingdom and the United States. The resulting values Pr= 2.5 and Pzc = 4.0 are larger than those used in the 1964 report ; this is due in part to inclusion of data from Sweden,194 where the factors are approximately twice as high as for the other countries. Since present evidence suggests that factors similar to those in ScandinaYia may affect only a small fraction of the world population the above value of the factors may well lead to an over-estimate of the world situation. No allowance has been made for the expected small contribution of the cumulative deposit of Cs137 in the soil. as its effect should be very slight in comparison with other sources of uncertainty.
foDIXE-131
118. P 31 was detected in rain and in the air in J apan197· 195 follo"·ing the atmospheric tests carried out
64
in central Asia in 1964 and 1965. Average levels of the psi detected in milk in J apan199· 200 between 18 October and 12 November 1964 were of the order of 100 pCi/Iitre and nearly the same during one week of May 1965. Only traces of psi were found in milk, at the end of 1964 in Canada151 and in the United Arab Republic,201 and at the end of .May and in early June 1965 in the United States102 and in Israel.26· z42 pai was also observed in human thyroids (0.02-1.3 pCijg fresh tissue) 202 and in urine2°3 in October and November l 964 in Ja pan.
OTHER NUCLIDE$
119. Fe55 has been detected in foodstuffs, in cattle and in human beings.16 '· 172 Fe55 is an emitter of low energy x rays due to electron capture. and at present levels of contamination the radiation dose from this nuclide to man is insignificant.
120. Na22 has been measured in rain, in grass and in foodstuffs. 168• 204• .::o:; This nuclide was also detected by means of whole body counting in Alaskan Eskimos.168 The sources of Na22 and Cs137 in human diet are similar. So far, the activities of the first nuclide do not exceed a few per cent of the latter.
121. Mn54 was detected in human food206• 207 but no observation was reported on its presence in human beings, except for possible traces detected in liver at post mortem.208 The radiation dose from both Na2!
and Mn54 may be neglected at present.
122. Three recent studies209-211 have confirmed that, as expected, the C14 specific activity of plant foodstuffs and milk follows with a slight delay that of tropospheric air. vVith the exception of adult cartilage, in which .the cu specific activity remained essentially unaltered since the pre-test period, the specific activity of human tissues follows the specific activity of air with a delay of the order of one to two years. Until 1964, individuals from the southern hemisphere showed little increase in C14 content as compared with the pretest levels (before 1952), consistent with the small rise of C14 specific activity in the air in that hemisphere. Results of C14 measurements in biological materials haYe been presented in table XVI and figure 29.
RADIO-NUCLIDES IN THE RESPIRATORY TRACT
123. Data subsequent to those reviewed in the 1964 report on the contamination of the human respiratory tract by fission products from nuclear tests have been published. Thus, Rundo and Newton212 reported levels of Zr9~ + Nb95 in the range 79-161 pCi in 1962 and 1963 in England, while Wrenn et al.213 reported values of 210-460 pCi in the respiratory system of people deceased in the United States in the first half of 1963. Assuming a homogeneous distribution of the nuclide, these levels would lead to an annual dose rate of a few millirads at a constant level of contamination. However, the levels of Zr9~ + ::\b95 in the air decreased in the period 1963-1965 by two orders of magnitude.
124. A study of the contamination of the human respiratory tract by Ce144 revealed214 average yearly lung burdens of 105, 160. 268 and 182 pCi of this nuclide in 1961, 1962, 1963 and 1964, respectively. The authors calculated the average annual dose rate to the whole lung tissue from Ce144 and all other fission products over the period of im·estigation to be 24 mrad/ year. with 10 per cent of the population e.xceeding the

Hl,000 9,000 o,ooo. 7,000, o,ooo 5',000
•.OOO
3,0:JO,
2,().!)0,
'·~ BOO, 700 600.
500
•00
~ 300
a 0\ ~ 2
Ul ii
100 9()
llO 70 60
30
2()
10
-• _ • _ • _ • Jopnn
----- Dfl11fl\Ork
----- F'~•al R~pvblh of Gerrnony IJnh.;d s,.,,~ '- (Clikogo)
Odgioff!
-·- .. - Unll.,d Shitt::. (N .. w M•·,o;ko tmd C:.;Ufon:lu)
..................... S•~dcr1
l)r,ilr-d Kingdom (B.,.rbhl1 ..-)
---- - A·i'..t~ uU•>
H1.w~y (Od(• 't'!itjdcinl•)
tforwtiy (B1ff9e11 rukJL,nl:i.)
- - - - - - Fi,,lond (Hf'l'..fqf,j\
Ni•' wuy (M;::;,,fiordttn rHid,..nt:.)
lb1 ~y (w1 ~r coo<jl {lf"eo)
or vul<Jr~ H:po1 tetl fw {YOUµ« ol fin"ts,h Lopp~
volvioa ntpoti•d fQr 0' oupa ul Afo&fwn E ~\m<H
Runge of vulw:. r•portod for dlffer•·,it ~·oup·. or SWt•dh:li Lopp~
Pclond (led') 9 Jopo ..
IO Ron91' of vol<>~r. r ... ind"""'' brred1·r~ Hw S.:,.,;,.., Unit'"
il'ldivid•1ol nol"fh cf
<D l
<D
.12,MO ~ 23,~0
r~f ' I I
' I I I I . I : 10 po I
®II I: @· l ® l I @·
© @'
I 0· I©
0· I ©· <D·
(D·
©
0 ©
<D·
I I I
..L
@·
I®
l
I0,000 9,000
r 1,000 tt.ooo 5,000
•.OOO
3,000
r 1,000 • '100
llOO 700 600
•• 500
400
300
100
100 •• 90
00 70 60
50
<O
r ~
-- IQ 1?66 ~~~~5, . ., ~~~
Fi911re 28. Cs1S7 levels in mrm during the period 1956 to early 1966 (shaded area indicates the yearly average values cakulated according lo the formula given in paragraphs 116-117, using average proportionality factors P,. and P •• of 2.5 and 4,0, respectively).

110
t\ I f ® ~ o)' ~ '
v .... •
100
90
i 00~ . .,, J>I '~
"""' ~o ~
j e 0 v
jvV v 0
© ;\
I ~
..
u 80 .s u >
.! 70 o L
.2 0 c. .. 60
/. ~ ~A
> 0
-& ::
50 0
~v ~ ~
~ ~ ~ ..
y? - -
/ -x c1"o2, SpitsberQOn A Human bloc.I, Trondheim
v cl"o2, Nord Kopp 0 Milk, Tronclh.U,, - o·cr"o2, Lindasn-e& @cereol•, Trondheim
~ 1 ;! 40 u 0 & .!! 30 ; ~
a.. 20
10
0 I I I I I I I . I I
J F M. A M J J A S 0 N D J F, M A M J J A S 0 1963 196-1
Figrire 29. Time trends in CH in Scandinavia, 1%3 and 1954210
value of 43 mrad/year. In view of the author's assumptions, the dose-rate estimate may be accepted as a possible upper limit.
125. The concentrations and the doses from Ce1~ in bronchial lymph nodes appear to be higher by one order of magnitude than those in the respiratory system as a whole.2 H The same proportionality has been ol:rtained for the concentrations, and therefore for the doses, from other nuclides that are retained in the respiratory tract and that show similar affinity for the lymphatic tissue (e.g. Pu~a9 ).
ill. Doses from external and internal contamination
!N"TRODUCTION
126. In this annex, most of the doses are expressed as dose commitments. For the purpose of this report. the dose commitment to a given tissue is defined as the integral over infinite time of the average dose rates delivered to the world's population as a result of a specific practice. e.g. a given series of nuclear explosions. The actual exposures may occur over many years after the e>..-plosions have taken place and may be received by individuals not yet born at the time of the explosions ( 1964 report. annex A. paragraph 147).
66
127. This concept has been used because it would permit the calculation of the total expected number of individuals eventually showing certain radiation effects as a result of any given test series, if the size of the population to which the dose commitment applied and the appropriate proportionality factors characterizing a linear dose-effect relationship with no threshold were valid and known. The number of affected individuals would then simply be the product of population size. proportionality factor and dose commitment. For further details regarding the general method of computation. see paragraphs 147-155 of annex A of the 1964 report.
128. To estimate dose commitments, the world-wide cumulative deposition of Sr9° uncorrected for decay is obtained from the annual deposition figures up to the end of 1965 given in table I and from the cumulative deposition before 1958 assumed to be 2 ~1Ci. The results from the United States and from the United Kingdom networks are weighted according to the number of sampling stations in each network and yield a total figure of 12 MCi. Estimates of future deposition are based on the stratospheric inventory of 0.8 MCi Sr90 as of January 1966 (table V) and a mean residence time of fourteen months. Taking into account. as in earlier reports of the Committee, the area of the earth

r I
between 80°N and 50°S (448 X 106 k:n2 ), in which over 97 per cent of the deposition takes place,65 gives an average expected deposit of
12·8 ~s 6 c·;1 ., 0.448= ~ . m i ,:m-.
This figure \vill be used for the purpose of estimating the Sr90 dose commitment. The figure differs slightly from that obtained in the 1964 report (31.7 mCi/ km2 ), as a consequence of a revision in the estim'.lte of the global inventory of Sr90•
129. Cs137 deposition is derived from the depcsition of Sr90 by means of a Cs137 /Sr90 ratio of 1.6. This ratio is representative of measurements carried out at various sites. as sho\vn in table II. The total integrated expected deposit of Cs137 is therefore 20.5 MCi. The expected deposit in each hemisphere is derived from this figure by using the ratio of the estimated cumulative deposits in either hemisphere as of January 1966 (table V). This gives integrated Cs137 deposits of 16.3 MCi in the northern hemisphere (0°-80°N) and 4.2 MCi in the southern hemisphere (0°-50°S), corresponding to 64.5 mCi/krn2 and 21.4 mCi/km2 • respecively.
ExTERNAL DOSE RATES
130. External dose rates from all deposited fission products may be determined by means of ionization chamber measurements, by converting to dose rates directly from results of gamma-ray spectroscopy obtained in the field. or by calculating the rates from radio-activity measurements in soil cores.18, 346, 349-364
Reasonable agreement is found when results obtained by these different methods are compared.
131. Figure 30 shows the external gamma air dose as measured outdoors 1 m above ground at Grove. Berkshire, United Kingdom346 and Chiba, Japan.31
These doses are obtained by subtracting a constant natural background from the measured dose rates. Thus, the net fall-out dose rates include an error due to fluctuations in background. Such fluctuations may be considerable, particularly where snow cover reduces the radiation from the ground during the winter. This is illustrated by figure 31, which shows the total external exposure rate in central Sweden during the years 1962-1965. 348
132. At Argonne. Illinois, United States, the fall-out doses have been calculated from gamma spectrometric analyses of soil cores.23• 74• 353 In 1963. the dose rate from fall-out was as high as 30 per cent of the e.xternal natural radiation.351• 353• 356 Its contribution decreased in 1964, owing to the decay of Zr95 , Ce144 and Ru106•
Dose rates during 1965, due mainly to deposited Cs137 •
were somewhat lower than the 1964 levels.
133. Beck364 comparing actual field measurements of dose rates to calculations based on deposition data at Westwood, New Jersey, United States, concluded that the best agreement with regard to Cs13T was obtained by assuming an exponential decrease of activity with depth having a 3 cm relaxation length. Measured soil profiles always reveal some penetration of deposited fall-out depending on the type of soil. on climatic conditions and on the fall-out history.365-369 This exponential distribution in soil would imply a gamma-ray
67
dose-~onversio1! facto~ o~ 0.034 mr~d/year per mCi/km2
deposited Cs13'. A similar study m Japan gave 0.050
mrad/year per mCi/km2•370 For calculation. a i:alue of
0.040 mrad/year per mCi/km2 will be used in this report.
134. A higher dose-conversion factor (0.12 mrad/ year per mCi/km2
) was used in the 1962 and 1964 reports. Su_ch a value was obtained on the assumption that Cs13
' \Vas deposited on an infinite plane. In estimating dose commitments. the effect of this hiaher dose-
• • b
conversion tactor was offset by assuminO' that Cs137
disappeared from the ground w1th an effective mean life of fourteen years, whereas calculations based on the e,"(ponential distribution assume disappearance by radio-active decay alone (mean life forty-three years). These two approaches, therefore, lead to about the same numerical estimate of the external dose commitment from Cs137
, but that discussed in the previous paragraph is probably more realistic at present and is followed here.
135. From the expected integrated deposits per unit area in each hemisphere as given in paragraph 129. a dose-rate factor of 0.04 mrad/year per mCi Csl37 /km2, a physical mean life of forty-three years. and geographical factors 1.2, and 1.0 (1964 report, annex A. paragraphs 147-155) the external dose commitments from Cs137 in the northern and southern hemisphere are 133 and 36.8 mrads. respectively. Weighting these figures by the relative size of the populations involved (91 per cent in the northern hemisphere) gives a world-wide external dose commitment of 124 mrads. By applying the same combined reduction factor of 0.2 that was used in previous reports to allow for shielding by buildings and screening by body tissues, a final estimate of the external dose commitment from Cs137 of 25 mrads is obtained, as compared to 29 mrads estimated in the 1964 report.
136. In the case of short-lived radio-nuclides such as Zr95, Ru106 and Ce144, accounting for the roughness of the ground would involve reducing by a factor of about two the dose rate estimated from deposition figures on the assumption that the nuclides constitute an infinite plane source.371 The factor of about three suggested for Cs137 for the reduction in dose rate over a long period of time would be too high for short-lived radionuclides, since these may decay before substantial redistribution to deeper layers of soil can occur.
137. In the 1962 report. dose commitments due to short-lived nuclides were estimated from actual measurements of external doses after deduction of an estimated contribution of Cs137• The same approach was followed in 1964, except for that fraction of the dose commitment from short-lived nuclides that had not yet been delivered and which was estimated from deposition figures. The correction factor discussed in the previous paragraph can be applied to this fraction which amounts. therefore. to 5 instead of 10 mrads. On the other hand, the measured values of external dose rates from short-lived nuclides must now be somewhat increased in the light of the new estimates of Cs131 deposition. thus leading to values of 109 instead of 92 mrads. Adding the 5 mrads estimated above gives a total dose commitment of 114 mrads instead of 104 as obtained in the 1964 report. Applying the combined conection factor for shielding and screening (0.2) leads to an estimated dose commitment from short-lived radioactive nuclides of 23 mrads that has now been essentially delivered in full.
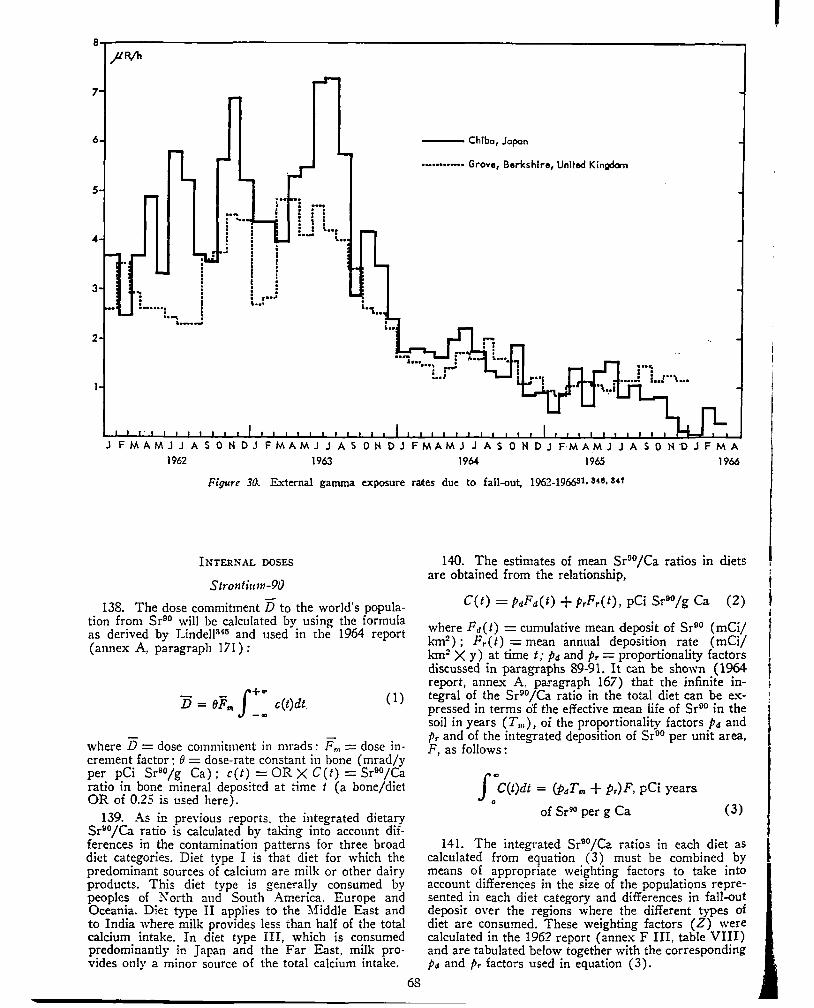
7
6
s
4
3
2
J'R/h
. . . . . . . .. . : ! ·······=·~ 1 ··-·.-
.... j ~- l
I !
r !
! , .. .: .....
--- Chiba, Japan
........ _. Grove, Berkshire, United Kingdom
. . . ... : i i ... ! . .J "··· t ••
i..'t ••
J FM AM J J A S 0 N DJ FM AM J J A S 0 N DJ FM AM J J A S 0 H DJ F·M AM J J A S O H ·o J F M A
1962 1963 1964 1965 1966
Figure 3(). External gamma cxJlOSure raites· due to fall-out, 1962-196631, 340, UT
INTERNAL DOSES
Strontimn-90
138. The dose commitment D to the world's population from Sr90 will be calculated by using the formula as derived by Lindell345 and used in the 1964 report (annex A, paragraph 171):
f+ ...
D = OF,,. _,. c(t)dt (1)
where D =dose commitment in rnrads: F,,, =dose increment factor: fJ = dose-rate constant in bone ( mrad/y per pCi Sr90/g Ca); c(t) =OR X C(t) = Sr90/Ca ratio in bone mineral deposited at time t (a bone/diet OR of 0.25 is used here).
139. As in previous reports, the integrated dietary Sr90/Ca ratio is calculated by taking into account differences in the contamination patterns for three broad diet categories. Diet type I is that diet for which the predominant sources of calcium are milk or other dairy products. This diet type is generally consumed by peoples of North and South lunerica. Europe and Oceania. Diet type II applies to the Middle East and to India where milk provides less than half of the total calcium intake. In diet type III, which is consumed predominantly in Japan and the Far East, milk provides only a minor source of the total calcium intake.
68
140. The estimates of mean Sr90/Ca ratios in diets are obtained from the relationship,
C(t) = PaFd(t) + PrFr(t), pCi Sr90/g Ca (2)
where Fa(t) =cumulative mean deposit of Sr90 (mCi/ h.'1112 ); Fr(t) =mean annual deposition rate (mCi/ km2 X y) at time t; pd and Pr = proportionality factors discussed in paragraphs 89-91. It can be shown ( 1964 report, annex A. paragraph 167) that the infinite integral of the Sr90/Ca ratio in the total diet can be expressed in terms of the effective mean life of Sr00 in the soil in years (Trn), of the proportionality factors pd and Pr and of the integrated deposition of Sr90 per unit area, F, as follows:
J"'c(t)dt = (pdT,,. + p,)F, pCi years 0
of Sr90 per g Ca (3)
141. The integrated Sr90/Ca ratios in each diet as calculated from equation ( 3) must be combined by means of appropriate weighting factors to take into account differences in the size of the populations represented in each diet category and differences in fall-out deposit over the regions where the different types of diet are consumed. These weighting factors (Z) were calculated in the 1962 report (annex F III, table VIII) and are tabulated below together with the corresponding pd and Pr factors used in equation ( 3).
I I I
l
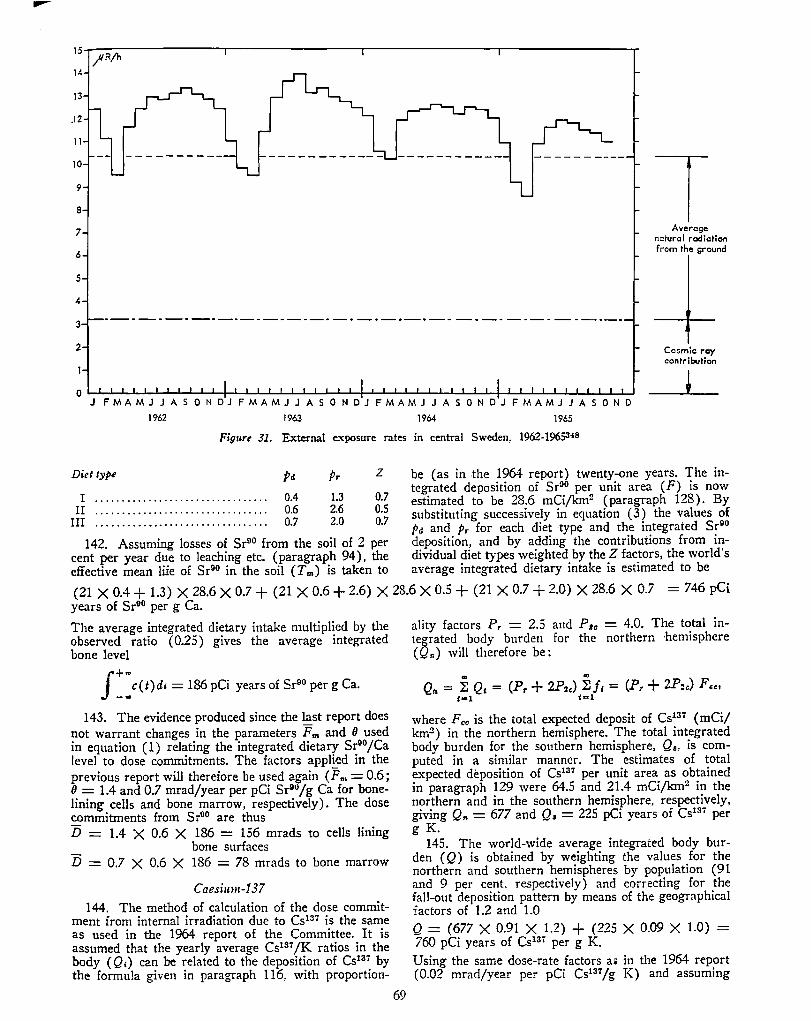
14
13
.12
11
10
9
8
7
6
5
4
1 Average
netural radiation from the ground
3 ------------------- -- ---·-·-- -· -- -·-· ---·-·
2 Cosmic: ray contribution
0 '":"""":"':'"~'--1..~"'-:-'"_._~-r-'-L-L-L-J........!....J.....J.....L-L-L--J--l....l.....l......iL...L....L...Ll....L..L.L.+....L...L.J....L..L.L...L-1-.Ll...J....J JFMAMJJASONDJFMAMJJASONDJFMAMJJASONDJFMAMJJASOND
1962 1963 1964 1965
Figure 31. External exposure rates in central Sweden, 1962-1965348
Diet type
I ................................ . II ................................ .
III ................................ .
0.4 0.6 0.7
Pr 1.3 2.6 2.0
z 0.7 0.5 0.7
be (as in the 1964 report) twenty-one years. The integrated deposition of Sr90 per unit area (F) is now estimated to be 28.6 mCi/km2 (paragraph 128). By substituting successively in equation ( 3) the values of Pd and Pr for each diet type and the integrated Sr00
142. Assuming losses of Sr90 from the soil of 2 per deposition, and by adding the contributions from in-cent per year due to leaching etc. (paragraph 94), the dividual diet types weighted by the Z factors, the world's effective mean life of Sr90 in the soil (Tm) is taken to average integrated dietary intake is estimated to be
(21 x 0.4 + 1.3) x 28.6 x 0.7 + (21 x 0.6 + 2.6) x 28.6 x 0.5 + (21 x 0.7 + 2.0) x 28.6 x 0.7 = 746 pCi years of Sr90 per g Ca.
The average integrated dietary intake multiplied by the observed ratio (0.25) gives the average integrated bone level
J::c(t)dt = 186 pCi years of Sr90 per g Ca.
143. The evidence produced since the last report does not warrant changes in the parameters F m and () used in equation ( 1) relating the integrated dietary Sr90 /Ca level to dose commitments. The factors applied in the previous report will therefore be used again ( F ni = 0.6; 8 = 1.4 and 0.7 mrad/year per pCi Sr9°/g Ca for bonelining cells and bone marrow, respectively). The dose commitments from Sr00 are thus D = 1.4 X 0.6 X 186 = 156 mrads to cells lining
bone surfaces D = 0.7 X 0.6 X 186 = 78 mrads to bone marrow
Caesium-137
144. The method of calculation of the dose commitment from internal irradiation due to Cs137 is the same as used in the 1964 report of the Committee. It is assumed that the yearly average Cs137/K ratios in the body ( Q;) can be related to the deposition of Cs137 by the formula given in paragraph 116, with proportion-
69
ality factors Pr = 2.5 and P1a = 4.0. The total integrated body burden for the northern hemisphere ( Q n) will therefore be :
where Fca is the total expected deposit of Cs137 (mCi/ km2 ) in the northern hemisphere. The total integrated body burden for the southern hemisphere, Qs, is computed in a similar manner. The estimates of total expected deposition of Cs137 per unit area as obtained in paragraph 129 were 64.5 and 21.4 mCijkm2 in the northern and in the southern hemisphere, respectively, giving Q,. = 677 and Q, = 225 pCi years of Cs137 per g K.
145. The world-wide average integrated body burden ( Q) is obtained by weighting the values for the northern and southern hemispheres by population (91 and 9 per cent. respectively) and correcting for the fall-out deposition pattern by means of the geographical factors of 1.2 and 1.0 Q = (677 X 0.91 X 1.2) + (225 X 0.09 X LO) = 760 pCi years of Cs137 per g K.
Using the same dose-rate factors a• in the 1964 report (0.02 mrad/year per pCi Cs137 /g K) and assuming
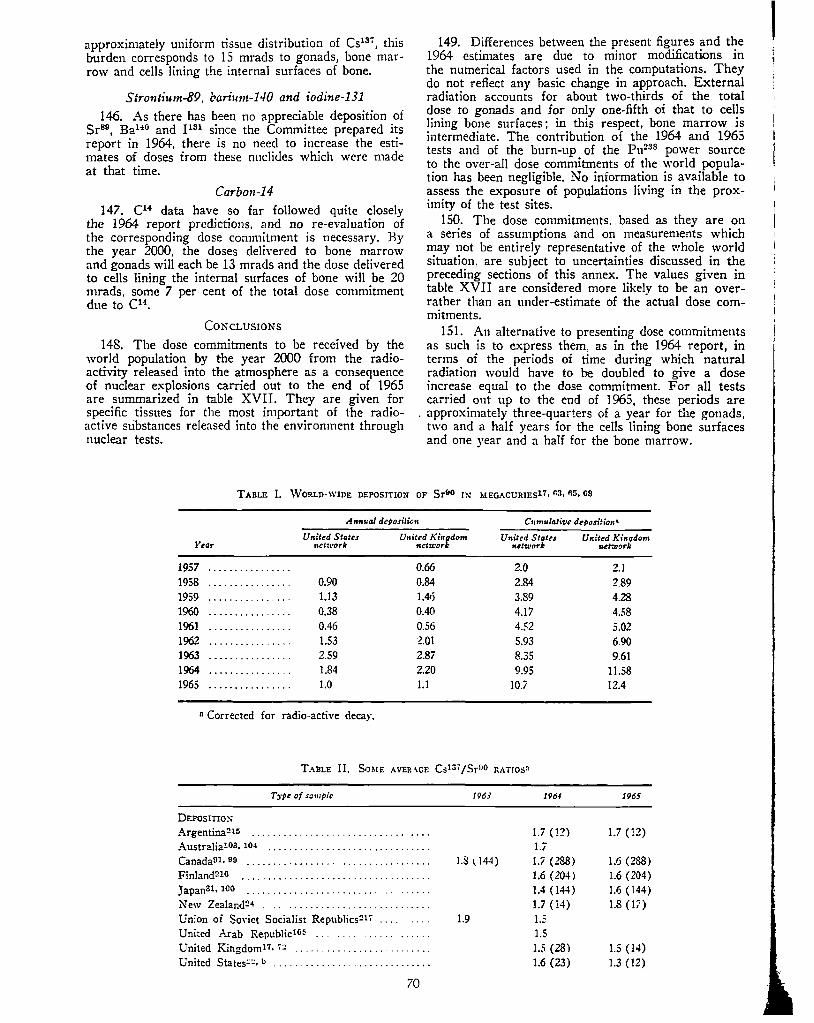
approximately uniform tissue distribution of Cs137, this
burden corresponds to 15 mrads to gonads, bone marrow and cells lining the internal surfaces of bone.
Strontiinn-89. bari11111-l40 and iodine-131
146. As there has been no appreciable deposition of Sr89, Ba140 and !131 since the Committee prepared its report in 1964, there is no need to increase the estimates of doses from these nuclides which were made at that time.
Carbon-14
147. C14 data have so far followed quite closely the 1964 report predictions, and no re-evaluation of the corresponding dose commitment is necessary. By the year 2000, the doses deJiyered to bone marrow and gonads will each be 13 mrads and the dose delivered to cells lining the internal surfaces of bone will be 20 mrads, some 7 per cent of the total dose commitment due to C14•
CONCLUSIONS
148. The dose commitments to be received by the world population by the year 2000 from the radioactivity released into the atmosphere as a consequence of nuclear explosions carried out to the end of 1965 are summarized in table XVI!. They are given for specific tissues for the most important of the radioactive substances released into the environment through nuclear tests.
149. Differences between the present figures and the 1964 estimates are due to minor modifications in the numerical factors used in the computations. They do not reflect any basic change in approach. Ex-ternal radiation accounts for about two-thirds of the total close to gonads and for only one-fifth of that to cells lining bone surfaces; in this respect, bone marrow is intermediate. The contribution of the 1964 and 1965 tests and of the burn-up of the Pu238 power source to the over-all dose commitments of the world population has been negligible. No information is available to assess the exposure of populations living in the proximity of the test sites.
150. The dose commitments, based as they are on a series of assumptions and on measurements which may not be entirely representative of the whole world situation, are subject to uncertainties discussed in the preceding sections of this annex. The values given in table XVI! are considered more likely to be an overrather than an under-estimate of the actual dose commitments.
151. An alternative to presenting dose commitments as such is to express them. as in the 1964 report, in terms of the periods of time during which natural radiation would have to be doubled to give a dose increase equal to the dose commi-tment. For all tests carried out up to the end of 1965, these periods are
. approximately three-quarters of a year for the gonads, two and a half years for the cells lining bone surfaces and one year and a half for the bone marrow.
TABLE I. '\TORLD-WlDE DEPOSITION OF SrllO JN MEGACURIEsl7. 113, 115, GS
Amrnal deposilion CHmulotive deposition•
Year
1957 1958 1959 1960 1961 1962 1963 1964 1965
United States netu1ork
0.90 1.13 0.38 0.46 1.53 2.59 1.84 1.0
n Corrected for radio-active decay.
0.66 0.84 1.46 0.40 0.56 -Z.01 2.87 2.20 1.1
United States network
2.0 2.84 3.89 4.17 4.52 5.93 8.35 9.95
10.7
TABLE II. SOME AVERe\GE (;IS'i'/Sr!lO RATros•
T;ype of sample 1963 1964
DEFOSITIOX
Argentina!!l5 ............................. . 1.7 (!2)
Australial03, 104 .••........•.............. 1.i Canada91, 99 . . . . . . . . . . . . . . . . . . .......... . LS ( 144) 1.7 (288) Finland216 ........................... . 1.6 (204) J apan31, ioo . . . . . . . . . . . . . . . . . . . . . . . . . . . . . ..... 1.4 (144) New Zealand!!4 . . . . . .................... . 1.7 (i4) Union oi SoYiet Socialist Republics!!t7 . . . . 1.9 1.5 United Arab Republicllio . 1.5 United Kingdoml7, •~ .................... . 1.5 (28) United States~~. b ........••....•• 1.6 (23)
70
United Kinqdom network
2.1 2.89 4.28 4.58 5.02 6.90 9.61
11.58 12.4
1965
1.7 ( 12)
1.6 (288) 1.6 (204) 1.6 (144) 1.8 ( 17)
1.5 (14) 1.3 ( 12)
I

TABLE II. So~E ."-VERAGE CsI31 /SrOO RAnosa (co11tinued)
TJ•Pe of sample
SURFACE AIR linion of Soviet Socialist Hepublics2l 7
United KingdomI•, 72 Chilton, Berkshire United State:; network59, 62, 66, 21s. 219
Northern hemisphere ....... , ................ . Southern hemisphere . . . . . . . . . . .......... .
STRATOSPHERE Northern hemisphere (15-21 krn)59, 60, 62, ns .. . Southern hemisphere ( 15-21 km) . . . . . . ....... . Northern hemisphere (22-34 km)49, 62, 21s, ~20 .. 64' S (22-34 km) . . . . . . . . . . . . . . . . . . . . . . . .. · ..
1963
1.4 1.7 l 12)
1.3 (98) 1.5 (78)
1.7 (38) 1.5 (11) 1.5 ( 48) 1.5 (35)
1964
1.4 1.7 ( 12)
1.4 ( 107) 1.4 (83)
1.6 ( 14) 1.5 (8) 1.5 ( 47) 1.4 ( 37)
a Figures in parentheses indicate the number oi samples. b Based on New York City, New York and Weshvood, New Jersey data only.
1965
1.7 (6)
1.4 (75) 1.4 ( 40)
1.4 (8) 1.3 ( 4) 1.5 (50) 1.4 (23)
TABLE III. Sr90 IN SURFACE WATERS OF THE WORLD'S OCEANS AND SEAS, 1960-1961
(Based on reference 125)
Average concffltra#ons (pCi/litrt)
Number of samples
A~·eragc concentrations (pCi/litrc)
South China Sea ......... . Sea of Japan ............. . Sulu Sea ................. . Pacific Ocean
N orthem hemisphere ..... . Southern hemisphere ..... .
Black Sea ................. .
0.26 020 0.20
0.23 0.08 0.26
2
2
42 24 41
Baltic Sea ................ .
Red Sea .................. .
Indian Ocean ............. .
Atlantic Ocean Northern hemisphere Southern hemisphere
TABLE IV. Sr90 IN NORTH ATLANTIC SURFACE WATER, 1960-1965
Sampling year Avcraoe val11e
(PCi/litrc) Range
(pCi/litrc} Nrwrbcr of
samplts
1960-1961 ················ ..... 0.07 0.03-0.14 81 1962 ... ················ ...... 0.10 0.05-0.15 6 1963 ............. ······ ....... 0.15 0.06-0.30 27 1964 .......................... 0.18 0.09-0.26 19 1965 (January-June) .......... 0.14 0.07-0.19 20
TABLE V. GLOBAL INVEXTORY OF Sr90 (IN MEGACURIES)61, 62, 65, 86
May May A~ril January September lanuar)' 1960 1961 1962 1961 1961 1964
STRATOSPIIERE Northern hemisphere .. 0.50 0.34 2.1 6.2 4.1 3.1 Southern hemisphere .. 0.44 0.38 0.7 0.8 1.0 0.9
TOTAL stratosphere 0.94 0.72 2.8 7.0 5.1 4.0
TROPOSPHERE Northern hemisphere .. 0.05 0.04 0.03 0.24 0.19 0.24 Southern hemisphere .. 0.01 0.01 0.02 0.03 0.03 0.02
ToT.-1.L tropcsphere 0.06 0.05 0.05 0.27 0.22 0.26
CUMUl.ATITE WORLD-\VIDE DEPOSITIONa, b, c Northern hemisphere .. 3.13 3.25 3.85 4.57 6.39 6.74 Southern hemisphere .. 0.92 1.04 1.23 1.36 1.54 1.61
TOTAL deposition 4.05 4.29 5.08 5.93 7.93 8.35
TOTAL ACCOUNTED FOR 5.05 5.06 7.93 13.20 13.25 12.61
n Based on conti11ental sampling. b Corrected for decay. •Does not include local fall-out, estimated as 2.6 MCi in 1960.61
71
0.30
0.11
0.11
0.07 0.01
R•f<rcnces
lr -~ 113, 118 112. 115 115 115
]an nary 1965
1.10 0.54
1.6--l
0.08 0.04
0.12
8.01 1.94
9.95
11.71
Number of samples
5
3
38
81 24
Jan11at'J' 1966
( esti"'4ted)
0.45 0.35
0.80
0.06 0.04
0.10
8.48 2.20
10.68
11.58

TABLE VI. GLOBAL EXCESS C14 IN\'ENTORYG:?, 64
(1()21 atoms)
July 1963 Jan11ary 1964 July 1964 J an11ary 1965 July 1965
STRATOSPHERE Northern hemisphere ........... 24.2 20.3 13.4 10.2 8.8 Southern hemisphere ........... 5.9 5.3 5.8 5.4 5.5
TROPOSPHERE ..................... 25.3 27.1 29.9 25.9 28.1
OCEANIC UPTAKE Assuming 20 per cent of tropo-
spheric content per year 13.5 17.ll 18.9 21.7 24.4
Assuming 25 per cent of tropo-spheric content per year 16.0 19.3 24.9 26.4 29.8
TOTAL 68.9-71.4 69.7-72.0 68.0-72.0 63.2-67.9 66.8-72.2
TABLE VII. RATIOS BETWEEN CONCENTRATIONS OF Sr90 (Sr90/Ca) IN TEETH AND IN THE SKELETON (WHOLE SKELETON AVERAGES) IN HUMANS OF DIFFERENT AGE IN 1962 AND 1964146
1962 1964
Year 5.13 years
0.60 0.47
Age group
> 30 years&
0.34h 0.30
n Values above thirty years were found to be independent of age. b The values estimated for seven urban areas of the USSR vary between 0.33 ancl 0.37.
They are based on 124 bo_ne samples and 2,390 teeth samples pooled in fifty-four analyses.
TABLE VIII. Sr&o TO CALCIUM RATIO IN MILK
The values are given iii pCi/g Ca and repi·tsent ,•early aiieroges 1111/ess othei-..oise indicated
Type of study A- Systematic widespread survey
Region, area or country
Narth America
Canada ....................... .
United States
conterminous ................ . Alaska ................ · .. · · · Chicago, Ill. ................. . New York City, N.Y ........ . San Francisco, Cal •...........
Europe
Austria ....................... . Belgium ....................... . Czechoslovakia ................ . Denmark ..................... . Faroes ........................ . Federal Republic of Germany Finland ..... France ........................ . Iceland .. Ireland .... !\orway .. Switzerland .. . USSR ........................ . United Kingdom
Latilllde
40-55°N
25-48°N -62°N -40°N -40°N -40'N
47-49°N -so0 N 48-51 GN 5~0°N
60-70°N 43-55°N 60-67'~
42-50°N 66-7.3°N 50-55°N 58-70°N 46-4-i'N 32-70°N 50-60°N
B - Systematic local survey C- Irregular sampling
1963 1964
NORTHERN HEMISPHERE
288
19h 17 14 26 10
25-12d zoe 2Ic 24!,::
131 28! 221: 27" 8oa 41 3ga 55'1 30n 261:
72
310.
19b 13 16 23 9
27 2oc 24r, i:
154 zst 231: 35 6511
43 soa 55a .)Jn 2~
1965
z3a
14b 14 13 19 9
1sc 17r, i:
115 21r 1~
29 8oa
4Qa
191:
Type uf study
A
A B c B c
A A B A A A A A A A A A A A
I anuary 1966 (utimated)
8.5 5.0
28.5
27.2
33.3 69.2-75.3
Rqercnces
151
221 221 222,223 222,223 222, 223
153 224,225 226 206,207,227 ?27-229 230 231 232-234 235 1 i:;-~:i
69,236 237,238 239 155,240

TABLE VIII. SrOO TO CALCIUU RATIO IX MILK (co11tin11ed)
The •values are givc11 in pCi/g Ca and represmt :yearly averages 1mless otlterm'se indicated
Type of st11dy A - Systematic widespread survey B - Systematic local survey C - Irregular sampling
Region, area. or co:in:-ry Latitude 1963 1964 1965 Type of rt•dy
Near East Israel ...... ············--······ -32'N 9 3.3 c
Asia India ............................. 8-35'N !()a sa 6& A
Far East Japan ......... ·············· ... 30-SO'N 15 15 13 A
Middle America and Caribbea11
Jamaica ·······················. -13'N 161 13k B Panama ........................ -7'N 6k B United States
Puerto Rico ······ ............ 18°N 12 10 8 B Venezuela ...................... 5-12'N 4 6m 4k B
Africa United Arab Republic ............ 20-30'N !61 171 A
Oceania United States
Hawaii ...................... 21°N 8 10 7 B
SOUTHERN HEMISPHERE Oceania
Australia ··············-······. 10-40'S 6& 8.9'1 9.2a A
References
241,242
243
244-248
221 221
221 221
201
221
103, 249 New Zealand ··················· 35-47'5 711 1111 12& A 87, 98, 250, 251
South America Argentina (littoral area) 35-ss=s 3.7 6.2 6.5 B 215, 252
a Unweighted mean for all stations. h January-August, unweighted mean for seven collecting b Country-wide mean weighted by population. stations. c Dried milk from sevei:'!l factories, unweig:hted mean. 1 Cairo area only, d Range of average values reported for three zones of different
rainfall, covering the country. j Average for Delta region and Upper Egypt. k January-August.
e Ann_ual average for three farms and three dairies, I April-December. t Dried milk country-wide mean weighted by production. i: Fresh milk country-wide mean weighted by production.
m January-November. 0 Means for the European and Asian parts of the USSR
TABLE IX. SrllO AND CALCIUM I)( TOTAL DIET AND ITS COMPONE:\'15
Calcium in grammes per day in parentheses: SrOO ill pCi pl!'1' day; SrDO/Ca ratio fo total diet in pCi/g Ca iii colum11 10 (all vallles have bee11 roimded out to two si_qnifica1it fim1res)
Region, area or C()11.ntry
N orlh America Greenland .................. .
Types of study: A- Survey of individual foodstuffs B-Total diet analyses
Latitude
>60°N
Ytar
C - Widespread regular sampling D - Local regular sampling E - Irregular sampling
Milk Fr11its and milk and leafy Root products Cereals vtgtlables :>egetablts
NORTHER." HEMISPHERE
1963 1964 1965
7.5 7.8
23 69
0.9 0.7
0.4 0.4
United States . . . . . . . . . . . . . . . 25-62°N Alaska (institutional diet
sampling) .............. . 1963 1964 1965
73
Miscel· lanetniS
8.0 8.0
Total Type of di.tin Refer· st11dy pCi/g Ca ences
AC AC
BD BD BD
26 56
24 37 21•
253 254
221 221 221
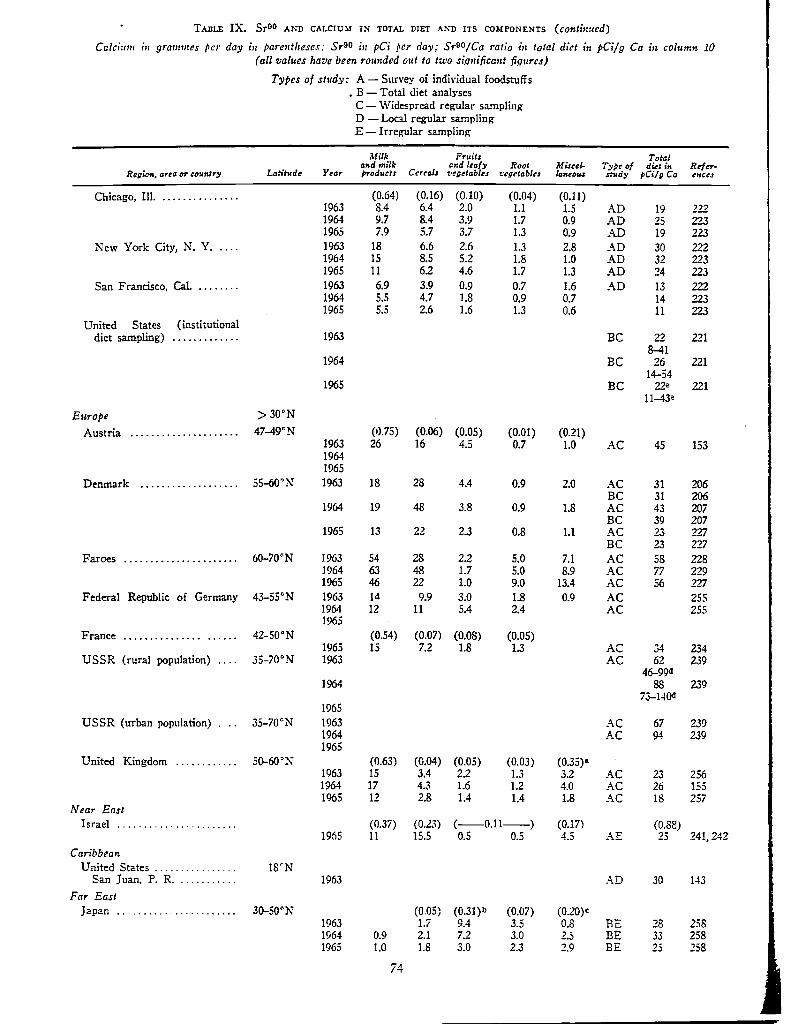
TABLE IX. Sr90 A?-."1> CALCIU:ll IN TOTAL DIET AND ITS COMPONENTS (continued)
Calci11m in grammes pcr day fo parentheses; Sr90 ill pCi pe1· day; S1·90/Ca ratio ill total dfrt in pCi/g Ca iii column 10 (all values have been rounded out to two si_qni/ica11t fi_q11res)
Types of study: A - Survey of individual foodstuffs • B -Total diet analyses
C - Widespread regular sampling D - Local regular sampling E - Irregular sampling
Milk Fruits Total and milk and leafy Root Miscel- T;ype of diet;,. Refer·
Region, area or counlry Latitude Year /'roducts Certols vegetables t·egetablcs lane mu study pCi/g Ca encc.s
Chicago, Ill. . ...........•.. (0.64) (0.16) (0.10) (0.04) (0.11) 1963 8.4 6.4 2.0 1.1 1.5 AD 19 222 1964 9.7 8.4 3.9 1.7 0.9 AD r -:l 2"23 1965 7.9 5.7 3.7 1.3 0.9 AD 19 223
New York City, N. Y. 1963 18 6.6 2.6 1.3 2.8 AD 30 222 1964 15 8.5 5.2 1.8 1.0 AD 32 223 1965 11 6.2 4.6 1.7 1.3 AD 24 223
San Francisco, Cal ........ 1963 6.9 3.9 0.9 0.7 1.6 AD 13 222 1964 5.5 4.7 1.8 0.9 0.7 14 223 1965 5.5 2.6 1.6 1.3 0.6 11 223
United States (institutional diet sampling) ············· 1963 BC 22 221
8-41 1964 BC 26 221
14-54 1965 BC z2e 221
ll-43e
Ettrope >30°N
Austria ..................... 47-49°N (0.75) (0.06) (0.05) (0.01) (0.21) 1963 26 16 4.5 0.7 1.0 AC 45 153 1964 1965
Denmark ··················· 55-60°N' 1963 18 28 4.4 0.9 2.0 AC 31 206 BC 31 206
1964 19 48 3.8 0.9 1.8 AC 43 207 BC 39 207
1965 13 22 2.3 0.8 1.1 AC 23 2Z'l BC 23 227
Faroes ···-·················· 60-70"N 1963 54 28 2.2 5.0 7.1 AC 58 228 1964 63 48 1.7 5.0 8.9 AC 77 229 1965 46 22 1.0 9.0 13.4 AC 56 2Z'l
Federal Republic of Germany 43-55.N 1963 14 9.9 3.0 1.8 0.9 AC 255 1964 12 11 5.4 2.4 AC 255 1965
France ............... ...... 42-50°N (0.54) (0.07) (0.08) (0.05) 1965 15 7.2 1.8 1.3 AC .J4 234
USSR (rural population) .... 35-70°N 1963 AC 62 239 46-994
1964 88 239 73-14Qa
1965 USSR (urban population) 35-70°N 1963 AC 67 239
1964 AC 94 239 1965
United Kingdom ............ 50-60°N (0.63) (0.04) (0.05) (0.03) (0.35) 8
1963 15 3.4 2.2 1.3 3.2 AC 23 256 1964 17 4.3 1.6 1.2 4.0 AC 26 155 1965 12 2.8 1.4 1.4 1.8 AC 18 257
Near East Israel . ····· ................. (0.37) (0.23) (--0.11--) (0.17) (0.8E)
1965 11 15.5 0.5 0.5 4.5 AE r _:J 241,242
Caribbea11 United States ...... .......... 18°N
San Juan, P. R. ........... 1963 AD 30 143
Far East Japan ........... ············ 30-50°N (0.05) (0.31 )b (0.07) (020)<
1963 1.7 9.4 3.5 0.8 BE 28 258 1964 0.9 2.1 7.2 3.0 ' --·:J BE 33 258 1965 1.0 1.8 3.0 2.3 2.9 BE ,-
-:l 258
74

TABLE IX. Sr90 AND CALC!Ul! IN TOTAL DIET AND ITS COMPONENTS (continued)
Calcium in grammes per day ill parentheses; Sr90 in pCi P•r day; Sr90/Ca ratio in total diet i11 pCi/g Ca iii column 10 (all values have bem roiinded out to two significa11t figures)
Region1 area or country
Ocea11ia United States
Hawaii (institutional diet sampling) .............. .
Oce1tt1ia Australia ··········· ........
South America
T·:;,ipes of st11dy: A-Survey of individual foodstuffs B - Total diet analyses
Latit:ide
21°N
10-40°S
Ye"'
1963 1964 1965
C - Widespread regular sampling D - Local regular sampling E - Irregular sampling
Milk Fr11its and milk and leaf;• Root 1>roducts Cereals rJegetables vtgetables
SOUTHERN EEMISPHERE
(0.64) (0.05) (0.07) (0.01) 1963 3.9 0.5 0.5 0.1 1964 1965
Argentina (littoral area) .... - 35-55°s 1963 (0.45) (0.02) (0.11) (0.02) 1.7 0.5 1.2 0.4
1964 (0.4) (0.07) (0.09) (0.09) 2.3 2.1 0.9 0.8
1965 2.8 2.1 0.6 02
Total Miscel· T11>• of diet in Refer-laneous study pCi/g Ca ences
(0.05) -o.3
(0.06) 0.5
(0.05) 0.4 0.4
BD BD BD
AC
AD
AD AD
o.4 9.0
6.5
92 8.7
221 221 221
249 103
252
215 215
a Including creta /mupar_ata. 4 Range of average values reported for sixteen republics b Including seaweeds. the USSR c Including fish and shellfish, dairy products, eggs and meat. e First half of the year 1965.
i5
of

TABLE x. SrDO IN HUMAN DONE
pCi SrD0 per gramme of calci11111• (Numhcr of samples in parentheses)
New-born and/ lJonc type Averooc
H~oim1, country or arra > IP ycal's studied Sr/Ca ratio for Reftr-
l'tar or still·born 1 0-I yrar• 1. year 2 )'ears J years 4 years 5·19 years (adults) adult sktltton• ence.1
NORTHERN IIUHSl'llERE
Nortlr //111crica (30-60°N)
Ca11;ula ................. , ........ 1963 2.3 6.0 5.4 4.8 3.4 3.1 2.6 1.7 v 1.0 2S9 (15) (40) ( 12) (9) (5) (9) (48) (34)
1964 4.3 8.4 9.5 5.8 3.8 3.1 v 1.8 260 (35) (46) (27) (47) (94) (59)
1965
U11itcd States
Cl1icago, Ill. ......... ' ......... 1963 3.5 3.7 2.8 2.4 1.1 v 0.65 261 (2) (2) (3) (2) (12)
1964 2.0 3.1 1.4 v 0.85 223,262 (1) (5) (43)
1965 1.3 v 0.76 263 (16)
New York City, N. Y ... ...... 1963 6.8 6.9 3.7 2.8 2.2 2.1 L6 v 0.94 261 (10) (2) (6) (3) (1) (26) (23)
'-t 1964 6.9 7.9 4.9 6.0 3.2 4.4 3.2 2.0 v 1.2 223,262
°' (.1) (7) (4) (4) (3) (2) (30) (28) 1965 2.8 5.0 7.0 7.2 6.7 4.1 3.5 2.1 v 1.2 263
(6) (5) (3) (2) (6) (2) (39) (16)
San Francisco, Cal. . _ ...... _ . _ . 1963 2.1 2.7 1.7 1.1 1.7 1.4 0.9 v 0.53 261 (32) (2) (7) (5) (5) (27) (22)
1964 2 "} 2.9 3.2 2.4 1.8 1.6 1.4 v 0.82 223.262 ( 1.1) (l.S) (8) (4) (2) (24) (14)
1965 1.6 3.3 3.8 3.1 3.0 1.8 1.7 1.2 v 0.68 263 (13) (13) (6) (1) (3) (5) (19) (30)
All regions ····· ...... ········· 1963 1.7 4.8 5.7 5.3 4.2 3.0 2.2 v 1.3 221 (4) (3) (8) (11) (14) (141) (55)
190·1 4.3 5.4 5.7 4.6 4.1 3.2 2.2 v 1.3 221 (4) (7) (10) (16) (15) ( 160) (46)
1965 5.5 3.6 5.5 4.2 3.2 2.8 1.9 v 1.1 221 (6) (3) (6) (6) (10) (66) (19)
Ca,.ib/J1·a11 ( I0--20"N)
Unitctl States San Juan, P.R. ............... 1963 2.2 1.7 v 1.0 143
(69) (26)
Europe (45-70"N)
Czcclioslovakia ................ _ .. 1964 4.6 7.1 8.3 3.0 3.9 4.0 3.3 1.8 v 1.1 226 (15) (42) (6) (4) (4) (J) (36) (04)

~ TADLE x. Sr90 JN HUMAN BONE (coiilinucd)
~Ci SrllO Per _qra111111e of ca/ci11111n. (. umber of samples in parentheses)
Bone type A'<Jcragc New-bor11 a11d/ > 19 )'cars
studied Sr/Ca ratio for Ucf•r· Rcoio11, co1rntry or arta Year or still·/Jorn' 0·1 year• 1 year Z years 3 years 4 years 5·19 year·• (adult•) ,ulult skclrtour- CUCi.'S
Dc11111ark ........................ 19<13 2.8 4.2 4.9 2.3 5.1 2.2 1.2 v 0.71 20<.i (12) (13) (2) (1) (2) (13) (44)
1964 3.8 6.5 5.9 3.9 5.1 9.1 3.9 2.4 v 1.4 207 (11) (44) (2) (1) (3) (5) (46} (77)
1965 2.7 6.1 8.5 6.5 8.4 4.1 2./ v 1.6 227 (14) (17) (3) (2) (2) (.H) (23)
Federal Republic of Germany ..... 1963 2.3 4.0 2.9 1.4 0.5 T _d 264,265 (1611) (21) (9) (27) (46)
1964 3.1 4.9 6.0 2.8 0.8 T _tl 264,2ti5 (172) (20) (16) (28) (47)
1965 2.5 6.2 . 5.5 2.7 I.I T _•I 264 (92) (10) (9) (13) (43)
Norway ......................... 1963 2.5 6.9 5.3 3.2 1.7 v 1.0 2u6 (14) (2) (1) (5) (1)
1964 4.8 8.9 9.2 4.2 266 (7) (6) (4) (8)
1965 5.7 15.0 12.0 5.3 26(>
'l (13) (6) (1) (4) '-l
Poland ....... , .................. 1%3 5.0" 5.61 6.1 -4.8- 3.3 3.2 1.6 v 0.94 267 (53) (55) (3) (2) (2) (23) (66)
1964 4.8h 5.61 3.9 -6.0-- .3.1 3.8 2.5 v 1.5 267 (44) (49) (3) (4) (I) ( 10) {56)
1965 ~r
Switzerland ···-········ ......... 1963 1.0 v 0.59 237,238 t4i)
1963 0.70 R 0.70 237,238 (40)
1964 2.5 v 1.5 238 (15)
1964 1.4 R 1.4 238 (4)
1965
USSR" ......................... 1963 5.0 4.2 1.9 1.oc 1.0 156 (6) (7) (1,56'l) (4,142)
1964 3.5 5.9 6.9 2.!; 1.4 1.4 1:l7 (68) (33) (9) (5,425) (18,694)
1965
United Kingdom ................ 1CJ6JI: 2.4 5.2 5.1 4.1 2.2 2.3 1.6 0.6 F -~ ~r.s. 269 (167) (104) (24) (12) (11) (14) (74) (22)
19fiJ1 1.8 4.5 2.6111 --1.3"-- 0.86 v 051 270 (20) (17) (11) (15) (47)
1964" 3.0 8.6 9.2 6.4 4.9 4.6 2.211 0.5 F -~ 271,272 (92) (80) (21) (7) (9) (13) (46) (9)

,, 00
TABLE x. SrOO rn HUMAN DONE (co11/i111ud)
pCi SrOO per gramme of ca/ci11111n (Number of samples in parentheses)
l~t(lioH, country or area
Far /{as/ (30-50°N) Japan ...........................
So11l/1 America (- 35°5) Argentina (littoral area) .........
Ocea11i11 (10-40"5) Australia ......... ' ..............
Na11•: V-Vertcbrae. R-Ribs. T-Tihiae. F-Femora.
Y1.•ar
1%41
19l5k Jan.-June
1963
1964
1965
1963
1964 1965
1963
1964
1965 Ja1111.ary-Junc
New-born and/ or still-born t
3.3 (15)
3.0 (102)
1.4 (17)
2.0 (J6)
2.2 (12)
0.8 (23)
1.6 (12)
0.78 (80)
0.86 (60)
1.2 (21)
0·1 year·• 1 year
8.1 (12)
7.2 11.0 (53) (16)
3.6 8.5 (8) (2)
SOUTIIERN
2.0 2 .. 1 (3!i) (8)
1.2 2.1 (315) (22)
1.9 2.2 (15.1) (35)
2.9 3.0 (68) (12)
11 All values have been rounded out to two significant figures. h Average values for all areas investigated in the European and Asian territory of
the USSR. Values in [larcntbescs indicate number of indivicl11al samples collected, composed mainly of teeth in 5-19 aml > 19 year groups (usnally analyzcd as pooled samples).
0 Skeletal average for adults obtained by applying normalization factors detcnninc<l in 11J6J by M.arci et 111., the ratios vertebrae/skeleton, ribs/skeleton, femur shaft/skeleton and teeth/skeleton being 1.7. 1.0, 0.4 and 0.3. respectively.
Jlmw t1•/>c /JVcrll(/C /fr/er• studied Sr/Ca ratio for
2 years J l'Uars 4 years 5·19 years > 19 yc<11·s (adults) adult skelctow c11ccs
4,911' --2. 1.5 v o.~8 270 (14) (13) (44)
8.4 7.1 5.3 2.8 1.3 Di ff. 270 (8) (3) (4) (41) (5)
2.0 1.4 0.4 R 0.4 Li3 (38) (44) (47) 5.1 2.8 0.9 [{ 0.9 274
(14) (58) (39) 11 6.0 3.6 2.5 1.0 R 1.0 275
(1) ( 1) (1) (27) (20)
IIEMISl'llERE
145
2.0 --1.7-- l.5l 215 (5) (4) (12)
1.7 1.2 1.3 1.0 0.61 v 0.36 l49 (9) (15) (5) (247) (57i') 2.0 1.8 1.3 1.0 0.69 v 0.41 103
(25) (20) (13) (119) (494) 2.7 2.0 2.8 1.3 0.76 v 0.45 103 (8) (9) (6) (48) (225)
cl No direct normalization factor determined: skeletal averages may be a~snmcd to be higher by a factor of ,..., 2.
e Vertical hemisections of fcmora analyzed; no recent normalization factors available. t Still-born children ancl children of the age between zero and fourteen or zero and
thirty d.ays. i: Age between two weeks ancl one year or one month and one year. h Age between zero ancl two months. l Age between two and twelve months. J Age betwecn five ancl ten years. l< Country-wide survey, inclmling England. Wales and Scullaml. l Limited survey in \II/est London area. m One to nine years of age. 0 Ten to nineteen years of age.
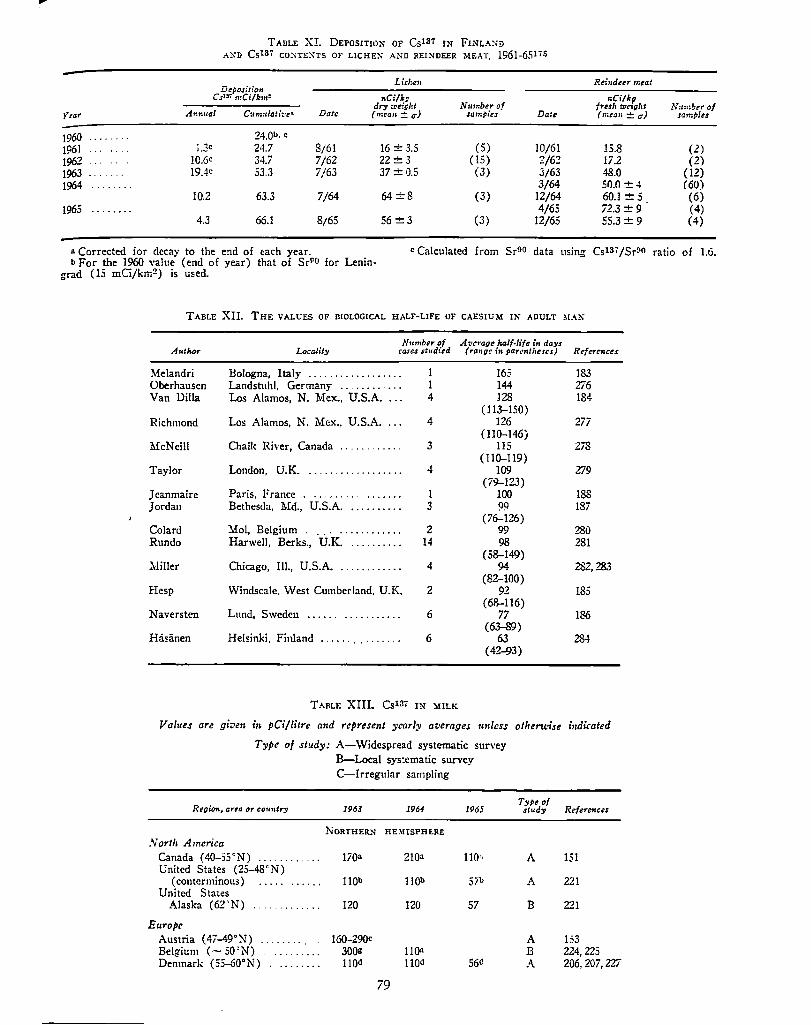
TADLE XL DEPOSITION OF Csl37 IN FINLAND Al\D Csl37 co:XTENTS OF LICHE1' AND REINDEER MEAT, 1961-65175
Lichen Reindur meat D~position
Cs= mCi/km• nCi/k11 11Ci/kp
Date dry "1eicht Number of fresli W<'•11l1t Number of
}'tar A1rn11al Cunzulath1t:r. (mean ± ,,) samples Date (mean±,,) samples
1960 24.Qb, c
1961 . "c J..J 24.7 8/61 16 ± 3.5 (5) 10/61 15.8 (2) !962 JQ.6C 34.7 7/62 22±3 (15) 2/6?. 172 (2) 1963 19.4c 53.3 7/63 37 :± 0.5 (3) J/63 48.0 (12) 1964 3/64 50.0 ±4 (60)
10.2 63.3 7/64 64±8 (3) 12/64 60.l ± 5 (6) 1965 4/65 72.3 ± 9 (4)
4.3 66.l 8/65 56±3 (3) 12/65 55.3 ± 9 (4)
a Corrected for decay to the end of each year. c Calculated from Sr90 data using Cs137 /Sr~o ratio of 1.6. b For the 1960 value (end of year) that of SrFO for Lenin
grad ( 15 mCi/krn!!) is used.
TABLE XII. THE VALUES OF BIOLOGICAL HALF-LIFE OF CAESIUM IN ADULT MAN
N"mber of Average half·lifc 1'n days Autluw Locality cases studied (ra11ge fo parentheses) References
Melandri Bologna, Italy ---····· .......... 1 165 183 Oberhausen Landstuhl, Germany ......... 1 144 276 Van Dilla Los Alamos, N. Mex., U.S.A. 4 128 184
(113-150) Richmond Los Alamos, N. Mcx., U.S.A. 4 126 277
( 110-146) McNeill Chalk River, Canada ...... ······ 3 115 2i8
(110-119) Taylor London, U.K. ...... ..... ....... 4 109 Z79
(79-123) Jeanmaire Paris. France ......... I 100 188 Jordan Bethesda, Md., U.S.A. .......... 3 99 187
(76-126) Colard Mo!, Belgium ............ 2 99 280 Run do Harwell, Berks., U.K. .......... 14 98 281
(58-149) Miller Chicago, Ill., U.S.A. .. . ····--··· 4 94 282,283
(82-100) Hesp Windscale. West Cumberland, U.K. 2 92 185
(68-116) Naversten Lund, Sweden ...... ... . ....... 6 77 186
(63--89) Rasanen Helsinki, Finland 6 63 284
(42-93)
TABLE XIII. Cs137 IN MILK
Values are given ii~ pCi/litre and represent yearly averages unless otherwise indicated
Type of study: A-Widespread systematic survey
B-Local sys,crnatic sun·ey
C-Irregular sampling
RegWn,, arta or tomitry 1963 1964 1965 Type of
study References
NoRTHER:i HE:\IISPH.E.RE }\forth America
Canada (40-55"N) ......... 1/0a 210" 110" A 151 United States (25-48"N)
(conterminous) ..... .... .. llOb lJQb 5/!J A 221 United States
Alaska (62'N) .. .. ...... ... 120 120 57 B 221
Europe Austria ( 47-49°N) ...... ·- }6Q-290C A 153 Belgium (- 50°N) ......... 3QQg 11()4 B 224,225 Denmark (55-60°N) ........ llOd llQd 56<! A 206.207,227
79

TABLE XIII. Csl37 lN MILK (continued)
Values are given fo pCi/litre and represent yearly averages miless otherwise indicated
Type of study: A - Widespread systematic survey B - Local systematic survey
Region, area or co;uitry
Faroes (60-70''N) . , ......... . Federal Republic of
Germany (43-55'N) .. , .. , Finland (60-67'N) . , ........ . France (42-50°N) . , . , ...... . Iceland (66-73'N) ........... . Ireland (50-55°N) . , ... , _ ... . Italy (37-47°N) ............. . Nonvay (58-70'N) .......... .
Sweden (55-70'~) ........ _ .. Switzerland
Geneva (- 46°N) .. ,, ..... . United Kingdom (50-60°N) .. USSR (35-70':!\) ........... .
Middle America, South America and Caribbean
Jamaica (,_, l3°N) ........... .Panama (-' 7°N) ············ United States
Puerto Rico (l8°N) ········ Venezuela (5-12°N) ..........
Asia
India (8-35°N) •·. ···········
Near East
Israel (- 32°N) .............. Far East
Japan (30-50' N) .. ··········· Oceania
United States Hawaii (21'1'<) ·············
Oceania
Australia (10-40°S) . ········· New Zealand (35-47°S) .......
South America
Argentina (littoral area, 35-55°S) .....
C - Irregular sampling
1963
79Qb, r
130d 2401 24Cd 580r 190 16Qb 540•• •· r
330•· t, r 1801
2JOm 130d 21oa
88 22P
29•
35"
120
73
1964
l,40Qb:r
llQd 2501 220i 870• 170 200 600•• c, r 43Qn, !, r 1721
180 150d 160•
350Jl
70 26
Isa
95
77
SOUTHERN HE!»ISPHERE
3Jn 49a 56•t, n 90a
13 20
a Unweighted mean for all milksheds surveyed. b Country-wide mean weighted by population.
1965
1.10Qh, r
110"' 1901 130i 750r
s2on. e, r
360•• !, r 1101
280t 40~
42 21i.:
11a
25"
59k
51
47a 969
20
Type of st1Ldy References
A 227-229
A 230 A 285 A 232-234 A 235 A 155 A 286, 287 A 2S8 A 69,236 A 289
B 237, 238 A 155,240,256 c 239
B 152 c 152
B 221 B 152
A(C) 243
c 241, 242
Co 244-248,290
B 221
A 291. 292 A 98,250
B 102,215
c Average values for three zones oi different yearly rainfall, covering the whole country. d Country-wide mean weighted by production. e Unweighted mean from the survey of thirty milksheds. r Unweighted mean from the survey of ten milksheds. i: Simple average of values obtained from three farms and three dairies. h Locally produced. ! Non-weighted average of three milksheds for the period October 1962-July 1963. i Unweighted mean of representative samples from all departments of France. & January-August only. 1 Country-wide mean weighted by consumption. m June-December only. n July-December only. ° Kon-systematic widespread sampling. P April-December only. r Unusually high levels due to heavy rainfall and particular grazing conditions.
80

TABLE XIV. Csl3T rn TOTAL DmT
Yea1·!)' ai•erage c·'alties are given ill pCi/day 1111/ess otherwise ii:dicatca (all t'aliie.r have beeii rormded 011t to two sigttificanl figures)
Type of st11dy: A-Survey of individual foodstuffs B-Total diet analyses C-Widespread sampling
North An1erica
Greenland (> 60°N)
United States
Year
1963 1964 1965
Uilk and mill: p..od11ets
24 24
Chicago, Ill. (42cN) . . . . . . . 1963b 58 1963C 88 1964b 69 1964c 120 1965b,d 51 1965t-, d 82
United States
contermin-0us (25-48°N) (institutional diet sampling) 1963
Alaska (62°N) (local
1964
1965
institutional diet sampling). . 1963 1964 1965
Europe
Denmark (50-60'N) . . . . . . . . . 1963
1964
1965
Faroes (60-70°N) . . . . . . . . . . . 1963 1964 1965
Federal Republic of Germany
(43-55°N) . .. .. . . .. .. .. .. .. 1963 1964 1965
Sweden (55-70°N) ........ . 1964
USSR (rural population) (35-700N) .. .. ... .. . .. .. .. .. .. . 1963
1964
1965
USSR (urban population) . . . . 1963 1964 1965
United Kingdom (50-60°N) . . 1963 1964
Near East
Israel (- 32°N) . .. .. . .. .. .. . 1965
50
53
26
280 430 340
50 62
90
57 66
D-Local sampling E-Irregular sampling
1808
3108
34 5
43 9
38 5
94
91
64
570 210 290
60 110
75
70 59
Miscellaneoii.s Total T;;pe of stud;;
81
95 230
58 6
90 13 64 12
130
180
100
170 250 250
90 88
100
51 36
300 560
AC AC
150 AD 99 AD
200 AD 140 AD 150 AD 99 AD
140 BC (14-270)f
150 BC (70-JOO)t
100 BC (40-220)f. t
140 ED 160 ED 65t ED
270 AC (250) BC 320 AC
(320) BC 190 AC
(240) BC 1,000 AC
890 AC 880 AC
200 AC 260 AC 150 AC
260g AC
250 AC (130-450)j
330 AC (190-550)i
210 AC 290 AC
180 AC 160 AC
92 AE
Remarks
Area of poor grazing conditions and high rainfall
Area of high rainfall and poor grazing conditions
Refermus
253 254
293 294 293 294 294,295 294,295
221
221
221
221 221 221
206 206 207 207 227 227 228 229 227
255 255 296
194
239
239
239 239
256 155
242

T ADLE XIV. Cs137 IN TOTAL DIET (continued)
Yearly a·uerage vailles arc given in pCi/day unless other..t-ise indicated (all values have bec11 ro1111ded out to t"dlo significant figures)
Regi*on, area. or country
Far East
Japan ...................... .
Oceania
United States Hawaii (institutional diet
sampling) (21 'N) ..... .
0 Including eggs and fish. b Average adults' diet.
Type of study: A-Survey of individual foodstuffs
Milk a11d }"car t11ilk prodi:cts
1963 1964 1965
1%3 1964 1965
B-Total diet analyses C-Widespread sampling D-Loc:al sampling E-Irrcgular sampling
Type of Meat M isulla11eo:rs Total study
65 64 41
97 120 120k
BC BC BC
BD BD BD
g January 1964 sampling.
Remarks
h Dairy products, eggs, meat, fish and shellfish.
Referersces
~7,298 299,300 299,300
221 221 221
c Infants' diet during the first year of life. d January and April sampling only. e Widespread dietary survey in twenty-one boarding schools
in the l:nited States, based on composite diets of childre:i and adolescents of six to eighteen years of age.
I Data for 1963 include three series of sampling at four locations in the period January-July.
t Range of yearly averages reported for individual schools.
82
J Range of values calculated for daily average intake by the rural population of sixteen republics of the Soviet Union.
t January-June only.

R1.•uiou, country or area of resi<lence
Nor/It America
Canada (northern) (H) .. Canada
Ottawa ...............
United States Alaska (Eskimos) (H) Alaska (Eskimos)
Anaktuvuk Pass (H) Ilrookhaven, N.Y •....
Los Alamos, N. Mex ...
Los Angeles, Cal. ....
00 Eurof't and Asia VJ
Belgi11111 . . ........
Denmark Wso ..................
Federal Republic of Germany ..............
Finland Helsinki ........ ' ' ... La.pland (I-I) .........
France (northern)
Italy Bologna .. ············
Norway (western) (R) ..
Oslo" .................
1fasfjorrlcn (R) ......
Poland Lodz ··········· ......
.... 60 (IO)
T ABU: xv. CAESIUM-137 IN MAN
All vallles art gro11p averages in pCi Cs1B1/g K 1111/ess otherwise illdicaltd
(Figures in parentheses indicate the number of measurements performed)
1963 1964 1965
II lll IV I II II! IV !! Ill
NORTHERN HEJ\IISPHERE
-· 1,00011 •• _, 1,400-2,BOOb, c - 2,800-9,000b. c
170 (63)
24.1-4,500•· b 36~9,100•· b -31~7.500•· b 3,400b 8,200b 5,600b 4.600b 4,600b
(50) (51) (30) (25) (25) 70 95 120 130 140 180
(10) (10) (10) (10) (10) (10) 72 92 95
(86) (80) 59 95 93 114 99 91 91 86 84
(14) (36) (36) (25) (15) (34) (50) (40) (51)
IV
76 (50)
--73-- -117- -146- -169- -144- -- 125 --(507) (529) (552) (623) (407) (381)
89 132 143 195 176 191 170 153 (14) (14) (10) (10) (10) (20) (15) (20)
47 54 83 120 141 163 152 148 131 119 104 101 (42) (42) (40) (40) (40) (40) (40) (40) (40) (40) (40) (40)
112 120 175 200 204 218 205h 200 160 (49) (49) (49) (49) (24) (49) (78) (27)
1,430-4,420• 2,260-8,360ft 2,370-10,640•
70 103 132 168 197 240 273 198 242 220 159 155 (- 60) ( _, 60) (-60) ( _, 60) (- 60) ( .... 60) (- 60) (-60) ( _, 60) (-60) (- 60) (-60)
74 81 124 150 (13) (13) (13) (13) 332t 651 (11) (169) 178 338 357 337 (23) (23) (23) (25) 870 1,430 2,000 1,230 (II) (10) (10) (10)
133 181 128 200 (23) (23) (22) (22)
1966
l<e/erenr.es
301,302
303
304-306 307
308
309
63 310 (23)
105 280 (167)
206,207,227
311
173, 28•1, 312, 313
2,000-8,ZOOa ( 121) 173, 312, 314 103
(-60) :115,316
183
288, 317
288,317
288, 317
318

~
TAm,E XV. CAESIUM-137 IN MAN (co11li1wcd)
All values are gro11p averages in pCi Cs131 /g K 1111/ess otherwise indicated
(Figures in parentheses indicate the number of measurements performed)
Rwiou, country or area of' esi,lcncc
Sweden Stockholm
I
60 (13)
196J
II Ill
72 122 (9) (8)
IV
151 (22)
La1>land (H) ----l,700-2,90{}a----
Switzerland
Gc11cva .............. .
(105)
74 107 (-15) (-15)
151 (,..., 15)
USSR {far north) (H) ---3.570-23,600b, d __ _
United Kingdom Berkshire . . . . . . . . . . . . . 54
(10) West Cumberland 107
(14)
Par East
Japan . . . . . . . . . . . . . . . . . . 641t
Ocea11fo
Australia Adelaide
(68)
36 (24)
(60)
64 90 (12) (11) 138 198 (14) (14)
591r (68)
33 (19)
66B (74)
33 (22)
115 (13) 249 (14)
40 (23)
21 (21)
1964
I II 111 IV
235 182 (20) (10) ----2,600-5,400----
191 {13)
180 (15)
(94)
188 196 (17) (14)
184 (22)
----7.140-25.700b, d ---
138 (13) 255 (14)
32 (29)
(30)
150 162 (13) (15) 256 272 (14) (14)
96 (20)
101 (42)
SOUTHERN llEMISPHEltE
.16 (6)
31 (4)
170 (17)
107 (41)
45 (4)
1965
II Ill IV
----3,000-6,400---(96)
---1,400-34,000b, d __ _
166 (18)
90 (29)
67 (7)
160 149 (21) (19)
82 (54)
66 (29)
71 (16)
67 (11)
124 (21)
62 (11)
1966
I
104 (24)
194
174
237,238
175,319
320,321
322
275,323
324
Nole: (H) =IIigh levels of Csl37 due lo operation of the lichen-reindeer (caribou) food
chain mechanism (paragraphs 9S-IOI ).
e Approximate values calculated from excretion of Cs137 in urine in groups of population subsisting to a varying degree on reindeer meat in their diet.
(R) = Ili.i::h levels of Csl37 due to very high average rainfall in the area and .poor grazing conditions for callle.
n A vcrage values for cliff erent groups of lOl:al population (Lapps or Eskimos only). h Approximate values calculated only for adults from reported total body burden
assuming 140 g of potassium in the body, or from data on caesium-137 body weight ratio assuming approximately 1.9 g K/kg in females and 2.3 g K/kg in males.
d Range of concentrations observed in individual reindeer breeders. e Group of schoolboys sixteen lo eighteen years old in 1963 and eighteen to twenty
years old in 1965. t Masfjor1len residents. g Estimated from radio-chemical analysis of muscles. h Calculated from total body burden assuming 140 g K in an average adult male.

,...
TABLE XVI. CH CO:STENT OF SOME l'00DSTUFFS AND HUMAN TISSUES COLLECTED IN VARIOUS PLAas209-2ll
Tlie ;;alues are expressed in per cent increase of CH specific activity aboz•e pre-test le:•els
(Number of samples in parentheses)
Year: 1962 1963 1964
Arta or kcaJity Quarltr: Ill IV I II 111 IV I 11 Ill IV
Foodstuffs
Cereals, Xonvay 64°N 94 (.3)
Milk, Norway ... 64'N 84 71 71 91 (1) (2) (1) (3)
Milk, United States 30-50'N 40 (1)
Meat, poultry and eggs, United States ......... 30-50'N 28 16
(4) (2)
Fruits, linited States .... 30-so0 N 12 18 (1) (3)
Potatoes, United States .. 30-so0 N 48 (2)
Total diet, United States 30-50'N 26 33 34 (7) (6) (1)
Human tissues
Soft tissues and blood Norway .............. 64'N 34 41 43 46 53 53
(2) (3) (3) (4) (2) (2) United States . ....... 30-so·N 24 33 16 38 54
(2) (1) (3) (14) (1) Australia, Melbourne .. 38°S S7a' 14&"
a Data for a subject from Melbourne, Australia, who stayed in the United States for two weeks prior to death (a' -plasma; a" -erythrocytes).
Tissue
Gonads
Ce Us lining bone surfaces
Bone marrow
TABLE XVI!. DOSE COMYIT:MENTS FROM NUCLEAR E...XPLOSIONS
Source of radi•tiot1
External, short-lived ............ . Cs137 .. - ... - - - - - .. - .
Internal, es1a1 ................. .
CHa ................. .
Dose commitm1N1ts (mrad)
for perrod of testit1g 1954-1965
23 25 15 13
ToTALl> 76
External, short-lived ............ . Csl37 ..••... - - - - ... - - ..
Internal, Sr90 .................. . Csl37 ........ - - ...... . Q4n ...... , ...... _ ... . SrSD ................. .
23 25
156 15 20 0.3
ToTALb 240
External, short-lived ............ . cs1a1 . __ . . . . . _ ..... __ .
Internal, Sr90 .................. . cs1a1 . . . . . . . . . . . ..... . CH a ....•.......•..
Sr89 ........... - . - - - -
23 25 78 15 13 0.15
TOTAI.b 150
Paragraphs
137 135 145 147
137 135 143 145 147 146
137 135 143 145 147 146
•As in the 1964 report, only the doses accumulated up to year 2000 are given for CH; at ithat time, the doses from the other nuclides will have essentially been delivered in full. The total dose commitment to the gonads due to CB from tests up to the end of 1965 is about 180 mrads.
b Totals have been rounded off to two significant figures.
85

REFERENCES
1. United Nations Scientific Committee on the Effects of Atomic Radiation, Report of the United Nations Scientific Committee on the Effects of Atomic Radiation. General Assembly document, 19th session, Suppl. No. 14 (A/5814). United Nations, N. Y., 1964.
2. United Nations Scientific Committee on the Effects of Atomic Radiation, Report of the United Nations Scientific Committee on the Effects of Atomic Radiation. General Assembly document, 17th session, Suppl. No. 16 (A/5216). United Nations, N. Y., 1962.
3. United States Atomic Energy Commission, Wash., D.C., Official press release, 1v1arch 2, 1966.
4. Krey, P. W., W. C. Rosa. Jr .. HASL surface air sampling program-gamma activity measurements for October 1964. Health and Safety Laboratory, New York, N. Y .. 3 February 1965. Also-gamma activity measurements for November 1964. Health and Safety Laboratory, New York, N. Y., 8 March 1965.
5. Krey, P. W., W. C. Rosa, Jr., HASL surface air sampling program-gamma activity measurements for December 1964. Health and Safety Laboratory, New York, N. Y .. 12 April 1965.
6. United States Department of Health, Education, and Welfare, Public Health Service, Radiological Health Data. vol. 6. No. 4. April 1965; v.e. United Nations document A/AC.82/G/L.1010.
7. United States Department of Health, Education, and Welfare, Public Health Service, Radiological Health Data, vol. 5, No. 11, November 1964: v.e. United Nations document A/AC.82/GjL.980.
8. Mamuro, T .. A. Fujita, T. Matsunami, et. al., Observation of fallout around our laboratory. Annual report of the Radiation Center of Osaka Prefecture (Japan) 5: 1-4 (1964).
9. Mamuro, T., A. Fujita, T. Matsunami. Microscope examination of highly radioactive fallout particles from the first Chinese nuclear test explosion. Annual report of the Radiation Center of Osaka Prefecture (Japan) 5: 5-15 (1964).
10. Mamuro, T., K. Yoshikawa, T. Matsunami, et al., Radionuclide fractionation seen in the fallout from the first Chinese nuclear test explosion. Annual report of the Radiation Center of Osaka Prefecture (Japan) 5: 16-22 (1964).
11. SisefsJ...-y, J., Preliminary report on debris particles from the first Chinese nuclear weapon test. ForS\·arets Forskningsanstalt. Avdelning 4 rapport A 4428-456. ?-.fay 1965.
12. Persson, G., Observations on debris from the first Chinese nuclear test. Fi:irsvarets Forskningsanstalt, Avdelning 4 rapport A 4424-456, April 1965.
13. Kuroda. P. K.., B. D. Palmer. ·~vI. Attrep, Jr., et al ... Fallout from the nuclear explosion of 16 October 1964. Science 147: 1284-1286 (1965).
86
14. Led, J. J., L. Kristensen, Detection in Denmark of the Sinkiang nuclear detonation. Nature 205: 1307-1308 (1965).
15. Persson, G., Observations on debris from the first Chinese nuclear test. Nature 209: 1228-1229 (1966).
16. Vohra, K. G., Some aspects of fallout from the first and second Chinese tests. Atomic Energy Establishment Trombay report A.E.E.T.-240 (1965).
17. Cambray, RS., E. M. R Fisher, W. L. Brooks, et al., Radioactive fallout in air and rain. Results to the middle of 1965. United Kingdom Atomic Energy Authority Research Group report AERER 4997 ( 1965); v.e. United Nations document A/ AC.82/G/L.1054.
18. Foote. R. S., Fallout measurements by totalabsorption gamma-ray spectroscopy, pp. 183-197 in Radioactive Fallout from Nuclear Weapons Tests. Proceedings of the Second Conference, Germantown, Maryland, November 3-6 ( 1964). Klement. A. W .. Jr., ed., USAEC Division of Technical Information. 1965; v.e. United Nations document A/ AC.82/G/L.1057.
19. National Institute of Radiological Sciences, Radioactivity Survey Data in Japan, No. 5, Nov. 1964: v.e. United Nations document A/AC.82/ G/L.1044.
20. Murayama, N., Radioactive fallout from three nuclear explosions for late 1964 and early 1965. J. Meteor. Res. (Japan) 14: 246-258 (1965).
21. Gold, S., J. Harndin, E. Tabor. et al., Fallout from Chinese nuclear test of May 14, 1965. pp. 209-214 in Radiological Health Data and Reports, vol. 7, No. 4, April 1966: v.e. United Nations document A/ AC.82/G/L.1101.
22. Hardy, E. P., Jr., J. Rivera, Fission product and activation product radionuclides in monthly precipitation at selected U. S. sites. pp. 169-203 in Health and Safety Laboratory fallout program quarterly summary report. April 1, 1966. USAEC report HASL-171: v.e. United Nations document A/AC.82/G/L.1075.
23. Gustafson, P. F .. Private communication. 24. New Zealand Department of Scientific and In
dustrial Research. The Institute of Nuclear Sciences, Radioisotopes in rainwater. p. 324 in Health and Safety Laboratory fallout program quarterly summary report. April 1, 1966. USA.EC report HASL-171: v.e. United Nations document A/AC.82/G/L.1075.
25. Krey. P. \V .. W. C. Rosa. Jr., Fallout from the second Chinese nuclear test and comparison with the first. pp. 288-295 in Health and Safety Laboratory fallout program quarterly summary report. July 1. 1965. USA.EC report HASL-161: v.e. United Nations document A/AC.82/G/L.1015.
26. Donagi, A.. A. Eisenberg. Y. Feige. et al., Fresh fallout in Israel from the second Chinese nuclear test. Nature. In press.

r
27. Persson, G .. Fractionation phenomena in debris from the Chinese nuclear explosion in May 1965. Nature 209: 1193-1195 (1966).
28. Johnson, J. E., D. W. Wilson, G. M. Ward .. The appearance of iodine-131 and barium-lanthanum-140 in fallout due to the second Chinese nuclear test. pp. 1-2 in Radiological Health Data and Reports, vol. 7, No. 1, January 1966: v.e. United Nations document A/AC.82/G/L.1067.
29. Krey, P. W., W. C. Rosa, Jr., HASL surface air sampling program, gamma activity measurements for May 1965. Health and Safety Laboratory, New York., N. Y .. September 20. 1965.
30. Krey, P. W., HASL surface air sampling program, gamma activity measurements for June 1965. Health and Safety Laboratory, New York, N. Y .. November 2, 1965.
31. National Institute of Radiological Sciences, Radioactivity Survey Data m Ja pan, No. 7, May 1965; v.e. United Nations document A/AC.82/ GjL.1074.
32. United States Department of Health, Education, and Welfare. Public Health Service, Radiological Health Data, vol. 5, No. 4, April 1964; v.e. United Nations document A/ AC.82/G/ L.937.
33. United States Department of Health, Education, and Welfare, Public Health Service, Radiological Health Data, vol. 5, No. 7, July 1964; v.e. United Nations document A/AC.82/G/L.961.
34. United States Department of Health, Education, and Welfare, Public Health Service, Radiological Health Data, vol. 6, No. 2, February 1965; v.e. United Nations document A/ AC.82/ GjL.997.
35. United States Department of Health, Education, and Welfare, Public Health Service, Radiological Health Data, vol. 6, No. 5, May 1965; v.e. United Nations document A/AC.82/G/L.1013.
36. Koyama, S., T. Sotobayashi, T. Suzuki, Highly fractionated nuclear debris resulting from the venting of a Soviet underground nuclear test. Nature 209: 239-240 (1966).
37. Kobayashi, U., H. Sasaki, Fallout radioactivity due to the underground nuclear test of USSR (Jan. 15, 1965). J. Rad. Res. (Japan) 6: 64-72 (1965).
38. Sotobayashi, T., S. Koyama, Strontium-90 fallout from surface and underground nuclear tests. Science 152: 1059-1060 ( 1966).
39. Martell. E. A., Iodine-131 fallout from underground tests. Science 143: 126-129 (1964).
40. Martell, E. A., Iodine-131 fallout from underground tests II. Science 148: 1756-1757 (1965).
41. Holland. W. D .. First quarterly report of SNAP-9A particle studies during 15 October 1965-15 January 1966. TRA.CERLAB, division of Laboratory for Electronics. Inc.. Richmond. Cal., February 7 (1966).
42. Harley, J. H .. Possible Pu-238 distribution from a satellite failure, pp. 138-142 in Health and Safety Laboratory fallout program quarterly summary report. October 1. 1964. USi\EC report HASL-149; v.e. United Nations document A/ AC.82/G/L.971.
43. Machta, L., Calculation of Pu-238 concentrations from the SNAP-9A burn-up. pp. 297-299 in
87
Health and Safety Laboratory fallout program quarterly summary report, January 1, 1965. USAEC report HASL-155: v.e. United Nations document A/ AC.82/G/L.990.
44. Salter, L. P., Stratospheric air concentrations of plutonium isotopes and strontium-90. October 1964-February 1965. HASL Technical Memorandum 65-10, June 11, 1965.
45. Salter, L. P .. Measured levels of plutonium-238 and plutonium-239 in the stratosphere. pp. 143-145 in Health and Safety Laboratory fallout program quarterly summary report. October 1, 1964. USA.EC report HASL-149: v.e. United Nations document A/AC.82/G/L.971.
46. Salter, L. P., High altitude balloon sampling program, pp. 214-245 in Health and Safety Laboratory fallout program quarterly summary report, April 1. 1965. USAEC report HASL-158; v.e. United Nations document A/AC.82/GjL.1002.
47. Salter, L. P., Stratospheric distribution of Pu-238 from the SNAP-9A abort of April 1964, pp. 269-280 in Health and Safety Laboratory fallout program quarterly summary report, October 1, 1965. USAEC report HASL-164: v.e. United Nations document A/ AC.82/G/L.1036.
48. List, R. J., L. P. Salter. K. Telegadas, Radi<r active debris as a tracer for investigating stratospheric motions. Tellus. In press.
49. Krey, P. vV., High altitude balloon sampling program, pp. 269-281 in Health and Safety Laboratory fallout program quarterly summary report, April 1, 1966. USAEC report HASL-171; v.e. United Nations document A/AC.82/G/L.1075.
50. Volchok, H. L., The anticipated distribution of Cd-109 and Pu-238 (from SNAP-9A) based upon the Rh-102 tracer experience, pp. 312-331 in Health and Safety Laboratory fallout program quarterly summary report, January 1, 1966. USAEC report HASL-165: v.e. United Nations document A/ AC.82/G/L.1058.
51. Feely, H. W., P. E. Biscaye, R. J. Lagomarsino, et al., Atmospheric circulation rates from measurements of nuclear debris. Paper presented at the CACR Symposium on Atmospheric Chemistry, Circulation and Aerosols, Visby, Sweden, August 18-24 ( 1965).
52. Salter, L. P., Stratospheric radioactivity in the southern hemisphere from 1961 and 1962 weapon tests, pp. 409-421 in Radioactive Fallout from Nuclear Weapons Tests. Proceedings of the Second Conference, Germantown, Maryland, November 3-6 (1964). Klement. A. W., Jr .. ed., USAEC Division of Technical Information, 1965; v.e. United Nations document A/AC.82/G/ L.1057.
53. Friend, J. P .. ed .. The high altitude sampling program. Defence Atomic Support Agency report No. DASA-1300. vol. I, August 31 (1961).
54. Feely. H. vV., J.E. Hardaway. R. J. Lagomarsino, An estimate of the stratospheric burden of strontium-90 on 1 January 1964. A special report on Project Star Dust. Isotopes, Inc., May 11 (1964).
55. Feely. H. W., J. P. Friend. R. J. Lagomarsino, et al., Flight data and results of radiochemical analyses of filter samples collected during 1963 under Project Stardust. USAEC report HASL-

168; v.e. United Nations document A/AC.82/ GjL.1071.
56. Feely. H. W., D. C. Bogen, R. J. Lagomarsino, et al.. Flight data and results of radiochemical analyses of filter samples collected during 1964 under Project Stardust. USAEC report HASL-169; v.e. United Nations document A/AC.82/ GjL.1072.
57. Salter, L. P., High altitude balloon sampling program, pp. 214-245 in Health and Safety Laboratory fallout program quarterly summary report, April 1, 1965. USAEC report HASL-158: v.e. United Nations document A/ AC.82/G/L.1002.
58. Salter, L. P .. High altitude balloon sampling program, p. 222 in Health and Safety Laboratory fallout program quarterly summary report, July 1, 1965. USAEC report HASL-161: v.e. United Nations document A/AC.82/G/L.1015.
59. Hardy, E. P., Jr., J. Rivera, Global atmospheric radioactivity June 1963, August-September 1963, February 1964 and August 1964, pp. 301-311 in Health and Safety Laboratory fallout program quarterly summary report, January 1, 1966. USAEC report HASL-165; v.e. United Nations document A/ AC.82/G/L.1058.
60. Krey, P. W., High altitude balloon sampling program, pp. 223-268 in Health and Safety Laboratory fallout program quarterly summary report, April 1. 1966. USAEC report HASL-171; v.e. United Nations document A/AC.82/G/L.1075.
61. Machta, L., R. J. List, K. Telegadas, Inventories of selected long-lived radioisotopes produced during nuclear testing, pp. 243-271 in Health and Safety Laboratory fallout program quarterly summary report, January 1, 1964. USAEC report HASL-142; v.e. United Nations document A/ AC.82/G/L.871.
62. Machta, L., Prediction of radioactive fallout and doses to man after January 1, 1965. Air Resources Laboratory, Institute of Atmospheric Sciences, Washington, D.C., January 1966.
63. Volchok, H. L., Balancing of the Sr-90 budget, pp. 261-268 in Health and Safety Laboratory fallout program quarterly summary report, October 1, 1965. USAEC report HASL-164; v.e. United Nations document A/ AC.82/G/L.1036.
64. Machta, L, Private communication. 65. Volchok, H. L., Private communication. 66. Krey, P. VI., Surface air sampling program, pp.
288-320 in Health and Safety Laboratory fallout program quarterly summary report, April 1, 1966. USAEC report HASL-171; v.e. United Nations document A/AC.82/G/L.1075.
67. Volchok, H. L., Distribution of strontium-90 in surface air during 1963. Nature 206: 1031-1033 (1965); v.e. United Nations document A/AC.82/ GjL.1020.
68. Hvinden, T., Radioactive fallout in Norway, July 1963 to December 1964. Norwegian Defence Research Establishment intern rapport F -460 (1965).
69. Hvinden, T .. Radioactive fallout in Norway 1965. Norwegian Defence Research Establishment intern rapport F-475 (1966).
70. Lindblom. G., Summary of fallout measurements in Sweden up to September 1964. I. Air concentrations and deposition of Cs-137, Fi:irsvarets
88
Forskningsanstalt, Avdelning 4 rapport A 4420-456 (1965).
71. Lindblom, G., Measurements of radionuclides in the environment and in the human body. Research Institute of National Defence, Sweden.
72. Cambray, R. S .. E. M. R. Fisher, G. S. Spicer, Radioactive fall-out in air and rain : results to the middle of 1964. Atomic Energy Research Establishment, Harwell, report AERE-R-4687 (1964); v.e. United Nations document A/ AC.82/G/ L.996.
73. Machta, L., R. J. List, K. Telegadas, Updating the radioactive fallout picture to 1965. Statement prepared for the Public Hearings of the Joint Committee on Atomic Energy on Federal Radiation Council Protective Action Guides. June 29 and 30 (1965).
74. Gustafson, P. F., S. S. Brar, S. E. Muniak, Variation of fission products and natural radioactivity in surface air. pp. 497-506 in Radioactive Fallout from Nuclear Weapons Tests. Proceedings of the Second Conference. Germantown, Maryland, November 3-6 (1964). Klement, A. W., Jr., ed., USAEC Division of Technical Information, 1965; v.e. United Nations document A/AC.82/ G/L.1057.
75. Rangarajan, C., S. Gopalakrishnan, S. Sadasivan, et al., Measurements of airborne radioactive fallout in India. Atomic Energy Establishment. Trombay report A.E.E.T.-208 (1965): v.e. United Nations document A/AC.82/GjL.1051.
76. Vohra, K. G .. C. Rangarajan, S. Gopalalcrishnan, et al., Measurements on airborne and surface fallout radioactivity in India from nuclear weapon tests (Results up to June 1965). Atomic Energy Establishment Trombay report A.E.E.T.-247 (1966).
77. Federal Radiation Council, Estimates and evaluation of fallout in the United States from nuclear weapons testing conducted through 1962. Report No. 4, May 1963: v.e. United Nations document A/ AC.82/G/L.843.
78. Hagemann, F. T., J. Gray, Jr., L. Machta, Carbon-14 measurements in the atmosphere--1953 to 1964. USAEC report HASL-159: v.e. United Nations document A/ AC.82/G/L.1003.
79. Fergusson, G. J., Radiocarbon and tritium in the upper troposphere. Paper presented at the International C-14 and Tritium Dating Conferen~e, June 7-11 (1965). Pullman, \Vashington, U.S.A.
80. Health and Safety Laboratory, Carbon-14 measurements in the atmosphere, January 1. 1966. USAEC report HASL-166; v.e. United Nations document A/ AC.82/GJL.1059.
81. Drobinski, J. C., Jr., Radiocarbon in the environment, pp. 10-12 in Radiological Health Data and Reports, vol. 7, No. 1, January 1966: v.e. United Nations document A/AC.82/G/L.1067.
82. Stiller. M., Y. Feige, Fallout studies. pp. 147-149 in Semi-annual report for the period July-December 1963. Israel Atomic Energy Commission report IA-920 (1964 ).
83. Stiller, :M., I. Prulov, Y. Feige, Fallout data. pp. 135-140 in Semi-annual report for the period January-June 1964. Israel Atomic Energy Commission report IA-984 ( 1964).

84. Prulov, I., M. Stiller, Y. Feige, Fallout deposition and air activity, pp. 137-140 in Semi-annual report for the period July-December 1964. Israel Atomic Energy Commission report IA-1021 (1965).
85. Volchok. H. L., Sr90 : Estimation of wvrld-wide deposition. Science 145: 1451-1452 (1%4).
86. Volchok, H. L.. Worldwide deposition of Sr90
through 1964, pp. 268-284 in Health and Safety Laboratory fallout program quarterly summary report, July 1, 1965. USAEC report HASL-161; v.e. United Nations document A/ AC.82/G/ L.1015.
87. New Zealand Department of Health, National Radiation Laboratory, Quarterly report. Oct.Dec. 1964 and Annual summary on fallout in New Zealand. Report NRL/Fl5 (1965).
88. Volchok, H. L., Sr00 fallout in Antarctica, pp. 286-287 in Health and Safety Laboratory fallout program quarterly summary report, July 1, 1965. USAEC report HASL-161; v.e. United Nations document A/ AC.82/GJL.1015.
89. Hardy, E. P., Jr., J. Rivera, Health and Safety Laboratory fallout program quarterly summary report. April 1, 1966, pp. 1-168. USAEC report HASL-171; v.e. United Nations document A/ AC.82/G/L.1075.
90. Mahmoud, K. A., M. K. Moloukhia. S. A. AbdelLatif, et al., Fallout and radioactive content of food chain in U.A.R. during the year 1963. U.A.R.S.C.E.A.R. vol. 6-1, June 1964; v.e. United Nations document A/ AC.82/G/L.948.
91. Booth, A. H., E. R. Samuels, V. K. Mohindra, Fallout levels in Canada during 1964, pp. 17-38 in Data from Radiation Protection Programs, vol. 3, No. 1, January 1965. Department of National Health and Welfare, Ottawa, Canada, Radiation Protection Division.
92. Samuels, E. R., V. K. Mahindra, Canadian fallout data for April 1965, pp. 14-26 in Data from Radiation Protection Programs, vol. 3, No. 5, May 1965. Department of National Health and Welfare, Ottawa, Canada, Radiation Protection Division.
93. Peirson, D. H., R. S. Cambray, Fission product fall-out from the nuclear explosions of 1961 and 1962. Nature 205: 433-440 (1965).
94. Hvinden, T., A. Lillegraven, 0. Lillesaeter, Precipitation as a cause of seasonal and latitudinal variations in radioactive fall-out. Nature 206: 461-463 (1965).
95. New Zealand Department of Health, National Radiation Laboratory, Fallout in New Zealand. Quarterly report, January-March 1965. Report NRL/F16.
96. New Zealand Department of Health, National Radiation Laboratory, Fallout in New Zealand. Quarterly report, April-June 1965. Report NRL/ F17.
97. New Zealand Department of Health, National Radiation Laboratory. Fallout in New Zealand. Quarterly report, July-September 1965. Report NRLjF18.
98. Ne\v Zealand Department of Health. National Radiation Laboratory, Fallout in New Zealand. Annual summary. Report NRL/F19. In press.
89
99. Samuels, E. R.. V. K. Mahindra, Canadian fallout data for December 1964, pp. 8-33 in Data from Radiation Protection Programs. vol. 4. No. 1. January 1966. Department of Xational Health and Welfare, Ottawa, Canada, Radiation Protection Division.
100. National Institute of Radiological Sciences. Chiba, Japan, Radioactivity Survey Data in Japan, No. 6. February 1965.
101. Bhatnagar, V. S.. S. Sadasivan. Measurements of radioactive fallout in individual rain showers at Bombay. Atomic Energy Establishment Trombay report A.E.E.T.-215 (1965).
102. Beninson, D., E. Vander Elst, E. Ramos, Estudio de evoluci6n de materiales radioactivos en el media terrestre. Comisi6n Nacional de Energia At6mica Informe No. 133 (1964): v.e. United Nations document A/AC.82/G/L.1033.
103. Fletcher, W., W. J. Gibbs, J. R. Moroney, et al., Strontium-90 m the Australian environment during 1964. Australian J. Science. In press. Also Stevens, D., Private communication.
104. Alsop, R. J. L., J. Bonnyman, J. C. Duggleby, et al., Concentration of caesium-137 in Australian rainwater during 1964 and 1965. In press.
105. Mahmoud, K. A.. M. K. Moloukhia, F. H. Abdel-Sayed, et al., Fall out programme in U.A.R. during 1964. Environmental Laboratories, Atomic Energy Establishment of U.A.R. report U.A.R.S.C.E.A.R. vol. 7-1, June 1%5.
106. Hardy, E. P., Jr., J. Rivera. Figure 2-Monthly deposition of Sr90, New York City, p. 36 iri Health and Safety Laboratory fallout program quarterly summary report, April 1, 1966. USA.EC report HASL-171; v.e. United Nations document A/ AC.82/G/L.1075.
107. Volchok, H. L., Estimate of Sr90 deposition in New York City in 1964, pp. 275-279 in Health and Safety Laboratory fallout program quarterly summary report, January 1. 1965. USAEC report HASL-155; v.e. United Nations document A/ AC.82/G/L.990.
108. l\{oller, F., Quarterly rainfall maps for the whole world. Patermans Geographische Mitteilungen 95 : 1 (1957).
109. Federal Radiation Council, Revised fallout estimates for 1964-1965 and verification of the 1963 predictions. Report No. 6 (1964): v.e. United Nations document A/AC.82/G/L.977.
110. Harley, N., I. Fisenne. L. D. Y. Ong, et al., Fission yield and fission product decay, pp. 251-260 in Health and Safety Laboratory fallout program quarterly summary report, October 1, 1965. USAEC report HASL-164; v.e. United Nations document A/ AC.82/G/L.1036.
ll l. Harley, J.. Summary of working meeting on oceanic radioactivity. Health and Safety Laboratory memorandum. January 1966.
112. Broecker, W. S .. E. R. Bonebakker. G. G. Rocco. The vertical distribution of cesium-137 and strontium-90 in the oceans, 2. J. Geophysical Res. 71 : 1999-2003 ( 1966).
113. Bowen, V. T .. V. E. Noshkin. T. T. Sugihara, Equatorward transport of strontium-90 at middepths in the Atlantic Ocean. Progress report on USAEC contract HASL No. NY0-2174-41.
ll4. Sutton, D., Private communication.

115. Bowen, V. T., Private communication. 116. Broecker. \\T. S., Private communication. 117. Noshkin, V. E .. D. C. Sutton, Strontium-90 con
tamination in analytical reagents. pp. 389-397 in Health and Safety Laboratory fallout program quarterly summary report, April 1, 1966. USAEC report HASL-171: v.e. United Nations document A/AC.82/GjL.1075.
118. Rocco. G. G., W. S. Broecker, The vertical distribution of caesium-137 and strontium-90 in the oceans. J. Geophysical Res. 68: 4501-4512 (1963).
119. Nagaya, Y., M. Shiozaki, Y. Seto, Some fallout radionuclides in deep waters around Ja pan. J. Rad. Res. (Japan) 6: 23-31 (1965).
120. Bowen. V. T., T. T. Sugihara. Oceanographic implications of radioactive fall-out distributions in the Atlantic Ocean: from 20° N to 25° S from 1957 to 1961. J. Marine Res .. 23: 123-146 (1965).
121. B]J,OBeHitO B. M., I\oJieCIIIIIWB A. r., re]J,eOHOB .JI. H. II ,u;p., 3arpmnemrn ATJiaHTJillecr;.oro oxeaHa II ero MOpett ]J,O.lrOif;HB~II pa,D;IIOHYR:m,u;aim no Ha-6.i!IO]J,eHIIJrn B 1963-1964 ro,u;ax. Paper presented at the Symposium on the Disposal of Radioactive Wastes into Seas, Oceans and Surface Waters, Vienna, 16-20 May 1966.
122. OaMII.n;OB P. B., IIonoB H. Il., HeKoropue ,u;amrae o pacnpocrpaHemm npmrecett B oireane. Ta:M :ite.
123. IIonOB H. II., K on;em>e o6m;ero ItOJIBqecTBa crponD;IIJI-90 B MIIpOBOM OKeane. I'ocy,u;apcTBeHlllidt liOMHTeT no 11cnom.aOBaHHIO aTOlIBOfi anepI'IlH CCCP. Moc1rna, 1965; v.e. ]J,OI(YlieHT OOH A/ AC.82/G/L.1081.
124. Kap on Il .• ! .. I\pacnoneBn;eB IO. B., Bmienclillfi B.~n p;pyrne, Cpa1mIITe11IiJThlil: anaJIII3 rJo6am.nm: BhTIIa,n;en11tt IlpO]J,JKTOB JI]J,epmn: B3phtBOB Ha MaTePlffiH II OKeaHbl. rocyp;apcTBenlilidl ROMJITeT no IIcrro11baonaHIIro aTOMHOi1 anepnm CCCP, Moc1ma. 1965; v.e. ]l;OKJ!IeHT OOH A/ AC.82/G/L.1080.
125. IIonoB H. Il., IlaTIIH C. A., OcnoBmrn qepm rJI0-6a.JILnoro pacrrpe,u;eJiemrn crpo~JI-90 na nonepxnocTII MnpoBoro oteana (1960-1961 rr.). rocynapcTBeHlllidt KOMIITeT no IlCIIOlIL30BaHnIO aTOMHOI sneprnn CCCP, MocIIBa, 1965; v.e. ]J;OitYMeHT OOH A/ AC.82/G /L.1082.
126. IIarIIH C. A., 0 pernonam,noM pacnpe;n;e11enmr crponn;nH-90 na no11epxnocrn :mrpoBoro o:i;.eana. 0Realio.Jorn.ll 5: 458-462 (1965).
127. Nagaya. Y., M. Shiozaki, Y. Seto, Radioactive contamination of the Indo-Antarctic Ocean water in each earlier period in 1%1 and 1962. J. Rad. Res. (Japan) 5: 206-214 ( 1964).
128. IIorroB H. H .. Op.110B B. l\L IlaTIIH C. A. n )lp .. Crponrrntt-90 B rroBepxnocTHiiu BO,n;ax HH;nillctoro oReana 11 1960-1961 ro,u;ax. rocy,ll;apcTBeHHiirl1 KO)nITeT no ncnonaoBamuo armrnott eHeprIIII CCCP. MocKBa. 1963; v.e. iJ:OI\)'MeHT OOH A/AC.82/G/L.904.
129. BapaHOB B. 1I .. B.rr.oBeHJiO B. M., re.n;eOHOB .II. II. n ,u;p., 3arpsranerrrre 01rnanoB .n;o.1romrrBym;inrn pa,11,noa:r>TIIBHLIMII nyurr,11,a~m no ;n;aHniirn coBercrrnx ncc.Jie;i:oBamrn, crp. 72-81 B KHnre: Tpy;n;LI rpenett Melt\)!j"Hapo;mott KOHcpepe~ IIO IICIIOJTh30Bamno aTo::irnott sneprnn B MIIpHI>IX I(e.rnx. TOM 14. Opramrnanrr.H 06'Le.rr.nnemmx Ha~tt. Hnro-HopK, 1965.
130. Be:ureB B. II .. Ko.'!eC.HilKOB A. r .. He;ierro B. A .. OIIpe,u;e.wrrrre rrHTeIICIIBHOCTII pa,u;rroaKrnBnoro aa-
90
rpJiaHeHIUI B o:&eane na OCHOBe HOBLIX .n;aIIHEX 0 npon;ecce oforena. TaM :Ee, TO:\! 14, CTP. 83-86.
131. Broecker, \V. S., Radioisotopes and the rate of mixing across the main thermoclines of the ocean. In press.
132. Chesselet, R., C. Lalou, D. Nordemann, Methodes et resultats de mesure de radioactivite dans la mer Colloque international sur ''La pollution du milie~ marin", 15, 16, 17 septembre 1964. C.E.R.B.0.M. Nice '
133. Bowen, V. T., T. T. Sugihara, Strontium-90 in the "mixed layer" of the Atlantic Ocean. Nature 186: 71-72 (1960).
134. Broecker, W. S., G. G. Rocco, H. L. Volchok, Strontium-90 fallout: comparison of rates over ocean and land. Science 152: 639-640 {1966).
135. IllBe,u;on B. II., IOae<Iiomrri: A. A., re.n;eonon .[, B. n .n;p., Onpe,n;eJreHIIe crpomi;IIJI-90 11 Bo;n;ax ATJ:anTJI'Iec1wro OJieaHa B 1961 f0,11,y. I'ocy,n;apcTBeHHld KOMIITeT no IICilOJIL30BaHIIIO aTOMHO:tt 9Heprnn CCCP, MocKBa, 1963; v.e. p;oKyMeHT OOH A/AC.-82/G/L.899.
136. Suschny, 0., Radioactive contamination of the oceans. pp. 123-146 in Meteorological Aspects of Atmospheric Radioactivity. WMO Technical Note No. 68. Bleeker, W., ed., World Meteorological Organization. Geneva, 1965.
137. Volchok, H. L., The global strontium 90 budget. J. Geophysical Res. 71: 1515-1518 (1966).
138. Chesselet, R., D. Nordemann, C. Lalou, Etude comparative des tame de retombees radioactives maritimes et continentales. C. R. Acad. Sc. (Paris) 260: 2875-2878 (1965).
139. ()stlund, G., Private communication.
140. Machta, L., D. L. Harris, K Telegadas, Sr90
concentrations in Lake Michigan. In press.
141. Walser, M., B. H. B. Robinson, Renal excretion and tubular reabsorption of calcium and strontium, pp. 305-326 in The Transfer of Calcium and Strontium Across Biological Membranes. Wasserman, R. H. ed., Academic Press, N. Y., 1963.
142. Marcus, C. S., R. H., \Vasserman, Comparison of intestinal discrimination between calcium-47, strontium-SS, and barium-133. Am. J. Physic!. 209: 973-977 ( 1965).
143. Rivera, J., Strontium-90 in diet and bone of San Juan, Puerto Rico residents of low income, pp. 130-133 in Health and Safety Laboratory fallout program quarterly summary report, October 1, 1964. USAEC report HASL-149: v.e. United Nations document A/AC.82/G/L.971.
144. Burton. J. D.. R. Scott Russell, The use of measurements of stable strontium in diet and in bone to infer the e..xtent of discrimination between strontium and calcium in metabolic processes, pp. 73-79 in Agricultural Research Council Radiobiological Laboratory Annual Report 1963-64, ARCRL-12 (1964): v.e. United Nations document A/ AC.82/G/L.964.
145. Beninson. D .. E. Ramos. R. Touzet. Strontium-90 in the diets and bones of children. Progress report II. pp. 119-129 in Health and Safety Laboratory fallout program quarterly summary report. October 1, 1964. USAEC report HASL-149; v.e. United Nations document A/AC.82/GjL.971.

146. ::Mapefi .A. !L KHIIil\HTIIWB B. A., HpneB E. il., .Hcc:reµ;oBamre sKcrparnpoBaHfilTI sy6oB EaK MeToµ; 11acco:soro EOHTpo.rn sa co;i;eparn.mreM crpom:µur-90 B Opramrn:lle JIO,;i;e:tl. rocy,n:apcTBeRHHii EOMHTeT ITO ncno,n,soBamno aTOiirnofi s:aeprnn CCCP, :Moc:i;,11a, 1965; v.e. ,n:oKpreHT OOH A/AC.82/G/L.1087.
147. l\fapefi A. H., .Hp~ell E. H., :MonceeHKO e. M.. K BOnpocy o pacnpe,n;eJie:ann cTpoHu;na-90 n cRe:rere B3pOC.'!OTO tJ0.iIOBeEa. rocy,IJ;apCTB€HHfilfi JtQ)IITT€T no ncrro.T&30Bamno aroIDio.li BHepTIIB CCCP, M:oc:i;;Ba. 1965; v.e. ,!l;OEyMeHT OOH A/ AC.82/G/L.1086.
148. Kuip, J. L.. A. R. Schulert, E. J. Hodges. Strontium-90 in man IV. Science 132: 448-454 (1960).
149. Bryant, F. J., J. F. Loutit, Human bone metabolism deduced from strontium assays. Atomic Energy Research Establishment, Hanvell. report AERE-R-3718 (1961).
150. Rivera, J., J. H. Harley, Calcium, strontium-90 and stable strontium in two human skeletons. pp. 21-23 in The HA.SL bone program 1961-1964. USAEC report HASL-163: v.e. United Nations document A/ AC.82/G/L.1030.
151. Department of National Health and Welfare. Ottawa, Canada, Radiation Protection Division, Data from radiation protection programs, vol. 1 (1963); vol. 2 (1964): vol. 3 (1965); vol. 4 (1966).
152. United States Department of Health. Education, and Welfare, Public Health Service, Radiological Health Data, vol. 5 ( 1964) ; vol. 6 ( 1965) ; vol. 7 (1966).
153. Mirna. A.. Untersuchungen iiber die Radioaktivitat der in Osterreich im Jahre 1963 konsumierten Lebensmittel. pp. 35-42 in Radioaktivitatsmessungen in Osterreich. 4. J ahresbericht-1963. Bundesministerium fiir soziale Verwaltung, Wien. 1964.
154. Rivera, J., J. Harley, HASL contributions to the study of fallout in food chains. pp. 13-14 in HASL-147: v.e. United Nations document A/ AC.82/G/L.959.
155. Agricultural Research Council Radiobiological Laboratory, Annual report 1964-65. Report ARCRL 14 (1965): v.e. United Nations document A/ AC.82/G/L.1042.
156. l\Iapeii A. H .. KHIIaIBIIBOB B. A., .Hpn;eB E. IiI. n ;q>., CoAepamHIIe crpomnm-90 B 1wcrHoii: TKa:arr :aaceJieHIIJI CoBeTCROTO Coroaa B 1959-1963 roti:ax. rocyµ;apcTBeHH:orfi R01fIITeT no IICIIO.i!b30BaHHro aTOMHOii sHeprnn CCCP, AToMns,D;aT, l\IocKna. 1964; v.e. ,TI;ORy:ti!eHT OOH A/AC.82/G/L.1026.
157. l\fapeit A. H.. KrrmrrnmwB B. .A., .Hpn;eB E. IiI .. Coµ;eparn:arre crpoHIJ,Il.rr-90 B ROCTHOii TKa:an naceJie:ana CCCP. rocy,n;apcTBeHHhlii ROMIITeT no ncno;rr,aona:amo aTO:illIOfi SHepTim CCCP. MocIIBa, 1965: v.e. ,ll;OKyMeHT OOH A/AC.82/G/L.1084.
158. Liniecki, J .. Some aspects of the kinetics of Sr90
accumulation in the body under conditions of chronic intake. Pelnomocnik Rzadu d/s Wykorzystania Energii Jadrowej. Warszawa. 1963.
159. Kulp, J. L., A. R. Schulert, Strontium-90 in man V. Science 136: 619-632 ( 1962).
160. Bartlett. B. 0 .. R. Scott Russell, Prediction of future levels of long-lived fission-products in milk. Nature 209: 1062-1065 (1966).
91
161. Fredriksson. L.. R. J. Garner, R. Scott Russell, Caesium-137, chap. 15 in Radioactivity and Human Diet. Scott Russell, R., ed .. Pere-amon Press. Oxford, 1966. ~
162. Squire, H. M .. L. J. 1'1iddleton. The behaviour of caesium-137 m soils and pastures. Radiation Botany. In press.
163. Barber. D. A., Influence of soil organic matter on the entry of caesium-137 into plants. Nature 204: 1326-1327 (1964).
164. Shone. M. G. T., Effect of organic matter on the absorption of caesium by soils and clays, pp. 62-64 in Agricultural Research Council Radiobiological Laboratory Annual Report 1964-65, ARCRL 14 (1965): v.e. United Nations document A/ AC.82/G/L.1042.
165. Squire. H. M., W. A. Mitchell, The effect of organic matter on the absorption of caesium-137 by ryegrass, i!J.id., pp. 60-62.
166. Jokelainen, A., Diet of the Finnish Lapps and its caesium-137 and potassium contents. Acta Agralia F ennica (Helsinki) vol. 103 ( 1965).
167. Palmer. H. E., T. M. Beasley, Fe-55 in humans and their foods. Health Physics. In press.
168. Perkins, R. W .. J. M. Nielsen, Sodium-22 and caesium-134 in foods. man and air. Nature 205: 866-867 ( 1965).
169. Hill. C. R.. Po210 content of human tissues in relation to dietary habits. Science 152: 1261-1262 (1966).
170. Holtzman. R. B., The Pb210 (RaD) concentrations of some biological materials from Arctic regions. pp. 59-69 in Argonne National Laboratory annual report ANL-6769 (1963).
171. Kauranen, P .. J. K. Miettinen. 210Po and 210Pb in enviromnental samples in Finland in University of Helsinki, Department of Radiochemistry annual report 1965. Helsinki, 1966.
172. Persson, B., Iron-55 from fallout in lichen, reindeer and Lapps. Paper presented at the International Symposium on Radioecological Concentration Processes, Stockholm, April 25-29 (1966).
173. Miettinen. J. K., E. Rasanen, 137Cs in Finnish Lapps and other Finns in 1962-65 in University of Helsinki. Department of Radiochemistry annual report 1965. Helsinki, 1966.
174. Liden, K., M. Gnstafsson, Relationship and seasonal variation of 137Cs in lichen, reindeer and man in northern Sweden, 1961 to 1965. Ibidem.
175. Nevstrueva, M. A., P. V. Ramzaev, A. A. Moiseev, et al., The nature of caesium-137 and strontium-90 transport over the lichen-reindeer-man food chain. Ibidem.
176. Kolehmainen. S .. E. Rasanen. J. K. Miettinen, 137 Cs levels in fish of different limnological types of lakes in Finland during 1963. Health Physics. In press.
177. Kolehmainen, S., E. Hasanen, J. K. Miettinen, 137Cs in fish, planh."ton and plants in Finnish lakes during 1964-65 in University of Helsinki, Department of Radiochemistry annual report 1965. Helsinki, 1966.
178. Liden, K., Private communication.
179. Miettinen, J. K., Investigations of radioactivity in man and his environment in the Finnish Lapland. Proc. Ann. Acad. Sci. Fenn. In press.

180. Bengtsson. L. G .. Y. Naversten. K. G. Svensson, Maternal and infantile metabolism of caesium, pp. 21-32 in Assessment of Radioactivity in Man, vol. II. IAEA, Vienna, 1964.
181. Vennart, J., Use of whole body counters in radiobiological protection. Nature 204: 1041-1046 (1964).
182. Salo, K., U. Uotila, the 90Sr content of human bone and 137Cs content of human muscle in Finland in 1961-1965. Acta Radiologica. In press.
183. Melandri. C., 0. Rimondi, In vivo measurements of Cs137 with human body counter, pp. 143-145 in Assessment of Radioactivity in Man, vol. II. IAEA, Vienna, 1964.
184. Van Dilla, M.A., On the retention of cesium-137 in people. Health Physics 11: 21-22 (1965).
185. Hesp, R., The retention and excretion of Cs-137 by two male subjects, pp. 61-74 in Assessment of Radioactivity in Man, vol. II. IAEA, Vienna, 1964.
186. Naversten, Y., K. Liden, Half-life studies of radiocaesium in humans, ibid., pp. 79-87.
187. Jordan, R. D., J. S. Burkle, L. T. Brown, et al., Caesium-137 chloride retention following accidental ingestion, ibid., pp. 103-113.
188. Jeanmaire, L. Note au sujet de deux types de contamination humaine par le 137Cs., ibid., pp. 75-78.
189. Miettinen, J. K., Private communication. 190. ~fay, U., W. Stahlhofen, A. Kaul, Distribution
of caesium-137 in samples consisting of soft tissue, bone and bone-marrow (preliminary results), pp. 49..(i() in Assessment of Radioactivity in Man, vol. II. IAEA, Vienna, 1964.
191. Ellett, W. H., G. L. Brownell, Caesium-137 fallout body burdens, time variation and frequency distribution. Nature 203: 53-55 ( 1964).
192. Yamagata, N., K. Iwashima, T. Nagai, et al., In vivo experiment on the metabolism of caesium in human blood with reference to rubidium and potassium. To be published in J. Rad. Res. (Japan).
193. Yamagata, N., Blood levels of caesium-137 in people in the Far East and the Pacific region. Nature. In press.
194. Lindell, B., A. Magi. The occurrence of Cs137 in Swedish food, especially dairy milk and in the human body after the nuclear test explosions in 1961 and 1962. Arkiv for Fysik 29: 69-96 ( 1965).
195. Ellis, F. B., B. T. Barnes, Relationship between the concentration of caesium-137 in beef and milk, pp. 77-78 in Agricultural Research Council Radiobiological Laboratory annual report ARCRL 14 (1965): v.e. United Nations document A/AC.82/ G/L.1042.
196. Johnson, J .. G. !If. Ward, A. H. Dahl, Comparisons of Cs137 levels in feed and meat of cattle fed on pasture and in the dry lot. Health Physics 10 : 621 ( 1964). Abstract.
197. Saiki. l\L G. Tanaka, Gross beta-radioactivity and radioactive iodine and other radionuclides in rain and dry fallout, pp. 9-11 in Radioactivity Survey Data in Japan, No. 5, November 1964: v.e. United Nations document A/AC.82/G/ L.1044.
92
198. Murayama, N., H. Fujimoto, ?.L Kamiyama, Dat:: of the second nuclear test by People's Republic .of China, pp. 27-36 in Radioactivity Survey Data m Japan, No. 7, May 1965: v.e. United Nations document A/ AC.82/G JL.107 4.
199. Danbara, H., T. Mitsuhashi. Radioactive iodine-131 in milk, part I, and Saiki, M., G. Tanaka, part II, p. 20 in Radioactivity Survey Data in Japan, No. 5, November 1964: v.e. United Nations document A/AC.82/G/L.1044.
200. Saiki. M., Y. Ohmomo, H. Yamaguchi, Iodine!31 in milk. p. 37 in Radioactivity Survey Data m Japan, No. 7, Mav 1965: v.e. United Nations document A/AC.82iGJL.1074.
201. Mahmoud, K. A., M. K. Moloukhia, S. A. AbdelLatif, et al., Sr90 and !131 content of certain food items in U.A.R. during 1964. Atomic Energy Establishment of U.A.R., Environmental Laboratories report U.A.R.S.C.E.A.R.. vol. 7-2, June 1965.
202. Sa_iki, M., G. Tana~, Iod.ine-1.31 in human thy:01d glands, p. 23 in Radioactivity Survey Data m Japan, No. 5, November 1964: v.e. United Nations document A/AC.82/G/L.1044.
203. Saiki, M., G. Tanaka, Iodine-131 in human urine, 1'.bid .. p. 23.
204. De Bartoli, M .. P. Gaglione, A. Malvicini. Sodium-22 in fall-out, herbage and milk at Ispra, pp. 270-274 in Health and Safety Laboratory fallout program quarterly summary report. January 1, 1965. USAEC report HASL-155; v.e. United Nations document A/AC.82/G/L.990.
205. De Bartoli, M .. P. Gaglione, A. Malvicini, Some data and comments on sodium-22 in food chains. Health Physics 12: 353-359 ( 1966).
206. Aarkrog. A., J. Lippert, Environmental radioactivity in Denmark in 1963. Danish Atomic Energy Commission Riso report 85 ( 1964).
207. Aarkrog, A., J. Lippert, Environmental radioactivity in Denmark in 1964. Danish Atomic Energy Commission Riso report 107 (1965).
208. Sa.x, N. Y., J. J. Gabay, Occurrence of ~•Mn in human and bovine livers. Letter to the editor. Health Physics 11: 585 (1965).
209. Libby, W. F .. R. Beyer, J. F. Mead et al., Replacement rates for human tissue from atmospheric radiocarbon. Science 146: 1170-1172 (1964).
210. Nydal, R., K. Lovseth, Distribution of radiocarbon from nuclear tests. Nature 206: 1029-1031 (1965).
211. Drobinski, J.C., Jr .. D. P. La Gatta, A. S. Goldin et al., Analyses of environmental samples for carbon-14 and tritium. Health Physics 11: 385-395 (1965).
212. Rundo, J., D. Newton, Inhalation and retention of fallout zirconium-95 by human beings. Nature 205: 37-40 (1965).
213. Wrenn, M. E., R. Mowafy. G. R. Laurer, 9~Zr-95Nb in human lungs from fallout. Health Physics 10: 1051-1058 (1964 ).
214. Schonfeld, T., C. Friedmann. Deposition of inhaled fission products in lungs and pulmonary lymph nodes of human beings. Summary report on research project, Vienna, February 1965.
215. Beninson, D., Private communication.

216.
217.
218. 219.
220.
221.
222.
223. 224.
225. 226. 227. 228.
229.
230. 231.
232.
233.
234.
235.
Salo, A., Strontium-90 and caesium-137 in water in Finland. Institute of Radiation Physics, Helsinki, report SFL-A4, April 1966. 3DffiOBa .-\. C., Te.1)'1!IlillHa E . .iL . .Hp:a;eB E. ll. n .n;p., HeEorophle ,u;aHHhie o 3aBnc1LuocTII MejRp,y co;i.ep:1rnmie:\l CTpO~Irn-90 II :a;e3IIJI-137 B ORpy;imrom;ejt cpe;i;e II Opramrn:ue i!IO.'.l;efi. focy;i;apcTBeHIIhlfi Ii.O:\IHTeT no rrcno.Tu30namno aro11rnofi sneprnrr CCCP, }Ioc1;na. 1966; v.e. µ;oEyMeHT OOH A/ AC.82/G/L.1089. Krey, P. Vv., Private communication. Volchok, H. L., The HASL surface air sampling program summary report for 1963. USAEC report HASL-156 (1965); v.e. United Nations document A/ AC.82/G/L.993. Salter, L. P., High altitude balloon sampling program, pp. 54-99 in Health and Safety Laboratory fallout program quarterly summary report. October 1, 1964. USAEC report HASL-149; v.e. United Nations document A/AC.82/G/L.971. United States Department of Health, Education, and Welfare, Public Health Service, Special compilation of data from Radiological Health Data, vol. 2 (1961), vol. 3 (1962), vol. 4 (1963), vol. 5 (1964), vol. 6 (1965). Rivera, J., Tri-city diet study. USAEC reports HASL-138, pp. 163-165 (1963); HASL-140, pp. 163-165 (1963); HASL-142, pp. 182-184 (1964); HASL-144, pp. 281-287 (1964): v.e. United Nations documents A/ AC.82/G/L.842; G/L.856; G/L.871 and G/L.936. Rivera, J., Private communication. Boulanger, R., La retombee radioastive 11;1esuree a Mol. Rapport d'avancement, annee 1963. Report CEEN-R.2302 (1964); v.e. United Nations document A/ AC.82/G/L.987. Cohen, J. A .. Private communication. Muller, J .. Private communication.
Aarkrog. A., Private communication. Aarkrog, A., J. Lippert. Environmental radioactivity in the Farces in 1963. Danish Atomic Energy Commission Riso report 86 (1964 ). Aarkrog, A., J. Lippert, Environmental radioactivity in the Farces in 1964. Danish Atomic Energy Commission Riso report 108 (1965).
Merten. D., Private communication. Paakkola. 0 .. Radiostrontium in milk, grass and some other biological samples in Finland. Institute of Radiation Physics, Helsinki. report SFLA3, April 1966. Commissariat a l'Energie atomique, Departement de la protection sanitaire. pollution radioactive des denrees alimentaires. Tableaux recapitulatifs. Document destine a l'enquete de l'OAA. octobre 1963. Service central de Protection contre les rayonnements ionisants. Rapport d'activite. SCPRI (RM) I to XII (1964): SCPRI (RM) I to XII (1965); SCPRI (RM) I (1966). Republique frani;aise. Premier Ministre, Commissariat a l'Energie atomique, La contamination radioactive du lait et du regime alimentaire total pour I'annee 1965. Rapport inedit. Theodorsson. P., Private communication.
93
236.
237.
238.
239.
240.
241.
242. 243. 244.
245.
246.
247.
248.
249.
250.
251.
Hvinden, T., A. Lillegraven, Cesium-137 and strontium-90 m milk m Norway 1960-1964. Forsvarets Forskningsinstitutt intern rapport F-460 (1965). Huber, P., 7. Bericht der Eidg. Kommission zur uberwachung der Radioak"tivitat zuhanden des Bundesrates fiir das Jahr 1963. Bulletin des Eidg. Gesundheitsamtes Nr. 4 (1964); v.e. United Nations document A/ AC.82/G/L.979. Huber. P., 8. Bericht der Eidg. Kommission zur uberwachung der Radioaktivitii.t zuhanden des Bundesrates fiir das Jahr 1964. Bulletin des Eidg. Gesundheitsamtes N r. 5 ( 1965) : 'i.1.e. United Nations document A/ AC.82/G/L.1041. I\mn1mmiOB B. A., CTeIIaHOB IO. c., IIelJXOBa a. B. II ;i;p., IIocTy11.1em1e npo,u;yxToB IICIIIiITamrtt Ji,],epHOro opyjJCJUI nace.rrenmo Conerc1mro Coroaa c ITIIm;e:nmr pa.n;nono)I n no,u;ofi n 1963-1964 roµ;ax. rocy.u;apcTDeH1llilil KOMIITeT IIO IlCil0.lb30Danmo aTOMHOil aneprnn CCCP. l\Ioc1rna, 1965; v.e. ,Ii;OKfMeHT OOH A/AC.82/G/L.1083. Agricultural Research Council Radiobiological Laboratory, Interim report: Radioactivity in milk. 1965. Report ARCRL 15 ( 1966) ; v.e. United Nations document A/AC.82/G/L.1069. Feige, Y., E. Eisenberg, N. Passy. et al., Estimation of the 00Sr in the Israeli diet during 1962-1963 as based on the radioanalysis of milk. Health Physics 11: 629-635 (1965). Prulov. Y.. M. Stiller, Private communication. Vohra. K. G., Private communication. Asari, T., 1-.L Chiba, M. Kuroda. Strontium-90 and cesium-137 in milk, pp. 9-13 in Radioactivity Survey Data in Japan, No. 1 (1963); v.e. United Nations document A/AC.82/G/L.921. Danbara, H .. T. Mitsuhashi. Strontium-90 and cesium-137 in milk, pp. 13-16 in Radioactivity Survey Data in Japan. No. 1 (1963): v.e. United Nations document A/AC.82/G/L.921. Asari. T., l\L Chiba. M. Kuroda. Strontium-90 and cesium-137 in milk in Radioactivity Survey Data in Japan, No. 3 (1964). Asari, T., M. Chiba. M. Kuroda. Strontium-90 and cesium-137 in milk. April 1964-Sept. 1964. pp. 18-19 in Radioactivity Survey Data in Japan, No. 6, Feb. 1965. National Institute of Radiological Sciences, Chiba, Japan. Asari. T., l\L Chiba. M. Kuroda. Strontium-90 and cesium-137 in milk. Oct. 1964 to July 1965, pp. 14-15 in Radioactivity Survey Data in Japan, No. 7. Mav 1965: v.e. United Nations document A/AC.82/GfL.1074. Bryant. F. J., W. J. Gibbs, J. R. Moroney et al., Strontium-90 in the Australian environment during 1963. Australian J. Sci. 27: 222-226 (1965): v.e. United Nations document A/AC.82/ G/L.1011. New Zealand Department of Health. National Radiation Laboratory. Fallout in New Zealand. Annual report for 1963, NRL/Fll (1964). New Zealand Department of Health. National Radiation Laboratory. Environmental radioactivity in New Zealand. Quarterly report. NRL/ F20. In press. Beninson. D .. Radioestroncio y estroncio estable en la dieta y el hueso humano. Comisi6n Nacional

253.
254.
255.
256.
257.
258. 259.
260. 261.
262.
263.
264. 265.
266.
267.
268.
269.
270.
de Energia At6mica de Ja Reptiblica Argentina, 1964. Aarkrog, A., J. Lippert, Environmental radioactivity in Greenland in 1963. Danish Atomic Energy Commission. Riso report 87 ( 1964). Aarkrog, A., J. Lippert, Environmental radioactivity in Greenland in 1964. Danish Atomic Energy Commission, Riso report 109 (1965). Der Bundesminister fiir \i\Tissenschaftlicbe Forschung, Umweltradioaktivitii.t und Strahlenbelastung. Bericht II/64, p. 144; II/65, p. 126. Agricultural Research Council Radiobiological Laboratory, Annual report 1963-64. Report ARCRL 12 ( 1964); v.e. United Nations document A/AC.82/G/L.964. Agricultural Research Council Radiobiological Laboratory. Annual report 1964-65. Report ARCRL 16. In press. Hiyama, Y., Private communication. Department of National Health and Welfare, Ottawa, Canada, Radiation Protection Division, Data from Radiation Protection Programs, vol. II. No. 6, pp. 32-33 ( 1964). Booth, A. H., Private communication. Rivera, J ., Strontium-90 in human vertebrae, pp. 236-240 in Health and Safety Laboratory fallout program quarterly summary report. July 1, 1964. USAEC report HASL-146; v.e. United Nations document A/ AC.82/G/L.958. Rivera, J., Strontium-90 in human vertebrae, 1964 results. pp. 296-306 in Health and Safety Laboratory fallout program quarterly summary report. July 1. 1965. USAEC report HASL-161; v.c. United Nations document A/AC.82/G/ L.1015. Rivera. ].. Sr90 in human vertebrae-1965 results. In press. Pribilla. 0.. Private communication. Pribilla. 0., U. Mutschke, Uber 90Sr-Kontamination von menschlirhen Geweben und einer Standardnahrung. Klinische Wochenschrift 43: 690-694 ( 1965). Kvaale. E .. A. F. Olsen, A. C. Pappas, et al., Assay of strontium-90 in human bone in Norway, 1962-1965. Private communication. Liniecki. J .. \V. Karniewicz, Sr90 in human bone in Poland from 1962 through 1964. Nukleonika. In press. 1'viedical Research Council, Assay of strontium-90 in human bone in the United I(ingdom. Results for 1963. part I. Monitoring report series No. 8 (1964): v.e. United Nations document A/AC.82/G/L.938. 1'1edical Research Council. Assay of strontium-90 in human bone in the United Kingdom. Results for 1963. part II. l\fonitoring report series No. 9 (1964): v.e. United Nations document A/AC.82/ G/L.973. l\Iedical Research Council. Assay of strontium-90 in human bone in the United Kingdom. Results for 1965, part I. with some further results for 1963 and 1964. Monitoring report No. 12 (1966): -c•.e. United Nations document A/AC.82/G/ L.1098.
271. Medical Research Council. Assav of strontium-90 in human bone in the United Kingdom. Results
94
272.
273.
274.
275. 276.
277.
278.
279.
280. 281.
282.
283.
284.
285.
286.
287.
288.
289.
for 1964, part I. Monitoring report series No. 10 (1965); v.e. United Nations document A/AC.82/ G/L.1009. Medical Research Council, Assay of strontium-90 in human bone in the United Kingdom. Results for 1964, part II. Monitoring report series No. 11 (1965); ·v.e. United Nations document A/ AC.82/G/L.1043. Saiki, M., T. Koyanagi, G. Tanaka, et al., Assay of strontium-90 in human bone in Japan. 1961-1963. J. Rad. Res. 5: 120-123 (1964). Saiki, M., G. Tanaka, A. Tomikawa. et al., Strontium-90 in human bone, pp. 19-21 in Radioactivity Survey Data in Japan, No. 7. May 1965; v.e. United Nations document A/ AC.82/G/ L.1074. Saiki, M., Private communication. Oberhausen, E., :Measurement of contaminated individuals. pp. 286-292 in USAEC report TID-7612 (1960). Richmond, C. R, J. E. Furchner, W. H. Langham. Long-term retention of radiocaesium by man. Health Physics 8: 201-205 ( 1962). McN eill. K. G., R. M. Green, The effective halflives of caesium and iodine in the body. Canadian J. Phys. 37: 528-529 (1959). Taylor, M.A., J. Vernart, D. ~L Taylor. Retention and excretion of caesium-137 by man. Phys. Med. Biol. 7: 157-165 (1962). Colard, J., Private communication. Rundo. J., J. I. Mason, D. Newton, et al., Biological half-life of caesium in man in acute and chronic exposure. Nature 200 : 188-189 (1963). Miller C. E .. Half-life of Cs137 in two men, p. 31 in Argonne National Laboratory report ANL-5596 (1956). Miller. C. E .. Distribution and retention of Cs137
after accidental inhalation. Argonne National Laboratory report UAC-8383: v.e. United Nations document A/AC.82/G/L.892. Rasanen. E .. J. K. :Miettinen. The body burden of caesium-137 in people of southern Finland. pp. 183-192 in Assessment of Radioactivity in Man, vol. II. IAEA, Vienna, 1964. Castren, 0., Gammaspectrometric determinations of caesium-137 and potassium in Finnish milk. Institute of Radiation Physics. Helsinki, report SFL-A2 (1966). Comitato Nazionale Energia Nucleare. Data on environmental radioactivity collected in Italy. January-June 1963. Report BI0/32/63; v.e. United Nations document A/AC.82/G/L.982. Comitato Nazionale Energia Nucleare, Data on environmental radioactivitv collected in Italy (January-June 1963). report No. BI0/32/63: July-December 1963. report No. RI0/04/64: Tanuary-June 1964, report Ko. BJ0/08/64: v.e. United Nations documents A/AC.82/G/L.982: G/L.1014; G/L.1062. Madshus, K.. A. Str~mme. 187Cs in people and food in N orwav. 1963-1965. Contract No. AT (30-1 )-3364 with USAEC. l\Iagi. A .. G. A. Swedjemark. Hatten aY cesium-137 i mejerimjolk i Sverige. Stateus Strals1.·ydds institut. Stockholm 1966. Unpublished report.

290. Danbara, H .. T. 1'1itsuhashi, Strontium-90 and cesium-137 in milk Feb. 1964-Dec. 1964. pp. 16-17 ·in Radioactivity Survey Data in Japan, :.'\o. 6, Feb. 1965. National Institute of Radiological Sciences, Chiba, Ja pan.
291. Bonnyman, J., J. C. Duggleby, J. Molina-Ramos, et al .. Concentration of caesium-137 in Australian milk ·during 1965. Private communication.
292. Alsop, R. J. L., J. Bonnyman, D. W. Kearn. et al., Concentration of caesium-137 in Australian milk during 1964. Australian J. Science 28: 69-71 (1965); v.e. United Nations document A/AC.82/ G/L.1066.
293. Brar. S. S., P. F. Gustafson. S. E. Muniak. Cs-137 in various Chicago foods, pp. 262-268 in Health and Safety Laboratory fallout program quarterly summary report, January 1. 1965. USAEC report HASL-155: v.e. United Nations document A/ AC.82/G/L.990.
294. Brar, S. S., P. F. Gustafson, D. M. Nelson, Cs-137 in various Chicago foods, pp. 267-271 in Health and Safety Laboratory fallout program quarterly summary report, April I, 1965. USAEC report HASL-158; v.e. United Nations document A/ AC.82/G/L.1002.
295. Brar, S. S., P. F. Gustafson. D. M. Nelson, Cs-137 in various Chicago foods, pp. 254-258 in Health and Safety Laboratory fallout program quarterly summary report, July 1. 1965. USAEC report HASL-161: v.e. United Nations document A/AC.82/G/L.1015.
296. Der Bundesminister fiir Wissenschaftliche Forschung, Umweltradioaktivifat und Strahlenbelastung. Bericht IV /65, p. 73.
297. Hiyama, Y., H. Hayami, N. Yamagata, et al., Japanese dietary habits and the fall-out problemII. J. Rad. Res. 5: 102-112 ( 1964).
298. Abe. M .. K. Kitahara, Y. Hiyama, et al., Annual reports of scientific research grants 1963. Radiation Effects, Ministry of Education, Japan, 1964.
299. Saiki, l\I., T. Ueda, Y. Suzuki, et al., S.trontium-90 and cesium-137 in total diet-July 1964 to July 1965, pp. 16-17 in Radioactivity Survey Data in Japan, No. 7. May 1965: v.e. United Nations document A/AC.82/G/L.1074.
300. Asari, T., M. Chiba, M. Kuroda, Strontium-90 and cesium-137 in total diet-May to Aug. 1965, ibid., pp. 17-18.
301. Department of National Health and Welfare, Ottawa, Canada, Radiation Protection Division. Data from Radiation Protection Programs, vol. II. No. 12, pp. 49-87 (1964).
302. Mahindra, V. K., J. H. Gordon, Cesium-137 levels in the Canadian North, January to June 1965, pp. 3-14 in Data from Radiation Protection Programs, vol. 3, No. 10, October 1965.
303. Finn, R. J., D. W. Lecuyer. M. E. Dancey. Fallout cesium-137 body burdens of 63 adult residents m Ottawa. pp. 3-12 m Data from Radiation Protection Programs. vol.. 3, No. 9. September 1965.
304. Palmer. H. E .. W. C. Hanson, B. J. Griffin, et al., Radioactivity measurements in Alaskan Eskimos in 1963. Science 144: 859-860 ( 1964).
95
305. Palmer, H. E., W. C. Hanson, B. ]. Griffin, et al., Radioactivity measured in Alaskan natives 1962-1964. Science 147: 620 (1965).
306. Bruce. W. D .. D. G. Remark, W. J. _.\verett, Cesium-137 body burdens of Alaskan men, spring 1965. Public Health Reports 80: 949-954 ( 1965).
307. Hanson, W. C., H. E. Palmer, Seasonal cycle of 1a•cs m some Alaskan natives and animals. Heaith Physics 11: 1401-1406 (1965).
308. Cohn, S. H., E. A. Gusmano, R. A. Love, Recent trends in the level of fallout caesium-137 in man. Nature 205: 537-539 ( 1965).
309. Dean. P. N., Private communication. 310. MacDonald, N. S., n'1. Hepler, E. James, et al.,
Changes in human body burdens of gamma radioactivities, 1960-64. Nature 206: 1127-1128 (1965). Also private communication.
311. Der Bundesminister fiir Wissenschaftliche Forschung. Der Cs-137 Gehalt 1m menschlichen Korper. Umweltradioaktivitat und Strahlenbelastung II/63, pp. 139-140; UI/63, p. 151; IV /63, p. 151; I/64, p. 196; II/64, p. 146; III/64, p. 146; IV/64, p. 144; I/65, p. 131; II/65, p. 136.
312. Miettinen, J. K., Measurements of caesium-137 in Finnish Lapps in 1962-1964 by a mobile whole-body counter. pp. 193-204 in Assessment of Radioactivity in Man. vol. II. IA.EA, Vienna, 1964.
313. Suomela, M., Private communication. 314. Miettinen. J. K.. E. Rasanen. Cs137 in Lapps,
1966. Paper presented at the International Symposium on Radioecological Concentration Processes, Stockholm. April 25-29 ( 1966).
315. Pellerin, P., J.P. 'Moroni, M. L. Remy. Premiers resultats d'une etude systematique des contaminations internes consecutives aux retombees radioactives. pp. 121-133 in Assessment of Radioactivity in Man. vol. II. IAEA. Vienna, 1964.
316. Pellerin, P., Private communication. 317. Madshus, K., A. Str$<Smme. 137Cesium body
burden and its variation in 23 Norwegian school boys. Zeitschrift fiir Naturforschung 19 B : 1055-1057 (1964).
318. Karniewicz. W., J. Liniecki, A. Kosterkiewicz, Caesium-137 in population of Lodz (Poland) in 1963 and 1964. Nukleonika X: 35-49 ( 1965).
319. HeBC'rpyena l\I. A., l\IonceeB A. A., IIonoB ,11;. E. H ;iw., Xapa:itrepncmKa pal(nOaKTilBIIOro 3arpa:memrn OIIO.'IOTI11Iec1wtt nelIOlffiII MOX-OJeHb-TieJOBe:& Ha KpatirreM cenepe CCCP B 1961-1964 rol(ax:. rocyl(apcTBemratt KOMilTeT no IIClIO.lb30BaHIII-O aTOMHOti BHeprllII CCCP, ATollIBaJJ;aT, l\[ocruia, 1964; 'u.e. l(OKyMeHT OOH A/ AC.82/G/L.1027.
320. Rundo, J., D. Newton, Increase in the caesium-137 content of man due to radioactive fall-out, 1962-1964. Nature 203: 537-538 (1964).
321. Rundo, J .. Private communication. 322. Hesp, R.. Uptake of caesium-137, due to nuclear
weapon fall-out, in subjects from West Cumberland. Nature 206: 1213-1215 (1965).
323. Saiki, M., T. Iinuma. l\L Uchiyama. Cesium-137 content in human body, pp. 22-26 in Radioactivity Survey Data in Japan. No. 7. May 1965: v.e. United Nations document A/AC.82/G/L.1074.
324. Vlorthley, B .. Private communication.

325. IIorroB H. II .. IlaTIIH C. A., Ihe.IBIIH B. A. rr ,11.p., Crponn;rrtt-90 n BOp;ax Trrxoro OI>eaHa. rocy.n.apCTBeHIIhlii .&OMIITeT no IICnOJb30BaHif!O aTOMH011 aHeprun CCCP, ATOMH3,11.aT. MocKBa, 1963; v.e. .n;oKy:MeHT OOH A/AC.82/G/L.907.
326. Higano, R., Y. Nogaya, :M. Shiozaki, et al., On the artificial radioactivity in sea water. J. Oceanogr. Soc. Japan 18: 34-41 (1963).
327. Ilorron H. II., A;im~>a 8. r., I\ocoypon r. Il. u ,11.p., Crpoimntl-90 n noBepxHocTHiiIX no.n;ax ArnanTIItiecxoro o.&eana. 0Kea!IOJIOTIIJI 2: 845-848 ( 1962).
328. IlaT!I!I C. A., AJie1rnaH,11.poB A. B., Op;iion B. l\I., CrpoHn;liit-90 na rronepxnocrn AT:11anTifCiec1>oro OReaHa BO BTOpoii: IIO.'IOBIIBe 1961 ro](a. Tpy.n;LI IlHCTUTYTa o:&eanoJiorm1. B neqam.
329. AiKaJ!\a 8. r., llymwn II. M., CTpO!IIIIItt-90 B nonepxHOCTIII:ilX no.n;ax ATJianrnqecKoro 01rnana B nepEofi IIOJ:OEnne 1961 ro,11.a. OKeaHoJiorm1 4: 68-73 (1964).
330. 1'.IIIBe)f.OBB.TI., ~OaeipOBIIllA.A., Epom;en-illaKB.A. II )(llyrne, Onpe,11.e,;ienne co,11.epamHII.a: crpo~JI-90 n LiepnoM Mope. C6. «Pa11,noaKTJIBHaJr 3arpJiane1IHOCTh Mope.ii II oKeanon, Ila.n;-no «Hay1m>, )Joc1•na, 1964.
331. IIIne.u;on B. TI., TiaTirn C. A., l\IaKcmrnna A. M. II 11,p., Co!(epammie crpo!I~JI-90 B liep!IOM Mope n 1959-1961 ro,11.ax. rocy,11.apcTBemrnii r.omrreT no ncnonaoBanmo aToMHoil arrepl'.lm CCCP, Momma, 1963; v.e . .n;oKyMeHT OOH A/ AC.82/G/L.909.
332. cI>e,IJ;opon A. cI> .. Tiop;JIMaxllH B. H., KHJie;neHKo B. TI. u )(ll., PaiJ,1Ian;noHHaJI o6cTaHOBKa B npom.ICJOnLIX pattonax CenepHott AT.llanmrrn ( moHO-anrycT 1961 ro)(a). 01rnano;rornJI 4: 431-436 (1964).
333. IIIne.n;on B. TI., MaacIDiona A. M., Co.n;epamHIIe neItOTOpI.iIX ,11.0.llfOllniBYID;IIX rrpo,n;yitTOB )J;eJJeHJIJI B noBepXHOCTHJlIX B0,11.ax. C6 .. «Pa,11.IIoaKTIIBHLie sarpn:anemrn nnemHefi cpe;ri;LI>. illBe11.on B. TI. II illnpoKOB c. H., pe)J.., rocaTOMll3,11.aT, l\Iocruia, 1962.
334. Dera, J., B. Szczeblewski, B. Lo~~cijev:'ski, Skazenia radioaktywne wody morskieJ re1onu Polnocno-Europejskiego w latach 1959-1961. Acta Geoph. Polonica 10: 173-182 ( 1962).
335. Bowen, V. T .. The use of radioisotopes to determine the diffusion. dispersion and circulation of ocean waters, pp. 234-245 in Hearings before the Subcommittee on Research, Development and Radiation of the Joint Committee on Atomic Energy. Congress of the United States. 87th Congress, lst session on Applications of Radioisotopes and Radiation in the Life Sciences, March 27. 28. 29 and 30. 1961. U.S. Gov't. Printing Office, Wash .. D. C., 1961: v.e. United Nations document A/ AC.82/G/L.660/ Add.I.
336. Health and Safety Laboratory, Environmental contamination from weapon tests. United States Atomic Energy Commission. New York Operations Office, Oct. 1958: v.c. United Nations document A/AC.82/G/R.235.
337. Bowen, V. T .. T. T. Sugihara, ~farine geochemical studies with fallout radioisotopes. pp. 434-438 in Proc. 2nd Int'I. Conference on Peaceful Uses of Atomic Energy, vol. 18. United Nations, Geneva. 1958.
338. Miyake, Y., K. Saruhashi. Y. Katsuragi. et al., Cesium-137 and strontium-90 in sea water. Pap. 1feteorol. and Geophys. 12: 85-88 (1961).
96
339. Miyake, Y., K. Saruhashi, Y. Katsuragi, Paper submitted to the working group on ocean radioactivity, Special Committee on Oceanographic Studies, Vienna, April 1961 (as cited in Okeanologiya, vol. 2, No. 4 (1962) ).
340. Higano, R .. Radiochemical analysis of the equarorial Pacific surface water. Prepr. Int'l. Oceanogr. Congr., 1959. Washington, D.C., 1959.
341. Folsom, G., Paper submitted to the working group on ocean radioactivity, Special Committee on Oceanographic Studies, Vienna. April 1961 (as cited in Okeanologiya, vol. 2, No. 4 (1962) ).
342. Volchok, H. L., M. T. Kleinman, Fallout in the Atlantic Ocean. A preliminary evaluation based upon data from the ECHO station, pp. 295-299 in Health and Safety Laboratory fallout program quarterly summary report, April l, 1965. USAEC report HASL-158: v.e. United Nations document A/ AC.82/GjL.1002.
343. Hammond, R. R., T. H. Shirasawa, D. R. Minard, Fallout in the North Pacific Ocean, ibid., pp. 357-369.
344. Lindell, B., B. Aberg. Private communication.
345. Lindell, B., An approach to the question of computing doses and effects from fallout. Health Physics 2: 341-365 (1960).
346. Gibson, J. A. B., The gamma radiation background at Grove, Berkshire. Atomic Energy Research Establishment, Harwell. report AEREHP /GEN 39 (1964).
347. Marley, W. G .. Private communication.
348. Swedjemark, G. A., Gamma radiation at ground level in Sweden during 1960-1965. National Institute of Radiation Protection, Stockholm, Sweden, 1966.
349. Gustafson, P. F., S. S. Brar, External gammaray dose from short-lived fission products from nuclear weapon tests. Health Physics 9: 629-634 (1963).
350. Spiers, F. W., M. J. McHugh, D. B. Appleby, Environmental gamma-ray dose to populations : surveys made with a portable meter, pp. 885-905 in The Natural Radiation Environment. Adams, J. A. S., W. M. Lowder, eds., The University of Chicago Press, Chicago, Ill., 1964.
351. Lowder, W. M .. H. L. Beck, W. J. Condon, Spectrometric determination of dose rates from natural and fallout gamma radiation in the United States, 1962-1963. Nature 202: 745-749 (1964).
352. Gustafson. P. F .. S. S. Brar, ·Measurement of gamma-emitting radionuclides in soil and calculation of the dose arising therefrom, pp. 499-512 in The Natural Radiation Environment. Adams, J. A. S .. W. M. Lowder, eds .. The University of Chicago Press, Chicago. Ill., 1964.
353. Gustafson, P. F .. J. Kastner, J. Luetzelschwab, Environmental radiation: measurements of dose rates. Science 145: 44-47 (1964).
354. Lowder, W. M.. W. J. Condon. H. L. Beck, Field spectrometric investigations of environmental radiation in the U.S.A .. pp. 597-616 iH The Natural Radiation Environment. Adams. J. A. S .. W. M. Lowder, eds., The University of Chicago Press, Chicago, III .. 1964.

r I
355. Lowder, W. M., A. Segall, W. J. Condon, Environmental radiation survey in Northern New England, ibid .. pp. 907-917.
356. Lowder, W. M., W. J. Condon, Measurement of the exposure of human populations to environmental radiation. Nature 206: 658-662 ( 1965).
357. Appehdi.x 3, Intercalibration experiment, pp. 1029-1032 in The Natural Radiation Environment. Adams, J. A. S., W. M. Lowder, eds., The University of Chicago Press, Chicago, Ill., 1964.
358. Gibson, J. A. B., Measurement of the gamma radiation background. Atomic Energy Research Establishment, Hanvell , report AERE-R-4137 ( 1962).
359. Harley, J. H. , Fallout dose estimates, 1965-1969. Paper prepared for inclusion in an International Radiological Protection Society volume.
360. Beck, H. L., W. J. Condon, W. M. Lowder, Environmental radiation measurements m the southeastem, central and western United States, 1962-1963. USAEC report HASL-145: v.e. United Nations document A/AC.82/GjL.939.
361. Beck, H. L , W. J. Condon, W. M. Lowder, Spectrometric techniques for measuring environmental gamma radiation. USAEC report HASL-150 (1964).
362. Freiling, E. C., G. R. Crocker, C. E. Adams, Nuclear-debris formation . pp. 1-43 in Radioactive Fallout from Nuclear Weapons Tests. Proceedings of the Second Conference. Germantown, Maryland, November 3-6, 1964. Klement, A. W., Jr .. ed., USAEC Division of Technical Information. 1965: v.e. United Nations document A/ AC.82/G/LI057.
363. Lowder, W. M .. H. L. Beck, W. J. Condon, Dosimetric investigations of environmental
97
gamma radiation from deposited fission products, ibid., pp. 233-244.
364. Beck, H. L, Environmental gamma radiation from deposited fission products. 1960-1964. Health Physics 12: 313-322 (1966) .
365. Pavlotskaya, F. I., E. V. Tyuryukanova, V. I. Baranov, On the mobilitv of strontium and some other components of global fallout in soils and their accumulation in plants. Paper presented at the International Symposium on Radio-ecological Concentration Processes, Stockholm, 25-29 April 1966.
366. Walton, A., The distribution in soils of radioactivity from weapons tests. J. Geophysical Res. 68: 1485-1496 (1963).
367. Telfair, D., J. Luetzelschwab, Penetration of fallout fission products into an Indiana soil. Science 138: 829-830 (1962).
368. Gustafson, P. F., :Measurement of soil radioactivity and calculation of the dose therefrom, pp. 156-163 in Argonne National Laboratory Radiological Physics Division Semiannual Report, July through December, 1958. Report ANL-5967 (1959).
369. Yamasaki. F., M. Okano, M. Takeuchi, et al., Vertical distribution of fallout gamma-ray sources in ground soil in eastern Ja pan. Scientific Papers of the Institute of Physical and Chemical Research (Japan) 59: 106-111 (1965).
370. Takeuchi, M., Y. Nagahara, Y. Ishizuka, et al., To be published in J. Nucl. Eng. (Japan).
371. Souk, R. R., Gamma ray fields above rough contaminated surfaces. Paper presented at the Fallout Phenomena Symposium, Monterey, Cal., April 12, 1966.