report on 2013 general elections trial - barbados of... · table of contents subject page...
TRANSCRIPT

REPORT
ON THE
BARBADOS
GENERAL ELECTION
2013
TABLE OF CONTENTS
SUBJECT PAGE
Introduction
2. Revised Register of Electors -- Preliminary List .......................................................................... 1
3. Election Administration ............................................................................................................. 2
4. The Candidates ....................................................................................................................... 3
5. Polling Stations ....................................................................................................................... 3
6. Political Broadcasts .................................................................................................................... 3
7. Public Relations ....................................................................................................................... 4
8. Register for Elections ................................................................................................................. 4
9. Voting ........................................................................................................................................ 5
10. Counting of Votes and Publication of Results .......................................................................... 6
11. Election Expenses ....................................................................................................................... 6
12. Statistical Data ....................................................................................................................... 6
13. Appreciation ....................................................................................................................... 7
14. TABLE I -- Number and Percentage of Votes Cast by Party and Constituency ............... 8
TABLE II -- Votes Cast for Individual Candidates by Party and Constituency ............... 10
TABLE III -- Registered Voters and Votes Cast by Gender and Constituency ................. 12
TABLE IV -- Registered Voters, the Number and Percentage of Votes Cast,Rejected Ballot Papers by Polling Stations, Candidate andConstituency
1. City of Bridgetown ......................................................................................................... 14
2. St. Michael South ........................................................................................................... 15
3. St. Michael East .............................................................................................................. 16
4. St. Michael South Central .............................................................................................. 17
5. St. Michael Central ......................................................................................................... 18

SUBJECT PAGE
6. St. Michael South East .................................................................................................. 19
7. St. Michael North East ................................................................................................. 20
8. St. Michael North .......................................................................................................... 21
9. St. Michael North West ................................................................................................ 22
10. St. Michael West ........................................................................................................... 23
11. St. Michael West Central .............................................................................................. 24
12. Christ Church West ....................................................................................................... 25
13. Christ Church West Central .......................................................................................... 26
14. Christ Church South ...................................................................................................... 27
15. Christ Church East Central ........................................................................................... 28
16. Christ Church East ........................................................................................................ 29
17. St. Philip North ................................................................................................................ 30
18. St. Philip South ............................................................................................................... 31
19. St. Philip West ................................................................................................................. 32
20. St. George North ............................................................................................................. 33
21. St. George South ............................................................................................................. 34
22. St. John ..................................................................................................................... 35
23. St. Joseph ..................................................................................................................... 36
24. St. Thomas ..................................................................................................................... 37
25. St. James North ............................................................................................................... 38
26. St. James South .............................................................................................................. 39
27. St. James Central ............................................................................................................ 40
28. St. Peter ..................................................................................................................... 41
29. St. Andrew ..................................................................................................................... 42
30. St. Lucy ..................................................................................................................... 43
(ii)

APPENDIX “A” -- List of Persons Appointed as Returning Officers ........................................... 44
APPENDIX “B” -- List of Persons Appointed as Election Clerks .................................................. 45
APPENDIX “C” -- List of Polling Stations ........................................................................................ 46
APPENDIX “D” -- Summary of Candidates Election Expenses ......................................................... 58
SUBJECT PAGE
(iii)

REPORT ON THE BARBADOS GENERAL ELECTION 2013
1. INTRODUCTION
1.1 On Tuesday January 29, 2013, the Governor-General acting in accordance withSection 61 (2) of the Constitution of Barbados issued a Proclamation dissolving Parliament.Writs for an election in the thirty (30) constituencies were also issued on that date to the thirty(30) Returning Officers (Appendix A) appointed under Section 31(1) of the Representationof The People Act, Cap. 12 (hereinafter referred to as the "Act").
1.2 The Writs issued in accordance with Section 36 of the Act appointed:-Wednesday February 6, 2013 as Nomination Day,Thursday February 21, 2013 as Polling Day andFriday February 22, 2013 as the latest day for return of the Writs.
1.3 In accordance with Section 18 (1) (a) of the Act, on Tuesday January 29, 2013, theGovernor-General issued a Proclamation declaring the period ending SundayFebruary 17, 2013 as the Special Electoral Registration Period and on ThursdayJanuary 31, 2013, by Order, appointed Friday February 15, 2013 as:
1. The Polling Day for Foreign Service Electors at Missions, in accordance withRule 44 (1); and
2. The Special Polling Day for Election Officers, in accordance with Rule 30 (2A).
1.4 In accordance with Regulation 35(1) of the Representation of the People (Registration ofElectors) Regulations, 1990, the Chairman of the Electoral and Boundaries Commission(hereinafter referred to as the Commission) by Order dated Friday February 1, 2013, directedthe Chief Registering Officer to establish Electoral Revising Centres for each constituencyon Friday February 1, 2013. The Revising Centres remained opened for the receipt ofClaims until Wednesday February 6, 2013 and for Objections until Friday February 8, 2013.
2. REVISED REGISTER OF ELECTORS -- PRELIMINARY LIST
2.1 The Commission published the Preliminary List of Electors on Thursday January 31, 2013,in accordance with the provisions of Section 18 (1) (b) of the Act.
2.2 The Preliminary List, which comprised two hundred and forty-eight thousand, and thirty-one(248 031) electors, was made available to the two political parties, and to the general publicat the Public Library, the Electoral Department and the Revising Centres. On ThursdayJanuary 31, 2013, a notice was placed in the press, which invited the public to inspect thePreliminary List, the notice provided the dates by which Claims and Objections were to befiled with the Registering Officers at the Revising Centres.

2.3 The public was also informed via public notices in the newspapers that they should be registeredon or before Wednesday February 6, 2013, in order to be eligible to vote at the election.
3. ELECTION ADMINISTRATION
3.1 The General Election of Thursday February 21, 2013 was conducted by the Commission inaccordance with the provisions of the Representation of the People Act and Section 42 (1) ofthe Constitution of Barbados which provides that "The election of members to the House ofAssembly shall be conducted under the direction and supervision of the Commission". Themembers of the Commission are:-
Mr. Owen L. Estwick, GCM, BCH -- Chairman
Dame Billie Miller, DA, BCH -- Deputy Chairman
Mr. John Haynes, BSM, JP -- Member
Ms. Kim Thompson -- Member
Mr. Larry A. C. Smith, LLB (Hons.) -- Member
3.2 In accordance with Section 30 (1) of the Act, Mrs. Angela Taylor was appointed the Supervisorof Elections and the Governor-General, in accordance with Section 30 (2) of the Act, appointedMr. Ian Browne, the Deputy Supervisor of Elections.
3.3 In addition, two thousand, two hundred and fifty-nine (2 259) officers were engaged in theconduct of the elections, in the following categories:-
CATEGORY NUMBER
Returning Officers 30
Election Clerks 30
Special Presiding Officers 30
Special Poll Clerks 60
Presiding Officers 546
Poll Clerks 1275
Counting Assistants 258
Clerical Assistants 30
TOTAL 2259
2

4. THE CANDIDATES
4.1 Sixty-eight (68) persons were duly nominated on Wednesday February 6, 2013 to contest thethirty (30) seats in the election as listed below:
Barbados Labour Party -- 30 Candidates
Democratic Labour Party -- 30 Candidates
Peoples Democratic Congress -- 2 Candidates
Independents -- 4 Candidates
Kingdom Government of Barbados -- 1 Candidate
Bajan Free Party -- 1 Candidate
5. POLLING STATIONS
5.1 In establishing Polling Stations, the three hundred and thirteen (313) Polling Districts weredivided into five hundred and forty-one (541) Polling Divisions which were accommodated intwo hundred and fifty-three (253) buildings. Of these, one hundred and twenty-nine (129)were government buildings and one hundred and twenty-four (124) privately ownedproperties. A complete list of the Polling Stations is at Appendix C.
6. POLITICAL BROADCASTS
6.1 Regulations 4 (a) & (b) of the General Elections (Allocation of Broadcasting Time)Regulations 1990 make provision for the allocation of broadcasting time, during anelection, to any political party which satisfies the Commission that no less than ten of itsmembers are validly nominated candidates for the election.
6.2 The Barbados Labour Party and the Democratic Labour Party having complied withRegulation 4 and having submitted applications for the allocation of broadcasting time, wereallocated broadcasting time as follows:-
Democratic Labour Party
(1) Tuesday February 12, 2013
(2) Friday February 15, 2013
(3) Tuesday February 19, 2013
Barbados Labour Party
(1) Wednesday February 13, 2013
(2) Sunday February 17, 2013
3

6.3 The Barbados Labour Party's allocated broadcast for Wednesday February 13 was deferredto Thursday February 14, 2013.
7. PUBLIC RELATIONS
7.1 As part of the ongoing registration outreach programme for updating the Register of Electors,the Commission, through a Public Notice, used the print and electronic media to provide thepublic with the criteria for being registered as an elector and invited:
(i) all qualified persons 18 years and over who had not yet applied to be registeredas electors or who had not been photographed for a Barbados IdentificationCard to make the appropriate application;
(ii) all registered electors who had changed their addresses but had not yet notifiedthe Electoral Department to complete the required Change of Residence Form(Form 10) and file it with the Department.
7.2 The Public Notice was aired and published from March to July 2012 and fromNovember 2012 to January 2013.
7.3 There was another Public Notice which, from Friday February 15, 2013 to WednesdayFebruary 20, 2013, informed that the Electoral Office was functioning as an InformationCentre and provided twelve telephone numbers in the Electoral Office which persons coulduse to check the Polling Station at which they were registered to vote.
7.4 Additionally, electors were able to view the Polling Station, at which they were registered tovote, on line via the Government Portal at http://www.gov.bb. and on the Electoral Department'swebsite at www.electoral.barbados.gov.bb. Circulars were also sent to all electors informingof Polling District and Polling Station at which they were registered to vote; the circulars wereposted by Wednesday February 6, 2013 which gave electors adequate time to either makeenquiries by telephone or check their registration on line.
8. REGISTER FOR ELECTIONS
8.1 In accordance with Section 18 (3) of the Act, the Commission published a Register for Electionson Tuesday February 19, 2013, which comprised two hundred and forty-seven thousand, twohundred and sixteen (247 216) electors. It was made available to the political parties andother nominated candidates. It was also displayed for public inspection at the Public Libraryand the Electoral Department.
4

9. VOTING
9.1 VOTING BY ELECTION OFFICERS
9.1.1 Friday February 15, 2013 was designated Polling Day for the Election Officers. This wasdone to make it convenient for Election Officers to exercise their franchise before theThursday February 21, 2013, Polling Day when they would be deployed at various PollingStations, conducting the poll.
9.1.2 Special Presiding Officers were appointed by the Commission to supervise the voting, andpolling was conducted between 7.00 a.m. and 5.00 p.m., at the station in each constituencydesignated for that purpose.
9.1.3 One thousand seven hundred and eighty (1 780) Election Officers were registered to vote onSpecial Polling Day.
9.2 VOTING BY FOREIGN SERVICE ELECTORS
9.2.1 Friday February 15, 2013 was also designated as Polling Day for the Foreign ServiceElectors. The Electoral and Boundaries Commission in accordance with the provisions ofSection 13 (1) of the Act, appointed the Heads of the Missions as Presiding Officers at therespective Missions.
9.2.2 Twenty-eight (28) Foreign Service Electors were registered to vote on Polling Day.
9.3 VOTING BY OTHER ELECTORS
9.3.1 Thursday February 21, 2013 was designated as Polling Day for all other registered electorsand polling was conducted between 6.00 a.m. and 6.00 p.m., at the designated stations in eachconstituency.
9.3.2 Two hundred and forty-seven thousand, two hundred and sixteen (247 216) persons wereregistered to vote on Polling Day.
9.3.3 The number of registered electors totalled two hundred and forty-nine thousand, andtwenty-four (249 024) as follows:
Election Officers registered to vote on Friday February 15, 2013: 1 780
Foreign Service Electors registered to vote on Friday February 15, 2013: 28
Electors registered to vote on Thursday February 21, 2013: 247 216
249 024
5

10. COUNTING OF VOTES AND PUBLICATION OF RESULTS
10.1 Transport Board buses with Police escorts were used to transport Presiding Officers withballot boxes, other Election Officers and Polling Agents to the Counting Centres. Countingcommenced at approximately 8.00 p.m.
10.2 During the Count the Returning Officer in each constituency made periodic reports to themedia on the progress of the Count.
10.3 The Democratic Labour Party's candidate for St. Michael South East, Mr. Patrick Tannisrequested and received a recount on the night of the election.
11. ELECTION EXPENSES
11.1 In accordance with Section 52 (1) of the Act, all Candidates/Election Agents were requiredto file a Statement of Election Expenses with the Supervisor of Elections within seven weeksof the declaration of the results of the election.
11.2 Candidates/Election Agents are allowed to incur expenses to a maximum of $10.00 in respectof each person registered as a voter in their respective constituencies. Appendix "D" showsthe amount expended on behalf of each candidate.
12. STATISTICAL DATA
12.1 The accompanying tables present in detail the election results showing:-
Table I -- Number and percentage of votes cast per Party and Constituency.
Table II -- Votes cast for Individual Candidates by Party and Constituency.
Table III -- Registered voters and votes cast by Gender and Constituency.
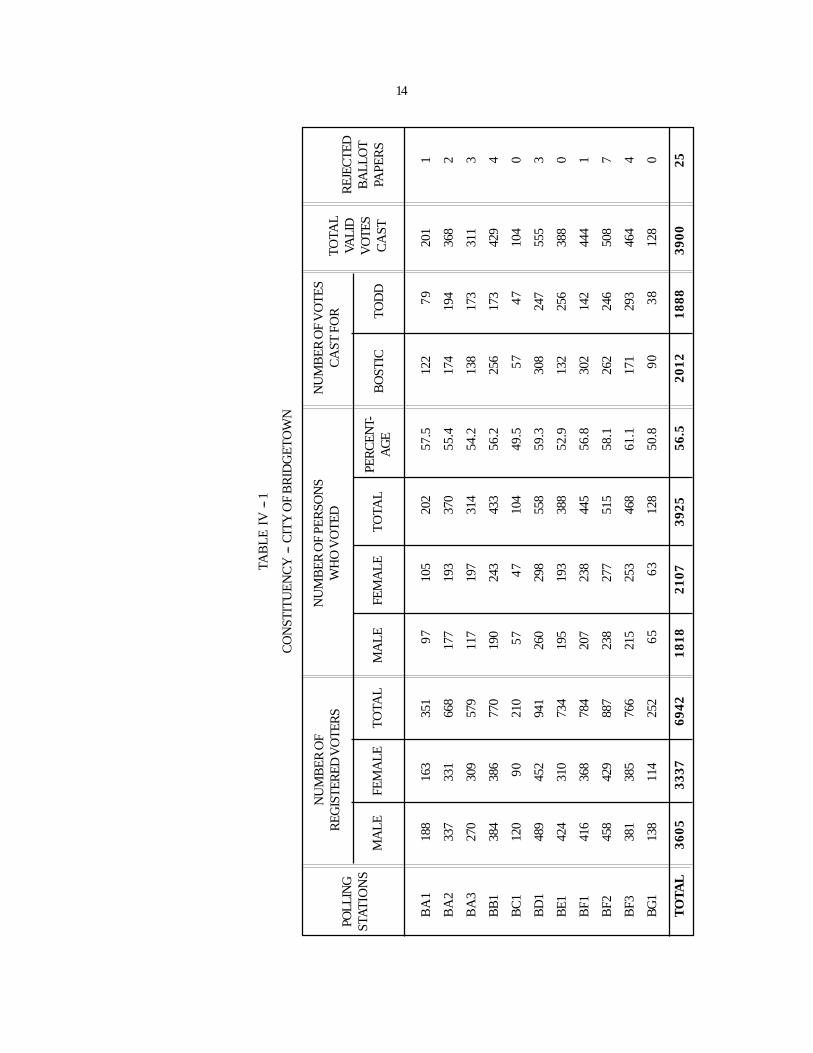
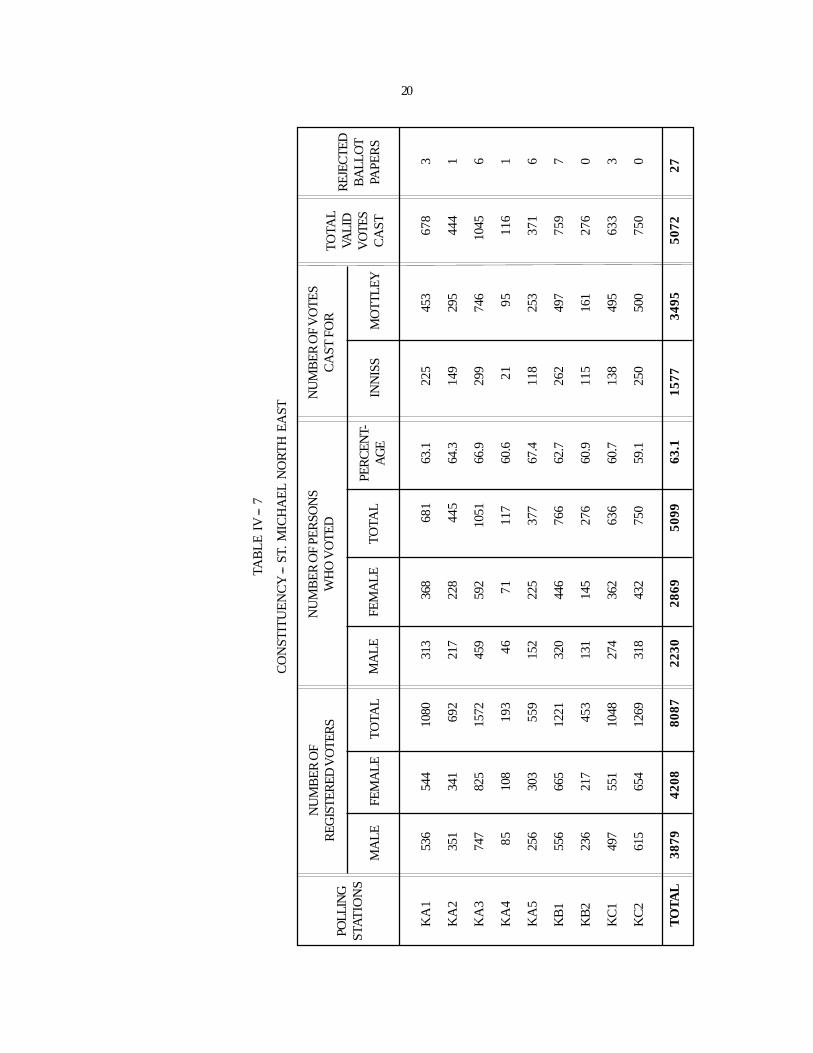
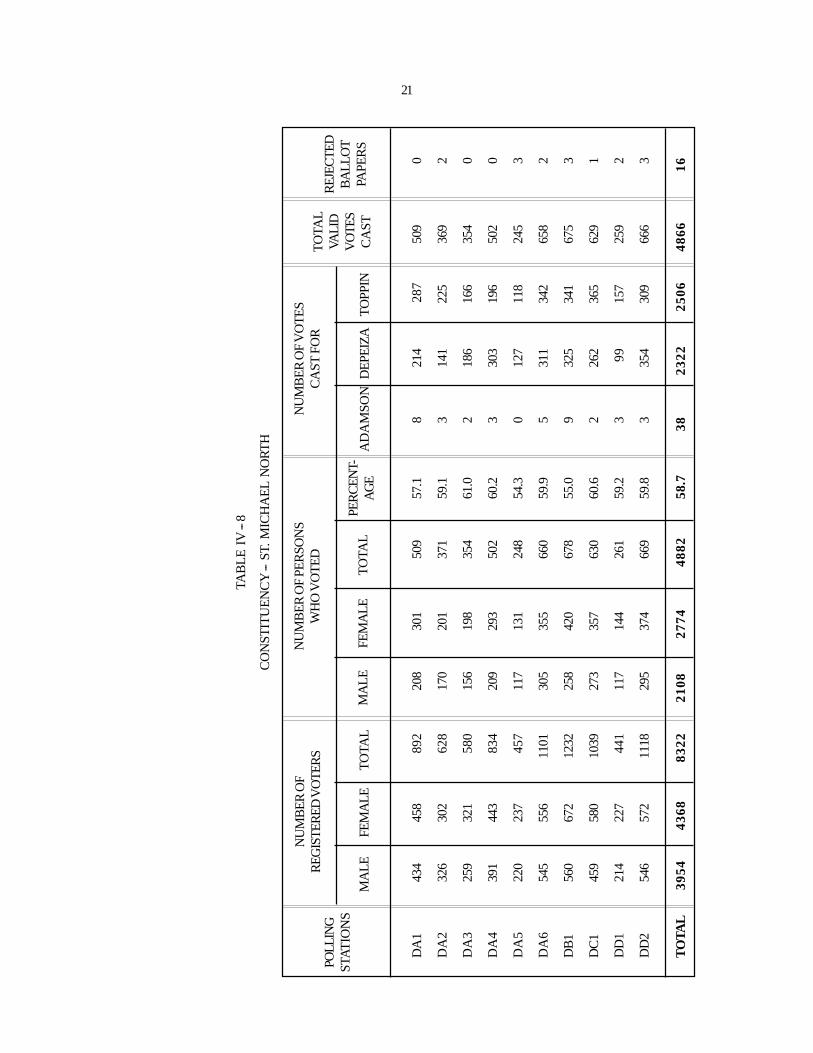
Table IV (1-30) -- Number of registered voters, the number and percentage of votes
cast and rejected ballots relating to Polling Station, Candidate andConstituency.
6

13. APPRECIATION
13.1 The Commission wishes to thank all those who contributed in any way to the successfulcompletion of the 2013 General Election. Special mention must be made and thanks extendedto the Commission's legal counsel, Carrington and Sealy; the Government Printer and staff;the Chief Information Officer and staff; the Commissioner and members of the RoyalBarbados Police Force; the Postmaster General and staff; the Management and staff of theTransport Board; the Government Electrical Engineer and staff; the Caribbean BroadcastingCorporation; Starcom Network Inc.; the Barbados Advocate; the Nation Publishing Company;the Barbados Today Inc.; the Election Officers and the staff of the Electoral Department.
ANGELA TAYLORSUPERVISOR OF ELECTIONS
June 12, 2013
7

TO
TAL
VALI
D
VO
TES
CA
ST
REJ
ECTE
D
BA
LL
OT
PAPE
RS
Cit
y of
Bri
dget
own
2,01
250
.31,
888
47.2
101
2.5
4,00
125
St.
Mic
hael
Sou
th1,
459
35.0
2,70
565
.050
1.2
4,16
414
St.
Mic
hael
Eas
t2,
452
57.9
2,33
355
.14,
236
11
St.
Mic
hael
Sou
th C
entr
al1,
967
48.7
2,23
155
.24,
042
24
St.
Mic
hael
Cen
tral
2,07
852
.02,
117
53.0
3,99
822
St.
Mic
hael
Sou
th E
ast
2,40
252
.52,
392
52.3
4,57
223
St.
Mic
hael
Nor
th E
ast
3,49
575
.01,
577
33.8
4,66
227
St.
Mic
hael
Nor
th2,
506
56.4
2,32
252
.338
0.9
4,44
316
St.
Mic
hael
Nor
th W
est
1,53
336
.32,
450
58.0
4,22
524
St.
Mic
hael
Wes
t2,
095
53.5
2,22
056
.73,
915
32
St.
Mic
hael
Wes
t C
entr
al2,
046
46.6
2,23
951
.010
6 2
.44,
386
33
Chr
ist
Chu
rch
Wes
t2,
340
57.6
1,80
844
.537
4 9
.24,
060
25
Chr
ist
Chu
rch
Wes
t C
entr
al2,
112
48.8
2,94
067
.94,
331
26
Chr
ist
Chu
rch
Sou
th2,
062
48.0
2,66
362
.039
0.9
4,29
518
Chr
ist
Chu
rch
Eas
t C
entr
al2,
264
47.5
3,25
968
.44,
768
21
Chr
ist
Chu
rch
Eas
t2,
487
52.9
3,25
569
.34,
698
31
TO
TAL
35,3
1051
.338
,399
55.8
70
8 1
.0
68,
796
3
72
CO
NST
ITU
EN
CIE
S
TA
BL
E I
GE
NE
RA
L E
LE
CT
ION
201
3
NU
MB
ER
AN
D P
ER
CE
NTA
GE
OF
VO
TE
S C
AS
T B
Y P
AR
TY
AN
D C
ON
ST
ITU
EN
CY
BA
RB
AD
OS
LA
BO
UR
PA
RT
YD
EM
OC
RA
TIC
LA
BO
UR
PA
RT
YIN
DE
PEN
DE
NT
NO
. OF
VO
TE
SPE
RC
EN
T-A
GE
NO
. OF
VO
TE
SPE
RC
EN
T-A
GE
NO
. OF
VO
TE
SPE
RC
EN
T-A
GE
8

TO
TAL
VALI
D
VO
TES
CA
ST
REJ
ECTE
D
BA
LL
OT
PAPE
RS
St.
Phi
lip
Nor
th1,
974
32.8
4,05
367
.26,
027
26
St.
Phi
lip
Sou
th3,
114
51.2
2,96
548
.86,
079
37
St.
Phi
lip
Wes
t2,
315
46.6
3,72
074
.84,
973
36
St.
Geo
rge
Nor
th3,
508
59.5
2,39
140
.55,
899
21
St.
Geo
rge
Sou
th3,
642
55.1
2,96
544
.96,
607
22
St.
Joh
n1,
091
21.3
4.02
578
.75,
116
27
St.
Jos
eph
2,71
553
.52,
364
46.5
5,07
924
St.
Tho
mas
3,66
065
.61,
919
34.4
5,57
924
St.
Jam
es N
orth
2,55
854
.62,
124
45.4
4,68
228
St.
Jam
es S
outh
2,55
643
.53,
326
56.5
5,88
228
St.
Jam
es C
entr
al2,
315
50.2
2,24
748
.7
51
1.1
4,61
315
St.
Pet
er3,
665
64.1
1,98
234
.7
72
1.3
5,71
934
St.
And
rew
2,96
852
.62,
670
47.4
5,63
834
St.
Luc
y2,
730
46.4
3,15
253
.65,
882
13
TO
TAL
77,3
2253
.069
,275
47.5
264
0.2
145,
799
821
CO
NST
ITU
EN
CIE
S
TAB
LE
I -
- Con
t’d
GE
NE
RA
L E
LE
CT
ION
201
3
NU
MB
ER
AN
D P
ER
CE
NTA
GE
OF
VO
TE
S C
AS
T B
Y P
AR
TY
AN
D C
ON
ST
ITU
EN
CY
BA
RB
AD
OS
LA
BO
UR
PA
RT
YD
EM
OC
RA
TIC
LA
BO
UR
PA
RT
YIN
DE
PEN
DE
NT
NO
. OF
VO
TE
SPE
RC
EN
T-A
GE
NO
. OF
VO
TE
SPE
RC
EN
T-A
GE
NO
. OF
VO
TE
SPE
RC
EN
T-A
GE
B/F
38,5
1156
.629
,372
43.2
141
0.2
68,0
24
452
9

City of Bridgetown JEFFREY D. BOSTIC B.L.P. 2,012Patrick M. T. Todd D.L.P. 1,888
St. Michael South FREUNDEL J. STUART D.L.P. 2,705Noel A. Lynch B.L.P. 1,459Alex Mitchell B.F.P. 50
St. Michael East TREVOR A. PRESCOD B.L.P. 2,452Kenneth St. C. Best D.L.P. 2,333
St. Michael South Central RICHARD L. SEALY D.L.P. 2,231David T. Gill B.L.P. 1,967
St. Michael Central STEVEN D. BLACKETT D.L.P. 2,117Arthur E. Holder B.L.P. 2,078
St. Michael South East SANTIA J. O. BRADSHAW B.L.P. 2,402Patrick B. Tannis D.L.P. 2,392
St. Michael North East MIA A. MOTTLEY B.L.P. 3,495Patricia I. Inniss D.L.P. 1,577
St. Michael North RONALD St. C. TOPPIN B.L.P. 2,506Francis G. Depeiza D.L.P. 2,322Mark A. Adamson P.D.C. 38
St. Michael North West CHRISTOPHER P. SINCKLER D.L.P. 2,650Gregory P. B. Nicholls B.L.P. 1,533
St. Michael West MICHAEL A. CARRINGTON D.L.P. 2,220Joseph J. S. Atherley B.L.P. 2,095
St. Michael West Central JAMES D. PAUL D.L.P. 2,239George P. I. Gooding-Edghill B.L.P. 2,046Hermon O. Lowe IND. 38Jonn R. Warde IND. 68
Christ Church West MARIA M. AGARD B.L.P. 2,340Verla A.G. De Peiza D.L.P. 1,808Taan Abed IND. 374
Christ Church West Central STEPHEN A. LASHLEY D.L.P. 2,940Margo A. Durant-Callender B.L.P. 2,112
Christ Church South JOHN D. E. BOYCE D.L.P. 2,663Jerome X. Walcott B.L.P. 2,062Steve N. Hunte K.G. B. 39
NUMBER OFVOTES
RECEIVEDPARTYCONSTITUENCY CANDIDATE
TABLE IIVOTES CAST FOR INDIVIDUAL CANDIDATES BY PARTY
AND CONSTITUENCY
10

Christ Church East Central RONALD D. JONES D.L.P. 3,259Desmond D. M. Sands B.L.P. 2,264
Christ Church East DENIS S. LOWE D.L.P. 3,255Wilfred A. Abrahams B.L.P. 2,487
St. Philip North MICHAEL A. LASHLEY D.L.P. 4,053Indar A. Weir B.L.P. 1,974
St. Philip South ADRIEL D. BRATHWAITE D.L.P. 3,514Anthony P. Wood B.L.P. 3,114
St. Philip West DAVID C. ESTWICK D.L.P. 3,720Lynette V. Eastmond B.L.P. 2,315
St. George North GLINE A. CLARKE B.L.P. 3,508Jepter Ince D.L.P. 2,391
St. George South DWIGHT G. SUTHERLAND B.L.P. 3,642Esther R. Byer-Suckoo D.L.P. 2,965
St. John MARIE J. M. THOMPSON D.L.P. 4,025Hudson E. Griffith B.L.P. 1,091
St. Joseph DALE D. MARSHALL B.L.P. 2,715Dennis D. Holder D.L.P. 2,364
St. Thomas CYNTHIA Y. FORDE B.L.P. 3,660Rolerick M. Hinds D.L.P. 1,919
St. James North EDMUND G. HINKSON B.L.P. 2,558Harcourt A. Husbands D.L.P. 2,124
St. James South DONVILLE O. INNISS D.L.P. 3,326Cheryl S. Husbands B.L.P. 2,556
St. James Central KERRIE D. SYMMONDS B.L.P. 2,315Edwin G. Hutson D.L.P. 2,247Eric R. Marshall P.D.C. 51
St. Peter OWEN S. ARTHUR B.L.P. 3,665Haynesley L. Benn D.L.P. 1,982Lynroy Scantlebury IND. 72
St. Andrew GEORGE W. PAYNE B.L.P. 2,968Virginia I. Sandiford-Garner D.L.P. 2,670
St. Lucy DENIS St. E. KELLMAN D.L.P. 3,152Peter R. Phillips B.L.P. 2,730
TABLE II -- (Cont’d)VOTES CAST FOR INDIVIDUAL CANDIDATES BY PARTY
AND CONSTITUENCY -- (Cont’d)
CONSTITUENCY
NUMBER OFVOTES
RECEIVEDPARTYCANDIDATE
11

Cit
y of
Bri
dget
own
3,60
53,
337
6,94
21,
818
2,10
73,
925
56.5
St.
Mic
hael
Sou
th3,
403
3,63
97,
042
1,89
22,
336
4,22
860
.0
St.
Mic
hael
Eas
t3,
874
4,09
77,
971
2,21
22,
584
4,79
660
.2
St.
Mic
hael
Sou
th C
entr
al3,
263
3,71
26,
975
1,89
72,
325
4,22
260
.5
St.
Mic
hael
Cen
tral
3,28
63,
517
6,80
31,
898
2,31
94,
217
62.0
St.
Mic
hael
Sou
th E
ast
3,89
54,
432
8,32
71,
990
2,82
74,
817
57.8
St.
Mic
hael
Nor
th E
ast
3,87
94,
208
8,08
72,
230
2,86
95,
099
63.1
St.
Mic
hael
Nor
th3,
954
4,36
88,
322
2,10
82,
774
4,88
258
.7
St.
Mic
hael
Nor
th W
est
3,36
73,
575
6,94
21,
890
2,31
74,
207
60.6
St.
Mic
hael
Wes
t3,
626
3,61
07,
236
1,96
32,
384
4,34
760
.1
St.
Mic
hael
Wes
t Cen
tral
3,57
94,
118
7,69
71,
892
2,53
24,
424
57.5
Chr
ist
Chu
rch
Wes
t3,
777
4,44
28,
219
1,92
72,
620
4,54
755
.3
Chr
ist C
hurc
h W
est C
entr
al4,
027
4,63
88,
665
2,12
22,
956
5,07
858
.6
Chr
ist C
hurc
h E
ast C
entr
al4,
020
4,81
78,
837
2,37
13,
173
5,54
462
.7
TO
TA
L C
/F51
,555
56,5
1010
8,06
528
,210
36,1
2364
,333
59.5
NU
MB
ER
OF
RE
GIS
TE
RE
D V
OT
ER
SN
UM
BE
R O
F PE
RSO
NS
WH
O V
OT
ED
CO
NST
ITU
EN
CY
MA
LE
FEM
AL
ET
OTA
LM
AL
EFE
MA
LE
TO
TAL
TAB
LE
III
RE
GIS
TE
RE
D V
OT
ER
S A
ND
VO
TE
S C
AST
BY
GE
ND
ER
AN
D C
ON
STIT
UE
NC
Y
PER
CEN
T-A
GE
12

TO
TA
L B
/F51
,555
56,5
1010
8,06
528
,210
36,1
2364
,333
59.5
Chr
ist C
hurc
h S
outh
3,93
84,
518
8,45
62,
132
2,65
04,
782
56.6
Chr
ist C
hurc
h E
ast
4,23
44,
686
8,92
02,
614
3,15
95,
773
64.7
St.
Phi
lip
Nor
th4,
637
5,01
89,
655
2,81
33,
240
6,05
362
.7
St.
Phi
lip
Sou
th4,
941
5,74
110
,682
2,92
93,
736
6,66
562
.4
St P
hili
p W
est
4,28
64,
708
8,99
42,
741
3,33
06,
071
67.5
St.
Geo
rge
Nor
th4,
352
4,68
99,
041
2,70
93,
211
5,92
065
.5
St.
Geo
rge
Sou
th4,
689
4,95
29,
641
3,05
63,
573
6,62
968
.8
St.
Joh
n4,
272
4,15
68,
428
2,41
42,
729
5,14
361
.0
St.
Jos
eph
3,77
43,
819
7,59
32,
387
2,71
65,
103
67.2
St.
Tho
mas
4,43
14,
930
9,36
12,
395
3,20
85,
603
59.9
St.
Jam
es N
orth
3,54
53,
910
7,45
52,
077
2,63
34,
710
63.2
St.
Jam
es S
outh
4,19
85,
148
9,34
62,
498
3,41
25,
910
63.2
St J
ames
Cen
tral
3,72
94,
086
7,81
52,
078
2,55
04,
628
59.2
St.
Pet
er4,
148
4,33
08,
478
2,63
73,
116
5,75
367
.9
St.
And
rew
4,11
24,
168
8,28
02,
686
2,98
65,
672
68.5
St.
Luc
y4,
280
4,53
48,
814
2,70
23,
193
5,89
566
.9
TO
TAL
119,
121
129,
903
249,
024
69,0
7885
,565
154,
643
62.1
NU
MB
ER
OF
RE
GIS
TE
RE
D V
OT
ER
SN
UM
BE
R O
F PE
RSO
NS
WH
O V
OT
ED
CO
NST
ITU
EN
CY
MA
LE
FEM
AL
ET
OTA
LM
AL
EFE
MA
LE
TO
TAL
PER
CEN
T-A
GE
TAB
LE
III
-- (C
ont’
d)
RE
GIS
TE
RE
D V
OT
ER
S A
ND
VO
TE
S C
AST
BY
GE
ND
ER
AN
D C
ON
STIT
UE
NC
Y --
(Con
t’d)
13
BA
118
816
335
1 9
710
520
257
.512
2 7
920
11
BA
233
733
166
817
719
337
055
.417
419
436
82
BA
327
030
957
911
719
731
454
.213
817
331
13
BB
138
438
677
019
024
343
356
.225
617
342
94
BC
112
0 9
021
0 5
7 4
710
449
.5 5
7 4
710
40
BD
148
945
294
126
029
855
859
.330
824
755
53
BE1
424
310
734
195
193
388
52.9
132
256
388
0
BF1
416
368
784
207
238
445
56.8
302
142
444
1
BF2
458
429
887
238
277
515
58.1
262
246
508
7
BF3
381
385
766
215
253
468
61.1
171
293
464
4
BG
113
811
425
2 6
5 6
312
850
.8 9
0 3
812
80
TO
TAL
36
05
33
37
69
42
18
18
21
07
39
25
56.5
20
12
18
88
39
00
25
NU
MB
ER
OF
REG
ISTE
RED
VO
TER
SN
UM
BE
R O
F PE
RSO
NS
WH
O V
OT
ED
NU
MB
ER
OF
VO
TE
SC
AST
FO
RT
OTA
LVA
LID
VO
TES
CA
ST
REJ
ECTE
DB
AL
LO
TPA
PER
ST
OD
DB
OST
ICPE
RC
ENT-
AG
ET
OTA
LFE
MA
LE
MA
LE
TAB
LE
IV
-- 1
CO
NST
ITU
EN
CY
-- C
ITY
OF
BR
IDG
ET
OW
N
POLL
ING
STA
TIO
NS
TO
TAL
FEM
AL
EM
AL
E
14

UA
121
822
1 4
3911
915
727
662
.9 3
111
160
274
2
UB
135
536
0 7
1521
723
745
463
.5 6
148
299
453
1
UC
128
729
9 5
8614
019
133
156
.5 6
128
194
328
3
UC
214
816
7 3
15 7
510
317
856
.5 0
61
117
178
0
UC
346
750
5 9
7225
830
856
658
.2 7
193
363
563
3
UD
152
958
411
1330
138
268
361
.4 1
125
941
168
12
UD
2 7
2 9
0 1
62 3
5 5
3 8
854
.3 1
42
45
88
0
UE
144
445
1 8
9523
425
749
154
.9 8
146
336
490
1
UF1
294
298
592
170
189
359
60.6
113
022
635
72
UG
141
944
0 8
5924
531
155
664
.7 5
147
404
556
0
UG
217
022
4 3
94 9
814
824
662
.4 2
94
150
246
0
TO
TAL
34
03
36
39
70
42
18
92
23
36
42
28
60.0
501
45
92
70
54
21
414
NU
MB
ER
OF
REG
ISTE
RED
VO
TER
SN
UM
BE
R O
F PE
RSO
NS
WH
O V
OT
ED
NU
MB
ER
OF
VO
TE
SC
AST
FO
RT
OTA
LVA
LID
VO
TES
CA
ST
REJ
ECTE
DB
AL
LO
TPA
PER
SST
UA
RT
LYN
CH
PER
CEN
T-A
GE
TO
TAL
FEM
AL
EM
AL
E
TAB
LE
IV
-- 2
CO
NST
ITU
EN
CY
-- S
T. M
ICH
AE
L S
OU
TH
POLL
ING
STA
TIO
NS
TO
TAL
FEM
AL
EM
AL
EM
ITC
HE
LL
15

QA
123
621
5 4
5112
714
026
759
.213
213
526
70
QB
151
454
310
5729
434
964
360
.833
330
563
85
QB
215
915
6 3
15 9
110
519
662
.2 8
411
219
60
QC
145
445
6 9
1026
529
355
861
.328
127
755
80
QC
226
932
0 5
8914
819
834
658
.713
321
234
51
QC
333
634
4 6
8019
122
241
360
.716
624
641
21
QC
447
455
410
2828
134
162
260
.530
231
862
02
QD
123
724
4 4
8112
613
125
753
.411
314
425
70
QD
214
415
9 3
03 8
8 9
718
561
.110
8 7
618
41
QE
121
820
3 4
2111
712
924
658
.411
812
724
51
QE
239
441
5 8
0925
225
750
962
.925
925
050
90
QE
343
948
8 9
2723
232
255
459
.830
425
055
40
TO
TAL
3874
4097
7971
2212
2584
4796
60.2
233
324
5247
8511
NU
MB
ER
OF
REG
ISTE
RED
VO
TER
SN
UM
BE
R O
F PE
RSO
NS
WH
O V
OT
ED
NU
MB
ER
OF
VO
TE
SC
AST
FO
RT
OTA
LVA
LID
VO
TES
CA
ST
REJ
ECTE
DB
AL
LO
TPA
PER
SPR
ESC
OD
BES
TPE
RC
ENT-
AG
ET
OTA
LFE
MA
LE
MA
LE
TAB
LE
IV
-- 3
CO
NST
ITU
EN
CY
-- S
T. M
ICH
AE
L E
AST
POLL
ING
STA
TIO
NS
TO
TAL
FEM
AL
EM
AL
E
16

RA
128
630
358
915
721
437
163
.017
319
737
01
RA
230
734
064
718
422
641
063
.421
119
740
82
RA
344
546
691
128
828
457
262
.826
430
356
75
RB
114
019
033
0 8
4 9
117
553
.012
5 5
017
50
RB
229
433
162
517
821
339
162
.619
120
039
10
RC
137
444
081
421
527
749
260
.420
628
148
75
RD
129
435
965
316
719
836
555
.921
514
836
32
RE1
435
489
924
248
330
578
62.6
179
397
576
2
RE2
215
242
457
130
164
294
64.3
127
165
292
2
RF1
372
442
814
189
257
446
54.8
215
227
442
4
RF2
101
110
211
57
71
128
60.7
61
66
127
1
TO
TAL
3263
3712
6975
1897
2325
4222
60.5
1967
2231
4198
24
NU
MB
ER
OF
REG
ISTE
RED
VO
TER
SN
UM
BE
R O
F PE
RSO
NS
WH
O V
OT
ED
NU
MB
ER
OF
VO
TE
SC
AST
FO
RT
OTA
LVA
LID
VO
TES
CA
ST
REJ
ECTE
DB
AL
LO
TPA
PER
SSE
ALY
GIL
LPE
RC
ENT-
AG
ET
OTA
LFE
MA
LE
MA
LE
TAB
LE
IV
-- 4
CO
NST
ITU
EN
CY
-- S
T. M
ICH
AE
L S
OU
TH
CE
NT
RA
L
POLL
ING
STA
TIO
NS
TO
TAL
FEM
AL
EM
AL
E
17

MA
131
536
5 6
8017
923
841
761
.3 2
3118
641
70
MA
231
634
4 6
6019
021
840
861
.8 1
9920
540
44
MA
347
846
3 9
4127
227
454
658
.0 2
8026
254
24
MB
135
137
5 7
2620
222
943
159
.4 2
2121
043
10
MC
120
524
5 4
5010
816
227
060
.0 1
5311
426
73
MC
235
941
2 7
7122
028
950
966
.0 2
2628
350
90
MC
352
153
710
5829
635
264
861
.2 3
1832
764
53
MD
151
452
410
3830
638
368
966
.4 3
5333
168
45
MD
222
725
2 4
7912
517
429
962
.4 1
3616
029
63
TO
TAL
3286
3517
6803
1898
2319
4217
62.0
2117
2078
4195
22
NU
MB
ER
OF
REG
ISTE
RED
VO
TER
SN
UM
BE
R O
F PE
RSO
NS
WH
O V
OT
ED
NU
MB
ER
OF
VO
TE
SC
AST
FO
RT
OTA
LVA
LID
VO
TES
CA
ST
REJ
ECTE
DB
AL
LO
TPA
PER
SH
OLD
ERB
LA
CK
ET
TPE
RC
ENT-
AG
ET
OTA
LFE
MA
LE
MA
LE
TAB
LE
IV
-- 5
CO
NST
ITU
EN
CY
-- S
T. M
ICH
AE
L C
EN
TR
AL
POLL
ING
STA
TIO
NS
TO
TAL
FEM
AL
EM
AL
E
18

NA
165
876
214
2033
546
279
756
.152
527
079
54
NB
155
462
111
7527
838
766
556
.634
931
266
14
NC
124
526
5 5
1012
718
631
361
.416
514
731
21
NC
259
462
712
2129
839
969
757
.130
738
769
43
NC
320
626
2 4
6812
016
228
260
.313
215
028
20
NC
436
740
5 7
7219
827
146
960
.818
927
846
71
NC
532
838
7 7
1515
625
641
257
.618
722
341
02
NC
644
547
0 9
1521
528
750
254
.923
426
249
66
NC
749
863
311
3126
341
768
060
.131
436
367
72
TO
TAL
38
95
44
32
83
27
19
90
28
27
48
17
57.8
24
02
23
92
47
94
23
NU
MB
ER
OF
RE
GIS
TE
RE
D V
OT
ER
SN
UM
BE
R O
F P
ER
SON
SW
HO
VO
TE
DN
UM
BE
R O
F V
OT
ES
CA
ST F
OR
TO
TAL
VALI
DV
OTE
SC
AST
REJ
ECTE
DB
AL
LO
TPA
PER
STA
NN
ISB
RA
DSH
AW
PER
CEN
T-A
GE
TO
TAL
FEM
AL
EM
AL
E
TA
BL
E I
V --
6
CO
NS
TIT
UE
NC
Y --
ST
. M
ICH
AE
L S
OU
TH
EA
ST
POLL
ING
STA
TIO
NS
TO
TAL
FEM
AL
EM
AL
E
19
KA
153
654
410
8031
336
8 6
8163
.1 2
2545
3 6
783
KA
235
134
1 6
9221
722
8 4
4564
.3 1
4929
5 4
441
KA
374
782
515
7245
959
210
5166
.9 2
9974
610
456
KA
4 8
510
8 1
93 4
6 7
1 1
1760
.6
21 9
5 1
161
KA
525
630
3 5
5915
222
5 3
7767
.4 1
1825
3 3
716
KB
155
666
512
2132
044
6 7
6662
.7 2
6249
7 7
597
KB
223
621
7 4
5313
114
5 2
7660
.9 1
1516
1 2
760
KC
149
755
110
4827
436
2 6
3660
.7 1
3849
5 6
333
KC
261
565
412
6931
843
2 7
5059
.1 2
5050
0 7
500
TO
TA
L38
7942
0880
8722
3028
6950
9963
.115
7734
9550
7227
NU
MB
ER
OF
REG
ISTE
RED
VO
TER
SN
UM
BE
R O
F PE
RSO
NS
WH
O V
OT
ED
NU
MB
ER
OF
VO
TE
SC
AST
FO
RT
OTA
LVA
LID
VO
TES
CA
ST
REJ
ECTE
DB
AL
LO
TPA
PER
SM
OTT
LEY
INN
ISS
PER
CEN
T-A
GE
TO
TAL
FEM
AL
EM
AL
E
TAB
LE
IV
-- 7
CO
NST
ITU
EN
CY
-- S
T. M
ICH
AE
L N
OR
TH
EA
ST
POLL
ING
STA
TIO
NS
TO
TAL
FEM
AL
EM
AL
E
20
DA
143
445
8 8
9220
830
150
957
.18
214
287
509
0
DA
232
630
2 6
2817
020
137
159
.13
141
225
369
2
DA
325
932
1 5
8015
619
835
461
.02
186
166
354
0
DA
439
144
3 8
3420
929
350
260
.23
303
196
502
0
DA
522
023
7 4
5711
713
124
854
.30
127
118
245
3
DA
654
555
611
0130
535
566
059
.95
311
342
658
2
DB
156
067
212
3225
842
067
855
.09
325
341
675
3
DC
145
958
010
3927
335
763
060
.62
262
365
629
1
DD
121
422
7 4
4111
714
426
159
.23
99
157
259
2
DD
254
657
211
1829
537
466
959
.83
354
309
666
3
TO
TAL
39
54
43
68
83
22
21
08
27
74
48
82
58.7
382
32
22
50
64
86
616
NU
MB
ER
OF
REG
ISTE
RED
VO
TER
SN
UM
BE
R O
F PE
RSO
NS
WH
O V
OT
ED
NU
MB
ER
OF
VO
TE
SC
AST
FO
RT
OTA
LVA
LID
VO
TES
CA
ST
REJ
ECTE
DB
AL
LO
TPA
PER
ST
OPP
IND
EPE
IZA
PER
CEN
T-A
GE
TO
TAL
FEM
AL
EM
AL
E
TAB
LE
IV
-- 8
CO
NST
ITU
EN
CY
-- S
T. M
ICH
AE
L N
OR
TH
POLL
ING
STA
TIO
NS
TO
TAL
FEM
AL
EM
AL
EA
DA
MSO
N
21

HA
122
723
7 4
6411
113
524
653
.0
7716
724
42
HA
222
925
7 4
8612
115
928
057
.6
8020
028
00
HA
346
551
0 9
7524
430
154
555
.9 1
7636
954
50
HA
428
533
0 6
1515
320
335
657
.9 1
0125
435
51
HA
522
421
8 4
4212
213
425
657
.9 1
70 8
625
60
HB1
603
578
1181
362
407
769
65.1
261
502
763
6
HB2
529
563
1092
308
396
704
64.5
227
471
698
6
HB3
164
153
317
79
78
157
49.5
86
71
157
0
HC
144
653
6 9
8226
637
764
365
.5 2
7136
863
94
HC
219
519
3 3
8812
412
725
164
.7
8416
224
65
TO
TAL
3367
3575
6942
1890
2317
4207
60.6
1533
2650
4183
24
NU
MB
ER
OF
REG
ISTE
RED
VO
TER
SN
UM
BE
R O
F PE
RSO
NS
WH
O V
OT
ED
NU
MB
ER
OF
VO
TE
SC
AST
FO
RT
OTA
LVA
LID
VO
TES
CA
ST
REJ
ECTE
DB
AL
LO
TPA
PER
SSI
NC
KLE
RN
ICH
OLL
SPE
RC
ENT-
AG
ET
OTA
LFE
MA
LE
MA
LE
TAB
LE
IV
-- 9
CO
NST
ITU
EN
CY
-- S
T. M
ICH
AE
L N
OR
TH
WE
ST
POLL
ING
STA
TIO
NS
TO
TAL
FEM
AL
EM
AL
E
22

FA1
327
324
651
175
223
398
61.1
165
230
395
3
FA2
335
361
696
180
233
413
59.3
191
221
412
1
FB1
281
259
540
150
178
328
60.7
147
181
328
0
FB2
441
381
822
246
271
517
62.9
249
267
516
1
FC1
243
275
518
138
177
315
60.8
156
159
315
0
FC2
249
256
505
140
177
317
62.8
139
170
309
8
FD1
265
300
565
138
175
313
55.4
155
155
310
3
FE1
370
383
753
191
237
428
56.8
238
187
425
3
FF1
196
210
406
109
145
254
62.6
130
123
253
1
FF2
293
284
577
175
177
352
61.0
165
178
343
9
FF3
460
447
907
241
304
545
60.1
284
259
543
2
FG1
166
130
296
80
87
167
56.4
76
90
166
1
TO
TAL
36
26
36
10
72
36
19
63
23
84
43
47
60.1
20
95
22
20
43
15
32
NU
MB
ER
OF
RE
GIS
TE
RE
D V
OT
ER
SN
UM
BE
R O
F P
ER
SON
SW
HO
VO
TE
DN
UM
BE
R O
F V
OT
ES
CA
ST F
OR
TO
TAL
VALI
DV
OTE
SC
AST
REJ
ECTE
DB
AL
LO
TPA
PER
SC
AR
RIN
GT
ON
AT
HE
RL
EY
PER
CEN
T-A
GE
TO
TAL
FEM
AL
EM
AL
E
TAB
LE
IV
-- 1
0
CO
NST
ITU
EN
CY
-- S
T. M
ICH
AE
L W
EST
POLL
ING
STA
TIO
NS
TO
TAL
FEM
AL
EM
AL
E
23

WA
162
672
613
5232
547
079
558
.842
9 1
0 3
349
791
WA
241
048
3 8
9322
428
050
456
.423
2
1 6
261
500
WA
338
743
2 8
1921
127
648
759
.518
6
2 3
293
484
WA
462
278
214
0432
244
676
854
.737
1
5 6
383
765
WB
138
740
1 7
8819
225
444
656
.621
0
9 2
220
441
WB
220
823
2 4
4011
715
427
161
.612
8
1 3
137
269
WC
156
865
112
1930
441
571
959
.032
4
511
370
710
WC
237
141
1 7
8219
723
743
455
.516
6
534
226
431
TO
TAL
3579
4118
7697
1892
2532
4424
57.5
2046
3868
2239
4391
NU
MB
ER
OF
REG
ISTE
RED
VO
TER
SN
UM
BE
R O
F PE
RSO
NS
WH
O V
OT
ED
NU
MB
ER
OF
VO
TE
SC
AST
FO
RT
OTA
LVA
LID
VO
TES
CA
STW
AR
DE
LOW
EPE
RC
ENT-
AG
ET
OTA
LFE
MA
LE
MA
LE
TAB
LE
IV
-- 1
1
CO
NST
ITU
EN
CY
-- S
T. M
ICH
AE
L W
EST
CE
NT
RA
L
POLL
ING
STA
TIO
NS
TO
TAL
FEM
AL
EM
AL
EG
OO
DIN
G-
EDG
HIL
LPA
UL
24

ZA
138
738
7 7
7416
621
638
249
.427
202
151
380
2
ZB
174
185
515
9635
045
380
350
.356
412
331
799
4
ZC
115
218
5 3
37 7
810
418
254
.023
109
49
181
1
ZC
236
449
7 8
6120
634
054
663
.444
261
236
541
5
ZC
368
678
314
6936
344
981
255
.352
413
340
805
7
ZC
435
447
6 8
3018
628
747
357
.036
245
192
473
0
ZD
134
140
6 7
4716
421
838
251
.154
247
80
381
1
ZD
226
731
2 5
7911
516
928
449
.127
170
87
284
0
ZE
148
554
110
2629
938
468
366
.655
281
342
678
5
TO
TAL
37
77
44
42
82
19
19
27
26
20
45
47
55.3
37
42
34
01
80
84
52
225
NU
MB
ER
OF
REG
ISTE
RED
VO
TER
SN
UM
BE
R O
F PE
RSO
NS
WH
O V
OT
ED
NU
MB
ER
OF
VO
TE
SC
AST
FO
RT
OTA
LVA
LID
VO
TES
CA
ST
REJ
ECTE
DB
AL
LO
TPA
PER
SD
EPE
IZA
AG
AR
DPE
RC
ENT-
AG
ET
OTA
LFE
MA
LE
MA
LE
TAB
LE
IV
-- 1
2
CO
NST
ITU
EN
CY
-- C
HR
IST
CH
UR
CH
WE
ST
POLL
ING
STA
TIO
NS
TO
TAL
FEM
AL
EM
AL
EA
BED
25

CA
135
240
7 7
5919
926
045
960
.519
326
645
90
CA
261
166
712
7831
540
772
256
.529
642
171
75
CB
117
419
5 3
69 9
212
221
458
.0 7
913
421
31
CC
149
555
610
5123
131
654
752
.026
328
254
52
CC
257
275
513
2732
251
583
763
.132
350
983
25
CC
343
248
0 9
1222
231
753
959
.121
132
453
54
CC
433
237
4 7
0618
323
641
959
.316
525
241
72
CD
160
768
012
8732
845
177
960
.532
245
177
36
CD
245
252
4 9
7623
033
256
257
.626
030
156
11
TO
TAL
4027
4638
8665
2122
2956
5078
58.6
2112
2940
5052
26
NU
MB
ER
OF
RE
GIS
TE
RE
D V
OT
ER
SN
UM
BE
R O
F P
ER
SON
SW
HO
VO
TE
DN
UM
BE
R O
F V
OT
ES
CA
ST F
OR
TO
TAL
VALI
DV
OTE
SC
AST
REJ
ECTE
DB
AL
LO
TPA
PER
SLA
SHLE
YD
UR
AN
T-C
AL
LE
ND
ER
PER
CEN
T-A
GE
TO
TAL
FEM
AL
EM
AL
E
TAB
LE
IV
-- 1
3
CO
NST
ITU
EN
CY
-- C
HR
IST
CH
UR
CH
WE
ST C
EN
TR
AL
POLL
ING
STA
TIO
NS
TO
TAL
FEM
AL
EM
AL
E
26

VA1
274
352
626
127
173
300
47.9
134
316
029
73
VA2
237
268
505
123
151
274
54.3
142
212
927
31
VA3
415
409
824
243
278
521
63.2
283
11
223
517
4
VA4
486
603
1089
219
299
518
47.6
279
523
351
71
VA5
405
485
890
222
294
516
58.0
232
128
351
60
VB
146
154
310
0423
128
952
051
.832
3 3
193
519
1
VB
234
740
6 7
5319
925
145
059
.826
7 3
179
449
1
VB
353
955
510
9433
137
971
064
.945
3 6
248
707
3
VB
437
045
0 8
2019
423
743
152
.616
5 1
263
429
2
VB
540
444
7 8
5124
329
954
263
.738
5 4
151
540
2
TO
TAL
39
38
45
18
84
56
21
32
26
50
47
82
56.6
26
63
392
06
24
76
418
NU
MB
ER
OF
REG
ISTE
RED
VO
TER
SN
UM
BE
R O
F PE
RSO
NS
WH
O V
OT
ED
NU
MB
ER
OF
VO
TE
SC
AST
FO
RT
OTA
LVA
LID
VO
TES
CA
ST
REJ
ECTE
DB
AL
LO
TPA
PER
SW
ALC
OTT
HU
NTE
PER
CEN
T-A
GE
TO
TAL
FEM
AL
EM
AL
E
TAB
LE
IV
-- 1
4
CO
NST
ITU
EN
CY
-- C
HR
IST
CH
UR
CH
SO
UT
H
POLL
ING
STA
TIO
NS
TO
TAL
FEM
AL
EM
AL
EB
OY
CE
27

YA
156
465
512
1932
041
673
660
.439
933
373
24
YA
220
125
4 4
5514
218
132
371
.018
214
132
30
YA
323
232
2 5
5410
117
427
549
.617
310
127
41
YB
147
150
1 9
7229
033
662
664
.417
544
962
42
YB
220
523
3 4
3810
715
125
858
.9 8
017
725
71
YB
366
174
914
1040
049
289
263
.337
651
589
11
YC
139
051
5 9
0522
335
457
763
.819
337
857
16
YC
245
548
4 9
3926
131
157
260
.920
736
457
11
YC
345
758
010
3730
039
669
667
.126
343
169
42
YC
438
452
4 9
0822
736
258
964
.921
637
058
63
TO
TAL
4020
4817
8837
2371
3173
5544
62.7
2264
3259
5523
21
NU
MB
ER
OF
RE
GIS
TE
RE
D V
OT
ER
SN
UM
BE
R O
F P
ER
SON
SW
HO
VO
TE
DN
UM
BE
R O
F V
OT
ES
CA
ST F
OR
TO
TAL
VALI
DV
OTE
SC
AST
REJ
ECTE
DB
AL
LO
TPA
PER
SJO
NE
SSA
ND
SPE
RC
ENT-
AG
ET
OTA
LFE
MA
LE
MA
LE
TAB
LE
IV
-- 1
5
CO
NST
ITU
EN
CY
-- C
HR
IST
CH
UR
CH
EA
ST C
EN
TR
AL
POLL
ING
STA
TIO
NS
TO
TAL
FEM
AL
EM
AL
E
28

XA
141
747
5 8
9227
433
661
068
.429
131
760
82
XA
257
059
611
6636
943
079
968
.538
241
179
36
XA
326
924
6 5
1517
617
735
368
.512
322
835
12
XB
131
336
2 6
7520
625
345
968
.020
724
945
63
XB
229
434
1 6
3519
522
341
865
.816
525
341
80
XB
310
913
9 2
48 7
7 9
717
470
.210
3 6
917
22
XC
149
754
410
4127
035
462
459
.921
141
062
13
XC
260
067
112
7136
345
481
764
.333
348
181
43
XC
348
850
7 9
9530
232
562
763
.032
530
062
52
XD
141
949
3 9
1223
529
753
258
.318
634
252
84
XD
225
831
2 5
7014
721
336
063
.216
119
535
64
TO
TAL
4234
4686
8920
2614
3159
5773
64.7
248
732
5557
4231
NU
MB
ER
OF
RE
GIS
TE
RE
D V
OT
ER
SN
UM
BE
R O
F P
ER
SON
SW
HO
VO
TE
DN
UM
BE
R O
F V
OT
ES
CA
ST F
OR
TO
TAL
VALI
DV
OTE
SC
AST
REJ
ECTE
DB
AL
LO
TPA
PER
SLO
WE
AB
RA
HA
MS
PER
CEN
T-A
GE
TO
TAL
FEM
AL
EM
AL
E
TAB
LE
IV
-- 1
6
CO
NST
ITU
EN
CY
-- C
HR
IST
CH
UR
CH
EA
ST
POLL
ING
STA
TIO
NS
TO
TAL
FEM
AL
EM
AL
E
29

PA1
516
511
1027
305
337
642
62.5
175
465
640
2
PB1
503
548
1051
319
347
666
63.4
232
430
662
4
PC1
496
535
1031
310
349
659
63.9
210
442
652
7
PC2
261
244
505
169
169
338
66.9
130
207
337
1
PC3
358
370
728
227
234
461
63.3
230
229
459
2
PD1
635
717
1352
371
458
829
61.3
306
522
828
1
PD2
468
500
968
294
323
617
63.7
148
465
613
4
PD3
556
629
1185
300
427
727
61.4
216
511
727
0
PD4
844
964
1808
518
596
1114
61.6
327
782
1109
5
TO
TAL
4637
5018
9655
2813
3240
6053
62.7
1974
4053
6027
26
NU
MB
ER
OF
RE
GIS
TE
RE
D V
OT
ER
SN
UM
BE
R O
F P
ER
SON
SW
HO
VO
TE
DN
UM
BE
R O
F V
OT
ES
CA
ST F
OR
TO
TAL
VALI
DV
OTE
SC
AST
REJ
ECTE
DB
AL
LO
TPA
PER
SLA
SHLE
YW
EIR
PER
CEN
T-A
GE
TO
TAL
FEM
AL
EM
AL
E
TAB
LE
IV
-- 1
7
CO
NST
ITU
EN
CY
-- S
T. P
HIL
IP N
OR
TH
POLL
ING
STA
TIO
NS
TO
TAL
FEM
AL
EM
AL
E
30

PF1
810
935
1745
511
641
1152
66.0
555
592
1147
5
PF2
474
536
1010
278
356
634
62.8
279
353
632
2
PF3
409
495
904
248
307
555
61.4
299
253
552
3
PG1
771
926
1697
472
620
1092
64.3
568
517
1085
7
PG2
594
626
1220
331
404
735
60.2
369
361
730
5
PG3
626
695
1321
366
415
781
59.1
453
321
774
7
PH1
977
1191
2168
550
775
1325
61.1
792
528
1320
5
PH2
280
337
617
173
218
391
63.4
199
189
388
3
TO
TAL
4941
5741
1068
229
2937
3666
6562
.435
1431
1466
2837
NU
MB
ER
OF
RE
GIS
TE
RE
D V
OT
ER
SN
UM
BE
R O
F P
ER
SON
SW
HO
VO
TE
DN
UM
BE
R O
F V
OT
ES
CA
ST F
OR
TO
TAL
VALI
DV
OTE
SC
AST
REJ
ECTE
DB
AL
LO
TPA
PER
SW
OO
DB
RA
TH
WA
ITE
PER
CEN
T-A
GE
TO
TAL
FEM
AL
EM
AL
E
TAB
LE
IV
-- 1
8
CO
NST
ITU
EN
CY
-- S
T. P
HIL
IP S
OU
TH
POLL
ING
STA
TIO
NS
TO
TAL
FEM
AL
EM
AL
E
31

PJ1
393
397
79
026
830
056
871
.9
222
337
559
9
PJ2
250
222
47
215
615
531
165
.9
88
221
309
2
PK1
611
719
133
039
949
088
966
.8
373
513
886
3
PK2
344
418
76
221
728
550
265
.9
151
350
501
1
PL1
530
664
119
432
348
180
467
.3
252
551
803
1
PL2
575
609
118
437
841
979
767
.3
430
358
788
9
PL3
413
481
894
269
347
616
68.9
25
8 3
55 6
133
PM
128
932
2
611
155
215
370
60.6
8
3 2
87 3
700
PM
245
346
1 9
1428
733
261
967
.7
332
281
613
6
PM3
428
415
843
289
306
595
70.6
126
467
593
2
TO
TAL
42
86
47
08
89
94
27
41
33
30
60
71
67.5
231
53
72
06
03
536
NU
MB
ER
OF
RE
GIS
TE
RE
D V
OT
ER
SN
UM
BE
R O
F P
ER
SON
SW
HO
VO
TE
DN
UM
BE
R O
F V
OT
ES
CA
ST F
OR
TO
TAL
VALI
DV
OTE
SC
AST
REJ
ECTE
DB
AL
LO
TPA
PER
SE
STW
ICK
EA
STM
ON
DPE
RC
ENT-
AG
ET
OTA
LFE
MA
LE
MA
LE
TAB
LE
IV
-- 1
9
CO
NST
ITU
EN
CY
-- S
T. P
HIL
IP W
EST
POLL
ING
STA
TIO
NS
TO
TAL
FEM
AL
EM
AL
E
32

GE1
338
354
692
230
239
469
67.8
224
245
469
0
GE2
535
567
1102
340
378
718
65.2
281
435
716
2
GF1
671
691
1362
429
476
905
66.4
490
414
904
1
GF2
704
741
1445
468
490
958
66.3
390
563
953
5
GG
130
635
2 6
5818
424
442
865
.0 1
8923
742
62
GG
262
965
512
8438
949
488
368
.8 2
7061
088
03
GG
331
839
9 7
1719
428
748
167
.1 1
6531
247
74
GH
146
953
710
0627
434
561
961
.5 2
4737
061
72
GH
238
239
3 7
7520
125
845
959
.2 1
3532
245
72
TO
TAL
43
52
46
89
90
41
27
09
32
115
92
065
.52
39
13
50
85
89
921
NU
MB
ER
OF
RE
GIS
TE
RE
D V
OT
ER
SN
UM
BE
R O
F P
ER
SON
SW
HO
VO
TE
DN
UM
BE
R O
F V
OT
ES
CA
ST F
OR
TO
TAL
VALI
DV
OTE
SC
AST
REJ
ECTE
DB
AL
LO
TPA
PER
SC
LAR
KE
INC
EPE
RC
ENT-
AG
ET
OTA
LFE
MA
LE
MA
LE
TAB
LE
IV
-- 2
0
CO
NST
ITU
EN
CY
-- S
T. G
EO
RG
E N
OR
TH
POLL
ING
STA
TIO
NS
TO
TAL
FEM
AL
EM
AL
E
33

GA
125
025
8 5
0816
419
435
870
.5 1
6019
635
62
GA
2
83 9
3 1
76 5
8 6
712
571
.0
47 7
712
41
GA
318
719
9 3
8611
013
924
964
.5
8416
424
81
GA
451
058
010
9031
839
771
565
.6 3
5236
171
32
GB
145
149
7 9
4830
435
065
469
.0 2
7637
364
95
GB
253
453
610
7034
636
671
266
.5 4
0830
471
20
GB
324
122
9 4
7015
917
032
970
.0 1
8913
932
81
GC
153
556
511
0037
041
878
871
.6 3
6242
478
62
GC
262
968
913
1841
550
491
969
.7 3
9152
491
54
GD
144
247
9 9
2128
635
564
169
.6 2
4039
963
92
GD
227
830
4 5
8218
923
041
972
.0 1
6725
141
81
GD
334
433
0 6
7421
523
945
467
.4 1
7727
645
31
GD
420
519
3 3
9812
214
426
666
.8 1
1215
426
60
TO
TAL
4689
4952
9641
3056
3573
6629
68.8
2965
3642
6607
22
NU
MB
ER
OF
RE
GIS
TE
RE
D V
OT
ER
SN
UM
BE
R O
F P
ER
SON
SW
HO
VO
TE
DN
UM
BE
R O
F V
OT
ES
CA
ST F
OR
TO
TAL
VALI
DV
OTE
SC
AST
REJ
ECTE
DB
AL
LO
TPA
PER
SS
UT
HE
RL
AN
DB
YE
R-
SU
CK
OO
PER
CEN
T-A
GE
TO
TAL
FEM
AL
EM
AL
E
TAB
LE
IV
-- 2
1
CO
NST
ITU
EN
CY
-- S
T. G
EO
RG
E S
OU
TH
POLL
ING
STA
TIO
NS
TO
TAL
FEM
AL
EM
AL
E
34
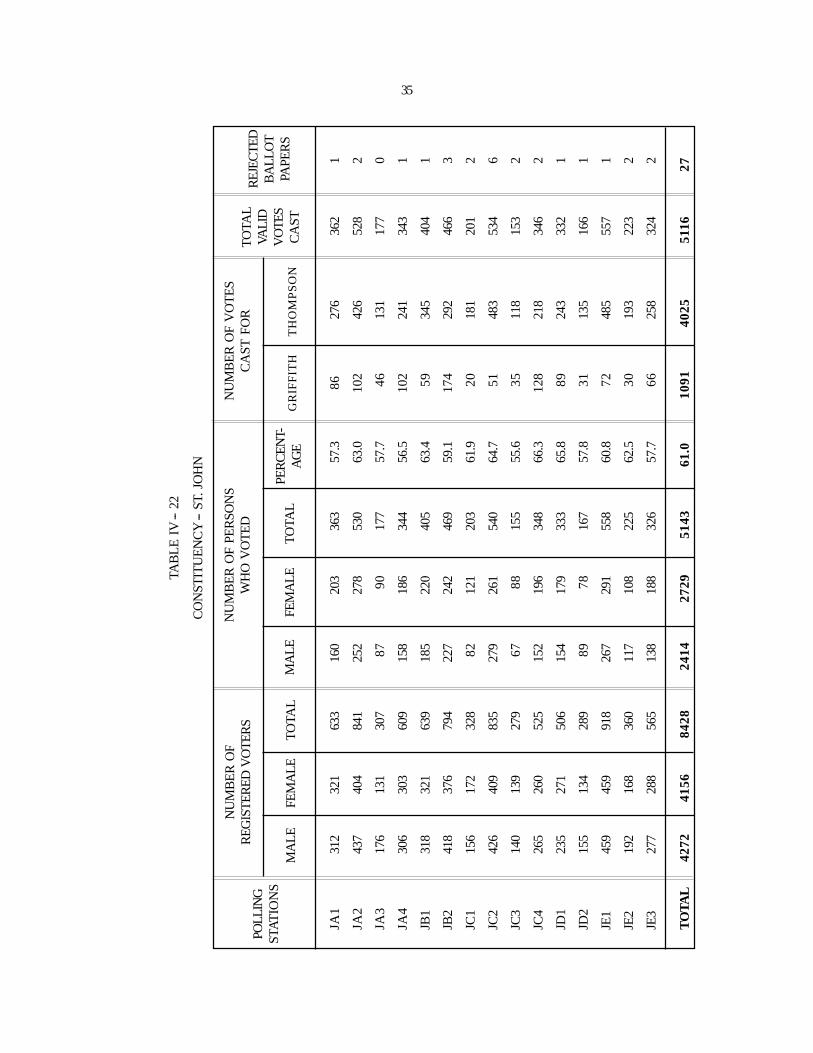
JA1
312
321
633
160
203
363
57.3
86
276
362
1
JA2
437
404
841
252
278
530
63.0
102
426
528
2
JA3
176
131
307
87
90
177
57.7
46
131
177
0
JA4
306
303
609
158
186
344
56.5
102
241
343
1
JB1
318
321
639
185
220
405
63.4
59
345
404
1
JB2
418
376
794
227
242
469
59.1
174
292
466
3
JC1
156
172
328
82
121
203
61.9
20
181
201
2
JC2
426
409
835
279
261
540
64.7
51
483
534
6
JC3
140
139
279
67
88
155
55.6
35
118
153
2
JC4
265
260
525
152
196
348
66.3
128
218
346
2
JD1
235
271
506
154
179
333
65.8
89
243
332
1
JD2
155
134
289
89
78
167
57.8
31
135
166
1
JE1
459
459
918
267
291
558
60.8
72
485
557
1
JE2
192
168
360
117
108
225
62.5
30
193
223
2
JE3
277
288
565
138
188
326
57.7
66
258
324
2
TO
TAL
4272
4156
8428
2414
2729
5143
61.0
1091
4025
5116
27
NU
MB
ER
OF
RE
GIS
TE
RE
D V
OT
ER
SN
UM
BE
R O
F P
ER
SON
SW
HO
VO
TE
DN
UM
BE
R O
F V
OT
ES
CA
ST F
OR
TO
TAL
VALI
DV
OTE
SC
AST
REJ
ECTE
DB
AL
LO
TPA
PER
ST
HO
MP
SO
NG
RIF
FIT
HPE
RC
ENT-
AG
ET
OTA
LFE
MA
LE
MA
LE
TAB
LE
IV
-- 2
2
CO
NST
ITU
EN
CY
-- S
T. J
OH
N
POLL
ING
STA
TIO
NS
TO
TAL
FEM
AL
EM
AL
E
35
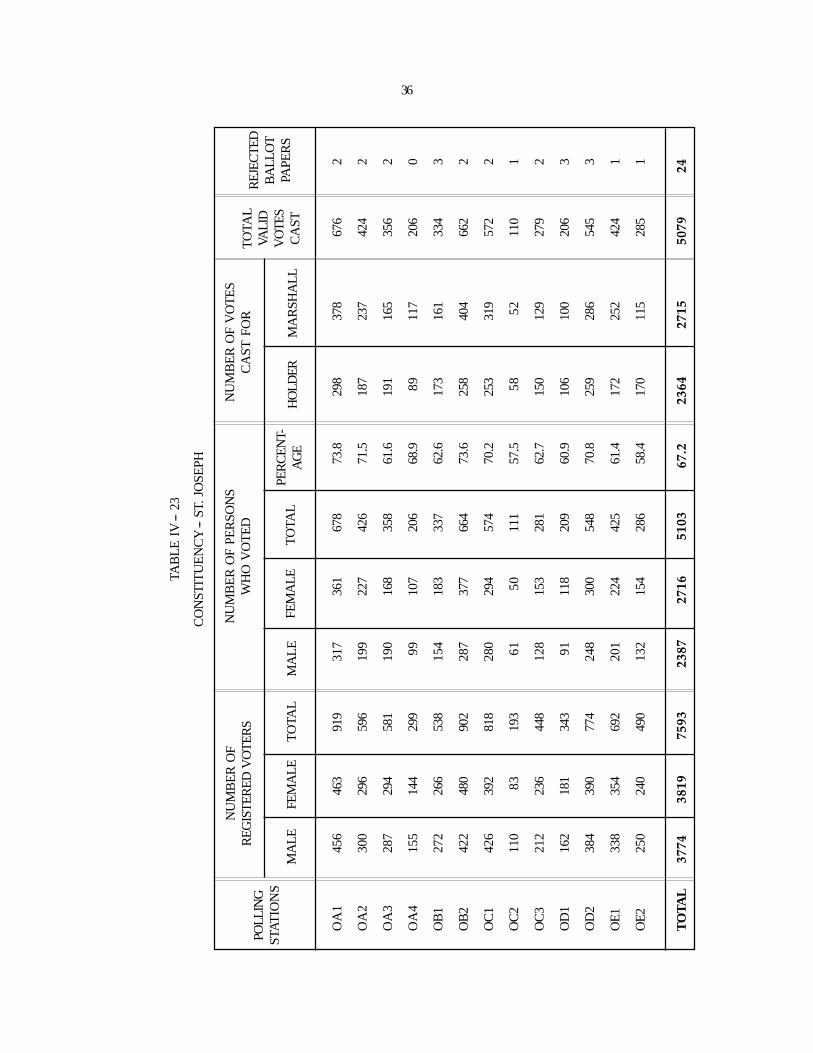
OA
1 4
5646
391
9 3
1736
167
873
.829
837
867
62
OA
2 3
0029
659
6 1
9922
742
671
.518
723
742
42
OA
3 2
8729
458
1 1
9016
835
861
.619
116
535
62
OA
4 1
5514
429
9
9910
720
668
.9 8
911
720
60
OB
1 2
7226
653
8 1
5418
333
762
.617
316
133
43
OB
2 4
2248
090
2 2
8737
766
473
.625
840
466
22
OC
1 4
2639
281
8 2
8029
457
470
.225
331
957
22
OC
2 1
10 8
319
3
61 5
011
157
.5 5
8 5
211
01
OC
3 2
1223
644
8 1
2815
328
162
.715
012
927
92
OD
1 1
6218
134
3
9111
820
960
.910
610
020
63
OD
2 3
8439
077
4 2
4830
054
870
.825
928
654
53
OE
1 3
3835
469
2 2
0122
442
561
.417
225
242
41
OE
2 2
5024
049
0 1
3215
428
658
.417
011
528
51
TO
TAL
3774
3819
7593
2387
2716
5103
67.2
2364
2715
5079
24
NU
MB
ER
OF
RE
GIS
TE
RE
D V
OT
ER
SN
UM
BE
R O
F P
ER
SON
SW
HO
VO
TE
DN
UM
BE
R O
F V
OT
ES
CA
ST F
OR
TO
TAL
VALI
DV
OTE
SC
AST
REJ
ECTE
DB
AL
LO
TPA
PER
SM
AR
SHA
LL
HO
LDER
PER
CEN
T-A
GE
TO
TAL
FEM
AL
EM
AL
E
TAB
LE
IV
-- 2
3
CO
NST
ITU
EN
CY
-- S
T. J
OSE
PH
POLL
ING
STA
TIO
NS
TO
TAL
FEM
AL
EM
AL
E
36

TA1
432
487
919
223
298
521
56.7
340
176
516
5
TA2
478
591
1069
266
413
679
63.5
414
263
677
2
TA3
333
416
749
187
277
464
61.9
292
165
457
7
TB
1 3
7440
4 7
7819
926
346
259
.425
820
446
20
TB
2 2
4323
0 4
7314
015
529
562
.423
0 6
229
23
TC
1 2
7027
4 5
4414
017
331
357
.522
8 8
431
21
TC
2 2
8730
3 5
9016
120
836
962
.529
6 7
236
81
TC
3 1
7816
2 3
4011
010
321
362
.617
0 4
221
21
TD
1 5
8366
012
4329
743
473
158
.846
726
473
10
TD
2 2
7130
8 5
7914
920
135
060
.424
110
935
00
TE
1 5
6066
212
2233
045
478
464
.251
227
178
31
TE
2 4
2243
3 8
5519
322
942
249
.421
220
741
93
TO
TAL
4431
4930
9361
2395
3208
5603
59.9
366
019
1955
7924
NU
MB
ER
OF
RE
GIS
TE
RE
D V
OT
ER
SN
UM
BE
R O
F P
ER
SON
SW
HO
VO
TE
DN
UM
BE
R O
F V
OT
ES
CA
ST F
OR
TO
TAL
VALI
DV
OTE
SC
AST
REJ
ECTE
DB
AL
LO
TPA
PER
SH
IND
SFO
RD
EPE
RC
ENT-
AG
ET
OTA
LFE
MA
LE
MA
LE
TAB
LE
IV
-- 2
4
CO
NST
ITU
EN
CY
-- S
T. T
HO
MA
S
POLL
ING
STA
TIO
NS
TO
TAL
FEM
AL
EM
AL
E
37