report on analysis of medical schemes claims data ... · report on analysis of medical schemes...
TRANSCRIPT

Report on analysis of medical schemes claims data – descriptive
statistics
21 November 2016

i
CONTENTS
TABLES ......................................................................................................................................... iii
FIGURES ....................................................................................................................................... iv
ABBREVIATIONS ........................................................................................................................... v
INTRODUCTION ............................................................................................................................ 6
Approach to understanding health care expenditure .................................................................... 7
DATA .............................................................................................................................................. 8
Data requested ............................................................................................................................ 8
Approach to confidentiality ......................................................................................................... 10
Data received ............................................................................................................................ 10
Data Quality............................................................................................................................... 11
Data quality checks ................................................................................................................ 11
Building of Analysis Datasets .................................................................................................... 12
Results of Quality Checks and Final Dataset ............................................................................. 12
Membership Numbers Reasonability Checks ......................................................................... 14
Claim Amounts Reasonability Checks .................................................................................... 16
Summary of Reasonability Checks......................................................................................... 18
Final data set used for analysis ................................................................................................. 19
METHODOLOGY .......................................................................................................................... 20
Beneficiary File .......................................................................................................................... 20
Demographic Indicators ......................................................................................................... 20
Claims Utilisation Indicators ................................................................................................... 21
Summary Claims Information ................................................................................................. 22
Admissions File ......................................................................................................................... 23
Patient Information ................................................................................................................. 23
Medical Practitioner Information ............................................................................................. 23
Facility Information ................................................................................................................. 24
Admission Information............................................................................................................ 24
Claim Information ................................................................................................................... 25
Additional Methodological Considerations for Descriptive Statistics ........................................... 25
INDUSTRY TRENDS AND STATISTICS ...................................................................................... 27

Report 1 Claims data analysis – descriptive statistics
ii
Demographic Trends ................................................................................................................. 27
Overall Claims Trends ............................................................................................................... 29
Out-of-hospital Costs ................................................................................................................. 30
In-hospital costs ........................................................................................................................ 35
Appendix A – Member data comparison........................................................................................ 40
Appendix B: Claims Data Comparison .......................................................................................... 42

Report 1 Claims data analysis – descriptive statistics
iii
TABLES
Table 1 Medical Schemes that provided no data to the HMI 11
Table 2 Medical schemes with incomplete submissions 13
Table 3 Medical schemes submitting data with material mismatches 14
Table 4 Demographic trends – all schemes 27
Table 5 Demographic trends - open schemes 28
Table 6 Demographic trends – restricted schemes 28
Table 7 Overall cost trends – all schemes 29
Table 8 Overall cost trends – open schemes 29
Table 9 Overall cost trends – restricted schemes 30
Table 10 Out-of-hospital cost trends – all schemes 30
Table 11 Out-of-hospital costs trends – open schemes 31
Table 12 Out-of-hospital cost trends – restricted schemes 31
Table 13 Out-of-hospital claims trends 2010-2014 33
Table 14 Out-of-hospital claims trends 2010-2014 34
Table 15 In-hospital cost trends – all schemes 35
Table 16 In-hospital cost trends – open schemes 36
Table 17 In-hospital cost trends – restricted schemes 36
Table 18 Top ten admitting disciplines 2010-2014 38
Table 19 Admitting diagnosis 2010-2014 38
Table 20 Top ten procedure claims 2010-2014 39

Report 1 Claims data analysis – descriptive statistics
iv
FIGURES
Figure 1 Scheme data requested, supplied, and excluded resulting in final dataset 19
Figure 2 Out-of-hospital claims split by type of service for 2014 32
Figure 3 Admissions per 1000 lives – all schemes 2010-2014 36
Figure 4 Overnight admissions claims split 2014 37

Report 1 Claims data analysis – descriptive statistics
v
ABBREVIATIONS
BHF Board of Health Care Funders
CMS Council for Medical Schemes
Discovery Health Discovery Health Pty Ltd
HMI Health Market Inquiry
ICD10 International Classification of Diseases version 10
NAPPI National Pharmaceutical Product Interface – a unique identifier owned by MediKredit, for all pharmaceutical, surgical and healthcare consumable products in RSA to enable electronic transfer of information throughout the healthcare delivery chain. https://www.medikredit.co.za/index.php?option=com_content&view=article&id=21&Itemid=31)
RSA Republic of South Africa
WTW Willis Towers Watson

6
INTRODUCTION
1. The Competition Commission’s Health Market Inquiry (HMI) is an inquiry into the state,
nature and form of competition within the South African private healthcare sector. The HMI
was initiated as there was reason to believe that there are features of the private
healthcare sector that prevent, distort or restrict competition, and in order to achieve the
purposes of the Competition Act1. The Statement of Issues, published on 1 August 2014,
identified a number of potential sources of harm to competition in the South African
healthcare sector. Subsequently, the HMI published a Revised Statement of Issues on 11
February 2016, which further elaborates on the HMI’s areas of focus. The HMI seeks to
assess whether, and (if so) to what extent, these potential sources of harm exist. The HMI
will then make recommendations on how competition within the private healthcare sector
can be promoted.
2. To allow the HMI to understand expenditure various data were requested from industry
stakeholders.
3. The HMI, through an open tender, appointed Willis Towers Watson (WTW) to assist with
the storage, warehousing and analysis of part of the data collected.
4. This report specifically deals with medical scheme claims data from the period 2010 – 2014
submitted by medical schemes and/or their administrators.
5. The HMI is releasing these data to present and test our analyses and findings before
drawing conclusions. In order to make the information digestible the HMI will be releasing a
series of reports based on the claims data.
6. This is the first of a set of reports and is a descriptive analysis of the data received. Further
reports will use the available data to describe how various factors influence costs and
change in costs over time (the attribution analyses), describing the impact of prescribed
minimum benefits, billing practises and other related analyses. These reports are put out
for information and comments are welcome.
7. This report is based on work done for the HMI by WTW.
1 Section 43B(1)(i) and (ii) of the Competition Act 98 of 1998. See also Section 1 of the HMI Terms of Reference.

Report 1 Claims data analysis – descriptive statistics
7
Approach to understanding health care expenditure
8. One of the objectives of the HMI is to analyse the drivers of expenditure in the private
healthcare industry. The data held by medical schemes provides the best basis to form as
holistic a view as possible of expenditure in the private sector, and hence is the primary
source of data for many of the expenditure analyses undertaken by HMI.
9. These data do not report out-of-pocket spending where an individual pays a provider
directly and does not submit this to their medical aid for reimbursement or is not a member
of a medical aid.
10. The analyses presented in this, and subsequent reports in this series, are based on the
detailed claims and membership data submitted either by the medical schemes directly or
by the medical scheme administrators on behalf of the scheme. This has been
supplemented with other data sources such as the practice numbering system files
submitted by the Board of Healthcare Funders (BHF) and data provided by the hospitals,
where necessary.

Report 1 Claims data analysis – descriptive statistics
8
DATA
Data requested
11. The HMI send an information request to registered medical schemes in March 2015
requesting one year of data. One aim was to assess the structure of the medical schemes
claims data and ascertain what was routinely available in order to inform our approach to
gathering, storing and analysing these data.
12. A further call for claims data was made in October 2015. The HMI requested all claims
submitted to medical schemes for treatments that occurred over the five-year period from
2010 to 2014. The expectation was that all claims would have been submitted by members
to their medical schemes by October 2015 so that the HMI would have complete data for all
requested years.
13. Stakeholders were requested to submit data in four files and seven tables:
14. File one containing:
14.1. All of the healthcare providers with respect to whom claims had been submitted;
14.2. Information on the provider geographic location; and
14.3. The network contracts that the provider had agreed with the medical scheme.
15. File two containing:
15.1. A list of all claim lines submitted to the medical scheme for the treatment period;
15.2. The service dates upon which the claims were incurred;
15.3. The values of the claims submitted by the service providers in Rand;
15.4. The values of benefits paid by the medical schemes in Rand paid from members’
risk/pooled benefit;
15.5. The values of benefits paid by medical schemes in Rand from members’ personal
savings accounts;
15.6. Information on the diagnoses codes (ICD10) pertaining to each claim;
15.7. Information on the service/procedure codes (tariff codes and NAPPI codes)
pertaining to each claim;

Report 1 Claims data analysis – descriptive statistics
9
15.8. Information on the codes used to determine how each claim was classified for
payment against the medical scheme rules (rule code);
15.9. Flags to indicate the benefit category from which each claim was paid, for example
an in-hospital claim versus a prescribed minimum benefit (PMB); and
15.10. Links to the provider, member and beneficiary files.
16. File three containing:
16.1. A list of all medical scheme beneficiaries who were entitled to submit a claim for
treatment over the treatment period;
16.2. The gender of each beneficiary;
16.3. The date of birth of each beneficiary;
16.4. The medical scheme service history for each beneficiary; and
16.5. Links to the member file and the table containing RSA identity numbers.
17. File four containing:
17.1. A list of all medical scheme main members who were entitled to submit a claim for
treatment over the treatment period;
17.2. A history of medical scheme main members’ income;
17.3. A history of and medical scheme plan options; and
17.4. Links to the medical scheme main members’ address history table.
18. The following tables were requested:
18.1. A scheme table to provide descriptions of the various medical schemes in the
dataset and the associated benefit options for each of the years covered;
18.2. Rule code table to provide descriptions of the various rule codes applied during the
assessment of claims;
18.3. In-house code table to provide descriptions of the in-house codes used by the
administrator to pay claims where the standard tariff code tables were
supplemented;
18.4. Details of RSA identity number table;

Report 1 Claims data analysis – descriptive statistics
10
18.5. Family number table to provide details of the numbers used by the administrator to
identify different families on each scheme;
18.6. Date of birth table; and
18.7. The address history of the member/beneficiary.
Approach to confidentiality
19. Confidential data is protected in accordance with the Competition Act. Date of birth, identity
numbers and address data contain personal information that is protected. To protect
information submitted and ensure anonymity the HMI published a “De-identification of
personal data” document on the 1st of June 2016 and a related “Health Market Inquiry
Standard Operating Procedure for Data De-identification” published on the 6th of November
2015. The de-identification of data was performed by the HMI. Subsequent to de-
identification data could be linked appropriately but it was not possible to know the
individual to whom the data referred. Thus all data, from then on, was anonymised. It is
these anonymised data that was used for the analytical work. It was possible for any
individual to be defined, for example, as a male with asthma who saw a particular doctor
and was admitted to a particular hospital but not to know who that individual is or where
they live beyond a reference to the Statistics South Africa enumerator area they live in.
Data received
20. In 2014 the CMS listed 91 registered medical schemes and noted that during the year 8
deregistered leaving 83 schemes still registered at the end of 2014. The requests outlined
above were sent to these 83 registered medical schemes. Additional data was submitted
for 10 schemes that were not approached but for whom data was available at some period
between 2010-2014.
21. We received no data from three schemes listed in table 1.

Report 1 Claims data analysis – descriptive statistics
11
Table 1 Medical Schemes that provided no data to the HMI
Scheme Administrator
Community Medical Aid Scheme (COMMED) Allcare Administrators (Pty) Ltd
Genesis Medical Scheme Self-Administered
Makoti Medical Scheme Universal Healthcare Administrators (Pty) Ltd
Data Quality
22. There is no industry standard data specification in the South African medical schemes
industry. There has also been a proliferation of different administration systems in the
South African medical schemes industry and changes in data management systems within
one scheme over time. While formal specifications were sent to all stakeholders,
nonetheless data was received in various non-comparable formats. This required a series
of to-and-froes between the HMI and stakeholders to ensure clarity and data fidelity.
23. The variability of the data format and administrative systems used by schemes required
unique cleaning algorithms to be developed to cater for each submitter.
24. As standard conventions do not exist regarding how practice numbers, tariff, NAPPI and
ICD10 codes should be captured, stored and/or provided, data manipulation to make these
comparable was required.
25. The HMI had to request some schemes to re-submit data.
26. This process was time consuming and the HMI had to balance having a complete data set
against time limitations. After careful assessment of the additional benefit that would have
been obtained if further efforts had been made to obtain additional correct and/or useable
data, the HMI decided on a cut-off point (31 July 2016) after which data would no longer be
processed.
Data quality checks
27. Following best practise, a number of checks on the quality and completeness of the data
were performed before data were ready for analysis.
28. Quality assessment involved two broad steps:

Report 1 Claims data analysis – descriptive statistics
12
28.1. Checking that the data is consistent with itself i.e. that all years are submitted in the
same format and that formats and other data characteristics are consistent across
the dataset. For the medical scheme data this also involved making sure that the
claims data could be matched to the membership data when the data were
combined. This process was carried out in the data warehouse and has no formal
outputs.
28.2. Another level of quality control is to assess if data received is consistent with an
external data source, if such exists.
29. For this exercise, the CMS data were used as CMS data are audited data that schemes are
required by law to provide to the CMS. This allowed us to assess if the HMI data were the
same as those data that the schemes themselves have verified as true and correct in the
CMS submissions. Each year's total membership and claims data were checked against
the applicable CMS annual report which contains financial details for all registered
schemes.
Building of Analysis Datasets
30. The datasets extracted from the data warehouse and provided to the analysis team are
large and cumbersome to work with on a routine basis. For this reason summarised
analysis datasets were built to enable analysis at a high level of detail without returning to
the raw data every time a new analysis is commissioned. These datasets form the basis for
the quantitative claims analyses undertaken by the HMI, and are structured as follows:
30.1. The 'Beneficiary' dataset contains demographic information for every registered
beneficiary in each of the years analysed, as well as several beneficiary
characteristics and some summarised claims information;
30.2. The 'Admissions' dataset contains details of each hospital admission in each year,
including details of treating practitioners, treating facilities, diagnostic and procedure
information as well as demographic information about the patient; and
30.3. The 'Disciplines' dataset contains summarised cost trends by various cost
categories, which are used to produce the summarised claims statistics contained in
this report.
Results of Quality Checks and Final Dataset

Report 1 Claims data analysis – descriptive statistics
13
31. Nine schemes in table 2 were incomplete in the various aspects explained in the table.
Table 2 Medical schemes with incomplete submissions
Scheme Administrator Notes
Alliance Midmed Medical Scheme
Private Health Administrators (Pty) Ltd
Address, Date of Birth, Family No and RSAID tables missing
Building & Construction Industry Medical Aid Fund
Universal Healthcare Administrators (Pty) Ltd
Claims file missing medicine information
Compcare Wellness Medical Scheme
Universal Healthcare Administrators (Pty) Ltd
Claims file missing medicine information
Grintek Electronics Medical Aid Scheme
Universal Healthcare Administrators (Pty) Ltd
Claims file missing medicine information
Massmart Health Plan Universal Healthcare Administrators (Pty) Ltd
Claims file missing medicine information
Medimed Medical Scheme Providence Healthcare Risk Managers (Pty) Ltd No membership listings provided
Platinum Health Self-Administered No membership listings provided
Tiger Brands Medical Scheme
Universal Healthcare Administrators (Pty) Ltd
Claims file missing medicine information
Topmed Medical Scheme Private Health Administrators (Pty) Ltd
Address, Date of Birth, Family No and RSAID tables missing
32. As outlined above, the data cleaning process required either clarifications or re-
submissions from a number of schemes, the majority of which were received prior to the
cut-off point for inclusion in the final dataset. However, a few schemes did not provide re-
submitted data in time and were excluded from the final analysis dataset. They are listed in
table 3.

Report 1 Claims data analysis – descriptive statistics
14
Table 3 Medical schemes submitting data with material mismatches
Scheme Administrator Notes
Sizwe Medical Fund Sechaba Medical Solutions (Pty) Ltd
No link between membership and claims files
Hosmed Medical Scheme Thebe Ya Bophelo Healthcare Administrators (Pty) Ltd
No link between membership and claims files
Sisonke Health Medical Scheme Providence Healthcare Risk Managers (Pty) Ltd
Significant unmatched claims, some beneficiaries not assigned to policy
Suremed Health Providence Healthcare Risk Managers (Pty) Ltd
Significant unmatched claims, some beneficiaries not assigned to policy
Rhodes University Medical Scheme
Providence Healthcare Risk Managers (Pty) Ltd
No policy file, significant unmatched claims
33. The excluded data constitutes 491 581 beneficiaries. The HMI has data covering 8 294 452
beneficiaries, constituting 94.41% of the 2014 medical scheme population of South Africa,
at its disposal for analysis. It is more than reasonable to assume that this excluded data will
have negligible material impact on the results presented in this and subsequent related
reports. (See figure 1.)
Membership Numbers Reasonability Checks
34. In order to assess the completeness of the membership files supplied by the stakeholders,
the total exposed beneficiaries calculated for each submitting scheme from the data
provided was compared to the total figures provided in the CMS annual reports for the
periods covered. The detailed results are contained in Appendix A, and show the
calculated membership per scheme per year divided by the membership reported in the
CMS report (100% would indicate an exact match, less than 100 suggests that more data
was submitted to the CMS than to the HMI and more than 100 indicates that more (maybe
duplicate data) were submitted to the HMI compared to that submitted to the CMS. The
general findings from the comparison were as follows:
34.1. In the majority of cases, the figures were very close, allowing for the fact that
backdated membership changes can occur and for the inherent volatility of
membership databases;

Report 1 Claims data analysis – descriptive statistics
15
34.2. However, certain specific issues were identified as follows:
34.2.1. Afrisam Medical Scheme amalgamated with Discovery Health Medical
Scheme on 1 June 2010 and hence the data is incomplete for 2010 and
no data exists after 2010 (even though the scheme no longer operates,
the data has been kept by Discovery Health (Pty) Ltd (Discovery Health)
and was provided to the HMI);
34.2.2. Altron Medical Scheme amalgamated with Discovery Health Medical
Scheme on 1 January 2014 and hence no data exists after 2013 (again,
even though the scheme no longer operates, the data has been kept by
Discovery Health and was provided to the HMI);
34.2.3. Anglo Medical Scheme changed administrators from Momentum to
Discovery Health on 1 January 2014, and it appears the historical data
kept by Momentum and provided to the HMI overstates the membership
of the scheme;
34.2.4. BMW Employees Medical Aid Scheme changed administrators from
Medscheme to Discovery Health on 1 January 2014, but the historical
data was not provided by Medscheme, and thus BMW is only included for
2014;
34.2.5. Edcon Medical Aid Scheme amalgamated with Discovery Health Medical
Scheme on 1 January 2012 and hence no data exists after 2011 (again,
even though the scheme no longer operates, the data has been kept by
Discovery Health and was provided to the HMI);
34.2.6. Glencore Medical Aid Scheme only provided data for the 2014 benefit
year, and was not included in CMS reports prior to 2014;
34.2.7. IBM South Africa Medical Scheme amalgamated with Discovery Health
Medical Scheme on 1 July 2013 and hence the data is incomplete for
2013 and does not exist for 2014 (even though the scheme no longer
operates, the data has been kept by Discovery Health and was provided
to the HMI);
34.2.8. Impala Medical Plan did not submit data for 2010 and 2011, and the data
submitted for the other years appears incomplete;
34.2.9. KeyHealth only submitted data for 2013 and 2014;

Report 1 Claims data analysis – descriptive statistics
16
34.2.10. Malcor Medical Scheme changed administrators from Eternity to
Discovery Health in 2015 and although Discovery Health submitted data
in respect of Malcor, the data did not cover the period requested and
hence no submission could be used for Malcor;
34.2.11. Medihelp only submitted data from 2012;
34.2.12. Naspers Medical Fund was self-administered in 2010 and transferred to
Discovery Health from 2011 and, although some data was provided in
respect of 2010 by Discovery Health, it appears incomplete;
34.2.13. PG Group Medical Scheme is still operational, but only submitted data for
2010 and 2011;
34.2.14. Profmed only submitted data from 2013;
34.2.15. Resolution Health Medical Scheme only submitted data from 2012;
34.2.16. A comparison with the CMS report would suggest that SAMWUMED have
submitted membership data which is incomplete;
34.2.17. Sedmed only provided data from 2012, and appears to have been
excluded from the 2013 CMS report for non-submission of their annual
financial reports;
34.2.18. Selfmed only provided data from 2012, and the membership files appear
to overstate the membership of the scheme;
34.2.19. Spectramed only provided data from 2012;
34.2.20. TFG Medical Aid Scheme only provided data from 2012;
34.2.21. Umed amalgamated with Discovery Health Medical Scheme on 1 August
2010 and hence the data is incomplete for 2010 and no data exists after
2010 (even though the scheme no longer operates, the data has been
kept by Discovery Health and was provided to the HMI); and
34.2.22. Witbank Coalfields Medical Scheme appears to have provided an
incomplete membership listing as part of its submission.
Claim Amounts Reasonability Checks
35. In order to assess the completeness of the claims data files supplied by stakeholders, the
total insured benefits calculated for each submitting scheme from the data provided was
compared to the total figures provided in the income statements outlined in the CMS
annual reports for the periods covered. The detailed results are contained in Appendix B,

Report 1 Claims data analysis – descriptive statistics
17
and show the calculated claims incurred per scheme per year divided by the membership
reported in the CMS report (100% would again indicate an exact match in this case).
36. We note that the CMS figures include some managed care and risk transfer/capitation
arrangements which do not feed into the detailed data, so claims figures are expected to be
lower for schemes with such arrangements. The general findings from the comparison are
as follows:
36.1. In the majority of cases, the figures are very close, allowing for the fact that claims
can be submitted post the CMS reporting period and for the inherent volatility of
claims databases;
36.2. However, note should be taken of the following:
36.2.1. The same set of issues around incomplete submissions and
amalgamations will be relevant to this comparison as well;
36.2.2. As with the membership, the claims amounts in the Anglo Medical
Scheme data supplied by Momentum appear to be overstated;
36.2.3. Again, as with the membership, Food Workers Medical Benefit Fund
appears to have provided an incomplete data set;
36.2.4. Horizon Medical Scheme shows lower claims than outlined in the CMS
report, however the CMS report also indicates a significant risk transfer
arrangement for the scheme, which is likely the reason for the difference;
36.2.5. As per the membership data checks above, Impala Medical Plan appears
to have provided an incomplete dataset, although a significant risk
transfer arrangement is also reported in the CMS report for the scheme;
36.2.6. Lonmin Medical Scheme shows significantly lower claims than outlined in
the CMS report, however the CMS report also indicates a significant risk
transfer arrangement for the scheme, which is likely the reason for the
difference;
36.2.7. The Naspers Medical Fund was self-administered in 2010 and these 2010
data are incomplete;
36.2.8. As per the membership file checks, SAMWUMED appears to have
provided incomplete data;
36.2.9. Umvuzo Health also shows significantly lower claims than outlined in the
CMS report, however the CMS report also indicates a significant risk

Report 1 Claims data analysis – descriptive statistics
18
transfer arrangement for the scheme, which is likely the reason for the
difference;
36.2.10. Witbank Coalfields Medical Aid Scheme also shows significantly lower
claims than outlined in the CMS report, however the CMS report indicates
a significant risk transfer arrangement for the scheme, which is likely the
reason for the difference.
Summary of Reasonability Checks
37. As a result of the checks against the CMS report, three key issues have been identified,
and our approach to them is as follows:
37.1. A number of schemes have only provided data for part of the requested time period
(2010-2014); either for systems reasons or because the scheme amalgamated and
is no longer registered independently. These data have been included in our
analyses. Thus when total numbers are used these may vary, for example, in a year
it would appear that there are more lives covered but this is as a result of more
complete data for that year rather than a real change in the number of lives covered.
Membership analysis (number of lives covered) at the industry level are best
understood using CMS data. However when analyses are done as a ratio the
numerator and denominator are aligned and these results are not impacted by
missing data for particular years. Trend analyses are conducted at a ‘per
beneficiary’ level and are thus unaffected by the change in absolute numbers.
37.2. A number of schemes appear to have provided incomplete data for both
membership and claims. However the incompleteness is consistent across both
files, and suggests only a subset of members has been provided to the HMI for
whatever reason. Since the analysis data has been cleaned to ensure all claims
match to the membership file, there is no problem including these schemes in the
analysis dataset. However, to the extent these schemes are isolated in any
individual analyses, the results should be interpreted with some caution.
37.3. Anglo Medical Scheme shows overstated claims and membership for the years it
was administered by Momentum. Since the scheme is small and no specific
analyses by individual scheme are envisaged, the results should not be materially
impacted by including the Momentum data. This could be important since Anglo

Report 1 Claims data analysis – descriptive statistics
19
Medical Scheme is the only case where data has been supplied pre- and post an
administration change for a scheme, if specific analysis results based on the
Momentum data is used to understand pre-post administration change for this case,
it should be interpreted with caution.
Final data set used for analysis
38. A graphic illustration of the final data set, the number of lives covered and percentage of
the industry reflected in the analyses is presented in Figure 1 below.
Figure 1 Scheme data requested, supplied, and excluded resulting in final dataset

Report 1 Claims data analysis – descriptive statistics
20
METHODOLOGY
39. We describe our approach to produce the summary analysis datasets and the methods
used in preparing the descriptive statistics presented in this report. It should be noted that
methods presented here will also be relevant to subsequent publications on further
analyses forthcoming.
Beneficiary File
40. The beneficiary file contains various demographic information about each registered
beneficiary in each benefit year, as well as some indicators built off claims data and
summary claims information.
Demographic Indicators
41. The demographic information (age, gender, medical scheme, plan selection, dependent
type) was extracted directly from the information provided by the stakeholders. In addition
two indicator variables were created to describe individual clinical profiles and member
movements in the industry.
41.1. The clinical profile indicator is used to standardise the clinical profiles of
beneficiaries including the burden of disease across the industry and over time. It
builds a clinical profile of each beneficiary's health status using the claims
experience over time. Beneficiaries are then grouped into 18 different clinically and
financially homogeneous groups which are created as follows:
41.1.1. Using the Clinical Classifications Software (CCS) published by the
Healthcare Cost and Utilisation Project (HCUP) we grouped ICD10 codes
into clinically consistent diagnosis groups, which are summarised into the
18 groups used for the indicator;
41.1.2. As far as possible, medicine NAPPI codes are mapped to the conditions
they are used to treat, and similarly assigned a summary group;
41.1.3. A beneficiary is then assigned to a group if either:
41.1.4. They have two or more out-of-hospital medical practitioner consultations
within that diagnosis group; or

Report 1 Claims data analysis – descriptive statistics
21
41.1.5. They have a single out-of-hospital medical practitioner consultation within
that group, but have also claimed two or more times for medications
associated with that diagnosis group.
41.1.6. The conditions are then prioritised by severity and beneficiaries assigned
uniquely to the group corresponding to the most severe of the conditions
they have been assigned to. For example, if a beneficiary is assigned to
the “Acute Respiratory” and “HIV” group they will be labelled as “HIV”.
41.2. The member movements indicator is created as follows2:
41.2.1. Beneficiaries joining their scheme (not the industry) in the analysis year
for any reason are grouped as ‘Joiners’;
41.2.2. Beneficiaries resigning from their scheme in the analysis year for any
reason are grouped as 'Leavers';
41.2.3. Beneficiaries who are on a different plan within the same scheme in the
analysis year to the one they were on in the previous year are grouped as
'Switchers'; and
41.2.4. All other beneficiaries are grouped as 'Stayers'.
Claims Utilisation Indicators
42. A number of claims utilisation indicators have been built to describe how beneficiaries
navigate through the healthcare system when in need of care. These describe what type of
medical practitioners a beneficiary claims for, how many different practices the beneficiary
visits and how many services the beneficiary used. The indicators are as follows:
42.1. The medical practitioner usage indicator aims to assess the extent to which
members use general practitioners as an entry point to the healthcare system.
Beneficiaries are grouped into four groups as follows:
42.1.1. Those who have not seen a medical practitioner (either general
practitioner or specialist);
42.1.2. Those who have only seen general practitioners;
42.1.3. Those who have visited both general practitioners and specialists; and
42.1.4. Those who have only visited specialists.
2 Reliable mortality data is not universally available in the industry and was thus not requested.

Report 1 Claims data analysis – descriptive statistics
22
42.2. The multiple medical practitioner indicator describes whether beneficiaries
consistently use one medical practitioner, or whether they change practitioners
regularly. The indicator is 'Yes' if a beneficiary claims for more than two different
practitioners within the same discipline in the same year.
42.3. The pathology usage indicator measures the number of pathology tests performed
on a beneficiary in a given year. We also assessed, for those who claimed for
pathology tests, the average number of tests claimed per beneficiary. The indicator
is:
42.3.1. 'None' if there are no claims for pathology;
42.3.2. 'Low' if a beneficiary claims for pathology, but for significantly fewer than
average tests;
42.3.3. 'Average' if the number of tests is similar to the average for those
beneficiaries who claim; and
42.3.4. 'High' if a beneficiary claims for significantly more pathology tests than the
average.
42.4. We note that while this may imply that the average use is appropriate this is not
assumed to be the case, it may be inappropriately too high or too low, but
nonetheless the approach allows us to categorise all data in a similar way for
analysis purposes.
42.5. The radiology usage indicator is created for the same reason and in the same way
as the pathology usage indicator.
Summary Claims Information
43. In the beneficiary file claims are split between out-of-hospital and in-hospital claims. In-
hospital claims are identified by using the first date for which a hospital claim is recorded –
the day the beneficiary was hospitalised (claimed from one or more hospitals) and we
assume that all claims incurred on the days a beneficiary was hospitalised relate to that
hospitalisation and are classified as in-hospital claims. The claims are then grouped as
follows:
43.1. In-hospital claims are summarised at an overall level, and the beneficiary file
contains only the number of admissions (number of hospital claims with unique,

Report 1 Claims data analysis – descriptive statistics
23
non-sequential dates) and the total in-hospital claims. In-hospital claims are
analysed in detail using the Admissions file. (See below)
43.2. Out-of-hospital claims are grouped by discipline as follows:
43.2.1. Medicines, Consumables and Surgical items (any items where a NAPPI
codes is claimed and all pharmacy claims);
43.2.2. General Practitioner;
43.2.3. Specialists, including anaesthesiologists to the extent there are out-of-
hospital claims;
43.2.4. Pathologists;
43.2.5. Radiologists;
43.2.6. Auxiliary Services; and
43.2.7. Other.
43.3. Out-of-hospital Prescribed Minimum Benefit (PMB) diagnosis claims are also
summarised in the beneficiary file. These are identified using the list of PMB ICD10
codes published by the CMS.
Admissions File
44. The admission file contains details about each hospital admission (as defined above),
including details of the facility admitted to, the treating medical practitioners and the patient,
as well as information about the diagnosis and procedure(s) performed.
Patient Information
45. A number of indicators are transferred from the beneficiary file outlined above to give
insight into the demographic and clinical profiles of the patient. These are age, gender,
medical scheme, medical scheme plan, the clinical profile indicator. Geographic location
using enumerator areas and catchment areas will be added for later analyses.
Medical Practitioner Information
46. As part of the admission file, information about the medical practitioners who have treated
the patient is also recorded. The fields are as follows:

Report 1 Claims data analysis – descriptive statistics
24
46.1. Treating discipline and medical practitioner, identified as the medical practitioner
who has claimed the highest value over the duration of the admission, excluding
anaesthesiologists;
46.2. Attending medical practitioners, up to a maximum of four, indicating which practices
have claimed for that patient during the course of the admission;
46.3. Treating radiologist and pathologist, identified as the radiologist and pathologist with
the highest value of claims for that patient during the admission.
Facility Information
47. The treating facility, as well as its geographic location, are also identified. To the extent that
a patient is transferred from one facility to another, the facility where higher values are
claimed will be identified as the treating facility. ‘Facility’ in this instance refers to psychiatric
hospitals, general hospitals, provincial hospitals and day clinics, and excludes sub-acute
facilities and rehabilitation centres.
Admission Information
48. Some information about the reason for and nature of the admission is also recorded as
follows:
48.1. Admission and discharge dates (the first and last dates of hospital claims for that
admissions) as well as a “day admission flag” (a day admission is where the
admission and discharge dates are the same);
48.2. Admission type indicator; ‘Maternity’ if the hospital tariff codes indicate a maternity
ward, ‘Surgical’ if a theatre claim is recorded, or else ‘Medical’;
48.3. Number of days spent in day wards, general wards, high care ward, intensive care
and maternity wards, as well as number of minutes spent in theatre;
48.4. Diagnoses provided by the attending medical practitioners as well as the facilities
separately, grouping using the CCS classification of ICD10 codes (to the extent
multiple diagnosis groups are recorded the group with the highest claimed value is
used);

Report 1 Claims data analysis – descriptive statistics
25
48.5. Procedure performed (if any), grouped using the medical practitioner tariff codes
classified into the CCS procedure classification (again if there are multiple
procedure groups the highest value group is used); and
48.6. Admission day (of the week).
Claim Information
49. As with the out-of-hospital claims in the beneficiary file, the admission file claims have been
grouped by discipline (using the hospital tariff codes where necessary), as follows:
49.1. Hospital Ward Fees;
49.2. Hospital Theatre Fees;
49.3. Hospital Medicines, Consumables and Surgical Items;
49.4. Hospital ARM codes (any per diem or global fee arrangements, as identified by the
medical scheme administrators);
49.5. Other Hospital claims;
49.6. General Practitioners;
49.7. Specialists;
49.8. Anaesthesiologist;
49.9. Pathologists;
49.10. Radiologists;
49.11. Auxiliary claims; and
49.12. Other.
50. In addition, PMB claims have been identified in two ways, firstly by the CMS diagnosis
codes as outlined above and, secondly, by the PMB benefit indicator which the medical
schemes were asked to provide.
Additional Methodological Considerations for Descriptive Statistics
51. When calculating the descriptive statistics, the following definitions were taken into
account:

Report 1 Claims data analysis – descriptive statistics
26
51.1. When the report refers to members, it counts total members on any scheme in a
given year, as opposed to the average exposed membership used in financial
reporting. This will mean that the numbers reflected in our results will be higher than
the numbers reported in the CMS annual reports.
51.2. Claim figures (or costs) are calculated using fees charged as opposed to benefits
paid. Thus claim estimates will include claims rejected and paid out of pocket by
beneficiaries as well as those paid from medical savings accounts. We note that
true out of pocket expenditure will still be understated since claims not submitted to
medical schemes and paid out of pocket will not be recorded.
51.3. 'Open' and 'Restricted' schemes are defined as in the CMS annual reports.
51.4. All calculated inflation figures are annualised, i.e. when an inflation figure from 2010
to 2014 is quoted as x%, it should be read as x% per year. This will be consistent
throughout all of the reports produced as part of the expenditure analysis, and any
exceptions will be noted accordingly.
51.5. Where claims figures are summarised by an analysis variable, the definition will
correspond to those used in the sections above.

Report 1 Claims data analysis – descriptive statistics
27
INDUSTRY TRENDS AND STATISTICS
Demographic Trends
52. The table below shows the demographic profile of the schemes for which data has been
supplied to the HMI between 2010 and 2014:
Table 4 Demographic trends – all schemes
Year Beneficiaries Average Age % Male
2010 7 783 718 31.26 47.37%
2011 8 068 616 31.38 47.37%
2012 8 842 029 32.01 47.16%
2013 9 209 614 32.29 47.18%
2014 9 211 943 32.49 47.06% Change 18.35% 1.23 -0.31%
53. The table shows that:
53.1. The membership of this group of schemes has grown by 18.35% over the five year period. A significant proportion of this is because some schemes have only been able to supply data for later parts of the requested period, but there also is some genuine growth of the industry. 3
53.2. The industry average age has increased by 1.23 years over the five-year period. This is similar to the figures reported in the CMS annual report, which shows a gradually increasing average age3.
54. The figures for open and restricted schemes are shown in the tables below:
3 Please see paragraph 51.1 for explanation of why CMS data differs slightly from these data. Further description of how
these data vary from CMS data is presented in detail in appendices 1 and 2.
Report 1 Claims data analysis – descriptive statistics
28
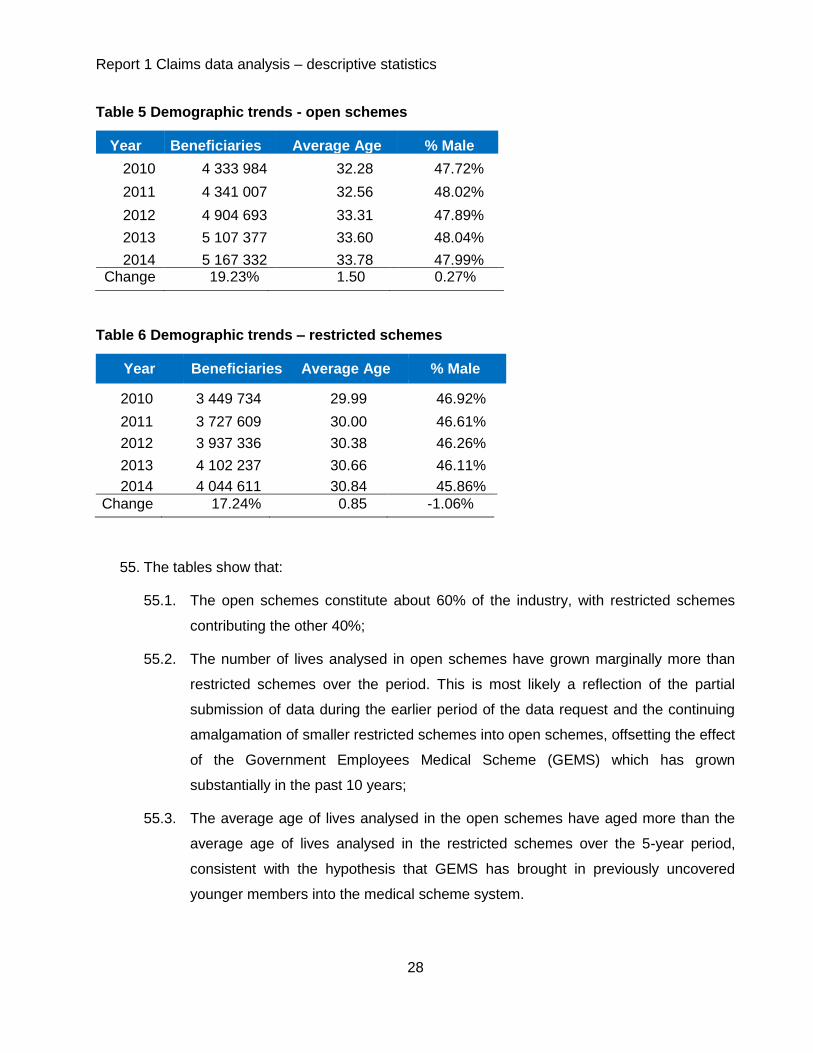
Table 5 Demographic trends - open schemes
Year Beneficiaries Average Age % Male
2010 4 333 984 32.28 47.72%
2011 4 341 007 32.56 48.02%
2012 4 904 693 33.31 47.89%
2013 5 107 377 33.60 48.04%
2014 5 167 332 33.78 47.99% Change 19.23% 1.50 0.27%
Table 6 Demographic trends – restricted schemes
Year Beneficiaries Average Age % Male
2010 3 449 734 29.99 46.92%
2011 3 727 609 30.00 46.61%
2012 3 937 336 30.38 46.26%
2013 4 102 237 30.66 46.11%
2014 4 044 611 30.84 45.86%
Change 17.24% 0.85 -1.06%
55. The tables show that:
55.1. The open schemes constitute about 60% of the industry, with restricted schemes
contributing the other 40%;
55.2. The number of lives analysed in open schemes have grown marginally more than
restricted schemes over the period. This is most likely a reflection of the partial
submission of data during the earlier period of the data request and the continuing
amalgamation of smaller restricted schemes into open schemes, offsetting the effect
of the Government Employees Medical Scheme (GEMS) which has grown
substantially in the past 10 years;
55.3. The average age of lives analysed in the open schemes have aged more than the
average age of lives analysed in the restricted schemes over the 5-year period,
consistent with the hypothesis that GEMS has brought in previously uncovered
younger members into the medical scheme system.

Report 1 Claims data analysis – descriptive statistics
29
Overall Claims Trends
56. Table 7 below shows the overall cost trends for the schemes included in the dataset over
the period. These are crude data with no adjustments for risk or case mix.
Table 7 Overall cost trends – all schemes
Cost Trends - All Schemes 2011 2012 2013 2014
Total Cost Increase 13.03% 19.00% 13.75% 10.19%
Membership Growth 3.66% 9.59% 4.16% 0.03%
Cost Increase per beneficiary 9.04% 8.59% 9.21% 10.16%
Utilisation
- Frequency (% claimers) 1.32% 0.13% 1.17% 1.11%
- Intensity (cost per claimer) 2.50% 2.70% 2.13% 2.68%
Price (CPI) 5.00% 5.60% 5.70% 6.10%
57. The table shows that, adjusted for membership, claim costs have increased by between
8.59% and 10.16% a year over the last five years. This compares to a CPI of between
5.0% and 6.1%. This would suggest that medical scheme claims inflation is at least 4%
higher than CPI consistently. A contribution of around 1% to 4% margin comes from
utilisation frequency, i.e. more lives claiming than before, while rest comes either from
intensity (more services being used per claimer) or price increases above CPI. These
trends will be explored further in later reports.
58. The tables for open and restricted schemes are shown respectively below, showing some
differences by individual year, but similar trends at an overall level.
Table 8 Overall cost trends – open schemes
2011 2012 2013 2014
Total Cost Increase 10.17% 19.79% 15.90% 11.11%
Membership Growth 0.16% 12.99% 4.13% 1.17%
Cost Increase per beneficiary 9.99% 6.02% 11.30% 9.82%
Utilisation
- Frequency (% claimers) 0.71% -0.56% 2.38% 0.47%
- Intensity (cost per claimer) 4.02% 0.96% 2.85% 3.02%
Price (CPI) 5.00% 5.60% 5.70% 6.10%

Report 1 Claims data analysis – descriptive statistics
30
Table 9 Overall cost trends – restricted schemes
2011 2012 2013 2014
Total Cost Increase 16.95% 17.98% 10.93% 8.92%
Membership Growth 8.05% 5.63% 4.19% -1.40%
Cost Increase per beneficiary 8.23% 11.70% 6.74% 10.47%
Utilisation
- Frequency (% claimers) 1.73% 1.20% -0.21% 1.97%
- Intensity (cost per claimer) 1.33% 4.52% 0.94% 2.11%
Price (CPI) 5.00% 5.60% 5.70% 6.10%
Out-of-hospital Costs
59. The tables outlined above are repeated below considering only out-of-hospital costs. Again
these figures have not been adjusted for risk profiles of the population.
Table 10 Out-of-hospital cost trends – all schemes
2011 2012 2013 2014
Total Cost Increase 11.55% 15.33% 11.43% 9.36%
Membership Growth 3.66% 9.59% 4.16% 0.03%
Cost Increase per beneficiary 7.61% 5.25% 6.99% 9.33%
Utilisation
- Frequency (% claimers) 1.42% 0.13% 1.21% 1.13%
- Intensity (cost per claimer) 1.05% -0.46% 0.01% 1.90%
Price (CPI) 5.00% 5.60% 5.70% 6.10%
60. The table shows that the cost increase is smaller for out-of-hospital claims than the overall
increase. This suggests a proportion shift in expenditure – more of the total spend is on in-
hospital than out-of-hospital costs over time. The results by scheme type are again shown
below, with similar trends (albeit with greater variability).

Report 1 Claims data analysis – descriptive statistics
31
Table 11 Out-of-hospital costs trends – open schemes
2011 2012 2013 2014
Total Cost Increase 8.91% 15.24% 14.18% 9.72%
Membership Growth 0.16% 12.99% 4.13% 1.17% Cost Increase per beneficiary
8.74% 1.99% 9.65% 8.45%
Utilisation
- Frequency (%claimers) 0.82% -0.56% 2.44% 0.49% - Intensity (cost per claimer) 2.72% -2.88% 1.26% 1.71%
Price (CPI) 5.00% 5.60% 5.70% 6.10%
Table 12 Out-of-hospital cost trends – restricted schemes
2011 2012 2013 2014
Total Cost Increase 14.96% 15.45% 8.08% 8.89%
Membership Growth 8.05% 5.63% 4.19% -1.40% Cost Increase per beneficiary 6.39% 9.30% 3.73% 10.44%
Utilisation
- Frequency (%claimers) 1.78% 1.21% -0.19% 1.98%
- Intensity (cost per claimer) -0.45% 2.27% -1.68% 2.07%
Price (CPI) 5.00% 5.60% 5.70% 6.10%
61. The proportion of out-of-hospital expenditure by each of the categories defined above is
shown in the graph below. It shows that, as expected, medicines (medicines category
includes both acute and chronic medication claims) and medical practitioner services are
the most prevalent categories, with auxiliary services and other claims forming a smaller
proportion.

Report 1 Claims data analysis – descriptive statistics
32
Figure 2 Out-of-hospital claims split by type of service for 2014
62. Table 13 shows for all schemes the overall change in the disease profile as well as the
annual change over the 5-year period in the cost per beneficiary by each of the clinical
profile disease flags over time.
Specialist 11%
GP 13%
Medicine 40%
Pathology 9%
Radiology 5%
Auxiliary 5%
Other 17%

33
Table 13 Out-of-hospital claims trends 2010-2014
This table shows that:
62.1. The out-of-hospital claims have increased annually by 7.27% per beneficiary per year;
62.2. The categories which show the highest annual increase are pathology (12.38%) and radiology (10.12%), followed by
specialist services category (9.07%);
Average Annual Increase Lives Specialist GP Meds Pathology Radiology Auxiliary Other Total OH
Healthy1
-1.4% 9.91% 8.06% 7.98% 13.14% 10.71% 9.00% 4.96% 8.01%
Acute Respiratory 0.6% 5.82% 5.19% 5.62% 9.25% 8.48% 7.76% 2.08% 5.31%
Chronic Respiratory -0.3% 6.17% 4.76% 5.15% 9.07% 8.38% 7.06% 4.12% 5.46%
Hypertension 0.7% 7.36% 5.60% 4.33% 10.86% 8.98% 6.78% 3.51% 5.39%
Infections -0.4% 7.20% 5.69% 6.95% 9.49% 9.81% 9.61% 3.21% 6.45%
Psychiatric 0.2% 6.93% 4.15% 4.68% 7.51% 7.37% 6.25% 4.52% 5.19%
Diabetes 0.3% 8.15% 3.96% 4.15% 12.54% 9.28% 4.67% 2.73% 5.18%
HIV 0.4% 1.27% 5.08% 2.45% 7.21% 8.27% 13.43% 2.01% 3.86%
CNS Disorders -0.1% 7.69% 5.47% 5.24% 10.08% 7.12% 7.19% 5.86% 6.20%
Back Problems 0.0% 5.61% 5.74% 4.47% 8.68% 5.50% 4.88% 1.17% 4.68%
Arthritis 0.0% 7.52% 5.62% 7.11% 9.15% 8.32% 6.21% 2.57% 6.43%
Cancer 0.1% 6.91% 6.86% 0.52% 9.42% 9.19% 7.05% 7.11% 4.02%
Heart Conditions 0.0% 8.64% 5.98% 3.76% 15.02% 7.65% 5.51% 5.05% 6.24%
Other Cardiovascular -0.2% 12.12% 3.27% 7.06% 10.86% 13.56% 6.04% 6.75% 7.75%
Anaemia, Blood Disorders 0.0% 6.22% 4.32% 7.03% 9.98% 8.49% 6.38% 3.94% 6.80%
Renal Failure 0.0% 4.36% 7.50% 0.48% 5.83% 5.13% 1.03% 3.12% 3.70%
Congenital Conditions 0.0% 8.29% 2.30% 5.66% 6.50% 5.37% 13.70% 8.87% 6.89%
Coma, Brain Damage, Paralysis 0.0% 10.86% 2.09% 6.69% 20.39% -2.04% 7.46% 14.61% 8.67%
All Lives 0.0% 9.07% 6.58% 6.83% 12.38% 10.12% 8.20% 4.56% 7.27%

Report 1 Claims data analysis – descriptive statistics
34
62.3. The disease profile of the population analysed does not appear to have shifted markedly over time, although some of
the chronic diseases (hypertension and HIV) show an increasing prevalence; and
62.4. The highest annual increases are for the so called ‘Healthy’ i.e. unassigned lives.
63. Table 14 shows the same trends, but illustrates beneficiaries by the medical practitioner usage variable (GPs only - one or
more; specialists only - one or more; both GPs and specialist – one or more).
Table 14 Out-of-hospital claims trends 2010-2014
Annual Increase Lives Specialist GP Meds Pathology Radiology Auxiliary Other Total OH
No medical Practitioners -2.4% 7.81% 12.22% 12.17% 9.41% 5.78% 7.42%
GPs only - single 1.5% 5.72% 6.67% 11.73% 9.55% 8.13% 3.04% 6.05%
- multiple 0.1% 4.84% 6.94% 11.26% 12.00% 14.45% 2.51% 6.26%
Specialists only - single 0.0% 8.33% 5.43% 13.79% 9.99% 6.63% 5.39% 7.50%
- multiple 0.0% 19.47% 9.14% 12.31% 21.74% 8.30% 7.94% 13.38%
GPs and Specialists - single 0.7% 7.84% 6.01% 5.49% 10.95% 8.65% 5.78% 4.31% 6.45%
- multiple 0.0% 9.97% 5.78% 5.97% 10.92% 10.21% 9.47% 5.17% 7.39%
All Lives 0.0% 9.06% 6.58% 6.83% 12.38% 10.12% 8.20% 4.56% 7.27%

Report 1 Claims data analysis – descriptive statistics
35
64. In addition to the points made with regard to disease profile (Table 13) this table
illustrates that:
64.1. Those beneficiaries visiting only specialists show higher cost increases than the
remaining beneficiaries, with the group visiting multiple specialists showing the
highest increases of all, noting again that the figures in the table have not been
adjusted for any changes in clinical or demographic risk profiles;
64.2. It is noted that fewer beneficiaries are falling into the “no medical practitioners”
category. This implies that over time larger proportions of the population are
being managed by and/or accessing the services of medical practitioners.
In-hospital costs
65. The tables outlined in the previous sub-section are repeated below but now present in-
hospital costs. Again these figures have not been adjusted for risk profiles of the
population changing over time.
Table 15 In-hospital cost trends – all schemes
IH Cost Trends - All Schemes 2011 2012 2013 2014
Total Cost Increase 14.30% 22.07% 15.58% 10.82%
Membership Growth 3.66% 9.59% 4.16% 0.03%
Cost Increase per beneficiary 10.27% 11.40% 10.97% 10.79%
Utilisation
- Frequency (% claimers) 1.91% 1.97% 2.50% 2.37%
- Intensity (cost per claimer) 3.05% 3.45% 2.42% 2.01%
Price (CPI) 5.00% 5.60% 5.70% 6.10%
66. Table 15 shows that the cost increase is higher for in-hospital claims than the overall
increase, with increases over 10% in all the years covered. This again suggests a
proportional change towards in-hospital care over time. The results by scheme type are
shown below, with similar trends (albeit with greater variability).

Report 1 Claims data analysis – descriptive statistics
36
Table 16 In-hospital cost trends – open schemes
2011 2012 2013 2014
Total Cost Increase 11.20% 23.45% 17.19% 12.13%
Membership Growth 0.16% 12.99% 4.13% 1.17%
Cost Increase per beneficiary 11.02% 9.26% 12.54% 10.83%
Utilisation
- Frequency (% claimers) 1.54% 0.52% 3.92% 2.19%
- Intensity (cost per claimer) 4.13% 2.93% 2.46% 2.22%
Price (CPI) 5.00% 5.60% 5.70% 6.10%
Table 17 In-hospital cost trends – restricted schemes
2011 2012 2013 2014
Total Cost Increase 18.77% 20.22% 13.36% 8.94%
Membership Growth 8.05% 5.63% 4.19% -1.40%
Cost Increase per beneficiary 9.92% 13.81% 8.80% 10.49%
Utilisation
- Frequency (% claimers) 2.39% 3.76% 0.79% 2.60%
- Intensity (cost per claimer) 2.24% 3.87% 2.13% 1.51%
Price (CPI) 5.00% 5.60% 5.70% 6.10%
67. All of the tables show increased utilisation frequency for in-hospital services i.e. more
beneficiaries being admitted over time. Figure 3, below, shows the trends in admission
rates (per 1 000 lives) over time. Again these figures have not been adjusted for risk
profile.
Figure 3 Admissions per 1000 lives – all schemes 2010-2014
0
20
40
60
80
100
120
140
160
2010 2011 2012 2013 2014
Adm
issio
ns p
er
1 0
00
Day Overnight

Report 1 Claims data analysis – descriptive statistics
37
68. The graph shows constantly increasing admission rates over time, consistent with the
results outlined in the overall analysis presented in the various tables The trend appears
to be across both day admissions and overnight stay admissions, suggesting a systemic
shift towards in-hospital care. The trend will be analysed further and results reported on
in later reports.
69. Figure 4 shows claims split across various expenditure categories for all overnight stay
admissions in 2014.
Figure 4 Overnight admissions claims split 2014
70. The next set of tables shows the most common treating disciplines, diagnoses and
procedures for overnight admissions. These data describe admissions profile only.
Detailed analysis and various correlations will be addressed in later reports. Table 18
illustrates the top ten specialist disciplines admitting patients overnight.

Report 1 Claims data analysis – descriptive statistics
38
Table 18 Top ten admitting disciplines 2010-2014
Discipline Name % of Admissions
2010 2011 2012 2013 2014
Physicians 16.95% 17.53% 18.26% 19.31% 19.73%
Gynaecologists 14.60% 14.22% 14.01% 13.61% 13.43%
Surgeons 12.65% 12.82% 12.90% 12.93% 12.97%
General Practitioners 13.20% 12.90% 12.68% 12.23% 11.82%
Paediatricians 11.27% 11.08% 10.66% 10.81% 10.74%
Orthopaedic Surgeons 9.02% 9.15% 9.29% 9.32% 9.50%
Psychiatrists 4.05% 4.08% 4.13% 4.16% 4.16%
Urologists 3.64% 3.83% 3.88% 3.81% 3.92%
Otorhinolaryngologists 2.41% 2.62% 2.48% 2.23% 2.19%
Cardiologists 2.18% 2.13% 2.18% 2.14% 2.12%
Other disciplines combined 10.02% 9.64% 9.53% 9.45% 9.41%
71. The table illustrates, what would be expected, that generalist disciplines as well as
gynaecologists, are the most common admitting practitioners. Table 19 illustrates the
most common diagnoses for which patients are being admitted overnight. The admission
diagnoses are derived from ICD diagnosis codes provided by the treating practitioner.
Table 19 Admitting diagnosis 2010-2014
Diagnosis % of Admissions
2010 2011 2012 2013 2014
Trauma 7.36% 7.08% 7.37% 9.09% 9.97%
Uncomplicated Maternity 6.56% 7.13% 7.81% 8.10% 8.28%
Non-Specific 7.28% 7.63% 8.16% 8.17% 8.03%
Pneumonia 6.23% 6.86% 7.33% 7.56% 7.85%
Heart Conditions 5.36% 5.94% 6.15% 6.55% 6.44%
Psychiatric 4.48% 4.96% 5.81% 6.19% 6.29%
Complicated Maternity 4.25% 4.64% 5.18% 5.46% 5.59%
Cancer 3.94% 4.40% 4.91% 5.30% 5.57%
Bronchitis 3.31% 3.64% 3.97% 4.20% 4.46%
Chronic Respiratory 3.08% 3.48% 3.65% 3.95% 3.99%
Other diagnoses combined 48.16% 44.23% 39.66% 35.42% 33.53%
72. As would be expected, maternity, trauma and respiratory conditions are very prevalent.
The high proportion of non-specific diagnoses is noted. Possible explanations include
that the ICD10 coding is not as accurate and/or as detailed as it should be, or that detail
is being lost during one or more of the various stages of claims submission and
processing.
73. The final table, table 20, describes the most common procedures performed by the
treating practitioners. The procedures were identified from the tariff code submitted by

Report 1 Claims data analysis – descriptive statistics
39
the treating practitioner. In the instances where only hospital visits were claimed without
an accompanying procedure/intervention the event was classified as “No Procedure”.
74. Non-specific procedures represent a group of relatively trivial and/or diagnostic
procedures, for example intravenous infusion and venepuncture.
Table 20 Top ten procedure claims 2010-2014
Procedure % of Admissions
2010 2011 2012 2013 2014
No Procedure 28.36% 30.77% 34.10% 37.28% 39.60%
Non-Specific 11.07% 11.95% 13.04% 13.25% 12.54%
Caesarean Section 6.57% 6.90% 7.56% 7.68% 7.76%
ICU Care 4.80% 5.10% 5.64% 6.17% 6.27%
Psychiatric 4.54% 4.99% 5.55% 5.94% 6.06%
Normal Delivery 2.68% 2.80% 2.87% 2.86% 2.76%
Upper GI Endoscopy 2.14% 2.38% 2.60% 2.65% 2.70%
Joint Replacements 1.61% 1.79% 1.95% 2.05% 2.19%
Colonoscopy 1.43% 1.85% 2.07% 2.00% 2.09%
Fractures/Dislocations 1.22% 1.36% 1.51% 1.61% 1.69%
Other procedures combined 35.58% 30.11% 23.12% 18.53% 16.34%
75. Thus description of procedures is as would be expected. The high proportion of “other”
procedures again suggests issues to do with coding or recording of codes.
76. Further analyses building on these data will be published in due course.

Report 1 Claims data analysis – descriptive statistics
40
Appendix A – Member data comparison
Scheme Name 2010 2011 2012 2013 2014
AECI Medical Aid Society 100% 100% 100% 102% 100%
Afrisam SA Medical Scheme 42% Altron Medical Aid Scheme 100% 100% 100% 100% Anglo Medical Scheme 321% 322% 322% 311% 100%
Anglovaal Group Medical Scheme 100% 100% 100% 100% 100%
Bankmed 97% 98% 98% 98% 98%
Barloworld Medical Scheme 100% 100% 100% 100% 100%
Bestmed Medical Scheme 129% 128% 128% 124% 122%
BMW Employees Medical Aid Society 100%
Bonitas Medical Fund 100% 100% 100% 100% 100%
BP Medical Aid Society 98% 99% 99% 99% 98%
Chartered Accountants (SA) Medical Aid Fund 100% 100% 100% 100% 100%
Cape Medical Plan 100% 100% 100% 98% 99%
De Beers Benefit Society 99% 100% 101% 101% 101%
Discovery Health Medical Scheme 100% 100% 100% 100% 100%
Edcon Medical Aid Scheme 100% 100% Engen Medical Benefit Fund 99% 99% 99% 99% 98%
Fedhealth Medical Scheme 99% 99% 99% 99% 99%
Fishing Industry Medical Scheme 93% 96% 97% 98% 98%
Food Workers Medical Benefit Fund 98% 106% 103% 103% 105%
Government Employees Medical Scheme 100% 100% 99% 100% 100%
Glencore Medical Scheme 101%
Golden Arrow Employees' Medical Benefit Fund 99% 99% 99% 100% 100%
Horizon Medical Scheme 100% 100% 100% 100% 100%
IBM (SA) Medical Scheme 101% 101% 102% 52% Impala Medical Plan 57% 55% 52%
Imperial Group Medical Scheme 98% 99% 100% 100% 100%
KeyHealth 100% 100%
LA-Health Medical Scheme 99% 99% 99% 99% 99%
Libcare Medical Scheme 100% 100% 101% 100% 100%
Liberty Medical Scheme 99% 99% 99% 99% 100%
Lonmin Medical Scheme 101% 103% 100% 100% 100%
Malcor Medical Scheme MBMed Medical Aid Fund 100% 100% 100% 100% 101%
Medihelp 100% 100% 100%

Report 1 Claims data analysis – descriptive statistics
41
Scheme Name 2010 2011 2012 2013 2014
Medipos Medical Scheme 98% 98% 99% 99% 99%
Medshield Medical Scheme 137% 100% 100% 100% 100%
Metropolitan Medical Scheme 93% 93% 94% 96% 94%
Momentum Health 103% 95% 96% 96% 97%
Motohealth Care 95% 95% 96% 97% 99%
Naspers Medical Fund 41% 101% 100% 100% 100%
Nedgroup Medical Aid Scheme 99% 100% 100% 100% 100%
Netcare Medical Scheme 99% 100% 100% 102% 100%
Old Mutual Staff Medical Aid Fund 99% 100% 100% 100% 100%
PG Group Medical Scheme 100% 100% Pick n Pay Medical Scheme 99% 99% 99% 100% 100%
South African Police Service Medical Scheme 96% 96% 97% 97% 97%
Profmed 93% 93%
Quantum Medical Aid Society 100% 100% 100% 100% 100%
Rand Water Medical Scheme 99% 98% 98% 98% 98%
Remedi Medical Aid Scheme 100% 100% 100% 100% 100%
Resolution Health Medical Scheme 113% 100% 101%
Retail Medical Scheme 102% 101% 102% 101% 101%
South African Breweries Medical Aid Scheme 98% 98% 99% 99% 100%
SABC Medical Aid Scheme 100% 100% 100% 100% 100%
SAMWUMED 40% 40% 41% 43% 44%
Sasolmed 100% 100% 100% 100% 101%
Sedmed 100% 100%
Selfmed Medical Scheme 398% 419% 447%
Spectramed 102% 103% 103%
TFG Medical Aid Scheme 100% 100% 100%
Thebemed 91% 103% 105% 108% 108%
Transmed Medical Fund 98% 98% 98% 97% 97%
Tsogo Sun Group Medical Scheme 100% 100% 100% 100% 100%
Umed 58% Umvuzo Health Medical Scheme 94% 97% 99% 100% 102%
University of Kwa-Zulu Natal Medical Scheme 100% 99% 99% 99% 99%
Witbank Coalfields Medical Aid Scheme 70% 72% 72% 72%
University of the Witwatersrand Staff Medical Aid 100% 100% 100% 100% 100%
Wooltru Healthcare Fund 98% 98% 99% 99% 99%

Report 1 Claims data analysis – descriptive statistics
42
Appendix B: Claims Data Comparison
Scheme Name 2010 2011 2012 2013 2014
AECI Medical Aid Society 91% 94% 94% 89% 91%
Afrisam SA Medical Scheme 102% Altron Medical Aid Scheme 96% 102% 92% 98% Anglo Medical Scheme 233% 230% 233% 222% 94%
Anglovaal Group Medical Scheme 99% 100% 99% 101% 98%
Bankmed 94% 95% 94% 90% 90%
Barloworld Medical Scheme 98% 99% 98% 100% 97%
Bestmed Medical Scheme 94% 95% 96% 95% 95%
BMW Employees Medical Aid Society 100%
Bonitas Medical Fund 85% 85% 84% 91% 91%
BP Medical Aid Society 95% 94% 95% 96% 97%
Chartered Accountants (SA) Medical Aid Fund 111% 109% 109% 107% 108%
Cape Medical Plan 100% 99% 100% 100% 100%
De Beers Benefit Society 109% 109% 107% 108% 107%
Discovery Health Medical Scheme 100% 101% 100% 100% 99%
Edcon Medical Aid Scheme 98% 101% Engen Medical Benefit Fund 96% 96% 95% 96% 96%
Fedhealth Medical Scheme 99% 99% 99% 99% 99%
Fishing Industry Medical Scheme 87% 86% 81% 88% 87%
Food Workers Medical Benefit Fund 7% 46% 47% 68% 75%
Government Employees Medical Scheme 99% 100% 100% 100% 100%
Glencore Medical Scheme 99%
Golden Arrow Employees' Medical Benefit Fund 94% 91% 97% 99% 94%
Horizon Medical Scheme 83% 79% 80% 81%
IBM (SA) Medical Scheme 101% 100% 101% 102% 0%
Impala Medical Plan 47% 47% 46%
Imperial Group Medical Scheme 97% 97% 97% 99% 97%
KeyHealth 98% 98%
LA-Health Medical Scheme 99% 100% 100% 101% 99%
Libcare Medical Scheme 99% 100% 101% 100% 99%
Liberty Medical Scheme 90% 87% 90% 92% 91%
Lonmin Medical Scheme 51% 46% 53% 53% 57%
Malcor Medical Scheme MBMed Medical Aid Fund 92% 92% 93% 92% 92%
Medihelp 91% 93% 91%
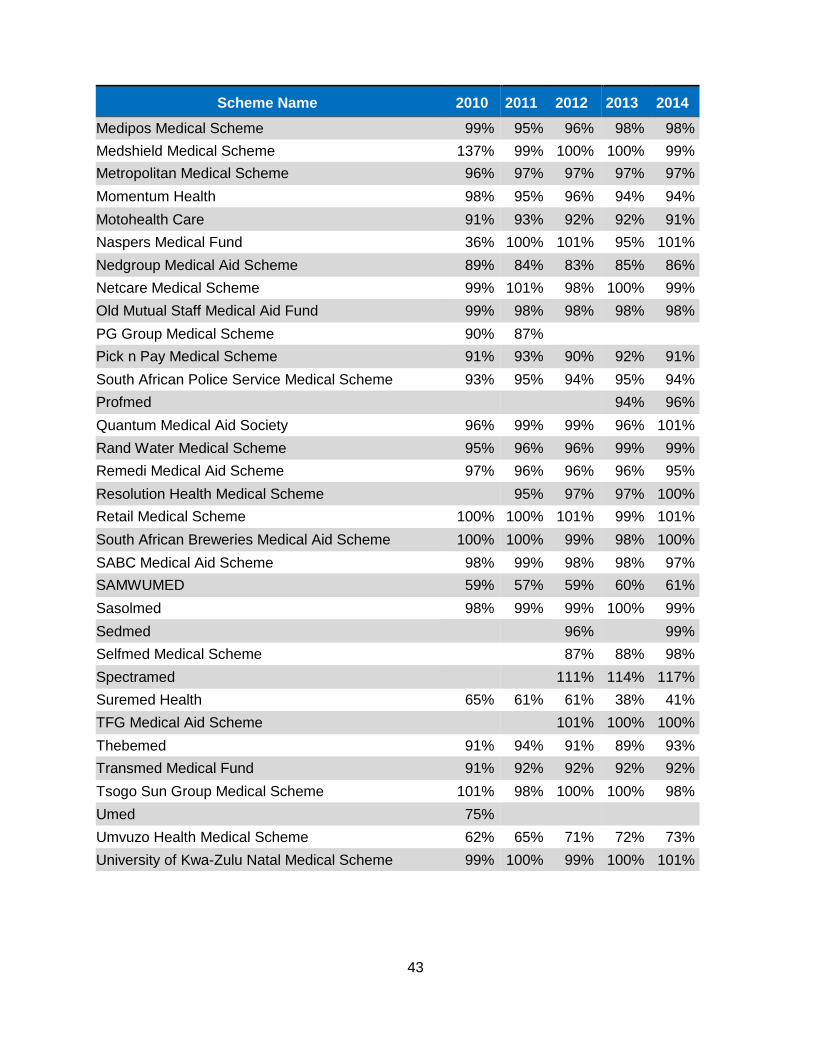
43
Scheme Name 2010 2011 2012 2013 2014
Medipos Medical Scheme 99% 95% 96% 98% 98%
Medshield Medical Scheme 137% 99% 100% 100% 99%
Metropolitan Medical Scheme 96% 97% 97% 97% 97%
Momentum Health 98% 95% 96% 94% 94%
Motohealth Care 91% 93% 92% 92% 91%
Naspers Medical Fund 36% 100% 101% 95% 101%
Nedgroup Medical Aid Scheme 89% 84% 83% 85% 86%
Netcare Medical Scheme 99% 101% 98% 100% 99%
Old Mutual Staff Medical Aid Fund 99% 98% 98% 98% 98%
PG Group Medical Scheme 90% 87% Pick n Pay Medical Scheme 91% 93% 90% 92% 91%
South African Police Service Medical Scheme 93% 95% 94% 95% 94%
Profmed 94% 96%
Quantum Medical Aid Society 96% 99% 99% 96% 101%
Rand Water Medical Scheme 95% 96% 96% 99% 99%
Remedi Medical Aid Scheme 97% 96% 96% 96% 95%
Resolution Health Medical Scheme 95% 97% 97% 100%
Retail Medical Scheme 100% 100% 101% 99% 101%
South African Breweries Medical Aid Scheme 100% 100% 99% 98% 100%
SABC Medical Aid Scheme 98% 99% 98% 98% 97%
SAMWUMED 59% 57% 59% 60% 61%
Sasolmed 98% 99% 99% 100% 99%
Sedmed 96% 99%
Selfmed Medical Scheme 87% 88% 98%
Spectramed 111% 114% 117%
Suremed Health 65% 61% 61% 38% 41%
TFG Medical Aid Scheme 101% 100% 100%
Thebemed 91% 94% 91% 89% 93%
Transmed Medical Fund 91% 92% 92% 92% 92%
Tsogo Sun Group Medical Scheme 101% 98% 100% 100% 98%
Umed 75% Umvuzo Health Medical Scheme 62% 65% 71% 72% 73%
University of Kwa-Zulu Natal Medical Scheme 99% 100% 99% 100% 101%

Report 1 Claims data analysis – descriptive statistics
44
Witbank Coalfields Medical Aid Scheme 33% 63% 62% 63%
University of the Witwatersrand Staff Medical Aid 100% 97% 98% 98% 97%
Wooltru Healthcare Fund 91% 92% 92% 93% 94%