report on evaluation of framework of appraisal of...
TRANSCRIPT
Report on
Evaluation of Framework of
Appraisal of Projects
A Study* undertaken for the
PAMD, Planning Commission, Government of India
By
Indian Institute of Management, Bangalore
March 18th 2014
Prof. G. Ramesh1, Prof. V. Nagadevara2,
Srividya Sridharan3, Shahana Sheikh4
*This study was sponsored by the Planning Commission under the Scheme of Socio Economic Research
of the Socio Economic Research Division, Planning Commission, Government of India.
1 Associate Professor, Centre for Public Policy, Indian Institute of Management, Bangalore 2 Professor, Quantitative Methods & Information Systems, Indian Institute of Management, Bangalore 3 Research Associate, Indian Institute of Management, Bangalore 4 Research Associate, Indian Institute of Management, Bangalore
2 | P a g e
Table of Contents Acknowledgements ................................................................................................................................. 6
1. Executive Summary ......................................................................................................................... 7
2. Introduction .................................................................................................................................. 12
3. Background ................................................................................................................................... 13
3.1. Guidelines for Formulation, Appraisal and Approval of Government Plan Funded Projects ..... 13
3.2. PAMD’s Role in the Appraisal of the EFC Memo/ Proposal ...................................................... 15
4. Methodology ................................................................................................................................. 16
4.1. Review of Project Formulation and Appraisal Methods .......................................................... 16
4.2. Pre-Project Investigations & Selection of EFC Memos ............................................................. 16
4.3. Assessment of EFC Memos ..................................................................................................... 19
4.4. Assessment of Appraisal of EFC Memos by the Planning Commission ..................................... 22
4.5. Assessment of the Timeline for Project Appraisal ................................................................... 23
5. Methods for Project Formulation & Appraisal ................................................................................ 24
5.1. Problem Tree Analysis ............................................................................................................ 24
5.2. Stakeholder Analysis .............................................................................................................. 25
5.3. Risk Analysis ........................................................................................................................... 27
5.4. Logical Framework Analysis (LFA) ........................................................................................... 29
5.4.1. LFA – Original Framework ............................................................................................... 29
5.4.2. Advantages and Disadvantages of the LFA ...................................................................... 30
5.4.3. Variations and Adaptations of the LFA ............................................................................ 31
5.5. Project Management Techniques ........................................................................................... 37
5.5.1. Gantt Chart .................................................................................................................... 37
5.5.2. Network Analysis ............................................................................................................ 37
6. Findings & Analysis ........................................................................................................................ 39
3 | P a g e
6.1. Based on Scoring of EFC Memos/ Proposals ........................................................................... 39
6.1.1. Project-wise Scores ........................................................................................................ 39
6.1.2. Trend in Scores across Years ........................................................................................... 40
6.1.3. Trends in Scores across Sectors ...................................................................................... 41
6.1.4. Trends in Scores across Value of Proposals ..................................................................... 42
6.1.5. Comparison of Scores for proposals with more than one EFC Memo .............................. 43
6.1.6. Detailed Component-wise Analysis ................................................................................. 44
6.1.7. Sub-components with Nil Scores .................................................................................... 52
6.2. Analysis of Comments by the Planning Commission ............................................................... 53
6.2.1. Trends in Comments across Years ........................................................................................ 54
6.2.2. Trends in Comments across Sectors ................................................................................ 55
6.2.3. Trend in Number of Comments across Value of Proposals .............................................. 56
6.2.4. Trends in Nature of Comments across Value of Proposals ............................................... 57
6.3. Time Taken for Appraisal of Proposals .................................................................................... 61
7. Recommendations ......................................................................................................................... 64
7.1. EFC Memo/ Proposal Format.................................................................................................. 64
7.1.1. Concerns Identified ........................................................................................................ 64
7.1.2 Recommended Changes in EFC Memo/ Proposal Format ...................................................... 67
7.1.3 Model EFC Memo 73
7.2. Project Appraisal by the Planning Commission ....................................................................... 74
7.2.1 Concerns Identified ............................................................................................................... 74
7.2.2. Recommended Changes in the Appraisal Process ................................................................. 74
8. Conclusion ..................................................................................................................................... 76
9. Annexures and References............................................................................................................. 77
4 | P a g e
List of Tables Table 1: Summary of EFC Memos Analyzed in this Study ........................................................................ 17
Table 2: Components for Assessment of EFC Memos/ Proposals ........................................................... 20
Table 3: Questions Assessed within Each Component with High Weighting ........................................... 20
Table 4: Definition of Parameters assessed while Scoring Comments of the Planning Commission ........ 22
Table 5: Component wise break-up of total scores ................................................................................ 44
Table 6: Break-up of 'Statement of Proposal' Component ...................................................................... 45
Table 7: Break-up of 'Program Schedule' Component ............................................................................ 46
Table 8: Break-up of 'Expenditure Involved and Reliability of Cost Estimates' Component ..................... 47
Table 9: Break-up of ‘Operational Capability' Component ...................................................................... 49
Table 10: Break-up of ‘Points for Decision' Component.......................................................................... 50
Table 11: Break-up of ‘DPR' Component ................................................................................................ 51
Table 12: Sub-Components with Nil Scores ............................................................................................ 52
Table 13: Scoring of Comments by Parameter ....................................................................................... 53
Table 14: R.A.G Analysis Snapshot ......................................................................................................... 62
Table 15: Summary Statistics for 1188 EFC Memos (2006-11) ................................................................ 64
Table 16: Recommended changes for ambiguous, rhetorical and long questions ................................... 69
List of Figures Figure 1: Timeframes for Steps in Formulation, Appraisal and Approval of Government Plan Funded
Projects ................................................................................................................................................. 14
Figure 2: Increasing Appraisal Limits of Different Appraisal Forums ....................................................... 15
Figure 3: Structure of a Problem Tree .................................................................................................... 24
Figure 4: Structure of a Readiness/ Power Matrix .................................................................................. 25
Figure 5: Structure of a Stakeholder Table ............................................................................................. 26
Figure 6: Structure of an Importance/ Influence Matrix ......................................................................... 26
Figure 7: Structure of Operational Risk Assessment Framework used by the World Bank ....................... 27

5 | P a g e
Figure 8: Structure of Risk Assessment Matrix used by the Department for International Development
(DFID), HM Government, United Kingdom ............................................................................................. 27
Figure 9: Diagram for Assessing Risk Factors used by Norwegian Agency for Development Co-operation
(NORAD) ................................................................................................................................................ 28
Figure 10: Structure of a Logical Framework Matrix ............................................................................... 29
Figure 11: The Rosetta Stone of Logical Frameworks ............................................................................. 31
Figure 12: Structure of Logframe used by the World Bank ..................................................................... 33
Figure 13: Structure of Logframe used by the Department for International Development (DFID), HM
Government, United Kingdom ............................................................................................................... 34
Figure 14: Structure of Results Framework and Monitoring used by the World Bank ............................. 35
Figure 15: Structure of Results Framework used by USAID ..................................................................... 36
Figure 16: Project wise Scores of EFC Memos/Proposals ........................................................................ 39
Figure 17: Year wise Scores of EFC Memos/Proposals ............................................................................ 40
Figure 18: Sector wise Scores of EFC Memos/Proposals ......................................................................... 41
Figure 19: Total Score Vs. Value of Proposal .......................................................................................... 42
Figure 20: Comparison of Scores where Proposals had more than 1 EFC Memo ..................................... 43
Figure 21: Score for ‘Expenditure Involved’ Component Vs. Value of Proposal ....................................... 48
Figure 22: Trends in Comments across Years ......................................................................................... 54
Figure 23: Trends in Comments across Sectors ...................................................................................... 55
Figure 24: Total Comments Vs. Value of Proposal .................................................................................. 56
Figure 25: Critical % Vs. Value of Proposals ............................................................................................ 57
Figure 26: Directional % Vs. Value of Proposals ...................................................................................... 58
Figure 27: Endorsed by Others % Vs. Value of Proposals ........................................................................ 58
Figure 28: Total Comments Vs. Score of EFC Memos/Proposals ............................................................. 59
Figure 29: Share of Comments Endorsed by Others Vs. Score of EFC Memos/Proposals ......................... 60
Figure 30: No. of Days Beyond Benchmark ............................................................................................ 61

6 | P a g e
Acknowledgements We thank the Planning Commission for awarding this project to us. We are grateful to Dr. Montek Singh
Ahluwalia, Deputy Chairman, Planning Commission, Government of India, for providing us his valuable
guidance for conducting this study.
We acknowledge and thank the Socio Economic Research Division of the Planning Commission for
sponsoring this study under its Scheme of Socio Economic Research.
We are thankful to Ms. Anjali Goyal, Adviser, PAMD, Planning Commission for providing valuable insights
on critical aspects that the proposals and appraisals can include. We thank her for all the fruitful
discussions we had with her.
We thank Dr. Nagesh Singh, former Adviser, PAMD, Planning Commission for providing us with the
overview of the appraisal process and his valuable insights based on his immense experience.
We are grateful to Dr. C. Chandramohan, Senior Adviser, Planning Commission for giving the perspective
of Subject Divisions at the Planning Commission.
We would like to thank Shri. Shatrughan Lal, Consultant, PAMD for providing us with all requisite
information and for sharing his experience in project appraisal.
Finally, we are thankful to PAMD, Planning Commission for all the support and co-operation.

7 | P a g e
1. Executive Summary The Planning Commission, Government of India, is the highest planning body in India and one of its
important role is appraising large projects that are funded by the central government. It plays a crucial
role in project appraisal by ensuring that the projects are within broad plan priorities and policies; the
projects are technically sound; and financially appropriate. Planning Commission and, specifically the,
Project Appraisal and Monitoring Division (PAMD) play a critical role ensuring independent and
professional appraisal of large projects, especially the social sector projects.
In India, projects fully or partially funded by the central government, i.e. Government of India, undergo a
detailed process of formulation, appraisal and approval prior to implementation. The Ministry/
Department proposing a new scheme/ project which requires funding from the central government,
first submits a Feasibility Report (FR) for the proposed scheme/ project , based on which the Planning
Commission gives it an ‘in principle’ approval. Post this, the proposing Central Ministry/ Department
prepares a proposal as per pre-defined format to obtain the necessary approvals from appropriate
authorities depending on the size of the scheme/ project. However, before the scheme/ project can be
given approval, it undergoes appraisal by different agencies during which Ministries/ Departments
including the Planning Commission comment on the proposal.
The Study Objective
This study, undertaken by a team at the Indian Institute of Management, Bangalore (IIMB), aims at
evaluating project appraisal framework adopted by the PAMD and broadly, the Planning Commission,
Government of India. The focus of the study is especially restricted to large social sector projects which
are more complex to appraise than infrastructural projects.
Methodology
Initially, a review of project formulation and appraisal processes followed by large government and
international organizations globally was undertaken. The study focused on assessing the EFC Memo/
Proposal appraisal process at the Planning Commission. To analyse the EFC Memo/ Proposal appraisal
process, a list of projects for the last five years was generated and finally, 25 projects were chosen based
on select criteria mutually decided by the PAMD and the IIMB team. The documents concerning these
25 projects, especially the EFC Memos/ Proposals were collected by the IIMB team.
To undertake the assessment of the documents, a weighted scoring methodology was designed to: (i)
assess EFC Memos/ Proposals and (ii) to assess the appraisal of these EFC Memos/ Proposals by the
Planning Commission. The EFC memos were analyzed on the dimensions of: statement of proposal,
program schedule, expenditure involved and reliability of cost estimates, operational capabilities, points
on which decisions/ sanctions are required and Detailed Project Report. The comments of the Planning
Commission, which are provided during the appraisal process, were evaluated on the dimensions of
criticality, directionality, endorsement by others, discussion during EFC meeting and decision during EFC
8 | P a g e
meeting. Further, the timeline for each proposal was assessed against the timeframes prescribed by the
guidelines.
Findings and Analysis
The quality of a project appraisal is expected to depend on the quality of the project proposal itself.
Hence, focus was given to analyzing the quality of the EFC Memos/ Proposals as much as appraisal. At
the outset, it should be mentioned the quality of the EFC Memos/ Proposals varied significantly.
The EFC Memos/Proposals appraised originated across years 2006 to 2011. The project wise scores on
EFC Memo/Proposals ranged between 21 and 74, with the average being 45 (Figure 16). It was observed
that the while the average score reduced from 2006 to 2007, an upward trend in the average score was
observed from 2007 to 2011 (Figure 17). A comparison of sectors revealed that proposals belonging to
the ‘Disaster Management’ sector outperformed all other sectors in terms of the average, highest and
lowest scores; however, proposals from the ‘Health’ sector were consistent underperformers in terms of
these three scores (Figure 18). It was also observed that as the value of the proposal rose, the score of
the EFC Memo/ Proposal decreased (Figure 19). Out of 25 EFC Memos/ Proposals, only 11 had more
than one version of the EFC Memo. An increment in the total score was observed in six out of 11
proposals, with the highest increase in score seen in the case of the EFC Memo on ICT (Figure 20). It was
also observed that the linkages of the project with the objectives and targets of five year plans are
unclear.
An analysis of the comments made by Planning Commission on the 25 surveyed proposals suggested
that a significantly large percentage of comments across years were ‘critical’ and ‘directional’. This
suggests that the PAMD and the Subject Divisions at the Planning Commission are making critical value
additions through the appraisal process as they are: (i) commenting on key issues relating to the projects
such as programme fit, programme inter relatedness, administrative and operational details, cost
estimates and technicalities; and (ii) these comments are often direct and specific to elicit responses
from the proposing Ministries/ Departments resulting in more clarity and concreteness.
However, variations were observed across sectors. For example, proposals belonging to the ‘Child
Welfare’ and ‘Others’ sectors received relatively lower percentage of ‘critical’ comments; and in case of
proposals from the ‘Disaster Management’ and ‘Textiles’ sectors, the percentage of ‘directional’
comments were lower than ‘critical’ comments. Further, in the years 2007 and 2010, relatively larger
percentage of Planning Commission’s comments were endorsed by other commenting agencies as well.
It was also observed that as the value of the proposals rose, the number of comments by Planning
Commission increased suggesting higher level of scrutiny during appraisal for high value projects.
For the purpose of assessing the time-lines across all appraisal steps of various EFC Memos/Proposals,
the R.A.G analysis was adopted. It was observed that in case of most EFC Proposals/ Memos, the
benchmarked timeframes for various steps have not been met. Specifically, for the step on ‘Time taken
between the Date of Draft EFC Memo/Proposal and Date of Note or Appraisal Note by PAMD’, the
9 | P a g e
number of days delay ranged between 4 and 1144. This suggests that a review of these timelines could
be undertaken.
Recommendations
Based on the above analysis, discussion and study of various appraisal methods, recommendations have
been made on the ‘Format of the EFC Memo/Proposal’ and on the ‘Project Appraisal Process at the
Planning Commission’.
Format of the EFC Memo/Proposal
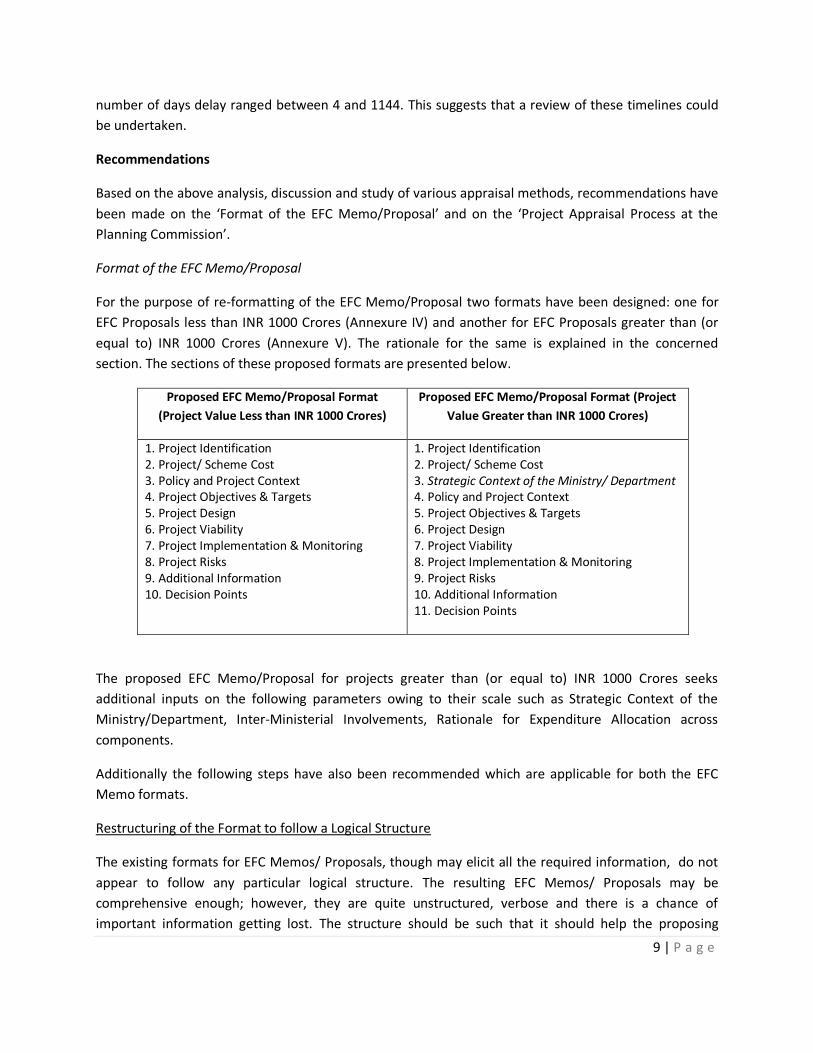
For the purpose of re-formatting of the EFC Memo/Proposal two formats have been designed: one for
EFC Proposals less than INR 1000 Crores (Annexure IV) and another for EFC Proposals greater than (or
equal to) INR 1000 Crores (Annexure V). The rationale for the same is explained in the concerned
section. The sections of these proposed formats are presented below.
Proposed EFC Memo/Proposal Format
(Project Value Less than INR 1000 Crores)
Proposed EFC Memo/Proposal Format (Project
Value Greater than INR 1000 Crores)
1. Project Identification 2. Project/ Scheme Cost 3. Policy and Project Context 4. Project Objectives & Targets 5. Project Design 6. Project Viability 7. Project Implementation & Monitoring 8. Project Risks 9. Additional Information 10. Decision Points
1. Project Identification 2. Project/ Scheme Cost 3. Strategic Context of the Ministry/ Department 4. Policy and Project Context 5. Project Objectives & Targets 6. Project Design 7. Project Viability 8. Project Implementation & Monitoring 9. Project Risks 10. Additional Information 11. Decision Points
The proposed EFC Memo/Proposal for projects greater than (or equal to) INR 1000 Crores seeks
additional inputs on the following parameters owing to their scale such as Strategic Context of the
Ministry/Department, Inter-Ministerial Involvements, Rationale for Expenditure Allocation across
components.
Additionally the following steps have also been recommended which are applicable for both the EFC
Memo formats.
Restructuring of the Format to follow a Logical Structure
The existing formats for EFC Memos/ Proposals, though may elicit all the required information, do not
appear to follow any particular logical structure. The resulting EFC Memos/ Proposals may be
comprehensive enough; however, they are quite unstructured, verbose and there is a chance of
important information getting lost. The structure should be such that it should help the proposing

10 | P a g e
Ministry/ Department to frame its proposal comprehensively, logically and concisely; and present it in a
concrete manner. The structure suggested for the EFC Memo/ Proposal format builds on the vertical
hierarchy following from the ‘Logical Framework Analysis’. This includes the disclosure of information on
Objectives followed by Outcomes and Outputs and thereafter, by Activities and Inputs.
Introduction of Specific Sections for Linkages with Plans
Specific questions in Section 1 have added to elicit the linkages with the plan objectives and targets. The
proposing Ministry have to elaborate the linkages of the project with the overall plan framework for the
Ministry. Wherever specific targets have been asked, these are again linked to plan targets, both with
reference to financial and physical targets. This will help at the appraisal stage to link appraisal with five
year plans.
Introduction of New Sections and Questions
A few new questions and sections have been introduced as part of proposed EFC Memo/Proposal
format. Questions regarding Legal Framework and Stakeholders have been added to the section on
Project Design. To ensure policy fit of the project/ scheme, the proposing Ministry/ Department is asked
to quote the objectives from their RFD document within which the project/ scheme is envisaged in the
section on Policy and Project Context. Under the section on Project/Scheme Cost the ‘State-level’
expenditure details are asked for. Additionally, State-level activity details are also sought under the
section on Project Implementation and Monitoring.
Grouping of Questions on Similar Themes
Questions relating to ‘on-going or previous schemes with similar or same objectives’, belonging to the
old EFC Memo format, have been grouped together. Questions relating to ‘Resettlement &
Rehabilitation and Disaster Management’ which are not applicable for all projects have been grouped
under the Section on Additional Information.
Modification of Ambiguous, Rhetorical and Long Questions
Questions which were observed to be either ambiguous, rhetorical or long have been modified and
included as a part of the revised EFC Memo/ Proposal format.
Introduction of Standard Formats for Presentation of Information
To ensure consistency in presentation of information/data and relevant clarifications to questions in the
EFC Memo/Proposal, tables have been introduced under certain questions as part of proposed format
for EFC Memo/Proposals. Such pre-defined styles of presentation would help in reducing the often
observed long textual answers.
Questions for which formats for answers are suggested include those concerning: details of previous and
on-going schemes with similar/ same objectives, definition of objectives/ outcomes/ outputs, details of

11 | P a g e
stakeholders, details of project expenses vis-à-vis financing, schedule for project implementation,
identification of risks among others.
These aforementioned suggested changes are in line with the illustrative check list, issued by the
Planning Commission in January 2010, which highlights ‘major points on which data/ information should
invariably be furnished in the EFC/ PIB memo’.5
Further a separate format is proposed for EFC Memo/ Proposal which are for Revised Cost Estimates
(RCE) (Annexure VI).
Finally, it should also be mentioned that the capacities of the Ministries/ Departments will have to be
built to strengthen EFC Memos/ Proposals. Watertight project proposals are as important as project
appraisal and project management. Planning Commission could hold seminars to build these capacities
in the Ministries/ Departments through academic institutions and international development agencies.
The Ministries/ Departments could also engage management consultants to help them to convert their
proposals, which might be strong on the technical front, into holistic project proposals which are sound
on the project management front as well.
Project Appraisal Process at the Planning Commission
It has also been recommended that the PAMD at the Planning Commission use the ‘Appraisal Grid’
(Annexure VII) to consolidate its comments. As is presently done, we recommend that as a part of the
Note for EFC/ Appraisal Note (which is prepared by the PAMD), a project summary is prepared which
covers the basic profile of the project, justification of the project and the associated cost estimates.
Following this, the comments and observations of the Planning Commission can be presented under the
following heads:
Project Summary
List of areas wherein decisions required
Policy and Project Context
Technical Feasibility
Financial Aspects
Project Management – Administrative, Operational, Implementation
Monitoring and Evaluation
Risk Analysis These would ensure that all critical components of the projects are appraised without any omission.
Additionally, it is also suggested that the Subject Divisions at the Planning Commission use a specific
‘Appraisal Grid’ (Annexure VIII). This would ensure that expertise in their specified fields of development
is incorporated and their crucial comments are highlighted.
5 Available at: http://efc.planningcommission.nic.in/9May/14th-Jan-2010.pdf

12 | P a g e
Further, additional aspects to be appraised for projects greater than (equal to) INR 1000 Crores have
been included under the following broad categories:
Strategic Fit
Involvement of Ministries/Departments (other than proposing Ministry/ Department) at various stages of the project
Expenditure allocation across components/sub-components
2. Introduction Project appraisal is a key step in any project cycle. It is the step which decides whether a project will
proceed from the formulation stage to the implementation stage. It is an ex-ante assessment of the
project focused on scrutiny of the project proposal.
In India, projects fully or partially funded by the central government, i.e. Government of India, undergo a
detailed process of formulation, appraisal and approval prior to implementation. One of the institutions
at the centre of this process is the Planning Commission, Government of India. The Central Ministry/
Department proposing a new scheme/ project which requires funding from the central government,
first submits a Feasibility Report (FR) for the proposed scheme/ project to the Planning Commission on
the basis of which the Commission gives it an ‘in principle’ approval. The ‘in principle’ approval allows
the scheme/ project to be included in the Five Year Plan document. After the ‘in principle’ approval, the
proposing Central Ministry/ Department conducts an exercise with the Planning Commission to find
resources to fund the scheme/ project.
Once the financial resources have been tied up, the proposing Central Ministry/ Department must
prepare a proposal to obtain the necessary approvals from the appropriate authority depending on the
size of the scheme/ project. One of the authorities is the Expenditure Finance Committee. The
composition of this Committee depends on the scheme/ project to be approved. Before the scheme/
project can be given approval by the EFC, the appraisal of the proposal is undertaken wherein different
agencies (Ministries/ Departments including the Planning Commission) comment on the proposal.
The Project Appraisal and Management Division (PAMD) at the Planning Commission is the key division
which consolidates the comments of various divisions of the Planning Commission. The main objective
of this study, undertaken by a team at the Indian Institute of Management, Bangalore (IIMB), is to
broadly, evaluate frameworks of project appraisal and to specifically, assess the project appraisal
process at the Planning Commission. The study was undertaken from July to September 2012.
The study has been presented in this report and its annexures (separate document). The following
section, Section 3, gives a brief background on the guidelines for formulation, appraisal and approval of
government plan funded projects in India and also defines the role of the PAMD in the same. Thereafter,
Section 4 explains the methodology followed to undertake the assessment. Section 5 presents a review
of methods for project formulation and appraisal undertaken by various large government and non-
government organizations globally. The section thereafter, Section 6 presents the findings and analysis
13 | P a g e
of this study from an assessment of 25 EFC Memos and comments offered on them by the Planning
Commission. Section 7 explains the recommendations to improve the project formulation and appraisal
process and finally, Section 8 concludes the study.
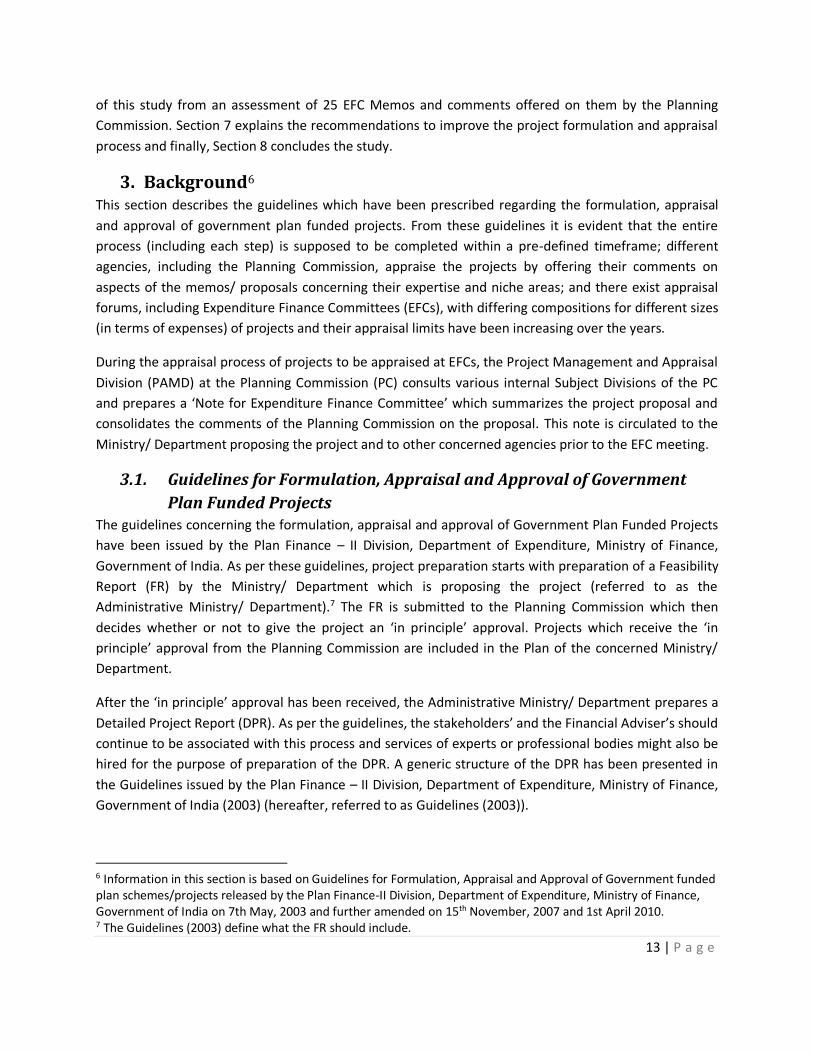
3. Background6 This section describes the guidelines which have been prescribed regarding the formulation, appraisal
and approval of government plan funded projects. From these guidelines it is evident that the entire
process (including each step) is supposed to be completed within a pre-defined timeframe; different
agencies, including the Planning Commission, appraise the projects by offering their comments on
aspects of the memos/ proposals concerning their expertise and niche areas; and there exist appraisal
forums, including Expenditure Finance Committees (EFCs), with differing compositions for different sizes
(in terms of expenses) of projects and their appraisal limits have been increasing over the years.
During the appraisal process of projects to be appraised at EFCs, the Project Management and Appraisal
Division (PAMD) at the Planning Commission (PC) consults various internal Subject Divisions of the PC
and prepares a ‘Note for Expenditure Finance Committee’ which summarizes the project proposal and
consolidates the comments of the Planning Commission on the proposal. This note is circulated to the
Ministry/ Department proposing the project and to other concerned agencies prior to the EFC meeting.
3.1. Guidelines for Formulation, Appraisal and Approval of Government
Plan Funded Projects The guidelines concerning the formulation, appraisal and approval of Government Plan Funded Projects
have been issued by the Plan Finance – II Division, Department of Expenditure, Ministry of Finance,
Government of India. As per these guidelines, project preparation starts with preparation of a Feasibility
Report (FR) by the Ministry/ Department which is proposing the project (referred to as the
Administrative Ministry/ Department).7 The FR is submitted to the Planning Commission which then
decides whether or not to give the project an ‘in principle’ approval. Projects which receive the ‘in
principle’ approval from the Planning Commission are included in the Plan of the concerned Ministry/
Department.
After the ‘in principle’ approval has been received, the Administrative Ministry/ Department prepares a
Detailed Project Report (DPR). As per the guidelines, the stakeholders’ and the Financial Adviser’s should
continue to be associated with this process and services of experts or professional bodies might also be
hired for the purpose of preparation of the DPR. A generic structure of the DPR has been presented in
the Guidelines issued by the Plan Finance – II Division, Department of Expenditure, Ministry of Finance,
Government of India (2003) (hereafter, referred to as Guidelines (2003)).
6 Information in this section is based on Guidelines for Formulation, Appraisal and Approval of Government funded plan schemes/projects released by the Plan Finance-II Division, Department of Expenditure, Ministry of Finance, Government of India on 7th May, 2003 and further amended on 15th November, 2007 and 1st April 2010. 7 The Guidelines (2003) define what the FR should include.
14 | P a g e
In addition to the DPR, the proposing Ministry/ Department also prepares a draft for the EFC
(Expenditure Finance Committee) Memo/ Proposal. The DPR is then circulated along with the draft EFC
Memo/ Proposal to the Department of Expenditure, Planning Commission and any other concerned
Ministries for seeking their comments on the EFC Memo/ Proposal. After the comments are received by
the Administrative Ministry/ Department, the final EFC Memo/ Proposal is prepared by it based on the
comments received. This, along with the notice for the EFC meeting, is then circulated to the
Department of Expenditure, Planning Commission and any other concerned Ministries. Thereafter, the
EFC meeting is convened and the minutes of this meeting are issued.
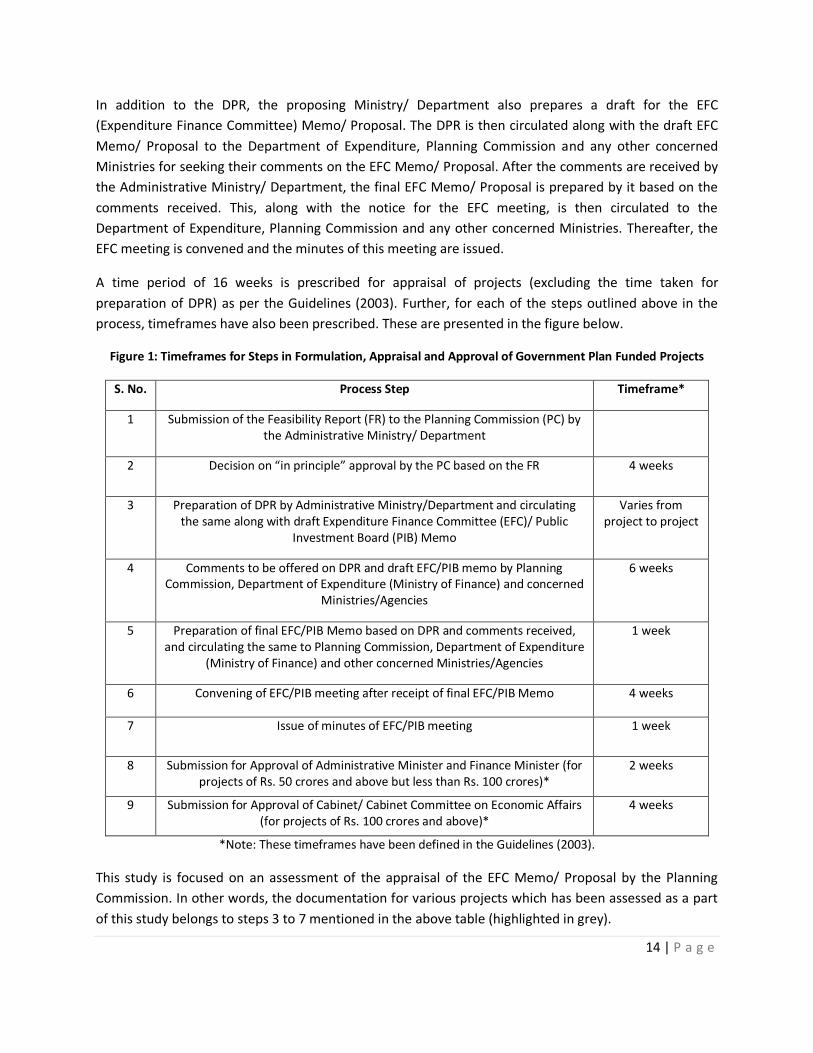
A time period of 16 weeks is prescribed for appraisal of projects (excluding the time taken for
preparation of DPR) as per the Guidelines (2003). Further, for each of the steps outlined above in the
process, timeframes have also been prescribed. These are presented in the figure below.
Figure 1: Timeframes for Steps in Formulation, Appraisal and Approval of Government Plan Funded Projects
S. No. Process Step Timeframe*
1 Submission of the Feasibility Report (FR) to the Planning Commission (PC) by the Administrative Ministry/ Department
2 Decision on “in principle” approval by the PC based on the FR 4 weeks
3 Preparation of DPR by Administrative Ministry/Department and circulating the same along with draft Expenditure Finance Committee (EFC)/ Public
Investment Board (PIB) Memo
Varies from project to project
4 Comments to be offered on DPR and draft EFC/PIB memo by Planning Commission, Department of Expenditure (Ministry of Finance) and concerned
Ministries/Agencies
6 weeks
5 Preparation of final EFC/PIB Memo based on DPR and comments received, and circulating the same to Planning Commission, Department of Expenditure
(Ministry of Finance) and other concerned Ministries/Agencies
1 week
6 Convening of EFC/PIB meeting after receipt of final EFC/PIB Memo 4 weeks
7 Issue of minutes of EFC/PIB meeting 1 week
8 Submission for Approval of Administrative Minister and Finance Minister (for projects of Rs. 50 crores and above but less than Rs. 100 crores)*
2 weeks
9 Submission for Approval of Cabinet/ Cabinet Committee on Economic Affairs (for projects of Rs. 100 crores and above)*
4 weeks
*Note: These timeframes have been defined in the Guidelines (2003).
This study is focused on an assessment of the appraisal of the EFC Memo/ Proposal by the Planning
Commission. In other words, the documentation for various projects which has been assessed as a part
of this study belongs to steps 3 to 7 mentioned in the above table (highlighted in grey).

15 | P a g e
Though, this project analyses memos/ proposal for the Expenditure Finance Committee; however, there
are different appraisal forums for projects of different sizes in terms of expenditure. The appraisal limits
for these forums have been increasing over the last decade and these are presented in the figure below
(EFCs which are the focus of this study are highlighted in grey).
Figure 2: Increasing Appraisal Limits of Different Appraisal Forums
S. No. Appraisal Limits Appraisal Forum
Years
2003 2007 2010
1 < Rs. 5 crore < Rs. 15 crore < Rs. 25 crore Ministry/ Department concerned
2 Rs. 5 crore ≤ & < Rs.
25 crore
Rs. 15 crore ≤ & <
Rs. 50 crore
Rs. 25 crore ≤ & <
Rs. 100 crore
SFC (Standing Finance Committee of
Ministry/ Department)
3 Rs. 25 crore ≤ & <
Rs. 100 crore
Rs. 50 crore ≤ & <
Rs. 150 crore
Rs. 100 crore ≤ & <
Rs. 300 crore
Expenditure Finance Committee (EFC)
[Chaired by Secretary of the
proposing Ministry/Department]
4 Rs. 100 crore ≤ & <
Rs. 200 crore and
Rs. 200 crore ≤
Rs. 150 crore ≤ Rs. 300 crore ≤ Expenditure Finance Committee
[Chaired by Secretary of the
Department of Expenditure]/ Public
Investment Board (PIB)
Source: Guidelines (2003) further amended on 15th November, 2007 and 1st April 2010
3.2. PAMD’s Role in the Appraisal of the EFC Memo/ Proposal The Project Appraisal and Management Division (PAMD) at the Planning Commission is mainly
responsible to undertake techno-economic appraisal of all plan projects/schemes of
Ministries/Departments of Government of India to facilitate investment decisions by the EFC/PIB (Public
Investment Board). As a part of techno-economic appraisal, PAMD presently appraises Central
Sector/Centrally Sponsored schemes/projects costing Rs. 50 crore and above, and prepares Appraisal
Notes in consultation with the concerned Subject Divisions of the Planning Commission.8 Depending on
the nature and size of the project, the Appraisal Notes prepared by the PAMD assist decision making on
the proposal at various forums such as the Expenditure Finance Committee (EFC), Public Investment
Board (PIB), Committee of Public Investment Board (CPIB) and Expanded Board of Railways (EBR).
Further, the PAMD also develops formats and guidelines for the submission of proposals for projects /
programmes and for their techno-economic evaluation, undertakes support research studies to improve
methodology and procedure for appraisal of projects and programmes, and associates with Subject
8 Website of the Planning Commission (http://planningcommission.nic.in/sectors/index.php?sectors=pamd), accessed 15th September, 2012.
16 | P a g e
Divisions in Planning Commission in examining the proposals received from Departments/Ministries for
grant of ‘in principle’ approval for new schemes.
4. Methodology The Terms of Reference for this project given by the PAMD, Planning Commission to the IIMB team
expected the scope of this study to include an examination of the quality of EFC Memos/ Proposals
being received at the Planning Commission, an assessment of the appraisal process at the PAMD and to
suggest a suitably modified framework for the EFC Memo/ Proposal and the appraisal process.
This study adopted a methodology with two components. The first component involved a review of
project formulation and appraisal processes followed by large government and non-governmental
organizations globally.
The second was focused on assessing the EFC Memo/ Proposal appraisal process at the Planning
Commission. To analyse the EFC Memo/ Proposal appraisal process, documents concerning 25 EFC
Memos/ Proposals were made available by the Planning Commission to the IIMB Study Team. To
undertake the assessment of the documents, a weighted scoring methodology was designed to: (i)
assess EFC Memos/ Proposals and (ii) to assess the appraisal of these EFC Memos/ Proposals by the
Planning Commission. Further, the timeline for each proposal was assessed against the timeframes
prescribed by the guidelines.
4.1. Review of Project Formulation and Appraisal Methods Across the world, several methods are used for project formulation and appraisal by large governmental
and non-governmental institutions. These methods gain greater importance when the projects are
concerned with the social sector where the routine methods which involve quantitative analyses (such
as viability analysis) cannot be applied. A review of these methods was carried out by the IIMB Study
Team based on the documents and information available on the websites of these organizations with an
emphasis on whether they could be adopted in the case of government plan funded projects in India.
The findings from this review are presented in Section 5.
4.2. Pre-Project Investigations & Selection of EFC Memos To finalize the methodology for the assessment of the EFC Memo/ Proposal appraisal process at the
Planning Commission, pre-project investigations were undertaken. These included discussions with
officials of the PAMD, Planning Commission, Subject Divisions of the Planning Commission as well as
with the Deputy Chairman of the Planning Commission and detailed study of documentations
concerning four EFC Proposals/ Memos.
During the pre-project investigations, it was noted that the EFC Proposals/ Memos follow a consistent
format which requires the proposing Ministry/ Department to answer 26 pre-defined questions. This
format with list of questions is attached in Annexure I. It was also noted that multiple agencies, including
the Planning Commission, comment on each EFC Proposal/ Memo during the project appraisal which is
often followed by the proposing Ministry/ Department submitting its responses to the comments.

17 | P a g e
Specifically, the Project Appraisal and Management Division (PAMD), a division of the Planning
Commission, prepares a ‘Note for the Expenditure Finance Committee (EFC)’ wherein the comments of
different divisions of the Planning Commission are consolidated, following which the EFC meeting is
convened.
As a part of the pre-project investigations, first 75-80 EFC Memos/ Proposals were chosen from a list of
1188 proposals given by the Planning Commission to the IIMB Study Team based on year, sector and size
of these Memos. Further, in consultation with the PAMD, Planning Commission, 25 of these were
selected to be studied in detail. A summary of these EFC Memos in terms of month and year of
origination, sector, sponsoring Ministry/ Department, size and nature of scheme is presented in the
table below.
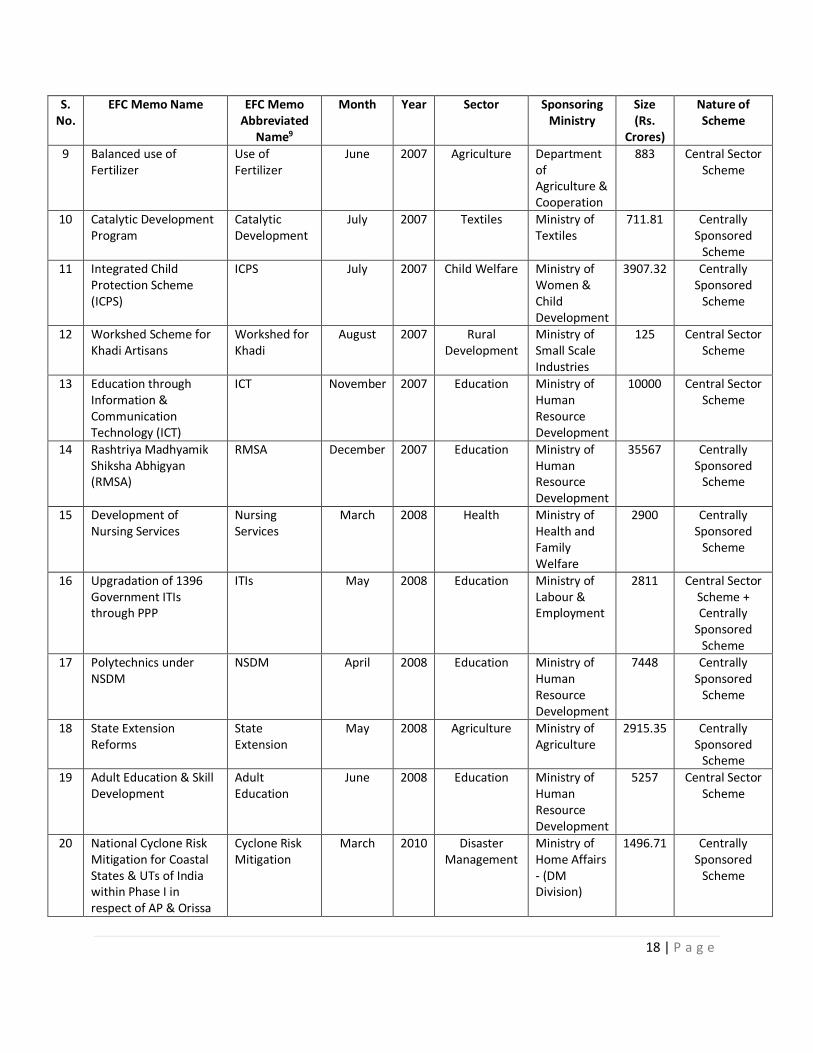
Table 1: Summary of EFC Memos Analyzed in this Study
S. No.
EFC Memo Name EFC Memo Abbreviated
Name9
Month Year Sector Sponsoring Ministry
Size (Rs.
Crores)
Nature of Scheme
1 Enhancing Productivity and Competitiveness of Traditional Khadi Industries & Artisans
Khadi Productivity
June 2006 Rural Development
Ministry of Rural & Agro Industry
90 Central Sector Scheme
2 Ganga Action Plan (GAP) II
GAP II August 2006 Environmental Ministry of Environment & Forests
478.82 Centrally Sponsored
Scheme
3 Permanent Shelter for Tsunami Affected People
Tsunami August 2006 Disaster Management
Directorate General of Works, Central Public Works Department
1221 Central Sector Scheme
4 PURA PURA February 2007 Rural Development
Ministry of Rural Development
5950 Centrally Sponsored
Scheme
5 Integrated Handloom Development Scheme (IHDS)
IHDS March 2007 Textiles Ministry of Textiles
800 Central Sector Scheme
6 Dryland Farming Systems
Dryland Farming
May 2007 Agriculture Ministry of Agriculture
1548.74 Central Sector Scheme
7 Medicinal Processing Zone
Medicinal Processing Zone
May 2007 Health Ministry of Health & Family Welfare
649 Centrally Sponsored
Scheme
8 Mumbai Metro Rail Mumbai Metro Rail
May 2007 Infrastructure Ministry of Urban Development
2356 Not mentioned
9 In the text of this report, EFC Memos are referred to by their EFC Memo Abbreviated Names.
18 | P a g e
S. No.
EFC Memo Name EFC Memo Abbreviated
Name9
Month Year Sector Sponsoring Ministry
Size (Rs.
Crores)
Nature of Scheme
9 Balanced use of Fertilizer
Use of Fertilizer
June 2007 Agriculture Department of Agriculture & Cooperation
883 Central Sector Scheme
10 Catalytic Development Program
Catalytic Development
July 2007 Textiles Ministry of Textiles
711.81 Centrally Sponsored
Scheme
11 Integrated Child Protection Scheme (ICPS)
ICPS July 2007 Child Welfare Ministry of Women & Child Development
3907.32 Centrally Sponsored
Scheme
12 Workshed Scheme for Khadi Artisans
Workshed for Khadi
August 2007 Rural Development
Ministry of Small Scale Industries
125 Central Sector Scheme
13 Education through Information & Communication Technology (ICT)
ICT November 2007 Education Ministry of Human Resource Development
10000 Central Sector Scheme
14 Rashtriya Madhyamik Shiksha Abhigyan (RMSA)
RMSA December 2007 Education Ministry of Human Resource Development
35567 Centrally Sponsored
Scheme
15 Development of Nursing Services
Nursing Services
March 2008 Health Ministry of Health and Family Welfare
2900 Centrally Sponsored
Scheme
16 Upgradation of 1396 Government ITIs through PPP
ITIs
May 2008 Education Ministry of Labour & Employment
2811 Central Sector Scheme + Centrally
Sponsored Scheme
17 Polytechnics under NSDM
NSDM April 2008 Education Ministry of Human Resource Development
7448 Centrally Sponsored
Scheme
18 State Extension Reforms
State Extension
May 2008 Agriculture Ministry of Agriculture
2915.35 Centrally Sponsored
Scheme
19 Adult Education & Skill Development
Adult Education
June 2008 Education Ministry of Human Resource Development
5257 Central Sector Scheme
20
National Cyclone Risk Mitigation for Coastal States & UTs of India within Phase I in respect of AP & Orissa
Cyclone Risk Mitigation
March 2010 Disaster Management
Ministry of Home Affairs - (DM Division)
1496.71 Centrally Sponsored
Scheme

19 | P a g e
S. No.
EFC Memo Name EFC Memo Abbreviated
Name9
Month Year Sector Sponsoring Ministry
Size (Rs.
Crores)
Nature of Scheme
21 Teachers’ Education Teacher's Education
June 2010 Education Ministry of Human Resource Development
9429 Centrally Sponsored
Scheme
22 E-Health Initiatives including e-Telemedicine
E-Telemedicine
August 2010 Health Ministry of Health and Family Welfare
120 Centrally Sponsored
Scheme
23 Rajiv Awas Yojana (RAY)
RAY May 2010 Housing Ministry of Housing & Urban Poverty Alleviation
55000 Centrally Sponsored
Scheme
24 Financial restructuring of NAFED
NAFED February 2011 Agriculture Ministry of Agriculture
920.21 Central Sector Scheme
25
Integrated Child Development Service (ICDS)
ICDS November 2011 Child Welfare Ministry of Women & Child Development
183855 Centrally Sponsored
Scheme
Source: Authors
From the table it can be noted that the date of origin of the EFC Memos/ Proposals ranged from June
2006 to November 2011; their sizes ranged from Rs. 90 crore to Rs. 1,83,855 crore; and 9 were for
Central Sector Schemes, 14 were for Centrally Sponsored Schemes, the EFC Memo on ITIs had both,
Central Sector and Centrally Sponsored, components and the nature of scheme was not mentioned in
the case of the EFC Memo on the Mumbai Metro Rail. The sectors covered in the selected EFC Memos/
Proposals included agriculture, child welfare, disaster management, education, health, rural
development and textiles.
4.3. Assessment of EFC Memos For the purpose of the assessment of the EFC Memos/ Proposals, six broad areas of questions were
selected from the pre-defined questions in the format for EFC Memos/ Proposals (Annexure I). The
areas chosen are as follows: statement of proposal, programme schedule, expenditure involved and
reliability of cost estimates, operational capabilities, points on which decisions/ sanctions are required
and the Detailed Project Report (DPR). The primary reason for the selection of these six areas was that
they were applicable across all projects which are under consideration of this study.
Areas such as the following were not considered as they were not applicable for all projects: revised cost
estimates, resettlement, disaster management, individual beneficiaries, previous schemes/ projects with
similar/ same objectives and viability (economic and financial).
To analyse the answers provided in the EFC Proposals/ Memos for the questions in the aforementioned
six areas, a weighted scoring method was adopted. Variations of the weighted scoring method are often

20 | P a g e
used for the purpose of project appraisal in case of projects where different non-monetary factors are to
be assessed. For the six areas chosen, their weightings out of a maximum of 100 were decided based on
their perceived relative importance to the EFC. These are presented below in Table 2.
Table 2: Components for Assessment of EFC Memos/ Proposals
Components for Assessment10 Maximum Score
Statement of Proposal 25
Program Schedule 15
Expenditure Involved + Reliability of Cost Estimates 30
Operational Capabilities 15
Points on which decisions/sanctions are required 5
Detailed Project Report (DPR) 10
Total 100
Source: Authors
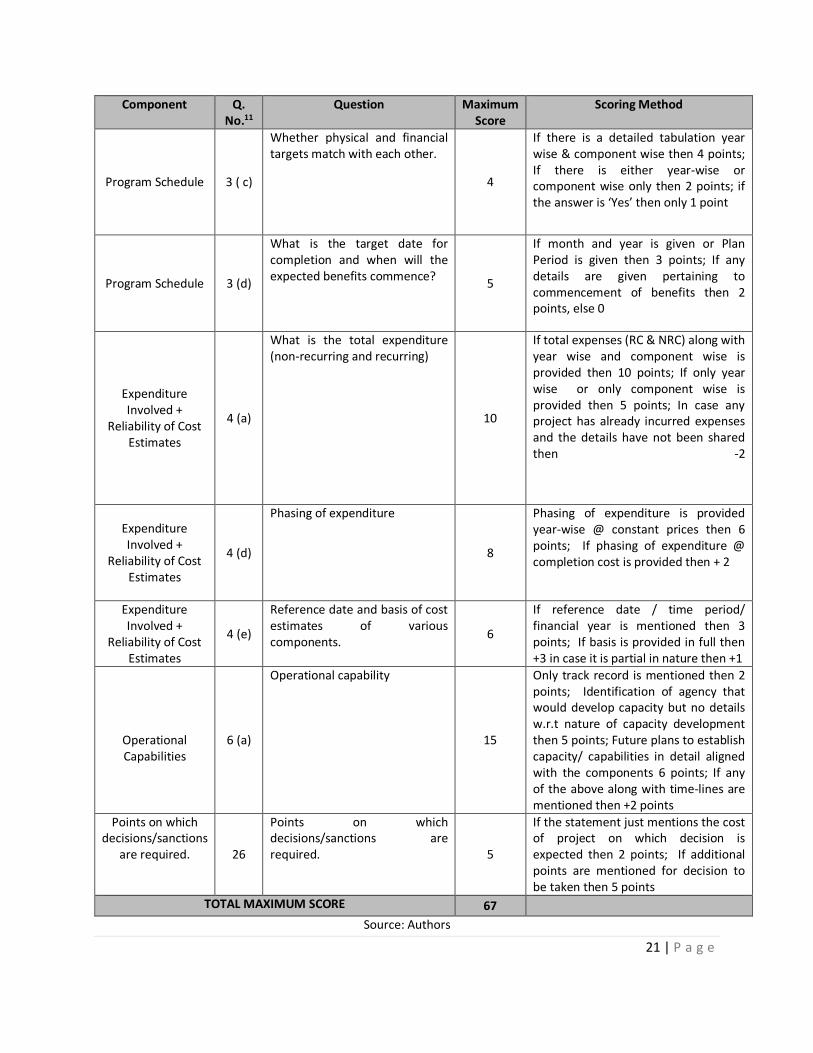
Thereafter, for the questions to be assessed in each of these six sections, weightings of the questions
were decided. To maintain consistency and to avoid subjectivity during the scoring process of EFC
Proposals/ Memos, a ‘Scoring Method’ was developed. For the first five components, the questions
within each component which were given high weighting are listed in the following table. The total
maximum scores of these add up to 67, i.e. two-thirds of the total score. The completed list of questions
assessed with their maximum scores and ‘Scoring Method’ is presented in Annexure II. The findings and
analysis from this scoring are presented in Section 6.1.
Table 3: Questions Assessed within Each Component with High Weighting
Component Q. No.11
Question Maximum Score
Scoring Method
Statement of Proposal
2 (d)
Reasons and justification for proposal.
7
Historical Background: 4 Mention of alternatives: 1; if there is a comparison between alternatives and proposed scheme with respect to economics then +1, if there are other relevant aspects being compared then additional +1
Statement of Proposal
2 (l)
What are the development “outcomes” and “outputs” of the scheme/project?
7
If outcomes are mentioned then 2 points; If outputs are mentioned then 3 points; If baseline is also mentioned then additional 2 points
10 These components are a part of the format for EFC Memo/ Proposal presented in Annexure I. 11 These question numbers are as per the format for EFC Memo/ Proposal presented in Annexure I.
21 | P a g e
Component Q. No.11
Question Maximum Score
Scoring Method
Program Schedule 3 ( c)
Whether physical and financial targets match with each other.
4
If there is a detailed tabulation year wise & component wise then 4 points; If there is either year-wise or component wise only then 2 points; if the answer is ‘Yes’ then only 1 point
Program Schedule 3 (d)
What is the target date for completion and when will the expected benefits commence?
5
If month and year is given or Plan Period is given then 3 points; If any details are given pertaining to commencement of benefits then 2 points, else 0
Expenditure Involved +
Reliability of Cost Estimates
4 (a)
What is the total expenditure (non-recurring and recurring)
10
If total expenses (RC & NRC) along with year wise and component wise is provided then 10 points; If only year wise or only component wise is provided then 5 points; In case any project has already incurred expenses and the details have not been shared then -2
Expenditure Involved +
Reliability of Cost Estimates
4 (d)
Phasing of expenditure
8
Phasing of expenditure is provided year-wise @ constant prices then 6 points; If phasing of expenditure @ completion cost is provided then + 2
Expenditure Involved +
Reliability of Cost Estimates
4 (e)
Reference date and basis of cost estimates of various components.
6
If reference date / time period/ financial year is mentioned then 3 points; If basis is provided in full then +3 in case it is partial in nature then +1
Operational Capabilities
6 (a)
Operational capability
15
Only track record is mentioned then 2 points; Identification of agency that would develop capacity but no details w.r.t nature of capacity development then 5 points; Future plans to establish capacity/ capabilities in detail aligned with the components 6 points; If any of the above along with time-lines are mentioned then +2 points
Points on which decisions/sanctions
are required. 26
Points on which decisions/sanctions are required. 5
If the statement just mentions the cost of project on which decision is expected then 2 points; If additional points are mentioned for decision to be taken then 5 points
TOTAL MAXIMUM SCORE 67
Source: Authors

22 | P a g e
The Detailed Project Report is not a part of the EFC Proposal/ Memo format per se. However, according
to the Guidelines (2003), the Detailed Project Report (DPR) for each scheme/ project is to be submitted
and circulated along with the EFC Proposal/ Memo during the project appraisal process. Therefore, a
weighting of 10 percent was given to the DPR or any attached document which could be treated as a
DPR such as Guidelines for the scheme/ project proposed, Concept Note for the scheme/ project
proposed.
A generic structure for the DPR has been prescribed in the Guidelines (2003), while many components of
this structure are common to the components of the EFC Proposal/ Memo, four components that are
not covered within the assessment components of the EFC Proposal/ Memo and ought to be disclosed
for all projects are the legal framework, risk analysis, evaluation and sustainability. These four sub-
components were, therefore assessed under the DPR component during the assessment of the EFC
Proposal/ Memo. The details of these sub-components, including definitions as per the Guidelines
(2003) and their ‘Scoring Method’, are available in Annexure II.
4.4. Assessment of Appraisal of EFC Memos by the Planning Commission As mentioned earlier, the appraisal of EFC Memos/ Proposals is undertaken by the Planning Commission
by way of providing comments on the EFC Memo/ Proposal. For the purpose of assessing these
comments on each EFC Proposal/ Memo under consideration of this study, another scoring mechanism
was developed. This is available as part of Annexure III.
The assessment of the projects under appraisal in the background of plan framework is not brought out
explicitly often. It is as if every project is a fresh proposal and is being appraised on stand-alone basis.
Even in the case of projects which are in the nature of renewal, assessment of its performance in the
context of the plan target is quite weak.
Each comment was assessed on five parameters including the following: criticality, directionality,
endorsement by other commenting agencies, discussion regarding the comment during the EFC meeting
and decision relating to the comment during the EFC meeting. The scoring for each parameter was
binary (0,1). The detailed definition of the assessing parameters is presented in the table below. The
findings and analysis from this scoring are presented in Section 6.2.
Table 4: Definition of Parameters assessed while Scoring Comments of the Planning Commission
Parameter Definition
Criticality Defines the importance of the issue which is highlighted
in the context of the subject of the scheme/ project
proposal.
Directionality Defines how direct and specific is the comment in terms
of eliciting a response from the concerned department
(however, this is not concerned with whether the
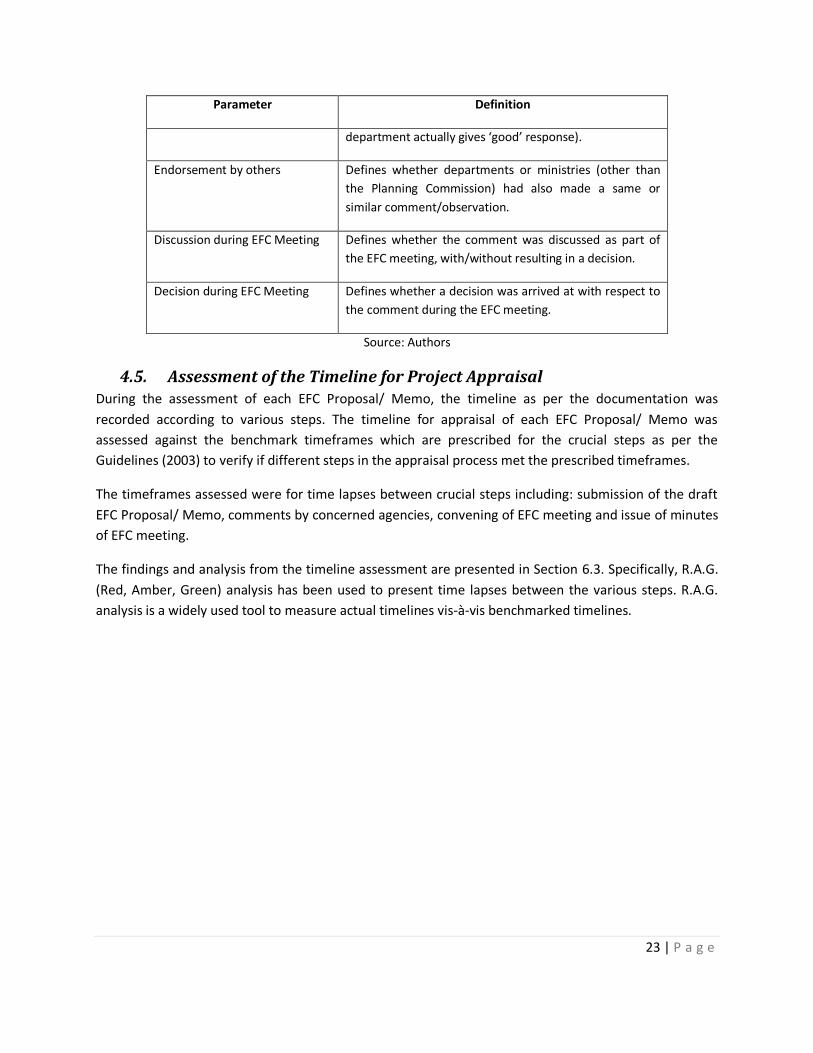
23 | P a g e
Parameter Definition
department actually gives ‘good’ response).
Endorsement by others Defines whether departments or ministries (other than
the Planning Commission) had also made a same or
similar comment/observation.
Discussion during EFC Meeting Defines whether the comment was discussed as part of
the EFC meeting, with/without resulting in a decision.
Decision during EFC Meeting Defines whether a decision was arrived at with respect to
the comment during the EFC meeting.
Source: Authors
4.5. Assessment of the Timeline for Project Appraisal During the assessment of each EFC Proposal/ Memo, the timeline as per the documentation was
recorded according to various steps. The timeline for appraisal of each EFC Proposal/ Memo was
assessed against the benchmark timeframes which are prescribed for the crucial steps as per the
Guidelines (2003) to verify if different steps in the appraisal process met the prescribed timeframes.
The timeframes assessed were for time lapses between crucial steps including: submission of the draft
EFC Proposal/ Memo, comments by concerned agencies, convening of EFC meeting and issue of minutes
of EFC meeting.
The findings and analysis from the timeline assessment are presented in Section 6.3. Specifically, R.A.G.
(Red, Amber, Green) analysis has been used to present time lapses between the various steps. R.A.G.
analysis is a widely used tool to measure actual timelines vis-à-vis benchmarked timelines.

24 | P a g e
5. Methods for Project Formulation & Appraisal Several methods are used for project formulation and appraisal by large governmental and non-
governmental institutions across the world. As is well known, project appraisal is a key step in any
project cycle since it is an ex-ante assessment of a project and is crucial in deciding whether the project
will be implemented or not. However, any project appraisal has to be done of a project prepared by the
proposing agencies and hence, the outcome of the project preparation process is what is assessed
during project appraisal.
Some of the methods often used for project appraisal and thereafter for appraisal include Problem Tree
Analysis, Stakeholder Analysis and Logical Framework Analysis (LFA). Economic analysis including cost-
benefit analysis or alternatively, social cost-benefit analysis might be undertaken as well. Further,
techniques used in project identification and preparation, focussed on project management, include
Gantt Chart preparation, Network Analysis techniques and linear and non-linear programming among
other optimization techniques.
5.1. Problem Tree Analysis Problem tree analysis is a method which maps out problems, showing their interconnections and
predicting how a project might address those problems. The main objective of this analysis is to
establish the cause and effect relationships between problems that exist and relations between the
problems. The analysis is concerned with primarily three steps including: (a) defining the framework and
subject for analysis; (b) identifying the main problems that are faced by the target groups and/or
beneficiaries; and (c) visualizing the problems and their contributory factors in form of a diagram called
the problem tree. Following is a generic structure of a Problem Tree.
Figure 3: Structure of a Problem Tree
Source: DFID, 2002
FOCAL PROBLEM
EFFECTS OF THE FOCAL PROBLEM
CAUSES OF THE FOCAL PROBLEM

25 | P a g e
5.2. Stakeholder Analysis Stakeholders of a project include those people or organizations that are likely to be affected by project
and/ or can influence the success or failure of the project. A stakeholder analysis involves identification
of all stakeholders, individuals and groups, which are likely to be affected either positively or negatively
by a project and an analysis of their interests, problems, potentials etc. Most often, data on
stakeholders is collected by undertaking workshops or focus group discussions with different groups of
stakeholders. The crucial outcome of such an analysis is to develop strategies to get the most effective
support possible for the project and reduce any obstacles which might hinder the success of the project
(WHO).
A stakeholder analysis might be quite simplified to one which is more refined.
1. Readiness/ Power Matrix: Such a matrix is used to assess how ready different stakeholders to
participate are and how much power do they have; where “readiness” is either the amount a
stakeholder knows about the activity or a stakeholder’s view of the activity, whether positive or
negative and “power” is the influence a stakeholder has over the success of the activity (DFID,
2002). A matrix such as the following might be used to present this analysis:
Figure 4: Structure of a Readiness/ Power Matrix
S. No. Stakeholders Readiness Power
High Medium Low High Medium Low
1 O X X
2 X O X
3 X X
4 X X O
Note: “X” is the position at which the stakeholders are to start with and “O” is the position where the project/
programme wants them to move to; Source: DFID, 2002
2. Stakeholder Table and Importance/ Influence Matrix: In this case, first a stakeholder table is
prepared wherein primary stakeholders (individuals and/or groups which are ultimately affected by
an activity as either beneficiaries or dis-beneficiaries) and secondary stakeholders (all other
individuals and/or groups who have an interest or an intermediary role in the activity) are listed with
their interests and a value is assigned to priority of the interests (relative to the aims/priorities of
the action being contemplated), and to assess the likely impact of any activity on them as positive or
negative (ODI). A table such as the following is created:
26 | P a g e
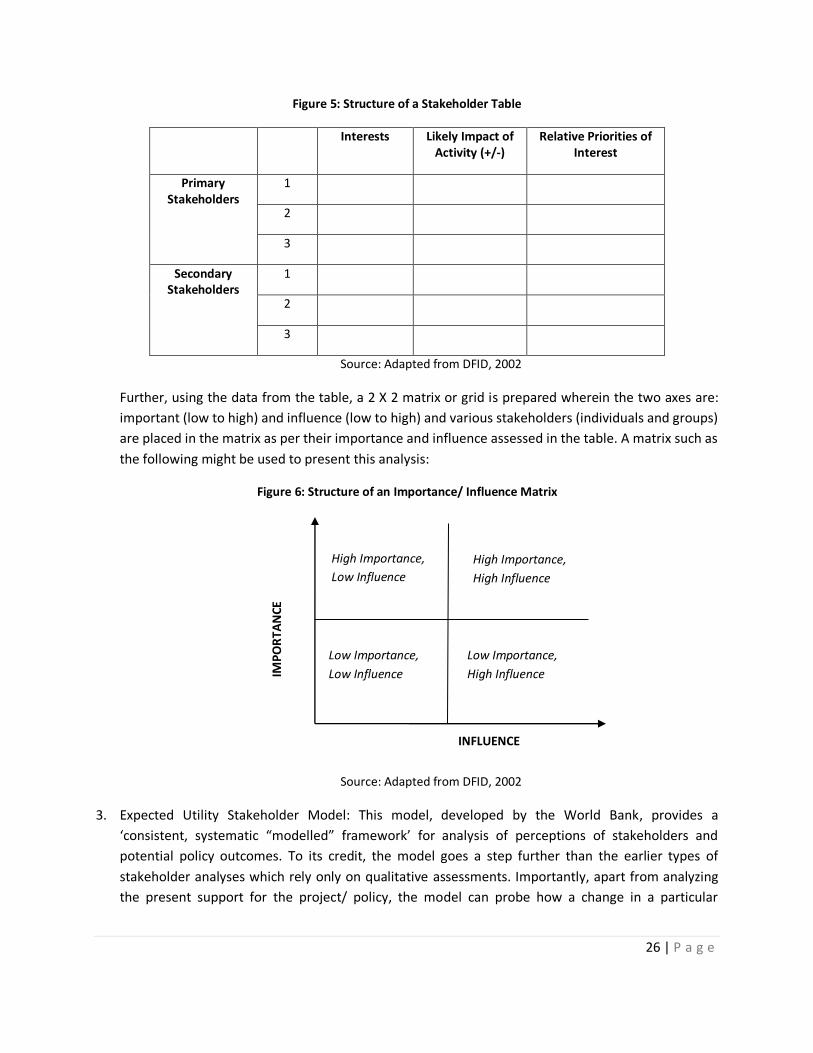
Figure 5: Structure of a Stakeholder Table
Interests Likely Impact of Activity (+/-)
Relative Priorities of Interest
Primary Stakeholders
1
2
3
Secondary Stakeholders
1
2
3
Source: Adapted from DFID, 2002
Further, using the data from the table, a 2 X 2 matrix or grid is prepared wherein the two axes are:
important (low to high) and influence (low to high) and various stakeholders (individuals and groups)
are placed in the matrix as per their importance and influence assessed in the table. A matrix such as
the following might be used to present this analysis:
Figure 6: Structure of an Importance/ Influence Matrix
Source: Adapted from DFID, 2002
3. Expected Utility Stakeholder Model: This model, developed by the World Bank, provides a
‘consistent, systematic “modelled” framework’ for analysis of perceptions of stakeholders and
potential policy outcomes. To its credit, the model goes a step further than the earlier types of
stakeholder analyses which rely only on qualitative assessments. Importantly, apart from analyzing
the present support for the project/ policy, the model can probe how a change in a particular
INFLUENCE
IMP
OR
TAN
CE
High Importance,
Low Influence
Low Importance,
Low Influence
High Importance,
High Influence
Low Importance,
High Influence
27 | P a g e
stakeholder’s initial policy position might affect either the likelihood of reform or the level of
consensus going forward (World Bank, 2004).
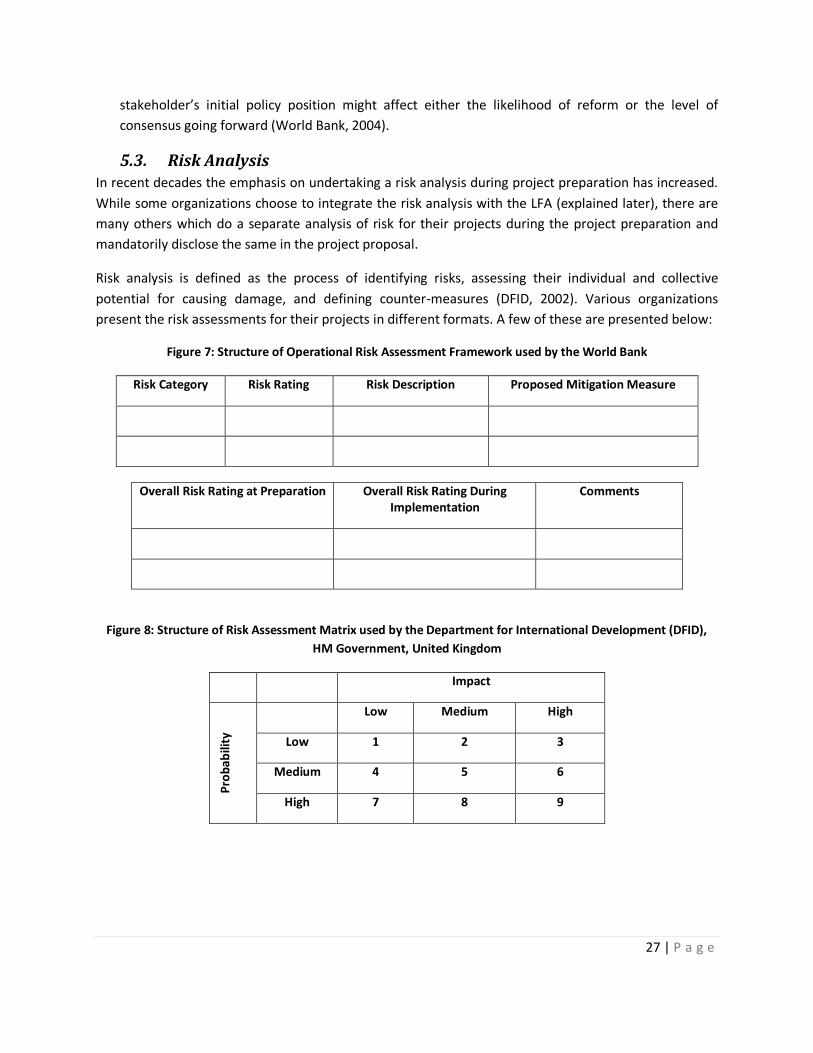
5.3. Risk Analysis In recent decades the emphasis on undertaking a risk analysis during project preparation has increased.
While some organizations choose to integrate the risk analysis with the LFA (explained later), there are
many others which do a separate analysis of risk for their projects during the project preparation and
mandatorily disclose the same in the project proposal.
Risk analysis is defined as the process of identifying risks, assessing their individual and collective
potential for causing damage, and defining counter-measures (DFID, 2002). Various organizations
present the risk assessments for their projects in different formats. A few of these are presented below:
Figure 7: Structure of Operational Risk Assessment Framework used by the World Bank
Risk Category Risk Rating Risk Description Proposed Mitigation Measure
Overall Risk Rating at Preparation Overall Risk Rating During Implementation
Comments
Figure 8: Structure of Risk Assessment Matrix used by the Department for International Development (DFID),
HM Government, United Kingdom
Impact
Pro
bab
ility
Low Medium High
Low 1 2 3
Medium 4 5 6
High 7 8 9
28 | P a g e
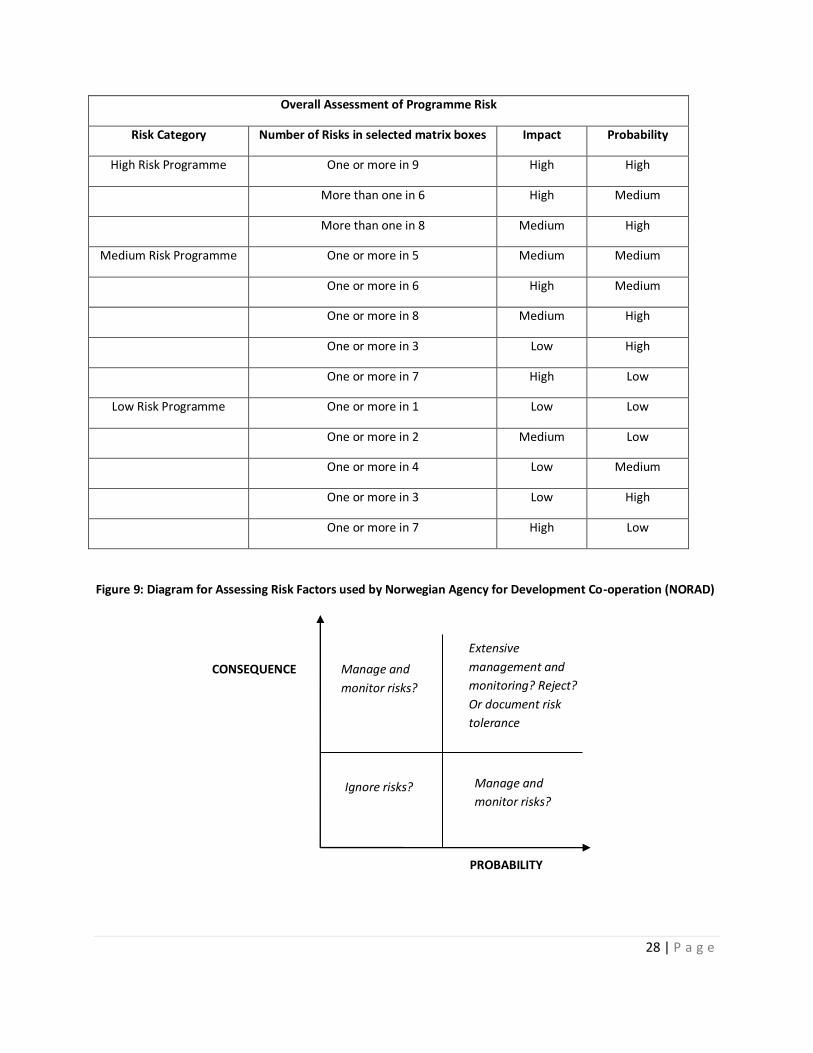
Overall Assessment of Programme Risk
Risk Category Number of Risks in selected matrix boxes Impact Probability
High Risk Programme One or more in 9 High High
More than one in 6 High Medium
More than one in 8 Medium High
Medium Risk Programme One or more in 5 Medium Medium
One or more in 6 High Medium
One or more in 8 Medium High
One or more in 3 Low High
One or more in 7 High Low
Low Risk Programme One or more in 1 Low Low
One or more in 2 Medium Low
One or more in 4 Low Medium
One or more in 3 Low High
One or more in 7 High Low
Figure 9: Diagram for Assessing Risk Factors used by Norwegian Agency for Development Co-operation (NORAD)
PROBABILITY
CONSEQUENCE Manage and
monitor risks?
Ignore risks?
Extensive
management and
monitoring? Reject?
Or document risk
tolerance
Manage and
monitor risks?
29 | P a g e
5.4. Logical Framework Analysis (LFA)
5.4.1. LFA – Original Framework
The Logical Framework Approach (LFA) to design and evaluate projects was first developed by a
consulting firm, Practical Concepts Incorporated (PCI), for the US Agency for International Development
(USAID) in 1979. The approach, as defined by PCI is, “a set of interlocking concepts which must be used
together in a dynamic fashion to permit the elaboration of a well designed, objectively described and
evaluable project” (PCI, 1979). The approach, therefore, is “not an integrated set of procedures, and nor
is it a set of guidelines for the evaluation of a particular type of project” (Coleman, 1987).
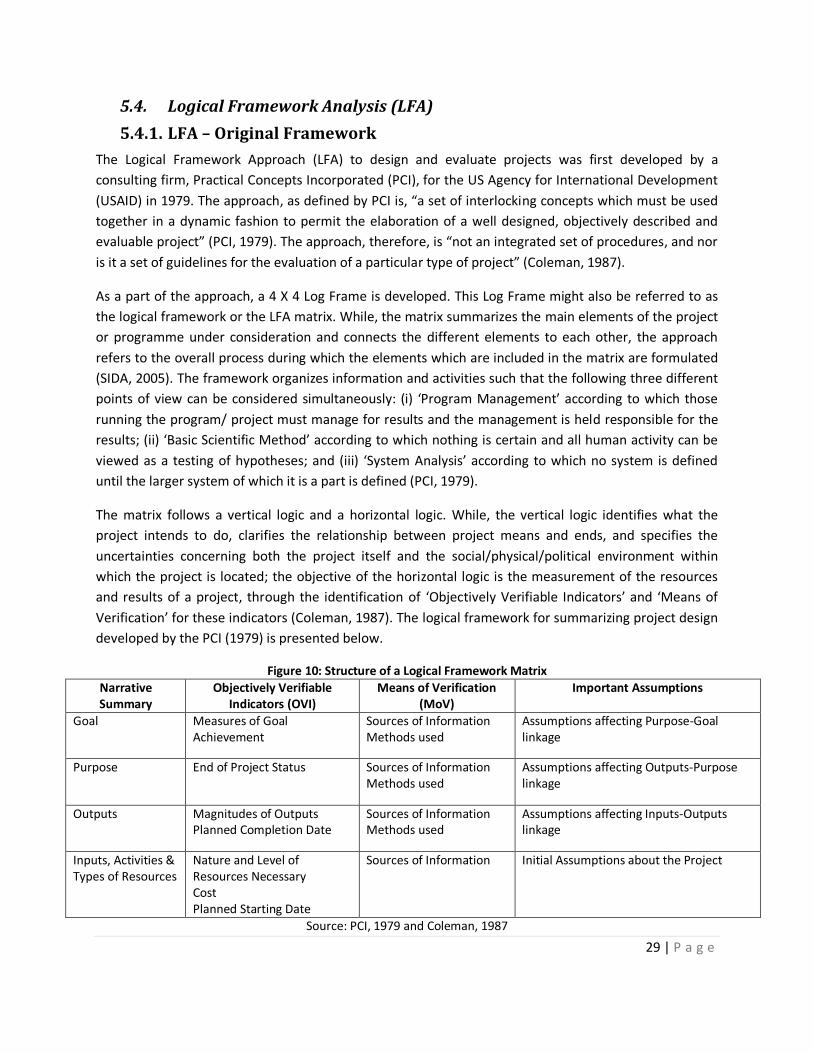
As a part of the approach, a 4 X 4 Log Frame is developed. This Log Frame might also be referred to as
the logical framework or the LFA matrix. While, the matrix summarizes the main elements of the project
or programme under consideration and connects the different elements to each other, the approach
refers to the overall process during which the elements which are included in the matrix are formulated
(SIDA, 2005). The framework organizes information and activities such that the following three different
points of view can be considered simultaneously: (i) ‘Program Management’ according to which those
running the program/ project must manage for results and the management is held responsible for the
results; (ii) ‘Basic Scientific Method’ according to which nothing is certain and all human activity can be
viewed as a testing of hypotheses; and (iii) ‘System Analysis’ according to which no system is defined
until the larger system of which it is a part is defined (PCI, 1979).
The matrix follows a vertical logic and a horizontal logic. While, the vertical logic identifies what the
project intends to do, clarifies the relationship between project means and ends, and specifies the
uncertainties concerning both the project itself and the social/physical/political environment within
which the project is located; the objective of the horizontal logic is the measurement of the resources
and results of a project, through the identification of ‘Objectively Verifiable Indicators’ and ‘Means of
Verification’ for these indicators (Coleman, 1987). The logical framework for summarizing project design
developed by the PCI (1979) is presented below.
Figure 10: Structure of a Logical Framework Matrix
Narrative Summary
Objectively Verifiable Indicators (OVI)
Means of Verification (MoV)
Important Assumptions
Goal Measures of Goal Achievement
Sources of Information Methods used
Assumptions affecting Purpose-Goal linkage
Purpose End of Project Status Sources of Information Methods used
Assumptions affecting Outputs-Purpose linkage
Outputs Magnitudes of Outputs Planned Completion Date
Sources of Information Methods used
Assumptions affecting Inputs-Outputs linkage
Inputs, Activities & Types of Resources
Nature and Level of Resources Necessary Cost Planned Starting Date
Sources of Information Initial Assumptions about the Project
Source: PCI, 1979 and Coleman, 1987

30 | P a g e
The matrix presents the underlying ‘if and then’ logic of the logical framework approach. Starting from
the bottom, left hand corner of the matrix the logic flows as follows: (i) if the activities are undertaken
and the assumptions hold true then the outputs will be created; (ii) if the outputs are created and the
assumptions hold true then the purpose will be achieved; and (iii) if the purpose is achieved and the
assumptions hold true then a contribution to the goal will be made (DFID, 2002).
5.4.2. Advantages and Disadvantages of the LFA
Mikkelsen (1995) highlights the main advantages of the LFA including the following: (i) it ensures that
the fundamental questions are asked and weaknesses are analysed to provide decision makers with
better and relevant information; (ii) it guides a systematic and logical analysis of inter-related key
elements which constitute a ‘well designed’ project; (iii) it improves planning by highlighting linkages
between elements of the project and external factors; (iv) it provides a sound basis for systematic
monitoring and analysis of the effects of a project; (v) it enables a common understanding and improved
communication between the decision makers, managers and other actors involved in the project; (vi) it
benefits the management and administration due to the standard procedures used in collection and
analysis of information; (vii) it ensures continuity even if the original staff are replaced; (viii) it enables
inter-sectoral and intra-sectoral comparative studies.
However, the approach is not without its limitations and these have also been emphasized by different
actors in the development sector. The very basis of the logical framework which relies on the ‘if and
then’ logic has been questioned, since it is widely accepted that such a linear linkage does not hold valid
in a practical sense due to multiple external factors which are not in control of those implementing the
project.
Gasper (2001) outlines the problems with both, the vertical and horizontal logics of the logical
framework. With regard to the vertical logic, following limitations arise: (i) meanings of the levels are
difficult to differentiate and apply; (ii) the need to specify a single ‘Goal’ and ‘Purpose’ leads to the
danger of a tunnel vision and loss of synergies; (iii) since there is no explicit mention of a timeline for the
project within the approach (and matrix), there might be an over-estimation of the ‘Purpose’; (iv)
process objectives which concern how things are done rather than what end-state outcomes are
achieved are difficult to include; (v) while the assumptions column is most crucial, it is often
marginalized; and (vi) attention to alternatives and learning might be suppressed due to an over-
emphasis on the linkage running from inputs to outputs to impact (purpose/ outcome and goal) (Gasper,
2001). With regard to the horizontal logic, most of the limitations that arise concern the indicators,
including the following: (i) it is unclear to what degree are measurements required as some objectives
may not be measureable; (ii) it is often presumed that the indicators are the targets which might lead to
rigidity during implementation; (iii) partial indicators might be treated as perfect measures of all facets
of the objectives leading, again, to a tunnel vision; (iv) incentives might be distorted if rewards are tied
to indicators which have partial scope and validity; and (v) it is often less clear what is to be measured at
the purpose and goal levels (Gasper, 2001).

31 | P a g e
5.4.3. Variations and Adaptations of the LFA
While the aforementioned approach is the original or the ‘first generation’ LFA, second and third
generations of the approach have also been developed. The ‘second generation’ of the LFA, mostly
pioneered by the European development organizations in the late 1980s and 1990s, recognized the
importance of both, content of the design and the processes undertaken to attain the same (Dearden,
2001). This version of the LFA primarily integrated stakeholder analysis and problem tree analysis with
the existing LFA. Further, the ‘third generation’ of the LFA, developed in the mid 1990s, aimed at
combining the LFA with newly developed computer software packages to ease preparation and revision
of matrices and at gaining better insights into indicators and the links of the LFA to the other planning
methods including time scheduling, budgeting etc. (Gasper, 2001).
Presently, the LFA approach has been adopted by numerous multilateral organizations engaged in
development across the globe such as the European Commission, DFID, SIDA, NORAD, GIZ (earlier GTZ),
DANIDA, UN organizations including UNICEF, UNDP. Various steps of the LFA, including the development
of the LFA matrix, and a presentation of the matrix so developed in the project proposal have to be
undertaken as a part of the project preparation process at these organizations.
It ought to be noted that while the matrix presented in Figure 11 is what was initially developed by PCI
for USAID, variations in terminology (for example, ‘Aim’ might be used instead of ‘Goal’, ‘Objective’ or
‘Outcome’ might be used instead of ‘Purpose’) have been made by organizations who are using the
framework (SIDA, 2005). A comparison between terminologies used by different organizations of the
results/ logical frameworks has been prepared by Jim Rugh for CARE International and InterAction’s
Evaluation Interest Group and called the ‘The Rosetta Stone of Logical Frameworks’ (table presented
below).
Figure 11: The Rosetta Stone of Logical Frameworks
Ultimate Impact End Outcomes Intermediate Outcomes Outputs Interventions
Needs-based Higher Consequence
Specific Problem Cause Solution Process Inputs
CARE terminology12
Program Impact Project Impact Effects Outputs Activities Inputs
CARE Logframe
Program Goal Project Final Goal
Intermediate Objectives Outputs Activities Inputs
PC/LogFrame13
Goal Purpose Outputs Activities
USAID Results Framework14
Strategic Objective Intermediate Results Outputs Activities Inputs
12 CARE Impact Guidelines, October 1999. 13 PC/LogFrame (tm) 1988-1992 TEAM technologies, Inc. 14 Results Oriented Assistance Sourcebook, USAID, 1998.
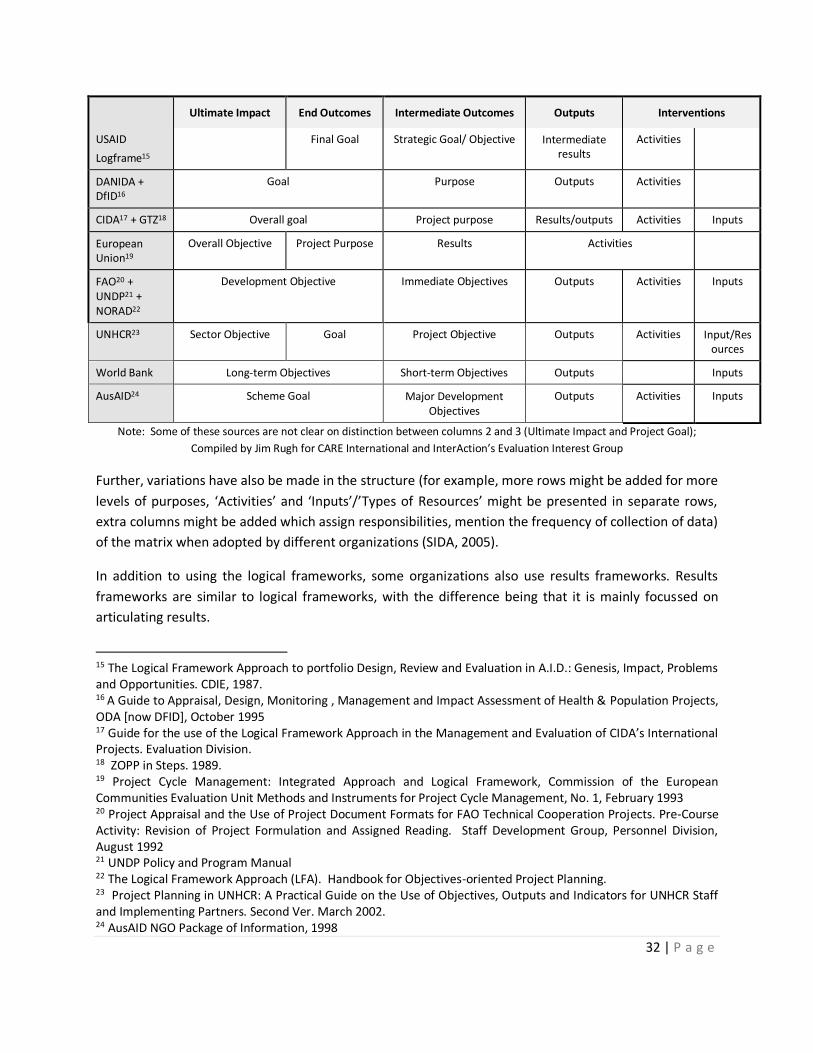
32 | P a g e
Ultimate Impact End Outcomes Intermediate Outcomes Outputs Interventions
USAID
Logframe15
Final Goal Strategic Goal/ Objective Intermediate results
Activities
DANIDA + DfID16
Goal Purpose Outputs Activities
CIDA17 + GTZ18 Overall goal Project purpose Results/outputs Activities Inputs
European Union19
Overall Objective Project Purpose Results Activities
FAO20 + UNDP21 + NORAD22
Development Objective Immediate Objectives Outputs Activities Inputs
UNHCR23 Sector Objective Goal Project Objective Outputs Activities Input/Resources
World Bank Long-term Objectives Short-term Objectives Outputs Inputs
AusAID24 Scheme Goal Major Development Objectives
Outputs Activities Inputs
Note: Some of these sources are not clear on distinction between columns 2 and 3 (Ultimate Impact and Project Goal);
Compiled by Jim Rugh for CARE International and InterAction’s Evaluation Interest Group
Further, variations have also be made in the structure (for example, more rows might be added for more
levels of purposes, ‘Activities’ and ‘Inputs’/’Types of Resources’ might be presented in separate rows,
extra columns might be added which assign responsibilities, mention the frequency of collection of data)
of the matrix when adopted by different organizations (SIDA, 2005).
In addition to using the logical frameworks, some organizations also use results frameworks. Results
frameworks are similar to logical frameworks, with the difference being that it is mainly focussed on
articulating results.
15 The Logical Framework Approach to portfolio Design, Review and Evaluation in A.I.D.: Genesis, Impact, Problems and Opportunities. CDIE, 1987. 16 A Guide to Appraisal, Design, Monitoring , Management and Impact Assessment of Health & Population Projects, ODA [now DFID], October 1995 17 Guide for the use of the Logical Framework Approach in the Management and Evaluation of CIDA’s International Projects. Evaluation Division. 18 ZOPP in Steps. 1989. 19 Project Cycle Management: Integrated Approach and Logical Framework, Commission of the European Communities Evaluation Unit Methods and Instruments for Project Cycle Management, No. 1, February 1993 20 Project Appraisal and the Use of Project Document Formats for FAO Technical Cooperation Projects. Pre-Course Activity: Revision of Project Formulation and Assigned Reading. Staff Development Group, Personnel Division, August 1992 21 UNDP Policy and Program Manual 22 The Logical Framework Approach (LFA). Handbook for Objectives-oriented Project Planning. 23 Project Planning in UNHCR: A Practical Guide on the Use of Objectives, Outputs and Indicators for UNHCR Staff and Implementing Partners. Second Ver. March 2002. 24 AusAID NGO Package of Information, 1998
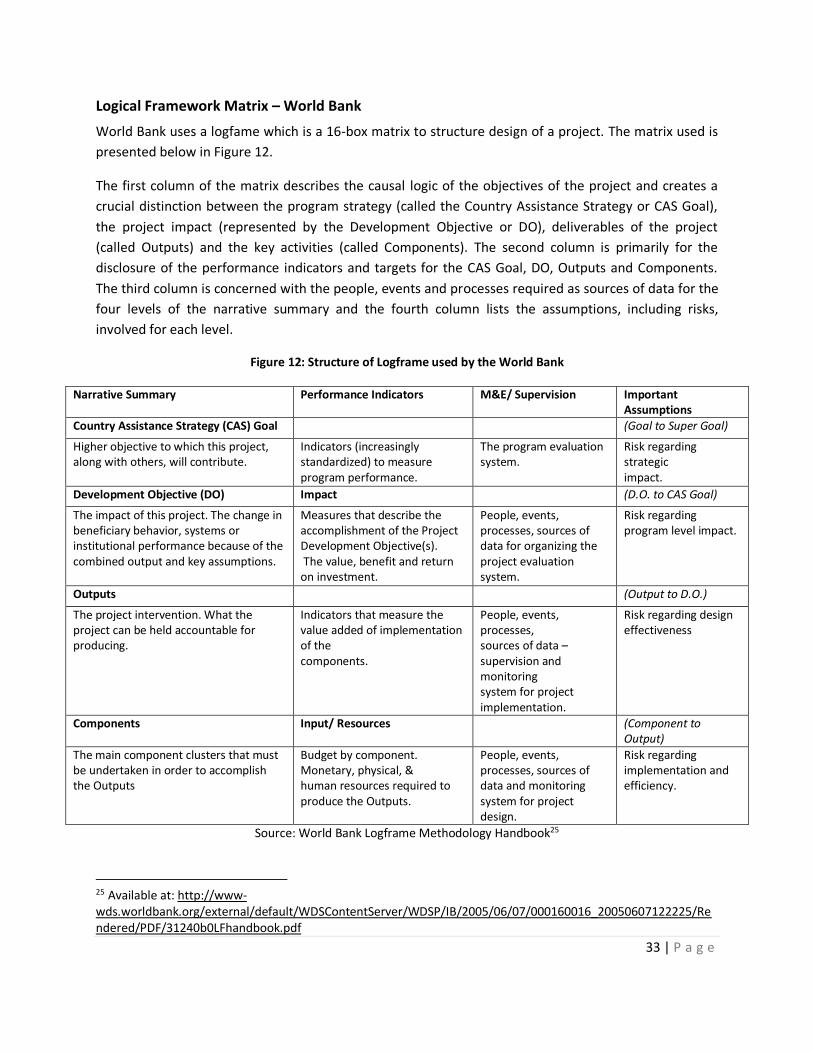
33 | P a g e
Logical Framework Matrix – World Bank
World Bank uses a logfame which is a 16-box matrix to structure design of a project. The matrix used is
presented below in Figure 12.
The first column of the matrix describes the causal logic of the objectives of the project and creates a
crucial distinction between the program strategy (called the Country Assistance Strategy or CAS Goal),
the project impact (represented by the Development Objective or DO), deliverables of the project
(called Outputs) and the key activities (called Components). The second column is primarily for the
disclosure of the performance indicators and targets for the CAS Goal, DO, Outputs and Components.
The third column is concerned with the people, events and processes required as sources of data for the
four levels of the narrative summary and the fourth column lists the assumptions, including risks,
involved for each level.
Figure 12: Structure of Logframe used by the World Bank
Narrative Summary Performance Indicators M&E/ Supervision Important Assumptions
Country Assistance Strategy (CAS) Goal (Goal to Super Goal)
Higher objective to which this project, along with others, will contribute.
Indicators (increasingly standardized) to measure program performance.
The program evaluation system.
Risk regarding strategic impact.
Development Objective (DO) Impact (D.O. to CAS Goal)
The impact of this project. The change in beneficiary behavior, systems or institutional performance because of the combined output and key assumptions.
Measures that describe the accomplishment of the Project Development Objective(s). The value, benefit and return on investment.
People, events, processes, sources of data for organizing the project evaluation system.
Risk regarding program level impact.
Outputs (Output to D.O.)
The project intervention. What the project can be held accountable for producing.
Indicators that measure the value added of implementation of the components.
People, events, processes, sources of data – supervision and monitoring system for project implementation.
Risk regarding design effectiveness
Components Input/ Resources (Component to Output)
The main component clusters that must be undertaken in order to accomplish the Outputs
Budget by component. Monetary, physical, & human resources required to produce the Outputs.
People, events, processes, sources of data and monitoring system for project design.
Risk regarding implementation and efficiency.
Source: World Bank Logframe Methodology Handbook25
25 Available at: http://www-wds.worldbank.org/external/default/WDSContentServer/WDSP/IB/2005/06/07/000160016_20050607122225/Rendered/PDF/31240b0LFhandbook.pdf
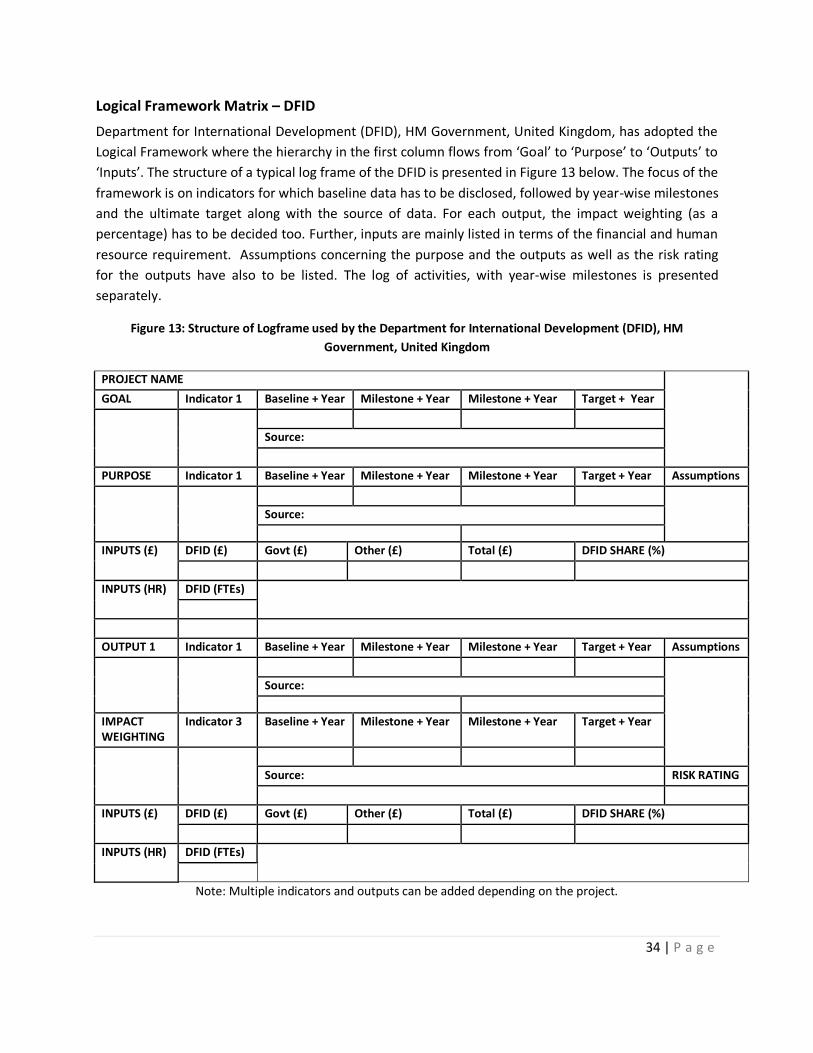
34 | P a g e
Logical Framework Matrix – DFID
Department for International Development (DFID), HM Government, United Kingdom, has adopted the
Logical Framework where the hierarchy in the first column flows from ‘Goal’ to ‘Purpose’ to ‘Outputs’ to
‘Inputs’. The structure of a typical log frame of the DFID is presented in Figure 13 below. The focus of the
framework is on indicators for which baseline data has to be disclosed, followed by year-wise milestones
and the ultimate target along with the source of data. For each output, the impact weighting (as a
percentage) has to be decided too. Further, inputs are mainly listed in terms of the financial and human
resource requirement. Assumptions concerning the purpose and the outputs as well as the risk rating
for the outputs have also to be listed. The log of activities, with year-wise milestones is presented
separately.
Figure 13: Structure of Logframe used by the Department for International Development (DFID), HM
Government, United Kingdom
PROJECT NAME
GOAL Indicator 1 Baseline + Year Milestone + Year Milestone + Year Target + Year
Source:
PURPOSE Indicator 1 Baseline + Year Milestone + Year Milestone + Year Target + Year Assumptions
Source:
INPUTS (£) DFID (£) Govt (£) Other (£) Total (£) DFID SHARE (%)
INPUTS (HR) DFID (FTEs)
OUTPUT 1 Indicator 1 Baseline + Year Milestone + Year Milestone + Year Target + Year Assumptions
Source:
IMPACT WEIGHTING
Indicator 3 Baseline + Year Milestone + Year Milestone + Year Target + Year
Source: RISK RATING
INPUTS (£) DFID (£) Govt (£) Other (£) Total (£) DFID SHARE (%)
INPUTS (HR) DFID (FTEs)
Note: Multiple indicators and outputs can be added depending on the project.

35 | P a g e
Results Framework – World Bank
As a part of the design of each project undertaken at the World Bank, a ‘Results Framework and
Monitoring’ is prepared. A structure of this is presented in Figure 14. The emphasis of this framework is
on disclosure regarding indicators to measure Project Development Objectives (PDOs) and Intermediate
Results. For each indicator, information regarding the unit of measure, baseline data, cumulative target
values, data source or methodology to be used for data collection, responsibility for data collection and
a description of the indicator has to be completed.
Figure 14: Structure of Results Framework and Monitoring used by the World Bank
Project Development Objective(s) (PDO):
PDO Level
Results
Indicators
Co
re
Unit of
Measure
Baseline Cumulative
Target
Values
(Year-wise)
Frequency Methodology
for Data
Responsibility
for Data
Collection
Description
(Indicator
Definition
etc.)
1 2 3
Indicator 1 ○
INTERMEDIATE RESULTS
COMPONENT A
Intermediate
Result
Indicator 1
○
COMPONENT B
Intermediate
Result
Indicator 1
○
Note: Multiple indicators under the PDO and Intermediate Results can be added depending on the project.
Results Framework – USAID
The United States Agency for International Development (USAID) has developed a results framework to
help its project managers identify and focus on key objectives within a complex development
environment.
As per USAID (2010), a person looking at this framework ‘should be able to understand the basic theory
for how key program objectives will be achieved.’ The three main definitions used in creating this
framework are as follows (USAID, 2010):

36 | P a g e
An Assistance Objective (AO) is the most ambitious result (intended measurable change) that a
USAID Mission/Office, along with its partners, can materially affect, and for which it is willing to
be held accountable.
An Intermediate Result (IR) is an important result that is seen as an essential step to achieving a
final result or outcome; it is a measurable result that may capture a number of discrete and
more specific results.
A Critical Assumption is a general condition under which the development hypothesis will hold
true. Critical assumptions are outside the control or influence of USAID and its partners (in other
words, they are not results), but they reflect conditions that are likely to affect the achievement
of results in the Results Framework. Critical assumptions may also be expressed as risks or
vulnerabilities
The structure for the results framework used by the USAID is presented below in Figure 15. In addition
to having the aforementioned three elements, this framework also assigns responsibilities for various
lower level Intermediate Results (IRs) to USAID and/or its partners.
Figure 15: Structure of Results Framework used by USAID
Source: USAID Performance Monitoring & Evaluation TIPS – Building a Results Framework, 2010

37 | P a g e
5.5. Project Management Techniques After an organization has undertaken the logical framework approach and produced the log frame
matrix for a particular project, the next step usually involve operationalizing the same by undertaking
project scheduling using Gantt charts, network analysis; budgeting; resource planning; fixing
responsibilities; and establishing monitoring and evaluation systems.
5.5.1. Gantt Chart
A Gantt Chart is a graphical representation, most often a horizontal bar chart, showing different project
activities and tasks in sequential order with bars, which represent the estimated time required to
complete them. The chart depicts the time relationship of activities, tasks, milestones and resources
involved in a project and most importantly, it is flexible document which is updated regularly through
the life of the project (Tasmanian Government, 2008).
Needleman (1993) gives a brief description of how a Gantt Chart is prepared. The project is first broken
down into various tasks and subtasks and these are placed on a timeline. Thereafter, each task is
assigned a start date, duration, and end date, and perhaps also the various resources attached to it such
as specific personnel, a budget, equipment, facilities, and support services. For the purpose of
presentation, the tasks are represented in horizontal bars (or boxes) against a vertical time scale,
resulting in a Gantt Chart. The main utility of such a chart is for planning and scheduling a project and
subsequently for monitoring the progress of the project against the base timeline.
A Gantt Chart is a relatively easy to prepare graphical representation of when project activities are
scheduled to take place; however, this simplistic tool is unable to indicate details regarding the progress
of activities and also unable to consider interdependencies between various activities.
5.5.2. Network Analysis
Network Analysis refers to methods used for planning, managing and controlling projects. Two methods
often included under network analysis are the Critical Path Analysis (CPA) and Programme Evaluation
and Technique Review (PERT) Analysis.
Critical Path Analysis (CPA)
Critical Path Analysis (CPA) (also known as the Critical Path Method (CPM)) is a ‘mathematically based
algorithm for scheduling a set of project activities’ (Santiago and Magallon, 2009).
This analysis is an extension of the Gantt Chart wherein projects are divided into individual tasks or
activities, which might either, be interdependent or independent of each other and the times for various
job durations and completion differ significantly (Stelth and Roy, 2008). The analysis helps to identify the
‘critical path’ i.e. the path of project activities which would take the longest duration and the activities
on this path are called the ‘critical activities’, implying that only if these activities are completed as
scheduled, can the project be completed as scheduled.

38 | P a g e
A CPA enables decision makers and those involved in the implementation of a project to identify the
best estimates of the time needed to complete the project and also helps in identifying any alternate
paths or plans which can be undertaken to reduce the interruption and hurdles that may arise during
the execution of various tasks of the project (Stelth and Roy, 2008).
The analysis consists of three different phases: Planning, Scheduling and Controlling. These three phases
have been outlined in a document of the Centre for Financial and Management Studies at the University
of London (2011) as follows:
Planning Phase – This phase clarifies the objective of the project and the arrangement of project
tasks into an order of precedence. While some tasks in this phase will be carried out in parallel,
others will be carried out in series.
Scheduling Phase – This phase develops from the planning phase and converts the plan into a
feasible and readily implemented schedule, having analysed the path with reference to the
optimum use of available resources such as time, human resources and equipment.
Control Phase – This develops from the scheduling phase and allows actual progress to be
monitored and corrections to be made to ensure adherence to the schedule or modified
schedule.
Programme Evaluation and Review Technique (PERT) Analysis
A PERT Analysis is similar to CPA; however its distinguishing feature is that it takes into account
uncertainties i.e. it uses probabilistic time estimates for various project activities. When this tool is used,
estimates have to be made of an optimistic or shortest possible time under most favourable conditions,
the ‘most likely’ time under ‘normal’ conditions and a pessimistic or longest time taken under most
unfavourable conditions to complete each activity; this, in turn reduces the bias which tends to assume
to the shortest possible times for completion of various project activities.
Tools available in Microsoft Project can be used to undertake CPA and PERT analyses.
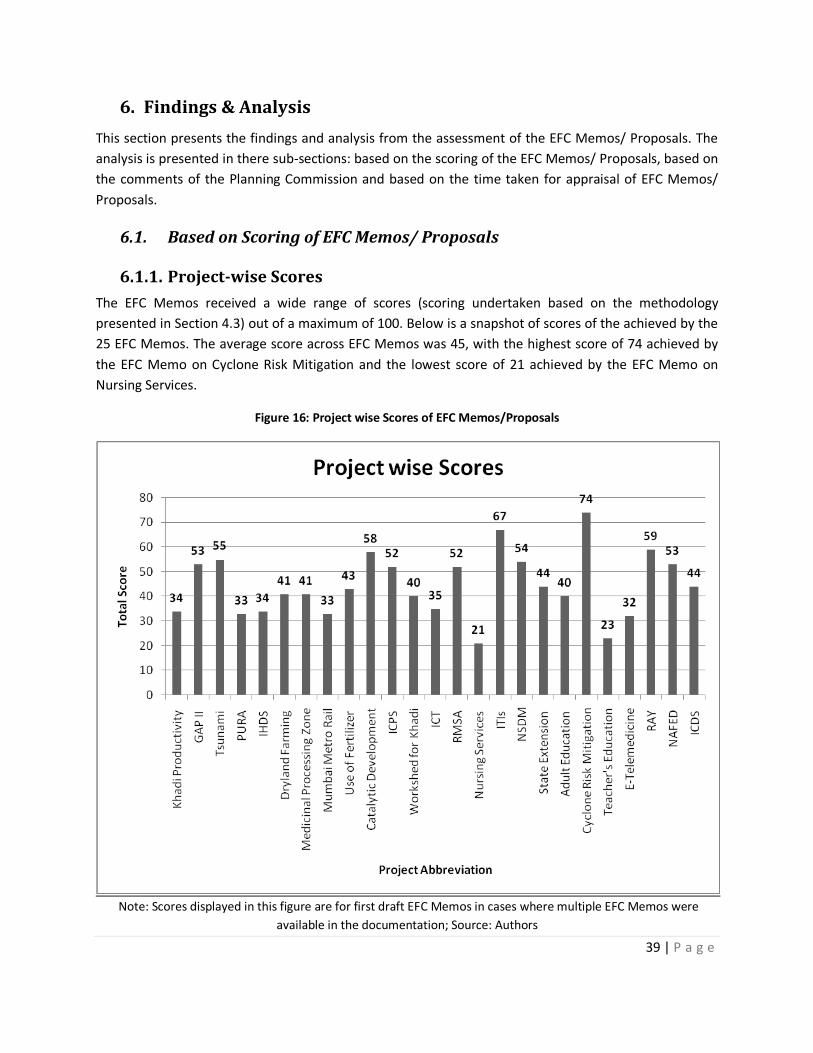
39 | P a g e
6. Findings & Analysis
This section presents the findings and analysis from the assessment of the EFC Memos/ Proposals. The
analysis is presented in there sub-sections: based on the scoring of the EFC Memos/ Proposals, based on
the comments of the Planning Commission and based on the time taken for appraisal of EFC Memos/
Proposals.
6.1. Based on Scoring of EFC Memos/ Proposals
6.1.1. Project-wise Scores
The EFC Memos received a wide range of scores (scoring undertaken based on the methodology
presented in Section 4.3) out of a maximum of 100. Below is a snapshot of scores of the achieved by the
25 EFC Memos. The average score across EFC Memos was 45, with the highest score of 74 achieved by
the EFC Memo on Cyclone Risk Mitigation and the lowest score of 21 achieved by the EFC Memo on
Nursing Services.
Figure 16: Project wise Scores of EFC Memos/Proposals
Note: Scores displayed in this figure are for first draft EFC Memos in cases where multiple EFC Memos were
available in the documentation; Source: Authors

40 | P a g e
6.1.2. Trend in Scores across Years
To understand the trend in scores of EFC Memos drafted in different years, the scores achieved by the
EFC Memos across years (2006 to 2011) were considered. It was observed that the while the average
score reduced from 2006 to 2007, an upward trend in the average score was observed from 2007 to
2011, wherein the average increased from 42 to 49.
The highest score showed a gradual rise from 2006 to 2010 but a drastic fall from 2010 to 2011.
However, the trend of the lowest score was observed to be U-shaped, decreasing from 34 to 21 from
2006 to 2008 and then rising up to 44 in 2011.
Figure 17: Year wise Scores of EFC Memos/Proposals
Note: Scores displayed in this figure are for first draft EFC Memos in cases where multiple EFC Memos were
available in the documentation; Source: Authors
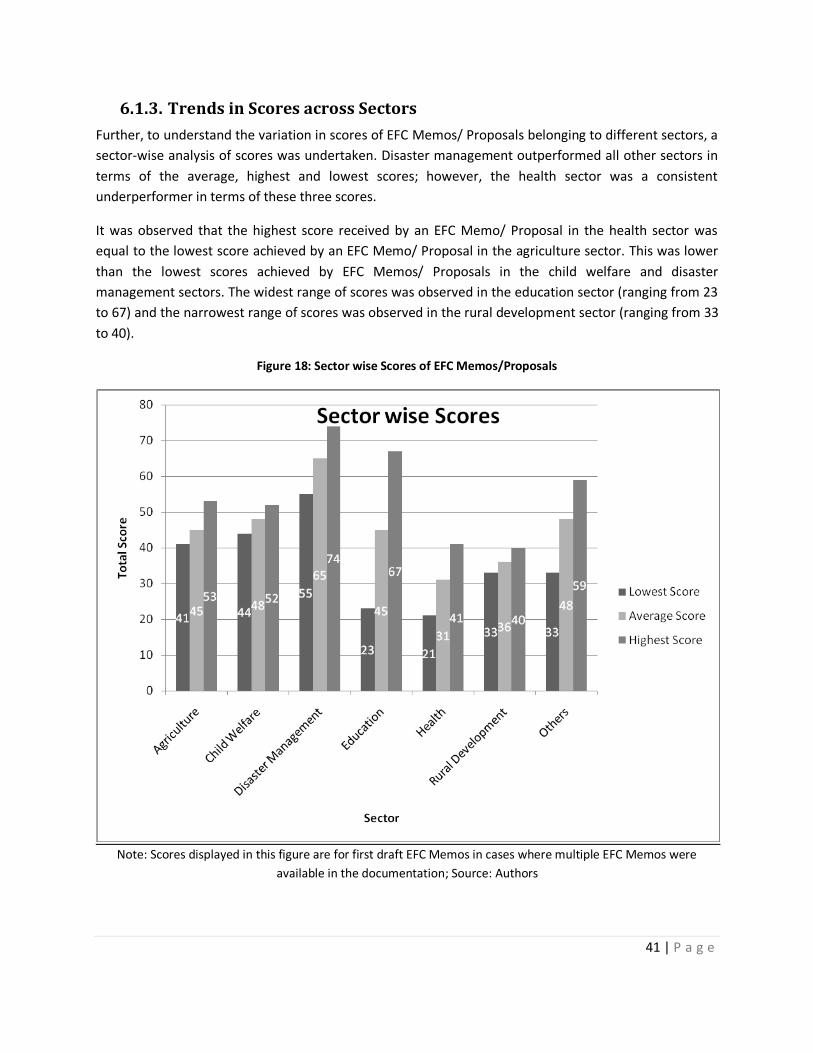
41 | P a g e
6.1.3. Trends in Scores across Sectors
Further, to understand the variation in scores of EFC Memos/ Proposals belonging to different sectors, a
sector-wise analysis of scores was undertaken. Disaster management outperformed all other sectors in
terms of the average, highest and lowest scores; however, the health sector was a consistent
underperformer in terms of these three scores.
It was observed that the highest score received by an EFC Memo/ Proposal in the health sector was
equal to the lowest score achieved by an EFC Memo/ Proposal in the agriculture sector. This was lower
than the lowest scores achieved by EFC Memos/ Proposals in the child welfare and disaster
management sectors. The widest range of scores was observed in the education sector (ranging from 23
to 67) and the narrowest range of scores was observed in the rural development sector (ranging from 33
to 40).
Figure 18: Sector wise Scores of EFC Memos/Proposals
Note: Scores displayed in this figure are for first draft EFC Memos in cases where multiple EFC Memos were
available in the documentation; Source: Authors
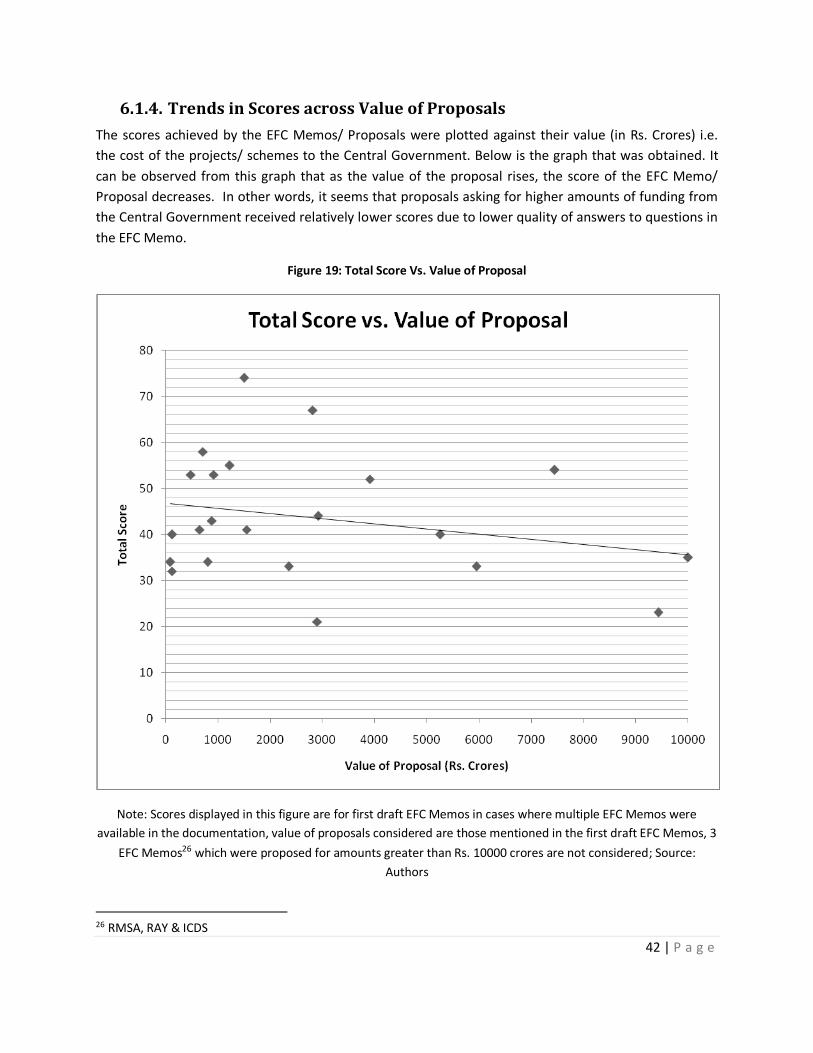
42 | P a g e
6.1.4. Trends in Scores across Value of Proposals
The scores achieved by the EFC Memos/ Proposals were plotted against their value (in Rs. Crores) i.e.
the cost of the projects/ schemes to the Central Government. Below is the graph that was obtained. It
can be observed from this graph that as the value of the proposal rises, the score of the EFC Memo/
Proposal decreases. In other words, it seems that proposals asking for higher amounts of funding from
the Central Government received relatively lower scores due to lower quality of answers to questions in
the EFC Memo.
Figure 19: Total Score Vs. Value of Proposal
Note: Scores displayed in this figure are for first draft EFC Memos in cases where multiple EFC Memos were
available in the documentation, value of proposals considered are those mentioned in the first draft EFC Memos, 3
EFC Memos26 which were proposed for amounts greater than Rs. 10000 crores are not considered; Source:
Authors
26 RMSA, RAY & ICDS
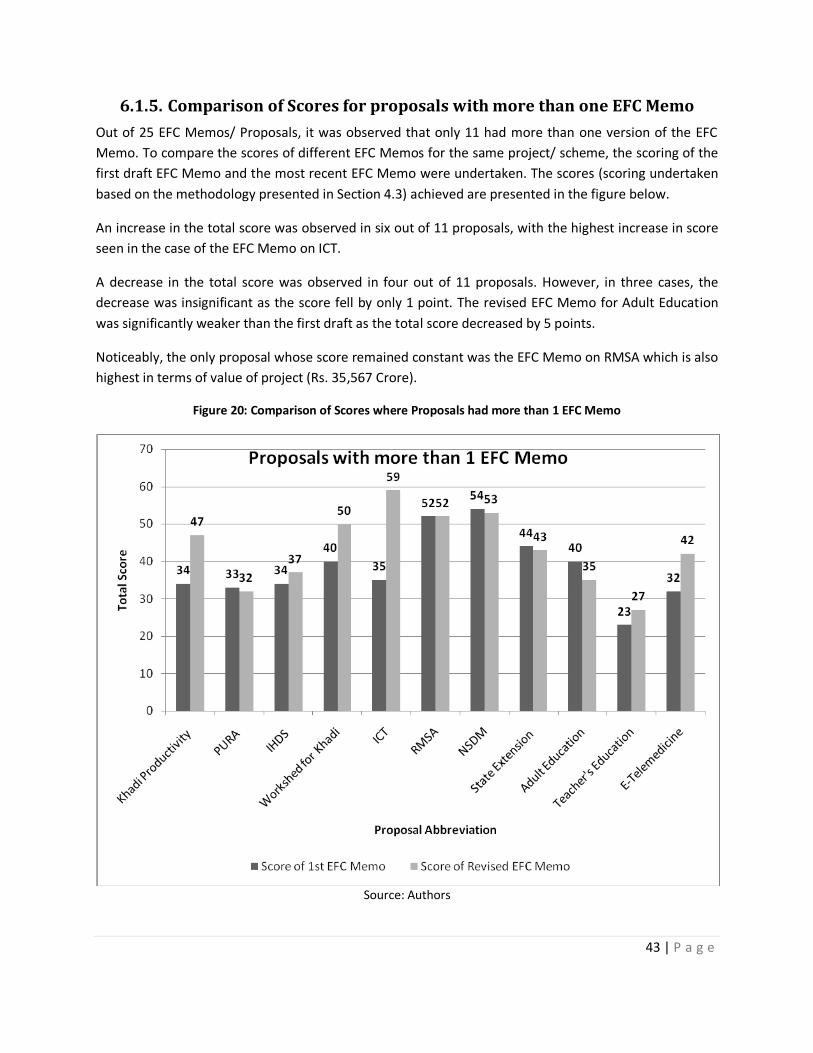
43 | P a g e
6.1.5. Comparison of Scores for proposals with more than one EFC Memo
Out of 25 EFC Memos/ Proposals, it was observed that only 11 had more than one version of the EFC
Memo. To compare the scores of different EFC Memos for the same project/ scheme, the scoring of the
first draft EFC Memo and the most recent EFC Memo were undertaken. The scores (scoring undertaken
based on the methodology presented in Section 4.3) achieved are presented in the figure below.
An increase in the total score was observed in six out of 11 proposals, with the highest increase in score
seen in the case of the EFC Memo on ICT.
A decrease in the total score was observed in four out of 11 proposals. However, in three cases, the
decrease was insignificant as the score fell by only 1 point. The revised EFC Memo for Adult Education
was significantly weaker than the first draft as the total score decreased by 5 points.
Noticeably, the only proposal whose score remained constant was the EFC Memo on RMSA which is also
highest in terms of value of project (Rs. 35,567 Crore).
Figure 20: Comparison of Scores where Proposals had more than 1 EFC Memo
Source: Authors
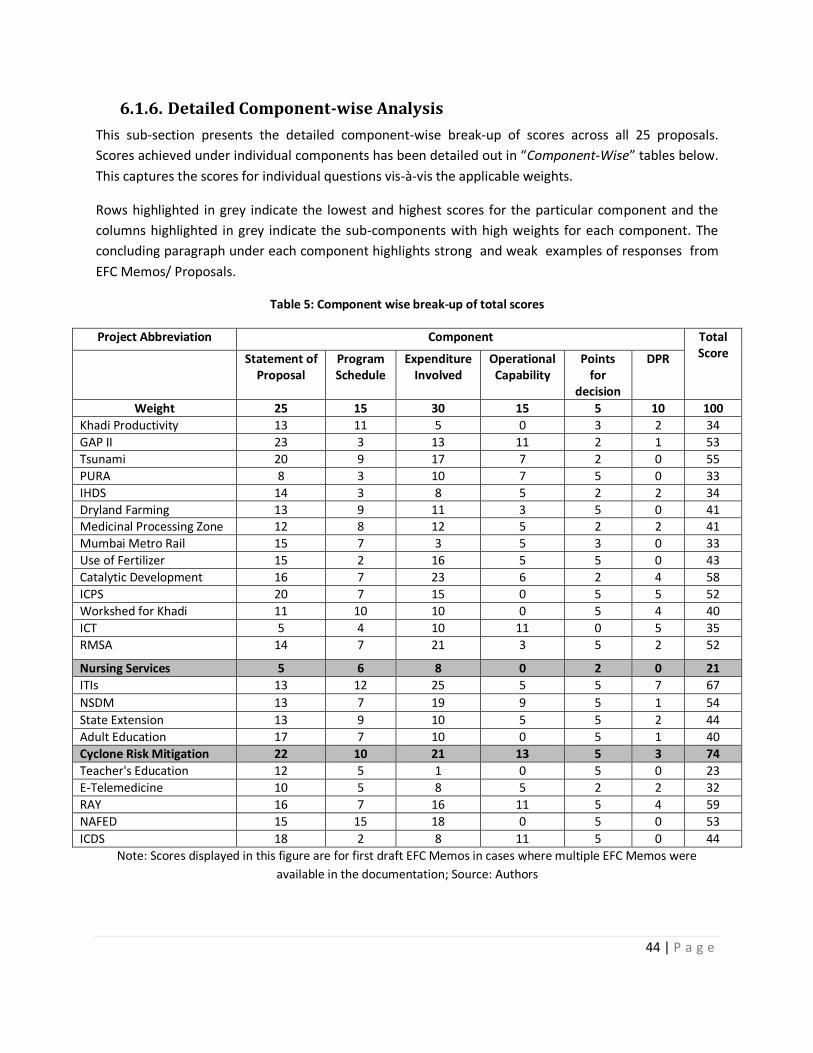
44 | P a g e
6.1.6. Detailed Component-wise Analysis
This sub-section presents the detailed component-wise break-up of scores across all 25 proposals.
Scores achieved under individual components has been detailed out in “Component-Wise” tables below.
This captures the scores for individual questions vis-à-vis the applicable weights.
Rows highlighted in grey indicate the lowest and highest scores for the particular component and the
columns highlighted in grey indicate the sub-components with high weights for each component. The
concluding paragraph under each component highlights strong and weak examples of responses from
EFC Memos/ Proposals.
Table 5: Component wise break-up of total scores
Project Abbreviation Component Total Score Statement of
Proposal Program Schedule
Expenditure Involved
Operational Capability
Points for
decision
DPR
Weight 25 15 30 15 5 10 100
Khadi Productivity 13 11 5 0 3 2 34
GAP II 23 3 13 11 2 1 53
Tsunami 20 9 17 7 2 0 55
PURA 8 3 10 7 5 0 33
IHDS 14 3 8 5 2 2 34
Dryland Farming 13 9 11 3 5 0 41 Medicinal Processing Zone 12 8 12 5 2 2 41
Mumbai Metro Rail 15 7 3 5 3 0 33
Use of Fertilizer 15 2 16 5 5 0 43
Catalytic Development 16 7 23 6 2 4 58
ICPS 20 7 15 0 5 5 52
Workshed for Khadi 11 10 10 0 5 4 40
ICT 5 4 10 11 0 5 35
RMSA 14 7 21 3 5 2 52
Nursing Services 5 6 8 0 2 0 21
ITIs 13 12 25 5 5 7 67
NSDM 13 7 19 9 5 1 54
State Extension 13 9 10 5 5 2 44
Adult Education 17 7 10 0 5 1 40
Cyclone Risk Mitigation 22 10 21 13 5 3 74
Teacher's Education 12 5 1 0 5 0 23
E-Telemedicine 10 5 8 5 2 2 32
RAY 16 7 16 11 5 4 59
NAFED 15 15 18 0 5 0 53
ICDS 18 2 8 11 5 0 44
Note: Scores displayed in this figure are for first draft EFC Memos in cases where multiple EFC Memos were
available in the documentation; Source: Authors

45 | P a g e
Statement of Proposal
Scoring for the component; ‘Statement of Proposal ‘was done by way of assessing 7 questions as part of
EFC Memo format. A description of the questions along with the question numbers and the weights
associated for the same is available in the table below. The total weight assigned to this component was
25 and the scores achieved by EFC Memos ranged between 5 and 23 with the average being 14.
Twelve out of 25 EFC Memos scored at least 60 percent (score of 15 or above) under this component.
Table 6: Break-up of 'Statement of Proposal' Component
Project Abbreviation
Nature of Scheme
Type of Proposal
Reasons and
Justification
Location Inclusion in the FYP
Estimated Yield
Outcomes, Outputs
Total
Question No. 2a 2c 2d 2e 2f 2g 2l -
Weight 2 1 7 3 2 3 7 25
Khadi Productivity 1 0 0 2 2 1 7 13 GAP II 2 1 5 3 2 3 7 23
Tsunami 1 1 7 3 0 3 5 20
PURA 1 1 1 2 2 1 0 8
IHDS 1 1 6 1 2 3 0 14
Dryland Farming 1 1 7 3 2 1 0 15
Medicinal Processing Zone
1 1 5 0 2 3 0 12
Mumbai Metro Rail
0 1 6 3 2 3 0 15
Use of Fertilizer 1 1 6 2 2 3 0 15
Catalytic Development
1 1 5 2 2 2 3 16
ICPS 1 1 6 3 2 2 5 20
Workshed for Khadi
2 1 5 0 2 0 1 11
ICT 1 0 3 0 0 0 1 5
RMSA 1 0 4 0 2 2 5 14
Nursing Services 0 1 4 0 0 0 0 5
ITIs 1 0 4 2 2 2 2 13
NSDM 1 1 2 2 0 2 5 13
State Extension 1 1 5 1 2 3 0 13
Adult Education 1 1 7 2 2 3 1 17
Cyclone Risk Mitigation
1 1 7 3 2 3 5 22
Teacher's Education
1 1 5 0 2 1 2 12
E-Telemedicine 1 1 4 0 2 2 0 10
RAY 1 1 5 0 2 2 5 16 NAFED 1 1 7 3 2 1 0 15
ICDS 2 1 5 0 2 3 5 18
Note: Scores displayed in this figure are for first draft EFC Memos in cases where multiple EFC Memos were
available in the documentation; Source: Authors
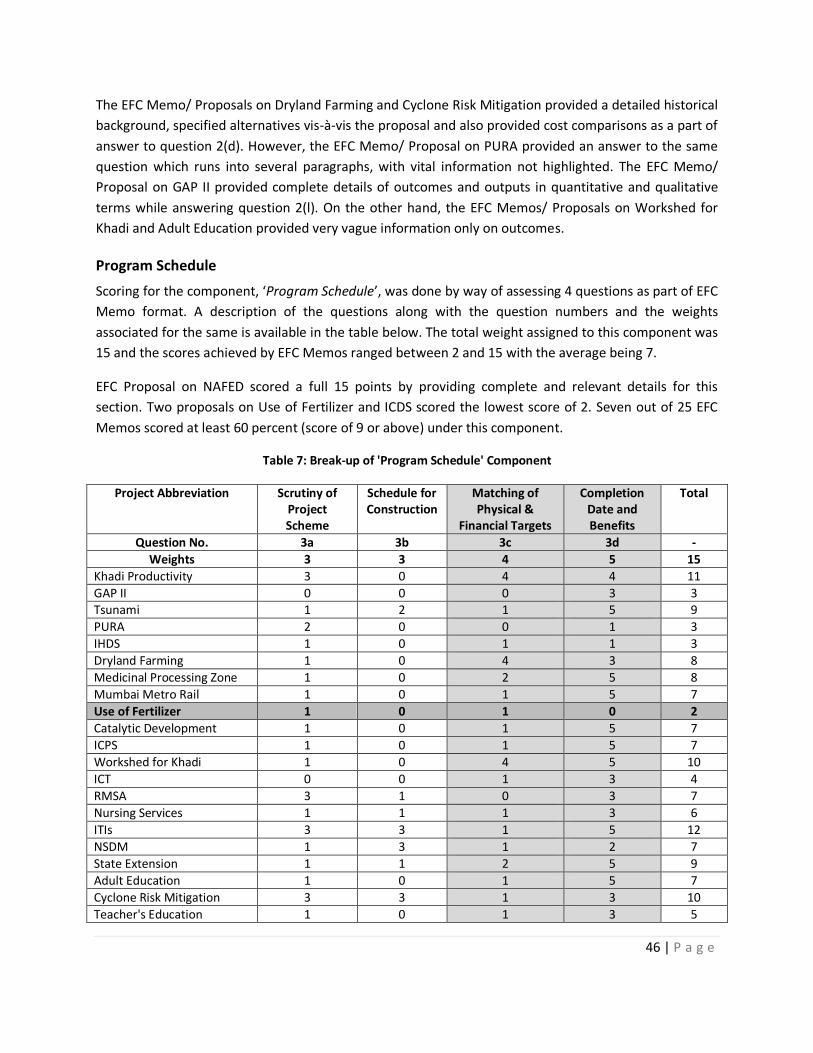
46 | P a g e
The EFC Memo/ Proposals on Dryland Farming and Cyclone Risk Mitigation provided a detailed historical
background, specified alternatives vis-à-vis the proposal and also provided cost comparisons as a part of
answer to question 2(d). However, the EFC Memo/ Proposal on PURA provided an answer to the same
question which runs into several paragraphs, with vital information not highlighted. The EFC Memo/
Proposal on GAP II provided complete details of outcomes and outputs in quantitative and qualitative
terms while answering question 2(l). On the other hand, the EFC Memos/ Proposals on Workshed for
Khadi and Adult Education provided very vague information only on outcomes.
Program Schedule
Scoring for the component, ‘Program Schedule’, was done by way of assessing 4 questions as part of EFC
Memo format. A description of the questions along with the question numbers and the weights
associated for the same is available in the table below. The total weight assigned to this component was
15 and the scores achieved by EFC Memos ranged between 2 and 15 with the average being 7.
EFC Proposal on NAFED scored a full 15 points by providing complete and relevant details for this
section. Two proposals on Use of Fertilizer and ICDS scored the lowest score of 2. Seven out of 25 EFC
Memos scored at least 60 percent (score of 9 or above) under this component.
Table 7: Break-up of 'Program Schedule' Component
Project Abbreviation Scrutiny of Project Scheme
Schedule for Construction
Matching of Physical &
Financial Targets
Completion Date and Benefits
Total
Question No. 3a 3b 3c 3d -
Weights 3 3 4 5 15
Khadi Productivity 3 0 4 4 11
GAP II 0 0 0 3 3 Tsunami 1 2 1 5 9
PURA 2 0 0 1 3
IHDS 1 0 1 1 3
Dryland Farming 1 0 4 3 8
Medicinal Processing Zone 1 0 2 5 8
Mumbai Metro Rail 1 0 1 5 7
Use of Fertilizer 1 0 1 0 2
Catalytic Development 1 0 1 5 7
ICPS 1 0 1 5 7
Workshed for Khadi 1 0 4 5 10
ICT 0 0 1 3 4
RMSA 3 1 0 3 7
Nursing Services 1 1 1 3 6
ITIs 3 3 1 5 12
NSDM 1 3 1 2 7
State Extension 1 1 2 5 9
Adult Education 1 0 1 5 7
Cyclone Risk Mitigation 3 3 1 3 10
Teacher's Education 1 0 1 3 5

47 | P a g e
Project Abbreviation Scrutiny of Project Scheme
Schedule for Construction
Matching of Physical &
Financial Targets
Completion Date and Benefits
Total
E-Telemedicine 3 0 0 2 5
RAY 3 0 1 3 7
NAFED 3 3 4 5 15
ICDS 0 1 1 0 2
Note: Scores displayed in this figure are for first draft EFC Memos in cases where multiple EFC Memos were
available in the documentation; Source: Authors
The EFC Memo/ Proposal on Dryland Farming was one of the only which provided year-wise as well as
component-wise physical and financial targets in a tabular format, while answering question 3(c).
Expenditure Involved and Reliability of Cost Estimates
Scoring for this component, ‘Expenditure Involved’, was done by way of assessing 5 questions as part of
EFC Memo format. A description of the questions along with the question numbers and the weights
associated for the same is available in the table below. The total weight assigned to this component was
30 and the scores achieved by EFC Memos ranged between 1 and 25 with the average being 13.
6 out of 25 EFC Memos scored at least 60 percent (score of 18 or above) under this component.
Table 8: Break-up of 'Expenditure Involved and Reliability of Cost Estimates' Component
Project Abbreviation Total Expenditure (RC& NRC)
Other Financial
obligations
Phasing of Expenditure
Reference Date and
Basis
Pre-Project Investigations
Total
Question No. 4a 4b 4d 4e 5a - Weights 10 2 8 6 4 30
Khadi Productivity 5 0 0 0 0 5
GAP II 10 0 0 1 2 13
Tsunami 5 0 6 6 0 17
PURA 5 1 4 0 0 10
IHDS 5 2 0 0 1 8
Dryland Farming 10 0 0 3 2 15
Medicinal Processing Zone 5 0 4 3 0 12
Mumbai Metro Rail 0 2 0 0 1 3
Use of Fertilizer 10 0 6 0 0 16
Catalytic Development 8 2 8 3 2 23
ICPS 10 1 0 4 0 15
Workshed for Khadi 10 0 0 0 0 10
ICT 10 0 0 0 0 10
RMSA 10 2 6 0 3 21
Nursing Services 1 0 6 0 1 8
ITIs 10 2 8 3 2 25
NSDM 10 0 6 3 0 19 State Extension 3 0 6 0 1 10
Adult Education 10 0 0 0 0 10
Cyclone Risk Mitigation 10 0 6 3 2 21

48 | P a g e
Project Abbreviation Total Expenditure (RC& NRC)
Other Financial
obligations
Phasing of Expenditure
Reference Date and
Basis
Pre-Project Investigations
Total
Teacher's Education 1 0 0 0 0 1
E-Telemedicine 5 0 3 0 0 8
RAY 3 0 6 4 3 16
NAFED 10 2 6 0 0 18
ICDS 8 0 0 0 0 8 Note: Scores displayed in this figure are for first draft EFC Memos in cases where multiple EFC Memos were
available in the documentation; Source: Authors
Out of all the components, the ‘Expenditure Involved’ component carried the highest weighting of 30,
hence, the scores for this component was plotted against the values of the proposals to observe a trend,
if any. It appears that the score for this component decreases as the value of the proposal increases.
This implies that for projects involving larger costs, the quality of responses in the EFC Memo format to
questions relating to expenditure weakened.
Figure 21: Score for ‘Expenditure Involved’ Component Vs. Value of Proposal
Note: Scores displayed in this figure are for first draft EFC Memos in cases where multiple EFC Memos were
available in the documentation, value of proposals considered are those mentioned in the first draft EFC Memos, 3
EFC Memos27 which were proposed for amounts greater than Rs. 10000 crores are not considered; Source:
Authors
27 RMSA, RAY & ICDS

49 | P a g e
While answering question 4(a), the EFC Memo/ Proposal on RMSA drew references to various annexures
wherein complete cost details were provided. However, the EFC Memo/ Proposal on Teachers’
Education provided only the total project approved costs without any details of year wise and
component wise expenses while answering the same question. The EFC Memos/ Proposals on Catalytic
Development and ITIs provided year-wise phasing of expenditure for various programmes under the
schemes while answering question 4(d); however, the EFC Memo/ Proposal on E-Telemedicine provided
an aggregate-level of phasing of only recurring expenditure.
Operational Capability
Scoring for the component, ‘Operational Capability’, was done by way of assessing 1 question as part of
EFC Memo format. A description of the question along with the question number and the weights
associated for the same is available in the table below. The total weight assigned to this component was
15 and the scores achieved by EFC Memos ranged between 0 and 13 with the average being 5.
Six out of 25 EFC Memos scored at least 60 percent (score of 9 or above) under this component.
However, 7 out of 25 EFC Proposals had not answered the question on ‘Operational Capability’.
Table 9: Break-up of ‘Operational Capability' Component
Project Abbreviation Operational Capability Total
Question No. 6a -
Weights 15 15
Khadi Productivity 0 0
GAP II 11 11
Tsunami 7 7
PURA 7 7
IHDS 5 5
Dryland Farming 3 3
Medicinal Processing Zone 5 5
Mumbai Metro Rail 5 5
Use of Fertilizer 5 5
Catalytic Development 6 6 ICPS 0 0
Workshed for Khadi 0 0
ICT 11 11
RMSA 3 3
Nursing Services 0 0
ITIs 5 5
NSDM 9 9
State Extension 5 5
Adult Education 0 0
Cyclone Risk Mitigation 13 13
Teacher's Education 0 0
E-Telemedicine 5 5
RAY 11 11

50 | P a g e
Project Abbreviation Operational Capability Total
NAFED 0 0
ICDS 11 11
Note: Scores displayed in this figure are for first draft EFC Memos in cases where multiple EFC Memos were
available in the documentation; Source: Authors
The EFC Memo/ Proposal on Cyclone Risk Mitigation provided details including track record, agencies
and future plans to establish capacity. Further, implementation arrangements were also annexed and
responsibilities of various units to be set-up were mentioned while answering question 6(a). However,
EFC Memos/ Proposal on Dryland Farming merely identified the agencies that would be involved in the
implementation of the scheme. Further, the EFC Memo/ Proposal on RMSA gave a vague answer mainly
stating, “The capacity of the State Governments to implement the new scheme will be further enhanced
to institutional and policy reforms in order to make delivery system efficient, transparent and effective.”
Points for Decision
Scoring for the component; ‘Points for Decision’ was done by way of assessing 1 question as part of EFC
Memo format. A description of the question along with the question number and the weights associated
for the same is available in the table below. The total weight assigned to this component was 5 and the
scores achieved by EFC Memos ranged between 2 and 5.
Seven out of 25 proposals merely stated the total cost of project as the sole point on which decision had
to be taken in the EFC meeting. In other words, these proposals did not lay emphasis on other critical
aspects of project for decision making.
Table 10: Break-up of ‘Points for Decision' Component
Project Abbreviation Points for Decision Total
Question No 26 -
Weights 5 5 Khadi Productivity 3 3
GAP II 2 2
Tsunami 2 2
PURA 5 5
IHDS 2 2
Dryland Farming 5 5
Medicinal Processing Zone 2 2
Mumbai Metro Rail 3 3
Use of Fertilizer 5 5
Catalytic Development 2 2
ICPS 5 5
Workshed for Khadi 5 5
ICT 0 0
RMSA 5 5
Nursing Services 2 2
ITIs 5 5
NSDM 5 5

51 | P a g e
Project Abbreviation Points for Decision Total
State Extension 5 5
Adult Education 5 5
Cyclone Risk Mitigation 5 5
Teacher's Education 5 5
E-Telemedicine 2 2
RAY 5 5
NAFED 5 5
ICDS 5 5
Note: Scores displayed in this figure are for first draft EFC Memos in cases where multiple EFC Memos were
available in the documentation; EFC Memo on ICT received a score of zero as the page with the question was
missing from the document; Source: Authors
DPR (Detailed Project Report)
Scoring for the component; ‘DPR’ was done by way of assessing 4 aspects details for which are available
in the table below. The total weight assigned to this component was 10 and the scores achieved by EFC
Memos ranged between 0 and 5.
In 7 out of 25 Projects had nil scoring because either ‘DPR’ or ‘DPR like’ document was missing,
alternatively even if such a document was available, the same did not cover the four aspects below.
Table 11: Break-up of ‘DPR' Component
Project Abbreviation Legal Framework
Risk Analysis
Evaluation Sustainability Total
Question No. 6 13 14 17
Weights 2 2 3 3 10
Khadi Productivity 0 0 1 1 2
GAP II 0 0 0 1 1
Tsunami 0 0 0 0 0
PURA 0 0 0 0 0
IHDS 0 0 2 0 2
Dryland Farming 0 0 0 0 0
Medicinal Processing Zone 0 0 2 0 2
Mumbai Metro Rail 0 0 0 0 0
Use of Fertilizer 0 0 0 0 0
Catalytic Development 0 0 2 2 4
ICPS 2 0 2 1 5 Workshed for Khadi 0 0 2 2 4
ICT 0 0 2 3 5
RMSA 0 0 2 0 2
Nursing Services 0 0 0 0 0
ITIs 2 2 2 1 7
NSDM 0 0 0 1 1
State Extension 0 0 2 0 2
Adult Education 0 0 1 0 1
Cyclone Risk Mitigation 2 1 0 0 3
Teacher's Education 0 0 0 0 0

52 | P a g e
Project Abbreviation Legal Framework
Risk Analysis
Evaluation Sustainability Total
E-Telemedicine 0 0 0 2 2
RAY 1 0 2 1 4
NAFED 0 0 0 0 0
ICDS 0 0 0 0 0
Note: Scores displayed in this figure are for first draft EFC Memos in cases where multiple EFC Memos were
available in the documentation; Source: Authors
The DPR attached with the EFC Memo/Proposal on ITIs was the only one with complete details on Legal
Framework, Risk Analysis, Monitoring & Evaluation and partial details on Sustainability.
6.1.7. Sub-components with Nil Scores
Out of the total number of questions assessed as part of EFC Memo format, it was observed that certain
questions received nil scores either on account of the answer being irrelevant to question or on account
of question being omitted or the question being answered as ‘Not Applicable’ without any justification
for the same.
The below table indicates details of such questions along with their weights and the total number of
proposals where the scoring was Nil.
Table 12: Sub-Components with Nil Scores
Question No.
Details of Question Weight No. of Proposals that scored 0
Project Abbreviations
2 (d) Reasons and Justifications 7 1 Khadi Productivity
2 (l) Outcomes, Outputs 7 10 PURA, IHDS, Dryland Farming, Medicinal Processing Zone,
Mumbai Metro Rail, Use of Fertilizer, Nursing Services, State Extension, E-Telemedicine, NAFED
3 (d) Completion Date and Benefits
5 2 Use of Fertilizer, ICDS
4 (a) Total Expenditure (RC & NRC)
10 1 Mumbai Metro Rail
4 (d)
Phasing of Expenditure 8 11 Khadi Productivity, GAP II, IHDS, Dryland Farming, Mumbai Metro Rail, ICPS, Workshed for Khadi, ICT, Adult Education,
Teachers’ Education, ICDS
4 (e) Reference Date and Basis 6 15
Khadi Productivity, PURA, IHDS, Mumbai Metro Rail, Use of Fertilizer, Workshed for Khadi, ICT, RMSA, Nursing Services,
State Extension, Adult Education, Teachers’ Education, E-Telemedicine, NAFED, ICDS
6 (a) Operational Capabilities 15 7 Khadi Productivity, ICPS, Workshed for Khadi, Nursing Services,
Adult Education, Teachers’ Education, NAFED
Note: Scores displayed in this figure are for first draft EFC Memos in cases where multiple EFC Memos
were available in the documentation; Source: Authors
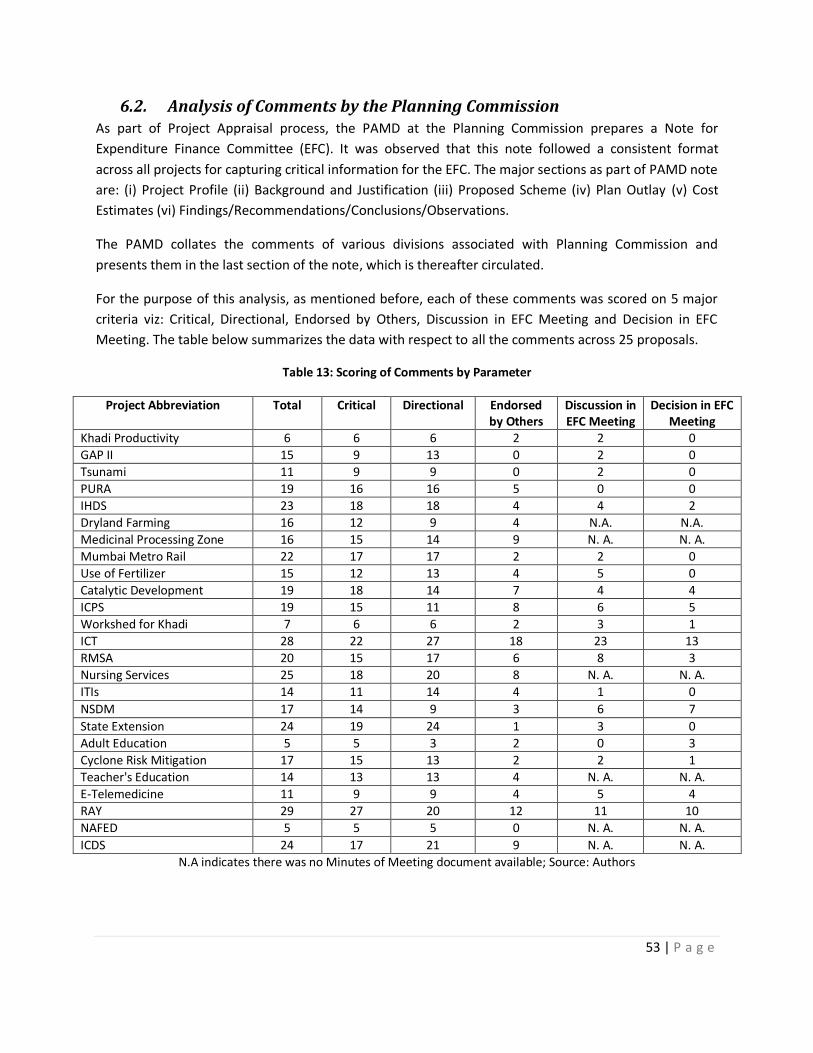
53 | P a g e
6.2. Analysis of Comments by the Planning Commission As part of Project Appraisal process, the PAMD at the Planning Commission prepares a Note for
Expenditure Finance Committee (EFC). It was observed that this note followed a consistent format
across all projects for capturing critical information for the EFC. The major sections as part of PAMD note
are: (i) Project Profile (ii) Background and Justification (iii) Proposed Scheme (iv) Plan Outlay (v) Cost
Estimates (vi) Findings/Recommendations/Conclusions/Observations.
The PAMD collates the comments of various divisions associated with Planning Commission and
presents them in the last section of the note, which is thereafter circulated.
For the purpose of this analysis, as mentioned before, each of these comments was scored on 5 major
criteria viz: Critical, Directional, Endorsed by Others, Discussion in EFC Meeting and Decision in EFC
Meeting. The table below summarizes the data with respect to all the comments across 25 proposals.
Table 13: Scoring of Comments by Parameter
Project Abbreviation Total Critical Directional Endorsed by Others
Discussion in EFC Meeting
Decision in EFC Meeting
Khadi Productivity 6 6 6 2 2 0
GAP II 15 9 13 0 2 0
Tsunami 11 9 9 0 2 0
PURA 19 16 16 5 0 0
IHDS 23 18 18 4 4 2
Dryland Farming 16 12 9 4 N.A. N.A.
Medicinal Processing Zone 16 15 14 9 N. A. N. A.
Mumbai Metro Rail 22 17 17 2 2 0
Use of Fertilizer 15 12 13 4 5 0
Catalytic Development 19 18 14 7 4 4
ICPS 19 15 11 8 6 5
Workshed for Khadi 7 6 6 2 3 1
ICT 28 22 27 18 23 13
RMSA 20 15 17 6 8 3
Nursing Services 25 18 20 8 N. A. N. A.
ITIs 14 11 14 4 1 0
NSDM 17 14 9 3 6 7
State Extension 24 19 24 1 3 0
Adult Education 5 5 3 2 0 3
Cyclone Risk Mitigation 17 15 13 2 2 1
Teacher's Education 14 13 13 4 N. A. N. A.
E-Telemedicine 11 9 9 4 5 4
RAY 29 27 20 12 11 10
NAFED 5 5 5 0 N. A. N. A.
ICDS 24 17 21 9 N. A. N. A.
N.A indicates there was no Minutes of Meeting document available; Source: Authors
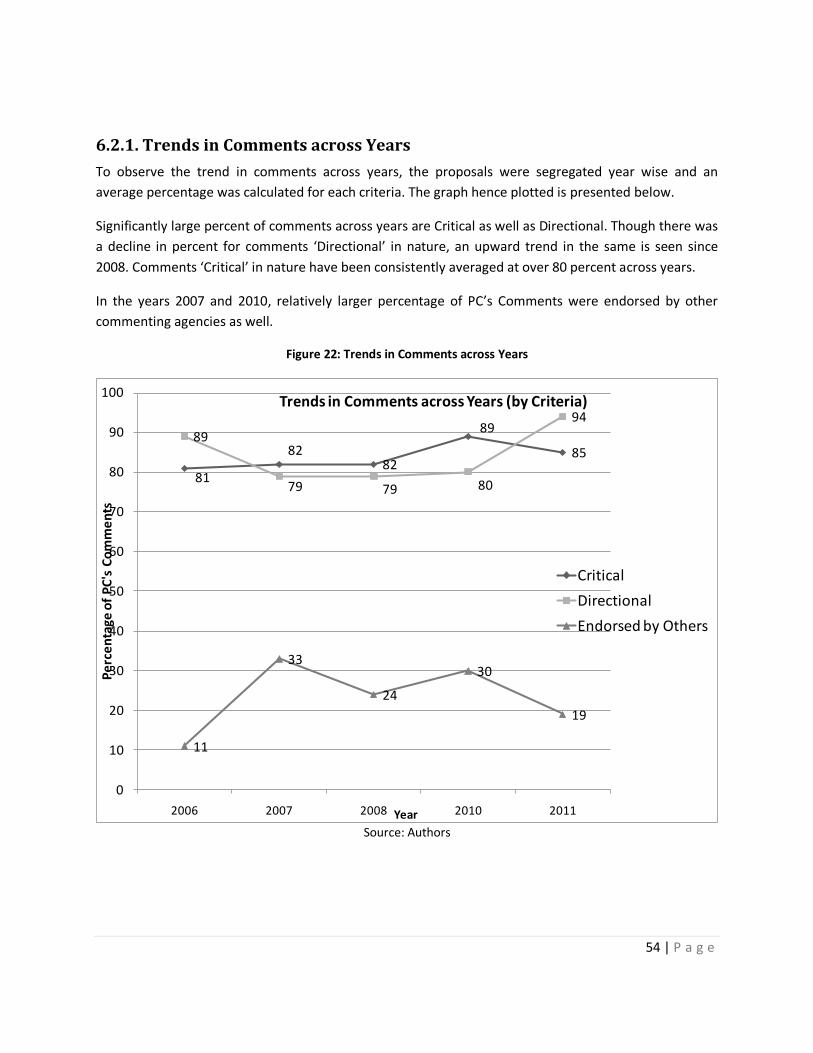
54 | P a g e
6.2.1. Trends in Comments across Years
To observe the trend in comments across years, the proposals were segregated year wise and an
average percentage was calculated for each criteria. The graph hence plotted is presented below.
Significantly large percent of comments across years are Critical as well as Directional. Though there was
a decline in percent for comments ‘Directional’ in nature, an upward trend in the same is seen since
2008. Comments ‘Critical’ in nature have been consistently averaged at over 80 percent across years.
In the years 2007 and 2010, relatively larger percentage of PC’s Comments were endorsed by other
commenting agencies as well.
Figure 22: Trends in Comments across Years
81
8282
89
8589
79 79 80
94
11
33
24
30
19
0
10
20
30
40
50
60
70
80
90
100
2006 2007 2008 2010 2011
Pe
rce
nta
ge o
f P
C's
Co
mm
en
ts
Year
Trends in Comments across Years (by Criteria)
Critical
Directional
Endorsed by Others
Source: Authors
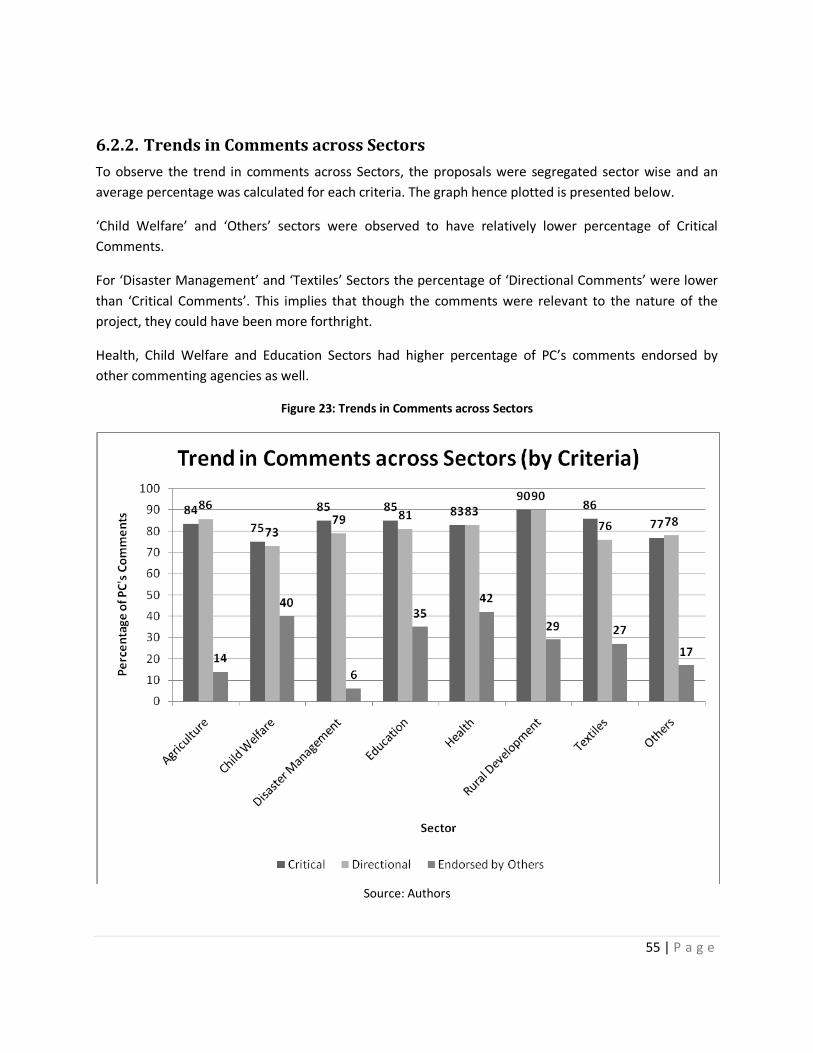
55 | P a g e
6.2.2. Trends in Comments across Sectors
To observe the trend in comments across Sectors, the proposals were segregated sector wise and an
average percentage was calculated for each criteria. The graph hence plotted is presented below.
‘Child Welfare’ and ‘Others’ sectors were observed to have relatively lower percentage of Critical
Comments.
For ‘Disaster Management’ and ‘Textiles’ Sectors the percentage of ‘Directional Comments’ were lower
than ‘Critical Comments’. This implies that though the comments were relevant to the nature of the
project, they could have been more forthright.
Health, Child Welfare and Education Sectors had higher percentage of PC’s comments endorsed by
other commenting agencies as well.
Figure 23: Trends in Comments across Sectors
Source: Authors
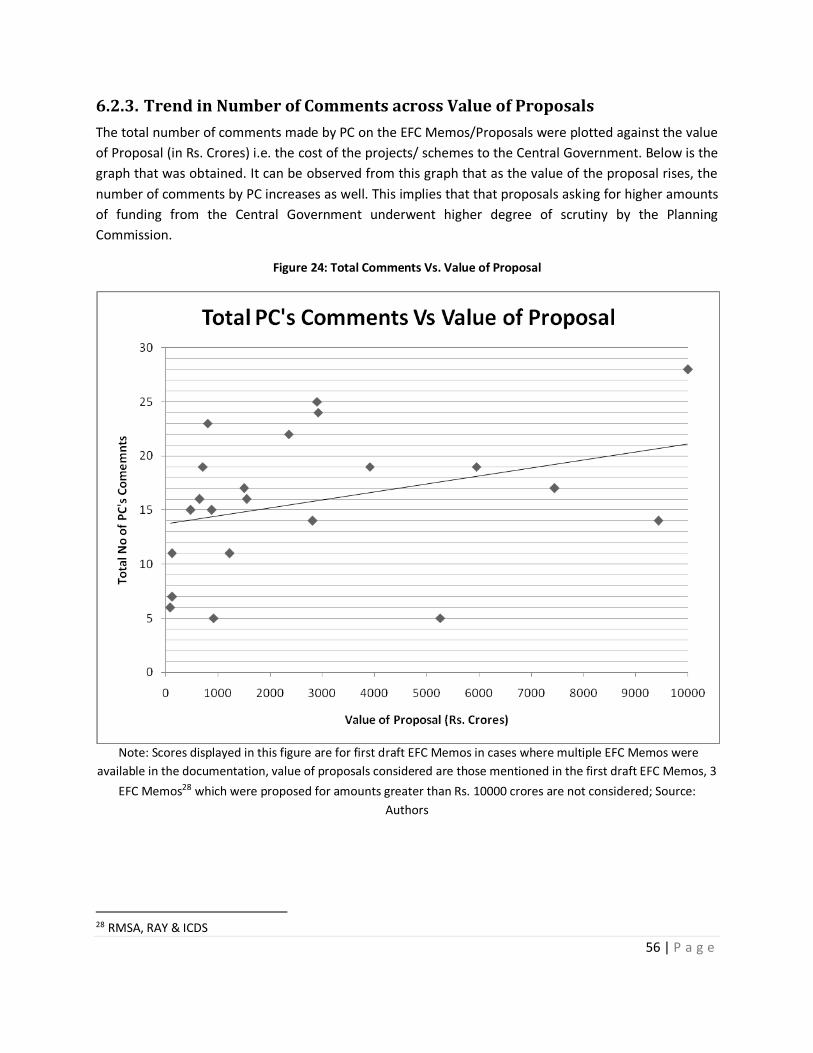
56 | P a g e
6.2.3. Trend in Number of Comments across Value of Proposals
The total number of comments made by PC on the EFC Memos/Proposals were plotted against the value
of Proposal (in Rs. Crores) i.e. the cost of the projects/ schemes to the Central Government. Below is the
graph that was obtained. It can be observed from this graph that as the value of the proposal rises, the
number of comments by PC increases as well. This implies that that proposals asking for higher amounts
of funding from the Central Government underwent higher degree of scrutiny by the Planning
Commission.
Figure 24: Total Comments Vs. Value of Proposal
Note: Scores displayed in this figure are for first draft EFC Memos in cases where multiple EFC Memos were
available in the documentation, value of proposals considered are those mentioned in the first draft EFC Memos, 3
EFC Memos28 which were proposed for amounts greater than Rs. 10000 crores are not considered; Source:
Authors
28 RMSA, RAY & ICDS
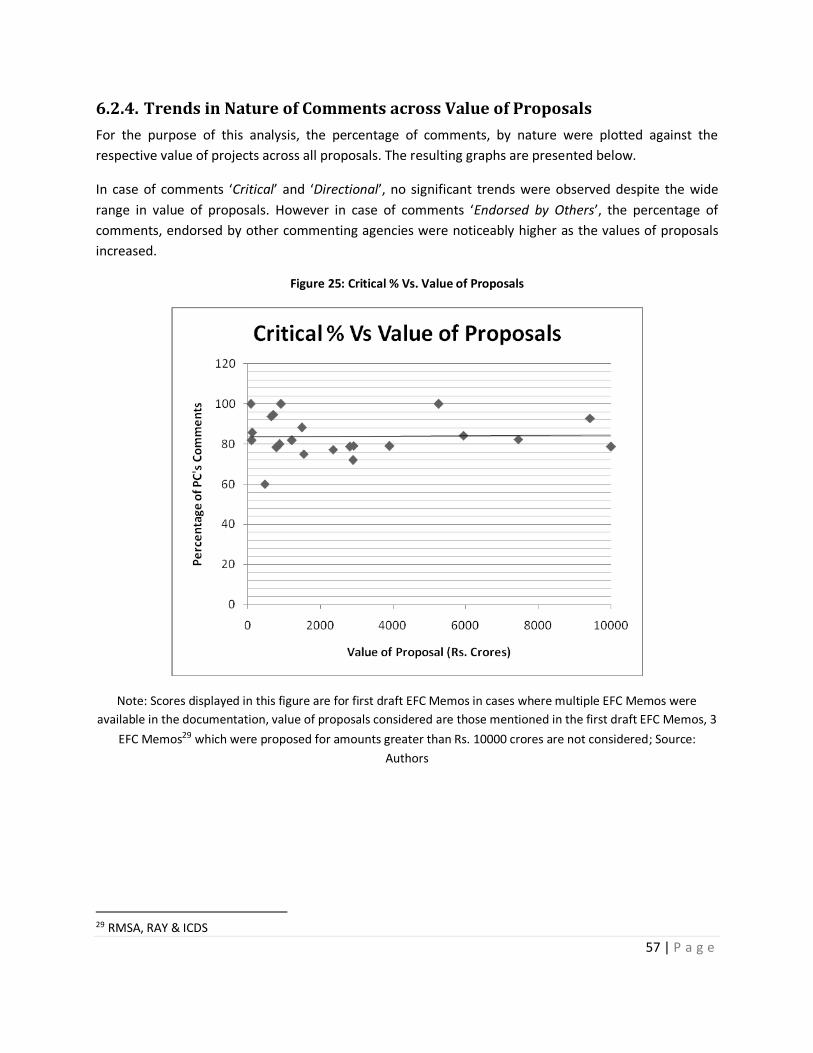
57 | P a g e
6.2.4. Trends in Nature of Comments across Value of Proposals
For the purpose of this analysis, the percentage of comments, by nature were plotted against the
respective value of projects across all proposals. The resulting graphs are presented below.
In case of comments ‘Critical’ and ‘Directional’, no significant trends were observed despite the wide
range in value of proposals. However in case of comments ‘Endorsed by Others’, the percentage of
comments, endorsed by other commenting agencies were noticeably higher as the values of proposals
increased.
Figure 25: Critical % Vs. Value of Proposals
Note: Scores displayed in this figure are for first draft EFC Memos in cases where multiple EFC Memos were
available in the documentation, value of proposals considered are those mentioned in the first draft EFC Memos, 3
EFC Memos29 which were proposed for amounts greater than Rs. 10000 crores are not considered; Source:
Authors
29 RMSA, RAY & ICDS
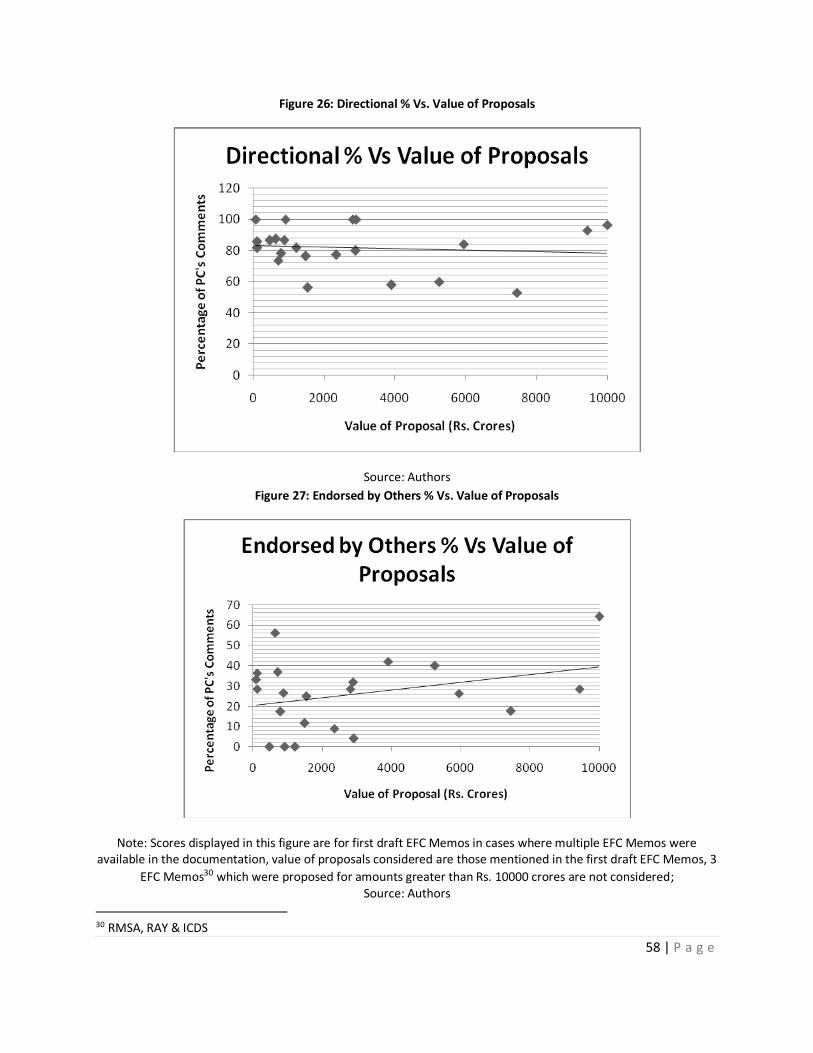
58 | P a g e
Figure 26: Directional % Vs. Value of Proposals
Source: Authors
Figure 27: Endorsed by Others % Vs. Value of Proposals
Note: Scores displayed in this figure are for first draft EFC Memos in cases where multiple EFC Memos were available in the documentation, value of proposals considered are those mentioned in the first draft EFC Memos, 3
EFC Memos30 which were proposed for amounts greater than Rs. 10000 crores are not considered; Source: Authors
30 RMSA, RAY & ICDS
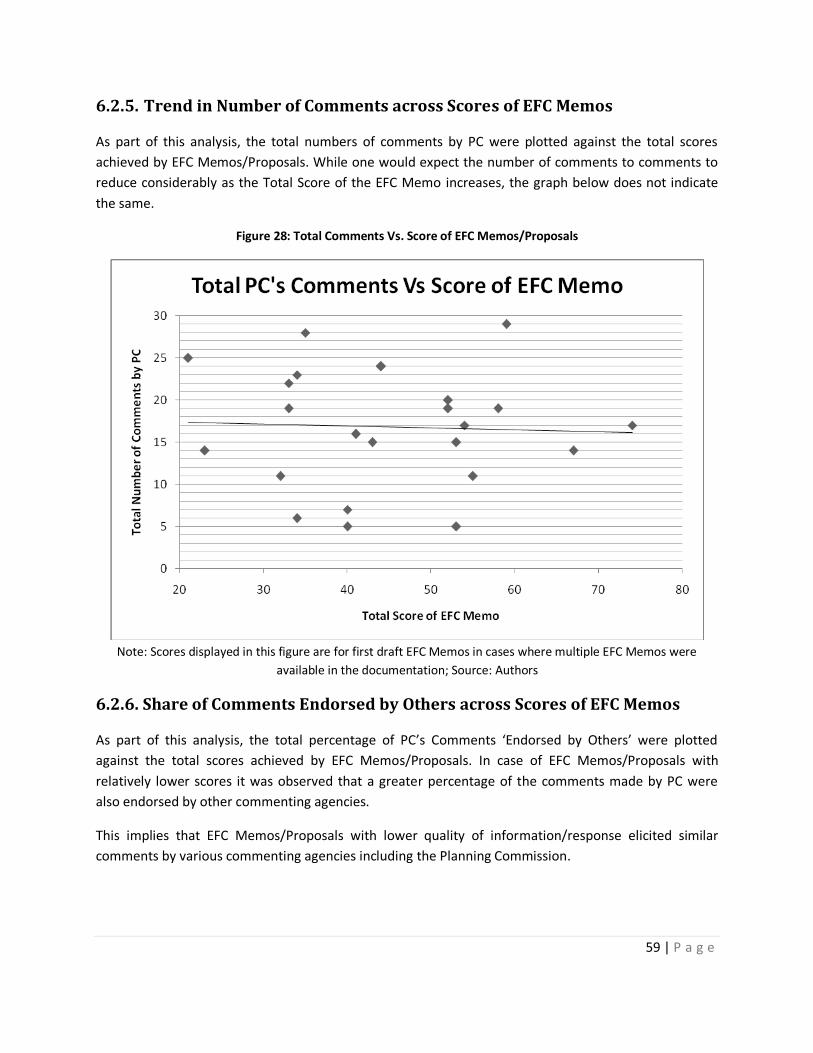
59 | P a g e
6.2.5. Trend in Number of Comments across Scores of EFC Memos
As part of this analysis, the total numbers of comments by PC were plotted against the total scores
achieved by EFC Memos/Proposals. While one would expect the number of comments to comments to
reduce considerably as the Total Score of the EFC Memo increases, the graph below does not indicate
the same.
Figure 28: Total Comments Vs. Score of EFC Memos/Proposals
Note: Scores displayed in this figure are for first draft EFC Memos in cases where multiple EFC Memos were
available in the documentation; Source: Authors
6.2.6. Share of Comments Endorsed by Others across Scores of EFC Memos
As part of this analysis, the total percentage of PC’s Comments ‘Endorsed by Others’ were plotted
against the total scores achieved by EFC Memos/Proposals. In case of EFC Memos/Proposals with
relatively lower scores it was observed that a greater percentage of the comments made by PC were
also endorsed by other commenting agencies.
This implies that EFC Memos/Proposals with lower quality of information/response elicited similar
comments by various commenting agencies including the Planning Commission.

60 | P a g e
Figure 29: Share of Comments Endorsed by Others Vs. Score of EFC Memos/Proposals
Note: Scores displayed in this figure are for first draft EFC Memos in cases where multiple EFC Memos were
available in the documentation; Source: Authors
Value Addition by PAMD
Overall, from the above analysis it can be concluded that the PAMD and the Subject Divisions at the
Planning Commission are making value additions during the appraisal process as they are: (i)
commenting on important issues in the context of the projects such as matters related to project
management (both, administrative and operational details), cost estimates and technicalities; and (ii)
these comments are often direct and specific to elicit responses from the proposing Ministries/
Departments. However, it must be noted that despite these critical and directional comments,
proposing Ministries/ Departments may choose to give elusive replies.
Further, in the years 2007 and 2010, relatively larger percentage of Planning Commission’s comments
were endorsed by other commenting agencies as well. It was also observed that as the value of the
proposals rose, the number of comments by Planning Commission increased suggesting higher level of
scrutiny during appraisal for high value projects.

61 | P a g e
6.3. Time Taken for Appraisal of Proposals
The below graph indicates delay in number of days in the Preparation of the PAMD Note during the
Appraisal Process (Time taken between the Date of Draft EFC Memo/Proposal and Date of Note or
Appraisal Note by PAMD at the Planning Commission). As per Guidelines 2003 issued, the benchmark
timeframe for this step is 42 days. The below graph indicates the number of days delay ranges between
4 and 1144. Six Projects without any value/bars in the graph indicate that there was no delay in
Preparation of the PAMD Note.
Figure 30: No. of Days Beyond Benchmark
Source: Authors
For the purpose of comparing time-lines across all appraisal steps of various EFC Memos/Proposals, the
R.A.G analysis was adopted. Red, Amber or Green rating was provided based on comparison of the
‘Actual Timeframes’ to the ‘Benchmark Timeframes’ (Guidelines 2003). The resulting table is presented
below. Out of the projects that were delayed during the Preparation of the PAMD Note, 9 Projects
experienced greater than 100% delay as compared to the Benchmark Timeframe of 42 days.
It was also observed that Minutes of Meeting (EFC Meeting) were not available as part of
documentation in 11 Projects. Further out of these in 6 Projects, though the EFC Meeting was held, the
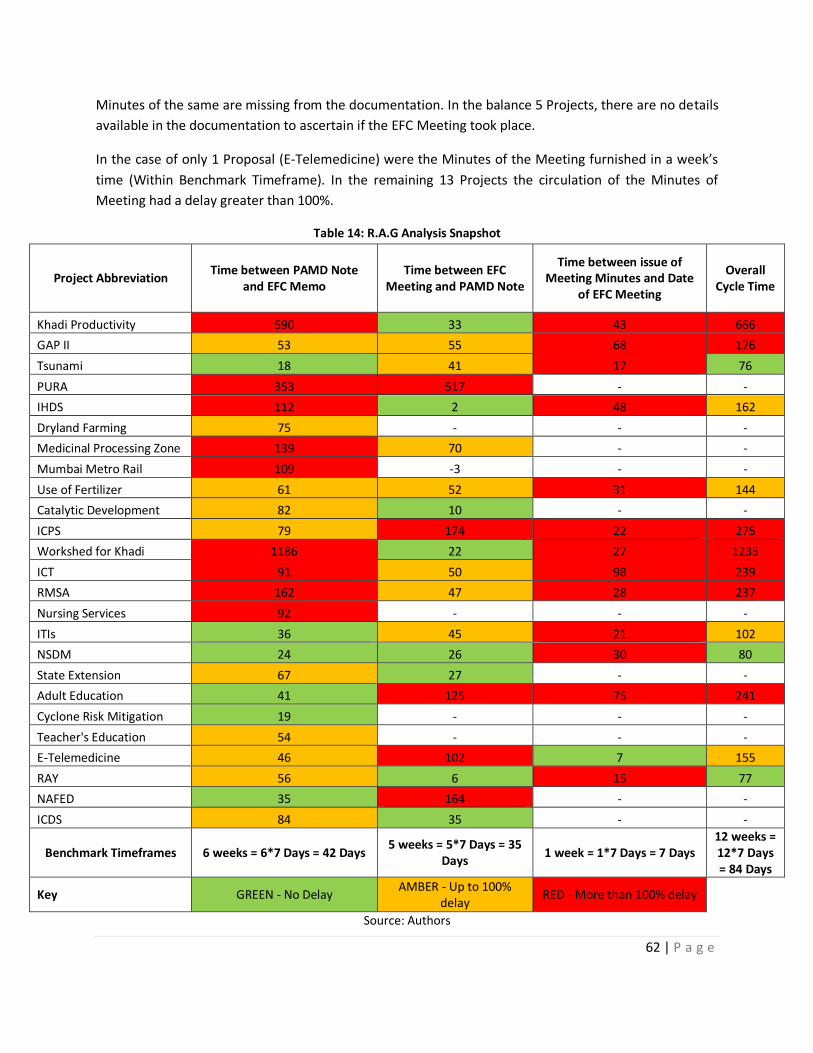
62 | P a g e
Minutes of the same are missing from the documentation. In the balance 5 Projects, there are no details
available in the documentation to ascertain if the EFC Meeting took place.
In the case of only 1 Proposal (E-Telemedicine) were the Minutes of the Meeting furnished in a week’s
time (Within Benchmark Timeframe). In the remaining 13 Projects the circulation of the Minutes of
Meeting had a delay greater than 100%.
Table 14: R.A.G Analysis Snapshot
Project Abbreviation Time between PAMD Note
and EFC Memo Time between EFC
Meeting and PAMD Note
Time between issue of Meeting Minutes and Date
of EFC Meeting
Overall Cycle Time
Khadi Productivity 590 33 43 666
GAP II 53 55 68 176
Tsunami 18 41 17 76
PURA 353 517 - -
IHDS 112 2 48 162
Dryland Farming 75 - - -
Medicinal Processing Zone 139 70 - -
Mumbai Metro Rail 109 -3 - -
Use of Fertilizer 61 52 31 144
Catalytic Development 82 10 - -
ICPS 79 174 22 275
Workshed for Khadi 1186 22 27 1235
ICT 91 50 98 239
RMSA 162 47 28 237
Nursing Services 92 - - -
ITIs 36 45 21 102
NSDM 24 26 30 80
State Extension 67 27 - -
Adult Education 41 125 75 241
Cyclone Risk Mitigation 19 - - -
Teacher's Education 54 - - -
E-Telemedicine 46 102 7 155
RAY 56 6 15 77
NAFED 35 164 - -
ICDS 84 35 - -
Benchmark Timeframes 6 weeks = 6*7 Days = 42 Days 5 weeks = 5*7 Days = 35
Days 1 week = 1*7 Days = 7 Days
12 weeks = 12*7 Days = 84 Days
Key GREEN - No Delay AMBER - Up to 100%
delay RED - More than 100% delay
Source: Authors
63 | P a g e
The above table seems to suggest that in case of most EFC Proposals/ Memos, the benchmarked
timeframes for various steps have not been met. Commenting agencies including the Planning
Commission are likely to take more time and effort while appraising proposals with higher value or
higher degree of complexity or multiple objectives. Therefore, the authority responsible for deciding the
benchmarked timeframes might review these and make mutually acceptable changes.
Specifically, the timelines may be revisited for the step ‘Time between PAMD Note and EFC Memo’. The
timeline could be linked to the value of the proposed scheme/project. Since additional inputs are
expected to be sought for an EFC Memo/Proposal greater than (equal to) INR 1000 Crores (Proposed
EFC Memo Format in Annexure V), the PAMD/Subject Divisions at Planning Commission may require
additional time to appraise the same.
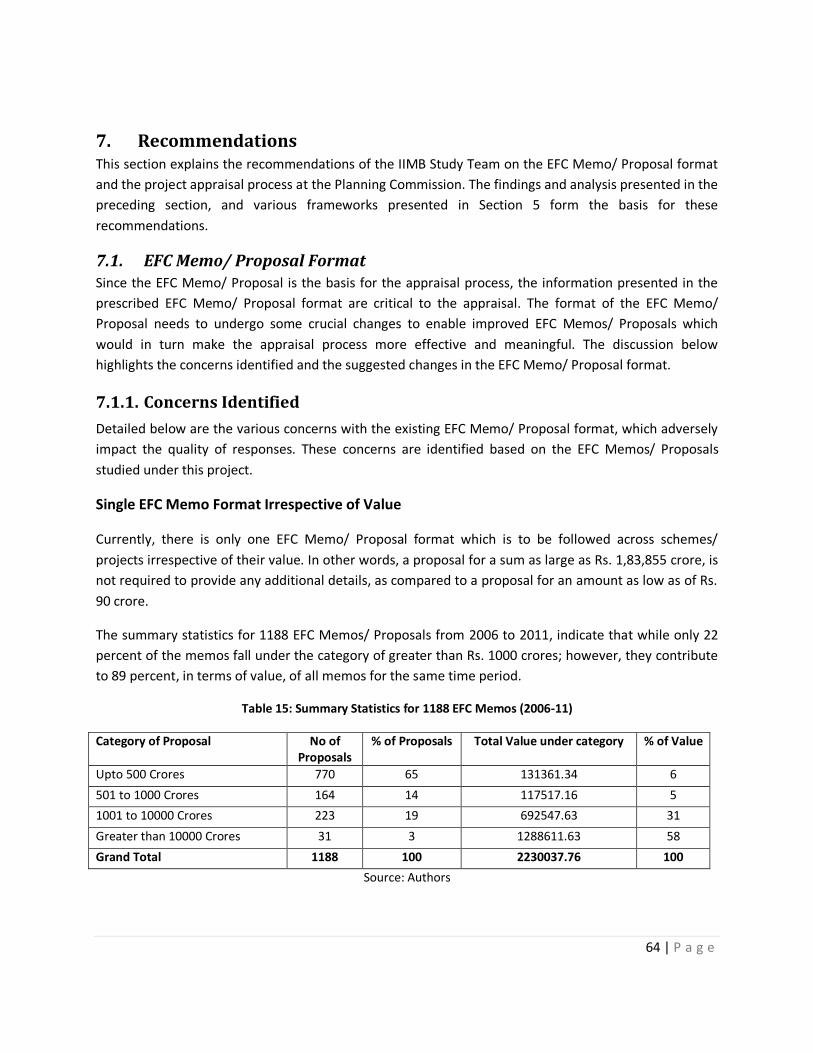
64 | P a g e
7. Recommendations This section explains the recommendations of the IIMB Study Team on the EFC Memo/ Proposal format
and the project appraisal process at the Planning Commission. The findings and analysis presented in the
preceding section, and various frameworks presented in Section 5 form the basis for these
recommendations.
7.1. EFC Memo/ Proposal Format Since the EFC Memo/ Proposal is the basis for the appraisal process, the information presented in the
prescribed EFC Memo/ Proposal format are critical to the appraisal. The format of the EFC Memo/
Proposal needs to undergo some crucial changes to enable improved EFC Memos/ Proposals which
would in turn make the appraisal process more effective and meaningful. The discussion below
highlights the concerns identified and the suggested changes in the EFC Memo/ Proposal format.
7.1.1. Concerns Identified
Detailed below are the various concerns with the existing EFC Memo/ Proposal format, which adversely
impact the quality of responses. These concerns are identified based on the EFC Memos/ Proposals
studied under this project.
Single EFC Memo Format Irrespective of Value
Currently, there is only one EFC Memo/ Proposal format which is to be followed across schemes/
projects irrespective of their value. In other words, a proposal for a sum as large as Rs. 1,83,855 crore, is
not required to provide any additional details, as compared to a proposal for an amount as low as of Rs.
90 crore.
The summary statistics for 1188 EFC Memos/ Proposals from 2006 to 2011, indicate that while only 22
percent of the memos fall under the category of greater than Rs. 1000 crores; however, they contribute
to 89 percent, in terms of value, of all memos for the same time period.
Table 15: Summary Statistics for 1188 EFC Memos (2006-11)
Category of Proposal No of Proposals
% of Proposals Total Value under category % of Value
Upto 500 Crores 770 65 131361.34 6
501 to 1000 Crores 164 14 117517.16 5
1001 to 10000 Crores 223 19 692547.63 31
Greater than 10000 Crores 31 3 1288611.63 58
Grand Total 1188 100 2230037.76 100
Source: Authors

65 | P a g e
Lack of Overall Logical Framework and Weak Linkages
The current checklist and the Memo format is quite comprehensive but can be presented in a
more logical manner. Presently, many such frameworks are available. The proposed framework
is line with logical framework. The existing structure does not bring out the overall plan
objectives and targets in the background of which a particular project is proposed. Also, it is
important that the activities of the projects are closely linked with the plan objectives.
Vague Questions
It is observed that some of the questions are vague due to which they do not elicit a clear cut response
from the concerned Ministry/ Department. For example, question number (2j) asks, “Whether any
evaluation had been done? If so, broad findings of such evaluation studies may be given.” This question
does not flow from previous questions and does not mention ‘evaluation of what’. It has often resulted
in routine replies.
Rhetorical Questions
Some questions are observed to be very rhetorical, implying these questions are asked in a manner
which does not elicit a detailed response. For example, question (3a) asks, “Has the project/ scheme
been worked out and scrutinized in all its details?” This question lacks concreteness and is prone to
different interpretations by the departments.
Long Questions Seeking Multiple Answers
There are a few questions which are very long and elicit multiple answers, which often the proposing
Department/ Ministry fail to address or address partially. For example, question (4b) asks, “Details of the
scheme of financing clearly bringing out the financial obligations undertaken by the PSU/Ministry with or
without the proposal under consideration. In other words, details of commitment on account of on-going
projects to be funded from internal resources of the PSU may be given in the EFC Note along with the
requirement and availability of funds for the project under consideration. In case of schemes /
programmes, Five Year Plan Outlay for the Ministry/Department and commitments on on-going
schemes/programmes along with the requirement and availability of funds for the scheme/programme
may be furnished.” It is preferable to have a main question followed by explanation of the same.
Questions relating to a Similar Theme are scattered
Questions regarding the same theme are sometimes found to be scattered across the EFC Memo/
Proposal. For example, question numbers (2b), (2h) & (2j) seem to refer to previous schemes with
similar/ same objectives. Similarly, question numbers (2i), (2k) & (24) are all regarding comments
received from several agencies including concerned Ministries and Planning Commission, Parliamentary/
Departmental Committee(s) & Financial Adviser. These could have been grouped under major

66 | P a g e
categories. The format should be such that it helps the proposers to formulate their proposal in a
structured way.
Critical Questions Currently Not Included in EFC Memo Format
Presently, there is no question in the EFC Memo/ Proposal which seeks inputs on the ‘strategic fit’ or
the ‘policy fit’ of the proposed project/ scheme. The project linkages with the plan objectives and
targets are clearly spelt out. In other words, there is no question which addresses the issue of the
relevance of the project/ scheme to the macro domain of the Ministry/ Department. This poses the risk
of each proposal being treated in an isolated manner.
There are also no questions in the EFC Memo/ Proposal format asks the proposing Department/
Ministry to present details regarding the Monitoring and Evaluation of the scheme/ project being
proposed. While this information is required in the DPR, most proposals are not accompanied with a
DPR which carries these details.
Further, the format for the EFC Memo/ Proposal does not require the proposing Department/ Ministry
to disclose the aspects of Risks that the proposing project/ scheme might face and the risks’ mitigating
strategies. While such a disclosure is required in the DPR, however, most proposals are not accompanied
with a DPR which carries these details.
Projects/ schemes being proposed are often Centrally Sponsored31 . Therefore, it is crucial to ask the
proposing Ministry/ Department to disclose specific State-level Details pertaining to financing and other
obligations.
Currently, there are no questions seeking information regarding the Legal Framework within which the
proposed project/ scheme is to be implemented. Further, there are no details asked regarding
Stakeholders.
Inconsistent Format for Presentation of Answers
Since certain questions are broad, the proposing Ministries/ Departments tend to present a whole lot of
written material running into several pages which do not necessarily clarify. For example, the existing
format for the EFC Memo/ Proposal does not prescribe a set format for presentation of answers relating
to timeline of the project, outputs and outcomes, expenditure and financing details, etc. Questions
could be made more concrete to elicit specific responses from Ministries/ Departments.
31 Schemes which deal with subjects not on the Union list but are funded by a Department/ Ministry of the Central Government and implemented by State agencies.
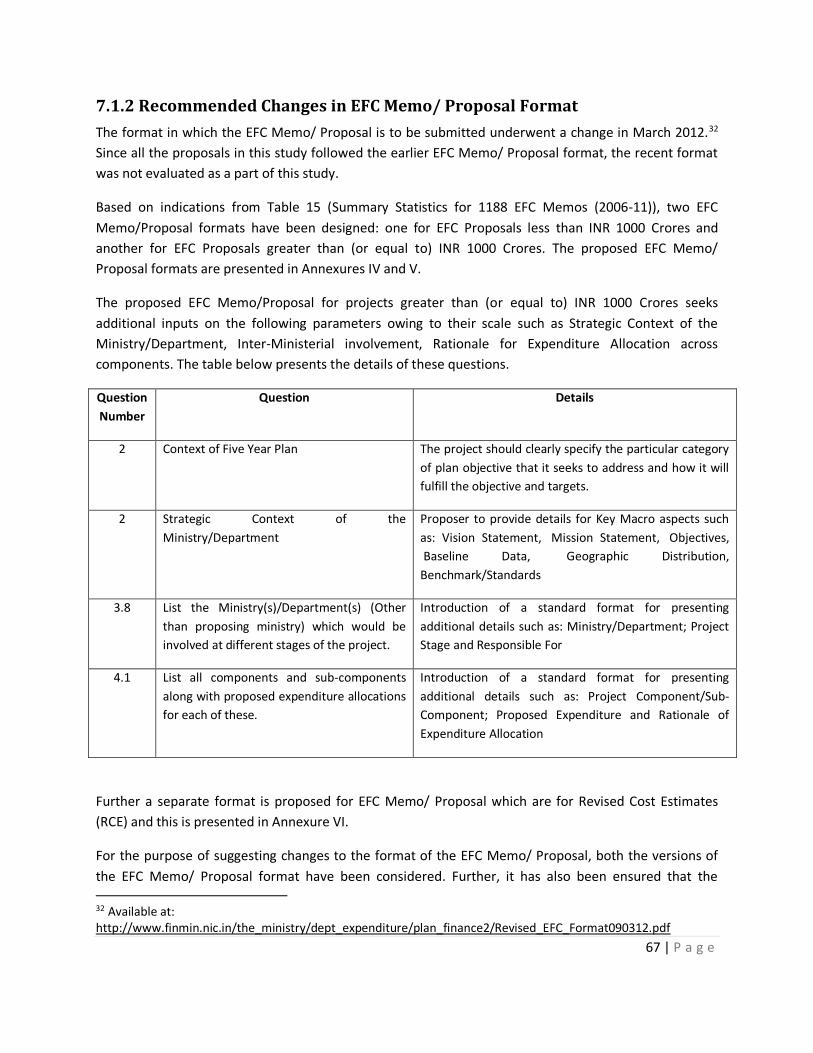
67 | P a g e
7.1.2 Recommended Changes in EFC Memo/ Proposal Format
The format in which the EFC Memo/ Proposal is to be submitted underwent a change in March 2012.32
Since all the proposals in this study followed the earlier EFC Memo/ Proposal format, the recent format
was not evaluated as a part of this study.
Based on indications from Table 15 (Summary Statistics for 1188 EFC Memos (2006-11)), two EFC
Memo/Proposal formats have been designed: one for EFC Proposals less than INR 1000 Crores and
another for EFC Proposals greater than (or equal to) INR 1000 Crores. The proposed EFC Memo/
Proposal formats are presented in Annexures IV and V.
The proposed EFC Memo/Proposal for projects greater than (or equal to) INR 1000 Crores seeks
additional inputs on the following parameters owing to their scale such as Strategic Context of the
Ministry/Department, Inter-Ministerial involvement, Rationale for Expenditure Allocation across
components. The table below presents the details of these questions.
Question
Number
Question Details
2 Context of Five Year Plan The project should clearly specify the particular category
of plan objective that it seeks to address and how it will
fulfill the objective and targets.
2 Strategic Context of the
Ministry/Department
Proposer to provide details for Key Macro aspects such
as: Vision Statement, Mission Statement, Objectives,
Baseline Data, Geographic Distribution,
Benchmark/Standards
3.8 List the Ministry(s)/Department(s) (Other
than proposing ministry) which would be
involved at different stages of the project.
Introduction of a standard format for presenting
additional details such as: Ministry/Department; Project
Stage and Responsible For
4.1 List all components and sub-components
along with proposed expenditure allocations
for each of these.
Introduction of a standard format for presenting
additional details such as: Project Component/Sub-
Component; Proposed Expenditure and Rationale of
Expenditure Allocation
Further a separate format is proposed for EFC Memo/ Proposal which are for Revised Cost Estimates
(RCE) and this is presented in Annexure VI.
For the purpose of suggesting changes to the format of the EFC Memo/ Proposal, both the versions of
the EFC Memo/ Proposal format have been considered. Further, it has also been ensured that the 32 Available at: http://www.finmin.nic.in/the_ministry/dept_expenditure/plan_finance2/Revised_EFC_Format090312.pdf
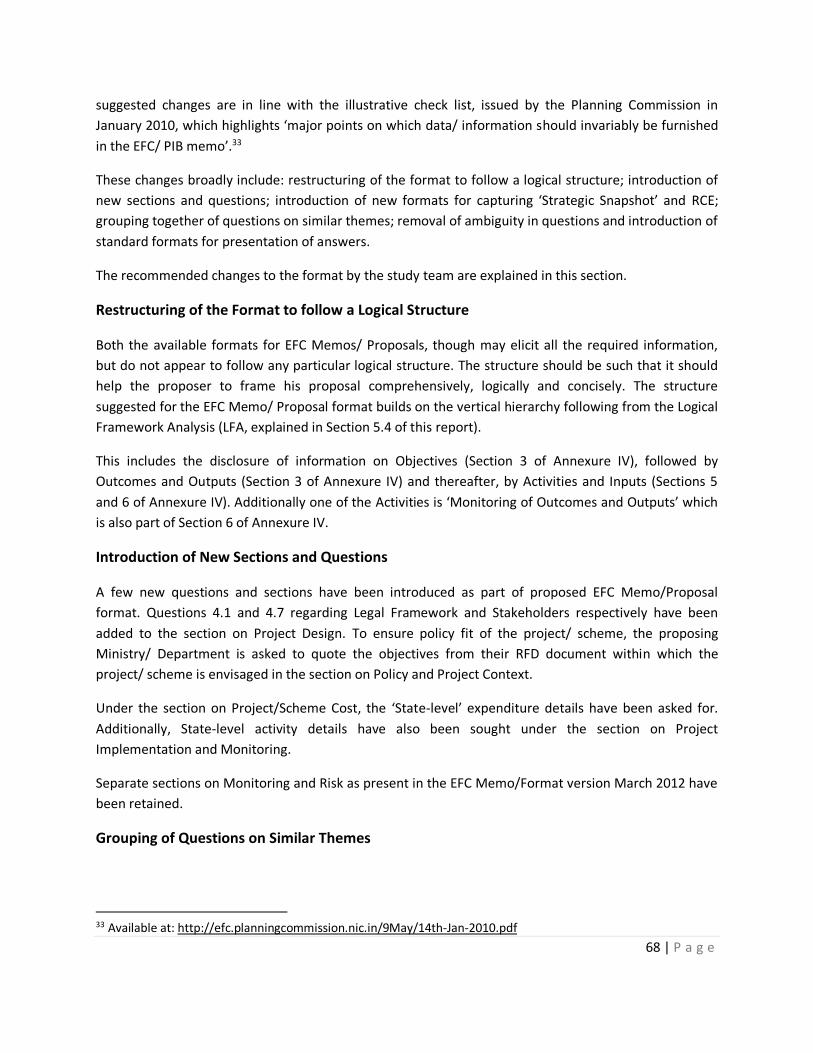
68 | P a g e
suggested changes are in line with the illustrative check list, issued by the Planning Commission in
January 2010, which highlights ‘major points on which data/ information should invariably be furnished
in the EFC/ PIB memo’.33
These changes broadly include: restructuring of the format to follow a logical structure; introduction of
new sections and questions; introduction of new formats for capturing ‘Strategic Snapshot’ and RCE;
grouping together of questions on similar themes; removal of ambiguity in questions and introduction of
standard formats for presentation of answers.
The recommended changes to the format by the study team are explained in this section.
Restructuring of the Format to follow a Logical Structure
Both the available formats for EFC Memos/ Proposals, though may elicit all the required information,
but do not appear to follow any particular logical structure. The structure should be such that it should
help the proposer to frame his proposal comprehensively, logically and concisely. The structure
suggested for the EFC Memo/ Proposal format builds on the vertical hierarchy following from the Logical
Framework Analysis (LFA, explained in Section 5.4 of this report).
This includes the disclosure of information on Objectives (Section 3 of Annexure IV), followed by
Outcomes and Outputs (Section 3 of Annexure IV) and thereafter, by Activities and Inputs (Sections 5
and 6 of Annexure IV). Additionally one of the Activities is ‘Monitoring of Outcomes and Outputs’ which
is also part of Section 6 of Annexure IV.
Introduction of New Sections and Questions
A few new questions and sections have been introduced as part of proposed EFC Memo/Proposal
format. Questions 4.1 and 4.7 regarding Legal Framework and Stakeholders respectively have been
added to the section on Project Design. To ensure policy fit of the project/ scheme, the proposing
Ministry/ Department is asked to quote the objectives from their RFD document within which the
project/ scheme is envisaged in the section on Policy and Project Context.
Under the section on Project/Scheme Cost, the ‘State-level’ expenditure details have been asked for.
Additionally, State-level activity details have also been sought under the section on Project
Implementation and Monitoring.
Separate sections on Monitoring and Risk as present in the EFC Memo/Format version March 2012 have
been retained.
Grouping of Questions on Similar Themes
33 Available at: http://efc.planningcommission.nic.in/9May/14th-Jan-2010.pdf

69 | P a g e
Questions 2 (b) , 2 (h) and 2 (j) (relating to ‘on-going or previous schemes with similar or same
objectives’), belonging to the old EFC Memo format, have been grouped together in the proposed EFC
Memo/Proposal format.
Questions relating to ‘Resettlement & Rehabilitation and Disaster Management’ which are not
applicable for all projects have been grouped under the Section on Additional Information.
Modification of Ambiguous, Rhetorical and Long Questions
Questions which were observed to be either ambiguous, rhetorical or long have been modified and
included as a part of the revised EFC Memo/ Proposal format. The table below presents the details of
such questions.
Table 16: Recommended changes for ambiguous, rhetorical and long questions
Question No. Type of Concern Recommended Changes
2 (d) – Reasons and Justifications of
Proposal
Question is very long asking for
multiple answers, which often the
proposing Department/ Ministry fail
to answer or answer partially.
Added as questions 2.1 and 2.2
under Section on Justification of
Project
2 (b), (h), (j) – Question on previous
schemes with overlapping objectives
Scattered and Vague Grouped under question 2.3
2 (i), (k), 24 – Question on
involvement of other concerned
ministry/consultation
Scattered and Vague Grouped under Section on
Additional Information
3 (a) – Scrutiny of project scheme in
all details
Rhetorical question asked in a
manner which does not elicit a
detailed response.
Added as question 2.3 as part of
Section on Justification of Project
3 (c ) – Physical and Financial targets Rhetorical question asked in a
manner which does not elicit a
detailed response.
Introduced question 5.2 with
tabular format
6 (a) – Operational Capability Question is very long asking for
multiple answers, which often the
proposing Department/ Ministry fail
to answer or answer partially.
Introduced Sections on Project
Implementation and Monitoring,
and Project Risks
Source: Authors
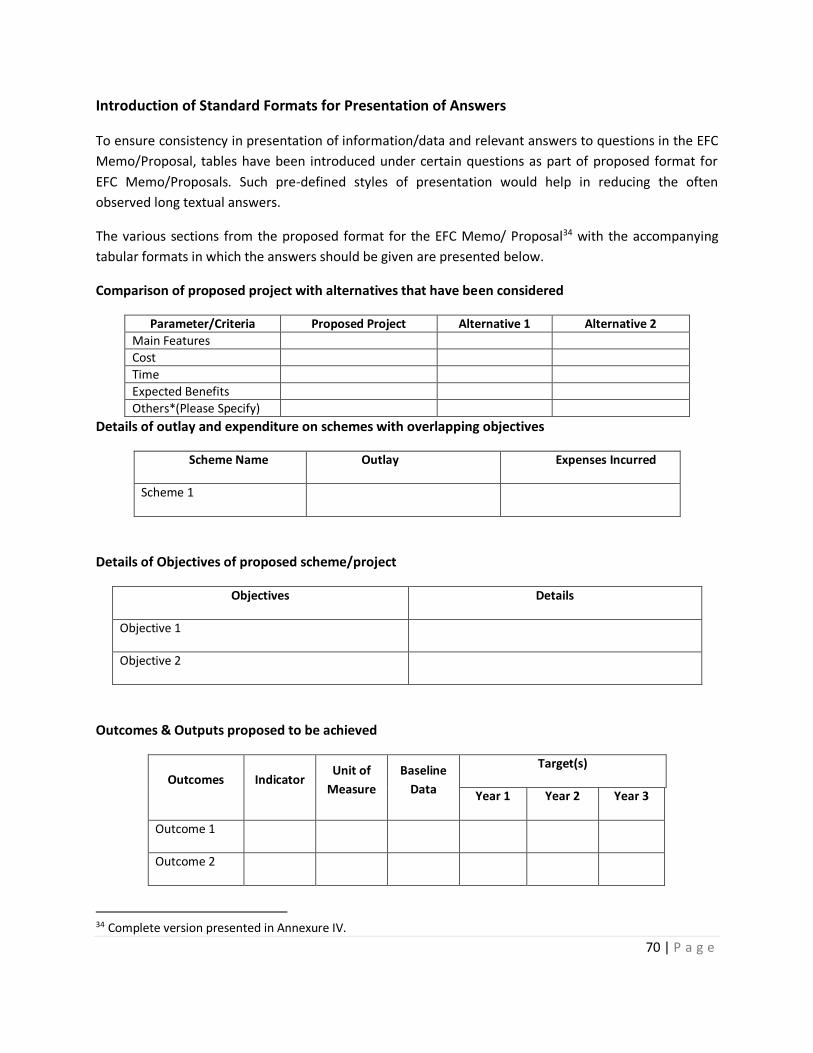
70 | P a g e
Introduction of Standard Formats for Presentation of Answers
To ensure consistency in presentation of information/data and relevant answers to questions in the EFC
Memo/Proposal, tables have been introduced under certain questions as part of proposed format for
EFC Memo/Proposals. Such pre-defined styles of presentation would help in reducing the often
observed long textual answers.
The various sections from the proposed format for the EFC Memo/ Proposal34 with the accompanying
tabular formats in which the answers should be given are presented below.
Comparison of proposed project with alternatives that have been considered
Parameter/Criteria Proposed Project Alternative 1 Alternative 2
Main Features
Cost
Time
Expected Benefits
Others*(Please Specify)
Details of outlay and expenditure on schemes with overlapping objectives
Scheme Name Outlay Expenses Incurred
Scheme 1
Details of Objectives of proposed scheme/project
Objectives Details
Objective 1
Objective 2
Outcomes & Outputs proposed to be achieved
Outcomes Indicator Unit of
Measure
Baseline
Data
Target(s)
Year 1 Year 2 Year 3
Outcome 1
Outcome 2
34 Complete version presented in Annexure IV.
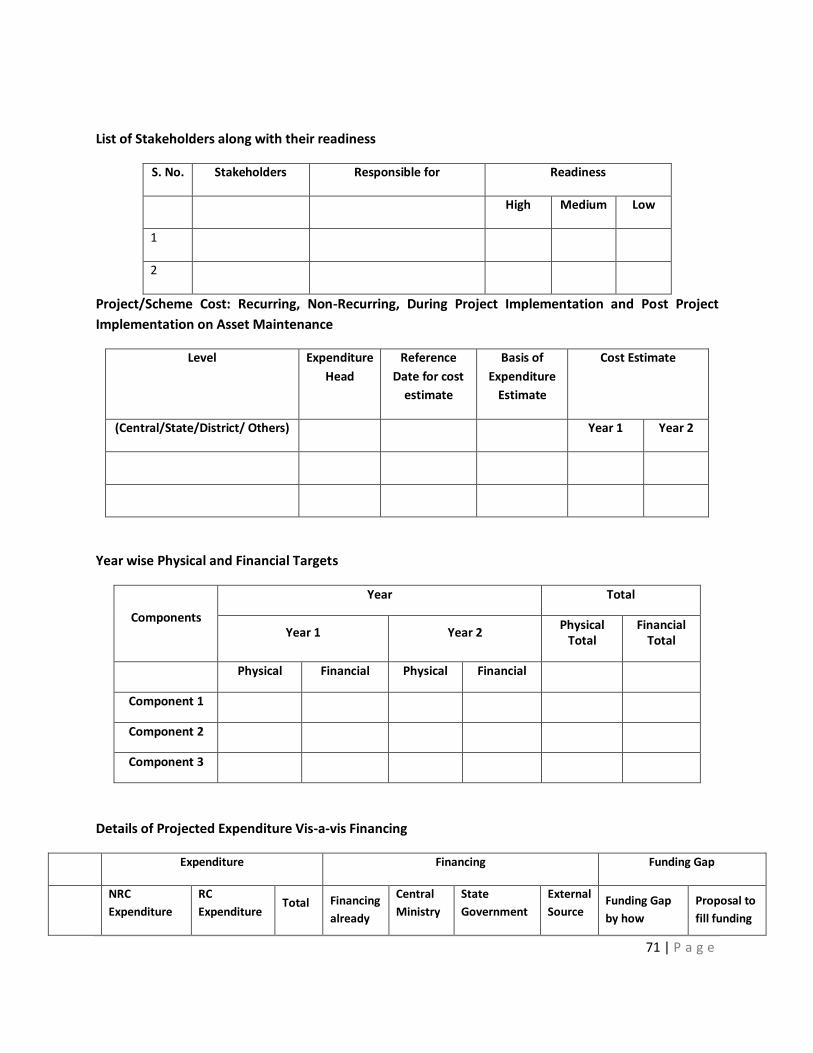
71 | P a g e
List of Stakeholders along with their readiness
S. No. Stakeholders Responsible for Readiness
High Medium Low
1
2
Project/Scheme Cost: Recurring, Non-Recurring, During Project Implementation and Post Project
Implementation on Asset Maintenance
Level Expenditure
Head
Reference
Date for cost
estimate
Basis of
Expenditure
Estimate
Cost Estimate
(Central/State/District/ Others) Year 1 Year 2
Year wise Physical and Financial Targets
Components
Year Total
Year 1 Year 2 Physical
Total Financial
Total
Physical Financial Physical Financial
Component 1
Component 2
Component 3
Details of Projected Expenditure Vis-a-vis Financing
Expenditure Financing Funding Gap
NRC
Expenditure
RC
Expenditure Total Financing
already
Central
Ministry
State
Government
External
Source Funding Gap
by how
Proposal to
fill funding

72 | P a g e
secured much? gap
Year 1
Year 2
Total
Schedule for Project Implementation under major activities, along with time-lines and different levels
of government
Major Activity/Head Level of Government Timeline for implementation
Outcomes & Outputs – Monitoring of Scheme Outcomes and Outputs
Outcomes
Details regarding Data
Agency Responsible for
Data Collection
Methodology for
Data Collection Frequency of Data Collection
Outcome 1
Outcome 2
List of Agencies/Committees/Other Concerned Ministries that have been consulted and their
comments
Name of Ministry / Agency Comments/Observations Response of Proposing Ministry
Ministry 1
Agency 1
Finally, it should also be mentioned that the capacities of the Ministries/ Departments will have to be
built to strengthen EFC Memos/ Proposals. Watertight project proposals are as important as project
73 | P a g e
appraisal and project management. Planning Commission could hold seminars to build these capacities
in the Ministries/ Departments through academic institutions and international development agencies.
The Ministries/ Departments could also engage management consultants to help them to convert their
proposals, which might be strong on the technical front, into holistic project proposals which are sound
on the project management front as well.
7.1.3 Model EFC Memo
We have attempted to provide a model EFC memo to indicate how various questions can be
addressed (Annexure IX). We have used ICDS as the case. ICDS is a comprehensive case and
supported by documents. We have tried to complete the Memo using the existing memo and
other related documents. This may indicate how the logical sequence can be achieved and how
concretization can be ensured. Attempt has also been to link physical targets with objectives
clearly. These are also related to financial targets. However, it should be mentioned here that
these are indicative only as these are based on available documents and the Team is limited by
its limited exposure to the domain. In some cases, we have also indicated missing data. This
annexure should hopefully clarify the suggested format. In the suggested format clarifications
are provided against select concepts.
74 | P a g e
7.2. Project Appraisal by the Planning Commission Presently, as a part of project appraisal process, the PAMD at the Planning Commission prepares a Note
for Expenditure Finance Committee (EFC). This note follows a consistent format across all projects for
capturing critical information for the EFC. The major sections as part of PAMD note are: (i) Project Profile
(ii) Background and Justification (iii) Proposed Scheme (iv) Plan Outlay (v) Cost Estimates (vi)
Findings/Recommendations/Conclusions/Observations.
7.2.1 Concerns Identified
The comments of various divisions associated with Planning Commission are usually presented in the
last section of the note. These comments cover operational, administrative, financial, policy, project
management and technical aspects relating to the proposed project/ scheme. However, these
comments do not appear to follow any specific logical structure.
In addition, the comments of the concerned Subject Division(s) are presently not highlighted as a part of
the Note for EFC. In other words, since the Subject Division(s) of the Planning Commission are known to
have domain knowledge, it is critical that their comments are identifiable. This might also help in
ensuring that their expert views concerning strategic fit, technical aspects such as benchmarks etc. are
duly captured.
In contrast to social projects, it is observed that many international and leading agencies while
appraising infrastructural projects use standard financial return models based on calculations of Internal
Rates of Returns (IRRs) and Net Present Values (NPVs). Further, to take into account social and
environmental factors, social cost-benefit analyses may be carried out, as is done at organizations such
as UNIDO (United Nations Industrial Development Organization). Financial institutions follow appraisal
models which are based on guidelines, priorities, and lending principles of respective banks.
International Agencies such as the World Bank and African Development Bank, follow structured a
project appraisal method. A typical World Bank project appraisal document has the following sections:
Strategic Context, Project Development Objectives, Project Description, Project Implementation, Key
Risks and Mitigation Measures and an Appraisal Summary. The Appraisal Summary covers the following
aspects: economic and financial analysis, technical, financial management, procurement, social and
environmental. Similarly, a typical African Development Bank project appraisal report has the following
sections: Strategic Thrust & Rationale, Project Description, Project Feasibility (which includes economic
and financial performance and environmental and social impacts), Project Implementation, Legal
Framework and Recommendations.
Hence, the next section aims to highlight ways in which the PAMD at the Planning Commission could
improve appraisal process, which is documented in the form of the Note for EFC.
7.2.2. Recommended Changes in the Appraisal Process
It was noted that all the proposals in this study followed a consistent format for PAMD Note
preparation; however, the comments of Planning Commission were not presented in any specific
75 | P a g e
pattern. Comments were observed to oscillate from one aspect (say, policy) to another (say, technical)
without any particular order. Only in some cases, it was seen that the comments regarding the cost or
financial aspects were grouped together.
As is presently done, we recommend that as a part of the Note for EFC, a project summary is prepared
which covers the basic profile of the project, justification of the project and the associated cost
estimates. Following this, the comments and observations of the Planning Commission can be presented
under the following heads. This would ensure that all critical components of the projects are appraised
without any omissions.
Project Summary
List of areas wherein decisions required
Policy, Plan and Project Context
Technical Feasibility
Financial Aspects
Project Management – Administrative, Operational, Implementation
Monitoring and Evaluation
Risk Analysis
The details of the appraisal aspects concerning the aforementioned components are presented in the
‘Appraisal Grid for PAMD, Planning Commission’ in Annexure VII. A similar document for appraisal by
Subject Divisions of the Planning Commission is also suggested. This appraisal gird is presented in
Annexure VIII.
Additional aspects to be appraised for projects greater than (equal to) INR 1000 Crores have been
included under the following broad categories:
Strategic Fit
Involvement of Ministries/Department (other than proposing ministry) at various stages of the
project
Expenditure allocation across components/sub-components
Further, in case of projects greater than or equal to INR 1000 Crores, the PAMD and the respective
Subject Division at the Planning Commission could also ask the proposing Ministry/ Department to
present their EFC Memo/ Proposal in the form of a presentation.
76 | P a g e
8. Conclusion This study on the evaluation of the project appraisal methodology and process at the Planning
Commission, Government of India revealed lacuna in the process. It is, therefore, recommended that
changes be brought about in both, the format of the EFC Memo/ Proposal as well as in the appraisal
process undertaken by various divisions in the Planning Commission.
For the purpose of re-formatting of the EFC Memo/Proposal two formats have been designed: one for
EFC Proposals less than INR 1000 Crores and another for EFC Proposals greater than (or equal to) INR
1000 Crores. Additionally the following steps have also been recommended: restructuring of the format
to follow a logical structure, introduction of new sections and questions, grouping of questions on
similar themes, modification of ambiguous, rhetorical and long questions and introduction of standard
formats for presentation of answers.
It has also been recommended that the PAMD at the Planning Commission use the ‘Appraisal Grid’ to
consolidate its comments. This grid should contain following broad aspects: strategic fit, technical
feasibility, financial aspects, project management – administrative, operational, implementation,
monitoring and evaluation, and risk analysis, to ensure a holistic approach in appraisal. Additionally, it is
also suggested that the Subject Divisions at the Planning Commission use the Appraisal Grid. This would
ensure that expertise in their specified fields of development is incorporated and their critical comments
are highlighted.

77 | P a g e
9. Annexures and References
Attached as a separate document.

EvaluationofFrameworkof
AppraisalofProjects
AnnexuresandReferencestoReport
AStudyforthe
PAMD,PlanningCommission,GovernmentofIndia
By
IndianInstituteofManagement,Bangalore
October2012
Prof. G. Ramesh1, Prof. V. Nagadevara2,
Srividya Sridharan3, Shahana Sheikh4
1 Associate Professor, Centre for Public Policy, Indian Institute of Management, Bangalore 2 Professor, Quantitative Methods & Information Systems, Indian Institute of Management, Bangalore 3 Research Associate, Indian Institute of Management, Bangalore 4 Research Associate, Indian Institute of Management, Bangalore
2 | P a g e
TableofContents
Annexure I ‐ EFC Memo Format .................................................................................................................... 3
Annexure II – Scoring Method ‐ EFC Memo/Proposal .................................................................................. 9
Annexure III – Scoring Method – Comments .............................................................................................. 14
Annexure IV – Proposed EFC Memo/Proposal Format (Project Value Less than INR 1000 Crores) ........... 15
Annexure V – Proposed EFC Memo/Proposal Format (Project Value Greater than INR 1000 Crores) ...... 24
Annexure VI – Proposed EFC Memo/Proposal Format for RCE Proposals ................................................. 36
Annexure VII – Appraisal Grid for PAMD, Planning Commission ................................................................ 37
Annexure VIII – Appraisal Grid for Subject Divisions, Planning Commission .............................................. 40
Annexure IX ‐ Proposed EFC Format ‐ a Model Format 42
References

3 | P a g e
AnnexureI‐EFCMemoFormat
Format of EFC/SFC Memorandum
1) Sponsoring Ministry/Department
2) Statement of proposal
a) Whether Central Scheme or Centrally Sponsored? In the case of new CSS or CSS with changed parameters, funding pattern etc. whether approval of full Planning Commission has been obtained.
b) Whether there are schemes with overlapping objectives and coverage in other Ministries and States? If so, the details of such schemes and the scope for integration.
c) New Proposal/Modified/Revised Cost Estimate.
d) Reasons and justification for proposal, indicating historical background, circumstances in which the need have arisen, whether other alternatives have been considered and what detailed studies have been made in regard to the proposal for establishing its need, its economics and other relevant aspects.
e) If it is location specific, basis for selection of location.
f) Has the proposal been included in the Five Year Plan and what are the provisions in the Five Year Plan and in the current annual plan? Is any modification proposed?
g) What is the estimated yield from the Project and what are the economic implications?
h) In case of ongoing scheme/project, present status and benefits already accrued to the beneficiaries may also be furnished.
i) Have other concerned Ministries and Planning Commission been consulted and if so, with what results?
j) Whether any evaluation had been done? If so, broad findings of such evaluation studies may be given.
k) Has the proposal or its variant been gone into by any Committee, Departmental or Parliamentary, if so, with what result and what decisions have been taken?
l) What are the development “outcomes” and “outputs” of the scheme/project? The development outcomes and outputs should be specified in measurable and monitorable terms along with baseline data against which the impact of the scheme will be assessed. (An illustration of the distinction between “outcomes” and “outputs” is available under the National River Conservation Programme – setting up of an STP/Laboratory is an “output” while improvement of river water quality to a prescribed standard is a development “outcome”
m) Please specify whether the scheme envisages support to individual beneficiaries and if so, please provide the following details: (i) The mechanism of identification of the potential beneficiary of the scheme may be
detailed
4 | P a g e
(ii) The linkage of the beneficiary identification mechanism with the Unique ID (Aadhar) numbers provided/ to be provided by the UIDAI maybe explained.
3) Programme Schedule
A. Has the project/scheme been worked out and scrutinised in all its details?
B. What is the schedule for construction, indicating the position separately relating to plant and machinery and civil works, raw materials, manpower etc. together with year‐wise phasing.
C. Whether physical and financial targets match with each other.
D. What is the target date for completion and when will the expected benefits commence?
E. If the project involves dislocation of human settlements, the resettlement costs should be included fully in the project cost. The resettlement Plan should also be indicated in the project implementation schedule. The resettlement cost may be worked out on the following basis:
i. The cost of land required to resettlement would be as indicated by the District/State Authorities;
ii. The compensation to be paid to the displaced persons. This compensation cost is dependent on the rates indicated by District/State Authorities. Thus the total compensation cost may be worked out on the basis of these rates.
F. Does the project involve any creation/modification of structural/engineering assets including land reclamation or changes to existing land use plans? If yes, then the costs involved in prevention and mitigation of disaster(s) (natural and man‐made) would need to be included fully in the project cost.
a. What is the location of the project area? Reason for selecting the site. Have possible alternative sites been considered? Is the type of activity envisaged in the area compatible with the provisions of relevant NDMA Guidelines?
b. Identify the possible risks and analyse the likelihood and impact from earthquakes, floods, cyclones and landslides due to the location of the project sites as well as through secondary evidence.
c. What are the land use directives, regulations applicable? List preventive measures enshrined in regulations which are to be complied with and confirm compliance.
d. Based on the prioritization of risks, the mitigation measures being contemplated, both structural and non‐structural. Confirmation that the implementation of the selected mitigation measures will not create new risks.
5 | P a g e
e. Confirmation that the design and engineering of the structure has taken into consideration the National Building Code 2005, the appropriate BIS Codes and the NDMA guidelines. Other sources such as Indian Road Congress Manual, Ministry of Road Transport, Highways and Shipping manual, Railway Board manual, Central Public Health Engineering Organisation (Min. of Urban Development) manual, Central Electricity Authority manual and Central Water Commission manual etc may also be consulted where applicable.
f. Has the cost of disaster treatment/mitigation measures been included in the overall project cost?
g. Also indicate that the whole process of risk assessment has been done based on available information and secondary evidence and the mitigation measure(s) are in conformity with the statutory and other regulatory requirements and are the most viable ones in the present circumstances.
4) Expenditure involved:
a) What is the total expenditure (non‐recurring and recurring): Indicate the position year‐wise and also whether any budget provision has been made and if
not, how it is proposed to be arranged? Has any expenditure been incurred already?
b) Details of the scheme of financing clearly bringing out the financial obligations undertaken by the PSU/Ministry with or without the proposal under consideration. In other words, details of commitment on account of on‐going projects to be funded from internal resources of the PSU may be given in the EFC Note along with the requirement and availability of funds for the project under consideration. In case of schemes / programmes, Five Year Plan Outlay for the Ministry/Department and commitments on on‐going schemes/programmes along with the requirement and availability of funds for the scheme/programme may be furnished.
c) What is the foreign exchange component (separately for non‐recurring and recurring expenditure)? What are the items of expenditure involving foreign exchange and expenditure on foreign experts? Has clearance of E.A.D. been obtained and has availability of credit facilities been explored and if so, with what result?
d) Phasing of expenditure (non‐recurring and recurring) : i. On constant prices; ii. On completion cost.
e) Reference date and basis of cost estimates of various components.
6 | P a g e
5) Reliability of Cost Estimates and other parameters:
a. Has pre‐project investigations been arrived at in detail and details of area where changes in project parameters could be anticipated?
b. To what extent cost estimates are firmed up?
6) Operational Capabilities:
a. Operational capability of PSU/Department/Implementing Agency/Ministry to undertake the tasks required for the implementation of the proposal under consideration. For this purpose, track record of the PSU in respect of the projects already implemented/under implementation may be highlighted and also steps proposed for ensuring timely execution of the project under consideration.
b. In case of RCE proposals, variance analysis of cost increase due to price escalation, variation in exchange rates/custom and other statutory duties and levies, change in scope, under estimation, addition/alteration, etc. is to be given.
c. In case of continuing Social Sector Schemes of: i. Estimate of committed liabilities at the end of previous plan; ii. Whether this been transferred to States/non‐plan head.
7) Add statements showing:
a) The number of posts required and the pay scales, together with basis adopted for staffing, both in current year and future years; (A separate proposal for creation of posts may be sent to JS (Pers), Department of Expenditure at least two weeks before the circulation of EFC Note).
b) Expenditure on buildings and other works and its basis and phasing; and, c) Expenditure on stores and equipment.

7 | P a g e
8) Viability:
Information is to be given if benefits accruable from the projects/schemes are quantifiable and can
be translated in monetary term.
a. Financial IRR i. At constant prices; ii. On completion cost basis.
b. Economic IRR i. At constant prices; ii. On completion cost basis.
9) Whether Nodal Officer (Chief Executive for the project) has been appointed. If yes, give details
about his status, past experience in implementing such projects, number of years left for
superannuation etc.
10) Date of approval of original cost or firmed up cost.
11) Original or firmed up approved cost together with FE component.
a. Fixed cost; b. Completion cost.
12) Present cost (completion cost) together with FE component.
13) Earlier project completion schedule.
14) Revised project completion schedule.
15) Brief reasons for time overrun in clear terms.
16) Variance analysis of increase in completion cost under the following heads:
a. Escalation. b. Exchange rate variation. c. Change in scope. d. Statutory levies. e. Addition/deletion. f. Under estimation.
8 | P a g e
g. Other (Specify).
17) Quantification of increase in cost on account of time overrun.
18) Present status of physical progress of the project.
19) Expenditure incurred and commitments made so far.
20) Effect of revision in capital cost estimates on cost of production and profitability with reference
to earlier approved capital cost of the project.
21) Whether, at the stage when funds to the extent of 50% of the approved cost were released, the
mandatory review of the cost estimates was done by the project authorities and the administrative
ministry? If so
a. The date when, as a result of mandatory review, project authorities and the administrative Ministry became aware that the cost of the project is likely to be exceeded by more than 5% of the originally approved cost due to reasons other than price escalation, exchange rate variations statutory levies etc. and the date when RCE was drawn up and brought before EFC.
b. A statement showing commitments made by the project authorities/Administrative Ministries in the EFC/PIB Memorandum regarding reliability of cost estimates, pre‐project investigations, land acquisition, completion schedule etc. and during the PIB meeting with regard to the project at the time of seeking project approval and the status regarding their fulfilment.
c. Have the reasons for the time and cost overrun been gone into thoroughly and responsibility fixed? If so, details in this regard may be indicated.
22) Whether the issue of cost and time over run was brought before EC/QPR? If so, details of
decision taken in EC/QPR & further follow up action.
23) For RCE proposals requiring CCEA approval, report/ recommendations of the Standing
Committee and Action Taken Report may be appended.
24) Whether Financial Adviser’s concurrence/comments on EFC Memo have been obtained? If so,
details thereof
25) Supplementary Information.
26) Points on which decisions/sanctions are required.

9 | P a g e
AnnexureII–ScoringMethod‐EFCMemo/ProposalScoring for the “Statement of Proposal” Component:
STATEMENT OF PROPOSAL
Q. No.
Question Actual Score Given
Total Score
Scoring Method
2 (a)
Whether Central Scheme or Centrally Sponsored? In the case of new CSS or CSS with changed parameters, funding pattern etc. whether approval of full Planning Commission has been obtained.
2
If nature of scheme to be clearly specified then 1 point; If there is an annexure with “FR” & “In Principle” approval then +1
2 ( c) Is it a new Proposal/Modified/Revised Cost Estimate?
1 Nature of proposal mentioned clearly +1
2 (d)
Reasons and justification for proposal, indicating historical background, circumstances in which the need have arisen, whether other alternatives have been considered and what detailed studies have been made in regard to the proposal for establishing its need, its economics and other relevant aspects.
7
Historical Background: 4Mention of alternatives: 1; if there is a comparison between alternatives and proposed scheme w.r.t economics then +1, if there are other relevant aspects being compared then additional +1
2 (e)
If it is location specific, basis for selection of location
3
If location choice is left to state and no basis for choice is given then 0; If location is specified, but no basis is given then 1 point; If basis is defined and states are left to chose the location then 2 points; If both details are present then 3 points
2 (f)
Has the proposal been included in the Five Year Plan and what are the provisions in the Five Year Plan and in the current annual plan? Is any modification proposed?
2
If provisions in FYP and/or current annual plan is mentioned then 2 points; Mere mention of Yes/No then 0 points
2 (g)
What is the estimated yield from the Project and what are the economic implications?
3
If the answer is vague then 1 point, if the answer is in quantified terms or qualitative terms then 3 points
2 (l)
What are the development “outcomes” and “outputs” of the scheme/project? The development outcomes and outputs should be specified in measurable and monitorable terms along with baseline data against which the impact of the scheme will be assessed
7
If outcomes are mentioned then 2 points; If outputs are mentioned then 3 points; If baseline is also mentioned then additional 2 points
Total 25

10 | P a g e
Scoring for “Program Schedule” Component:
PROGRAM SCHEDULE
Q. No. Question Actual Score Given
Total Score
Scoring Method
3 (a) Has the project/scheme been worked out and scrutinized in all its details?
3 If the answer is just “yes” then 1 point; If details are also provided then +2 points
3 (b)
What is the schedule for construction, indicating the position separately relating to plant and machinery and civil works, raw materials, manpower etc. together with year‐wise phasing.
3
If the year wise and component wise (Expenditure Head) break‐up is present then 3 points; If either of the 1 is present then 2 points
3 ( c)
Whether physical and financial targets match with each other.
4
If there is a detailed tabulation year wise & component wise then 4 points; If there is either year‐wise or component wise only then 2 points; If the answer is Yes then only 1 point
3 (d)
What is the target date for completion and when will the expected benefits commence? 5
If month and year is given or Plan Period is given then 3 points; If any details are given pertaining to commencement of benefits then 2 points, else 0
Total 15

11 | P a g e
Scoring for the “Expenditure Involved & Reliability of Cost Estimates” Component:
EXPENDITURE INVOLVED + RELIABILITY OF COST ESTIMATES
Q. No. Question Actual Score Given
Total Score
Scoring Method
4 (a)
What is the total expenditure (non‐recurring and recurring): Indicate the position year‐wise and also whether any budget provision has been made and if not, how it is proposed to be arranged? Has any expenditure been incurred already?
10
If total expenses (RC & NRC) along with year wise and component wise is provided then 10 points; If only year wise or only component wise is provided then 5 points; In case any project has already incurred expenses and the details have not been shared then give ‐2(Look for mobilization strategy in other projects for further review)
4 (b)
Details of the scheme of financing clearly bringing out the financial obligations undertaken by the PSU/Ministry with or without the proposal under consideration. In other words, details of commitment on account of on‐going projects to be funded from internal resources of the PSU may be given in the EFC Note along with the requirement and availability of funds for the project under consideration. In case of schemes / programs, Five Year Plan Outlay for the Ministry/Department and commitments on ongoing schemes/programs along with the requirement and availability of funds for the scheme/program may be furnished.
2
If all details relevant to question (including FYP outlay for ministry/department, Commitments on ongoing schemes/programs, requirement and availability of funds for the scheme/program under consideration) are provided then 2 points; If partial details are provided then 1 point; If no details are provided then 0 point
4 (d)
Phasing of expenditure (non‐recurring and recurring): (i) On constant prices; (ii) On completion cost
8
Phasing of expenditure is provided year‐wise @ constant prices then 6 points; If phasing of expenditure @ completion cost is provided then + 2
4 (e)
Reference date and basis of cost estimates of various components.
6
If reference date / time period/ financial year is mentioned then 3 points; If basis is provided in full then +3 in case it is partial in nature then +1
5 (a)
Has pre‐project investigations been arrived at in detail and details of area where changes in project parameters could be anticipated?
4
If pre‐project investigations have been provided then 2 points; If areas where project parameters are anticipated to be changed are mentioned then +1 if these details are quantified then and additional +1
Total 30

12 | P a g e
Scoring for the “Operational Capabilities” Component:
OPERATIONAL CAPABILITIES
Q. No. Question Actual Score Given
Total Score
Scoring Method
6 (a)
Operational capability of PSU/Department/Implementing Agency/Ministry to undertake the tasks required for the implementation of the proposal under consideration. For this purpose, track record of the PSU in respect of the projects already implemented/under implementation may be highlighted and also steps proposed for ensuring timely execution of the project under consideration .
15
Only track record is mentioned then 2 points; Identification of agency that would develop capacity but no details w.r.t nature of capacity development then 5 points; Future plans to establish capacity/capabilities in detail aligned with the components 6 points; If any of the above along with time‐lines are mentioned then +2 points
Total 15
Scoring for the “Points on which Decisions/ Sanctions required” Component:
POINTS ON WHICH DECISIONS/SANCTIONS REQUIRED
Q. No. Question Actual Score Given
Total Score
Scoring Method
26
Points on which decisions/sanctions are required.
5
If the statement just mentions the cost of project on which decision is expected then 2 points; If additional points are mentioned for decision to be taken then 5 points
Total 5
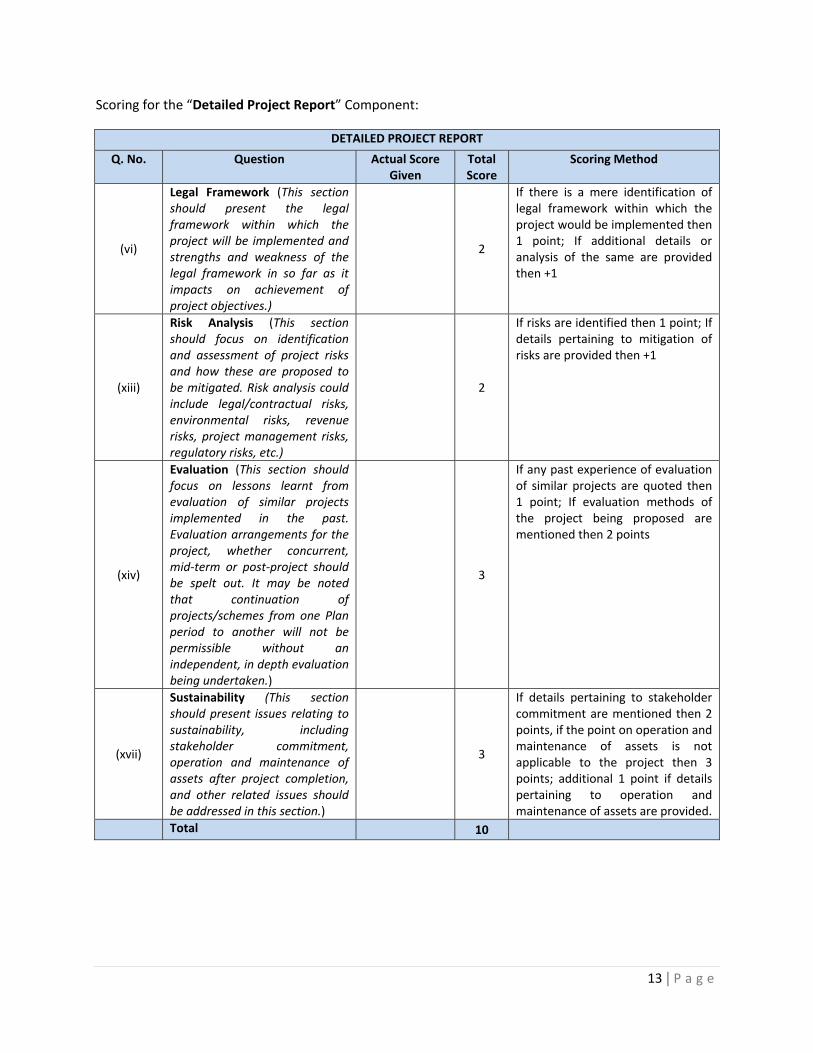
13 | P a g e
Scoring for the “Detailed Project Report” Component:
DETAILED PROJECT REPORT
Q. No. Question Actual Score Given
Total Score
Scoring Method
(vi)
Legal Framework (This section should present the legal framework within which the project will be implemented and strengths and weakness of the legal framework in so far as it impacts on achievement of project objectives.)
2
If there is a mere identification of legal framework within which the project would be implemented then 1 point; If additional details or analysis of the same are provided then +1
(xiii)
Risk Analysis (This section should focus on identification and assessment of project risks and how these are proposed to be mitigated. Risk analysis could include legal/contractual risks, environmental risks, revenue risks, project management risks, regulatory risks, etc.)
2
If risks are identified then 1 point; If details pertaining to mitigation of risks are provided then +1
(xiv)
Evaluation (This section should focus on lessons learnt from evaluation of similar projects implemented in the past. Evaluation arrangements for the project, whether concurrent, mid‐term or post‐project should be spelt out. It may be noted that continuation of projects/schemes from one Plan period to another will not be permissible without an independent, in depth evaluation being undertaken.)
3
If any past experience of evaluation of similar projects are quoted then 1 point; If evaluation methods of the project being proposed are mentioned then 2 points
(xvii)
Sustainability (This section should present issues relating to sustainability, including stakeholder commitment, operation and maintenance of assets after project completion, and other related issues should be addressed in this section.)
3
If details pertaining to stakeholder commitment are mentioned then 2 points, if the point on operation and maintenance of assets is not applicable to the project then 3 points; additional 1 point if details pertaining to operation and maintenance of assets are provided.
Total 10
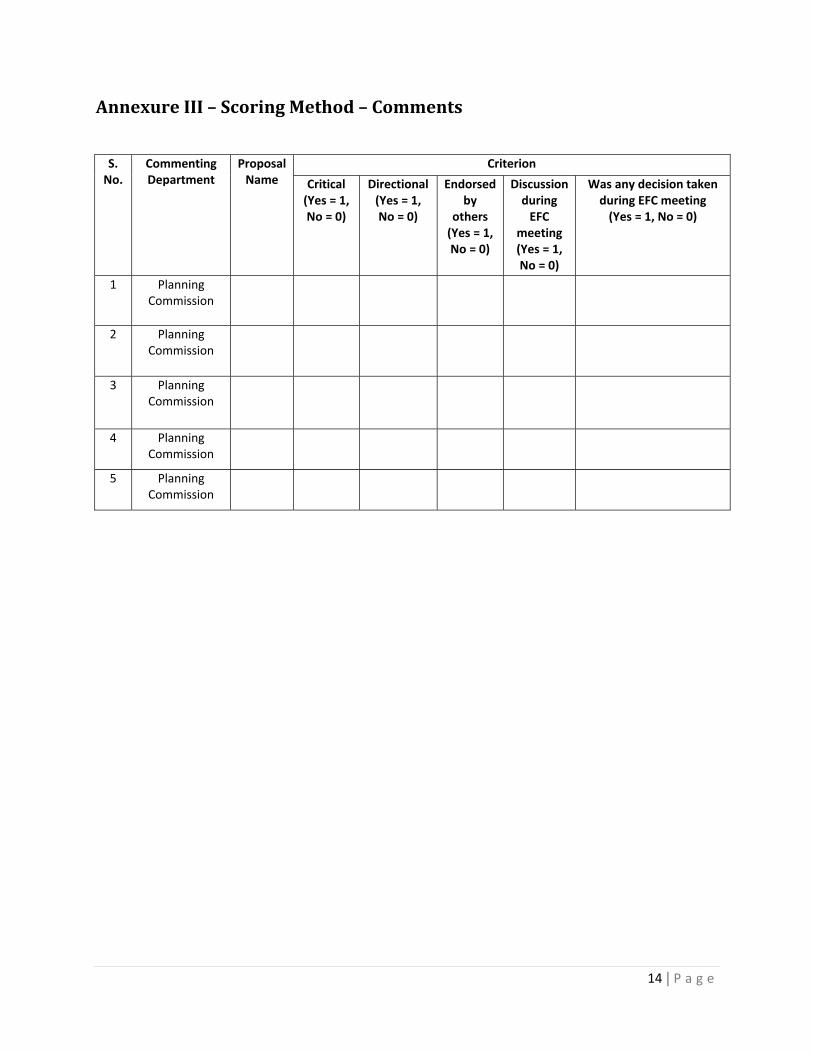
14 | P a g e
AnnexureIII–ScoringMethod–Comments
S. No.
Commenting Department
Proposal Name
Criterion
Critical (Yes = 1, No = 0)
Directional(Yes = 1, No = 0)
Endorsed by
others (Yes = 1, No = 0)
Discussion during EFC
meeting (Yes = 1, No = 0)
Was any decision taken during EFC meeting (Yes = 1, No = 0)
1 Planning Commission
2 Planning Commission
3 Planning Commission
4 Planning Commission
5 Planning Commission

15 | P a g e
AnnexureIV–ProposedEFCMemo/ProposalFormat(ProjectValueLessthanINR1000Crores)
Proposed EFC Memo/Proposal Format
(Project Value Less than INR 1000 Crores)
1 Project Identification
1.1 Title of the project/ scheme:
1.2 Name of the sponsoring agency (Ministry/Department/ Autonomous Body/ Central PSE):
1.3 Nature of Scheme (Select from below)
a) Central Sector Scheme b) Centrally Sponsored Scheme c) Additional Central Assistance
1.4 Mention the relevant Objectives of the Plan which this Project addresses and how it seeks to
meet the objectives
1.5 Mention the relevant programme under which the project is proposed and how it seeks to fulfil
the targets of the programme.
1.6 Discuss the performance gap of the relevant plan targets / programme targets and how this
project seeks to address it.
1.7 Nature of Proposal (Select from below)
a) New Proposal b) Modified Proposal c) Revised Cost Estimate
(In case of nature is selected as Revised Cost Estimate, please complete the ‘RCE Proposal Format’)
1.8 Proposed duration of the project:
1.9 Mention time gap between Date of Approval and Date of Implementation of project/ scheme:
2 Project/Scheme Cost
2.1 Total cost of the project over the proposed duration (Mention in figures only):
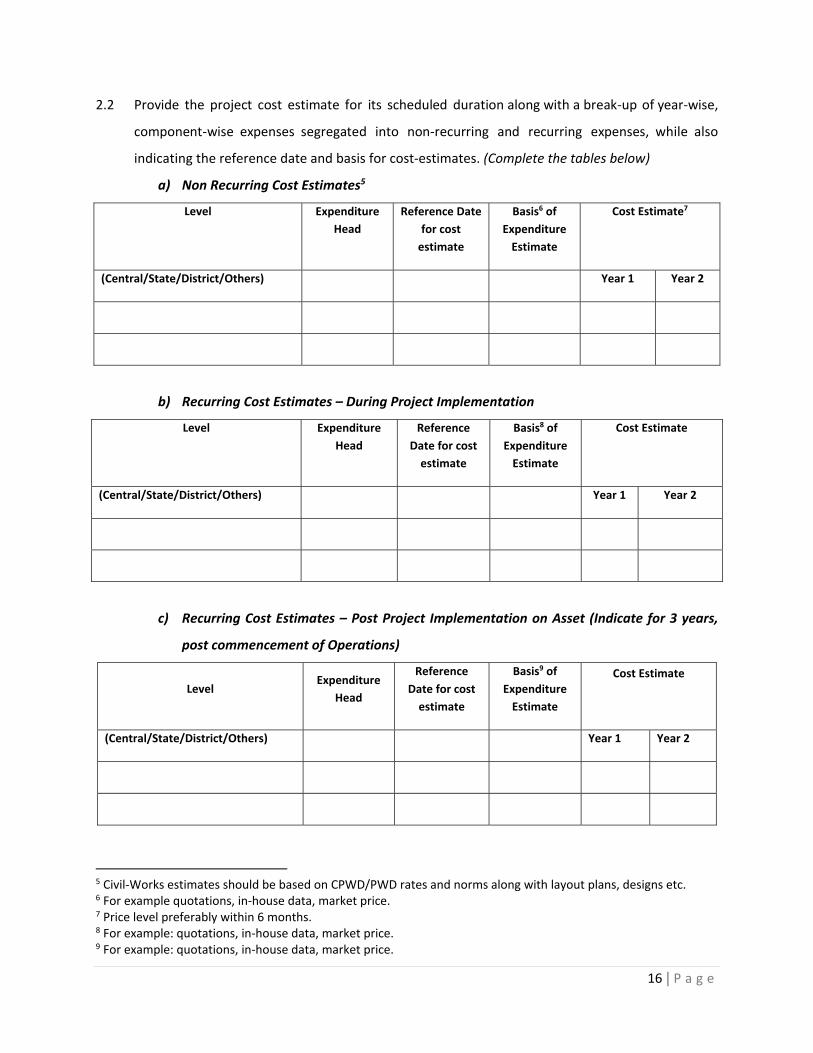
16 | P a g e
2.2 Provide the project cost estimate for its scheduled duration along with a break‐up of year‐wise,
component‐wise expenses segregated into non‐recurring and recurring expenses, while also
indicating the reference date and basis for cost‐estimates. (Complete the tables below)
a) Non Recurring Cost Estimates5
Level Expenditure
Head
Reference Date
for cost
estimate
Basis6 of
Expenditure
Estimate
Cost Estimate7
(Central/State/District/Others) Year 1 Year 2
b) Recurring Cost Estimates – During Project Implementation
Level Expenditure
Head
Reference
Date for cost
estimate
Basis8 of
Expenditure
Estimate
Cost Estimate
(Central/State/District/Others) Year 1 Year 2
c) Recurring Cost Estimates – Post Project Implementation on Asset (Indicate for 3 years,
post commencement of Operations)
Level Expenditure
Head
Reference
Date for cost
estimate
Basis9 of
Expenditure
Estimate
Cost Estimate
(Central/State/District/Others) Year 1 Year 2
5 Civil‐Works estimates should be based on CPWD/PWD rates and norms along with layout plans, designs etc. 6 For example quotations, in‐house data, market price. 7 Price level preferably within 6 months. 8 For example: quotations, in‐house data, market price. 9 For example: quotations, in‐house data, market price.

17 | P a g e
2.3 Indicate cost components that can vary, the factors that could cause the variation and the extent
of the expected variation.
2.4 In case the project/ scheme involve payout of subsidy, the year wise expected outgo, up to the
last year of payout, may be indicated.
2.5 What is the foreign exchange component (separately for non‐recurring and recurring
expenditure)? What are the items of expenditure involving foreign exchange and expenditure on
foreign experts? Has clearance of E.A.D. been obtained and has availability of credit facilities
been explored and if so, with what result?
2.6 Mention details of other financial commitments under the sponsoring Ministry.
2.7 Details of Projected Expenditure vis‐à‐vis Financing
Expenditure Financing Funding Gap
NRC
Expenditure
RC
Expenditure Total
Financing
already
secured
Central
Ministry
(Plan
Finance)
State
Government
External
Source
Funding Gap
by how
much?
Proposal to
fill funding
gap
Year 1
Year 2
Year 3
Total
3 Policy and Project Context
3.1 Quote the objectives from the ‘RFD’ document of the Ministry/ Department within which this
proposed project/ scheme is envisaged. (Attach the relevant ‘RFD’ document of the
Ministry/Department)
3.2 Describe the historical background and context of the proposed project/ scheme
3.3 Provide details of previous and on‐going schemes with overlapping objective
a) List down schemes with overlapping objectives
b) Details of outlay and expenditure on the aforementioned schemes
Scheme Name Outlay Expenses Incurred
Scheme 1
c) Mention key findings of evaluation/achievements of aforementioned schemes
(This section should elaborate the section 1.3 and 1.4)
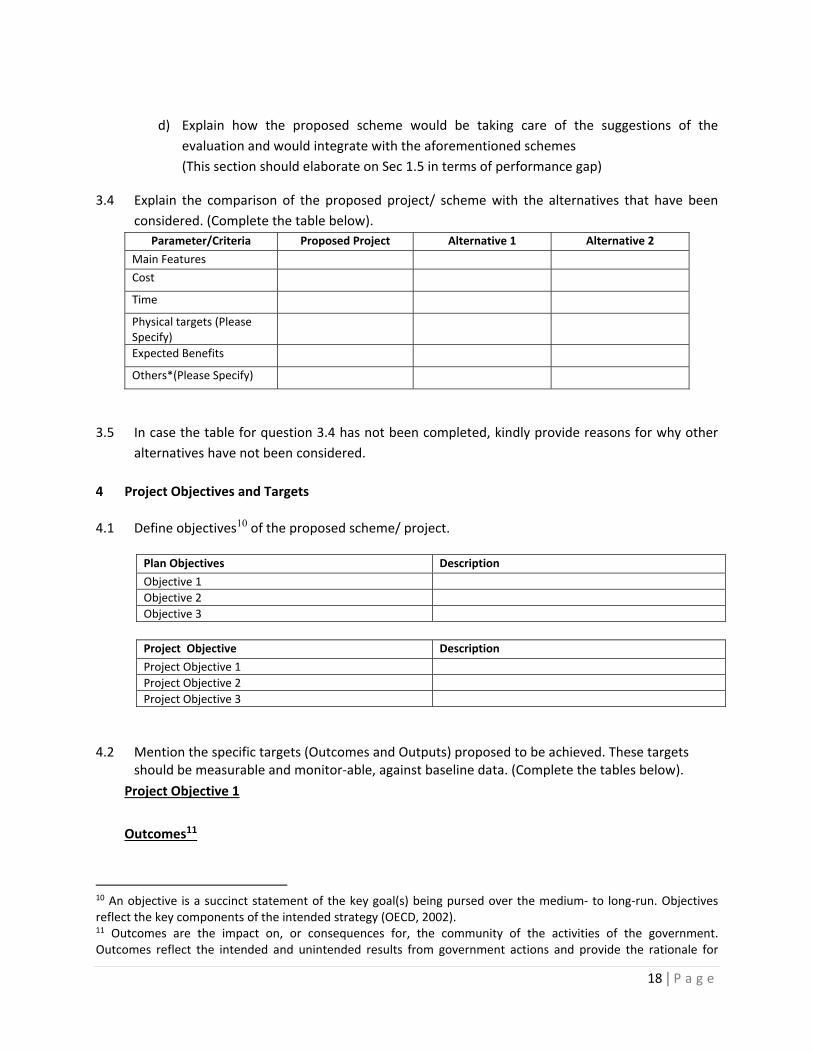
18 | P a g e
d) Explain how the proposed scheme would be taking care of the suggestions of the
evaluation and would integrate with the aforementioned schemes
(This section should elaborate on Sec 1.5 in terms of performance gap)
3.4 Explain the comparison of the proposed project/ scheme with the alternatives that have been
considered. (Complete the table below).
Parameter/Criteria Proposed Project Alternative 1 Alternative 2
Main Features
Cost
Time
Physical targets (Please Specify)
Expected Benefits
Others*(Please Specify)
3.5 In case the table for question 3.4 has not been completed, kindly provide reasons for why other
alternatives have not been considered.
4 Project Objectives and Targets
4.1 Define objectives10 of the proposed scheme/ project. Plan Objectives Description
Objective 1
Objective 2
Objective 3
Project Objective Description
Project Objective 1
Project Objective 2
Project Objective 3
4.2 Mention the specific targets (Outcomes and Outputs) proposed to be achieved. These targets should be measurable and monitor‐able, against baseline data. (Complete the tables below).
Project Objective 1
Outcomes11
10 An objective is a succinct statement of the key goal(s) being pursed over the medium‐ to long‐run. Objectives reflect the key components of the intended strategy (OECD, 2002). 11 Outcomes are the impact on, or consequences for, the community of the activities of the government. Outcomes reflect the intended and unintended results from government actions and provide the rationale for
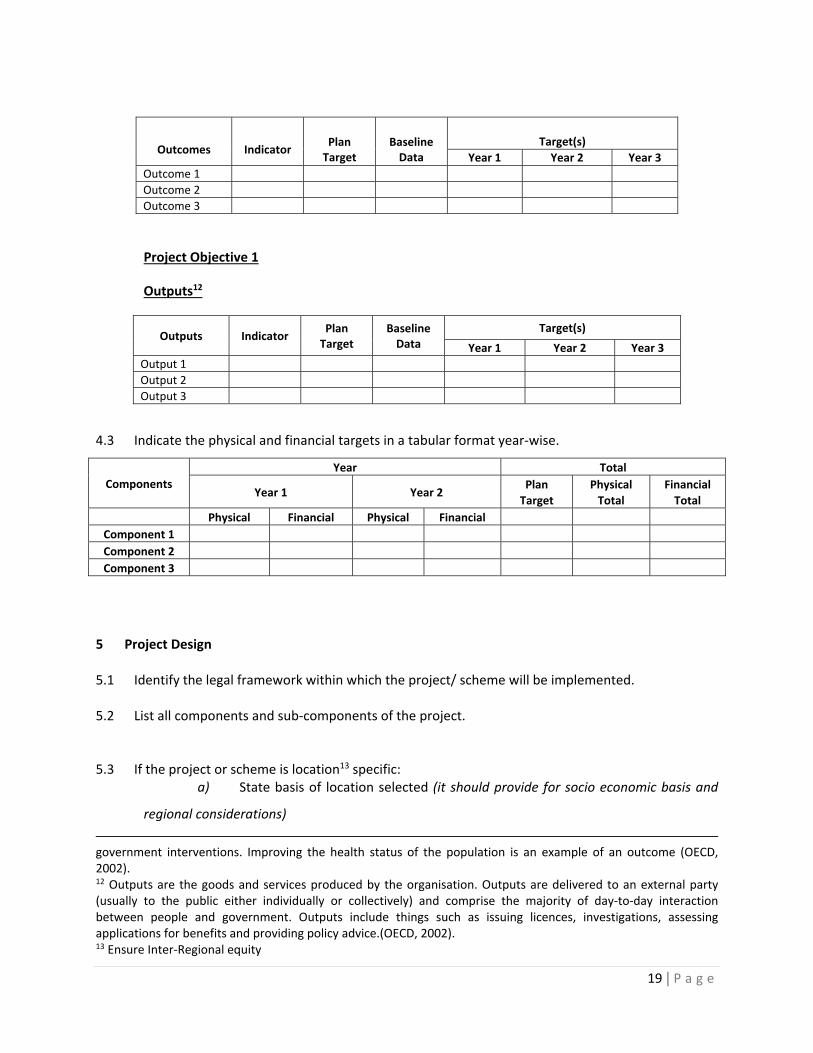
19 | P a g e
Outcomes Indicator Plan Target
Baseline Data
Target(s)
Year 1 Year 2 Year 3
Outcome 1
Outcome 2
Outcome 3
Project Objective 1
Outputs12
Outputs Indicator Plan Target
Baseline Data
Target(s)
Year 1 Year 2 Year 3
Output 1
Output 2
Output 3
4.3 Indicate the physical and financial targets in a tabular format year‐wise.
Components
Year Total
Year 1 Year 2 Plan
Target
Physical
Total
Financial
Total
Physical Financial Physical Financial
Component 1
Component 2
Component 3
5 Project Design
5.1 Identify the legal framework within which the project/ scheme will be implemented.
5.2 List all components and sub‐components of the project.
5.3 If the project or scheme is location13 specific: a) State basis of location selected (it should provide for socio economic basis and
regional considerations)
government interventions. Improving the health status of the population is an example of an outcome (OECD, 2002). 12 Outputs are the goods and services produced by the organisation. Outputs are delivered to an external party (usually to the public either individually or collectively) and comprise the majority of day‐to‐day interaction between people and government. Outputs include things such as issuing licences, investigations, assessing applications for benefits and providing policy advice.(OECD, 2002). 13 Ensure Inter‐Regional equity
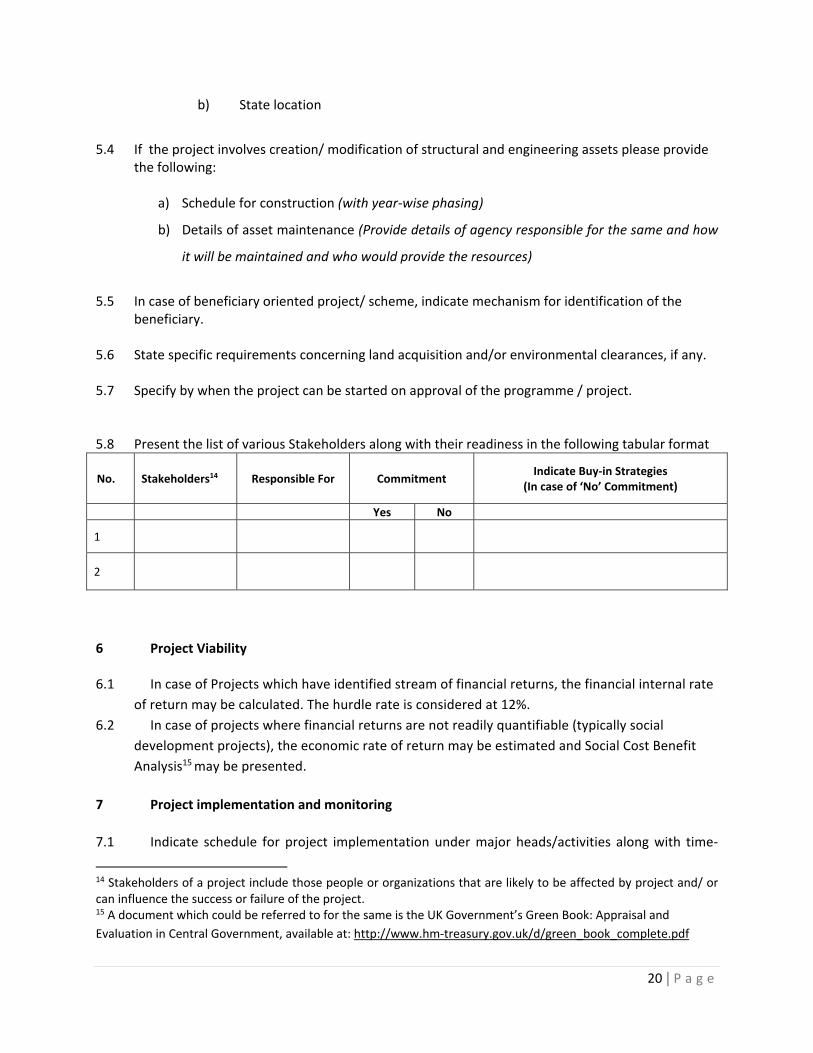
20 | P a g e
b) State location
5.4 If the project involves creation/ modification of structural and engineering assets please provide
the following:
a) Schedule for construction (with year‐wise phasing)
b) Details of asset maintenance (Provide details of agency responsible for the same and how
it will be maintained and who would provide the resources)
5.5 In case of beneficiary oriented project/ scheme, indicate mechanism for identification of the
beneficiary.
5.6 State specific requirements concerning land acquisition and/or environmental clearances, if any.
5.7 Specify by when the project can be started on approval of the programme / project.
5.8 Present the list of various Stakeholders along with their readiness in the following tabular format
No. Stakeholders14 Responsible For Commitment Indicate Buy‐in Strategies
(In case of ‘No’ Commitment)
Yes No
1
2
6 Project Viability
6.1 In case of Projects which have identified stream of financial returns, the financial internal rate
of return may be calculated. The hurdle rate is considered at 12%.
6.2 In case of projects where financial returns are not readily quantifiable (typically social
development projects), the economic rate of return may be estimated and Social Cost Benefit
Analysis15 may be presented.
7 Project implementation and monitoring
7.1 Indicate schedule for project implementation under major heads/activities along with time‐
14 Stakeholders of a project include those people or organizations that are likely to be affected by project and/ or can influence the success or failure of the project. 15 A document which could be referred to for the same is the UK Government’s Green Book: Appraisal and
Evaluation in Central Government, available at: http://www.hm‐treasury.gov.uk/d/green_book_complete.pdf

21 | P a g e
lines and different levels of government
Major Activity/Head/Component Target Level of Government Timeline for implementation
Objective 1 ‐
7.2 Operational and Human Resource capabilities:
i. Mention steps to develop operational capabilities16
ii. Provide Institutional Framework for implementation (in flow chart form)
iii. In case of additional manpower requirement, please indicate the phased
requirement over the project timeline (i.e. year‐wise break‐ up of the manpower
requirement)
7.3 Monitoring for the project/ scheme proposed by Outcomes and Outputs
Outcomes
Outcomes
Details regarding Data
Agency Responsible for
Data Collection
Methodology for Data
Collection Frequency of Data Collection
Outcome 1
Outcome 2
Outputs
Outputs
Details regarding Data
Agency Responsible for
Data Collection
Methodology for Data
Collection Frequency of Data Collection
Output 1
Output 2
8 Project Risks
8.1 Indicate foreseeable risks which can affect the project design, costing and implementation of
the project.
Identified Risk Impact of Risk Mitigation Strategy17
16 Recognize differential capacities of the states as part of Pre‐Implementation strategy
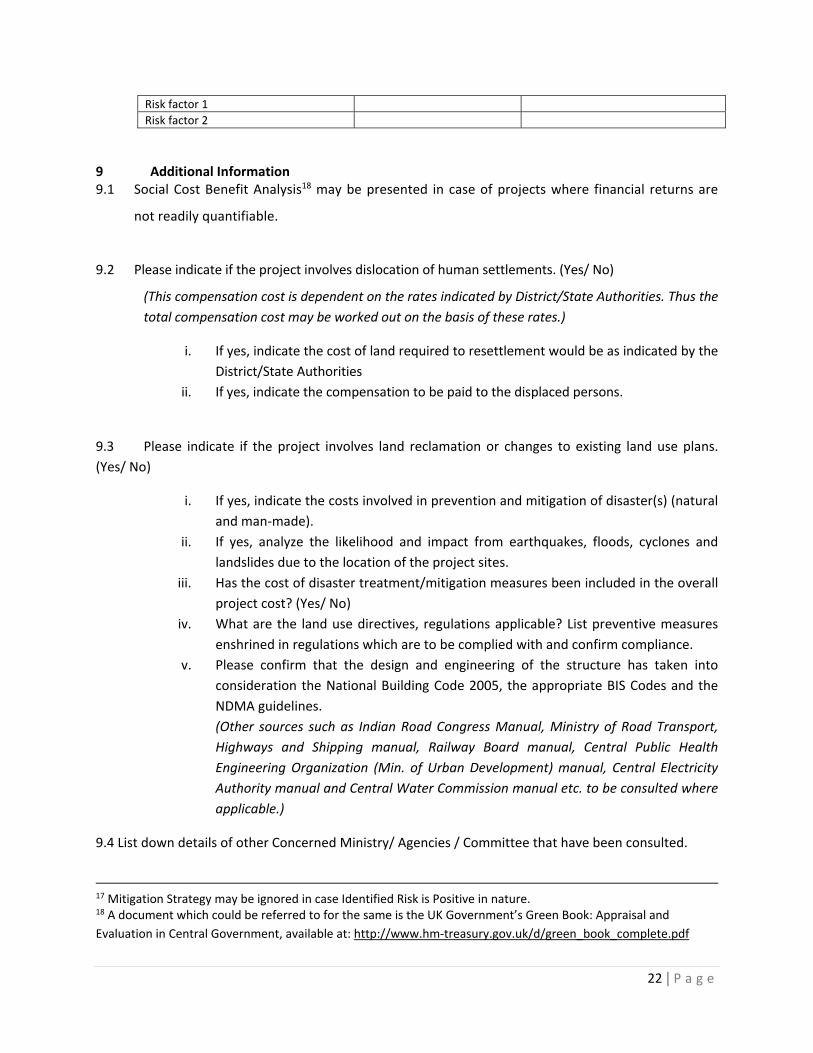
22 | P a g e
Risk factor 1
Risk factor 2
9 Additional Information 9.1 Social Cost Benefit Analysis18 may be presented in case of projects where financial returns are
not readily quantifiable.
9.2 Please indicate if the project involves dislocation of human settlements. (Yes/ No)
(This compensation cost is dependent on the rates indicated by District/State Authorities. Thus the
total compensation cost may be worked out on the basis of these rates.)
i. If yes, indicate the cost of land required to resettlement would be as indicated by the
District/State Authorities
ii. If yes, indicate the compensation to be paid to the displaced persons.
9.3 Please indicate if the project involves land reclamation or changes to existing land use plans.
(Yes/ No)
i. If yes, indicate the costs involved in prevention and mitigation of disaster(s) (natural
and man‐made).
ii. If yes, analyze the likelihood and impact from earthquakes, floods, cyclones and
landslides due to the location of the project sites.
iii. Has the cost of disaster treatment/mitigation measures been included in the overall
project cost? (Yes/ No)
iv. What are the land use directives, regulations applicable? List preventive measures
enshrined in regulations which are to be complied with and confirm compliance.
v. Please confirm that the design and engineering of the structure has taken into
consideration the National Building Code 2005, the appropriate BIS Codes and the
NDMA guidelines.
(Other sources such as Indian Road Congress Manual, Ministry of Road Transport,
Highways and Shipping manual, Railway Board manual, Central Public Health
Engineering Organization (Min. of Urban Development) manual, Central Electricity
Authority manual and Central Water Commission manual etc. to be consulted where
applicable.)
9.4 List down details of other Concerned Ministry/ Agencies / Committee that have been consulted.
17 Mitigation Strategy may be ignored in case Identified Risk is Positive in nature. 18 A document which could be referred to for the same is the UK Government’s Green Book: Appraisal and
Evaluation in Central Government, available at: http://www.hm‐treasury.gov.uk/d/green_book_complete.pdf
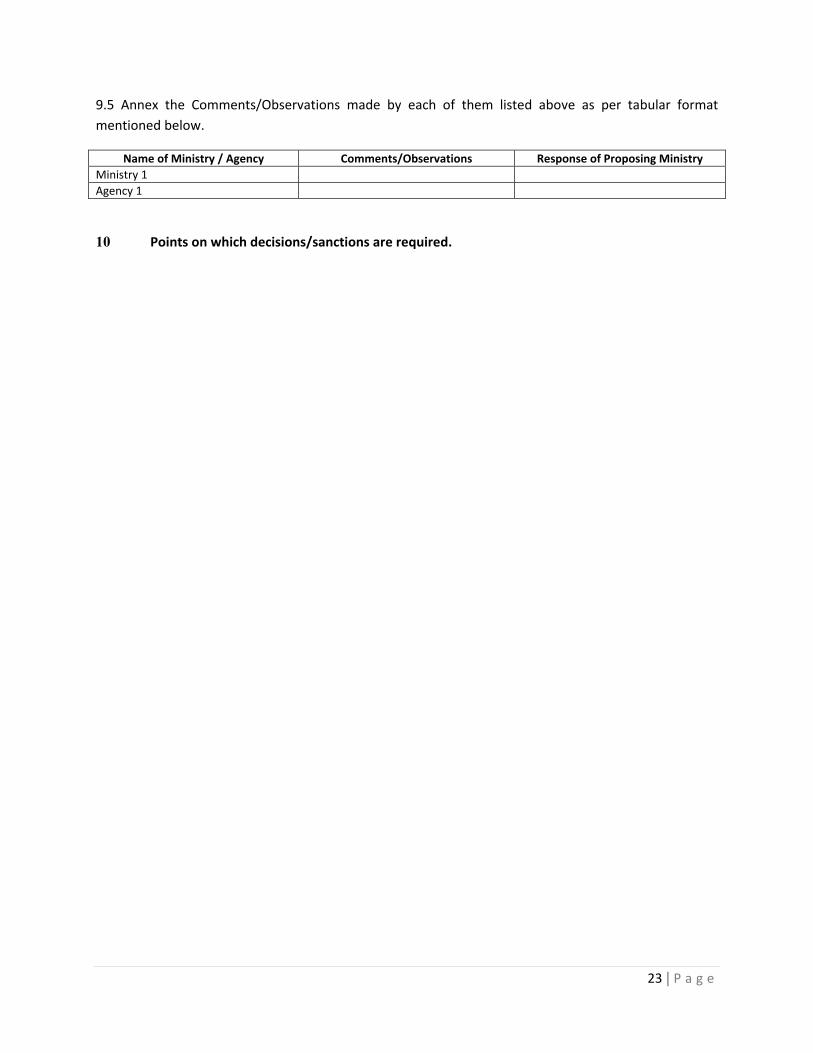
23 | P a g e
9.5 Annex the Comments/Observations made by each of them listed above as per tabular format
mentioned below.
Name of Ministry / Agency Comments/Observations Response of Proposing Ministry
Ministry 1
Agency 1
10 Points on which decisions/sanctions are required.
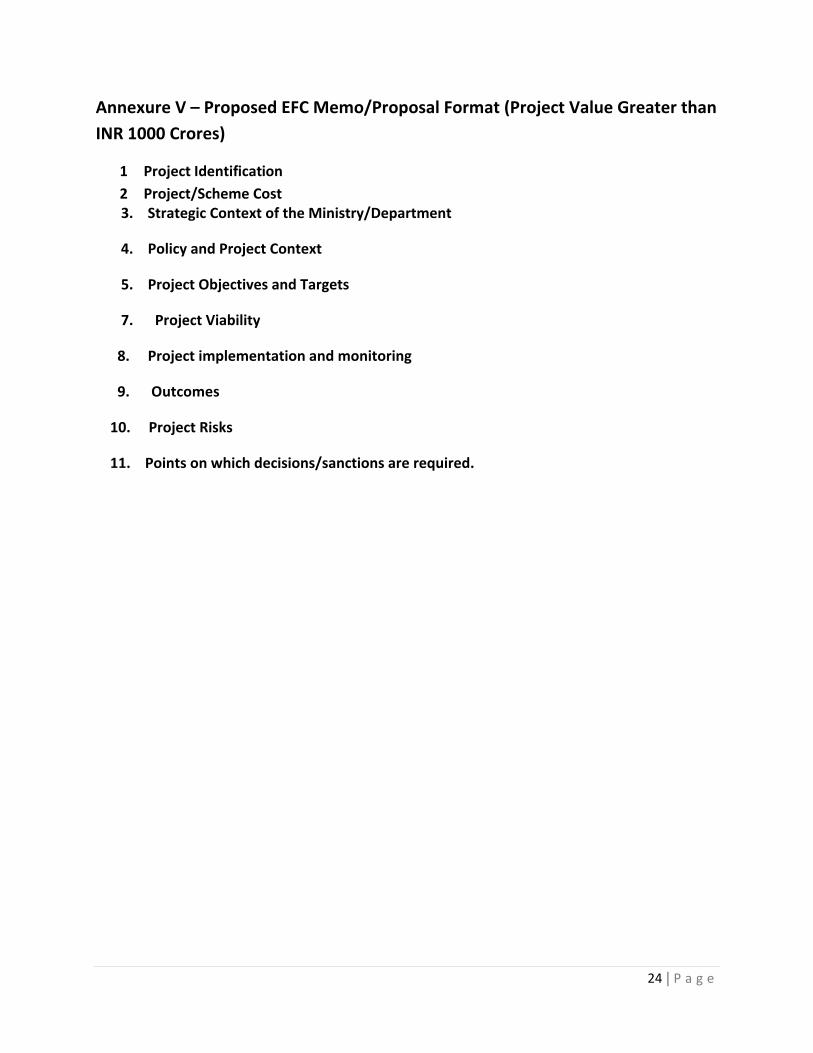
24 | P a g e
Annexure V – Proposed EFC Memo/Proposal Format (Project Value Greater than
INR 1000 Crores)
1 Project Identification
2 Project/Scheme Cost 3. Strategic Context of the Ministry/Department
4. Policy and Project Context
5. Project Objectives and Targets
7. Project Viability
8. Project implementation and monitoring
9. Outcomes
10. Project Risks
11. Points on which decisions/sanctions are required.

25 | P a g e
Proposed EFC Memo/Proposal Format
(Project Value Greater than or Equal to INR 1000 Crores)
3 Project Identification
1.1 Title of the project/ scheme:
1.2 Name of the sponsoring agency (Ministry/Department/ Autonomous Body/ Central PSE)
1.3 Mention the relevant Objectives of the Plan which this Project addresses and how it seeks to meet
the objectives
1.4 Discuss the relevant programme under which the project is proposed and how it seeks to fulfil the
targets of the programme.
1.5 Linkages among Plan, Programmes , Activities and Targets.
Plan / Programme
Objectives
Project Objectives Activity Physical targets
Programme Objective 1 Project Objective 1 Activity 1 Annual Target
1.6 Discuss the performance gap of the relevant plan targets / programme targets and how this project
seeks to address it.
This should include summary of evaluation studies done and the implementation of the gaps.
1.7 Nature of Scheme (Select from below)
a) Central Sector Scheme b) Centrally Sponsored Scheme c) Additional Central Assistance
1.4 Nature of Proposal (Select from below)
a) New Proposal b) Modified Proposal c) Revised Cost Estimate
1.5 Proposed duration of the project:
1.6 Mention start up time from the Date of Approval of the Project:
2 Project/Scheme Cost

26 | P a g e
2.1 Total cost of the project over the proposed duration (Mention in figures only):
2.2 Provide the project cost estimate for its scheduled duration along with a break‐up of year‐wise,
component‐wise expenses segregated into non‐recurring and recurring expenses, while also
indicating the reference date and basis for cost‐estimates. (Complete the tables below)
i. Non Recurring Cost Estimates19
Level Expenditure
Head
Reference
Date for cost
estimate
Basis20 of
Expenditure
Estimate
Cost Estimate
(Central/State/District/Others) Year 1 Year 2
ii. Recurring Cost Estimates –
During Project Implementation
Level Expenditure
Head
Reference
Date for cost
estimate
Basis21 of
Expenditure
Estimate
Cost Estimate
(Central/State/District/Others) Year 1 Year 2
iii. Recurring Cost Estimates – Post
Project Implementation on Asset (Indicate for 3 years, post commencement of
Operations)
Level Expenditure
Head
Reference
Date for cost
estimate
Basis22 of
Expenditure
Estimate
Cost Estimate
19 Civil‐Works estimates should be based on CPWD/PWD rates and norms along with layout plans, designs etc. 20 For example: quotations, in‐house data, market price. 21 For example: quotations, in‐house data, market price. 22 For example: quotations, in‐house data, market price.
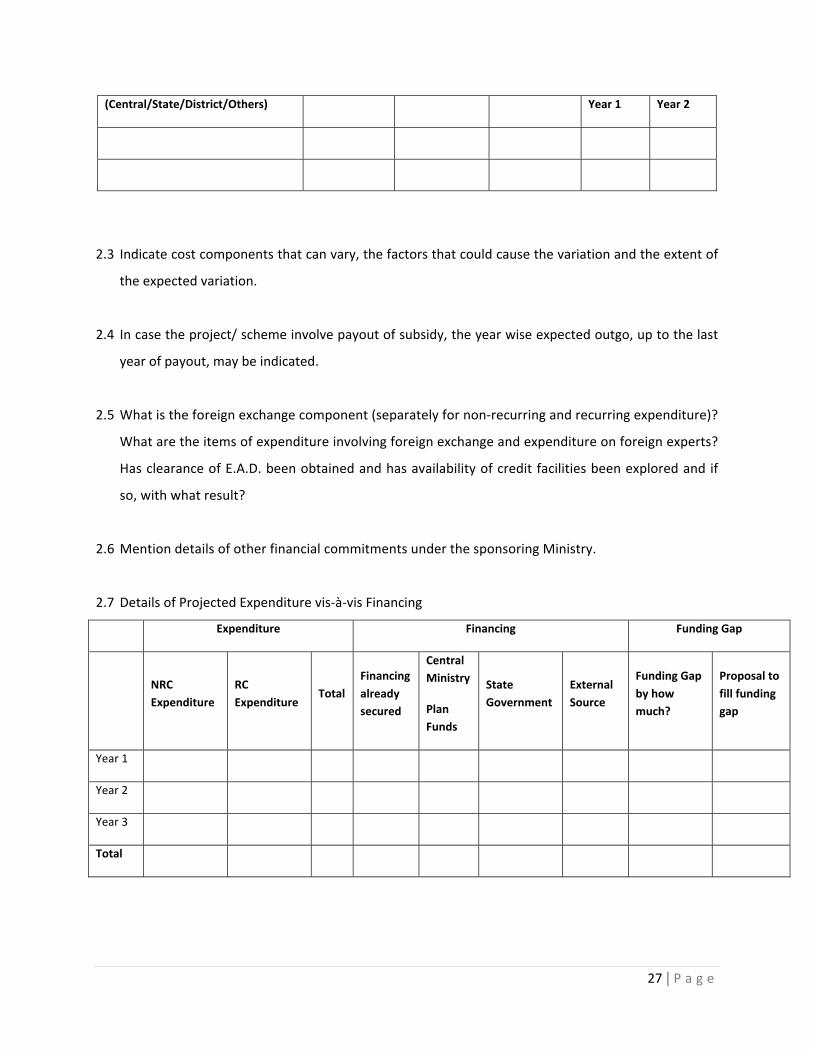
27 | P a g e
(Central/State/District/Others) Year 1 Year 2
2.3 Indicate cost components that can vary, the factors that could cause the variation and the extent of
the expected variation.
2.4 In case the project/ scheme involve payout of subsidy, the year wise expected outgo, up to the last
year of payout, may be indicated.
2.5 What is the foreign exchange component (separately for non‐recurring and recurring expenditure)?
What are the items of expenditure involving foreign exchange and expenditure on foreign experts?
Has clearance of E.A.D. been obtained and has availability of credit facilities been explored and if
so, with what result?
2.6 Mention details of other financial commitments under the sponsoring Ministry.
2.7 Details of Projected Expenditure vis‐à‐vis Financing
Expenditure Financing Funding Gap
NRC
Expenditure
RC
Expenditure Total
Financing
already
secured
Central
Ministry
Plan
Funds
State
Government
External
Source
Funding Gap
by how
much?
Proposal to
fill funding
gap
Year 1
Year 2
Year 3
Total
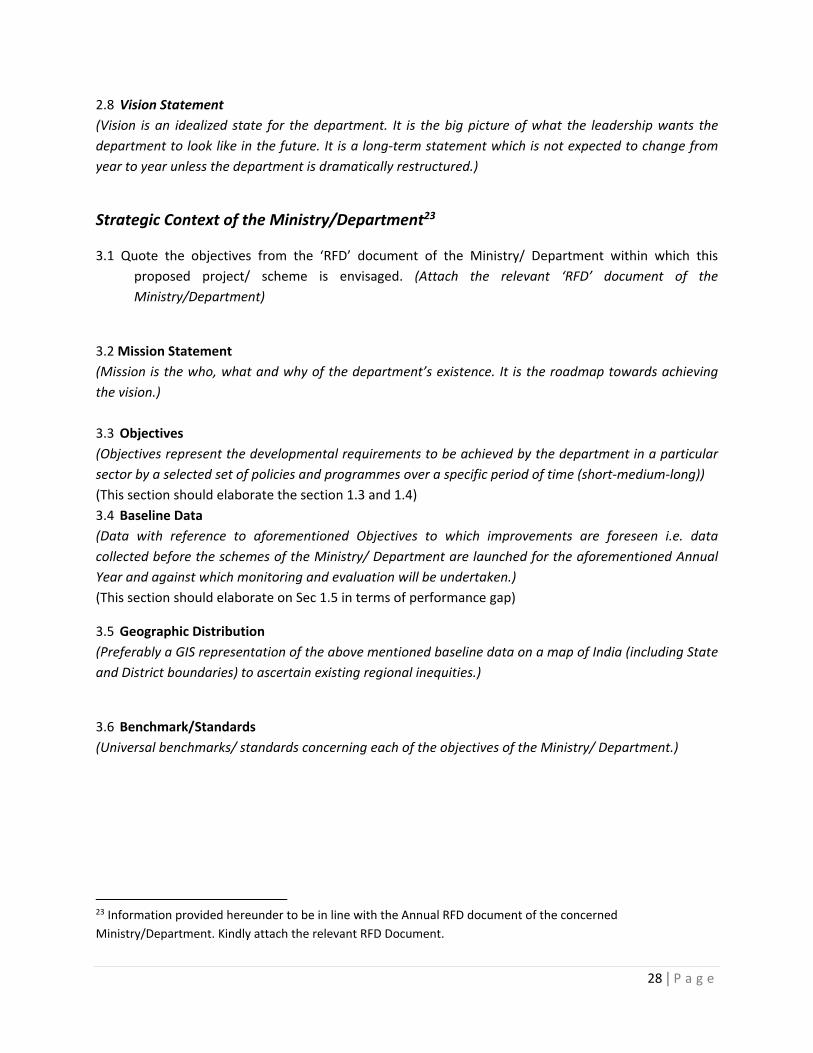
28 | P a g e
2.8 Vision Statement
(Vision is an idealized state for the department. It is the big picture of what the leadership wants the
department to look like in the future. It is a long‐term statement which is not expected to change from
year to year unless the department is dramatically restructured.)
Strategic Context of the Ministry/Department23
3.1 Quote the objectives from the ‘RFD’ document of the Ministry/ Department within which this
proposed project/ scheme is envisaged. (Attach the relevant ‘RFD’ document of the
Ministry/Department)
3.2 Mission Statement
(Mission is the who, what and why of the department’s existence. It is the roadmap towards achieving
the vision.)
3.3 Objectives
(Objectives represent the developmental requirements to be achieved by the department in a particular
sector by a selected set of policies and programmes over a specific period of time (short‐medium‐long))
(This section should elaborate the section 1.3 and 1.4)
3.4 Baseline Data
(Data with reference to aforementioned Objectives to which improvements are foreseen i.e. data
collected before the schemes of the Ministry/ Department are launched for the aforementioned Annual
Year and against which monitoring and evaluation will be undertaken.)
(This section should elaborate on Sec 1.5 in terms of performance gap)
3.5 Geographic Distribution
(Preferably a GIS representation of the above mentioned baseline data on a map of India (including State
and District boundaries) to ascertain existing regional inequities.)
3.6 Benchmark/Standards
(Universal benchmarks/ standards concerning each of the objectives of the Ministry/ Department.)
23 Information provided hereunder to be in line with the Annual RFD document of the concerned
Ministry/Department. Kindly attach the relevant RFD Document.

29 | P a g e
4 Policy and Project Context
iii. Quote the objectives from the ‘RFD’ document of the Ministry/ Department within
which this proposed project/ scheme is envisaged. (Attach the relevant ‘RFD’ document
of the Ministry/Department)
iv. Describe the historical background and context of the proposed project/ scheme
v. Provide details of previous and on‐going schemes with overlapping objective
a) List down schemes with overlapping objectives
b) Details of outlay and expenditure on the aforementioned schemes
Scheme Name Outlay Expenses Incurred
Scheme 1
c) Mention key findings of evaluation/achievements of aforementioned schemes
d) Explain how the proposed scheme would be taking care of the suggestions of the evaluation and
would integrate with the aforementioned schemes
vi. Explain the comparison of the proposed project/ scheme with the alternatives that have
been considered. (Complete the table below).
Parameter/Criteria Proposed Project Alternative 1 Alternative 2
Main Features
Cost
Time
Physical targets (Please Specify)
Expected Benefits
Others*(Please Specify)
vii. In case the table for question 4.4 has not been completed, kindly provide reasons for
why other alternatives have not been considered.
d. Project Objectives and Targets
i. Define objectives24 of the proposed scheme/ project.
Plan Objectives Description
Project Objective 1 Description
Project Objective 2
Project Objective 3
24 An objective is a succinct statement of the key goal(s) being pursed over the medium‐ to long‐run. Objectives reflect the key components of the intended strategy (OECD, 2002).

30 | P a g e
ii. Indicate how the aforementioned Objectives would fulfil the major objectives of the
Ministry/Department (Indicated in 2.3)
iii. Mention the specific targets (Outcomes and Outputs) proposed to be achieved. These
targets should be measurable and monitor‐able, against baseline data. (Complete the
tables below).
Project Objective 1
Outcomes25
Outcomes Indicator Plan Target
Baseline Data
Target(s)
Year 1 Year 2 Year 3
Outcome 1
Outcome 2
Outcome 3
Project Objective 1
Project Outputs26
Indicator Plan target
Baseline Data
Target(s)
Year 1 Year 2 Year 3
Output 1
Output 2
Output 3
iv. Mention the Success Indicators (from the RFD Document) relevant to the Proposed
Project/Scheme.
v. Indicate the physical and financial targets in a tabular format year‐wise.
Components
Year Total
Year 1 Year 2 Plan
Target
Physical
Total
Financial
Total
Physical Financial Physical Financial
Component 1
25 Outcomes are the impact on, or consequences for, the community of the activities of the government. Outcomes reflect the intended and unintended results from government actions and provide the rationale for government interventions. Improving the health status of the population is an example of an outcome (OECD, 2002). 26 Outputs are the goods and services produced by the organisation. Outputs are delivered to an external party (usually to the public either individually or collectively) and comprise the majority of day‐to‐day interaction between people and government. Outputs include things such as issuing licences, investigations, assessing applications for benefits and providing policy advice.(OECD, 2002).

31 | P a g e
Component 2
Component 3
e. Project Design
i. Identify the legal framework within which the project/ scheme will be implemented.
ii. List all components and sub‐components of the Project.
iii. If the project or scheme is location27 specific:
a) State basis of location selected (it should provide for socio economic basis and regional
considerations)
b) State location
iv. If the project involves creation/ modification of structural and engineering assets
please provide the following:
c) Schedule for construction (with year‐wise phasing)
d) Details of asset maintenance (Provide details of agency responsible for the same and how
it will be maintained and who would provide the resources)
v. In case of beneficiary oriented project/ scheme, indicate mechanism for identification
of the beneficiary.
vi. State specific requirements concerning land acquisition and/or environmental
clearances, if any.
vii. Specify by when the project can be started on approval of the programme / project.
viii. List the Ministry(s)/Department(s) (Other than proposing ministry) which would be
involved at different stages of the project.
No. Ministry/Department Project Stage Responsible For
1
2
3
27 Ensure Inter‐Regional equity

32 | P a g e
ix. Present the list of various Stakeholders along with their readiness in the following
tabular format
No. Stakeholders28 Responsible For Commitment Indicate Buy‐in Strategies
(In case of ‘No’ Commitment)
Yes No
1
2
f. Project Viability
i. In case of Projects which have identified stream of financial returns, the financial
internal rate of return may be calculated. The hurdle rate is considered at 12%.
ii. In case of projects where financial returns are not readily quantifiable (typically social
development projects), the economic rate of return may be estimated.
g. Project implementation and monitoring
i. Indicate schedule for project implementation under major heads/activities along with
time‐lines and different levels of government
Major Activity/Head/Component Level of Government Timeline for implementation
ii. Operational and Human Resource capabilities:
iv. Mention steps to develop operational capabilities29
v. Provide Institutional Framework for implementation (in flow chart form)
vi. In case of additional manpower requirement, please indicate the phased
requirement over the project timeline (i.e. year‐wise break‐ up of the manpower
requirement)
28 Stakeholders of a project include those people or organizations that are likely to be affected by project and/ or can influence the success or failure of the project. 29 Recognize differential capacities of the states as part of Pre‐Implementation strategy
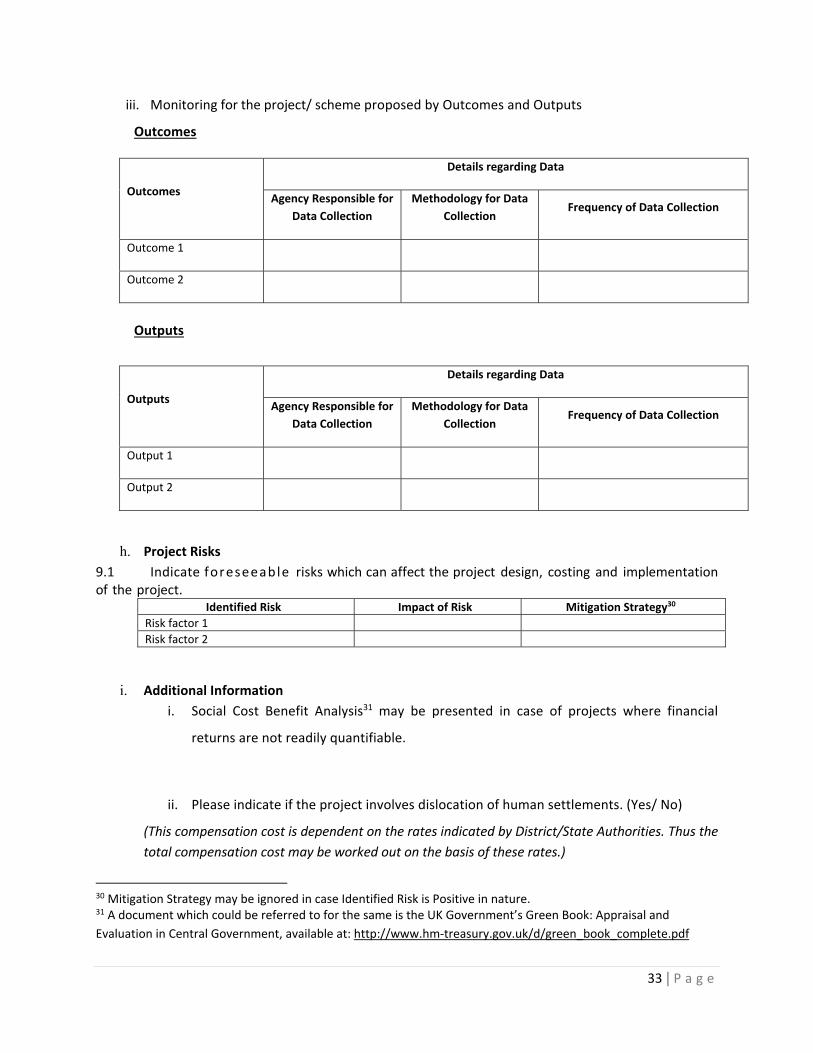
33 | P a g e
iii. Monitoring for the project/ scheme proposed by Outcomes and Outputs
Outcomes
Outcomes
Details regarding Data
Agency Responsible for
Data Collection
Methodology for Data
Collection Frequency of Data Collection
Outcome 1
Outcome 2
Outputs
Outputs
Details regarding Data
Agency Responsible for
Data Collection
Methodology for Data
Collection Frequency of Data Collection
Output 1
Output 2
h. Project Risks
9.1 Indicate foreseeable risks which can affect the project design, costing and implementation of the project.
Identified Risk Impact of Risk Mitigation Strategy30
Risk factor 1
Risk factor 2
i. Additional Information
i. Social Cost Benefit Analysis31 may be presented in case of projects where financial
returns are not readily quantifiable.
ii. Please indicate if the project involves dislocation of human settlements. (Yes/ No)
(This compensation cost is dependent on the rates indicated by District/State Authorities. Thus the
total compensation cost may be worked out on the basis of these rates.)
30 Mitigation Strategy may be ignored in case Identified Risk is Positive in nature. 31 A document which could be referred to for the same is the UK Government’s Green Book: Appraisal and
Evaluation in Central Government, available at: http://www.hm‐treasury.gov.uk/d/green_book_complete.pdf
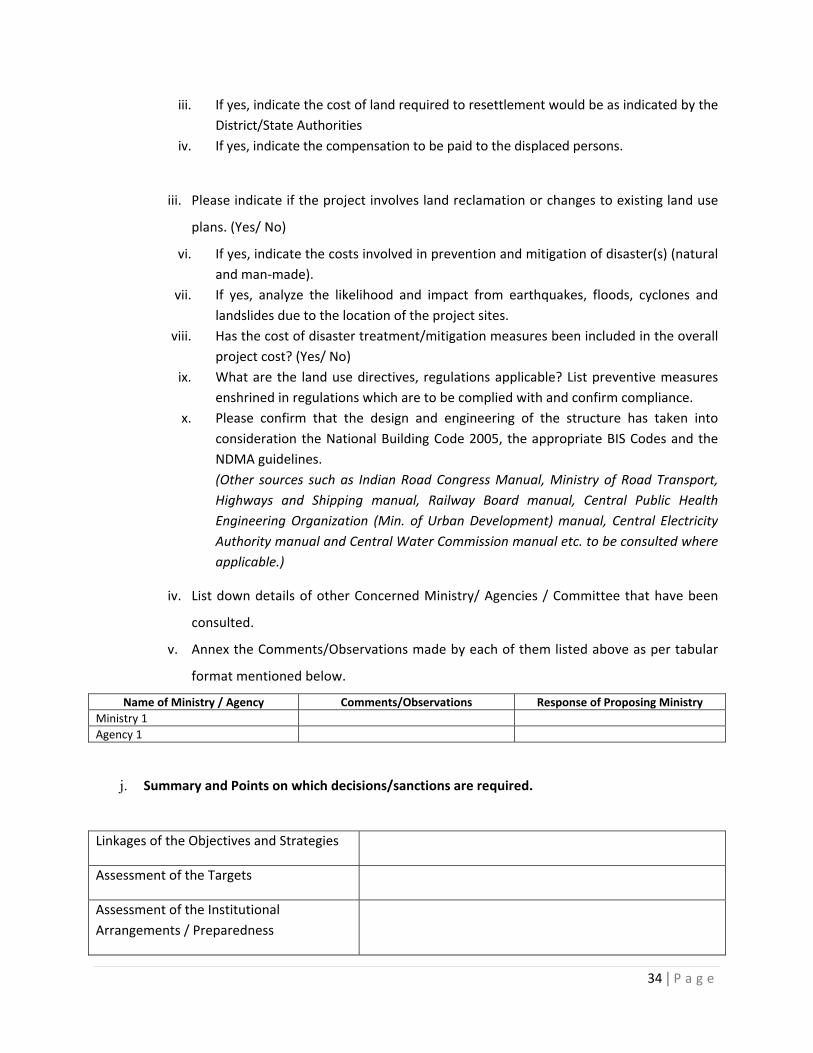
34 | P a g e
iii. If yes, indicate the cost of land required to resettlement would be as indicated by the
District/State Authorities
iv. If yes, indicate the compensation to be paid to the displaced persons.
iii. Please indicate if the project involves land reclamation or changes to existing land use
plans. (Yes/ No)
vi. If yes, indicate the costs involved in prevention and mitigation of disaster(s) (natural
and man‐made).
vii. If yes, analyze the likelihood and impact from earthquakes, floods, cyclones and
landslides due to the location of the project sites.
viii. Has the cost of disaster treatment/mitigation measures been included in the overall
project cost? (Yes/ No)
ix. What are the land use directives, regulations applicable? List preventive measures
enshrined in regulations which are to be complied with and confirm compliance.
x. Please confirm that the design and engineering of the structure has taken into
consideration the National Building Code 2005, the appropriate BIS Codes and the
NDMA guidelines.
(Other sources such as Indian Road Congress Manual, Ministry of Road Transport,
Highways and Shipping manual, Railway Board manual, Central Public Health
Engineering Organization (Min. of Urban Development) manual, Central Electricity
Authority manual and Central Water Commission manual etc. to be consulted where
applicable.)
iv. List down details of other Concerned Ministry/ Agencies / Committee that have been
consulted.
v. Annex the Comments/Observations made by each of them listed above as per tabular
format mentioned below.
Name of Ministry / Agency Comments/Observations Response of Proposing Ministry
Ministry 1
Agency 1
j. Summary and Points on which decisions/sanctions are required.
Linkages of the Objectives and Strategies
Assessment of the Targets
Assessment of the Institutional
Arrangements / Preparedness
35 | P a g e
Assessment of the Intervention proposed
Provision and adequacy of Finance
Assessment of cost / expenditure
estimates
Adequacy of Personnel
Risk analysis
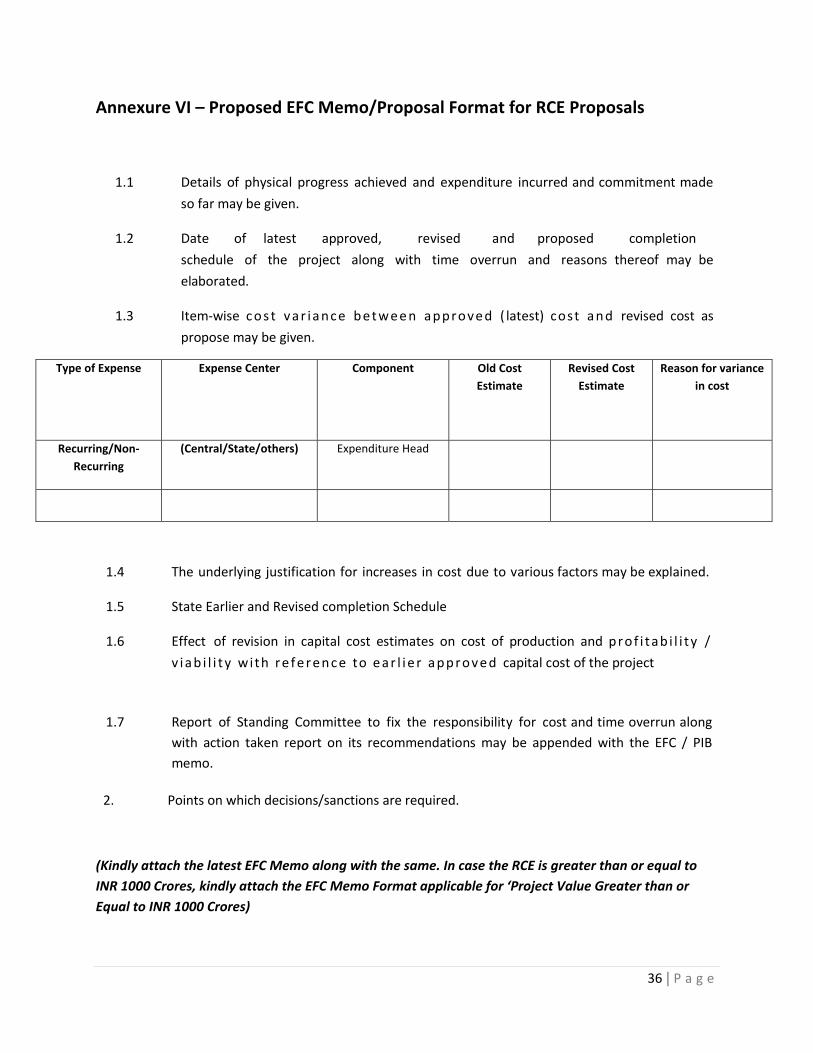
36 | P a g e
Annexure VI – Proposed EFC Memo/Proposal Format for RCE Proposals
1.1 Details of physical progress achieved and expenditure incurred and commitment made
so far may be given.
1.2 Date of latest approved, revised and proposed completion
schedule of the project along with time overrun and reasons thereof may be
elaborated.
1.3 Item‐wise cos t var iance between approved ( latest) cost and revised cost as
propose may be given.
Type of Expense Expense Center Component Old Cost
Estimate
Revised Cost
Estimate
Reason for variance
in cost
Recurring/Non‐
Recurring
(Central/State/others) Expenditure Head
1.4 The underlying justification for increases in cost due to various factors may be explained.
1.5 State Earlier and Revised completion Schedule
1.6 Effect of revision in capital cost estimates on cost of production and prof i tab i l i ty /
v iab i l i t y with re ference to ear l ie r approved capital cost of the project
1.7 Report of Standing Committee to fix the responsibility for cost and time overrun along
with action taken report on its recommendations may be appended with the EFC / PIB
memo.
2. Points on which decisions/sanctions are required.
(Kindly attach the latest EFC Memo along with the same. In case the RCE is greater than or equal to
INR 1000 Crores, kindly attach the EFC Memo Format applicable for ‘Project Value Greater than or
Equal to INR 1000 Crores)
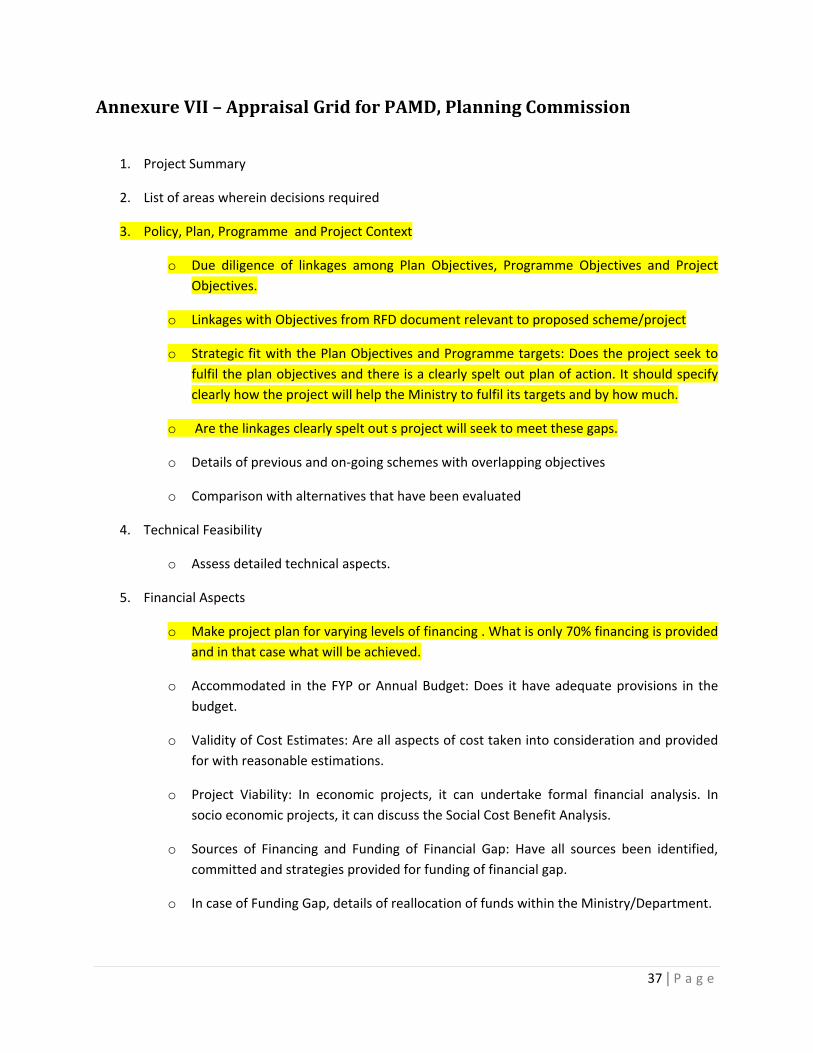
37 | P a g e
AnnexureVII–AppraisalGridforPAMD,PlanningCommission
1. Project Summary
2. List of areas wherein decisions required
3. Policy, Plan, Programme and Project Context
o Due diligence of linkages among Plan Objectives, Programme Objectives and Project
Objectives.
o Linkages with Objectives from RFD document relevant to proposed scheme/project
o Strategic fit with the Plan Objectives and Programme targets: Does the project seek to
fulfil the plan objectives and there is a clearly spelt out plan of action. It should specify
clearly how the project will help the Ministry to fulfil its targets and by how much.
o Are the linkages clearly spelt out s project will seek to meet these gaps.
o Details of previous and on‐going schemes with overlapping objectives
o Comparison with alternatives that have been evaluated
4. Technical Feasibility
o Assess detailed technical aspects.
5. Financial Aspects
o Make project plan for varying levels of financing . What is only 70% financing is provided
and in that case what will be achieved.
o Accommodated in the FYP or Annual Budget: Does it have adequate provisions in the
budget.
o Validity of Cost Estimates: Are all aspects of cost taken into consideration and provided
for with reasonable estimations.
o Project Viability: In economic projects, it can undertake formal financial analysis. In
socio economic projects, it can discuss the Social Cost Benefit Analysis.
o Sources of Financing and Funding of Financial Gap: Have all sources been identified,
committed and strategies provided for funding of financial gap.
o In case of Funding Gap, details of reallocation of funds within the Ministry/Department.
38 | P a g e
o Sensitivity analysis: Has it been done and what are the ranges of financing required and
timelines. It is a what if analysis. Analysis will be varied depending on resources, time,
personnel, etc.
6. Project Management – Administrative, Operational, Implementation
o Assess the institutional preparedness
o Appraise whether the various activities are well‐planned
(For example, a proposal for ITI should specify how the problem of shortage of trainers is
going to be addressed and how the courses are going to be identified and designed.)
o Geographical Distribution considered for implementation
o Assess willingness of State Governments to participate (in case of Centrally Sponsored
Schemes)
o Pre requisite for various phases including processes like clearances
o Project management structure: Activities, milestones, timeliness, and financial flows.
o Project implementation agencies
o Human Resource Capabilities
o Stakeholders’ involvement and engagement
7. Sensitivity Analysis
Evaluate effectiveness of the programme / project for various levels of outcome and outputs.
8. Monitoring and Evaluation
o Methods to Monitor and Evaluate achievement of Outputs and Outcomes, including
what will be monitored in terms of the outcomes, benchmarks, baselines, and
indicators.
o Agencies responsible and funds for the same.
9. Risk Analysis
o Identification of risks and their Impacts
o Undertake a gross sensitivity analysis of time and cost and arrive at range of estimations
o Assess the Mitigation Strategies proposed
10. Additional Aspects to be considered for Projects greater than INR 1000 Crores

39 | P a g e
o Strategic Fit
Fit with the Vision and Mission and Priorities of the Ministry/ Department and
its relevant programmes
Scale of problem solved vis‐à‐vis baseline: It should indicate the overall extent of
the problem and how much it proposes to address.
Baseline Data Vs Universal Benchmarks and Standards
Geographic Distribution
o Involvement of Ministries/Department (other than proposing ministry) at various stages
of the project
Assessment of past coordinated efforts
Need for involvement of other ministries/department as part of proposed
scheme/project
o Expenditure allocation across components/sub‐components
Assess basis of prioritization
40 | P a g e
AnnexureVIII–AppraisalGridforSubjectDivisions,PlanningCommission
1. Policy, Plan and Project Context
o Mention of Objectives from RFD document relevant to proposed scheme/project
o Strategic fit with the Plan Objectives and Programme targets: Does the project seek to
fulfil the plan objectives and there is a clearly spelt out plan of action. It should specify
clearly how the project will help the Ministry to fulfil its targets and by how much.
o Justification for the project: Does the PC support the justification for the programme
and are there any qualifications.
o Details of previous and on‐going schemes with overlapping objectives
o Comparison with alternatives that have been evaluated
2. Technical Feasibility
o Assess detailed technical aspects. This is will be a key focus of the appraisal of the
Subject division. Wherever necessary it can seek the help of technical agencies to give
specific suggestions.
o Consideration of Benchmarks in the sector (Consider those benchmarks relevant to the
proposed scheme/project which would enable progress towards Outcomes and Outputs)
o Strategic Fit
Fit with the Vision and Mission and Priorities of the Ministry/ Department and
its relevant programmes
Scale of problem solved vis‐à‐vis baseline: It should indicate the overall extent of
the problem and how much it proposes to address.
Baseline Data Vs Universal Benchmarks and Standards
Geographic Distribution
o Assess how the Proposed Project/Scheme would address the Technology Gaps, Capacity
Gaps and Human Resource Gaps.

41 | P a g e
o Assess Inter‐linkages of the Proposed Project/Scheme with other Programs (Inter and
Intra Ministry)
3. Financial Aspects
o Accommodated in the FYP or Annual Budget: Does it have adequate provisions in the
plan and annual budget.
o Validity of Cost Estimates: Are all aspects of cost taken into consideration and provided
for with reasonable estimations.
o Project Viability: In economic projects, it can undertake formal financial analysis. In
socio economic projects, it can discuss the Social Cost Benefit Analysis.
o Sources of Financing and Funding of Financial Gap: Have all sources been identified,
committed and strategies provided for funding of financial gap.
o In case of Funding Gap, details of reallocation of funds within the Ministry/Department.
o Sensitivity analysis: Has it been done and what are the ranges of financing required and
timelines.
4. Project Management – Administrative, Operational, Implementation
o Appraise whether the various activities are well‐planned
(For example, a proposal for ITI should specify how the problem of shortage of trainers is
going to be addressed and how the courses are going to be identified and designed.)
o Geographical Distribution considered for implementation
o Assess willingness of State Governments to participate (in case of Centrally Sponsored
Schemes)
o Pre requisite for various phases including processes like clearances
o Project management structure: Activities, milestones, timeliness, and financial flows.
o Project implementation agencies
o Human Resource Capabilities
o Stakeholders’ involvement and engagement

42 | P a g e
5. Monitoring and Evaluation
o Methods to Monitor and Evaluate achievement of Outputs and Outcomes, including
what will be monitored in terms of the outcomes, benchmarks, baselines, and
indicators.
o Agencies responsible and funds for the same.
6. Risk Analysis
o Identification of risks and their Impacts
o Undertake a gross sensitivity analysis of time and cost and arrive at range of estimations
o Asses the Mitigation Strategies proposed
7. Additional Aspects to be considered for Projects greater than INR 1000 Crores
o Involvement of Ministries/Department (other than proposing ministry) at various stages
of the project
Assessment of past coordinated efforts
Need for involvement of other ministries/department as part of proposed
scheme/project
o Expenditure allocation across components/sub‐components
Asses basis of prioritization
43 | P a g e
ReferencesColeman, Gilroy. 1987. Logical framework approach to the monitoring and evaluation of agricultural and
rural development projects. Project Appraisal, Vol. 2, No. 4, December 1987, pages 251‐259.
Dearden, Philip N. 2001. Programme and Project Cycle Management (PPCM): Lessons from DFID and
other organisations. To be presented at the Foundation for Advanced Studies for International
Development (FASID) Tokyo, Japan. February. (Available at:
http://www.mande.co.uk/docs/dearden.pdf)
Department for International Development (DFID). 2002. Tools for Development. Performance and
Effectiveness Department, DFID, UK aid. (Available at:
http://www.unssc.org/home/sites/unssc.org/files/publications/tools_for_development_‐
_a_handbook_for_those_engaged_in_development_activities.pdf)
Department for International Development (DFID). 2009. Guidance on using the revised Logical
Framework. A DFID Practice Paper. Value for Money Department, FCPD. February. (Available at:
http://mande.co.uk/blog/wp‐content/uploads/2009/06/logical‐framework.pdf)
Gasper, Des. 2001. “Logical Frameworks”: Problems and Potentials. (Available at:
http://www.ecode.es/marco_logico/pdf/10.pdf)
Government of India. 2012. Guidelines For Results‐Framework Document (RFD) 2012‐2013. Cabinet
Secretariat. Available at: http://performance.gov.in/PDF/RFD‐Guidelines‐2012‐13.pdf
Government of India. 2012. Circulation of Revised formats of EFC/PIB Memorandum. Department of
Expenditure (Plan Finance – II Division). Available at:
http://www.finmin.nic.in/the_ministry/dept_expenditure/plan_finance2/Revised_EFC_Format090312.p
df
Government of India. 2010. Letter from Planning Commission, Government of India. Available at:
http://efc.planningcommission.nic.in/9May/14th‐Jan‐2010.pdf
Government of India. 2010. Guidelines for Formulation, Appraisal and Approval of Government Plan Funded Projects/Schemes to be made effective w.e.f. 1st April 2010. Department of Expenditure (Plan Finance – II Division), Ministry of Finance. Available at: http://finmin.nic.in/the_ministry/dept_expenditure/plan_finance2/guideline_formulation_app_approv_01042010.pdf Government of India. 2007. Guidelines for Formulation, Appraisal and Approval of Government Plan Funded Projects/Schemes to be made effective over the duration of XI Plan. Department of Expenditure (Plan Finance – II Division), Ministry of Finance. Available at: http://finmin.nic.in/the_ministry/dept_expenditure/plan_finance2/dele_of_power.pdf
44 | P a g e
Government of India. 2004. Formulation, Appraisal and Approval of Plan Schemes and Projects ‐ Compendium of Important Circulars. Department of Expenditure (Plan Finance – II Division), Ministry of Finance. Available at: http://finmin.nic.in/the_ministry/dept_expenditure/notification/misc/Faapsrcomp.pdf Government of India. 2003. Guidelines for Formulation, Appraisal and Approval of Government funded plan schemes/projects. Department of Expenditure (Plan Finance – II Division), Ministry of Finance. Available at: http://finmin.nic.in/the_ministry/dept_expenditure/plan_finance2/updated.PDF HM Treasury. 2003. The Green Book: Appraisal and Evaluation in Central Government. Treasury
Guidance, London, UK. (Available at: http://www.hm‐treasury.gov.uk/d/green_book_complete.pdf)
Mikkelsen, Britha. 1995. Methods for Development Work and Research: A New Guide for Practitioners.
SAGE Publications Pvt. Ltd.
Norwegian Development Cooperation (NORAD). 2008. Results Management in Norwegian Development
Cooperation : A practical guide. December. (Available at: http://www.norad.no/en/tools‐and‐
publications/publications/publication?key=109837)
OECD. 2002. Outcome‐focused Management in the United Kingdom. OECD Journal on Budgeting.
(Available at: http://www.oecd.org/unitedkingdom/43513955.pdf)
Overseas Development Institute (ODI). Mapping Political Context: A Toolkit for CSOs – Stakeholder
Analysis Tool. United Kingdom. (Available at: http://www.odi.org.uk/resources/docs/6861.pdf)
Practical Concepts Incorporated (PCI). 1979. The Logical Framework – A Manager’s Guide to a Scientific
Approach to Design & Evaluation. November. (Available at:
http://pdf.usaid.gov/pdf_docs/PNABN963.pdf)
Swedish International Development Cooperation Agency (SIDA). 2005. The use and abuse of the logical
framework approach. (Available at: http://www.intrac.org/data/files/resources/518/The‐Use‐and‐
Abuse‐of‐the‐Logical‐Framework‐Approach.pdf)
Santiago, Jesse and Magallon, Desirae. 2009. Critical Path Method (CEE 320 – VDC Seminar). (Available
at: http://www.stanford.edu/class/cee320/CEE320B/CPM.pdf)
Stelth, Peter and Roy, Guy Le. 2008. Projects’ Analysis through CPM (Critical Path Method). School of
Doctoral Studies (European Union) Journal ‐ July, 2009 No. 1. (Available at:
http://www.iiuedu.eu/press/journals/sds/sds1_july_2008/05_SECC_01.pdf)
Tasmanian Government. 2008. Project Management Framework, Project Management Fact Sheet:
Developing a Gantt Chart, Version: 1.2, November. (Available at:
http://www.egovernment.tas.gov.au/__data/assets/pdf_file/0019/78112/Developing_a_Gantt_Chart_F
act_Sheet.pdf)

45 | P a g e
USAID, 2010. Performance Monitoring & Evaluation TIPS – Building a Results Framework. (Available at:
http://pdf.usaid.gov/pdf_docs/pnadw113.pdf)
World Bank. 2004. Operationalizing Political Analysis: the Expected Utility Stakeholder Model and
Governance Reforms. World Bank PremNotes, No. 95. (Available at:
http://www1.worldbank.org/prem/PREMNotes/premnote95.pdf)
World Bank. 2005. World Bank LogFrame Methodology Handbook. (Available at: http://www‐
wds.worldbank.org/external/default/WDSContentServer/WDSP/IB/2005/06/07/000160016_200506071
22225/Rendered/PDF/31240b0LFhandbook.pdf)
World Health Organization (WHO). Stakeholder Analysis. Transforming Health Priorities into Projects –
Health Action in Crises. (Available at:
http://www.who.int/hac/techguidance/training/stakeholder%20analysis%20ppt.pdf)

Annexure IX
Proposed EFC Memo/Proposal Format (Project Value Greater than or
Equal to INR 1000 Crores)
A Model Format: ICDS as the case
This proposal format has been filled up by scrutinising different documents and Annexures (letters and
Office Memorandums) such as:
a. EFC Memo
b. Guidelines for Constitution of Monitoring and Review Committees at different level to
review progress in implementation of ICDS scheme issued by MWCD on March 31, 2011.
(Annex XXIV) of Strengthening and Restructuring of ICDS – A Broad Framework for
Implementation.
c. Strengthening and Restructuring of ICDS – A Broad Framework for Implementation.
1 Project Identification
1.1 Title of the project/ scheme: INTEGRATED CHILD DEVELOPMENT SERVICES (ICDS)
1.2 Name of the sponsoring agency (Ministry/Department/ Autonomous Body/ Central PSE): MINISTRY
OF WOMEN AND CHILD DEVELOPMENT, GOVERNMENT OF INDIA
1.3 Nature of Scheme (Select from below)
a) Central Sector Scheme b) Centrally Sponsored Scheme c) Additional Central Assistance
1.4 Nature of Proposal (Select from below)
a) New Proposal b) Modified / Extended Proposal c) Revised Cost Estimate
(In case of nature is selected as Revised Cost Estimate, please fill in RCE Proposal format)
1.5 Proposed duration of the project: ONGOING
1.6 Mention time lag from Date of Approval1
Three months from the date of approval (For illustration).
NOTE: For this document 1.6 can be deleted here because this question is covered in question 5.7
1.7 Total cost of the project over the proposed duration (Mention in figures only):
Total cost of Rs 2,54,740 crore
Total GOI share of Rs 1,83,855.
An average annual GOI share of about Rs 36,000 crore is estimated for effectively implementing
the ICDS.
(Note: A detailed summary of cost estimates is available on Page 36 of the EFC Memo,
Section II on Cost Estimates.)
1 Time Lag = Start Date Minus Date of Approval 2. Prepared by Prof G Ramesh, Prof Nagadevara, Ranjini C R and Ms Shahana Sheikh of IIM Bangalore for Planning Commission.
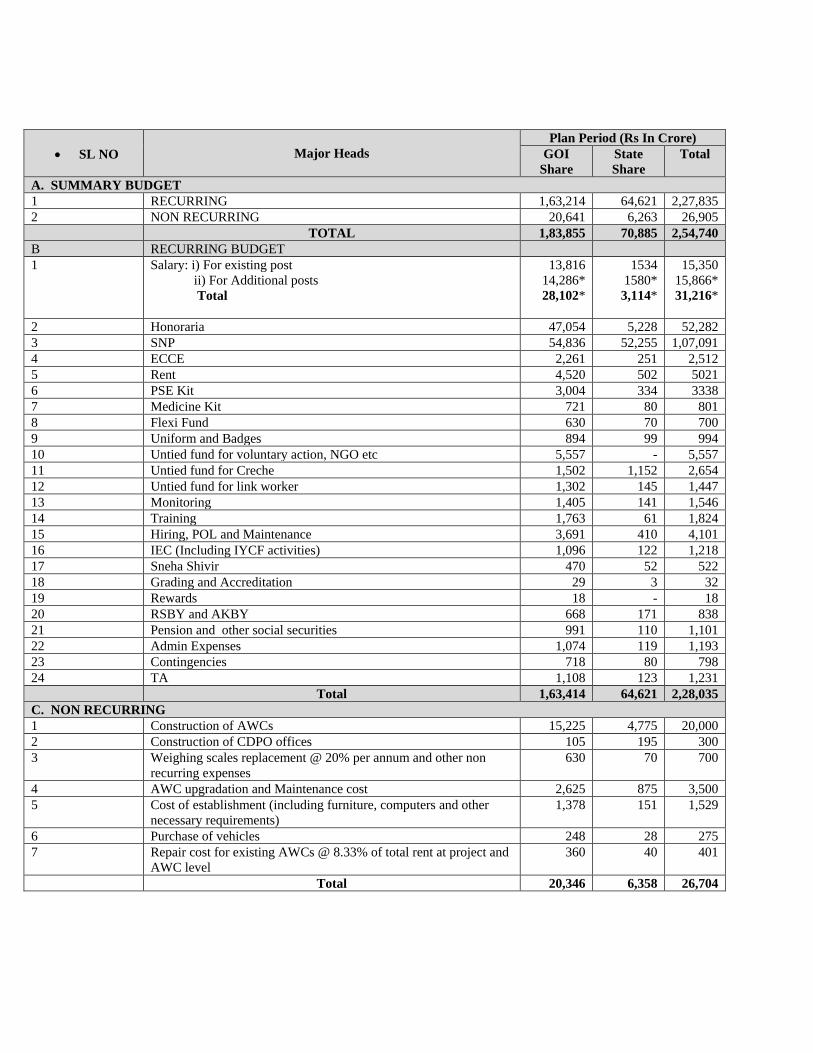
SL NO
Major Heads
Plan Period (Rs In Crore)
GOI
Share
State
Share
Total
A. SUMMARY BUDGET
1 RECURRING 1,63,214 64,621 2,27,835
2 NON RECURRING 20,641 6,263 26,905
TOTAL 1,83,855 70,885 2,54,740
B RECURRING BUDGET
1
Salary: i) For existing post
ii) For Additional posts
Total
13,816
14,286*
28,102*
1534
1580*
3,114*
15,350
15,866*
31,216*
2 Honoraria 47,054 5,228 52,282
3 SNP 54,836 52,255 1,07,091
4 ECCE 2,261 251 2,512
5 Rent 4,520 502 5021
6 PSE Kit 3,004 334 3338
7 Medicine Kit 721 80 801
8 Flexi Fund 630 70 700
9 Uniform and Badges 894 99 994
10 Untied fund for voluntary action, NGO etc 5,557 - 5,557
11 Untied fund for Creche 1,502 1,152 2,654
12 Untied fund for link worker 1,302 145 1,447
13 Monitoring 1,405 141 1,546
14 Training 1,763 61 1,824
15 Hiring, POL and Maintenance 3,691 410 4,101
16 IEC (Including IYCF activities) 1,096 122 1,218
17 Sneha Shivir 470 52 522
18 Grading and Accreditation 29 3 32
19 Rewards 18 - 18
20 RSBY and AKBY 668 171 838
21 Pension and other social securities 991 110 1,101
22 Admin Expenses 1,074 119 1,193
23 Contingencies 718 80 798
24 TA 1,108 123 1,231
Total 1,63,414 64,621 2,28,035
C. NON RECURRING
1 Construction of AWCs 15,225 4,775 20,000
2 Construction of CDPO offices 105 195 300
3 Weighing scales replacement @ 20% per annum and other non
recurring expenses
630 70 700
4 AWC upgradation and Maintenance cost 2,625 875 3,500
5 Cost of establishment (including furniture, computers and other
necessary requirements)
1,378 151 1,529
6 Purchase of vehicles 248 28 275
7 Repair cost for existing AWCs @ 8.33% of total rent at project and
AWC level
360 40 401
Total 20,346 6,358 26,704
2.1 Vision Statement
The vision of ICDS is to ensure holistic physical, psychosocial, cognitive and emotional development of
children under 6 years of age (with special emphasis on children under 3 and maternal care) as well as
promotion of optimal early childhood care, development and learning.
NOTE: From Page 20, section 3.2 of Strengthening and Restructuring of ICDS – A Broad Framework for Implementation.
(Vision is an idealized state for the department. It is the big picture of what the leadership wants
the department to look like in the future. It is a long-term statement which is not expected to
change from year to year unless the department is dramatically restructured.)
2.2 Mission Statement
The mission of ICDS would be to empower States and UT Administrations to carry out the required
reforms for achieving the vision to reduce under-nutrition in children under three years of age and to
enhance development and learning outcomes in all children under six years of age. (for illustration)
NOTE: (Mission is the who, what and why of the department’s existence. It is the roadmap towards
achieving the vision.)
(Mission Statement has not be mentioned anywhere in the ICDS documents. The above statement is for
illustration only
2.3 Objectives
1. To improve the nutritional and health status of pre-school children in the age-group (0-6 years);
2. To lay the foundation of proper psychological development of the child;
3. To reduce the incidence of mortality, morbidity, malnutrition and school drop-out;
4. To achieve effective coordination of policy and implementation amongst the various
departments to promote child development;
5. To enhance the capability of the mother to look after the normal health and nutritional needs of
the child through education.
NOTE: (Culled out from page 38 of EFC Memo, Section I on Historical Background) (Objectives represent the developmental requirements to be achieved by the department in a particular
sector by a selected set of policies and programmes over a specific period of time (short-medium-long))
2.3.1 Mapping of Objectives and Package of services and activities
These are mentioned for illustration
1. OBJECTIVE 1: To improve the nutritional and health status of pre-school children in the age-
group (0-6 years);

Package of Services Activities
Supplementary Nutrition 1 Provide Morning Snack, Hot cooked meal and
Take Home Rations as per norms
Health services 1 Weight monitoring and tracking using growth
charts
Note: Objectives should be consistent. Right now, they are different in different documents. Activities
undertaken for each objective should be clearly mentioned.
2.4 Baseline Data
Annual data of ICDS, AHS, NFHS, DLHS, Independent Surveys
Note: (Data with reference to aforementioned Objectives to which improvements are foreseen i.e. data
collected before the schemes of the Ministry/ Department are launched for the aforementioned Annual
Year and against which monitoring and evaluation will be undertaken.)
2..4.1 Geographic Distribution
ICDS is reaching out to approximately 9.75crore beneficiaries through a network of 12.88 lakh
operational AWCs
Note: (Preferably a GIS representation of the above mentioned baseline data on a map of India
(including State and District boundaries) to ascertain existing regional inequities.)
2.5 Benchmark/Standards
(Universal benchmarks/ standards concerning each of the objectives of the Ministry/ Department.)
Mention here Adoption of WHO growth standards, nutritional standards or nutritional index or
morbidity assessment index here.
For example see table below:
NUTRITIONAL AND FEEDING NORMS ISSUED BY MWCD (Feb, 2009)
Category Calories (K Cal) Protein (g)
Children (6-72 months) 500 12-15
Severely underweight Children (6-72 months) 800 20-25
Pregnant women and nursing mothers 600 18-20
(Note: From page 55, 1.2, Supplementary Nutrition, Annexure I of Strengthening and Restructuring
of ICDS – A Broad Framework for Implementation).

2 Policy and Project Context
3.1 Quote the objectives from the ‘RFD’ document of the Ministry/ Department within which this
proposed project/ scheme is envisaged. (Attach the relevant ‘RFD’ document of the
Ministry/Department)
One of the objectives in the RFD document states:
Laying foundation for development of children below 6 years with a focus on supplementary nutrition,
pre-school, non-formal education and to enhance awareness and capacity of mothers to meet the
nutritional and health needs of the child.
(Note: RFD Document Attached)
RFD Objective is not comprehensively stated for ICDS. It is not clear from where ICDS Mission and
objectives flow from.
Note: The linkage between policy content and objectives of the project and thereafter the activities
should be clearly stated.
3.2 Describe the historical background and context of the proposed project/ scheme.
Launched in 1975, ICDS, is a unique early childhood development programme aimed at addressing
health, nutrition and development needs of young children, pregnant and nursing mothers. These
objectives are sought to be achieved through a package of six services comprising (i) supplementary
nutrition (ii) immunization (iii) health check-up, (iv) referral services, (v) pre-school non formal education
and (vI) nutrition and health education.
In 2010, Prime Minister’s National Council on India’s Nutrition Challenges and the National Advisory
Council recommended strengthening and restructuring ICDS by forging institutional convergence with
NRHM and TSC and providing flexibility for local action and empower mothers and community to have a
stake in the programme.
Note: This can be as brief as possible. (From page 38, Section I on Historical Background of
EFC Memo).
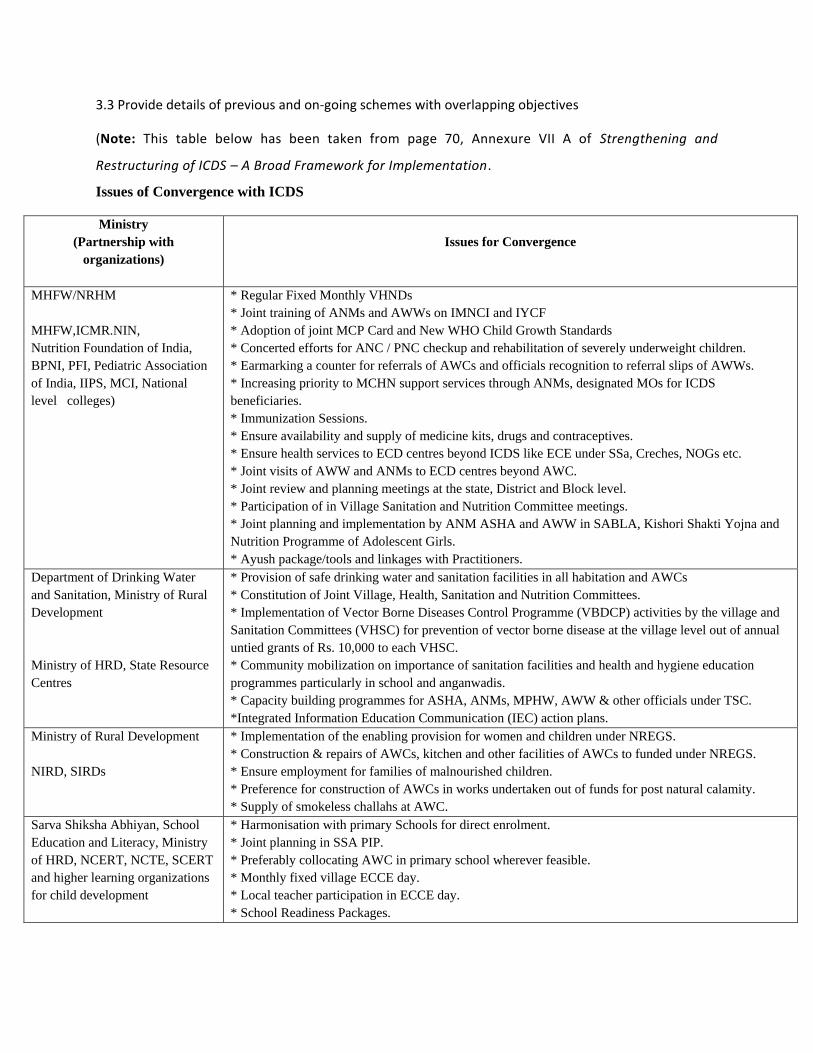
3.3 Provide details of previous and on-going schemes with overlapping objectives
(Note: This table below has been taken from page 70, Annexure VII A of Strengthening and
Restructuring of ICDS – A Broad Framework for Implementation.
Issues of Convergence with ICDS
Ministry
(Partnership with
organizations)
Issues for Convergence
MHFW/NRHM
MHFW,ICMR.NIN,
Nutrition Foundation of India,
BPNI, PFI, Pediatric Association
of India, IIPS, MCI, National
level colleges)
* Regular Fixed Monthly VHNDs
* Joint training of ANMs and AWWs on IMNCI and IYCF
* Adoption of joint MCP Card and New WHO Child Growth Standards
* Concerted efforts for ANC / PNC checkup and rehabilitation of severely underweight children.
* Earmarking a counter for referrals of AWCs and officials recognition to referral slips of AWWs.
* Increasing priority to MCHN support services through ANMs, designated MOs for ICDS
beneficiaries.
* Immunization Sessions.
* Ensure availability and supply of medicine kits, drugs and contraceptives.
* Ensure health services to ECD centres beyond ICDS like ECE under SSa, Creches, NOGs etc.
* Joint visits of AWW and ANMs to ECD centres beyond AWC.
* Joint review and planning meetings at the state, District and Block level.
* Participation of in Village Sanitation and Nutrition Committee meetings.
* Joint planning and implementation by ANM ASHA and AWW in SABLA, Kishori Shakti Yojna and
Nutrition Programme of Adolescent Girls.
* Ayush package/tools and linkages with Practitioners.
Department of Drinking Water
and Sanitation, Ministry of Rural
Development
Ministry of HRD, State Resource
Centres
* Provision of safe drinking water and sanitation facilities in all habitation and AWCs
* Constitution of Joint Village, Health, Sanitation and Nutrition Committees.
* Implementation of Vector Borne Diseases Control Programme (VBDCP) activities by the village and
Sanitation Committees (VHSC) for prevention of vector borne disease at the village level out of annual
untied grants of Rs. 10,000 to each VHSC.
* Community mobilization on importance of sanitation facilities and health and hygiene education
programmes particularly in school and anganwadis.
* Capacity building programmes for ASHA, ANMs, MPHW, AWW & other officials under TSC.
*Integrated Information Education Communication (IEC) action plans.
Ministry of Rural Development
NIRD, SIRDs
* Implementation of the enabling provision for women and children under NREGS.
* Construction & repairs of AWCs, kitchen and other facilities of AWCs to funded under NREGS.
* Ensure employment for families of malnourished children.
* Preference for construction of AWCs in works undertaken out of funds for post natural calamity.
* Supply of smokeless challahs at AWC.
Sarva Shiksha Abhiyan, School
Education and Literacy, Ministry
of HRD, NCERT, NCTE, SCERT
and higher learning organizations
for child development
* Harmonisation with primary Schools for direct enrolment.
* Joint planning in SSA PIP.
* Preferably collocating AWC in primary school wherever feasible.
* Monthly fixed village ECCE day.
* Local teacher participation in ECCE day.
* School Readiness Packages.
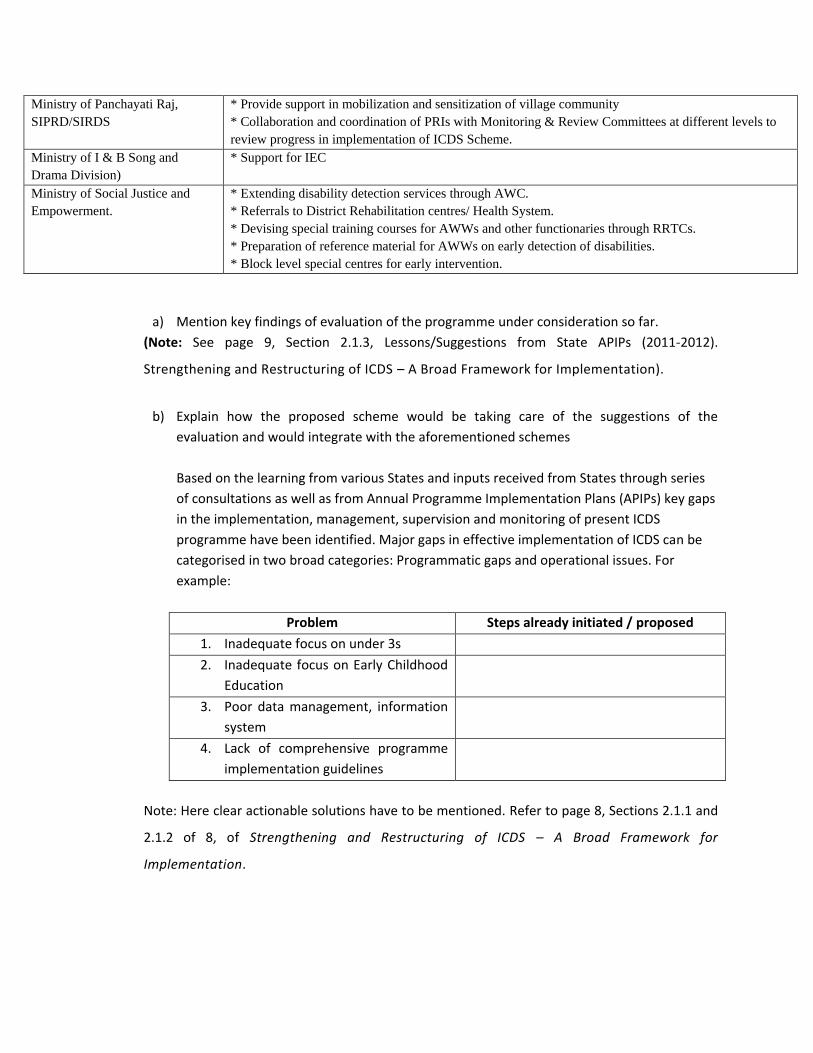
Ministry of Panchayati Raj,
SIPRD/SIRDS
* Provide support in mobilization and sensitization of village community
* Collaboration and coordination of PRIs with Monitoring & Review Committees at different levels to
review progress in implementation of ICDS Scheme.
Ministry of I & B Song and
Drama Division)
* Support for IEC
Ministry of Social Justice and
Empowerment.
* Extending disability detection services through AWC.
* Referrals to District Rehabilitation centres/ Health System.
* Devising special training courses for AWWs and other functionaries through RRTCs.
* Preparation of reference material for AWWs on early detection of disabilities.
* Block level special centres for early intervention.
a) Mention key findings of evaluation of the programme under consideration so far.
(Note: See page 9, Section 2.1.3, Lessons/Suggestions from State APIPs (2011-2012).
Strengthening and Restructuring of ICDS – A Broad Framework for Implementation).
b) Explain how the proposed scheme would be taking care of the suggestions of the
evaluation and would integrate with the aforementioned schemes
Based on the learning from various States and inputs received from States through series
of consultations as well as from Annual Programme Implementation Plans (APIPs) key gaps
in the implementation, management, supervision and monitoring of present ICDS
programme have been identified. Major gaps in effective implementation of ICDS can be
categorised in two broad categories: Programmatic gaps and operational issues. For
example:
Problem Steps already initiated / proposed
1. Inadequate focus on under 3s
2. Inadequate focus on Early Childhood
Education
3. Poor data management, information
system
4. Lack of comprehensive programme
implementation guidelines
Note: Here clear actionable solutions have to be mentioned. Refer to page 8, Sections 2.1.1 and
2.1.2 of 8, of Strengthening and Restructuring of ICDS – A Broad Framework for
Implementation.

3.3 Explain the comparison of the proposed project/ scheme with the alternatives that have been
considered. (Complete the table below).
Parameter/Criteria Proposed Project Alternative 1 Alternative 2
Main Features M o v i n g f r o m
r e n t e d s p a c e t o
n e w b u i l d i n g
S e l e c t i v e l y
m o v i n g t o n e w
b u i l d i n g
O u t s o u r c i n g t o
N G O s .
Cost
Time
Physical targets (Please Specify)
Expected Benefits
Others*(Please Specify)
3.4 In case the table for question 2.3 has not been completed, kindly provide reasons for why other
alternatives have not been considered.
3 Project Objectives and Targets
4.1 Define objectives2 of the proposed scheme/ project.
Objectives Current Status Stretched Target Achievable
Targets (End 12th Plan)
Reduction in underweight children below 3 years
42.5% (NFHS-3) for below 5 years 10 percentage point
Reduction in underweight children below 5 years
40.4% (NFHS-3) for below 3 years 20%
Reduction in prevalence of anaemia in pregnant-women
57.9% (NFHS-3) 20%
Note: (Refer to Report of the Inter-Ministerial Group on ICDS Restructuring, Annex – ID, page 12 for a
complete table)
4.2 Indicate how the aforementioned Objectives would fulfil the major objectives of the
Ministry/Department (indicated in 2.3)
Objectives of Ministry Objectives of Programme
4.3 Mapping of Objectives and package of services
Objectives Package of Services
2 An objective is a succinct statement of the key goal(s) being pursed over the medium- to long-run. Objectives reflect the key components of the intended strategy (OECD, 2002).

Objective 1 Early Childhood Care and Education (ECCE)/pre-
school Non Formal Education
Objective 2 Supplementary nutrition
Objective 3 Infant and Young Child Feeding (IYCF) Promotion
and Counselling
Objective 4 Maternal Care and Counselling
Objective 5 Care, Nutrition and Hygiene Education
4.3 Mention the specific targets (Outcomes and Outputs) proposed to be achieved. These targets
should be measurable and monitor-able, against baseline data. (Complete the table below).
4.3.1Outcomes3
Outcomes Indicator Unit of
Measure Baseline
Data Target(s)
Year 1 Year 2 Year 3
Outcome 1 Percentage of children weighted at birth within 24 hours
Current Status 46.5% (NCAER, 2009)
AHS/Independent Surveys
90% Not Available Not Available
Outcome 2 % of children initiated breastfeeding within one hour of birth
Current Status 40.5% (DLHS-3)
NFHS/DLHS/AHS
75% Not Available Not Available
Outcome 3 % of children exclusively breastfed till 6 months
46% (NFHS-3)
NFHS/DLHS/AHS
75% Not Available Not Available
3 Outcomes are the impact on, or consequences for, the community of the activities of the government. Outcomes reflect the intended and unintended results from government actions and provide the rationale for government interventions. Improving the health status of the population is an example of an outcome (OECD, 2002).

4.3.2 Components, Core Interventions and Outcomes:
(Note: This table has been adapted from page 11 of Strengthening and Restructuring of ICDS – A
Broad Framework for Implementation). One more column on Outcomes need to be added here.
Sl.
No.
Components Services Core Interventions Target
Group
Service Provider Outcomes
1. Early
Childhood Care
Education &
Development
(ECCED)
Early
Childhood care
and Education
(ECCE)/Pre-
school Non-
formal
Education
* Home based guidance for parents
* Early stimulation
* Early screening and referral
* Optimal IYCF Practices
* Monthly Monitoring & Promotion
of Child Growth & Developmental
Milestones.
* Fixed Village ECCE Days
0-3 years
Parents/ca
regivers
Second AWW
cum Child Care
& Nutrition
Counsellor
* Non formal preschool education:
a) activity based
b) semi-structured play and learning
method
* Quarterly Monitoring & Promotion
of Child Growth & Developmental
Milestones.
* Fixed Village ECCE Days
3-6 years
Parents/ca
regives
AWW
Supplementary
Nutrition
* Morning snack, Hot Cooked Meal
And THR as per norms
6 m –
3yrs
3-6 years
P& L
Mothers
AWW/Second
AWW/ AWH/
SHGs/others
2. Care &
Nutrition
Counselling
Infant &
Young child
Feeding
(IYCF)
Promotion &
Counselling
* One to one counselling for optimal
breastfeeding practices
* One to one counselling on
complementary feeding
* Counselling to ensure food intake
* Home visit and follow up
P&L
mothers.
Mothers
of
children
under 3
yrs
Second AWW
cum nutrition
counsellor/
supervisors
ASHA/ ANM
Maternal Care
and
Counselling
* Early registration of pregnancy, 3 or
more ANC, Institutional delivery and
PNC
* Counselling on diet, rest and IFA
compliance during Home Visit
* Monitoring weight gain
* Examination for pallor and oedema
and any danger signs
* Home based counseling for essential
newborn care
* Counseling and lactational support
* Counseling on spacing
P&L
Women
ASHA/ANM/M
O/Second
AWW cum
nutrition
counsellor
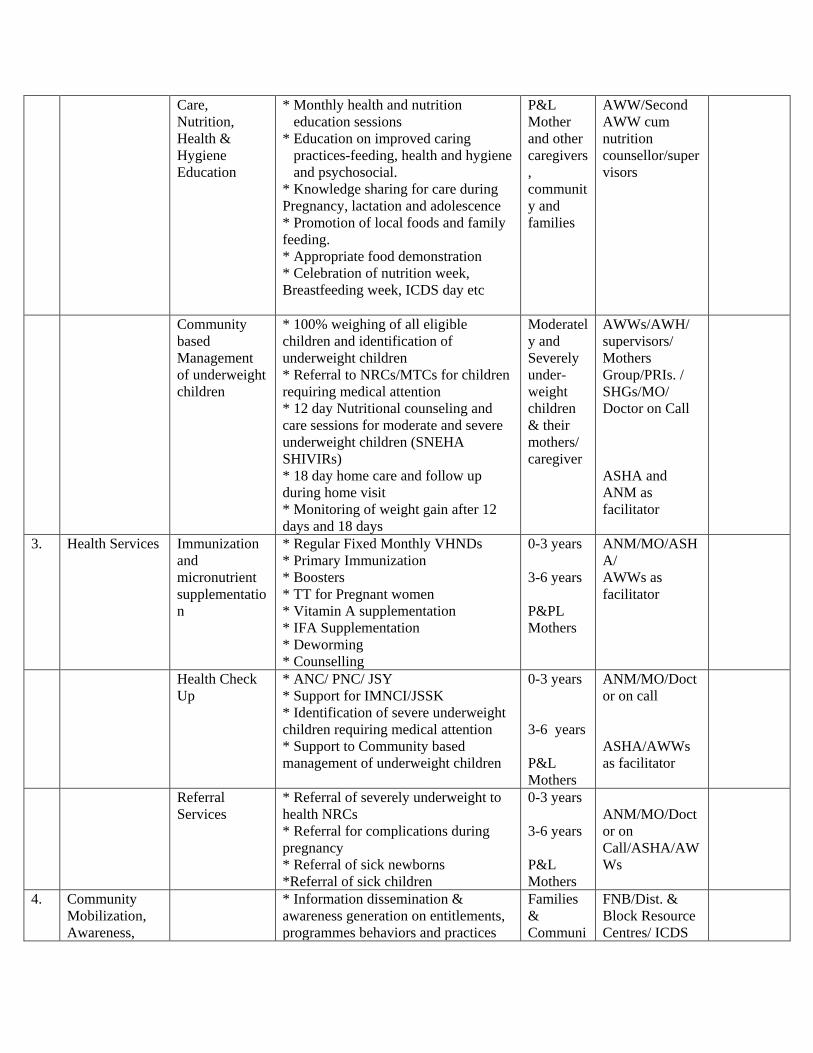
Care,
Nutrition,
Health &
Hygiene
Education
* Monthly health and nutrition
education sessions
* Education on improved caring
practices-feeding, health and hygiene
and psychosocial.
* Knowledge sharing for care during
Pregnancy, lactation and adolescence
* Promotion of local foods and family
feeding.
* Appropriate food demonstration
* Celebration of nutrition week,
Breastfeeding week, ICDS day etc
P&L
Mother
and other
caregivers
,
communit
y and
families
AWW/Second
AWW cum
nutrition
counsellor/super
visors
Community
based
Management
of underweight
children
* 100% weighing of all eligible
children and identification of
underweight children
* Referral to NRCs/MTCs for children
requiring medical attention
* 12 day Nutritional counseling and
care sessions for moderate and severe
underweight children (SNEHA
SHIVIRs)
* 18 day home care and follow up
during home visit
* Monitoring of weight gain after 12
days and 18 days
Moderatel
y and
Severely
under-
weight
children
& their
mothers/
caregiver
AWWs/AWH/
supervisors/
Mothers
Group/PRIs. /
SHGs/MO/
Doctor on Call
ASHA and
ANM as
facilitator
3. Health Services Immunization
and
micronutrient
supplementatio
n
* Regular Fixed Monthly VHNDs
* Primary Immunization
* Boosters
* TT for Pregnant women
* Vitamin A supplementation
* IFA Supplementation
* Deworming
* Counselling
0-3 years
3-6 years
P&PL
Mothers
ANM/MO/ASH
A/
AWWs as
facilitator
Health Check
Up
* ANC/ PNC/ JSY
* Support for IMNCI/JSSK
* Identification of severe underweight
children requiring medical attention
* Support to Community based
management of underweight children
0-3 years
3-6 years
P&L
Mothers
ANM/MO/Doct
or on call
ASHA/AWWs
as facilitator
Referral
Services
* Referral of severely underweight to
health NRCs
* Referral for complications during
pregnancy
* Referral of sick newborns
*Referral of sick children
0-3 years
3-6 years
P&L
Mothers
ANM/MO/Doct
or on
Call/ASHA/AW
Ws
4. Community
Mobilization,
Awareness,
* Information dissemination &
awareness generation on entitlements,
programmes behaviors and practices
Families
&
Communi
FNB/Dist. &
Block Resource
Centres/ ICDS
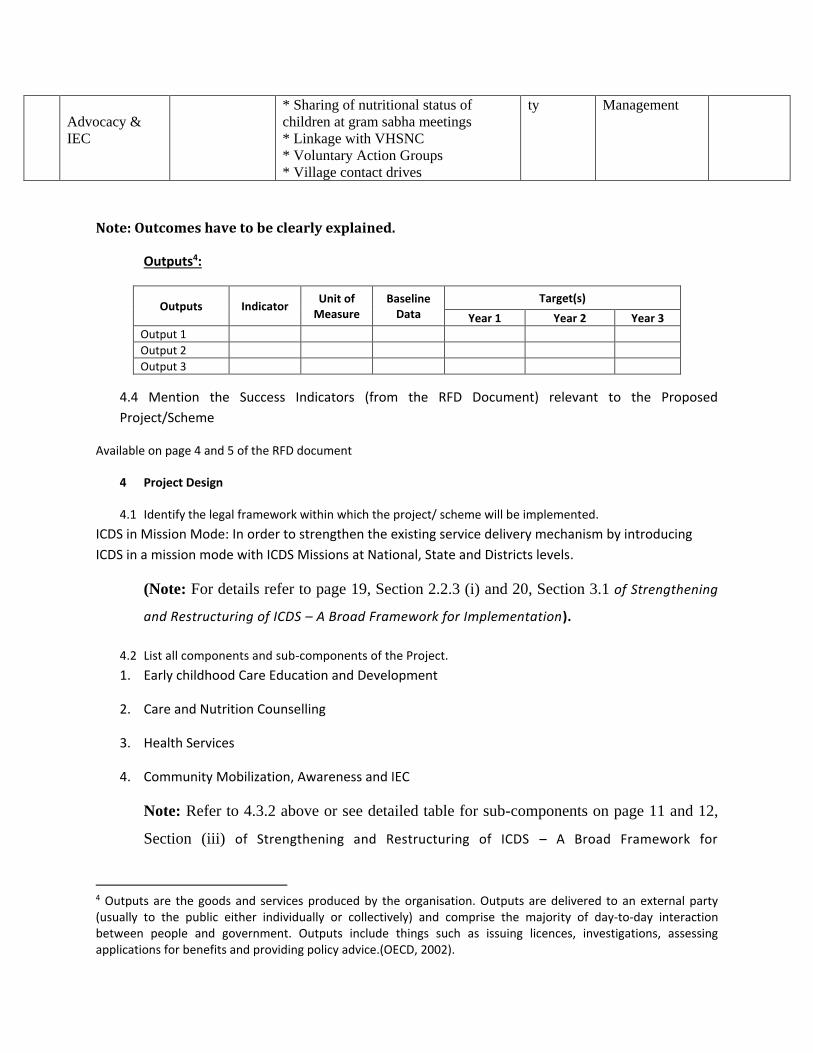
Advocacy &
IEC
* Sharing of nutritional status of
children at gram sabha meetings
* Linkage with VHSNC
* Voluntary Action Groups
* Village contact drives
ty Management
Note: Outcomes have to be clearly explained.
Outputs4:
Outputs Indicator Unit of
Measure Baseline
Data
Target(s)
Year 1 Year 2 Year 3
Output 1
Output 2
Output 3
4.4 Mention the Success Indicators (from the RFD Document) relevant to the Proposed
Project/Scheme
Available on page 4 and 5 of the RFD document
4 Project Design
4.1 Identify the legal framework within which the project/ scheme will be implemented.
ICDS in Mission Mode: In order to strengthen the existing service delivery mechanism by introducing
ICDS in a mission mode with ICDS Missions at National, State and Districts levels.
(Note: For details refer to page 19, Section 2.2.3 (i) and 20, Section 3.1 of Strengthening
and Restructuring of ICDS – A Broad Framework for Implementation).
4.2 List all components and sub-components of the Project.
1. Early childhood Care Education and Development
2. Care and Nutrition Counselling
3. Health Services
4. Community Mobilization, Awareness and IEC
Note: Refer to 4.3.2 above or see detailed table for sub-components on page 11 and 12,
Section (iii) of Strengthening and Restructuring of ICDS – A Broad Framework for
4 Outputs are the goods and services produced by the organisation. Outputs are delivered to an external party (usually to the public either individually or collectively) and comprise the majority of day-to-day interaction between people and government. Outputs include things such as issuing licences, investigations, assessing applications for benefits and providing policy advice.(OECD, 2002).
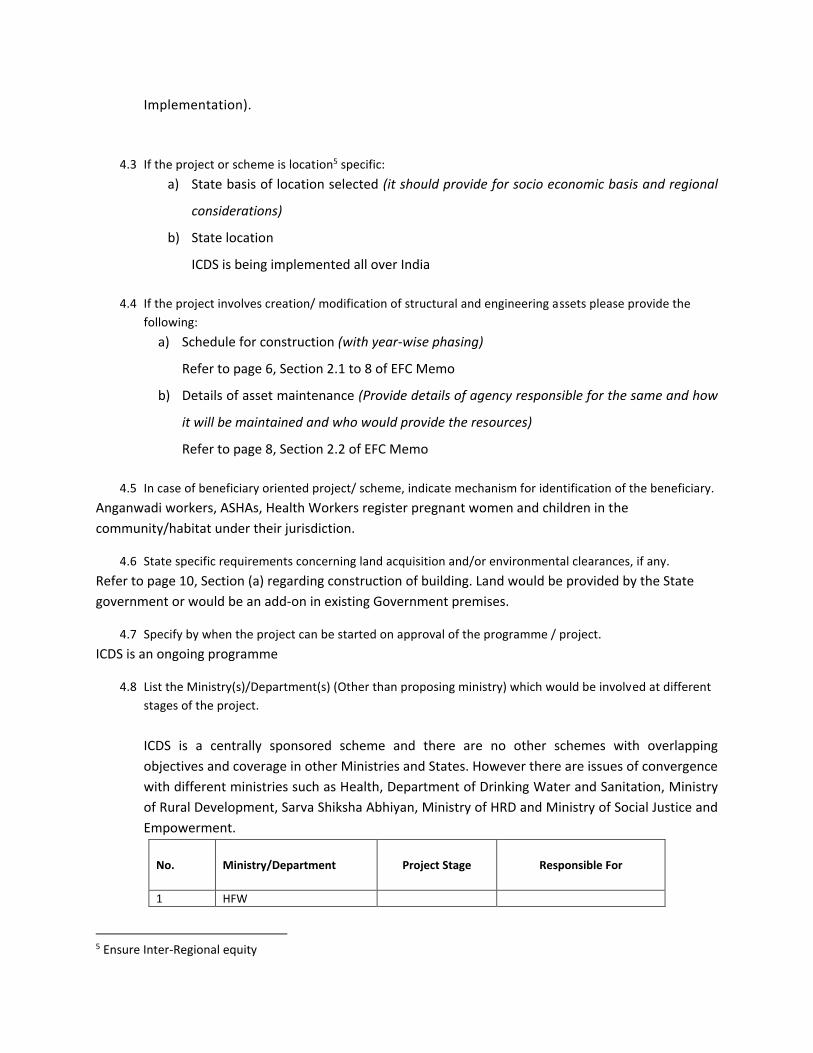
Implementation).
4.3 If the project or scheme is location5 specific:
a) State basis of location selected (it should provide for socio economic basis and regional
considerations)
b) State location
ICDS is being implemented all over India
4.4 If the project involves creation/ modification of structural and engineering assets please provide the
following:
a) Schedule for construction (with year-wise phasing)
Refer to page 6, Section 2.1 to 8 of EFC Memo
b) Details of asset maintenance (Provide details of agency responsible for the same and how
it will be maintained and who would provide the resources)
Refer to page 8, Section 2.2 of EFC Memo
4.5 In case of beneficiary oriented project/ scheme, indicate mechanism for identification of the beneficiary.
Anganwadi workers, ASHAs, Health Workers register pregnant women and children in the
community/habitat under their jurisdiction.
4.6 State specific requirements concerning land acquisition and/or environmental clearances, if any.
Refer to page 10, Section (a) regarding construction of building. Land would be provided by the State
government or would be an add-on in existing Government premises.
4.7 Specify by when the project can be started on approval of the programme / project.
ICDS is an ongoing programme
4.8 List the Ministry(s)/Department(s) (Other than proposing ministry) which would be involved at different
stages of the project.
ICDS is a centrally sponsored scheme and there are no other schemes with overlapping
objectives and coverage in other Ministries and States. However there are issues of convergence
with different ministries such as Health, Department of Drinking Water and Sanitation, Ministry
of Rural Development, Sarva Shiksha Abhiyan, Ministry of HRD and Ministry of Social Justice and
Empowerment.
No. Ministry/Department Project Stage Responsible For
1 HFW
5 Ensure Inter-Regional equity
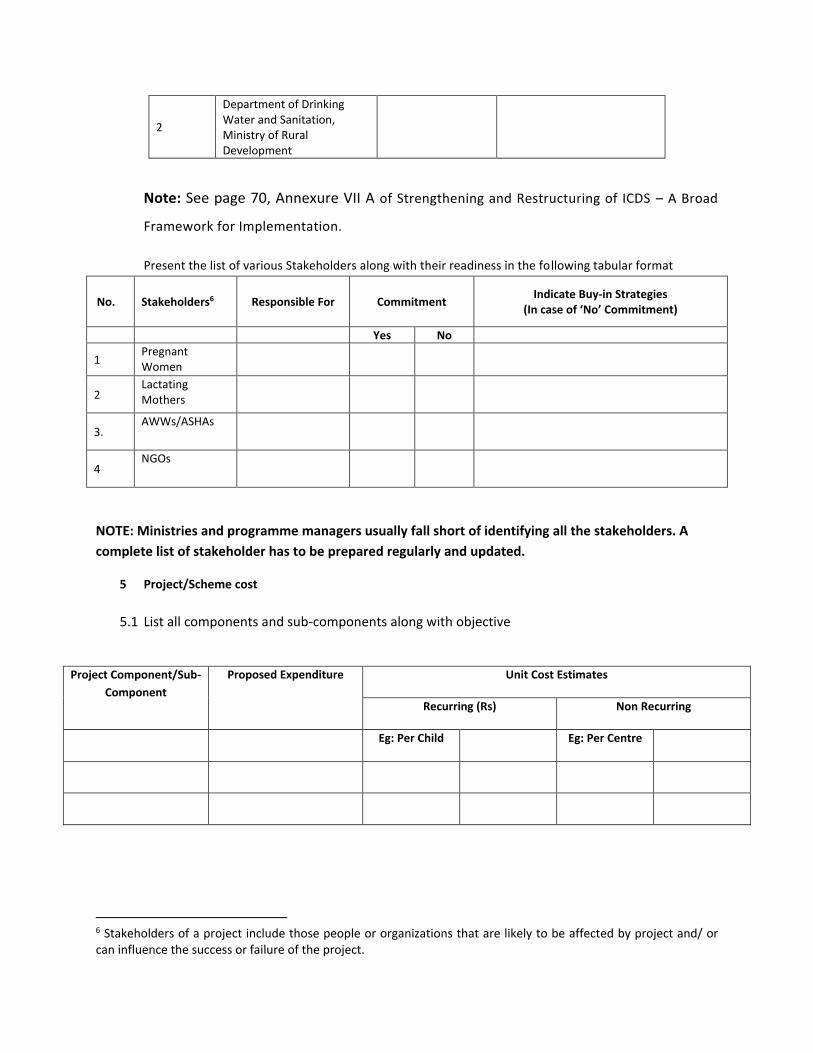
2
Department of Drinking Water and Sanitation, Ministry of Rural Development
Note: See page 70, Annexure VII A of Strengthening and Restructuring of ICDS – A Broad
Framework for Implementation.
Present the list of various Stakeholders along with their readiness in the following tabular format
No. Stakeholders6 Responsible For Commitment Indicate Buy-in Strategies
(In case of ‘No’ Commitment)
Yes No
1 Pregnant Women
2 Lactating Mothers
3. AWWs/ASHAs
4 NGOs
NOTE: Ministries and programme managers usually fall short of identifying all the stakeholders. A
complete list of stakeholder has to be prepared regularly and updated.
5 Project/Scheme cost
5.1 List all components and sub-components along with objective
Project Component/Sub-
Component
Proposed Expenditure Unit Cost Estimates
Recurring (Rs) Non Recurring
Eg: Per Child Eg: Per Centre
6 Stakeholders of a project include those people or organizations that are likely to be affected by project and/ or can influence the success or failure of the project.
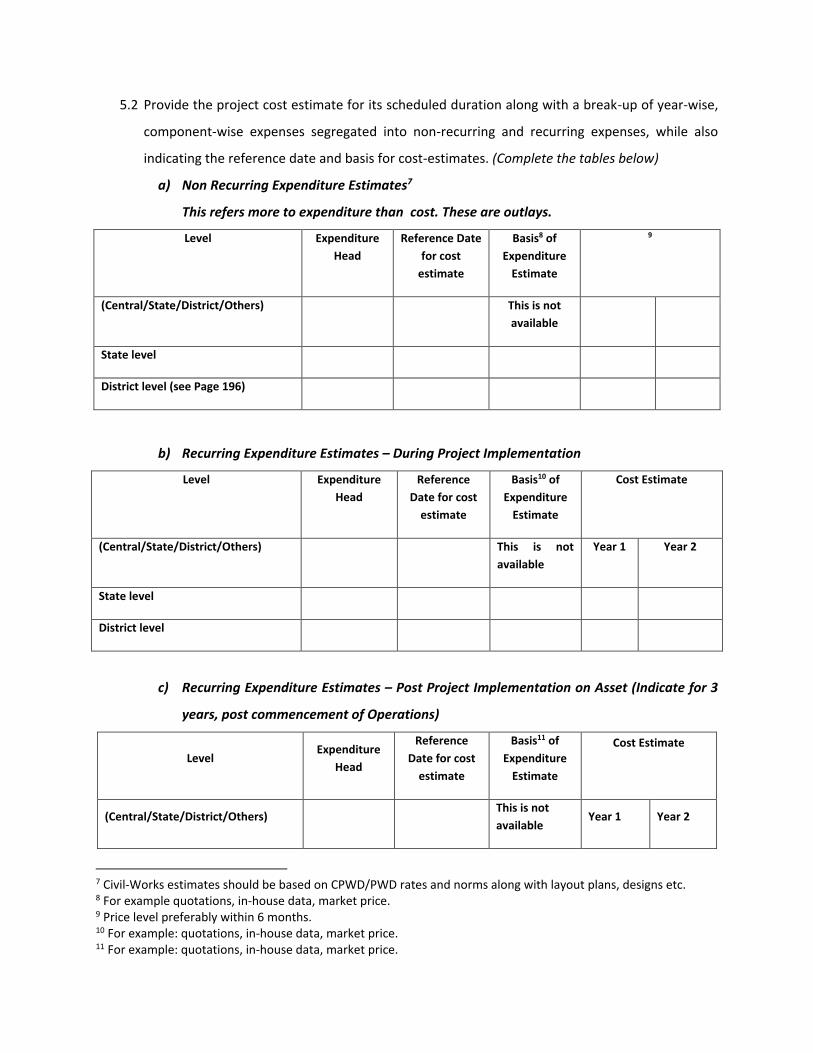
5.2 Provide the project cost estimate for its scheduled duration along with a break-up of year-wise,
component-wise expenses segregated into non-recurring and recurring expenses, while also
indicating the reference date and basis for cost-estimates. (Complete the tables below)
a) Non Recurring Expenditure Estimates7
This refers more to expenditure than cost. These are outlays.
Level Expenditure
Head
Reference Date
for cost
estimate
Basis8 of
Expenditure
Estimate
9
(Central/State/District/Others) This is not
available
State level
District level (see Page 196)
b) Recurring Expenditure Estimates – During Project Implementation
Level Expenditure
Head
Reference
Date for cost
estimate
Basis10 of
Expenditure
Estimate
Cost Estimate
(Central/State/District/Others) This is not
available
Year 1 Year 2
State level
District level
c) Recurring Expenditure Estimates – Post Project Implementation on Asset (Indicate for 3
years, post commencement of Operations)
Level Expenditure
Head
Reference
Date for cost
estimate
Basis11 of
Expenditure
Estimate
Cost Estimate
(Central/State/District/Others) This is not
available Year 1 Year 2
7 Civil-Works estimates should be based on CPWD/PWD rates and norms along with layout plans, designs etc. 8 For example quotations, in-house data, market price. 9 Price level preferably within 6 months. 10 For example: quotations, in-house data, market price. 11 For example: quotations, in-house data, market price.

Ongoing
D Unit cost estimates: Non Recurring
This pertains to one time investment per activity.
Unit Cost Rs
Investment per
additional AWC
Investment per district
center
D Unit cost estimates : Recurring
This pertains to each of services to be provided.
Unit Cost Rs
Cost per normal child (6-
72 months)
Cost per AW center
Cost per diet
Cost per pregnant
woman or lactating
mother
Cost per severely
malnourished child
(Note: Refer to Annexure XX on page 104, Revision of Financial norms for supplementary
nutrition - Cost Indexation in Strengthening and Restructuring of ICDS – A Broad Framework
for Implementation.
5.3 Indicate the physical and financial targets in a tabular format year-wise.

Components
Year Total
Year 1 Year 2 Physical
Total
Financial
Total
Physical Financial Physical Financial
PS 1
PS 2
PS 3
5.4 Indicate cost components that can vary, the factors that could cause the variation and the
extent of the expected variation.
This is not available
5.5 In case the project/ scheme involve payout of subsidy, the year wise expected outgo, up to the
last year of payout, may be indicated.
Not applicable
5.6 What is the foreign exchange component (separately for non-recurring and recurring
expenditure)? What are the items of expenditure involving foreign exchange and expenditure
on foreign experts? Has clearance of E.A.D. been obtained and has availability of credit facilities
been explored and if so, with what result?
Not applicable
5.7 Mention details of other financial commitments under the sponsoring Ministry.
Not Available. Important but is not available
5.8 Details of Projected Expenditure vis-à-vis Financing
(year-wise breakup not available)
Expenditure Financing Funding Gap
NRC
Expenditure
RC
Expenditure Total
Financing
already
secured
Central
Ministry
State
Government
External
Source
Funding Gap
by how
much?
Proposal to
fill funding
gap
Year 1
Year 2
Year 3
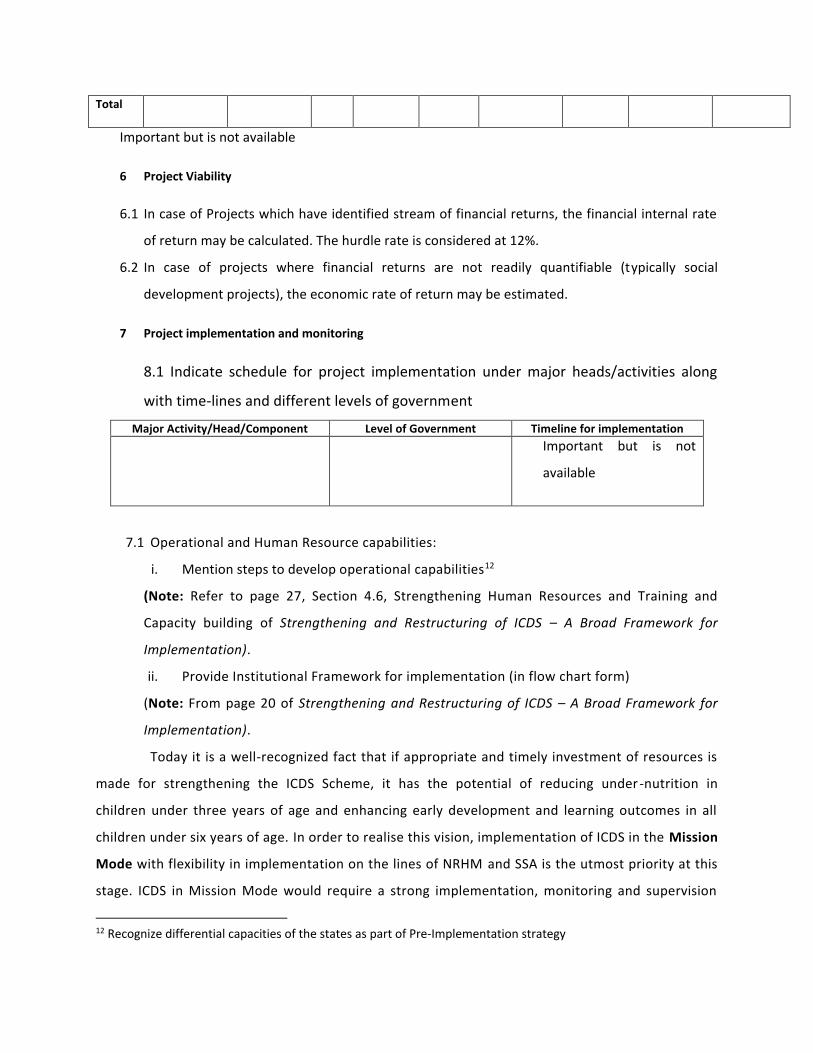
Total
Important but is not available
6 Project Viability
6.1 In case of Projects which have identified stream of financial returns, the financial internal rate
of return may be calculated. The hurdle rate is considered at 12%.
6.2 In case of projects where financial returns are not readily quantifiable (typically social
development projects), the economic rate of return may be estimated.
7 Project implementation and monitoring
8.1 Indicate schedule for project implementation under major heads/activities along
with time-lines and different levels of government
Major Activity/Head/Component Level of Government Timeline for implementation
Important but is not
available
7.1 Operational and Human Resource capabilities:
i. Mention steps to develop operational capabilities12
(Note: Refer to page 27, Section 4.6, Strengthening Human Resources and Training and
Capacity building of Strengthening and Restructuring of ICDS – A Broad Framework for
Implementation).
ii. Provide Institutional Framework for implementation (in flow chart form)
(Note: From page 20 of Strengthening and Restructuring of ICDS – A Broad Framework for
Implementation).
Today it is a well-recognized fact that if appropriate and timely investment of resources is
made for strengthening the ICDS Scheme, it has the potential of reducing under-nutrition in
children under three years of age and enhancing early development and learning outcomes in all
children under six years of age. In order to realise this vision, implementation of ICDS in the Mission
Mode with flexibility in implementation on the lines of NRHM and SSA is the utmost priority at this
stage. ICDS in Mission Mode would require a strong implementation, monitoring and supervision
12 Recognize differential capacities of the states as part of Pre-Implementation strategy

mechanism right from central level to the grassroots levels. ICDS mission would envisage creating
such arrangements at all levels. The existing service delivery mechanism will be strengthened
though setting up of a National ICDS Mission Directorate and Child Development Societies at State
and District levels. These Missions will be responsible for the effective implementation of ICDS. It is
also proposed to create advisory bodies at all levels to oversee and guide the ICDS Mission. An
Empowered Committee at the National level will be set up and equipped with the decision making
powers. An overview of the proposed institutional arrangements is given as under:
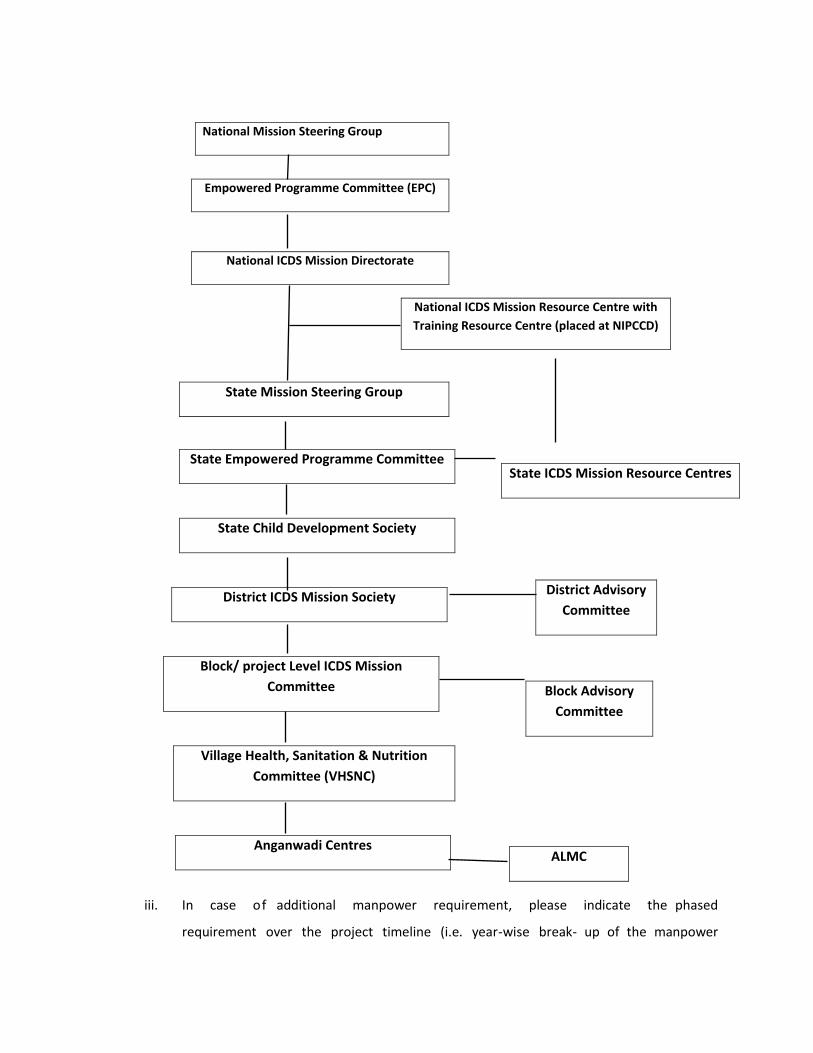
National Mission Steering Group
National ICDS Mission Directorate
State Mission Steering Group
State Empowered Programme Committee
State Child Development Society
District ICDS Mission Society
Block/ project Level ICDS Mission
Committee
Village Health, Sanitation & Nutrition
Committee (VHSNC)
iii. In case of additional manpower requirement, please indicate the phased
requirement over the project timeline (i.e. year-wise break- up of the manpower
Empowered Programme Committee (EPC)
National ICDS Mission Resource Centre with
Training Resource Centre (placed at NIPCCD)
State ICDS Mission Resource Centres
District Advisory
Committee
Block Advisory
Committee
Anganwadi Centres ALMC

requirement)
Project timeline and phased requirement needs to be mentioned, but presently is not
available
7.2 Monitoring for the project/ scheme proposed by Outcomes and Outputs
d. Page 25, Section 15 of EFC Memo Common Review Mission, Jan sunvai and Community
owned accreditation system
e. Refer to Guidelines for Constitution of Monitoring and Review Committees at different
level to review progress in implementation of ICDS scheme issued by MWCD on March 31,
2011. (Page 121 Annex XXIV) of Strengthening and Restructuring of ICDS – A Broad
Framework for Implementation.
f. Strengthening Monitoring, Review and Evaluation under ICDS Mission (Page 143 Annex
XXV) of Strengthening and Restructuring of ICDS – A Broad Framework for
Implementation.
Outcomes
Outcomes
Details regarding Data
Agency Responsible for
Data Collection
Methodology for Data
Collection Frequency of Data Collection
Outcome 1
Health Workers and
ASHA of Health
Department
Survey of their
respective habitat
Annual
Outcome 2
Gain in WEight
Anganwadi Workers Survey of their
respective habitat
Annual
Outputs
Outputs
Details regarding Data
Agency Responsible for
Data Collection
Methodology for Data
Collection Frequency of Data Collection
Output 1

Output 2
How many children are
being weighed regurlary
8 Project Risks
9.1 Indicate foreseeable risks which can affect the project design, costing and implementation
of the project.
Identified Risk Impact of Risk Mitigation Strategy13
Risk factor 1 : Food Poisoning
Risk factor 2 : Quality of Food Quality control and checks
9 Additional Information
9.1 Social Cost Benefit Analysis14 may be presented in case of projects where financial returns are
not readily quantifiable.
9.2 Please indicate if the project involves dislocation of human settlements. No
(This compensation cost is dependent on the rates indicated by District/State Authorities. Thus the
total compensation cost may be worked out on the basis of these rates.)
i. If yes, indicate the cost of land required to resettlement would be as indicated by the
District/State Authorities
ii. If yes, indicate the compensation to be paid to the displaced persons.
9.3 Please indicate if the project involves land reclamation or changes to existing land use plans.
No. Not Applicable
i. If yes, indicate the costs involved in prevention and mitigation of disaster(s) (natural
and man-made).
ii. If yes, analyze the likelihood and impact from earthquakes, floods, cyclones and
landslides due to the location of the project sites.
iii. Has the cost of disaster treatment/mitigation measures been included in the overall
project cost? (Yes/ No)
iv. What are the land use directives, regulations applicable? List preventive measures
enshrined in regulations which are to be complied with and confirm compliance.
13 Mitigation Strategy may be ignored in case Identified Risk is Positive in nature. 14 A document which could be referred to for the same is the UK Government’s Green Book: Appraisal and
Evaluation in Central Government, available at: http://www.hm-treasury.gov.uk/d/green_book_complete.pdf
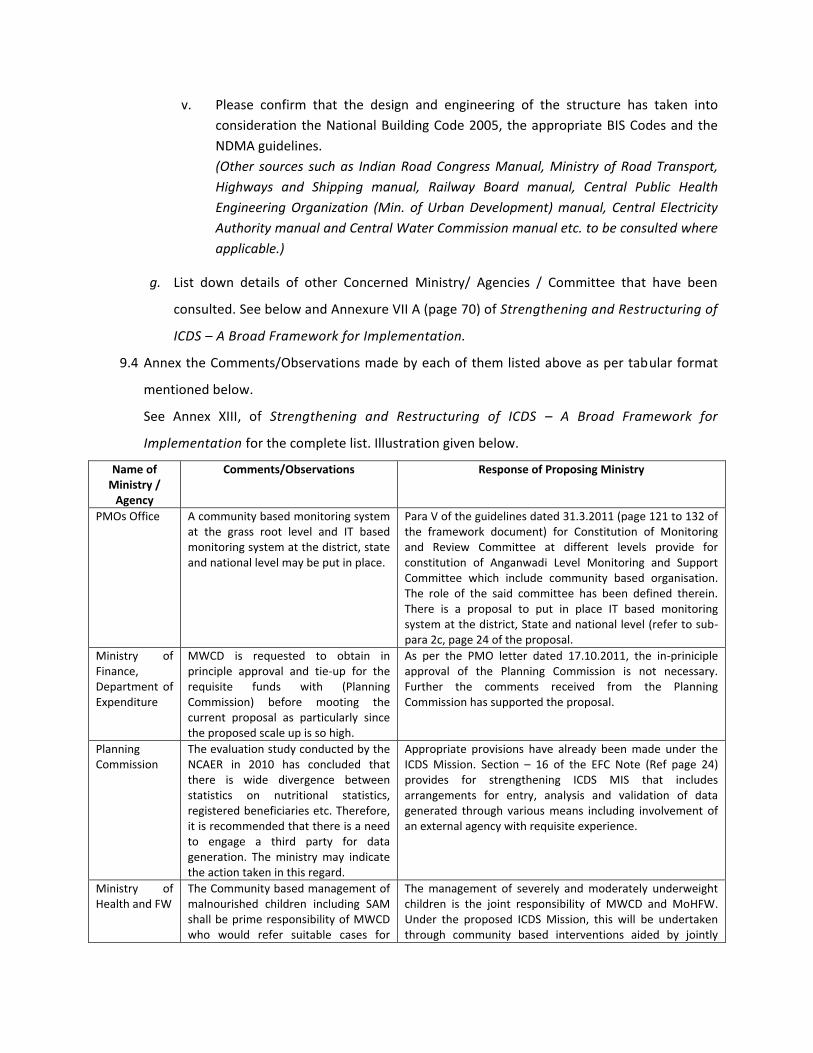
v. Please confirm that the design and engineering of the structure has taken into
consideration the National Building Code 2005, the appropriate BIS Codes and the
NDMA guidelines.
(Other sources such as Indian Road Congress Manual, Ministry of Road Transport,
Highways and Shipping manual, Railway Board manual, Central Public Health
Engineering Organization (Min. of Urban Development) manual, Central Electricity
Authority manual and Central Water Commission manual etc. to be consulted where
applicable.)
g. List down details of other Concerned Ministry/ Agencies / Committee that have been
consulted. See below and Annexure VII A (page 70) of Strengthening and Restructuring of
ICDS – A Broad Framework for Implementation.
9.4 Annex the Comments/Observations made by each of them listed above as per tabular format
mentioned below.
See Annex XIII, of Strengthening and Restructuring of ICDS – A Broad Framework for
Implementation for the complete list. Illustration given below.
Name of Ministry /
Agency
Comments/Observations Response of Proposing Ministry
PMOs Office A community based monitoring system at the grass root level and IT based monitoring system at the district, state and national level may be put in place.
Para V of the guidelines dated 31.3.2011 (page 121 to 132 of the framework document) for Constitution of Monitoring and Review Committee at different levels provide for constitution of Anganwadi Level Monitoring and Support Committee which include community based organisation. The role of the said committee has been defined therein. There is a proposal to put in place IT based monitoring system at the district, State and national level (refer to sub-para 2c, page 24 of the proposal.
Ministry of Finance, Department of Expenditure
MWCD is requested to obtain in principle approval and tie-up for the requisite funds with (Planning Commission) before mooting the current proposal as particularly since the proposed scale up is so high.
As per the PMO letter dated 17.10.2011, the in-priniciple approval of the Planning Commission is not necessary. Further the comments received from the Planning Commission has supported the proposal.
Planning Commission
The evaluation study conducted by the NCAER in 2010 has concluded that there is wide divergence between statistics on nutritional statistics, registered beneficiaries etc. Therefore, it is recommended that there is a need to engage a third party for data generation. The ministry may indicate the action taken in this regard.
Appropriate provisions have already been made under the ICDS Mission. Section – 16 of the EFC Note (Ref page 24) provides for strengthening ICDS MIS that includes arrangements for entry, analysis and validation of data generated through various means including involvement of an external agency with requisite experience.
Ministry of Health and FW
The Community based management of malnourished children including SAM shall be prime responsibility of MWCD who would refer suitable cases for
The management of severely and moderately underweight children is the joint responsibility of MWCD and MoHFW. Under the proposed ICDS Mission, this will be undertaken through community based interventions aided by jointly
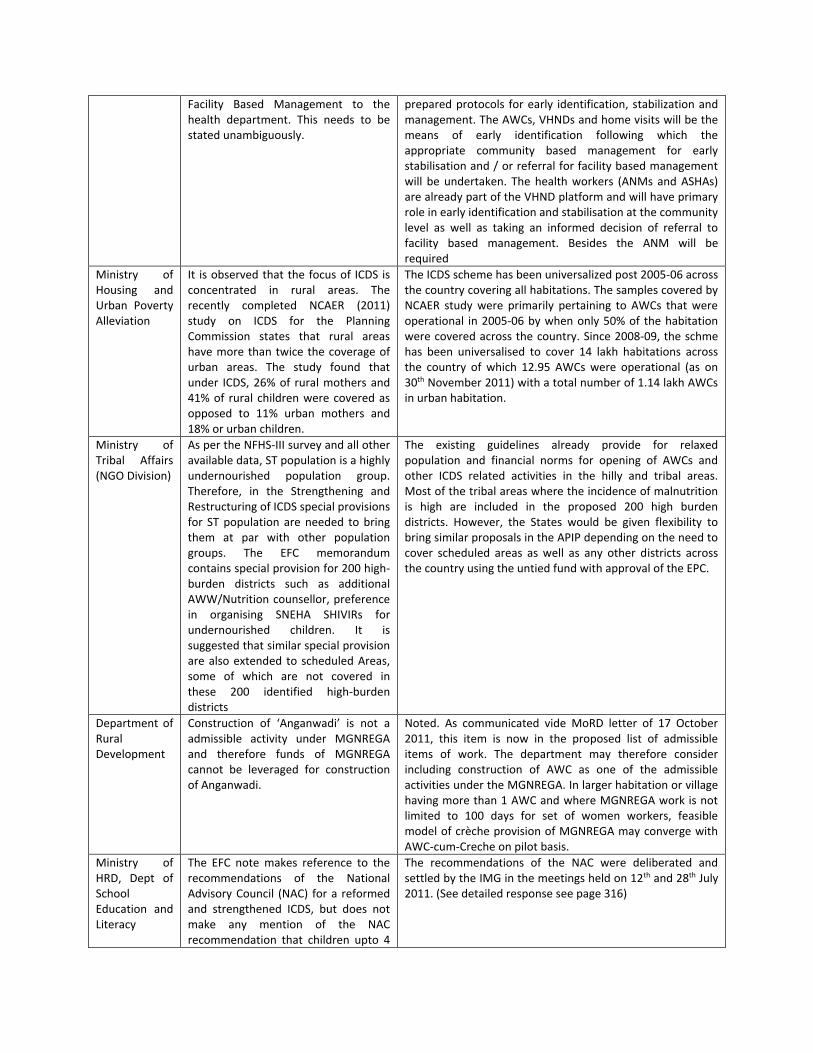
Facility Based Management to the health department. This needs to be stated unambiguously.
prepared protocols for early identification, stabilization and management. The AWCs, VHNDs and home visits will be the means of early identification following which the appropriate community based management for early stabilisation and / or referral for facility based management will be undertaken. The health workers (ANMs and ASHAs) are already part of the VHND platform and will have primary role in early identification and stabilisation at the community level as well as taking an informed decision of referral to facility based management. Besides the ANM will be required
Ministry of Housing and Urban Poverty Alleviation
It is observed that the focus of ICDS is concentrated in rural areas. The recently completed NCAER (2011) study on ICDS for the Planning Commission states that rural areas have more than twice the coverage of urban areas. The study found that under ICDS, 26% of rural mothers and 41% of rural children were covered as opposed to 11% urban mothers and 18% or urban children.
The ICDS scheme has been universalized post 2005-06 across the country covering all habitations. The samples covered by NCAER study were primarily pertaining to AWCs that were operational in 2005-06 by when only 50% of the habitation were covered across the country. Since 2008-09, the schme has been universalised to cover 14 lakh habitations across the country of which 12.95 AWCs were operational (as on 30th November 2011) with a total number of 1.14 lakh AWCs in urban habitation.
Ministry of Tribal Affairs (NGO Division)
As per the NFHS-III survey and all other available data, ST population is a highly undernourished population group. Therefore, in the Strengthening and Restructuring of ICDS special provisions for ST population are needed to bring them at par with other population groups. The EFC memorandum contains special provision for 200 high-burden districts such as additional AWW/Nutrition counsellor, preference in organising SNEHA SHIVIRs for undernourished children. It is suggested that similar special provision are also extended to scheduled Areas, some of which are not covered in these 200 identified high-burden districts
The existing guidelines already provide for relaxed population and financial norms for opening of AWCs and other ICDS related activities in the hilly and tribal areas. Most of the tribal areas where the incidence of malnutrition is high are included in the proposed 200 high burden districts. However, the States would be given flexibility to bring similar proposals in the APIP depending on the need to cover scheduled areas as well as any other districts across the country using the untied fund with approval of the EPC.
Department of Rural Development
Construction of ‘Anganwadi’ is not a admissible activity under MGNREGA and therefore funds of MGNREGA cannot be leveraged for construction of Anganwadi.
Noted. As communicated vide MoRD letter of 17 October 2011, this item is now in the proposed list of admissible items of work. The department may therefore consider including construction of AWC as one of the admissible activities under the MGNREGA. In larger habitation or village having more than 1 AWC and where MGNREGA work is not limited to 100 days for set of women workers, feasible model of crèche provision of MGNREGA may converge with AWC-cum-Creche on pilot basis.
Ministry of HRD, Dept of School Education and Literacy
The EFC note makes reference to the recommendations of the National Advisory Council (NAC) for a reformed and strengthened ICDS, but does not make any mention of the NAC recommendation that children upto 4
The recommendations of the NAC were deliberated and settled by the IMG in the meetings held on 12th and 28th July 2011. (See detailed response see page 316)

years be provided ECCE experiences through the ICDS, and that a pre-school section be provided in all government primary schools to ensure continuity in the child’s educational growth. D/SE&L had conveyed concurrence to the NAC recommendation vide letter No.14-10/2011-EE.8 dated July 2011, and this factual position may be specifically incorporated in the EFC note.
Ministry of Drinking Water and Sanitation
Chapter 2.1 (i) Page -7 of EFC: Under the NRDWP of Ministry of Drinking Water and Sanitation, one of the goals is to provide drinking water facilities to all rural anganwadis housed in Government/community buildings. Assistance is provided on a 50:50 Centre: State sharing basis to States for this purpose.
There are 14 lakh approved AWCs under the ICDS Scheme, of which only about 7 lakh AWCs are operating from their own building/school building/others with little space or operating from verandah. The remaining AWCs are either functioning from the rented premises and / or the house of AWWs. Since the provisions of NRDWP are only restrictive to Government / Community buildings in rural areas, a large number of AWCs get left out. The provisions of NRDWP may be extended to cover all AWCs.
10 Points on which decisions/sanctions are required.
Refer to page 52, Section 25 of the EFC Memo
(i) Continued implementation of ICDS, along with changes proposed for strengthening and
restructuring of ICDS, during the XII Five Year Plan;
(ii) Approval for proposals contained in para 2 © of this EFC Memo;
(iii) Approval for creation of posts as per proposal contained at para 7 of this EFC Memo and as per
details in Annexure VII to be operationalised in a phased manner;
(iv) Approval for implementation of ICDS in Mission Mode as per the Broad Framework for
Implementation of ICDS Mission including illustrative financial norms for listed activities
with space for flexibility and innovation to States;
(v) Approval for the constitution of the Mission Steering Group (NMSG) and Empowered
Programme Committee (EPC) at national and State levels for effective planning,
implementation, monitoring and supervision of ICDS Mission;
(vi) Approval for delegation of powers to the Empowered Programme Committee (EPC) to approve
APIPs as well as make modifications of norms of approved schemes/items of
expenditure/add new schemes, within the overall budget of ICDS Mission/Ministry of
Women and Child Development;
(vii) Approval of the National ICDS Mission Directorate to be headed by the Joint Secretary level
officer as Mission Director (as per detailed given in section – of this EFC Note) and to vest it
with adequate administrative and financial powers by the EPC as deemed necessary, to
enable the Directorate for working towards achieving the agreed vision and outcomes of the
ICDS Mission;
(viii) Creation of a separate ICDS Mission Budget head to allow flexibility and integration within
the child development and nutrition sectors and for convergent action with wider
determinants of maternal and child nutrition.
(ix) Approval on the allocation of financial resource for ICDS Mission during 12th Five Year Plan (2012
– 2016), i.e., Rs 1,80,055 crore with average annual GOI share of about Rs 36,000 crore;
(x) Approval on proposed revision and inclusion of norms under ICDS Mission given at Annex – XII.
(xi) Approval for carrying out any such modifications in operational modalities by the Ministry of
Women and Child Development as may be warranted, from time to time, for effective
implementation of the ICDS Scheme.
Note: Decisions /Sanctions required should be a self-contained document. It should not point to other
documents and references.