report on instrumentation best practice - tethys ec report on instrumentation best practice rev. ,...
TRANSCRIPT

WP2: Marine Energy System Testing - Standardisation and Best Practice
Deliverable 2.5 EC
Report on Instrumentation Best Practice
Marine Renewables Infrastructure Network
Status: Final Version: Date: 20-Dec-2013
EC FP7 Capacities: Research Infrastructures Grant Agreement No. 262552, MARINET

D2.5 EC Report on Instrumentation Best Practice
Rev. , 20-Dec-2013 i
ABOUT MARINET MARINET (Marine Renewables Infrastructure Network for emerging Energy Technologies) is an EC-funded network of research centres and organisations that are working together to accelerate the development of marine renewable energy - wave, tidal & offshore-wind. The initiative is funded through the EC's Seventh Framework Programme (FP7) and runs for four years until 2015. The network of 29 partners with 42 specialist marine research facilities is spread across 11 EU countries and 1 International Cooperation Partner Country (Brazil). MARINET offers periods of free-of-charge access to test facilities at a range of world-class research centres. Companies and research groups can avail of this Transnational Access (TA) to test devices at any scale in areas such as wave energy, tidal energy, offshore-wind energy and environmental data or to conduct tests on cross-cutting areas such as power take-off systems, grid integration, materials or moorings. In total, over 700 weeks of access is available to an estimated 300 projects and 800 external users, with at least four calls for access applications over the 4-year initiative. MARINET partners are also working to implement common standards for testing in order to streamline the development process, conducting research to improve testing capabilities across the network, providing training at various facilities in the network in order to enhance personnel expertise and organising industry networking events in order to facilitate partnerships and knowledge exchange. The initiative consists of five main Work Package focus areas: Management & Administration, Standardisation & Best Practice, Transnational Access & Networking, Research, Training & Dissemination. The aim is to streamline the capabilities of test infrastructures in order to enhance their impact and accelerate the commercialisation of marine renewable energy. See www.fp7-marinet.eu for more details.
Partners
Ireland University College Cork, HMRC (UCC_HMRC)
Coordinator
Sustainable Energy Authority of Ireland (SEAI_OEDU)
Denmark Aalborg Universitet (AAU)
Danmarks Tekniske Universitet (RISOE)
France Ecole Centrale de Nantes (ECN)
Institut Français de Recherche Pour l'Exploitation de la Mer (IFREMER)
United Kingdom National Renewable Energy Centre Ltd. (NAREC)
The University of Exeter (UNEXE)
European Marine Energy Centre Ltd. (EMEC)
University of Strathclyde (UNI_STRATH)
The University of Edinburgh (UEDIN)
Queen’s University Belfast (QUB)
Plymouth University(PU)
Spain Ente Vasco de la Energía (EVE)
Tecnalia Research & Innovation Foundation (TECNALIA)
Belgium 1-Tech (1_TECH)
Netherlands Stichting Tidal Testing Centre (TTC)
Stichting Energieonderzoek Centrum Nederland (ECNeth)
Germany Fraunhofer-Gesellschaft Zur Foerderung Der Angewandten Forschung E.V (Fh_IWES)
Gottfried Wilhelm Leibniz Universität Hannover (LUH)
Universitaet Stuttgart (USTUTT)
Portugal Wave Energy Centre – Centro de Energia das Ondas (WavEC)
Italy Università degli Studi di Firenze (UNIFI-CRIACIV)
Università degli Studi di Firenze (UNIFI-PIN)
Università degli Studi della Tuscia (UNI_TUS)
Consiglio Nazionale delle Ricerche (CNR-INSEAN)
Brazil Instituto de Pesquisas Tecnológicas do Estado de São Paulo S.A. (IPT)
Norway Sintef Energi AS (SINTEF)
Norges Teknisk-Naturvitenskapelige Universitet (NTNU)

D2.5 EC Report on Instrumentation Best Practice
Rev. , 20-Dec-2013 ii
DOCUMENT INFORMATION Title Report on Instrumentation Best Practice
Distribution Management Board and EC
Document Reference MARINET-D2.5 EC
Deliverable Leader
Amélie Têtu AAU
Contributing Authors
Amélie Têtu AAU Peter Frigaard AAU Jens Peter Kofoed AAU Miguel Lopes WAVEC Aby Iyer UEDIN Sylvain Bourdier ECN Dorleta Marina EVE Stuart Stripling PU Lars Johanning UNEXE
REVISION HISTORY Rev. Date Description Prepared by
(Name & Org.) Approved By (Task/Work-
Package Leader)
Status (Draft/Final)
01 27/11/2013 Final draft Amelie Tetu AAU Draft
02 20/12/ 2013 Final Copy Cameron Johnstone
Final
ACKNOWLEDGEMENT The work described in this publication has received support from the European Community - Research Infrastructure Action under the FP7 “Capacities” Specific Programme through grant agreement number 262552, MaRINET.
LEGAL DISCLAIMER The views expressed, and responsibility for the content of this publication, lie solely with the authors. The European Commission is not liable for any use that may be made of the information contained herein. This work may rely on data from sources external to the MARINET project Consortium. Members of the Consortium do not accept liability for loss or damage suffered by any third party as a result of errors or inaccuracies in such data. The information in this document is provided “as is” and no guarantee or warranty is given that the information is fit for any particular purpose. The user thereof uses the information at its sole risk and neither the European Commission nor any member of the MARINET Consortium is liable for any use that may be made of the information.

D2.5 EC Report on Instrumentation Best Practice
Rev. , 20-Dec-2013 iii
EXECUTIVE SUMMARY
The present document deals with the specificity of the instrumentation related to wave energy converters.
The introduction section summarizes the different development phases of wave energy converters and introduces Froude scaling law which emphasizes the requirement for instrumentation at different scaling factors of wave energy converters.
An overview of the different instruments related to wave climate, forces, flow, pressures, motions, torque and current velocity is presented with commonly used instruments to measure those physical quantities.
The principal outcome of this report is a list of the different instrumentation for modelling the power take-off system and for measuring the power harvested from the waves by the wave energy converters for scaled models, which is the biggest challenge when modelling this type of devices.
The report lists best practice as used in several MaRINET partners laboratory facilities.

D2.5 EC Report on Instrumentation Best Practice
Rev. , 20-Dec-2013 iv
NOMENCLATURE
SYMBOLS
Acceleration [m/s2]
Coriolis force [N]
Force of friction [N]
Instantaneous force [N]
Froude number [-]
Gravitational acceleration [m/s2]
Difference in height [m]
Spring stiffness [N/m]
Characteristic length [m]
Full scale characteristic length [m]
Model characteristic length [m]
Mass [kg]
Moment [Nm]
Scaling ratio [-]
Pressure difference [kg/ms2]
Instantaneous power [W]
Time average power [W]
Hydraulic power of reservoir [W]
Total hydraulic power [W]
Overtopping rate of reservoir [m3/s]
Fluid density [kg/m3]
Radius [m]
Crest freeboard of reservoir [m]
Time [s]
Period of time [s]
Stream velocity [m/s]
Full scale stream velocity [m/s]
Model stream velocity [m/s]
Angular rate [s-1]
Initial resonance frequency [s-1]
Resonance frequency of the sensing mode [s-1]
Instantaneous velocity [s-1]
Distance [m]
Instantaneous velocity [m/s]
Sensing vibration amplitude [m]
Initial vibration amplitude [m]
ABBREVIATIONS
ADV Acoustic Doppler velocimeter DoF Degree-of-freedom MaRINET Marine Renewables Infrastructure Network MEMS Micro-Electro-Mechanical-Systems PTO Power take-off SSG Seawave Cone-Slot Generator WEC Wave energy converter

D2.5 EC Report on Instrumentation Best Practice
Rev. , 20-Dec-2013 v
CONTENTS
1 INTRODUCTION .............................................................................................................................................1
1.1 DEVELOPMENT PHASES OF WAVE ENERGY CONVERTERS ............................................................................................... 1 1.2 SCALING LAW ....................................................................................................................................................... 2 1.3 CONCLUSION ....................................................................................................................................................... 2
2 INSTRUMENTATION .......................................................................................................................................3
2.1 MEASURING TECHNIQUES – AN OVERVIEW................................................................................................................ 3 2.1.1 Relevant parameters ................................................................................................................................... 3 2.1.2 Conclusion ................................................................................................................................................... 8
3 MODELING THE POWER TAKE-OFF SYSTEM.....................................................................................................9
3.1 FOR WAVE ENERGY CONVERTERS ............................................................................................................................. 9 3.1.1 Friction based .............................................................................................................................................. 9 3.1.2 Weight lifting by rotating axle .................................................................................................................. 10 3.1.3 Eddy current brakes ................................................................................................................................... 11 3.1.4 Pressure difference .................................................................................................................................... 12 3.1.5 Overtopping flow ....................................................................................................................................... 13 3.1.6 Passive linear actuator .............................................................................................................................. 14 3.1.7 Advanced PTO systems .............................................................................................................................. 15 3.1.8 Summary ................................................................................................................................................... 16
4 CONCLUSIONS AND RECOMMENDATIONS .................................................................................................... 18
5 REFERENCES ................................................................................................................................................ 19

D2.5 EC Report on Instrumentation Best Practice
Rev. , 20-Dec-2013 Page 1 of 20
1 INTRODUCTION
1.1 DEVELOPMENT PHASES OF WAVE ENERGY CONVERTERS Wave energy converters (WEC) are still at an early stage of development. This is illustrated by the limited amount of devices currently tested in real sea conditions and the many different types of working principle behind these devices.
For technical and financial reasons, WECs cannot be tested directly in full scale. The optimized pathway for developing such a device includes 4 different phases. The different phases are described in Table 2.1.
Phase 1 Phase 2 Phase 3 Phase 4
Scale 1:20 – 1:100 1:10 – 1:50 1:3 – 1:10 1:1 – 1:3
Location Lab Lab Nursery test site Open seas
Model - Idealized setup - Load-adaptable
power take-off - Standard
mooring
- Final design - Mooring layout - Simulated power
take-off
- Full fabrication - True power take-
off and electrical generator
First fully operational device
Waves Wave States Wave States Pilot site waves Full scatter
Objectives - Concept validation
- Performance estimation
- Design variables - Power take-off &
mooring characteristics
- Loads estimation - Movement
estimation
- Performance estimation
- Parametric study - Detailed
numerical calculations
- Estimates on cost
- Feasibility study - Power take-off
design - Sea keeping
- Real sea performance
- Wave-to-wire model
- Control strategy - Mooring forces - Survival & sea
keeping - Marine
environment
International market, projection for device sales
Table 1-1: The 4 development phases for wave energy converters [1],[2],[3]
Phase 1 intends in verifying and proving the working principle of the device. The validation model is not always identical to the full scale model but includes the basic working principle and at this phase the scale is usually between 1:20 to 1:100. Monochromatic waves are first used to get the general hydrodynamic behaviour of the model. Power estimation is then achieved for different wave states in irregular waves. A general characterisation of the model can be done at this stage. This usually leads to some modifications of the model and their influence on the performance is evaluated. This general characterisation gives key information in the future optimisation and development of the design.
Phase 2 is often referred to as the design and feasibility study. The model is usually between 1:10 and 1:50 in scaling ratio and is an improved version of the phase 1 based on the optimisation results obtained during the proof of concept tests. The tests performed during this phase are similar to the one in phase 1, but more accurate as the outcome of this phase should lead to the final design.
In Phase 3 of the development the tests are done on a functional model. The scaling ratios at this stage are typically between 1:3 and 1:10 and the tests are usually performed in a nursery test site having non-controllable real sea conditions. The physical model is similar to the one of Phase 2 and the power conversion system should be the same as the one used in the full scale model. At this stage it is recommended to take advantage of a grid connection and use power electronics in order to develop the control strategy and monitor the quality of the electricity supply. By the end of this phase, information on the overall cost of the full scale model, the control of the system and the electrical performance of the device should be available.

D2.5 EC Report on Instrumentation Best Practice
Rev. , 20-Dec-2013 Page 2 of 20
Phase 4 is the last phase before commercialising the device. It includes the deployment of a fully operational device in open seas. To reduce cost, a section of the complete device is usually built and installed. The aim of this phase is to demonstrate that the device is operational and that it can supply electricity on a long term basis.
1.2 SCALING LAW For marine renewable devices, the inertial forces are predominant. Froude’s law is used to scale the different parameters from the full scale to a given scaling ratio or vice-versa in order to insure hydrodymanic similitude. The Froude number ( ) is a dimensionless number that measures the relative importance between the inertial forces and the gravitational forces and is expressed as:
√
where is the stream velocity, the gravitational acceleration and the characteristic length. The Froude number should be constant whatever the scaling ratio. The scaling ratio ( ), requiring geometrical similarity is obtained from:
√
√
where the subscript and stand for full scale and model respectively.
Table 1-2 presents how to transfer the different parameters measured from a 1:20 scaled model to the full scale device.
Parameter Scaling effect Example for a 1:20 model
Length
Area
Volume
Time √ Velocity √ Force
Power
Table 1-2 : Scaling parameters relative to the full scale values.
For example, if a full scale device as a power production rated at 1 MW, the 1:20 model power rating will be of the order of 28 W. If one measures a maximum load of 70 kg on a model in scale 1:20 during laboratory tests, this load will be equal to 570 tonnes in full scale.
1.3 CONCLUSION In order for a device to evolve through the different phases of the development introduced earlier, the energy production has to be evaluated carefully at each phase. This is very demanding on the instrumentation level since it is important to be able to relate the results obtained from one phase to the next, where the parameters values vary significantly.

D2.5 EC Report on Instrumentation Best Practice
Rev. , 20-Dec-2013 Page 3 of 20
2 INSTRUMENTATION
2.1 MEASURING TECHNIQUES – AN OVERVIEW When testing a WEC, two main points are of interest: defining the power production of the device and measuring the behaviour of the device subjected to extreme loads. In order to assess the performances of a device, several parameters have to be measured:
Wave climate
Forces (strain, stress)
Flow
Pressures
Motions (displacements, velocities, accelerations)
Torque
Current velocity
Dimensions
Table 2.2 lists examples of instruments used to measure the different quantities mentioned above.
Examples of instruments
Wave climate Resistance and capacitance gauges
Radar 3D arrays Wave rider buoy
Forces Frame with displacement gauges
Tension/compression transducer
“Bone” combined with strain gauges
Strain gauge on the structure
Flow Pitot pipe Turbine flow meter Ultrasonic (Doppler) Pressure and moment
Pressures Pressure transducers / transmitters
Motions Accelerometer Ultrasonic remote sensing
Camera based sensing
Wire / potentiometer
Torque Dynamomenter Generator Water breaks Disc brakes
Current velocity Ultrasonic flowmeter Radar Acoustic profilers Acoustic Doppler velocimeter
Table 2.2 Examples of instruments to measure wave climate, forces, flow, pressure, motions, torque and current velocity.
2.1.1 Relevant parameters
2.1.1.1 Wave climate
In order to assess the efficiency of a WEC it is necessary to know the incoming energy flux in the waves where the device is placed. Whatever the scaling ratio, the wave climate has to be known. An extensive database of wave measurement devices has been compiled within the MaRINET consortium. The reader is referred to the deliverable D2.1 [12] for instrumentation related to wave measurements.
2.1.1.2 Forces
Forces are widely measured when testing WEC at all scales. Mooring forces, fatigue study on structures, force-displacement curves are examples of important parameters for which forces have to be measured. Force transducers are commonly used for those purposes. Figure xx shows a strain gauge S-beam load cell commonly used at the deep water wave basin at the department of civil engineering, Aalborg University.

D2.5 EC Report on Instrumentation Best Practice
Rev. , 20-Dec-2013 Page 4 of 20
(a)
(b)
Figure 2-1: (a) Schematic of an S-Beam load cell and (b) commonly used 222 N S-beam load cell (Pictures taken from [13]) at the deep wave basin at the department of civil engineering, Aalborg University.
Strain gauge load cells are certainly the most commonly used type of force transducers. That type of cells consists of an element for which its deformation is proportional to the force applied on it. Materials like for example tool steel, piezoelectric crystals, silicon, stainless steel, aluminium or beryllium copper can be used. The shape the element depends on the range of forces to be measured, dimensional limits, performances and cost of production. Figure 2-1 shows an S-beam load cell where the elastic element uses the metal foil technology. The working range of strain gauge load cells can vary from 5 N to more than 50 MN. When working with force transducers, it is important to have an idea of the forces to be measured in order to choose the appropriate load cell for the particular application.
2.1.1.3 Flow
For WEC involving a flow of air or water feeding a turbine, measuring the flow is essential. Pitot static tube can be used to measure the flow of air or water. A concentric Pitot tube is placed in the flow as shown in Figure 2-2. The inner tube measure the stagnation pressure with an opening perpendicular to the flow while the outer tube measures the static pressure with an opening parallel to the flow. By taking the reference plane at the height of the Pitot tube measurement, a pressure difference ( ) at the other end of the concentric tube can be rearranged to give the velocity of the flow:
√
where is the fluid density. As can be seen from Figure 2-2 a Pitot-static tube measures a difference of pressure at a local point. The result is the local flow velocity and not its average.
Figure 2-2: Illustration of the working principle of a Pitot-static tube (taken from [15]).
Figure 2-3 shows a turbine flowmeter used to measure flow and flow velocity. The working principle is very simple. The screw head turns with a speed proportional to the flow velocity. The flow velocity is then calculated from the number of rotation the propeller does for a given time, taking into account the calibration equation. These turbine flowmeters are precise and reliable and have been used for decades.

D2.5 EC Report on Instrumentation Best Practice
Rev. , 20-Dec-2013 Page 5 of 20
Figure 2-3: Turbine flowmeter (taken from [14]).
Another way of measuring average flow velocity is to utilize ultrasonic flowmeter sensors. This type of instrument takes advantage of the Doppler effect. The frequency of the ultrasonic waves passing through the flow of water is shifted depending of the flow velocity of water.
2.1.1.4 Pressure
It is sometimes needed to know the air pressure or the water pressure in a WEC. Pressure sensors can be used for that. The technology behind those sensors can vary drastically and there exist many different technologies and companies producing pressure sensors. For general purpose pressure measurement, piezoresistive strain gauges are commonly used. The piezoresistive effect corresponds to the change in resistivity of a semiconductor material or a metal when subjected to a strain and deformation. An example of a microfabricated pressure sensor is shown in Figure 2-4. A piezoresistor is placed in the region of maximum tensile stress when the thin diaphragm is deformed by an external pressure. Knowing the response in resisistivity of the piezoresistor, the external pressure can be obtained.
(a)
(b)
Figure 2-4: Side view of a piezoresistive pressure sensor (taken from [16]).
Figure 2-5: GE Unik 5000 piezoresistive pressure sensor.
Figure 2-5 shows an example a piezoresistive pressure sensor.

D2.5 EC Report on Instrumentation Best Practice
Rev. , 20-Dec-2013 Page 6 of 20
2.1.1.5 Motions
Recording the motion of a body subjected to waves is extremely relevant when dealing with all types of WEC. For qualitative measurement, a camera can be sufficient, but more advanced instruments are found when quantitative measurements are needed.
Accelerometers are one example. They measure linear acceleration along with tilt angle. Figure 2-6 illustrates the working principle of an accelerometer. It consists of spring damper mass system fixed to the body of interested. Acceleration of the body of interest will causes a force to act on the proof mass which will be displaced by a distance . By applying Newton’s second law, the acceleration ( ) of the body of interest can be obtained:
where is the mass attached to the spring and is the spring stiffness. The damping is required in order to avoid the spring mass system to oscillate at its natural frequency for any input signal.
Figure 2-6: Working principle of an accelerometer [17].
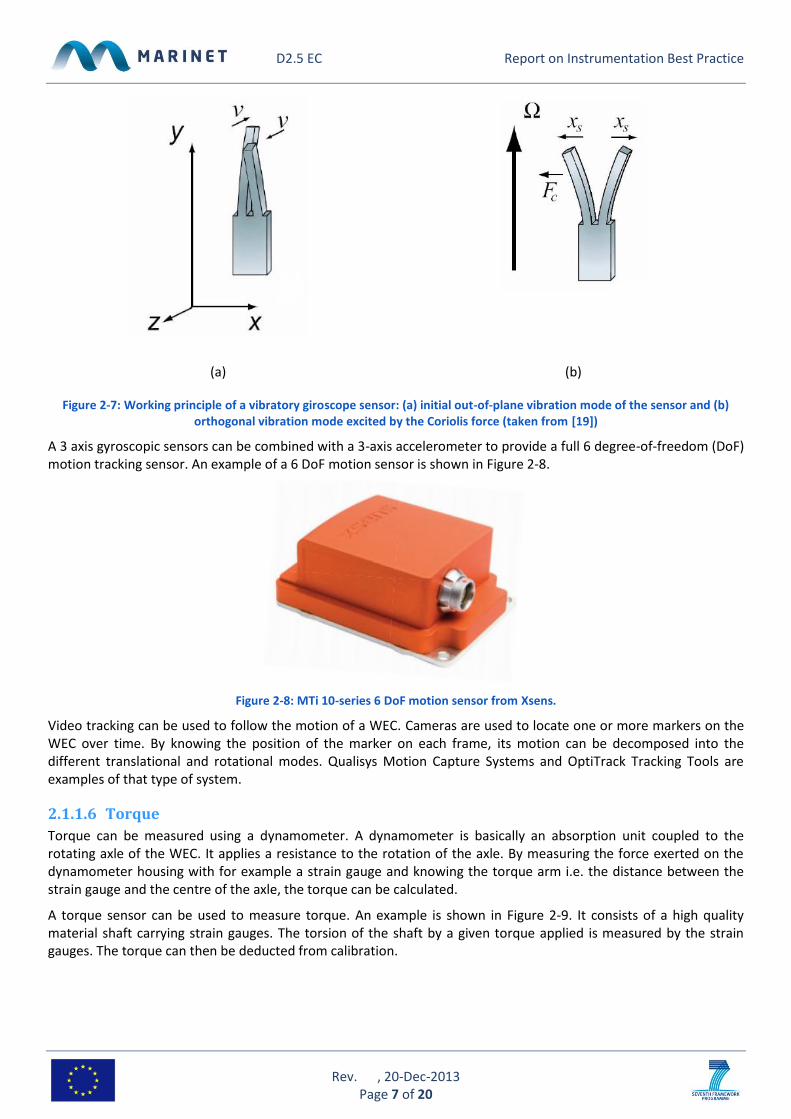
Gyroscopic sensor can be used to measure the angular motion of a body in multiple dimensions relative to an inertial frame of reference. They can record the angular velocity with respect to 1, 2, or 3 axes. Unlike accelerometers, gyroscopes can measure in which direction a body as moved and are not affected by external fields. Micro-Electro-Mechanical-Systems (MEMS) gyroscopes have replaced the conventional rotating ones. Most of the gyroscopic motion detection sensors are vibratory gyroscopes, also called Coriolis vibratory gyroscopes. Figure 2-7 shows an example of a vibratory gyroscope. The device is initially oscillating at its resonance frequency along the axis with a amplitude . When subjected to an angular rate , the sensor is forced to oscillated along the direction of the Coriolis force . The sensing vibration amplitude is given by:
where is the mass of the resonator and is the resonance frequency of the sensing mode. Knowing that and that , the sensing vibration amplitude, which is the measurable quantity, can be linked to the angular rate:
D2.5 EC Report on Instrumentation Best Practice
Rev. , 20-Dec-2013 Page 7 of 20
(a) (b)
Figure 2-7: Working principle of a vibratory giroscope sensor: (a) initial out-of-plane vibration mode of the sensor and (b) orthogonal vibration mode excited by the Coriolis force (taken from [19])
A 3 axis gyroscopic sensors can be combined with a 3-axis accelerometer to provide a full 6 degree-of-freedom (DoF) motion tracking sensor. An example of a 6 DoF motion sensor is shown in Figure 2-8.
Figure 2-8: MTi 10-series 6 DoF motion sensor from Xsens.
Video tracking can be used to follow the motion of a WEC. Cameras are used to locate one or more markers on the WEC over time. By knowing the position of the marker on each frame, its motion can be decomposed into the different translational and rotational modes. Qualisys Motion Capture Systems and OptiTrack Tracking Tools are examples of that type of system.
2.1.1.6 Torque
Torque can be measured using a dynamometer. A dynamometer is basically an absorption unit coupled to the rotating axle of the WEC. It applies a resistance to the rotation of the axle. By measuring the force exerted on the dynamometer housing with for example a strain gauge and knowing the torque arm i.e. the distance between the strain gauge and the centre of the axle, the torque can be calculated.
A torque sensor can be used to measure torque. An example is shown in Figure 2-9. It consists of a high quality material shaft carrying strain gauges. The torsion of the shaft by a given torque applied is measured by the strain gauges. The torque can then be deducted from calibration.

D2.5 EC Report on Instrumentation Best Practice
Rev. , 20-Dec-2013 Page 8 of 20
Figure 2-9: Example of a torque sensor from Burster Model 8661.
2.1.1.7 Current velocity
Acoustic Doppler velocimeters (ADVs) are widely used to measure current velocity. Their working principle is based on the Doppler effect. An illustration of the measuring probe of an ADV is shown in Figure 2-10. The acoustic transmitter sends a beam of acoustic waves at a given frequency. These waves are scattered by moving particulate matter in the water in the remote sampling volume below the acoustic transmitter and the acoustic receivers, fixed at a specific position with respect to the acoustic transmitter and the sampling volume, record the shift in frequency of the scattered acoustic waves. The geometry of the measuring probe and the shift in frequency measured by the acoustic receivers are used to calculate the orientation and amplitude of the current velocity.
Figure 2-10: Illustration of a measuring probe of an ADV (from [18]).
Ulrasonic flowmeter can in principle also be used to measure current velocity (see section 2.1.1.3).
2.1.2 Conclusion Most of the instruments mentioned above have been used for decades in many different fields and information concerning their working principle, limitations and capacity can be found in the literature. The biggest challenge concerning the instrumentation of WEC is related to modelling the power conversion system of those devices. The question is: how can one use the well documented instrumentation to get a measure of the power harvested from the waves for modelled devices?

D2.5 EC Report on Instrumentation Best Practice
Rev. , 20-Dec-2013 Page 9 of 20
3 MODELING THE POWER TAKE-OFF SYSTEM
3.1 FOR WAVE ENERGY CONVERTERS The main mechanism to convert the energy in the waves to useable energy (mechanical or/and electrical) is often referred to as power conversion systems or power take-off (PTO). The diversity of wave energy converters results in many different systems to convert the energy harvested from the waves. Figure 3-1 illustrated some of the energy conversion pathways for WEC.
Figure 3-1: Different PTO systems for wave energy converter and the energy conversion stages (from [4])
The biggest challenge of the instrumentation regarding testing of wave energy converters is certainly related to modelling the PTO systems as these normally do not follow the Froude scaling laws, i.e. the final full scale PTO system cannot be directly modelled. In addition, the load from the PTO system should also be controllable. Many different options have been found to model a PTO system according to the principle of the wave energy converter and they are explained in the following sections.
3.1.1 Friction based A simple way of modelling a PTO system is the friction based technique. The technique is illustrated in Figure 3-2 for the case of a rotating shaft. The PTO is simulated by the friction of a pre-tensioned cable around a metallic wheel connected to the shaft of the WEC. In this particular case, the instrumentation consists of two force transducers and a potentiometer (as illustrated in Figure 3-2(a)). The moment on the shaft ( ) is given by the force transducers and the radius of the metallic wheel:
(| | | |)
while the instantaneous velocity ( ) is obtained from the potentiometer. The instantaneous power ( )can then be derived:
.

D2.5 EC Report on Instrumentation Best Practice
Rev. , 20-Dec-2013 Page 10 of 20
(a)
(b)
(c)
Figure 3-2: Illustration of the friction based technique to model a PTO system: (a) illustration of a friction based technique applied to a WEC with a rotating axle, (b) time series of the reading from two force transducers and a potentiometer and (c)
picture of a friction based technique applied to a WEPTOS rotor (taken from [8]).
This technique has the advantages that the loading on the PTO system can easily be changed and there is no limitation on the test duration. On the other hand high friction can lead to heating of the pre-tensioned cable, which can eventually change the load characteristics.
Another configuration of a friction based PTO system consists of friction disks and pads just like on a bicycle. Such systems are used at Queen’s University, Belfast for modelling the PTO of oscillating water columns.
3.1.2 Weight lifting by rotating axle
A simple way of modelling a PTO system is by weight lifting of the main body. An example is illustrated in Figure 3-3. In this case it consists of a wire attached to the main body of a WEC, going through a pulley and attached at the other end to a variable mass. By absorbing power from the wave, the main body of the WEC will turn and lift the weight attached at the other end of the wire, as illustrated in Figure 3-3. By measuring the time needed to lift the weight from water level up to the pulley, one can estimate the power production with the following relation:

D2.5 EC Report on Instrumentation Best Practice
Rev. , 20-Dec-2013 Page 11 of 20
where is the mass attached to the end of the wire, is the gravitational acceleration, is the distance between the water level and the pulley and is the measured time for the mass to travel from the water level to the pulley. It is possible to change the load of the PTO by varying the mass .
(a)
(b)
Figure 3-3: (a) Illustration of the weight lifting technique to model a PTO system and (b) picture of Bartholin scale model using the weight lifting technique to model the PTO system (taken from [11]).
This technique is easy to implement on a rotating axle and simple. It is mostly suited for regular waves testing as the duration of the test is limited and height dependant.
3.1.3 Eddy current brakes Eddy current brakes provide a versatile way of simulating the PTO in the model testing of WECs at small scale. Eddy current brakes are a well known application of induced magnetic fields. These are based on the principle that a conductive material moving perpendicularly to a magnetic field generates a braking force proportional to its velocity.
Eddy current brakes to model scale WEC have been used at the University of Edinburgh, in model scale study of the Sloped IPS Buoy heaving/surging device (see Figure 3-4(a)). Figure 3-4(b) shows a section through the dynamometer tube. The excitation coils create a magnetic field which circulates through the mild steel stator and a concentric ‘return ring’. In the gap between those two parts, the field is orientated radially. The eddy-tube slides axially through this 1.5mm wide gap. This motion, perpendicular to the magnetic field, induces a circumferential voltage in the tube, which in turns drives a current. This current, in combination with the radial magnetic field, generates a force which tends to oppose the motion of the eddy tube. For a constant magnetic field, this force is proportional to the axial velocity of the eddy tube. The bases for the design of the Sloped IPS Buoy PTO simulator are presented in [25] and results for the device performance at constant damping are reported in [26].
(a)
(b)
Figure 3-4: (a) Underwater view of the Sloped IPS Buoy heaving/surging model in Edinburgh Curved Tank and (b) section view of the dynamometer used to model the PTO.

D2.5 EC Report on Instrumentation Best Practice
Rev. , 20-Dec-2013 Page 12 of 20
An eddy current has also been designed for the 1:16 scale model testing of the WaveRoller wave energy converter (see [27]). The model is presented in Figure 3-5: the low speed rotating eddy current brake was designed with the electromagnets being located inside a watertight box. The six pairs of electromagnets create a magnetic field perpendicular to the aluminum disc, which causes the disc to be braked proportionally to its angular velocity, thus representing the WaveRoller PTO.
(a)
(b)
Figure 3-5: (a) Schematic representation of the eddy current brakes PTO system (from [28]) and (b) eddy current brakes PTO system of the Waveroller.
3.1.4 Pressure difference For wave energy devices dealing with air flow, like for example oscillation water column, a simple way to model the PTO system is to measure the pressure difference across the turbine hole ( ) and the velocity of the flow ( ). The instantaneous power is then:
The power harvested is then the time average of :
∫
A simple way of varying the load for that specific PTO system is to change the size of the turbine hole through which the air flows.
This technique was applied to the case of the LEANCON (see ref. [6]). The working principle of this device is illustrated in Figure 3-6 together with a picture of the scale model tested.

D2.5 EC Report on Instrumentation Best Practice
Rev. , 20-Dec-2013 Page 13 of 20
(a)
(b)
(c)
Figure 3-6: (a) LEANCON working principle and (b),(c) The LEANCON WEC 1:40 scale model in the deep 3‐D wave basin at Department of Civil Engineering, Aalborg University (from [6]).
For this particular device, the power absorbed by the device was measured through continuous time series of the pressure in the intake pipe corresponding to the pressure in the top left compartment in Figure 3-6(a), the pressure in the exhaust pipe corresponding to the pressure in the top right compartment in Figure 3-6(a), and the flow velocity measured in the exhaust pipe.
In order to simulate the air turbine in an OWC, throttling processes were used successfully and reported in [20] (see also [21]). The author described two strategies to simulate the turbine, depending on linear or quadratic characteristics of the turbine. A porous membrane was used in order to attempt the simulation of a linear relation between the volume flow rate and the pressure drop. The membrane (or in some cases carpet) has to have enough area so that the velocity is sufficiently low for the flow across it to be laminar. The calibration of this porous membrane and the experimental installation used to perform it are described in detail in [22]. The same carpet material for attempting to obtain a linear pressure drop was used in the 1:33 scale model of the modified Edinburgh duck (see [23] and [24]). An orifice plate was used in [20] to simulate a non-linear relation between the volume flow rate and the pressure drop. The characteristics of the carpet and orifice plate were calibrated in a wind tunnel, which allowed to compute the energy dissipation based on the free surface displacement (neglecting the air compressibility).
3.1.5 Overtopping flow For overtopping devices, the key parameter to measure is the overtopping rate ( ), i.e. the amount of water reaching the reservoir as a function of time. The method to obtain the overtopping rate for the prototype of a device is illustrated for the case of a Seawave Cone-Slot Generator (SSG) depicted in Figure 3-7. Each of the three reservoirs was connected to a reservoir tank. Each tank was equipped with a level gauge and a pump. The level gauges and the

D2.5 EC Report on Instrumentation Best Practice
Rev. , 20-Dec-2013 Page 14 of 20
pumps were connected to a computer programmed to empty the reservoir tanks and thereby record the amount of overtopping water in the individual reservoirs. The hydraulic power of reservoir is found as:
where is the gravitational acceleration, is the overtopping rate of reservoir and is the crest freeboard of
reservoir . The total hydraulic power is then: ∑ .
Figure 3-7: SSG overtopping device setup (from [7]).
3.1.6 Passive linear actuator The passive linear actuator consists of a piston combined with a displacement monitoring system. This method is illustrated for the particular case of a device consisting of two rigid pontoons connected with a rigid hinge in Figure 3-8. The relative motion between the two pontoons is translated to a horizontal movement of the PTO system. A force transducer is placed next to the piston in order to record the forces exerted on the PTO system. The displacement of the piston can be recorded in different way. In the example illustrated in Figure 3-9 a magnetic displacement sensor was used. The power harvested from the waves can be derived from the force ( ) measured by the force transducer and the instantaneous velocity obtained from the displacement measurements ( ) as a function of time:
The average power is then the integral mean value of the instantaneous power ( ).
Figure 3-8: Illustration of a passive linear actuator used to model a PTO system.
D2.5 EC Report on Instrumentation Best Practice
Rev. , 20-Dec-2013 Page 15 of 20
Figure 3-9: Example of the passive linear actuator used to model the PTO system of the DEXA wave energy converter (taken from [5]).
The load on this PTO system can be adjusted by changing the rigidity of the PTO. In the example shown in Figure 3-9, the rigidity is adjusted by changing the distance between the PTO system and the axis of the device.
The principle of passive actuator can also be applied to rotating systems. In that case rotary dampers can be used.
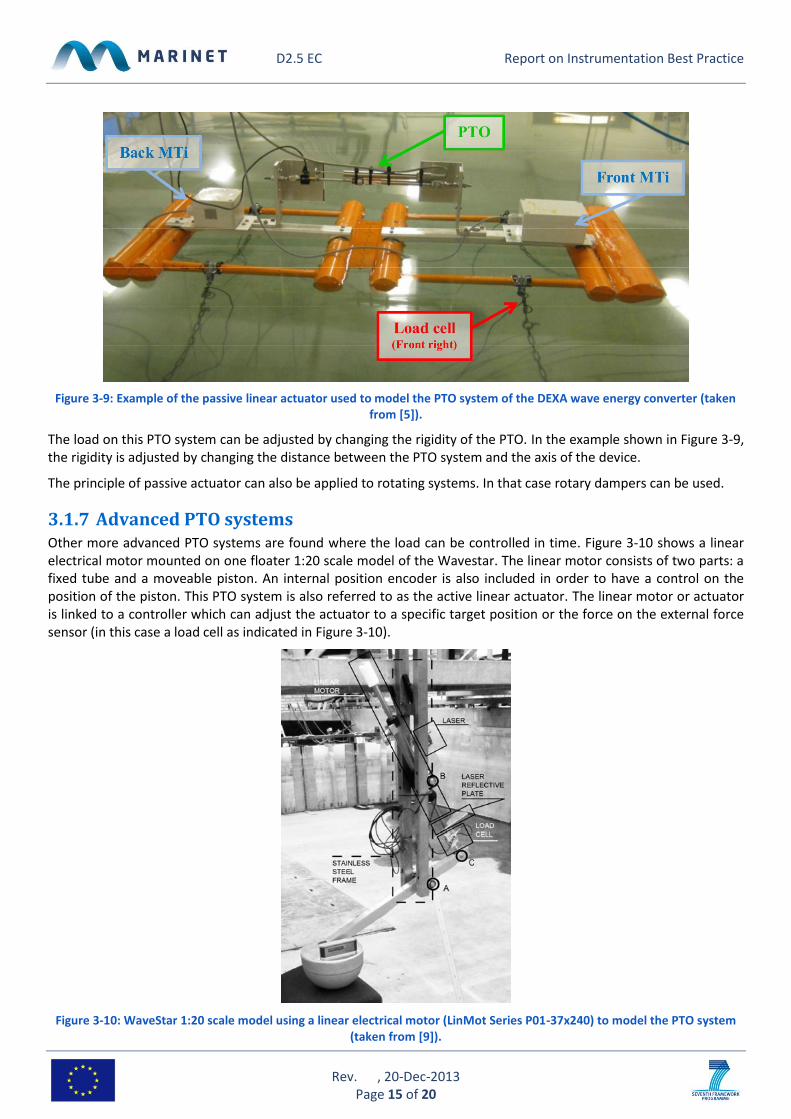
3.1.7 Advanced PTO systems Other more advanced PTO systems are found where the load can be controlled in time. Figure 3-10 shows a linear electrical motor mounted on one floater 1:20 scale model of the Wavestar. The linear motor consists of two parts: a fixed tube and a moveable piston. An internal position encoder is also included in order to have a control on the position of the piston. This PTO system is also referred to as the active linear actuator. The linear motor or actuator is linked to a controller which can adjust the actuator to a specific target position or the force on the external force sensor (in this case a load cell as indicated in Figure 3-10).
Figure 3-10: WaveStar 1:20 scale model using a linear electrical motor (LinMot Series P01-37x240) to model the PTO system (taken from [9]).

D2.5 EC Report on Instrumentation Best Practice
Rev. , 20-Dec-2013 Page 16 of 20
(a)
(b)
Figure 3-11: (a) Controllable torque and rotational speed PTO system used on the Nemos floater (b) tested in Nissum Bredning, Aalborg University (taken from [10]).
The same principle can also be applied for controllable torque and rotational speed as shown in Figure 3-11.
Controllable load PTO model based on Eddy current brakes has also been used. Figure 3-12 shows a model of such an actuator used for an oscillating water column WEC.
Figure 3-12: Exploded solid model of an eddy-current pitch actuator (from [29]).
The advantage of these advanced methods is the full control over the force/position or torque/rotational speed. However, these methods are complex and costly and thus used for devices having reached Phase 2 or 3 of their development.
3.1.8 Summary This chapter presented the biggest challenge of the instrumentation related to modelling of WECs. Different methods for measuring the power production of scaled models were described showing a big diversity of systems with different levels of complexity. Table 3-1 summarizes the availability of the different PTO systems in different wave facilities within the MaRINET consortium.

D2.5 EC Report on Instrumentation Best Practice
Rev. , 20-Dec-2013 Page 17 of 20
Type of PTO system AAU ECN UNEXE EMEC EVE UEDIN SEAI WavEC UoP* IPT HMRC
Friction based Y N N n N y n n N y y
Weight lifting Y N N n N y n n N y n
Pressure difference Y Y N n N y n n N y y
Overtopping flow Y Y N n N n n n N y y
Passive linear actuator
Y Y N n N y n n N y y
Eddy Current Brakes N N N n N Y n n N n n
Advanced PTO system
Y Y N n N Y n n N n n
Table 3-1: Summary of the different PTO systems available in different wave facilities within the MaRINET consortium. Y: confirmed by the facility, N: denied by the facility, y: assumed to be available, n: assumed not to be available.
*At Plymouth University, the PTO model is considered the client’s responsibility.

D2.5 EC Report on Instrumentation Best Practice
Rev. , 20-Dec-2013 Page 18 of 20
4 CONCLUSIONS AND RECOMMENDATIONS
The instrumentation related to wave energy converters is related to wave climate, forces, flow, pressure, motions, torque and current velocity. Some examples of instruments related to these quantities were described in chapter 2 briefly as most of them are common knowledge in hydraulic labs testing all type of sea structures. The specificity and challenge of WECs instrumentation concerns the measurement of the output power for scaled models. Because of scaling issues, the power take-off system is different than the full scale real PTO system. Different methods for modelling the PTO systems were identified and explained in chapter 3 and a table identifying the different PTO systems available in different facilities of the MaRINET consortium was presented at the end of the chapter. Despite the many years of experience in testing wave energy converters, there is still a need for development and standardisation of the instrumentation related to PTO modelling in laboratory facilities.
When dealing with modelling of a power take-off system in a hydraulic laboratory, it is of course important to model the characteristic behaviour (force) of the system. Because of scaling issues, this will, most of the time, lead to a model system different than the intended full scale power take-off system. It can sometimes be an exercise in itself to make the inventor, the user or the company testing a small scale device understand that the power take-off will most likely be different depending on the scaling ratio of the model tested and that the real PTO system should first be tested when reaching a larger scale.

D2.5 EC Report on Instrumentation Best Practice
Rev. , 20-Dec-2013 Page 19 of 20
5 REFERENCES
[1] Holmes, B (2009). “Tank testing of Wave Energy Conversion Systems”, EMEC.
[2] Kofoed, JP, Frigaard, P (2009). “Development of Wave Energy Converters: The Danish Case”, Renewable Ocean Energy, Vol.4, No.4, p.83-96.
[3] Pecher, A, Kofoed, JP (2010). “State-of-the-art Tank Testing”, DCE contract report No. 86, Department of Civil Engineering, Aalborg University.
[4] López, I, Andreu, J, Ceballos, S, Martínez de Alegría, I, and Kortabarria, I (2013). “Review of wave energy technologies and the necessary power-equipment”, Renewable and Sustainable Energy Reviews, Vol.27, p.413-434.
[5] Angelelli, E, Zanuttigh, B, Ferri, F, and Kofoed, JP (2013). “Experimental assessment of the mooring influence on the power output of floating Wave Activated”, Proceedings of the 10th European Wave and Tidal Energy Conference, Aalborg (DK).
[6] Kofoed, JP, Frigaard, P (2008). “Hydraulic evaluation of the LEANCON wave energy converter”, DCE Technical Report No. 45, Department of Civil Engineering, Aalborg University.
[7] Kofoed, JP (2005). “Model testing of the wave energy converter Seawave Slot-Cone Generator”, Hydraulics and Coastal Engineering No. 18, Aalborg (DK).
[8] Rapuc, S (2012). “Numerical study of the WEPTOS Single Rotor”, Master Thesis report, Aalborg University and Technical University of Denmark (DK).
[9] Ferri, F, Kramer, MM, Pecher, A (2013). “Validation of a wave-body interaction model by experimental tests”, Proceedings of the Twenty-third (2013) International Offshore and Polar Engineering, Anchorage (USA).
[10] Private communication between Aalborg University and Nemos.
[11] Kofoed, JP (2001). “Indledende hydrauliske undersøgelser af bølgeernergianlægget Bartholins roterende bølgeenergiabsorber”, Report, Department of Civil Engineering, Aalborg University (DK).
[12] Lawrence, J, Holmes, B, Bryden, I, Magagna, D, Torre-Enciso, Y, Rousset, JM, Smith, H, Paul, M, Margheritini, L, Cândido, J (2012). ”D2.1 Wave Instrumentation Database”, Work Package 2: Standards and Best Practice of the MaRINET project.
[13] Futek (2013). Web. 7 Nov 2013. www.futek.com
[14] Ott (2011). Web. 8 Nov 2013. http://www.ott-schweiz.ch/web/ott_ch.nsf/id/pa_c2_fr.html
[15] Bengtson, H. “How to Measure Fluid Veolicty with a Pitot Tube”. Bright Hub Engineering. 1 Jun. 2010. Web. 8 Nov. 2013. http://www.brighthubengineering.com/hydraulics-civil-engineering/58382-how-to-measure-fluid-velocity-with-a-pitot-tube/#imgn_1
[16] Liu, C (2012). “Foundations of MEMS”, Prentice Hall.
[17] Kraft, M (1997). “Closed Loop Digital Accelerometer Employing Oversampling Conversion”, PhD Thesis, Coventry University, School of Engineering, UK.
[18] SonTek (2012). Web. 8 Nov 2013. http://www.sontek.com/10mhzadv.php
[19] Parent, A, Le Traon, O, Masson, S, and Le Foulgoc, B (2007). “A Coriolis Vibrating Gyro Made of a Strong Piezoelectric Material”, Proceedings of The 6th IEEE Conference on Sensors, Atlanta (USA).
[20] Sarmento, AJNA (1992). “Wave flume experiments on two-dimensional oscillating water column wave energy devices”, Experiments in Fluids, Vol.12, p.286-292.

D2.5 EC Report on Instrumentation Best Practice
Rev. , 20-Dec-2013 Page 20 of 20
[21] Sarmento, AJNA (1993). “Model-test optimization of an OWC wave power plant”, International Journal of Offshore and Polar Engineering, Vol.3, p.66-72.
[22] Alves, M (2003). “Calibração de uma alcatifa para introdução de perda de carga”, Report, Departamento de Engenharia Mecânica, Instituto Superior Técnico (PT).
[23] Lucas, J, Cruz, J, Salter, S, Taylor, J and Bryden, I (2008). “Update on the design of a 1:33 scale model of a modified Edinburgh duck WEC”. Proceedings of the ASME 27th International Conference on Offshore Mechanics and Arctic Engineering, Estoril (PT).
[24] Lopes MFP, Ricci, O, Gato, LMC and Falcão AF de O (2007). “Experimental and numerical analysis of the oscillating water column inside a surface piercing cylinder in regular waves”. Proceedings of the 7th European Wave and Tidal Energy Conference, Porto (PT).
[25] Taylor, JRM, Mackay, I. (2001). “The design of an Eddy current dynamometer for a free-floating sloped IPS buoy”. Proceedings of the International Conference on Marine Renewable energies, Newcastle (UK).
[26] Payne, GS, Taylor, JRM, Bruce, T and Parkin, P (2008). “Assessment of boundary-element method for modelling a free-floating sloped wave energy device. Part 2: experimental validation”, Ocean Engineering, Vol.35, p.342-357.
[27] Henriques, JCC, Lopes, MFP, Gomes, RPF, Gato, LMC, and Falcão, AFO (2012). “On the annual wave energy absorption by two-body heaving WECs with latching control”, Renewable Energy, vol.45, p. 31-40.
[28] Lopes, MFP, Henriques, JCC, Lopes, MC, Gato, LMC, and Dente, A (2009). “Design of a non-linear power take-off simulator for model testing of rotating wave energy devices”, Proceedings of the 8th European Wave and Tidal Energy Conference, Uppsala (SE).
[29] Caldwell, NJ and Taylor, JRM (1998). “Eddy-Current Actuator for a Variable Pitch Air Turbine”, Proceedings of the 3rd European Wave Power Conference, Patras (GR).