report on operations
TRANSCRIPT

1
Report on Operations
Annual Report 2005

2
Review of Operations
Contents Page No Statement of Compliance 3 About ECU 4 Mission and Defining Themes 5 ECU Organisational Structure 6 Highlights of the Year 2005 7 Chancellor’s Foreword 8 The Work of the University Council 9 Vice-Chancellor’s Commentary 11 Teaching and Learning 13 Students 16 Research and Higher Degrees 18 Engagement and Enterprise 20 Business and Resources 22 Corporate Standards and Risk Management 24 Risk Management Statement 26 Corporate Governance Statement 27 Advertising and Related Expenditure for 2005 31 Record Keeping 32 Compliance with Relevant Written Laws 33 Summary Statistics 34 Appendices – Matrix of Compliance with Treasurer’s Instruction, Financial Administration and Audit Act
Other Sections
Auditor General’s Statement Financial Statements • Certification • Statement of Financial Performance • Statement of Financial Position • Statement of Cash Flows • Notes to the Financial Statements for the year ended 31 December 2005 Key Performance Indicators • Certification • Effectiveness Indicators • Efficiency Indicators

3
Statement of Compliance The Hon Ljiljanna Ravlich MLC Minister for Education and Training 12th Floor, Dumas House 2 Havelock Street WEST PERTH WA 6005 21 March 2006 My Dear Minister In accordance with Section 66 of the Financial Administration and Audit Act 1985, we hereby submit for your information and presentation to Parliament the Annual Report of Edith Cowan University for the year ending 31 December 2005. The Annual Report has been prepared in accordance with the provisions of the Financial Administration and Audit Act 1985. Yours sincerely Hendy Cowan Chancellor On behalf of the University Council. Edith Cowan University Joondalup Drive JOONDALUP WA 6027 Telephone: 13 43 28 Facsimile: +61 8 9300 1257

4
About ECU
Named after the first woman elected to an Australian Parliament – Edith Dircksey Cowan – Edith Cowan University (ECU) is an exciting fusion of traditional education principles with contemporary enterprise.
Working to its three defining themes of service, professionalism and enterprise, the University is a market leader in education for the service professions and prides itself on producing graduates who can operate effectively in today’s globalised workplace.
Since 1902, ECU through its forerunner organisations, has been Western Australia’s major provider of teacher education. Given university status in 1991, ECU has since developed innovative and practical courses across a wide range of disciplines, established a vibrant research culture and attracted a growing range of quality research partners and researchers, many working at the cutting edge of their fields.
ECU is WA’s second largest university, and has more than 21,000 enrolled students at both undergraduate and postgraduate levels. In addition to Australian students, the University has approximately 2,400 international students originating from around 90 countries.
The University has three metropolitan campuses in Churchlands, Mount Lawley and Joondalup and a regional campus in Bunbury, a city 200kms south of Perth.
More than 330 courses are offered through the five faculties:
• Business and Law • Computing, Health and Science • Communications and Creative Industries
which incorporates the Western Australian Academy of Performing Arts • Community Services, Education and Social Sciences • Regional Professional Studies.
ECU works closely with private and public sector organisations, locally and overseas, in designing its study programs. Research is undertaken in collaboration with industry, particularly the service industries and professions.
The University strives to offer education of the highest quality in the service professions. Differentiating itself in the WA tertiary education market, ECU recognises and concentrates on its areas of particular strength – education, nursing, finance, business, computing, communications and the creative and performing arts.

5
University Mission and Defining Themes Mission To provide, within a diverse and dynamic learning environment, university education of recognised quality, especially for those people employed in, or seeking employment in, the service professions. Defining Themes Three defining themes inform the way ECU pursues its mission: Service: • Encouraging the highest standards of learning by adopting a student-centred approach to
teaching, learning and the administration of student services • Seeking opportunities for close and productive involvement with the professions, government,
industry, the community and educational institutions at local, national and international levels Professionalism: • Building on, and expanding, the University’s strengths in professional education and training to
produce graduates who contribute to the workforce and the economy • Seeking to demonstrate the highest standards of professional behaviour in its relationship with
students, staff and the community Enterprise: • Building a culture which constantly seeks to improve itself by supporting and rewarding
initiatives which enhance the University’s performance • Increasing the international dimension of the University’s teaching, research and community
service programs through selective partnerships and enterprises • Collaborating with other institutions and organisations in strategic partnerships to accomplish
objectives that would be beyond the capability of individual institutions acting alone • Promoting the University’s strengths in local, national and international contexts through
community service, targeted marketing and publicity
These themes have been adopted across the broad sweep of the University’s activities, and guide all aspects of its strategic planning.

6
ECU’s Organisational Structure
Edith Cowan UniversityOrganisation Structure – December 2005 Vice-Chancellor
Vice-President (Resources)& Chief Financial Officer
Mr. W. Snell
Vice-President (Resources)& Chief Financial Officer
Mr. W. SnellPro Vice-Chancellor
(Equity and Indigenous)Professor R. Harvey
Pro Vice-Chancellor(Equity and Indigenous)
Professor R. HarveyDeputy Vice-Chancellor
(Academic)Professor P. Garnett
Deputy Vice-Chancellor(Academic)
Professor P. Garnett
Deputy Vice-Chancellor(Students, Advancements &
International)Professor J. Wood
Deputy Vice-Chancellor(Students, Advancements &
International)Professor J. Wood
Pro Vice-Chancellor(Technology & Information
Services)Professor A. Watson
Pro Vice-Chancellor(Technology & Information
Services)Professor A. Watson
Pro Vice-Chancellor(Research)
Professor W. Louden
Pro Vice-Chancellor(Research)
Professor W. Louden
Executive Director(Governance, Policy &
Planning Services)Dr S. King
Executive Director(Governance, Policy &
Planning Services)Dr S. King
Pro Vice-Chancellor(Teaching & Learning)
Professor R. Quin
Pro Vice-Chancellor(Teaching & Learning)
Professor R. Quin
Faculty of RegionalProfessional Studies
(RPS)Professor Neil Tuckwell
Interim Dean
Enterprise &Technology
Enterprise &Technology
Management ServicesCentre (MSC)
Mr G. HollandDirector
Faculty of Business &
Law (B&L)Professor R. Harvey
Executive Dean
AccountingFinance &Economics
AccountingFinance &Economics
Facilities &Services(F&S)
Mr A. BranstonDirector
Capital Projects
Capital Projects
Risk Management& Audit Assurance
Mr P. DraberDirector
Risk Management& Audit Assurance
Mr P. DraberDirector
Student Services Centre (SSC)Mr Andrew Crevald
Director
Student Systems&Information
Student Systems&Information
ECU International & CommercialMr J. Wade, Director
InternationalMarketing
InternationalMarketing
Marketing & Development
Dr L. Cretney-Barnes, Director
CorporateCommunications
CorporateCommunications
Faculty of ComputingHealth & Sciences (CHS)
Professor A. WatsonExecutive Dean
Exercise, Biomedical &
Health Science
Exercise, Biomedical &
Health Science
Knowledge & IT ServicesCentre (KITS)
Mr J. Murray Director
Library Collections& Access
Library Collections& Access
EducationEducation
Faculty of CommunityServices, Education &
Social Sciences (CSESS)Professor W. Louden
Executive Dean
Faculty of Communications &Creative Industries
(C&CI)Professor R. Quin
Executive Dean
Communications& Multimedia
Communications& Multimedia
ResourceDevelopment
ResourceDevelopment
Learning & Development
Services (LDS)Dr J. Millar
Director
ProfessionalDevelopment
ProfessionalDevelopment
UniversityPreparation
UniversityPreparation
Governance, Policy & Planning Services
(GPPS)Dr S. King
Executive Director
Executive Director’s
Office
Executive Director’s
Office
Office of ResearchAnd Innovation
Mr C. ThornDirector
Office of ResearchAnd Innovation
Mr C. ThornDirector
Graduate SchoolProf A. Garton
Director
Graduate SchoolProf A. Garton
DirectorCampusServices
CampusServices
CommercialServices
CommercialServices
Buildings &Services
Buildings &Services
BusinessSupport Unit
BusinessSupport Unit
Planning &Development
Planning &Development
Law &Justice
Law &Justice
ManagementManagement
ProfessionalCommunity
Services
ProfessionalCommunity
Services
Computer & Information
Science
Computer & Information
Science
Nursing, Midwifery& Postgraduate
Medicine
Nursing, Midwifery& Postgraduate
Medicine
Engineering &Mathematics
Engineering &Mathematics
NaturalSciences
NaturalSciences
PsychologyPsychology
KurongkuriKatitjin
KurongkuriKatitjin
Contemporary Arts
Contemporary Arts
WA Academyof PerformingArts (WAAPA)
WA Academyof PerformingArts (WAAPA)
GovernanceServices
GovernanceServices
Policy,Planning &
Acad. Support
Policy,Planning &
Acad. Support
University Quality
Co-ordination
University Quality
Co-ordination
Equity &Diversity
Equity &Diversity
ManagementInformation
Systems
ManagementInformation
Systems
Marketing,Tourism &
Leisure
Marketing,Tourism &
Leisure
International,Cultural &
Community Studies
International,Cultural &
Community Studies
Library ServicesLibrary Services
InformationSecurity
InformationSecurity
Information Technology
Support Services
Information Technology
Support Services
InformationDelivery Services
InformationDelivery Services
InformationTechnology
Infrastructure
InformationTechnology
Infrastructure
ManagementAccounting
ManagementAccounting
FinancialServices
FinancialServices
HR ServicesHR Services
BusinessServices
BusinessServices
StrategicProcurement
StrategicProcurement
RiskFinancing
RiskFinancing
StudentStrategy
StudentStrategy
StudentServices
StudentServices
Careers AdvisoryServices
Careers AdvisoryServices
CounsellingService
CounsellingService
MultifaithChaplaincy
MultifaithChaplaincy
Student HealthService
Student HealthService
InternationalAdmissions
InternationalAdmissions
CommercialRelations
CommercialRelations
AdvertisingAdvertising
Corporate Events & Graduation
Corporate Events & Graduation
StudentsRecruitment
StudentsRecruitment
Development& Alumni
Development& Alumni
CuratorialServices
CuratorialServices
University Council

7
Highlights of the Year 2005 The year was marked by major leadership changes at the top of the University. The Honourable Hendy Cowan, a former Deputy Premier of Western Australia and great nephew of the University’s namesake, was installed as Chancellor. The Vice-Chancellor, Professor Millicent Poole, retired after eight and a half years at the helm. Professor Kerry Cox, formerly Vice-Chancellor of the University of Ballarat, was appointed the new Vice-Chancellor, effective March 2006. ECU’s research income grew substantially. Four research institutes in which the University has a key stake attracted external investment worth $18 million over four years. The value of research grants, external research funding and industry funding leapt significantly over the previous year. The University’s Campus Consolidation program achieved a major milestone with the transfer of the historic Claremont Campus to the University of Western Australia. New buildings were opened at Mount Lawley Campus and two major capital works projects commenced planning and construction on the Joondalup Campus. The year was marked by a major enhancement of students’ educational and support services with particular improvements to the online environment, computing access and chaplaincy.
8
Chancellor’s Foreword During the year, the University Council systematically examined its ability to make a difference to the direction and performance of ECU. An external review of Council provided a foundation for a program of governance reforms designed to strengthen Council’s independence and strategic leadership. The Council ensured the University fulfilled a broad range of compliance measures, revised performance indicators, responded to numerous Commonwealth Government policy positions and sustained progress on campus redevelopment. A major responsibility was the recruitment of a Vice-Chancellor to succeed Professor Millicent Poole after eight and a half years. The Council appointed Professor Kerry Cox to take office from 7 March 2006. Professor Cox, Vice-Chancellor of the University of Ballarat, is a medical scientist who was educated in Western Australia and later held senior positions at Flinders University in South Australia. He has a strong record of establishing linkages between universities and government, business, industry and community groups. The Council is confident that his experience and leadership will be of great value as ECU continues to build its reputation for relevance and excellence for the service professions. The Council farewelled ECU’s third and longest-serving Vice-Chancellor, Millicent Poole. Professor Poole always had a great vision for this University and championed three core themes for ECU: service, professionalism and enterprise. During her vice-chancellorship, these themes emerged as a powerful hallmark of this University and underpinned its reputation. Professor Poole also played a great role in building the physical side of the University; with the backing of Council, she shaped the bold set of plans known as campus consolidation. Upon her retirement, the Council expressed its deep gratitude and admiration for her enormous contribution to ECU and higher education. It was a great honour to serve in my first year in the office of Chancellor. I commend the work of all my Council colleagues, the Vice-Chancellor, senior executives and all the staff. Hon Hendy Cowan Chancellor

9
The Work of the University Council Edith Cowan University’s establishing Act provides that the Council is the governing authority of the University. The fundamental responsibilities of the Council are to determine the strategic direction and governance framework of the University. The Council is chaired by the Chancellor and consists of the Vice-Chancellor and members drawn from the community and the University’s alumni, staff and students. Council Members fulfil an important duty to the University and the community and do so on an honorary basis. Council addressed key strategic and governance tasks and fulfilled a demanding program in 2005. The Council met formally on eight occasions during 2005 under the chairmanship of its new Chancellor, the Hon Hendy Cowan, who took office on 1 January. It held six regular meetings and also two special meetings concerned with the recruitment and appointment of the Vice-Chancellor. In addition the Council held three workshops with executive management on governance and strategy. The major activities of Council in 2005 fell into four categories – • governance of the University • strategic direction of the University • self-governance of the Council • compliance. Governance of the University The Council’s most important task in 2005 was the selection of the next Vice-Chancellor of the University. At a special meeting on 9 March, Council established a Guiding Committee chaired by the Chancellor to oversee the recruitment process. At a special meeting on 27 October, Council approved the appointment of Professor Kerry Cox as the University’s fourth Vice-Chancellor. Other key Council activities related to the governance of the University were – • adoption of a policy on the assessment of the Vice-Chancellor’s performance, pursuant to the
primary functions of Council • revision of the University’s framework of key performance indicators to provide more
meaningful and comprehensive performance reporting • reform of the processes for academic appeals to simplify and expedite students’ appeals Strategic Direction of the University Prospective mergers between public universities in WA was the most prominent strategic issue in 2005. After consideration over several meetings, Council on 27 October affirmed ECU’s distinct mission and that it would not pursue a merger for the foreseeable future. Other key Council activities related to the strategic direction of the University were – • noted the mid-term review of the University’s Strategic Plan 2003-2008 • approving for 2006 the goals for the University, the budget and student enrolment strategies • responding to key Commonwealth Government policy discussion papers or initiatives including
Building Better Foundations, Building University Diversity and the Research Quality Framework • endorsing a major review of the Faculty of Regional and Professional Services (Bunbury) • continuing to oversee the implementation of the University’s Campus Consolidation Plan,
including the transfer of the Claremont Campus to the University of Western Australia and approving the arrangements for the disposal of the Churchlands Campus
Self-Governance of the Council Council commissioned an independent external review of its role as part of its commitment to good governance and in compliance with the National Governance Protocols. As a result of the review, the Council on 29 September endorsed a governance reform program which emphasised Council’s role in the strategic direction of the University and self-governance by the Council.

10
Other key Council activities related to self-governance were –
• adoption of a policy on nominations to Council and Council Committees, pursuant to the National Governance Protocols
• implementation of changes to the composition of Council, again related to the National Governance Protocols
• enhancing the legal protection for Council Members Compliance A key activity of the Council was the approval of the measures for the University to comply with the National Governance Protocols. The University’s funding from the Commonwealth Government is linked to compliance with the Protocols and with the Higher Education Workplace Reforms (HEWR). Council also considered measures to ensure compliance with HEWR. Throughout the year Council received reports on University activities from the Vice-Chancellor, Boards, Committees and senior officers. The reports addressed areas such as –
• the academic program of the University • financial management • performance indicators • risk management • information technology • capital and other works
ECU Council Members For a list of ECU Council Members, visit www.ecu.edu.au/GPPS/council To view ECU’s Council Committee Structure visit www.ecu.edu.au/GPPS/committees/resources_files/ECU_Comt_structure.pdf Attendance by Council Members at Council Meetings Council held six regular meetings and two special meeting during the year. The bracketed figure indicates the potential number of attendances for members whose term of office did not cover the full year. Hon Hendy Cowan (Chancellor) 7 Mr Steve Abbott 6 (6) Dr Norman Ashton 3 (3) Ms Jenni Ballantyne 6 Mrs Danielle Blain (Pro Chancellor) 4 Leslie Chalmers 2 (4) Mrs Helen Charlesworth 8 Mr Andrew Crevald 7 (7) Mrs Carol Devitt 6 Mr Neil Douglas 7 Justice Rene Le Miere 5 Mrs Karen Macdonald 7 Mr John May 8 Mr Chilekwa Mwaba 2 (2) Mr Kevin O’Keefe 3 (4) Professor Ron Oliver 7 Mr David Pilkington 1 (4) Professor Millicent Poole (Vice-Chancellor) 7 Ms Elizabeth Prime 6 (6) Br Steve Spain 2 (2) Mr Paul Snellgrove 6 (6) Professor Peter Thompson, AM 6 Mr Serge Walberg 3

11
Vice-Chancellor’s Commentary This year has been my last at the head of ECU. As I retire at the end of eight and a half years leading this University, I intend to use this commentary to reflect on the whole period of my term of office. ECU today is a remarkably transformed institution, hardly recognisable from the University I joined in 1997. The admirable efforts of my predecessors had not been sufficient to significantly turn around the institution’s fortunes. I believed a fresh start was needed. The platform on which I set about transforming ECU was strategic planning. The first and second strategic plans, developed and implemented with the backing of the University’s governing Council, have been the primary vehicles for change and improvement. I was determined to ensure that the key planks of the strategic plans directed ECU towards the creation of core values, a differentiation of purpose, modernisation of campuses, strategic business and community partnerships, branding, a quality framework, socially-valuable research and the enhancement of teaching and learning. Today ECU has been transformed from a potentially vulnerable institution fragmented across five campuses into an integrated University setting nationally-recognised benchmarks in many areas of performance. Behind this dramatic transformation is a story of steadfast strategic vision, collaborative teamwork and major structural and cultural reform. All our work has been directed towards raising the profile of the institution. For instance, new resources and imagination went into marketing the organisation. A new brand emerged. ECU’s market share of student applications accelerated as a result. At the same time we invested in staff renewal, new research leadership at professorial level, new technology and new buildings and associated facilities. ECU has never paused in its transformation. Among the best evidence of this was an overwhelmingly positive report card from its first independent quality audit in late 2004. In 2005, the current five-year strategic plan was reviewed, measuring progress at the half-way mark against its designated priorities. It is clear that in recent years ECU has demonstrated improvements in teaching and learning, resulting in a series of positive trends evident over the period from 1997. Similarly, research performance has improved substantially in recent years. ECU has also attained a stronger market acceptance over the years. In parallel, the University has gained recognition for its community and professional engagement, evidenced in a number of ways including the development of precinct-based partnerships, new courses and broader pathways for entry. New methods of communicating with students have been put in place and staff show increased satisfaction and are more highly qualified. Furthermore, ECU has delivered on its campus consolidation program and as a result is well positioned in population growth corridors and has excellent physical infrastructure. All of this has been achieved while still ensuring a sound financial position. Of course, the future presents many challenges. Many factors are likely to impact on the University in the period ahead. Some may detrimentally affect ECU, while others may provide new opportunities which the University can use to enhance its position. Some are able to be controlled by the University, while others are less able to be controlled as they relate to global changes or to national policy changes, such as those arising from the Commonwealth Government’s evolving higher education policy agenda. Despite the volatility of the higher education environment and the uncertainties the University faces, what is important is that the ECU community is aware of this shifting and increasingly challenging environment and has identified or is developing approaches to meet those challenges and benefit from associated opportunities.
For ECU, key identified challenges include:
12
• Positioning ECU to respond to outcomes of the Commonwealth’s new Learning and Teaching Performance Fund
• Development of a more distinctive ECU pedagogy based around new knowledge or
scholarship clusters and a practicum-based approach, relevant to students and the industries and professions ECU serves. This development is critical to ECU’s positioning in an ever more competitive higher education market, both domestic and international
• The likely detrimental impact of the Commonwealth’s new Research Quality Framework
(RQF). ECU is doing much to prepare for the introduction of the RQF and will lead internal and external RQF assessment pilot studies
• The combination of the introduction of the RQF and proposed revisions to the National
Protocols for the Accreditation of Higher Education, may see the emergence of three tiers within the Australian university sector, with the possibility of ECU being in the third “teaching-intensive” tier
• The Commonwealth Government’s Voluntary Student Unionism legislation which could see
the loss of some $1.5 million in revenue to support non-academic student support services at ECU or, alternatively may require changes to service provision responsibilities and a re-examination of current student consultative processes. These matters are critical to ECU’s efforts to improve the quality of student life on campus and to attract international students
• The age demographics of ECU’s workforce, which pose both challenges and opportunities
• Cost and staff relations pressures resulting from the implementation of the Commonwealth
Government’s higher education workplace relations changes
• Significant reshaping of ECU’s budget strategy and an increased focus on business-case based decision-making
• Significant re-thinking of ECU’s admissions processes, transition support for students and
outreach to schools, the TAFE sector and employers to ensure that the University has the ability to meet its student load and related revenue targets
• An enhanced multi-faceted approach to ECU’s positioning in the international student
market
• A more enterprising and engagement-oriented internal culture, essential in an increasingly competitive environment
We have often talked about ECU being ‘on the move’. It’s been true for eight and a half years and, hopefully, it will still be true after my departure. I have been most fortunate to work with a highly-motivated and most capable team of people who have all contributed greatly to improving ECU and delivering value to the community.
My belief in the importance of higher education burns as strongly today as it ever did. ECU can be proud of its place in the sector. I look back at my time here with immense pride and satisfaction.
Millicent Poole 31 December 2005

13
Teaching and Learning ECU in 2005 maintained a strong focus on improving teaching and learning outcomes, offering improved and relevant courses and enhancing teaching and learning support mechanisms. Teaching and Learning Management Plan Teaching and learning at ECU is supported by the Teaching and Learning Management Plan whose objectives are: improving courses, enhancing flexibility and improving teaching and learning. Courses were improved in a variety of ways in 2005: the ECU Graduate Attributes Framework was progressively embedded in courses and units and linked to assessment, and training was provided to Course Co-ordinators for reporting on course quality and improvement options based on CEQ, UTEI, viability, attrition, KPIs and focus groups. Enhancing flexibility involved expanding the ECU Advantage (IBM Laptop) Project, with considerable student acceptance, and increasing the number of units on the Blackboard system. Online unit resources are now available to around 86 per cent of students. A Learning Content Management System (LCMS) was developed to support use and digitisation of print-based units to the Blackboard system and an LCMS was trialled for national and international programs. Greater flexibility was applied to the academic calendar and to course structures. Improvements in teaching and learning were aided by regular appraisals of teaching quality, expanded use of the Course Experience Questionnaire (CEQ) and the Unit and Teaching Evaluation Instrument (UTEI); awarding teaching excellence; conducting teaching and learning forums; mentoring and providing staff professional development. A set of Key Strategies and expected outcomes for the 2006 year has been developed under the Teaching and Learning Management Plan. Teaching and Learning Support A pilot mid-term CEQ was conducted and a report submitted to the Curriculum Teaching and Learning Committee (CTLC). CTLC endorsed the concept of a mid-course CEQ as an approved form of quality assurance for teaching and learning across an ECU course. The UTEI system was upgraded and now specifically assists the collection of UTEI data from remote locations, thus meeting AUQA requirements. To promote and simplify the system’s use, a plain language guide —The Little Red Book — was developed and placed on the UTEI website. The upgrade, for the first time, also made available historic data enabling both analysis into trends, strengths and improvement opportunities in UTEI outcomes, and interpretation of individual staff results. The following commendations were made by CTLC in relation to 2004 UTEI results: • School of Law and Justice and WAAPA
For its maintenance of the high standards of its units and teaching by School/Academy staff. • School of International, Cultural and Community Studies
For its maintenance of a high standard of teaching by School staff. • School of Nursing, Midwifery and Postgraduate Medicine
For its achievement of a high standard of teaching by School staff. • School of Exercise, Biomedical and Health Studies
For its achievement of a high standard in its units. • Kurongkurl Katitjin, School of Indigenous Australian Studies
For the high standard of its units.
Teaching and learning support in 2005 was also provided by a comprehensive program of professional development. One priority service provided by the Teaching and Learning Development Centre included implementing the practical requirements of the ECU policy on Professional Development for Tertiary Teachers (PDTT). Three specific units — Induction for all new academic staff, Introduction to Tertiary Teaching for all sessional staff and Introduction to Teaching and Learning — were offered, with a total of 378 staff attending during the year.

14
Teaching support was further supplemented by new Learning and Development Services grants for teaching and learning projects and initiatives. In all, 25 Teaching and Learning Small Grants were awarded, with an average funding of $3,000 per grant. Funds were also allocated for Graduate Certificate in Tertiary Teaching Scholarships. For the first time in 2005, these scholarships were designated as course scholarships rather than individual unit scholarships.
Quality teaching was recognised by the Vice-Chancellor’s Awards for Excellence in Teaching and 2005’s winners were:
Teaching Excellence – Individual or Team Dr Susan Ash, Faculty of Community Services, Education and Social Sciences, School of International, Cultural and Community Studies Mr Timothy Perkins, Faculty of Computing, Health and Science, School of Natural Sciences Dr Terry DeJong and team, Faculty of Community Services, Education and Social Sciences, School of International, Cultural and Community Studies. Teaching Excellence – Early Career Dr Magda Wajrak, Faculty of Computing, Health and Science, School of Natural Sciences Mr Wayne Snell, Faculty of Computing, Health and Science, School of Engineering and Mathematics. Institutional Mr Sandy Kerr and team, Faculty of Community Services, Education and Social Sciences, School of Education Associate Professor Chris Forlin and team, Faculty of Community Services, Education and Social Sciences, School of Education Ms Cassandra Colvin and team, Centre for DVC Students Advancement and International, International Student Support.
Nominations for the Australian Awards for University Teaching (AAUT) were:
Teaching Excellence – Individual or Team Dr Susan Ash, Faculty of Community Services, Education and Social Sciences, School of International, Cultural and Community Studies Dr Chris Meredith, Faculty of Computing, Health and Science, School of Exercise, Biomedical and Health Sciences
Teaching Excellence – Early Career Dr Magda Wajrak, Faculty of Computing, Health and Science, School of Natural Sciences.
Dr Susan Ash was selected as a finalist in the AAUT Teaching Excellence Awards in November 2005.
Teaching and Learning Outcomes The Course Experience Questionnaire (CEQ) showed encouraging results for ECU for the 2005 year. Areas of particular interest included Generic Skills, Good Teaching and Overall Satisfaction and data is compared over the last four years. Trend patterns in the ECU CEQ scale scores for the years from 2001 to 2004 (collected in 2005 from graduates who completed their course in the 2004 calendar year) show that there is a slight but steady increasing trend in the ECU Good Teaching scores across time. Generic Skills remained the same as for 2003 graduates, and the results for Overall Satisfaction showed a one point increase from that for 2003 graduates. Overall Course Satisfaction scores remain high – the national average for 2004 graduates was 89 per cent and the ECU result was 88.6 per cent. In other Key Performance Indicators, the University’s performance in its student retention rate was down to 79.1 per cent in 2004 from 85.4 per cent in 2003. This 6.3 per cent drop was considered to be largely a function of the buoyant WA employment market, but student retention is nevertheless a high priority of ECU’s teaching and learning activities and a focus of the Teaching and Learning

15
Management Plan. More positively, the University’s student progress rate was 88.3 per cent for 2004 and remains above the national average of 85 per cent. Academic Profile During the year, more than 330 courses were offered, and 109 new programs, from Advanced Diploma to PhD, were approved. A significant development was the commencement of the Bachelor of Laws program. Two major new course offerings — the Bachelor of Science (Occupational Therapy) and Bachelor of Science (Occupational Therapy) Honours — were approved, and will be offered from 2006. A comprehensive review of admission pathways and standards for all courses was undertaken in 2005 and incorporated into an ECU Admissions Framework. The Admissions Framework provides information on entry requirements for both Australian Qualifications Framework (AQF) and non-AQF courses. A review of English university entry standards was also conducted and incorporated into a formal standards document. A Qualifications Framework was developed which includes a new range of course types outside the AQF, which are designed to provide additional entry pathways for students wishing to enter AQF courses. These initiatives are designed to provide ECU access for students who do not meet conventional entry requirements.

16
Students Student Profile In 2005 ECU had a total of 21,104 students of whom 4,207 were postgraduate students and 3,567 were fee-paying overseas students. Full-time students comprised 67 per cent of the student body, part-time 22.6 per cent and external students 10.4 per cent. More than 5,000 students graduated in 2005. Student Services Student services were enhanced with the smooth online implementation of both the Callista student management system and the new HESA data. The implementation of the Higher Education Support Act (2003) came into full effect in 2005 and involved change of around 50 processes. ECU made significant improvements to its transition/orientation procedures and resources for 2005. This included developing orientation resources, campus guides, establishing an orientation website, providing workshops on Library Tours and Locating Resources and Work Smarter, Not Harder, offering UniStart – an undergraduate preparatory orientation course (Postgraduate and ESL versions are in production for 2006), conducting Campus Welcome Fairs which promoted services to students and broadening international student activities. The Multifaith Chaplaincy was expanded with six new visiting chaplains granted Visiting Chaplain standing. The Mutlifaith Chaplaincy Services now has representation from Anglican, Baptist, Baha’i, Buddhist, Hindu, Jewish and Muslim traditions. As part of the ECU’s response to the Indian Ocean Tsunami, the Multifaith Chaplaincy Service worked with the Office of Marketing and Development to produce four ECU Condolence Books, one each for the Consuls of India, Indonesia, Sri Lanka and Thailand which were signed by students and staff and presented to Consular officials at a function on the Joondalup Campus. Student Counselling Service involvement in transition to university activities was increased in response to a growing demand for one-on-one counselling. The service delivered 30 workshops to 430 students during the year, covering relaxation, procrastination, exam anxiety, time and stress management and trauma and emotional wellbeing. Customised staff training for handling student grievance or equity enquiries was implemented. A new academic appeals rules framework was put in place during the year. Final year students were offered Focus Week activities to increase awareness of employment outcomes and to maximise employer/student contact. A Part-Time Employment Program, run by the newly appointed Guildlink Employment Officer, was established to expand student employment opportunities — with the number of advertised positions ballooning from 412 in 2004 to 1489. Some 6,000 students, 4,000 employers and 530 staff registered with the ECU Careers Advisory Service. University Preparation Course This course continued to attract strong numbers of ‘near miss’ students into a revised format. The course ran with four units (up from three) for the first time and maintained a high pass rate. The take-up rate of places in regular undergraduate programs improved as the opportunities for places in courses grew in the current demographics. The University has also developed specific variants of the course for entry into Nursing and Sport Science programs. In addition to the usual intake of over 200 in first semester, a smaller intake proved to be viable in semester 2. An intake also ran at Bunbury with the assistance of the Faculty of Regional Professional Studies. Scholarships In 2005 ECU almost doubled the number of undergraduate scholarships it offers – taking the number to more than 400 valued at a total of $3.2 million over their duration. These include a range of merit-based scholarships in strategic curriculum areas, scholarships for domestic full fee-paying students from financially disadvantaged backgrounds who were unable to secure a Commonwealth-supported place, but meet ECU’s minimum entry requirements, ECU Undergraduate Excellence

17
Scholarships awarded to 15 students who have achieved academic excellence in prior studies and Undergraduate First Year Equity Bursaries to assist students from equity groups to establish themselves in their first year of tertiary study. In total, 609 students received scholarship payments from the ECU Scholarships Office in 2005 of which 511 were new scholarships students in 2005. The value of disbursements from the Scholarships office for the year was $1,641,295. Information Technology and Library Services In the area of IT, new functionality in the Student Information Management Online offered significantly enhanced enrolment procedures. Implementation of an online Virtual Information Pack site supported 24-hour offer acceptance, IT authentication and tailored enrolment information by course. A post-admissions survey indicated 95-98 per cent student satisfaction with ease of usage. Student Central launched the ECU Student Contact Centre, enabling a single student assistance contact number and call analysis. Significant additional annual funding was allocated to the library collection, and the MetaQuest Portal, which enables users to search multiple databases simultaneously, was introduced mid-year. Work has commenced on the new $35.5 million library, scheduled for completion at the end of 2006. International In a slowing market, ECU’s onshore international student numbers grew by 9.5 per cent to 2,411, drawn from about 90 countries. More than 30 per cent were enrolled in postgraduate programs. Programs in most demand included Business, Information Technology, Communications and Education. The top source countries grew strongly — China by 25 per cent, India 29.7 per cent and Zambia 50 per cent. Bangladesh and Canada also showed exceptional growth. ECU was the market leader in WA for the number of onshore international students from Norway, India, Zambia, United Kingdom, Nepal, Seychelles, Bangladesh, Malawi, Slovakia and Ghana. The University ranked first in Australia in terms of on-campus students from Zambia, Seychelles, Malawi and Ghana. ECU International (ECUI) recorded some significant achievements in 2005 — revenue from onshore international students reached $30 million for the first time, ECUI was a finalist in the WA State Export Awards and ECUI’s transition program was nominated for AAUT in 2005 and for a Carrick Institute for Learning and Teaching in Higher Education award in 2006. New Regional Marketing Managers and two new Regional Marketing Officers were appointed. Another 12 student recruitment agents from key markets participated in a workshop/familiarisation visit held in conjunction with ECU Live! and 176 international visitors were hosted during the year. Reflecting a stronger focus on services for international onshore students, e-newsletters were produced, both the number and membership of international student groups increased, student planning forums were introduced and ECU’s transition program, supported by 180 current student volunteers, achieved close to 100 per cent approval by new students.
18
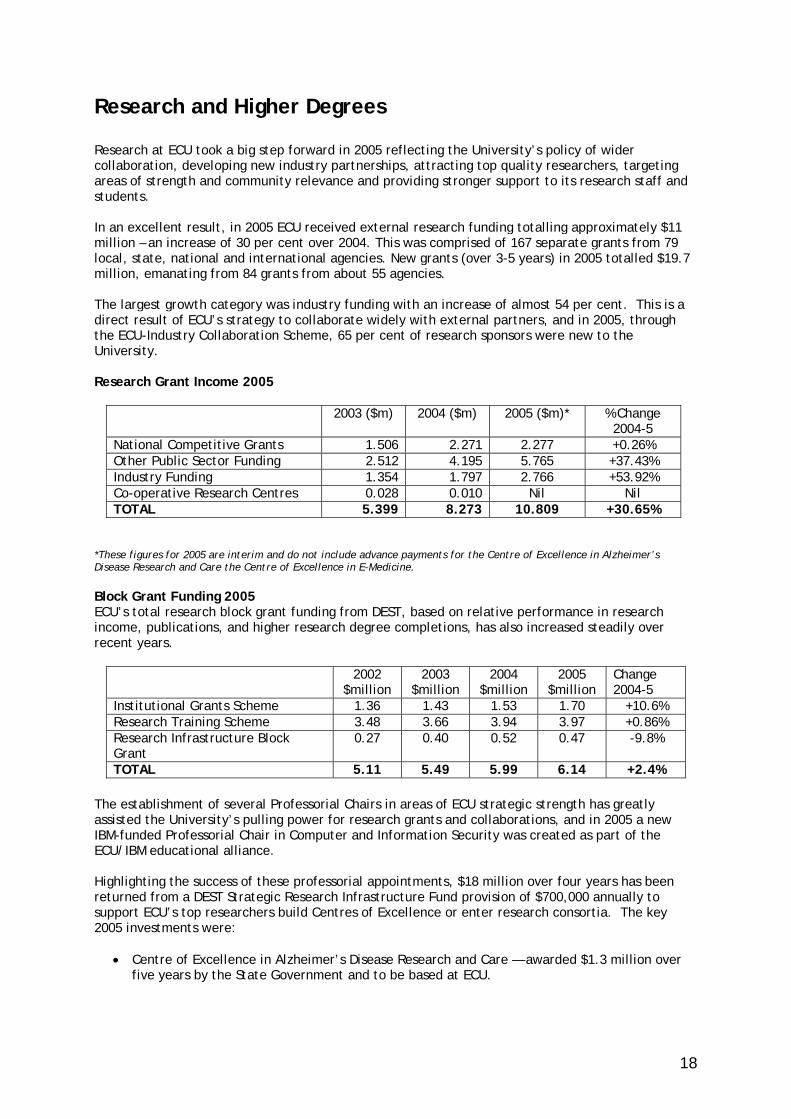
Research and Higher Degrees Research at ECU took a big step forward in 2005 reflecting the University’s policy of wider collaboration, developing new industry partnerships, attracting top quality researchers, targeting areas of strength and community relevance and providing stronger support to its research staff and students. In an excellent result, in 2005 ECU received external research funding totalling approximately $11 million – an increase of 30 per cent over 2004. This was comprised of 167 separate grants from 79 local, state, national and international agencies. New grants (over 3-5 years) in 2005 totalled $19.7 million, emanating from 84 grants from about 55 agencies. The largest growth category was industry funding with an increase of almost 54 per cent. This is a direct result of ECU’s strategy to collaborate widely with external partners, and in 2005, through the ECU-Industry Collaboration Scheme, 65 per cent of research sponsors were new to the University. Research Grant Income 2005
2003 ($m) 2004 ($m) 2005 ($m)* % Change 2004-5
National Competitive Grants 1.506 2.271 2.277 +0.26% Other Public Sector Funding 2.512 4.195 5.765 +37.43% Industry Funding 1.354 1.797 2.766 +53.92% Co-operative Research Centres 0.028 0.010 Nil Nil TOTAL 5.399 8.273 10.809 +30.65%
*These figures for 2005 are interim and do not include advance payments for the Centre of Excellence in Alzheimer’s Disease Research and Care the Centre of Excellence in E-Medicine. Block Grant Funding 2005 ECU’s total research block grant funding from DEST, based on relative performance in research income, publications, and higher research degree completions, has also increased steadily over recent years.
2002 $million
2003 $million
2004 $million
2005 $million
Change 2004-5
Institutional Grants Scheme 1.36 1.43 1.53 1.70 +10.6% Research Training Scheme 3.48 3.66 3.94 3.97 +0.86% Research Infrastructure Block Grant
0.27 0.40 0.52 0.47 -9.8%
TOTAL 5.11 5.49 5.99 6.14 +2.4% The establishment of several Professorial Chairs in areas of ECU strategic strength has greatly assisted the University’s pulling power for research grants and collaborations, and in 2005 a new IBM-funded Professorial Chair in Computer and Information Security was created as part of the ECU/IBM educational alliance. Highlighting the success of these professorial appointments, $18 million over four years has been returned from a DEST Strategic Research Infrastructure Fund provision of $700,000 annually to support ECU’s top researchers build Centres of Excellence or enter research consortia. The key 2005 investments were:
• Centre of Excellence in Alzheimer’s Disease Research and Care — awarded $1.3 million over five years by the State Government and to be based at ECU.

19
• Centre of Excellence in E-Medicine, International Centre for Healthcare Solutions (E-Med) — the world’s first e-medicine research initiative — awarded $2.25 million over three years by the State Government. Core partners are ECU, UWA, Lions Eye Institute and ANU.
• McCusker Foundation for Alzheimer’s Disease Research — an agreement forged under which ECU will conduct research to a minimum value of $500,000 pa.
• Western Australian Marine Science Institution — established by the State Government with a grant of $21 million. A collaboration between four universities, ECU is expected to receive $2.3 million in grants for research into WA’s marine biodiversity.
Other investments supported include:
• Centre for Microphotonics • National Network Tele-Test Facility • Consultancy to support a WA bid for a national ICT capacity in WA.
A telling indicator of ECU’s growing success in research funding applications, both in number and monetary amounts, is that, in 2005, ECU was awarded 23 research grants valued at $150,000 and above. This was more than double the number of grants of this value awarded in 2004. THE ECU Early Career Researcher Grant scheme funded seven projects totalling $102,039. Higher Degrees ECU’s Graduate School has responsibility for research Master, PhD and professional doctorate students and by early December 2005, 57 research higher completions — 49 PhD, eight Master by Research — and 13 professional doctorates were achieved, with 40 submitted theses currently under examination. There are presently around 290 EFTSL in research, and the University’s commitment is to maintain research training at a target of three per cent of funded load (around 300 EFTSL). Research Services The Graduate School supported both staff and student research through the work of its newly appointed Postgraduate Information Officer and by providing workshops and scholarships. Researchers at ECU are supported by both the Office of Research and Innovation and the Graduate School. During 2005, the Office of Research and Innovation made submissions to relevant research funding bodies on issues such as the Research Quality Framework; provided University-wide seminars on research-related topics, marketed ECU research in a range of forums and delivered enhanced web access research information through provision of relevant, new software. Supervisors of research higher degree students were supported with training workshops and this year by the inaugural Vice-Chancellor’s Award for Excellence in Research Supervision. The recipients were:
• Professor Ron Oliver, Associate Dean Teaching and Learning in the Faculty of Communications and Creative Industries
• Dr Richard Rossiter, Senior Lecturer, School of International, Cultural and Community Studies, Faculty of Community Services, Education and Social Sciences.
Commercialisation An active commercialisation program was undertaken including systems and policy development, training, developing the intellectual property portfolio, commercialisation support and development of a number of key projects such as the Panorama Labs research contract, production and dissemination of research-based bullying materials in the Friendly Schools and Families Program, external funding negotiations for Alzheimer’s Disease research and preparation of Professional Development@ ECU in readiness for provision of services externally.

20
Engagement and Enterprise In 2005 ECU set out to extend its range of industry and community partnerships, engagement with the professions, advancement and alumni relations, marketing and corporate relations and community engagement through arts, culture and sport. Marketing The major marketing drives for the year occurred mid-year with a strong campaign for mature-age and post-graduate enrolments, and at year’s end when a new portfolio entry scheme was introduced as an alternative pathway commencing in 2006. A new marketing theme, Breaking the mould, was devised and rolled out progressively to draw attention to ECU’s clusters of core disciplines or course genres. At the same time, the University identified new directions for the ECU brand, geared towards future positioning in the market. It again ran large-scale open days at Joondalup and Mount Lawley Campuses. Development and Alumni A major focus of industry and community partnerships is their ability to contribute to the University’s development work. Development involves raising funds for purposes additional to government grants and student income. Through the ECU Foundation, this money is committed to a range of programs such as research, scholarships, student services and facilities. In 2005 the Foundation began planning its first professional capital-raising campaign, aimed at generating donations to assist the development of the Vario Health Institute, a grouping of numerous health-related research centres within ECU and beyond. Prominent people from business and the professions were enlisted to advance this cause. The Foundation gained the first contribution from wireless internet network supplier Nortel as part of an ongoing partnership. Major alliance partner IBM funded a professorial chair in computer and information security. Professor Bill Hutchinson, author of Information Warfare: Corporate Attack and Defence in the Digital Age, took up the new five-year post. Professor Hutchinson oversees seven ECU researchers undertaking ground-breaking international, federal and Western Australian research projects. The University appointed its first Alumni Ambassador, based in the Thai capital of Bangkok. This funded role co-ordinates local chapters through networking and liaison with ECU in WA. Community Engagement Examples of community engagement for the year included sponsorship of the inaugural Sunset Valentine free public concert in Joondalup, the official opening of a new building for the School of Indigenous Studies, Kurongkurl Katitjin, and ECU Sports at Mount Lawley Campus, an official farewell function for Claremont Campus and the launch of a research consortium known as the E-Med Centre at Churchlands Campus. Key partnerships for nursing practica were established with Sir Charles Gairdner Hospital, Joondalup Health Campus and the Fremantle Hospital and a statewide Wellbeing Survey targeting 21,000 WA teachers, nurses and police was commenced, aimed at developing a scorecard on the wellbeing of these professions. An ECU-developed “Living Longer, Living Stronger” group exercise program for seniors was launched at the Joondalup Campus and the University joined with the State Government in funding a free CAT bus service in the Joondalup central business district. A large number of leaders from the professions and community participated in the installation of the new Chancellor early in the year and a series of farewell functions for the retiring Vice-Chancellor later in 2005. Graduation ceremonies for more than 5000 students and the WA Curriculum Council’s Awards also drew large audiences to ECU over the year. ECU conducted the second annual Early Careers awards program in partnership with a range of professional associations and employer groups. Arts and Culture ECU’s cultural assets also played a role in community activities. The Western Australian Academy of Performing Arts (WAAPA) celebrated its Silver Anniversary with a year-long program of glittering events including a musical performance by WAAPA students in Parliament House Chambers hosted

21
by the Western Australian Parliament, a gala dinner featuring WAAPA Alumnus William McInnes, a series of student workshops and public lectures from special guest artists and alumni, and concerts from all of WAAPA’s performing arts fields. The University’s art collection featured in a month-long series of events focusing on Western Australia’s living artists. This included art-focused talks in several localities including Bunbury Campus. The Museum of Childhood’s collection moved into new facilities at Churchlands and embarked on a program of public activities and forward planning under new management from ECU’s Marketing and Development directorate.

22
Business and Resources Strategic Planning ECU takes a planned approach to the management of its business and resources through the adoption of five-year strategic plans. A mid-term review of ECU’s Strategic Plan 2003-2007 was undertaken internally and externally to assess progress against strategic priorities; identify both gaps and future challenges; and provide a reference point for the incoming Vice-Chancellor. A set of ECU Goals for 2006 was subsequently developed as groundwork for the next Strategic Plan. Financial Management and Outcomes ECU finished the year with a consolidated operating surplus of $22.26 million, which included $14 million profit from the sale of the Claremont Campus. Excluding this sale, consolidated operating profit was $8.26 million which compared favourably with the 2004 financial year. The University’s operating margin was 8.75 per cent compared to 3.7 per cent for 2004 and the liquidity position remained sound. Cash reserves equalled four weeks of the University’s turnover, the acceptable DEST level. The University maximised investment returns achieving 18 base points return over benchmark investment returns. A major achievement in financial management for 2005 was the successful reimplementation of ECU’s financial system on the Oracle 11i Business Suite. The new system operated from January 2006. Staffing Profile The academic staffing profile was enhanced by an allocation worth several million dollars which funded 68 additional academic staff appointments, with a further 30 commencing in 2006. This will impact positively on student/staff ratios, reduce sessional staff numbers, and, together with 16 new appointments to senior academic levels, strengthen academic leadership capacity. The proportion of academic staff at Professor level grew from 5.9 per cent in 2004 to 6.2 per cent compared to 8.2 per cent for New Generation Universities and 10.8 for the sector. The general staff classification profile is in line with other universities, but with proportionately less staff at H10 and above and requires further improvement. University of South Australia demographer Professor Graeme Hugo conducted an analysis of ECU’s academic staff demographics and results are informing strategies for renewal, succession and retention. With 46.8 per cent of academic staff having PhD qualifications, ECU is moving into line with sector averages of 50- 55 per cent. In equity areas, ECU has outperformed the sector for academic female representation for six years. Based on this performance, the Office of Equal Employment Opportunity for Women in the Workplace has granted the University a two-year waiver from reporting. ECU is the largest employer of indigenous staff of the WA universities and employs approximately three times the education sector average of indigenous Australians. Occupational Safety and Health ECU’s workers’ compensation costs in the 2004/5 insurance period represented 0.26 per cent of its annual payroll compared to the state average of 2.25 per cent. ECU benchmarks its OSH performance against the Group of Eight, WA Universities and WA averages (educational workers) in the number of Workers’ Compensation Claims/100 employees, number of Lost Time Injuries/100 employees, number of Lost Time Days/Lost Time Injury and number of Working Days Lost per 1,000,000 hours worked and in all cases compares favourably and/or significantly better. ECU took a leadership role in establishing the first sector-wide benchmarking framework for occupational safety and health indicators with the continuing development of the Positive Performance Indicator Benchmarking Project and in the presentation of a collaborative universities paper to the Australian Vice-Chancellors’ Committee (AVCC) Safety Conference.

23
Professional Development More than 250 professional development workshops were conducted with over 2,000 staff attending. An internally developed Leadership@ECU Accredited Program was offered and articulates into formal university programs and management qualifications. Professional Development undertook its first commercial activity this year – the facilitation of a Documentation and Process Improvement Workshop for the City of Wanneroo. Staff focus groups identified priorities for improvement from the 2004 staff survey and resultant initiatives will be implemented in 2006. The web-based ‘shopfront’ Staffplus was implemented and will improve competitiveness and retention in staffing. The University acknowledges the achievements of its staff through the Vice-Chancellor’s Awards for Service, Professionalism and Enterprise. The 2005 winners were:
Service Mr David Marshall, Business Manager, Office of the Deputy Vice-Chancellor (Students, Advancement and International) Professionalism Professor Max Angus, Head, School of Education, Faculty of Community Services, Education and Social Sciences Enterprise Dr Beth Walker, Director – Small and Medium Enterprise Research Centre, Faculty of Business and Law Team Award (Category: Service) Student Support Staff Team, School of Psychology, Faculty of Community Services, Education and Social Sciences
Campus Consolidation and Capital Works Campus consolidation is now well advanced and approximately 3,450 students have moved to the Joondalup Campus and 2,000 to Mount Lawley. The Claremont Campus has been transferred to UWA and redevelopment of the Churchlands Campus is underway. Major capital development took place in 2005. On the Mount Lawley Campus, the new Indigenous Centre ($7.2 million) was built, the Sport and Recreation Centre ($5.3 million) came into operation as a joint project with the Mount Lawley Senior High School and a two-storey car park ($2.3 million) was completed. Extensive campus refurbishment was undertaken. At the Joondalup Campus construction commenced on the new Library and Technology Centre and the Health and Wellness Building ($35.5 million each) planned for completion by late 2006 and mid 2007 respectively. Design was commenced for a new $4.8 million 350 Seat Lecture Theatre.
24
Corporate Standards and Risk Management ECU’s commitment to being an exemplary corporate citizen is embedded in all its activities and across all its faculties and centres. The University works closely to its mission and fefining themes, as set out below, and has regularly reviewed its policies and procedures to ensure it adheres to the highest corporate standards. Particular attention is paid to equity issues, quality maintenance and enhancement and risk management. Equity ECU’s commitment to equity was strengthened in 2005. Key initiatives included launching two high-order statements — the Equity Statement of Commitment and the Statement of Commitment to Indigenous Australians — focusing on developing attainable, visible and contemporary equity outcomes, conducting a Disability Access Audit of the University, targeting Higher Education Equity Support Program (HEESP) funds at university-wide projects which focus on access, participation, retention and success of equity students and more actively promoting equity-related scholarships and bursaries to the relevant groups. A Portfolio Entry Pathway, which assesses applicants for certain degree courses by a portfolio of evidence demonstrating an ability to succeed in higher education, was developed for introduction in 2006 and will facilitate participation of students from equity groups. ECU’s 2005 performance for both students and staff was monitored against equity performance indicators by its Equity Committee. The University has been exempted from reporting to the Equal Opportunity for Women Agency until 2008 as a result of its high performance in terms of gender equity outcomes and development of initiatives and programs. For more information on Equity visit: http://www.ecu.edu.au/equity/ Quality Quality enhancement in 2005 focused on outcomes of the 2004 Australian Universities Quality Agency (AUQA) audit of ECU. An internal risk-rating exercise of the AUQA recommendations for improvement enabled ECU to take a strategic approach to managing this process and a progress report will be provided to AUQA in early 2006.The University had the highest number of practices of audited universities accepted for inclusion in AUQA’s Good Practice Database and, at AUQA’s invitation, contributed to its Occasional Papers series, focusing on the evolution of quality at ECU. Further enhancing and embedding quality across all the University’s operations, a Processes and Practices Plus (PPP) Scheme was initiated, identifying good internal processes and practices for inclusion in a good practice database. The PPP Scheme will assist ECU to promote benchmarking and best-practice principles. ECU was one of 14 Australian universities awarded an Australian Vice-Chancellors’ Committee grant in 2004 to develop an enhanced model for selecting and managing offshore partners and/or agents. The model was developed and presented to other Australian universities in 2005. For more information on Quality@ECU visit: www.ecu.edu.au/Quality@ECU/ Risk Management A major component of corporate governance at ECU is effective risk management. Several milestones were achieved in this area in 2005 including Council approval of a strategic risk map identifying nine strategic risks facing ECU in pursuit of its mission — these strategic risks now form the basis of the University Risk Register, establishing Risk Registers in all faculties and centres and for all major projects including Strategic IT Systems development, commercialisation projects and offshore programs. Supporting ECU’s risk management was the identification of more than 100 pieces of legislation that ECU is requested to comply with in its operations, the update of fraud and misconduct policies and the completion of audits of two mega faculties and the South West Campus (Bunbury).

25
The RMAA office is developing best practice guides for legislative compliance, for Faculty and Centre Audit Protocols regarding preparation for internal audits and self-assessments of work environments. A Business Continuity Co-ordinator was appointed to ensure effective response to critical incidents and work has commenced on Business Continuity Plans for Faculties and Centres and functional plans for human, physical, communications and IT incidents. For more information on Risk Management, visit: www.ecu.edu.au/RMAA/index.html

26
Risk Management Statement Consistent with National Governance Protocol 9 Edith Cowan University has an integrated risk management policy that was approved by the University Council in December 2001. The oversight of risk management is included in the terms of reference for the Council’s Quality and Audit Committee. Functionally the Office of Risk Management and Audit Assurance has responsibility for the development and implementation of governance-related risk management strategies such as the maintenance of risk registers, legislative compliance and business continuity. The Management Services Centre is accountable for risk financing and occupational safety and health strategies. Legal risk is dealt by the University Secretariat located within the Governance, Policy and Planning portfolio.

27
Corporate Governance Statement Council endorsed a statement on corporate governance in December 2002. The statement was amended by Council in December 2004 pursuant to the implementation of the National Governance Protocols. The following is an abridged version summarising the statement. The full statement can be viewed at www.ecu.edu.au/GPPS/committees/corp_gov_stmt.html Statutory Framework The governance of the University takes place within a specific statutory framework. At the highest level of that framework, is the Edith Cowan University Act 1984 (WA) (‘the Act’), as amended, which establishes the University as a body corporate, consisting of the Council, the members of staff and the enrolled students (s.5). Functions of the University Section 7 of the Act sets out, in non-exhaustive terms, the functions of the University which include: providing courses of study; encouraging and providing for tertiary education; supporting and pursuing scholarship and research; fostering the welfare and development of all enrolled students; promoting and encouraging collaboration and consultation with other institutions; and providing such facilities that relate to its functions. Council: its authority, functions and duties, powers and responsibilities Section 8 of the Act provides that the Council is the governing authority of the University. Section 16 specifies the functions and duties of Council, with section 16(1)(c) encapsulating the full scope of the Council’s functions. (1) Subject to this Act the Council shall – (a) perform any function or duty conferred or imposed upon the University under this Act; (b) act in all matters concerning the University in such manner as appears to it best calculated to
promote the objects and interests of the University; and (c) control and manage the operation, affairs, concerns and property of the University. Council has, however, exercised its power of delegation to delegate to the Vice-Chancellor powers to manage the University. Section 17 relates to the powers of Council and provides in the preamble that: Subject to this Act and the Statutes the Council has power to do all things necessary or convenient to be done for or in connection with the operation, affairs, concerns and property of the University. Under the Act, Council has responsibility for University lands (s.28), finance (s.36), the appointment, termination, terms and conditions of academic and other staff, including the chief executive officer (ss.30 and 31), and to make Statutes, and By-laws and Rules under the Statutes (s.26). Pursuant to the National Governance Protocols, Council has adopted the following responsibilities: (a) appointing the vice-chancellor as the chief executive officer of the higher education provider,
and monitoring his/her performance (b) approving the mission and strategic direction of the higher education provider, as well as the
annual budget and business plan (c) overseeing and reviewing the management of the higher education provider and its
performance (d) establishing policy and procedural principles, consistent with legal requirements and
community expectations (e) approving and monitoring systems of control and accountability, including general overview of
any controlled entities. A controlled entity is one that satisfies the test of control in s.50AA of the Corporations Act
(f) overseeing and monitoring the assessment and management of risk across the higher education provider, including commercial undertakings

28
(g) overseeing and monitoring the academic activities of the higher education provider (h) approving significant commercial activities of the higher education provider. The role of Council outlined in the Corporate Governance Statement is broadly consistent with the responsibilities mandated by the Protocols. While retaining its ultimate governance responsibilities, Council has an appropriate system of delegations in place to ensure the effective discharge of these responsibilities. Role of Council The Statutory Framework sets out in formal terms the authority and legislative context in which the Council operates. Council recognises, however, that to be effective it must share a common understanding of both the manner in which it intends to operate and its specific roles. Manner of operating In carrying out its statutory responsibilities, Council operates according to the following characteristics and values:
Visionary: Council uses its breadth of expertise and experience to help inform the vision for the University's future and the strategies by which that vision might be attained. Pro-active: Council actively engages with its tasks to help the University achieve its mission. Committed to the University: Council is committed to the University and its role in the governance of the University. This commitment is to the ongoing well-being of the University as a whole, setting aside individual or representational interests. Holistic: Council recognises that its authority resides in Council as an entity. Advisory/Supportive: Council provides advice and support to executive management and supports it as it implements Council decisions. Quality-Focused: Council assures itself that processes have been put in place by executive management to ensure quality in all aspects of the work of the University. Ethical: Council works to the highest ethical standards and expects similar standards of the staff of the University. Skilled and Informed: Council and the University will work to secure a Council membership that has the appropriate skills, experience and geographic precinct profile consistent with the current objectives and strategies of the University.
Specific Roles The major roles of Council working with the advice of the Vice-Chancellor and the Academic Board may be usefully outlined within the following categories: External Promotion and Advocacy • promoting and being an advocate of the University to the wider community • enhancing and broadening the links between the University and the wider community Strategy Formation: • approving the University’s strategic direction and financial objectives • perpetuating the strategic leadership of the University, including appointment of the Vice-
Chancellor and selection of the Chancellor and Pro Chancellor Policy Making: • ensuring the University has in place policies which serve the needs and interests of its students,
staff and the wider community • approving higher order policies • establishing governance policies in line with best practice Accountability: • accountability for the financial well-being of the University • delegating authority appropriately • accountability, drawing on advice from the Vice-Chancellor and the Academic Board, for the
quality of the University’s academic programs and services • final accountability for the actions and operations of the University and their compliance with
statutory requirements
29
Monitoring, through regular or requested reports, of: • compliance with relevant legislation • the financial standing of the University • quality, audit and risk management processes and arrangements • academic standards, through advice from the Vice-Chancellor and the Academic Board • the University’s progress against key objectives • the reconciliation and approval of capital plans and operating budgets against the strategic
direction of the University • the Vice-Chancellor’s performance • Council’s own performance Maintaining the distinction between governance and executive management In order for Council and executive management to perform their respective roles effectively, Council recognises that a distinction needs to be maintained between governance and executive management. Evaluating Council Performance Council is committed to both collective and individual performance appraisal. To allow for more concrete assessment of Council’s performance, Council will also set for itself clear goals and objectives to achieve within a given year. Induction of Members Council is committed to its members being well informed about: • their role and responsibilities • the role of Council as the governing body of the University • the strategic direction and key features of the University Professional Development The Council Professional Development Program aims to provide a structured, but flexible, program for members. Council Committees Council establishes committees to assist it to meet its responsibilities. The Standing Committees of Council, as at December 2005, are:
i. Quality and Audit ii. Resources iii. Nominations iv. Remuneration v. Honorary Awards vi. Council Student Prize vii. Legislative and viii. Council Executive Academic Board The Academic Board has a special role within the governance framework of the University. The Act under which the University operates specifies that there “shall be an Academic Board of the University” (s.18(1)), the constitution of which may be prescribed by Statute. The Council views the Academic Board as a forum through which senior academics within the University can provide advice to Council on the University’s core business of teaching, learning and research. Council has therefore devolved to the Academic Board, within stipulated constraints, particular functions relating to approving changes in academic programs. It also looks to the Academic Board to ensure that appropriate quality assurance processes are in place relating to academic programs and services, and that academic standards are maintained. Role of the Chancellor The Chancellor is elected by Council to facilitate its work and collegiality by effective and ethical means, providing a focal point to ensure the high standing of the University in the wider community. As part of this role, the Chancellor presides over Council meetings.

30
Role of the Vice-Chancellor The Act provides that Council shall appoint a person to be the chief executive officer of the University (s.30(1)). University Statute No 6 provides that the person appointed as the chief executive officer is the Vice-Chancellor of the University (s.1). This Statute further provides that subject to the Act, the Statutes, By-laws and Rules of the University, and resolutions of the Council, the Vice-Chancellor is responsible for the academic, administrative and other affairs of the University (s.2). As well as being the chief executive officer of the University, the Vice-Chancellor is also its senior academic officer. Role of the Pro Chancellor The Act provides that there shall be a Pro Chancellor and that the Pro Chancellor presides at meeting of Council in the absence of the Chancellor (Act s.12). The role of the Pro Chancellor is to act for the Chancellor in the absence of that Officer and on other occasions support the Chancellor in all the Chancellor’s roles.
31
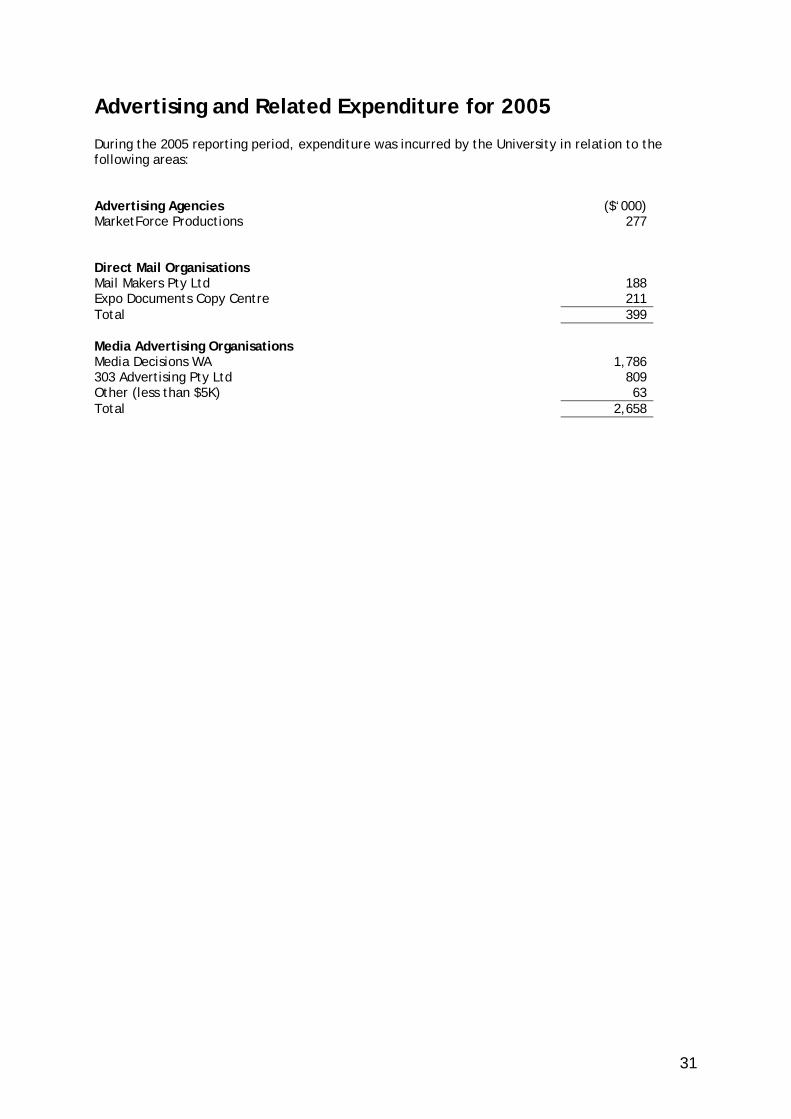
Advertising and Related Expenditure for 2005 During the 2005 reporting period, expenditure was incurred by the University in relation to the following areas: Advertising Agencies ($‘000) MarketForce Productions 277 Direct Mail Organisations Mail Makers Pty Ltd 188 Expo Documents Copy Centre 211 Total 399 Media Advertising Organisations Media Decisions WA 1,786 303 Advertising Pty Ltd 809 Other (less than $5K) 63 Total 2,658

32
Record Keeping The university is committed to best practice and compliance with its record keeping activities. As a university established under the legislation of Western Australia, ECU is subject to the requirements of the State Records Act (WA) 2000. ECU’s Record Keeping Plan (RKP), a requirement under the State Records Act, was submitted to the State Records Office in December 2004 and was approved. State Records Commission Standard 2 Record-keeping Plans: Principal 6 – Compliance The efficiency & effectiveness of the organisation’s recordkeeping system is evaluated not less than once every 5 years.
An independent review of ECU’s record keeping systems was completed in 2004 and a Records Management Business Plan was subsequently developed and approved. The RKP and ECU’s evaluation of the effectiveness and efficiency of its record keeping systems has undergone further review in 2005, in line with the implementation of the business plan, and was resubmitted in December 2005.
The organisation conducts a recordkeeping training program.
Records Management Officers have been deployed to business units at the university to provide record keeping training to system users. The officers have received external training on appraisal and classification as well as on the record keeping system.
The efficiency & effectiveness of the recordkeeping training program is reviewed from time to time.
Yearly reviews are conducted on recordkeeping awareness training. Consideration is being given for a Records Awareness training package intended to be provided to all staff with appropriate feedback and statistical reporting to assess its effectiveness.
The organisation’s induction program addresses employees’ roles and responsibilities with regards to their compliance with the organisation’s recordkeeping plan.
All new ECU employees undergo an induction course which addresses employee roles and responsibilities in regard to the importance and compliance aspects of the RKP. Additionally this material is also covered in a new employees handbook issued at time of joining ECU.

33
EDITH COWAN UNIVERSITY
Compliance with Relevant Written Laws In the performance of its functions during the year ended 31 December 2005, the University has operated within the provisions of the Edith Cowan University Act 1984. Having made or caused to be made on our behalf all relevant enquiries, but noting the very broad extent of application of written laws to the University, to the best of our knowledge, information and belief, the University has complied with all relevant written law. We are aware of no fact or circumstance apparent or existing at the date of signing this statement, to lead us to conclude otherwise. Kerry O Cox Vice-Chancellor 31 March 2006 Warren Snell Vice-President (Resources) and Chief Financial Officer

34
Summary Statistics Student and Staff Data as at 31 March 2005 1999 2000 2001 2002 2003 2004 2005 Students Full-time Students 11,069 11,096 11,735 12,920 13,731 12,930 14,151 Part-time Students 5,129 4,951 4,815 4,849 5,338 6631# 4,765 External Students 3,786 3,757 3,379 3,430 2,642 2,108 2,188 Total Students 19,984 19,804 19,929 21,199 21,711 21,669 21,104 Higher Degree by Research Student 606 687 707 638 597 559 488 Master and Doctorate by Coursework Students 831 948 1,015 1,217 1,217 1,501 1,704 Other Postgraduate Students 1,329 1,166 1,061 1,540 1,654 2,024 2,015 Undergraduate Students 17,218 17,004 17,027 17,804 18,273 17,585 16,897 Fee-paying Overseas Students 1,614 2,180 2,559 3,069 3,393 3,638 3,567 Equivalent Full-time Student Load (EFTSL) 14,776 14,848 15,324 16,599 17126 17,104 16,445 Course Completions 4,218 4,135 4,458 5,173 5,366 5,608 N/A Staff Full-time Equivalent Staff 1,794 1,775 1,794 1,817 1,813 1,834 1,869 Library Volumes Held * 625,458 787,487 626,766 700,591 661,420 651,980 647,644 Serial Subscriptions 14,701 14,611 16,343 18,693 15,005 19,279 21,109 Total Income ($000s) 165,888 161,543 191,730 205,708 208,253 278,685 251,131 # Multi-modal students have been allocated into Full-time, Part-time and External Student cohorts in 2004, to make data consistent and comparable with other years. * Data is at 31 December 2005

AUDITOR GENERAL
4th Floor Dumas House 2 Havelock Street West Perth 6005 Western Australia Tel: 08 9222 7500 Fax: 08 9322 5664
INDEPENDENT AUDIT OPINION To the Parliament of Western Australia EDITH COWAN UNIVERSITY FINANCIAL STATEMENTS AND PERFORMANCE INDICATORS FOR THE YEAR ENDED 31 DECEMBER 2005 Audit Opinion In my opinion,
(i) the financial statements are based on proper accounts and present fairly the financial position of the Edith Cowan University and the consolidated entity at 31 December 2005 and their financial performance and cash flows for the year ended on that date. They are in accordance with applicable Accounting Standards and other mandatory professional reporting requirements in Australia and the Treasurer’s Instructions;
(ii) the controls exercised by the University provide reasonable assurance that the receipt, expenditure and investment of moneys, the acquisition and disposal of property, and the incurring of liabilities have been in accordance with legislative provisions; and
(iii) the key effectiveness and efficiency performance indicators of the University are relevant and appropriate to help users assess the University’s performance and fairly represent the indicated performance for the year ended 31 December 2005.
Scope The University Council is responsible for keeping proper accounts and maintaining adequate systems of internal control for preparing the financial statements and performance indicators, and complying with the Financial Administration and Audit Act 1985 (the Act) and other relevant written law.
The financial statements consist of the Income Statement, Balance Sheet, Statement of Changes in Equity, Cash Flow Statement of the University and the consolidated entity, and the Notes to the Financial Statements.
The performance indicators consist of key indicators of effectiveness and efficiency.
Summary of my Role As required by the Act, I have independently audited the accounts, financial statements and performance indicators to express an opinion on the financial statements, controls and performance indicators. This was done by testing selected samples of the evidence. Further information on my audit approach is provided in my audit practice statement. Refer "http://www.audit.wa.gov.au/pubs/Audit-Practice-Statement.pdf".
An audit does not guarantee that every amount and disclosure in the financial statements and performance indicators is error free. The term “reasonable assurance” recognises that an audit does not examine all evidence and every transaction. However, my audit procedures should identify errors or omissions significant enough to adversely affect the decisions of users of the financial statements and performance indicators.
D D R PEARSON AUDITOR GENERAL 15 March 2006

1
Annual financial statements
as at 31 December 2005
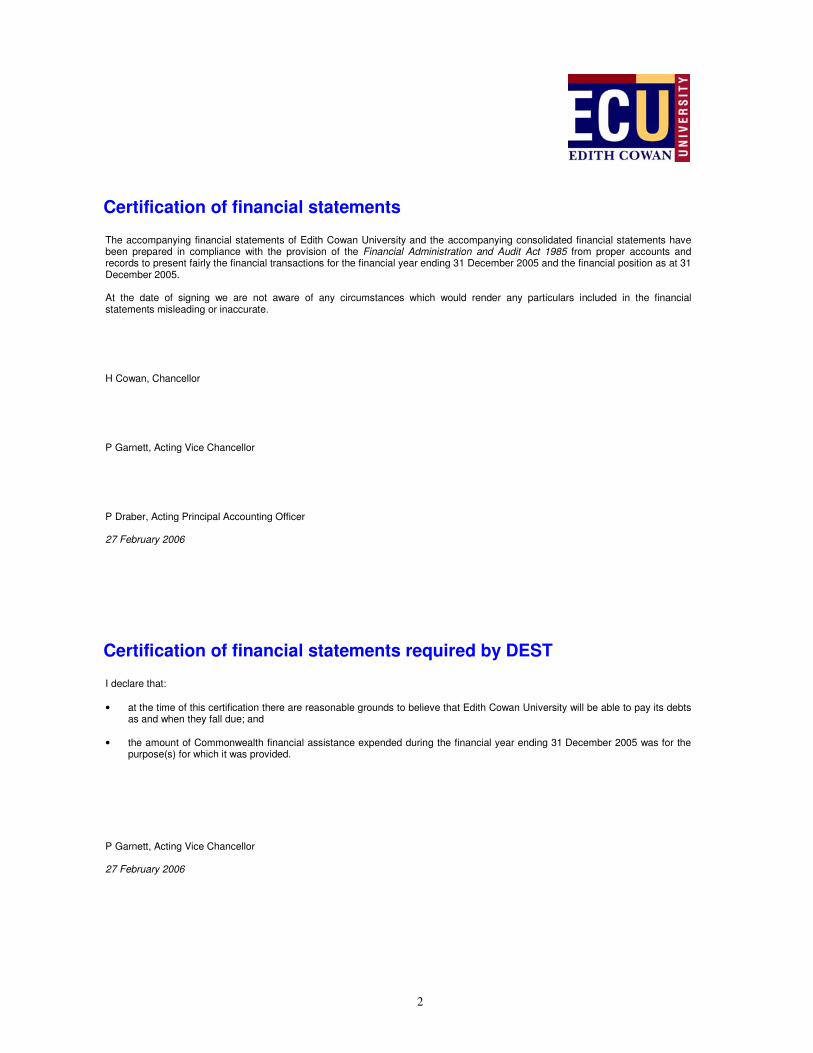
2
Certification of financial statements The accompanying financial statements of Edith Cowan University and the accompanying consolidated financial statements have been prepared in compliance with the provision of the Financial Administration and Audit Act 1985 from proper accounts and records to present fairly the financial transactions for the financial year ending 31 December 2005 and the financial position as at 31 December 2005. At the date of signing we are not aware of any circumstances which would render any particulars included in the financial statements misleading or inaccurate. H Cowan, Chancellor P Garnett, Acting Vice Chancellor P Draber, Acting Principal Accounting Officer 27 February 2006
Certification of financial statements required by DEST I declare that: • at the time of this certification there are reasonable grounds to believe that Edith Cowan University will be able to pay its debts
as and when they fall due; and • the amount of Commonwealth financial assistance expended during the financial year ending 31 December 2005 was for the
purpose(s) for which it was provided. P Garnett, Acting Vice Chancellor 27 February 2006

This page is blank.
3

EDITH COWAN UNIVERSITY Income Statement
for the Year Ended 31 December 2005
4
Economic Entity Parent Entity [Consolidated] [General University] 2005 2004 2005 2004
Note $000’s $000’s $000’s $000’s REVENUE Revenue from Continuing Operations Australian Government financial assistance
Australian Government grants 4.1 103,711 90,558 103,711 90,558 HECS-HELP - Australian Government payments 4.1 44,722 46,309 44,722 46,309 FEE-HELP 4.1 5,165 4,348 5,165 4,348
WA Government financial assistance 4.2 7,024 64,748 7,024 64,748 HECS-HELP – Student payments 7,618 7,085 7,618 7,085 Fees & charges 4.3 49,699 43,931 49,699 43,931 Investment income 4.4 1,658 1,038 1,636 1,018 Royalties, trademarks & licences 4.5 6,028 5,309 4,600 4,244 Consultancy & contract research 4.6 2,286 1,216 2,231 1,058 Net gain on disposal of non-current assets 6.1 14,117 184 14,117 184 Net gain on revaluation of investment property 6.2 1,124 1,761 1,124 1,761 Sale of goods 6,708 6,515 6,708 6,515 Other revenue 4.7 3,364 4,997 1,768 2,738
Subtotal 253,224 277,999 250,123 274,497 Deferred Government Superannuation Contributions 26(2) 1,008 4,188 1,008 4,188 Total revenue from continuing operations 254,232 282,187 251,131 278,685 EXPENSES Expenses from Ordinary Activities
Employee benefits and on-costs 5.1 145,249 134,979 143,766 133,137
Depreciation and amortisation 5.2 15,955 14,598 15,905 14,557 Repairs and maintenance 5.3 6,563 6,611 6,563 6,611 Bad & doubtful debts 5.4 771 432 771 432 Borrowing cost expense 5.5 1,267 1,022 1,267 1,022 Cost of goods sold 3,587 3,598 3,587 3,598 Other 5.6 57,628 58,742 55,981 56,828
Subtotal 231,020 219,982 227,840 216,185 Deferred Employee Benefits for Superannuation 26(2) 1,008 4,188 1,008 4,188 Total expenses from ordinary activities 232,028 224,170 228,848 220,373
Operating result before income tax 22,204 58,017 22,283 58,312
Income tax equivalents (expense)/refund 9 55 25 - -
Net Operating Result for the Year 22,259 58,042 22,283 58,312
Net increase/(decrease) in asset revaluation reserve 21 52,551 (44,556) 52,551 (44,556)
Net increase/(decrease) in foreign currency translation (38) - - -
Total Changes in Equity Other than those Resulting from Transactions with Owners as Owners
74,772
13,486 74,834 13,756
The accompanying notes form part of these financial statements.

EDITH COWAN UNIVERSITY Balance Sheet
for the Year Ended 31 December 2005
5
Economic Entity Parent Entity [Consolidated] [General University] 2005 2004 2005 2004 Note $000’s $000’s $000’s $000’s
CURRENT ASSETS Cash and cash equivalents 23(a) 11,061 8,608 10,322 8,114 Receivables 10 12,438 10,611 11,977 10,240 Inventories 11 1,898 1,848 1,780 1,774 Other financial assets 13 6,182 4,000 6,182 4,000 Other non-financial assets 12 1,381 1,647 1,164 1,406 Total Current Assets 32,960 26,714 31,425 25,534
NON-CURRENT ASSETS Receivables 10 32,976 33,660 33,101 33,660 Property, plant, equipment and vehicles 14 530,907 460,741 530,775 460,568 Investment Property 15 10,561 9,437 10,561 9,437 Other financial assets 13 5,772 2,489 5,772 2,489 Intangibles 16 4,752 5,388 4,752 5,388 Total Non-Current Assets 584,968 511,715 584,961 511,542 TOTAL ASSETS 617,928 538,429 616,386 537,076
CURRENT LIABILITIES Payables 17 8,230 5,457 8,016 4,451 Interest bearing liabilities 18 3,508 180 3,508 169 Provisions 19 8,549 16,767 8,470 16,703 Other liabilities 20 19,175 19,892 18,754 19,892 Total Current Liabilities 39,462 42,296 38,748 41,215 NON-CURRENT LIABILITIES Payables 17 606 - - - Interest bearing liabilities 18 20,820 21,328 20,820 21,328 Provisions 19 47,811 40,348 47,750 40,299 Total Non-Current Liabilities 69,237 61,676 68,570 61,627 TOTAL LIABILITIES 108,699 103,972 107,318 102,842 NET ASSETS 509,229 434,457 509,068 434,234 EQUITY Reserves 21 222,471 169,958 222,509 169,958 Retained surplus 22 286,758 264,499 286,559 264,276 TOTAL EQUITY 509,229 434,457 509,068 434,234
The accompanying notes form part of these financial statements.

EDITH COWAN UNIVERSITY Statement of Changes in Equity for the Year Ended 31 December 2005
6
Economic Entity Parent Entity [Consolidated] [General University] 2005 2004 2005 2004 Note $’000 $’000 $’000 $’000 Total equity at the beginning of the financial year 35 434,457 420,983 434,234 420,478 RESERVES Asset Revaluation Reserve 21 Balance at start of period 169,958 216,241 169,958 216,241 Net adjustment on transition to AIFRS - De-recognition of unrealised gain of investment property - (1,727) (1,727) Restated balance at start of period 169,958 214,514 169,958 214,514 Reversal to Property, Plant and Equipment in respect of disposal of vested land and buildings at Churchlands Campus
(52,674) (52,674)
Gains/(losses) from revaluation of land 8,118 8,118 Movement in Asset Revaluation Reserve 66,551 - 66,551 - Reversal of revaluation on sale of Claremont campus (14,000) - (14,000) - Balance at end of period 222,509 169,958 222,509 169,958 Foreign Currency Translation Reserve (38) - - - Balance of total Reserves at end of period 222,471 169,958 222,509 169,958
RETAINED SURPLUS 22 Balance at start of period 264,499 204,742 264,276 204,237 Net adjustment on transition to AIFRS - Recognition of unrealised gain of investment property 35 - 1,727 - 1,727 Restated balance at start of period 264,499 206,469 264,276 205,964 Correction of prior period errors - (12) - - Total result for the period 22,259 58,042 22,283 58,312 Balance at end of period 286,758 264,499 286,559 264,276 Balance of equity at end of period 509,229 434,457 509,068 434,234
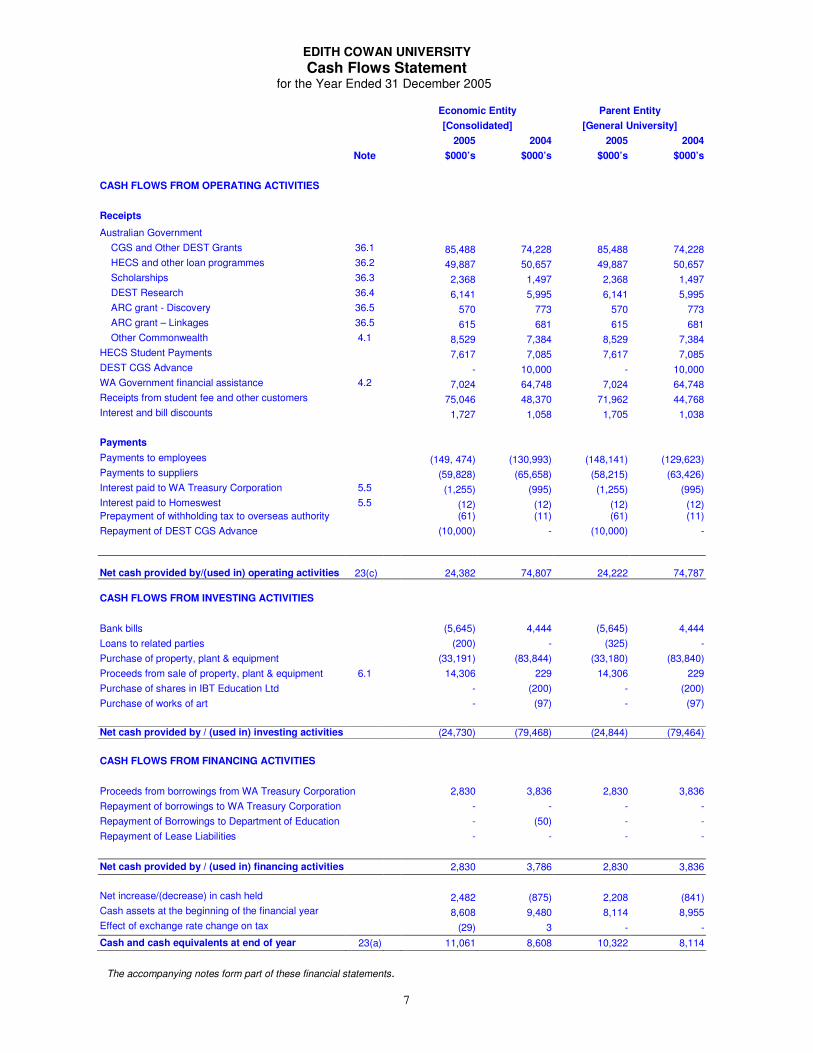
EDITH COWAN UNIVERSITY Cash Flows Statement
for the Year Ended 31 December 2005
7
Economic Entity Parent Entity [Consolidated] [General University] 2005 2004 2005 2004 Note $000’s $000’s $000’s $000’s CASH FLOWS FROM OPERATING ACTIVITIES Receipts
Australian Government CGS and Other DEST Grants 36.1 85,488 74,228 85,488 74,228 HECS and other loan programmes 36.2 49,887 50,657 49,887 50,657 Scholarships 36.3 2,368 1,497 2,368 1,497 DEST Research 36.4 6,141 5,995 6,141 5,995 ARC grant - Discovery 36.5 570 773 570 773 ARC grant – Linkages 36.5 615 681 615 681 Other Commonwealth 4.1 8,529 7,384 8,529 7,384 HECS Student Payments 7,617 7,085 7,617 7,085 DEST CGS Advance - 10,000 - 10,000 WA Government financial assistance 4.2 7,024 64,748 7,024 64,748 Receipts from student fee and other customers 75,046 48,370 71,962 44,768 Interest and bill discounts 1,727 1,058 1,705 1,038 Payments Payments to employees (149, 474) (130,993) (148,141) (129,623) Payments to suppliers (59,828) (65,658) (58,215) (63,426) Interest paid to WA Treasury Corporation 5.5 (1,255) (995) (1,255) (995) Interest paid to Homeswest 5.5 (12) (12) (12) (12) Prepayment of withholding tax to overseas authority (61) (11) (61) (11) Repayment of DEST CGS Advance (10,000) - (10,000) -
Net cash provided by/(used in) operating activities
23(c)
24,382 74,807 24,222 74,787 CASH FLOWS FROM INVESTING ACTIVITIES Bank bills (5,645) 4,444 (5,645) 4,444 Loans to related parties (200) - (325) - Purchase of property, plant & equipment (33,191) (83,844) (33,180) (83,840) Proceeds from sale of property, plant & equipment 6.1 14,306 229 14,306 229 Purchase of shares in IBT Education Ltd - (200) - (200) Purchase of works of art - (97) - (97) Net cash provided by / (used in) investing activities (24,730) (79,468) (24,844) (79,464)
CASH FLOWS FROM FINANCING ACTIVITIES
Proceeds from borrowings from WA Treasury Corporation 2,830 3,836 2,830 3,836 Repayment of borrowings to WA Treasury Corporation - - - - Repayment of Borrowings to Department of Education - (50) - - Repayment of Lease Liabilities - - - - Net cash provided by / (used in) financing activities 2,830 3,786 2,830 3,836 Net increase/(decrease) in cash held 2,482 (875) 2,208 (841) Cash assets at the beginning of the financial year 8,608 9,480 8,114 8,955 Effect of exchange rate change on tax (29) 3 - - Cash and cash equivalents at end of year 23(a) 11,061 8,608 10,322 8,114
The accompanying notes form part of these financial statements.

EDITH COWAN UNIVERSITY Notes to the Financial Statements
for the Year Ended 31 December 2005
8
TABLE OF CONTENTS
Note Contents
1 University Organisation 2 Significant Accounting Policies 3 The impact of adopting International Accounting Standards 4 Revenue from Ordinary Activities 5 Expenses from Ordinary Activities 6 Gain on Sale of Assets 7 Remuneration of Members of the Accountable Authority and Senior Officers 8 Remuneration of Auditors 9 Income Tax 10 Receivables 11 Inventories 12 Other Non-financial Assets 13 Other Financial Assets 14 Property, Plant, Equipment and Vehicles 15 Investment Property 16 Intangibles 17 Payables 18 Interest-Bearing Liabilities 19 Provisions 20 Other Liabilities 21 Reserves 22 Equity 23 Notes to the Cash Flow Statement 24 Commitments for Expenditure 25 Contingent Liabilities 26 Superannuation 27 Subsidiaries 28 Interests in Joint Ventures 29 Explanatory Statement 30 Events Occurring After Reporting Date 31 Disaggregation Information 32 Restricted Cash 33 Financial Instruments 34 Write-Offs 35 Reconciliation Explaining the Transition to Australian Equivalents to the International Financial Reporting Standards 36 Acquittal of Commonwealth Government Financial Assistance
EDITH COWAN UNIVERSITY Notes to the Financial Statements
for the Year Ended 31 December 2005
9
1 UNIVERSITY ORGANISATION Edith Cowan University (the University) is a Statutory Authority of the Government of Western Australia and is domiciled in Australia. The address of its registered office is 100 Joondalup Drive, Joondalup, Western Australia. The University is a public not-for-profit institution of higher education funded primarily through Commonwealth grant funding. Established in 1902 when it began as a teaching college, the University gained university status in 1991 and is the second largest university in Western Australia, with approximately 23,000 students. Its principal activities cover teaching, learning and research. The University Council is the governing body which controls and manages the operation, affairs, concerns and property of the University. 2 SIGNIFICANT ACCOUNTING POLICIES The following accounting policies have been adopted in the preparation of the financial statements. These policies have been consistently applied to all the years presented, unless otherwise stated. General statement
The financial statements constitute a general purpose financial report which has been prepared in accordance with Australian Accounting Standards, Statements of Accounting Concepts and other authoritative pronouncements of the Australian Accounting Standards Board, and Urgent Issues Group (UIG) Consensus Views as applied by the Treasurer's Instructions. Several of these are modified by the Treasurer's Instructions to vary the application, disclosure, format and wording. The Financial Administration and Audit Act 1985 and the Treasurer's Instructions are legislative provisions governing the preparation of financial statements and take precedence over Australian Accounting Standards, Statements of Accounting Concepts and other authoritative pronouncements of the Australian Accounting Standards Board, and UIG Consensus Views. The modifications are intended to fulfil the requirements of general application to the public sector, together with the need for greater disclosure and also to satisfy accountability requirements. If any such modification has a material or significant financial effect upon the reported results, details of that modification and where practicable, the resulting financial effect, are disclosed in individual notes to these financial statements. Reporting Entity The reporting entity is Edith Cowan University and its controlled entity; ECU Resources for Learning Ltd. Control is taken to exist where:
• the entity is accountable to the University; • the University has a residual financial interest in the
net assets of the entity; and • the University has the power to govern the financial
and operating policies of an entity so as to obtain benefits from its activities.
Specific details of controlled entities appear in note 27.
Basis of Preparation
The financial report has been prepared in accordance with applicable Australian Accounting Standards which includes Australian equivalents to International Financial Reporting Standards, Urgent Issues Group Interpretations and other authoritative pronouncements of the Australian Accounting Standards Board. The Balance Sheet and Income Statement have been prepared on an accrual basis and are in accordance with historical cost convention, modified by the revaluation of land and buildings which have been measured at fair value. The accounting policies applied in the preparation of the financial statements have been consistently applied throughout all periods presented except that AASB 132 and AASB 139 have been applied from 1 January 2005, with the option provided by AASB 1 paragraph 36A. Assets and liabilities are recognised in the Balance Sheet when, and only when, it is probable that future economic benefits will flow and the amounts of the assets or liabilities can be reliably measured. Contingent liabilities and contingent assets are not recognised in the Balance Sheet, but are discussed in the relevant Notes to the Financial Statements. They may arise from uncertainty as to the existence of a liability or asset, or represent an existing liability or asset in respect of which settlement is not probable or the amount cannot be reliably measured. Where settlement becomes probable, a liability or asset is recognised. The consolidated financial report is presented in Australian dollars and all amounts are rounded to the nearest thousand dollars ($’000). The judgements that have been made in the process of applying accounting policies that have the most significant effect on the amounts recognised in the financial report are included at note 4. The key assumptions made concerning the future, and other key sources of estimation uncertainty at the reporting date that have a significant risk of causing a material adjustment to the carrying amounts of assets and liabilities within the next financial year, are included at note 5.
Basis of Accounting The consolidated financial statements have been prepared on the accrual basis of accounting using the historical cost convention, except for certain assets and liabilities which, as noted are measured at fair value. (a) Principles of consolidation
Subsidiary The consolidated financial statements incorporate the financial statements of Edith Cowan University (the parent entity) and entities controlled by the University (its subsidiary) made up to 31 December each year. Control is achieved where the University has the power to govern the financial and operating policies of an investee entity so as to obtain benefits from its activities. A list of controlled entities appears in note 27. Consistent accounting policies have been employed in the preparation and presentation of the consolidated financial statements.

EDITH COWAN UNIVERSITY Notes to the Financial Statements
for the Year Ended 31 December 2005
10
The consolidated financial statements include the information and results of each controlled entity from the date on which the University obtains control and until such time as the University ceases to control such entities. Inter-company transactions, balances and unrealised gains on transactions between the University and controlled entities are eliminated in full on consolidation. Unrealised losses are also eliminated unless the transaction provides evidence of an impairment of the asset transferred. Accounting policies of the subsidiary have been changed on consolidation where necessary to ensure consistency with the accounting policies adopted by the University. (b) Grants and other Contributions
Government Grants Grant contributions from the Commonwealth Government and Western Australia State Government for financial assistance for operational purposes are recognised as revenue when the University obtains control over the asset comprising the contributions. When the University does not have control of the contribution or does not have the right to receive the contribution or has not fulfilled grant conditions, the grant contribution is treated as deferred income. Grant contributions from the Commonwealth Government and Western Australia State Government for financial assistance for the acquisition of non-current assets are recognised as revenue when the University obtains control over the asset comprising the contributions. When the University does not have control of the contribution or does not have the right to receive the contribution or has not fulfilled grant conditions, the grant contribution is treated as deferred income. Sponsored Research Research funds provide the opportunity for graduate and undergraduate students to work with the faculty in research as part of their educational experience. Research grant contributions from various sources of sponsored research, including corporations, foundations, Commonwealth, State and local governments and research institutes are recognised as revenue when the University obtains control over the asset comprising the contributions. When the University does not have control of the contribution or does not have the right to receive the contribution or has not fulfilled grant conditions, the grant contribution is treated as deferred income. Donations Donations, gifts and other non-reciprocal contributions are recognised as revenue when the University obtains control over the assets comprising the contributions. Control is normally obtained upon their receipt. Endowment and Bequest Contributions The University receives restricted funds from donors who wish to fund specific programs or initiatives in the University. Endowments and bequests are invested to create a source of income which is used for scholarships, research, prizes and special lecture programs. Endowment contributions are recognised as revenue when the University obtains control over the assets comprising the contributions. Control is normally obtained upon their receipt. (c) Revenue Recognition
Revenue is measured at the fair value of the consideration received or receivable and represents amounts receivable for goods and services provided in the normal course of business,
net of discounts and Goods and Services Taxes (GST). Revenue is recognised as follows:
Sale of Goods Revenue from sales of goods and disposal of other assets is recognised when goods are delivered and title has passed. Fees and Charges Revenue from fees and charges is recognised in the accounting period in which the services are rendered, by reference to completion of the specific transaction assessed on the basis of the actual service provided as a proportion of the total services to be provided. Revenue from students studying at the English language centre (ELICOS), is recognised on a cash basis. This is because students who have been offered an ELICOS course are issued with an invoice; payment of the invoice is a condition of acceptance. Interest Income Interest income is accrued on a time-proportion basis, by reference to the principal outstanding and at the effective interest rate applicable. Parking and Library Fines Revenue from parking and library fines is recognised on a cash basis, as the purpose of the fine is to act as a deterrent not strictly for raising revenue. Non-payment of these fines are not actively pursued. Royalty, Trademark and Licences Income Royalties, trademark and licences income is recognised on an accrual basis in accordance with the substance of the relevant agreements. Gains Gains may be realised or unrealised. Realised gains are determined on a net basis as the difference between the sale proceeds received or receivable and the carrying amount of the non-current asset. Unrealised gains are determined on a net basis as the difference between the fair value and the carrying amount of an asset. The policies adopted for the recognition of significant categories of gains are as follows: Realised gains on disposal of non-current assets Gains arising on the disposal or retirement of a non-current asset are recognised when control of the asset and the significant risks and rewards of ownership have passed to the buyer. Net gains are included in revenue for the period in which they arise. Unrealised gains associated with investment property at fair value Gains arising from changes in the fair value of an investment property are included in revenue for the period in which they arise. (d) Expense Recognition
Expenses are recognised when incurred and are reported in the year to which they relate. The policies adopted for the recognition of significant categories of expenses are as follows: Depreciation, amortisation and impairment losses Depreciation of non-financial physical assets (excluding inventories) is provided on a straight-line basis at rates based on the expected useful lives of those assets. The expected

EDITH COWAN UNIVERSITY Notes to the Financial Statements
for the Year Ended 31 December 2005
11
useful lives for each class of depreciable asset are provided under property, plant and equipment. Amortisation is provided on leasehold improvements, intangible assets and on assets held under finance leases and is calculated on a straight-line basis, generally over the expected useful lives on the same basis as owned assets. Impairment losses are recognised as an expense when an asset’s carrying amount exceeds its recoverable amount (unless it is related to a re-valued assets where the value changes are recognised directly in equity). Superannuation expense The University receives Commonwealth Government superannuation supplementary funding for employer contributions of the Pension Scheme and Gold State Superannuation (GSS). These contributions where paid to state-administered GESB during the year. The University also receives Commonwealth Government general operating funding for employer contributions of the various UniSuper superannuation plans. The University includes the following elements in calculating a superannuation expense: (a) Defined benefit plan – change in the unfunded employer’s
liability in respect of current employees who are members of the Pension Scheme and current employees who accrued a benefit on transfer from that Scheme to the Gold State Superannuation Scheme; and
(b) Defined benefit plan – emerging cost in respect of current employees who are members of the Pension Scheme and current employees who accrued a benefit on transfer from that Scheme to the Gold State Superannuation Scheme; and
(c) Defined contribution plan – employer contributions paid to the Gold State Superannuation Scheme and all of the Unisuper superannuation plans.
A revenue ‘Superannuation – deferred government contributions’ equivalent to (b) is recognised under Revenue in the Income Statement as emerging cost superannuation for which they are fully recouped by the Commonwealth superannuation supplementary grant.
(d) Property, Plant and Equipment
Land and buildings held for use in the production or supply of goods or services, for investment, and for administrative purposes, are stated in the Balance Sheet at their revalued amounts, being the fair value at the date of revaluation, determined from market-based evidence by appraisal undertaken by independent professional valuers, less any subsequent accumulated depreciation and subsequent accumulated recoverable amount write-down. Revaluations are performed with sufficient regularity such that the carrying amount does not differ materially from that which would be determined using fair values at the reporting date. Any revaluation increase arising on the revaluation of such land and buildings is credited to the asset revaluation reserve, except to the extent that it reverses a revaluation decrease for the same asset class previously recognised as an expense, in which case the increase is credited to the Income Statement to the extent of the decrease previously charged on a asset class basis. A decrease in carrying amount arising on the revaluation of such land and buildings is charged as an expense to the extent that it exceeds the balance, if any, held in the asset revaluation reserve relating to a previous revaluation of that asset class. Depreciation on revalued assets is charged to the Income Statement. On the subsequent sale or retirement of a revalued
asset, the attributable revaluation surplus remaining in the asset revaluation reserve is transferred directly to the Income Statement. Properties in the course of construction for production, rental or administrative purposes, or for purposes not yet determined, are carried at cost, less any recognised recoverable amount write-down. Cost includes professional fees and, for qualifying assets, borrowing costs are capitalised. Depreciation of these assets, on the same basis as other property assets, commences when the assets are ready for their intended use. Fixtures and computer equipment are stated at cost less accumulated depreciation and any recognised recoverable amount write-down. Purchases of fixtures and computer equipment which individually cost less than $5,000 are expensed in the Income Statement in the year of acquisition. Depreciation is charged so as to write off the cost or valuation of assets, other than land and properties under construction, over their useful lives, using the straight-line method. Expected useful lives for each class of depreciable asset are: Asset Category Life Land Not depreciated Buildings 50 years Computing equipment 4 years Other equipment & furniture 6 years Motor vehicles 6 years Leased Motor vehicles 6 years Art Works Not depreciated Library Collections Depreciated at 100% in the fourth year after acquisition Assets held under finance leases are depreciated over their expected useful lives on the same basis as owned assets or, where shorter, over the term of the relevant lease. Library Collections are stated at cost of the last three years’ acquisition of library books. In each year, that year’s cost of acquisition is added to the carrying value and the earliest year’s cost of acquisition within the carrying value is written off. Works of art are classified as heritage assets. These artefacts are protected and preserved for public exhibition, education, research and the furtherance of public service. They are neither disposed of for financial gain nor encumbered in any manner. Accordingly, such collections are capitalised, irrespective of value and are not depreciated as it is anticipated that they have indefinite useful lives. Their service potential has not, in any material sense, been consumed during the reporting period. Investment Property Investment property comprises land and buildings which are held to earn rentals and/or capital appreciation Initial recognition and measurement Investment property assets are initially recognised at cost. Subsequent measurement after recognition After recognition, the University uses the revaluation model for measurement of investment land and buildings. Land and buildings are carried at fair value and no depreciation is provided in respect of freehold land and building. The fair value of land has been determined on a continuing basis, determined from market-based evidence. Revaluations are performed with sufficient regularity such that the carrying amount does not differ materially from that which would be determined using fair values at the reporting date. The last revaluation of investment land and buildings was conducted in December 2004 by an independent professional valuer.

EDITH COWAN UNIVERSITY Notes to the Financial Statements
for the Year Ended 31 December 2005
12
The gain arising from changes in the fair value of the investment property are included in the income statement for the period in which they arise. (e) Leases
Leases are classified as finance leases whenever the terms of the lease transfer substantially all the risks and rewards of ownership to the lessee. All other leases are classified as operating leases. Assets held under finance leases are recognised as assets of the University at their fair value or, if lower, at the present value of the minimum lease payments, each determined at the inception of the lease. The corresponding liability to the lessor is included in the Balance Sheet as a finance lease obligation. Lease payments are apportioned between finance charges and reduction of the lease obligation so as to achieve a constant rate of interest on the remaining balance of the liability. Finance charges are charged directly against income, unless they are directly attributable to qualifying assets, in which case they are capitalised. Rentals payable under operating leases are charged to expense on a straight-line basis over the term of the relevant lease. (f) Impairment
The University is required to assess property, plant and equipment and intangible assets for any indication of impairment at each reporting date. Where there is an indication of impairment, the recoverable amount must be estimated. As the University is a not-for-profit entity, unless an asset has been identified as surplus asset, AASB 136 prescribes the recoverable amount is the higher of an asset’s fair value less selling costs and depreciated replacement cost. Consequently, the risk of impairment is generally limited to circumstances where an asset’s depreciation is materially understated or where the replacement cost is falling. The University reviews each relevant class of assets annually to verify that the accumulated depreciation/amortisation reflects the level of consumption or expiration of asset’s future economic benefits and to evaluate any impairment risk from falling replacement costs. For assets identified as surplus assets, the recoverable amount is the higher of fair value less selling costs and the present value of future cash flows expected to be derived from the asset. (g) Cash
For the purposes of the Cashflow Statement, cash includes cash assets and restricted cash assets. These include short-term deposits that are readily convertible to cash on hand and are subject to insignificant risk of changes in value. (h) Restricted Cash
Endowment and bequest funds are classified as restricted cash assets. Endowment and bequest funds have been received from benefactors who, by the terms of their conveying instruments, have stipulated that the use of funds is limited in future years to the purposes designated by the benefactors. (i) Inventories
Inventories are valued at the lower of cost and net realisable value. Cost comprises direct materials and where applicable,
import duties, transport and handling costs that have been incurred to bring the inventories to their present location and condition. Cost is calculated using the weighted average method. Net realisable value represents the estimated selling price less all estimated costs of completion and costs to be incurred in marketing, selling and distribution. (j) Receivables
Accounts receivable include amounts due from students for tuition fees, housing and other enrolment related services and reimbursements due from sponsors of externally funded research. Accounts receivables are recognised at the amounts receivable as they are due for settlement no more than 30 days from the date of recognition. Accounts receivables do not carry any interest and are stated at their nominal value as reduced by appropriate allowances for estimated irrecoverable amounts. (k) Intangibles
The University’s intangibles comprise externally acquired software for internal use and have been customised by ECU. These assets are carried at cost. Software is amortised on a straight-line basis over its anticipated useful life. The useful life of the University’s currently amortised software is 5 years. (l) Other financial assets
Investments are recorded at their fair value. In the case of Investments that represent shares held in publicly listed companies – the fair value is measured at balance date as the last sale price quoted on the Australian Stock Exchange. (m) Payables
Payables, including accruals not yet billed, are recognised when the University becomes obliged to make future payments as a result of a purchase of assets or services. Accounts payable are not interest bearing and are stated at their nominal value. (n) Interest bearing liabilities
Interest-bearing loans and overdrafts are recorded as the proceeds received, net of direct issued costs. Finance charges, including premiums payable on settlement or redemption and direct issue costs, are accounted for on an accrual basis using the effective interest method and are added to the carrying amount of the instrument to the extent that they are not settled in the period in which they arise. (o) Employee Benefits
Annual Leave The liability for annual leave that will fall due within 12 months after the end of the reporting date is recognised in the provision for employee benefits and is measured at the undiscounted amounts expected to be paid. The liability for annual leave that will fall due more than 12 months after the end of the reporting date is recognised in the provision for employee benefits and is measured at the present value of amounts expected to be paid in the future in respect of services provided by employees up to the reporting date. Consideration is given, when assessing expected future payments, to expected future wage and salary levels including superannuation on-costs. Expected future payments are discounted using market yields at the reporting date on national government bonds with terms to maturity that match, as closely as possible, the estimated future cash flows.

EDITH COWAN UNIVERSITY Notes to the Financial Statements
for the Year Ended 31 December 2005
13
Long Service Leave The liability for long service leave that will fall due within 12 months after the end of the reporting date is recognised in the provision for employee benefits and is measured at the undiscounted amounts expected to be paid. The liability for long service leave that will fall due more than 12 months after the end of the reporting date is recognised in the provision for employee benefits and is measured at the present value of amounts expected to be paid in the future in respect of services provided by employees up to the reporting date. Consideration is given, when assessing expected future payments, to expected future wage and salary levels including superannuation on-costs. Expected future payments are discounted using market yields at the reporting date on national government bonds with terms to maturity that match, as closely as possible, the estimated future cash flows.
Leave benefits are calculated at remuneration rates expected to be paid when liabilities are settled. A liability for long service leave is recognised after an employee has completed four years of service. An actuarial assessment of long service leave undertaken in-house in 2005 and determined that the liability measured using the short-hand method was not materially different from the liability measured using the present value of expected future payments.
All unconditional long service leave is classified as a current liability. Provisions - Other Employee On-Costs Employee on-costs, including workers’ compensation insurance and payroll tax, are not employee benefits and are recognised as liabilities and expenses when the employee benefits to which they relate has occurred. Employee on-costs are not included as part of the University’s ‘Employee benefits expense’ and the related liability is included in Employee on-costs provision. Other Compensated Absences Employees accrue and accumulate sick leave and study leave in accordance with University policies. It is the policy of the University to recognise the cost of sick leave and study leave when paid. Employees who leave University employment are not entitled to be paid for accrued sick leave or study leave. Therefore, no liability is shown in the financial statements. Superannuation The University contributes to the GESB Pension Scheme, GESB Gold State Superannuation Scheme and various UniSuper superannuation schemes on behalf of its employees. The contributions made to these schemes by the University, and emerging costs from unfunded schemes, are expensed in the Income Statement. Refer to Note 26 for details relating to the individual schemes. GESB Scheme Information Pension Scheme members receive pension benefits on retirement, death or invalidity. The Fund Share of the pension benefit, which is based on the member’s contributions plus investment earnings, may be commuted to a lump sum benefit. The State Share of the pension benefit, which is employer-financed, cannot be commuted to a lump sum benefit. Some former Pension Scheme members have transferred to the Gold State Scheme. In respect of their transferred benefit the members receive a lump sum benefit at retirement, death or invalidity which is related to their salary during their employment and indexed during any deferral period after leaving public sector employment.
(p) Foreign currency translation and Hedges
Transactions in currencies other than Australian dollars are recorded at the rates of exchange prevailing on the dates of the transactions. At each reporting date, monetary assets and liabilities that are denominated in foreign currencies are retranslated at the rates prevailing on the reporting date. Non-monetary assets and liabilities carried at fair value that are denominated in foreign currencies are translated at the rates prevailing at the date when the fair value was determined. Gains and losses arising on retranslation are included in the Income Statement for the period. In order to hedge its exposure to certain foreign exchange risks, the University enters into forward contracts and options. (q) Joint ventures Joint Venture Operations The University participates in a number of joint venture operations. The University uses its own property, plant and equipment and incurs its own expenses and liabilities. The joint venture agreements provide that venturers will fund the costs of the joint venture in specific proportions and the revenue generated from the activity is pooled and distributed based on the level of contribution by each venturer. Joint Venture Entities The University has no material interest in joint venture entities and does not include any amounts in the financial statements for its interest in joint venture entities. (r) Disaggregation Information
The University has determined reportable segment information on the basis of business segments and geographical segments. A business segment is a group of assets and operations engaged in providing products or services that are subject to risks and returns that are different from those of other business segments. A geographic segment is engaged in providing services within a particular economic environment that are subject to risks and returns that are different from those of segments operating in other economic environments. The University and its subsidiary have two reportable business segments consisting of higher education and technical and further education (TAFE). The higher education segment is an aggregation of operations that deliver progressive university degree programs for the modern workplace and focus on the service professions. The TAFE segment primarily delivers nationally accredited flexible training solutions designed to meet the varied needs of businesses and individuals activities. Geographically, these activities are conducted and operated predominantly in Australia. Off-shore activities are analysed as a separate geographical segment. Segment revenues, expenses, assets and liabilities are allocated to business and geographic segments on the basis of direct attribution and reasonable estimates of usage. Income tax has not been included in assets and liabilities. (s) Special reserves
The special reserve represents restricted funds, whose use is limited in future years to the purposes designated by the benefactors, donors or sponsors such as research financial assistance, scholarships and capital equipment replacement. No funds are currently held in special reserves at the reporting date.

EDITH COWAN UNIVERSITY Notes to the Financial Statements
for the Year Ended 31 December 2005
14
(t) Taxation
The controlled entity, E.C.U. Resources for Learning Ltd. (ECURL) trading as Steps Professional Development, is subject to income tax in Australia under the Income Tax Assessment Act 1997. Authority has been granted to ECURL to adopt a calendar tax year. The overseas branches are subject to income tax relating to income and expenditure items attributable to permanent establishments in the UK and the US. The taxation expense represents the sum of tax currently payable and is measured at 31 December each year. Taxable profit differs from net profit as reported in the Income Statement because it excludes items of income or expense that are taxable or deductible in other years and it further excludes items that are never taxable or deductible. The liability for current tax is calculated using tax rates that have been enacted by the reporting date. (u) Deferred Tax
The University adopts an income statement liability method to account for expected income tax consequences inherent in the financial statements. The provision for deferred income tax liability and the deferred tax assets includes the tax effect (at current tax rates) of differences between income and expense items recognised in different accounting periods for book and tax purposes. The benefit arising from estimated carry-forward tax losses, has also been recorded as a deferred tax asset only where realisation of the asset is considered to be virtually certain. The carrying amount of deferred tax assets is reviewed at each reporting date and reduced to the extent that it is no longer virtually certain that sufficient taxable profits will be available to allow all or part of the asset to be recovered. (v) Comparative figures
Comparative figures have been restated on the AIFRS basis except for financial instruments information which has been prepared under the previous AGAAP Accounting Standard AAS 33 as permitted by AASB 1.36A. The transition to AIFRS for data prepared under AASB 132 and AASB 139 will be 1 January 2005. (w) Rounding
Amounts in the financial statements have been rounded to the nearest thousand dollars.
3 THE IMPACT OF ADOPTING INTERNATIONAL ACCOUNTING STANDARDS This is the University’s first financial statements prepared under Australian equivalents to International Financial Reporting Standards (AIFRS). The University has adopted AASB 1 First-time Adoption of Australian Equivalents to International Financial Reporting Standards (AIFRS) for application to reporting periods beginning on 1 January 2005. Until 31 December 2004, the financial statements of the University had been prepared under the previous Australian Generally Accepted Accounting Principles (AGAAP). The Australian Accounting Standards Board (AASB) adopted the Standards of the International Accounting Standards Board (IASB) for application to reporting periods beginning on or after 1 January 2005 by issuing AIFRS which comprises a framework for the Preparation and Presentation of Financial Statements, Accounting Standards and the Urgent Issues Group (UIG) Interpretations. The first financial report has been prepared as if the new standards always applied. All changes in the accounting policies under AIFRS have been made in accordance with the transitional provisions in the respective standards. All standards adopted by the Government require retrospective application except, the following: AASB 132 Financial Instruments: Disclosure and Presentation AASB 139 Financial Instruments: Recognition & Measurement In accordance with the options provided by AASB 1 paragraph 36A, financial instrument information prepared under AASB 132 and AASB 139 will apply from 1 January 2005 and consequently, comparative information for financial instruments is presented on the previous AGAAP basis. All other comparative information is prepared under the AIFRS basis. Reconciliations explaining the transition to AIFRS as at 1 January 2004 and 31 December 2004 are included in note 35. Information in accordance with AASB 104 ‘Disclosing the Impacts of Adopting Australian Equivalents to International Financial Reporting Standards’ was presented in the published financial report for the year ended 31 December 2004.
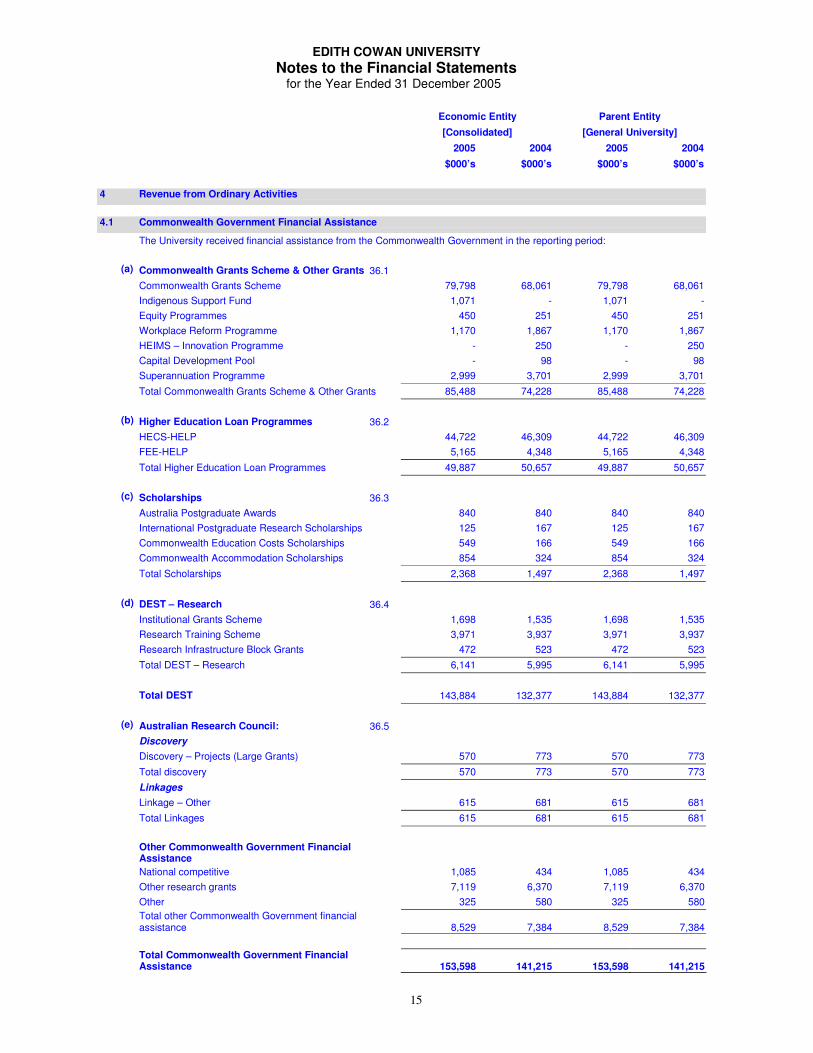
EDITH COWAN UNIVERSITY Notes to the Financial Statements
for the Year Ended 31 December 2005
15
Economic Entity Parent Entity
[Consolidated] [General University]
2005 2004 2005 2004
$000’s $000’s $000’s $000’s
4 Revenue from Ordinary Activities
4.1 Commonwealth Government Financial Assistance
The University received financial assistance from the Commonwealth Government in the reporting period:
(a) Commonwealth Grants Scheme & Other Grants 36.1 Commonwealth Grants Scheme 79,798 68,061 79,798 68,061 Indigenous Support Fund 1,071 - 1,071 - Equity Programmes 450 251 450 251 Workplace Reform Programme 1,170 1,867 1,170 1,867 HEIMS – Innovation Programme - 250 - 250 Capital Development Pool - 98 - 98 Superannuation Programme 2,999 3,701 2,999 3,701 Total Commonwealth Grants Scheme & Other Grants 85,488 74,228 85,488 74,228
(b) Higher Education Loan Programmes 36.2 HECS-HELP 44,722 46,309 44,722 46,309 FEE-HELP 5,165 4,348 5,165 4,348 Total Higher Education Loan Programmes 49,887 50,657 49,887 50,657
(c) Scholarships 36.3 Australia Postgraduate Awards 840 840 840 840 International Postgraduate Research Scholarships 125 167 125 167 Commonwealth Education Costs Scholarships 549 166 549 166 Commonwealth Accommodation Scholarships 854 324 854 324 Total Scholarships 2,368 1,497 2,368 1,497
(d) DEST – Research 36.4 Institutional Grants Scheme 1,698 1,535 1,698 1,535 Research Training Scheme 3,971 3,937 3,971 3,937 Research Infrastructure Block Grants 472 523 472 523 Total DEST – Research 6,141 5,995 6,141 5,995 Total DEST 143,884 132,377 143,884 132,377
(e) Australian Research Council: 36.5 Discovery Discovery – Projects (Large Grants) 570 773 570 773 Total discovery 570 773 570 773 Linkages Linkage – Other 615 681 615 681
Total Linkages 615 681 615 681 Other Commonwealth Government Financial
Assistance
National competitive 1,085 434 1,085 434 Other research grants 7,119 6,370 7,119 6,370 Other 325 580 325 580 Total other Commonwealth Government financial assistance 8,529 7,384 8,529 7,384
Total Commonwealth Government Financial Assistance 153,598 141,215 153,598 141,215

EDITH COWAN UNIVERSITY Notes to the Financial Statements
for the Year Ended 31 December 2005
16
Economic Entity Parent Entity
[Consolidated] [General University]
2005 2004 2005 2004
$000’s $000’s $000’s $000’s
4.1 Commonwealth Government Financial Assistance (continued)
Reconciliation Australian Government grants income 103,711 90,558 103,711 90,558 HECS-HELP – Australian Government payments 44,722 46,309 44,722 46,309 Other Australian Government loan programmes (FEE-HELP) 5,165 4,348 5,165 4,348
Total Australian Government financial assistance 153,598 141,215 153,598 141,215
4.2 Western Australian Government and Local Government Financial Assistance
Western Australian Government financial assistance for the following purposes was received by the University during the reporting period:
WAAPA¹ @ ECU 6,996 6,740 6,996 6,740 Department of Education and Training - 150 - 150 Department of Education Services Grant (a)(b) - 57,728 - 57,728 Other 28 130 28 130
Total Western Australian Government Financial Assistance 7,024 64,748 7,024 64,748
¹ Western Australian Academy of Performing Arts
(a) During 2004 the University received a Grant of $57.728m from the WA Department of Education Services to enable the University to acquire the freehold title to its existing campus at Pearson Street, Churchlands. The proceeds of this Grant were fully acquitted by transferring the funds to the WA Department of Planning and Infrastructure, to acquire the title
[b] As per UIG 11 Abstract “Accounting for contributions of, or contributions for the acquisition of, non-current assets”, the University has reported this Grant as revenue when received.
4.3 Fees and Charges
Fees and charges were collected from the following sources during the reporting period:
Course fees and charges Continuing education 2,959 3,402 2,959 3,402 Fee-paying overseas students 33,984 27,831 33,984 27,831 Fee-paying domestic postgraduate students 3,369 2,334 3,369 2,334 Fee-paying domestic undergraduate students 706 908 706 908 Fee-paying domestic non-award students 376 69 376 69 Charges for student accommodation 1,535 1,533 1,535 1,533 Total course fees and charges 42,929 36,077 42,929 36,077 Other fees and charges Rental charges 1,089 1,182 1,089 1,182 Seminar and workshop fees 685 580 685 580 Registration fees 1 24 1 24 Examination fees 16 17 16 17 Photocopying fees 457 486 457 486 Library fines 27 197 27 197 Late fees 268 151 268 151 Parking fees 1,059 1,484 1,059 1,484 Student amenities and service fees 1,284 1,590 1,284 1,590 All other 1,884 2,143 1,884 2,143 Total other fees and charges 6,770 7,854 6,770 7,854 Total Fees and Charges 49,699 43,931 49,699 43,931

EDITH COWAN UNIVERSITY Notes to the Financial Statements
for the Year Ended 31 December 2005
17
Economic Entity Parent Entity
[Consolidated] [General University]
2005 2004 2005 2004
$000’s $000’s $000’s $000’s
4.4 Investment Income Interest from current account 412 317 390 297 Interest from bank bills 1,212 721 1,212 721 Dividends Received 34 - 34 - Total investment income 1,658 1,038 1,636 1,018
4.5 Royalties, Trademarks and Licences Royalties 6,028 5,309 4,600 4,244
4.6 Consultancy and Contracts Research Consultancy 873 1,216 818 1,058 Contract Research 1,413 - 1,413 - Total consultancy and contracts 2,286 1,216 2,231 1,058
4.7 Other Revenue Sale of publications 23 60 23 60 Donations, bequests and scholarships 262 407 262 407 Prizes, contributions and sponsorships 312 87 312 87 Commissions and rebates received 326 305 326 305 Expense recoups 148 141 148 141 Insurance claims 34 16 34 16 Other 2,259 3,981 663 1,722 Total Other Revenue 3,364 4,997 1,768 2,738

EDITH COWAN UNIVERSITY Notes to the Financial Statements
for the Year Ended 31 December 2005
18
Economic Entity Parent Entity
[Consolidated] [General University]
2005 2004 2005 2004
$000’s $000’s $000’s $000’s
5 Expenses from Ordinary Activities 5.1 Employee Benefits and on costs Employee Benefits Academic Salaries 55,444 51,429 55,444 51,429 Contributions to superannuation and pension schemes: • Emerging cost 2,653 2,875 2,653 2,875 • Funded 7,846 7,174 7,846 7,174 Long service leave expense 997 1,594 997 1,594 Annual Leave 1 55 1 55 Other 1,167 1,300 1,167 1,300 Total academic 68,108 64,427 68,108 64,427 Non-academic Salaries 57,973 52,352 56,708 50,791 Contributions to superannuation and pension schemes: • Emerging cost 1,144 975 1,033 781 • Funded 7,770 7,112 7,770 7,112 Long service leave expense 1,721 1,702 1,707 1,699 Annual leave (136) 55 (151) 50 Other 326 286 312 281 Total non-academic 68,798 62,482 67,379 60,714 Total employee benefits 136,906 126,909 135,487 125,141 Employee on costs Academic Payroll tax 3,669 3,588 3,669 3,588 Workers’ compensation 446 420 446 420 Total academic 4,115 4,008 4,115 4,008 Non-academic Payroll tax 3,774 3,644 3,710 3,570 Workers’ compensation 454 418 454 418 Total non-academic 4,228 4,062 4,164 3,988 Total employee on costs 8,343 8,070 8,279 7,996
Total academic & non-academic employee benefits & on costs 145,249 134,979 143,766 133,137
Deferred employee benefits for superannuation 26(2) 1,008 4,188 1,008 4,188 Total employee benefits & on costs 146,257 139,167 144,774 137,325

EDITH COWAN UNIVERSITY Notes to the Financial Statements
for the Year Ended 31 December 2005
19
Economic Entity Parent Entity
[Consolidated] [General University]
2005 2004 2005 2004
$000’s $000’s $000’s $000’s
5.2 Depreciation and Amortisation Expense
Depreciation Buildings 7,553 8,299 7,553 8,299 Leasehold improvements 270 110 257 107 Computing equipment 1,935 1,124 1,914 1,099 Other equipment and furniture 2,467 2,358 2,454 2,349 Motor vehicles 124 146 121 142 Library collections 2,038 1,732 2,038 1,732 Total Depreciation Expense 14,387 13,769 14,337 13,728 Amortisation Intangible assets 1,568 829 1,568 829 Total Amortisation Expense 1,568 829 1,568 829 Total Depreciation and Amortisation Expense 15,955 14,598 15,905 14,557
5.3 Repairs and Maintenance Buildings maintenance 4,849 3,928 4,849 3,928 Grounds maintenance 524 907 524 907 Other 1,190 1,776 1,190 1,776 Total Buildings and Grounds 6,563 6,611 6,563 6,611
5.4 Bad and Doubtful Debts Bad debts written off directly 128 12 128 12 Bad debts provided for 643 420 643 420 Total Bad and Doubtful Debts 771 432 771 432
5.5 Borrowing Costs Expense Interest paid 1,267 1,007 1,267 1,007 Unwinding of discounts applied to provisions - 15 - 15 Total Finance Costs 1,267 1,022 1,267 1,022
5.6 Other Expenses Student related expenditure 7,368 6,541 7,368 6,541 Telecommunications 1,612 1,493 1,590 1,466 Non-capitalised equipment 5,852 10,816 5,852 10,816 Computer Software 6,293 5,086 6,293 5,086 Travel, staff development & entertainment 7,053 6,808 6,781 6,487 Operating lease rental expenses 954 1,006 941 1,000 Professional and consulting fees 9,736 9,726 9,409 9,433 General Consumables 2,928 1,852 2,407 1,852 Stationery and materials 3,979 4,568 3,979 3,965 Electricity, gas and rates 3,368 3,230 3,231 3,230 Advertising and marketing 4,036 3,138 3,874 2,967 Asset write-offs during the year 67 83 67 80 Other 4,382 4,395 4,189 3,905 Total Other Expenses 57,628 58,742 55,981 56,828

EDITH COWAN UNIVERSITY Notes to the Financial Statements
for the Year Ended 31 December 2005
20
Economic Entity Parent Entity
[Consolidated] [General University]
2005 2004 2005 2004
$000’s $000’s $000’s $000’s
6 Gains 6.1 Gains on disposal of non-current assets Proceeds from sale Property, plant & equipment 14,306 229 14,306 229 Carrying amount of assets sold Property, plant & equipment (189) (45) (189) (45) Net realised gain on disposal of non-current assets 14,117 184 14,117 184 6.2 Gain on revaluation of investment property Investment Property – Collier Pass, Joondalup 1,124 1,761 1,124 1,761
Net unrealised gain on revaluation of investment property
1,124 1,761 1,124 1,761
During the year ended 31 December 2005 $823,848 was recognised as rental income and $303,088 was recognised as rental expenditure in the Income Statement.
7 Remuneration of Members of the Accountable Authority and Senior Officers
7.1 Remuneration of Members of the Accountable Authority
Names of Persons who were members of the Accountable Authority For the purposes of the Financial Administration and Audit Act 1985, the University Council, is the Accountable Authority of the University.
The University’s council members are:
The Hon. Hendy Cowan (Chancellor) (term 3yrs end 1/3/07,external appt) Mrs Danielle Blain (Pro-Chancellor) (term 2yrs 3 mths end 23/10/06, external appt) Prof Millicent Poole (Vice-Chancellor, retired December 2005) Mr Stephen Abbott (term 3yrs ending 29/8/08, external appt) Professor Peter Thompson AM (term 3yrs end 9/10/06, co-option appt) Ms Jennifer Ballantyne (term 2yrs end 24/6/07, co-option appt) Mr Serge Walberg (term 3yrs end 20/9/07, external (alumni) appt) Mr Neil Douglas (term 2yrs 3mths end 1/3/06, external appt) Professor Ron Oliver (term 3yrs end 1/10/06, internal (academic staff) election) Mr David Lloyd (University Secretary) Mr John May (term 3yrs end 1/10/06, internal (academic staff) election) Ms Karen McDonald (term 2yrs 10 mths ended 19/12/05, external appt)
Ms Helen Charlesworth (term 3yrs ended 31/12/05, external appt) Mrs Carol Devitt (term 3yrs ended 17/8/08, co-option appt) Ms Elizabeth Prime (term 1yr end 29/8/06 external appt) Ms Leslie Chalmers (apptd May 2005) (term 3yrs end 26/4/08, external appt) Dr Norman Ashton (appointed Aug 2005) (term 3yrs end 29/8/08, ministerial appt) JP Rene LeMiere (appointed Jan 2005) (term 3yrs end 17/8/08, co-option appt) Brother Steve Spain (appointed Oct 2005) (Student Guild member) Mr Chilekwa Mwaba (appointed Oct 2005) (Student Guild member) Mr Kevin O’Keefe (retired June 2005) Mr Andrew Crevald (retired Dec 2005) Mr Paul Snellgrove (retired Oct 2005) Mr David Pilkington (retired July 2005)
The controlled entity’s, (refer to note 29), directors are:
Steps Professional Development Mr Geoff Sherwin (Chairman) Mr Bruce Wilson Professor John Wood
Professor William Louden Mr Greg Holland Dr Lianne Cretney-Barnes
All directors of Steps Professional Development are appointed by resolution of the members of the Accountable Authority (University Council)

EDITH COWAN UNIVERSITY Notes to the Financial Statements
for the Year Ended 31 December 2005
21
Economic Entity Parent Entity [Consolidated] [General University] 2005 2004 2005 2004 $000’s $000’s $000’s $000’s
7 Remuneration of Members of the Accountable Authority and Senior Officers (Continued)
Remuneration of Members of the Accountable Authority The number of members of the Accountable Authority, whose total fees, salaries, superannuation and other benefits for the
financial year, fall within the following bands are: Nil - $10,000 23 22 19 19 $10,001 - $20,000 1 1 - - $20,001 - $30,000 1 1 - - $60,001 - $70,000 - - - - $80,001 - $90,000 - - - - $90,001 - $100,000 - - - - $100,001 - $110,000 1 1 1 1 $110,001 - $120,000 1 - 1 - $160,001 - $170,000 1 2 1 2 $170,001 - $180,000 1 - 1 - $470,001 - $480,000 - 1 - 1 $790,001 - $800,000 1 - 1 - Aggregate Remuneration of Members of the
Accountable Authority $1,393 $954 $1,353 $916
19 members of the Accountable Authority receive no remuneration, fees, superannuation or benefits. The superannuation included here represents the superannuation expense incurred by the University in respect of the members
of the Accountable Authority. 7.2 Names and Positions held of Persons who were Senior Officers of the University
The University’s Senior Officers during 2005 were:
Mr Warren Snell (Chief Financial Officer) Prof Anthony Watson (Executive Dean, Faculty of CHS) Mr Greg Holland (Principal Accounting Officer) Prof Robyn Quin (Executive Dean, Faculty of CCI) Prof Patrick Garnett (Deputy Vice-Chancellor) Prof Robert Harvey (Executive Dean, Faculty of BPM) Prof John Wood (Deputy Vice-Chancellor) Prof William Louden (Executive Dean, Faculty of CSESS) Dr Susan King (Executive Officer, Governance Policy and Planning Services) Prof Neil Tuckwell (Executive Dean, Faculty of RPS) Remuneration of Senior Officers
The number of Senior Officers other than Senior Officers reported as members of the Accountable Authority, whose total of fees, salaries, superannuation and other benefits for the financial year, fall within the following bands are:
$90,001 - $100,000 1 1 1 1 $160,001 - $170,000 - 1 - 1 $170,001 - $180,000 1 1 1 1 $190,001 - $200,000 1 1 1 1 $200,001 - $210,000 - 2 - 2 $210,001 - $220,000 - 1 - 1 $220,001 - $230,000 2 1 2 1 $230,001 - $240,000 2 2 2 2 $250,001 - $260,000 1 - 1 - $260,001 - $270,000 2 - 2 - Aggregate Remuneration of Senior Officers: $2,153 $1,986 $2,153 $1,986 The superannuation included here represents the superannuation expense incurred by the University in respect of Senior Officers other
than Senior Officers reported as members of the Accountable Authority.

EDITH COWAN UNIVERSITY Notes to the Financial Statements
for the Year Ended 31 December 2005
22
Economic Entity Parent Entity [Consolidated] [General University] 2005 2004 2005 2004 $000’s $000’s $000’s $000’s
8 Remuneration of Auditors Remuneration to the Auditor General for the financial year is as follows: Auditing the accounts, financial statements and
performance indicators 132 125 118
110
9 Income Tax Deferred tax asset Balance at the beginning of the period 102 77 - - Current year income tax related to continuing activities 55 25 - - Balance at the end of the period 157 102 - -
10 Receivables Current Trade debtors 10,602 8,059 10,140 7,688 Provision for doubtful debts (1,263) (671) (1,262) (671) 9,339 7,388 8,878 7,017 Commonwealth Government
Deferred Government Contribution for Superannuation 3,099 3,223 3,099 3,223 Total Current 12,438 10,611 11,977 10,240 Non-Current Loans to related parties 200 - 325 - Commonwealth Government Deferred Government Contribution for Superannuation 32,776 33,660 32,776 33,660 Total Non-Current 32,976 33,660 33,101 33,660 Deferred Government Contribution for Superannuation is discussed further under note 26(2) Superannuation.

EDITH COWAN UNIVERSITY Notes to the Financial Statements
for the Year Ended 31 December 2005
23
Economic Entity Parent Entity [Consolidated] [General University] 2005 2004 2005 2004 $000’s $000’s $000’s $000’s
11 Inventories Current Trading stock 1,898 1,848 1,780 1,774
Total current inventories 1,898 1,848 1,780 1,774
12 Other Non-financial Assets Current Accrued income 223 501 177 414 Advances and prepayments 1,045 1,044 987 992 Current tax assets 113 102 - - Total Current 1,381 1,647 1,164 1,406
13 Other Financial Assets Shares Shares held in Publicly Listed companies: IBT Education Limited 900 900 900 900 Diminution in value of investments (180) - (180) - Total shares 720 900 720 900
(400,000 Ordinary Shares at a par value of $1.00 each: Market Value of $1.80 per share as at 31st December 2005)
Bank bills Maturing within 1yr 6,182 4,000 6,182 4,000 Maturing later than 1yr 5,052 1,589 5,052 1,589 Total bank bills 11,234 5,589 11,234 5,589 Total other financial assets 11,954 6,489 11,954 6,489 Current 6,182 4,000 6,182 4,000 Non-current 5,772 2,489 5,772 2,489 11,954 6,489 11,954 6,489

EDITH COWAN UNIVERSITY Notes to the Financial Statements
for the Year Ended 31 December 2005
24
14 Property, Plant, Equipment and Vehicles Reconciliations Reconciliations of the carrying amounts of property, plant, equipment and vehicles at the beginning and end of the current financial year are set out below.
2005
Land
$000’s
Buildings
$000’s
Leasehold Improvements
$000’s
Work in progress $000’s
Computing equipment
$000’s
Other equipment and
furniture $000’s
Motor vehicles $000’s
Leased motor
vehicles $000’s
Works of Art $000’s
Library collections
$000’s
Total $000’s
Economic Entity [Consolidated]
Year ended 31 December 2005 Opening net book amount 134,769 284,151 5,334 11,695 2,453 7,964 509 13 6,674 7,179 460,741 Additions - 9,833 2,326 23,544 2,102 2,172 59 - 71 3,068 43,175 Disposals (5,749) (8,251) - - (120) (353) (336) - - - (14,809) Accumulated depreciation on disposals - - - - 117 338 165 - - - 620 Write-offs during the year - - (267) - (1,466) (841) - - - (15) (2,589) Accumulated depreciation on write-offs - - - - 1,463 792 - - - - 2,255 Net foreign currency exchange difference from the translation of a foreign operation - - (2) - 2 (3) - (1) - - (4) Revaluation increments/(decrements) 20,425 44,352 1,774 (10,766) - - - - - - 55,785 Depreciation - (7,553) (270) - (1,933) (2,467) (121) (3) - (2,038) (14,385) Adjustment to 2004 costs - - - - 17 101 - - - - 118 Carrying amount at end of year 149,445 322,532 8,895 24,473 2,635 7,703 276 9 6,745 8,194 530,907 At 31 December 2005 -Cost - - 41 24,473 11,775 20,583 827 26 - 10,232 67,957 -Valuation 149,445 322,532 8,871 - - - - (17) 6,745 - 487,576 Accumulated depreciation - - (17) - (9,140) (12,880) (551) - - (2,038) (24,626) Net book amount 149,445 322,532 8,895 24,473 2,635 7,703 276 9 6,745 8,194 530,907

EDITH COWAN UNIVERSITY Notes to the Financial Statements
for the Year Ended 31 December 2005
25
14 Property, Plant, Equipment and Vehicles (Continued)
2004
Land
$000’s
Buildings
$000’s
Leasehold Improvements
$000’s
Work in progress $000’s
Computing equipment
$000’s
Other equipment and
furniture $000’s
Motor vehicles $000’s
Leased motor
vehicles $000’s
Works of Art $000’s
Library collections
$000’s
Total $000’s
Economic Entity [Consolidated]
At 1 January 2004 -Cost - - 41 7,907 10,763 18,717 1,276 26 - 8,665 47,395 -Valuation 124,992 284,142 - - - - - - 6,577 - 415,711 Accumulated depreciation - - (1) - (8,262) (9,698) (687) (9) - (2,282) (20,939)
Net book amount 124,992 284,142 40 7,907 2,501 9,019 589 17 6,577 6,383 442,167
Year ended 31 December 2004 Opening net book amount 124,992 284,142 40 7,907 2,501 9,019 589 17 6,577 6,383 442,167 Additions 50,501 12,841 5,403 20,112 1,112 1,356 106 - 97 2,527 94,055 Disposals (44,665) (9,894) - (16,324) (180) (393) (148) - - - (71,604) Accumulated depreciation on disposals - - - - 170 376 117 - - - 663 Write-offs during the year - - - - (386) (344) (15) - - - (745) Accumulated depreciation on write-offs - - - - 354 312 2 - - - 668 Net foreign currency exchange difference from the translation of a foreign operation - -
1 - 2 1 - - - - 4
Revaluation increments/(decrements) 3,941 3,630 - - - - - - - - 7,571 Depreciation - (6,568) (110) 0 (1,120) (2,362) (142) (4) 0 (1,732) (12,038)
Carrying amount at end of year 134,769 284,151 5,334 11,695 2,453 7,965 509 13 6,674 7,178 460,741
At 31 December 2004 -Cost - - 5,446 11,695 11,297 19,337 1,219 28 97 8,910 58,029 -Valuation 134,769 284,151 - - - - - - 6,577 - 425,497 Accumulated depreciation - - (112) - (8,844) (11,372) (710) (15) - (1,732) (22,785)
Net book amount 134,769 284,151 5,334 11,695 2,453 7,965 509 13 6,674 7,178 460,741

EDITH COWAN UNIVERSITY Notes to the Financial Statements
for the Year Ended 31 December 2005
26
14 Property, Plant, Equipment and Vehicles (Continued)
2005
Land
$000’s
Buildings
$000’s
Leasehold Improvements
$000’s
Work in progress $000’s
Computing equipment
$000’s
Other equipment and
furniture $000’s
Motor vehicles $000’s
Leased motor
vehicles $000’s
Works of Art $000’s
Library collections
$000’s
Total $000’s
Parent Entity [General University] Year ended 31 December 2005 Opening net book amount 134,769 284,151 5,296 11,695 2,387 7,909 509 - 6,674 7,178 460,568 Additions - 9,833 2,325 23,544 2,096 2,167 59 - 71 3,068 43,163 Disposals (5,749) (8,251) - - (120) (353) (336) - - - (14,809) Accumulated depreciation on disposals - - - - 117 338 165 - - - 620 Write-offs during the year - - (267) - (1,466) (841) - - - (15) (2,589) Accumulated depreciation on write-offs - - - - 1,463 792 - - - - 2,255 Net foreign currency exchange difference from the translation of a foreign operation - - - - - - - - - - 0 Revaluation increments/(decrements) 20,425 44,352 1,774 (10,766) - - - - - - 55,785 Depreciation - (7,553) (257) - (1,913) (2,455) (121) - - (2,037) (14,336) Adjustment to 2004 costs - - - - 17 101 - - - - 118 Carrying amount at end of year 149,445 322,532 8,871 24,473 2,581 7,658 276 0 6,745 8,194 530,775 At 31 December 2005 -Cost - - - 24,473 11,583 20,475 827 - 10,232 67,590 -Valuation 149,445 322,532 8,871 - - - - 6,745 - 487,593 Accumulated depreciation - - - - (9,002) (12,817) (551) - - (2,038) (24,408) Net book amount 149,445 322,532 8,871 24,473 2,581 7,658 276 0 6,745 8,194 530,775
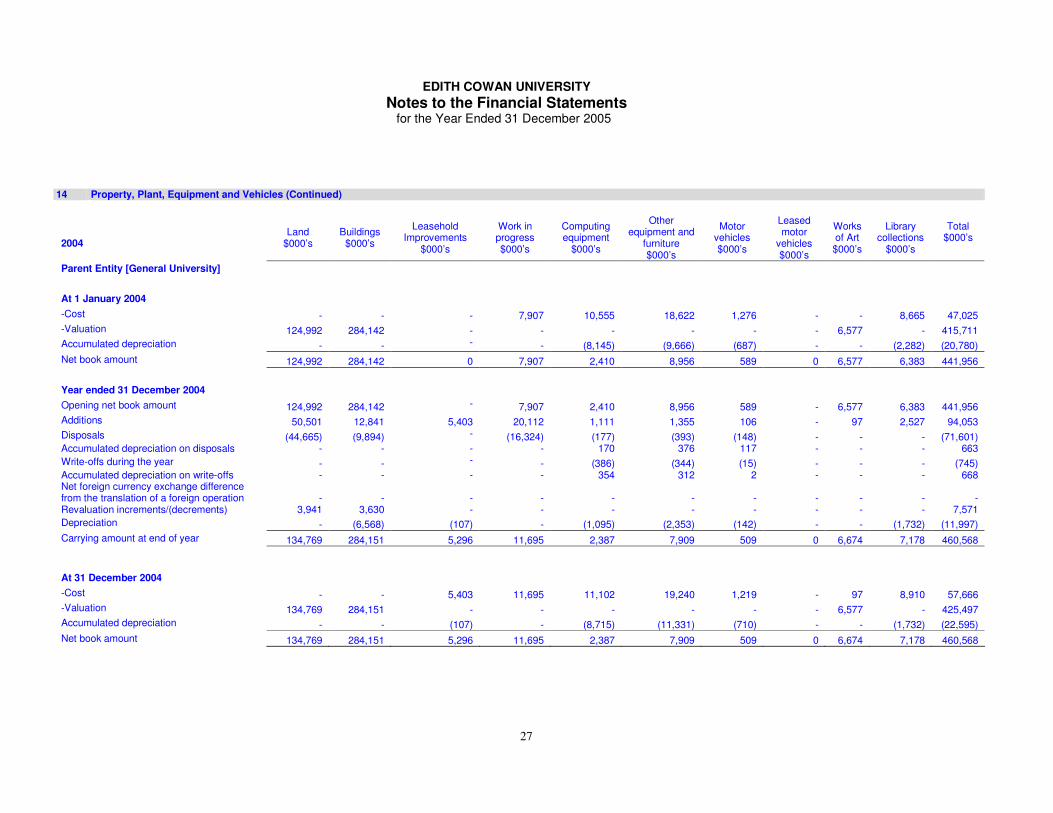
EDITH COWAN UNIVERSITY Notes to the Financial Statements
for the Year Ended 31 December 2005
27
14 Property, Plant, Equipment and Vehicles (Continued)
2004
Land
$000’s
Buildings
$000’s
Leasehold Improvements
$000’s
Work in progress $000’s
Computing equipment
$000’s
Other equipment and
furniture $000’s
Motor vehicles $000’s
Leased motor
vehicles $000’s
Works of Art $000’s
Library collections
$000’s
Total $000’s
Parent Entity [General University]
At 1 January 2004 -Cost - - - 7,907 10,555 18,622 1,276 - - 8,665 47,025 -Valuation 124,992 284,142 - - - - - - 6,577 - 415,711 Accumulated depreciation - - - - (8,145) (9,666) (687) - - (2,282) (20,780) Net book amount 124,992 284,142 0 7,907 2,410 8,956 589 0 6,577 6,383 441,956 Year ended 31 December 2004 Opening net book amount 124,992 284,142 - 7,907 2,410 8,956 589 - 6,577 6,383 441,956 Additions 50,501 12,841 5,403 20,112 1,111 1,355 106 - 97 2,527 94,053 Disposals (44,665) (9,894) - (16,324) (177) (393) (148) - - - (71,601) Accumulated depreciation on disposals - - - - 170 376 117 - - - 663 Write-offs during the year - - - - (386) (344) (15) - - - (745) Accumulated depreciation on write-offs - - - - 354 312 2 - - - 668 Net foreign currency exchange difference from the translation of a foreign operation - - - - - - - - - - - Revaluation increments/(decrements) 3,941 3,630 - - - - - - - - 7,571 Depreciation - (6,568) (107) - (1,095) (2,353) (142) - - (1,732) (11,997) Carrying amount at end of year 134,769 284,151 5,296 11,695 2,387 7,909 509 0 6,674 7,178 460,568
At 31 December 2004 -Cost - - 5,403 11,695 11,102 19,240 1,219 - 97 8,910 57,666 -Valuation 134,769 284,151 - - - - - - 6,577 - 425,497 Accumulated depreciation - - (107) - (8,715) (11,331) (710) - - (1,732) (22,595) Net book amount 134,769 284,151 5,296 11,695 2,387 7,909 509 0 6,674 7,178 460,568

EDITH COWAN UNIVERSITY Notes to the Financial Statements
for the Year Ended 31 December 2005
28
Economic Entity Parent Entity [Consolidated] [General University]
2005 2004 2005 2004 $000’s $000’s $000’s $000’s
15 Investment Property Land 2,340 2,250 2,340 2,250 Building 8,221 7,187 8,221 7,187 Total investment property 10,561 9,437 10,561 9,437 Reconciliation Balance as at 1 January 9,437 7,676 9,437 7,676 Net gain on revaluation 1,124 1,761 1,124 1,761 Balance as at 31 December 10,561 9,437 10,561 9,437 Operating leases (as lessor) Within one year 581 564 581 564 Later than one year but not later than 5 years 2,503 2,430 2,503 2,430 Later than 5 years 3,575 4,229 3,575 4,229 6,659 7,223 6,659 7,223
The investment property comprises an office building on Collier Pass, Joondalup which is leased to a third party. The property is not used in the University’s operations but held for rental yield and capital appreciation. The revaluation of the investment property was performed in December 2005 determined from market-based evidence by appraisal undertaken by independent professional valuers.
16 Intangibles Computer Software Callista Student Records System At Cost 6,321 6,217 6,321 6,217 Accumulated Amortisation (1,569) (829) (1,569) (829) 4,752 5,388 4,752 5,388 Reconciliation Opening net book amount 5,388 - 5,388 - Additions 933 6,217 933 6,217 Amortisation (1,569) (829) (1,569) (829) Closing net book amount 4,752 5,388 4,752 5,388
17 Payables Current OS-HELP Liability to Australian Government 90 - 90 - CGS Liability to Australian Government 5,056 - 5,056 - Trade payables 3,084 5,457 2,870 4,451 Total Current Payables 8,230 5,457 8,016 4,451 Non-Current DETWA 606 - - - 606 - - -

EDITH COWAN UNIVERSITY Notes to the Financial Statements
for the Year Ended 31 December 2005
29
Economic Entity Parent Entity [Consolidated] [General University] 2005 2004 2005 2004
$000’s $000’s $000’s $000’s
18 Interest-Bearing Liabilities Current WA Treasury Corporation 3,175 169 3,175 169 Homeswest 333 - 333 - Finance lease - 11 - - Total Current 3,508 180 3,508 169 Non-Current WA Treasury Corporation 20,820 20,995 20,820 20,995 Homeswest - 333 - 333 Total Non-Current 20,820 21,328 20,820 21,328
Details of the interest-bearing liabilities as at balance date are as follows:
Principal outstanding
31/12/05
Principal outstanding
31/12/04
Current annual interest rate
31/12/05
Description of the Borrowing
$000’s $000’s %
Maturity date
Student Housing (Mount Lawley) ¹ 333 333 3.39 December 2006 Campus West 10,000 10,000 5.2 July 2008 Campus West 5,000 5,000 6.12 January 2009 Campus West 4,000 4,000 5.76 January 2010 Campus West 3,000 - 5.84 February 2006 Academy Stagehouse ² 1,995 2,164 6.27 October 2017 First National Motor Finance (Finance Lease) - 11 June 2005 24,328 21,508 ¹ Homeswest – Interest is payable at a rate of 2% below the prevailing bank bill rate and principal is repayable in three equal
instalments during the 15 year term of the loan. ² WA Teasury Corporation – Quarterly principal and interest repayments.
19 Provisions Current Employee benefits Annual leave 2,150 2,181 2,071 2,117 Long service leave 1,716 8,252 1,716 8,252 3,866 10,433 3,787 10,369 Other Superannuation 3,099 3,223 3,099 3,223 Staff Bonuses 749 686 749 686 Employee Oncosts 835 2,425 835 2,425 4,683 6,334 4,683 6,334 Total Current 8,549 16,767 8,470 16,703

EDITH COWAN UNIVERSITY Notes to the Financial Statements
for the Year Ended 31 December 2005
30
Economic Entity Parent Entity [Consolidated] [General University] 2005 2004 2005 2004
$000’s $000’s $000’s $000’s
19 Provisions (Continued)
Non-Current Employee benefits Long service leave 12,349 5,488 12,295 5,445 Other Deferred tax liability 7 6 - - Superannuation 32,764 33,660 32,764 33,660 Employee Oncosts 2,764 1,205 2,764 1,205 Other (73) (11) (73) (11) 35,462 34,860 35,455 34,854 Total Non-Current 47,811 40,348 47,750 40,299
Employee Benefits The aggregate employee benefits liability recognised and included in the financial statements is as follows: Provision for employee benefits: Current 3,866 10,433 3,787 10,369 Non-current 12,349 5,488 12,295 5,445 16,215 15,921 16,082 15,814 The consolidated entity considers the carrying amount of employee benefits approximates the net fair value. Provisions - other Current 4,683 6,334 4,683 6,334 Non-current 35,462 34,860 35,455 34,854 40,145 41,194 40,138 41,188
20 Other Liabilities Current Financial assistance and fees received in advance 10,129 15,327 10,129 15,327 Accrued expenses 9,046 4,565 8,625 4,565 Total current other liabilities 19,175 19,892 18,754 19,892

EDITH COWAN UNIVERSITY Notes to the Financial Statements
for the Year Ended 31 December 2005
31
Economic Entity Parent Entity [Consolidated] [General University] 2005 2004 2005 2004 $000’s $000’s $000’s $000’s
21 Reserves
Asset revaluation reserve Balance at start of year 169,958 214,514 169,958 214,514 Net revaluation increments / (decrements):
Reversal in respect of disposal of vested land and buildings at Churchlands Campus - (52,674) - (52,674)
Land 14,676 3,941 14,676 3,941 Buildings¹ 37,875 3,477 37,875 3,477 Shares held in Publicly Listed companies - 700 - 700 Works of art - - - - Movement for the year 52,551 (44,556) 52,551 (44,556) Balance at End of Year 222,509 169,958 222,509 169,958
Foreign Currency Translation Reserve (38) - - -
Total Reserves 222,471 169,958 222,509 169,958
¹ Buildings – As part of the revaluation of the Churchlands campus, certain buildings have/will be decommissioned during the period 2003 to 2007. Their valuations reflect their remaining useful life.
22 Equity Retained surplus Retained surplus at the beginning of the year 264,499 206,469 264,276 205,964 Prior year adjustment (STEPS) - (12) - - Net operating result attributable to the parent entity 22,259 58,042 22,283 58,312 Retained surplus at the end of the year 286,758 264,499 286,559 264,276
23 Notes to the Cash Flow Statement (a) Reconciliation of cash Cash at the end of the financial year as shown in the Cash Flow Statement is reconciled to the related items in the Balance
Sheet as follows:
Cash Unrestricted cash assets Cash at bank 7,215 5,109 6,476 4,615 Cash held in imprests 27 36 27 36 Total Unrestricted Cash Assets 7,242 5,145 6,503 4,651 Restricted Cash Assets ECU Foundation (see note 32) 3,819 3,463 3,819 3,463 Total Cash and Cash Equivalents 11,061 8,608 10,322 8,114

EDITH COWAN UNIVERSITY Notes to the Financial Statements
for the Year Ended 31 December 2005
32
Economic Entity Parent Entity [Consolidated] [General University] 2005 2004 2005 2004 $000’s $000’s $000’s $000’s
23 Notes to the Cash Flow Statement (Continued) (b) Non-cash financing and investing activities During the financial year, there were no assets/liabilities transferred/assumed from other Universities or government agencies
and therefore not reflected in the Cash Flow Statement.
(c) Reconciliation of profit from ordinary activities to net cash flows provided by operating activities Net operating result 22,259 58,042 22,283 58,312 Non-cash items: Depreciation expense 15,955 14,598 15,905 14,557 Doubtful debts and bad debts written off 771 432 771 432 Provision for employee benefits (3,304) 4,218 (3,330) 4,216 Provision for diminution in investments 180 - 180 - (Profit)/loss on sale of assets (14,117) (184) (14,117) (184) Net loss on asset write-offs 67 83 67 80 Repayment of DEST CGS advance (10,000) - (10,000) - Prepayment of withholding tax to overseas authority (61) (11) (61) (11) Unrealised foreign exchange loss 37 48 - - Unrealised gain on revaluation of investment property (1,124) (1,761) (1,124) (1,761) Changes in assets and liabilities: (Increase) decrease in accrued income 278 17 236 (113) (Increase) decrease in accounts receivable 1,072 (3,442) 1,162 (3,551) (Increase) decrease in tax assets (17) (87) - - (Increase) decrease in advances and prepayments 1 150 7 119 (Increase) decrease in inventories (50) 103 (6) 133 Increase (decrease) in accounts payable 3,465 (986) 3,650 (1,399) Increase (decrease) in fees received in advance 4,802 2,593 4,802 2,594 Increase (decrease) in accrued expenses 4,480 1,287 4,062 1,633 Increase (decrease) in interest-bearing liabilities (11) - - - Increase (decrease) in tax liabilities (36) (24) - - (Increase) decrease in GST recoverable/payable (265) (270) (265) (270) (Increase) decrease in formation costs - 1 - - Net Cash provided by/(used in) Operating Activities 24,382 74,807 24,222 74,787
24 Commitments for Expenditure (a) Capital expenditure commitments
Capital expenditure commitments, being contracted capital expenditure additional to the amounts reported in the financial statements, are payable as follows:
Within 2 years 79,733 10,883 79,733 10,883 The capital commitments include amounts for: Infrastructure 79,733 10,883 79,733 10,883

EDITH COWAN UNIVERSITY Notes to the Financial Statements
for the Year Ended 31 December 2005
33
24 Commitments for Expenditure (Continued) Capital expenditure commitments The major capital expenditure commitments for capital works expected to be completed within two years are as follows:
Project Title Year Project first
Budgeted for
Year for Completion
Original Budgeted Cost
Current Expenditure
Cost to Complete
Comments
Joondalup
Site Services Infrastructure 2005 Dec-06 1,000 989 500 Increased Costs due to Scope
Changes Library and Technology Centre 2005 Apr-07 34,350 13,903 21,735
On Grade Car Park (600 Bays released as 3 lots of 200 bays each) 2005 Dec-06 1,000 1,211 944
Additional bays required for medium term
Lecture Theatre (350 Seat) 2003 Apr-07 2,800 64 4,075 Update of initial budget for
escalation and scope changes
Health & Wellness Building 2005 Jul-07 29,970 2,145 33,300 Update of initial budget to
reflect tender and escalation
Mount Lawley
ECU/HS Recreation Centre 2002 Apr-05 3,700 4,522 200 Update of initial budget to
reflect tender and escalation
ECU/HS (2 Level Car Park) 2003 Jun-05 1,600 2,159 50 Preliminary Budget did not
reflect Scope of work Student Central Relocation to Building 3 & Library Refurbishments 2004 Jun-06 1,700 79 2,217
Update of initial budget to reflect scope and escalation
Total 76,120 25,072 63,021
Economic Entity Parent Entity [Consolidated] [General University] 2005 2004 2005 2004 $000’s $000’s $000’s $000’s
(b) Operating lease commitments Commitments in relation to leases contracted for at the reporting date but not recognised as liabilities, are payable as follows:
Within 1 year 899 1,032 831 935 Later than 1 year and not later than 5 years 651 485 380 173 Later than 5 years 56 415 - - Total Operating Lease Commitments 1,606 1,932 1,211 1,108
Representing: Cancellable operating leases 1,606 1,932 1,211 1,108 (c) Finance lease commitments
Finance lease commitments are payable as follows:
Within 1 year - 6 - - Later than 1 year and not later than 5 years - - - - Minimum lease payments - 6 - - Total Lease Liability - 6 - - Finance lease liability on equipment capitalised Current - 6 - - Non Current - - - - - 6 - - (d) Other expenditure commitments
Commitments in relation to purchase orders, are payable as follows: Within 1 year 2,189 3,329 2,189 3,329

EDITH COWAN UNIVERSITY Notes to the Financial Statements
for the Year Ended 31 December 2005
34
25 Contingent Liabilities
In addition to the liabilities incorporated in the financial statements, the University has the following contingent liability: Native title claims have been made on the University land but as yet no claims have been determined by the National Native Title Tribunal. It is not practicable to estimate the potential financial effect of these claims at this point in time.
26 Superannuation The University contributes to the following superannuation schemes on behalf of its employees: 1. Unisuper Limited Defined Benefit Plan (DPB) / Investment Choice (ICP) The UniSuper Defined Benefit Plan (DBP) is a defined benefit plan. The employer’s contribution rate as at 31 December 2005 was 7% for staff contributing 3.5% and 14% for staff contributing 7% of their salary. The last actuarial assessment was conducted by Towers Perrin as at 31 December 2002. It concluded that the scheme’s funds were adequate to satisfy all benefits payable to employees. The scheme is fully funded. Sufficient information is not available to account for the defined benefits provided by the DBP as a defined benefit plan. As set out under Paragraph 32 (b) of AASB 119, the DBP exposes the participating employers to actuarial risks associated with the current and former employees of other participating employers, with the result that there is no consistent and reliable basis for allocating the obligation, plan assets and cost to participating employers. As at 30 June 2005 there is no funding surplus or deficit which currently affects, or is expected to affect, the amount of future contributions payable by participating employers to the DBP. Historically surplus in the DBP has been used to improve members’ benefits and has not affected the amount of participating employers’ contributions; As at 30 June 2005 the assets of the DBP in aggregate were estimated to be $230 million in excess of vested benefits. The vested benefits are benefits which are not conditional upon continued membership (or any factor other than leaving the service of the participating institution) and include the value of CPI indexed pensions being provided by the DBP. As at 30 June 2005 the assets of the DBP in aggregate were estimated to be $1,543 million in excess of accrued benefits. The accrued benefits have been calculated as the present value of expected future benefit payments to members and CPI indexed pensioners which arise from membership of UniSuper up to the reporting date. The vested benefit and accrued benefit liabilities were determined by the Fund’s actuary Russell Employee Benefits using the actuarial demographic assumptions outlined in their report dated 16 May 2003 on the actuarial investigation of the DBP as at 31 December 2002. The financial assumptions used were: Vested Accrued Benefits Benefits Gross of tax investment return 7.0% p.a. 9.1% p.a. Net of tax investment return 6.5% p.a. 8.6% p.a. Consumer Price Index 2.5% p.a. 2.5% p.a. Inflationary salary increases 3.5% p.a. 3.5% p.a. Additional promotional salary increases are assumed to apply based on past experience. Assets have been included at their net market value, i.e. allowing for realisation costs. Clause 34 of the UniSuper Trust Deed outlines the process UniSuper must undertake (including employer notifications and notice periods) in order to request additional contributions from employers if the UniSuper assets are considered by the Trustee to be insufficient to provide benefits payable under the Deed. At least four years notice that such a request may be made is required. If such a request was agreed to by employers then members must also contribute additional contributions equal to one-half of the rate at which their employer is prepared to contribute. If employers do not agree to increase contributions the Trustee must reduce benefits on a fair and equitable basis. The Trustee notified employers during 2003 that such a request may be made in the future but it considered this was unlikely at that time. Award Plus Plan (APP) This is a non-contributing employee scheme whereby the University contributes 3% of base salaries for staff who are in DBP/ICP and 9% for the University’s casual and non-permanent employees who are not members of the DBP/ICP.

EDITH COWAN UNIVERSITY Notes to the Financial Statements
for the Year Ended 31 December 2005
35
26 Superannuation (Continued)
2. Government Employees Superannuation Board Unfunded Pension and Unfunded Gold State (Lump sum) Schemes The University has in its staffing profile a number of employees who are members of the Government Employees Superannuation Board (GESB) Scheme. As the Employer, the University is required to contribute to the scheme as employees are paid a pension or lump sum pay out. Consequently, an unfunded liability has been created. The Commonwealth Government is committed to reimbursing the University for payments actually made to the scheme for these emerging costs. Reconciliation of the Present Value of the Defined Benefit Obligation
Financial year ending 31 December 2005 31 December 2004
(A$'000s) (A$'000s)
Present value of defined benefit obligations at beginning of the year 36,883 37,623
(+) Current service cost 8 26
(+) Interest cost 1,869 2,020
(+) Contributions by Scheme participants - -
(+) Actuarial (gains)/losses 511 421
(-) Benefits paid 3,396 3,207
Present value of defined benefit obligations at end of the year 35,875 36,883 These defined benefit obligations are wholly unfunded, such that there are no Assets. The employer contributes, as required, to meet the benefits paid.
Economic Entity Parent Entity [Consolidated] [General University] 2005 2004 2005 2004 $000’s $000’s $000’s $000’s
Reconciliation of income and expenses
Total liability as at the end of the year 35,875 36,883 35,875 36,883
Total liability as at the end of the previous year 36,883 32,695 36,883 32,695
Amount recognised as income and expenditure 1,008 4,188 1,008 4,188
27 Subsidiaries
Name of Entity Address Principal
Activities Country of
Incorporation Class of Shares Equity Holding
2005 %
2004 %
Steps Professional Development (ACN. 084 208 060)
Edith Cowan University Churchlands Campus
Pearson Street Chuchlands WA 6018
Develop and deliver professional development
resources for teaching professions
WA
Australian Public
Company, Limited by Guarantee
100 100
28 Interests in Joint Ventures The University participates in a number of research joint ventures. These operations are not material to the University and there is no separate disclosure for 2005 in accordance with the Australian Accounting Standard AASB 1006 ‘Interests in Joint Ventures’. Unincorporated Joint Venture – National Network Tele Test Facility The University participates in a collaborative arrangement with other parties to operate a virtual test facility that aids the research and industry communities to test and prototype Very Large Scale Integrated (VLSI) circuits and other System-On-Chip (SOC) devices, prior to moving into the manufacturing stage. This collaborative arrangement also shares the characteristics of a joint venture operation. The University’s contributions and expenses are included in the Income Statement. The contributions include funding from the Commonwealth Government and external sources. The University has sole and exclusive ownership of the assets employed in the joint venture totalling $3.2 million (2004 $4.5 million). These are included in the Balance Sheet. To the best of our knowledge and after having taken reasonable steps, there are no material capital expenditure commitments or no known material contingent liabilities relating to joint ventures.

EDITH COWAN UNIVERSITY Notes to the Financial Statements
for the Year Ended 31 December 2005
36
29 Explanatory Statement Details and reasons for significant variations between actual results with the corresponding items of the preceding year are detailed below. Significant variations are considered to be those greater than 10%.
Parent Entity [General University] 2005 2004 Actuals Actuals Variance
Note Category $000’s $000’s $000’s % Revenue
[1] Commonwealth Government financial assistance 103,711 90,558 13,153 15 [2] WA Government financial assistance 7,024 64,748 (57,724) (89) [3] Commonwealth Loan Programme 5,165 4,348 817 19 [4] Fees and Charges 49,699 43,931 5,768 13 [5] Superannuation – Deferred Government contribution 1,008 4,188 3,180 (76) [6] Investment Income 1,636 1,018 618 61 [7] Consultancy & contract research 2,231 1,058 1,173 111 [8] Net gain on disposal of non-current assets 14,117 184 13,933 7,572 [9] Net gain on revaluation of investment property 1,124 1,761 (637) (36)
[10] Other 1,768 2,738 (970) (35) Expenses
[11] Bad & doubtful debts 771 432 339 78 [12] Borrowing cost expense 1,267 1,007 260 26
Note Commentary
[1]
[2]
[3]
[4]
[5]
[6]
[7]
[8]
[9]
[10]
[11]
[12]
The increase in Commonwealth Government financial assistance in 2005 resulted due to an increase in the Commonwealth Grants Scheme (CGS) funds received from DEST ($16.8m increase), as a consequence of the increase in the number of commencing students in 2005. The introduction of the Indigenous Support Fund (DEST) in 2005 also contributed $900k towards the increase in Commonwealth Government financial assistance. The decrease in WA Government financial assistance in 2005 is the result of the one-off Grant of $57.728m received in 2004 from the WA Department of Education Services to assist the University in acquiring the freehold title to its existing Campus at Pearson Street, Churchlands and which was treated as revenue in 2004. Further awareness in the Commonwealth Loan Program has led to an increase in the numbers of Postgraduate Students taking up the scheme. This rate has continued to climb since inception of the scheme in 2002. The increase in Fees and Charges is due mainly to the increase in revenue received for fee-paying overseas students (an increase of ($6.1m increase in 2005), fee-paying domestic postgraduate students ($1m increase in 2005) and fee-paying domestic non-award students ($300k increase in 2005). Increase in the level of GESB unfunded superannuation expected to be recovered from the Commonwealth Government, as a result of revised GESB liability figures under the AIFRS. Investment Income increased in 2005 largely due to an increase of interest received from bank bills ($490k increase in 2005). The introduction of commercialised research income in 2005 ($1.4m received from Panorama Flats Ltd in 2005) was the main reason for the increase in consultancy and contract research revenue. However, professional consultancy revenue was reduced by $240k in 2005. Proceeds received for the sale of the Claremont Campus ($14m) was the cause for the increase of the Net gain on disposal of non-current assets in 2005. The decrease in the Net gain on revaluation of investment property in 2005 was due to the impact of the first time adoption of the AIFRS. The decrease in other revenue in 2005 was the consequence of the award for damages relating to a dispute for the construction of the Campus West building Bad & doubtful debts increased in 2005 as result of writing off old students debts upon the introduction of the new student records system (Callista) The increase in borrowing cost in 2005 expense was due largely to the increase in borrowing required for the University’s consolidation of the four metropolitan Perth campuses into two.

EDITH COWAN UNIVERSITY Notes to the Financial Statements
for the Year Ended 31 December 2005
37
29 Explanatory Statement (Continued) (ii) Significant variations between budget estimates and actual results for the financial year.
Parent Entity [General University] 2005 2005 Actuals Budget Variance
Note Category $000’s $000’s $000’s % Revenue
[1] Superannuation – Deferred Government contribution 1,008 - 1,008 - [2] Investment Income 1,636 508 1,128 222 [3] Royalties, trademarks & licenses 4,600 3,835 765 20 [4] Consultancy and contract research 2,231 528 1,703 323
Expenses [5] Buildings & grounds 6,563 8,224 (1,661) (20) [6] Bad & doubtful debts 771 1,700 (929) (55) [7] Borrowing cost expense 1,267 2,637 (1,370) (52)
Note Commentary
[1]
[2]
[3]
[4]
[5]
[6]
[7]
The revenue for Superannuation – Deferred Government contributions is not budgeted for because there is an offsetting expenditure in Employee benefits and on costs. The variance of actual to budget in 2005 in investment income is the result of larger than expected returns on bank bills due to the increase in the value of bank bills and an increase in interest rates. The variance of actual to budget in 2005 in royalties, trademarks and licenses can be largely attributed to the unexpected increase in the commercialisation of income received by the School of Biomedical and Health Sciences ($565k). The higher than budgeted consultancy and contract research in 2005 is due to the research contract taken up with Panoramaflat Ltd in June 2005 for research provided by the University for the Electronic Research Science Institute ($1.4m). The University was also more successful than expected in gaining other additional consultancy contracts. The variance to budget in 2005 for repairs and maintenance is due to the less than expected overall maintenance on buildings and costs for consultancy fees. The variance in bad and doubtful debts is due to the lower than expected bad debts written off and doubtful debts provided for during the year. The variance of actual to budget in 2005 for borrowing costs expense is due to the delay of several expected 2005 capital works projects.
30 Events Occurring After Reporting Date
No events have occurred since balance date that are likely to have a material impact on the financial statements or notes of the University.
31 Disaggregation Information
Higher Education TAFE Total Entity
INDUSTRY 2005 2004 2005 2004 2005 2004 $000’s $000’s $000’s $000’s $000’s $000’s
Income Statement
Total revenues from continuing activities 230,458 264,660 23,774 17,527 254,232 282,187
Total expenses from continuing activities 215,292 206,885 16,681 17,260 231,973 224,145
Operating result from continuing activities 15,166 57,775 7,093 267 22,259 58,042

EDITH COWAN UNIVERSITY Notes to the Financial Statements
for the Year Ended 31 December 2005
38
31 Disaggregation Information (Continued)
Higher Education TAFE Total Entity
INDUSTRY 2005 2004 2005 2004 2005 2004 $000’s $000’s $000’s $000’s $000’s $000’s
Balance Sheet Assets Current assets 35,077 25,617 2,935 2,686 38,012 28,303 Non-current assets 578,341 508,588 1,575 1,538 579,916 510,126 Total assets 613,418 534,205 4,510 4,224 617,928 538,429 Liabilities Current liabilities 38,332 40,762 1,130 1,534 39,462 42,296 Non-current liabilities 67,768 61,284 1,469 392 69,237 61,676 Total liabilities 106,100 102,046 2,599 1,926 108,699 103,972
Net Assets 507,318 432,159 1,911 2,298 509,229 434,457 Equity 507,318 432,159 1,911 2,298 509,229 434,457
Australia Other Total Entity GEOGRAPHICAL 2005 2004 2005 2004 2005 2004 $000’s $000’s $000’s $000’s $000’s $000’s
Total revenues from ordinary activities 249,638 278,487 4,594 3,700 254,232 282,187
Results 21,426 57,928 833 114 22,259 58,042 Assets 617,928 538,429 - - 617,928 538,429
Economic Entity Parent Entity [Consolidated] [General University] 2005 2004 2005 2004
$000’s $000’s $000’s $000’s
32 Restricted Cash ECU Foundation 3,819 3,463 3,819 3,463 3,819 3,463 3,819 3,463
(i) The purpose of the ECU Foundation is to hold funds received from external sources and these funds are appropriated for a variety of educational and research purposes ranging from scholarships, research, prizes and special lecture programmes. The Foundation was established to aid and promote excellence in educational and research activities by seeking, receiving and administering private gifts for the benefit of the University and its community.
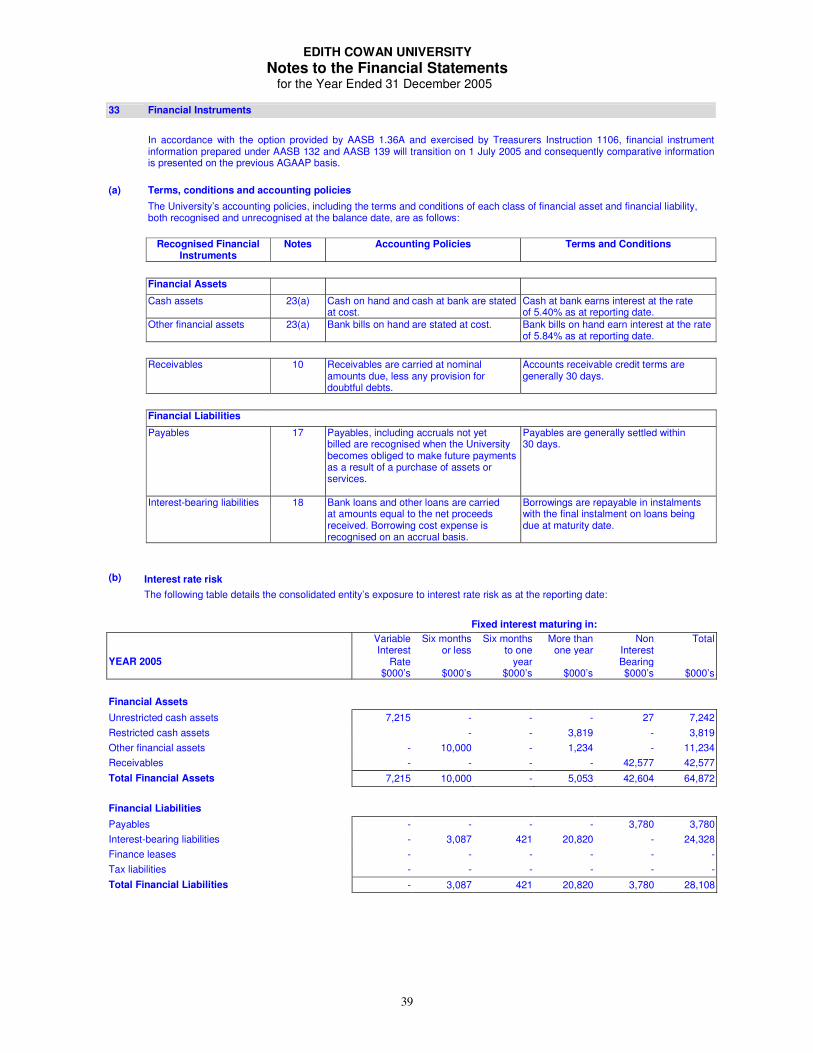
EDITH COWAN UNIVERSITY Notes to the Financial Statements
for the Year Ended 31 December 2005
39
33 Financial Instruments In accordance with the option provided by AASB 1.36A and exercised by Treasurers Instruction 1106, financial instrument
information prepared under AASB 132 and AASB 139 will transition on 1 July 2005 and consequently comparative information is presented on the previous AGAAP basis.
(a) Terms, conditions and accounting policies The University’s accounting policies, including the terms and conditions of each class of financial asset and financial liability,
both recognised and unrecognised at the balance date, are as follows:
Recognised Financial Instruments
Notes Accounting Policies Terms and Conditions
Financial Assets
Cash assets 23(a) Cash on hand and cash at bank are stated at cost.
Cash at bank earns interest at the rate of 5.40% as at reporting date.
Other financial assets 23(a) Bank bills on hand are stated at cost. Bank bills on hand earn interest at the rate of 5.84% as at reporting date.
Receivables 10 Receivables are carried at nominal amounts due, less any provision for doubtful debts.
Accounts receivable credit terms are generally 30 days.
Financial Liabilities
Payables 17 Payables, including accruals not yet billed are recognised when the University becomes obliged to make future payments as a result of a purchase of assets or services.
Payables are generally settled within 30 days.
Interest-bearing liabilities 18 Bank loans and other loans are carried at amounts equal to the net proceeds received. Borrowing cost expense is recognised on an accrual basis.
Borrowings are repayable in instalments with the final instalment on loans being due at maturity date.
(b) Interest rate risk The following table details the consolidated entity’s exposure to interest rate risk as at the reporting date:
Fixed interest maturing in: YEAR 2005
Variable Interest
Rate $000’s
Six months or less
$000’s
Six months to one
year $000’s
More than one year
$000’s
Non Interest Bearing $000’s
Total
$000’s Financial Assets
Unrestricted cash assets 7,215 - - - 27 7,242 Restricted cash assets - - 3,819 - 3,819 Other financial assets - 10,000 - 1,234 - 11,234 Receivables - - - - 42,577 42,577 Total Financial Assets 7,215 10,000 - 5,053 42,604 64,872
Financial Liabilities
Payables - - - - 3,780 3,780 Interest-bearing liabilities - 3,087 421 20,820 - 24,328 Finance leases - - - - - - Tax liabilities - - - - - - Total Financial Liabilities - 3,087 421 20,820 3,780 28,108

EDITH COWAN UNIVERSITY Notes to the Financial Statements
for the Year Ended 31 December 2005
40
33 Financial Instruments (Continued)
Fixed interest maturing in: YEAR 2004
Variable Interest
Rate $000’s
Six months or less
$000’s
Six months to one
year $000’s
More than one year
$000’s
Non Interest Bearing $000’s
Total
$000’s Financial assets 5,109 4,000 - 5,053 44,147 58,309 Financial liabilities - 95 85 21,328 15,456 36,964
Average Interest Rate 2005 2004 Financial Assets Cash assets 5.36% 5.15% Investment securities 5.77% 5.73% Financial Liabilities Interest-bearing liabilities 5.65% 5.64%
(c) Credit risk
Cash includes amounts held in cheque and money market accounts.
The consolidated entity, while exposed to credit related losses in the event of non-performance by counterparties does not expect any counterparties to fail to meet their obligations.
Economic Entity Parent Entity [Consolidated] [General University] 2005 2004 2005 2004
$000’s $000’s $000’s $000’s
34 Write-Offs Total write-offs as approved by the Accountable Authority
during the financial year 315 674 315 674
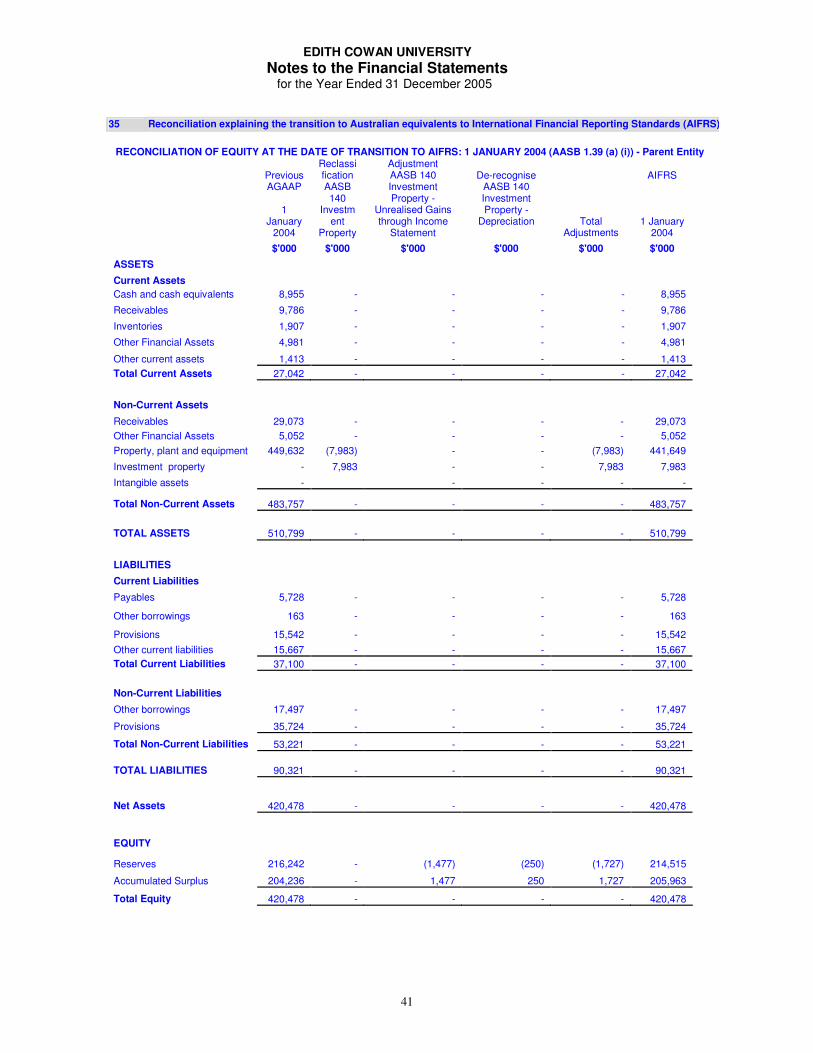
EDITH COWAN UNIVERSITY Notes to the Financial Statements
for the Year Ended 31 December 2005
41
35 Reconciliation explaining the transition to Australian equivalents to International Financial Reporting Standards (AIFRS)
RECONCILIATION OF EQUITY AT THE DATE OF TRANSITION TO AIFRS: 1 JANUARY 2004 (AASB 1.39 (a) (i)) - Parent Entity
Previous AGAAP
1
January 2004
Reclassification AASB 140
Investment
Property
Adjustment AASB 140 Investment Property -
Unrealised Gains through Income
Statement
De-recognise AASB 140 Investment Property -
Depreciation
Total Adjustments
AIFRS
1 January 2004
$'000 $'000 $'000 $'000 $'000 $'000
ASSETS
Current Assets Cash and cash equivalents 8,955 - - - - 8,955
Receivables 9,786 - - - - 9,786
Inventories 1,907 - - - - 1,907
Other Financial Assets 4,981 - - - - 4,981
Other current assets 1,413 - - - - 1,413 Total Current Assets 27,042 - - - - 27,042
Non-Current Assets
Receivables 29,073 - - - - 29,073 Other Financial Assets 5,052 - - - - 5,052 Property, plant and equipment 449,632 (7,983) - - (7,983) 441,649
Investment property - 7,983 - - 7,983 7,983
Intangible assets - - - - -
Total Non-Current Assets 483,757 - - - - 483,757
TOTAL ASSETS 510,799 - - - - 510,799
LIABILITIES
Current Liabilities
Payables 5,728 - - - - 5,728
Other borrowings 163 - - - - 163
Provisions 15,542 - - - - 15,542 Other current liabilities 15,667 - - - - 15,667 Total Current Liabilities 37,100 - - - - 37,100
Non-Current Liabilities
Other borrowings 17,497 - - - - 17,497
Provisions 35,724 - - - - 35,724
Total Non-Current Liabilities 53,221 - - - - 53,221
TOTAL LIABILITIES 90,321 - - - - 90,321
Net Assets 420,478 - - - - 420,478
EQUITY
Reserves 216,242 - (1,477) (250) (1,727) 214,515
Accumulated Surplus 204,236 - 1,477 250 1,727 205,963
Total Equity 420,478 - - - - 420,478

EDITH COWAN UNIVERSITY Notes to the Financial Statements
for the Year Ended 31 December 2005
42
35 Reconciliation explaining the transition to Australian equivalents to International Financial Reporting Standards (AIFRS)
RECONCILIATION OF EQUITY AT THE DATE OF TRANSITION TO AIFRS: 1 JANUARY 2004 (AASB 1.39 (a) (i)) - Economic Entity
Previous AGAAP
1
January 2004
Reclassification AASB 140
Investment
Property
Adjustment AASB 140 Investment Property -
Unrealised Gains through Income
Statement
De-recognise AASB 140 Investment Property -
Depreciation
Total Adjustments
AIFRS
1 January 2004
$'000 $'000 $'000 $'000 $'000 $'000
ASSETS
Current Assets Cash and cash equivalents 9,480 - - - - 9,480
Receivables 10,245 - - - - 10,245
Inventories 1,952 - - - - 1,952
Other financial assets 4,981 - - - - 4,981
Other current assets 1,716 - - - - 1,716 Total Current Assets 28,374 - - - - 28,374
Non-Current Assets
Receivables 29,073 - - - - 29,073 Other financial assets 5,052 - - - - 5,052 Other non-financial assets 9 - - - - - Property, plant and equipment 449,843 (7,983) - - (7,983) 441,860
Investment property - 7,983 - - 7,983 7,983
Intangible assets - - - - -
Total Non-Current Assets 483,977 - - - - 483,977
TOTAL ASSETS 512,351 - - - - 512,351
LIABILITIES
Current Liabilities
Payables 6,243 - - - - 6,243
Other borrowings 169 - - - - 169
Provisions 15,645 - - - - 15,645 Other current liabilities 16,013 - - - - 16,013 Total Current Liabilities 38,070 - - - - 38,070
Non-Current Liabilities
Other borrowings 17,507 - - - - 17,507
Provisions 35,791 - - - - 35,791
Total Non-Current Liabilities 53,298 - - - - 53,298
TOTAL LIABILITIES 91,368 - - - - 91,368
Net Assets 420,983 - - - - 420,983
EQUITY
Reserves 216,242 - (1,477) (250) (1,727) 214,515
Accumulated Surplus 204,741 - 1,477 250 1,727 206,468
Total Equity 420,983 - - - - 420,983

EDITH COWAN UNIVERSITY Notes to the Financial Statements
for the Year Ended 31 December 2005
43
35 Reconciliation explaining the transition to Australian equivalents to International Financial Reporting Standards (AIFRS)
RECONCILIATION OF EQUITY AT THE DATE OF TRANSITION TO AIFRS: 31 DECEMBER 2004 (AASB 1.39 (a) (ii)) – Parent Entity
Previous AGAAP
31 December
2004
Reclassification AASB
140 Investment
Property
AASB 112
Income Tax - Re-measure tax effect through Income
Statement
Adjustment AASB 140 Investment Property - Unrealised
Gains through Income
Statement
De-recognise AASB 140 Investment Property -
Depreciation
Reclass Deferred
Govt Super Contribution
s
AIFRS
31 December 2004
$'000 $'000 $'000 $'000 $'000 $'000 $'000
ASSETS
Current Assets
Cash and cash equivalents 8,114 - - - - - 8,114
Receivables 10,240 - - - - - 10,240
Inventories 1,774 - - - - - 1,774
Deferred tax assets - - - - - - -
Other financial assets 4,000 - - - - - 4,000
Other current assets 1,406 - - - - - 1,406
Total Current Assets 25,534 - 6 - - - 25,534
Non-Current Assets
Receivables 32,128 - - - - 1,532 33,660
Other financial assets 1,589 - - - - - 1,589
Property, plant and equipment 470,005 (9,437) - - - - 460,568
Investment property 900 9,437 - - - - 10,337
Intangible assets 5,388 - - - - - 5,388
Total Non-Current Assets 510,010 - - - - 1,532 511,542
TOTAL ASSETS 535,544 - 6 - - 1,532 537,076
LIABILITIES
Current Liabilities
Payables 4,451 - - - - - 4,451
Other borrowings 169 - - - - - 169
Provisions 16,703 - - - - - 16,703
Other current liabilities 19,892 - - - - - 19,892
Total Current Liabilities 41,215 - - - - - 41,215
Non-Current Liabilities
Other borrowings 21,328 - - - - - 21,328
Provisions 38,767 - - - - 1,532 40,299
Total Non-Current Liabilities 60,095 - - - - 1,532 61,627
TOTAL LIABILITIES 101,310 - - - - 1,532 102,842
Net Assets 434,234 - - - - - 434,234
EQUITY
Reserves 173,600 - - (3,238) (404) - 169,958
Accumulated Surplus 260,634 - - 3,238 404 - 264,276 Total Equity 434,234 - - - - 434,234

EDITH COWAN UNIVERSITY Notes to the Financial Statements
for the Year Ended 31 December 2005
44
35 Reconciliation explaining the transition to Australian equivalents to International Financial Reporting Standards (AIFRS)
RECONCILIATION OF EQUITY AT THE DATE OF TRANSITION TO AIFRS: 31 DECEMBER 2004 (AASB 1.39 (a) (ii)) – Economic Entity
Previous AGAAP
31 December
2004
Reclassification AASB
140 Investment
Property
AASB 112
Income Tax - Re-measure tax effect through Income
Statement
Adjustment AASB 140 Investment Property - Unrealised
Gains through Income
Statement
De-recognise AASB 140 Investment Property -
Depreciation
Reclass Deferred
Govt Super Contribution
s
AIFRS
31 December 2004
$'000 $'000 $'000 $'000 $'000 $'000 $'000
ASSETS
Current Assets
Cash and cash equivalents 8,608 - - - - - 8,608
Receivables 10,611 - - - - - 10,611
Inventories 1,848 - - - - - 1,848
Deferred tax assets 96 - 6 - - - 102
Other financial assets 4,000 - - - - - 4,000
Other current assets 1,545 - - - - - 1,545
Total Current Assets 26,708 - 6 - - - 26,714
Non-Current Assets
Receivables 32,128 - - - - 1,532 33,660
Other financial assets 1,589 - - - - - 1,589
Property, plant and equipment 470,178 (9,437) - - - - 460,741
Investment property 900 9,437 - - - - 10,337
Intangible assets 5,388 - - - - - 5,388
Total Non-Current Assets 510,183 - - - - 1,532 511,715
TOTAL ASSETS 536,891 - 6 - - 1,532 538,429
LIABILITIES
Current Liabilities
Payables 5,457 - - - - - 5,457
Other borrowings 180 - - - - - 180
Provisions 16,767 - - - - - 16,767
Other current liabilities 19,892 - - - - - 19,892
Total Current Liabilities 42,296 - - - - - 42,296
Non-Current Liabilities
Other borrowings 21,328 - - - - - 21,328
Provisions 38,816 - - - - 1,532 40,348
Total Non-Current Liabilities 60,144 - - - - 1,532 61,676
TOTAL LIABILITIES 102,440 - - - - 1,532 103,972
Net Assets 434,451 - - - - - 434,457
EQUITY
Reserves 173,600 - - (3,238) (404) - 169,958
Accumulated Surplus 260,851 - 6 3,238 404 - 264,499 Total Equity 434,451 - 6 - - - 434,457
The transition to AIFRS includes adjustments for the transition AIFRS as at 1 January 2004 plus adjustments for the period 1 Jan 04 to 31 Dec 04.

EDITH COWAN UNIVERSITY Notes to the Financial Statements
for the Year Ended 31 December 2005
45
35 Reconciliation explaining the transition to Australian equivalents to International Financial Reporting Standards (AIFRS)
RECONCILIATION OF INCOME STATEMENT (PROFIT OR LOSS) FOR THE YEAR ENDED 31 DECEMBER 2004 (AASB 1.39 (b)) –Parent Entity Previous
AGAAP
31 Dec 2004
Reclass. AASB 140 Investment Property Income &
Dep'n
AASB 112 Income Tax
- Re-measure tax
expense
Adjustment AASB 140 Investment Property - Unrealised
Gains
Re-classify AASB 116 Net
Gains on disposal
Reclass. of Trading
Profit & Unwind.
of discount
Reclass Deferred
Govt Super
Contributions
AIFRS
31 Dec 2004
$'000 $'000 $'000 $'000 $'000 $'000 $'000 $'000 REVENUE Commonwealth Government financial assistance Commonwealth Government financial assistance 90,558 - - - - - - 90,558 Higher Education Contribution Scheme 0 0 - Student contributions 7,085 - - - - - - 7,085 - Commonwealth payments 46,309 - - - - - - 46,309 Commonwealth Loan Programmes 4,348 - - - - - - 4,348 WA Government financial assistance 64,748 - - - - - - 64,748 Superannuation - Deferred Government contributions 1,225 - - - - - 2,963 4,188 Fees & charges 43,931 (698) - - - - - 43,233 Investment income 1,018 - - - - - - 1,018 Royalties, Trademarks & Licenses 4,244 - - - - - - 4,244 Consultancy & contract research 1,058 - - - - - - 1,058 Sales - - - - 6,515 - 6,515 Other revenue 5,884 - - - (229) (2,917) - 2,738 Rental Income - Investment Property - 698 - - - - - 698 0
Total Revenue 270,408 - - - (229) 3,598 2,963 276,740
EXPENSES Employee benefits expense 134,377 - - - - (15) 2,963 137,325
Depreciation and amortisation 14,711 (154) - - - - - 14,557
Repairs & Maintenance 6,611 (162) - - - - - 6,449
Impairment of receivables 432 - - - - - - 432
Finance costs 1,007 - - - - 15 - 1,022
Cost of goods sold - - - - - 3,598 - 3,598
Other expenses 56,872 - - - (44) - - 56,828
Rental Expense - Investment Property - 162 - - - - - 162
Total Expenses 214,010 (154) - - (44) 3,598 2,963 220,373
Gains on sale of Property Plant & Equipment - - - - 184 - - 184
Gains on revaluation of Investment Property - - - 1,761 - - - 1,761
Total Gains / (Loss) - - - 1,761 184 - - 1,945
Result before income tax expense 56,398 154 - 1,761 (1) - - 58,312
Income Tax expense - - 6 - - - - - NET PROFIT
56,398
154 6 1,761 (1) - - 58,312
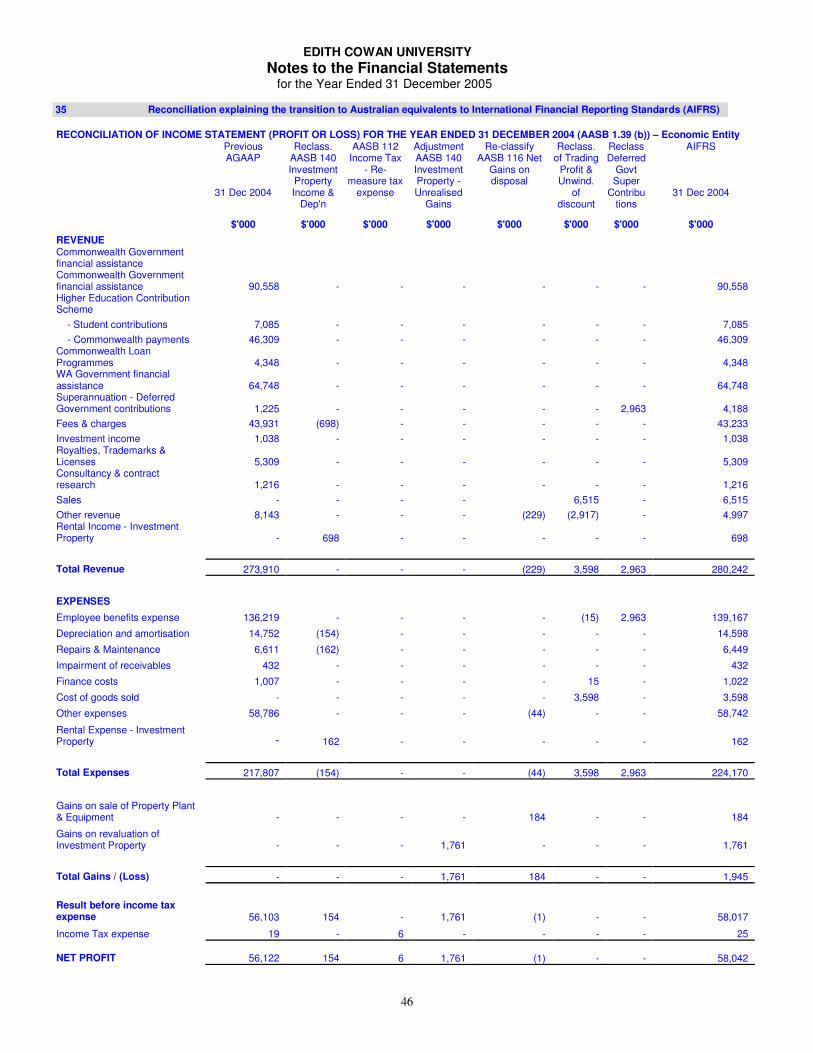
EDITH COWAN UNIVERSITY Notes to the Financial Statements
for the Year Ended 31 December 2005
46
35 Reconciliation explaining the transition to Australian equivalents to International Financial Reporting Standards (AIFRS)
RECONCILIATION OF INCOME STATEMENT (PROFIT OR LOSS) FOR THE YEAR ENDED 31 DECEMBER 2004 (AASB 1.39 (b)) – Economic Entity Previous
AGAAP
31 Dec 2004
Reclass. AASB 140 Investment Property Income &
Dep'n
AASB 112 Income Tax
- Re-measure tax
expense
Adjustment AASB 140 Investment Property - Unrealised
Gains
Re-classify AASB 116 Net
Gains on disposal
Reclass. of Trading
Profit & Unwind.
of discount
Reclass Deferred
Govt Super
Contributions
AIFRS
31 Dec 2004
$'000 $'000 $'000 $'000 $'000 $'000 $'000 $'000 REVENUE Commonwealth Government financial assistance Commonwealth Government financial assistance 90,558 - - - - - - 90,558 Higher Education Contribution Scheme - Student contributions 7,085 - - - - - - 7,085 - Commonwealth payments 46,309 - - - - - - 46,309 Commonwealth Loan Programmes 4,348 - - - - - - 4,348 WA Government financial assistance 64,748 - - - - - - 64,748 Superannuation - Deferred Government contributions 1,225 - - - - - 2,963 4,188 Fees & charges 43,931 (698) - - - - - 43,233 Investment income 1,038 - - - - - - 1,038 Royalties, Trademarks & Licenses 5,309 - - - - - - 5,309 Consultancy & contract research 1,216 - - - - - - 1,216 Sales - - - - 6,515 - 6,515 Other revenue 8,143 - - - (229) (2,917) - 4,997 Rental Income - Investment Property - 698 - - - - - 698
Total Revenue 273,910 - - - (229) 3,598 2,963 280,242
EXPENSES Employee benefits expense 136,219 - - - - (15) 2,963 139,167
Depreciation and amortisation 14,752 (154) - - - - - 14,598
Repairs & Maintenance 6,611 (162) - - - - - 6,449
Impairment of receivables 432 - - - - - - 432
Finance costs 1,007 - - - - 15 - 1,022
Cost of goods sold - - - - - 3,598 - 3,598
Other expenses 58,786 - - - (44) - - 58,742
Rental Expense - Investment Property - 162 - - - - - 162
Total Expenses 217,807 (154) - - (44) 3,598 2,963 224,170
Gains on sale of Property Plant & Equipment - - - - 184 - - 184
Gains on revaluation of Investment Property - - - 1,761 - - - 1,761
Total Gains / (Loss) - - - 1,761 184 - - 1,945
Result before income tax expense 56,103 154 - 1,761 (1) - - 58,017
Income Tax expense 19 - 6 - - - - 25 NET PROFIT
56,122
154 6 1,761 (1) - - 58,042

EDITH COWAN UNIVERSITY Notes to the Financial Statements
for the Year Ended 31 December 2005
47
35 Reconciliation explaining the transition to Australian equivalents to International Financial Reporting Standards (AIFRS)
Notes to the reconciliation of equity and profit and loss at 1 January 2004 and 31 December 2004 Note 35.1 Investment Property (AASB 140) AASB 140 requires investment property, which is property held to earn rentals and/or capital appreciation, to be disclosed as a separate class of asset on the balance sheet. Assets classified as investment property are not depreciated and are measured at fair value. Under previous AGAAP these assets were includes in Property, Plant and Equipment at fair value. Fair value gains or losses relating to investment property are transferred to the income statement under AIFRS. Under previous AGAAP the revaluation differences were transferred to equity. The University has identified land and buildings that are required to be classified as investment property as held to earn rentals and/or capital appreciation, and has made the following adjustments:
35.1a Adjustments to opening balance sheet (1 January 2004) The University has transferred $7,983,000 from property, plant and equipment to investment property. Accumulated depreciation (property, plant and equipment) has been reduced by $250,000 with a corresponding increase in accumulated surplus. Asset revaluation reserve has been reduced by $1,477,000 with a corresponding increase in accumulated surplus. 35.1b Adjustments to balance sheet (31 December 2004) The University has transferred $9,437,000 from property, plant and equipment to investment property. Accumulated depreciation (property, plant and equipment) has been reduced by $404,000 with a corresponding increase in accumulated surplus. Asset revaluation reserve has been reduced by $3,238,000 with a corresponding increase in accumulated surplus.
35.1c Adjustments to income statement (31 December 2004) Investment property adjustments totalling $3,642,000 increased net profit for the year. The adjustments in respect of the investment property adjustments consists of:
• Depreciation, amortisation and impairment expense has been reduced by $404,000. • Unrealised gains on revaluation of investment property $3,238,000.
Note 35.2 Income Tax (AASB 112) AASB 112 requires all income tax balances to be calculated using the comprehensive balance sheet liability method. Deferred tax items have been calculated by comparing the difference in carrying amounts to tax bases for all assets and liabilities of the subsidiary who is subject to domestic and foreign income tax. These differences in carrying amounts are multiplied by the tax rate expected to apply to the period when the asset is realised or the liability settled. Recognition of the resulting amounts give rise to deferred tax balances and are recognised where there exists the probability that future tax profit will be available to recognise the asset.
35.2a Adjustments to opening balance sheet (1 January 2004) There were no deferred tax assets recognised as at 1 January 2004. 35.2b Adjustments to balance sheet (31 December 2004) The deferred tax asset has been increase by $6,000 with a corresponding increase in net profit for the year.
35.2c Adjustments to income statement (31 December 2004) Income tax equivalents has increased by 6,000 with a corresponding increase in net profit for the year.
Note 35.3 Employee benefits (AASB 119 and AASB 137) Employee on-costs are not included in employee benefits under AIFRS. Under AGAAP employee benefits and on-costs are disclosed together on the face of the balance sheet under general category of provisions. On-costs include payroll tax and workers compensation only, with superannuation on-costs included in employee benefits. Employee benefits and employee benefit on-costs are shown separately in the notes to the financial statements. AASB 137 requires the unwinding of discounts to be disclosed as a finance cost.
35.3a Adjustments to income statement (31 December 2004) The movement in provisions due to the unwinding of discounts of $15,000 has been reclassified from other expenses to finance costs.
Note 35.4 Government Employees Superannuation Scheme (GESB) In accordance with AASB 119 of the AIFRS, The amount recorded as a liability and asset for the GESB deferred Government contribution as at 31 December 2004 have been restated. Subsequently, the amount treated as an expense and revenue for 2004 have been restated. Refer to note 26 for the full disclosure
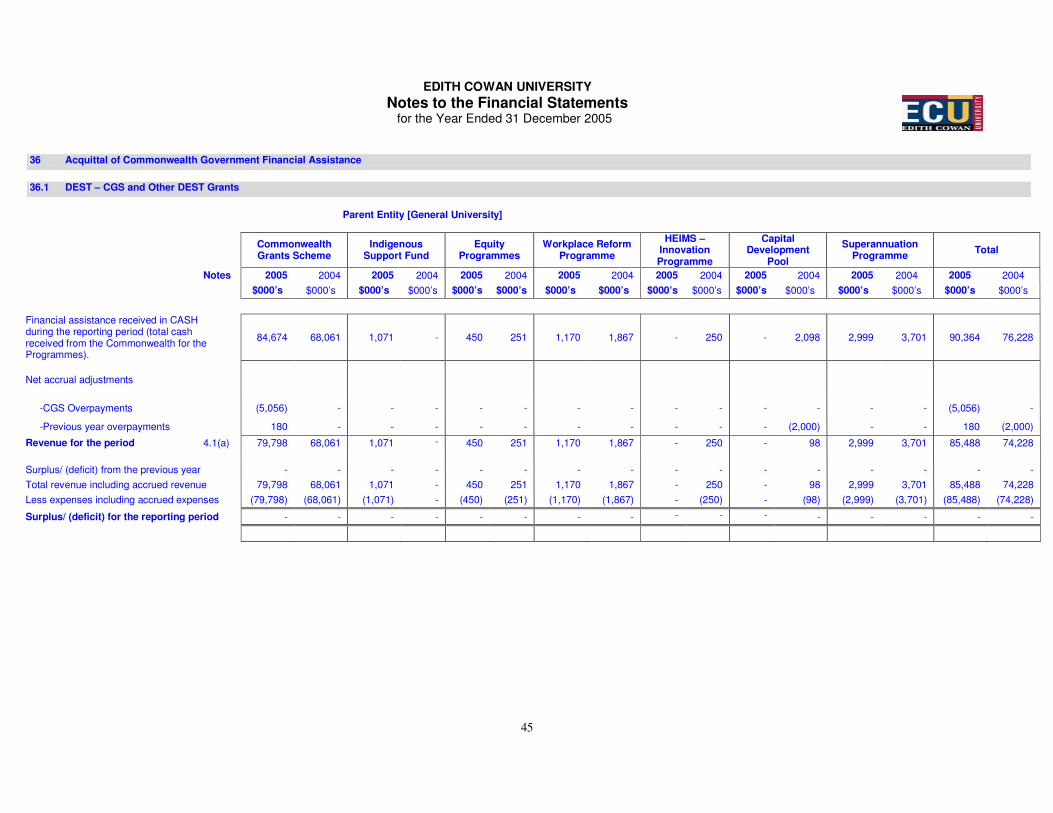
EDITH COWAN UNIVERSITY Notes to the Financial Statements
for the Year Ended 31 December 2005
45
36 Acquittal of Commonwealth Government Financial Assistance
36.1 DEST – CGS and Other DEST Grants
Parent Entity [General University]
Commonwealth
Grants Scheme Indigenous
Support Fund Equity
Programmes Workplace Reform
Programme
HEIMS – Innovation Programme
Capital Development
Pool
Superannuation Programme Total
Notes 2005 2004 2005 2004 2005 2004 2005 2004 2005 2004 2005 2004 2005 2004 2005 2004 $000’s $000’s $000’s $000’s $000’s $000’s $000’s $000’s $000’s $000’s $000’s $000’s $000’s $000’s $000’s $000’s
Financial assistance received in CASH during the reporting period (total cash received from the Commonwealth for the Programmes).
84,674 68,061 1,071
-
450 251 1,170 1,867 - 250 - 2,098 2,999 3,701 90,364 76,228
Net accrual adjustments
-CGS Overpayments (5,056) - - - - - - - - - - - - - (5,056) -
-Previous year overpayments 180 - - - - - - - - - - (2,000) - - 180 (2,000)
Revenue for the period 4.1(a) 79,798 68,061 1,071 - 450 251 1,170 1,867 - 250 - 98 2,999 3,701 85,488 74,228 Surplus/ (deficit) from the previous year - - - - - - - - - - - - - - - - Total revenue including accrued revenue 79,798 68,061 1,071 - 450 251 1,170 1,867 - 250 - 98 2,999 3,701 85,488 74,228 Less expenses including accrued expenses (79,798) (68,061) (1,071) - (450) (251) (1,170) (1,867) - (250) - (98) (2,999) (3,701) (85,488) (74,228)
Surplus/ (deficit) for the reporting period - - - - - - - - - - - - - - - -

Notes to the Financial Statements for the Year Ended 31 December 2005
49
36 Acquittal of Commonwealth Government Financial Assistance (Continued)
36.2 Higher Education Loan Programmes
Parent Entity [General University]
HECS-HELP) (Australian Government
payments only) FEE-HELP Total
Notes 2005 2004 2005 2004 2005 2004 $000’s $000’s $000’s $000’s $000’s $000’s Financial assistance received in CASH during the reporting period (total cash received from the Commonwealth for the Programmes).
48,943 46,309 4,984 4,245 53,927 50,554
Net accrual adjustments -Overpayment of HECS-HELP for 2005 (3,460) - - - (3,460) - -Previous year overpayments (761) - 181 103 (580) 103 Revenue for the period 4.1(b) 44,722 46,309 5,165 4,348 49,887 50,657 Surplus/ (deficit) from the previous year - - - - - - Total revenue including accrued revenue 44,722 46,309 5,165 4,348 49,887 50,657 Less expenses including accrued expenses (44,722) (46,309) (5,165) (4,348) (49,887) (50,657) Surplus/ (deficit) for the reporting period - - - - - -
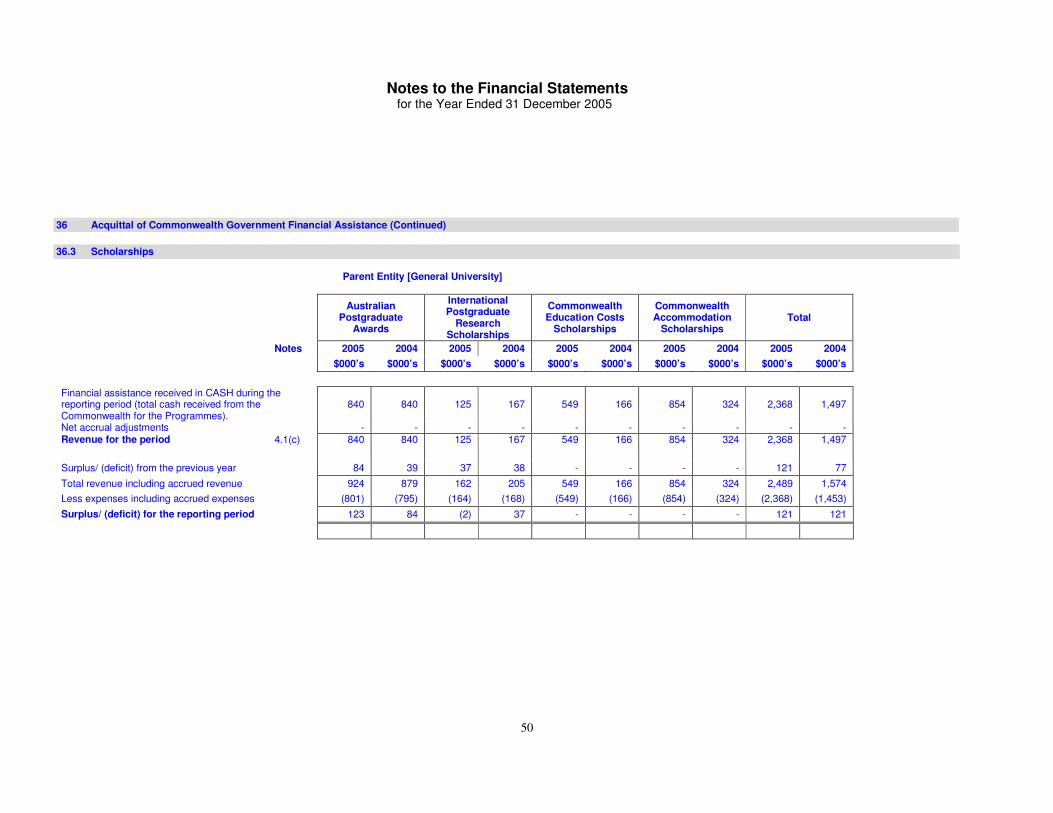
Notes to the Financial Statements for the Year Ended 31 December 2005
50
36 Acquittal of Commonwealth Government Financial Assistance (Continued)
36.3 Scholarships
Parent Entity [General University]
Australian
Postgraduate Awards
International Postgraduate
Research Scholarships
Commonwealth Education Costs
Scholarships
Commonwealth Accommodation
Scholarships Total
Notes 2005 2004 2005 2004 2005 2004 2005 2004 2005 2004 $000’s $000’s $000’s $000’s $000’s $000’s $000’s $000’s $000’s $000’s
Financial assistance received in CASH during the reporting period (total cash received from the Commonwealth for the Programmes).
840 840 125 167 549 166 854 324 2,368 1,497
Net accrual adjustments - - - - - - - - - - Revenue for the period 4.1(c) 840 840 125 167 549 166 854 324 2,368 1,497 Surplus/ (deficit) from the previous year 84 39 37 38 - - - - 121 77
Total revenue including accrued revenue 924 879 162 205 549 166 854 324 2,489 1,574 Less expenses including accrued expenses (801) (795) (164) (168) (549) (166) (854) (324) (2,368) (1,453) Surplus/ (deficit) for the reporting period 123 84 (2) 37 - - - - 121 121

Notes to the Financial Statements for the Year Ended 31 December 2005
51
36 Acquittal of Commonwealth Government Financial Assistance (Continued)
36.4 DEST Research
Institutional Grants Scheme
Research Training Scheme
Research Infrastructure Block
Grants Total
Notes 2005 2004 2005 2004 2005 2004 2005 2004 $000’s $000’s $000’s $000’s $000’s $000’s $000’s $000’s Financial assistance received in CASH during the reporting period (total cash received from the Commonwealth for the Programmes).
1,698 1,535 3,971 3,937 472 523 6,141 5,995
Net accrual adjustments - - - - - - - - Revenue for the period 4.1(d) 1,698 1,535 3,971 3,937 472 523 6,141 5,995 Surplus/ (deficit) from the previous year - - - - 15 78 15 78 Total revenue including accrued revenue 1,698 1,535 3,971 3,937 487 601 6,156 6,073 Less expenses including accrued expenses (1,698) (1,535) (3,971) (3,937) (487) (586) (6,156) (6,058) Surplus/ (deficit) for the reporting period - - - - - 15 - 15

Notes to the Financial Statements for the Year Ended 31 December 2005
52
36 Acquittal of Commonwealth Government Financial Assistance (Continued)
36.5 Australian Research Council Grants
Discovery - Projects (Large Grants)
Linkage – Infrastructure Linkage – Other Total
Notes 2005 2004 2005 2004 2005 2004 2005 2004 $000’s $000’s $000’s $000’s $000’s $000’s $000’s $000’s Financial assistance received in CASH during the reporting period (total cash received from the Commonwealth for the Programmes).
570 773 - - 615 681 1,185 1,454
Net accrual adjustments - - - - - - - - Revenue for the period 4.1(e) 570 773 - - 615 681 1,185 1,454 Surplus/ (deficit) from the previous year 169 43 205 205 412 194 786 442 Total revenue including accrued revenue 739 816 205 205 1,027 875 1,971 1,896 Less expenses including accrued expenses (646) (647) (205) - (788) (463) (1,639) (1,110) Surplus/ (deficit) for the reporting period 93 169 - 205 239 412 332 786

Notes to the Financial Statements for the Year Ended 31 December 2005
36 Acquittal of Commonwealth Government Financial Assistance (Continued)
36.6 Summary of Unspent Financial Assistance
Amount of unspent financial assistance as at
31 December 2005
Amount of unspent financial assistance that it
is more likely will be approved by the
Commonwealth for carry forward
Amount of unspent financial assistance that it
is more likely will be recovered by the Commonwealth
Category of Financial Assistance 2005 2005 2005 $'000 $'000 $'000
Teaching & Learning: Operating - - - Capital Development Pool - - - HECS - - - PELS - - - BOTPLS - - - ARC: Discovery – Projects (Large Grants) 93 93 - Linkage - Infrastructure - - - Linkage - Other 239 189 50 DEST: Australian Postgraduate 123 123 - International Postgraduate Research Scholarships (2) (2) -
Research Infrastructure Block Grants - - -
Total 453 403 50

ECU Annual Report 2005 Key Performance Indicators
Key Performance Indicators Certification
We hereby certify that the performance indicators are based on proper records, are
relevant and appropriate for assisting users to assess Edith Cowan University’s
performance, and fairly represent the performance of Edith Cowan University for the
year ending 31 December 2005.
Hendy Cowan Patrick Garnett
Chancellor Acting Vice-Chancellor
1
27 February, 2006 27 February, 2006

ECU Annual Report 2005 Key Performance Indicators
Key Performance Indicators (KPIs) The ECU Strategic Plan 2003-2007 sets out the following mission and five Strategic Priorities for the University: 1. Enhancing Teaching, Learning and Research 2. Engaging with the Professions and Professional Life 3. Building Partnerships, Pathways and Precincts 4. Improving Outcomes for Students and Staff 5. Strengthening Enterprise and the Resource Base
The Mission of Edith Cowan
University is to provide, within a diverse and dynamic learning
environment, university education of recognised
quality, especially for those people employed in, or seeking
employment in, the service professions.
To demonstrate how well ECU is performing in terms of these Strategic Priorities, a number of effectiveness and efficiency indicators are presented below. These KPI’s are generally consistent with those used elsewhere within the Higher Education Sector, and focus on the University’s core business (teaching, learning and research), and core stakeholders (students). Effectiveness Indicators: Enhancing Teaching, Learning and Research 1. Retention Rate 2. Course Satisfaction 3. Quality of Teaching 4. Research Funding Improving Outcomes for Students and Staff 5. Graduate Employment 6. Share of First Preferences Efficiency Indicators: 7. Research Higher Degree Completions 8. Research and Development Publication Research per 10 Academic Staff - DEST 9. Teaching – Related Expenditure per Student Load (EFTSL) 1. Enhancing Teaching, Learning and Research ECU is focused on
“the education of learners for the knowledge based service professions, and will be recognised for the quality of its teaching and its learning opportunities in those fields. ECU is a teaching and research university, and research will inform its teaching. ECU will be sought out to participate in research projects and productive partnerships. This will be because of the University's excellence in collaboration and the delivery of research outcomes that contribute to policy development and improved practice in the professional fields of business, human services and education, and to advances in health, information and communication technologies and the environment.” (ECU Strategic Plan 2003 – 2007, page 9)
2

ECU Annual Report 2005 Key Performance Indicators
Key Performance Indicators related to these outcomes are – • Retention Rate • Course Satisfaction • Quality of Teaching • Research Funding 1. Retention Rate
The Retention Rate is used to indicate how effective the University is at retaining its
students from one year to the next. Many factors impact on a student’s decision to
remain at a university. These include university-controlled factors such as course
content, teaching styles, learning support, and institutional infrastructure. They also
include factors such as individual expectations, financial and social circumstances
over which a university has little or no influence. Nevertheless, this indicator is
commonly used to show a university’s ability to retain its students.
Student Retention has been a high priority for the University’s teaching and learning
activities and is a focus of the Teaching and Learning Management Plan. ECU has had
a reduction of retention rate in 2004, with the 2004 result being 6.3% less then 2003.
While there are many factors contributing to performance against this indicator, the
buoyant WA employment market is believed to be a major contributing factor to this
change. This is a lagging indicator; results for 2004 are the latest available for the
current reporting period.
Table 1: Student Retention Rate
Year of Commencement
2000 2001 2002 2003 2004
Edith Cowan University 82.5% 84.2% 85.0% 85.4% 79.1% Source: DEST Higher Education Statistics Collection Return, Edith Cowan University. Definition: The percentage of students who commence a Bachelor Pass course in a given year and either complete, defer or are still enrolled in the same or an alternative course one year later.
3

ECU Annual Report 2005 Key Performance Indicators
2. Course Satisfaction
Course Satisfaction is used to indicate how satisfied students are with the education
and service provided, given their expectations and experience of their course. This
indicator is derived from the results of the Course Experience Questionnaire (CEQ),
which is conducted annually by the Graduate Careers Council of Australia (GCCA).
The number of 2004 ECU Bachelor Pass graduates surveyed during 2005 was 3621, of
whom 1883 responded for a 52% response rate. This is a lagging indicator, reflecting
the time of publication by the GCCA. Results for 2004 are the latest available for the
current reporting period.
The University’s performance for this indicator has gone down by 1.3% in 2004,
compared to 2003, which was a peak year following gradual increases between 2000
and 2003. Despite the decrease, the 2004 course satisfaction level remains above the
2000 level and is only marginally below the 2004 national average of 89%.
The GCCA states that comparison of CEQ results between disciplines and universities
is not recommended. This reflects the different student cohorts, subject matter, and
professional requirements that make such comparisons problematic. The GCCA
suggests that bona fide comparisons can only be made between like disciplines across
institutions using trends over time.
Table 2: Course Satisfaction
Year of Completion
2000 2001 2002 2003 2004
Edith Cowan University 88.0% 89.0% 89.5% 89.9% 88.6% Source: National Course Experience Questionnaire results 2000-2004 graduates. Definition: The percentage of Bachelor Pass students who ‘broadly agree’ (score #3 or #4 or #5 on a five-point Likert scale) with the overall satisfaction statement from the Annual Course Experience Questionnaire (CEQ).
4
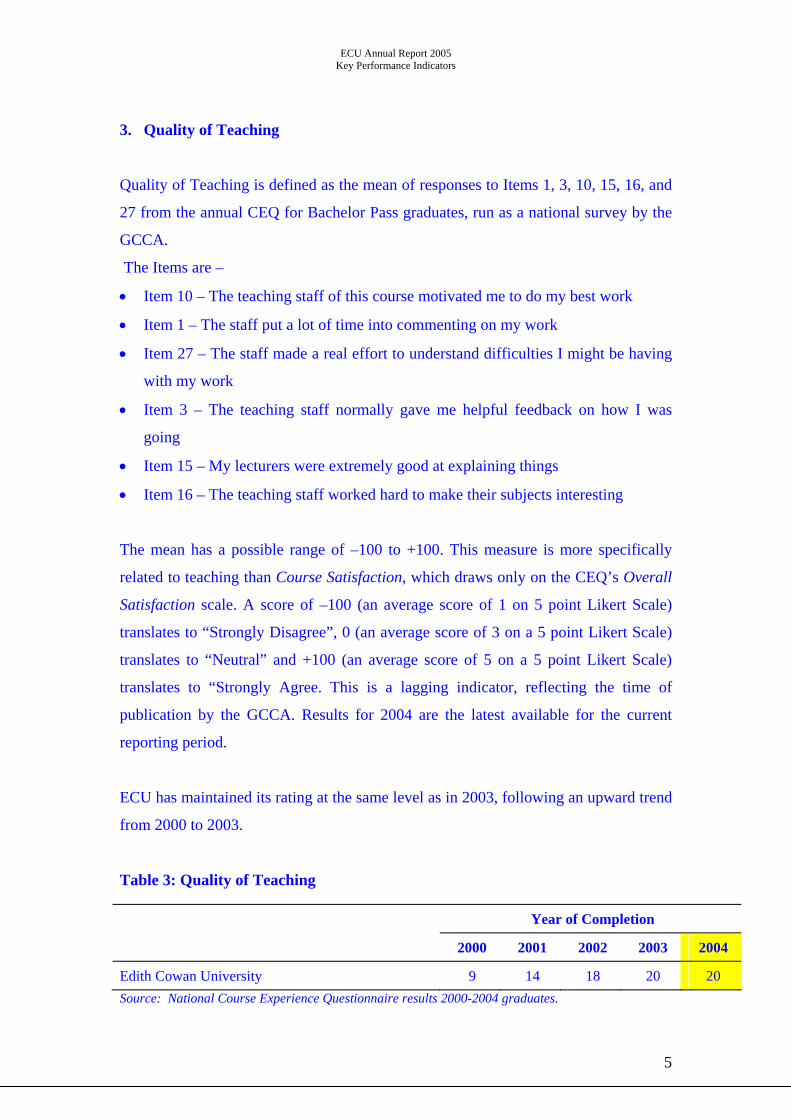
ECU Annual Report 2005 Key Performance Indicators
3. Quality of Teaching
Quality of Teaching is defined as the mean of responses to Items 1, 3, 10, 15, 16, and
27 from the annual CEQ for Bachelor Pass graduates, run as a national survey by the
GCCA.
The Items are –
• Item 10 – The teaching staff of this course motivated me to do my best work
• Item 1 – The staff put a lot of time into commenting on my work
• Item 27 – The staff made a real effort to understand difficulties I might be having
with my work
• Item 3 – The teaching staff normally gave me helpful feedback on how I was
going
• Item 15 – My lecturers were extremely good at explaining things
• Item 16 – The teaching staff worked hard to make their subjects interesting
The mean has a possible range of –100 to +100. This measure is more specifically
related to teaching than Course Satisfaction, which draws only on the CEQ’s Overall
Satisfaction scale. A score of –100 (an average score of 1 on 5 point Likert Scale)
translates to “Strongly Disagree”, 0 (an average score of 3 on a 5 point Likert Scale)
translates to “Neutral” and +100 (an average score of 5 on a 5 point Likert Scale)
translates to “Strongly Agree. This is a lagging indicator, reflecting the time of
publication by the GCCA. Results for 2004 are the latest available for the current
reporting period.
ECU has maintained its rating at the same level as in 2003, following an upward trend
from 2000 to 2003.
Table 3: Quality of Teaching
Year of Completion
2000 2001 2002 2003 2004
Edith Cowan University 9 14 18 20 20
5
Source: National Course Experience Questionnaire results 2000-2004 graduates.

ECU Annual Report 2005 Key Performance Indicators
4. Research Funding Research Funding obtained during a prescribed year, in terms of DEST Categories 1,
2, 3 and 4 is a measure of the University’s research activity.
It should be acknowledged that levels of Research Funding can be strongly influenced
by the receipt of large grants. The relatively small number of such grants may limit the
capacity of the institution to maintain performance at a high level. This is a lagging
indicator, reflecting the time to publication by the Commonwealth Department of
Education, Science and Training (DEST). Results for 2004 are the latest available for
the current reporting period.
The University’s total performance has improved considerably in 2004 over 2003,
following a growth trend over 2000 to 2002. Figures for all categories other than
Category 4, are higher in 2004 than at any of the four previous years. The specific
variation with category is reflective of the nature of the competitive grant process and
the pipelining effects of relatively small numbers of comparatively large grants
working through the system.
Table 4: Research Funding ($M) DEST Categories 2000 2001 2002 2003 2004 Category 1 - National Competitive Research Grants
1.082 1.827 1.547 1.506 2.271
Category 2 - Other Public Sector Research Funding
2.032 2.540 2.725 2.512 4.195
Category 3 - Industry and Other Funding for Research
1.504 0.739 1.155 1.354 1.797
Category 4 - Cooperative Research Centre Funding
0.020 0.057 0.028 0.010
Total 4.618 5.126 5.484 5.399 8.273 Source: DEST Annual Financial and Research and Development Collections Return, Edith Cowan University
6

ECU Annual Report 2005 Key Performance Indicators
Improving Outcomes for Students Desired Outcomes -
“ECU will provide a challenging and supportive environment suited to the students that study at the University, so they can realise their potential and develop the skills and flexibility needed to succeed in their careers. It will shape policies, programs, services and infrastructure to foster the active engagement of students in support of ECU's strategic positioning as a leader in education for the service professions. This priority will be outcomes focused.” ECU Strategic Plan 2003 – 2007, page 16
The Key Performance Indicators related to these outcomes are –
• Graduate Employment
• Share of First Preferences
5. Graduate Employment Graduate Employment is used to indicate the extent to which graduates find
employment and is a measure used by the sector to indicate the quality of learning
outcomes. The indicator is limited to Bachelor Pass and Honours students to remove
any skewing of the data by research and higher degree graduates (many of whom
already have jobs in their chosen professions). This indicator is defined in such a way
as to factor in the desired employment mode (full-time or part-time) of graduates. As
such, a graduate working part-time but not seeking full-time work is included as
‘working in the mode of their choice’. In recognition of the diverse nature of the
University’s students, graduates are included irrespective of their mode of study.
Results for 2004 are the latest available, as again this is a lagging indicator reflecting
the availability and publication of data from GCCA.
In 2004, there is a 6% decline in graduate employment. This is mostly attributed to the
downturn in the graduate employment in various areas such as Natural and Physical
Sciences and Management and Commerce related fields. Results for 2004 are the
lowest in the last ten years.
7

ECU Annual Report 2005 Key Performance Indicators
The GCCA states that comparison of CEQ or GDS results between disciplines and
universities is not recommended. This reflects the different student cohorts, subject
matter, and professional requirements that make such comparisons problematic.
Table 5: Graduate Employment
Year of Completion
2000 2001 2002 2003 2004
Edith Cowan University 80.9% 76.7% 72.9% 73.6% 67.6% Source: National Graduate Destination Survey Results 2000 – 2004 Graduates Definition: The percentage of Bachelor Pass and Honours graduates working in the mode of their choice as a percentage of the total number of graduates seeking work. Mode relates to full-time or part-time.
6. Share of First Preferences This Key Performance Indicator is the most public expression of the level of demand
for entry to the University within the broader competitive market and reflects the
composite achievements of many initiatives and the general perception of the
University by potential students and the community.
In 2005, ECU marginally increased its market share in percentage terms. Not
withstanding this increase, the absolute number of ECU First Preferences declined
from 5894 First Preferences in 2004 to 5397 in 2005 (-8.4%), part of an overall WA
decrease in First Preferences of 2018 (-8.9%).
Table 6: Share of First Preferences to WA Universities through TISC
University 2001 2002 2003 2004 2005
Edith Cowan University 22.35% 23.81% 27.89% 26.01% 26.14%
Curtin University 33.21% 32.35% 30.25% 31.33% 30.23%
Murdoch University 16.63% 16.29% 17.03% 16.75% 17.41%
University of Western Australia 27.80% 27.56% 24.83% 25.91% 26.21% Source: Tertiary Institution Service Centre Definition: Each WA University’s share of First Preferences processed by TISC after the closure of all processing
8

ECU Annual Report 2005 Key Performance Indicators
7. Research Higher Degree Completions
Research Higher Degree Completions is defined as the number of Higher Degree by
Research (HDR) completions per year. This figure is important because it shows the
level of throughput of higher degree research students, which is in turn an indirect
indication of the appropriateness of student selection and the quality of higher degree
supervision. Completions, however, need to be considered in relation to the size of
HDR load if they are to be used as a measure of the efficiency of research training.
After a significant increase between 2001 and 2002, ECU has increased completions
in 2004 compared to all previous years, with the number of completions representing
a record high.
Table 7: Higher Degree Research Completions
2000 2001 2002 2003 2004
Higher Degree by Research Completions 75 58 76 75 84
Source: DEST Higher Education Statistics Collection Return, Edith Cowan University. 8. Research and Development Publication Research per 10 Academic Staff -
DEST This indicator shows the research output in terms of publications per 10 research
academic staff of Level B and above. The indicator shows that the performance has
decreased in categories B & C1, but increased in categories A1 and E1, relative to
2003. The University’s Research and Research Training Management Plan
incorporates strategies for improving the University’s research performance, and is
intended to lead to growth in research publications in the future. This is using a
lagging indicator, reflecting the availability of data from DEST. Results for 2004 are
the latest available for the current reporting period.
9

ECU Annual Report 2005 Key Performance Indicators
Table 8: Research and Development Publications per 10 Staff – DEST
DEST Categories 2000 2001 2002 2003 2004
Staff (FTE) 455 458 453 451 457
A1 – Authored Research 0.09 0.09 0.21 0.10 0.20
B – Book Chapter 1.16 0.65 0.65 1.36 0.99
C1 – Article in Scholarly Refereed Journal 4.20 4.24 4.25 4.60 4.40
E1 – Full Written Paper-Refereed Proceedings
5.58 6.77 5.95 5.61 5.80
J1 – Major Original Creative Works 0.00 0.19 0.00 0.00 0.00 Source: DEST Annual Research and Development Annual Collection, Edith Cowan University. Definition: The number of publications in DEST categories A1, B, C1, E1 and J1 per 10 FTE academic ‘teaching and research’ and ‘research only’ staff at Level B and above, produced during a prescribed year.
9. Teaching Related Expenditure per Student Load ( EFTSL)
This indicator is included to show how efficiently the University uses its funds for
teaching and learning. The indicator has been refined from that used in previous years
by broadening the scope from ‘Teaching Expenditure’ to ‘Teaching Related
Expenditure’. Teaching Related Expenditure is defined as Total Expenditure less
Research Only Expenditure. This enables data to be reported annually rather than
biennially, as was previously the case.
The figures for 2002 to 2005 show that Teaching Related Expenditure / Total Load
(2005 $) has increased in 2005, relative to previous years. This change is due to
increases in salary related expenditure as a result of enterprise bargaining related
salary increments coupled with a reduction in the total load (EFTSL) in 2005.
10

ECU Annual Report 2005 Key Performance Indicators
Table 9: Teaching Related Expenditure per Student Load (EFTSL)
2002 2003 2004 2005
Teaching Related Expenditure ($’000) 173,189 173,401 197,346 210,833
Total Load (EFTSL) 15,445 15,889 16,170 15,693
Teaching Related Expenditure / Total Load ($) 11,254 10,913 12,204 13,435
Teaching Related Expenditure / Total Load (2005 $)* 12,294 11,681 12,689 13,435 Note: The prior year comparatives have been amended to agree to the latest published audited financial statements * CPI is Perth All Groups as at December Quarter2005 Source: ECU General Ledger and DEST Higher Education Statistics Collections, Edith Cowan University. Definition: Teaching Related Expenditure expressed per EFTSL (includes total TAFE EFTSL).
11
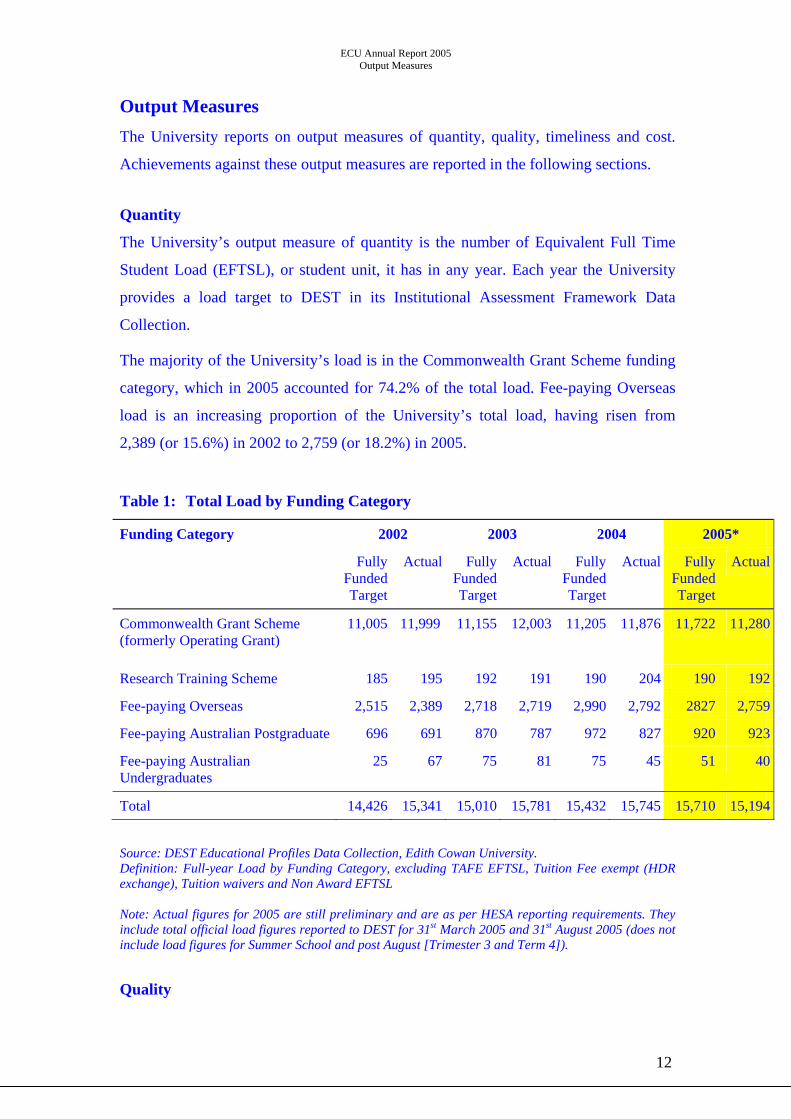
ECU Annual Report 2005 Output Measures
Output Measures The University reports on output measures of quantity, quality, timeliness and cost.
Achievements against these output measures are reported in the following sections.
Quantity
The University’s output measure of quantity is the number of Equivalent Full Time
Student Load (EFTSL), or student unit, it has in any year. Each year the University
provides a load target to DEST in its Institutional Assessment Framework Data
Collection.
The majority of the University’s load is in the Commonwealth Grant Scheme funding
category, which in 2005 accounted for 74.2% of the total load. Fee-paying Overseas
load is an increasing proportion of the University’s total load, having risen from
2,389 (or 15.6%) in 2002 to 2,759 (or 18.2%) in 2005. Table 1: Total Load by Funding Category
Funding Category 2002 2003 2004 2005*
Fully Funded Target
Actual Fully Funded Target
Actual Fully Funded Target
Actual Fully Funded Target
Actual
Commonwealth Grant Scheme (formerly Operating Grant)
11,005 11,999 11,155 12,003 11,205
11,876 11,722 11,280
Research Training Scheme 185 195 192 191 190 204 190 192
Fee-paying Overseas 2,515 2,389 2,718 2,719 2,990 2,792 2827 2,759
Fee-paying Australian Postgraduate 696 691 870 787 972 827 920 923
Fee-paying Australian Undergraduates
25 67 75 81 75 45 51 40
Total 14,426 15,341 15,010 15,781 15,432 15,745 15,710 15,194 Source: DEST Educational Profiles Data Collection, Edith Cowan University. Definition: Full-year Load by Funding Category, excluding TAFE EFTSL, Tuition Fee exempt (HDR exchange), Tuition waivers and Non Award EFTSL Note: Actual figures for 2005 are still preliminary and are as per HESA reporting requirements. They include total official load figures reported to DEST for 31st March 2005 and 31st August 2005 (does not include load figures for Summer School and post August [Trimester 3 and Term 4]).
Quality
12

ECU Annual Report 2005 Output Measures
The University reports Course Satisfaction as its output measure of teaching quality.
This indicator reflects students’ overall satisfaction with their course experience at
Edith Cowan University and thus is an indicator of perceived quality.
Table 2: Course Satisfaction
Year of Completion
2000 2001 2002 2003 2004
Edith Cowan University 88.0% 89.0% 89.5% 89.9% 88.6% Source: National Course Experience Questionnaire results 1999-2004 graduates. Definition: The percentage of Bachelor Pass students who ‘broadly agree’ (score #3 or #4 or #5 on a five-point Likert scale) with the overall satisfaction statement from the Annual Course Experience Questionnaire (CEQ).
The University aims to be in line with the national average on this measure. The
National average for 2004 graduates was 89% and the ECU result was only marginally
below this figure.
Timeliness The University’s output measure of timeliness is the Student Progress Rate. The
indicator reflects our students’ timely progress through their degree course. Table 3
shows that the University’s performance has been consistently trending upwards. The
results for 2004 are the latest available.
Table 3: Student Progress Rate
Year of Study
2000 2001 2002 2003 2004
Edith Cowan University 83.9% 85.0% 85.7% 86.8% 88.3% Source: DEST Higher Education Statistics Collection Return, Edith Cowan University. Definition: The percentage of Bachelor Pass coursework degree unit load passed to total unit load attempted excluding all units for which no final results are available. Load is defined as the number of Equivalent Full Time Student Loads – a classification that takes into account full-time and part-time student enrolments.
13
The University aims to have a progress rate of at least 85%, which is in line with the
National average.
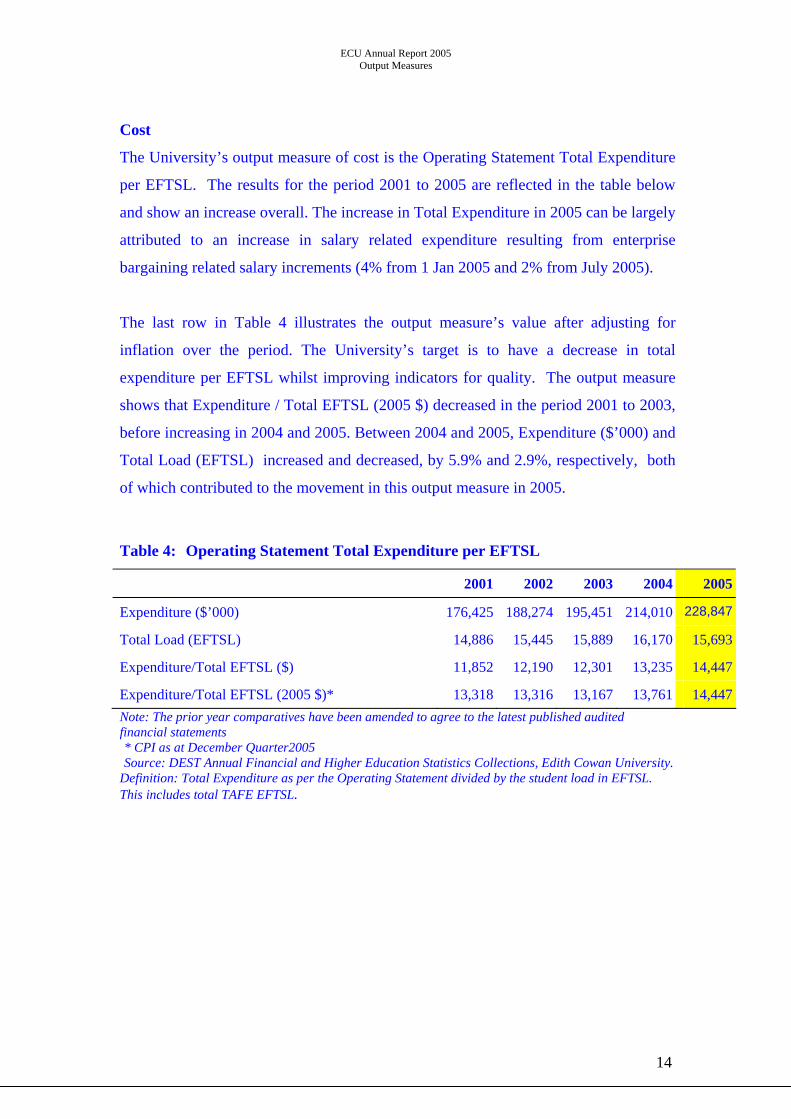
ECU Annual Report 2005 Output Measures
Cost
The University’s output measure of cost is the Operating Statement Total Expenditure
per EFTSL. The results for the period 2001 to 2005 are reflected in the table below
and show an increase overall. The increase in Total Expenditure in 2005 can be largely
attributed to an increase in salary related expenditure resulting from enterprise
bargaining related salary increments (4% from 1 Jan 2005 and 2% from July 2005).
The last row in Table 4 illustrates the output measure’s value after adjusting for
inflation over the period. The University’s target is to have a decrease in total
expenditure per EFTSL whilst improving indicators for quality. The output measure
shows that Expenditure / Total EFTSL (2005 $) decreased in the period 2001 to 2003,
before increasing in 2004 and 2005. Between 2004 and 2005, Expenditure ($’000) and
Total Load (EFTSL) increased and decreased, by 5.9% and 2.9%, respectively, both
of which contributed to the movement in this output measure in 2005.
Table 4: Operating Statement Total Expenditure per EFTSL
2001 2002 2003 2004 2005
Expenditure ($’000) 176,425 188,274 195,451 214,010 228,847
Total Load (EFTSL) 14,886 15,445 15,889 16,170 15,693
Expenditure/Total EFTSL ($) 11,852 12,190 12,301 13,235 14,447
Expenditure/Total EFTSL (2005 $)* 13,318 13,316 13,167 13,761 14,447Note: The prior year comparatives have been amended to agree to the latest published audited financial statements * CPI as at December Quarter2005 Source: DEST Annual Financial and Higher Education Statistics Collections, Edith Cowan University.
14
Definition: Total Expenditure as per the Operating Statement divided by the student load in EFTSL. This includes total TAFE EFTSL.