report on passing rates of commission-approved ... 03, 2012 · report on passing rates of...
TRANSCRIPT

Strategic Plan Goal: 1 Promote educational excellence through the preparation and certification of professional educators.
♦ Sustain high quality standards for the preparation and performance of professional educators and for the accreditation of credential programs
January 2012
3B Information
Professional Services Committee
Report on Passing Rates of Commission-Approved
Examinations from 2006-2007 to 2010-2011
Executive Summary: This agenda item reports the passing rates of Commission-approved examinations. For each examination, the purpose of the examination, its structure, the scoring process, the examination volume, the first-time passing rate, and the cumulative passing rate are discussed. When available, the passing rate by demographic data is also discussed.
Recommended Action: For information only Presenter: Michael Taylor and Phyllis Jacobson, Consultants, Professional Services Division


PSC 3B-1 January 2012
Report on Passing Rates of Commission-Approved
Examinations from 2006-2007 to 2010-2011
Introduction This agenda item presents the passing rates for Commission-approved examinations over the past five years, 2006-2007 through 2010-2011. The purpose of each examination, the structure, the scoring process, the volume, and the first-time and cumulative passing rates are discussed in detail. Additional data tables referenced throughout this item are presented in an appendix to this agenda item available on the Commission website. Background The Commission on Teacher Credentialing (Commission) issues credentials, certificates, and permits that authorize service as a teacher, administrator, counselor, or other professional service provider in California’s public school. California uses a number of examinations to assess candidates’ competencies in basic skills, subject matter proficiency, and/or professional knowledge. Basic Skills Examinations The California Basic Educational Skills Test (CBEST) is one method used to verify basic proficiency in reading, mathematics, and writing, which is a requirement for nearly all credentials, certificates, and permits. Candidates who have not yet met this requirement are also required to take a basic skills exam for diagnostic purposes prior to admission to a program of professional preparation, and must pass the examination prior to certification. The CBEST was first administered in 1982. Subject Matter Competency Examinations The California Subject Examinations for Teachers (CSET) is the current set of examinations used to verify candidates’ subject matter knowledge. Candidates are required to demonstrate competency in the content area(s) they will teach. The CSET examinations measure candidates’ subject matter knowledge, skills, and abilities, not their pedagogical knowledge. The CSET examinations are offered for multiple subject candidates and in a range of content areas for single subject candidates. Education specialist candidates also use this option to verify subject matter knowledge. The CSET was first administered in 2003. Beginning with the May 2007 administration of the CSET: Multiple Subjects examination, an optional fourth subtest known as the CSET: Writing Skills examination was added. Candidates for a multiple subject credential may use the CSET: Multiple Subjects examination plus the CSET: Writing Skills subtest to verify basic skills as an alternative to passing the CBEST. Professional Knowledge Examinations The Reading Instruction Competence Assessment (RICA) is designed to test professional knowledge about the teaching of reading. All multiple subject and education specialist teacher preparation programs are required to include instruction in the teaching of reading in their

PSC 3B-2 January 2012
methodology courses. California candidates for these credentials must pass the RICA before they are recommended for a preliminary credential. Passage of the RICA is not a requirement for the single subject teaching credential. The RICA was first administered in 1998 and revised in 2009. The California Teachers of English Learners (CTEL) examination is used by candidates other than those prepared in SB 2042 teacher preparation programs (such as, for example, out of state candidates) to demonstrate they have the level of knowledge and skills required to effectively teach English learner (EL) students. The prior CLAD (Crosscultural Language and Academic Development) examination previously used for this purpose was replaced with the CTEL examination in December 2005. For candidates seeking a bilingual authorization via examination, the bilingual-specific subtests of the CSET: World Language (formerly the Languages Other Than English) examinations are used to demonstrate bilingual language and cultural knowledge and skills. The prior BCLAD (Bilingual Crosscultural Language and Academic Development) examination was replaced by the CSET bilingual-specific subtests in 2007. The Teaching Foundations Examinations (TFE) satisfies a part of the pedagogical portion of the Early Completion Option of the internship program for multiple subject and selected single subject credentials. The TFE was first administered in 2004. The TFE is owned and administered by the Educational Testing Service and is not a Commission-owned examination. The School Leaders Licensure Assessment (SLLA) measures whether potential entry-level principals and other school leaders have relevant knowledge necessary for competent professional practice. The SLLA is owned by the Educational Testing Service and was first administered for California candidates in 2003. Beginning in June 2011, the California Preliminary Administrative Credential Examination (CPACE), an exam aligned specifically to California standards, replaced the SLLA. The SLLA is no longer used by California candidates for an administrative services credential. Caveats about the Data Passing rate data are based on examinees’ test scores. When the total number of examinees for a given examination is less than 10, pass rate data may not be reported. Preparation and demographic data are self-reported by examinees, and thus these data may not be available for all candidates. Whenever demographic variables are available, the passing rate by demographic variables such as gender, ethnicity, educational level, preparation, and parents’ education levels are presented in the Appendix http://www.ctc.ca.gov/commission/agendas/2012-01/2012-01-3B-Appendix.pdf. Definition of Terms Some of the commonly used terms in this agenda item are: • Cohort – a group of examinees who took a particular examination in a particular year. • Criterion-referenced test – a test designed to measure an examinee’s knowledge and skills in
relation to an established standard rather than in relation to the performance of other examinees. Examinees who know the content covered by the test would be expected to do well.

PSC 3B-3 January 2012
• Cumulative passing rate – the number of examinees who have passed the examination divided by the number of examinees who have taken all sections or subtests of the examination. Cumulative passing rate takes into account the fact that examinees can take the examination as many times as needed in order to pass. Please note that the 2010-2011 cohort for any examination has had fewer opportunities to retake the examination at the time of preparation of this report than prior cohorts, which would affect the cumulative passing rate.
• First-time passing rate – the number of examinees who passed all sections or subtests of the examination the first time they took each divided by the total number of first-time examinees who took all sections or subtests.
Institutional Data Reports The Commission’s examinations contractor provides institutional data reports concerning each institution’s candidates for those candidates who chose to list the institution at the time of registration as a score recipient. The Commission determines which institutions are authorized score report recipients, and those institutions are listed in each registration bulletin under “Score Reporting Institutions.” The individual at each authorized score recipient institution who receives the reports is determined by that institution. Each year, the Commission’s examinations contractor requests each institution to designate an individual with his/her contact information. Throughout the year, however, institutions may contact the contractors to update their score reporting contact information. Score reports are provided following each test administration, and include data for examinees who selected that institution as a score recipient. The institutional score reports are posted one week after the examinee score data are available, and can be accessed by the institutional contact person from a secure, password-protected web site. Information is made available to the institutions based on their needs. The files available for downloading may include the following:
• Instruction manual • Examinee roster report • Institution and statewide summary report
Summary statistics are provided for the institution based on all examinees who selected that institution as a score recipient when they registered may include:
• Number of examinees tested • Mean scaled score • Number and percentage of examinees passing or not passing • Performance by skill area
Individual examinee information provided for examinees who selected that institution as a score recipient when they registered may include:
• Name and other identifying information • Test administration date • Tests/subtests taken • Passing status • Scaled scores for tests not passed • Multiple choice section performance • Constructed response section performance • Performance by skill area

PSC 3B-4 January 2012
Report on Individual Commission Examinations CBEST: California Basic Educational Skills Test The California Basic Educational Skills Test (CBEST) measures basic proficiency in reading, mathematics, and writing. The examination is given in English, and all responses must be in English. Verifying basic skills proficiency is a requirement for nearly all credentials, certificates, and permits. California Education Code Sections 44252 and 44252.6 allow several options for individuals to meet the basic skills requirement. Currently individuals can demonstrate basic skills proficiency by
• taking and passing the CBEST; or • passing a basic skills examination from another state; or • passing the CSET: Multiple Subjects plus the CSET: Writing Skills Test; or • passing both the math and the English sections of the California State University
(CSU) Early Assessment Program (EAP); or • passing both of the CSU placement examinations: English Placement Test and Entry
Level Mathematics. The CBEST consists of three sections – reading, mathematics, and writing. Each section assesses basic skills and concepts that are important to performing the job of an educator in California. At each administration, examinees can take one, two, or three sections of the test during a single four-hour testing session. No individual test section is timed. The CBEST has been administered six times per year as a paper-based test at multiple sites in California as well during 12 testing windows per year as a computer-based test inside as well as outside of California until 2011. Beginning in 2011, the computer-based CBEST became available on demand throughout the year at the contractor’s computer-based testing centers along with the six times per year paper-based test administrations.
Reading Section: The CBEST Reading section consists of 50 multiple-choice questions: 40 “scorable” questions used to determine a candidate’s score, and 10 “nonscorable” questions that are being field-tested and are not used to determine a candidate’s score. The questions assess the candidate’s ability to comprehend information presented in written passages, tables, and graphs. Two major skill areas are covered: (a) critical analysis and evaluation, and (b) comprehension and research skills. Approximately 40 percent of the questions assess critical analysis and evaluation skills, and approximately 60 percent assess comprehension and research skills. Mathematics Section: The CBEST Mathematics section consists of 50 multiple-choice questions: 40 “scorable” and 10 “nonscorable.” The questions require the candidate to solve mathematical problems, and most are presented as word problems. The questions assess skills in three major areas: (a) estimation, measurement, and statistical principles; (b) computation and problem solving; and (c) numerical and graphic relationships. Approximately 30 percent of the questions are from skill area (a), 35 percent from skill area (b), and 35 percent from skill area (c).

PSC 3B-5 January 2012
Writing Section: The CBEST Writing section assesses the candidate’s ability to write effectively. Candidates are provided two essay topics and are asked to write a response to each. One of the topics requires a written analysis of a specific situation or statement; the other asks the candidate to write about a personal experience. Examinees are not expected to demonstrate specialized knowledge of any topic in their response.
Scoring of the CBEST The Reading and Mathematics sections of the CBEST consist entirely of multiple-choice questions that are machine-scored. A raw score for each of these sections is calculated by totaling the number of questions answered correctly. There is no penalty for incorrect answers. The raw scores are then converted to scaled scores. The Writing Section consists of two essays, each of which is double-scored, using a holistic rubric that ranges from a low score of one to a high score of four. The scores from both essays are summed, yielding a Writing Section raw score that can range from 4 to 16. The raw score is then converted to a scaled score. The total score is obtained by adding the Mathematics, Reading and Writing scaled scores together. Table 1: CBEST State Passing Score Standard and Score Range
Test Name State Passing Score Standard Score Range CBEST
• Reading • Mathematics • Writing
a scaled score of 41 in each of the three sections (a score as low as 37 on any section is acceptable
if the minimum total score is 123)
20 – 80 for each section
Examination Volume The volume of CBEST examinations administered has declined dramatically from 74,122 in 2006-07 to 44,778 in 2010-11. Overall, this is a decline of more than 29,000 examinees, or almost 40 percent, in the past five years. Beginning in May 2007, two additional Commission examination options became available for individuals to meet the basic skills requirement. The first allows out-of-state individuals to use their home state’s basic skills examination, if the examination is comparable to CBEST, to satisfy this requirement. The second option allows individuals to satisfy this requirement by passing the California Subject Examinations for Teachers: Multiple Subjects (CSET: MS) plus the CSET: Writing Skills subtest. In 2010-11, 1,427 examinees took both the CSET: MS and the CSET: Writing Skills examinations. See Appendix B2 for details on the CSET: Writing Skills subtest. Table 2 provides the number of CBEST examinees and test sections administered for the past six testing years. These data include all examinees who took the CBEST for California purposes, either within or outside California.

PSC 3B-6 January 2012
Table 2: Number of CBEST Examinees and Test Sections Administered, 2006 – 2011
Testing Year Total Number of Examinees
Total Number of Test Sections Administered Reading Mathematics Writing
2006-07 74,122 59,546 59,892 59,545 2007-08 72,747 58,435 58,659 58,653 2008-09 70,002 56,960 56,798 56,840 2009-10 53,252 42,923 42,905 44,011 2010-11 44,778 35,952 35,900 37,202
Preparation and Demographic Data The preparation and demographic data for the CBEST are presented in Appendix A1: CBEST Preparation and Demographic Data, Cohorts 2006 to 2010. Approximately 34 percent of all test takers reported Algebra II and/or Geometry as their highest mathematics course in high school, and over one-third reported that they completed Pre-calculus in high school. More than two-thirds reported that they completed one or two Writing courses in high school. Less than one-fifth of the examinees reported completing one or two courses in high school Oral Language courses. More than three-fourths reported high school grade point averages of at least 3.0. About five percent of the examinees reported high school grade point averages below 2.5. Nearly three-fourths of the examinees completed all of their high school education in California. Nearly half of the examinees reported that the highest college mathematics course they completed was Calculus and/or Statistics. About 7 percent reported completing no college mathematics courses. Nearly three-fourths reported completing one to three courses in Writing and about 41 percent reported taking college courses in Oral Language. More than two-thirds reported an undergraduate college grade point average of 3.0 or higher. More than half of the examinees reported having a bachelor’s degree or a bachelor’s degree and additional units. About one-third had not yet earned a bachelor’s degree, but about 12 percent reported having a master’s degree. Almost 30 percent reported currently attending college while 39 percent indicated it had been three years or less since they attended. Less than one-fifth reported that it had been more than ten years since they attended college. Nearly two-thirds reported that they were currently enrolled in a teacher preparation program and another eleven percent reported they were considering enrollment in a teacher preparation program. Few examinees (7.8%) reported taking test preparation courses. Nearly half reported taking the examination for obtaining a teaching credential and another one-third reported that the reason for taking the CBEST was for full-time or part-time employment or for substitute teaching. At the time they tested, more than one-third of the examinees in the five-year cohorts reported being employed, but not in a school position. Another 26 percent reported being students. Almost two-thirds (62.1%) of the examinees reported that their fathers had completed at least some college and/or bachelor’s degree, and almost the same (62.9%) reported that their mothers had completed at least some college. When asked which their best language was, nearly all (94.3%) reported that it was English. More than two-thirds of the examinees were female, and

PSC 3B-7 January 2012
nearly half reported that “white” best describes their ethnic background. More than 12% of examinees did not indicate an ethnicity. Passing Rate Table 3 shows data for both First-Time and Cumulative Passing Rates for each of the recent five cohorts, 2006 through 2011. The total number of examinees who completed all three sections, number passed, and percent passed are provided below. Table 3: CBEST All Three Sections – First-Time and Cumulative Passing Rates, 2006 – 11
Testing Year First-Time Passing Rate Cumulative Passing Rate N Completed N Passed % Passed N Completed N Passed % Passed
2006 to 2010 168,095 119,346 70.7% 176,072 149,044 84.6%
2006-07 39,531 28,059 71.0% 41,622 36,403 87.5% 2007-08 38,458 26,819 69.7% 40,308 34,578 85.8% 2008-09 38,138 27,224 71.4% 39,727 33,944 85.4% 2009-10 28,788 20,369 70.8% 29,838 24,943 83.6% 2010-11 23,990 16,875 70.3% 24,577 19,176 78.0%
The first-time passing rates for the past five years show a steady pattern, ranging from 69.7 percent to 71.4 percent, with an overall passing rate of 70.7 percent for the 2006-2011 cohorts. In 2006-07, the cumulative passing rate was 87.5 percent and for 2010-11, it decreased to 78.0 percent. The main reason for this seeming downward trend with the lowest passing rate in 2010-11 is that the recent cohort has not had a chance to repeat the sections they have not yet passed. The overall cumulative passing rate for the past five years is 84.6 percent. This situation also characterizes all of the cumulative data for 2010-11 presented below for the individual three subtests, since examinees from the recent cohort have not had a chance to repeat sections they have not yet passed. Table 4 presents First-Time and Cumulative Passing Rates for the Reading Section for the past five years. Table 4: CBEST Reading Section – First-Time and Cumulative Passing Rates, 2006 – 2011
Testing Year
First-Time Passing Rate Cumulative Passing Rate N Completed N Passed % Passed N Completed N Passed % Passed
2006 to 2010 179,459 143,619 80.0% 179,459 153,755 85.7%
2006-07 42,179 33,573 79.6% 42,179 36,370 86.2% 2007-08 41,030 32,053 78.1% 41,030 34,776 84.8% 2008-09 40,462 32,511 80.3% 40,462 34,833 86.1% 2009-10 30,416 24,840 81.7% 30,416 26,414 86.8% 2010-11 25,372 20,642 81.4% 25,372 21,362 84.2%
The first-time CBEST Reading passing rate is 80.0 percent, and the overall cumulative CBEST Reading passing rate is 85.7 percent. The first-time passing rate ranges from 78.1 percent in
PSC 3B-8 January 2012
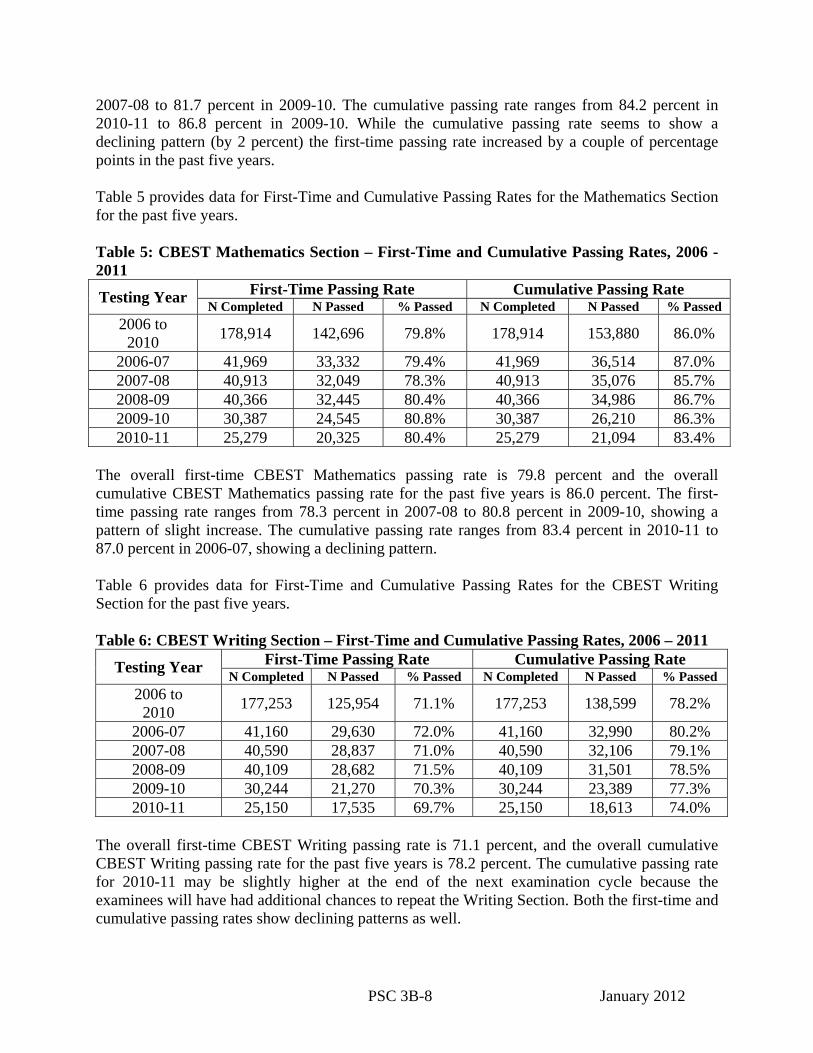
2007-08 to 81.7 percent in 2009-10. The cumulative passing rate ranges from 84.2 percent in 2010-11 to 86.8 percent in 2009-10. While the cumulative passing rate seems to show a declining pattern (by 2 percent) the first-time passing rate increased by a couple of percentage points in the past five years. Table 5 provides data for First-Time and Cumulative Passing Rates for the Mathematics Section for the past five years. Table 5: CBEST Mathematics Section – First-Time and Cumulative Passing Rates, 2006 -2011
Testing Year First-Time Passing Rate Cumulative Passing Rate N Completed N Passed % Passed N Completed N Passed % Passed
2006 to 2010 178,914 142,696 79.8% 178,914 153,880 86.0%
2006-07 41,969 33,332 79.4% 41,969 36,514 87.0% 2007-08 40,913 32,049 78.3% 40,913 35,076 85.7% 2008-09 40,366 32,445 80.4% 40,366 34,986 86.7% 2009-10 30,387 24,545 80.8% 30,387 26,210 86.3% 2010-11 25,279 20,325 80.4% 25,279 21,094 83.4%
The overall first-time CBEST Mathematics passing rate is 79.8 percent and the overall cumulative CBEST Mathematics passing rate for the past five years is 86.0 percent. The first-time passing rate ranges from 78.3 percent in 2007-08 to 80.8 percent in 2009-10, showing a pattern of slight increase. The cumulative passing rate ranges from 83.4 percent in 2010-11 to 87.0 percent in 2006-07, showing a declining pattern. Table 6 provides data for First-Time and Cumulative Passing Rates for the CBEST Writing Section for the past five years. Table 6: CBEST Writing Section – First-Time and Cumulative Passing Rates, 2006 – 2011
Testing Year First-Time Passing Rate Cumulative Passing Rate N Completed N Passed % Passed N Completed N Passed % Passed
2006 to 2010 177,253 125,954 71.1% 177,253 138,599 78.2%
2006-07 41,160 29,630 72.0% 41,160 32,990 80.2% 2007-08 40,590 28,837 71.0% 40,590 32,106 79.1% 2008-09 40,109 28,682 71.5% 40,109 31,501 78.5% 2009-10 30,244 21,270 70.3% 30,244 23,389 77.3% 2010-11 25,150 17,535 69.7% 25,150 18,613 74.0%
The overall first-time CBEST Writing passing rate is 71.1 percent, and the overall cumulative CBEST Writing passing rate for the past five years is 78.2 percent. The cumulative passing rate for 2010-11 may be slightly higher at the end of the next examination cycle because the examinees will have had additional chances to repeat the Writing Section. Both the first-time and cumulative passing rates show declining patterns as well.

PSC 3B-9 January 2012
Figure 1: CBEST – First-Time and Cumulative Passing Rates, 2006 – 2010
In summary, the first-time passing rates for the CBEST Reading and Mathematics Sections for the past five years are at 80.0 percent and 79.8 percent, respectively. The first-time passing rate for the Writing Section is 71.1 percent. The cumulative passing rates for the Reading and Mathematics Sections have remained in the high eighty percentage range, at 85.6 percent and 86.0 percent, respectively. The cumulative passing rate for the Writing Section is 78.2 percent, approximately 7 percentage points lower than the other two sections. For all three sections together, the first-time passing rate is 70.7 percent and cumulative rate is 84.6 percent. Passing Rates by Demographic Data The passing rates by preparation and demographic data are presented in Appendix A2: CBEST First-Time and Cumulative Passing Rate by Demographic Variables, 2006 to 2010. First-time and cumulative passing rates by gender and ethnicity are shown in table 7 below. Table 7: CBEST All Three Sections – First-Time and Cumulative Passing Rates by Gender and Ethnicity, 2006 – 10
CBEST
First-Time Passing Rate: Cohorts 2006 to 2010
Cumulative Passing Rate: Cohorts 2006 to 2010
N Completed
N Passed
% Passed
N Completed
N Passed
% Passed
ALL EXAMINEES 168,905 119,346 70.7 176,072 149,044 84.6 Gender
Female 112,290 77,095 68.7 117,568 98,388 83.7 Male 52,098 38,290 73.5 53,919 46,424 86.1 No response 4,517 3,961 87.7 4,585 4,232 92.3
Ethnicity African American 8,676 4,007 46.2 9,285 6,240 67.2 Asian American 8,616 5,742 66.6 9,134 7,278 79.7 Filipino 4,290 2,409 56.2 4,584 3,407 74.3
80.0% 79.8%
71.1% 70.7%
85.7% 86.0%
78.2%84.6%
Reading Math Writing CBEST
First‐Time Cumulative

PSC 3B-10 January 2012
CBEST
First-Time Passing Rate: Cohorts 2006 to 2010
Cumulative Passing Rate: Cohorts 2006 to 2010
N Completed
N Passed
% Passed
N Completed
N Passed
% Passed
South East Asian 2,285 1,157 50.6 2,450 1,711 69.8 Pacific Islander 2,137 1,179 55.2 2,295 1,631 71.1 Mexican American 20,653 10,787 52.2 22,164 16,717 75.4 Latino 9,074 4,774 52.6 9,935 7,280 73.3 Native American 851 601 70.6 882 748 84.8 White 81,775 65,339 79.9 83,787 76,401 91.2 Other 8,428 5,612 66.6 8,861 7,341 82.8 No Response 22,120 17,739 80.2 22,695 20,290 89.4
Overall, the first-time passing rates based on educational background varied by high school preparation, high school grade point average, college preparation, and college grade point average. Cumulative passing rates for the five-year period were at the mid to high eighty percent and did not vary much by preparation or demographic variables. However, a positive relationship between college grade point average (GPA) and cumulative passing rates was noticed – the passing rates for examinees with a GPA of 3.5 to 4.0 was 91 percent and the passing rate for examinees with a GPA below 2.5 was 73 percent. The examinees who reported English as their best language passed at a higher rate (86%) than the examinees who reported other languages as their best language – Spanish (54%) and other languages (51%).
CSET: California Subject Examinations for Teachers The majority of California Subject Examinations for Teachers (CSET) tests measure the candidate’s competency in the subject matter they will be authorized to teach. The CSET series includes CSET: Multiple Subjects and CSET: Single Subjects. The CSET: Multiple Subjects examination consists of three subtests plus the optional fourth Writing Skills subtest; the CSET: Single Subjects examination consists of two to four subtests, depending on the candidate’s subject area. Most of the CSET examinations consist of both multiple-choice and constructed-response items. Examinees can choose to take any or all subtests of a given content area within a single testing session. As with all other Commission examinations, the CSET are criterion-referenced examinations that measure the examinees’ knowledge and skills in relation to an established standard rather than in relation to the performance of other examinees. The CSET: Multiple Subjects and CSET: Writing Skills computer-based examinations are offered year round on demand at the contractor’s computer-based testing sites. Based on the subject area, other CSET examinations are administered from two to six times per year, with areas such as Mathematics offered six times per year, Home Economics and Art offered four times per year, and certain world languages offered twice per year. The CSET examination option was expanded for less commonly taught languages to include a combination of specific CSET language subtests plus a local target language skills assessment administered by agencies approved by the Commission. This process is currently used for Hebrew, Italian, and Portuguese. Although not part of the CSET examination option, candidates in Native American languages may also qualify for a credential through a language and cultural assessment process conducted entirely by tribal agencies.

PSC 3B-11 January 2012
Table 8: Structure of the CSET Examinations
CSET Examination Subtest Domains
# of Multiple choice items
# of Constructed
response items
Multiple Subjects
I Reading, Language, and Literature; History and Social Science
52 4
II Science; Mathematics 52 4 III Physical Education; Human Development
Visual and Performing Arts 39 3
IV Writing Skills - 2
Single Subjects: Agriculture
I Plant and Soil Science Ornamental Horticulture
25 15
2 1
II Animal Science Environmental Science and Natural Resource Management
25 15
2 1
III Agricultural Business and Economics Agricultural Systems Technology
20 20
2 1
Art
I Artistic Perception Historical and Cultural Context of the Visual Arts Aesthetic Writing
20 15 15
1 1 2
II Creative Expression Connections, Relationships, and Applications History and Theories of Learning in Art
30 10 10
3 1 -
Business
I Business Management Marketing
20 20
1 1
II Accounting and Finance Economics
25 15
1 1
III Information Technology Business Environment and Communication
25 15
1 1
English
I Literature and Textual Analysis Composition and Rhetoric
50 -
II Language, Linguistics, and Literacy 50 - III Composition and Rhetoric
Literature and Textual Analysis - 2
IV Communications: Speech, Media, and Creative Performance
- 4
Health Science
I Foundations of Health Education Human Growth and Development Chronic and Communicable Diseases
10 10 20
1 - 1
II Nutrition and Fitness Mental and Emotional Health Alcohol, Tobacco, and Other Drugs
15 10 15
1 - 1
III Family Life and Interpersonal Relationships Consumer and Community Health Environmental Health
15 15 10
1 - -
Home Economics
I Personal, Family, and Child Development 40 1 II Nutrition, Foods, and Hospitality 40 2 III Fashion and Textiles
Housing and Interior Design Consumer Education
12 12 16
1 1 2
Industrial and Technology
I Nature of Technology 45 2 1

PSC 3B-12 January 2012
CSET Examination Subtest Domains
# of Multiple choice items
# of Constructed
response items
Education II Power and Energy Information and Communication Project and Product Development
25 25 25
1 1 1
World Languages** • American
Sign Language
1 Literary and Cultural Texts and Traditions Cultural Analysis and Comparisons
10 20
1 1
II General Linguistics Linguistics of the Target Language –American Sign Language ( Language Structures; Contrastive Analysis; Sociolinguistics and Pragmatics)
10 20
- 2
III Linguistics of the Target Language –American Sign Language (Error Analysis) Language and Communication: Receptive Comprehension Language and Communication: Expressive Production
-
18 -
1
1
2
• Arabic • Armenian • Farsi • Filipino • Hmong • Khmer
I General Linguistics Linguistics of the Target Language Literary and Cultural Texts and Traditions Cultural Analysis and Comparisons
- 1 3 1 1
II Language and Communication: Listening Comprehension Language and Communication: Reading Comprehension Language and Communication: Written Expression Language and Communication: Oral Expression
- 2
2
1 2
• Cantonese
I General Linguistics Linguistics of the Target Language
5 15
1 3
II Literary and Cultural Texts and Traditions Cultural Analysis and Comparisons
10 10
2 1 1
III Language and Communication: Listening Comprehension Language and Communication: Reading Comprehension Language and Communication: Written Expression Language and Communication: Oral Expression
10 10 - -
1
1
2 2
• French • German • Japanese • Korean • Mandarin • Punjabi • Russian • Spanish • Vietnamese
I General Linguistics Linguistics of the Target Language
15 25
1 2
II Literary and Cultural Texts and Traditions Cultural Analysis and Comparisons
20 20
1
III Language and Communication: Listening Comprehension Reading Comprehension Written Comprehension Oral Expression
15 15 - -
1 1 2 2
• Hebrew** • Italian • Portuguese
I General Linguistics Linguistics of the Target Language Literary and Cultural Texts and Traditions Cultural Analysis and Comparisons
- - - -
1 2 1 2
Mathematics* I Algebra;
Number Theory 30 4
II Geometry; Probability and Statistics 30 4

PSC 3B-13 January 2012
CSET Examination Subtest Domains
# of Multiple choice items
# of Constructed
response items
III Calculus; History of Mathematics 30 4
Music
I Artistic Perception Historical and Cultural Foundations Aesthetic Valuing
30 15 -
1 1 1
II Creative Expression Connections, Relationships, and Applications
30 10
2 -
III Music Methodology and Repertoire 40 2
Physical Education
I Growth, Motor Development, and Motor Learning The Science of Human Movement
20 20
1 1
II The Sociology and Psychology of Human Movement Movement Concepts and Forms Assessment and Evaluation Principles
10 24 6
1 1 -
III Professional Foundations Integration of Concepts
16 24
- 1
Science***
I General Science: Astronomy; Dynamic Processes of the Earth; Earth Resources; Waves; Forces and Motion; Electricity and Magnetism
58
2
II General Science: Ecology; Genetics and Evolution; Molecular Biology and Biochemistry; Cell and Organismal Biology; Heat Transfer and Thermodynamics; Structure and Properties of Matter
58
2
III Concentration: Biology/Life Science, Chemistry, Earth and Planetary Science, or Physics
50 3
IV Specialized Science 40 1
Social Science I World History; World Geography 39 3 II U.S. History; U.S. Geography 39 3 III Civics; Economics; California History 40 3
*The CSET: Mathematics examination requiring all three subtests authorizes teaching of all mathematics
coursework. The CSET: Foundational-Level Mathematics examination requiring subtests I and II authorizes teaching only in limited mathematics content areas: general mathematics, algebra, geometry, probability and statistics, and consumer mathematics.
**To use the CSET examinations in Hebrew, Italian, and Portuguese toward certification, the individual must also
pass the language and communication skills examinations offered by other entities approved by the Commission. ***The CSET: Science subtests I and II cover general science content while subtest III covers the candidate’s area
of concentration. A credential in this subject matter based on subtests I, II, and the specific science in III authorizes teaching general and integrated science and the area of concentration. The CSET: Science (specialized), which requires passing the specific area of concentration in both subtests III and IV authorizes teaching only in the specialized area and does not authorize teaching general and integrated science. The CSET: Foundational-Level General Science requires subtests I and II and authorizes teaching only in general, introductory, and integrated science (integrated science through Grade 8 only).
Scoring of the CSET To pass an examination of the CSET, candidates must earn a passing score on each of the examination’s subtests. Each CSET subtest is scored separately. For each CSET subtest, an individual’s performance is evaluated against an established standard. Passing status is determined based on total subtest performance. The total subtest score is based on the number of raw score points earned on each section (multiple-choice section and/or constructed-response

PSC 3B-14 January 2012
section) and the weighting of each section. Raw scores are converted to a scale of 100 to 300, with the scaled score of 220 representing the minimum passing score for each subtest. Examination Volume The first administration of the initial CSET examinations was in January 2003. During this first phase, CSET examinations in Multiple Subjects, English, Mathematics, Science, and Social Science were offered as well as Foundational-Level Mathematics. CSET examinations in Science (Specialized) were added in fall 2003. CSET examinations in World Languages (French, German, Japanese, Korean, Mandarin, Punjabi, Russian, Spanish, and Vietnamese) were first administered in fall 2004 as well as CSET examinations in Art, Music, and Physical Education. CSET examinations in Agriculture, American Sign Language, Business, Health Science, Home Economics, and Industrial and Technology Education were first administered in fall 2005. The CSET examination in Filipino was first administered in fall 2006. The CSET: Arabic, Armenian, Cantonese, Farsi, Hmong, and Khmer examinations, and the CSET: Bilingual Methodology and CSET: Bilingual Culture subtests were added in 2007-2008 (see the section below regarding English Learner-related examinations for information on these two subtests). The Foundational-Level General Science authorization was added in 2009. The CSET: World Language examinations in Hebrew, Italian, and Portuguese were added in 2009-2010. There has been a significant increase in the volume of CSET test takers; more than 240,000 examinees took multiple and single subject examinations since the inception of CSET in 2003. Among the total examinees, more than half (56%) are Multiple Subjects examinees. Table 9: CSET Multiple and Single Subjects - Total number of examinees, 2003 – 2011
CSET Examination 2003-2011
2010-2011
2009-2010
2008-2009
2007-2008
2006-2007
All examinees 240,202 16,709 21,583 25,195 26,524 27,618
Multiple Subjects 135,453 6,767 9,424 11,679 12,933 14,820 Writing 6,053 1,427 1,310 1,495 1,457 364
Single Subjects: Agriculture 135 13 16 19 31 24 Art 1,524 172 158 242 225 234 Business 530 48 58 81 95 119 English 21,029 1,702 2,097 2,380 2,407 2,580 Health Science 2,354 266 344 340 420 437 Home Economics 292 34 41 53 48 52 Industrial Technology Education 340 63 49 55 67 48 World Languages: American Sign Language 130 15 18 14 17 30 Arabic 20 8 5 3 4 . Armenian 11 4 6 1 Cantonese 5 1 2 1 1 Farsi 4 1 2 1 Filipino 41 2 3 4 7 25 French 499 50 72 66 60 75 German 72 3 10 8 8 12 Hebrew 1 1 Hmong 15 1 5 4 5

PSC 3B-15 January 2012
CSET Examination 2003-2011
2010-2011
2009-2010
2008-2009
2007-2008
2006-2007
All examinees 240,202 16,709 21,583 25,195 26,524 27,618 Italian 12 12 Japanese 131 13 14 17 22 19 Khmer 1 1 Korean 98 15 21 12 12 19 Mandarin 775 70 91 101 119 235 Portuguese 3 1 2 Punjabi 14 2 3 1 4 Russian 40 2 8 9 7 8 Spanish 3,089 304 409 414 450 471 Vietnamese 32 1 3 5 9 8 Mathematics (Foundational-Level)* 14,652 1,918 2,552 2,885 2,723 2,694 Mathematics 8,258 472 759 908 823 863 Music 796 71 94 105 113 136 Physical Education 4,303 483 528 658 711 616 Science: Biological Sciences 8,361 579 892 947 955 953 Biological Sciences (Specialized)
1,867 156 209 206 255 246
Chemistry 3,169 220 334 398 363 359 Chemistry (Specialized) 1,015 114 118 140 134 118 Geosciences 2,766 138 307 341 342 357 Geosciences (Specialized) 744 80 92 112 110 109 General Science (Foundational-Level)*
14,652 142 173 202 210 197
Physics 1,827 99 83 92 91 80 Physics (Specialized) 654 1,531 1,760 1,842 1,854 1,899 Social Science 17,323 579 892 947 955 953
* The numbers for the Foundational-Level Mathematics and Foundational-Level General Science incorporate all examinees who took the respective two subtests and thus they also reflect individuals seeking a broader mathematics or science authorization. Table 10 presents annual passing rates and cumulative passing rates for multiple subjects and the single subjects of Agriculture, Art, Business, English, Health Science, Home Economics, Industrial Technology Education, World Languages, Mathematics, Music, Physical Education, Science, and Social Science. Table 10: CSET – Annual and Cumulative Passing Rates, 2003 - 2011
CSET Examination
Annual Passing Rate September 2010 – July 2011
Cumulative Passing Rate September 2003 – July 2011
N Attempted
N Passed
% Passed
N Attempted
N Passed
% Passed
Multiple Subjects 6,767 5,278 78.0 135,453 123,663 91.3 Writing 1,427 1,209 84.7 6,053 5,001 82.6 Single Subjects: Agriculture 13 5 38.5 135 67 49.6 Art 172 125 72.7 1,524 1,249 82.0 Business 48 25 52.1 530 291 54.9 English 1,702 1,016 59.7 21,029 16,572 78.8 Health Science 266 170 63.9 2,354 1,746 74.2 Home Economics 34 15 44.1 292 213 72.9

PSC 3B-16 January 2012
Industrial Technology Education 63 50 79.4 340 296 87.1 World Languages: American Sign Language 15 5 33.3 130 68 52.3 Arabic 8 20 17 85.0 Armenian 0 11 10 90.9 Cantonese 1 5 Farsi 1 4 Filipino 2 41 38 92.7 French 50 42 84.0 499 446 89.4 German 3 72 58 80.6 Hmong 1 15 14 93.3 Japanese 13 8 61.5 131 108 82.4 Khmer 0 1 Korean 15 11 73.3 98 88 89.8 Mandarin 70 58 82.9 775 724 93.4 Portuguese 1 3 Punjabi 2 14 7 50.0 Russian 2 40 37 92.5 Spanish 304 244 80.3 3,089 2,688 87.0 Vietnamese 1 32 30 93.8 Mathematics (Foundational Level)* 1,446 578 40.0 14,652 7,152 48.8 Mathematics 472 266 56.4 8,258 5,086 61.6 Music 71 61 85.9 769 729 91.6 Physical Education 483 241 49.9 4,303 3,034 70.5 Sciences: Biological Sciences 579 423 73.1 8,361 6,659 79.6 Biological Sciences (Specialized) 156 105 67.3 1,867 1,387 74.3 Chemistry 220 172 78.2 3,169 2,564 80.9 Chemistry (Specialized) 114 87 76.3 1,015 885 87.2 Geosciences 138 91 65.9 2,766 2,166 78.3 Geosciences (Specialized) 80 59 73.8 744 619 83.2 General Science (Foundational-Level)* 1,446 578 40.0 14,652 7,152 48.8 Physics 142 84 59.2 1,827 1,210 66.2 Physics (Specialized) 99 66 66.7 654 511 78.1 Social Science 1,531 968 63.2 17,323 13,755 79.4
Note: Pass rates are not reported for exams with fewer than ten candidates
* The numbers for the Foundational-Level Mathematics and Foundational-Level General Science incorporate all examinees who took the respective two subtests and thus they also reflect individuals seeking a broader mathematics or science authorization.
For the CSET: Multiple Subjects, the annual passing rate for 2010-11 was 78 percent and the cumulative passing rate from 2003-2011 was 91.3 percent. For the single subjects, the cumulative passing rate varied from 48.8 percent to 100 percent. English and Social Sciences had cumulative passing rates of 78.8% and 79.4 percent, respectively. The cumulative passing rate was in the 90% - 100% range for the following world languages: Armenian, Filipino, Hmong, Italian, Khmer, Mandarin, Portuguese, Russian, and Vietnamese. These languages had relatively small total numbers of examinees, however. The cumulative passing rate for the sciences ranged from 66.2 percent for Physics to 87.2 percent for Chemistry (Specialized).

PSC 3B-17 January 2012
Figure 2: CSET: Multiple Subjects and Single Subjects (high volume) – Annual (2010-2011) and Cumulative (2003 – 2011) Passing Rates
Note – CSET low incidence examinations (Agriculture, Art, Business, Health Science, Home Economics, Music, and Physical Education and World Languages) are not included here. Appendix C1 displays the CSET: Multiple Subjects passing rates by selected demographic variables. For the CSET: Multiple Subjects, the annual passing rate for 2010-11 was 78 percent. Table 11 below shows annual and cumulative passing rates by gender and ethnicity. Table 11: CSET: Multiple Subjects – Annual and Cumulative Passing Rates by Gender and Ethnicity, 2003 –2011
Multiple Subjects
Annual Passing Rate September 2010 – July 2011
Cumulative Passing Rate September 2003 – July 2011
N Completed
N Passed
% Passed
N Completed
N Passed
% Passed
ALL EXAMINEES 6,767 5,278 78.0 135,453 123,663 91.3 Gender
Female 5,463 4,232 77.5 112,159 102,366 91.3 Male 1,171 935 79.8 22,036 20,124 91.3
Ethnicity African American 208 116 55.8 5,876 4,698 80.0 Asian American 609 465 76.4 13,043 11,849 90.8 Hispanic American 1,223 783 64.0 29,778 26,041 87.5 Native American 49 39 79.6 770 676 87.8 White 3,524 2,955 83.9 72,365 67,974 93.9
0%
10%
20%
30%
40%
50%
60%
70%
80%
90%
100%
Multiple Subjects
English Mathematics Foundational Level
Mathematics
Biological Sciences
Chemistry Geosciences Physics Social Science
Annual Passing Rate Cumulative Passing Rate

PSC 3B-18 January 2012
The cumulative passing rate for Multiple Subjects was 91.3 percent. Although, as expected, the cumulative passing rate was higher than the annual rate due to multiple testing opportunities, a similar pattern was observed: passing rates differed by ethnicity, reason for taking the CSET, college/university training, and highest educational level. Examinees who took the CSET to obtain an initial multiple subject teaching credential or education specialist credential had almost the same passing rates: 79.3 percent and 76 percent, respectively. However, those who took the examination to add an authorization to an existing credential had a higher passing rate of 85.9 percent. Appendices C2 through C13 display CSET: Single Subject passing rates by selected demographic variables. Similar to the CSET: Multiple Subjects, the passing rates differed by gender, ethnicity, GPA, reason for taking the CSET, college/university training, and highest education level attained. As an example, for the highest cumulative passing rates, scores for California trained candidates were higher in Agriculture than those trained outside the state, and females scored higher in English than males. Teaching Foundations Examinations (TFE) The Teaching Foundations Examinations (TFE) assess candidate pedagogical knowledge within specified content areas and are used to satisfy a portion of the Early Completion Option of the internship programs for California Multiple and Single Subject Teaching Credentials. Candidates who pass the TFE must still meet the TPA requirement. The TFE examinations were created by the Educational Testing Service (ETS) in five areas: Multiple Subjects, English, Mathematics, Science, and Social Science. Each TFE is comprised of a written examination and is four hours in length. In order to establish a passing score standard for the various tests within the TFE array, a sufficient number of examinees must take the initial administration of the particular TFE. At this time, there have not been enough examinees for the TFE Social Science examination to set a passing score standard. There are, however, passing score standards for the remaining TFE tests. ETS plans to discontinue use of the current TFE series at the end of June 2012. The TFE includes 50 multiple-choice questions and additional constructed-response questions. The multiple-choice questions cover knowledge of human development, learning differences and special needs, instructing English learners, assessing student progress, classroom management techniques, and reading instruction. The two constructed-response questions in the TFE in English, Mathematics, Science, and Social Science cover methods in middle school and in high school. Four constructed-response questions are included in the TFE: Multiple Subjects, with individual questions covering teaching methods in each of the following: mathematics, social science, English, and science. Examination Volume The TFE is administered four times a year. In 2010-11, More than 100 examinees took TFE: Multiple Subjects and another 144 examinees took TFE: English, TFE: Mathematics, and TFE: Science, combined.

PSC 3B-19 January 2012
Scoring of the TFE To pass the TFE, candidates must take the entire examination at one administration and obtain the minimum passing score based on their performance on the overall test. In each TFE, the multiple-choice questions comprise one-third of the total score and the constructed-response questions the remaining two-thirds. Candidates receive a scaled score computed from the total number of raw points in each component and the weighting of each component in a way that adjusts for the complexities of the questions. The raw scores for the TFE tests are converted to a scaled score. Table 12: TFE California State Passing Score Standard and Score Range
TFE Examination State Passing Score Standard Score Range
TFE: Multiple Subject 155 100-200 TFE: English 173 100-200 TFE: Mathematics 153 100-200 TFE: Science 171 100-200
TFE Passing Rates Tables 13 and 14 provide data for the passing rate for four of the five Teaching Foundations Examinations – Multiple Subjects, English, Mathematics, and Science. The passing rate ranged from 71 percent for TFE: Science in 2009-10 to 100 percent for TFE: Mathematics in 2007-08. Passing rates have increased for TFE: Multiple Subject (by 3%), TFE: English (by 13%), and TFE: Science (by 4%), and have decreased for TFE: Mathematics (by 4%), in the past five years. Table 13: TFE Passing Rate by Subjects, 2006 – 2011
TFE: Multiple Subjects TFE: English TFE: Mathematics TFE: Science Testing
Year N
Completed N
Passed %
Passed N
Completed N
Passed %
Passed N
Completed N
Passed %
Passed N
Completed N
Passed %
Passed
2006-07 104 96 92% 47 39 83% 45 44 98% 34 26 76% 2007-08 133 125 94% 57 46 81% 54 54 100% 65 58 89% 2008-09 135 130 96% 52 49 94% 72 71 99% 60 51 85% 2009-10 103 98 95% 32 29 91% 58 57 98% 65 46 71% 2010-11 103 98 95% 28 27 96% 52 49 94% 64 56 88%
Table 14: TFE Passing Rate by Gender and Ethnicity, 2010-2011
Gender Ethnicity
Female Male African America
n
Asian America
n Hispanic
Native America
n
Pacific Islander
White
TFE: Multiple Subjects
N Completed 83 20 5 7 13 0 1 52
N Passed 81 17 5 6 10 * * 51
% Passed 97.59 85.00 100.00 85.71 76.92 * * 98.08
TFE: English
N Completed 20 8 4 0 3 0 0 13
N Passed 20 7 * * * * * 13
% Passed 100.00 87.50 * * * * * 100.00
TFE: N Completed 31 21 1 4 4 0 1 24

PSC 3B-20 January 2012
Gender Ethnicity Mathematics N Passed 30 19 * * * * * 22
% Passed 96.77 90.48 * * * * * 91.67
TFE: Science
N Completed 39 25 3 7 4 1 1 35
N Passed 36 20 * 4 * * * 32
% Passed 92.31 80.00 * 57.14 * * * 91.43
Note: Pass rates are not reported for exams with fewer than five candidates.
RICA: Reading Instruction Competence Assessment The Reading Instruction Competence Assessment (RICA) tests professional knowledge related to the teaching of reading. The RICA is the only Commission examination to assess candidate knowledge of content delivered as part of a Commission-approved educator preparation program. Effective October 1, 1998, most California-trained candidates for multiple subject credentials and, effective January 1, 2000, most California-trained education specialist candidates are required to pass the RICA. The RICA was revised in 2009 based on changes to the Reading/Language Arts Framework for California Public Schools, K-12 and, beginning with the August 2009 administration, covers content within the following five domains:
• Domain 1: Planning, Organizing, and Managing Reading Instruction Based on Ongoing Assessment
• Domain 2: Word Analysis • Domain 3: Fluency • Domain 4: Vocabulary, Academic Language, and Background Knowledge • Domain 5: Comprehension
Approximately 10 percent of the revised RICA assesses competencies in Domain 1; 33 percent assesses competencies in Domain 2; 13 percent in Domain 3; 20 percent in Domain 4; and 23 percent in Domain 5. As under the prior RICA, the revised RICA has two assessment options: the RICA Written Examination (WE) and the RICA Video Performance Assessment (VPA). A candidate may pass either the Written Examination or the Video Performance Assessment. The RICA Written Examination is administered year round at the contractor’s computer-based testing centers as a computer-based assessment. The RICA Video Performance Assessment has three deadlines per year for submission of videos and other supporting materials. A. The RICA Written Examination The RICA Written Examination is a computer-based examination that consists of two sections: a multiple-choice section and a constructed-response section. RICA Multiple-Choice Section: This section consists of 70 multiple-choice questions: 60 “scorable” and 10 “nonscorable.” The questions include both content questions, in which knowledge about reading and reading instruction is directly assessed, and contextualized questions that assess the candidate’s ability to apply specific knowledge, to analyze specific problems, or to conduct specific tasks related to reading instruction.

PSC 3B-21 January 2012
RICA Constructed-Response Section: The constructed-response section includes two types of items for which candidates have to write an original response. These are: 1. Focused educational problems and instructional tasks – These items present problems or tasks in educational contexts, and require candidates first to consider information about a class, a group of students, an individual student, or an instructional situation, and then to provide explanations related to or devise appropriate instructional strategies or assessment approaches for the specified student(s). Four focused educational problems and instructional tasks are included in each examination. Each problem or task assesses one or more competencies in Domains 2 through 5, with one problem or task for each domain. The problem or task for Domains 3 and 4 each requires a written response of approximately 75-125 words and those in Domains 2 and 5 each require a written response of approximately 150-300 words. 2. A case study based on a student profile – For this item type, candidates receive substantial background information about a student and samples of materials illustrating the student’s reading performance. Candidates are asked to assess the student’s reading performance, describe appropriate instructional strategies, and explain why these strategies would be effective. Each examination has one case study, which includes content related to all five domains. Candidates provide a written response of approximately 300-600 words. B. The RICA Video Performance Assessment The RICA Video Performance Assessment is designed to allow the candidate to choose and submit videos of his/her best classroom work related to teaching reading. Candidates must create three “video packets,” each of which includes:
• a completed Instructional Context Form, on which the candidate provides information relevant to understanding the video recorded instruction, such as information about the students in the class/group, a lesson plan, and a description of assessment methods the candidate used to determine the appropriateness of the planned lesson;
• a ten-minute video of the candidate providing the reading instruction; and • a completed Reflection Form, in which the candidate provides an appraisal of the video-
recorded instruction, suggestions for further or alternative instructional strategies, and similar information.
One video packet must be based on whole-class instruction, one on small-group instruction, and the third on individual instruction. In addition, one videotape should demonstrate the candidate’s competencies in Domains 1 and 2, one should demonstrate the candidate’s competencies in Domains 1 and 4, and the last Domains 1 and 5. Doman 3: Fluency was not included as a separate video requirement because its content is extensively interrelated with the areas already covered by Domains 2, 4, and 5. Scoring the RICA The RICA Written Examination consists of multiple-choice and constructed-response sections, with five constructed-response items in that section. The score for the multiple-choice section is based on the number of questions candidates correctly answers with no penalty for wrong answers. On the constructed-response section, each response receives two scores from
PSC 3B-22 January 2012
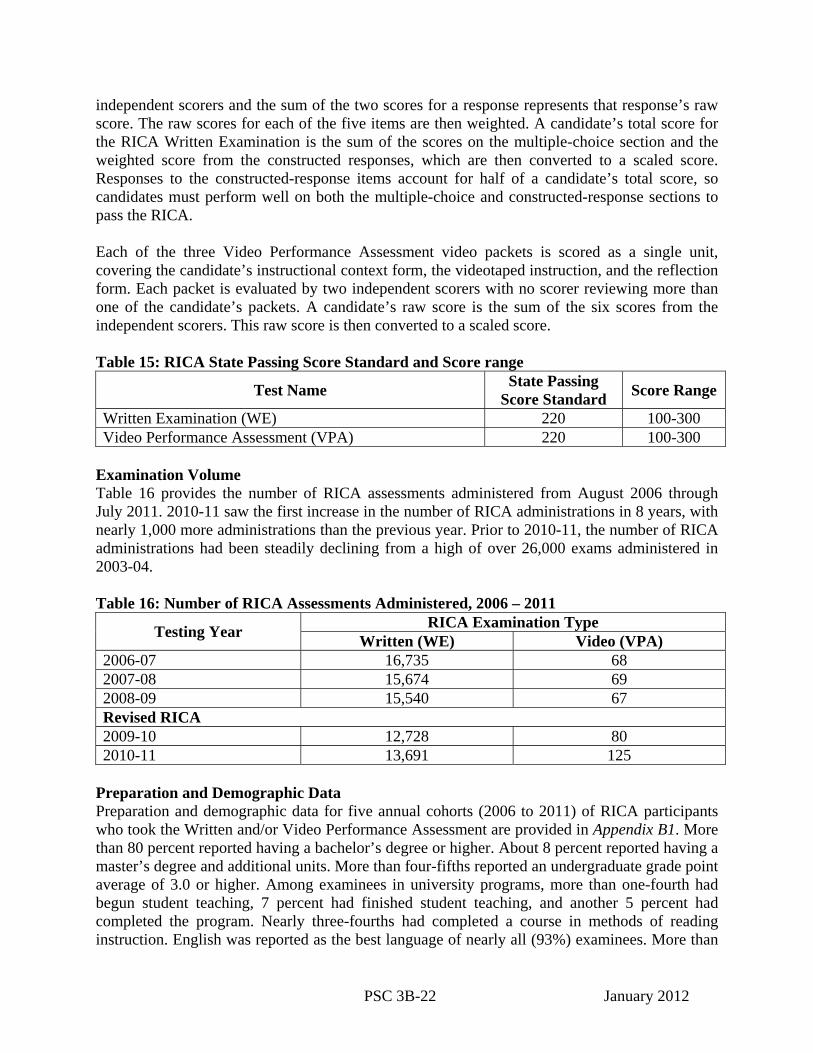
independent scorers and the sum of the two scores for a response represents that response’s raw score. The raw scores for each of the five items are then weighted. A candidate’s total score for the RICA Written Examination is the sum of the scores on the multiple-choice section and the weighted score from the constructed responses, which are then converted to a scaled score. Responses to the constructed-response items account for half of a candidate’s total score, so candidates must perform well on both the multiple-choice and constructed-response sections to pass the RICA. Each of the three Video Performance Assessment video packets is scored as a single unit, covering the candidate’s instructional context form, the videotaped instruction, and the reflection form. Each packet is evaluated by two independent scorers with no scorer reviewing more than one of the candidate’s packets. A candidate’s raw score is the sum of the six scores from the independent scorers. This raw score is then converted to a scaled score. Table 15: RICA State Passing Score Standard and Score range
Test Name State Passing Score Standard Score Range
Written Examination (WE) 220 100-300 Video Performance Assessment (VPA) 220 100-300
Examination Volume Table 16 provides the number of RICA assessments administered from August 2006 through July 2011. 2010-11 saw the first increase in the number of RICA administrations in 8 years, with nearly 1,000 more administrations than the previous year. Prior to 2010-11, the number of RICA administrations had been steadily declining from a high of over 26,000 exams administered in 2003-04. Table 16: Number of RICA Assessments Administered, 2006 – 2011
Testing Year RICA Examination Type Written (WE) Video (VPA)
2006-07 16,735 68 2007-08 15,674 69 2008-09 15,540 67 Revised RICA 2009-10 12,728 80 2010-11 13,691 125
Preparation and Demographic Data Preparation and demographic data for five annual cohorts (2006 to 2011) of RICA participants who took the Written and/or Video Performance Assessment are provided in Appendix B1. More than 80 percent reported having a bachelor’s degree or higher. About 8 percent reported having a master’s degree and additional units. More than four-fifths reported an undergraduate grade point average of 3.0 or higher. Among examinees in university programs, more than one-fourth had begun student teaching, 7 percent had finished student teaching, and another 5 percent had completed the program. Nearly three-fourths had completed a course in methods of reading instruction. English was reported as the best language of nearly all (93%) examinees. More than

PSC 3B-23 January 2012
four-fifths of the examinees were female and more than half reported that “White” best describes their ethnic background. The next largest ethnic groups among the examinees were Mexican American or Chicano (14.3%) and Latino (5.6%). About 70 percent indicated taking the RICA to satisfy the Multiple Subjects requirement and 15 percent indicated the Education Specialist requirement. Table 17 provides First-Time and Cumulative Passing Rates for both the Written Examination and Video Performance Assessment combined for the past five years. Table 17: RICA – First-Time and Cumulative Passing Rates, 2006 – 2011
Testing Year First-Time Passing Rate Cumulative Passing Rate N Completed N Passed % Passed N Completed N Passed % Passed
2006 to 2011 51,453 40,119 78.0% 51,453 47,883 93.1% 2006-07 11,831 9,764 82.5% 11,831 11,554 97.7% 2007-08 11,405 9,295 81.5% 11,405 11,039 96.8% 2008-09 11,391 9,228 81.0% 11,391 10,841 95.2% Revised RICA 2009-10 8,560 6,120 71.5% 8,560 7,766 90.7% 2010-11 8,266 5,712 69.1% 8,266 6,683 80.8%
The first-time passing rate for the prior version of the RICA was relatively consistent, from 82.5 percent in 2006-07 to 81.0 percent in 2008-09. The revised RICA first-time pass rate declined a little from 71.5 percent in 2009-10 to 69.1% in 2010-11. The cumulative passing rates for both the original and revised RICA have remained above 90% through 2009-10. The 2010-11 cohort who took the revised RICA has a cumulative passing rate of 80.8 percent. Figure 3: RICA – First-Time and Cumulative Passing Rates, 2006 – 2011
78.0%
55.6%
78.0%
92.9%
63.7%
93.1%
Written Video Performance Assessment WE and VPA Combined
First‐Time Cumulative

PSC 3B-24 January 2012
There is a difference of about 8 percentage points for the Video Performance Assessment and 14 percentage points for the Written examination between the first-time and cumulative passing rates. Regardless of the difference in the passing rates for the two different assessment options, candidates who did not pass initially typically retake the RICA, thereby leading to an increase in cumulative passing rates. Passing Rate by Demographic Data The first-time and cumulative passing rates for the combined RICA Written and Video Performance Assessment data are provided in Appendix B2. First-time and cumulative passing rates by gender and ethnicity are shown in table 18 below. Table 18: RICA–First-Time and Cumulative Passing Rates by Gender and Ethnicity, 2006 – 2011
First-Time Passing Rate Cumulative Passing Rate
N Completed
N Passed
% Passed
N Completed
N Passed
% Passed
GenderMale 7,900 5,149 65.2 7,900 6,936 87.8 Female 42,868 34,406 80.3 42,868 40,321 94.1 No response 685 564 82.3 685 626 91.4
EthnicityAfrican American/Black 1,707 1,072 62.8 1,707 1,442 84.5 Asian American/Asian 2,527 2,061 81.6 2,527 2,413 95.5 Filipino 1,004 763 76.0 1,004 929 92.5 Southeast Asian American 586 422 72.0 586 529 90.3 Pacific Island American 173 131 75.7 173 159 91.9 Mexican American or Chicano 7,363 4,888 66.4 7,363 6,567 89.2 Latino, Latin American, Puerto Rican, Hispanic 2,866 1,879 65.6 2,866 2,570 89.7
Native American, American Indian 279 210 75.3 279 248 88.9
White, non-Hispanic 27,026 22,758 84.2 27,026 25,835 95.6 Other 2,705 2,112 78.1 2,705 2,520 93.2 Did not respond 5,217 3,823 73.3 5,217 4,671 89.5
There is a relationship between the cumulative passing rate and variables such as college GPA and best language of communication. The cumulative passing rate for examinees with a GPA of 3.5 or higher was 95.3 percent and, for those indicating English as their best language, the cumulative passing rate was 93.5 percent. California Teacher of English Learners (CTEL) The purpose of the California Teacher of English Learners (CTEL) examination is for candidates who did not complete an SB 2042 teacher preparation program, veteran classroom teachers who need but do not have an English learner authorization, and out of state candidates who do not have an English learner authorization earned in another state to demonstrate they have the level of knowledge and skills required to effectively teach English learners (EL) in the regular classroom. The CTEL examination is criterion-referenced: that is, the examinee’s knowledge, skills, and abilities are measured in relation to an established standard rather than in relation to the performance of other examinees.

PSC 3B-25 January 2012
The CTEL examination was first offered in 2005-2006 as an updated version of the prior CLAD examination. Passage of all three CTEL subtests is a way to satisfy one of the requirements for a CLAD certificate. The CTEL subtests’ content is provided below.
CTEL Subtest 1: Language and Language Development This subtest covers language structure and use and first- and second-language development and their relationship to academic achievement. This subtest is in English and consists of 50 multiple-choice questions and one essay. CTEL Subtest 2: Assessment and Instruction This subtest covers the assessment of English learners, the foundations of English language and literacy development and content instruction, and approaches and methods for English language development and content instruction. This subtest is in English and consists of 60 multiple-choice questions and two essays. CTEL Subtest 3: Culture and Inclusion This subtest covers culture and cultural diversity and their relationship to academic achievement and culturally inclusive instruction. This subtest is in English, does not focus on any specific cultural group, and has 40 multiple-choice questions and one essay.
Examination Volume The number of CTEL examinees has risen gradually since 2006-07 to more than 6,000 in 2008-09; however, there has been a decline of about 60% in the numbers of administrations between 2008-09 and 2010-11. It is important to keep in mind that following the transition of teacher preparation programs to approved programs under SB 2042 program standards and AB 1059 requirements, the authorization to teach English learners in the regular education classroom was incorporated within the authorization of the preliminary credential for California-prepared multiple and single subject candidates. Additionally, individuals entering the California Education Specialist program (after 2008) also complete an EL authorization within their program. The primary candidate pool of CTEL test-takers now is veteran California teachers who need to add an authorization to teach English learners, out-of-state teachers who need to earn an EL authorization, and/or other credential holders who need to earn or add an EL authorization. Table 19: Number of CTEL Examinations Administered, 2006 – 2011
Testing Year CTEL Subtest 1 CTEL Subtest 2 CTEL Subtest 3 2006-07 3,901 3,748 3,934 2007-08 5,345 5,201 5,667 2008-09 6,117 5,631 6,151 2009-10 4,295 4,284 4,244 2010-11 2,469 2,520 2,644

PSC 3B-26 January 2012
CTEL Passing Rates Table 20 shows data for both first-time and cumulative passing rates for each of the recent five cohorts, 2006-07 through 2010-11. The total number of examinees who completed all three tests, the number passed, and the percent passed are provided below. The cumulative passing rate for the 2010-2011 cohort reflects the few times that this group has had an opportunity to retake the exam since it is only offered twice a year. Table 20: CTEL – First-Time and Cumulative Passing Rates, 2006 – 2011
Testing Year
First-time Passing Rate Cumulative Passing Rate N Tried
all 3 Subtests
N Passed all 3
Subtests
% Passedall 3
Subtests
N Tried all 3
Subtests
N Passed all 3
Subtests
% Pass when all 3 are
attempted 2006 to 2011 17,893 10,805 60.4 17,893 14,269 79.7
2006-07 3,443 2,082 60.5 3,443 2,923 84.9 2007-08 4,756 2,909 61.2 4,756 3,987 83.8 2008-09 4,872 3,053 62.7 4,872 3,953 81.1 2009-10 3,119 1,804 57.8 3,119 2,332 74.8 2010-11 1,703 957 56.2 1,703 1,074 63.1
CTEL, first administered in December 2005, shows a first-time passing rate of 60.4 percent for 2006 to 2011. There was a decrease of more than 6 percent in the first-time passing rate between 2008-09 (62.7%) and 2010-111 (56.2%). The cumulative passing rate remained fairly steady around 80 percent for cohorts who have had many opportunities to retest. Table 21: CTEL–First-Time and Cumulative Passing Rates by Gender and Ethnicity, 2006 – 2011
First-Time Passing Rate Cumulative Passing Rate N Tried
all 3 Subtests
N Passed all 3
Subtests
% Passed all 3
Subtests
N Tried all 3
Subtests
N Passed all 3
Subtests
% Pass when all 3
are attempted
GenderFemale 11,906 7,709 64.7 11,906 9,910 83.2 Male 5,605 2,813 50.2 5,605 4,047 72.2 No response 382 283 74.1 382 312 81.7
EthnicityAfrican American/Black 773 242 31.3 773 439 56.8 Asian American/Asian 447 255 57.0 447 338 75.6 Filipino 382 114 29.8 382 232 60.7 Southeast Asian American 205 92 44.9 205 146 71.2 Pacific Island American 58 30 51.7 58 45 77.6 Mexican American or Chicano 833 357 42.9 833 581 69.7 Latino, Latin American, Puerto Rican, Hispanic 532 233 43.8 532 369 69.4
Native American, American Indian 124 65 52.4 124 93 75.0 White, non-Hispanic 12,336 8,023 65.0 12,336 10,297 83.5 Other 691 394 57.0 691 551 79.7 Did not respond 1,512 1000 66.1 1512 1178 77.9

PSC 3B-27 January 2012
CSET: World Languages Bilingual-Specific Examinations The purpose of the CSET: World Languages Bilingual-Specific subtests is for candidates to demonstrate they have the level of knowledge and skills required to effectively teach English learners and other students in bilingual classroom settings. The CSET: World Languages examinations are criterion-referenced: that is, the examinee’s knowledge, skills, and abilities are measured in relation to an established standard rather than in relation to the performance of other examinees. In 2007, the CSET: World Languages Bilingual-Specific examination series updated and replaced the three former BCLAD subtests, and the former CLAD and BCLAD examinations were discontinued as separate entities. Passage of the two CSET: World Languages Bilingual-Specific subtests plus the CSET: World Language target language proficiency skills subtest is one way to satisfy the bilingual portion of the requirements for a Bilingual Authorization. An individual also needs an English learner authorization as well as an appropriate prerequisite credential as part of the requirements for a bilingual authorization. The information below describes the content of the CSET: World Languages subtests which incorporate the former BCLAD examination content. Examinations are available for Arabic, Armenian, Cantonese, Farsi, Filipino, French, German, Hmong, Japanese, Khmer, Korean, Mandarin, Punjabi, Russian, Spanish, and Vietnamese.
CSET: World Languages: Subtest III (or Subtest II, for low incidence languages): Listening Comprehension, Reading Comprehension, Written Expression, and Oral Expression There are multiple versions of this subtest, each focusing on a specific language. Each version consists of four separate components: listening, speaking, reading, and writing the target language. This subtest is used by all candidates for a single subject World Language credential as well as by candidates for a bilingual credential to ensure that all candidates using a language other than English for instructional purposes meet the same standards of language proficiency as established by the Commission. The specific number of multiple-choice items and constructed-response items may vary across languages. For the Listening component, examinees listen to oral language samples and answer questions; for the Reading component, examinees read passages written in the target language and respond to questions; for the Speaking component, candidates respond orally in the target language to speaking assignment prompts; and for the Writing component, examinee write responses in the target language to specific writing prompts.
Note: For the less commonly taught languages of Hebrew, Italian, and Portuguese, candidates must pass the alternative language assessment approved by the Commission for this purpose. CSET: World Languages: Subtest IV: Bilingual Education and Bilingualism; Intercultural Communication; and Instruction and Assessment

PSC 3B-28 January 2012
This test covers foundations of bilingual education; bilingualism and biliteracy; intercultural communication and culturally inclusive instruction; school, home, and community collaboration; language and literacy instruction and assessment in bilingual education settings; content instruction and assessment in bilingual education settings; and evaluation, use, and augmentation of materials in bilingual education settings. Subtest 4 is in English, does not focus on any specific language, and consists of 50 multiple-choice questions. CSET: World Languages: Subtest V: Bilingual Culture There are multiple versions of this subtest, each focusing on a specific culture. Each version covers the following for the target population: the geographic and demographic contexts; the historical context; the sociopolitical context; the sociocultural context; and crosscultural, intercultural, and intracultural contexts. Each version is in English and consists of either 50 multiple-choice questions or five constructed response questions, based on the target culture. Candidates may respond in English or in the target language.
Table 22: Number of: World Languages Bilingual-specific Examinations Administered, 2007 – 2011
Testing Year
Bilingual Education Bilingual Culture Target Language
CSET: WL: Subtest IV
CSET: WL: Spanish Subtest V
CSET: WL: Spanish Subtest III (also used for the Single Subject in Spanish)
2007-08 328 314 743 2008-09 452 379 840 2009-10 618 572 922 2010-11 420 380 743
*For tests for other target language and cultural populations, the annual number of examinees is less than 50, so they are not reported. CSET: World Language Bilingual Passing Rates Table 23 shows data for both first-time and cumulative passing rates for the 2003-11 CSET: WL Bilingual cohorts who were seeking the Bilingual Authorization in Spanish. The total number of examinees who completed all three tests, the number passed, and the percent passed are provided below. Table 23: CSET: WL Bilingual-specific Examinations for Spanish – First-Time and Cumulative Passing Rates by Gender and Ethnicity, 2003 – 2011
Spanish (bilingual-specific)
Annual Passing Rate September 2010 – July 2011
Cumulative Passing Rate September 2003 – July 2011
N Attempted
N Passed
% Passed
N Attempted
N Passed
% Passed
All Examinees 211 109 51.7 1,089 693 63.6 Gender
Male 38 20 52.6 210 134 63.8 Female 171 88 51.5 868 551 63.5
EthnicityAfrican American 4 13 8 61.5 Asian American 15 8 53.3 57 27 47.4

PSC 3B-29 January 2012
Spanish (bilingual-specific)
Annual Passing Rate September 2010 – July 2011
Cumulative Passing Rate September 2003 – July 2011
N Attempted
N Passed
% Passed
N Attempted
N Passed
% Passed
Hispanic American 137 66 48.2 695 408 58.7 Native American . . . 2 White 33 21 63.6 222 177 79.7
Note: Pass rates are not reported for exams with fewer than ten candidates.
The 2010-11 average annual passing rate for the CSET: WL bilingual-specific subtests is 49.8 percent, and the 2003-2011 cumulative passing rate is 63 percent. School Leaders Licensure Assessment (SLLA #1010) and the California Preliminary Administrative Credential Examination (CPACE) The purpose of the School Leaders Licensure Assessment (SLLA #1010) and the California Preliminary Administrative Credential Examination (CPACE) is to measure whether entry-level principals and other school administrators have the standards-relevant knowledge necessary for competent professional practice. From 2002-2011 the SLLA was used as the Commission- adopted exam option for a preliminary administrative services credential. In 2008, the Commission approved the development of a California-specific examination to replace the SLLA for this purpose, and in 2011, the newly developed, Commission-owned CPACE replaced the SLLA. SLLA #1010, 2006-2011 All sections of the SLLA consist of constructed-response questions only. The six-hour assessment is divided into four sections:
• Evaluation of Actions I (one hour) is based on ten short vignettes covering situations a principal might encounter. In each case, candidates respond to a focused question that asks for next steps, factors influencing a decision, or possible consequences of an action.
• Evaluation of Actions II (one hour) contains six longer vignettes. Each presents a dilemma based on typical school issues. Candidates must analyze the circumstances and respond to a focused analytical question that requires prioritizing action steps or articulating the relevant issues.
• Synthesis of Information and Problem Solving (two hours) contains two case studies involving teaching and learning issues. In each case, candidates must propose a course of action to address a complex problem, referring to a set of documents and a short scenario describing a school and its community.
• Analysis of Information and Decision Making (two hours) focuses on seven documents that relate to teaching and learning issues. Candidates must answer two questions about each document.
Educational Testing Services (ETS) has phased out the SLLA #1010, with the last administration in California on February 26, 2011. ETS revised the #1010 and now offers nationally the SLLA #1011. Because of the implementation of the California-oriented California Preliminary Administrative Credential Examination (CPACE) discussed earlier, SLLA #1011 is not being used towards California certification.
PSC 3B-30 January 2012
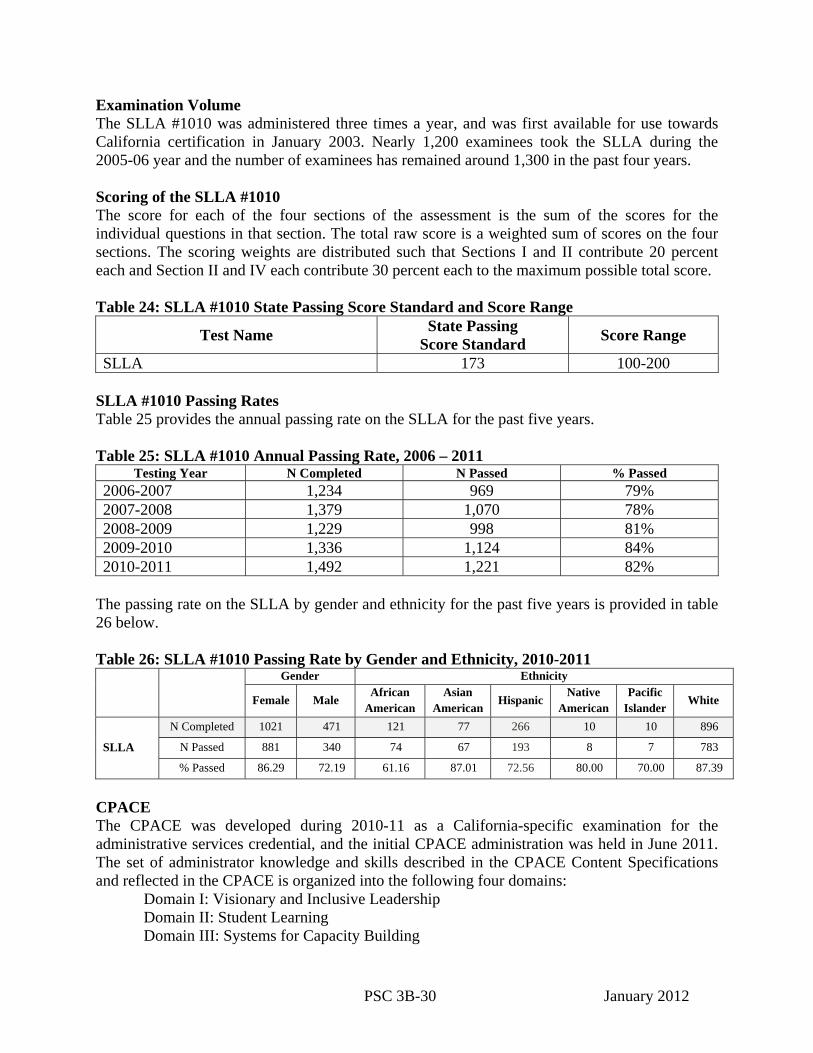
Examination Volume The SLLA #1010 was administered three times a year, and was first available for use towards California certification in January 2003. Nearly 1,200 examinees took the SLLA during the 2005-06 year and the number of examinees has remained around 1,300 in the past four years. Scoring of the SLLA #1010 The score for each of the four sections of the assessment is the sum of the scores for the individual questions in that section. The total raw score is a weighted sum of scores on the four sections. The scoring weights are distributed such that Sections I and II contribute 20 percent each and Section II and IV each contribute 30 percent each to the maximum possible total score. Table 24: SLLA #1010 State Passing Score Standard and Score Range
Test Name State Passing Score Standard Score Range
SLLA 173 100-200 SLLA #1010 Passing Rates Table 25 provides the annual passing rate on the SLLA for the past five years. Table 25: SLLA #1010 Annual Passing Rate, 2006 – 2011
Testing Year N Completed N Passed % Passed 2006-2007 1,234 969 79% 2007-2008 1,379 1,070 78% 2008-2009 1,229 998 81% 2009-2010 1,336 1,124 84% 2010-2011 1,492 1,221 82%
The passing rate on the SLLA by gender and ethnicity for the past five years is provided in table 26 below. Table 26: SLLA #1010 Passing Rate by Gender and Ethnicity, 2010-2011
Gender Ethnicity
Female Male African
American Asian
American Hispanic
Native American
Pacific Islander
White
SLLA
N Completed 1021 471 121 77 266 10 10 896
N Passed 881 340 74 67 193 8 7 783
% Passed 86.29 72.19 61.16 87.01 72.56 80.00 70.00 87.39
CPACE The CPACE was developed during 2010-11 as a California-specific examination for the administrative services credential, and the initial CPACE administration was held in June 2011. The set of administrator knowledge and skills described in the CPACE Content Specifications and reflected in the CPACE is organized into the following four domains:
Domain I: Visionary and Inclusive Leadership Domain II: Student Learning Domain III: Systems for Capacity Building

PSC 3B-31 January 2012
Domain IV: Resource Management and Educational Law To pass the CPACE, an examinee must pass both the CPACE-Written and the CPACE-Video. CPACE-Written The CPACE-Written is a three-hour and forty-five minute computer-based test that consists of 70 multiple-choice items, three focused assignments (short essays), and one case study. The multiple-choice items and constructed-response assignments are distributed across the four domains of the CPACE Content Specifications approximately as follows: 20% from Domain I, 30% from Domain II, 30% from Domain III, and 20% from Domain IV. CPACE-Video The CPACE-Video component requires the examinee to demonstrate knowledge, skills, and abilities in using effective communication skills in a professional interaction, such as facilitating a meeting. Although communication is specifically included as an example of the first competency of Domain I, the CPACE-Video addresses effective communication skills in professional interactions as described in all four domains of the CPACE Content Specifications. The holistic scoring approach used in assessing the video submissions allows reviewers to take into consideration aspects across domains in determining how well the examinee met the self-stated goals. CPACE scores are reported on a standard range of 100-300, with the scaled score of 220 representing the minimum passing score as determined by the Commission. Table 27: CPACE Annual Passing Rate, Initial Administration only, June 2011
Testing Year CPACE Written CPACE Video N Completed N Passed % Passed N Completed N Passed % Passed 2010-2011 104 35 34% 82 55 67%
Summary Highlights, All Examinations Overall, all examinations show a fairly steady passing rate pattern for the past five years, 2006-07 to 2010-11. The difference between the first-time passing rate and the cumulative passing rate for the CBEST, RICA, and CSET examinations clearly indicates that candidates persevere to take and pass the examinations, thus increasing the cumulative passing rates over time. For the CBEST, there was a significant decrease in the examination volume (by 29,000 examinees) between 2006-07 and 2010-11. Beginning in May 2007, a second option was available for individuals to meet the basic skills requirement. Individuals could pass the California Subject Examinations for Teachers: Multiple Subjects (CSET: MS) plus the additional CSET: Writing Skills subtest. Therefore, not all prospective teachers must pass the CBEST examination. This, the out-of-state basic skills option, and the lower number of individuals seeking credentials account for the downward trend in the CBEST exam volume. However, in 2010-11, 1,427 examinees took both the CSET: MS and the CSET: Writing Skills subtest. The first-time passing rate was in the 70 percent range and the cumulative passing rate was in the upper 80 percent range. The first-time passing rate remained fairly steady, while the cumulative passing rate showed a decline of 7 percentage points in the cumulative passing rate between the

PSC 3B-32 January 2012
2006-07 and 2010-11 cohorts for CBEST. Much of this decline can be explained by the fact that examinees in the 2010-11 cohort have not had as many chances to pass as previous cohorts. For the RICA, there was a decrease in the volume of administrations by 6,000, or 30 percent, between 2006-07 and 2010-11. Over the last five years, the first-time RICA passing rate was nearly 80 percent and the cumulative passing rate was in the mid 90 percent range. Both first-time and cumulative passing rates under the prior RICA showed a steady pattern for 2006-07 to 2008-09. Both initial and cumulative pass rates for the revised RICA appear to be somewhat lower than pass rates for its predecessor. The CSET showed a significant increase in examination volume: more than 240,000 examinees have attempted multiple and single subject examinations since the inception of the CSET in 2003. Though the examination volume is low for world languages and for specialized sciences, there has been a steady increase in the number of examinees taking these new CSET examinations. The annual passing rate was 78 percent for the CSET: Multiple Subjects and the cumulative passing rate was 91.3 percent. For the single subjects, the cumulative passing rate varied by content area from 48.8 percent to 100 percent. The overall CSET annual and cumulative passing rate for CSET multiple and single subject was 78.6 percent and 87.9 percent, respectively. Other examinations, such as the SLLA, TFE, and CTEL, have fairly consistent examination volumes. The initial passing rate on these examinations varied by gender and ethnicity.

PSC 3B- 33 January 2012
Report on Passing Rates of Commission-Approved Examinations
2006-07 to 2010-11 Appendix
Appendix A: CBEST .......................................................................................................... 34
A1 – CBEST Preparation and Demographic Data, 2006 - 2010 A2 – CBEST First-time and Cumulative Passing Rates by Demographic Variables, 2006 - 2010
Appendix B: CSET ............................................................................................................. 40
B1 – CSET: Multiple Subjects B2 – CSET: Multiple Subjects (Writing Skills only) B3 – CSET: Agriculture B4 – CSET: Art B5 – CSET: Business B6 – CSET: English B7 – CSET: Health Science B8 – CSET: Home Economics B9 – CSET: Industrial and Technology Education B10 – CSET: World Language (WL): American Sign Language B11 – CSET: World Language (WL): French B12 – CSET: World Language (WL): Mandarin B13 – CSET: World Language (WL): Spanish B14 – CSET: Mathematics (Foundational-level) B15 – CSET: Mathematics B16 – CSET: Music B17 – CSET: Physical Education B18 – CSET: Science: Biology/Life Science B19 – CSET: Science: Biology/Life Science (Specialized) B20 – CSET: Science: Chemistry B21 – CSET: Science: Chemistry (Specialized) B22 – CSET: Science: Earth/Planetary Science B23 – CSET: Science: Earth/Planetary Science (Specialized) B24 – CSET: Science: Physics B25 – CSET: Science: Physics (Specialized) B26 – CSET: Social Science
Note: For low incidence CSET examinations, passing rate data by demographic data are not provided. Pass rates are not calculated for exams with less than ten candidates.
Appendix C: TFE Passing Rate by Gender and Ethnicity .............................................. 53 Appendix D: RICA ............................................................................................................. 54
D1 – RICA Preparation and Demographic Data, 2006 - 2011 D2 – RICA First-time and Cumulative Passing Rates by Demographic Variables, 2006 - 2011
Appendix E: SLLA Passing Rate by Gender and Ethnicity ........................................... 58

PSC 3B- 34 January 2012
Appendix A1: CBEST Participation and Demographic Data, 2006 to 2011
CBEST Cohorts
2006 to 2011 N %
ALL EXAMINEES 180,127 100.0 Highest Level of High School Math Completed
No High School Math 279 0.2 General Math/Algebra I 13,821 7.7 Algebra II and/or Geometry 60,647 33.7 Pre-calculus 66,271 36.8 Calculus 35,575 19.7 No response 3,534 2.0
Number of High School Literature CoursesNo courses taken 16,787 9.3 1 course 44,337 24.6 2 or 3 courses 111,921 62.1 No response 7,082 3.9
Number of High School Writing CoursesNo courses taken 53,286 29.6 1 course 64,413 35.8 2 or 3 courses 55,346 30.7 No response 7,082 3.9
Number of High School Oral Language CoursesNo courses taken 142,303 79.0 1 or 2 courses 30,742 17.1 No response 7,082 3.9
High School Grade Point Average3.50 to 4.00 79,376 44.1 3.00 to 3.49 61,619 34.2 2.50 to 2.99 26,189 14.5 Below 2.50 7,701 4.3 No response 5,242 2.9
High School AttendanceIn California 133,560 74.1 Some in California 4,919 2.7 Not in California 39,167 21.7 No response 2,481 1.4
College Math No college math 12,197 6.8 HS-level courses 53,791 29.9 Calculus and/or Statistics 89,590 49.7 Advanced math 20,082 11.1 No response 4,467 2.5
College Grade Point Average 3.50 to 4.00 49,431 27.4 3.00 to 3.49 73,790 41.0 2.50 to 2.99 42,960 23.8 Below 2.50 8,110 4.5 No response 5,836 3.2
Number of College Literature Courses No courses taken 50,572 28.1 1 course 57,162 31.7 2 or 3 courses 66,933 37.2 No response 5,460 3.0

PSC 3B- 35 January 2012
CBEST Cohorts
2006 to 2010 N %
Number of College Writing CoursesNo courses taken 44,819 24.9 1 course 75,277 41.8 2 or 3 courses 54,571 30.3 No response 5,460 3.0
Number of College Oral Language Courses No courses taken 101,214 56.2 1 or 2 courses 73,453 40.8 No response 5,460 3.0
Education Level HS/Lower Division College 10,686 5.9 Upper Division College 44,202 24.5 Bachelor’s degree 73,236 40.7 Bachelor’s degree + additional units 29,395 16.3 Master’s degree 12,026 6.7 More than Master’s degree 8,256 4.6 No response 2,326 1.3
Years Away from College Currently attending college 50,474 28.0 Less than a year 37,415 20.8 1-3 years 33,663 18.7 4-10 years 25,847 14.3 More than 10 years 25,089 13.9 No response 7,639 4.2
Professional Preparation Enrolled in Professional Preparation Program 119,230 66.2 Completed Professional Preparation Program 18,274 10.1 Considering a Professional Preparation Program 20,302 11.3 Not enrolled in Professional Preparation Program 2,509 1.4 Have not begun Professional Preparation Program 12,533 7.0 No response 7,279 4.0
Special Preparation Took test preparation courses 14,031 7.8 Did not take test preparation courses 161,935 89.9 No response 4,161 2.3
Employment Status Student 47,547 26.4 Working as a teacher in a school 11,151 6.2 Working as school/district administrator 874 0.5 Working in another school role 26,028 14.4 Employed, but not in a school role 60,321 33.5 Unemployed outside the home 28,947 16.1 No response 5,259 2.9
Reason for Taking CBEST For teaching credential 86,115 47.8 For service credential 4,712 2.6 For Full-time or Part-time employment or substitute list 69,319 38.5 For admission to Professional Preparation program 17,867 9.9 No response 2,114 1.2

PSC 3B- 36 January 2012
CBEST Cohorts
2006 to 2010 N %
Type of Credential Elementary teaching 47,232 26.2 Secondary teaching 46,129 25.6 Teaching adults 2,278 1.3 Teaching special education students 8,963 5.0 Admin. Services or school counseling 7,809 4.3 Emergency/substitute teaching 16,786 9.3 Other credential or permit 12,145 6.7 Not now seeking credential/permit 29,476 16.4 No response 9,309 5.2
Father’s Education High school diploma or less 57,192 31.8 Some college 37,373 20.7 Bachelor’s degree or higher 74,515 41.4 Unknown 8,045 4.5 No response 3,002 1.7
Mother’s Education High school diploma or less 58,335 32.4 Some college 47,785 26.5 Bachelor’s degree or higher 65,650 36.4 Unknown 5,545 3.1 No response 2,812 1.6
Best Language English 169,780 94.3 Spanish 3,940 2.2 Other languages 4,077 2.3 No response 2,330 1.3
Gender Female 120,566 66.9 Male 54,900 30.5 No response 4,661 2.6
Ethnicity African American 9,708 5.4 Asian American 9,493 5.3 Filipino 4,786 2.7 South East Asian 2,542 1.4 Pacific Islander 2400 1.3 Mexican American 22,927 12.7 Latino 10,442 5.8 Native American 899 0.5 White 84,678 47.0 Other 9,133 5.1 No response 23,119 12.8

PSC 3B- 37 January 2012
Appendix A2: CBEST First-Time and Cumulative Passing Rates by Demographic Variables, 2006 – 2010
CBEST
First-Time Passing Rate: Cohorts 2006 to 2010
Cumulative Passing Rate: Cohorts 2006 to 2010
N Completed
N Passed
% Passed
N Completed
N Passed
% Passed
ALL EXAMINEES 168,905 119,346 70.7 176,072 149,044 84.6 High School Math Coursework
No High School Math 229 142 62.0 254 189 74.4 General Math/Algebra I 11,937 5,741 48.1 13,003 8,869 68.2 Algebra II and/or Geometry 56,520 35,606 63.0 59,222 48,044 81.1 Pre-calculus 63,239 47,995 75.9 65,307 57,732 88.4 Calculus 33,924 27,793 81.9 34,978 31,535 90.2 No response 3,056 2,069 67.7 3,308 2,675 80.9
High School Grade Point Average3.50 to 4.00 76,203 61,795 81.1 78,306 71,131 90.8 3.00 to 3.49 57,582 37,874 65.8 60,159 49,562 82.4 2.50 to 2.99 23,778 13,065 54.9 25,301 19,053 75.3 Below 2.50 6,796 3,527 51.9 7,395 5,404 73.1 No response 4,546 3,085 67.9 4,911 3,894 79.3
High School AttendanceIn California 126,570 88,838 70.2 131,212 111,900 85.3 Some in California 4,432 3,060 69.0 4,742 3,890 82.0 Not in California 35,748 25,979 72.7 37,795 31,410 83.1 No response 2,155 1,469 68.2 2,323 1,844 79.4
College Math No college math 11,477 8,996 78.4 11,881 10,167 85.6 HS-level courses 50,176 32,758 65.3 52,398 42,575 81.3 Calculus and/or Statistics 84,934 62,543 73.6 88,049 76,781 87.2 Advanced math 18,380 12,354 67.2 19,527 16,175 82.8 No response 3,938 2,695 68.4 4,217 3,346 79.3
College Grade Point Average 3.50 to 4.00 46,804 37,995 81.2 48,623 44,225 91.0 3.00 to 3.49 69,343 49,435 71.3 72,217 62,124 86.0 2.50 to 2.99 40,089 24,463 61.0 41,859 32,890 78.6 Below 2.50 7,505 4,158 55.4 7,856 5,675 72.2 No response 5,164 3,295 63.8 5,517 4,130 74.9
Number of High School Literature Courses No courses taken 14,739 9,210 62.5 15,894 11,943 75.1 1 course 41,490 29,100 70.1 43,257 35,564 82.2 2 or 3 courses 106,801 77,301 72.4 110,437 96,612 87.5 No response 5,875 3,735 63.6 6,484 4,925 76.0
Number of High School Oral Language Courses No courses taken 134,155 95,802 71.4 139,460 118,531 85.0 1 or 2 courses 28,875 19,809 68.6 30,128 25,588 84.9 No response 5,875 3,735 63.6 6,484 4,925 76.0
Education Level HS/Lower Division College 10,087 6,791 67.3 10,363 8,146 78.6 Upper Division College 41,781 29,232 70.0 43,362 37,020 85.4 Bachelor’s degree 68,858 48,787 70.9 71,678 60,709 84.7 Bachelor’s degree + additional units 27,272 18,926 69.4 28,704 24,431 85.1 Master’s degree 11,132 8,181 73.5 11,708 9,862 84.2 More than Master’s degree 7,742 6,052 78.2 8,076 7,149 88.5 No response 2,033 1,377 67.7 2,181 1,727 79.2

PSC 3B- 38 January 2012
CBEST
First-Time Passing Rate: Cohorts 2006 to 2010
Cumulative Passing Rate: Cohorts 2006 to 2010
N Completed
N Passed
% Passed
N Completed
N Passed
% Passed
Years Away from CollegeCurrently attending college 47,869 33,418 69.8 49,530 41,973 84.7 Less than a year 35,691 25,425 71.2 36,870 31,980 86.7 1-3 years 31,706 21,985 69.3 33,047 27,687 83.8 4-10 years 23,857 16,768 70.3 25,083 20,785 82.9 More than 10 years 22,875 17,011 74.4 24,268 20,868 86.0 No response 6,907 4,739 68.6 7,274 5,751 79.1
Professional Preparation Enrolled in Professional Preparation 112,781 82,460 73.1 116,841 99,729 85.4 Completed Professional Preparation 17,207 11,849 68.9 17,932 15,279 85.2 Considering Professional Preparation 18,672 11,013 59.0 19,863 16,629 83.7 Not enrolled in Professional Preparation 2,194 1,236 56.3 2,383 1,702 71.4 Have not begun Professional Preparation 11,523 8,268 71.8 12,168 10,254 84.3 No response 6,528 4,520 69.2 6,885 5,451 79.2
Special Preparation Took test preparation courses 12,139 5,891 48.5 13,460 10,106 75.1 Did not take test preparation courses 153,065 110,912 72.5 158,669 135,759 85.6 No response 3,701 2,543 68.7 3,943 3,179 80.6
Employment Status Student 45,143 31,955 70.8 46,754 40,305 86.2 Working as a teacher in a school 10,124 6,821 67.4 10,784 8,905 82.6 Working as school/district administrator 795 542 68.2 839 688 82.0 Working in another school role 23,632 14,501 61.4 25,281 20,451 80.9 Employed, but not in a school role 57,273 41,947 73.2 59,133 50,646 85.6 Unemployed outside the home 27,204 20,247 74.4 28,279 23,987 84.8 No response 4,734 3,333 70.4 5,002 4,062 81.2
Reason for Taking CBEST For teaching credential 80,035 54,098 67.6 84,061 70,849 84.3 For service credential 4,368 2,991 68.5 4,621 4,009 86.8 For employment or substitute list 65,874 48,636 73.8 67,937 57,490 84.6 For admission to Professional Preparation 16,729 12,241 73.2 17,475 15,105 86.4 Other 1,899 1,380 72.7 1,978 1,591 80.4
Type of Credential Elementary teaching 43,956 28,445 64.7 46,115 38,158 82.7 Secondary teaching 43,589 32,722 75.1 45,333 40,032 88.3 Teaching adults 1,976 1,213 61.4 2,145 1,636 76.3 Teaching special education students 8,083 4,785 59.2 8,673 6,905 79.6 Admin. Services or school counseling 7,179 4,406 61.4 7,631 6,204 81.3 Emergency/substitute teaching 16,002 12,294 76.8 16,523 14,482 87.6 Other credential or permit 11,410 8,360 73.3 11,854 10,044 84.7 Not now seeking credential/permit 28,081 20,688 73.7 28,886 24,388 84.4 No response 8,629 6,433 74.6 8,912 7,195 80.7

PSC 3B- 39 January 2012
CBEST
First-Time Passing Rate: Cohorts 2006 to 2010
Cumulative Passing Rate: Cohorts 2006 to 2010
N Completed
N Passed
% Passed
N Completed
N Passed
% Passed
Father’s Education High school diploma or less 52,363 31,918 61.0 55,397 43,920 79.3 Some college 35,709 26,332 73.7 36,810 32,090 87.2 Bachelor’s degree or higher 71,275 56,283 79.0 73,364 65,591 89.4 Unknown 6,891 2,936 42.6 7,652 5,118 66.9 No response 2,667 1,877 70.4 2,849 2,325 81.6
Mother’s Education High school diploma or less 53,119 32,435 61.1 56,385 44,557 79.0 Some college 45,654 33,518 73.4 47,069 40,973 87.0 Bachelor’s degree or higher 63,062 50,047 79.4 64,731 58,077 89.7 Unknown 4,580 1,592 34.8 5,225 3,258 62.4 No response 2,490 1,754 70.4 2,662 2,179 81.9
Best Language English 161,151 116,513 72.3 166,793 143,509 86.0 Spanish 2,734 622 22.8 3,494 1,903 54.5 Other languages 2,935 712 24.3 3,578 1,832 51.2 No response 2,085 1,499 71.9 2,207 1,800 81.6
Gender Female 112,290 77,095 68.7 117,568 98,388 83.7 Male 52,098 38,290 73.5 53,919 46,424 86.1 No response 4,517 3,961 87.7 4,585 4,232 92.3
Ethnicity African American 8,676 4,007 46.2 9,285 6,240 67.2 Asian American 8,616 5,742 66.6 9,134 7,278 79.7 Filipino 4,290 2,409 56.2 4,584 3,407 74.3 South East Asian 2,285 1157 50.6 2,450 1,711 69.8 Pacific Islander 2137 1179 55.2 2295 1631 71.1 Mexican American 20,653 10,787 52.2 22,164 16,717 75.4 Latino 9,074 4,774 52.6 9,935 7,280 73.3 Native American 851 601 70.6 882 748 84.8 White 81,775 65,339 79.9 83,787 76,401 91.2 Other 8,428 5,612 66.6 8,861 7,341 82.8 No response 22,120 17,739 80.2 22,695 20,290 89.4

PSC 3B- 40 January 2012
Appendix B1: CSET Multiple Subjects – Annual (2010-11) & Cumulative Passing Rates, 2003-11
Annual Passing Rate Cumulative Passing Rate N
Completed N
Passed %
Passed N
Completed N
Passed %
Passed ALL EXAMINEES 6,767 5,278 78.0 135,453 123,663 91.3
Ethnicity African American 208 116 55.8 5,876 4,698 80.0 Asian American 609 465 76.4 13,043 11,849 90.8 Hispanic American 1,223 783 64.0 29,778 26,041 87.5 Native American 49 39 79.6 770 676 87.8 White, non-Hispanic 3,524 2,955 83.9 72,365 67,974 93.9
Gender Female 1,171 935 79.8 22,036 20,124 91.3 Male 5,463 4,232 77.5 112,159 102,366 91.3
Reason for Taking the CSET To obtain an initial MS/SS teaching credential 5,393 4,223 78.3 102,022 93,441 91.6 To obtain an initial Ed Special teaching credential 617 469 76.0 4,587 4,029 87.8 To add an authorization 213 183 85.9 6,389 5,948 93.1 To meet NCLB requirement – possess MSTC 92 74 80.4 9,652 8,972 93.0
College/University Training In California 5,222 4,042 77.4 103,649 94,895 91.6 Outside of California 765 655 85.6 14,749 13,644 92.5
Highest Educational Level Fresh/Soph/Jr/Sr College 2,178 1,712 78.6 28,538 26,785 93.9 Bachelor’s degree + additional credits 3,671 2,854 77.7 86,395 78,738 91.1 Master’s degree or doctoral degree 518 425 82.0 10,916 9,754 89.4 Appendix B2: CSET Multiple Subjects (Writing Skills only) – Annual (2010-11) and Cumulative Passing Rates, May 2007-2011
Annual Passing Rate Cumulative Passing Rate N
Completed N
Passed %
Passed N
Completed N
Passed %
Passed ALL EXAMINEES 1,427 1,209 84.7 6,053 5,001 82.6
Ethnicity African American 43 34 79.1 206 157 76.2 Asian American 151 115 76.2 626 456 72.8 Hispanic American 224 156 69.6 1,135 741 65.3 Native American 9 25 23 92.0 White, non-Hispanic 746 679 91.0 3,135 2,820 90.0
Gender Female 1,201 1,016 84.6 5,098 4,195 82.3 Male 206 174 84.5 859 714 83.1
Reason for Taking the CSET To obtain an initial MS/SS teaching credential 1,055 886 84.0 4,865 4,063 83.5 To obtain an initial Ed Special teaching credential 174 160 92.0 411 338 82.2 To add an authorization 29 25 86.2 72 54 75.0
College/University Training In California 1,003 833 83.1 4,166 3,398 81.6 Outside of California 207 197 95.2 899 827 92.0
Highest Educational Level Fresh/Soph/Jr/Sr College 593 494 83.3 2,535 2,166 85.4 Bachelor’s degree + additional credits 688 593 86.2 2,922 2,379 81.4 Master’s degree or doctoral degree 57 53 93.0 277 239 86.3

PSC 3B- 41 January 2012
Appendix B3: CSET: Agriculture – Annual (2010-11) and Cumulative Passing Rate, 2005-2011 Annual Passing Rate Cumulative Passing Rate
N Completed
N Passed
% Passed
N Completed
N Passed
% Passed
ALL EXAMINEES 13 5 38.5 135 67 49.6 Ethnicity
African American 1 Asian American 3 7 Hispanic American 7 Native American 3 White, non-Hispanic 10 2 20.0 107 53 49.5
Gender Female 10 3 30.0 84 39 46.4 Male 3 48 26 54.2
Reason for Taking the CSET To obtain an initial MS/SS teaching credential 6 100 55 55.0 To obtain an initial Ed Special teaching credential 6 To add an authorization 4 19 5 26.3
College/University Training In California 7 105 58 55.2 Outside of California 2 12 3 25.0
Educational Level Fresh/Soph/Jr/Sr College 1 16 6 37.5 Bachelor’s degree + additional credits 7 91 47 51.6 Master’s degree or doctoral degree 2 17 8 47.1 Appendix B4: CSET: Art – Annual (2010-11) and Cumulative Passing Rate, 2004-2011 Annual Passing Rate Cumulative Passing Rate
N Completed
N Passed
% Passed
N Completed
N Passed
% Passed
ALL EXAMINEES 172 125 72.7 1,524 1,249 82.0 Ethnicity
African American 2 25 14 56.0 Asian American 12 10 83.3 108 88 81.5 Hispanic American 21 14 66.7 180 139 77.2 Native American 5 22 16 72.7 White, non-Hispanic 97 74 76.3 951 800 84.1
Gender Female 122 84 68.9 1,034 830 80.3 Male 47 38 80.9 472 402 85.2
Reason for Taking the CSET To obtain an initial MS/SS teaching credential 119 88 73.9 1,121 916 81.7 To obtain an initial Ed Special teaching credential 2 16 11 68.8 To add an authorization 41 29 70.7 324 273 84.3
College/University Training In California 123 92 74.8 1,108 908 81.9 Outside of California 27 19 70.4 297 250 84.2
Educational Level Fresh/Soph/Jr/Sr College 18 12 66.7 69 55 79.7 Bachelor’s degree + additional credits 105 77 73.3 1,104 906 82.1 Master’s degree or doctoral degree 38 29 76.3 291 243 83.5

PSC 3B- 42 January 2012
Appendix B5: CSET: Business – Annual (2010-11) and Cumulative Passing Rates, 2005-2011 Annual Passing Rate Cumulative Passing Rate
N Completed
N Passed
% Passed
N Completed
N Passed
% Passed
ALL EXAMINEES 48 25 52.1 530 291 54.9 Ethnicity
African American 0 38 10 26.3 Asian American 7 4 57.1 54 27 50.0 Hispanic American 4 57 29 50.9 Native American 4 White, non-Hispanic 32 17 53.1 335 196 58.5
Gender Female 18 10 55.6 223 109 48.9 Male 30 15 50.0 305 181 59.3
Reason for Taking the CSET To obtain an initial MS/SS teaching credential 20 12 60.0 336 179 53.3 To obtain an initial Ed Special teaching credential 1 8 To add an authorization 22 10 45.5 134 76 56.7
College/University Training In California 25 14 56.0 334 184 55.1 Outside of California 9 113 64 56.6
Educational Level Fresh/Soph/Jr/Sr College 5 Bachelor’s degree + additional credits 25 16 64.0 313 164 52.4 Master’s degree or doctoral degree 18 7 38.9 159 93 58.5 Appendix B6: CSET: English – Annual (2010-11) and Cumulative Passing Rates, 2003-2011 Annual Passing Rate Cumulative Passing Rate
N Completed
N Passed
% Passed
N Completed
N Passed
% Passed
ALL EXAMINEES 1,702 1,016 59.7 21,029 16,572 78.8 Ethnicity
African American 67 31 46.3 1,164 760 65.3 Asian American 156 86 55.1 1,623 1,264 77.9 Hispanic American 204 98 48.0 2,531 1,800 71.1 Native American 8 118 89 75.4 White, non-Hispanic 949 590 62.2 13,050 10,635 81.5
Gender Female 1,190 716 60.2 14,562 11,516 79.1 Male 470 270 57.4 6,203 4,837 78.0
Reason for Taking the CSET To obtain an initial MS/SS teaching credential 1,097 665 60.6 14,851 11,939 80.4 To obtain an initial Ed Special teaching credential 31 12 38.7 264 180 68.2 To add an authorization 455 265 58.2 4,296 3,238 75.4
College/University Training In California 1,227 704 57.4 14,129 11,009 77.9 Outside of California 282 192 68.1 4,239 3,541 83.5
Educational Level Fresh/Soph/Jr/Sr College 191 128 67.0 1,562 1,240 79.4 Bachelor’s degree + additional credits 983 554 56.4 13,291 10,482 78.9 Master’s degree or doctoral degree 392 253 64.5 4,398 3,493 79.4

PSC 3B- 43 January 2012
Appendix B7: CSET: Health Science – Annual (2010-11) & Cumulative Passing Rates, 2005-2011 Annual Passing Rate Cumulative Passing Rate
N Completed
N Passed
% Passed
N Completed
N Passed
% Passed
ALL EXAMINEES 266 170 63.9 2,354 1,746 74.2 Ethnicity
African American 7 168 87 51.8 Asian American 29 21 72.4 183 137 74.9 Hispanic American 41 24 58.5 301 202 67.1 Native American 15 10 66.7 White, non-Hispanic 151 99 65.6 1,438 1,124 78.2
Gender Female 161 112 69.6 1,479 1,153 78.0 Male 103 56 54.4 856 577 67.4
Reason for Taking the CSET To obtain an initial MS/SS teaching credential 71 42 59.2 1,081 772 71.4 To obtain an initial Ed Special teaching credential 10 2 20.0 126 87 69.0 To add an authorization 159 111 69.8 940 739 78.6
College/University Training In California 180 111 61.7 1,592 1,172 73.6 Outside of California 34 26 76.5 304 235 77.3
Educational Level Fresh/Soph/Jr/Sr College 2 46 28 60.9 Bachelor’s degree + additional credits 128 79 61.7 1,456 1,059 72.7 Master’s degree or doctoral degree 103 70 68.0 629 488 77.6 Appendix B8: CSET: Home Economics – Annual (2010-11) & Cumulative Passing Rates, 2005-11 Annual Passing Rate Cumulative Passing Rate
N Completed
N Passed
% Passed
N Completed
N Passed
% Passed
ALL EXAMINEES 34 15 44.1 292 213 72.9 Ethnicity
African American 6 Asian American 3 20 11 55.0 Hispanic American 1 20 15 75.0 Native American 1 2 White, non-Hispanic 22 10 45.5 208 159 76.4
Gender Female 32 14 43.8 273 199 72.9 Male 2 16 11 68.8
Reason for Taking the CSET To obtain an initial MS/SS teaching credential 8 132 94 71.2 To obtain an initial Ed Special teaching credential 10 6 60.0 To add an authorization 22 11 50.0 124 96 77.4
College/University Training In California 20 9 45.0 170 122 71.8 Outside of California 4 43 32 74.4
Educational Level Fresh/Soph/Jr/Sr College 1 6 Bachelor’s degree + additional credits 14 7 50.0 170 125 73.5 Master’s degree or doctoral degree 16 7 43.8 87 62 71.3

PSC 3B- 44 January 2012
Appendix B9: CSET: Industrial & Technology Education –Annual (2010-11) and Cumulative Passing Rates, 2005-2011 Annual Passing Rate Cumulative Passing Rate
N Completed
N Passed
% Passed
N Completed
N Passed
% Passed
ALL EXAMINEES 63 50 79.4 340 296 87.1 Ethnicity
African American 8 Asian American 6 29 26 89.7 Hispanic American 5 25 18 72.0 Native American White, non-Hispanic 45 38 84.4 244 218 89.3
Gender Female 11 7 63.6 48 35 72.9 Male 50 41 82.0 290 259 89.3
Reason for Taking the CSET To obtain an initial MS/SS teaching credential 13 10 76.9 138 120 87.0 To obtain an initial Ed Special teaching credential 1 2 To add an authorization 44 38 86.4 171 152 88.9
College/University Training In California 30 23 76.7 197 173 87.8 Outside of California 12 12 100.0 51 48 94.1
Educational Level Fresh/Soph/Jr/Sr College 1 7 Bachelor’s degree + additional credits 31 24 77.4 194 168 86.6 Master’s degree or doctoral degree 26 22 84.6 106 94 88.7 Appendix B10: CSET: ASL – Annual (2010-11) and Cumulative Passing Rates, 2005-2011 Annual Passing Rate Cumulative Passing Rate
N Completed
N Passed
% Passed
N Completed
N Passed
% Passed
ALL EXAMINEES 15 5 33.3 130 68 52.3 Ethnicity
African American 2 Asian American 3 7 Hispanic American 12 5 41.7 Native American 1 White, non-Hispanic 11 5 45.5 92 52 56.5
Gender Female 13 4 30.8 110 57 51.8 Male 2 19 10 52.6
Reason for Taking the CSET To obtain an initial MS/SS teaching credential 5 72 41 56.9 To obtain an initial Ed Special teaching credential 1 9 To add an authorization 8 43 21 48.8
College/University Training In California 11 3 27.3 98 50 51.0 Outside of California 3 21 12 57.1
Educational Level Fresh/Soph/Jr/Sr College 1 10 4 40.0 Bachelor’s degree + additional credits 6 67 31 46.3 Master’s degree or doctoral degree 7 47 30 63.8

PSC 3B- 45 January 2012
Appendix B11: CSET: French – Annual (2010-11) and Cumulative Passing Rates, 2004-2011 Annual Passing Rate Cumulative Passing Rate
N Completed
N Passed
% Passed
N Completed
N Passed
% Passed
ALL EXAMINEES 50 42 84.0 499 446 89.4 Ethnicity
African American 3 39 34 87.2 Asian American 5 29 25 86.2 Hispanic American 4 29 24 82.8 Native American 1 1 White, non-Hispanic 30 26 86.7 323 292 90.4
Gender Female 37 32 86.5 372 338 90.9 Male 12 9 75.0 118 99 83.9
Reason for Taking the CSET To obtain an initial MS/SS teaching credential 29 24 82.8 296 262 88.5 To obtain an initial Ed Special teaching credential 4 To add an authorization 19 16 84.2 149 133 89.3
College/University Training In California 20 18 90.0 186 168 90.3 Outside of California 17 13 76.5 200 178 89.0
Educational Level Fresh/Soph/Jr/Sr College 2 20 16 80.0 Bachelor’s degree + additional credits 28 23 82.1 258 225 87.2 Master’s degree or doctoral degree 17 16 94.1 171 158 92.4 Appendix B12: CSET: Mandarin – Annual (2010-11) and Cumulative Passing Rates, 2004-2011 Annual Passing Rate Cumulative Passing Rate
N Completed
N Passed
% Passed
N Completed
N Passed
% Passed
ALL EXAMINEES 70 58 82.9 775 724 93.4 Ethnicity
African American Asian American 60 50 83.3 633 596 94.2 Hispanic American Native American White, non-Hispanic 3 12 9 75.0
Gender Female 59 50 84.7 636 596 93.7 Male 11 8 72.7 122 112 91.8
Reason for Taking the CSET To obtain an initial MS/SS teaching credential 36 33 91.7 492 467 94.9 To obtain an initial Ed Special teaching credential 3 29 26 89.7 To add an authorization 18 13 72.2 153 136 88.9
College/University Training In California 13 9 69.2 145 125 86.2 Outside of California 34 30 88.2 329 318 96.7
Educational Level Fresh/Soph/Jr/Sr College 4 17 16 94.1 Bachelor’s degree + additional credits 23 19 82.6 282 257 91.1 Master’s degree or doctoral degree 32 26 81.3 367 347 94.6

PSC 3B- 46 January 2012
Appendix B13: CSET: Spanish – Annual (2010-11) and Cumulative Passing Rates, 2004-2011 Annual Passing Rate Cumulative Passing Rate
N Completed
N Passed
% Passed
N Completed
N Passed
% Passed
ALL EXAMINEES 304 244 80.3 3,089 2,688 87.0 Ethnicity
African American 2 41 37 90.2 Asian American 11 10 90.9 90 79 87.8 Hispanic American 160 127 79.4 1,787 1,522 85.2 Native American 8 White, non-Hispanic 84 69 82.1 853 775 90.9
Gender Female 229 188 82.1 2,176 1,905 87.5 Male 69 53 76.8 872 751 86.1
Reason for Taking the CSET To obtain an initial MS/SS teaching credential 192 150 78.1 1,975 1,724 87.3 To obtain an initial Ed Special teaching credential 2 32 28 87.5 To add an authorization 86 74 86.0 780 693 88.8
College/University Training In California 178 144 80.9 1,723 1,487 86.3 Outside of California 59 56 94.9 711 658 92.5
Educational Level Fresh/Soph/Jr/Sr College 38 30 78.9 238 208 87.4 Bachelor’s degree + additional credits 171 134 78.4 1,869 1,611 86.2 Master’s degree or doctoral degree 72 65 90.3 668 609 91.2 Appendix B14: CSET: Mathematics (Foundational-Level) – Annual (2010-11) and Cumulative Passing Rates, 2003-2011 Annual Passing Rate Cumulative Passing Rate
N Completed
N Passed
% Passed
N Completed
N Passed
% Passed
ALL EXAMINEES 1,446 578 40.0 14,652 7,152 48.8 Ethnicity
African American 71 20 28.2 933 320 34.3 Asian American 232 108 46.6 2,375 1,332 56.1 Hispanic American 246 67 27.2 2,321 944 40.7 Native American 6 66 21 31.8 White, non-Hispanic 682 288 42.2 7,493 3,806 50.8
Gender Female 815 308 37.8 7,919 3,770 47.6 Male 613 260 42.4 6,587 3,304 50.2
Reason for Taking the CSET To obtain an initial MS/SS teaching credential 892 393 44.1 8,999 4,692 52.1 To obtain an initial Ed Special teaching credential 21 3 14.3 152 41 27.0 To add an authorization 434 153 35.3 4,310 1,839 42.7
College/University Training In California 987 372 37.7 9,557 4,440 46.5 Outside of California 226 123 54.4 2,471 1,389 56.2
Educational Level Fresh/Soph/Jr/Sr College 138 59 42.8 768 324 42.2 Bachelor’s degree + additional credits 946 365 38.6 9,580 4,605 48.1 Master’s degree or doctoral degree 273 124 45.4 3,057 1,564 51.2

PSC 3B- 47 January 2012
Appendix B15: CSET: Mathematics – Annual (2010-11) & Cumulative Passing Rates, 2003-2011 Annual Passing Rate Cumulative Passing Rate
N Completed
N Passed
% Passed
N Completed
N Passed
% Passed
ALL EXAMINEES 472 266 56.4 8,258 5,086 61.6 Ethnicity
African American 12 5 41.7 399 146 36.6 Asian American 89 59 66.3 1,874 1,347 71.9 Hispanic American 57 24 42.1 925 426 46.1 Native American 2 32 12 37.5 White, non-Hispanic 239 136 56.9 4,093 2,541 62.1
Gender Female 221 104 47.1 3,644 2,133 58.5 Male 243 156 64.2 4,473 2,848 63.7
Reason for Taking the CSET To obtain an initial MS/SS teaching credential 383 231 60.3 5,925 3,690 62.3 To obtain an initial Ed Special teaching credential 7 57 32 56.1 To add an authorization 49 14 28.6 1,556 942 60.5
College/University Training In California 318 185 58.2 5,021 2,974 59.2 Outside of California 92 51 55.4 2,026 1,414 69.8
Educational Level Fresh/Soph/Jr/Sr College 96 51 53.1 707 438 62.0 Bachelor’s degree + additional credits 249 138 55.4 4,829 2,821 58.4 Master’s degree or doctoral degree 98 60 61.2 1,987 1,378 69.4 Appendix B16: CSET: Music – Annual (2010-11) and Cumulative Passing Rates, 2004-2011 Annual Passing Rate Cumulative Passing Rate
N Completed
N Passed
% Passed
N Completed
N Passed
% Passed
ALL EXAMINEES 71 61 85.9 796 729 91.6 Ethnicity
African American 1 23 18 78.3 Asian American 10 8 80.0 86 78 90.7 Hispanic American 6 80 75 93.8 Native American 4 White, non-Hispanic 38 35 92.1 508 470 92.5
Gender Female 34 28 82.4 393 358 91.1 Male 36 32 88.9 396 365 92.2
Reason for Taking the CSET To obtain an initial MS/SS teaching credential 62 55 88.7 668 622 93.1 To obtain an initial Ed Special teaching credential 1 10 7 70.0 To add an authorization 6 86 73 84.9
College/University Training In California 54 46 85.2 539 499 92.6 Outside of California 12 10 83.3 205 187 91.2
Educational Level Fresh/Soph/Jr/Sr College 14 11 78.6 69 61 88.4 Bachelor’s degree + additional credits 38 34 89.5 476 442 92.9 Master’s degree or doctoral degree 18 15 83.3 218 197 90.4

PSC 3B- 48 January 2012
Appendix B17: CSET: Physical Education – Annual (2010-11) and Cumulative Passing Rates, 2004-2011 Annual Passing Rate Cumulative Passing Rate
N Completed
N Passed
% Passed
N Completed
N Passed
% Passed
ALL EXAMINEES 483 241 49.9 4,303 3,034 70.5 Ethnicity
African American 15 3 20.0 296 150 50.7 Asian American 43 23 53.5 315 212 67.3 Hispanic American 75 31 41.3 557 342 61.4 Native American 5 35 17 48.6 White, non-Hispanic 284 152 53.5 2,691 2,022 75.1
Gender Female 212 114 53.8 1,797 1,281 71.3 Male 270 127 47.0 2,481 1,740 70.1
Reason for Taking the CSET To obtain an initial MS/SS teaching credential 256 117 45.7 2,709 1,914 70.7 To obtain an initial Ed Special teaching credential 6 59 35 59.3 To add an authorization 181 101 55.8 1,160 832 71.7
College/University Training In California 307 156 50.8 2,784 1,980 71.1 Outside of California 61 28 45.9 565 410 72.6
Educational Level Fresh/Soph/Jr/Sr College 33 12 36.4 120 69 57.5 Bachelor’s degree + additional credits 291 138 47.4 2,889 2,032 70.3 Master’s degree or doctoral degree 114 71 62.3 844 629 74.5 Appendix B18: CSET Science: Biology/Life Science – Annual (2010-11) and Cumulative Passing Rates, 2003-2011 Annual Passing Rate Cumulative Passing Rate
N Completed
N Passed
% Passed
N Completed
N Passed
% Passed
ALL EXAMINEES 579 423 73.1 8,361 6,659 79.6 Ethnicity
African American 9 298 183 61.4 Asian American 98 72 73.5 1,290 1,018 78.9 Hispanic American 63 41 65.1 975 707 72.5 Native American 1 62 51 82.3 White, non-Hispanic 305 225 73.8 4,796 3,933 82.0
Gender Female 372 269 72.3 5,100 3,971 77.9 Male 191 141 73.8 3,156 2,599 82.4
Reason for Taking the CSET To obtain an initial MS/SS teaching credential 422 343 81.3 6,163 5,188 84.2 To obtain an initial Ed Special teaching credential 8 64 44 68.8 To add an authorization 104 54 51.9 1,437 933 64.9
College/University Training In California 409 303 74.1 5,516 4,408 79.9 Outside of California 114 91 79.8 1,800 1,507 83.7
Educational Level Fresh/Soph/Jr/Sr College 116 104 89.7 807 736 91.2 Bachelor’s degree + additional credits 329 239 72.6 5,406 4,315 79.8 Master’s degree or doctoral degree 93 57 61.3 1,468 1,115 76.0

PSC 3B- 49 January 2012
Appendix B19: CSET Science: Biology/Life Science (Specialized) – Annual (2010-11) and Cumulative Passing Rates, 2003-2011 Annual Passing Rate Cumulative Passing Rate
N Completed
N Passed
% Passed
N Completed
N Passed
% Passed
ALL EXAMINEES 156 105 67.3 1,867 1,387 74.3 Ethnicity
African American 2 92 55 59.8 Asian American 16 12 75.0 280 221 78.9 Hispanic American 21 13 61.9 237 164 69.2 Native American 3 10 7 70.0 White, non-Hispanic 90 62 68.9 1,042 793 76.1
Gender Female 101 66 65.3 1,234 889 72.0 Male 52 37 71.2 612 482 78.8
Reason for Taking the CSET To obtain an initial MS/SS teaching credential 89 69 77.5 1,174 934 79.6 To obtain an initial Ed Special teaching credential 3 25 18 72.0 To add an authorization 44 22 50.0 428 277 64.7
College/University Training In California 98 63 64.3 1,163 859 73.9 Outside of California 37 31 83.8 396 321 81.1
Educational Level Fresh/Soph/Jr/Sr College 14 11 78.6 133 105 78.9 Bachelor’s degree + additional credits 87 56 64.4 1,113 841 75.6 Master’s degree or doctoral degree 40 31 77.5 441 326 73.9 Appendix B20: CSET Science: Chemistry – Annual (2010-11) & Cumulative Passing Rates, 2003-11 Annual Passing Rate Cumulative Passing Rate
N Completed
N Passed
% Passed
N Completed
N Passed
% Passed
ALL EXAMINEES 220 172 78.2 3,169 2,564 80.9 Ethnicity
African American 5 107 71 66.4 Asian American 42 34 81.0 629 531 84.4 Hispanic American 25 21 84.0 322 240 74.5 Native American 10 6 60.0 White, non-Hispanic 100 78 78.0 1,764 1,445 81.9
Gender Female 114 86 75.4 1,632 1,263 77.4 Male 99 80 80.8 1,487 1,260 84.7
Reason for Taking the CSET To obtain an initial MS/SS teaching credential 163 136 83.4 1,955 1,659 84.9 To obtain an initial Ed Special teaching credential 12 9 75.0 To add an authorization 32 18 56.3 943 709 75.2
College/University Training In California 136 106 77.9 1,923 1,549 80.6 Outside of California 58 48 82.8 904 771 85.3
Educational Level Fresh/Soph/Jr/Sr College 51 44 86.3 266 231 86.8 Bachelor’s degree + additional credits 118 87 73.7 1,833 1,467 80.0 Master’s degree or doctoral degree 32 28 87.5 844 702 83.2

PSC 3B- 50 January 2012
Appendix B21: CSET Science: Chemistry (Specialized) – Annual (2010-2011) and Cumulative Passing Rate, 2003-2011 Annual Passing Rate Cumulative Passing Rate
N Completed
N Passed
% Passed
N Completed
N Passed
% Passed
ALL EXAMINEES 114 87 76.3 1,015 885 87.2 Ethnicity
African American 4 38 28 73.7 Asian American 23 18 78.3 204 186 91.2 Hispanic American 15 7 46.7 103 78 75.7 Native American 2 4 White, non-Hispanic 57 49 86.0 541 479 88.5
Gender Female 64 45 70.3 524 440 84.0 Male 48 40 83.3 479 434 90.6
Reason for Taking the CSET To obtain an initial MS/SS teaching credential 41 35 85.4 470 415 88.3 To obtain an initial Ed Special teaching credential 1 11 11 100.0 To add an authorization 60 39 65.0 422 359 85.1
College/University Training In California 77 58 75.3 604 524 86.8 Outside of California 21 15 71.4 261 230 88.1
Educational Level Fresh/Soph/Jr/Sr College 15 13 86.7 66 60 90.9 Bachelor’s degree + additional credits 59 43 72.9 534 462 86.5 Master’s degree or doctoral degree 31 23 74.2 331 293 88.5 Appendix B22: CSET Science: Earth/Planetary Science – Annual (2010-11) and Cumulative Passing Rates, 2003-2011 Annual Passing Rate Cumulative Passing Rate
N Completed
N Passed
% Passed
N Completed
N Passed
% Passed
ALL EXAMINEES 138 91 65.9 2,766 2,166 78.3 Ethnicity
African American 2 53 27 50.9 Asian American 21 15 71.4 278 202 72.7 Hispanic American 13 5 38.5 261 175 67.0 Native American 1 31 26 83.9 White, non-Hispanic 84 58 69.0 1,891 1,532 81.0
Gender Female 69 40 58.0 1,283 936 73.0 Male 67 51 76.1 1,461 1,210 82.8
Reason for Taking the CSET To obtain an initial MS/SS teaching credential 67 46 68.7 1,340 1,065 79.5 To obtain an initial Ed Special teaching credential 18 13 72.2 To add an authorization 53 35 66.0 1,163 907 78.0
College/University Training In California 95 60 63.2 1,790 1,387 77.5 Outside of California 21 19 90.5 528 441 83.5
Educational Level Fresh/Soph/Jr/Sr College 17 11 64.7 99 81 81.8 Bachelor’s degree + additional credits 69 42 60.9 1,703 1,328 78.0 Master’s degree or doctoral degree 36 30 83.3 745 603 80.9

PSC 3B- 51 January 2012
Appendix B23: CSET Science: Earth/Planetary Science (Specialized) – Annual (2010-11) and Cumulative Passing Rates, 2003-2011 Annual Passing Rate Cumulative Passing Rate
N Completed
N Passed
% Passed
N Completed
N Passed
% Passed
ALL EXAMINEES 80 59 73.8 744 619 83.2 Ethnicity
African American 13 8 61.5 Asian American 10 6 60.0 63 42 66.7 Hispanic American 7 76 58 76.3 Native American 1 9 White, non-Hispanic 47 36 76.6 498 429 86.1
Gender Female 44 31 70.5 340 273 80.3 Male 34 27 79.4 393 337 85.8
Reason for Taking the CSET To obtain an initial MS/SS teaching credential 21 16 76.2 206 166 80.6 To obtain an initial Ed Special teaching credential 2 8 To add an authorization 46 35 76.1 452 385 85.2
College/University Training In California 49 39 79.6 481 406 84.4 Outside of California 11 7 63.6 129 103 79.8
Educational Level Fresh/Soph/Jr/Sr College 2 13 10 76.9 Bachelor’s degree + additional credits 40 30 75.0 423 355 83.9 Master’s degree or doctoral degree 31 24 77.4 236 199 84.3 Appendix B24: CSET Science: Physics – Annual (2010-11) & Cumulative Passing Rates, 2003-2011 Annual Passing Rate Cumulative Passing Rate
N Completed
N Passed
% Passed
N Completed
N Passed
% Passed
ALL EXAMINEES 142 84 59.2 1,827 1,210 66.2 Ethnicity
African American 1 39 24 61.5 Asian American 21 9 42.9 308 200 64.9 Hispanic American 14 7 50.0 149 72 48.3 Native American 11 5 45.5 White, non-Hispanic 79 54 68.4 1,094 755 69.0
Gender Female 37 16 43.2 550 300 54.5 Male 101 66 65.3 1,246 887 71.2
Reason for Taking the CSET To obtain an initial MS/SS teaching credential 105 65 61.9 1,074 783 72.9 To obtain an initial Ed Special teaching credential 1 8 To add an authorization 25 12 48.0 584 323 55.3
College/University Training In California 90 51 56.7 1,048 685 65.4 Outside of California 39 26 66.7 542 381 70.3
Educational Level Fresh/Soph/Jr/Sr College 26 17 65.4 118 86 72.9 Bachelor’s degree + additional credits 74 41 55.4 1,018 650 63.9 Master’s degree or doctoral degree 30 20 66.7 534 385 72.1

PSC 3B- 52 January 2012
Appendix B25: CSET Science: Physics (Specialized) – Annual (2010-11) and Cumulative Passing Rates, 2003-2011 Annual Passing Rate Cumulative Passing Rate
N Completed
N Passed
% Passed
N Completed
N Passed
% Passed
ALL EXAMINEES 99 66 66.7 654 511 78.1 Ethnicity
African American 1 9 Asian American 16 7 43.8 124 97 78.2 Hispanic American 11 6 54.5 60 40 66.7 Native American 1 4 White, non-Hispanic 52 41 78.8 373 299 80.2
Gender Female 32 19 59.4 190 129 67.9 Male 60 42 70.0 448 368 82.1
Reason for Taking the CSET To obtain an initial MS/SS teaching credential 47 32 68.1 274 228 83.2 To obtain an initial Ed Special teaching credential 9 To add an authorization 43 29 67.4 308 228 74.0
College/University Training In California 61 42 68.9 353 269 76.2 Outside of California 23 16 69.6 203 170 83.7
Educational Level Fresh/Soph/Jr/Sr College 11 9 81.8 33 28 84.8 Bachelor’s degree + additional credits 47 30 63.8 313 242 77.3 Master’s degree or doctoral degree 32 22 68.8 258 204 79.1 Appendix B26: CSET: Social Science – Annual (2010-11) & Cumulative Passing Rates, 2003-2011 Annual Passing Rate Cumulative Passing Rate
N Completed
N Passed
% Passed
N Completed
N Passed
% Passed
ALL EXAMINEES 1,531 968 63.2 17,323 13,755 79.4 Ethnicity
African American 44 21 47.7 761 493 64.8 Asian American 152 94 61.8 1,326 1,039 78.4 Hispanic American 223 125 56.1 2,691 1,964 73.0 Native American 7 126 91 72.2 White, non-Hispanic 838 535 63.8 10,329 8,452 81.8
Gender Female 686 366 53.4 7,264 5,381 74.1 Male 817 580 71.0 9,861 8,208 83.2
Reason for Taking the CSET To obtain an initial MS/SS teaching credential 1,103 699 63.4 13,343 10,658 79.9 To obtain an initial Ed Special teaching credential 21 15 71.4 188 149 79.3 To add an authorization 296 187 63.2 2,469 1,943 78.7
College/University Training In California 1,124 694 61.7 12,344 9,719 78.7 Outside of California 223 159 71.3 2,714 2,281 84.0
Educational Level Fresh/Soph/Jr/Sr College 266 175 65.8 1,788 1,361 76.1 Bachelor’s degree + additional credits 871 524 60.2 11,293 8,894 78.8 Master’s degree or doctoral degree 297 209 70.4 2,912 2,455 84.3

PSC 3B- 53 January 2012
Appendix C: TFE Passing Rate by Gender and Ethnicity, 2010-2011
Gender Ethnicity
Female Male African American
Asian American Hispanic Native
American Pacific
Islander White
TFE: Multiple Subjects
N Completed 83 20 5 7 13 0 1 52
N Passed 81 17 5 6 10 * * 51
% Passed 97.59 85.00 100.00 85.71 76.92 * * 98.08
TFE: English
N Completed 20 8 4 0 3 0 0 13
N Passed 20 7 * * * * * 13
% Passed 100.00 87.50 * * * * * 100.00
TFE: Mathematics
N Completed 31 21 1 4 4 0 1 24
N Passed 30 19 * * * * * 22
% Passed 96.77 90.48 * * * * * 91.67
TFE: Science
N Completed 39 25 3 7 4 1 1 35
N Passed 36 20 * 4 * * * 32
% Passed 92.31 80.00 * 57.14 * * * 91.43
Note: Pass rates are not calculated for exams with fewer than five candidates.

PSC 3B- 54 January 2012
Appendix D1: RICA Preparation and Demographic Data, 2006 – 2011
RICA (2006 - 2011)
Written Exam (WE)
Video Performance Assessment
(VPA)
WE and VPA combined
N % N % N % ALL EXAMINEES 51,382 100.0 248 100.0 51,453 100.0
Educational Level High School diploma 1,953 3.8 5 2.0 1,956 3.8 Associate of Arts degree 1,116 2.2 3 1.2 1,118 2.2 Bachelor’s degree 7,802 15.2 15 6.0 7,804 15.2 Bachelor’s degree + additional credits 34,048 66.3 155 62.5 34,094 66.3 Master’s degree 1,824 3.5 13 5.2 1,823 3.5 Master’s degree + additional credits 2,060 4.0 30 12.1 2,074 4.0 Doctoral degree 189 0.4 2 0.8 191 0.4 Did not respond 2,390 4.7 25 10.1 2,393 4.7
College Grade Point Average 3.50 to 4.00 21,143 41.1 72 29.0 21,171 41.1 3.00 to 3.49 20,746 40.4 95 38.3 20,772 40.4 2.50 to 2.99 6,098 11.9 50 20.2 6,112 11.9 2.00 to 2.49 668 1.3 4 1.6 666 1.3 Below 2.00 17 0.0 1 0.4 18 0.0 Did not attend college 5 0.0 0 0.0 5 0.0 Did not respond 2,705 5.3 26 10.5 2,709 5.3
Reason for Taking RICA Multiple Subject Teaching Credential 36,148 70.4 151 60.9 36,214 70.4 Education Specialist Instruction Credential 8,013 15.6 69 27.8 8,029 15.6 No Response 7,221 14.1 28 11.3 7,210 14.0
Professional Preparation Not begun Professional Preparation 3,140 6.1 15 6.0 3,145 6.1 College/University Internship Program:
First year in Program 6,620 12.9 14 5.6 6,626 12.9 Second year in Program 4,829 9.4 17 6.9 4,833 9.4 Completed Program 3,891 7.6 59 23.8 3,918 7.6
District Internship Program: First year in Program 1,593 3.1 4 1.6 1,592 3.1 Second year in Program 1,685 3.3 24 9.7 1,686 3.3 Completed Program 925 1.8 16 6.5 931 1.8
Non-intern College/University Program: Not begun student teaching 4,875 9.5 7 2.8 4,874 9.5 Begun student teaching 12,917 25.1 22 8.9 12,921 25.1 Completed student teaching 3,620 7.0 22 8.9 3,629 7.1 Completed Program 2,745 5.3 18 7.3 2,755 5.4
Did not respond 4,542 8.8 30 12.1 4,543 8.8 Preparation for Reading Instruction
No preparation 3,787 7.4 25 10.1 3,791 7.4 Completed IHE course in Methods of Reading Instruction 36,525 71.1 118 47.6 36,561 71.1
Completed District Internship course 4,029 7.8 37 14.9 4,042 7.9 Observed Reading instruction in a K-12 school 15,789 30.7 60 24.2 15,807 30.7 Worked with individual students in K-12 school to improve their Reading skills 13,349 26.0 49 19.8 13,367 26.0
Had daily responsibility for classroom Reading instruction as student teacher or intern 16,113 31.4 79 31.9 16,156 31.4

PSC 3B- 55 January 2012
RICA (2006 - 2011)
Written Exam (WE)
Video Performance Assessment
(VPA)
WE and VPA combined
N % N % N % Student Teaching Assignments
None 12,738 24.8 52 21.0 12,755 24.8 One 15,239 29.7 55 22.2 15,255 29.6 Two 11,490 22.4 76 30.6 11,524 22.4 Three 2,670 5.2 17 6.9 2,676 5.2 Four or more 2,225 4.3 20 8.1 2,237 4.3 Did not respond 7,020 13.7 28 11.3 7,006 13.6
Grade Level Teaching Experience None 6,617 12.9 11 4.4 6,611 12.8 Pre K-2 30,242 58.9 135 54.4 30,304 58.9 Grades 3-5 26,067 50.7 119 48.0 26,122 50.8 Grades 6-8 10,905 21.2 75 30.2 10,942 21.3 Grades 9-12 4,705 9.2 59 23.8 4,722 9.2
Best Language of Communication English 47,805 93.0 210 84.7 47,862 93.0 Spanish 923 1.8 9 3.6 930 1.8 Vietnamese 54 0.1 1 0.4 55 0.1 Cantonese 23 0.0 0 0.0 23 0.0 Hmong 40 0.1 0 0.0 40 0.1 Other 357 0.7 1 0.4 357 0.7 Did not respond 2,180 4.2 27 10.9 2,186 4.2
First Language of Communication English only 36,380 70.8 178 71.8 36,435 70.8 English and one or more other languages 7,905 15.4 22 8.9 7,910 15.4 One or more languages other than English 4,820 9.4 22 8.9 4,829 9.4 Did not respond 2,277 4.4 26 10.5 2,279 4.4
Gender Male 7,884 15.3 90 36.3 7,900 15.4 Female 42,813 83.3 157 63.3 42,868 83.3 Did not respond 685 1.3 1 0.4 685 1.3
Ethnicity African American/Black 1,707 3.3 10 4.0 1,707 3.3 Asian American/Asian 2,527 4.9 5 2.0 2,527 4.9 Filipino 1,004 2.0 1 0.4 1,004 2.0 Southeast Asian American 586 1.1 3 1.2 586 1.1 Pacific Island American 173 0.3 1 0.4 173 0.3 Mexican American or Chicano 7,362 14.3 30 12.1 7,363 14.3 Latino, Latin American, Puerto Rican, Hispanic 2,865 5.6 10 4.0 2,866 5.6 Native American, American Indian 279 0.5 1 0.4 279 0.5 White, non-Hispanic 27,022 52.6 85 34.3 27,026 52.5 Other 2,704 5.3 10 4.0 2,705 5.3 Did not respond 5,153 10.0 92 37.1 5,217 10.1

PSC 3B- 56 January 2012
Appendix D2: RICA (Written & VPA combined) First-time and Cumulative Passing Rates, 2006 - 2011
RICA (2006 - 2011)
First-Time Passing Rate Cumulative Passing Rate N
Completed N
Passed %
Passed N
Completed N
Passed %
Passed ALL EXAMINEES 51,453 40,119 78.0 51,453 47,883 93.1
Educational Level High School diploma 2,105 1,671 79.4 1,956 1,860 95.1 Associate of Arts degree 1,247 879 70.5 1,118 1,018 91.1 Bachelor’s degree 8,150 6,178 75.8 7,804 7,269 93.1 Bachelor’s degree + additional credits 34,066 27,047 79.4 34,094 31,969 93.8 Master’s degree 1,646 1,199 72.8 1,823 1,601 87.8 Master’s degree + additional credits 2,031 1,601 78.8 2,074 1,884 90.8 Doctoral degree 188 166 88.3 191 178 93.2 Did not respond 2,020 1,378 68.2 2,393 2,104 87.9
College Grade Point Average 3.50 to 4.00 20,990 17,771 84.7 21,171 20,173 95.3 3.00 to 3.49 20,912 15,917 76.1 20,772 19,220 92.5 2.50 to 2.99 6,467 4,340 67.1 6,112 5,500 90.0 2.00 to 2.49 693 426 61.5 666 578 86.8 Below 2.00 14 10 71.4 18 13 72.2 Did not attend college 7 5 Did not respond 2,370 1,651 69.7 2,709 2,395 88.4
Reason for Taking RICA Multiple Subject Teaching Credential 36,577 29,236 79.9 36,214 34,117 94.2 Education Specialist Instruction Credential 8,062 5,926 73.5 8,029 7,286 90.7 No Response 6,814 4,957 72.7 7,210 6,480 89.9
Professional Preparation Not begun Professional Preparation 3,353 2,129 63.5 3,145 2,688 85.5 College/University Internship Program:
First year in Program 7,220 5,830 80.7 6,626 6,364 96.0 Second year in Program 4,985 3,940 79.0 4,833 4,572 94.6 Completed Program 3,236 2,412 74.5 3,918 3,482 88.9
District Internship Program: First year in Program 1,753 1,331 75.9 1,592 1,511 94.9 Second year in Program 1,690 1,263 74.7 1,686 1,589 94.2 Completed Program 707 522 73.8 931 816 87.6
Non-intern College/University Program: Not begun student teaching 5,444 4,338 79.7 4,874 4,563 93.6 Begun student teaching 13,846 11,536 83.3 12,921 12,600 97.5 Completed student teaching 2,905 2,214 76.2 3,629 3,248 89.5 Completed Program 2,206 1,646 74.6 2,755 2,395 86.9
Did not respond 4,108 2,958 72.0 4,543 4,055 89.3 Preparation for Reading Instruction
No preparation 3,838 2,588 67.4 3,791 3,358 88.6 Completed IHE course in Methods of Reading Instruction 36,963 29,749 80.5 36,561 34,457 94.2
Completed District Internship course 4,097 3,143 76.7 4,042 3,788 93.7 Observed Reading instruction in a K-12 school 16,426 13,273 80.8 15,807 14,936 94.5 Worked with individual students in K-12 school to improve their Reading skills 13,933 11,252 80.8 13,367 12,640 94.6
Had daily responsibility for classroom Reading instruction as student teacher or intern 16,244 13,429 82.7 16,156 15,361 95.1

PSC 3B- 57 January 2012
RICA (2006 - 2011)
First-Time Passing Rate Cumulative Passing Rate N
Completed N
Passed %
Passed N
Completed N
Passed %
Passed Student Teaching Assignments
None 14,123 10,691 75.7 12,755 11,829 92.7 One 15,658 12,684 81.0 15,255 14,576 95.5 Two 10,310 8,184 79.4 11,524 10,679 92.7 Three 2,591 2,042 78.8 2,676 2,470 92.3 Four or more 2,318 1,729 74.6 2,237 2,054 91.8 Did not respond 6,453 4,789 74.2 7,006 6,275 89.6
Grade Level Teaching Experience None 7,285 5,396 74.1 6,611 6,013 91.0 Pre K-2 30,109 24,034 79.8 30,304 28,494 94.0 Grades 3-5 25,593 20,557 80.3 26,122 24,572 94.1 Grades 6-8 10,870 8,477 78.0 10,942 10,125 92.5 Grades 9-12 4,706 3,359 71.4 4,722 4,238 89.8
Best Language of Communication English 48,218 38,089 79.0 47,862 44,757 93.5 Spanish 932 474 50.9 930 785 84.4 Vietnamese 56 38 67.9 55 45 81.8 Cantonese 21 14 66.7 23 22 95.7 Hmong 36 16 44.4 40 34 85.0 Other 348 220 63.2 357 315 88.2 Did not respond 1,842 1,268 68.8 2,186 1,925 88.1
First Language of Communication English only 36,435 29,995 82.3 36,435 34,451 94.6 English and one or more other languages 7,910 5,610 70.9 7,910 7,126 90.1 One or more languages other than English 4,829 3,184 65.9 4,829 4,290 88.8 Did not respond 2,279 1,330 58.4 2,279 2,016 88.5
Gender Male 7,900 5,149 65.2 7,900 6,936 87.8 Female 42,868 34,406 80.3 42,868 40,321 94.1 Did not respond 685 564 82.3 685 626 91.4
Ethnicity African American/Black 1,707 1,072 62.8 1,707 1,442 84.5 Asian American/Asian 2,527 2,061 81.6 2,527 2,413 95.5 Filipino 1,004 763 76.0 1,004 929 92.5 Southeast Asian American 586 422 72.0 586 529 90.3 Pacific Island American 173 131 75.7 173 159 91.9 Mexican American or Chicano 7,363 4,888 66.4 7,363 6,567 89.2 Latino, Latin American, Puerto Rican, Hispanic 2,866 1,879 65.6 2,866 2,570 89.7 Native American, American Indian 279 210 75.3 279 248 88.9 White, non-Hispanic 27,026 22,758 84.2 27,026 25,835 95.6 Other 2,705 2,112 78.1 2,705 2,520 93.2 Did not respond 5,217 3,823 73.3 5,217 4,671 89.5

PSC 3B- 58 January 2012
Appendix E: SLLA Annual Passing Rate by Gender and Ethnicity, 2006-2011
Gender Ethnicity
Female Male African American
Asian American Hispanic Native
American Pacific
Islander White
2006-2011
N Completed 4310 1998 450 253 953 60 46 3955
N Passed 3847 1533 322 219 744 53 42 3517
% Passed 89.26 76.73 71.56 86.56 78.07 88.33 91.30 88.93
2006-07
N Completed 836 398 99 34 176 13 8 808
N Passed 687 282 63 25 120 10 7 681
% Passed 82.18 70.85 63.64 73.53 68.18 76.92 87.5 84.28
2007-08
N Completed 927 452 103 54 187 18 10 826
N Passed 770 300 61 47 122 14 10 684
% Passed 83.06 66.37 59.22 87.04 65.24 77.78 100.00 82.81
2008-09
N Completed 813 416 95 36 189 16 5 755
N Passed 693 305 58 27 148 14 5 633
% Passed 85.24 73.32 61.05 75.00 78.31 87.50 100.00 83.84
2009-10
N Completed 923 413 94 62 216 7 13 840
N Passed 818 306 66 53 162 7 13 737
% Passed 88.62 74.09 70.21 85.48 75.00 100.00 100.00 87.74
2010-11
N Completed 1021 471 121 77 266 10 10 896
N Passed 881 340 74 67 193 8 7 783
% Passed 86.29 72.19 61.16 87.01 72.56 80.00 70.00 87.39
Note: Pass rates are not calculated for exams with fewer than five candidates.