report on prioritiza tion of microw …slusi.dacnet.nic.in/rrs/rrsabstracts/rrs_1443.pdf · 11....
TRANSCRIPT
REPORT ON PRIORITIZA TION OF MICROW ATERSHEDS OF 2C3B(LOWER SIND) SUB CATCHMENT OF SIND KUNWARICATCHMENT (RVP) OF YAMUNA BASIN, DISTRICT BHIND,DATIA, GWALIOR AND MORENA OF MADHYA PRADESH ANDDISTRICT ETAWAH AND JALAUN OF UTTAR PRADESH STATE.
ABSTRACT
1. Surveyed Area 2C3B (Lower Sind) Sub Catchment of SindKunwari Catchment of Yamuna Basin, DistrictBhind, Datia, Gwalior and Morena of MadhyaPradesh State and District Etawah and Jalaun ofUttar Pradesh State.
2.· Location a) Latitudeb) Longitude
25° 46' OS" to 26° 3' 06" N.78° 04' IQ" to 79° 14' 07" E.
3. Total Area 4,69,693 ha.
4. Agroclimatic Region BundelKhand zone of Central Plateau & HillRegion (viii) as per planning Commission(Khanna - 1989).
5. Type of Survey Rapid Reconnaissance Survey forPrioritization of Microwatersheds for soilconservation work.
6. Period o~ Survey
Base Material used
November, 2005 to April, 2006
Survey ofIndia Topographical maps of1:50,000 scale.
7.
8. HydrologicalSub division
a) Region - '2' Ganges River System flowingin the Bay of Bengal.
b) Basin - '2C' Yamuna River Basin
c) Catchment- '2C3' Sind Kunwari.
d) Sub-Catchment - '2C3B' Lower Sind
e) Watersheds -'2C3B 1 to B6
f) Subwatersheds - 95
g) Microwatersheds - 670
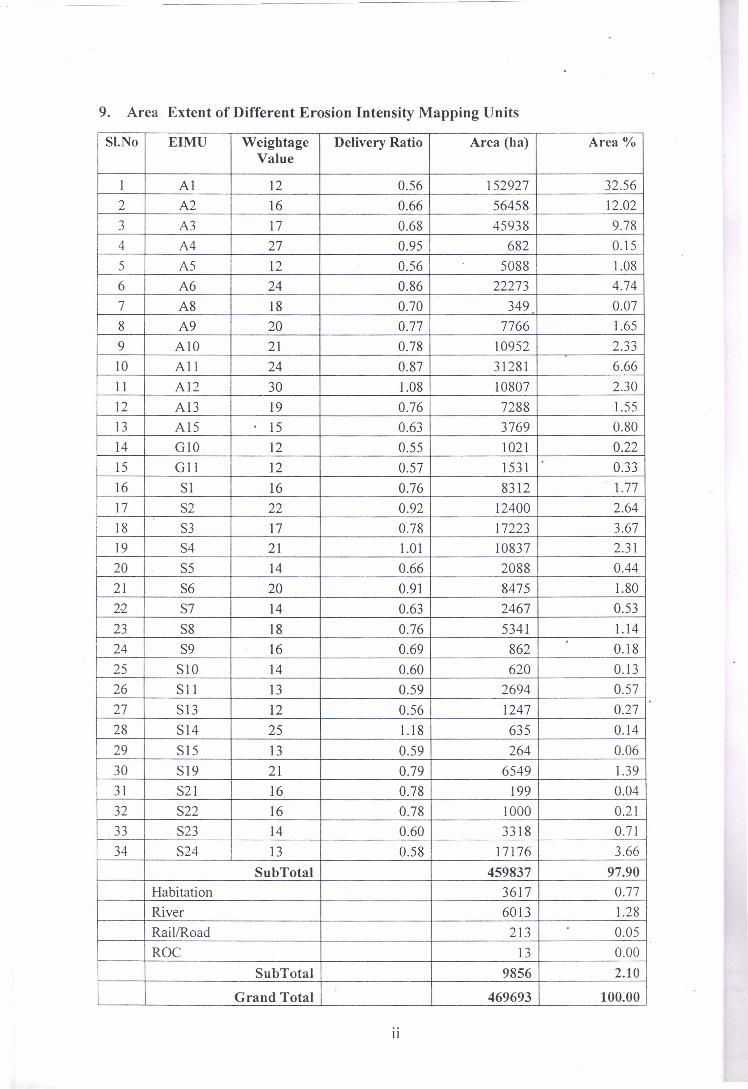
9. Area Extent of Different Erosion Intensity Mapping Units
SI.No EIMU Weightage Delivery Ratio Area (ha) Area %Value
I Al 12 0.56 152927 32.562 A2 16 0.66 56458 12.023 A3 17 0.68 45938 9.784 A4 27 0.95 682 0.155 A5 12 0.56 5088 1.086 A6 24 0.86 22273 4.747 A8 18 0.70 349 0.078 A9 20 0.77 7766 1.659 AI0 21 0.78 10952 2.33
10 All 24 0.87 31281 6.6611 AI2 30 1.08 10807 2.3012 A13 19 0.76 7288 1.5513 A15 15 0.63 3769 0.8014 GlO 12 0.55 1021 0.2215 Gl1 12 0.57 1531 0.3316 SI 16 0.76 8312 1.7717 S2 22 0.92 12400 2.6418 S3 17 0.78 17223 3.6719 S4 21 1.01 10837 2.3120 S5 14 0.66 2088 0.4421 S6 20 0.91 8475 1.802,2 S7 14 0.63 2467 0.5323 S8 18 0.76 5341 1.1424 S9 16 0.69 862 0.1825 S10 14 0.60 620 0.1326 SII 13 0.59 2694 0.5727 S13 12 0.56 1247 0.2728 S14 25 1.18 635 0.1429 S15 13 0.59 264 0.0630 S19 21 0.79 6549 1.3931 S21 16 0.78 199 0.0432 S22 16 0.78 1000 0.2133 S23 14 0.60 3318 0.7134 S24 13 0.58 17176 3.66
SubTotal 459837 97.90Habitation 3617 0.77River 6013 1.28RaillRoad 213 0.05ROC 13 0.00
SubTotal 9856 2.10Grand Total 469693 100:00
II

10. Watershedwise Distribution of Area under Different Erosion Intensity MappingUnits. (in ha)
SI. Area AreaNo EIMU 2C3B1 2C3B2 2C3B3 2C3B4 2C3B5 2C3B6 (ha) (%)
I AI 4362 39092 35262 37273 7571 29367 152927 32.562 A2 8716 8784 15953 11786 11219 56458 12.023 A3 3580 16719 6884 8 8199 10548 45938 9.784 A4 35 562 85 682 0.155 A5 2042 1809 753 484 5088 1.086 A6 1924 11999 6693 423 1088 146 22273 4.747 A8 349 349 0.078 A9 3254 1023 84 1364 2041 7766 1.659 AIO 1903 1934 2584 62 4469 10952 2.33
100 AI I 10129 4019 43 4018 13072 31281 6.66II AI2 1879 2965 3475.00 2488 10807 2.3012 AI3 150 3786 3352 7288 1.5513 A15 1163 1419 312 875 3769 0.8014 GI0 1021 1021 0.2215 Gl1 1531 1531 0.3316 SI 1548 540 6224 8312 1.7717 S2 7096 1634 19 3651 12400 2.6418 S3 1426 12500 ·3297 17223 3.6719 S4 1822 490 7905 620 10837 2.3120 S5 254 1382 452 2088 0.4421 S6 348 1083 1215 3992 78 1759 8475 1.8022 S7 1728 739 2467 0.5323 S8 2793 1862 686 5341 1.1424 S9 843 19 862 0.18
·25 S10 620 620 0.1326 SI I 135 1245 1314 2694 0.5727 S13 286 898 63 1247 0.2728 S14 600 35 635 0.1429 S15 264 264 0.0630 SI9 149 6358 42 6549 1.3931 S21 102 97 199 0.0432 S22 1000 1000 0.2133 S23 3318 3318 0.7134 S24 161 17002 13 17176 3.66SubTotal 37547 107349 68862 104610 43678 97791 459837 97.90Habitation 3409 99 109 3617 0.77River 1146 192 2339 2336 6013 1.28Rail/Road 32 181 213 0.05ROC 13 13 0.00Sub Total 1178 - 192 3422 2438 2626 9856 2.10Grand Total 38725 107349 69054 108032 46116 100417 469693 100.00
HI

11. Districtwise Distribution of Area under Different Erosion Intensity MappingUnits. (in ha)
SI. Total AreaNo EIMU Bhind Datia Etawa Gwalior Jalaun Morena Area (%)
1 Al 89053 7191 50252 6431 152927 32.562 A2 34335 9854 11159 938 172 56458 12.023 A3 31874 4533 9531 45938 9.784 A4 137 85 460 682 0.155 A5 3615 484 989 5088 1.086 A6 19926 905 1213 229 22273 4.747 A8 308 41 349 0.078 A9 6906 559 301 7766 1.659 AlO 3759 37 6671 485 10952 2.33
10 All 17101 2137 528 10594 846 75 31281 6.6611 A12 9209 1598 10807 2.3012 A13 416 3646 3076 150 7288 1.5513 A15 1409 325 2035 3769 0.8014 GI0 1021 1021 0.2215 G 11 1531 1531 0.3316 SI 155 5161 2922 74 8312 1.7717 S2 581 1456 10363 12400 2.6418 S3 278 565 14404 1976 17223 3.6719 S4 605 475 9757 10837 2.3120 S5 2088 2088 0.4421 S6 2312 635 4164 30 1334 8475 1.8022 S7 2467 2467 0.5323 S8 758 1375 3208 5341 1.1424 S9 862 862 0.1825 S10 620 620 0.1326 Sll 581 1314 799 2694 0.5727 S13 1163 84 1247 0.27·28 S14 259 376 635 0.1429 S15 195 69 264 0.0630 S19 392 6102 55 6549 1.3931 S21 199 199 0.04
- - ---
32 S22 1000 1000 0.2133 S23 3318 3318 0.7134 S24 17176 17176 3.66
SubTotal 224164 42051 853 179589 2494 10686 459837 97.90Habitation 21 815 2196 342 243 3617 0.77River 1669 3426 736 182 6013 1.28RaillRoad 32 181 213 0.05ROC 13 13 0.00SubTotal 1735 4241 3113 524 243 9856 2.10Grand Total 225899 46292 853 182702 3018 10929 469693 100.00
IV

12. Statewise Distribution of Area under Different Erosion Intensity MappingUnits
SI.No EIMU Madhya Uttar Total Area AreaPradesh Pradesh (ha) (%)
1 A1 152927 0 152927 32.562 A2 55520 938 56458 12.023 A3 45938 0 45938 9.784 A4 682 0 682 0.155 A5 5088 - 0 5088 1.086 A6 22044 229 22273 4.747 A8 349 0 349 0.078 A9 7465 301 7766 1.659 A10 10952 0 10952 2.33
10 All 29907 1374 31281 6.6611 A12 10807 0 10807 2.3012 A13 7138 150 7288 1.5513 A15 3444 325 3769 0.8014 GI0 1021 0 1021 0.2215 Gll 1531 0 1531 0.3316 SI 8312 0 8312 1.7717 S2 12400 0 12400 2.6418 S3 17223 0 17223 3.6719 S4 10837 0 10837 2.3120 S5 2088 0 2088 0.4421 S6 8445 30 8475 1.8022 S7 2467 0 2467 0.5323 S8 5341 0 5341 1.1424 S9 862 0 .862 0.1825 SlO 620 0.00 620 0.1326 S 11 2694 0 2694 0.5727 S13 1247 0 1247 0.2728 S14 635 0 635 0.1429 S15 264 0 264 0.0630 S19 6549 0 6549 1.3931 S21 199 ' 0 199 0.0432 S22 1000 0 1000 0.2133 S23 3318 0.00 3318 0.7134 S24 17176 0 17176 3.66
SubTotal 456490 3347 459837 97.90HA 3275 342 3617 0.77Ri 5831 182 6013 1.28RaillRoad 213 0 213 0.05
ROC 13 0 13 0.00SubTotal . 9332 524 9856 2.10
Grand Total 465822 3871 469693 100v

13. Priority Categorization
SI. Priority Category No. of Area (in ha) Area 0/0
No. Microwatersheds
1 Very high (1300 and above) 233 158333 33.71
2 High (1200 - 1299) 79 55633 11.85
3 Medium (1100 - 1199) 75 51488 10.96
-4 Low (1000 - 1099) 73 51215 10.90
5 Very Low (Below - 1000) 210 153024 32.58
Grand Total 670 469693 100.00
VI

14. Watershedwise Distribution of Area under Different Priority Categories.
Priority Category 2C3Bl 2C3B2 2C3B3 2C3B4 2C3B5 2C3B6 Grand Area& Range No. of Area No. of Area No. of Area No. of Area No. of Area No. of Area Total (%)
Mlw (ha) Mlw (ha) Mlw (ha) Mlw (ha) M/w (ha) Mlw (ha)Very high 40 25334 61 43080 9 6388 30 19702 31 20836 62 42993 158333 33.71(1300 and above)
High 2 1036 20 . 15307 10 6616 19 12821 6 4300 22 15553 55633 11.84(1200-1299)
Medium 3 1811 II 8478 15 9719 19 12674 14 10160 13 8646 51488 10.96(1100 - 1199)
Low 7 4548 13 8754 15 11009 18 12618 5 3645 15 10641 51215 10.90(1000 - 1099)
Very low 9 5996 41 31730 51 35322 66 50217 10 7175 33 22584 153024 32.58(below 1000)
Total 61 38725 146 107349 100 69054 152 108032 66 46116 145 100417 469693 100.00.
vii

15. Districtwise Distribution of Area under Different Priority Categories.
Priority Bhind Datia Etawa Gwalior Jalaun Morena Grand AreaCategory & No. of Area No. of Area No. of Area No. of Area No. of Area No. of Area Total (%)Range Full Part (ha) Full Part (ha) Full Part (ha) Full Part (ha) Full Part (ha) Full Part (ha)Very high 109 23 77040 21 16 20801 9 2 579 75 11 54790 3 4 2747 2 1 2376 158333 33.71(1300 and above)
High 33 5 25042 4 3 4152 0 36 6 26439 0 55633 11.84(1200 - 1299)
Medium 29 5 19082 12 4 10800 1 210 28 1 20075 2 1 1321 51488 10.96(1100-1199)
Low 32 2 22999 3 2 3267 0 31 1 23663 1 271 1 1015 51215 10.90(1000 - 1099)
Very low 101 22 81736 7 5 7272 1 64 75 16 57735 3 8 6217 153024 32.58(below 1000)
Total 304 57 225899 47 30 46292 9 4 853 245 35 182702 3 5 3018 8 10929 469693 100.00
viii

15. Statewise Distribution of Priority Area
PriorityCategory & Madhya Pradesh Uttar Pradesh Grand Total Area (%)Range
Very high 155007 3326 15833 33.71(1300 and above)
High 55633 55633 11.84(1200-1299) -
Medium 51278 210 51488 10.96(1100-1199)
Low 50944 271 512.15 10.90(1000 - 1099)
Very low152960 64 153024 32.58(below 1000)
Total 465822 3871 469693 100.00
IX

16 Salient Features of the Area:
----------
~ The survey area consist of 670 microwatersheds spreading over 4,69,693 ha, out ofwhich 233 (33.71 % area) fall under very high priority category cover 1,58,333 ha and79 microwatersheds (1 1.84 % area) identified under high priority covering 55,633 ha.
~ 312 microwatersheds out of 670 microwatersheds constituting 2,13,966 ha (45.55%)are placed under very high and high category need immediate attention for suitablesoil and water conservation measures for sustainable - of the area.
~ 2C3B6 watershed has the maximum number of very high and high priority categoryMicrowatersheds followed by 2C3B2 and 2C3B4 watersheds
~ Bhind district of Madhya Pradesh state covering 77040 ha of the area which is 16.5%of total area covers much area under very high category comparing to other districts ofthe survey area.
~ Moderate to severely eroded (7.48%), severely eroded (22.48%), severely to veryseverely eroded (0.15%) and very severely eroded (3.85%) lands combining toconstitute 33.96% of the survey area.
~ Nearly 34.33% of the area is unmanaged and 14.23% of the surveyed area is underPoorly to moderately managed.
x