report on public finances in emu 2015 - ec.europa.eu
TRANSCRIPT

Report on Public Finances in EMU
Economic and Financial Affairs
ISSN 2443-8014 (online)
2015
INSTITUTIONAL PAPER 014 | DECEMBER 2015
EUROPEAN ECONOMY
European Economy Institutional Papers are important reports and communications from the European Commission to the Council of the European Union and the European Parliament on the economy and economic developments
LEGAL NOTICE Neither the European Commission nor any person acting on its behalf may be held responsible for the use which may be made of the information contained in this publication or for any errors which despite careful preparation and checking may appear This paper exists in English only and can be downloaded from httpeceuropaeueconomy_financepublications
Europe Direct is a service to help you find answers to your questions about the European Union
Freephone number ()
00 800 6 7 8 9 10 11 () The information given is free as are most calls (though some operators phone boxes or hotels may charge you)
More information on the European Union is available on httpeuropaeu Luxembourg Publications Office of the European Union 2015
KC-BC-15-014-EN-N (online) KC-BC-15-014-EN-C (print) ISBN 978-92-79-48624-1 (online) ISBN 978-92-79-48623-4 (print) doi102765455670 (online) doi102765979849 (print)
copy European Union 2015 Reproduction is authorised provided the source is acknowledged
European Commission Directorate-General for Economic and Financial Affairs
Report on Public Finances in EMU 2015
EUROPEAN ECONOMY Institutional Paper 014
ACKNOWLEDGEMENTS
ii
This report was prepared in the Directorate-General for Economic and Financial Affairs under the
direction of Marco Buti Director-General Servaas Deroose Deputy Director-General Lucio Pench
Director for Fiscal Policy and Gilles Mourre Head of Unit for Fiscal Policy and Surveillance
M Salto was the editor of the report Contributors were Gerrit Bethuyne (Chapter II3) Joao Capella
Ramos (Chapter I2) Julia Lendvai (Part IV) Anton Mangov (Part III) Eloise Orseau (Chapters I1 II2
and II4) Lucia Rodriguez-Munoz (Chapter III2) Ralph Schmitt-Nilson (Chapter III2) Ingrid Toming
(Chapter II5) Adrien Zakhartchouk (Chapter III2 and Part IV)
Information on the sensitivity of budgetary items to inflation for individual Member States and useful
comments were provided by Frode Aasen Emiel Afman Wojciech Balcerowicz Barbara Bernardi
Stefan Bohner Ivan Csaba Marek Dobrovolnik Raffaele Fargnoli Luis Garcia Lombardero Maria
Gerhardt Michael Grams Oskar Grevesmuhl Valeska Gronert Zoltan Gyenes Renata Hruzova Robert
Kraemer Juho Kostiainen Jessica Larsson Dimitri Lorenzani Mart Maivali Janis Malzubris Dan Matei
Fabrizio Melcarne Olivia Mollen Marie Mulvihill Christos Paschalides Nicolas Philiponnet Dominik
Pripuzic Vito Ernesto Reitano Giedrius Sidlauskas Peeter Soidla Vladimir Solanic Henk van Noten
Alessandra Cepparulo was responsible for statistical support layout and IT support
The report benefitted from comments and suggestions by Johannes Bahrke Nicolas Carnot Stefan
Ciobanu Servaas Deroose Jean-Paul Keppenne Jakub Koniecki Gilles Mourre Lucio Pench and
Alexander Schwan
Editing and communication support was provided by Johannes Bahrke Nicolas Carpentiers Sarka
Novotna Leila Fernandez Stembridge Peter Koh Iciar Rodriguez-Miranda and the DGT team co-
ordinated by Nika Truhacev
Comments on the report would be gratefully received and should be sent by mail or e-mail to the editor
Matteo Salto
European Commission
Directorate-General for Economic and Financial Affairs
Directorate Fiscal Policy
Unit Fiscal Policy and Surveillance
Office CHAR 12103
Rue de la Loi 170
B-1000 Brussels
e-mail matteosaltoeceuropaeu
CONTENTS
iii
Communication from the Commission 1
Part I Current developments and prospects 6 1 Current developments and prospects 6
11 Economic developments and perspective on consolidation 6 12 Assessment of short-term fiscal developments 7 13 Developments in debt 13 14 Composition of the adjustment 14
2 Implementation of fiscal surveillance 17 21 The Excessive Deficit Procedure 17 22 The European semester and the fiscal Country -Specific Recommendations 20 23 Closing the fiscal surveillance cycle in the euro area Draft Budgetary Plans 21
A1 Assumptions underlying the assessment of fiscal stance 26 A11 Calculation of the indicative structural primary effort implied by sustainability
needs 26 A12 Calculation of the indicative structural primary effort implied by stabilisation
needs 26 A13 An alternative target for stabilisation needs 27
A2 Overview of EDP steps and Country-Specific fiscal Recommendations 29
Part II Recent development in fiscal surveillance 35 1 Introduction 36 2 The functioning of the preventive arm of the SGP an overview
after the Communication on flexibility 38 21 The legal basis for the preventive arm 40 22 The Medium-term budgetary objective (MTO) and the adjustment path
towards it 41 23 Assessment of compliance under the preventive arm 44
3 One-offs measure ndashclassification principles used in fiscal surveillance 52 31 Introduction 52 32 Guiding principles for the classification of one-off measures 52 33 An indicative list of lsquotypicalrsquo one-off measures with justifications for the
classification of each 56 34 Standard cases not to be considered one-offs 62
4 The communication on making the best use of flexibility within the Stability and Growth Pact 66 41 Taking into account structural reforms in the preventive arm the structural
reform clause 67 42 Taking investment into account in the preventive arm the investment clause 72 43 The Ecofin Council of 8 December 2015 74 44 Consequences of the guidance given in the Commission communication on
flexibility within the SGP for the corrective arm 74 5 Fiscal risks and contingent liabilities 76
51 Fiscal risk and the role of contingent liabilities 76
iv
52 New data requirements supporting fiscal surveillance in the eu 78 53 New dataset on contingent liabilities in Eurostats database 78 54 Conclusion 86
Part III Negative inflation surprises how much of a bad thing 89 1 Introduction 90 2 Country-by-country analysis of the reaction of budget to the
inflation surprise of 2014 92 21 Inflation elasticities in 2014 and 2015 according to Commission staff 93 22 Results on inflation sensitivity 96 23 Impact of inflation on interest expenditure 104
3 Impact of an inflation shock on fiscal effort under the SGP 111 31 The preventive arm 112 32 The corrective arm 113 33 The debt rule 115 34 Conclusion and implications for fiscal surveillance 116
A1 Survey 117 A2 Main country-specific features characterizing the impact of inflation on the budget
balance 118 A3 Impact of an inflation shock on interest expenditure 121 A4 Analytical decomposition of the impact of an inflation shock on fiscal effort
indicators 123 A41 Preventive arm of the SGP 123 A42 Corrective arm of the SGP 124 A43 The debt rule 127
Part IV The EUs stylized fiscal reaction function 129 1 The EUs stylized fiscal reaction function 130
11 Introduction 130 12 EDP episodes an overview 132 13 The determinants of the average effort 134 14 The determinants of the deadline 139 15 Conclusions 142
A1 Sample data and robustness checks 144 A11 List of EDP recommendations used in the analysis 144 A12 Description of the EDP sample 144 A13 Models of effort Tobit Model 146 A14 Multinominal Logit regression 147 A15 Test of the proportional odds assumptions and alternative estimations 148 A16 Rubustness checks 149
Part V Resources 151 1 Abbreviations and symbols used 152 2 Glossary 156 3 References 162 4 Useful Internet Links 165
v
LIST OF TABLES I11 Budget balance in EU Member States ( of GDP) 8 I12 Euro area-general government budget balance ( of GDP) 8 I13 Composition of changes in the government debt ratio in EU Member States ( of
GDP) 13 I14 Government revenue and expenditure( of GDP) 15 I21a Overview of individual Commission Opinions on the DBPs ndash Member States currently
under the preventive arm of the SGP 24 I21b Overview of individual Commission opinions on the DBPs ndash Member States currently
under the corrective arm of the SGP 25 IA11 Total fiscal adjustment needed in 2016-2020 according to the S1 indicator ( as of
GDP) 26 IA12 Change in the SPB implied by stabilisation and sustainability needs and in the
Commission forecast (as of GDP) 27 IA13 Change in the SPB implied by an alternative computation of stabilisation needs
(as of GDP) 28 IA21 Overview EDP steps ndash Euro area Member States 29 IA22 Overview EDP steps ndash Non-euro area Member States 30 IA23 Greece 31 IA24 Overview of Council country-specific recommendations relating to fiscal policy 32 II21 Matrix for determining the annual fiscal adjustment towards the MTO required under
the preventive arm 43 II22 Possible outcomes of the overall assessment under the preventive arm of the SGP 49 II41 Overview of the clauses relevant to the preventive arm 68 II51 Availability of indicators required under Council Directive 201185EU in Eurostats
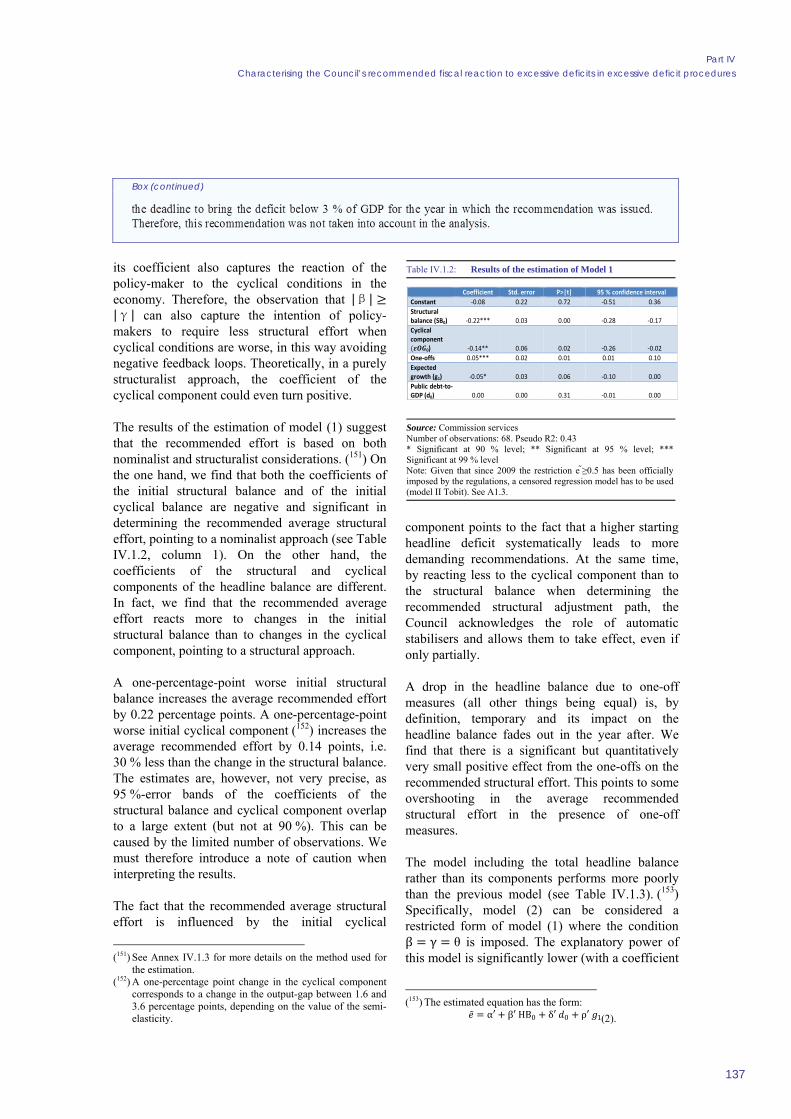
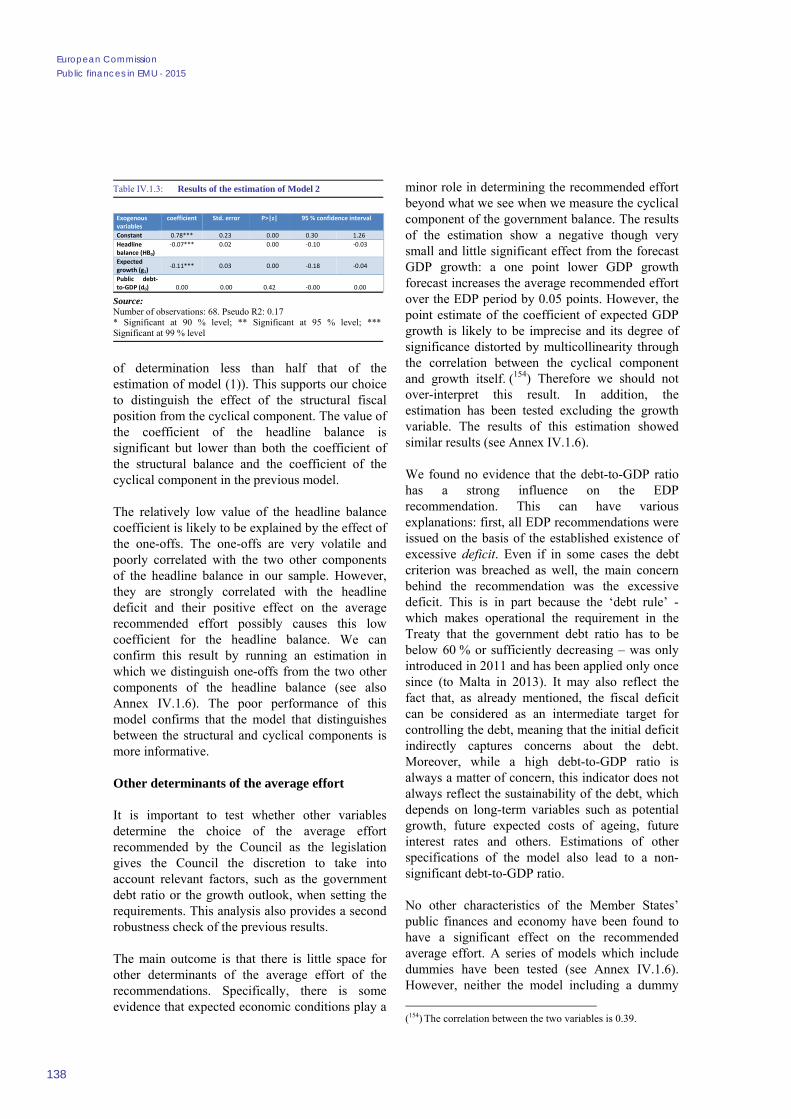
database (as at the end of 2015) 80 III21a Decomposition of expenditures with the ESA 2010 classification 94 III21b Decomposition of revenues with the ESA 2010 classification 94 IV11 Main characteristics of the EDP recommendations 134 IV12 Results of the estimation of Model 1 137 IV13 Results of the estimation of Model 2 138 IV14 Results of the estimation of Model 1 140 IV15 Estimation of the results of Model 2 143 IVA11 List of EDP recommendations 144 IVA12 Result for the Wald test for Model 1 148 IVA13 Results of the estimation of Model 1 using the non-ordered multinomial logit
method 149 IVA14 Other specifications for the determinants of the average effort (with the debt-to-
GDP ratio) 149 IVA15 Other specifications for the determinants of the length of the EDP 149
LIST OF GRAPHS I11 Composition of real GDP growth 6 I12 Fiscal stance in the euro area vs euro area output gap level nand change 10 I13 Change in SPB in the Commission forecast and as implied by stabilisation and
sustainability needs euro area 11
vi
II51 Outstanding guarantees by level of government 2013 of GDP 81 II52 Off-balance PPPs the stock of adjusted capital value by level of governments
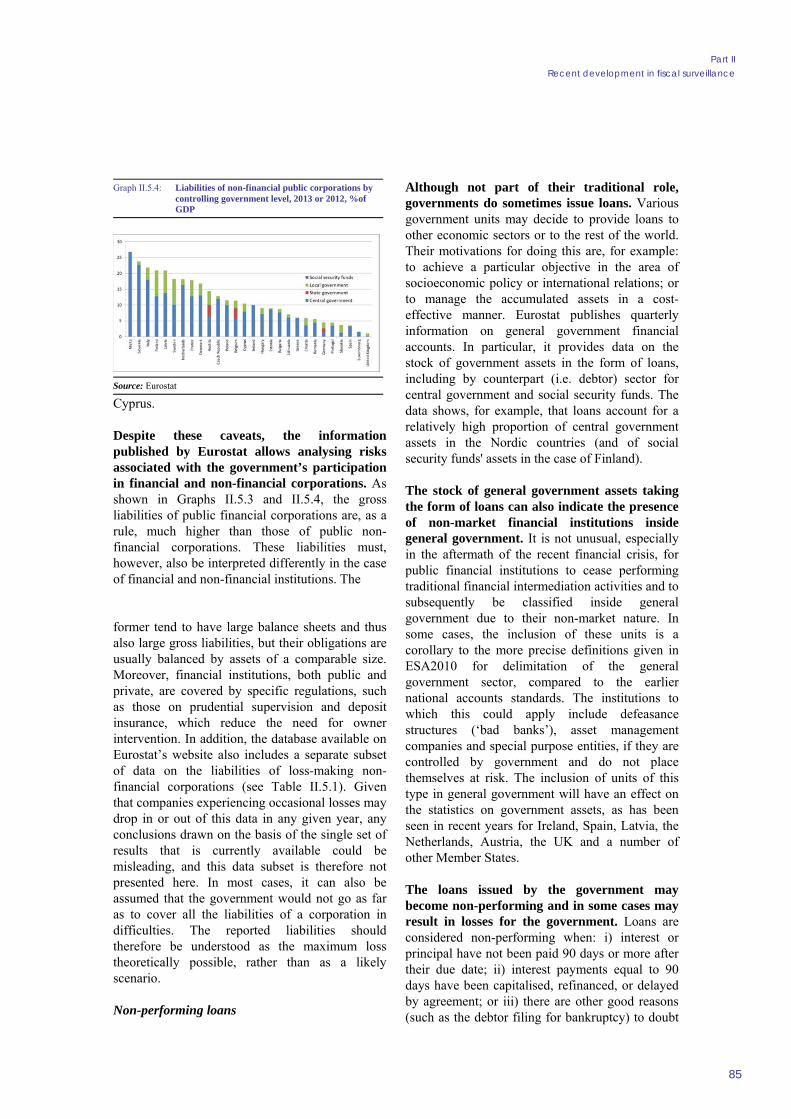
2013 of GDP 83 II53 Liabilities of public financial institutions by controlling government level 2013 or 2012
of GDP 84 II54 Liabilities of non-financial public corporations by controlling government level 2013
or 2012 of GDP 85 III21a 2014 HICP estimation from forecast (2013 autumn forecast) and outturn data
(2015 spring forecast) 92 III21b Inflation surprise for 2014 from forecast (2013 autumn forecast) to outturn data
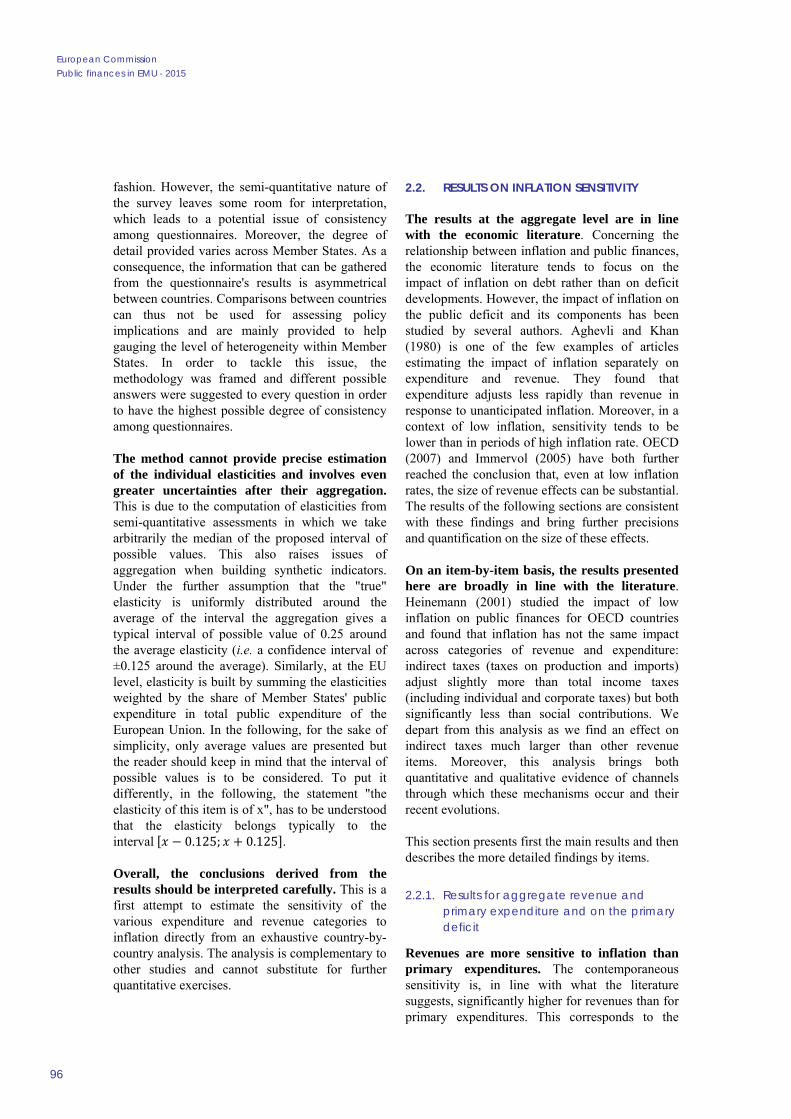
(2015 spring forecast) 93 III22 Elasticity of revenues with respect to inflation surprise in 2014 in the EU Member
States 97 III23 Elasticity of primary expenditures with respect to inflation surprise in 2014 in the EU
Member States 98 III24 Semi-elasticity of primary balance to inflation surprise in 2014 in the EU Member
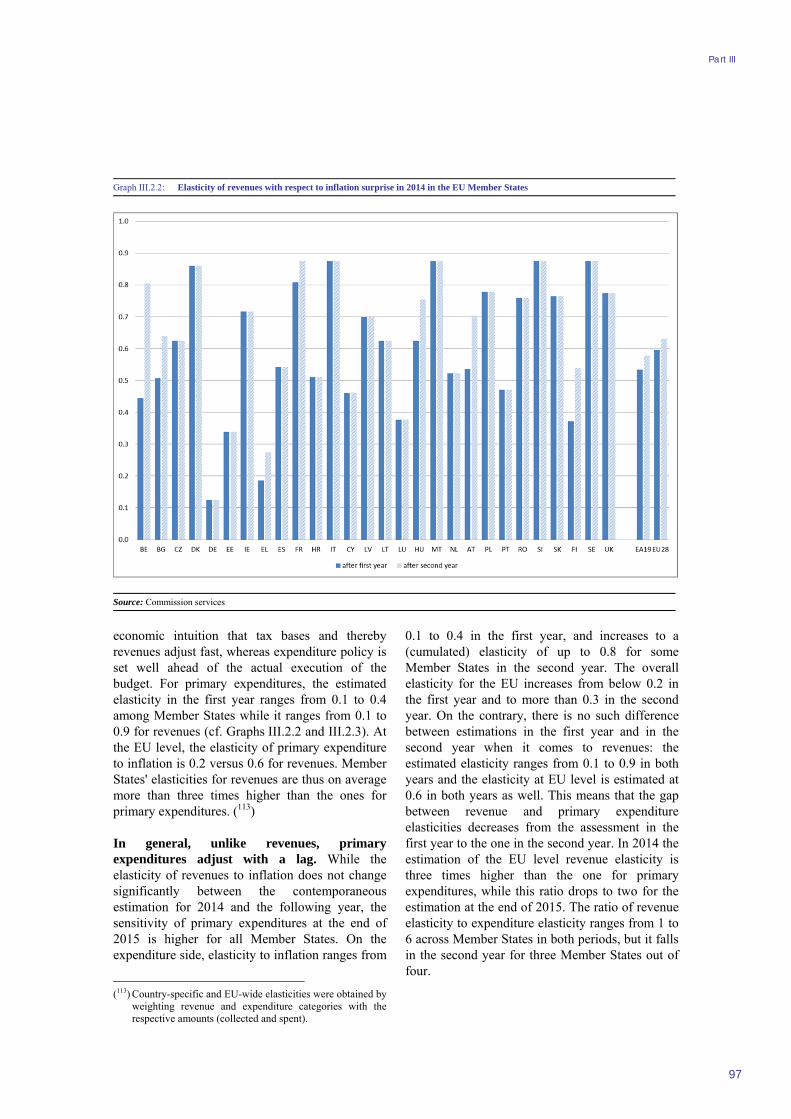
States 99 III25 Semi-elasticity of primary deficit in 2014 and 2015 to the inflation surprise in 2014 and
contributions of revenues and expenditures 99 III26 Elasticity of different revenue items to inflation surprise in 2014 100 III27 Elasticity of different expenditure items to inflation surprises in 2014 103 III28 Share of debt sensitive to inflation in the EU Member States 105 III29 Market-based inflation expectations in the euro area 106 III210 Elasticity of interest expenditure to inflation in the EU Member States 107 III211 Semi-elasticity of primary deficit in 2014 and 2015 to the inflation surprise in 2014
and contributions of revenues and expenditures(primary and interest) States ( of GDP) 107
III212 Impact on budget balance of the negative inflation surprise in 2014 in the EU Member 108
III213 Change in structural (primary) balance and in interest expenditure over 2012-16 government 110
IV11 Probability of recommended deadlines 141 IVA11 Distribution of the length of the EDP recommendations in the sample 144 IVA12 Distribution of the recommended cumulative structural effort in the sample 145 IVA13 Distribution of the recommended annual structural effort in the sample 145
LIST OF BOXES II21 The calculation of the minimum MTO 42 II22 The main factors explaining possible differences between the two pillars 50 II41 The adjustment path under the structural reform clause 71 II42 The adjustment path under the investment clause 73 II43 Use of the structural reform and investment clauses during the 2015 European
Semester (to benefit from a temporary deviation in 2016) 75 II51 Provisions in the EU budgetary framework on the reporting of fiscal risks 79 III21 The current low interest rate environment 109 IV11Comparability of pre-2009 and post-2009 recommendations 136
EDITORIAL
vii
After a number of difficult years when policy-makers were sometimes faced with the alternative between front-loaded consolidation and the risk of losing market access we are now starting to see the fruits of years of large fiscal efforts maturing with the negative short-term impact of the consolidation packages waning and a moderate recovery taking hold in the euro area On the back of the recovery the headline budget deficit is projected to continue to decrease through 2016 in the euro area and public debt will after peaking in 2014 at almost 95 of GDP keep falling at a slow pace even though the fiscal stance is expected to remain broadly neutral
An economically sound approach to the fiscal stance demands taking into account short-term stabilisation of the economy and long-term sustainability of public finances This is what we do in Part I of this report The shift to a broadly neutral fiscal stance for the Euro area as a whole for the period 2015-2016 is appropriate against the background of historically low interest rates and a large external surplus pointing to the need for some demand support Yet sustainability is essential and our rules are designed to improve it by reducing public debt in particular when the economy is performing well Indeed the economic literature and policy experience indicate that this is the best strategy to rebuild the necessary fiscal buffers and thereby allow for an effective counter-cyclical policy in future downturns To put it succinctly we can only make room for counter-cyclical policy in the bad times also if we apply it consistently in the good times This is one of the main lessons of the financial crisis while the crisis was not fiscal in origin the lack of fiscal buffer in many countries prevented an active use of the fiscal instrument when and where it was most needed
We recognise that the fiscal rules have become very complex At the same time the Commission is committed to clarifying the operation of the rules and increasing transparency in their application In this respect Part II of the report provides a comprehensive summary of how the Stability and Growth Pact accommodates cyclical fluctuations and structural reforms following the recent Commission Communication on Flexibility in the SGP It is also fair to say the depth and smart features of the surveillance framework have allowed it to take into account the unexpected negative inflation shock of recent years in a reasonable manner
We know that when inflation turns out to be lower than expected the achievement of budgetary objectives is affected in the short term since unlike revenues primary expenditures adjust only partially and with some time lag to an inflation surprise Part III of the report shows that the budgetary impact of the negative inflation shock of 2014 was relatively sizable and that the fiscal effort measured by the indicators used in surveillance was distorted in different directions as a result this shock In this regard the careful analysis of all indicators and all relevant factors led to relevant surveillance decisions This illustrates the importance of not fully tying our hands in the implementation of surveillance because the complexities of economic developments require an intelligent use of the existing surveillance indicators to adapt to an ever-changing reality
This also applies to recommendations given to Member States in the context of the Excessive Deficit Procedure Part IV of the report shows that the fiscal effort required by the EU Council in its recommendations is determined mostly on the basis of the headline deficit in line with the original legislation with some consideration also given to the specific fiscal impact of the economic situation The 2011 reform of the SGP went in this direction providing for a better implementation of the surveillance framework
Marco Buti
Director General Economic and Financial Affairs
SUMMARY
1
The recovery continues in line with expectations at a relatively moderate pace Supported by low oil prices and favourable policy conditions GDP growth in the euro area is expected to rise to 16 in 2015 (EU 19) and 18 in 2016 (EU 20) This outlook is subject to risks that are tilted to the downside While internal demand is already driving the current recovery the risks related to the global environment imply that growth may depend even more crucially on it In this improved economic context the large consolidation efforts of the past that have substantially reduced fiscal deficits are paying off the debt to GDP ratio is expected to fall in both the euro area and the EU for the first time since the beginning of the crisis albeit relatively slowly from high levels
As a consequence there are now only seven euro area Member States still in the Excessive Deficit Procedure (of which two Cyprus and Greece are under an economic adjustment programme) and two other EU Member States
In the euro area the aggregate headline budget deficit is expected to decline from 26 of GDP in 2014 to 18 in 2016 compared to 30 and 20 for the EU as a whole However the aggregate balance in structural terms ie adjusted for cyclical factors and excluding one-off measures is expected to remain broadly unchanged from last year The structural primary balance meanwhile is expected to deteriorate slightly
The economic appropriateness of the fiscal stance can be assessed against two objectives the need to stabilise the economy in the short-term and the long-term sustainability of public finances In terms of stabilisation the neutral fiscal stance expected in the euro area (as measured by the change in the structural balance) appears broadly appropriate as it should avoid hampering the recovery Indeed the pause in consolidation over 2015 and 2016 takes place at a time when there is considerable slack in the economy and downside risks to the growth outlook Nominal interest rates at historic lows and the high external surplus suggest the need for some degree of demand support However high debt countries face a risk which will materialize when interest rates begin to normalise again
As shown in Part I of the report some very heavily indebted Member States may find that they may need to increase their efforts in order to secure the medium-term sustainability of their public finances and strengthen their fiscal buffers once the recovery has gained pace
The preventive arm of the Stability and Growth Pact provides the framework to improve sustainability as it encourages budgetary savings to reduce public debt during times of economic strength The preventive arm of the pact aims to improve underlying budgetary positions by ensuring that government expenditures do not grow faster than potential GDP Economic studies and past experience show that this is the most effective strategy for rebuilding necessary fiscal buffers and thereby enabling effective counter-cyclical
The economic recovery in the euro area and the EU as a whole has continued this year at a moderate pace Government deficits continue to fall and debt levels have stabilised By 2016 most Member States are expected to be outside the EDP
The aggregate fiscal stance is broadly neutral which is overall appropriate given the fragile recovery and the risks attached to the economic environmenthellip
hellip while fiscal challenges related to sustainability remain high and long term risks have to be monitored
Member States should abide by the preventive arm of the SGP which aims to secure sound public financeshellip
European Commission Public finances in EMU - 2015
2
policies Accordingly improvements in budgetary positions have to be made in structural terms ie correcting for cyclical fluctuations and excluding measures which only have a one-off impact (see Part II of the Report)
The Commission Communication on flexibility within the SGP presented in Part II provides an operationalization of the prescriptions of the preventive arm by indicating how the convergence path to a sound medium-term budgetary position has to be modulated to take into account cyclical developments The same Communication also operationalizes the provision of the preventive arm which allows for a temporary deviation from the Medium-Term budgetary Objective or the adjustment path towards it to support structural reforms and investments that benefit the sustainability of public finances including by raising potential growth
The structural reform clause allows for a temporary deviation only under well-defined conditions One set of conditions relates to the nature of the reforms eligible for consideration Such reforms must be major in scope and plausibly conducive to an improvement in the sustainability of public finances A second set of conditions regards the status of the reforms in terms of implementation a reform must be credibly planned implemented or at least adopted by government Finally a third set of conditions concerns the situation of the Member State in question with respect to SGP requirements in order to ensure a safety margin with respect to the 3 of GDP deficit threshold of the Treaty and the convergence towards their MTO
The unexpected drops in inflation can make it harder for governments to meet their budgetary objectives because it affects revenues and expenditures differently Chapter III1 looks into the impact on the budget balance of the unexpected inflation shock of 2014
The analysis finds that the effect of inflation turning out to be just over 1 pp less than expected led to a deterioration in the deficit of around 01 pps of GDP in the euro area and almost 04 pps of GDP in certain Member States This is not a small impact especially if compared to the change and not the level of the deficit
The result is driven by the fact that unlike revenues primary expenditures adjust only partially and with a lag to an inflation surprise at least over a two-year horizon Specifically while the elasticity of revenues to the negative inflation surprise was an estimated 05 in 2014 and almost 06 over 2014 and 2015 in the euro area the corresponding figures for the elasticity of primary expenditures is estimated to have been less than 02 in 2014 and to have increased only to 03 cumulatively in 2015
The partial or complete removal of indexation mechanisms eg on wages and rigidities of downward nominal adjustment are important reasons why the elasticities of primary expenditures to price developments were found to be particularly low in 2014 These effects are thus very specific to 2014 because in this year the negative inflation shock overlapped with an already low-inflation environment and with the suspension of earlier practice for example concerning wages which in the past had generated relatively large short-term effects
hellipwhile benefitting from the flexibility present in the preventive arm identified by the Commission in its Communication on Flexibility in the SGP of Januaryhellip
which is allowed under well-specified conditions
helliphellip Inflation turning out lower than expected can hinder improvements in budgetary positionshellip
Summary
3
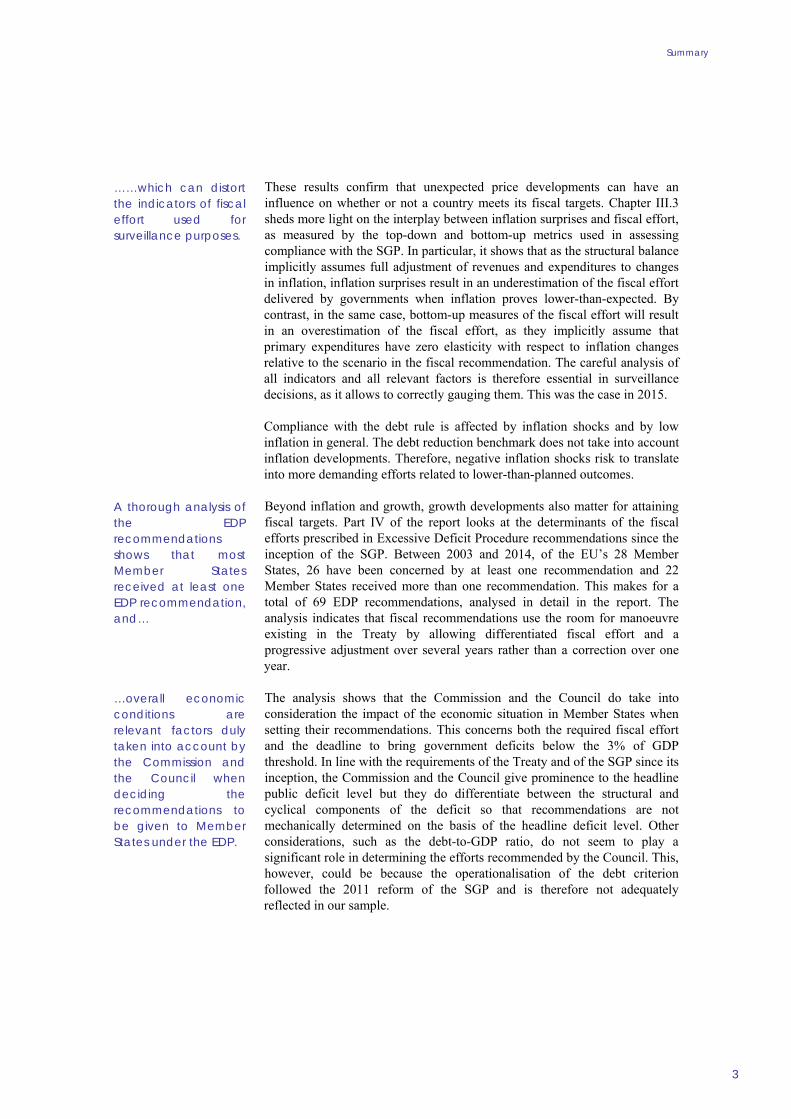
These results confirm that unexpected price developments can have an influence on whether or not a country meets its fiscal targets Chapter III3 sheds more light on the interplay between inflation surprises and fiscal effort as measured by the top-down and bottom-up metrics used in assessing compliance with the SGP In particular it shows that as the structural balance implicitly assumes full adjustment of revenues and expenditures to changes in inflation inflation surprises result in an underestimation of the fiscal effort delivered by governments when inflation proves lower-than-expected By contrast in the same case bottom-up measures of the fiscal effort will result in an overestimation of the fiscal effort as they implicitly assume that primary expenditures have zero elasticity with respect to inflation changes relative to the scenario in the fiscal recommendation The careful analysis of all indicators and all relevant factors is therefore essential in surveillance decisions as it allows to correctly gauging them This was the case in 2015
Compliance with the debt rule is affected by inflation shocks and by low inflation in general The debt reduction benchmark does not take into account inflation developments Therefore negative inflation shocks risk to translate into more demanding efforts related to lower-than-planned outcomes
Beyond inflation and growth growth developments also matter for attaining fiscal targets Part IV of the report looks at the determinants of the fiscal efforts prescribed in Excessive Deficit Procedure recommendations since the inception of the SGP Between 2003 and 2014 of the EUrsquos 28 Member States 26 have been concerned by at least one recommendation and 22 Member States received more than one recommendation This makes for a total of 69 EDP recommendations analysed in detail in the report The analysis indicates that fiscal recommendations use the room for manoeuvre existing in the Treaty by allowing differentiated fiscal effort and a progressive adjustment over several years rather than a correction over one year
The analysis shows that the Commission and the Council do take into consideration the impact of the economic situation in Member States when setting their recommendations This concerns both the required fiscal effort and the deadline to bring government deficits below the 3 of GDP threshold In line with the requirements of the Treaty and of the SGP since its inception the Commission and the Council give prominence to the headline public deficit level but they do differentiate between the structural and cyclical components of the deficit so that recommendations are not mechanically determined on the basis of the headline deficit level Other considerations such as the debt-to-GDP ratio do not seem to play a significant role in determining the efforts recommended by the Council This however could be because the operationalisation of the debt criterion followed the 2011 reform of the SGP and is therefore not adequately reflected in our sample
helliphellipwhich can distort the indicators of fiscal effort used for surveillance purposes
A thorough analysis of the EDP recommendations shows that most Member States received at least one EDP recommendation andhellip
hellipoverall economic conditions are relevant factors duly taken into account by the Commission and the Council when deciding the recommendations to be given to Member States under the EDP
Part I Current developments and prospects
1 CURRENT DEVELOPMENTS AND PROSPECTS
6
11 ECONOMIC DEVELOPMENTS AND PERSPECTIVE ON CONSOLIDATION
The economic recovery that started in the euro area and the EU as a whole in 2013 has continued this year supported by tailwinds amid more challenging global conditions Although it has been relatively timid compared with previous recoveries (as is often the case following major financial crises) (1) the recovery has so far proven resilient It has benefited in particular from a conjunction of tailwinds including low oil prices a relatively weak external value of the euro and policy support stemming from the ECBrsquos highly accommodative monetary policy and a neutral fiscal stance On the other hand economic growth has been muted by several factors in particular the recent sharp fall in global trade growth in a context of slowdown in emerging market economies geopolitical tensions subdued investment activity (especially due to economic and policy uncertainty) and lingering corporate deleveraging pressures in some Member States
The outlook for moderate but increasing output growth in the Commissionrsquos autumn 2015 forecast largely confirms expectations from the spring It points to further modest recovery with real GDP growth improving from 16 in 2015 to 18 in 2016 in the euro area and from 19 to 20 in the EU as a whole For both the euro area and the EU this is marginally more favourable than expected in the spring forecast for 2015 (as in the first half of the year GDP in the EU grew slightly faster than expected) and marginally less so for 2016
The aggregate growth figures mask sizeable differences across Member States While real GDP growth is expected to pick up in most Member States in 2016 it is projected to slow down in six euro area Member States (Ireland Spain Malta Portugal Slovenia and Slovenia) and five other Member States (Bulgaria the Czech Republic Hungary Sweden and the United Kingdom) though still likely to remain above EU average in most of these countries
(1) For comparisons with previous recoveries see for instance
Reinhart and Rogoff (2008) Furceri and Mourougane (2009) Jordagrave et al (2013) European Central Bank (2014) European Commission (2015a)
As regards its composition growth is likely to be driven by stronger domestic demand while net exports are expected to contribute hardly at all Private consumption has been stimulated by the favourable impact on purchasing power of low oil prices and a continued rise in nominal income thus becoming the main driver of economic growth Investment has been lagging but is expected to strengthen on the back of a rebound in residential investment favourable financing conditions improved profit margins and a brighter demand outlook Exports are likely to rebound with world trade growth expected to recover in 2016 underpinning an expansion of EU export markets However as the profile of import growth is projected to be similar to that of exports the contribution of net exports to growth is expected to be broadly neutral (see Graph I11)
The rebalancing from external towards internal demand is in line with a stabilisation of the euro arearsquos current-account surplus This surplus is set to decline marginally in 2016 after peaking in 2015 In 2015 it is expected to increase by 07 pp to 37 of GDP as a result of the shrinking oil trade deficit improvements in the terms of trade and subdued domestic demand It is then expected to edge down to 36 of GDP in 2016
Re-launching investment to support domestic demand is one of the Commissionrsquos priorities for 2016 especially with the operationalisation
Graph I11 Composition of real GDP growth
Source Commissionrsquos 2015 autumn forecast
-5
-4
-3
-2
-1
0
1
2
3
2008 2009 2010 2011 2012 2013 2014 2015 2016
Domestic demand Net exports
Inventories GDP (y-o-y)
forecastpps
Part I Current developments and prospects
7
at the beginning of the year of the Investment Plan for Europe It is aimed at mobilising new investments of over EUR 315 billion to address the investment shortage induced by the crisis Substantial progress has been made in building financial capacity with the setting-up of the European Fund for Strategic Investments and in selecting projects This needs to be accompanied by dismantling barriers to investment(2) Further steps are needed not only to complete Banking Union and Capital Markets Union so that the financial sector can focus on lending to the real economy but also to remove distortions in taxation that impede investment and invest in human capital and social infrastructure
The recovery has also benefited from support from monetary policy The combination of quantitative easing and credit easing by the ECB has reduced financing costs and contributed to a rebound in credit growth
The outlook is subject to risks that are tilted to the downside in particular on the external side World trade could deteriorate further and spillovers from the slowdown in emerging markets could turn out larger than expected which would increase the need for the euro area to turn from external to domestic sources of growth An additional external risk relates to a possible increase in volatility on financial markets On the domestic side the legacy of the crisis may continue to weigh on investment more heavily than expected At the same time the risks relating to the uncertainty in Greece have receded following the political agreement reached in the summer Upside risks include a stronger-than-expected rebound in global growth and foreign demand and more favourable impacts from structural reforms
12 ASSESSMENT OF SHORT-TERM FISCAL DEVELOPMENTS
121 Budget deficits
Following large consolidation efforts in 2011-2013 deficits have been substantially reduced From 2011 to 2013 and (more slowly) in 2014 (2) See Commission Staff Working Document SWD (2015)
400 final Available online at httpeceuropaeueurope2020pdf2016ags2016_challenges_ms_investment_environments_enpdf
sizeable consolidation was implemented in the euro area and the EU as a whole (Table I11) This reduced markedly the structural deficit in the EU from 46 of GDP in 2010 to 17 in 2014 and in the euro area from 43 to 10 In the same period headline deficit ratios also fell considerably by around 35 of GDP to 30 in the EU and 26 in the euro area in 2014 At country level while only five Member States recorded deficits below the 3 of GDP reference threshold in 2010 14 did so in 2014
Looking ahead the aggregate headline budget balance is expected to improve further in 2015 and 2016 In the euro area the deficit is projected to decrease to 20 of GDP in 2015 and 18 in 2016 A slightly faster reduction is expected in the EU as a whole to 25 in 2015 and 20 in 2016 These falls correspond to average annual improvements (by 04 and 05 of GDP respectively) amounting to half of the average observed in 2011-2013
This improvement is mainly due to lower interest rates improved growth and past consolidation efforts while the aggregate structural balance is expected to remain broadly unchanged and the structural primary balance is expected to deteriorate Following four years of improvement the structural balance (ie the headline balance corrected for cyclical factors one-offs and other temporary measures) is projected to edge down to -11 of GDP in 2015 and -12 in 2016 in the euro area and to hover at around -17 in the EU as a whole The difference vis-agrave-vis the evolution of the headline balance corresponds mainly to the impact of the cycle (which is expected to improve both headline balances by 04 pp per year) along with a positive expected impact of one-offs in 2015 Interest expenditure is expected to drop by 03 of GDP in both areas over the same period but this is expected to be offset by a deterioration in the structural primary balance cumulatively by roughly the same amount in the EU and by 05 of GDP in the euro area (Table I12)
European Commission Public finances in EMU - 2015
8
2012 2013 2014 2015 2016 2012 2013 2014 2015 2016 2012 2013 2014 2015 2016BE -41 -29 -31 -27 -26 -34 -27 -28 -25 -21 01 06 03 04 07DE -01 -01 03 09 05 -01 03 08 09 07 22 23 26 24 21EE -03 -01 07 02 02 -01 -04 03 03 02 00 -03 04 04 03IE -80 -57 -39 -22 -15 -64 -43 -32 -30 -21 -24 00 08 03 09EL -88 -124 -36 -46 -36 -04 20 06 -11 -03 47 60 45 32 38ES -104 -69 -59 -47 -36 -33 -19 -18 -25 -26 -04 15 16 06 03FR -48 -41 -39 -38 -34 -43 -35 -28 -27 -24 -17 -13 -06 -07 -03IT -30 -29 -30 -26 -23 -13 -09 -11 -10 -15 39 40 36 33 26
CY -58 -49 -89 -07 01 -51 -17 20 04 02 -22 14 49 32 27LV -08 -09 -15 -15 -12 00 -09 -18 -21 -19 16 05 -03 -08 -06LT -31 -26 -07 -11 -13 -26 -23 -14 -12 -14 -06 -05 02 04 01LU 02 07 14 00 05 25 21 21 07 09 30 25 25 11 13MT -36 -26 -21 -17 -12 -36 -25 -24 -21 -17 -07 04 05 06 08NL -39 -24 -24 -21 -15 -23 -09 -05 -11 -14 -06 06 09 03 -02AT -22 -13 -27 -19 -16 -18 -12 -07 -06 -10 09 14 18 18 12PT -57 -48 -72 -30 -29 -31 -25 -14 -18 -23 18 23 35 31 22SI -41 -150 -50 -29 -24 -21 -22 -27 -27 -25 -01 04 04 03 04SK -42 -26 -28 -27 -24 -36 -17 -21 -21 -20 -18 02 -01 -05 -05FI -21 -25 -33 -32 -27 -11 -10 -18 -17 -15 03 03 -05 -06 -04
EA-19 -37 -30 -26 -20 -18 -21 -14 -10 -11 -12 09 14 16 14 12BG -06 -08 -58 -28 -27 -05 -08 -25 -26 -24 03 00 -16 -16 -14CZ -40 -13 -19 -19 -13 -15 01 -08 -20 -14 00 14 05 -08 -02DK -36 -13 15 -33 -25 00 -02 06 -23 -14 19 16 21 -08 -01HR -53 -54 -56 -49 -47 -41 -36 -39 -35 -38 -07 -01 -04 01 -02HU -23 -25 -25 -23 -21 -14 -15 -25 -23 -26 32 31 15 12 07PL -37 -40 -33 -28 -28 -40 -34 -26 -30 -26 -14 -09 -07 -12 -10RO -32 -22 -14 -12 -28 -20 -11 -06 -08 -27 -03 07 10 08 -12SE -09 -14 -17 -14 -13 01 -02 -08 -10 -10 10 06 -01 -04 -03UK -83 -57 -57 -44 -30 -66 -45 -52 -45 -33 -37 -17 -25 -20 -09
EU-28 -43 -33 -30 -25 -20 -27 -18 -17 -18 -16 02 09 08 05 06
Budget balance Structural balance Structural primary balance
Consolidation efforts varied across Member States in 2014 The fiscal effort in 2014 as measured by the change in the structural balance points to a broadly equal number of Member States consolidating or loosening with large differences across countries Consolidation ranged from over 3 pp in Cyprus to a loosening of at least 1 pp in Bulgaria Greece and Hungary Ireland and Portugal implemented fiscal efforts of slightly above 1 pp Of the remaining Member States around half implemented an effort of 0-1 pp and the other half a loosening of 0-1 pp
Over 2015 and 2016 most Member States are projected to implement no or negative fiscal efforts on average with respect to 2014 Consolidation is expected to take place in only seven countries with a maximum of 09 pp per year (average in the UK) over the two years In the other consolidating countries (Ireland Belgium Malta France Slovenia and Finland) the projected average effort is expected to reach 05 pp
per year at most The structural balance is expected to remain unchanged in six Member States (Bulgaria Slovakia Hungary Poland Lithuania and Latvia) It is expected to deteriorate in the
Table I11 Budget balances in EU Member States ( of GDP)
Source Commission services figures for 2015 and 2016 are from the Commissions autumn 2015 forecast Note The structural budget balance is calculated on the basis of the commonly agreed production function method (European Commission (2004))
Table I12 Euro area ndash general government budget balance ( of GDP)
Source Commission services figures for 2015 and 2016 are from the Commissions autumn 2015 forecast Note Differences between the total and the sum of individual items are due to rounding
2011 2012 2013 2014 2015 2016Total revenue (1) 449 461 466 468 466 462Total expenditure (2) 491 497 496 494 486 480Actual balance (3) = (1) - (2) -42 -37 -30 -26 -20 -18Interest (4) 30 30 28 27 24 23Primary balance (5) = (3) + (4) -12 -06 -02 01 04 05One-offs (6) 00 -04 -01 -02 01 00Cyclically adjusted balance (7) -36 -25 -14 -12 -10 -12Cyclically adj prim balance = (7) + (4) -06 05 14 14 14 11Structural budget balance = (7) - (6) -36 -21 -14 -10 -11 -12Structural primary balance = (7)-(6)+(4) -06 09 14 16 14 12Change in actual balance 05 07 04 06 02of which - Cycle -06 -04 01 04 04 - Interest (reverse sign) 00 02 01 02 01 - One-offs -04 03 -01 03 -01 - Structural primary balance 15 05 02 -03 -02Change in cycl adj primary balance 12 08 01 00 -03Change in structural budget balance 15 07 03 -01 -01
Part I Current developments and prospects
9
remaining 15 with the largest loosening by 11 pp per year expected in Romania while in most cases the decline is not expected to exceed 05 pp a year However in several Member States these averages conceal significant differences in the fiscal effort between the two years
122 Assessing the euro arearsquos fiscal stance
The fiscal stance in the euro area can be assessed against the twin criteria of long-term sustainability of public finances and short-term macroeconomic stabilisation Long-term sustainability requires that public debt is put and maintained on a sustainable path taking into account the current level of debt and projected future expenditures relating to population ageing Macroeconomic stabilisation could be expressed in terms of closing the output gap at an appropriate pace in the short to medium term while in the current situation also ensuring a shift from external to domestic sources of growth(3)
Assessed against stabilisation needs the expected neutral fiscal stance in the euro area as measured by the change in the structural balance can be considered broadly appropriate After substantial fiscal consolidation was achieved from 2011 to 2013 the adjustment effort slowed down in 2014 and is expected to come to a halt in 2015 and 2016 corresponding to a broadly neutral fiscal stance (Graph I12) This is in a context of an output gap that has been negative since 2009 (although it has been narrowing since 2013) For both 2015 and 2016 a broadly unchanged structural balance is expected with the output gap improving at the same pace As the output gap is expected still to be negative by the end of 2016 (for the eighth year in a row) such a neutral fiscal stance in both years appears broadly appropriate in that it is not likely to hinder the projected substantial cumulative narrowing of the output gap (by 14 pp) while avoiding procyclicality It also appears suitable given the historically low interest rates and the high external surplus which would indicate a need for some degree of demand support Nevertheless because they are non-permanent savings from low interest
(3) This is consistent with the concept of responsible fiscal
policies as presented in the 2016 Annual Growth Survey (httpeceuropaeueurope2020pdf2016ags2016_annual_growth_surveypdf) ie policies that ensure growth-friendly fiscal consolidation
payments could represent a risk if used to increase government spending or cut taxes permanently
At the same time further consolidation is needed to address sustainability needs The euro area still faces considerable challenges as regards the sustainability of public finances Aggregate general government debt in the euro area remains high at over 90 of GDP and well above that level in certain Member States and it is decreasing only slowly This points to a need for further consolidation to bring and keep debt on a sustainable path also in view of the future increase in expenditures associated with population ageing
The previous analysis can be refined by referring to the S1 indicator (4) for sustainability and to a robustness check for stabilisation For the sake of transparency sustainability and stabilisation needs are estimated separately For this purpose the fiscal stance has to be expressed in terms of the change in structural primary balance (SPB) ie excluding interest payments This enables us to assess it against sustainability needs as measured on the basis of the S1 indicator which shows the total change in SPB required from 2016 to 2020 to bring debt to 60 of GDP by 2030 also taking into account contingent liabilities relating to ageing For the calculations it is assumed that 25 of this total adjustment is implemented in 2016 Stabilisation needs are expressed on the basis of the Keynesian idea that fiscal policy should be countercyclical and can be so with various degrees of ambition depending in particular on country-specific conditions Thus the needs are computed in terms of closing the output gap at a more or less rapid pace in 2016 namely by 25 to 50 as compared with its 2015 level Annex I1 provides further details on the methodology
(4) The Commission services use the S1 indicator to carry out
systematic and harmonised public-debt sustainability analysis for EU Member States It measures in structural terms net of interest payments the fiscal adjustment needed to bring the debt ratio to the reference threshold of 60 of GDP by 2030
European Commission Public finances in EMU - 2015
10
This analytical exercise does neither substitute for the SGP nor is to be seen as supporting fiscal fine-tuning It should be made clear that the intention is only to provide deeper positive analysis of budgetary developments not to suggest fiscal fine-tuning or draw normative conclusions The only relevant legal framework for policy recommendations is strict implementation of the SGP
Certain methodological limitations call for prudence in interpretation This is a tentative assessment which still has to be refined In particular it relies on real-time estimation of the output gap which is a notoriously difficult exercise the quantification of sustainability and stabilisation needs is illustrative the calculations use a single multiplier irrespective of the country and measures considered and they do not incorporate any spillover effects across countries Moreover the definition of stabilisation needs could be refined to depend on the number of consecutive years that the output gap has already been positive or negative
Graph I13 presents an assessment of the forecast fiscal stance in the euro area as a whole and in individual Member States against sustainability and stabilisation needs It compares the projected fiscal stance (red crosses)
with the changes in SPB that would be necessary to address sustainability needs (green squares) and stabilisation needs (the vertical bars bookended by a blue bar identifying a 25 reduction of the output gap and a black bar identifying a 50 reduction)
For the euro area as a whole this analysis confirms that the projected broadly neutral fiscal stance for 2016 is consistent with moderate stabilisation and less restrictive than implied by sustainability needs The Commission forecast expects a small deterioration in SPB by 02 pp in 2016 By comparison the sustainability needs would point to a need to improve the SPB by 03 pp As regards the stabilisation needs a consolidation effort of 02 pp in terms of change in SPB would be compatible with a reduction of the output gap by 25 while a loosening of 04 pp would be needed to reduce it by 50 in one year Overall the projected fiscal stance is located towards the middle of the vertical stabilisation bar indicating that it is consistent with an output gap reduction of more than 25 and less than 50 and it is less restrictive than suggested by sustainability needs Alternatively a limited improvement in SPB by around 02 pp would broadly address sustainability needs while allowing for some reduction of the output gap
Graph I12 Fiscal stance in the euro area vs euro area output gap level and change
Source Commission services Note In the left-hand chart the projected fiscal stances for both 2015 and 2016 follow the same plot as changes in structural balance and in output gap are expected to be the same in both years
2008
2010
2011
2012
2013
2014
20152016
-1 -05 00 105 15
-15
-10
-05
00
05
10
15
20
Ch
ange
in t
he
stru
ctu
ral b
alan
ce
Change in the output gap
2009
-5
2009
2010
2011
2012
2013
2014
201500-05-1-15-2-25-3-35 20
-15
-10
-05
00
05
10
15
20
Ch
ange
in t
he s
tru
ctu
ral b
alan
ce
Output gap
20082008
2016
Part I Current developments and prospects
11
123 Assessing the fiscal stance in euro area Member States
1231 A useful graphical tool
The following paragraphs provide more detailed explanations on how to read Graph I13 for all Member States
From the point of view of stabilisation needs Graph I13 shows two groups of euro area Member States depending on the sign of their expected output gap in 2015 In those in which the output gap is negative (ie the majority of euro area Member States) stabilisation involves improving the output gap and the fiscal stance consistent with a 50 reduction of the output gap is mechanically more expansionary than that consistent with a reduction of only 25 In
Graph I13 this means that the black bar (50 reduction) is below the blue bar (25 reduction) By contrast for countries in which the output gap is positive (Estonia Latvia Lithuania Malta and Ireland) narrowing the output gap would mean slowing down economic growth The reduction would be greater with a more restrictive fiscal stance For these countries the black bar is therefore above the blue bar
The length and position of the vertical bars can be interpreted as follows
- the length of the bars is an indication of the size of the output gap An output gap close to zero translates into limited stabilisation needs indicated by a short vertical bar For instance in Germany where the output gap in 2015 is estimated at -04 of GDP it does not make
Graph I13 Change in SPB in the Commission forecast and as implied by stabilisation and sustainability needs euro area
Source Commission services Notes (1) How to read this chart for the euro area as a whole the Commissionrsquos 2015 autumn forecast expects a deterioration in the SPB by 02 pp in 2016 (red cross) By comparison the sustainability needs would point to a need to improve the SPB by 03 pp (green square) As regards stabilisation needs a consolidation effort of 02 pp in terms of change in SPB would be compatible with a 25 reduction of the output gap (long blue bar) while it would take a loosening of 04 pp to reduce the output gap by 50 in one year (short black bar) Overall the projected fiscal stance is located on the vertical stabilisation bar indicating that it is consistent with a reduction of the output gap by more than 25 and less than 50 and it is less restrictive than suggested by sustainability needs (2) The change in SPB that would be mechanically consistent with the considered changes in the output gap is calculated assuming a (fairly large) fiscal multiplier of 08 (3) The calculations take into account the change in output gap entailed in the Commission forecast once it has been corrected for the impact of the projected fiscal stance (ie the change in output gap recalculated under a zero-change in the SPB scenario ceteris paribus) (4) Portugal has not yet submitted budgetary plans for 2016
-15
-10
-05
00
05
10
15
20
25
-15
-10
-05
00
05
10
15
20
25
EA LU DE NL SK CY AT ES IT SI FI BE PT FR EL EE LV LT MT IE
Change in the SPB consistent with a reduction of the OG by 25 Change in the SPB consistent with a reduction of the OG by 50
Change in the SPB in the Commission forecast Change in the SPB implied by sustainability needs
Member States with a negative OG in 2015 Member States with a positive OG in 2015
Euro area
broadly neutral fiscal
stance
(-31)
European Commission Public finances in EMU - 2015
12
much difference to the required level of fiscal adjustment whether it is closed by 25 or 50 Conversely with Spainrsquos output gap of -39 of GDP in 2015 the implied change in SPB differs substantially depending on whether the output gap is to be reduced by 1 pp or 2 pp This is shown by a long vertical bar
- the position of the bars indicates what change in SPB is suggested by the stabilisation needs this depends on how the output gap is projected to evolve ceteris paribus The calculations incorporate the evolution of the output gap that is implicit in the Commission forecast on the basis of identical assumptions for variables other than fiscal Only the fiscal stance is modulated so as to show what change in SPB would be consistent with a given change in the output gap via the operation of a given fiscal multiplier In most cases including for the euro area as a whole the forecast already foresees a significant reduction of the output gap even without fiscal policy intervention (see Annex I1) and a broadly neutral fiscal stance would be sufficient to reduce the output gap by at least 25 If the underlying reduction in the output gap is large enough some stabilisation can still be achieved even if it is partially offset by procyclical fiscal policy (eg in Cyprus Spain and Slovenia) If on the other hand the underlying closure of the output gap is limited or the output gap is expected to widen active countercyclical policy may be needed
The effort implied by sustainability needs depends on current and outlook debt levels In a majority of euro area Member States debt is projected to remain above 60 of GDP and further consolidation is needed to reduce it to 60 by 2030 this is indicated by green squares above the horizontal axis By contrast in other countries debt already stands below 60 of GDP (Estonia Latvia Luxembourg and Slovakia) or is expected to fall below 60 before 2030 (Germany the Netherlands) and is combined with a low projected increase in ageing-related expenditure This implies that up to a point debt could still remain at or below 60 of GDP by 2030 even with some deterioration in SPB In other words these Member States have scope for expansionary policies in response to stabilisation needs In
Graph I13 this is shown by green squares below the horizontal axis
The shaded area indicates a zone where the fiscal stance can be considered broadly neutral It corresponds to a change in SPB of between -02 pp and 02 pp The euro area as a whole Luxembourg Slovakia Slovenia Finland Estonia Latvia and Malta can be considered to have a broadly neutral fiscal stance in 2016 on the basis of the Commission forecast while Greecersquos Irelandrsquos and (to a lesser extent) Belgiumrsquos and Francersquos stance can be considered restrictive An expansionary fiscal stance is projected in the remaining euro area Member States
1232 Main messages
The analysis shows that in most cases sustainability and stabilisation needs do not necessarily conflict but tensions appear when the stabilisation targets are more ambitious There are no conflicts when the sustainability markers (green squares) are located on the stabilisation bar or below it as for Luxembourg Germany the Netherlands Slovakia Cyprus Spain Slovenia and all Member States with a positive output gap in these cases there is room for fiscal policy to address both needs simultaneously even if not necessarily with the SGP This is also the case to a lesser extent when stabilisation needs (at least measured by the least ambitious reduction target) point in the same direction as sustainability needs in terms of improving or lsquodisimprovingrsquo the SPB This is the case for the euro area as a whole Italy Finland Belgium and France in such cases both needs may not be fully addressed but do not conflict for limited stabilisation targets However tensions between stabilisation and sustainability needs appear if the targeted reduction of the output gap is more ambitious Finally there are only three cases of conflict Greece Portugal and to a much more limited extent Austria
The projected fiscal stance for most Member States in 2016 reflects at least partly stabilisation needs in Member States with a negative output gap in some cases at the expense of sustainability needs Among the countries with a negative output gap a deterioration of SPB is expected in seven (Germany the Netherlands Cyprus Austria
Part I Current developments and prospects
13
Spain Italy and Portugal) (5) in most cases coinciding with a substantial improvement in the output gap Of these it is only in Germany and the Netherlands that the fiscal expansion does not come at the expense of sustainability needs in all the other cases sustainability issues would suggest instead a need for an improvement in SPB (Spain Italy and Portugal) or an unchanged SPB (Cyprus and Austria) At the same time four Member States with a negative output gap are expected to have a broadly neutral fiscal stance For Luxembourg and Slovakia this is in line with both sustainability and stabilisation needs for Finland this partly addresses both needs for Slovenia it would take a more restrictive stance to address both needs The three remaining countries with a negative output gap are expected to improve their SPB somewhat which would mitigate both needs
(5) Portugal has not yet submitted budgetary plans for 2016
given the gap (Belgium and France) or conflict (Greece) between them
13 DEVELOPMENTS IN DEBT
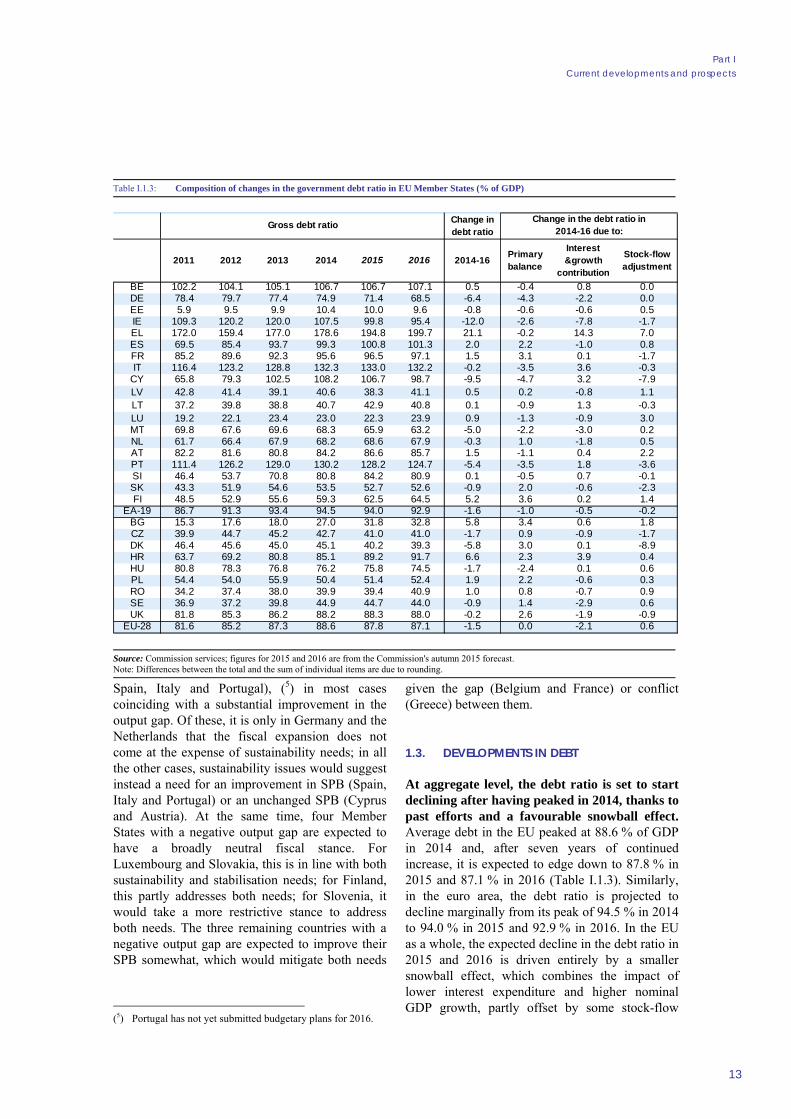
At aggregate level the debt ratio is set to start declining after having peaked in 2014 thanks to past efforts and a favourable snowball effect Average debt in the EU peaked at 886 of GDP in 2014 and after seven years of continued increase it is expected to edge down to 878 in 2015 and 871 in 2016 (Table I13) Similarly in the euro area the debt ratio is projected to decline marginally from its peak of 945 in 2014 to 940 in 2015 and 929 in 2016 In the EU as a whole the expected decline in the debt ratio in 2015 and 2016 is driven entirely by a smaller snowball effect which combines the impact of lower interest expenditure and higher nominal GDP growth partly offset by some stock-flow
Table I13 Composition of changes in the government debt ratio in EU Member States ( of GDP)
Source Commission services figures for 2015 and 2016 are from the Commissions autumn 2015 forecast Note Differences between the total and the sum of individual items are due to rounding
Change in debt ratio
2011 2012 2013 2014 2015 2016 2014-16Primary balance
Interest ampgrowth
contribution
Stock-flow adjustment
BE 1022 1041 1051 1067 1067 1071 05 -04 08 00DE 784 797 774 749 714 685 -64 -43 -22 00EE 59 95 99 104 100 96 -08 -06 -06 05IE 1093 1202 1200 1075 998 954 -120 -26 -78 -17EL 1720 1594 1770 1786 1948 1997 211 -02 143 70ES 695 854 937 993 1008 1013 20 22 -10 08FR 852 896 923 956 965 971 15 31 01 -17IT 1164 1232 1288 1323 1330 1322 -02 -35 36 -03
CY 658 793 1025 1082 1067 987 -95 -47 32 -79LV 428 414 391 406 383 411 05 02 -08 11LT 372 398 388 407 429 408 01 -09 13 -03LU 192 221 234 230 223 239 09 -13 -09 30MT 698 676 696 683 659 632 -50 -22 -30 02NL 617 664 679 682 686 679 -03 10 -18 05AT 822 816 808 842 866 857 15 -11 04 22PT 1114 1262 1290 1302 1282 1247 -54 -35 18 -36SI 464 537 708 808 842 809 01 -05 07 -01SK 433 519 546 535 527 526 -09 20 -06 -23FI 485 529 556 593 625 645 52 36 02 14
EA-19 867 913 934 945 940 929 -16 -10 -05 -02BG 153 176 180 270 318 328 58 34 06 18CZ 399 447 452 427 410 410 -17 09 -09 -17DK 464 456 450 451 402 393 -58 30 01 -89HR 637 692 808 851 892 917 66 23 39 04HU 808 783 768 762 758 745 -17 -24 01 06PL 544 540 559 504 514 524 19 22 -06 03RO 342 374 380 399 394 409 10 08 -07 09SE 369 372 398 449 447 440 -09 14 -29 06UK 818 853 862 882 883 880 -02 26 -19 -09
EU-28 816 852 873 886 878 871 -15 00 -21 06
Gross debt ratioChange in the debt ratio in
2014-16 due to
European Commission Public finances in EMU - 2015
14
adjustments In the euro area by contrast the main driver of the expected reduction in the debt ratio is the projected improvement in the primary surplus along with a smaller snowball effect and to a more limited extent stock-flow adjustments
Aggregate figures mask considerable variation in the evolution of debt-to-GDP ratios across Member States Although all Member Statesrsquo ratios in 2014 were higher than in 2008 in most cases the increase was not continuous but interrupted by reduction episodes notably in Greece (as a result of debt restructuring) The rise was continuous in 12 Member States Belgium Spain France Italy Cyprus the Netherlands Portugal Slovenia Finland Croatia Romania and the UK In five of these (Belgium Spain France Finland and Croatia) and in Greece Bulgaria and Poland debt ratios are expected to increase further in both 2015 and 2016 By contrast the debt ratios of five Member States are expected to remain on the downward trend initiated in recent years (Hungary in 2012 Germany and Ireland in 2013 Malta and Slovakia in 2014) Reductions are also expected for both 2015 and 2016 in Estonia Cyprus Portugal Denmark and Sweden In the remaining countries the debt ratio is projected to increase in one year and decline in the other Overall the largest reduction is expected in Ireland (-120 pp) followed by Cyprus (-95 pp) and the largest increase in Greece (211 pp)
Debt levels continue to vary widely across Member States The debt-to-GDP ratios of six Member States (Belgium Greece Spain Italy Cyprus and Portugal) are expected to exceed 100 in 2015 In Greece the ratio is expected to increase markedly to close to 200 by the end of 2016 while in Belgium Spain and Italy it should broadly stabilise and in Portugal and Cyprus it should decline In seven Member States (Ireland France Austria Slovenia Croatia Hungary and the UK) ratios are projected to remain well above 60 but below 100 (just below in the case of France) Debt in Germany Malta the Netherlands and Finland is expected to be between 60 and 70 of GDP by the end of 2016 with an increasing trend in the case of Finland In the remaining 11 Member States debt is expected to remain below the 60 of GDP threshold
Primary surpluses higher nominal growth and lower interest expenditure are set to have a
more favourable impact on debt developments than in previous years The snowball effect that pushed debt up in highly indebted Member States in recent years is expected to be eroded by lower interest payments the economic recovery and higher inflation expectations and may even turn negative in some countries It remains very large in Greece (143 pp in cumulated terms in 2015 and 2016) however although far below 2011-2012 levels In addition the primary surpluses projected for most euro area countries and Hungary are expected to help reduce debt ratios while primary deficits in Spain France the Netherlands Slovakia Finland and most non-euro area Member States are expected to weigh on debt dynamics Finally debt developments are expected to be affected by some stock-flow adjustment measures the largest mainly reflecting bank recapitalisation costs in Greece in 2015 privatisation proceeds in Cyprus in 2016 and a temporary change in the financing of public debt in Denmark in 2015
14 COMPOSITION OF THE ADJUSTMENT
Between 2011 and 2014 fiscal consolidation was driven mainly by revenue increases in the euro area but based on revenue increases and cuts in expenditure in non-euro area Member States on aggregate In the EU as a whole the revenue-to-GDP ratio increased until 2013 and stabilised at 452 in 2014 18 pp above its 2010 level (Table I14) At the same time the expenditure-to-GDP ratio was 17 pp lower in 2014 (482 ) than in 2010 In the euro area the rise in revenues to the peak of 2014 was slightly stronger by 25 pp while the expenditure ratio fell by 1 pp indicating that consolidation took place primarily on the revenue side
For 2015 and 2016 consolidation is expected to be driven by the expenditure side The decline in the expenditure ratio is expected to accelerate somewhat with cumulated drops of 16 pp in 2015-2016 in the EU and 14 pp in the euro area This is likely to be partially offset by a decline in the revenue ratio by 06 pp in both areas thus reversing the increasing trend of previous years
The reduction in the expenditure ratio in the euro area has been supported by a climate of low interest rates since the end of 2013 Sovereign bond yields in the euro area have fallen
Part I Current developments and prospects
15
sharply since the end of 2013 and reached historical lows in the first half of 2015 Despite some increase during the summer months yields still remain well below long-term averages As a result interest expenditure has also fallen from 29 of GDP in 2012 to 23 in 2015 and is expected to remain unchanged in 2016
Most of the decline in the revenue ratio appears to be of a structural nature while this is only partly the case on the expenditure side The drop in the structural revenue ratio is broadly identical to the change in nominal terms suggesting that the expected decline mainly reflects the impact of recent reforms in a number of Member States to lower the tax burden on labour income On the expenditure side however only 07 pp of the decline in the nominal expenditure ratio in the EU (04 pp in the euro area) is estimated to be structural This reflects the diverse nature of the main factors driving the expenditure ratio namely
the impact of the economic recovery on automatic stabilisers contained developments in public wages and lower interest expenditure On the other hand this reduction could be partly offset by additional budgetary costs associated with the arrival of a substantial number of asylum-seekers in some Member States
Despite some differences in magnitude the expenditure ratio is set to decline in a vast majority of Member States accompanied in most cases by a drop in the revenue ratio Projected cumulated changes in the revenue ratio in 2015 and 2016 range from a 68 pp decline in Denmark to a 12 pp increase in Estonia The expected changes in the expenditure ratio differ even more ranging from -103 pp in Cyprus to 17 pp in Germany Expenditures are however projected to decline as a ratio to GDP in all Member States except Estonia Greece Lithuania and Luxembourg In these four countries as well
Table I14 Government revenue and expenditures ( of GDP)
Source Commission services figures for 2015 and 2016 are from the Commissionrsquos autumn 2015 forecast
2011 2012 2013 2014 2015 2016 2011 2012 2013 2014 2015 2016BE 503 516 527 520 516 513 544 558 556 551 543 539DE 438 444 444 446 444 443 447 444 445 443 435 438EE 386 388 381 387 401 400 374 391 383 380 399 397IE 330 338 340 344 340 328 455 418 397 382 362 343EL 440 463 483 464 469 474 542 552 608 499 516 510ES 362 375 382 386 387 387 456 480 451 445 434 423FR 508 520 529 536 534 533 559 568 570 575 572 568IT 456 478 481 482 482 473 491 508 510 512 508 496
CY 368 361 365 404 396 391 425 419 414 493 403 390LV 356 361 359 356 349 346 390 369 368 371 364 357LT 335 330 329 341 346 345 425 361 356 348 357 358LU 438 447 440 438 436 439 433 446 433 424 436 434MT 383 389 400 419 423 404 409 425 426 440 440 416NL 427 432 440 439 426 418 470 471 464 462 447 433AT 483 489 496 500 502 497 508 511 509 527 521 512PT 426 429 451 445 449 442 500 485 499 517 479 471SI 434 444 453 448 448 434 500 486 603 498 477 458SK 364 360 384 389 399 374 405 401 410 416 427 398FI 533 540 550 549 549 554 544 561 576 583 581 581
EA-19 449 461 466 468 466 462 491 497 496 494 486 480BG 321 340 369 363 367 362 341 347 376 421 395 389CZ 402 405 413 406 410 404 429 445 426 426 429 418DK 548 552 558 584 525 517 568 588 571 569 558 541HR 410 417 425 426 431 432 488 471 478 482 480 479HU 443 463 470 474 471 442 497 486 495 499 494 463PL 388 389 384 388 391 388 436 426 424 421 419 416RO 337 333 330 335 354 314 391 365 352 349 366 341SE 505 507 510 501 499 501 505 517 524 518 514 513UK 392 384 392 382 384 386 469 468 449 439 428 416
EU-28 440 448 453 452 449 446 486 490 486 482 474 466
Revenue Expenditure
European Commission Public finances in EMU - 2015
16
as in Denmark and Romania the budget balance is expected to remain unchanged or to deteriorate in 2016 as compared with 2014 By contrast of the 22 Member States for which an improvement in the budget balance is foreseen 17 are expected to see both ratios decline (with the decline in expenditures exceeding that of revenues) while the other five (Spain Finland Croatia Sweden and the UK) are expected to combine a higher revenue ratio with a lower expenditure ratio
2 IMPLEMENTATION OF FISCAL SURVEILLANCE
17
The EU fiscal framework as laid down by the Stability and Growth Pact (SGP) aims at ensuring budgetary discipline through two main requirements First Member States are required by the Treaty to keep their general government deficit and debt positions not above the reference values of 3 and 60 of GDP respectively and to prompt their correction if these two criteria are temporarily not fulfilled (6) (7) Second they are required by the preventive arm of the SGP to achieve and maintain their medium-term budgetary objective (MTO) which corresponds to a cyclically-adjusted target for the budget balance net of one-offs and temporary measures (8) Country-specific MTOs are defined so as to secure the sustainability of public finances and allow the automatic stabilisers to operate without breaching the reference value for the deficit as defined in the Treaty
21 THE EXCESSIVE DEFICIT PROCEDURE
The Excessive Deficit Procedure (EDP) ensures that Member States correct their excessive deficit and debt positions measured against the reference values of 3 and 60 of GDP thus operationalising the requirements set in the Treaty (9)
(6) Article 126 TFEU lays down the Excessive Deficit
Procedure which is further specified in Council Regulation (EC) 146797 on speeding up and clarifying the implementation of the excessive deficit procedure amended in 2005 and 2011 which represents the corrective arm of the SGP Relevant legal texts and guidelines can be found at httpeceuropaeueconomy_financesgplegal_textsindex_enhtm
(7) In particular a Member State is not compliant with the debt criterion if its general government gross debt is greater than 60 of GDP and it is not sufficiently diminishing and approaching 60 of GDP at a satisfactory pace
(8) The preventive arm of the SGP is contained in Council Regulation (EC) 146697 on the strengthening of the surveillance of budgetary positions and the surveillance and coordination of economic policies which was amended in 2005 and 2011 Together with the procedure for the avoidance of excessive government deficit laid down in Article 126 TFEU further specified in Council Regulation (EC) 146797 in European Parliament and Council Regulation (EU) No 11752011 Council Regulation (EU) No 11772011 and Regulation (EU) No 11732011 on the effective enforcement of budgetary surveillance in the euro area form the SGP
(9) The concept of sufficiently diminishing and satisfactory pace is crucial in the assessment of compliance with the
This section focuses on the implementation of the EDP since the last Report on Public Finances was published in December 2014 The country-specific developments are summarised in Tables IA21-A23 in Annex I2 (10)
Currently nine Member States are in EDP two of which are under an economic adjustment programme (Cyprus and Greece)
211 Euro area Member States
While no new EDPs were opened in the course of 2015 the EDP was abrogated in the case of Malta and a new recommendation was issued to France Table I A21 shows the steps taken under the EDP for euro area countries
On 27 February 2015 on the basis of its 2015 winter forecast the Commission adopted Reports in accordance with Article 126(3) of the Treaty for Belgium Italy and Finland
In the case of Belgium the Report concluded that the estimated general government deficit of 32 of GDP in 2014 was above but close to 3 of GDP Moreover the estimated excess over the reference value which was notably due to methodological changes related to the introduction of ESA2010 and statistical clarifications could be qualified as exceptional in the meaning of the SGP and could in addition be considered as temporary On that basis the Report concluded that the deficit criterion of the Treaty was fulfilled Belgium was also projected to make insufficient progress
debt criterion for Member States whose general government gross debt is greater than 60 of GDP These requirements are specified in Regulation 146797 as being fulfilled if the differential [of the general government gross debt] with respect to the reference value has decreased over the previous three years at an average frac12th per year as a benchmark The Regulation then specified that the requirement under the debt criterion shall also be considered to be fulfilled if the budgetary forecasts of the Commission indicate that the required reduction in the differential will occur over the three-year period encompassing the two years following the final year for which data are available It further indicates that the influence of the cycle on the pace of debt reduction should be taken into account
(10) All the country-specific developments regarding the Excessive Deficit Procedure can be followed up at httpeceuropaeueconomy_financeeconomic_governancesgpcorrective_armindex_enhtm
European Commission Public finances in EMU - 2015
18
towards compliance with the debt reduction benchmark through the Minimum Linear Structural Adjustment (MLSA) during the transition period in 2014 and 2015 (11) The analysis presented in the Report suggested that following the assessment of all the relevant factors (12) the debt criterion should be considered as complied with at that stage
Similarly as regards Italy it appeared that based on both the Draft Budgetary Plan (DBP) for 2015 and the Commission 2015 winter forecast the required progress towards compliance with the debt reduction benchmark through the MLSA in the transitional period in 2014 and 2015 was neither planned nor foreseen to be fulfilled The analysis in the Report which took into consideration all the relevant factors (13) suggested that the debt criterion should be considered as complied with at that stage
Finally as for Finland on the basis of both the DBP for 2015 and the Commission 2015 winter forecast the general government gross debt was expected to stand above the reference value at 612 of GDP in 2015 The conclusions of the Report also suggested that the debt criterion should be considered as complied with at that stage owing to the fact that the plannedforecast excess of the general government gross debt over 60 of GDP in 2015 was fully explained by the countrys financial support to safeguard financial stability in the euro area (14)
(11) While the Draft Budgetary Plan of Belgium for 2015 did
not contain sufficient information to assess planned compliance with the Minimum Linear Structural Adjustment the Draft Budgetary Plan for 2015 targeted a recalculated change in the structural balance of 07 of GDP which exceeded the effort recommended by the Council in the Country-specific recommendations to Belgium of 2 June 2014 which was supposed to also ensure compliance with the Minimum Linear Structural Adjustment
(12) The set of relevant factors comprised (i) the unfavourable economic conditions which made the respect of the debt rule particularly demanding at that stage (ii) the expectation that compliance with the required adjustment towards the medium-term budgetary objective was broadly ensured and (iii) the expected implementation of ambitious growth-enhancing structural reforms in line with the authorities commitments which was expected to contribute to debt reduction in the mediumlong term
(13) Idem (14) The Report also took into consideration that the level of
general government gross debt in Finland had been influenced by (i) large purchases of financial assets by the
On 12 May 2015 on the basis of its 2015 spring forecast the Commission adopted a new Report for Finland in accordance with Article 126(3) of the Treaty which was triggered by the fact that the preliminary general government deficit had turned out above 3 of GDP at 32 of GDP in 2014 Moreover on the basis of the Stability Programme for 2016 submitted by the authorities on 2 April 2015 which was prepared under a no-policy-change assumption pending the formation of a new government the general government deficit was planned not to be below the reference value over the forecast horizon Overall the Report concluded that both the deficit and the debt criteria were not to be considered to be complied with
Following the 19 April 2015 elections the new incoming government announced fiscal policy measures to be implemented over 2016-2019 in its Strategic Programme On that basis the Commission published on 10 June 2015 an assessment of the announced measures and their budgetary impact thereby updating its initial assessment At the time of this assessment the Commission considered that the DBP for 2016 and the updated Stability Programme for 2016 to be submitted simultaneously would provide the opportunity to fully assess the fiscal policy measures envisaged by Finland in order to bring the general government deficit below 3 of GDP and to put the general government gross debt ratio on an appropriate downward path On that grounds and based on its 2015 autumn forecast the Commission therefore adopted on 16 November 2015 a new Report in accordance with Article 126(3) of the Treaty which indicated that the general government deficit was projected at 33 of GDP in 2015 but expected to fall below 3 of GDP in 2016 As a result the excess over the reference value could be considered as close and temporary while it could also be qualified as exceptional in the meaning of the SGP in 2014 but not in the period 2014-2016 For this reason the Report suggested that the deficit criterion was fulfilled Regarding the general government gross debt the Report confirmed that the planned breach of the debt criterion was still fully explained by Finlands financial support to safeguard financial
Social Security funds resulting in the accumulation of asses in parallel to the increase of debt and (ii) the effects of the countrys projected cyclical position at that stage
Part I Current developments and prospects
19
stability in the euro area in 2015 while this conclusion appeared not to hold in 2016 The Report which considered all the relevant factors and in particular the expectation that compliance with the required adjustment towards the MTO was then broadly ensured suggested that the debt criterion should also be considered as complied with at that stage
As regards France on 10 March 2015 following a Recommendation issued by the Commission in end-February according to which the available evidence minus in particular its 2015 autumn forecast minus did not allow to conclude on no effective action the Council adopted a revised Recommendation with a view to bringing an end to the excessive deficit thereby setting 2017 as the new deadline for correction In addition the Council established the deadline of 10 June 2015 for France to take effective action to comply with the Recommendation and to report in detail on the consolidation strategy that was envisaged to achieve the targets therein On 1 July 2015 based on a Report submitted by the authorities the Commission issued a Communication which concluded that the procedure was deemed to be put in abeyance as the targets for the general government deficit were expected to be fulfilled in both 2015 and 2016 even though the fiscal effort according to all metrics was projected to fall short of the recommended in those years However the Commission considered that the budgetary strategy pursued by France which relied primarily on the improving cyclical conditions and a continuation of the low-interest environment would need to be further reinforced in order to ensure a timely and durable correction of the excessive deficit
Finally concerning Malta on 19 June 2015 following a Recommendation issued by the Commission in mid-May the Council adopted a Decision abrogating the EDP as the correction of the excessive deficit had been achieved in a durable manner and the debt ratio fulfilled the forward-looking element of the debt benchmark
212 Non-euro area Member States
While no new EDPs were opened in the course of 2015 the EDP was abrogated in the case of Poland and a new recommendation was issued to the
United Kingdom Table IA22 shows the steps taken under the EDP for non-euro area countries
On 19 June 2015 following a Recommendation issued by the Commission in mid-May the Council adopted a Decision abrogating the EDP of Poland Even though its preliminary general government deficit amounted to 32 of GDP in 2014 above the reference value of the Treaty Poland was eligible to the specific provisions regarding systemic pension reforms (15) Although Poland had in December 2013 reversed a pension reform introduced in 1999 the net costs of this reform continued until the end of July 2014 (16) and were estimated at 04 of GDP which was sufficient to explain the excess over the reference value in 2014 Moreover on the basis of the Commission 2015 spring forecast the correction of the excessive deficit was deemed to be durable Also on 19 June 2015 following a Recommendation by the Commission issued in mid-May the Council adopted a Decision establishing that the United Kingdom had not taken effective action in response to the Council Recommendation of 2 December 2009 in the light of a general government deficit of 52 of GDP in 2014-15 notified to Eurostat and non-adherence to the recommended average fiscal effort of 1frac34 of GDP over the EDP period Therefore on that same date the Council adopted a new Recommendation
(15) The provisions regarding systemic pension reforms are laid
down in Article 2(7) of Regulation (EC) 146797 according to which [in] the case of Member States where the excess of the deficit over the reference value reflects the implementation of a pension reform introducing a multi-pillar system that includes a mandatory fully funded pillar the Council and the Commission shall also consider the cost of the reform when assessing developments of deficit figures in excessive deficit procedures as long as the deficit does not significantly exceed a level that can be considered close to the reference value and the debt ratio does not exceed the reference value provided that overall fiscal sustainability is maintained
(16) According to the specifications on the implementation of the Stability and Growth Pact and guidelines on the format and content of Stability and Convergence Programmes of 3 September 2012 [the] net cost of the reform is measured as its direct impact on the general government deficit This impact stems from the fact that revenue which used to be recorded as government revenue is diverted to a pension fund which is fully-funded and classified in a sector other than general government and that some pensions and other social benefits which used to be government expenditure will be after the reform paid by the pension scheme Thus net costs do not include interest expenditure that is linked to the higher accumulation of debt due to forgone social contributions or other revenues
European Commission Public finances in EMU - 2015
20
defining 2016-17 as the new deadline for correction of the excessive deficit In addition the Council set the deadline of 15 October 2015 for the United Kingdom to take effective action and report in detail the consolidation strategy that was envisaged to achieve the targets Subsequently on the basis of a report submitted by the authorities and its 2015 autumn forecast the Commission adopted a Communication on 16 November 2015 according to which the procedure for the United Kingdom could be put in abeyance since the targets for both the general government deficit and the underlying improvements in the structural balance were projected to be fulfilled over the EDP period
On 16 November 2015 on the basis of its 2015 autumn forecast the Commission also adopted Reports in accordance with Article 126(3) of the Treaty for Bulgaria and Denmark
In the case of Bulgaria the provisional general government deficit reached 58 of GDP in 2014 above and not close to 3 of GDP The excess over the reference value was assessed as temporary and could be qualified as exceptional in the meaning of the SGP as it was largely driven by the sizeable support to the financial sector minus amounting to about 3 of GDP Therefore the Report suggested that the deficit criterion could be considered as complied with
As for Denmark the general government deficit was planned to reach 33 of GDP in 2015 above but close to 3 of GDP The excess over the reference value was considered as temporary as the general government deficit was projected to return to below 3 of GDP as of 2016 and exceptional in the meaning of the SGP given that it resulted from extraordinary and unexpected losses in tax revenue in the period 2013-2015 related to technical errors in an automatic tax collection system On that basis the Report suggested that the deficit criterion was fulfilled
22 THE EUROPEAN SEMESTER AND THE FISCAL COUNTRY -SPECIFIC RECOMMENDATIONS
Member States submitted the 2015 Stability or Convergence Programmes (SCPs) in April this
year thereby bringing their medium-term fiscal plans up to date (17)
In their 2015 programmes Member States projected growth to strengthen in 2015 and 2016 with SCPs expecting positive real growth in 2015 in all Member States and with an output gap projected to shrink in 2015 and 2016 in both the euro area and the EU These projections are in line with the Commission 2015 autumn forecast ndash with the exception of Greece ndash which also confirms the relative expansion of internal demand a positive indication for some tax-richness of growth
All Member States planned a deficit below the 3 threshold by the end of the programme period while the general government deficit both at the euro area level and the EU was expected to remain below 3 of GDP in 2015 Moreover debt was set to start decreasing after a peak in 2015 driven by a reversed snowball effect and the achievement of primary surpluses The beginning in the decrease of debt ratios in 2015 is confirmed by the Commission 2015 autumn forecast as presented in Chapter I1
A significant slowdown in the pace of fiscal consolidation was already planned in the SCPs with the cumulative improvement in the structural balance over the programme horizon amounting to 04 of GDP in the euro area and 11 of GDP in the EU Overall for 2016 some moderate fiscal consolidation was planned in the 2015 programmes However in the euro area specifically this was no longer the case on the basis of both the SCPs and the DBPs presented in October (see Section I23 below) Fiscal consolidation was planned to resume at a moderate pace in the period 2017-2018 at around one quarter of GDP per year in both the euro area and the EU
Overall the 2015 SCPs planned to reduce revenues by about 12 percentage points of GDP over the programmes period and to reduce expenditures by around 2 percentage points of GDP in both areas with the composition public finances being slightly less biased against public investment than in the past However a substantial part of the expenditure effort projected for both the euro area
(17) For an overview of Member States plans see European
Commission (2015b)
Part I Current developments and prospects
21
and the EU was expected to stem from reduced interest payments
The broad picture of structural adjustment at the aggregate level masks considerable differences across Member States with the programmes of several individual Member States not at their country-specific MTO falling short of the requirements under the SG
On 14 July 2015 the Council adopted Country-Specific Recommendations (CSRs) and Opinions on economic employment and fiscal policies planned by Member States based on the information provided in the 2015 SCPs (and in the National Reform Programmes) thereby formally concluding the annual policy monitoring process entailed by the 2015 European Semester (18) The 2015 CSRs were addressed to 26 of the EUs 28 Member States and to the euro area as a whole To avoid duplication there were no CSRs for Greece and Cyprus as these were both still subject to economic adjustment programmes
In the area of fiscal policy Member States were invited to comply with the requirements of the SGP The Member States in EDP were recommended to ensure the timely and durable correction of their excessive deficits by fully implementing and where necessary reinforcing the planned budgetary strategies The Member States in the preventive arm of the SGP were recommended to ensure sufficient progress towards or stay at their country-specific MTOs with each Recommendation providing guidance on the specific structural adjustment to be delivered in 2015-2016 Where available Member States were also invited to use windfall gains to make further progress towards putting the general government debt-to-GDP ratios on an appropriate downward path Some general guidelines to achieve these goals included increasing the efficiency and control of public spending enhancing the efficiency of the tax system and broadening the tax base increasing the efficiency of tax compliance revising tax expenditures and cadastral values improving the coordination across sub-sectors of general government and strengthening medium-term budgetary frameworks
(18) An overview of the 2015 European Semester can be found
athttpeceuropaeueurope2020making-it-happencountry-specific-recommendations
All in all the 2015 CSRs aimed at adapting public finances to make them more supportive to growth while ensuring that Member States pursue responsible fiscal policies in line with the requirements of the SGP
Table IA24 provides an overview of the Country-specific Opinions and Recommendations in the area of fiscal policy that the Council issued in July
23 CLOSING THE FISCAL SURVEILLANCE CYCLE IN THE EURO AREA DRAFT BUDGETARY PLANS
This autumn marks the third time that the Commission carried out an assessment of the DBPs for the forthcoming year This monitoring procedure was introduced by the Two-Pact with the aim of enhancing the surveillance and coordination of budgetary and economic policies within the euro area
Every year most euro area Member States are thereby expected to submit their DBPs to the Commission and to the Eurogroup by the statutory deadline of 15 October 2015 (19) (20) However given that economic adjustment programmes per se already imply close fiscal monitoring Greece and Cyprus were exempted from submitting DBPs for 2016 (21) All the remaining euro area Member States complied with the requirement with the exception of Portugal which did not submit a plan as prescribed by the legislation
The overall picture emerging from the analysis of the sixteen euro area DBPs for 2016 is mixed
(19) In respect of the deadline and requirements laid down by
Article 6 of Regulation (EU) 4732013 (20) In particular in view of forthcoming general elections
Spain submitted its Draft Budgetary Plan for 2016 on 11 September 2015 significantly ahead of the deadline of 15 October Therefore to underpin its assessment the Commission prepared an ad-hoc forecast with a cut-off date of 29 September 2015
(21) Regulation (EU) 4722013 put forward the legal basis ensuring consistency between the fiscal surveillance framework laid down in the Stability and Growth Pact and the programme policy conditionality for euro area Member States under an economic adjustment programme On that basis during the programme the monitoring of compliance with the Stability and Growth Pact takes place within the regular programme surveillance provided for by Article 7(4) of the Regulation and is based on the concerned Member States complying with the specific policy requirements contained in its programme
European Commission Public finances in EMU - 2015
22
in line with Chapter I1 the plans confirm that the economic recovery is progressing although subject to a number of downside risks with GDP projections broadly in line with those of the spring and a continuing decrease in the general government deficit in the euro area to 17 of GDP in 2016 This is reflected in a planned neutral fiscal stance again in line with Member States projections in the spring
On the basis of the DBPs themselves the Commission did not identify any case of particularly serious non-compliance with the provisions of the SGP (22) Notwithstanding there were some DBPs according to which the planned fiscal efforts is clearly insufficient in view of the existing imbalances That is why the assessments of the DBPs flagged different degrees of risk and requested where needed appropriate action by the Member States in order to ensure compliance with the SGP
In order to provide benchmarks for the Opinions of the Commission DBPs were allocated to three categories depending on the strength of Member States compliance with their obligations vis-agrave-vis the SGP (i) compliant (ii) broadly compliant and (iii) at risk of non-compliance These categories have a different meaning depending on whether the concerned Member State is under the preventive or the corrective arm of the SGP
Five DBPs were found to be compliant with the provisions of the SGP These were submitted (22) The following non-exhaustive list of situations in which
particularly serious non-compliance could be found is presented in the specifications on the implementation of the Two-Pact and guidelines on the format and content of draft budgetary plans economic partnership programmes and debt issuance reports (i) if an obvious breach of the criteria laid down in Article 126(2) of the TFEU would follow from the implementation of the DBP (ii) for Member States in the preventive arm of the SGP if the fiscal effort envisaged in the DBP falls clearly short of the fiscal effort recommended by the Council in accordance with existing Council recommendation issued in accordance with Article 121(4) of the TFEU (iii) for Member States in the corrective arm of the SGP if the fiscal effort envisaged in the DBP ie the forecast change in the structural balance falls clearly short of the recommended fiscal effort by the Council in accordance with Article 126(7) or 126(9) of the TFEU (iv) where the implementation of the initial budgetary plan would put at risk the financial stability of the Member State concerned or risk jeopardizing the proper functioning of the economic and monetary union
by the following Member States under the preventive arm minus Germany Estonia Luxembourg the Netherlands and Slovakia For these Member States there was no need to adapt the plans within the national budgetary procedure to ensure compliance with the rules of the SGP
By the same token concerning the DBPs submitted by the remaining countries the Commission considered that the planned fiscal effort risked falling short of what is required by the SGP As a result the Commission invited the authorities of the remaining eleven countries to take the necessary measures within their national budgetary processes in order to ensure that the 2016 budgets wold be compliant with the SGP
In further detail the DBPs of seven countries were found to be broadly compliant with the SGP This concerned minus Ireland Slovenia and France minus currently under the corrective arm of the SGP minus and Belgium Latvia Malta and Finland minus under the preventive arm In the case of France while the targets for the general government deficit in years 2015 and 2016 were projected to be met on the basis of the Commission 2015 autumn forecast the fiscal effort was projected to fall significantly short of the recommended level according to all metrics For the remaining Member States the Commission considered that the plans might result in some deviation from the required adjustment path towards the respective country-specific MTOs in 2016
Finally the DBPs of four countries were found to be at risk of non-compliance with rules of the SGP This was the case of Spain minus under the corrective arm of the SGPminus as well as of Italy Austria and Lithuania minus under the preventive arm Spain was not expected to ensure compliance with the targets set in the Council Recommendation of 21 June 2013 for the general government deficit and the change in the structural balance in years 2015 and 2016 (23) Similarly the
(23) In light of the compliance risks and the fact that the Draft
Budgetary Plan did not include up-to-date and fully specified measures for regional governments the national authorities were also invited by the Commission to submit an updated plan including fully-specified regional measures as soon as possible The new Draft Budgetary Plan should take into account the Commission Opinion of 12 October 2015 in order to fully comply with the Stability and Growth Pact
Part I Current developments and prospects
23
DBPs of Italy (24) Austria (25) and Lithuania might result in a significant deviation from the required adjustment path towards the respective country-specific MTOs
Tables I21a and I21b provide overviews of individual Commission Opinions on the DBPs of Member States currently under the preventive and corrective arm of the SGP respectively
(24) In its Opinion the Commission conveyed its intention to
continue to closely monitor Italys compliance with the obligations under the Stability and Growth Pact notably in connection with the assessment of the next Stability Programme In the context of the overall assessment of a possible deviation from the adjustment path towards the Medium-term Budgetary Objective the Commission will take into account the above considerations on Italys possible eligibility for flexibility under the Stability and Growth Pact Particular attention will be paid to whether a deviation from the adjustment path is being effectively used for the purposes of increasing investments to the existence of credible plans for the resumption of the adjustment path towards the Medium-term Budgetary Objective and to progress with the structural reform agenda taking into account the Council Recommendations
(25) However if the current estimate of the increase in refugee-related expenditure were excluded the assessment would point to a risk of some deviation from the Medium-term Budgetary Objective
European Commission Public finances in EMU - 2015
24
Table I21a Overview of individual Commission Opinions on the DBPs ndash Member States currently under the preventive arm of the SGP
Source The Report in accordance Article 126(3) of the TFEU of 27 February 2015 concluded that the debt criterion should be considered as complied with at that time In case the current estimate of the budgetary impact of the exceptional inflow of refugees would be excluded from the assessment the projected deviation from the recommended adjustment path would no longer be significant As the notified deficit for 2014 and the planned deficit and debt for 2015 were above the Treaty reference values the Commission issued a Report in accordance with Article 126(3) of the TFEU on 16 November 2015 concluding that both the deficit and the debt criteria should be considered as complied with
Part I Current developments and prospects
25
Table I21b Overview of individual Commission opinions on the DBPs ndash Member States currently under the corrective arm of the SGP
Source Commission services The country is currently under the corrective arm but could move to the preventive arm from 2016 if a timely and sustainable correction is achieved The Commission adopted an Opinion on Spains DBP on 12 October Portugal did not submit a DBP for 2016 by 15 October
ANNEX 1 ASSUMPTIONS UNDERLYING THE ASSESSMENT OF FISCAL STANCE
26
Gap to the debt-
stabilizing primary balance
Cost of delaying
adjustment
BE 34 -05 04 32 02DE -13 -26 -02 07 08EE -36 -04 -04 -33 05IE 39 -09 05 27 16EL 88 00 13 84 -09ES 16 -01 02 26 -11FR 38 08 05 24 00IT 24 -21 03 46 -03
CY 01 -20 00 28 -07LV -14 06 -02 -14 -04LT 03 -01 00 -10 13LU -32 -14 -04 -28 14MT 04 -10 00 04 09NL -07 -05 -01 06 -07AT 02 -20 00 18 04PT 35 -17 05 42 05SI 26 01 04 15 06SK -05 00 -01 -05 01FI 27 05 04 02 17
EA 14 -11 02 22 01
S1 (2015
scenario)
Due to
Initial budgetary position
Debt requirement
Ageing costs
This annex provides more detailed information on the methodology underlying the assessment of the fiscal stance in the euro area as a whole and in individual euro area Member States that is presented in Chapter I1
The calculations are based on the Commissions autumn 2015 forecast
The projected fiscal stance is assessed against both long-term sustainability needs and short-term macroeconomic stabilisation needs Long-term sustainability needs are reflected in the fiscal adjustment required to put or maintain public debt on a sustainable path while macroeconomic stabilisation is defined as the need to ensure that the output gap closes at an appropriate pace Simple and transparent calculations are used to estimate illustrative changes in the structural primary balance (SPB) implied by each of these two types of needs
A11 CALCULATION OF THE INDICATIVE STRUCTURAL PRIMARY EFFORT IMPLIED BY SUSTAINABILITY NEEDS
Long-term sustainability requires that public debt is put and maintained on a sustainable path taking into account the current level of debt and projected future expenditures related to population ageing This is measured by the S1 indicator under the so-called 2015 scenario which indicates what cumulative change in the SPB over the period 2016-2020 would be needed to bring debt to 60 of GDP by 2030 based on the Commission forecast and taking the 2015 structural primary balance as a baseline Table IA11 reports the value of S1 under this scenario for all the euro area Member States and for the euro area as a whole as well as the breakdown of S1 as background information
To compute the indicative the change in the SPB implied by the sustainability needs of the various Member States a slightly frontloaded adjustment is assumed with 25 of this total effort (therefore S1 divided by four) to be achieved in 2016 This is reported under Sustainability needs in Table I A12
Table IA11 Total fiscal adjustment needed in 2016-2020 according to the S1 indicator (as of GDP)
Source Commission services
A12 CALCULATION OF THE INDICATIVE STRUCTURAL PRIMARY EFFORT IMPLIED BY STABILISATION NEEDS
Macroeconomic stabilisation is defined as the need to ensure that the output gap closes at an appropriate pace in the short to medium term For this purpose a reduction of the output gap by 25 in one year is considered in line with the assumption that length of an average half cycle is about four years A more ambitious reduction by 50 is also envisaged to provide some sensitivity analysis of fiscal policy with respect to stabilisation targets This is also motivated by the fact that in the euro area as a whole the output gap has been negative since 2009
The change in the SPB implied by these stabilisation needs ndash ie the one that would be needed to reduce the output gap by a certain proportion compared to its level of 2015 ndash is equal to the change in the SPB projected in the Commission forecast for 2016 (ΔSPBbaseline) minus the difference between the considered change in the output gap (ΔOG) and the projected change in the output gap (ΔOGbaseline) divided by the fiscal multiplier micro
Part I Current developments and prospects
27
SUSTAINABILITY NEEDS
EA 02 -04 03 -02 -18 07 06LU 03 -02 -08 02 -15 04 06DE -04 -05 -03 -03 -04 01 -02NL 04 -01 -02 -04 -16 10 07SK 00 -03 -01 00 -12 03 03CY 14 03 00 -04 -36 24 21AT -02 -06 01 -05 -12 05 01ES 12 00 04 -03 -39 22 19IT 02 -07 06 -07 -29 14 09SI 13 11 06 02 -05 11 12FI 00 -07 07 02 -25 05 07BE 00 -02 08 03 -09 01 03PT -03 -10 09 -09 -23 11 04FR 02 -03 09 04 -18 03 06EL -06 -31 22 06 -79 10 15EE -01 00 -09 -01 05 -01 -02LV 10 15 -03 02 17 02 04LT 03 04 01 -03 04 03 01MT 07 09 01 02 06 02 04IE 11 15 10 06 12 01 06
STABILISATION NEEDSChange in the SPB consistent
with a reduction of
the OG by 25
Change in the SPB consistent
with a reduction of
the OG by 50
Change in the SPB implied by the
sustainability needs
COMMISSION FORECAST
Change in the SPB in
2016(ΔSPB baseline )
OG in 2015ΔOG in 2016(ΔOG baseline )
Recalculated ΔOG in 2016 with ΔSPB=0
(ΔOGdeg )
ΔSPB = ΔSPB baseline ndash (ΔOG - ΔOGbaseline)micro
where micro is assumed to be equal to 08 which seems reasonable in the current environment ΔSPBbaseline and ΔOGbaseline are reported in Table IA12 under Commission forecast Two measures of ΔSPB corresponding to reductions by 25 and 50 are reported in the same table under Stabilisation needs
A13 AN ALTERNATIVE TARGET FOR STABILISATION NEEDS
An alternative way to envisage stabilisation needs is to compute the change in the SPB that would be needed to further reduce the output gap (by eg 25) in addition to the projected change in the output gap if there were no fiscal effort Indeed given that macroeconomic policy instruments are currently constrained with nominal interest rates close to the zero limit in a very low inflation
environment this context places further emphasis on the importance of fiscal policy to stabilise the economy
The first step is to correct the Commission forecast for the impact of the projected fiscal stance This requires calculating the change in the output gap under a zero-fiscal-effort scenario ndash ie assuming no change in the SPB ndash and given a certain value of the fiscal multiplier All the other assumptions in the forecast remain however unchanged
Concretely this is done as follows taking the example of the euro area The change in the output gap that is projected in the baseline scenario of the Commission forecast (ΔOGbaseline = 07 of GDP in 2016) already includes the impact of the projected change in the SPB (ΔSPBbaseline = -02 of GDP ie a negative effort which has a positive impact on GDP) To correct for the impact of the fiscal stance we add back to the projected change in the output gap the change in the SPB multiplied
Table IA12 Change in the SPB implied by stabilisation and sustainability needs and in the Commission forecast (as of GDP)
Source Commission services Note For consistency the Member States are listed in the same order as in Graph I14 of Chapter I1 ie grouped according to the sign of their output gap in 2015 and then sorted by increasing sustainability needs
European Commission Public finances in EMU - 2015
28
ΔSPBBE -02DE -02EE 01IE 06EL -20ES -06FR -04IT -06CY -05LV 06LT 02LU -03MT 03NL -03AT -03PT -06SI 02SK -03FI -06EA-19 -04
by the fiscal multiplier micro We thus calculate the change in the output gap that would result from no change in the SPB all other assumptions remaining unchanged
ΔOGdeg = ΔOGbaseline + ΔSPBbaseline micro
Here ΔOGdeg = 06 corresponding to an output gap improving from -18 of GDP in 2015 to -12 in 2016 ΔOGdeg is reported for all Member States in Table AI2 under Commission forecast
The second step is to compute the change in the SPB as defined under the alternative stabilisation scenario For the euro area this scenario consists in reducing the output gap by an additional 25 compared to -12 of GDP ie to -09 of GDP The corresponding change in the SPB is equal to the output gap in 2016 assuming no fiscal effort (ie the output gap in 2015 OG2015 plus the change in the output gap assuming no fiscal effort ΔOGdeg) divided by the fiscal multiplier micro and multiplied by the additional correction considered ie 25
ΔSPB = 025 (OG2015 + ΔOGdeg)micro
This is found to require a fiscal loosening by 04 of GDP in terms of change in the SPB for the euro area as a whole The computations for all euro area Member States are reported in Table IA13
Table IA13 Change in the SPB implied by an alternative computation of stabilisation needs (as of GDP)
Source Commission services Note ΔSPB is the change in the SPB consistent with a further reduction of the output gap in 2016 by 25 in addition to the implicit change in the output gap assuming zero fiscal effort as recalculated on the basis of the Commissions autumn 2015 forecast
AN
NEX 2 O
VERV
IEW O
F EDP STEPS A
ND
CO
UNTRY-SPEC
IFIC
FISCA
L RECO
MM
END
ATIO
NS
29
Table IA
21 O
verview E
DP
steps - Eu
ro area Mem
ber S
tates
Source C
omm
ission services
p
Treaty Art
IE FR ES LV MT LT BE DE IT NL AT PT SI SK CY FI MT
Commission adopts EDP-report = start of the procedure 126(3) 18022009 18022009 18022009 18022009 13052009 13052009 07102009 07102009 07102009 07102009 07102009 07102009 07102009 07102009 12052010 12052010 21052013Economic and Financial Committee adopts opinion 126(4) 27022009 27022009 27022009 27022009 29052009 29052009 27102009 27102009 27102009 27102009 27102009 27102009 27102009 27102009 27052010 27052010 21062013Commission adopts opinion on existence of excessive deficit 126(5) recommendation for Council decision on existence of excessive deficit 126(6) recommendation for Council recommendation to end this situation 126(7)Council adopts decision on existence of excessive deficit 126(6) recommendation to end this situation 126(7) deadline for correction of excessive deficit 2013 2012 2012 2012 2010 2011 2012 2013 2012 2013 2013 2013 2013 2013 2012 2011 2014
Commission adopts communication on action taken 27012010 15062010 15062010 15062010 15062010 15062010 15062010 15062010 15062010 27012011 27012011 15112013Commission adopts recommendation for NEW Council recommendation to end situation of excessive deficit
126(7)11112009 11112009 11112009 27012010 27012010 29052013 27092012
Council adopts recommendation for NEW Council recommendation to end situation of excessive deficit
126(7)02122009 02122009 02122009 16022010 16022010 21062013 09102012
new deadline for correction of excessive deficit 2014 2013 2013 2011 2012 2014 2014
Commission adopts communication on action taken 15062010 15062010 15062010 06012011 21092010 11012012 15112013 11012012Commission adopts recommendation for Council decision establishing inadequate action
126(8)29052013
Council adopts decision establishing inadequate action 126(8) 21062013Commission adopts recommendation for a Council decision to give notice 126(9) 29052013Council adopts decision to give notice 126(9) 21062013Commission adopts recommendation for NEW Council recommendation to end situation of excessive deficit
126(7)03122010 29052013 06072012 29052013 29052013 07052013
Council adopts recommendation for NEW Council recommendation to end situation of excessive deficit
126(7)07122010 21062013 10072012 21062013 21062013 16052013
new deadline for correction of excessive deficit 2015 2015 2014 2013 2015 2015 2016
Commission adopts communication on action taken 24082011 15112013 14112012 15112013 15112013 06092013Commission adopts recommendation for NEW Council recommendation to end situation of excessive deficit
126(7)27022015 29052013
Council adopts recommendation for NEW Council recommendation to end situation of excessive deficit
126(7)10032015 21062013
new deadline for correction of excessive deficit 2017 2016
Commission adopts communication on action taken 01072015 15112013
Commission adopts recommendation for Council decision abrogating existence of excessive deficit
126(12) 29052013 14112012 29052013 02062014 30052012 29052013 02062014 02062014 02062014 29062011 12052015
Council adopts decision abrogating existence of excessive deficit 126(12) 21062013 04122012 21062013 20062014 22062012 21062013 20062014 20062014 20062014 12072011 19062015
24062009
07072009 02122009 1307201007072009 02122009 02122009 02122009 13072010
29052013
21062013
15062010 1506201011112009
02122009 02122009 02122009 02122009
11112009 11112009 11112009 11112009 11112009
Steps in EDP procedure
Follow-up
Member State
02072009
07072009
24062009 11112009 1111200924032009
27042009
Abrogation
27042009
Starting phase
24032009
27042009
24032009
European Commission Public finances in EMU - 2015
30
Treaty Art
HU UK PL RO CZ BG DK HR
Commission adopts EDP-report = start of the procedure 126(3) 12052004 11062008 13052009 13052009 07102009 12052010 12052010 15112013Economic and Financial Committee adopts opinion 126(4) 24052004 25062008 29052009 29052009 27102009 27052010 27052010 29112013Commission adopts opinion on existence of excessive deficit 126(5) recommendation for Council decision on existence of excessive deficit 126(6)recommendation for Council recommendation to end this situation 126(7)Council adopts decision on existence of excessive deficit 126(6) recommendation to end this situation 126(7) deadline for correction of excessive deficit
2008 fin year 200910 2012 2011 2013 2011 2013 2016
Commission adopts communication on action taken 03022010 15062010 27012011 27012011 02062014Commission adopts recommendations for Council decision establishing inadequate action
126(8)22122004 24032009
Council adopts decision establishing inadequate action 126(8) 18012005 27042009Commission adopts recommendation for NEW Council recommendation to end excessive deficit situation
126(7)16022005 24032009 08022010
Council adopts NEW recommendation to end excessive deficit situation 126(7) 08032005 27042009 16022010 new deadline for correction of excessive deficit 2008 fin year
201314 2012
Commission adopts communication on action taken 13072005 11012012 21092010Commission adopts recommendations for Council decision establishing inadequate action
126(8)20102005
Council adopts decision establishing inadequate action 126(8) 08112005Commission adopts recommendation for NEW Council recommendation to end excessive deficit situation
126(7)26092006 11112009
Council adopts NEW recommendation to end excessive deficit situation 126(7) 10102006 02122009 new deadline for correction of excessive deficit 2009 fin year
201415Commission adopts communication on action taken 13062007 06072010Commission adopts recommendations for Council decision establishing inadequate action
126(8)12052015
Council adopts decision establishing inadequate action 126(8) 19062015Commission adopts recommendation for NEW Council recommendation to end excessive deficit situation
126(7)24062009 12052015 29052013
Council adopts NEW recommendation to end excessive deficit situation 126(7) 07072009 19062015 21062013 new deadline for correction of excessive deficit 2011 fin year
201617 2014
Commission adopts communication on action taken 27012010 16112015Commission adopts recommendations for Council decision establishing inadequate action
126(8)11012012 15112013
Council adopts decision establishing inadequate action 126(8) 24012012 10122013Commission adopts recommendation for NEW Council recommendation to end excessive deficit situation
126(7)06032012 15112013
Council adopts NEW recommendation to end excessive deficit situation 126(7) 13032012 10122013 new deadline for correction of excessive deficit 2012 2015
Commission adopts communication on action taken 30052012 02062014
Commission adopts recommendation for Council decision abrogating existence of excessive deficit 126(12)
29052013 12052015 29052013 02062014 30052012 02062014
Council adopts decision abrogating existence of excessive deficit 126(12) 21062013 19062015 21062013 20062014 22062012 20062014
Abrogation
Steps in EDP procedure
Starting phase
Follow-up
0207200824062004 24062009 11112009 06072010
Member State
24062009
21012014
15062010 10122013
05072004 08072008 07072009 07072009 02122009 13072010 13072010
Table IA22 Overview EDP steps - Non-euro area Member States
Source Commission services
Part I Current developments and prospects
31
Treaty Art
Greece
Commission adopts EDP-report = start of the procedure 126(3) 18022009Economic and Financial Committee adopts opinion 126(4) 27022009Commission adopts opinion on existence of excessive deficit 126(5) recommendation for Council decision on existence of excessive deficit 126(6) recommendation for Council recommendation to end this situation 126(7)Council adopts decision on existence of excessive deficit 126(6) recommendation to end this situation 126(7) deadline for correction of excessive deficit 2010
Commission adopts recommendations for Council decision establishing inadequate action
126(8) 11112009
Council adopts decision establishing inadequate action 126(8) 02122009Commission adopts Council recommendation for decision to give notice 126(9) 03022010Council decision to give notice 126(9) 16022010 new deadline for correction of the excessive deficit 2012
Commission adopts communication on action taken 09032010Council adopts conclusions thereon 16032010Commission adopts recommendation for NEW Council decision to give notice 126(9) 04052010Council decision to give notice 126(9) 10052010 new deadline for correction of the excessive deficit 2014
Commission adopts communication on action taken 19082010Commission adopts recommendation for Council decision amending the Council decision to give notice 126(9) 19082010Council decision amending the Council decision to give notice 126(9) 07092010
Commission adopts communication on action taken 09122010Commission adopts recommendation for Council decision amending the Council decision to give notice 126(9) 09122010Council decision amending the Council decision to give notice 126(9) 20122010
Commission adopts communication on action taken 24022011Commission adopts recommendation for Council decision amending the Council decision to give notice 126(9) 24022011Council decision amending the Council decision to give notice 126(9) 07032011
Commission adopts communication on action taken 01072011Commission adopts recommendation for Council decision amending the Council decision to give notice 126(9) 05072011Council decision amending the Council decision to give notice 126(9) 12072011
Commission adopts communication on action taken 26102011Commission adopts recommendation for Council decision amending the Council decision to give notice 126(9) 26102011Council decision amending the Council decision to give notice 126(9) 08112011
Commission adopts communication on action taken 09032012Commission adopts recommendation for Council decision amending the Council decision to give notice 126(9) 09032012Council decision amending the Council decision to give notice 126(9) 13032012
Commission adopts communication on action taken 30112012Commission adopts recommendation for Council decision amending the Council decision to give notice 126(9) 30112012Council decision amending the Council decision to give notice 126(9) 04122012 new deadline for correction of the excessive deficit 2016
Follow-up - Second Adjustment Programme
Follow-up - 1st review
Follow-up
Follow-up - Second Adjustment Programme
24032009
27042009
Steps in EDP procedure
Starting phase
Follow-up - 5th review
Follow-up - 2nd review
Follow-up - 3rd review
Follow-up - 4th review
Table IA23 Greece
Source Commission services
European Commission Public finances in EMU - 2015
32
Table IA24 Overview of Council Country-Specific Recommendations relating to fiscal policy
(Continued on the next page)
Part I Current developments and prospects
33
Table (continued)
(Continued on the next page)
European Commission Public finances in EMU - 2015
34
Table (continued)
Source Commission services
Part II Recent developments in fiscal surveillance
1 INTRODUCTION
36
Member States that exit the Excessive Deficit Procedure automatically fall under the lsquopreventive armrsquo of the Stability and Growth Pact (SGP) which requires a convergence towards a sound Medium-Term budgetary Objective (MTO) in order to secure long-term sustainability of public finances As shown in Part I a majority of Member States have reduced their government deficit below the 3 threshold and moved to the preventive arm of the SGP in the recent years The preventive arm aims at making use of periods when the economy is strong to improve sustainability and bring government finances to a situation in which automatic stabilisers have the room to fully play their role without entailing a breach of the 3 threshold In order to secure this objective Member States have to improve their structural budget to attain the lsquomedium-term budgetary objectiversquo or MTO In addition since the reform of the Stability and Growth Pact in 2011 Member States have to implement the Treaty requirement that government debt in excess of 60 of GDP must be reduced
Subsequent to the 2011 reform the Commission published a Communication on flexibility within the SGP in January 2015 (26) In this Communication the Commission provided an interpretation on the degree of flexibility in the existing rules of the preventive arm of the SGP Firstly the Commission decided that the preventive arm of the SGP needed to take better account of the economic cycle in individual Member States In that sense the Commission provided an operationalization of the provision of article 5 of Regulation (EC) No 146697 according to which the rate at which the Member State is required to reach its MTO is determined according to its economic situation
In this Communication the Commission provided an operationalization of the provision of the structural reform and investment clauses also contained in article 5 of Regulation (EC) No 146697 Improving long-term sustainability mdash the main objective of the preventive arm mdash indeed requires more than the implementation of sound budgetary policy on a year-by-year basis Investments and structural reforms are also needed
(26) COM(2015) 12 of 13 January 2015
to bring government finances under control and to boost potential growth
The two clauses are presented in Chapter II4 below These clauses provide incentives for Member States to
bull introduce structural reforms and
bull protect investments that potentially have the same effects as structural reforms in difficult economic times In this respect Member States are encouraged to make investments linked to national expenditure on projects co-funded by the EU under the Structural and Cohesion policy including the Youth Employment Initiative Trans-European Networks and Connecting Europe Facility and under the new European Fund for Strategic Investments (EFSI)
The structural balance is the main common analytical tool for measuring a countryrsquos budgetary situation and the convergence towards the MTO Both the MTO and the fiscal targets set in Council recommendations relate to the structural balance Since 2005 the Commission and the Member States have agreed that the structural balance is calculated by deducting the cyclical component one-off measures and other temporary measures from the deficit ratio The strengths and weaknesses of the cyclical correction and the usefulness of parallel indicators when assessing fiscal policy measures adopted are discussed in the 2013 Public Finance Report Chapter II3 presents the practice of implementation of the concept of one-off measures
In 2006 (27) the Commission introduced a number of transparent rules for determining whether or not the measures taken by the government should be classified as one-off In particular
i) one-off measures have a transitory budgetary effect that does not lead to a sustained change in the budgetary position
(27) European Commission (2006)
Part II Recent development in fiscal surveillance
37
ii) as a rule deliberate policy actions that increase the deficit do not qualify as one-offs
The rationale for removing the impact of one-off measures when assessing a Member Statersquos budgetary position has been to better identify underlying trends and in particular to provide incentives to policymakers to pursue fiscal consolidation on the basis of measures that lead to a sustained improvement of government finances Chapter II3 provides a picture of the existing practice on the treatment of one-offs to take into account a decade of case-law and to clarify how this treatment has been adapted to changes to statistical procedures in particular the introduction of the new ESA2010 national accounting system which entered into force in autumn 2014 Although decisions still require some degree of judgement there are a number of guiding principles the Commission applies when assessing the one-off nature of measures These are presented in Section II32 The following sections explain how the main stylised cases are treated based on the guiding principles and past decisions
Although sustainability can be assessed ex ante on the basis of explicit government liabilities such as government debt implicit and contingent liabilities are also a major risk to government finances It is therefore necessary to develop an understanding of the potential losses that government finances could suffer The 2011 reform introduced a reporting requirement designed to make this possible (28) The implicit liabilities related to population ageing are relatively predictable and can therefore be taken into account when implementing the preventive arm (29) Other implicit liabilities which have a very uncertain impact on government finances cannot however be explicitly taken into account in the debt figure An example of this type of liability is potential government intervention in the banking sector in times of crisis There are only model-based estimates available for the potential cost to the government sector of implicit liabilities
(28) See Article 14 of Council Directive 201185EU of
8 November 2011 on requirements for budgetary frameworks of the Member States (OJ L 306 23112011 p 41)
(29) The definition of the MTO takes into account projected ageing-related costs (see Box II21)
of this kind being realised and these estimates depend on a large number of assumptions (30)
The value of contingent liabilities can be assessed with more precision even if the likelihood of a particular liability being realised is too difficult to estimate to require Member States to account for these liabilities as government debt It is however necessary to monitor such liabilities in order to have an accurate picture of the long-term sustainability of government debt For this reason the Six-Pack (31) imposed reporting obligations on Member States and Eurostat has started collecting data on some liabilities of this type These include
minus guarantees issued by the government which can be called if the original borrower is not in a position to repay the debt
minus the financial liabilities of state-controlled entities the government being potentially liable to cover any potential losses
minus liabilities of off-balance public-private partnerships (PPPs) which can nonetheless represent potential liability for the government and
minus non-performing loans
Chapter II5 presents and reviews the data on liabilities of this type It also provides the additional information needed in order to be able to interpret this data correctly
(30) See Fiscal Sustainability Report 2012 Available online at
httpeceuropaeueconomy_financepublicationseuropean_economy2012pdfee-2012-8_enpdf
(31) Council Directive 201185EU
2 THE FUNCTIONING OF THE PREVENTIVE ARM OF THE SGP AN OVERVIEW AFTER THE COMMUNICATION ON FLEXIBILITY
38
The preventive arm of the Stability and Growth Pact (SGP) is expected to gain in prominence in the coming years in terms of both country coverage and procedure As seen in Part I of this report majority of Member States have exited or the others are expected to exit the corrective arm of the SGP and come under the preventive arm In addition the preventive arm has recently undergone several changes which have strengthened its role and made its implementation more accurate but also more complex
This chapter aims at explaining in detail the functioning of the preventive arm It provides an overall view of the economic rationale and the legal basis as well as the practical implementation and the monitoring process without dwelling at length on the most technical aspects (32) Two features of the preventive arm namely the structural reform clause and the investment clause which were operationalised following the January 2015 Commission Communication on Flexibility within the SGP (33) are presented more specifically in Chapter II4
The rationale of the preventive arm is to promote sound public finances in a forward-looking way Forward-looking policymaking has clear benefits For countries exiting the corrective arm continuing to improve structural balance positions and thereby reducing excessive levels of debt represents a commitment to a prudent forward-looking economic policy planning rather than a continuation of the correction of past errors The preventive arm is designed to ensure that when the next downturn arrives Member States public finances are in a position that allows them to make use of counter-cyclical fiscal policy ndash ie a fiscal policy that smooths the business cycle
(32) A more comprehensive description including all technical
aspects can be found in the Vade mecum on the Stability and Growth Pact that is available on the European Commissions website
httpeceuropaeueconomy_financepublicationsoccasional_paper2013pdfocp151_enpdf
(33) Making the best use of the flexibility within the existing rules of the Stability and Growth Pact COM (2015) 12 of 13 January 2015 Available online at httpeceuropaeueconomy_financeeconomic_governancesgppdf2015-01-13_communication_sgp_flexibility_guidelines_enpdf
instead of amplifying it thus supporting the economy and limiting job losses during difficult economic times
Sound public finances are a precondition for stabilising the economy and achieving fiscal sustainability Bringing public finances to a sound position and maintaining this position allows fiscal policy to play its counter-cyclical role over the course of the economic cycle while ensuring that the budget position remains within the boundaries of the 3 of GDP reference threshold This policy also preserves the sustainability of public finances in the long term more precisely ensuring that the debt ratio is reduced to the 60 of GDP reference value and kept below this level
The role of fiscal policy in stabilising the economy can only be effective if Member States are in a sound fiscal position thus allowing automatic fiscal stabilisers to operate fully In good economic times the operation of automatic stabilisers tends to cause general government revenue to increase as a result of more vigorous economic activity while expenditure related to unemployment falls Member States are therefore expected to use these good times to accumulate savings thus ensuring that automatic stabilisers will be able to work in the opposite direction during downturns Implementing prudent fiscal policy in good times is essential to avoid the repetition of mistakes made in the years prior to the economic crisis when the pro-cyclical policies implemented in good times ultimately deprived certain Member States from a margin of manoeuvre to support the economy when this was needed in the recession
As regards long-term sustainability the preventive arm is a key means to tackle debt reduction Illustrative simulations show that for Member States whose debt is above 60 of GDP and that are currently in the preventive arm adhering strictly to the requirements of the preventive arm in terms of improvement in the structural balance would also ensure that they reduce their debt in compliance with the debt rule
Part II Recent development in fiscal surveillance
39
ndash ie the debt criterion of the SGP ndash by 2017 at the very latest (34)
The cornerstone of the preventive arm since its inception has been the country-specific medium-term budgetary objectives (MTOs) that Member States should aim for achieve and maintain The MTO represents a sound budgetary position expressed in structural terms ie corrected for the impact of the economic cycle and net of one-off and temporary measures It is calculated in such a way as to take into account each individual countrys needs to ensure the long-term sustainability of its public finances including with regard to the impact of ageing populations It is also defined so as to provide in the short to medium term a safety margin with respect to the 3 of GDP reference value so that excessive deficits are avoided even in bad economic times Furthermore the preventive arm lays down requirements for the adjustment path towards the MTO which is expressed in terms of changes in the structural balance and modulated depending on the countrys cyclical conditions and debt level
Under normal economic circumstances there is consistency of methodology between the MTO and the debt rule There is a need however to ensure that it is the case in all circumstances For this reason the October 2015 Commission Communication on Steps towards completing Economic and Monetary Union (35) indicated that when updating the lower limits for the MTOs (see Box II21) that Member States can set the Commission will ensure the consistency of such values with the respect of the debt rule in the medium term
(34) The simulations use the Commission forecast for the first
year of the forecast and assume that the adjustment towards the MTO starts in the second year of the forecast They also assume that the nominal long-term interest rate on newly issued or rolled over government debt converges to 5 by 2025 that the fiscal multiplier is equal to 075 over one year and that both nominal and real GDP growth converge to the pace seen in normal economic circumstances
(35) Communication from the Commission to the European Parliament the Council and the European Central Bank on steps towards Completing Economic and Monetary Union COM(2015) 600 of 21 October 2015 Available online at httpeceuropaeuprioritieseconomic-monetary-uniondocssingle-market-strategycommunication-emu-steps_enpdf
Several reasons have motivated the recent changes to the preventive arm First following lessons learned from the economic crisis the preventive arm has been reinforced by providing tools to make the analysis of budgetary developments more accurate and more comprehensive Second the preventive arm faces some methodological issues related in particular to the estimation of the structural balance in real time the identification of revenue windfalls and shortfalls and their impact Lastly the Commission has provided guidance on the implementation of the preventive arm to make use of the flexibility existing within the rules by allowing the economic cycle and the budgetary impact of certain types of investment expenditure and structural reforms to be taken into account
The surveillance process through which the Commission and the Council regularly monitor progress towards the MTO has also been strengthened As a consequence of the Six-Pack and Two-Pack reforms (see Section II21) fiscal monitoring has been integrated into the annual surveillance cycle coordinated with the European Semester and aiming at providing guidance to Member States As part of the surveillance process Member Statesrsquo compliance with the preventive arm for any given year is conducted several times namely ex ante in-year and ex post The information to be provided by Member States has been enhanced with all Member States having to submit in spring detailed multi-annual budgetary plans in their stability or convergence programmes and euro area Member States submitting in addition in autumn their draft budgetary plans for the following year
The main challenge for the preventive arm in the coming years will be to avoid repeating past errors Since the inception of the SGP policy errors have been made reflecting both weaknesses in the institutional framework and methodological difficulties associated with assessing the situation in real time but also limited political will to comply with the agreed fiscal rules especially in good economic times In the future it will be crucial not to repeat these errors both for the credibility of the framework and for fiscal policy to be able to play an effective role In particular close monitoring will be necessary to prevent renewed unsustainable trends in public expenditure and pro-cyclical fiscal policies in good times
European Commission Public finances in EMU - 2015
40
Similarly Member States need to be more prudent than in the past regarding the use of unexpected windfalls in particular those resulting from reduced interest payments in the current environment of low interest rates
This chapter is organised as follows After a reminder of the legal basis of the preventive arm in Section II21 Section II22 describes how the MTO is defined and at what pace Member States are required to progress towards it The last section deals with the assessment of compliance presenting both the methodology and the practical implementation of the surveillance process
21 THE LEGAL BASIS FOR THE PREVENTIVE ARM
The legal basis for the preventive arm comes from both primary and secondary legislation It is based primarily on Article 121 of the Treaty on the Functioning of the European Union (TFEU) which requires Member States to coordinate their economic policies and introduces multilateral surveillance in this regard (36) The actual implementation of the preventive arm is governed by secondary legislation specifically Council Regulation (EC) No 146697 (37) and its subsequent amendments This Regulation requires Member States to submit information on their medium-term budgetary plans in April each year as part of either their stability programmes (in the case of euro area countries) or convergence programmes (in the case of non-euro area countries) The programmes are then assessed by the Commission and the Council The requirements relating to the stability and convergence programmes (SCPs) are set out in a harmonised framework namely the Code of Conduct on the SGP (38)
(36) All relevant legislation is available at
httpeceuropaeueconomy_financeeconomic_governancesgplegal_textsindex_enhtm
(37) Council Regulation ( EC ) No 146697 of 7 July 1997 on the strengthening of the surveillance of budgetary positions and the surveillance and coordination of economic policies (OJ L 209 281997 p 1)
(38) The Code of Conduct whose full title is Specifications on the implementation of the Stability and Growth Pact and guidelines on the format and content of the stability and convergence programmes is an opinion of the Economic and Financial Committee (EFC) endorsed by the Ecofin Council on the technical implementation of the SGP The
Surveillance and coordination under the preventive arm have been strengthened over the last ten years The Regulation was first amended in 2005 with the introduction of the requirement that each Member State set a country-specific MTO and an adjustment path towards it (39) A further set of amendments were adopted in 2011 (40) as part of the Six-Pack These introduced sizeable changes such as the European Semester the expenditure benchmark and the modulation of the adjustment path towards the MTO according to the position in the economic cycle The Six-Pack also introduced a procedure for correcting significant deviations from the requirements of the preventive arm along with the possibility of sanctions for euro area countries that repeatedly fail to comply with the recommendations under the preventive arm (41) and set out requirements to reinforce national budgetary frameworks in particular regarding statistics forecasts numerical fiscal rules medium-term planning and transparency (42)
Although formally outside the SGP the Fiscal Compact and the Two-Pack have also strengthened the fiscal framework in the euro area The Fiscal Compact is the fiscal part of the Treaty on Stability Coordination and Governance (TSCG) a public international law treaty which entered into force on 1 January 2013 The Fiscal Compact which is only binding for euro area countries enshrines in national legislation the provisions of the Six-Pack It does not only mirror them but also makes them more stringent in some aspects in particular by setting a higher minimum requirement for the MTOs The Two-Pack which entered into force in May 2013 and is also specific to euro area countries does not add any new requirements but strengthens surveillance More
EFC is a committee set up to promote policy coordination on economic and financial matters among Member States It is composed of senior officials from national administrations and central banks the ECB and the Commission
(39) Council Regulation (EC) No 10552005 of 27 June 2005 (OJ L 174 772005 p 1)
(40) Regulation (EU) No 11752011 of the European Parliament and of the Council of 16 November 2011 (OJ L 306 23112011 p 12)
(41) Regulation (EU) No 11732011 of the European Parliament and of the Council of 16 November 2011 (OJ L 306 23112011 p 1) adopted on the basis of Article 136 TFEU
(42) Council Directive 201185EU
Part II Recent development in fiscal surveillance
41
precisely it requires Member States to submit to the Commission and the Eurogroup their draft budgetary plans (DBPs) in October for the forthcoming year It also gives independent national institutions a key role in preparing or endorsing macroeconomic forecasts as well as in assessing compliance with numerical fiscal rules (43)
22 THE MEDIUM-TERM BUDGETARY OBJECTIVE (MTO) AND THE ADJUSTMENT PATH TOWARDS IT
221 The MTO
The MTO is at the core of the preventive arm It represents a sound budgetary position which ensures strong public finances both in the short and long term Under the preventive arm Member States are required to progress towards their MTOs at an appropriate pace and to maintain this position
The MTO is defined in structural terms This means that it is based on the general government budget balance corrected for the estimated impact of the economic cycle (the cyclically-adjusted balance) and net of one-off and other temporary measures as these do not necessarily imply an improvement in a countrys inter-temporal budgetary position This correction therefore allows the underlying budgetary position to be assessed more accurately
The MTO presented by each Member State must fulfil the following requirements (44)
(i) It must provide a safety margin with respect to the reference value of 3 of GDP for the deficit
(ii) It needs to ensure that public finances are sustainable or are rapidly progressing towards a sustainable position
(43) Regulation (EU) No 4732013 of the European Parliament
and of the Council of 21 May 2013 on common provisions for monitoring and assessing draft budgetary plans and ensuring the correction of excessive deficit of the Member States in the euro area (OJ L 140 2752013 p 11) adopted on the basis of Article 136 TFEU
(44) Council Regulation (EC) 146697
Taking these two first conditions into account the MTO must allow sufficient room for budgetary manoeuvre to let automatic stabilisers operate fully (in particular to allow welfare spending to increase and tax revenues to decline mechanically during downturns) while keeping the budget balance within the limit of a deficit of 3 of GDP and the debt under control Only if a country is above its MTO it has fiscal space for additional discretionary measures
(iii) In addition euro area and ERM2 Member States must have an MTO of at least -1 of GDP Contracting parties to the TSCG have committed themselves to MTOs of at least -05 of GDP unless their debt ratio is significantly below 60 of GDP and the risks for the long-term sustainability of public finances are low (in which case the lower limit may remain at -1 of GDP)
To ensure compliance with these requirements the Commission regularly estimates country-specific lower bounds For each country the lower bound (the minimum MTO) is determined by taking the most stringent of the three values corresponding to the three requirements set out above This is done using a commonly agreed methodology that is described in the Code of Conduct and presented here in Box II21 The calculations are updated every three years following the publication of the Ageing Report(45) thereby incorporating the latest available projections on the budgetary and economic impact of ageing populations
Each Member State sets its MTO in its stability or convergence programme (SCP) The MTO must be at least in line with the minimum MTO calculated by the Commission rounded to the most favourable frac14 of a percentage point Member States are however free to set more ambitious MTOs if they feel that circumstances warrant it They are required to revise their MTOs at least every three years Additional revisions can also take place on a case-by-case basis if a country implements a structural reform with a major impact on the sustainability of public finances such as a major reform of the pension system The MTOs currently in place range from a deficit of 17 of GDP to a surplus of 075 of GDP with most countries
(45) See European Commission (2014a)
European Commission Public finances in EMU - 2015
42
MTOs falling between a deficit of 1 of GDP and a balanced budget
222 The adjustment path towards the MTO
Under the SGP Member States must achieve and maintain the MTO or be on an appropriate adjustment path towards it A country is assessed to be at its MTO if its structural balance is at least as tight as its MTO As a matter of convention the structural balance is considered to
be in line with the MTO if the distance to the MTO is within a margin of 025 of GDP This is to account for uncertainty when estimating the output gap in real time If the Member State is not at its MTO it must follow an appropriate path towards it in terms of change in the structural balance
The appropriate adjustment path depends on each countrys situation Following the 2005 reform cyclical conditions are taken into account in the implementation of the SGP making it more
Part II Recent development in fiscal surveillance
43
Required annual fiscal adjustment
Condition Debt le 60 and lowmedium sustainability risks
Debt gt 60 or high sustainability risks
Exceptionally bad times
Real growth lt 0 or output gap lt -4 No adjustment needed
Very bad times -4 le output gap lt -3 0 025
Bad times -3 le output gap lt -15 0 if growth below potential
025 if growth above potential
025 if growth below potential
05 if growth above potential
Normal times -15 le output gap lt 15 05 gt 05
Good times Output gap ge 15 gt05 if growth below potential
ge075 if growth above potential
ge075 if growth below potential
ge1 if growth above potential
demanding in good economic times while giving more flexibility in bad times The Commission has detailed more precisely how the required annual adjustment is modulated by means of a matrix annexed to the 2015 Communication on flexibility within the SGP The modulation takes into consideration both the economic cycle and the countrys debt level and sustainability needs As a benchmark euro area and ERM2 Member States should plan to improve their structural balance each year by 05 of GDP in what is defined in the matrix as normal times In good economic times however a faster adjustment is required This also applies to Member States with debt in excess of 60 of GDP and Member States whose debt has been assessed as being at high risk of not being sustainable Conversely the effort may be reduced during bad times and when sustainability risks are limited In addition the required effort takes into account the direction into which the economy is moving ie whether the economic situation is improving or deteriorating This is assessed by looking at whether real GDP growth exceeds or falls short of the country-specific potential growth rate Overall the required adjustment ranges between zero and more than one percentage point of GDP The various cases are presented in the matrix of requirements (Table II21)
The matrix of requirements includes a waiver from structural adjustment in exceptionally bad times The background for the
waiver is the definition (borrowed from the corrective arm of the SGP) of an exceptionally severe economic downturn as a negative annual GDP volume growth rate or (hellip) an accumulated loss of output during a protracted period of very low annual GDP volume growth relative to its potential (46) More specifically it is considered that in years when real GDP growth is negative or when the output gap is lower than -4 of GDP in the Member State in question the downturn is so severe that the Member State cannot be required to improve its structural balance (47)
The two requirements of the preventive arm ndash namely achieving the MTO and implementing more consolidation effort in good times and less in bad times ndash are not always compatible There is a tension in the spirit of the Regulation in this regard Within the spirit of the SGP which privileges sustainability the current Commission in its Communication on flexibility within the SGP (see footnote 2) has increased the prominence of cyclical conditions and the modulation of effort This can at times prevail over the requirement of reaching the MTO within four years (48)
(46) Regulation (EC) 146797 as modified by Regulation (EC)
10562005 (47) Finland benefitted from the waiver for 2012 and 2014 and
so did Italy for 2014 due to negative growth in those years (48) While the matrix of requirements is in principle compatible
with the principle of achieving the MTO within four years it may lead in case of a protracted period of bad economic
Table II21 Matrix for determining the annual fiscal adjustment towards the MTO required under the preventive arm
Source European Commission All figures are in percentage points of GDP Sustainability risks are assessed on the basis of the S1 indicator which represents the change in the structural primary balance required by 2020 to bring the debt-to-GDP ratio to 60 by 2030
European Commission Public finances in EMU - 2015
44
223 Allowed temporary deviations from the MTO or the adjustment path towards it
The Communication on flexibility within the SGP has presented two clauses allowing temporary deviations from the MTO or the adjustment path towards it Their aim is to provide the necessary flexibility to support structural reforms and investment without compromising fiscal responsibility The structural reform clause allows Member States that implement major structural reforms to deviate temporarily from the MTO or the adjustment path towards it The idea is to cater for possible short-term costs of reforms that are expected to have positive budgetary effects in the long-term including through the expected positive impact on potential output Under the investment clause Member States may similarly be allowed temporary deviations from the adjustment path in this case to finance specific investment expenditure on projects co-funded by the EU that have positive direct and verifiable long-term effects on growth and on the sustainability of public finances
Both clauses are subject to specific conditions and are presented in more detail in Chapter II 4 In particular the Member State must remain in the preventive arm it must preserve an appropriate safety margin with respect to the 3 of GDP deficit limit and the Member States budgetary position must be expected to return to the MTO within the period of four years covered by the SCP In addition for the investment clause to apply the Member State must be in bad economic times or worse as defined in the matrix
In 2011 a general escape clause was included by the legislator in the preventive arm (and in the corrective arm) in order to accommodate exceptional conditions It reflects the same spirit as the waiver described above as it allows for a temporary deviation from the adjustment path providing that this does not endanger fiscal sustainability in the medium term This clause is however of a more general nature It is applicable in two possible situations i) a severe economic downturn affecting the euro area or the EU as a
conditions to requiring an adjustment that may not be sufficient to reach the MTO within this time horizon
whole (49) ii) an unusual event outside the control of the Member State concerned which has a major impact on the financial position of the general government (50) In view of the wide range of situations that could lead to the application of this clause the Commission and the Council have to assess each case individually in order to decide whether it qualifies This clause has so far not been applied It is indeed meant to remain limited to exceptional carefully circumscribed situations to minimise the risk of moral hazard (51)(52)
23 ASSESSMENT OF COMPLIANCE UNDER THE PREVENTIVE ARM
231 The two-pillar approach
Before the adoption of the Six-Pack progress towards the MTO was only assessed in terms of change in the structural balance This first pillar of the preventive arm had been introduced in 2005 alongside the MTO and involves assessing the change in the structural balance against the required annual adjustment Given its close connection with the MTO the first pillar remains a crucial element of the preventive arm
(49) It is recalled that the waiver referred to in the previous
section makes reference to economic conditions in the Member State itself
(50) Council Regulation (EC) No146697 as amended as part of the Six-Pack
(51) It reflects however de facto the same logic as the one underpinning the recovery plan in 2008 under which the adjustment paths were redesigned and Member States agreed on a coordinated temporary fiscal stimulus package in response to extraordinary economic conditions namely the financial crisis and the recession See the Commission Communication A European economic recovery plan COM (2008) 800 of 26 November 2008 Available online athttpeur-lexeuropaeulegal-contentENALLuri=CELEX52008DC0800
(52) The Commission is willing to use these provisions to accommodate the incremental spending resulting from the exceptional inflow of refugees in certain Member States as this is considered an unusual event outside the control of government It will monitor the situation closely on the basis of observed data as provided by the authorities of the Member States concerned to determine eligible amounts This information will be used when assessing (ex post) possible temporary deviations from the SGP requirements for 2015 and 2016 This means that deviations deriving only and directly from the net extra costs of the refugee crisis will not lead to any stepping up in the procedures This applies also to the opening of an Excessive Deficit Procedure provided that the general government deficit remains close to 3 of GDP in case of a breach of that threshold
Part II Recent development in fiscal surveillance
45
The Six-Pack has introduced a second pillar to operate in parallel to the structural balance the expenditure benchmark (53) Experience has shown that monitoring the structural balance alone is not sufficient to provide an accurate and comprehensive picture of budgetary developments and two main weaknesses have been identified First failure to meet fiscal targets tends to result mainly from the dynamics of expenditure while revenue tends to follow GDP Second as mentioned above real-time estimates of the structural balance are highly uncertain especially in periods of large shocks to the economy ndash on the positive or negative side (54) This is particularly true for revenue and may result in times when the economy is strong in revenue windfalls which Member States tend to spend rather than save to build fiscal buffers This is also the case for revenue shortfalls in downturns Controlling expenditure allows Member States to run a more counter-cyclical fiscal policy
The aim of the expenditure benchmark is to prevent increasing trends in the expenditure-to-GDP ratio which are not properly backed by revenue measures While government revenues (mainly taxes and social contributions) are largely driven by macroeconomic developments expenditure depends more directly on government decisions Keeping expenditure growth under control is therefore essential for steering public finances towards sound positions over the medium term This is the case if expenditure grows at the same pace as potential GDP ie if the ratio of expenditure to potential GDP remains unchanged The level of the expenditure-to-GDP ratio itself is however not constrained governments remain free to choose their preferred size of government as long as increases in expenditure are matched by additional revenues ndash which must result from measures not windfalls It is for this reason that
(53) A longer presentation is available in European Commission
(2011) (54) Indeed the estimate of the structural balance is based on
estimates of many unobservable variables including the output gap proxies for tax bases and elasticities of tax receipts to the tax bases In addition to the general uncertainty related to the imperfections of these real-time estimates the assessment of the structural balance may be affected by unexpected developments in tax revenues which are decoupled from the evolution of standard tax bases For more details see European Commission (2013) Part III Available online at httpeceuropaeueconomy_financepublicationseuropean_economy2013pdfee-2013-4pdf
the regulation refers to a net growth rate of government expenditure ie a growth rate that is net of discretionary revenue measures and of revenue increases mandated by law
Operationally in order to capture only items that are mostly under the control of government the expenditure aggregate is recalculated Certain expenditure items are netted out from the aggregate because they are not considered to be discretionary spending (1) the cyclical component of unemployment benefits as it depends on cyclical conditions (2) interest payments as they are not directly within the governments control and (3) expenditure matched by EU funds as it is not funded by general government Furthermore public investment is smoothed over four years to avoid the calculation being affected by peaks related to the public investment cycle This corrected expenditure aggregate is then adjusted for discretionary revenue measures and revenue increases mandated by law On this basis the growth of net public expenditure in nominal terms is computed It is then deflated using the change in the GDP deflator to obtain the growth rate in real terms Similarly the nominal expenditure figures submitted by Member States in their SCPs are converted into real terms by the Commission to allow comparison with the benchmark
The real growth of net expenditure is compared to that of potential GDP averaged over ten years ndash the reference rate This is a reference medium-term rate of potential GDP growth that is both backward- and forward-looking (covering the years t-5 to t+4) and updated on a yearly basis It reflects a medium-term time horizon that is long enough to reduce the bias of short-term fluctuations in growth while being short enough to remain of relevance for policymaking
The maximum net growth of expenditures allowed depends on the distance to the MTO (and the effort required from the Member State as explained in Section II22) Member States that have attained their MTO are required to ensure that expenditure growth does not exceed the reference rate or that any excess is funded by discretionary measures (55) Over time this will
(55) Articles 5(1) and 9(1) of Council Regulation (EC) No
146697
European Commission Public finances in EMU - 2015
46
result in both government revenue and spending increasing at the same pace thus keeping the structural balance stable at the MTO (56) By contrast countries that are not yet at their MTO are required to contain net expenditure growth at a lower rate below potential GDP growth thus expenditure will decline as a ratio to GDP the structural balance will strengthen and the gap with the MTO will close over time (57) Both the reference rate and the lower rate are revised on a yearly basis In addition to the constraint on net expenditure growth any discretionary reduction of government revenue items needs to be matched by cuts in expenditure or by discretionary increases in other government revenue items
Overall the expenditure benchmark has enriched the EU fiscal surveillance toolbox It reduces the uncertainty surrounding the structural budget balance and it strengthens effectiveness and transparency as the budgetary aggregates under consideration are observable and under the control of government and the relationship between the outcome of the assessment and the measures to be taken is direct The expenditure benchmark is meant to refine the assessment as an indicator of the fiscal effort that a Member State has effectively implemented in parallel to the analysis in terms of change in the structural balance As both pillars are based on different although complementary concepts and variables elements that are not captured in the structural balance will show in the comparison between the expenditure aggregate and the change in the structural balance with the two indicators giving opposite signals This comparison is performed in the so-called overall assessment which is described in more detail below
(56) However the Code of Conduct states that countries that
have overachieved their MTO are allowed to deviate from the expenditure benchmark as long as the MTO is not jeopardised over the programme period taking into account the possibility of significant revenue windfalls
(57) The difference between the reference rate and the lower rate is referred to as the convergence margin Its size is country-specific and depends on the size of the public sector (the share of government primary expenditure in GDP) and on the required tightening of the structural balance under the first pillar (a higher adjustment requirement translating into a larger convergence margin)
232 The surveillance process
The Commission and the Council assess compliance with the SGP through the surveillance process In particular they assess whether Member States converge towards the MTO (or maintain it for Member States that have already reached it) and comply with the Council recommendations with the view of possibly deciding whether it is necessary to open a Significant Deviation Procedure (SDP)
Timing of the assessment
Budgetary plans and outcomes are regularly assessed against the requirements of the preventive arm within a multilateral surveillance framework The assessment is carried out by the Commission and the Council on the basis of information provided by Member States and Commission forecasts Following the adoption of the Six-Pack the assessment takes place along an annual surveillance cycle in which Member States are given guidance for the current year the following year and the medium-term and procedural steps can be taken in case non-compliance is observed ex post
Member States are required to submit their budgetary plans for assessment with additional requests for euro area Member States(58) Member States must submit their SCPs to the Commission and the Council each year in April The SCPs provide detailed information on the outturn of year t-1 and on budgetary medium-term plans up to year t+3 according to a standardised format and content This includes in particular the MTO and the planned adjustment path towards it a range of economic and budgetary data and a quantified description of the envisaged budgetary strategy especially with regard to the intended policy measures Since the entry into force of the Two-Pack euro area Member States have in addition been required to submit their Draft Budgetary Plans (DBPs) for the following year in autumn each year
In terms of procedure the most important assessment is the ex post assessment which is conducted in spring of each year It consists in (58) Euro area Member States which are under a
macroeconomic adjustment programme are however not required to submit a stability programme
Part II Recent development in fiscal surveillance
47
assessing whether each Member State complied with the requirements of the preventive arm during the previous year and over the last two years on average based on outturn data In case a Member State fails to comply further analysis establishes whether non-compliance is significant which would trigger an SDP An SDP can only be launched on the basis of outturn data which only becomes available in the spring This is therefore the only time in the surveillance cycle when an SDP can be initiated (see Sub-section II233)
In addition the ex-ante and in-year assessments are intended to alert Member States of possible risks of deviations from the requirements and thus provide guidance for further adjustments In this way guidance is provided to Member States throughout the whole budgetary cycle In spring of each year along with the ex-post assessment compliance is also assessed by the Commission for the current year and over the medium term (59) on the basis of the SCPs and the Commissions spring forecast As part of the European Semester the Council then adopts opinions on the SCPs and issues policy guidance in the form of fiscal country-specific recommendations (CSRs) addressed to Member States following Commission recommendations Member States subsequently take the CSRs into account when preparing the budgets for the following year during the second half of the year For euro area Member States this is completed in autumn by an ex ante assessment for year t+1 as well as a further in-year assessment for year t on the basis of both the DBPs and the Commissions autumn forecast This assessment feeds into the Commissions opinion on the DBPs If the Commission identifies particularly serious non-compliance in a DBP it shall request in its opinion a revised DBP on which it will adopt a new opinion
The freezing principle
To ensure the predictability of the ex post assessment and allow Member States to plan ahead the appropriate measures the requirements are frozen over the assessment cycle Predictability is crucial in a context where a significant deviation from the requirements will
(59) Ex-ante evaluation for year t+1 and qualitative assessment
for years t+2 and t+3
lead to procedural consequences which eventually include financial sanctions for euro area Member States Yet the requirements in terms of structural adjustment and expenditure growth depend on economic conditions forecast in the Member State in particular its output gap Given the intrinsic volatility of output gap estimates these requirements could turn out to change between the ex-ante and ex-post assessments for a given year In order to keep the outcome of the ex-post assessment predictable and to preserve the guidance spirit of the preventive arm the requirements are therefore frozen More precisely the required adjustment path for a given year is set in the spring of the previous year and it remains the reference against which developments are assessed in the following years There are however two cases for which the requirements based on outturn data prevail over the frozen ones The first case is when the output gap turns out to deteriorate and be larger than -3 of GDP (ie the Member State is found to be in very bad times or exceptionally bad times) because the initially required adjustment turns out to be too large The other case is when the Member State is found to have achieved its MTO because the required adjustment is no longer necessary
In technical terms several variables are frozen at the level at which they are forecast in the spring of year t-1
- First the structural balance and therefore the distance from the MTO both for year t-1 are frozen and used to assess whether a country is at its MTO as a starting point ndash if it is no adjustment will be required (60)
- For the assessment under the first pillar the freezing regards the debt-to-GDP ratio and the sustainability risk indicator S1 both also for year t-1 as well as real GDP growth and the output gap both for year t as these are used to determine where the Member State stands in the matrix of requirements for year t and therefore what change in the structural balance is required On this basis the required adjustment for year t is formulated in
(60) However in each forecast round the structural balance for
year t-1 as fixed in the spring of year t-1 is compared to its level for the same year according to the new forecast and the more favourable of the two is used to identify the starting point
European Commission Public finances in EMU - 2015
48
t-1 and compliance is assessed both in years t and t+1
- Freezing is applied in a similar way for the assessment against the expenditure benchmark The reference rate the applicable convergence margin and the resulting lower rate for year t are communicated in the spring of year t-1 and frozen until the ex post assessment in year t+1 This means that the benchmark for the net growth of expenditure is not affected by the subsequent yearly updates of the reference rate and the convergence margin
The assessment of compliance in practice
The first step of the assessment whether ex ante in-year or ex post regards the distance to the MTO After checking that the MTO defined by the Member State considered is at least as demanding as the minimum MTO as calculated in Box II21 the Commission assesses whether the MTO has been achieved This is the case if the Member State has a structural balance at least as tight as its MTO As a convention a country is considered to be at its MTO if it is within a margin of tolerance of 025 of GDP to account for uncertainty in the measurement of the structural balance Member States which have achieved their MTO are required to maintain this position and Member States which have overachieved it have some fiscal space available
Compliance with the preventive arm is assessed against the required adjustment as defined in the matrix possibly corrected for the impact of the relevant clauses If the conditions are met the flexibility clauses ndash the structural reform clause and the investment clause ndash may allow a Member State to temporarily deviate from its MTO or the adjustment path towards it as described in Chapter II4 The general escape clause may also apply if it is assessed that the conditions are met
The assessment of compliance builds on an overall assessment combining the two pillars Both the structural balance and the expenditure benchmark are taken into account (61) For each
(61) As stated in Regulation 146697 The only exception
regards Member States that have overachieved their MTO in which case only the structural balance is relevant and compliance with the expenditure benchmark does not need to be assessed
pillar three outcomes are possible either the Member State complies with the requirements or it deviates from them but to a limited extent or it deviates significantly A significant deviation from the MTO or the adjustment path towards it is defined for the first pillar as a deviation of the structural balance of at least 05 of GDP over one year or cumulatively in two consecutive years (ie at least 025 of GDP on average per year in two consecutive years) Similarly for the expenditure benchmark a significant deviation is a deviation in the net expenditure developments that has an impact on the government balance of at least 05 of GDP over one year or cumulatively over two consecutive years (62) The ex post assessment is therefore conducted not only in respect of the year t-1 under consideration but also taking into account the preceding year t-2 to check the cumulative deviation over the two years The aim is to avoid small deviations (below 05) from cumulating year after year and sum up to a large deviation
In-depth analysis is needed in case of conflicting signals between the two indicators As the structural balance and the expenditure benchmark are based on different concepts and variables they can send out different messages They each provide a partial evaluation of the situation meaning that neither can be considered as being the right indicator The expenditure benchmark is nonetheless in general a preferable and less endogenous indicator of fiscal effort in so far as the bottom-up evaluation of measures is not distorted and hidden non-regulatory government actions are absent (63) On the other hand the two indicators are complementary and taken together they provide a comprehensive picture of a Member States fiscal position The overall assessment should therefore systematically analyse the factors explaining the differences between the two pillars in order to identify which reflects better the specific situation under consideration and conclude accordingly These factors are presented in Box II22
The outcome of the overall assessment depends on how the two pillars combine The Code of
(62) Articles 6(3) and 10(3) of Council Regulation (EC) No
146697 (63) A typical case is tolerated tax evasion or elusion which
may be practised by certain governments in certain circumstances
Part II Recent development in fiscal surveillance
49
Change in the structural
balance
Expenditure
benchmark
Adjustment delivered Deviation Breach of the threshold of significance
Benchmark complied with Compliance Overall assessment needed Overall assessment
needed
Deviation Overall assessment needed Overall assessment needed Overall assessment
needed
Breach of the threshold of significance
Overall assessment needed Overall assessment needed Significant deviation
Conduct specifies that a deviation is considered significant if indicators point to deviations that reach the threshold for significance as defined
above In case the deviation reaches the threshold for significance for only one of the indicators the deviation is considered significant if the overall assessment also shows some deviation although below the significance threshold with respect to the other condition As a result several cases are possible as shown in Table II22 When both indicators show compliance with the required adjustment (green cell) or both indicate a significant deviation from it (red cell) the conclusion of the assessment is straightforward When the messages provided by the two indicators differ (yellow and pink cells) the conclusion will be based on an in-depth analysis assessing the differences between the two indicators and deciding whether the deviation can be considered significant overall It is only possible to conclude that there is a significant deviation and therefore that an SDP should be launched for the Member State in question if the deviation from at least one indicator has reached the threshold of significance (corresponding to the red and pink cells) By contrast the cases represented by the yellow cells cannot lead to an SDP
233 The significant deviation procedure (SDP)
The SDP was introduced as part of the Six-Pack as a way of making the requirements of the preventive arm more binding It builds on
the lessons learnt from the past as peer pressure alone proved insufficient to avoid persistent non-compliance with the preventive arm The general aim of the SDP is to give Member States stronger incentives to make sufficient progress towards the MTO in particular when economic circumstances allow it Unlike the Excessive Deficit Procedure which is opened on the basis of objective conditions (relating to the evolution of the debt and deficit ratios) the SDP is intended to make sure that the Member State in question complies with the fiscal recommendations issued publicly by the Council during the European Semester If a euro area Member State repeatedly fails to comply with a recommendation it may face financial sanctions under the preventive arm
The successive procedural steps start with a warning in the spring and may lead to a financial sanction in November of the same year
- If a significant deviation is observed in the ex post assessment in the spring (conducted on the basis of data for the year t-1) the first step is for the Commission to issue a warning under Article 121(4) TFEU thus launching an SDP
- Within one month the Council adopts a recommendation based on a Commission recommendation on the policy measures that the Member State must take to address the deviation
- At most five months later (or in very severe cases at most three months later) the Member
Table II22 Possible outcomes of the overall assessment under the preventive arm of the SGP
Source Commission services Note The column Deviation corresponds to some deviation that remains below the threshold to conclude on a significant deviation
European Commission Public finances in EMU - 2015
50
(Continued on the next page)
Part II Recent development in fiscal surveillance
51
State reports on action taken If the Member State is found to have failed to take appropriate action the Commission immediately recommends that the Council adopt by qualified majority voting a decision establishing that no effective action has been taken The Commission may also recommend that the Council adopt a revised recommendation on the appropriate measures to be taken
- If the Council does not adopt the decision on no effective action and the Member State in question persists in not taking appropriate action the Commission issues a new recommendation for a Council decision on no effective action within one month of the previous one This new recommendation is subject to reverse simple majority voting in the Council (64)
- In the case of euro area Member States within 20 days the Commission recommends to the Council to adopt a decision requiring an interest-bearing deposit of 02 of GDP (65)
(64) This means that the decision is adopted unless a majority of
Member States votes against it (65) Regulation (EU) 11732011 of the Parliament and the
Council based on Article 136 TFEU
- Finally the Council votes on the adoption of this decision by reversed qualified majority voting within 10 days (66)
Given the consecutive steps this decision would be taken by November of the year in which the SDP was launched
(66) The Council may also vote to amend the Commissions
recommendation and adopt the amended text as a Council decision by qualified majority voting
Box (continued)
3 ONE-OFF MEASURE-CLASSIFICATION PRINCIPLES USED IN FISCAL SURVEILLANCE
52
31 INTRODUCTION
Since the 2005 reform of the Stability and Growth Pact (SGP) the concept of lsquostructural balancersquo ie the cyclically-adjusted balance net of lsquoone-off and other temporary measuresrsquo has become a cornerstone of fiscal surveillance The rationale for removing the impact of one-off and other temporary measures (referred to here collectively as lsquoone-off measuresrsquo) when assessing a Member Statersquos budgetary position has been to better identify underlying trends and in particular to reduce the incentive for national authorities to resort to lsquofiscal gimmickryrsquo ie improving budgetary results in the short term by means of easy-to-implement measures that do not lead to a sustained improvement of the general government balance In general terms one-off measures could therefore be defined as lsquomeasures having a transitory budgetary effect that does not lead to a sustained change in the budgetary positionrsquo
The ability to correctly identify lsquoone-off measuresrsquo as defined in the SGP is thus crucial for carrying out fiscal surveillance The definition provided above can however only be a starting point for the actual process of identifying individual such measures More specific guidance including an indicative and open list of one-off measures was developed in the wake of the 2005 SGP reform and published in the 2006 Report on Public Finance in the EMU The Commission has since been using this guidance as a point of reference for its surveillance activities
There are several reasons to review the guidance laid down in the 2006 Report on Public Finance in the EMU First it has become apparent that the existing guidance is not always conclusive often leaving substantial scope for interpretation in particular in relation to measures not mentioned explicitly in the indicative and open list of measures Second the classification of one-off measures has necessarily been a learning process New cases have appeared that the guidance did not cater for and principles as to how to treat certain cases have been refined over time Finally a number of statistical revisions (in particular the introduction of ESA2010) have made
it necessary to update the indicative and open list contained in the 2006 Report for example because some of the transactions included are now regarded as financial transactions (ie no longer affect the headline deficit)
These factors illustrate the need for both updated guidance on typical cases and also further work on the theoretical basis (the lsquoguiding principlesrsquo) A better developed set of guiding principles for classifying transactions as one-offs will make the criteria used by the Commission in its fiscal surveillance more transparent It will also form a more solid basis for decisions on the one-off nature of future as yet unknown cases The classification of a measure needs to be based on an overall assessment of that measure against the guiding principles presented below In some cases a certain degree of judgement may still need to be used in particular in cases where different guiding principles appear to point to different decisions (for instance when determining the boundary between lsquonormal economic fluctuationsrsquo and the impact of an lsquoexceptional eventrsquo)
This chapter develops such guiding principles and examines how they can be used in determining the lsquoone-offrsquo nature of a measure It is structured as follows Section II32 explains the guiding principles used for assessing the one-off nature of a measure Section II33 provides examples of frequently occurring one-offs and explains the rationale for their treatment based on the guiding principles set out in the previous section and Section II34 discusses a number of measures that have lsquoborderlinersquo characteristics and explains why they have ultimately however not been considered one-off measures
32 GUIDING PRINCIPLES FOR THE CLASSIFICATION OF ONE-OFF MEASURES
321 Principle I One-off measures are intrinsically non-recurrent
One-off measures are transactions that have by their very nature only a temporary non-recurrent impact on general government
Part II Recent development in fiscal surveillance
53
revenue or expenditure For this to be the case a one-off measure must have an inherent characteristic that makes its impact temporary ie a characteristic that means that it cannot have a sustained impact on the budgetary position As a rule a maximum of two years could be considered a reasonable length of time for defining temporariness Great care needs to be taken however in assessing the duration of the effect of a measure In particular if similar one-off measures are introduced repeatedly over the course of several years this does not change the fact that each individual measure has a temporary impact that cannot lead to a sustained improvement in the budgetary position A government can for example sell a series of non-financial assets over a period of time (ie repeating a particular type of transaction) but this does not alter the fact that a systematic liquidation of such assets can never become a sustainable source of government financing as the stock of assets is depleted further with every sale In such cases the measures in question should still be considered individually as one-off measures (67) Ultimately it is the intrinsic inability of a measure to lead to a sustained change in the budgetary position that determines its one-off nature
Measures identified as one-offs are very often although not always of one of the following types
a) Measures creating short-term benefits accompanied by a significant reduction in government assets or a build-up of future liabilities The implicit reasoning is that systematically running down non-financial assets (such as land or buildings) or building up liabilities can in principle never become a permanent source of government financing and should therefore be considered a one-off measure even in cases where there is a sequence of similar transactions taking place over a period of several years The impact of such measures would therefore be considered one-off
b) Measures entailing a short-term lump-sum benefit at the expense of a recurrent future cost
(67) For a more detailed discussion on the sale of non-financial
assets see also Section II335 An important factor in the classification of this example as a one-off would be the fact that there is a systematic depletion of the stock of assets
In certain situations policymakers may create a very short-term gain which also creates recurrent costs in the future (either in the form of lower revenue or increased expenditure) A typical example would be a case where the government is systematically substituting for ownership with rental contracts (68) The future cost is also often somewhat hidden This is particularly the case when the general government receives a payment in one year in return for services or entitlements it will provide over a longer period of time In such cases the recurrent future cost consists of the loss of revenue that would have been collected had the services or entitlements been granted on an annual basis In general the short-term benefits would be produced either through the treatment of the measure in national accounts or as a result of the behaviour of economic agents This would be the case for example when firms or consumers derive some benefit from early or advanced payments creating a very short-term peak in government revenue Irrespective of how the gain is generated when a lump-sum benefit of this type is created at the expense of a recurrent future cost the short-term gain should be considered one-off as it cannot become a permanent source of government financing On the other hand once the measure has been taken the future costs also created are recurrent and therefore structural
c) Measures implying a change in the timing of revenue or expenditure that create a temporary peak (positive or negative) in revenue or expenditure patterns Changes in the timing of recurrent revenue or expenditure patterns also often create very short-term transitional effects For example if a tax administration is able to considerably shorten the period between the occurrence of a taxable transaction and the settlement of the tax there would be a temporary increase in tax revenue in the year the measure is introduced A temporary impact of this kind should be considered one-off (any permanent effect of course being structural) The justification for this treatment lies in the transient nature of the peak it
(68) This example also illustrates that classification of a
measure as a one-off does not necessarily imply a judgement on the quality of the measure substituting ownership with rental contracts may mdash depending on the contractual arrangements mdash reflect very sound and cost-saving policies by the government This does not however affect the one-off nature of the budgetary impact of the sale
European Commission Public finances in EMU - 2015
54
being essentially a temporary side effect of a transition from one steady state to another
d) Measures introduced in direct response to lsquoexceptional eventsrsquo and that have a very short-term impact Exceptional events are defined for this purpose as specific occurrences that can be regarded as being beyond the control of the government and that have an often sudden impact on the revenueexpenditure or assetsliabilities of the general government or of the country that is temporary by nature and significantly exceeds normal economic fluctuations The fact that an exceptional event may have occurred unexpectedly and that its impact could not have been foreseen by policymakers when drafting their budgetary plans is not relevant to the assessment of the one-off nature of measures taken in response to it The critical factor is that the impact of the measure is inherently temporary and does not have the potential to affect the budgetary position in a more permanent manner It is often although not always the case that the one-off budgetary impact of a measure taken in response to an exceptional event results from implicit or even hidden liabilities that have been building up over several years and that materialise as a result of the measure A typical example would be a court ruling that a tax collected over a number of years is unlawful and needs to be repaid The classification as one-off is justified by the transient nature of the budgetary impact of the exceptional event In the example of a court ruling the entire budgetary impact may be accrued in a single year even though the tax was collected over many years prior to this The direct link to the exceptional event needs to be interpreted in a restrictive manner ie only those measures that have been introduced as an inevitable consequence of the event or that are strictly necessary to prevent the event from having an even greater negative impact can be considered one-offs (69) (see also Principle IV below)
(69) It should also be noted that all transactions classified as
one-offs are considered to be lsquofiscal policy measuresrsquo ie interventions by the government to change past policy orientations that are specified in sufficient detail adopted or credibly announced and that have a direct incremental budgetary impact even though some of these transactions may not be fully under the control of the government (such as the implementation of court rulings or decisions taken by EU authorities) In other words for budgetary surveillance purposes these actions are conventionally considered as fiscal policy measures despite their somewhat less discretionary nature
Furthermore the occurrence of exceptional events should as a rule be evaluated at micro level The term lsquoexceptional eventsrsquo should not be interpreted as covering a general worsening of the economic or environmental conditions throughout the year but should be understood to mean punctual events such as the default of a systemic bank nation-wide flooding caused by a single unusually severe storm or court decisions with significant budgetary impact
An additional difficulty may arise due to the fact that exceptional events can have a permanent as well as a temporary effect In the previous example of a court ruling the repayment of unjustified taxes would create a very short-term impact but the court ruling may also have an effect on the future tax base This would thus be a structural (ie not a one-off) effect Unlike in this example however the distinction may not always be immediately clear while some of the effects of an exceptional event may remain very short term (ie not extending beyond the standard two-year period) the impact could ultimately at least in part also become recurrent In such cases it may be necessary to review the one-off nature ex post and possibly reclassify at least part of the budgetary impact as structural When the budgetary impact of an exceptional event extends beyond the two-year period there should be a strong presumption that at least part of the impact is of a structural nature and therefore needs to be deducted from the one-off effect As a rule the impact recorded after the end of the two-year period should not be classified as part of the one-off effect Such revisions are similar to statistical revisions of the actual deficit figure and should be avoided as much as possible as they may hinder effective policy surveillance (see also Principle II hereafter)
Where a measure is not of one of the types listed as cases (a) to (d) above it could still be classified as a lsquoone-offrsquo but use of this label should nonetheless be restricted In particular the attribution of the one-off label should always be based on a careful assessment of (i) the likelihood of recurrence (ii) the level of control the government has (see Principle IV below) and (iii) the risk of giving the wrong incentive to policymakers with respect to the transparency and overall soundness and sustainability of public finances In particular it is important to avoid
Part II Recent development in fiscal surveillance
55
creating a situation where the possible recognition of a potentially sizeable transaction as a one-off would provide an incentive to policymakers to build up arrears or accumulate losses or to present specific categories of intrinsically structural expenditure (such as gross fixed capital formation) as one-off expenditure The exceptional size of the impact of a measure or event is not alone a sufficient condition for classifying it as a one-off measure
322 Principle II The one-off nature of a measure cannot be decreed by law or by an autonomous government decision
In order to ensure timely and effective policy surveillance it should be possible to evaluate the one-off nature of a measure unambiguously upon its announcement For that reason the one-off nature of a measure should not depend on whether the policymaker announces the measure as temporary or permanent Policy measures announced as temporary often later become permanent (even when their temporary nature is enshrined in legislation) whilst measures announced without an expiration date may be terminated shortly after their entry into force Making the one-off nature of a measure dependent on the way it is announced would lead to inconsistencies two otherwise identical measures could be assessed differently purely because of the way they have been announced This would be neither meaningful nor acceptable Furthermore the frequent ex post revision of classifications that would be needed on any occasion where the actual course of events differed from the announcement would make the concept of one-off measures unusable for real-time fiscal surveillance
For this reason the one-off nature of a measure cannot depend on the way it has been announced by policymakers Since it is not practical to wait and see to what extent the impact of a measure really is temporary the classification as a one-off needs to rely exclusively on the inherent characteristics of the measure (mentioned under Principle I) that prevent it from having a sustained impact on the budgetary position This is particularly the case for changes in tax or contribution rates or in aggregate expenditure levels that are announced (or legislated) by policy makers to be temporary Apart from very short-
term transitional effects as referred to under Principle I(c) above the impact of changes to tax or contribution rates or to aggregate expenditure levels should always be considered as structural even if the change is reversed shortly after its initial introduction In such cases the reversal of the initial measure also qualifies as a structural measure A corollary to this principle is that temporariness alone is not a sufficient condition for identifying a one-off measure many temporary measures are not in fact one-off
323 Principle III Volatile components of revenue or expenditure should not be considered one-off
The concept of one-offs should not be lsquomisusedrsquo as a way of smoothing the volatility of particular components of government revenue or expenditure It is clear that the cyclical part of revenue or expenditure (ie the part that is correlated to the output gap) should not be considered as a one-off as its impact is already corrected for via the cyclical adjustment of the general government balance But even after this cyclical adjustment revenue or expenditure components may still exhibit a significant degree of volatility The concept of one-offs is not however primarily intended to smooth time series and should therefore not be used to correct for this kind of volatility Identifying one-offs is instead intended to filter out certain transactions that intrinsically cannot lead to a sustained improvement of the government balance Moreover the volatility of some components of revenue and expenditure does not even result from a policy measure and also for this reason does not qualify as a one-off measure Nevertheless it may not always be easy to distinguish between the intrinsic volatility of revenue and expenditure and measures taken in response to an exceptional event (Principle I(d))
324 Principle IV Deliberate policy actions that increase the deficit do not as a rule qualify as one-offs
The provisions on one-offs were primarily introduced in order to avoid policy measures that do not lead to a sustained improvement of the budget balance being treated as structural In order to give policymakers the right incentive to fully recognise the permanent budgetary impact of
European Commission Public finances in EMU - 2015
56
their actions there is therefore a strong presumption that deliberate policy actions that increase the deficit are of a structural nature These measures should only exceptionally be classified as one-offs in cases where it can be unambiguously demonstrated that they have an intrinsic temporary nature
As a result the principles listed above need to be implemented in a restrictive manner for deficit-increasing measures This holds in particular for deficit-increasing one-off measures introduced in response to lsquoexceptional eventsrsquo as described in Principle I(d) Only measures designed to counter the very direct impact of an exceptional event that can be considered to be strictly outside the governmentrsquos control should be eligible for potentially being classified as one-offs By contrast when the government has been building up implicit andor contingent liabilities which could reasonably be expected to materialise at some point in time (eg by giving guarantees to loss-making public companies) the event triggering the liability should not be considered exceptional and the resulting budgetary impact should also not be considered a one-off Great care should also be taken to avoid a situation where the concept of one-off measures creates an incentive for policymakers to deliberately accumulate payment arrears or losses in the hope that these could all subsequently be settled simultaneously without affecting the structural balance Lump-sum upfront expenditure resulting from a deliberate policy action (ie unrelated to an exceptional event) aimed at reducing expenditure in the future would as a rule also not qualify as a one-off
325 Principle V Only measures having a significant impact on the general government balance should be considered one-offs
As a rule measures worth less than 01 (rounded) of GDP should not be considered one-offs Widening the definition to a larger number of measures would considerably increase the complexity of the task of monitoring government finances Moreover smaller measures are also more likely to be part of the day-to-day management of government finances and use of such measures would therefore mainly contribute to the normal volatility of public finances (see also Principle III)
Nonetheless one-off measures are not strictly limited to only those worth at least 01 of GDP First in cases where a number of similar measures can be logically grouped together (by nature of the measure or as a result of having similar adoption procedures eg a reform package) and have a combined impact of at least 01 of GDP the aggregated impact could be classified as a one-off Second measures worth less than 01 may be classified as one-offs for reasons of consistency across Member States in particular when an exceptional event affects several Member States in a similar way An example of this is major statistical revisions The impact of the introduction of ESA2010 on Member Statesrsquo contributions to the EU budget has been treated as a one-off in all Member States even though the effect was less than 01 of GDP in some Member States Finally the impact of some measures may be recorded statistically in two successive years but the classification of the measure should remain the same If the measure has the inherent characteristics of a one-off listed in Principle I it would be sufficient that the measure has an impact of at least 01 of GDP in one year for it to be classified as a one-off for both years (ie the budgetary impact attributed to the other year would still be recognised as a one-off even though it may be less than 01 of GDP in that year)
33 AN INDICATIVE LIST OF lsquoTYPICALrsquo ONE-OFF MEASURES WITH JUSTIFICATIONS FOR THE CLASSIFICATION OF EACH
This section presents a list of stylised examples of one-off measures compiled on the basis of the experience gathered over the last decade in the classification of one-off measures The list is not designed to be exhaustive but provides a broad sample of frequently occurring cases together with the reasoning as to why (or why not) these measures should be considered one-offs with explicit reference being made to the general principles set out above These cases should serve as guidance for assessing the measures actually being used by governments Nevertheless it should be emphasised that expert judgement is still required as the characteristics of each individual measure need to be examined carefully on the basis of the general principles listed above
Part II Recent development in fiscal surveillance
57
331 Tax amnesties and other similar arrangements that generate a lump-sum tax revenue
Tax amnesties (and other similar arrangements) often include incentives for taxpayers that may lead to exceptional peaks in government revenue Measures of this type may therefore qualify as one-offs Tax amnesties (and other similar arrangements) are understood here to mean any government decision allowing private or corporate taxpayers to regularise their position vis-agrave-vis the tax authorities on relatively favourable terms (which may include a temporary reduction of administrative fines or the authorities removing the threat of criminal prosecution) Tax amnesties may involve a significant group of taxpayers being offered an incentive to regularise their position before a given point in time (after which the conditions for a settlement are likely to become considerably less attractive) thereby effectively creating an exceptional peak in revenue just before the arrangement is expected to expire The incentive for taxpayers to act is usually created by the scheme having a pre-defined expiration date but it could also result from the high risk (as perceived by the taxpayers) that an existing scheme will be discontinued at a specific point in time If such an exceptional peak in revenue occurs it can be classified as a one-off The treatment as a one-off measure is justified on the basis of Principle I(b)
The above reasoning does not exclude the possibility that some tax amnesties (and other similar arrangements) may also have a permanent impact or be in themselves of a permanent nature Successful tax amnesties may in some cases contribute to a permanent increase of the tax base thereby also generating a permanent increase in tax revenue (in addition to the possible one-off effect) This impact is clearly of a structural nature Similarly open-ended tax settlement schemes in which taxpayers can come forward to regularise their position (in exchange for payment of an administrative fine for example) and which do not have a pre-defined (or generally understood) ending date would also not normally generate exceptional peaks in government revenue The introduction of an open-ended scheme would qualify as a structural fiscal policy measure and would have a permanent impact from its first year in force The critical distinguishing feature here is
the presence of incentives that lead to an exceptional peak in revenue
332 Peaks in tax collection triggered by the introduction or expected introduction of new tax rules
In a similar way to tax amnesties with a fixed expiration date the announcement of new tax rules may also generate significant one-off peaks in tax collection In some cases if the tax regime being introduced is considerably less favourable taxpayers may be allowed to advance their settlements to before the entry into force (or expected entry into force) of the new rules thereby benefiting from the more favourable regime for a certain number of transactions that would otherwise have come under the new regime In such cases the general government balance may profit from some exceptional revenue in the year preceding the year in which the new tax rule is applied This effect may have been created intentionally or unintentionally by the government but is usually at the expense of future revenue from after the date on which the new tax regime is actually implemented If the temporary peak in revenue is significant and clearly observable the excess revenue can be considered as a one-off A concrete example would be when the government announces a significant increase in the tax rate paid on reserved profits when a company goes into liquidation The announcement of this increase may prompt in particular owners of micro-companies close to retirement age to advance the liquidation of their company in order to ensure that they still benefit from the lower tax rate This would create a peak in the revenue collected from this liquidation tax in the year before the tax increase is introduced The treatment as a one-off measure is justified on the basis of Principle I(b)
A possible temporary reduction in tax revenue immediately following the introduction of the less favourable tax regime would not normally be classified as a one-off effect After the introduction of the new less favourable tax regime it may be normal for tax revenue to be lower for a certain period possibly up to several years This can be understood as the logical counterpart to the one-off peak in tax collection seen prior to the reform The change in tax revenue after the introduction of the reform is likely to be less pronounced however as the loss in revenue
European Commission Public finances in EMU - 2015
58
may be spread over a longer period of time The effect of lower tax revenue is deficit-increasing and may also be more difficult to quantify given the uncertainty as to what is the new steady state following the introduction of the new tax regime For these reasons the change in revenue is considered part of normal volatility and not a one-off effect
Nonetheless there are many tax reforms that may not generate a peak in tax collection If no pronounced peak in tax collection can be identified the measure should not be classified as a one-off This may be the case where for example the announced increase in the tax rate is small (eg a marginal increase in VAT) or is part of a wider tax reform where the impact of different aspects of the reform cannot be clearly distinguished
333 Permanent changes to the timing of recurrent revenue or expenditure
Permanent changes to the timing of items of recurrent revenue or expenditure may create exceptional peaks that qualify as one-offs A typical example would be a decision to permanently bring forward the settlement of income tax which would cause additional revenue to be generated from income tax in the first year following its entry into force Although the measure is permanent it creates an exceptional and temporary peak in tax revenue in its first year which should be recorded as a one-off effect A similar logic also applies to decisions to permanently delay the timing of certain categories of recurrent expenditure For example if the government usually approves a certain investment grant towards the end of the year it could at some point decide to delay the approval of applications for grants and from then on not approve them until the beginning of the following year If the expenditure were recorded as being at the date of the governmentrsquos decision to issue the grant there would be a one-off gain in the first year in which the new schedule is in force (70) The treatment as a one-off measure is justified on the basis of Principle I(c)
(70) For many transactions however changes in timing of this
type may only be visible in cash terms As a general rule following the accrual principle capital transfers in cash should be recorded as occurring at the time the liability is established regardless of the payment schedule
When a particular item of expenditure is permanently accelerated however the potential temporary effect should not be considered as a one-off This follows the logic of Principle IV the measure would be fully under the control of the government and is deficit-increasing Moreover it might be difficult to maintain that the increase in expenditure is a temporary effect resulting only from a shift in timing and to exclude entirely the possibility that it may lead to a permanent increase in the level of expenditure It is therefore prudent not to consider a measure of this type as a one-off
334 Exceptional changes to the timing of recurrent revenue or expenditure
Decisions to exceptionally shift the timing of items of recurrent expenditure or revenue also sometimes constitute one-off measures A typical example would be a decision to exceptionally shift the timing of the payment of an annually recurring investment grant thus not paying it out one year while paying it twice the following year If the government subsequently resumes its normal payment structure a transaction of this type creates a temporary fall in expenditure in the first year which is fully offset by a symmetrical temporary increase in expenditure the following year Both the deficit-reducing impact in the first year and the deficit-increasing impact the following year should be classified as one-off effects The treatment as a one-off measure is justified on the basis of Principle I(c) For the deficit-increasing part an exception to Principle IV is justified on the basis of the strict symmetry between the deficit-increasing and deficit-reducing effect of the measure
An important distinction should be made between the cases described above and decisions to shift the timing of non-recurrent items of expenditure or revenue which normally do not create one-off effects This can be illustrated using the example of a government that is planning to make an investment in a project but then subsequently postpones its plans by one year The question as to how to treat the postponement of the investment decision depends on how the investment decision was originally recorded (in particular whether the investment was considered to be a policy measure or part of the no-policy-change baseline projection) If the initial investment decision was considered to be part of the no-policy-change baseline projection
Part II Recent development in fiscal surveillance
59
(because the investment was not of exceptional size and did not alter the trend projection of investment) then the postponement of the project should also not be considered a fiscal policy measure and a fortiori also not a one-off If on the other hand the project was of such magnitude that it would have altered the no-policy-change government investment path the initial investment decision should be considered as a fiscal policy measure A decision to delay the investment to the next year would simply lead to the cancellation of the measure in the first year and the re-introduction of the same measure in the next year neither of which should be considered one-offs
335 Sales of non-financial assets (71)
A common example of a one-off measure is the sale of real estate (eg land and buildings) However it is to be noted that not all real-estate sales have the characteristics of a one-off In particular real-estate transactions that are part of the day-to-day management of government assets in which some buildings may be sold to be replaced by more suitable ones generally do not qualify as one-offs The classification of a sale as a one-off should be based on the following two criteria (i) whether the transaction contributes to a significant aggregate drop in government assets of the same type (ie the government is systematically selling off buildings or land in net terms) andor (ii) whether the measure will lead to higher recurrent costs in the future (for instance because the government is systematically substituting for ownership with rental contracts) For cases such as these the treatment as a one-off measure is justified on the basis of Principle I(a) or I(b) respectively
Payments for licences and concessions also often used to be classified as one-offs under ESA95 but their importance as a source of one-off transactions is much reduced under the ESA2010 accounting treatment Very often governments issuing licences or concessions for a number of years receive a lump-sum payment at the time when the licence or concession is granted Under ESA95 accounting rules the entire payment
(71) This paragraph refers exclusively to non-financial assets
(eg buildings land licences and concessions) as according to ESA2010 accounting rules the disposal of financial assets does not affect the general government balance
was recorded as negative expenditure at the time when this transaction took place Accordingly the payment was considered to be a one-off However the prevalence of such cases has been reduced considerably with the introduction of the ESA2010 accounting standard In particular in most cases the proceeds will now be distributed in accrual terms over the lifetime of the license (in most cases recorded as lsquoRentrsquo ESA2010 code D45) even if on cash basis the government receives the payment as a lump-sum The rent is then a recurrent source of government revenue and is obviously not a one-off Only in the remaining cases where payments are still recorded as negative expenditure (Acquisitions less disposals of non-produced non-financial assets ESA2010 code NP) at the time of the payment the transaction should be considered one-off For those cases the treatment as a one-off measure is justified on the basis of Principle I(b)
The sale of several other types of non-financial asset could also fall under this same general heading The sale of CO2 emission rights (lsquoAssigned Amounts Unitsrsquo under the Kyoto Protocol) is one of a number of clear cases in which the government is selling assets and thus generating one-off revenue at the time of the transaction Another example would be the sale of non-financial assets that the government has acquired in the context of a bank rescue operation
336 Exceptional revenue from the taking over of the assets and liabilities of pension schemes of entities classified as being outside general government
Under ESA95 accounting rules the takeover of pension funds was a frequent source of one-offs When a government takes over the assets and liabilities of pension schemes of entities classified as being outside the general government significant lump-sum payments may be made from that entity to the general government in return for the government covering future pension liabilities Under ESA95 the transfer of the assets of the fund was recorded in a single year as a deficit-improving capital transfer which was considered to be a one-off measure
Changes in the accounting treatment brought in under ESA2010 are likely to mean that transactions of this type are a much less
European Commission Public finances in EMU - 2015
60
frequent source of one-offs Providing the assets transferred to the government and the actuarial value of the pension schemersquos future liabilities are balanced under ESA2010 the lump-sum payment received by the government should now be recorded as a financial transaction that does not have an impact on the general government deficit In accrual terms the revenue will very generally speaking be distributed over the years in which the liabilities of the scheme materialise Overall the general government balance is not affected by a balanced pension fund transfer and the impact on revenue and expenditure will be recurrent
In the case of an unbalanced pension fund transfer however any assets transferred to the general government in excess of the liabilities would still qualify as a one-off When the assets of the pension fund are greater than the liabilities the excess transfer of assets (ie the part not matched by liabilities) would be recorded as a deficit-improving capital transfer at the time of the takeover This would imply that the government was generating lump-sum revenue by drawing on its assets (or those of public companies under its control) and the revenue should therefore be recorded as a one-off The treatment as a one-off measure is justified on the basis of Principle I(a)
When the assets of the pension scheme are smaller than the liabilities the resulting capital transfer should not be considered a one-off This treatment is justified by the fact that the transfer is in this case deficit-increasing and fully under the control of the government not classifying this as a one-off is fully consistent with Principle IV
337 Temporary peaks in revenue or expenditure resulting from a ruling issued by a court or another independent authority or from major statistical revisions
Court rulings (and decisions issued by other independent authorities) may give rise to significant and very short-term positive or negative peaks in government revenue or expenditure which qualify as one-offs Court rulings often lead to lump-sum payments designed to compensate for damages or implicit liabilities that have accumulated over a long period of time (often without the government being aware of
them) These rulings can usually be considered to be lsquoexceptional eventsrsquo as defined above and any peak in government revenue or expenditure directly resulting from them can therefore be classified as a one-off Important issues to consider in assessing the one-off nature are (i) whether the ruling or decision can be considered as an exceptional event (which may require a certain degree of judgement) and (ii) whether the resulting revenueexpenditure measures were directly prompted by the ruling or decision (the effect of any decision made by the government in excess of what is ordered by the court would normally not qualify as a one-off) Typical examples would be the reimbursement of taxes or subsidies that were found to be unlawful Any recurrent impact the court ruling may have would also of course not qualify as a one-off A very similar justification could also be given for fines paid following a decision taken by another independent authority (such as the EU) The treatment as a one-off measure is justified on the basis of Principle I(d)
A similar conclusion could be reached for reimbursements from or additional payments to the EU budget made necessary by major statistical revisions or changes in EU legislation When such reimbursements or additional payments exceed the level of normal fluctuations and are linked to over- or underpayments from several years there would be clear grounds for qualifying them as one-offs The major statistical revision or change in EU legislation that triggers the reimbursementpayment could be considered an exceptional event with budgetary implications that are beyond the control of a single Member State (a circumstance which also justifies the classification as a one-off in the case of deficit-increasing payments) When major statistical revisions of this type affect all Member States simultaneously the impact of such revisions is classified as one-off for all Member States for the sake of consistency even if the 01 of GDP criteria is not met for some countries The treatment as a one-off measure is justified on the basis of Principle I(d) An exception to Principle V is also justified for reasons of equal treatment
The one-off nature of reimbursements of or financial corrections to EU funds by Member States following a decision issued by an EU institution (eg in cases where not all conditions
Part II Recent development in fiscal surveillance
61
attached to the funding have been met) may be more difficult to assess On the one hand such reimbursements or corrections may occur quite frequently as the Commission reviews the eligibility of operational programmes and funded projects and whether they are meeting the conditions of the funding on a continuous basis The reimbursements and corrections may also involve relatively small amounts In view of this these payments should be considered a normal recurrent feature of government finances (ie part of normal volatility) and do not qualify as one-offs according to Principle III On the other hand in exceptional cases (in particular towards the end of a programming period) the Commission may undertake a more extensive audit potentially covering a wide range of projects (eg all the projects being carried out under a specific operational programme) and in particular a number of successive years The results of the audit could lead to very short-term reimbursements or corrections of a higher value connected with irregularities that have been accumulating over a much longer period of time In such cases the audit could be considered an exceptional event in a similar way to a court ruling and the resulting reimbursements or corrections would therefore qualify as one-off measures In summary a reimbursement or correction must meet all of the following criteria simultaneously in order to be classified as a one-off (i) the reimbursement or correction should be linked to a single exceptional event (ii) the impact should exceed the level of normal fluctuations (iii) the reimbursement or correction should relate to irregularities that have accumulated over several years and (iv) the impact is recorded in at most two successive years in accrual terms When the above conditions are met the treatment as a one-off measure is justified on the basis of Principle I(d)
Given however the complexity of these cases the temporary nature of reimbursements of or corrections to EU funding may be difficult to assess ex ante It is conceivable that for practical reasons (such as the capacity of the audit service to screen a large number of projects in a short period of time) the reimbursements or corrections take place over a longer period of time which would give grounds for a strong presumption that at least part of the impact has a more structural nature An ex post review of the one-off nature may therefore
be required This could lead to a reclassification or partial reclassification of a measure
338 Short-term costs associated with emergency response to major natural disasters or other exceptional events
The short-term cost of emergency measures taken by a government in response to a major natural disaster may be considered as a one-off even if these measures are deficit-increasing The classification as a one-off depends on all conditions for an exceptional event being fulfilled In particular the exceptional event must (i) be a specific punctual occurrence (eg an unusual amount of rainfall throughout the year would not normally qualify whereas a specific storm of exceptional magnitude could) and (ii) have a sudden impact on the revenueexpenditure or assetsliabilities of the general government or the country exceeding the level of normal fluctuations meaning that the government is forced to react Consistent with the general approach to exceptional events only costs that are directly and immediately caused by the disaster can be considered one-offs ie the cost of the measures needed in order to limit the damage to the government or to the country and to prevent the disaster from having an even more significant impact (eg direct medical relief and shelter for victims and the cost of limiting pollution or destruction) As a rule compensatory payments to households or businesses which are not directly triggered by the exceptional event and for which the government has a larger degree of discretion would not be considered as one-offs Generally expenditures that follow with a considerable delay after the exceptional event are less likely to be true emergency costs even though they may still be linked (indirectly) to the event The exceptional nature of such costs depends on the size of the country and on country-specific factors These are therefore the factors which should be considered when deciding whether to classify a measure as a one-off (For example a forest fire of a certain magnitude might be considered as an exceptional event if it occurs in a particularly small Member State but not if it is in a very large Member State) The treatment as a one-off measure is justified on the basis of Principle I(d)
Short-term emergency costs may also relate to events other than natural disasters A case in
European Commission Public finances in EMU - 2015
62
point is a capital transfer by the government to systemic banks to prevent them from collapsing The potential collapse of a systemic bank can be considered an exceptional event that is beyond the control of the government and could potentially have a major impact on the economy Furthermore the action taken by the government to prevent systemic damage to the financial system and the economy as a whole can be considered as a direct response to this exceptional event which as stated the government could not have avoided Note however that in the wake of the 2008 financial crisis no explicit distinction was made between government intervention to prevent the collapse of systemic and non-systemic financial institutions all deficit-increasing capital injections into distressed financial institutions have been treated as one-offs (72) The treatment as a one-off is justified on the basis of Principle I(d)
34 STANDARD CASES NOT TO BE CONSIDERED ONE-OFFS
This section sets out a number of measures generally not considered to be of a one-off nature This list should be read in conjunction with the list of measures that are typically one-offs provided in the previous section It contains a variety of measures that have a number of borderline characteristics This section explains the reasons why on the basis of the principles listed above and after careful consideration these measures have not however been classified as one-offs
341 Participation in large-scale military operations
The potentially considerable budgetary cost of participation in large-scale military operations does not generally qualify as a one-off In particular international conflicts do not generally qualify as exceptional events as referred to in Principle I as (i) the event triggering the intervention does not usually have an immediate and sudden impact on expenditure or on the assets of the government or the country but instead has
(72) Also in the opposite case when following a bank rescue
operation the government is recovering part of the injected capital in the form of a capital transfer from the financial corporation this transaction would be considered one-off
an impact in the medium term (ii) the cost of the intervention is often recurring or spread over several years (despite large-scale operations often being announced as temporary) and Member States often engage in several operations (of varying scale and budgetary impact) simultaneously or in rapid succession further substantiating the conclusion that this cost is a structural feature of government expenditure and (iii) given that the measure is deficit-increasing it should also be taken into consideration that many of these operations are for the most part within the control of the government The rejection as a one-off measure is justified on the basis of Principles I and IV
342 Large-scale infrastructure works and acquisition of military equipment
In the same way as any other form of government investment large-scale infrastructure works and expenditure on military equipment are considered a structural component of government expenditure Even if the budgetary impact of individual transactions is sufficiently sizeable to be considered a deviation from the no-policy-change baseline and therefore recorded as a fiscal policy measure such measures are not considered as one-offs as they are deficit-increasing and fully under the control of the government The rejection as a one-off measure is justified on the basis of Principles I and IV
343 Exceptional dividends from state-owned enterprises and central banks
Property income (including dividends from state-owned enterprises (SOEs) and central banks) is a regular and structural source of government income Although property income can show a certain degree of volatility changes in revenue from property (including dividends) that occur as a result of normal economic fluctuations should not be categorised as one-offs Such fluctuations are moreover not a fiscal policy measure The rejection as a one-off measure is justified on the basis of Principle III
Fluctuations in dividends may not be caused only by volatility in the underlying profits but also by changes in the lsquonormalrsquo dividend policy Dividend policies (which the government as the owner of the company may have significant
Part II Recent development in fiscal surveillance
63
influence on) could for example include a rule that a certain fraction of the entrepreneurial profit is paid out to the companyrsquos shareholders A decision to change the fraction of profits to be paid out even temporarily although qualifying as a policy measure should however not be considered as a one-off The reason for this lies in the general principle that one-offs cannot be decreed by law or by an autonomous government decision Opening up the possibility to classify cases of this type as one-offs would inevitably lead to multiple ex post revisions as temporary deviations from the lsquonormalrsquo policy can be repeated and may eventually replace the lsquonormalrsquo policy A similar reasoning would apply to cases where SOEs do not have a lsquonormalrsquo dividend policy (ie where the dividend is fixed every year on an ad hoc basis) Changes made to the dividend of these SOEs would also not qualify as one-offs The rejection as a one-off measure is justified on the basis of Principle II
Changes in the profits of corporate or central banks may nonetheless qualify as one-offs if they are the result of an exceptional event Whereas the 2006 Report on Public Finances in the EMU mentioned lsquoexceptional dividends of state-owned companiesrsquo as part of the lsquoindicative and open list of one-off measuresrsquo the current provisions clarify that normal volatility and changes in dividend policy do not qualify as lsquoexceptionalrsquo Instead a dividend being classified as one-off is strictly linked to the existence of an exceptional event in accordance with Principle I(d) It should however be noted that such cases are likely to remain rare in view of the ESA2010 provisions on lsquosuper dividendsrsquo According to ESA2010 a dividend payment exceeding the lsquoEntrepreneurial income (ESA2010 code B4) excluding holding gainsrsquo of a state-owned enterprise should be recorded as a financial transaction (lsquoCapital withdrawalrsquo ESA2010 code F5) not affecting the general government balance In practice many lsquoexceptionalrsquo dividends may therefore turn out to be super dividends thus precluding possible classification as a one-off
344 Exceptionally high tax revenue not attributable to changes or announced changes to tax rules
Exceptionally high tax revenue that is not the result of changes or announced changes to tax
rules is not a one-off In some cases exceptionally high tax revenue (in particular from corporate taxation or wealth taxes) can be attributed to significant fluctuations in the tax base unrelated to any change or announced change to tax rules or to any other policy measure This is the case for example if taxes are only levied when certain profits are paid out or when certain holding gains materialise In such cases profits or holding gains that have accumulated over many years may become taxable in a single year giving rise to a potentially significant peak in tax revenue The absence of any change in tax legislation or of a link to a policy measure introduced before or after the peak supports the view that such variations are part of the lsquonormalrsquo economic fluctuations inherent to the design of the tax system (although they can have a very sizeable temporary impact) and should not be confused with (one-off) fiscal policy measures The rejection as a one-off measure is justified on the basis of Principle III
345 Hosting major events including major sports events
The budgetary impact of hosting major events including major sports events should not be considered a one-off The organisation of events of this type is fully under the control of the government and therefore does not qualify as a potential one-off The rejection as a one-off measure is justified on the basis of Principle IV
346 Revenue from the exploitation of non-renewable natural resources
Revenue resulting from the exploitation of non-renewable natural resources is not considered a one-off Strictly speaking it could be argued that revenue resulting from the exploitation of non-renewable natural resources (such as oil coal and gas) goes hand-in-hand with a depletion of the stock of these resources and therefore that it has one of the particular characteristics of a one-off (see Principle I(a) above) Nevertheless given the typically very long period of time over which it is generated (usually several decades) regular revenue from the exploitation of non-renewable natural resources is considered to be recurrent The rejection as a one-off measure is justified on the basis of Principle I
European Commission Public finances in EMU - 2015
64
347 Costs related to the EU presidency
Costs related to the EU presidency are not considered to be a one-off but are viewed as a structural component of EU membership In particular costs related to the EU presidency should not be considered exceptional events as defined in Principle I(d) as the costs are at least partly under the control of the government and in practice rarely exceed what could be considered normal fluctuations Moreover the expenditure is deficit-increasing An additional consideration is that in practice it is very difficult to distinguish costs related to the EU presidency from other administrative costs which complicates the task of estimating their impact The rejection as a one-off measure is justified on the basis of Principles I and IV
348 Financial support to SOEs including loss-making SOEs
Providing financial support to loss-making state-owned enterprises is as a rule not considered a one-off This can be explained by considering the statistical treatment of expenditure of this type whenever the government provides funds while receiving something of equal value in return and expecting to earn a sufficient rate of return this is recorded as a financial transaction (eg loans or the acquisition of equity) Since this does not affect the general government balance it can also not be considered a one-off The cases that do not fall into this category are mainly transactions that are recorded as lsquoCapital transfersrsquo (ESA2010 code D9) ie transactions where the government either (i) does not receive equal value in exchange (ii) does not expect a sufficient rate of return or (iii) provides funds to a corporation that has shown a series of losses in the recent past In many cases the loss-making nature of the SOE receiving the transfer is a structural feature which would preclude qualifying its need for financial support as an exceptional event In addition allowing financial support to SOEs to potentially be classified as a one-off measure would actually create an incentive for policymakers to let losses accumulate until the point where they are large enough to be absorbed in the form of a one-off measure Moreover the decision to grant support to the SOE under the conditions mentioned above is fully under the control of the government and clearly deficit-increasing Overall these arguments
clearly support a decision not to classify such transactions as one-offs The rejection as a one-off measure is justified on the basis of Principles I and IV
One possible exception could be government expenditure directly related to the privatisation or voluntary liquidation of an SOE (termination costs) The aim of this expenditure is very specifically to allow the privatisation of a loss-making SOE or to terminate its operations entirely In these exceptional cases the deficit-increasing impact of the underlying transaction(s) could be accepted as a one-off provided that (i) the government has entirely renounced control of the company and will have no further financial involvement or the company itself ceases to exist (therefore precluding a possible recurrence of the transaction) or (ii) the transaction can be unequivocally demonstrated to be beneficial for public finances by virtue of the fact that it permanently cleans up the accounts of the loss-making SOE (for instance by closing down loss-making subsidiaries or business units) and permanently halts the recurrent stream of liabilities originating from it
An additional complication may arise when support to SOEs including loss-making SOEs takes the form of guarantees which may be called at some point in time Whilst a guarantee has not been called it forms a contingent liability for the government Once it has been called it creates a capital transfer which is economically very similar to that which occurs when a government provides support to a loss-making SOE by means of a direct capital injection especially in terms of the expected change in the financial situation of the company and the budgetary impact of the transaction for the government Differentiating between the two types of transaction in terms of their one-off treatment may therefore lead to regulatory arbitrage with the method that is subject to less stringent treatment in terms of budgetary surveillance becoming the preferred way to provide financial support to SOEs Similarly to capital injections into SOEs including loss-making SOEs these transactions should thus as a rule not be considered as one-offs The rejection as a one-off measure is justified on the basis of Principles I and IV
Part II Recent development in fiscal surveillance
65
A call of guarantees could nonetheless constitute a one-off if it has been prompted by the occurrence of an exceptional event As the classification of this measure as a one-off would however still depend on (i) the company being in good financial shape when it received the guarantee (ie not loss-making) (ii) the call and the release of the guarantee being connected to an exceptional event as referred to in Principle I (in particular an event which is beyond the control of the government and with an impact that significantly exceeds normal economic fluctuations) (iii) government guarantees of this kind being an exceptional practice in the sector or in the economy in general and (iv) the company not having previously benefited from similar guarantees Non-compliance with any of these requirements would constitute a strong argument against considering the call as a one-off measure
4 THE COMMUNICATION ON MAKING THE BEST USE OF FLEXIBILITY WITHIN THE STABILITY AND GROWTH PACT
66
This chapter presents the rationale behind and the practical implications in the context of the preventive arm of the SGP (see Chapter II2) of the Commission Communication Making the best use of flexibility within the existing rules of the Stability and Growth Pact (73) issued on 13 January 2015 The Communication provided new guidance on the implementation of the Stability and Growth Pact (SGP) with the aim of ensuring that best possible use is made of the flexibility that is built into the existing rules of the SGP rather than changing these rules As a result no legislative steps were needed and the Commission was able apply this new guidance immediately (74)
The new guidance is designed to strengthen the link between structural reforms investment and fiscal responsibility in order to support jobs and growth Its three specific aims are (1) to encourage the effective implementation of structural reforms (2) to promote investment also through the new European Fund for Strategic Investment (EFSI) (75) and (3) to better take into account the economic cycle in individual Member States The last of these three points is discussed in Section II22 of this report The aim of the first two points is to take into account the short-term budgetary cost of major structural reforms and of certain types of government expenditure on investment provided that they improve the sustainability of public finances including through the expected positive impact on potential output Overall the new guidance should thus contribute to a more growth-friendly fiscal stance in the euro area (76)
(73) COM(2015) 12 of 13 January 2015 (74) Some details relating to the implementation have been
recently discussed in the Committees See Section II43 (75) The EFSI set up jointly by the Commission and the
European Investment Bank (EIB) offers a new risk-bearing capacity which allows the EIB to invest in equity subordinated debt and higher risk tranches of senior debt and to provide credit enhancements to eligible projects
(76) See ECB President Mario Draghirsquos speech of 22 August 2014 [T]he existing flexibility within the rules could be used to better address the weak recovery and to make room for the cost of needed structural reforms [hellip] [I]t may be useful to have a discussion on the overall fiscal stance of the euro area Unlike in other major advanced economies our fiscal stance is not based on a single budget voted for by a single parliament but on the aggregation of eighteen [as of 1 January 2015 19] national budgets and the EU budget Stronger coordination
This guidance clarifies that equal treatment under the SGP does not mean taking a lsquoone-size-fits-allrsquo approach Equal treatment for all Member States and the predictability of the rules are central principles of the SGP The Commission Communication on flexibility within the SGP is of an interpretative nature (77) as it provides additional guidance without changing or replacing the existing rules As such it does not in any way modify the SGP itself but clarifies that its implementation needs to be combined with an economic assessment of each countryrsquos requirements as determined by the situation in that particular country
It is also on purpose that some discretion is left within the agreed rules for the Commission and the Council to assess the soundness of public finances in the light of country-specific circumstances in order to recommend the best course of action based on the latest developments and information
Nonetheless flexibility is subject to safeguards and conditions Member States can only take advantage of flexibility if they meet certain conditions in an ex ante assessment In addition delivery of the planned reforms on the basis of which the Member State has met the ex-ante conditions is checked in an ex post assessment Failure to implement announced structural reforms or to co-finance investment projects can result in the revocation of the additional flexibility granted and ultimately lead to sanctions This ensures that the credibility and effectiveness of the SGP in upholding fiscal responsibility are preserved
The degree of flexibility allowed depends on whether a Member State is in the preventive or the corrective arm of the SGP The aim of the
among the different national fiscal stances should in principle allow us to achieve a more growth-friendly overall fiscal stance for the euro area
(77) For another example of an interpretative Communication see Commission interpretative communication on certain aspects of the provisions on televised advertising in the lsquoTelevision without frontiersrsquo Directive OJ C 101 2842004 p 2
Part II Recent development in fiscal surveillance
67
preventive arm as mentioned in Chapter II2 of this report is to ensure that Member States have sound and sustainable public finances thus allowing fiscal policy to perform its counter-cyclical role when needed Given its forward-looking perspective the preventive arm can accommodate under certain conditions temporary and limited deviations from the medium-term budgetary objective (MTO) or the adjustment path towards it provided that these deviations are the result of measures that are ultimately expected to strengthen the sustainability of public finances This is the case for certain types of government expenditure on investment and for certain structural reforms In contrast the main purpose of the corrective arm is to ensure the prompt correction of existing excessive deficits Implementing structural reforms or additional spending on investment cannot therefore be accepted as lsquomitigating factorsrsquo to excuse a lack of effective action to correct an existing excessive deficit Structural reforms and contributions to the EFSI can however be taken into account as relevant factors at particular stages of the procedure in particular when deciding whether to open an Excessive Deficit Procedure (EDP) when setting or extending the deadline to correct the excessive deficit and when closing an EDP
The remainder of this section focuses on the guidelines on the treatment of structural reforms and investment It first presents the implementation of the provision of the SGP mdash which go under the name of the lsquostructural reform clausersquo and the lsquoinvestment clausersquo mdash as proposed by the Commission describing their legal basis the eligibility conditions and the procedure for their activation including the various safeguards that apply to this (Sections II41 and II42) Section II43 indicates how flexibility relating to structural reforms and investment expenditure is managed under the corrective arm of the SGP
41 TAKING INTO ACCOUNT STRUCTURAL REFORMS IN THE PREVENTIVE ARM THE STRUCTURAL REFORM CLAUSE
411 Legal background and eligibility conditions
The preventive arm provides the flexibility needed to support structural reforms without
compromising prudent fiscal policy making The SGP allows Member States implementing major structural reforms to deviate temporarily from the MTO or the adjustment path towards it in recognition of the short-term costs of reforms that will have positive budgetary effects in the long term including by increasing potential growth (78) The SGP thereby provides a form of budgetary incentive for implementing major structural reforms thus supporting this process
The structural reform clause allows a temporary deviation subject to clearly defined conditions These are of three types the first group of conditions relates to the nature of the reforms in terms of their impact the second group relates to the status of the reforms with respect to implementation and the third group relates to the Member Statersquos compliance with some explicit requirements displayed in the SGP These conditions are set out in more detail below and are summarised in Table II41 which also describes the procedure for allowing a deviation and the limits of the deviation itself
Conditions relating to the nature of reforms
Structural reforms need to meet a number of conditions relating to their impact and in order to be considered eligible They must (i) have a verifiable positive impact on the long-term sustainability of public finances and (ii) have a major impact
Whether structural reforms have an impact on the long-term sustainability of public finances is arguably difficult to assess It is neither possible (from a legal or an economic perspective) nor desirable to set up an exhaustive list of structural reforms that qualify for the temporary deviation Providing some broad guidance can however restrict the type of reforms which may be eligible There are two possible channels through which reforms can affect public finances in the long run First some structural reforms may generate a direct budgetary impact as is the case for example for pension reforms healthcare reforms and reforms to the civil service In addition some structural reforms may improve the sustainability of public finances via an indirect
(78) Article 5 of Council Regulation (EC) No 146697
European Commission Public finances in EMU - 2015
68
effect as they help to create higher potential output and thus lead to higher future government revenue At the same time some structural reforms may also generate budgetary costs particularly in the short run A qualitative assessment of a reformrsquos impact on the sustainability of public finances should therefore encompass all these possible budgetary effects
This assessment is to be conducted by the Commission and the Council on the basis of information provided by Member States The Code of Conduct of the SGP (79) states that the effects of the reforms over time lsquoare to be assessed by the Commission and the Council in a prudent way making due allowance of the margin of uncertainties associated to such an exercisersquo In practice the Commissionrsquos assessment builds on the information provided by the Member State on both the costs and savings directly caused by the reform and on the indirect budgetary impact it may have as a result of its potential effect on output Annex 1 to the Code of Conduct of the SGP which details the structure of the stability and convergence programmes (SCPs) stipulates
(79) Specifications on the implementation of the Stability and
Growth Pact and guidelines on the format and content of the stability and convergence programmes
that Member States should include information on the implications of major structural reforms for growth and public finances when submitting their economic and budgetary projections On the basis of the information provided by the Member State (80) the Commission makes an informed judgement as to whether the reform meets the condition that it must improve the sustainability of public finances
The second condition is that reforms must have a major impact The combined effect of a number of reforms can be considered when assessing whether this condition has been met While some individual reforms such as pension reforms may have a major positive impact on growth and the long-term sustainability of public finances well-designed and comprehensive packages of reforms addressing structural weaknesses can also be equally effective This is notably the case when the reforms introduced are mutually reinforcing thanks to an appropriate policy mix and effective sequencing of their implementation
(80) Member States applying for the use of the structural reform
clause are also requested to include in both their SCP and their National Reform Plan a table with a detailed description (including the budgetary impact) of each structural reform
Table II41 Overview of the clauses relevant to the preventive arm
Source Commission services
Part II Recent development in fiscal surveillance
69
Conditions relating to the implementation of reforms
Reforms can only be considered for eligibility for the clause after they have been adopted and their implementation must be monitored (81) It may however take time for the reform to show an effect and its implementation may be subject to delays and setbacks Where the reform in question has not yet been fully implemented the Commission will therefore monitor its implementation (82) This is to ensure that the reform is being enforced correctly and that it is having the intended effect
This condition is subject to a safeguard designed to prevent moral hazard If it is found ex post that a Member State has failed to implement the agreed reforms the allowed deviation from the MTO or the adjustment path towards it will no longer be considered as justified If in such cases there has been a significant deviation from the MTO or the path towards it the Commission will launch a Significant Deviation Procedure (SDP) (see Chapter II2 above)
Conditions relating to the Member Statersquos compliance with the requirements of the SGP
In order to ensure as far as possible that Member States respect the requirement to reach the MTO within the period covered by the SCP and that they maintain a margin of safety relative to the 3 -of-GDP threshold three additional eligibility conditions relating to Member Statesrsquo budgetary situation are attached to the clause These conditions place various limits on the headline and structural balances allowed when a Member State deviates from its MTO or the adjustment path towards it (83) The structural reform clause can only be
(81) Code of Conduct of the SGP p 7 lsquoOnly adopted reforms
should be considered provided that sufficient detailed information is provided in the Stability and Convergence Programmesrsquo
(82) While the SGP does not provide the means for monitoring the enforcement of structural reforms the legal framework in which the SGP operates mdash notably the European Semester exercise and the Excessive Imbalances Procedure (Regulation (EU) No 11762011 of the European Parliament and of the Council) mdash allows the Commission and the Council to assess the challenges and imbalances requiring structural reforms and to monitor action taken by the Member States
(83) Council Regulation (EC) No 146697
applied if all three of the conditions listed below are met and continue to be met once the clause is in application
bull the Member State remains in the preventive arm of the SGP
bull the Member State maintains a safety margin relative to the 3 -of-GDP deficit threshold (84) and
bull the budgetary position is expected to return to the MTO within the duration of the programme (ie by the year t+4 at the latest with t being the year in which the SCP is submitted)
This last condition is considered to be fulfilled if i) the initial distance from the MTO does not exceed 15 of GDP and the Member State respects its minimum benchmark (85) To ensure that a Member State returns to the MTO within the four-year period while allowing a maximum deviation of 05 of GDP a maximum initial distance that the Member State can be from the MTO at the time of applying for the clause must be set It is however not possible to determine with certainty four years in advance in which year a Member State is supposed to reach its MTO This is because for each year the adjustment required from a Member State is set only in the previous year in line with the matrix of requirements To overcome this uncertainty the Commission assumes as a simplification that the benchmark adjustment mdash the adjustment required in lsquonormal timesrsquo as explained in Table II22 mdash will apply namely an annual adjustment of 05 of GDP On this basis the maximum initial distance from the MTO is 15 of GDP in the year that the Member State applies to be allowed to use the clause
In addition a Member State that has benefited from the structural reform clause will not be
(84) The Code of Conduct stipulates that this safety margin
should be determined so as to take account of past output volatility and budgetary sensitivity to fluctuations in output This implies that the structural balance should be equal to or above the minimum benchmark (see Chapter II2 of this report)
(85) The minimum benchmark is a level of structural balance which takes into account past output volatility and budgetary sensitivity to output fluctuations With a structural balance at the minimum benchmark a Member State is likely to still respect the 3 deficit limit in case of economic downturn
European Commission Public finances in EMU - 2015
70
allowed to apply for it again until it has reached its MTO This restriction maintains the integrity of the MTO as the cornerstone of the preventive arm If the clause were allowed to be applied multiple times or more than once concurrently this could in effect negate the requirement for Member States to achieve their MTOs in the medium term This conclusion is supported by the record of Member Statesrsquo success in achieving their MTOs since the inception of the SGP Several Member States have consistently failed to meet their MTOs
412 Activation of the structural reform clause
Procedural requirements
The structural reform clause is activated on the request of the Member State concerned subject to compliance with the eligibility conditions Member States that wish to apply for the structural reform clause are required to present a comprehensive and detailed medium-term structural reform plan on the basis of which compliance with the eligibility criteria is assessed ex ante The plan mdash which can be included in the National Reform Programme and must be presented in the SCP together with the request for application of the clause mdash must include well-specified measures and must set credible timelines for their adoption and delivery The implementation of the reforms is then closely monitored as part of the European Semester exercise If the Member State is subject to an Excessive Imbalances Procedure (EIP) and has submitted a Corrective Action Plan containing the information required the implementation of the reforms is monitored within the EIP In both cases Member States are expected to provide in-depth and transparent documentation This documentation should quantify the impact of the reforms proposed both on the medium-term budgetary plans and on potential growth and should provide details of the timetable for implementation of the reforms
Pension reforms are subject to a specific assessment by Eurostat Pension reforms that introduce a multi-pillar system including a mandatory fully-funded pillar constitute a specific case and are therefore subject to slightly different conditions than other structural reforms For reforms of this type the allowed deviation is equal to the direct incremental impact of the reform on
the general government balance (86) The basis for this is that some contributions and other items of revenue that used to be recorded as government revenue are now being diverted to a pension scheme that is classified as being outside the general government sector thus causing an immediate increase of the deficit At the same time the corresponding outstanding pension obligations and other social benefits which used to be items of government expenditure are taken over by the pension scheme If a Member State wishes to make use of the clause allowing deviation from the MTO or the adjustment path towards it on the grounds of a pension reform it must liaise with Eurostat to verify the eligibility of the reforms envisaged It must also include in its SCP the cost incurred in the first year following the introduction of the reform and any annual incremental costs that will be incurred in subsequent years
The allowed deviation
The allowed deviation is effective from the year following the Member Statersquos application for the clause As indicated in Chapter II2 of this report the adjustments required each year to both the structural balance and the expenditure benchmark are set on the basis of the previous yearrsquos spring forecast The temporary deviation allowed on the basis of structural reforms included in the update of the SCP submitted in year t is effective from year t+1 onwards
The Communication on flexibility within the SGP differentiates between pension reforms and other types of structural reforms when determining the size of the deviation allowed In the case of a pension reform the allowed deviation from the adjustment path towards the MTO or from the MTO itself is equal to the direct incremental impact of the reform on the general government balance There is therefore no numerical cap on the magnitude of the allowed deviation In the case of other structural reforms however the allowed deviation cannot exceed 05 of GDP It is recognised that the costs and benefits of these other types of structural reforms cannot be estimated with certainty hence the need to put a cap on the allowed deviation The costs associated with pension reforms are however
(86) In accordance with Council Regulation (EC) No 146697
Part II Recent development in fiscal surveillance
71
directly measurable and can be verified by Eurostat
Box II41 explains how the adjustment path is determined when the structural reform clause is applied If a Member State is at the MTO it can depart from it for a period of three years by the amount of the allowed deviation If a Member State is converging towards the MTO a temporary deviation from the convergence path towards the MTO is allowed between year t+1 and year t+3 (87) As from the fourth year the Member State
(87) This also implies that a Member State adjusting towards
the MTO would be entitled to halt that adjustment if while
cannot deviate anymore from the MTO or the convergence path In the benchmark case of a 05 of GDP adjustment this mechanism implies a return of the Member State to its MTO As shown in Box II41 the method described reflects the fact that the allowed deviation is effective from year t+1 and that the Member State concerned is expected to achieve its MTO by the year t+4 at the latest
being entitled to the deviation they reach the point where they are at a distance from their MTO equal to the size of the temporary deviation)
European Commission Public finances in EMU - 2015
72
42 TAKING INVESTMENT INTO ACCOUNT IN THE PREVENTIVE ARM THE INVESTMENT CLAUSE
421 Legal background and eligibility conditions
Certain types of investment that increase potential growth are deemed to be equivalent to major structural reforms and may under certain conditions justify a deviation from the requirements set out in the preventive arm In a letter of 3 July 2013 from former Commission Vice-President Olli Rehn to the EU finance ministers the Commission provided some initial guidance on the application of the provisions allowing this deviation(88) This guidance commonly referred to as the lsquoinvestment clausersquo was further refined and formalised in the Commission Communication on flexibility within the SGP As a result a temporary deviation from the MTO or the adjustment path towards it may be permitted if it allows a Member State to finance certain specific investments that have positive direct and verifiable long-term effects on growth and on the sustainability of public finances
In the same way as the structural reform clause the investment clause is also subject to certain conditions These are of three types the first group of conditions relates to the nature of the investment in question the second group relates to the Member Statersquos economic situation and the third group common to both clauses relates to the Member Statersquos compliance with compliance with the requirements of the SGP These conditions are set out in more detail below and are summarised in Table II41 which also describes the procedure for allowing a deviation and the limits of the deviation itself
Conditions relating to the nature of government investment
The deviation must be the result of national expenditure on projects co-funded by the EU This includes expenditure on projects funded under the Structural and Cohesion policy (89) the Trans-
(88) In accordance with Article 5(1) of Council Regulation (EC)
No 146697 (89) Including projects co-financed through the Youth
Employment Initiative
European-Network and the Connecting Europe Facility and national co-financing of investment projects also co-financed by the EFSI EU-sponsored government investment relates to projects whose overarching objective is to promote long-term sustainable growth These projects are expected to have positive direct and verifiable effects on growth and therefore on the sustainability of public finances
Moreover co-financed expenditure should not be being used to substitute for nationally financed investment This condition is included in order to ensure that total public investment is not reduced given that the aim of the investment clause is not to deter public investment but on the contrary to encourage Member States to pursue productive investment in difficult economic conditions To assess whether this condition is being met the Commission checks that there will not have been any decline in gross fixed capital formation over the first year that the clause is applied on the basis of its economic forecasts
Conditions relating to the Member Statersquos economic situation
To be eligible for this clause a Member State needs to be considered to be in lsquobad economic timesrsquo or worse As defined in the matrix used in the SGP for determining the adjustments Member States are required to make this means that GDP growth is negative or that output is sufficiently below its potential to result in a negative output gap of over 15 of GDP This condition relates to the year for which the Member State requests application of the clause (90)
Conditions relating to the Member Statersquos compliance with the requirements of the SGP
As in the case of the structural reform clause the Member Statersquos headline and structural balance must remain within certain limits if the investment clause is being applied The relevant
(90) In contrast to the approach described in the guidance
previously given on the original investment clause introduced in 2013 the Commission will now apply the clause irrespective of the economic situation in the euro area or in the EU as a whole thus making it dependent only on the cyclical conditions faced by individual Member States The countries to have benefited from the investment clause are Bulgaria (2013 and 2014) and Slovakia (2014)
Part II Recent development in fiscal surveillance
73
conditions are identical to those presented in Subsection II412
Furthermore as was the case for the structural reform clause a Member State already benefiting from some allowed deviation cannot apply for the investment clause until the MTO has been achieved
422 Activation of the investment clause
Procedural requirements
The investment clause is activated ex ante when a Member State makes a request in its SCP It is subject to compliance with the eligibility conditions To be eligible to benefit from the clause in the year t+1 Member States should include the following information in their SCPs for year t i) the forecast path of national co-financing expenditure ii) detailed information on the positive direct and verifiable long-term budgetary effects of the expenditure covered by the clause and iii) the lsquocorrected pathrsquo that the structural balance would follow were the clause applied Moreover in the year following the year during which the clause has applied the Member State should report on the actual level of co-financing in its SCP
The allowed deviation
The temporary deviation allowed ex ante depends on the commitments made from the EU structural funds in favour of the Member
State concerned and on the level of planned co-financing The allowed deviation from the MTO or the adjustment path towards it is equal to the total amount of co-financing in the first year of application of the clause In the following years given that the national co-financing of EU-funded projects constitutes recurrent expenditure only positive incremental changes would be added to the temporary deviation originally allowed provided that the Member State continues to meet the other eligibility criteria This is intended to give Member States an incentive to increase investment and to take into account the proportion of investment that could potentially be co-funded in eligible Member States Incremental increases to the temporary deviation allowed are assessed and granted on the same basis as the initial temporary deviation ie Member States need to request an increase in their SCPs the previous year
As a safeguard the allowance will be reviewed ex post to allow the actual level of co-financing to be taken into account If the actual level of co-financing as shown in data available in year t+2 falls short of the projected level a correction reflecting the difference between the actual and the expected level will be added to the required change in the structural balance This could potentially lead to the opening of an SDP
Box IV42 explains how the adjustment path is determined when the investment clause is applied As for the structural reform clause the method described reflects the fact that the Member State concerned is expected to converge towards
European Commission Public finances in EMU - 2015
74
the MTO by the year t+4 at the latest the allowed deviation having been applied from year t+1
43 THE ECOFIN COUNCIL OF 8 DECEMBER 2015
The ECOFIN Council on 8 December 2015 confirmed a common position on the implementation of flexibility within the SGP on the basis of the draft agreed by the Economic and Financial Committee (91) The commonly agreed position specifies
minus The deviation allowed to Member States benefitting from the investment clause is capped at 05 of GDP The cumulative deviation allowed to Member States benefitting from the investment clause and the structural reform clause is capped at 075 of GDP
minus The possibility to request the application of the flexibility clauses also in autumn after the relevant Country-Specific Recommendation has been set by the Council in the spring provided that the allowed deviation from the existing budgetary requirement is made explicit through a revised CSR The Member State can apply for the clauses in its Draft Budgetary Plans or in ad hoc documents
minus By the end of June 2018 the Commission will carry out a review on the application of the structural reform and investment clauses taking full account of the economic situation at that time and the achievement of its objectives
44 CONSEQUENCES OF THE GUIDANCE GIVEN IN THE COMMISSION COMMUNICATION ON FLEXIBILITY WITHIN THE SGP FOR THE CORRECTIVE ARM
As the main purpose of the corrective arm of the SGP is to ensure the prompt correction of excessive deficits the room for flexibility is
(91) Council document number 1434515 available at
httpdataconsiliumeuropaeudocdocumentST-14345-2015-INITenpdf
more limited The rules relating to the corrective arm do not include detailed provisions allowing structural reforms or investment to be taken into account when assessing whether a country has taken effective action in response to the Councilrsquos recommendations to correct the excessive deficit Structural reforms are however recognised as a relevant factor in the corrective arm when deciding on various steps within the EDP when opening an EDP when setting or extending a deadline for the correction of the excessive deficit and in the case of systemic pension reform when closing an EDP
First structural reforms can be relevant factors at the point of deciding whether to open an EDP When making this decision the Commission carefully analyses all the relevant information relating to medium-term economic budgetary and debt developments (92) These lsquorelevant factorsrsquo may in certain cases lead the Commission to decide not to open an EDP (93) The Commission Communication on flexibility within the SGP clarifies that Member Statesrsquo contributions to the EFSI and the implementation of structural reforms (eg in accordance with recommendations from the European Semester or an EIP) fall under the appropriate categories (94) and should therefore be considered as relevant factors
Second relevant factors are also taken into account when recommending the deadline by which the excessive deficit must be corrected While an excessive deficit is as a rule expected to be corrected within a year of its detection implementing structural reforms is a factor that can be taken into account when setting the deadline or fixing the length of any extension to that deadline
Third when closing an EDP the Commission considers where relevant the direct cost of pension reforms As is the case under the preventive arm this relates to reforms introducing
(92) This analysis is presented in the report prepared by the
Commission under Article 126(3) TFEU (93) According to Council Regulation (EC) No 146797 (OJ L
209 281997 p 6) for Member States whose debt stands below 60 of GDP the relevant factors are considered irrespective of the level of the deficit For a Member State with debt above 60 of GDP however the relevant factors are only considered if the breach of the deficit criterion is small and temporary
(94) As defined in Council Regulation (EC) No 146797 (OJ L 209 281997 p 6)
Part II Recent development in fiscal surveillance
75
a multi-pillar system that includes a mandatory fully-funded pillar Specifically an EDP can be closed even if the deficit is still larger than 3 of GDP provided that i) the excess is entirely due to the costs of implementing the pension reform and ii) the deficit has been reduced substantially and continuously and has reached a level close to the reference value ie 3
The Communication on flexibility within the SGP states that structural reforms can be taken into account on an ex ante basis when considering them as relevant factors The Commission also indicated in the Communication that it would take account of reforms that have not yet been fully implemented The conditions for taking reforms into account within the corrective arm are similar to those required for the activation of the structural reform clause under the preventive arm In particular the reforms need to be clearly specified as part of a structural reform plan already adopted by the government andor national Parliament and there must be a credible timetable for their implementation For Member States with excessive macroeconomic imbalances the Corrective Action Plan would normally serve this purpose
If a Member State fails to implement the agreed reforms the Commission will consider this an aggravating factor This applies both to the Commissionrsquos assessment of the action taken by the Member State in response to the EDP recommendation and to the setting of a deadline for the correction of the excessive deficit Failure to take effective action will lead to a stepping up of the procedure and the possible suspension of European Structural and Investment Funds (95) For euro area Member States the Commission will also recommend that the Council imposes a fine
(95) Article 23 of Regulation (EU) No 13032013 of the
European Parliament and of the Council (OJ L 347 20122013 p 320)
5 FISCAL RISKS AND CONTINGENT LIABILITIES
76
It is not unusual for the general government deficit or debt to be significantly and unexpectedly affected by the materialisation of fiscal risks associated with contingent liabilities Examples of situations in which this can occur include calls being made on guarantees issued by the government or the government stepping in to cover the obligations of a public corporation experiencing financial difficulties A distinctive feature of such events is that they result from some explicit or implicit obligation that the state has previously established (ie a guarantee contract or majority ownership) The extent and the timing of the impact of such events cannot however be determined in advance with any degree of certainty The liabilities leading to these events are called contingent liabilities as it is only under certain specific conditions that they result in transactions and they are not recorded in core national accounts Nevertheless the potential impact of these liabilities on public deficit and debt means that they cannot be ignored in the management of public finances
Understanding and mitigating the risks created by contingent liabilities depends firstly on having comparable information for different Member States Eurostat recently published a new time series providing information on Member Statesrsquo contingent liabilities It covered in particular i) government guarantees ii) the liabilities related to public-private partnership agreements (PPPs) that are recorded off the government balance sheet iii) the liabilities of government-controlled institutional units outside the government sector and iv) non-performing loans issued by the government The following sections provide a review of the new dataset They discuss the factors that need to be taken into account when interpreting the data explore the ways in which contingent liabilities can materialise as actual losses for the government and give some examples of how the fiscal risks associated with contingent liabilities can be mitigated
51 FISCAL RISK AND THE ROLE OF CONTINGENT LIABILITIES
lsquoFiscal riskrsquo is a broad term that encompasses a variety of reasons why fiscal outcomes may be different from the targeted (or forecast) levels
These reasons are usually associated with either macroeconomic developments that have an impact on fiscal variables or with situations where the government has to make unexpected payments ie payments not included in the budget or in any other ex-ante estimate of expenditure
The overview presented here is limited to a narrower category of fiscal risks mdash those associated with contingent liabilities It does not cover fiscal risks that result from changes in macroeconomic variables but concentrates instead on public liabilities that would under certain conditions necessitate a response from the government which would in turn lead to changes in the expected deficit and debt levels The degree of discretion the government can exercise in responding to these events varies but a common feature is the existence of an underlying commitment which may or may not be formalised Polackova and Mody (2002) develop a lsquogovernment fiscal risk matrixrsquo where they distinguish firstly between explicit liabilities (government liabilities as recognised by a law or contract eg loans and guarantee agreements) and implicit liabilities (the governmentrsquos moral obligations which may reflect pressure from the public or from specific interest groups eg obligations relating to future state pensions or public investment projects) and secondly between direct liabilities (obligations that exist in any event eg expenditure defined in existing laws) and contingent liabilities (obligations that exist only if a particular event occurs eg intervention in the event of a failure of a public or private entity) Implicit and contingent liabilities are thus not mutually exclusive categories but different dimensions of categorisation
The terminology is also subject to rather diverse interpretations For example the definition of contingent liabilities in the lsquogovernment fiscal risk matrixrsquo above is macroeconomic in nature and it differs from definitions used in national accounts (ESA2010 508-511) or accounting (IAS 37 IPSAS 19) In particular this macroeconomic framework also covers the subset of implicit contingent liabilities for example government interventions in the context of bank failures to avoid or reduce systemic risk in the banking sector (beyond deposit or unemployment insurance) where no explicit
Part II Recent development in fiscal surveillance
77
obligation exists for the state and only macroeconomic estimates of their magnitude can be made for a specified set of assumptions The scope of implicit liabilities is difficult to define but this does not mean that they can be ignored by policymakers For example the approaches to estimating cost of ageing are presented in the 2015 Ageing Report (96) while contingent liabilities linked to public support to the banking sector estimated using SYMBOL model were presented in the 2012 Fiscal Sustainability Report (97)
The availability of information on potential exposure is the first step in assessing impact of a contingent liability The availability of information on the extent of potential exposure is the necessary precondition and a starting point for the quantification of the risk However even where the potential exposure can be assessed (which can only be done with sufficient degree of certainty for some types of contingent liabilities as discussed above) quantifying the risk itself also requires an estimate of the probability of the risk materialising This information cannot usually be easily obtained for individual cases For certain classes of explicit contingent liabilities that involve large numbers of homogenous contracts (eg export guarantees or student loan guarantees) the probability of guarantees being called can however be established with a sufficient degree of certainty at the aggregate level This means that the risk can be quantified and recorded appropriately in statistics on government finance Under ESA2010 standardised guarantees of this type are recorded by analogy to non-life insurance with fees treated similarly to insurance premiums and the transaction shown as creating financial assets and liabilities (Eurostat 2014)
The need for transparency with regard to contingent liabilities is widely recognised especially as relates to explicit contingent liabilities (98) The IMFrsquos Fiscal Transparency Code (IMF 2014) for example includes a separate section on the management of fiscal risks in which it provides a number of principles for the
(96)httpeceuropaeueconomy_financepublicationseuropean
_economy2014pdfee8_enpdf (97)httpeceuropaeueconomy_financepublicationseuropean
_economy2012pdfee-2012-8_enpdf (98) This conclusion is less straightforward in the case of
implicit contingent liabilities due to the risk of moral hazard See eg IMF (2007)
disclosure and management of the governmentrsquos exposure to risks resulting from guarantees and public-private partnerships (PPPs) Likewise the OECDrsquos Best Practices for Budget Transparency (OECD 2002) recommends that (i) all significant contingent liabilities should be disclosed in the budget in the mid-year report and in the annual financial statements and (ii) where feasible the following should be disclosed a) the total amount of contingent liabilities together with a breakdown of this total by nature of the liability b) historical information on the defaults occurring in each of these categories In cases where contingent liabilities cannot be quantified they should be listed and described International Public Sector Accounting Standard (IPSAS) No 19 on provisions contingent liabilities and contingent assets requires that unless the possibility of any outflow in settlement is remote an entity should provide for each class of contingent liability a brief description of the nature of the liability and where practicable an estimate of its financial effect (IPSASB 2014) While these internationally agreed standards and guidelines provide a basis for improving the availability of information on contingent liabilities the requirements remain non-binding and no precise data specifications exist thus limiting the potential comparability of data published at national level
Several countries and international organisations have also started developing ways to mitigate the fiscal risks associated with contingent liabilities A recent OECD discussion paper (OECD 2013) suggests that one of the main approaches taken in policy reforms designed to mitigate the risks arising from guarantees is to promote neutrality This is most often done in one of two ways i) by ensuring that policymakers have sufficient information to compare the effects of the risks arising from guarantees with the effects of direct budgetary appropriations and ii) by levying market-based fees that reflect the expected cost of such liabilities for the government The discussion paper also advocated full and transparent disclosure of the potential costs of these risks It encouraged governments to reduce the level of implicit liabilities either by eliminating them in a credible way or by converting them into explicit liabilities
Some Member States have already introduced reforms in the area of contingent liabilities In
European Commission Public finances in EMU - 2015
78
the Netherlands for example the approach to the issuance of guarantees has been to make the default position that it is not allowed ie there has to be a specific reason to justify the issuance of guarantees for example if risk cannot be insured on the market Where guarantees are issued they are subject to a premium which is treated in the budgetary process as a provision for future losses (Hofmans and van de Coevering 2014) In Sweden the Budget Act adopted in 2011 contains clearer rules on government guarantees and new provisions relating to government lending that entails credit risk The rules aim to ensure that these commitments are self-financed in the long run with fees corresponding to expected costs (Swedish National Debt Office 2015) In Latvia the Fiscal Discipline Law provides that a fiscal risk declaration must be prepared annually and must include a quantification of the fiscal risks This quantification then determines the size of the fiscal safety reserve set in the budget (Fiscal Discipline Council of Latvia 2015) In Portugal a separate unit with specialised expertise has been set up whose task it is to assess and monitor PPPs and to mitigate the risks arising from these contracts (European Commission 2014b)
Improvements to the statistics on government finances can also help to mitigate the risks associated with contingent liabilities The statistical framework is constantly evolving and a significant number of improvements have been introduced in recent years notably through ESA2010 which came into force in September 2014 These changes include qualitative aspects of control which led to the reclassification of several government-controlled entities such that they are now considered as being within general government ii) the introduction of a revised approach to standardised guarantees which takes expected losses into account at inception of the contract and iii) changes to the rules on determining the economic owner of a PPP asset As a result of these changes a number of risks are now captured at an earlier stage For example losses incurred by a government-controlled company classified as being inside general government would affect general government net borrowing gradually as they occur rather than being postponed until some point in the future at which time a large capital injection would then be needed
52 NEW DATA REQUIREMENTS SUPPORTING FISCAL SURVEILLANCE IN THE EU
Analysis and reporting related to contingent liabilities has been considerably strengthened in the EU as a result of the adoption of the Six-Pack in 2011 and subsequently of the Two-Pack for the euro area These packages of legislation were designed to strengthen economic governance in the EU and budgetary analysis now includes closer examination of contingent liabilities in recognition of the risks they entail The reporting requirements for these liabilities were also made more stringent (see Box II51) In particular under the corrective arm of the SGP contingent liabilities are now taken into account when the Commission prepares a report under Article 126(3) of the TFEU For euro area countries subject to an Excessive Deficit Procedure (EDP) the Commission may now request that the Member State submit additional information including on the financial risks associated with contingent liabilities that could have a potentially significant impact on the government budget Under the preventive arm contingent liabilities are mainly analysed as potential risks to the budgetary targets
In response to the requirements introduced by Council Directive 201185EU on budgetary frameworks Eurostat has begun publishing a new data series on contingent liabilities for all EU Member States The specific requirements relating to the coverage of the data (which Member States are required to submit pursuant to Article 14(3) of the above Directive) and the timing of its publication were agreed between the Member States and the European Commission in 2013 and Member States submitted the first set of time series to Eurostat in late 2014 Eurostat published this information and an accompanying press release (99) in February 2015
53 NEW DATASET ON CONTINGENT LIABILITIES IN EUROSTATS DATABASE
Eurostatrsquos publication (as referred to above) covers three classes of contingent liabilities as well as non-performing loans
(99)httpeceuropaeueurostatdocuments299552166164492-
10022015-AP-ENpdf
Part II Recent development in fiscal surveillance
79
European Commission Public finances in EMU - 2015
80
The information provided on contingent liabilities relates to (i) guarantees (ii) public-private partnerships recorded off government balance sheet and (iii) the liabilities of government-controlled entities classified outside general government These categories are described in further detail below Eurostatrsquos dataset also includes information on non-performing loans issued by the government A dedicated webpage (100) provides additional information including the legal basis for the data collection country-specific footnotes and reports The summary table below gives an overview of the information currently available in Eurostatrsquos database In most cases Member States are required to send the updated annual time series for the previous year(s) to Eurostat before the end of the year Each additional year is expected to be added to the time series early in the year t+2 eg information for 2014 will be sent to Eurostat by the end of 2015 and added to the current time series in early 2016
The publication of this data at EU level is accompanied by the publication of information at national level While Eurostat publishes a
(100) httpeceuropaeueurostatwebgovernment-finance-
statisticscontingent-liabilities
number of time series that are based on commonly agreed standard definitions Member States are encouraged to publish more detailed national information and several Member States are currently doing so In addition to providing more detail on contingent liabilities Member States national publications also include other information required by Council Directive 201185EU notably information on the participation of the general government in the capital of private and public corporations high-frequency fiscal data produced according to the national public accounting methodology and the reconciliation table explaining how this high-frequency data is converted into data that is ESA-compliant The national publications are often tailored to the specific situation of the country and do not easily allow cross-country comparison Eurostat maintains a list of the national websites where this information is published (101) National publications can improve fiscal transparency at national level thus contributing to improved oversight of fiscal policy by national monitoring institutions and by society as a whole Not all Member States have yet made full use of this
(101)httpeceuropaeueurostatdocuments10150356850409L
isting-of-national-websitespdf
Table II51 Availability of indicators required under Council Directive 201185EU in Eurostatrsquos database (as at the end of 2015)
Source European Commission Note S13 = General government S1311 = Central government (excluding social security funds) S1312 = State government (excluding social security funds) S1313 = Local government (excluding social security funds) S1314 = Social security funds
Sectors Years(compulsory)
Units
Contingent liabilities1 Guarantees - Total stock of government guarantees 1A One-off guarantees - Total stock of guarantees excluding debt assumed by government of which guarantees to public corporations Memo item guarantees to financial corporations 1B Standardised guarantees - Total stock of government guarantees
2 Adjusted capital value of off-balance private-public partnerships (PPPs)
S13S1311S1312S1313
T-1(2013)
Millions of national currency
Percent of GDP3 Total outstanding liabilities of government controlled entities classified outside generalgovernment 3A Liabilities of units involved in financial activities 3B Liabilities of units involved in other activities of which liabilities of loss-making non-financial unitsAssets that can result in losses
4 Stock of non-performing loans provided by government
S13S1311S1312S1313S1314
T-1(2013)
Millions of national currency
Percent of GDP
S13S1311S1312S1313
T-4 T-3 T-2 T-1(2010-2013)
Millions of national currency
Percent of GDP
S13S1311S1312S1313S1314
T-1 (T-2 if not available)
(2013 or 2012 if not available)
Millions of national currency
Percent of GDP
Part II Recent development in fiscal surveillance
81
opportunity to improve transparency limiting their publication to the small number of variables on which they are required to report
Government guarantees
Guarantees issued by the government in respect of the liabilities (and sometimes assets) of third parties constitute the most common form of contingent liabilities Only explicit or formal obligations set down in the form of a law or a contract are covered by Eurostatrsquos dataset (102) A debt guarantee for example is an arrangement in which a guarantor (in this case the government) agrees to pay a creditor if a debtor defaults Guarantees on assets meanwhile mean that the government has made a commitment to cover any losses resulting from a decrease in value of the assets Both public and private corporations and households can benefit from government guarantees The aim of a government guarantee is usually to allow the beneficiary to borrow at a lower interest rate in doing so potentially contributing to achieving certain policy objectives An example of this is a government providing guarantees on student loans in order to improve access to higher education Government guarantees are also used to improve access to markets an example of this being the use of export guarantees or guarantees issued to financial institutions in times of financial distress
Eurostatrsquos publication includes several subsets of data which facilitates analysis For some subsets however the reported data are not complete andor are not exhaustive The publication distinguishes between standardised and one-off guarantees (103) (see also Table II51
(102) According to the agreed data specifications data do not
include i) government guarantees issued within the guarantee mechanism created under the European Financial Stability Facility (as these liabilities are predominantly already included in Member Statesrsquo debt) ii) derivative-type guarantees (providing they meet the definition of a financial derivative and are recorded accordingly in the national accounts) iii) deposit insurance guarantees and compatible schemes (as these are covered by separate frameworks) and iv) guarantees issued on events the occurrence of which is very difficult to cover via commercial insurance (such as earthquakes large-scale flooding nuclear accidents and certain art exhibitions) as a result of the very high degree of uncertainty associated with any estimate of the value of such guarantees
(103) As explained in the introductory section ESA2010 distinguishes between standardised guarantees (which are characterised by frequent repeated transactions with similar
above) In most (but not all) Member States the latter category is by far the more significant one The separate time series relate respectively to guarantees issued to public corporations and to guarantees issued to financial (public and private) corporations Only guarantees issued to units classified outside general government are covered by the reporting As can be seen from Graph II51 central governments issue the largest proportion of guarantees although guarantees issued by state or local government also form a significant part of the total in some countries The time series currently cover four years 2010-2013 and are reported at nominal value They show the total stock of outstanding guarantees excluding the debt already assumed by the government There are however gaps in the reporting for example information on standardised guarantees is missing for Belgium Croatia and Portugal and information on guarantees issued by local government has not been provided by France Croatia or Slovenia Other notes relating to specific Member States are included under lsquoCountry-specific footnotesrsquo (104)
Contingent liabilities associated with guarantees will become actual costs if the guarantees are called Guarantees constitute contingent liabilities and are therefore not recorded
features and a pooling of risks and for which the average loss can be estimated) and one-off guarantees (which are individual agreements for which it is not possible to provide reliable estimates of the likely losses)
(104)httpeceuropaeueurostatdocuments10150356611302Contingent-Liabilities-Footnotespdf
Graph II51 Outstanding guarantees by level of government2013 of GDP
Source Eurostat
European Commission Public finances in EMU - 2015
82
in core national accounts except in the cases described below The treatment of a guarantee in government accounting depends on whether it is a one-off or a standardised guarantee In ESA2010 when a standardised guarantee is granted a liability should be recorded in governments balance sheet that is equal to the present value of expected calls under the guarantees net of any recoveries For one-off guarantees fees related to the issuance of the guarantee constitute revenue for the government while in the case of standardised guarantees fees are recorded as a financial prepayment to cover future losses (105)
When the risks materialise and a guarantee is called a call on a standardised guarantee gives rise to a financial (deficit-neutral) transaction whereas a partial or full call on a one-off guarantee is recorded as a capital transfer (debt assumption) which worsens the governmentrsquos budgetary position Moreover the rules in place specify that the full amount of an outstanding one-off guarantee must be recorded as a capital transfer after the third partial call on the guarantee The same treatment ie debt assumption equal to the full amount of the one-off guarantee applies when the likelihood of a guarantee being called is very high at inception (106)
The recent financial crisis had a significant effect on the issuance and calling of government guarantees in several Member States The stock of outstanding guarantees relating to financial corporations was particularly high in Ireland in 2013 (at 32 of GDP thus accounting for almost the whole stock of outstanding guarantees) and also in Spain and Austria The stock of guarantees issued to the financial sector is however now on a clear declining trend Eurostatrsquos reporting on the financial crisis (107) provides some insight into the effect that guarantees have on public finances It illustrates for example the effect that calls on guarantees issued to financial institutions in the
(105) If government charges no fees or fees are far from
covering present value of expected calls a capital transfer (deficit-increasing transaction) is recorded for government reflecting the unrequited nature of the transaction
(106) For a more detailed overview of the recording of guarantees see the Manual on Government Deficit and Debt (httpeceuropaeueurostatwebgovernment-finance-statisticsmethodologymanuals) Section VII4
(107) httpeceuropaeueurostatwebgovernment-finance-statisticsexcessive-deficitsupplemtary-tables-financial-crisis
context of the financial crisis have had in recent years on the budgetary position of the governments of Belgium Denmark Spain Latvia and Portugal
Liabilities related to public-private partnerships (PPPs) recorded off government balance sheet
As the name suggests public-private partnerships (PPPs) involve two partners that belong to different sectors of the economy These partnerships are long-term contractual arrangements (lasting at least five years and usually significantly longer) between a government unit and a private partner under which the latter builds or renovates a dedicated fixed asset and uses that asset to deliver services to the government unit or directly to the public in exchange for a periodic payment from the government (108)
The main issue for national accounts is determining the economic owner of the asset ie determining whether this is the private partner or the government unit The assets related to the PPP will be recorded on the balance sheet of the economic owner thus affecting that unitrsquos expenditure (and balance) over the construction period and its debt According to ESA2010 the economic owner of an asset is the unit that bears the largest proportion of the risks and is entitled to receive the largest proportion of the rewards related to the use of the asset The three main risk categories considered for this purpose are i) construction risk (risk related to the construction process and its costs) ii) availability risk (risk related to the availability of the asset for use after the construction phase) and iii) demand risk (risk related to the demand for the services that the asset contributes to providing) A number of other conditions of the contract are also closely analysed These include the allocation of the assets at the end of the contract the compensation and termination clauses and the existence of government financing and guarantees
(108) A distinction is made in national accounts between PPPs
and concessions on the basis of who pays the fees to the partner the term PPP is used for contracts where the government is paying all or most of the fees associated with the use of the asset to a private partner whereas in concession agreements it is the final users that make the majority of payments
Part II Recent development in fiscal surveillance
83
While information related to on-balance PPPs is
directly reflected in the general government deficit and debt this is not the case for off-balance PPPs However the latter may create potential liabilities for the government In cases where the government is judged to be the economic owner of the PPP and the asset is therefore recorded on the governmentrsquos balance sheet this will mean that all expenditure revenue and financial obligations associated with that asset affect the general government deficit and debt directly throughout the period during which the asset is being constructed or renovated This is not the case for PPPs where the private partner is deemed to be the economic owner of the asset In these cases the impact on the governmentrsquos deficit and debt would be more gradual reflecting periodic payments to the partner Should the private partner fail however there is a risk that the government may need to take over the asset during the life of the contract and this eventuality constitutes a contingent liability for the government
The dataset published by Eurostat shows that off-balance sheet PPPs do play a role in some countries As can be seen from Graph II52 the stock of off-balance sheet PPPs only exceeds 1 of GDP in a small number of Member States with the highest values recorded in Portugal and Cyprus These partnerships are almost exclusively concluded by central governments although in countries that have a federal government structure state governments do also play a role Member
States were only required to provide data for 2013 and the coverage is generally good there being only a small number of country-specific gaps A large majority of countries also reported figures for the years 2010-2012 on a voluntary basis When interpreting the data it should be kept in mind that
the figures for each year reflect the current value of the project at that time They can therefore be understood to represent an estimate of the impact there would be on investment expenditure and on debt were the government to need to take the asset over The current value increases rapidly during the construction phase of a project reflecting investments being made and then subsequently decreases progressively during the exploitation phase reflecting the economic depreciation of the asset The current value does not therefore reflect the amount of investment needed to finalise the asset if a project had encountered difficulties already during the construction phase
Liabilities of government-controlled entities
Governments often choose to set up corporations outside the budgetary perimeter A part of these entities is nevertheless classified as being inside general government for the purposes of national accounts There are a variety of reasons why governments may decide to set up entities outside the budgetary perimeter These entities may be created with a legal status that is different from traditional budgetary units (eg as limited liability companies) and they may combine commercial and public interest objectives The extent to which governments make use of this approach ie setting up entities outside general government varies considerably across Member States and no clear generalisations can be made as to the advantages they offer compared to direct procurement of goods and services Wherever such entities are controlled by the government (109) they belong to the public sector Whether a public sector unit is classified for statistical purposes as part of general government
(109) This control may take the form of i) the right to appoint
veto or remove a majority of the governing board or senior members of staff ii) ownership of the majority of the voting interest (most commonly ownership of over 50 of shares) iii) rights given by special shares and options iv) rights to control the company via contractual arrangements agreements or permissions to borrow or via excessive regulation or v) another form of control
Graph II52 Off-balance PPPs the stock of adjusted capital value by level of government 2013 of GDP
Source Eurostat
European Commission Public finances in EMU - 2015
84
or as part of the public corporations sector depends on the nature of the unit Units involved in non-market activities are classified as part of general government whilst those involved in market activities are classified as public corporations The term corporation must be understood here in a broad sense as it may include entities that do not have the legal status of a corporation
Units classified as being inside general government are covered by regular reporting on government deficit and debt This is not the case for government-controlled units outside general government whereas their debt represents a potential liability for the government If a public sector unit is classified in the general government sector its revenue expenditure and debt are added to those of the rest of the government sector and thus affect the government balance and debt directly As stated above the same treatment is not however applied for public corporations whether financial or non-financial that are by nature market units and which thus remain outside general government Participation in the capital of public corporations could nonetheless represent a potential liability for the government when the corporation is experiencing difficulties the government may need to step in its capacity as a controlling entity or majority owner This liability is contingent ie it will only lead to actual costs if some specific event occurs The cost of an intervention and the likelihood of such action being necessary cannot however in most cases be determined in advance A government may also decide to intervene for reasons other than financial difficulties In the case of a planned privatisation of a public company for example the government may decide to lsquocleanrsquo the companyrsquos balance sheet by assuming certain obligations including the obligations relating to an occupational pension scheme When such interventions take the form of an unrequited payment (ie when the government does not receive a payment of an equal value in return and is not expecting to earn a sufficient rate of return on its investment) they will worsen the governmentrsquos budgetary position (110)
(110) The application of lsquothe capital injection testrsquo including the
definition of a sufficient rate of return is described in Section III2 of the Manual on Government Deficit and Debt
Eurostatrsquos publication on the liabilities of government-controlled entities classified outside general government is the first of its kind but the data provided should be interpreted with caution Eurostatrsquos recent publication is the first step towards developing comparable time series on potential liabilities associated with government-controlled entities classified outside general government The data nevertheless reflects the high degree of variability in the approaches taken by different Member State governments to the role of public corporations and this should be taken into account when interpreting the information There are also a number of other considerations that need to be kept in mind Firstly the data reflect gross liabilities ie the figures show debt alone rather than debt offset against assets Secondly the reporting is non-consolidated ie part of the debt shown could be debt owed to another unit in the same institutional sector (For example if two public corporations have liabilities towards each other both amounts would be captured in the data and it will also cover subsidiarys debt towards its holding unit) Thirdly there are some gaps in the data submitted by Member States In particular the information on the liabilities of financial corporations is missing or incomplete for Belgium Greece Spain Cyprus and Luxembourg and information on corporations controlled by local government is missing or incomplete for Belgium Ireland Greece and
httpeceuropaeueurostatdocuments38595985937189KS-GQ-14-010-ENPDF
Graph II53 Liabilities of public financial institutions by controlling government level 2013 or 2012 of GDP
Source Eurostat
Part II Recent development in fiscal surveillance
85
Cyprus
Despite these caveats the information published by Eurostat allows analysing risks associated with the governmentrsquos participation in financial and non-financial corporations As shown in Graphs II53 and II54 the gross liabilities of public financial corporations are as a rule much higher than those of public non-financial corporations These liabilities must however also be interpreted differently in the case of financial and non-financial institutions The
former tend to have large balance sheets and thus also large gross liabilities but their obligations are usually balanced by assets of a comparable size Moreover financial institutions both public and private are covered by specific regulations such as those on prudential supervision and deposit insurance which reduce the need for owner intervention In addition the database available on Eurostatrsquos website also includes a separate subset of data on the liabilities of loss-making non-financial corporations (see Table II51) Given that companies experiencing occasional losses may drop in or out of this data in any given year any conclusions drawn on the basis of the single set of results that is currently available could be misleading and this data subset is therefore not presented here In most cases it can also be assumed that the government would not go as far as to cover all the liabilities of a corporation in difficulties The reported liabilities should therefore be understood as the maximum loss theoretically possible rather than as a likely scenario
Non-performing loans
Although not part of their traditional role governments do sometimes issue loans Various government units may decide to provide loans to other economic sectors or to the rest of the world Their motivations for doing this are for example to achieve a particular objective in the area of socioeconomic policy or international relations or to manage the accumulated assets in a cost-effective manner Eurostat publishes quarterly information on general government financial accounts In particular it provides data on the stock of government assets in the form of loans including by counterpart (ie debtor) sector for central government and social security funds The data shows for example that loans account for a relatively high proportion of central government assets in the Nordic countries (and of social security funds assets in the case of Finland)
The stock of general government assets taking the form of loans can also indicate the presence of non-market financial institutions inside general government It is not unusual especially in the aftermath of the recent financial crisis for public financial institutions to cease performing traditional financial intermediation activities and to subsequently be classified inside general government due to their non-market nature In some cases the inclusion of these units is a corollary to the more precise definitions given in ESA2010 for delimitation of the general government sector compared to the earlier national accounts standards The institutions to which this could apply include defeasance structures (lsquobad banksrsquo) asset management companies and special purpose entities if they are controlled by government and do not place themselves at risk The inclusion of units of this type in general government will have an effect on the statistics on government assets as has been seen in recent years for Ireland Spain Latvia the Netherlands Austria the UK and a number of other Member States
The loans issued by the government may become non-performing and in some cases may result in losses for the government Loans are considered non-performing when i) interest or principal have not been paid 90 days or more after their due date ii) interest payments equal to 90 days have been capitalised refinanced or delayed by agreement or iii) there are other good reasons (such as the debtor filing for bankruptcy) to doubt
Graph II54 Liabilities of non-financial public corporations by controlling government level 2013 or 2012 of GDP
Source Eurostat
European Commission Public finances in EMU - 2015
86
that the payments due will be made in full Non-performing loans may lead to full or partial non-recoverability of the debt and potentially to losses for the government These losses can take a number of forms A debt cancellation agreement in favour of the debtor for example would directly worsen the governmentrsquos balance A write-off of debts after the debtor unit has been liquidated meanwhile would not affect the balance directly but would imply an indirect increase in the creditorrsquos debt level (as its borrowing needs would be higher than they would have been had the principal and interest been fully repaid) According to Eurostatrsquos publication at the end of 2013 the total stock of non-performing loans issued by Member State governments was highest in Ireland (at around 11 of GDP) This was due to the inclusion of the Irish Bank Resolution Corporation in the general government The second-highest level of around 3 was recorded in Slovenia where the inclusion of the Bank Assets Management Company had contributed to the stock of non-performing loans In the majority of Member States however the amounts were negligible When the proportion of non-performing loans is high as a result of defeasance structures being classified as part of general government the situation is usually expected to change in the medium term and the amounts tend to decline rapidly as positions are wound down
The data reported by Member States remains incomplete Belgium France Croatia Cyprus and Slovakia have not provided any data on non-performing loans while Spain Italy and Finland have only partly met the reporting requirements Reporting of data on non-performing loans was only compulsory for 2013 but a number of countries also provided information for 2010-2012
54 CONCLUSION
It is through a better understanding of the fiscal risks associated with contingent liabilities that policymakers will be able to improve their countriesrsquo performance relative to budgetary targets Fiscal risk is a broad concept encompassing various reasons why fiscal outcomes can deviate from the targeted or forecast levels Contingent liabilities are one of the factors creating fiscal risk They are potential obligations for the state that materialise as actual losses and
higher debt only if and when certain events occur Because of this it is often very difficult to estimate in advance the potential impact they could have on deficit and debt and to predict the timing of the events that would cause the potential loss to materialise Irrespective of these difficulties contingent liabilities cannot be ignored as has also been demonstrated by the economic crisis Making information on contingent liabilities publicly available is an essential first step towards developing a better understanding of contingent liabilities and mitigating the risks associated with them
The requirements for reporting on contingent liabilities at EU level have recently been strengthened with the aim of increasing transparency As demonstrated by these changes there is a strong recognition of the importance of developing a better understanding of the fiscal risks associated with contingent liabilities both for the purpose of EU budgetary surveillance and more generally The new measures include in particular the introduction of new statistical reporting by Eurostat and the publication of more detailed information at national level in accordance with the requirements of Council Directive 201185EU on budgetary frameworks These new reporting requirements relate to i) government guarantees ii) liabilities related to public-private partnerships (PPPs) recorded off government balance sheet iii) liabilities of government-controlled entities and iv) non-performing loans
While recognising the country-specific nature of contingent liabilities the new data series allow some cross-country comparison They also show that contingent liabilities tend to be high when they relate to the financial sector The reasons why Member States choose to use contingent liabilities instead of carrying out direct budgetary interventions often reflect historical circumstances and established institutional frameworks which makes cross-country comparison less straightforward Nevertheless as mentioned above it can be seen that contingent liabilities tend to be higher if they relate to the financial sector The liabilities of public financial corporations for example were above 50 of GDP in 2013 in some cases while those of non-financial public corporations reached a maximum of around 25 of GDP Guarantees to financial institutions
Part II Recent development in fiscal surveillance
87
(public and private) were also as high as 30 of GDP in 2013 (the most recent year for which data is available) These findings are not surprising given the considerable impact that the financial stabilisation measures adopted by governments have had on the deficit and debt levels in many countries Where data series cover more than one year it can however also be seen that the liabilities associated with the financial sector are now on a declining trend Both contingent liabilities related to off-balance sheet PPPs and the stock of non-performing loans are currently of macroeconomic relevance in only a small number of countries
The next steps to be taken include improving the coverage and comparability of the data and finding the best ways to mitigate the fiscal risks associated with contingent liabilities While the recent Eurostat publication represents a considerable step forward in terms of improving the availability of comparable data in the EU there continue to be a number of gaps in reporting Moreover the length of the time series is still very limited in most cases Both the quality of data and the length of the time series are expected to improve over time thanks to the efforts being made by the EU statistical community The international organisations and the EU Member States have also started working on developing ways to mitigate the fiscal risks associated with contingent liabilities The most promising avenues involve making such liabilities self-financing or budgetary neutral in the longer run by charging fees and making provisions that reflect the expected future losses Strengthening the institutional and statistical frameworks and improving transparency are among the other strategies proposed for mitigating these risks
Part III Negative inflation surprises how much of a bad thing
1 INTRODUCTION
90
Price developments may affect public finances in a number of ways Inflation has a direct bearing on tax revenues through consumption wages property income etc Primary expenditure is also affected as government spending can be formally linked to changes in prices (eg through an indexation mechanism) or naturally reflect such changes (eg through government purchases of goods and services and public investment) Interest expenditure is directly affected by price developments as well In turn the stock of government debt can be influenced both in absolute terms and relative to the size of the economy
It is generally acknowledged that tax bases and hence tax revenues are faster to adjust to price developments than primary expenditure Indeed revenues evolve broadly in line with inflation developments but often with some time lag depending on how fast tax bases adjust as well as on tax rules and tax collection While the effects of inflation on government spending are slower to materialise it is also less straightforward to capture the precise impact Some items are often linked to inflation while others are not at least not in the short run Most importantly given that (nominal) expenditure ceilings are often set well ahead of the budgets adoption and actual implementation changes in the rate of inflation with respect to forecasts may not translate into lower or higher spending
Unexpected inflation shocks have a different impact on the budget than shocks which are fully anticipated by the government To the extent that inflation developments are anticipated and provided that budgetary appropriations are adjusted accordingly they should be neutral for public finances in the sense that governments can in principle secure the planned fiscal targets By contrast as discussed above unexpected price developments may have a material impact on the government balance in that revenues and expenditures may be affected differently That said a protracted period of low inflation even when fully anticipated may imply cost savings difficult to implement if revenues are to be continuously offset by ever stricter spending norms especially if these come at odds with underlying trends eg in the areas of healthcare or
age-related expenditure or imply cuts in absolute terms (as opposed to nominal freezes)
In addition inflation developments can give a biased picture of a governments fiscal policy In some cases price developments may help a country meet or make it more difficult to achieve fiscal targets In such cases the meeting of requirements may be wrongly seen as the country delivering on policy commitments and vice versa In that respect the way inflation developments affect compliance with the rules of the EUs Stability and Growth Pact is a relatively new topic also because most of the latter have been built under the implicit assumption of price stability evidenced by annual inflation closely fluctuating around 2 since the inception of the SGP
In this context Part III looks into the impact of an unexpected inflation shock on the budget balance and the consequences this might have in terms of fiscal surveillance focusing on the 2014 shock As is the case for fiscal multipliers the specific circumstances under which the unexpected inflation shock occurs are relevant for the actual value of the elasticity of the budget balance with respect to inflation For example the response of economic variables such as wages to inflation may be different in crisis periods than in boom periods and the same holds for interest rates
Specifically Chapter III2 provides a semi-quantitative impact assessment of the 2014 downward inflation surprise on Member States budgets and their components according to DG ECFINs desks and an analysis of the reaction of interest expenditure and shows that the budgetary impact of this shock was in many cases of the order of 01-02 of GDP
In order to interpret these results it should be considered that while such an impact of the inflation shock on the overall balance may seem small in size relative to a given deficit level (eg the 3 of GDP Treaty reference value) it may not be so in terms of the annual change in the deficit Similarly the impact may be all the more significant when compared with 05 of GDP which constitutes the maximum theoretical impact of a 1 inflation shock whereby revenues adjust one for one to inflation while expenditures remain unchanged Chapter III3 sheds more light on the
Part III
91
interplay between inflation surprises and fiscal effort as measured by the various metrics that are used when assessing compliance with the rules of the SGP
2 COUNTRY-BY-COUNTRY ANALYSIS OF THE REACTION OF BUDGET TO THE INFLATION SURPRISE OF 2014
92
In 2014 all EU Member States experienced a negative inflation surprise Inflation was revised downward for all EU Member States between the forecast prepared at the time of the adoption of national budgets (autumn 2013) and the first estimation of outturn data (spring 2015 EDP notification) The revision of the harmonised index of consumer prices (HICP) between the Commissions 2013 autumn forecast and outturn data for 2014 ranges from -01 pp (Czech Republic) to -30 pps (Bulgaria) and the EU average is -10 pp (see Graph III21a and III21b) For 5 Member States (Bulgaria Spain Cyprus Portugal and Slovakia) the revision even led to a change of sign (from positive to negative) in the HICP according to the 2013 autumn forecast only one Member State (Greece) was expected to be in deflation in 2014 while outturn data showed that 6 Member States ultimately faced deflationary developments that year
This chapter aims at analysing the impact of the
downward inflation surprise on the EU Member States budgets and their components based on a tailor-made survey For this purpose this Part collects the relevant information from DG ECFINs country desks and looks at both the expenditure and the revenue side Our methodology is described in Section 1 Section 2 shows the assessment of DG ECFIN to shed light on the Member States reaction to an inflation surprise and through which channels this surprise affects revenues and expenditures Section 3 discusses the particular cases of interest expenditure given their very specific link to inflation
This chapter aims at analysing the impact of the downward inflation surprise on the EU Member States budgets and their components based on a tailor-made survey For this purpose this Part collects the relevant information from DG ECFINs country desks and looks at both the
Graph III21a 2014 HICP estimation from forecast (2013 autumn forecast) and outturn data (spring 2015 EDP notification)
Source Commission services
Part III
93
expenditure and the revenue side
Our methodology is described in Section 1 Section 2 shows the assessment of DG ECFIN to shed light on the Member States reaction to an inflation surprise and through which channels this surprise affects revenues and expenditures Section 3 discusses the particular case of interest expenditure given its very specific link to inflation
21 INFLATION ELASTICITIES IN 2014 AND 2015 ACCORDING TO COMMISSION STAFF
Forecasts in DG ECFIN are produced by Commission staff Their preparation combines a geographically decentralised approach with central guidance and consistency checks The actual forecast figures are provided by country desks (teams of economists covering each Member State) using expert judgement combined with quantitative analysis which takes country
specificities into account Euro area and EU figures are generated by aggregation The central forecast team ensures the arithmetic and economic consistency of forecast figures prepared by the country desks and steers the forecast process to ensure convergence between the top-down and bottom-up views This part collects the information available across desks about the reaction of budgets to inflation
211 The coverage
An exhaustive dataset of EU Member States reaction to the 2014 inflation surprise in 2014 and 2015 was constructed by collecting the relevant information from DG ECFINs country desks The existing literature usually focuses on an EU-wide analysis sometimes complemented by examples mostly from the four largest economies (Germany France Italy and Spain) By contrast in this chapter each Member State is analysed individually The present analysis of EU level sensitivity to inflation is based on the exhaustive
Graph III21b Inflation surprise for 2014 from forecast (2013 autumn forecast) to outturn data ( spring 2015 EDP notification )
Source Commission services
European Commission Public finances in EMU - 2015
94
Type of item Name of the item Non-weighted average share among Member States in 2014
Revenue taxes on production and imports 33 Revenue current taxes on income and wealth 25 Revenue social contributions 27
Revenue sales and other current revenue capital transfers received 15
aggregation for the reactions of the twenty-eight Member States All of ECFIN country desks were involved in building the dataset through a survey that was fully answered In addition to a complete coverage of EU Member States the analyses made by country desks allow for a thorough assessment of the inflation surprise using both quantitative and qualitative analysis The survey is split into revenue and expenditure items along the ESA 2010 classification Seven expenditure categories and four revenue categories are retained (see Table III21a and Table III21b)
For all Member States the three most important revenue items are indirect taxation (taxes on production and imports) current taxes on income and wealth and social contributions Depending on the Member State these items represent between 77 and 91 of total revenues and are the focus of the present study (111)
The main expenditure aggregates are compensation of employees intermediate consumption and social transfers Social transfers in kind were in addition distinguished from the rest of the social transfers as their behaviour with respect to inflation is very different For all Member States these items represent from 69 to 83 of the total expenditures and are the focus of the present study (112)
Sales and other current revenue capital transfers received and other capital expenditure were treated differently given their small size and different behaviour These three items have a very specific behaviour and include different categories with heterogeneous economic and cyclical patterns Thus the consistency of answers among respondents to the survey could not be ensured Also they account for a relatively small share of overall expenditure and revenue It was then assumed that the behaviour of these items were similar to the one of the other items Sales and other current revenue and capital transfers are assumed to follow the average patterns of other revenues Other capital expenditures which represents less than 4 of GDP in all Member
(111) Shares are based on the Commissions 2015 spring
forecast (112) For Cyprus the effect of bank recapitalisation operations in
2014 (amounting to 86 of GDP) has been netted out
States was aggregated with subsidies and other current expenditures for the sake of simplicity
The sensitivity of interest payments was estimated separately They were not part of the survey given their very specific behaviour Interest payments depend strongly on the share of debt sensitive to inflation Short-term debt foreign-currency denominated debt and debt with variable interest rates are mechanically very sensitive to inflation while long-term domestic-currency denominated non-indexed debt is not Section 3 sheds more light on the link between inflation and interest payments and provides a quantitative assessment of the likely impact of an inflation shock
Table III21a Decomposition of expenditures with the ESA 2010 classification
Source Commission services
Table III21b Decomposition of revenues with the ESA 2010 classification
Source Commission services
212 Main elements of the survey
The questions of the survey were chosen in order to ensure consistency between Member States while taking into account country specificities For each item four main types of questions were asked concerning the influence of inflation on public finances
The first two questions refer to the impact of the inflation surprise in 2014 respectively in the first year and in the second year Specifically the questions consist in asking if the revenue or expenditure item is very sensitive to the inflation surprise in 2014 (corresponding to an elasticity
Part III
95
higher than 075) quite sensitive (corresponding to an elasticity between 05 and 075) weakly sensitive (corresponding to an elasticity between 025 and 05) or not sensitive (corresponding to an elasticity lower than 025) The first question bears on the contemporaneous effect in 2014 (assessment of the effect in the first year) while a second question refers to the assessment of the cumulated and total sensitivity at the end of 2015 They correspond to a semi-quantitative assessment of the elasticity of each main expenditure or revenue item to the inflation surprise in 2014 from the perspective of the 2014 and of the cumulated 2015 outcome respectively
A second series of questions relate to the mechanisms behind the sensitivity of revenue and expenditure items to inflation Though multiple stylised answers were proposed (see Annex III1) desks were encouraged to provide any possible clarifications including several specific features such as
minus Symmetry Elasticity to inflation is often thought as the reaction of a variable to a rise in inflation of 1 percentage point As the inflation surprise in 2014 was actually a downward revision respondents were asked to provide precisions if the sensitivity of an item would be symmetric for a downside and upside inflation surprise
minus Indexation Respondents were asked to indicate the possible existence of an automatic indexation mechanism to inflation Automatic mechanisms can be legal rules or less formal arrangements and the indexation provided for may be total or partial Respondents were also invited when relevant to indicate the index used for indexation (eg annual average CPI growth year-on-year lagged growth of CPI etc)
The last question concerns how indexation mechanisms and thus the sensitivity to inflation has evolved since the 2008-2009 crisis Since the Great Recession and the subsequent need for fiscal consolidation many Member States have modified or suspended indexation formulas of social transfers or public wages on the expenditure side or tax brackets on the revenue side The goal was to reduce expenditures and increase revenues
Respondents were asked for each item when relevant whether the automatic indexation rule was changed recently in particular whether a former indexation rule was abolished or frozen
213 Deriving the dataset on inflation surprises from the survey
The survey allows building a dataset which includes both a quantitative and qualitative assessment First this dataset contains a semi-quantitative assessment of sensitivity to inflation for all twenty-eight Member States for the five expenditure items and the three revenue items considered The assessment is used to estimate the elasticity of each item for each Member State in the first year and in the second year To do so the average of the proposed range of possible values for elasticity is assigned to every answer For instance if the respondent answered weakly sensitive (elasticity between 025 and 05) to the first question the elasticity in the first year of this item of this Member State is considered to be 0375 This treatment leads to quantitative results but has some weaknesses as pointed out in the next section Finally the dataset also includes a qualitative assessment of the mechanisms and its recent evolution for almost each Member State and each main revenue and expenditure item stemming from comprehensive comments received from respondents Main results per country are reported in Annex III2
214 Note of caution
The effects of a disinflation surprise are particularly difficult to measure also given the singularity of the event The 2014 disinflation shock coincided with low levels of inflation in some cases even deflation Inflation levels were already relatively low in 2013 thereby limiting the room for nominal adjustments due to price and wage rigidities as their growth rates approach zero It is thus challenging to disentangle effects from the disinflation surprise from the effects of low levels of inflation Moreover conclusions on the symmetric case of an inflation surprise should be drawn cautiously
The study is based on expert knowledge rather than direct quantitative measurement The dataset aggregates the assessment and experience of twenty-eight country desks in a bottom-up
European Commission Public finances in EMU - 2015
96
fashion However the semi-quantitative nature of the survey leaves some room for interpretation which leads to a potential issue of consistency among questionnaires Moreover the degree of detail provided varies across Member States As a consequence the information that can be gathered from the questionnaires results is asymmetrical between countries Comparisons between countries can thus not be used for assessing policy implications and are mainly provided to help gauging the level of heterogeneity within Member States In order to tackle this issue the methodology was framed and different possible answers were suggested to every question in order to have the highest possible degree of consistency among questionnaires
The method cannot provide precise estimation of the individual elasticities and involves even greater uncertainties after their aggregation This is due to the computation of elasticities from semi-quantitative assessments in which we take arbitrarily the median of the proposed interval of possible values This also raises issues of aggregation when building synthetic indicators Under the further assumption that the true elasticity is uniformly distributed around the average of the interval the aggregation gives a typical interval of possible value of 025 around the average elasticity (ie a confidence interval of plusmn0125 around the average) Similarly at the EU level elasticity is built by summing the elasticities weighted by the share of Member States public expenditure in total public expenditure of the European Union In the following for the sake of simplicity only average values are presented but the reader should keep in mind that the interval of possible values is to be considered To put it differently in the following the statement the elasticity of this item is of x has to be understood that the elasticity belongs typically to the interval[ minus 0125 + 0125]Overall the conclusions derived from the results should be interpreted carefully This is a first attempt to estimate the sensitivity of the various expenditure and revenue categories to inflation directly from an exhaustive country-by-country analysis The analysis is complementary to other studies and cannot substitute for further quantitative exercises
22 RESULTS ON INFLATION SENSITIVITY
The results at the aggregate level are in line with the economic literature Concerning the relationship between inflation and public finances the economic literature tends to focus on the impact of inflation on debt rather than on deficit developments However the impact of inflation on the public deficit and its components has been studied by several authors Aghevli and Khan (1980) is one of the few examples of articles estimating the impact of inflation separately on expenditure and revenue They found that expenditure adjusts less rapidly than revenue in response to unanticipated inflation Moreover in a context of low inflation sensitivity tends to be lower than in periods of high inflation rate OECD (2007) and Immervol (2005) have both further reached the conclusion that even at low inflation rates the size of revenue effects can be substantial The results of the following sections are consistent with these findings and bring further precisions and quantification on the size of these effects
On an item-by-item basis the results presented here are broadly in line with the literature Heinemann (2001) studied the impact of low inflation on public finances for OECD countries and found that inflation has not the same impact across categories of revenue and expenditure indirect taxes (taxes on production and imports) adjust slightly more than total income taxes (including individual and corporate taxes) but both significantly less than social contributions We depart from this analysis as we find an effect on indirect taxes much larger than other revenue items Moreover this analysis brings both quantitative and qualitative evidence of channels through which these mechanisms occur and their recent evolutions
This section presents first the main results and then describes the more detailed findings by items
221 Results for aggregate revenue and primary expenditure and on the primary deficit
Revenues are more sensitive to inflation than primary expenditures The contemporaneous sensitivity is in line with what the literature suggests significantly higher for revenues than for primary expenditures This corresponds to the
Part III
97
economic intuition that tax bases and thereby revenues adjust fast whereas expenditure policy is set well ahead of the actual execution of the budget For primary expenditures the estimated elasticity in the first year ranges from 01 to 04 among Member States while it ranges from 01 to 09 for revenues (cf Graphs III22 and III23) At the EU level the elasticity of primary expenditure to inflation is 02 versus 06 for revenues Member States elasticities for revenues are thus on average more than three times higher than the ones for primary expenditures (113)
In general unlike revenues primary expenditures adjust with a lag While the elasticity of revenues to inflation does not change significantly between the contemporaneous estimation for 2014 and the following year the sensitivity of primary expenditures at the end of 2015 is higher for all Member States On the expenditure side elasticity to inflation ranges from
(113) Country-specific and EU-wide elasticities were obtained by
weighting revenue and expenditure categories with the respective amounts (collected and spent)
01 to 04 in the first year and increases to a (cumulated) elasticity of up to 08 for some Member States in the second year The overall elasticity for the EU increases from below 02 in the first year and to more than 03 in the second year On the contrary there is no such difference between estimations in the first year and in the second year when it comes to revenues the estimated elasticity ranges from 01 to 09 in both years and the elasticity at EU level is estimated at 06 in both years as well This means that the gap between revenue and primary expenditure elasticities decreases from the assessment in the first year to the one in the second year In 2014 the estimation of the EU level revenue elasticity is three times higher than the one for primary expenditures while this ratio drops to two for the estimation at the end of 2015 The ratio of revenue elasticity to expenditure elasticity ranges from 1 to 6 across Member States in both periods but it falls in the second year for three Member States out of four
Graph III22 Elasticity of revenues with respect to inflation surprise in 2014 in the EU Member States
Source Commission services
European Commission Public finances in EMU - 2015
98
= minus ∙ minus ∙
The partial or complete removal of indexation mechanisms and rigidities of a downward adjustment are two main reasons why elasticities of primary expenditures are particularly low in 2014 These two elements will be further detailed item by item
This general assessment is valid at the country level with little exceptions Revenues are more sensitive than primary expenditures to inflation for twenty-six Member States for the estimation in the first year and for twenty-three Member States for the estimation in the second year Moreover for twenty-six Member States the change in elasticity of revenues is lower than 01 point between the two assessments (effects in the first year and in the second year) while for more than half of the Member States the difference between the two assessments on primary expenditures is greater than 01 The increase of expenditure elasticity between the two estimations is even very high (gt05) for five Member States
Graphs III24 and III25 show that a downward inflation surprise of 1 percentage point increased the primary budgetary deficit-to GDP ratio by 02 percentage point in the first year (2014) and by 01 point in the second year (2015) The impact on the primary deficit-to-GDP ratio writes
with E and R respectively the level of expenditure and revenues d the primary deficit-to-GDP ratio and the rate of inflation As the expenditure elasticity picks up in the second year the effect on the deficit will be higher in the first year than in the second year
The effect of the inflation surprise on the deficit in the first year ranges from 0 to 04 of GDP Thirteen Member States show a deficit semi-elasticity of at least 02 in the first year but it is the case for only five of them in the second year
Graph III23 Elasticity of primary expenditures with respect to inflation surprise in 2014 in the EU Member States
Source Commission services
Part III
99
According to these results the inflation surprise of 1 percentage point in 2014 at the EU level let to an increase in the 2014 headline deficit of 02 point The effect of the 2014 inflation surprise is still expected to be visible in 2015 but should be lower than in 2014 as it would only increase the deficit by 01 point
222 Revenues
The sensitivity of income taxes and social contributions is high The elasticity of both items (current taxes on income and wealth and net received social contributions) was of 05 at the EU level in the first year (see Graph III26 below) Social contributions are found in the survey as not sensitive for nine Member States while income taxes are found not sensitive for five Member States Both items are found as very sensitive for one-third of the Member States The elasticity of both items at the EU level in the second year is slightly higher than in the first year (from 05 to 06) The difference between the two estimations
(in the first year and in the second year) is thus limited and is mainly explained by four Member States for which the sensitivity shifts from quite sensitive or weakly sensitive to very sensitive
Graph III24 Semi-elasticity of primary balance to inflation surprise in 2014 in the EU Member States
Source Commission services
Graph III25 Semi-elasticity of primary deficit in 2014 and 2015 to the inflation surprise in 2014 and contributions of revenue and expenditures
Source Commission services
European Commission Public finances in EMU - 2015
100
for taxes on income and wealth between the first and the second year
Stickiness of income keeps the sensitivity of income taxes and social contributions below 1 against moderate fiscal drag Firstly the crucial question is to which extent wages adjust to an inflation surprise One would expect productivity and price developments to be the main drivers of nominal wage developments The survey results support the expectation that wages are sticky downward in particular in cases when nominal wage increases are already small or zero The impact of an inflation surprise is further lowered since wages might adjust with a time lag Also the wage setting process might be affected by other country specific aspects Secondly when the income tax payments are based on previous years incomes the impact of lower wages occurs with a lag Thirdly the elasticity of income tax to inflation is increased by fiscal drag ie when fixed tax brackets entail an increase in average tax rates linked to inflation even if the real wage remains constant Fiscal drag is linked to lagged indexation of tax brackets or a non-indexation of tax brackets
Yet fiscal drag is rather limited as many Member States have put in place a regular indexation For instance in the Netherlands the tax framework itself is indexed with inflation meaning that there is a lower fiscal drag than in other Member States However if both wages (and thus income) and tax brackets are sticky downward the fiscal drag has overall a limited role However the effects of fiscal drag can be observed with a lag in the second year if tax brackets are frozen and that income tax is based on previous years income A freezing of income tax brackets was observed for example in Ireland and in France since the crisis Still in the majority of Member States absence of strong fiscal drag and stickiness of income to a downward revision of inflation also explains why the elasticity of revenues to the 2014 inflation surprise is lower than 1 both in the first year and in the second year
As expected the elasticity of indirect taxation to the inflation surprise is higher than the one of overall revenues At the EU level the elasticity of taxes on production and imports (including VAT) is 07 both in the first year and in the second year
Graph III26 Elasticity of different revenue items to inflation surprise in 2014
Source Commission services
Part III
101
According to our survey this item is not sensitive to inflation only in two Member States while it is very sensitive for almost half of the Member States Taxes on production and imports are directly linked to inflation developments even in case of an inflation surprise However the fact that the elasticity as estimated in the survey is below 1 can be explained by two main factors First consumers react to a smaller increase in prices by increasing their consumption level (in real term) This effect is stronger in the first year (ie before the downward wages adjustment) but can carry on in the second year when wages are sticky with respect to a negative inflation surprise Secondly part of the taxes on import and production are in fact excise duties Thus they are affected by inflation only to the extent that the quantity of consumed goods does not compensate the price decrease and the link between volume (and thus product of the tax) and downward inflation surprise is negative This means that except when excise duties are being indexed to inflation (which happens only in few cases like Belgium (since 2015) for example they tend to lower the overall elasticity of the whole item taxes on imports and production In other words the elasticity of taxes on imports and production excluding excise duties should be closer to 1
223 Indexation of public wages and social transfers
Due to the need for fiscal consolidation the sensitivity of public wages and social transfers has dramatically changed since the financial crisis The purchasing power of households is directly affected by public employees compensation and social transfers That is why in the majority of Member States these expenditure items are frequently adjusted to inflation whether through automatic legal mechanism or following ad hoc decisions However the need for fiscal adjustments in almost all EU Member States in the aftermath of the economic crisis led Member States to remove partially or totally ndash though often temporarily ndash the indexation mechanisms or to freeze the adjustment for several years
Until recently public wages were automatically or semi-automatically indexed to inflation in around one-third of Member States In these Member States there was a legal framework of automatic indexation mechanism to inflation for
compensation of public employees For example in Slovenia compensation of employees was automatically indexed to the national consumption price index (NCPI) In Belgium the indexation is not periodical but public wages increase by 2 each time the reference index ndash NCPI excluding tobacco alcohol and fuels ndash has increased by 2
In other Member States indexation of public wages is less systematic and takes place non-automatically through negotiation or ad hoc decisions For around 20 of the Member States the sensitivity of public wages to inflation developments comes from a negotiated agreement Interesting examples are the Netherlands where trade unions take inflation on board in determining the wage demands but without automatic indexation In Italy the benchmark in the bargaining with Unions is the forecast of the Italian National Institute of Statistics for HICP inflation net of imported energy prices In the other Member States (slightly less than 50) reaction of public wages to inflation is based on an ad hoc decision that takes into account inflation developments but for which the link with inflation is somehow less mechanical For instance in Bulgaria the evolution of public wages follows ad hoc decisions based on a variety of political and economic factors In Lithuania public wages are weakly sensitive to inflation and there is no formal obligation to consider inflation developments
Social transfers were even more frequently indexed to inflation In most cases pensions (that represent the largest share of social transfers) are fully or partially indexed to inflation In more than 70 of the Member States there is an automatic legal mechanism setting the reaction of pensions to inflation developments However in the majority of the cases pensions are indexed to both inflation and real wage developments In Slovakia for instance pension indexation is based on a combination of wage growth and so-called pensioners inflation (ie inflation reflecting a consumption basket of retired people) even though a gradual transition towards pure indexation to pensioners inflation has been introduced In Romania pensions are indexed to a combination of inflation and real wages but with a lag of two years In these cases the link between social transfers and inflation developments strongly varies among Member States and is challenging to quantify as it is both direct and
European Commission Public finances in EMU - 2015
102
indirect (via the impact of inflation on wages which depends on the characteristics of the labour market and wage formations in the Member States) Concerning other social transfers these usually also reflect inflation developments
In the case of social transfers in kind sensitivity to price developments is often limited to the service component in the health sector Specifically in some countries components of health benefits are explicitly indexed to prices and in general inputs of the service such as wages of personnel can be linked to inflation The link between prices for medicines and inflation is often fairly indirect since the evolution of prices for pharmaceuticals and health services is mostly separated from overall inflation developments The price setting for medicines is not a pure market outcome and inflation indexation is not common being in general influenced or substituted for by administrative mechanisms In Hungary for example most of the medicines reimbursed by public health insurance are priced on the basis of a form of a reference pricing or a bidding process but prices are not indexed explicitly In Greece and Romania inflation does not impact expenditure on pharmaceuticals as it is capped via a claw-back mechanism In Belgium the health care budget is annually adapted to the health index an adjusted inflation index leading to higher price sensitivity
However only two Member States have not frozen their public wage indexation in recent years Taking again the example of Slovenia the mechanism was frozen in both 2014 and 2015 This is the case also for pensions although the indexation mechanism was more stable than for public wages in recent years Some social benefits have not caught up with inflation in recent years in several Member States such as in Italy where several recent budget laws have limited the indexation of higher pensions in the Czech Republic where indexation of pensions was temporarily suspended in 2013-2014 or in Spain where the 2013 pension reform reduced the incidence of inflation indexation
In addition pensions and public wages tend to be less sensitive to inflation in case of downward surprises compared with upward revisions For fourteen Member States pensions public wages or both are declared less sensitive in that case For example in Spain there is a minimum
rate of pension increase This limits the possible reaction to a downward surprise in inflation since among low inflation and fiscal consolidation pension increases are already close to or at the minimum rate In Hungary if inflation turns out to be lower than anticipated at the time of the pension increase then there is no downward adjustment in the pension increase On the contrary if inflation turns out to be higher than anticipated in the budget then pensioners are compensated during the course of the year In Latvia pensions below the average pay are linked to inflation and wages developments but the indexation is only applied if the value is positive
These recent evolutions of inflation adjustment decisions and asymmetric indexation explain why the sensitivity of compensation of employees and social transfers is quite low even in the second year (2015) The estimated elasticity of compensation of employees to inflation is particularly low (the EU average is 01 in the first year see Graph III27) Concerning the estimated effect in the first year only three desks answered weakly sensitive and all the others answered not sensitive Social transfers (other than in kind) have a slightly higher elasticity to inflation (only ten desks considered them to be not sensitive in the first year while 40 of them assessed them as weakly sensitive or very sensitive) confirming that inflation adjustment has been more preserved than for public wages However at the EU level elasticity of social transfers (other than in kind) stands at 02 in the first year Indeed the fact that many indexation mechanisms are based on past inflation or forecasts (with possibly an error correction in the following year) inflation surprises cannot be taken into account contemporaneously in most cases However elasticities are still quite low in the second year they stand at 03 for public wages and 04 for social transfers (other than in kind) In both cases for more than half of the Member States the item is considered not sensitive to inflation in the first year Still the diversity of mechanisms ndash and of recent evolutions of them ndash leads these results to be particularly diverse among Member States (see more details in Annex III2 which covers main findings of the survey by country) For both social transfers and compensation of employees around one-third and one-half of the answers in the respective categories stick to not sensitive in the second year while the rest of the answers is
Part III
103
distributed more or less equally over the three other possibilities
224 Intermediate consumption investment and other expenditures
Intermediate consumption has a slightly higher elasticity than the rest of the expenditures The elasticity of intermediate consumption at the EU level is 03 in the first year and 04 in the second year This is explained by the fact that intermediate consumption is directly related to price developments The sensitivity is higher in the second year because part of the dedicated budget for intermediate consumption is fixed in nominal terms on a yearly basis so adjustments to inflation surprises can only be done the year after Indeed at the stage of budgetary planning the amount dedicated to intermediate consumption is often linked to the inflation forecast and once the budget is adopted the expenditure ceilings assigned to specific government entries can rarely be exceeded However even in the second year the
sensitivity is rather low While some longer term service contracts may have an indexation clause there are many Member States in which no automatic mechanism of compensation for past inflation forecast errors are envisioned in the budgetary process Downward adjustments of the budget to compensate past lower inflation are indeed rarely observed Finally lower prices could result in higher volume of purchased goods rather than lower total spending Moreover it is difficult in particular for this item to distinguish inflation from other factors which are often judged to be far more important
Gross fixed capital formation is influenced by inflation but the link is much weaker than for intermediate consumption The elasticity of this item to inflation at the EU level is estimated at 02 for both the first and the second year As it concerns mainly long-term contracts the link with inflation is lagged and much weaker Investments are typically discrete events where the price is determined on the basis of public procurement Ex
Graph III27 Elasticity of different expenditure items to inflation surprise in 2014
Source Commission services
European Commission Public finances in EMU - 2015
104
Dtminus1 δ
ante (before a supplier is selected) bidders take into account their costs including anticipated inflation Ex post (once a supplier is selected) the treatment of inflation depends on the actual contract Unless the project duration is particularly long inflation risks are likely to be absorbed by the suppliers but there is no universal rule Moreover an important share of gross fixed capital formation (GFCF) is composed of EU funds in particular for those Member States which acceded to the EU in 2004 or later As EU funds-related spending is part of a different process link to inflation developments is quite weak on a year-on-year basis Finally a large share of GFCF concerns the construction sector so its evolution could be more linked to construction prices which have their own cycle than to consumption price index For example in Italy the price of public procurement for capital goods is usually set in advance However according to the Italian Civil Code the price of public procurement contracts may be subject to revision in case the direct or indirect costs borne by the supplier change (including but not only due to inflation) by more than 10 upwards or downwards making it more difficult to quantify the impact of an inflation surprise
23 IMPACT OF INFLATION ON INTEREST EXPENDITURE
An inflation shock may affect the cost of servicing debt through inflation-linked bonds as well as newly issued and variable rate debt Interest payments are sensitive to in-year inflation developments to the extent that inflation-linked bonds and newly issued or variable rate debt are affected by price changes Inflation-linked bonds are directly influenced in that the annual coupon payments or the principal payment or both are adjusted in line with movements in the level of prices Newly issued debt is affected insofar as higher or lower inflation leads to a change in inflation expectations which may in turn affect bond spot rates This is also the case for variable rate debt Finally while in theory interest payments on foreign currency-denominated debt are sensitive to inflation this depends on the validity both of the Purchasing Power Parity relation ndash which states that price levels are equalized across countries once account is taken of the Balassa-Samuelson effect ndash and the validity of
the Uncovered Interest Parity relation in financial markets Thus empirically in the short term the relationship between inflation and a countrys exchange rate and relative interest rate is complex and very difficult to estimate In what follows it is considered that foreign-denominated debt is not affected by an inflation surprise
Therefore the amount of interest payments in year t can be expressed as follows
(1)
Where is the amount of outstanding debt at the end of year t-1 is the share of in-year inflation sensitive debt (that is the sum of debt with a residual maturity of less than one year inflation-linked debt and variable rate debt) it δ is the implicit interest rate on that share and it1-δ is the implicit interest rate on the remaining stock of debt (that is non-inflation-linked fixed rate debt with a residual maturity of more than one year) It can be shown from the above that the elasticity of interest expenditure with respect to prices (and hence to an inflation shock) can be approximated by (114)
Where it is the aggregate implicit interest rate on debt A 1 percentage point decrease in inflation
will thus lead to a percent decline in the amount of interest payments This implies that in case of smaller implicit interest rate the elasticity will be higher since the same change in the implicit interest rate relates to a smaller initial level Note that when inflation expectations are revised in line with inflation surprises and provided that spot interest rates adjust fully to inflation expectations (the so-called Fisher effect see below) the elasticity is simply given by
(114) By definition = minus 1 and = Therefore
equiv times = times times
In addition it follows from equation (1) that = times times Therefore
= times times times = times times times (1 + ) cong times times
= times + (1 minus ) times 1minus times minus1
001 times δ times partitδpartπt times 1it
η cong times times 1
Part III
105
Annex III3 provides a disaggregated representation of how inflation impacts upon interest payments
The portion of debt that is sensitive to inflation can be derived using alternative andor complementary data sources Available data sources do not allow for comprehensive and consistent measurement of inflation-sensitive debt across EU Member States A two-step approach is used here Eurostat data which covers all general government sub-sectors and includes both debt securities and loans are used to compute the proportion of short-term debt However the time structure of debt in Eurostat data is computed on the basis of its initial maturity rather than its maturity structure at each moment in time which would be a more adequate figure for the purpose of this analysis Therefore Bloomberg data are used to assess the proportion of long-term debt that was
to be rolled over in 2014 (115) The shares of inflation-indexed and variable-rate debt are estimated separately using OECD data (116) Altogether this gives a proxy of the share of debt that could be influenced by in-year inflation developments
The portion of debt that is sensitive to inflation varies significantly from one Member State to another The share of debt (at the end of 2013) with a residual maturity of less than one year inflation-linked debt and variable rate debt can be considered at least partly sensitive to inflation and ranges from around 5 to slightly above 50 (see Graph III28) (117) The share of debt with less
(115) Data compiled by Bloomberg cover central government
debt and for some Member States central government-guaranteed debt However public debt of subnational governments and other entities classified in general government as well as loans are not always covered
(116) The relevant OECD database was used even though it was not updated since 2010 because no alternative comprehensive data source is available
(117) Limitations in the data set imply that the mentioned subsets may partly overlap in practice In addition Greece and
η =1 cong times 1
Graph III28 Share of debt sensitive to inflation in the EU Member States
Source Commission services
European Commission Public finances in EMU - 2015
106
than one year of remaining maturity ranged from around 5 to slightly less than 35 across Member States averaging close to 20 This share was below 10 only in three Member States The share of inflation-linked bonds exceeds 5 only for a couple of countries The UK and Sweden show the highest values around 20 (118)
The impact of an inflation shock on interest payments will depend on how much spot interest rates are affected by (actual and forecast) inflation developments The so-called Fisher effect states that there will be a one-for-one adjustment of the nominal interest rate to the expected inflation rate The implication of the conjectured constant real rate is that monetary policy will have no effect on the real economy However empirical evidence (119) suggests that at least in the short run changes in the expected inflation rate do not only have monetary effects but also affect real variables Thus the nominal interest rate and the expected inflation rate are
Cyprus the remaining euro area countries under a macroeconomic adjustment programme are not included in the analysis of the sensitivity of interest rates with respect to inflation Indeed interest rate conditions are in these cases subject to a specific agreement and can to a large extent be considered disconnected from inflation developments
(118) Missing data points were replaced with EU averages The composition of debt was thus aligned with EU averages
(119) An overview of recent studies can be found in Beyer et al (2009) and in Westerlund (2008) For a review of the literature on the Fisher effect see Cooray (2002)
positively correlated but there is not a one-for-one relationship A Fisher effect of 05 was chosen as a baseline assumption in this analysis As to the relationship between the actual and forecast rate of inflation at the current juncture the recent movements in inflation swaps (see Graph III29) suggest that medium- and long-term inflation expectations have fallen to a large extent in line with current inflation
Under the assumptions made the elasticity of interest payments (see Graph III210) with respect to inflation is found to be significantly larger than 1 Assuming 50 pass-through from inflation (expectations) to interest rates a 1 percentage point decrease in inflation is estimated to reduce interest payments in the EU as a whole by 39 in the first year and 35 in the second year (in cumulative terms-) We assume that on average debt is rolled uniformly over the year hence there is a carry-over effect in the following year for the share of debt that comes to renewal However the impact is decreasing in the second year as we consider the impact of the 2014 inflation shock as if the rate of inflation in the second year remained unchanged from the baseline (120) In turn this implies that spot interest rates in the second year and hence the amount of debt to be redeemed is not affected by the inflation shock Note that similarly interest payments on inflation-linked and variable rate debt are left unchanged from the baseline in the second year
Assuming the Fisher hypothesis in full leads to higher elasticity Under the assumption that the inflation shock filters into the interest rate one for one the elasticity of interest expenditure is estimated at 59 in the first year and 70 in the second year for the EU as a whole Note that independent of the assumption regarding the Fisher effect interest payments on inflation-linked bonds are assumed to adjust one-to-one with movements in the level of prices
(120) This choice reflects the focus on the impact of lower
inflation in 2014 on interest expenditure in 2014 and in 2015 and does not mean that the shock is necessarily temporary Irrespectively we assume that the effect of the Fisher effect (partly) holds as even in the case of a temporary shock interest expenditure would be affected through interest paid on short-term debt This lends further support to a partial (as opposed to a full) application of the Fisher effect
Graph III29 Market-based inflation expectations in the euro area
Source Eurostat Bloomberg and Commission services calculations Notes Curves represent inflation expectations as derived from inflation swap rates over different horizons Lines represent the y-o-y rate of core inflation
Part III
107
The results vary from one country to another depending on the portion of inflation sensitive debt The in-year elasticity of interest expenditure is found to vary from very small values in Luxembourg Malta Austria and Slovenia to around 11 in Sweden and around six in the UK assuming that the 50 pass-through Fisher effect holds (Graph III210) Sweden and the UK hold significant amounts of inflation or interest indexed debt leading to a decrease in the elasticity in the second year to around 9 and 25 Relatively long maturities for Luxembourg Malta Austria and Slovenia debt in combination with low share of indexed bonds lead to fairly low elasticities
The actual developments in interest expenditure over the last few years in a sub-set of EU Member States is summarised in Box III21
Savings in interest expenditure cushion the increase in the deficit induced by a downward inflation surprise Graph III211 shows savings in interest expenditure amount linked to a deflationary surprise of 1 pp amount to around 01 of GDP in the first and the second year Compared to the analysis in 21 the deficit increase is thus reduced to 01 of GDP in the
first year and below that in the second year The deficit is even slightly reduced following the inflation surprise for two countries in the first year and for seven countries in the second year
Assuming the Fisher hypothesis in full leads to an even smaller aggregate impact of inflation on the headline balance However the difference with the baseline scenario is relatively small in size (approximately 005 of GDP in the first year
Graph III210 Elasticity of interest expenditure to inflation in the EU Member States
Source Commission services
Graph III211 Semi-elasticity of deficit in 2014 and 2015 to an inflation surprise in 2014 Contributions of revenue and expenditures (primary and interest)
Source Commission services
European Commission Public finances in EMU - 2015
108
and01 in the second year)
The impact of the 2014 inflation surprise on the overall balance varies significantly across Member States At the country level the overall impact of a 1 pp negative inflation shock on the budget balance is comprised between -01 of GDP and 03 of GDP (see Graph III212) implying that it could have a material impact in terms of the annual change in the headline balance
This is all the more evident when comparing these estimates with what can be reasonably seen as theoretical maximum impact of a 1 pp inflation shock of around 04-05 of GDP (121) where by revenues adjust one for one while expenditures remain unchanged The maximum impact is even slightly smaller when taking into account the likely
(121) Indeed assuming that revenues evolve strictly in
proportion to nominal GDP and that primary expenditure is set by budget law and invariant to real-time movements in inflation changes in the primary balance will mirror those in the ratio of nominal primary expenditure to nominal GDP For example if the primary expenditure ratio is 50 a pp fall in inflation will automatically translate into a deterioration of the primary balance of 05 of GDP
fall in interest expenditure For example France and Italy are estimated to see their headline balances deteriorate by 03 and 02 of GDP respectively in the first year following a 1 pp drop in inflation versus a theoretical impact of up to 04 and 03 of GDP respectively
Graph III212 Impact on budget balance of the negative inflation surprise in 2014 in the EU Member States ( of GDP)
Source Commission services
Part III
109
(Continued on the next page)
European Commission Public finances in EMU - 2015
110
Box (continued)
3 IMPACT OF AN INFLATION SHOCK ON FISCAL EFFORT UNDER THE SGP
111
Chapter III2 showed that revenues evolve broadly in line with inflation developments possibly with a short time lag depending on how fast tax bases adjust as well as on tax rules and tax collection By contrast it is less straightforward to measure the impact on government spending Indeed some items are often linked to inflation while others are not at least not in the short run (eg items indexed on the basis of the inflation rate observed in the previous year or on the basis of expected inflation) Most importantly countries implementing nominal expenditure ceilings pay freezes cuts in social transfers etc as part of (predetermined multi-year) consolidation packages will find it difficult to adjust plans to take inflation surprises into account
This chapter sheds more light on the interplay between inflation surprises and fiscal effort as measured by the various metrics that are used when assessing compliance with the rules of the Stability and Growth Pact Indeed the way inflation developments affect compliance with the rules is a relatively new topic also because most of the latter have been built under the implicit assumption of price stability evidenced by annual inflation (almost) continuously around 2 since the inception of the SGP
In principle only unanticipated inflation shocks may affect the assessment of compliance with the SGP rules Indeed the way fiscal effort is measured for the purposes of EU fiscal surveillance implies that price developments that are not anticipated at the time of policy advice (eg a Council recommendation under the excessive deficit procedure) may lead to an overly positivenegative picture of the governments course of action in the subsequent assessments By contrast inflation developments should be surveillance-neutral as long as they (and their impact on the budget balance) are anticipated This said because revenues and expenditures may not be equally responsive to price developments a protracted period of low inflation ndash even if fully anticipated and thus with no impact on measuring fiscal effort ndash raises the question as to whether or not it is appropriate to take the inflation outlook into account when formulating policy recommendations This chapter focuses on
unexpected inflation shocks thus leaving the issue of the appropriateness of requirements in a low inflation environment aside
While not directly observable the concept of fiscal effort plays a central role in evaluating the extent to which government action impacts upon the budget balance Traditionally fiscal effort is gauged by (the change in) the structural budget balance which can be referred to as a top-down method of measuring the governments influence on the budget balance An alternative bottom-up approach which has been developed more recently seeks to account separately for the effects of individual policy initiatives on the budget balance Currently both approaches are used to assess compliance with the SGP whether under the preventive or the corrective arm of the SGP
This chapter shows that inflation surprises affect the top-down and bottom-up techniques in an opposite fashion In particular the implications in terms of the (relative) relevance of the different indicators used and hence in terms of policy surveillance depend crucially on how sensitive revenue and expenditure aggregates are to inflation
A disinflation shock that leads to a worsening in the budget balance will likewise lead to a worsening in the structural balance thereby showing an overly negative picture of the orientation of fiscal policy A negative inflation shock will typically impact negatively on the headline government balance as revenues will decrease more as a result of lower inflation than expenditures will do (see Chapter III2) The cyclical correction method used to transform the headline balance into a structural balance does not correct for inflation surprises Therefore a disinflation shock that affects the headline budget balance will also affect the structural balance and ultimately lead to underestimating the fiscal effort implemented by the country concerned
By contrast bottom-up estimates of fiscal effort will likely be inflated following a disinflation shock A negative inflation surprise will also affect the returns from discretionary fiscal measures
European Commission Public finances in EMU - 2015
112
However the way individual measures are aggregated for the purposes of fiscal surveillance (a truly bottom-up approach on the revenue side an essentially top-down method regarding expenditures) implies that inflation developments will act differently on revenue measures than on expenditures savings While the returns from revenue measures will be impacted by lower inflation this effect will be relatively marginal since it is only a base effect on the additional revenue provided by the measure This will likely be more than compensated for by the expenditure estimate since any fall in expenditures due to lower inflation will be assessed on the full expenditure base rather than a specific measure
Compliance with the debt rule can also be affected by inflation shocks The debt reduction benchmark specified in the Code of Conduct on the SGP and the methodology for assessing progress during the three-year transition period take account of cyclical conditions as far as the real economy is concerned but not inflation developments Negative inflation shocks can therefore translate into higher requirements if only through a denominator effect and jeopardise compliance with the debt rule
The chapter is organised as follows Sections III21 and III22 look at how inflation shocks affect the assessment of compliance with the preventive and the corrective arm of the SGP respectively Section III23 looks into the impact on the debt rule including during the transition period More detailed explanations are provided in Annex III4 Section III24 draws the implications for fiscal surveillance
31 THE PREVENTIVE ARM
Structural budget balances play a key role when assessing compliance with the preventive arm of the SGP They represent cyclically-adjusted general government budget positions net of one-off and other temporary measures They are used to assess whether the country-specific medium-term budgetary objectives (MTOs) also defined in structural terms are achieved or appropriate progress is made (see Chapter II1)
The structural balance pillar is complemented by an analysis of the growth rate of
expenditures net of discretionary revenue measures through the so-called expenditure benchmark This requires that for countries at their MTO any excess growth of expenditures over a medium-term reference rate of potential GDP growth be matched by discretionary revenue measures Countries on their adjustment path must contain their net expenditure growth at a rate lower than medium-term potential GDP growth again unless matched by discretionary revenue measures
Based on the results of Chapter III2 a disinflation shock will likely cause the structural balance to underestimate fiscal effort whereas the expenditure benchmark will be inflated The following subsections describe the channels through which inflations shocks impact upon the two indicators used
311 Impact on structural balance
A negative inflation shock which causes revenues to underperform while expenditures remain on target or adjust by less than revenues will lead to a worsening in the headline balance compared to the baseline where by baseline we mean no inflation shock
This in turn will lead to a worsening in the structural balance as the cyclical component of the budget balance is not influenced by inflation developments
This can be summarised as
πdarrrarr|ΔREV|gt|ΔEXP|rarr[GGBdarr and ΔOG=0]rarr SBdarrrarrΔSBdarr
Where π stands for inflation REV and EXP for general government revenues and expenditures GGB for general government balance OG for output gap and SB for structural balance
The quantitative impact will crucially depend on the relative response or elasticity of revenues and expenditures with respect to inflation Assuming that revenues adjust fully to inflation while only half of expenditures do so a rough calculation suggests that a 1 pp surprise in inflation will lead to a 02-03 pp of GDP worsening in the structural balance compared with the baseline
Part III
113
Therefore in the likely case where revenues adjust faster andor to a larger extent than expenditures to a negative inflation shock the change in the structural balance will tend to underestimate fiscal effort and thus paint an overly negative picture of the governments policy action
312 Impact on expenditure benchmark
The expenditure benchmark ie the reference rate against which the growth rate of expenditures (net of discretionary revenue measures) is assessed is frozen ex ante and thus remains unchanged for the in-year and ex post assessments of compliance For example a country that is at the MTO and whose medium-term potential GDP growth and GDP deflator for year t are estimatedforecast in year t-1 at 1 and 2 respectively should make sure that expenditures grow by not more than 3 And it is this 3 reference rate that will be used for the in-year and ex-post assessments
The effect of a negative inflation shock will mainly depend on whether andor to what extent expenditures adjust to lower inflation as the impact on discretionary revenue measures is expected in general to be negligible If the growth rate of expenditures remains unchanged from the baseline compliance with the expenditure benchmark (the 3 reference rate in the example) will not be affected and the distance to the benchmark whether positive or negative will provide an appropriate picture of the underlying fiscal effort
Conversely if expenditures adjust if only slightly to lower inflation this will make it easier for the country to comply with the benchmark In this case the expenditure benchmark approach will tend to overestimate fiscal effort
As a consequence the extent to which compliance with the expenditure benchmark is affected by inflation surprises will crucially depend on the elasticity of expenditures with respect to inflation Assuming that half of expenditures adjust to inflation while the returns from revenue measures are materially unaffected a rough calculation suggests that a 1 pp negative surprise in inflation will lead to a 02-03 pp of GDP improvement in fiscal effort as measured by the expenditure benchmark approach compared with the baseline
This can therefore be summarised as
πdarrrarr[ΔEXP=0 and ΔREVmeasures=0]rarr DEBharr
rarr [ΔEXPlt0 and ΔREV measures=0] rarr DEBuarr
Therefore in the likely case where expenditures adjust if only slightly to lower inflation the expenditure benchmark approach will tend to overestimate fiscal effort and thus paint an overly positive picture of the governments policy action
32 THE CORRECTIVE ARM
If a Member State that is subject to the excessive deficit procedure is not compliant with the headline deficit targets an assessment of effective action is undertaken Similarly to the preventive arm as a first step the assessment of effective action revolves around the comparison between the required change in the structural balance and the observed change in the structural balance
The structural balance is complemented by a bottom-up quantification of measures This is done by quantifying the budgetary impact of the (new) measures the Member State has introduced to raise revenues and to cut spending since the EDP recommendation was issued The effort on the revenue side is measured by adding up the returns from individual revenue measures The amount of expenditure savings is estimated as the difference between the outturn growth of expenditures and the growth expected at the time of recommendation ie the change in expenditures if no further measures had been taken
Conceptually the two indicators are very similar to those used in the preventive arm and will thus be affected by inflation surprises in a similar fashion The following subsections describe the channels through which inflations shocks impact upon the indicators used in the corrective arm
321 Impact on (corrected) structural balance
While conceptually very similar to the structural balance pillar used in the preventive arm in the corrective arm the observed change in the
European Commission Public finances in EMU - 2015
114
structural balance is corrected for effects outside the control of government (other than the normal working of the cycle that is captured by the cyclical component of the budget balance) In particular the change in the structural balance is adjusted to net out the effect of possible revisions to potential GDP growth estimates and unexpected shortfallswindfalls in revenues relative to the macroeconomic scenario underpinning the EDP recommendation through the so-called α and β adjustors
As already indicated the (non-adjusted) change in the structural balance will tend to underestimate fiscal effort as long as revenues adjust to inflation to a larger extent than expenditures In general this effect will not be corrected for by the α and β adjustors meaning that the adjusted changed in the structural balance used under the corrective arm will be distorted as well Indeed the α adjustor will remain materially unchanged as inflation surprises should not affect potential output growth estimates The β adjustor will also be unaffected as long as revenues adjust fully to the inflation shock
The process can therefore be summarised as
πdarr rarr |ΔREV| gt |ΔEXP| rarr [GGBdarr and ΔOG=0] rarr SBdarr rarr [ΔSBdarr and αβharr] rarr ΔSBdarr
A disinflation shock will as a rule distort the adjusted change in the structural balance so that the top-down approach will tend to underestimate fiscal effort This is similar to what happens with the structural balance pillar under the preventive arm
322 Impact on bottom-up approach
Conceptually the bottom-up approach is very similar to the expenditure benchmark except that in one case the reference growth rate for expenditures is medium-term potential GDP growth or a lower rate (expenditure benchmark) while in the other the reference rate is the growth rate of expenditures (net of discretionary revenue measures) expected at the time of the EDP recommendation (bottom-up approach)
Therefore the effect of a negative inflation shock will be very similar ndash a fall in expenditures due to lower inflation will translate into higher fiscal effort as this will affect the growth differential
between the outturn and the EDP recommendation while the returns from discretionary revenue measures will generally remain unchanged However here again any fall in interest payments will not distort the bottom-up approach
323 The impact of inflation on fiscal effort the case of France
As part of the normal EU surveillance process Member States compliance with the rules of the SGP is assessed after each Commissions forecast and may have procedural consequences After its 2015 winter forecast the Commission made a formal assessment of Frances compliance with the Council Recommendation of 21 June 2013 under the Excessive Deficit Procedure and recommended that the Council extend the deadline for bringing the deficit below 3 of GDP by two years to 2017
In its assessment the Commission took account of the lower-than-expected inflation observed in 2014 as measured by the deflator of GDP Indeed in the baseline scenario underpinning the Council Recommendation of 21 June the GDP deflator had been forecast to increase by 17 in 2014 while the Commissions 2015 winter forecast estimated the increase in the GDP deflator to have been 09 pp lower
The Commissions assessment showed that the lower-than-expected rate of inflation affected fiscal effort as measured by the corrected change in the structural balance (top-down approach) and the bottom-up approach Partly as a consequence of this the two indicators provided diverging signals thus calling for a careful analysis
The Commission assessed that the (corrected) structural balance indicator had been strongly affected by the inflation shock less so the bottom-up indicator The Commissions Report (122) showed that the negative inflation shock had an adverse impact on tax bases and led to downward revisions in tax revenues By comparison expenditures were found less sensitive to the inflation revision especially given that public expenditures are partly guided by norms set in
(122) Available online at
httpeceuropaeueurope2020pdfcsr2015cr2015_france_enpdf
Part III
115
nominal terms In addition a number of expenditures notably public wages and social transfers related to pensions and housing were frozen in nominal terms in 2014 making the achievement of further savings more difficult The resulting deterioration in the headline deficit led to a worsening in the structural balance thus leading to an estimated lower effort according to the top-down assessment This appears in line with the results of the survey set out in Chapter III2 Indeed the elasticity of primary expenditures with respect to the inflation surprise was found to be approximately 01 while that of revenues around 08 implying that primary expenditures remained virtually unchanged while revenues adjusted almost in proportion with the inflation shock
By contrast the bottom-up assessment was found less sensitive to the inflation revision than the top-down assessment The Commissions report indicated that the direct quantification of the discretionary revenue measures adopted in 2014 had only been marginally impacted by the lower-than-expected rate of inflation while a large part of expenditures did not adjust to lower inflation as expenditure targets had been set in nominal terms The overall impact of the downward revision in inflation on the bottom-up effort was found limited Again the results of the survey tend to confirm that the bottom-up estimate of fiscal effort was much less affected than the top-down estimate with primary expenditures virtually unaffected by the inflation shock
Overall the gap between the two indicators that could be attributed to the inflation surprise was estimated at 06 of GDP For the reasons indicated above this 06 of GDP difference was found to come almost exclusively from the corrected change in the structural balance being negatively affected by the lower than expected rate of inflation The bottom-up estimate was thus deemed to provide a broadly accurate picture of the fiscal effort delivered by France in 2014
33 THE DEBT RULE
A Member State is non-compliant with the debt criterion if its general government debt is greater than 60 of GDP and is not sufficiently diminishing and approaching 60 of GDP at a satisfactory pace This means that the gap between
the Member States debt level and the 60 reference threshold needs to be reduced by 120th annually (on average over three years) This in turn is translated into a debt reduction benchmark which is set out in the Code of Conduct on the SGP A breach of the debt criterion is judged by considering the debt reduction benchmark in three configurations a backward-looking version a forward-looking one and by taking into account the impact of the economic cycle Only if a country is in breach of all these conditions is the debt criterion considered breached and an Article 126(3) TFEU report is written
The debt benchmark takes the cyclical conditions into account as far as the real economy is concerned By contrast inflation developments and in particular low inflation are not accounted for in this methodology This also applies to the methodology used for calculating the MLSA ie the minimum linear structural adjustment that ensures ndash if followed ndash compliance with the debt rule at the end of the three-year transition period foreseen for those Member States that were in EDP at the time of adoption of the so-called 6-pack piece of legislation
Negative inflation surprises can therefore translate into a more demanding debt benchmark mainly through a denominator effect That is all things equal a disinflation shock can make it harder for Member States to comply with the debt rule both during the transition period and once this is over and the full debt rule is applied
Whether the impact of an inflation shock on the debt benchmark will be material will crucially depend on the nature and timing of the shock In particular in the case of a temporary inflation shock compliance with the debt benchmark (and the MLSA) will only be affected if the shock occurs during the period covered by the least stringent of the backward-looking the forward-looking and the cyclically-adjusted components To put it differently given the specification of the debt rule as long as the shock does not affect the least stringent component of the debt benchmark or in the case of the least stringent component it only affects the initial debt position ndash but not the dynamics underpinning the three-year average ndash compliance with the debt benchmark will not be influenced (and the MLSA will remain broadly unchanged)
European Commission Public finances in EMU - 2015
116
Another consequence is that the impact on the debt benchmark (and the MLSA) for year t of a shock in year t will be larger than the impact of an equal shock in year t-1
Also note that here we simply look at the denominator effect neglecting any possible impact of inflation on the numerator and in particular on the general government balance In particular as already seen a disinflation shock will likely lead to a worsening in the government balance which will in turn make compliance with the debt rule (and the MLSA) even more demanding
34 CONCLUSION AND IMPLICATIONS FOR FISCAL SURVEILLANCE
The above analysis suggests that the structural balance indicators might in some cases underestimate fiscal effort in the event of a negative inflation surprise By contrast the expenditure benchmark and the bottom-up approach will tend to provide an overly positive picture of the governments policy action However the extent to which the various the various metrics of fiscal effort are affected will very much depend on the countrys specificities As already discussed while it can generally be expected that revenues will respond more quickly to a negative inflation shock than expenditures the extent of this divergence will depend on domestic structures such as the extent and design of indexation arrangements or the use of nominal expenditure ceilings
In light of the findings from Chapter III2 both sets of indicators have likely been affected by the lower inflation observed in 2014 calling for an informed economic judgement The results presented in Chapter III2 suggest that for most Member States the disinflation shock observed in 2014 caused both revenues and expenditures to underperform though with revenues affected to a slightly larger extent This in turn implies that both sets of indicators ((corrected) structural balance on the one hand expenditure benchmark and bottom-up approach on the other) were generally affected by a disinflation shock meaning that none of them should be taken at face value but instead both should be qualified This should be done through
the so-called overall assessment in the preventive arm and the careful analysis in the corrective arm
The assessment of compliance should also consider whether the inflation shock could have been anticipated and most importantly the budget (namely expenditure ceilings) adjusted accordingly From this perspective only unanticipated shocks should in principle be considered a mitigating factor In all other cases and all things equal the structural balance indicators which implicitly assume that headline balances are unaffected by inflation developments would remain a valid measure of fiscal effort
The distinction between anticipated and unanticipated shocks appears relevant also when it comes to compliance with the debt rule As explained above low inflation makes it harder for Member States to meet the debt criterion and can lead to requirements which can be prohibitive While it is true that relevant factors can be taken into account in determining whether a numerical breach of the debt criterion should lead to the opening of an EDP in the case of inflation there is the specific difficulty that it remains unclear what should be considered as normal inflation This implies that the assessment of the role of inflation in the breach of the debt criterion is not possible per se but can only be conducted with respect to inflation surprises
While the current framework allows dealing with a temporary inflation shock that occurs after SGP recommendations are issued through an informed economic judgement a prolonged period of low inflation or negative inflation may raise the question of the appropriateness of new recommendations Indeed because low inflation makes it more difficult to reach a given improvement in the structural balance ndash in the sense that a larger amount of measures is necessary to reach this under the assumption of downward rigidity of expenditures ndash the required levels might need to be downgraded accordingly
ANNEX 1 SURVEY
117
For the main categories of revenue and expenditure the survey presented the following questions and proposed stylised answers Desks were invited to specify and substantiate their replies in comment fields
1) Sensitivity of the item to inflation as for 2014
1 Not sensitive (elasticity lower than 025)
2 Faintly sensitive (elasticity between 025 and 05)
3 Quite sensitive (elasticity between 05 and 075)
4 Very sensitive (elasticity greater than 075)
2a revenue) Through which main channels the item is impacted by inflation
1 Inflation impacts wages that in turn impact the item
2 Inflation impacts households consumption that in turn impacts the item
3 Fiscal drag
4 Automatic legal mechanism
5 Several of the above (precisions in comments)
6 Other channels (precisions in comments)
2b expenditure) Through which main channels the item is impacted by inflation
1 Inflation impacts wages in the private sector that in turn impact wages in the public sector
2 Automatic mechanism of indexation
3 Inflation-index bonds (for interests)
4 Several of the above (precisions in comments)
5 Other channels (precisions in comments)
3) Are there automatic mechanism driving the effect of inflation on the item
1 Yes full or almost full indexation of the item
2Yes but only partially (precisions in comments)
3Other mechanisms (precisions in comments)
4 No automatic mechanism
4) On which indicator the automatic mechanism is based
1 HICP
2 GDP deflator
3 Other (precisions in comments)
5) Is the indexation symmetric
1 Yes the indexation is symmetric
2 No the indexation is not symmetric (precision in comments)
3 Other (precisions in comments)
4 No indexation
6) Is there a lag in the indexation mechanism
1 No the item is indexed with current inflation
2 Yes the item is indexed on the previous year inflation
3 Yes (other lag precisions in comments)
4 No indexation
7) How the automatic mechanisms have evolved between 2009 and 2014
1 The mechanism did not change since 2009
2 New measures increased sensitivity to inflation (main measures in comments)
3 New measures decreased sensitivity to inflation (main measures in comments)
4 Sensitivity evolved for other reasons (precisions in comments)
ANNEX 2 MAIN COUNTRY-SPECIFIC FEATURES CHARACTERIZING THE IMPACT OF INFLATION ON THE BUDGET BALANCE
118
According to DG ECFINs analysis in the vast majority of countries there was hardly any real-time adjustment of primary expenditures to the inflation shock of 2014 At the same time in nearly two-third of the cases the in-year sensitivity of revenues was assessed to have been relatively strong This suggests that in 2014 budget balances were negatively affected by the negative inflation surprise In 2015 there has been some additional adjustment of primary expenditures but the picture remains broadly unchanged
As to the channels of transmission on the expenditure side a clear link to inflation developments can be seen for social transfers other than in kind which contain pensions through indexation mechanisms and for public wages mostly indirectly via private sector wage developments Government purchases of goods and services are also affected by price developments but not without differences across countries and often with a time lag For all other sub-categories of expenditures the link is less straightforward
On the revenue side not surprisingly the main channels are consumption taxes where the tax base directly reflects price developments (VAT) and taxes affected by wage developments (direct taxes and social contributions) In a number of countries (eg BE HU CZ FR IT MT AT PL RO and UK) revenues were found to be largely responsive to inflation In others (eg in BG DE EE EL ES HR CY PT and FI) the impact of the 2014 inflation surprise proved limited with private sector wages mostly driven by labour market developments It is noteworthy that in a number of countries (DE EL HR and CY) the lower than expected rate of inflation did not affect VAT receipts significantly
Fiscal drag due to no or suspended indexation was reported in DE IE ES CY LU PL SI In countries with a flat PIT system (ie one single rate) such as HU and RO the issue of fiscal drag is largely avoided
The main country-specific features characterizing the impact of inflation on the budget balance and notably on government expenditure according to DG ECFINs desks are the following
BG Public sector wages and social benefits are not automatically linked to inflation with increases decided on an ad hoc basis Most other expenditure items are also weakly sensitive to inflation developments
BE Most expenditure categories are very sensitive to inflation developments though often with a time lag mainly through automatic indexation mechanisms Virtually all revenues are also very sensitive to inflation with wages being the main channel of transmission
CZ Only social benefits appear sensitive to inflation developments with legislation providing for an automatic indexation of pensions (together with possible ad hoc adjustments) adjust to a large extent to inflation through the wage setting process (though no automatic link)
DK Apart from social benefits expenditures are not sensitive to inflation developments VAT and income tax receipts react to inflation(123)
DE According to DG ECFIN there is no evidence of inflation affecting the fiscal position of the country in the current context of relatively strong increases in real incomes and consumption leading to buoyant direct and indirect tax revenues Indeed while inflation can affect the wage setting process both in the public and in the private sector with knock-on effects on the public wage bill tax receipts and social benefits (whose indexation is linked to wages) the impact of the current low inflation environment on wages appears to be limited so far
EE The budget balance is weakly sensitive to inflation Indeed there are no indexation mechanisms except for pensions Any increase in public sector wages is conditional upon budgetary constraints
IE Most expenditure items are weakly if at all sensitive to inflation not least because of the temporary freeze in public sector wages and social benefits over 2013-16 decided as part of the so-called Haddington Road Agreement
(123) It should be noted that in Denmark social contributions
account for a negligible part of total revenues
Part III
119
EL Public sector wages have been frozen and automatic indexation of social benefits suspended as part of the macroeconomic adjustment programme
ES In the absence of an automatic mechanism high unemployment over the last few years together with fiscal consolidation needs have held back wage pressures in the public sector Pensions are no longer linked automatically to inflation at least not as long as the system continues to run deficits On the revenue side income tax and social contributions have been only partly affected by inflation with private sector wages also constrained by high unemployment
FR Public wages have been frozen since 2010 While automatically linked to inflation pensions were left unchanged in 2014 In 2015 the indexation mechanism would have led to a decrease in social benefits a possibility that was rejected
HR The budget balance is weakly if at all sensitive to changes in the level of prices with the exception of VAT receipts The indexation mechanism for regular pensions was modified leading to smaller increases whereas special and privileged pension schemes are only adjusted once the growth and deficit outlook improves significantly
IT Although there is no automatic indexation of public sector wages forecast inflation is the benchmark in the collective bargaining process Pensions are adjusted in line with the previous years inflation but recent budget laws have limited the indexation of higher pensions
CY Automatic indexation has been suspended until end-2016 both for public sector wages and public sector pensions Private sector pensions have been frozen as well
LV Most expenditure categories react only weakly to inflation in contrast with revenues Public sector wages are set discretionarily by the government though with the aim of narrowing the gap with private sector wages to 80 Pensions below the average pay are linked to inflation and real wage growth but this cannot result in negative indexation
LT Public wages and social benefits are only weakly sensitive to price developments with no formal obligation to consider inflation Intermediate consumption and gross fixed capital formation are quite sensitive though with a time lag
LU Public (and private) sector wages pensions and several other types of social benefits are increased each time the reference index increases by at least 25 implying that low inflation postpones such mechanical increases In turn this affects receipts from income tax and social contributions
HU Nominal wage freezes have prevailed since 2008 with only some ad hoc wage increases targeted at specific subsectors Pensions are indexed to (forecast) inflation with a subsequent adjustment in case of a higher than expected increase in prices
MT Most expenditure items are to a large extent sensitive to price developments often with a time lag either through an indexation mechanism (wages and social benefits) or through the price of government purchases
NL In general government expenditure is weakly sensitive to inflation Public wages and social benefits are linked to inflation via the gross minimum wage which is linked to private sector wage developments In recent years however policy decisions to cap spending growth have engendered a de-linking of public wages from inflation
AT Public wages and social benefits are indexed to lagged inflation
PL The largest expenditure items are affected by inflation though with a lag in case of unexpected shocks The main channels are (quasi) automatic indexation (wages and social benefits)
PT There is no automatic indexation of public sector wages automatic indexation of social benefits has been suspended since 2009 and intermediate consumption is only gradually affected by inflation
RO Recent inflation developments had little effect on government expenditure either due to the
European Commission Public finances in EMU - 2015
120
absence of a direct link or because of lagged indexation (in Romania pensions are indexed to year T-2 inflation)
SI While there is generally full indexation of public sector wages and social transfers this has been suspended since 2012
SK Inflation is one factor among others in pay agreements with public sector trade unions Pension indexation combines wage growth and inflation measured on a typical basket of goods and services for pensioners Other expenditure categories are weakly if at all sensitive to inflation in contrast with revenues
FI (Forecast) inflation is taken into account when building the budget Pension indexation is also based on inflation though the government has the right not to apply it in some years (which has been the case in 2015)
SE The budget balance is found to be only temporarily influenced by inflation in that both expenditures and revenues adjust to price developments though at a different pace
UK Apart from social benefits (pensions are subject to a triple lock meaning the higher rate of CPIearnings25 is applied) expenditure categories are only to a limited extent sensitive to price developments In particular as part of the fiscal consolidation plans public sector wages were frozen from 2010 and increased on average by 1 in later years with no visible link to inflation
ANNEX 3 IMPACT OF AN INLFATION SHOCK ON INTEREST EXPENDITURE
121
= (1 minus ) times times times minus1
Under the simplifying assumption that only the stock of debt at the end of year t-1 brings interest payments in year t the amount of interest expenditure in year t can be expressed as follows
(1)
is the interest paid on inflation-linked debt This
item can be rewritten as
where is the share of inflation-linked debt and
is the (nominal) implicit interest rate on that
share
- is the interest paid on the fraction of debt
not linked to inflation and coming to maturity
within year This item can be rewritten as
where is the share of debt with a residual
maturity of less than one year and is the
implicit interest rate on that share Note that
because we assume that changes in spot interest
rates will affect newly issued debt and the stock
of variable interest rate debt in the same manner
can be seen as covering both categories
- is the interest paid on the remaining
fraction of debt ie non-inflation-linked fixed
rate debt with a residual maturity of more than
one year This item can be rewritten as
where is the implicit interest rate on this
share of debt
Therefore can be written as
(2)
An inflation shock will impact differently upon
these three terms Note that equation (1) is a
simplified representation of equation (2)
Impact of an inflation shock on
By definition (124) the interest paid on inflation-
linked bonds will adjust fully with movements in
the level of prices
Impact of an inflation shock on
Debt which comes to maturity within the current
year needs to be refinanced in the current market
conditions Therefore the interest paid will depend
on the extent to which bond spot rates react to
inflation
Where is the sensitivity of bond spot rates to
inflation assumed to lie between 0 and 1
(124) Note that depending on the bond type the index to which
the bond is linked may apply only to the annual coupon similarly to variable interest instruments the principle payment or to both of these However whatever the specific design of the bond is the implicit aim is to hedge the inflation risk Therefore the implicit nominal interest
rate can be expressed as In this respect the ESA 2010 standard of national accounts states that the change in value of the instrument due to the index during an accrual period is treated as interest accruing in this period in addition to the normal interest accrued over this period
= + +
= times times minus1
= (1 minus ) times times times minus1
= (1 minus ) times (1 minus ) times times minus1
) times (1 minus ) times ] times minus1
= times minus1
= (1 minus ) times times times minus1
= +
= [ times + (1 minus ) times times + (1 minus
European Commission Public finances in EMU - 2013
122
Impact of an inflation shock on
The interest paid on non-inflation-linked fixed
rate debt with a residual maturity of more than one
year is not affected by movements in prices in year
Overall effect
Therefore the overall effect of an inflation shock
on the amount of interest expenditure in year is
The sensitivity is 0 if
bull = 0 and = 0 That is there is no
inflation-linked debt and there is no variable
rate debt or debt to be redeemed during the
year
bull = 0 and = 0 That is there is no
inflation-linked debt and market rates are not
influenced by inflation
The sensitivity is 1 if
bull = 1 That is the whole stock of debt is
indexed to inflation
bull = 0 and = 0 That is the whole stock of
debt is to be redeemed during the year
(andor is composed of variable rate
instruments) and there is full pass-through
from inflation to market rates
= = 0
= [ + (1 minus ) times times ] times minus1
ANNEX 4 ANALYTICAL DECOMPOSITION OF THE IMPACT OF AN INLFATION SHOCK ON FISCAL EFFORT
123
A41 PREVENTIVE ARM OF THE SGP
Structural balance
The cyclically-adjusted balance is computed as the difference between the headline balance-to-GDP ratio and an estimated cyclical component The structural balance is in turn the cyclically-adjusted balance excluding one-off items In algebraic terms
Where and stand for government revenues and expenditures respectively and for nominal GDP real GDP and potential GDP respectively and ε is the so-called budgetary semi-elasticity to the output gap The output gap ( ) is computed in real terms and is therefore not influenced by inflation developments (125)
It follows from the above that any change in the headline balance ratio following an inflation shock
will translate into a one-to-one change in the structural balance
(We assume that = 0) (126)
Basically the less expenditures adjust to lower inflation compared to revenues the more the headline balance and hence fiscal effort as measured by the change in the structural balance
(125) Note that here we do not look at possible effects of
inflation on the real economy which could in turn affect fiscal effort
(126) For the sake of simplicity we also neglect any denominator effects Indeed given that the various measures of fiscal effort are expressed as a of GDP any revision to the GDP deflator will also affect the denominator However the impact will generally be fairly small For example assuming an initial effort of 1 of GDP a 1 pp inflation shock will affect this by roughly 1 times 1 or 001 of GDP through the denominator effect
will be affected By contrast if revenues and expenditures adjust to the same extent following an inflation shock the headline balance and hence fiscal effort will remain unchanged
Expenditure benchmark
The expenditure benchmark to which is compared the change in the expenditure aggregate for year t is computed as follows (127)
(a)
Where and are respectively the so-called lower rate reference medium-term rate of potential GDP growth and convergence margin
The net expenditure growth rate for year t is computed as follows
(b)
Where and ∆ are respectively the net expenditure growth rate the modified expenditure aggregate and the estimated impact of revenue measures having an incremental effect on revenues
The net expenditure growth in real terms is computed as follows
(c)
Where lowast is the GDP deflator This is the average GDP deflator from the Commissions year t-1 spring and autumn forecasts implying that the reference rate is known with certainty in the autumn of year t-1
It follows from the above that any change in following an inflation shock will affect the net expenditure growth rate of year t Note that the impact on ∆ will generally be negligible Given that the expenditure benchmark itself (ie the medium-term reference rate of potential GDP
(127) See Chapter II2 for more details on the different steps of
the calculations
= minus minus times= minus minus
= minus
= minus
= minus ∆ minus minus1minus1
= 1 +1 + lowast minus 1
= minus minus times minus
European Commission Public finances in EMU - 2015
124
growth or for countries not yet at the MTO a lower rate) is frozen in year t-1 any change in inflation developments in year t that affects expenditures will affect compliance with the expenditure benchmark as well
In algebraic terms the deviation from the expenditure benchmark can be derived from (a) (b) and (c)
Let an inflation shock in year t Compliance with the expenditure benchmark will be affected as follows (remember that lowast is fixed)
It can be further shown that
With standing for the elasticity of expenditures with respect to the inflation shock (128)
It follows from the above that the extent to which (compliance with) the expenditure benchmark is affected will crucially depend on the extent to which expenditures are affected by the inflation shock Indeed
minus If the net expenditure aggregate remains unchanged following a disinflation shock ( = 0) the growth rate of this aggregate
(128) By definition Therefore and assuming that ∆ = 0
Plugging this in and rearranging the equation gives
will be unchanged as well and will not be affected
minus Alternatively if expenditures adjust if only slightly to lower inflation (0 lt le 1) this will translate into higher meaning that fiscal effort as measured by the expenditure benchmark will be positively affected Note that as already discussed while the returns from revenue measures will be impacted by lower inflation this effect will be relatively marginal since it is only a base effect on the additional revenue provided by the measure This will likely be more than compensated for by the expenditure estimate since any fall in expenditures due to lower inflation will be assessed on the full expenditure base rather than a specific measure
A42 CORRECTIVE ARM OF THE SGP
Top-down approach
The change in the structural balance is adjusted in the following way
minus The adjustor measures the impact of revisions in potential output growth compared to forecast underlying the EDP recommendation All other things equal a higher (or a lower) rate of potential output growth in year t would lead to a higher (or a lower) change in the structural balance
minus The adjustor measures the impact of revisions on the composition of economic growth or of other windfallsshortfalls on revenues This captures the fact that the response of revenues (the so-called elasticity) can differ from that expected at the time of the EDP recommendation for reasons outside the control of government
minus The adjustor captures the impact of other unexpected events under very unusual and significant circumstances
Analytically the adjustor corrects for the impact of the potential growth outturns being different from those forecast It is defined as
= ( minus ) times minus1
= minus times minus1 = minus 1 + lowast times minus1
= lowast = minus (1 + lowast)2 times
= minus1 minus 1= times minus1minus1 = times minus1minus1 times times = times times minus1minus1
= minus1 + lowast times times minus1minus1 times minus1 = minus1 + lowast times 11 + times= lowast = minus (1 + lowast)2 times
Part III
125
= (Δ minus minus [ + ( minus 1) times Δ ] times minus1)
= minus times minus1
minus(Δ minus minus [ + ( minus 1) times Δ ] times minus1)
Where stands for the structural expenditure
ratio in year t-1 and and for the outturn and forecast potential growth estimates
It follows from the above that theα adjustor is not affected by inflation developments (except for the
second-order impact through on the α adjustor
for year t+1)
(Remember that here we do not look at possible second-round effects of inflation on the real economy which could be sizeable and affect fiscal effort)
The adjustor corrects for the impact of the response of revenues with respect to nominal GDP being different from that forecast It is defined as
Where and ∆ stand for the level of revenues and the annual change in revenues for the amount of discretionary revenue measures (incremental effect on revenues in year t) and for nominal GDP and nominal GDP growth ∆ for the change in the output gap and for the standard revenue elasticity used for the computation of cyclically-adjusted balances
Let an inflation shock in year t In algebraic terms the adjustor will be affected as follows
Assuming that = 0 (as already discussed
while the returns from revenue measures will be
impacted by lower inflation this effect will be relatively marginal since it is only a base effect on the additional revenue provided by the measure)
It can be further shown that
With standing for the elasticity of revenues with respect to the inflation shock(129)
It follows that as long as revenues adjust fully to the inflation shock ( = 1) the parameter will be left (broadly) unchanged
Note that the impact of a disinflation shock on the corrected change in the structural balance will actually be broadly the same whether revenues adjust fully or only partly to the shock Indeed
ndash If revenues adjust fully following a disinflation shock ( = 1) the headline balance will deteriorate accordingly and so will the structural balance the uncorrected change in the structural balance and the corrected change in the structural balance
ndashAlternatively if revenues adjust only partly to lower inflation ( lt 1) the headline balance will deteriorate by less than in the previous case and so will the structural balance and the uncorrected change in the structural balance
However in this case lt 0 implying larger
windfalls or smaller shortfalls in revenues so that the corrected change in the structural balance will deteriorate by more than the uncorrected change All in all the deterioration in the corrected change will be broadly the same whether = 1 or lt 1
(129) By definition = minus 1 Therefore
Plugging this in and rearranging the equation gives
= minus1minus1 times ( minus minus1 )
= 0
= (Δ minus minus [ + ( minus 1) times Δ ] times minus1)
cong minus 11 + times
= times minus1 = times minus1 times times = times 1 += 1 += minus (1 + ) times (1 + ) times minus11 + times cong minus 11 + times
European Commission Public finances in EMU - 2015
126
Bottom-up
The annual bottom-up fiscal effort is defined as follows
Where
minus stands for the estimated budgetary impact of the discretionary revenue measures additional to the ones already included in the baseline as estimated at the time of assessment net of one-off measures implemented in year t (or under the relevant sub-period of time under scrutiny)
minus ∆ stands for the change in total nominal expenditure in year t net of one-off measures non-discretionary changes in interest payments non-discretionary changes in unemployment benefits and public investment matched by EU funds as estimated at the time of assessment as well as other country-specific effects in limited cases
minus ∆ is the change in the total nominal expenditure in year t as forecast in the baseline corrected for statistical revisions net of one-off measures non-discretionary changes in interest payments non-discretionary changes in unemployment benefits and public investment matched by EU funds as estimated at the time the EDP recommendation was issued as well as other country-specific effects in limited cases
minus stands for nominal GDP in year t as estimated at the time of assessment of effective action
The resulting total fiscal effort delivered since the recommendation was issued is then compared to the annual amount of discretionary fiscal measures specified in the recitals of the EDP recommendation or notice on a cumulative basis
Similarly to the expenditure benchmark approach under the preventive arm any change in ∆ following an inflation shock will affect the expenditure component one-to-one As is the case
with the expenditure benchmark the impact on will generally be negligible In
consequence any change to the inflation outlook since the EDP recommendation that affects expenditures will affect fiscal effort as measured by the bottom-up approach as well
Let an inflation shock in year t In algebraic terms the bottom-up measure of fiscal effort will be affected as follows
Assuming that = 0 (as already discussed
while the returns from revenue measures will be impacted by lower inflation this effect will be relatively marginal since it is only a base effect on the additional revenue provided by the measure)
It can be further shown that
With standing for the elasticity of expenditures with respect to the inflation shock (130)
As in the case of the expenditure benchmark the extent to which fiscal effort as measured by the bottom-up approach is affected will crucially depend on the extent to which expenditures are affected by the inflation shock Indeed
minus If the expenditure aggregate remains unchanged following a disinflation shock ( = 0) the growth rate of this aggregate
(130) By definition = minus 1 Therefore
Plugging this in and rearranging the equation gives
= minus ∆ minus∆
= minus ∆ = minus
= minus1 + times
= times minus1 = times minus1 times times =
= 1 += minus (1 + ) times (1 + ) times minus11 + times cong minus 11 + times
Part III
127
will be left unchanged as well and will not be affected
minus Alternatively if expenditures adjust if only slightly to lower inflation (0 lt le 1) this will translate into higher meaning that fiscal effort as measured by the bottom-up approach will be positively affected
A43 THE DEBT RULE
The backward-looking component of the debt reduction benchmark is defined as follows
Where stands for the debt-to-GDP ratio in year t
The gap to the backward-looking component is then
Let an inflation shock in year i The gap to the backward-looking component will be affected as follows
Assuming that affects the debt ratio only through the denominator implies that
Therefore an inflation shock will affect the gap to (or compliance with) the backward-looking component of the debt reduction benchmark for year t as follows
It follows from the above that only inflation shocks in years t t-1 and t-2 will have a material impact on compliance with the backward-looking component of the debt benchmark for year t with a shock in year t having a larger impact than a shock in year t-1
The forward-looking component of the debt reduction benchmark is defined as
The same reasoning as for the backward-looking component applies It follows that a temporary inflation shock will affect either the backward-looking component or the forward looking component for year t but not both at the same time unless the shock occurs in year t
Finally the cyclically-adjusted component of the debt benchmark is defined as
= 60+ 0953 times ( minus1 minus 60) + 09523times ( minus2 minus 60) + 09533times ( minus3 minus 60)
minus = minus 60minus 0953times ( minus1 minus 60) minus 09523times ( minus2 minus 60) minus 09533times ( minus3 minus 60)
( minus ) = minus 0953 times minus1 minus 09523times minus2 minus 09533 times minus3
cong minus1 cong cong =
minus1minus1 = minus2minus2 = = 0
( minus )
cong = 1 minus 0953 times = minus 11 minus 0953 minus 09523 times = minus 2
1 minus 0953 minus 09523 minus 09533 times le minus 3
+2 = 60 + 0953 times ( +1 minus 60)+ 09523 times ( minus 60)+ 09533 times ( minus1 minus 60)
= +sum minus2=0minus3 times prod (1 + minusℎ ) times (1 + minusℎ)2ℎ=0
European Commission Public finances in EMU - 2015
128
Where stands for debt for GDP at current prices for potential growth for the price deflator of GDP and for the cyclical part of the budget balance The equation can be rewritten as
Where stands for real growth The gap to the cyclically-adjusted component is then
Let an inflation shock in year i The gap to the cyclically-adjusted component will be affected as follows
Note that in general is expected to be close to 1
(ratio of two gross growth rates) and close to 0
Therefore an inflation shock will in general affect the gap to the cyclically-adjusted component of the debt benchmark to the same extent as it will affect the gap to the backward-looking component of the benchmark for any year t
This is consistent with the very purpose of the cyclically-adjusted component which is to remove the effect of real growth being different from potential growth ndash not to correct for inflation developments
Note that the MLSA will be affected in a similar manner However given that by definition the MLSA implies that the additional adjustment implemented is frontloaded (in order to ensure compliance with the debt reduction benchmark at the end of the transitional period) the overall adjustment is lower than if it had to be implemented in the last year of the transitional period To put it differently back loading fiscal effort necessarily implies a higher stock of debt in any year t
= timesprod (1 + minusℎ)2ℎ=0prod (1 + minusℎ )2ℎ=0+ sum minus2=0minus3 times prod (1 + minusℎ ) times (1 + minusℎ)2ℎ=0
equiv times +
minus = times + minus 60minus 0953times ( minus1 minus 60) minus 09523times ( minus2 minus 60) minus 09533times ( minus3 minus 60)
( minus ) = times + minus 0953times minus1 minus 09523 times minus2minus 09533 times minus3
( minus ) cong ( minus )
Part IV The EUs stylized fiscal reaction function
1 THE EUS STYLIZED FISCAL REACTION FUNCTION
130
11 INTRODUCTION
In this section we will analyse the factors that determined the Councilrsquos recommendations in excessive deficit procedures (EDPs) over the past 15 years
The EDP is one of the two arms of the common European budgetary rules which are defined in the Stability and Growth Pact (SGP) The aim of the EDP is to ensure that Member States correct their lsquoexcessive deficitsrsquo (131) Article 126 of the Treaty on the Functioning of the European Union (TFEU) requires that Member States avoid excessive government deficits and requires that the developments of the budgetary situation and of the stock of government debt in the Member States be monitored In particular the compliance of Member States with budgetary discipline has to be examined on the basis of i) whether the ratio of the planned or actual government deficit to gross domestic product exceeds a reference value (132) and ii) whether the ratio of government debt to gross domestic product exceeds 60 unless the ratio is sufficiently diminishing and approaching the reference value at a satisfactory pace
When a Member Statersquos general government deficit andor debt do not fulfil the criteria in the Treaty this triggers a procedure with the following main steps first the Commission prepares a report on the countryrsquos budgetary situation if the Commission considers that an excessive deficit in a country exists or may occur it informs the Member State and the Council about it After that the Council can on a proposal from the Commission and having considered any observations which the Member State concerned may wish to make decide whether an excessive deficit exists Finally in case the Council decides that an excessive deficit exists it adopts on a recommendation from the Commission recommendations addressed to the Member State
(131) The expression lsquoexcessive deficitrsquo is used both to refer to a
situation of excessive government borrowing and also to a government debt above 60 of GDP that is not diminishing at a satisfactory pace
(132) hellipunless either the ratio has declined substantially and continuously and reached a level that comes close to the reference value or alternatively the excess over the reference value is only exceptional and temporary and the ratio remains close to the reference value
concerned with a view to bringing that situation to an end within a given period (133)
The recommendations set the fiscal targets that the Member State has to achieve to correct its excessive deficit The targets are expressed in terms of general government headline deficit (134) There are two reasons for this approach first headline deficit is a governmentrsquos main operational variable Second the Treaty threshold for what qualifies as an excessive deficit is defined as the headline deficit-to-GDP ratio so it is natural that the targets in the recommendations should be given in the same unit of measurement
Over time the Council recommendations and the precise requirements have changed in form The initial version of the SGP focused on Member States attaining the required reduction in the headline deficit ratio within the shortest possible time whereas successive amendments acknowledged that it was better to take into account economic circumstances and country-specific characteristics This was achieved by increasing the use of the structural balance (2005) and by giving Member States more specific intermediate objectives and since 2011 bringing in a gradual enforcement mechanism identifying the fiscal effort necessary to respond to the Council recommendation Since 2009 EDP recommendations are also systematically expressed as improvements in the structural balance which are used as the main indicator of fiscal effort This makes it possible to give guidance deemed less dependent on economic cycles Finally to increase the weight of the recommendations a gradual enforcement mechanism was introduced in 2011
In the implementation of the SGP the Council has allowed Member States where necessary to depart from the one-year rule for bringing deficit below
(133) In practice the Commission recommendations for a
Council recommendation are followed by the Council in most cases Therefore the recommendations analysed in this Chapter are both the Commission and the Council recommendations For ease of exposition we will refer to these as Council recommendations throughout the whole chapter
(134) See Article 3(4) of Council Regulation No 146797 of 7 July 1997on speeding up and clarifying the implementation of the excessive deficit procedure (OJ L 209 281997 p 6)
Part IV Characterising the Councilrsquos recommended fiscal reaction to excessive deficits in excessive deficit procedures
131
the 3 threshold This gives the Council some discretion in balancing the need for fast reduction in the excessive deficit against the risk of weakening economic growth or even exacerbating recession during an economic crisis (135)
The EUs fiscal reaction to excessive deficits in the Member States through successive EDPs is complex taking into account both fiscal and economic factors There are two approaches that the Council can take when making its EDP recommendations the lsquonominalistrsquo approach and the lsquostructuralistrsquo approach
Under the nominalist approach the Council has to respect the letter and the spirit of the traditional view of the SGP which puts the emphasis on correcting the lsquoexcessive deficitrsquo in the shortest possible time
By contrast the structuralist approach gives a larger role to the countryrsquos economic situation when determining the requirements of the EDP recommendations This approach distinguishes between the structural and the cyclical component of the balance privileges requirements set as change in the structural balance so as to allow automatic stabilisers to play and modulates requirements depending on the countryrsquos economic situation and other relevant factors
Starting with Bohnrsquos 1998 paper a large body of literature has been written on lsquofiscal reaction functionsrsquo The literature on fiscal reaction functions investigates the behaviour of governments when setting fiscal policy as a function of the fiscal and the macroeconomic situation at the time the fiscal decisions are taken This is generally obtained by estimating the reaction of government deficits to debt levels past deficits and economic variables like cyclical conditions Studies in this field thus estimate lsquoex-post reaction functionsrsquo and use them to calculate a governmentrsquos fiscal space or to assess debt sustainability (136) This is assessed by checking whether when a governmentrsquos debt increases the government increases the (primary) balance enough to comply with its intertemporal budget constraint a result almost always borne out in
(135) Article 3(4) quoted sets a minimum annual requirement in
structural terms of 05 of GDP as a benchmark (136) See eg Gosh et al (2013)
advanced economies since the original Bohn paper Recent developments in the literature check for non-linearity in the relationship between the debt and the (primary) balance (137) or a lack of stability over time in this relationship for example against the backdrop of the recent Great Recession (138) or the accession to the euro (139)
Unlike the existing literature on the subject this chapter estimates the reaction function of the Council rather than of the national governments We will focus on what determined the fiscal requirements the Council issued to Member States over the past 12 years under the EDP By implication we will also be looking at the degree to which these rules enable the Council to take account of the economic environment and of country specificities and risks We will look specifically at the 38 EDPs opened between 2003 and 2014 (of which 11 were still ongoing at the end of 2014) (140) focusing on the 69 accompanying EDP recommendations the Council issued Of the EUrsquos 28 Member States 26 have been concerned by at least one of these recommendations and 22 Member States were addressed by more than one recommendation over the entire 12-year period
The use of real-time data mdash available in past economic forecasts published by the European Commission or in the Councilrsquos recommendations and accompanying documents themselves mdash makes it possible to accurately assess the influence of cyclical conditions on the choices made by the Council and the Commission In general estimates of fiscal reaction functions are based on ex post observations that are not representative of real-time information available at the time the decisions are taken This is particularly relevant when studying the cyclicality of the policy decisions (141) indeed fiscal plans might be significantly different from ex post outcomes This is because government decisions are based on data
(137) See eg Gosh et al (2013) Medeiros (2012) Lukkezen
and Rojas-Romagosa (2012) Celasun et al (2007) Fournier and Fall (2015) Legrenzi and Milas (2013) Mauro et al (2013)
(138) See eg Weichenrieder and Zimmer (2013) and Baldi and Staehr (2015)
(139) See eg Weichenrieder and Zimmer (2013) (140) By end 2015 two more Member States have seen their EDP
abrogated (141) See eg Larch and Salto (2005) Golinelli and Momigliano
(2006) and Cimadomo (2012)
European Commission Public finances in EMU - 2015
132
available in real-time which are often considerably revised over time (142) on forecast data on estimations of the cyclical position and on the multipliers which are uncertain by nature Another important factor is uncertainty over actual implementation as governments do not have complete control over the implementation of their budgets
A second major way in which this paper differs from the traditional literature on fiscal reaction functions is that we will analyse fiscal policy recommendations issued before the policy choices are made and before the outcome that they aim to influence By analysing what determines the recommended fiscal effort as opposed to the implemented fiscal effort that tends to be explored in the existing literature we do not face the problem of reverse causality between economic conditions and fiscal effort (143)
As an alternative to looking at the reaction function of the recommended fiscal effort we also performed an analysis of the number of years granted to Member States to correct their excessive deficit Indeed the length of the recommendation can be considered as a tool to modulate the recommended annual fiscal effort during the adjustment period
The results of the analysis indicate that the Council adopts a reaction function which combines both the nominalist and structuralist approaches described above The reaction function can be considered lsquonominalistrsquo in that the recommended average effort tends to be higher both where the initial deficit was structural and permanent or only cyclical and transitory At the same time lsquostructuralistrsquo considerations also seem to matter as suggested by the finding that cyclical economic conditions do play a role in the recommendations Specifically a worse initial fiscal position leads all things being equal to higher fiscal effort requirements and a higher probability of a longer deadline Worse cyclical economic conditions tend
(142) See eg de Castro et al (2013) (143) This problem of endogeneity is also present in the analysis
of fiscal multipliers where only a very limited number of papers distinguish between plans and outcomes see eg Ramey (2011a and 2011b) Mertens and Ravn (2011) Alesina et al (2015) Cugnasca and Rother (2015) use Council recommendations as instruments for the estimation of fiscal multipliers
to reduce the average recommended effort and to increase the probability of receiving a longer deadline
No other variables are found to have played a significant role in determining the recommendations The debt ratio in particular does not seem to have played any role in determining the fiscal effort required which is interesting considering not only that debt is the centre of focus of the existing literature on the fiscal reaction function but also considering the legislation itself which states that the medium-term debt position (its dynamics and sustainability) constitutes a relevant factor in determining the recommendation
The structure of the rest of this chapter is as follows Section IV12 presents the data providing an overview of the different EDP episodes the associated recommendations and the macroeconomic environment faced by the Member States Section IV13 shows the results of the analysis of the determinants of the required effort Section IV14 presents an analysis of the deadlines granted to Member States to put an end to their excessive deficits Section IV15 provides some conclusions
12 EDP EPISODES AN OVERVIEW
In our analysis we will characterise EDP recommendations by the total improvement in the structural balance recommended by the Council In the recommendation this total improvement is by design determined by the recommended headline deficit path and the macroeconomic scenario underlying each recommendation (144) The total recommended change in the structural balance can be broken down into two elements the recommended average annual effort and the number of years granted to correct the excessive deficit (ie the length of the recommendation) These two aspects form the main subject of this study
(144) When the Council recommendation is only given in terms
of a nominal target or an additional nominal effort relative to the plans included in the budget as is the case for most pre-2009 recommendations we carried out a special calculation to translate it into the corresponding change in structural balance For a precise description of this method see Box IV11
Part IV Characterising the Councilrsquos recommended fiscal reaction to excessive deficits in excessive deficit procedures
133
In total the dataset comprises 69 EDP recommendations issued by the Council for 38 distinct EDP episodes between the first excessive deficit procedure in 2003 and the final year in the sample 2014 (for a full list of all the recommendations see Table IVA11 in Annex IV1) (145) Slightly less than half of all the recommendations in the sample were new recommendations ie recommendations immediately following the opening of an EDP while slightly more than half were revised recommendations revising the length andor nominal path and structural effort of the original recommendation (146)
Real-time outturn and forecast data are used as available to the Council when it makes its recommendation This is important for two reasons First there can be significant differences between ex ante forecasts and ex post outturns Second the outturn may itself be influenced by the policy action actually implemented whereas the forecast is based on the assumption that no further policy changes are made (no-policy-change assumption henceforth) and on other information available at the time of the recommendation Therefore using real-time data allows us to better capture the Councilrsquos reaction to fiscal and economic aggregates even if these aggregates turn out to be different ex post The real-time data are collected from the relevant Commission and
(145) The EDP recommendation to Germany in 2003 is part of
the descriptive analysis but is not taken into account in the analysis (see Box IV11)
(146) Revised recommendations are issued when the Member State has failed to achieve the previously recommended targets This can happen in two scenarios First the Council decides that effective action was taken but unexpected adverse economic events with major adverse consequences for government finances prevented the government from reaching the targets Second the Council issues a new recommendation having established that the Member State took inadequate action In the second scenario the Council can decide to step up the EDP procedure for euro area Member States with stricter requirements and also eventually financial sanctions New recommendations and revised recommendations following unexpected adverse economic events are issued on the basis of Article 126(7) TFEU (previously Article 104(7) TEC) The decision establishing that a Member State has taken inadequate action is based on 126(8) TFEU (previously Article 104(8) TEC) If the Council decides to step up the procedure for euro area Member States it gives notice to the Member State on the basis of Article 126(9) TFEU (previously Article 104(9) TEC)
Council documents which are available on DG ECFINrsquos website (147)
The picture of the EDP recommendations shows that the lsquoaveragersquo recommendation issued in year Y follows a headline deficit outturn of 55 of GDP in the preceding year with projected headline deficits of 63 and 57 of GDP respectively for the years Y and Y+1 based on the no- policy-change assumption The average recommendation asks for a cumulative structural effort of 30 of GDP The average deadline is set by the Council at between two and three years after the recommendation (25 years) Therefore starting from a structural balance of -51 in the year of the recommendation the average annual recommended effort is 11 of GDP per year
Under the legislation the main determinants of EDP recommendations are expected to be the level of the headline balance andor its three components ie the level of the structural balance the level of the cyclical component and the level of one-off measures (lsquoone-offsrsquo) Other variables may play a role reflecting the discretion given to the Council and the relevant factors indicated in the legislation (148) Such variables include
minus the government debt ratio at the time of the recommendation which captures the initial fiscal risks and conditions
minus the projected GDP growth which captures the expected economic conditions
minus dummy variables to capture the specific features of recommendations issued before and after the financial crisis or the specificities of revised versus initial recommendations
The average output gap is estimated to be -24 in year Y and expected to fall to -29 in year Y+1 Therefore the average cyclical component of the budget balance is -11 of GDP in year Y
(147) Commission forecasts which constitute the basis for the
technical analysis and the baseline scenarios are available at httpeceuropaeueconomy_financepublicationscategoriesforecasts_enhtm while legal documents are available at httpeceuropaeueconomy_financeeconomic_governancesgpcorrective_armindex_enhtm
(148) See Council Regulation (EC) No 146797 Article 2
European Commission Public finances in EMU - 2015
134
Characteristics All recommendations
Excluding recommendations issued in the crisis
years
Excluding revised recommendations
average length of the recommendation 25 23 23
average cumulated effort 30 22 22
average annual effort 11 10 09
average headline deficit in year Y -63 -48 -55
average structural balance in year Y -51 -44 -46
average output gap in year Y -24 -18 -21
average cyclical balance in year Y -11 -08 -10
Average debtGDP ratio in year Y 686 733 611
Average real GDP growth forecast (in year Y for Y+1) is 08 and the debt ratio on average amounts to 686 of GDP in year Y
An average EDP episode (ie from the procedurersquos opening to its abrogation) lasts between three and four years (the average being 33) and often includes revised recommendations Most EDP recommendations include one revised recommendation before they are abrogated
Recommendations issued to seven Member States (Greece Poland Hungary France Malta Portugal and Spain) account for 48 of the total number of EDP recommendations and 34 of the total number of EDP episodes
The distribution of EDP recommendations across the 12 years covered by the dataset is irregular About half of all the recommendations were issued in the crisis years of 2009 and 2010 and only three Member States were not concerned by an EDP recommendation in those years (149) If we compare the average EDP recommendations without the crisis years 2009 and 2010 against the average recommendations including the crisis years we find a number of differences
First the initial conditions during the crisis years were clearly worse than during the non-crisis years as confirmed by the difference in the initial structural balance (-51 of GDP in year Y including crisis years compared with -44 of GDP in year Y excluding the crisis) and the output (149) The countries concerned were Estonia Luxembourg and
Sweden Croatia was not yet a Member State
gap in the year of the recommendation (-24 including the crisis years versus -18 excluding the crisis)
As a result the average cumulated structural effort recommended was significantly larger including the crisis years (30 of GDP) than the average recommendation excluding the crisis years (22 of GDP)
At the same time the length of the average recommendation including the crisis years was somewhat longer than if we exclude the crisis Therefore the recommended average annual structural effort (11 and 10 percentage points respectively) is not significantly different whether we include or exclude the crisis years This suggests that although initial conditions were more adverse during the crisis years the recommendations were trying to avoid increasing the required effort Table IV11 sums up the main characteristics of the EDP recommendations
Finally there are also some differences between the new and the revised recommendations In the subsample of initial recommendations (ie excluding the revised recommendations see Table IV11 column 3) the recommended cumulative structural effort is significantly lower than in the full sample that also includes the revised recommendations Also both the length of the recommendations and recommended average annual effort are lower in new recommendations than in the full sample suggesting that the revised recommendations tend to be more demanding than the new recommendations A longer description of the characteristics of the EDP recommendations and their potential determinants is given in Annex IV12
The following section uses this dataset to estimate the Councilrsquos ex ante fiscal recommendation function
13 THE DETERMINANTS OF THE AVERAGE EFFORT
This section focuses on the determinants of the average recommended effort over the period covered by an EDP recommendation Each recommendation is characterised by a (recommended) nominal deficit path which
Table IV11 Main characteristics of the EDP recommendations
Source Commission services
Part IV Characterising the Councilrsquos recommended fiscal reaction to excessive deficits in excessive deficit procedures
135
corresponds to a series of annual fiscal efforts running from the first year of the recommendation to the deadline These fiscal effort targets expressed as improvements in the structural balance as a percentage of potential GDP have been explicitly included in the recommendations since 2009 (150) For pre-2009 recommendations the required structural fiscal effort can be retrieved using a calculation involving the real-time series of output gaps and one-off measures (see Box IV11) The analysis of this section is conducted on the determinants of the average recommended effort which summarises all the information on the fiscal effort over the timeframe of the recommendation in one variable As the fiscal effort path recommended in the context of the EDP is usually quite smooth over the whole EDP period it is possible to focus on the average without losing too much information The next section will focus on the determinants of the number of years granted for the correction of the excessive deficit
EDP recommendations are a priori based on an assessment of the Member Statersquos need and capacity to reduce its deficit This means that a recommendation will be determined by both the Member Statersquos fiscal position and its economic conditions If the effort required depends mostly on the deficit ratio observed at the time of the recommendation with the aim being to reduce it below 3 as soon as possible this reflects the nominalist approach present in the SGP since its inception If however the effort required depends mostly on the economic conditions this would reflect the structuralist logic introduced into the SGP since the reform of 2005
Put differently under the nominalist approach the recommendation would be purely based on the initial headline balance without distinguishing whether the starting headline deficit is structural or cyclical Thereby the recommended average effort can be expected to react similarly to the initial structural and cyclical deficits By contrast under the structuralist approach economic conditions would be taken into account and therefore the recommended average effort would react
(150) Since 2013 recommendations also contain the
corresponding effort as measured in a bottom-up fashion centred on measures to be taken See European Commission (2013)
differently depending on whether the initial deficit is structural or cyclical
The equation we estimate is as follows
(1)
where SB stands for the structural balance at the time of the recommendation The parameter denotes the semi-elasticity of the headline balance to the output gap and OG stands for the output gap at the time of the recommendation
In other words the term εOG is the cyclical component of the balance at the time of the recommendation One-offs as a ratio of GDP at the time of the recommendation are denoted by OO In addition to these three components of the headline balance the equation also includes other potentially relevant factors is the debt-to-GDP ratio at the time of the recommendation and is real GDP growth in the first year of the recommendation
The model allows for a differentiated reaction of the recommended average annual structural effort to the different components of the headline balance Theoretically under a purely or mainly nominalist approach the recommended average effort can be expected to decrease both in the initial structural balance and in the initial cyclical balance ie the coefficients of these components of the headline balance are negative In addition under the purely nominalist approach the coefficients of the structural balance and the cyclical component would be equal ie = reflecting a situation where the policy-maker does not differentiate between the components of the deficit
By contrast where the policy-maker is taking structuralist considerations into account the average effort can be expected to react stronger to the structural balance than to the cyclical component of the balance ie |β| ge |γ| with βγ le 0 Indeed such a reaction would suggest that the Council requires the Member State to undertake more structural effort to eliminate the structural deficit than to eliminate the cyclical deficit which would be automatically eliminated once the output gap closes Moreover since the cyclical component is a function of the output gap
= α + β SB0 + γ(εOG0) + φOO0 + δ 0 + ρ 1 +
European Commission Public finances in EMU - 2015
136
(Continued on the next page)
Box IV11 Comparability of pre-2009 and post-2009 recommendations
An EDP recommendation consists of a path of fiscal deficit targets conducive to the achievement of the final budgetary objective within a given deadline The final budgetary objective is set in most cases at 3 of GDP unless the debt-reduction benchmark requires a budgetary objective below the 3 threshold
Regulation (EC) 146797 requires the yearly fiscal effort expressed as the improvement in the structural balance in terms of potential GDP to be such that for all The recommendation can therefore be summarised by two main parameters
bull the number of years between the first year of the recommendation and the deadline (n in the following)
bull the average recommended effort over the EDP period ( in the following)
The total recommended structural effort E over the EDP period is largely determined by the headline deficit at the beginning of the EDP period There is an implicit constraint on and n as the combination of the two parameters should allow E to be high enough to allow the deficit to come back below the 3 threshold given the projected economic conditions assumed multipliers and spontaneous trends in
expenditures and revenues Algebraically where the total cumulative effort is itself a function of the number of years granted and conditional on other parameters denoted by In order to ensure the comparability of pre-2009 and post-2009 recommendations we followed the strategy used by Cugnasca amp Rother (2015) which converts the nominal targets into a structural balance path using real-time output gap estimates to retrieve the fiscal effort implicit in the pre-2009 recommendations This approach is based on the assumptions of zero multipliers (ie taking the output gap estimates of the no-policy-change forecast as a given) and no one-offs In episodes where the pre-2009 recommendations explicitly stated the fiscal path in cyclically-adjusted terms the value of that fiscal path was used
Each recommendation can be seen as a path of required efforts resulting in a change in the structural balance where n is the length of the recommendation Therefore for t=1hellipn corresponds to the recommended change in the structural balance between year t-1 and t
Similarly to Cugnasca amp Rother (2015) for every recommendation j of every country i issued in year the fiscal path is
where is the structural effort recommended to Member State i for year t is the difference between the nominal target (namely the ratio of government balance to GDP) recommended to Member State i in t and t-1
ε is the semi-elasticity of Member State i as used in the Commission projections
is the real-time estimate of the change in the output gap between t and t-1 In order to retrieve the unspecified structural effort in pre-2009 recommendations lasting three years or longer the following
assumption had to be made as is generally not known for t ge 3 it is assumed that the output gap closes progressively over the years following the last year of the forecast horizon
As regards the timing convention we denote by t=1 the first year of the recommendation defined as the year after the recommendation was issued In practice this convention implied that one recommendation had to be dropped from the sample namely the recommendation addressed to Germany in 2003 which set
etet ge 05 et (e1hellip en)
= sum1 = ( | )
(e1hellip en) et
= ∆ minus ∆ lt 2009∆ lt 2009∆ ge 2009
∆ ∆
∆ ∆
Part IV Characterising the Councilrsquos recommended fiscal reaction to excessive deficits in excessive deficit procedures
137
Coefficient Std error Pgt|t| 95 confidence intervalConstant -008 022 072 -051 036Structural balance (SB0) -022 003 000 -028 -017 Cyclical component ( 0) -014 006 002 -026 -002 One-offs 005 002 001 001 010Expected growth (g1) -005 003 006 -010 000 Public debt-to-GDP (d0) 000 000 031 -001 000
its coefficient also captures the reaction of the policy-maker to the cyclical conditions in the economy Therefore the observation that |β| ge|γ| can also capture the intention of policy-makers to require less structural effort when cyclical conditions are worse in this way avoiding negative feedback loops Theoretically in a purely structuralist approach the coefficient of the cyclical component could even turn positive
The results of the estimation of model (1) suggest that the recommended effort is based on both nominalist and structuralist considerations (151) On the one hand we find that both the coefficients of the initial structural balance and of the initial cyclical balance are negative and significant in determining the recommended average structural effort pointing to a nominalist approach (see Table IV12 column 1) On the other hand the coefficients of the structural and cyclical components of the headline balance are different In fact we find that the recommended average effort reacts more to changes in the initial structural balance than to changes in the cyclical component pointing to a structural approach
A one-percentage-point worse initial structural balance increases the average recommended effort by 022 percentage points A one-percentage-point worse initial cyclical component (152) increases the average recommended effort by 014 points ie 30 less than the change in the structural balance The estimates are however not very precise as 95 -error bands of the coefficients of the structural balance and cyclical component overlap to a large extent (but not at 90 ) This can be caused by the limited number of observations We must therefore introduce a note of caution when interpreting the results
The fact that the recommended average structural effort is influenced by the initial cyclical
(151) See Annex IV13 for more details on the method used for
the estimation (152) A one-percentage point change in the cyclical component
corresponds to a change in the output-gap between 16 and 36 percentage points depending on the value of the semi-elasticity
component points to the fact that a higher starting headline deficit systematically leads to more demanding recommendations At the same time by reacting less to the cyclical component than to the structural balance when determining the recommended structural adjustment path the Council acknowledges the role of automatic stabilisers and allows them to take effect even if only partially
A drop in the headline balance due to one-off measures (all other things being equal) is by definition temporary and its impact on the headline balance fades out in the year after We find that there is a significant but quantitatively very small positive effect from the one-offs on the recommended structural effort This points to some overshooting in the average recommended structural effort in the presence of one-off measures
The model including the total headline balance rather than its components performs more poorly than the previous model (see Table IV13) (153) Specifically model (2) can be considered a restricted form of model (1) where the condition β = γ = θ is imposed The explanatory power of this model is significantly lower (with a coefficient
(153) The estimated equation has the form
(2) = αprime + βprime HB0 + δprime 0 + ρprime 1
Box (continued)
Table IV12 Results of the estimation of Model 1
Source Commission services Number of observations 68 Pseudo R2 043 Significant at 90 level Significant at 95 level Significant at 99 level Note Given that since 2009 the restriction e ge05 has been officially imposed by the regulations a censored regression model has to be used (model II Tobit) See A13
European Commission Public finances in EMU - 2015
138
Exogenous variables
coefficient Std error Pgt|z| 95 confidence interval
Constant 078 023 000 030 126Headline balance (HB0)
-007 002 000 -010 -003
Expected growth (g1)
-011 003 000 -018 -004
Public debt-to-GDP (d0) 000 000 042 -000 000
of determination less than half that of the estimation of model (1)) This supports our choice to distinguish the effect of the structural fiscal position from the cyclical component The value of the coefficient of the headline balance is significant but lower than both the coefficient of the structural balance and the coefficient of the cyclical component in the previous model
The relatively low value of the headline balance coefficient is likely to be explained by the effect of the one-offs The one-offs are very volatile and poorly correlated with the two other components of the headline balance in our sample However they are strongly correlated with the headline deficit and their positive effect on the average recommended effort possibly causes this low coefficient for the headline balance We can confirm this result by running an estimation in which we distinguish one-offs from the two other components of the headline balance (see also Annex IV16) The poor performance of this model confirms that the model that distinguishes between the structural and cyclical components is more informative
Other determinants of the average effort
It is important to test whether other variables determine the choice of the average effort recommended by the Council as the legislation gives the Council the discretion to take into account relevant factors such as the government debt ratio or the growth outlook when setting the requirements This analysis also provides a second robustness check of the previous results
The main outcome is that there is little space for other determinants of the average effort of the recommendations Specifically there is some evidence that expected economic conditions play a
minor role in determining the recommended effort beyond what we see when we measure the cyclical component of the government balance The results of the estimation show a negative though very small and little significant effect from the forecast GDP growth a one point lower GDP growth forecast increases the average recommended effort over the EDP period by 005 points However the point estimate of the coefficient of expected GDP growth is likely to be imprecise and its degree of significance distorted by multicollinearity through the correlation between the cyclical component and growth itself (154) Therefore we should not over-interpret this result In addition the estimation has been tested excluding the growth variable The results of this estimation showed similar results (see Annex IV16)
We found no evidence that the debt-to-GDP ratio has a strong influence on the EDP recommendation This can have various explanations first all EDP recommendations were issued on the basis of the established existence of excessive deficit Even if in some cases the debt criterion was breached as well the main concern behind the recommendation was the excessive deficit This is in part because the lsquodebt rulersquo - which makes operational the requirement in the Treaty that the government debt ratio has to be below 60 or sufficiently decreasing ndash was only introduced in 2011 and has been applied only once since (to Malta in 2013) It may also reflect the fact that as already mentioned the fiscal deficit can be considered as an intermediate target for controlling the debt meaning that the initial deficit indirectly captures concerns about the debt Moreover while a high debt-to-GDP ratio is always a matter of concern this indicator does not always reflect the sustainability of the debt which depends on long-term variables such as potential growth future expected costs of ageing future interest rates and others Estimations of other specifications of the model also lead to a non-significant debt-to-GDP ratio
No other characteristics of the Member Statesrsquo public finances and economy have been found to have a significant effect on the recommended average effort A series of models which include dummies have been tested (see Annex IV16) However neither the model including a dummy
(154) The correlation between the two variables is 039
Table IV13 Results of the estimation of Model 2
Source Number of observations 68 Pseudo R2 017 Significant at 90 level Significant at 95 level Significant at 99 level
Part IV Characterising the Councilrsquos recommended fiscal reaction to excessive deficits in excessive deficit procedures
139
for the crisis years nor the model tested with a dummy variable for the revised recommendations nor a dummy for Member States under a financial assistance programme suggest that these variables are significant We also tested the model with a simple ordinary least square (OLS) estimation method which also gives very similar results
14 THE DETERMINANTS OF THE DEADLINE
This section looks at what determines the number of years a Member State is granted to correct the excessive deficit As already discussed the legislation requires the excessive deficit to be corrected as fast as possible Nevertheless when the Council sets the deadline of the correction it can also weigh up fiscal and economic considerations
From a given starting fiscal position the Council can require a higher average annual effort over a shorter period or smaller average annual effort over a longer period of time Indeed the timeframe allowed by the Council can be considered as a tool for controlling the recommended average annual effort and consequently mirrors it In principle we would expect the Council to recommend longer deadlines for a very bad starting fiscal position (the nominalist approach) and where there were worse cyclical conditions (the structuralist approach) (155) As was the case in the previous estimate we can detect the structural approach through the difference in the odds ratio of the structural balance and the cyclical balance Since the coefficient of the cyclical balance captures both the impact of the initial headline balance and the cyclical economic conditions and better (worse) economic conditions should lead to a shorter (longer) deadline if they are taken into account the structuralist approach is reflected by a lower odds ratio or equivalently a larger inverse odds ratio of the cyclical balance than of the structural balance
(155) Strictly speaking the fact that the deadline is longer when
the initial headline balance is worse could already be considered a structuralist approach because the longer deadline itself contributes to containing the required annual average effort However our discussion will abstract from this consideration and stick to the more restrictive definition
While there is a negative relation between the recommended average annual effort and the recommended deadline there is no perfect mapping between them Therefore analysing the length of the recommendations separately may produce complementary results to what we found when we analysed the average recommended effort This is partly because the length of the recommendation is set in integer years ie a discrete variable therefore it cannot serve to precisely fine-tune the recommended average annual effort Also the absence of a one-to-one relationship between the recommended average effort and the deadline is due to the fact that the cumulative structural effort required to reach the 3 of GDP headline-deficit threshold is contingent on economic conditions over the duration of the EDP recommendation Given that the economic outlook is forecast to improve over most EDP episodes granting an additional year to correct the excessive deficit can reduce the cumulative structural improvement required Consequently the additional year more than proportionately reduces the average annual fiscal effort
A further different reason to run this analysis is that it also serves as a check on the previous results One may suspect the results of the previous section to be driven by the existence of an algebraic relation between the effort required by the Council and the deficit In fact this section shows that there is a genuine reaction function of the Council in giving recommendations under the SGP which goes beyond the algebraic relationship
In this section the relative probability that the Council recommends a deadline that is one year longer is modelled as a function of the initial fiscal position and the economic conditions captured by the variables included in the estimation of the recommended average structural effort (156)
The results of this estimation show that as with the results of the previous section a worse initial structural balance and a worse cyclical component
(156) By construction the length of the EDP recommendation
(the number of years between the first year of the recommendation and the deadline n in the following) can take only discrete values This requires the use of a lsquomultinomial ordinal logistic modelrsquo (further details of this model in A14)
European Commission Public finances in EMU - 2015
140
ln = α + β SB0 + γ(εOG0) + φ ∙ OO0 + δ 0 + ρ 1 isin 14
Exogenous variables
Odds ratio Odds ratio-
1 Std error Pgt|z| 95 confidence interval
Structural balance (SB0)
047 213 007 000 035 063
Cyclical component ( ∙ 0)
038 263 011 000 022 066
One-offs 037 270 012 000 019 071Expected growth (g1) 094
106012 064 073 121
Public debt-to-GDP (d0) 100
100
001 084 098 101
tend to increase the length of the EDP recommendation (see Table IV14)
Specifically all other things being equal a one percentage-point better initial structural balance broadly halves the probability of receiving a one year longer deadline (see odds ratio in Table IV14 column 1) by the same token a one-percentage-point worse structural balance more than doubles the odds of a longer deadline (see the inverse of the odds ratio in Table IV14 column 2)
Similarly a one-percentage-point better initial cyclical balance multiplies the odds by 038 which means that a one-percentage-point worse cyclical balance (or output gap) multiplies the odds by the inverse 26
Overall these results indicate once more that the Council follows a nominalist approach combined with structuralist considerations The finding that the odds ratios of the headline balance components are found to be significant ndash and moreover are all in the same ballpark ndash suggests that the Council primarily determines the deadline on the basis of the initial headline balance Still the probability of a longer deadline is somewhat higher for a one-percentage-point worse cyclical balance than for a one-percentage-point worse structural balance As discussed above once more the coefficient of the cyclical balance captures both the impact of the initial headline balance and the cyclical economic conditions in these estimates Therefore this finding suggests that the Council does give some consideration of the economic conditions beyond the purely nominalist approach However as in the case of the average effort estimates the difference is not significant
Interestingly the probability that the Council gives a longer correction deadline for a one percentage point balance-deteriorating one-off is similar to that for a one percentage point worse cyclical balance This finding is somewhat surprising as the cyclical component can be expected to be more persistent than the one-off the impact of which dissipates after one year At the same time this finding is consistent with the slight overshooting of the average effort in reaction to one-offs (ie the finding that where the initial headline deficit is deteriorated by one-offs the average effort required tends to be slightly lower than otherwise) The
finding could also be interpreted as evidence of some bias towards the nominalist approach suggesting that the Council mostly looks at the headline balance when determining the deadline At the same time the fact that the impact on the average effort is very small in contrast to the reaction in the deadline could also suggest that the one-offs capture some presumably longer-lasting characteristics which are not captured by the output gap but which are taken into account by the Council An example could be large capital injections during the crisis years into loss-making financial institutions which were signalling distress in the financial sector and therefore may have been accorded a longer deadline
The results displayed in Table IV14 are derived using the following equation (157)
(1rsquo)
where are the ratios of probability (the odds) that the length of the recommendation would be lower than or equal to a certain value j ( =( )( )) Whileα is specific to each value of j the
effect of the other variables on the odds ratio (β γφ δand ρ) does by construction not depend on j This hypothesis mdash called the lsquoproportional
(157) As indicated in the previous footnote the technical details
are found in Annex IV14
Table IV14 Results for the estimation of Model 1
Source Commission services Note Number of observations 68 Log likelihood -68 Significant at 90 level Significant at 95 level Significant at 99 level The odds ratio (column 1) is interpreted as the relative probability of a longer deadline relative to the shorter deadline for a unit increase in the independent variable The inverse of the odds ratio (column 2) is interpreted as the relative probability of a longer deadline relative to a shorter deadline for a unit decrease in the independent variable
Part IV Characterising the Councilrsquos recommended fiscal reaction to excessive deficits in excessive deficit procedures
141
odds assumptionrsquo or the lsquoparallel odds assumptionrsquo mdash is needed to perform an ordered logit estimation (158) The results of our test of this assumption can be found in Annex IV15
The results presented in Table IV14 and Table IV15 are expressed in the form of odds ratios (ie the exponential function applied to the coefficients) an increase by 1 unit in the value of a variable multiplies the odds by the value of the odds ratio For instance an improvement by one point in the structural balance multiplies the odds by e and an improvement by one point in the cyclical balance multiplies the odds by e
Another way to illustrate these findings is to calculate the probability of the length of the deadline n=1hellip5 for a given structural balance and for a given cyclical balance all things being equal These are shown in Graph IV11 The graph indicates that for both the structural balance and the cyclical balance the better the balance the higher the probability the Member State will be granted a shorter deadline The worse the conditions the higher the probability of longer deadlines As a result getting a one-year deadline is the most likely outcome for the range of the initial structural balance between -4 and 0 A
(158) Also the five probabilities cannot be independently
identified as sum ( = j) = 1sum ( = j) = 1 making it necessary to choose a baseline value for the variable of interest here n=1
three-year deadline becomes dominant over the range of structural balance between -4 and -95 while a four-year deadline is the most likely only below a -95 starting structural balance Two-year and the five-year deadlines are never the most likely outcomes over the initial structural balance range of the sample
Similarly looking at the initial cyclical balance getting a one-year deadline is the most likely outcome for the range of -05 to 1 while a three-year deadline is the most likely over the range of -5 to -05 The other outcomes are less likely over the range of the cyclical balance in our sample In addition the range of the cyclical balance over which the three-year deadline is the most likely outcome is to the right of the range of the structural balance This also confirms that the Council tends to grant longer deadlines in case of worse economic conditions in addition to reacting to the initial headline balance
As in the previous section we also estimated a model (model 2rsquo) in which the Member Statersquos fiscal position is represented only by the headline balance (ie without distinguishing between structural cyclical and one-off components) This model can be read as
(2rsquo) ln = αprime + βprime HB0 + δprime 0 + ρprime 1 isin 14
Graph IV11 Probability of recommended deadlines
Source Commission services Note The figures display the probability of recommended deadlines as a function of the initial structural balance (left-hand panel) and the initial cyclical balance (right-hand panel) Outcome=i i=1hellip5 shows the probability of a deadline of i years The calculations are based on the estimation results of model (1rsquo) Probabilities are displayed with 95 confidence intervals
European Commission Public finances in EMU - 2015
142
The likelihood ratio is similar to the one for the estimation of model (1rsquo) Moreover the odds ratio for the headline balance is of the same order of magnitude as the coefficients of its three components The odds ratio shows that a one point worse headline balance more than doubles the probability of a longer deadline This suggests that the above-discussed differences in the coefficients of the various headline balance components are relatively small and that the structuralist approach is not highly significant
Other determinants of the deadline
The results of the estimations of models 1rsquo and 2rsquo also show that economic growth has no significant effect beyond what is captured by the initial cyclical balance Indeed the GDP growth forecast for the year after the recommendation (ie the first year of fiscal adjustment) is not significant neither in the model with the distinction between the three components of the budget balance nor in the model with only the headline balance This could be due to the correlation between the initial output gap and the expected growth forecast for the first year of the recommendation As in the previous section the debt-to-GDP ratio does not seem to have an impact on the length of the recommendation either
Finally evidence suggests that recommendations issued in 2010 are more likely to have a longer deadline The recommendations issued in 2010 (following a breach of the deficit criterion in 2009) are on average slightly longer than the others (average length of 28 years for the 2010 recommendations compared with 24 for the others) When we include in our model a dummy for EDP recommendations issued in 2010 this variable seems to act as a determinant of the deadline (see Annex IV16) Specifically the odds ratio associated with this variable (017) suggests that recommendations issued in 2010 are 83 more likely to have a longer deadline than other recommendations Put differently all other things being equal deadlines were longer during the crisis This may reflect some more-than-proportionate reaction of the Council to the substantial economic slack in the crisis years and or may also be explained by the Councils consideration of the fact that many Member States simultaneously experienced a downturn leading to negative spill-over effects during the crisis years
15 CONCLUSIONS
The excessive deficit procedure was introduced more than 20 ago by the Maastricht Treaty For the first time since then we analyse the Council recommendations on the basis of an exhaustive dataset of past EDP episodes and provide a quantitative assessment of their main determinants While the objectives of these recommendations are straightforward ie that the Member State put an end to its excessive deficit situation as early as possible they are based on a much broader assessment than simply looking at the excess of deficit over the 3 of GDP threshold That is why it is worth estimating and quantifying the extent to which the Councilrsquos EDP recommendations are influenced by the Member Statesrsquo fiscal positions (both nominal and structural) and macroeconomic environment
Firstly the analysis shows that the Council uses the flexibility in the Treaty when making fiscal recommendations There is flexibility in the number of years allowed as three quarters of the recommended fiscal adjustment path is planned to last two years or more There is also flexibility in the average recommended effort which ranges from a recommended annual adjustment of 05 of GDP in 13 recommendations to 2 of GDP or more in seven recommendations
Secondly by characterising the recommendations according to the average structural effort recommended and the deadline granted to the Member State to reduce its excessive deficit we found the following tentative results
The Council adopts a reaction function which combines both nominalist and structuralist approaches The Councilrsquos reaction is nominalist in that the recommended average effort tends to be higher both if the initial deficit is structural and permanent or cyclical and transitory only
Structuralist considerations seem also to matter as the Councilrsquos reaction makes some differentiation between a structural deficit and a cyclical deficit The recommended average effort reacts less to the cyclical deficit than to the structural deficit In addition worse cyclical economic conditions tend to increase the probability of receiving a longer deadline This shows that while a worse initial fiscal position implies larger requirements in line
Part IV Characterising the Councilrsquos recommended fiscal reaction to excessive deficits in excessive deficit procedures
143
Exogenous variables
Odds ratio
Odds ratio-1
Std error Pgt|z| 95 confidence interval
Headline balance (HB0)
045 222 007 000 033 060
Expected growth (g1)
092 109 011 050 073 117
Public debt-to-GDP (d0)
100 100 001 092 098 102
with the Treaty the recommendations also take into account the difficulties associated with large and swift fiscal adjustment by giving to the Member State more time to meet the 3 to GDP threshold However because the limited number of observations does not allow for a statistically precise analysis this result should not be over-interpreted
Other potentially relevant variables such as expected growth or the debt-to-GDP ratio are not found to play a significant role in determining the Councilrsquos recommendations The debt ratio does not seem to play any role in determining the fiscal effort required This is interesting first considering the legislation itself which states that the medium-term debt position (its dynamics and sustainability) constitutes a relevant factor when deciding on the recommendation and second in light of the relevance of debt position when assessing sustainability and the consequent importance of debt in determining the fiscal stance as reflected in the literature
The 2008 financial crisis and its aftermath led to several EDPs being opened in 2009 and to revised recommendations for Member States already under an EDP in response to the rapid deterioration of macroeconomic and fiscal conditions that year However the specific features of the crisis period do not change the main results presented above While the particularities of the crisis period significantly increased the recommended deadline for closing the EDP they did not significantly increase the recommended average effort This is another confirmation of structuralist considerations in the Councilrsquos reaction function
Even though fiscal governance in the EU has evolved over time it remains the outcome of decisions based on a nominalist approach that
stresses the importance of meeting headline deficit requirements However there is also room for a structuralist view that stresses the importance of meeting structural deficit requirements while allowing for automatic stabilisers to operate
Table IV15 Estimation of the results of Model 2
Source Commission services Notes Number of observations 68 Log likelihood -69 Significant at 90 level Significant at 95 level Significant at 99 level
ANNEX 1 SAMPLE DATA AND ROBUSTNESS CHECKS
144
A11 LIST OF EDP RECOMMENDATIONS USED IN THE ANALYSIS
A12 DESCRIPTION OF THE EDP SAMPLE
A121 The deadline
The lengths of the recommendations range from one to five years (see Graph IVA11) The average length of a recommendation (regardless of whether it is an initial recommendation or not) is 24 years Of all the recommendations 88 call on the Member State to correct its excessive deficit in three years or less while only 26 call for a correction within one year Interestingly initial recommendations tend to favour shorter deadlines the average length of initial recommendations is only 23 years with 53 of recommendations lasting two years or less the average length of revised recommendations is 26 with 42 of recommendations lasting two years or less
The lengths of the 38 EDP episodes range from one to eight years The average length is 33 years and 58 of the procedures last between two and four years 16 of the procedures were ended within one year
Although the SGP clearly says that lsquoas a rulersquo the length of the EDP recommendation should be set at one year and a longer deadline should only be set if there are lsquospecial circumstancesrsquo only a quarter of all recommendations set the deadline for the year after the recommendation However this can be explained by the very large proportion of EDP episodes that were opened in 2008 or 2009 ie during the economic crisis Indeed almost three quarters of recommendations longer than one year concerned breaches of the deficit threshold in
Table IVA11 List of EDP recommendations
Source Commission services
Graph IVA11 Distribution of the length of the EDP recommendations in the sample
Source Commission services
date of the recommendation country deadline origin of the
recommendation ended withhellip
28012003 DE 2003 new EDP new recommendation 18062003 FR 2004 new EDP new recommendation 25112003 FR 2005 revised recommendation closing of the EDP 02062004 NL 2005 new EDP closing of the EDP 05072004 CY 2005 new EDP closing of the EDP 05072004 CZ 2008 new EDP new recommendation 05072004 EL 2005 new EDP new recommendation 05072004 MT 2006 new EDP closing of the EDP 05072004 PL 2007 new EDP new recommendation 05072004 SK 2007 new EDP closing of the EDP 07072004 HU 2008 new EDP new recommendation 09022005 EL 2006 revised recommendation closing of the EDP 08032005 HU 2008 revised recommendation new recommendation 20092005 IT 2007 new EDP closing of the EDP 20092005 PT 2008 new EDP closing of the EDP 24012006 UK 2006 new EDP closing of the EDP 14032006 DE 2007 revised recommendation closing of the EDP 09102006 HU 2009 revised recommendation new recommendation 23022007 PL 2007 revised recommendation closing of the EDP 06112007 CZ 2008 revised recommendation closing of the EDP 08072008 UK 2010 new EDP new recommendation 06042009 EL 2010 new EDP new recommendation 06042009 ES 2012 new EDP new recommendation 06042009 IE 2013 new EDP new recommendation 06072009 HU 2011 revised recommendation new recommendation 06072009 LT 2011 new EDP new recommendation 06072009 LV 2012 new EDP closing of the EDP 06072009 MT 2010 new EDP new recommendation 06072009 PL 2012 new EDP new recommendation 06072009 RO 2011 new EDP new recommendation 30112009 AT 2013 new EDP closing of the EDP 30112009 BE 2012 new EDP new recommendation 30112009 CZ 2013 new EDP closing of the EDP 30112009 DE 2013 new EDP closing of the EDP 30112009 ES 2013 revised recommendation new recommendation 30112009 FR 2013 new EDP new recommendation 30112009 IE 2014 revised recommendation new recommendation 30112009 IT 2012 new EDP closing of the EDP 30112009 NL 2013 new EDP new recommendation
30112009 PT 2013 new EDP new recommendation 30112009 SI 2013 new EDP new recommendation 30112009 SK 2013 new EDP closing of the EDP 02122009 UK 2015 revised recommendation ongoing 03022010 EL 2012 revised recommendation new recommendation 09022010 LT 2012 revised recommendation closing of the EDP 09022010 MT 2011 revised recommendation closing of the EDP 12022010 RO 2012 revised recommendation closing of the EDP 10052010 EL 2014 revised recommendation new recommendation 06072010 CY 2012 new EDP new recommendation 06072010 DK 2013 new EDP closing of the EDP 09072010 BG 2011 new EDP closing of the EDP 13072010 FI 2011 new EDP closing of the EDP 07122010 IE 2015 revised recommendation ongoing 13032012 EL 2014 revised recommendation new recommendation 13032012 HU 2012 revised recommendation closing of the EDP 09072012 ES 2014 revised recommendation new recommendation 02092012 PT 2014 revised recommendation new recommendation 04122012 EL 2016 revised recommendation ongoing 07052013 CY 2016 revised recommendation ongoing 18062013 NL 2014 revised recommendation closing of the EDP 18062013 PL 2014 revised recommendation new recommendation 18062013 PT 2015 revised recommendation ongoing 18062013 SI 2015 revised recommendation ongoing 20062013 ES 2016 revised recommendation ongoing 21062013 BE 2013 revised recommendation closing of the EDP 21062013 FR 2015 revised recommendation ongoing 21062013 MT 2014 new EDP ongoing 10122013 PL 2015 revised recommendation ongoing 21012014 HR 2016 new EDP ongoing
Part IV Characterising the Councilrsquos recommended fiscal reaction to excessive deficits in excessive deficit procedures
145
2008 or 2009 while 60 of the one-year recommendations were issued before or after the crisis years Excluding the crisis years 42 of the recommendations set the deadline for the year after the recommendation
A122 The recommended structural effort
The recommended cumulative fiscal efforts over the adjustment period range from 05 to 11 of GDP with an average of 3 Of all the recommended cumulative efforts 28 are lower than or equal to one percentage point and around one quarter are greater than three percentage points (cf Graph IVA12) The cumulative recommended effort and the length of the recommendation are positively correlated (correlation of 074) The cumulative structural effort is on average 08 percentage point when the deadline is fixed for the year after the recommendation was issued (ie length of one year) 19 when the EDP is planned to last two years and 45 when the recommended length is planned to last more than two years
The annual average structural efforts per recommendation range from 03 to 32 percentage points For three observations the recommended annual average fiscal effort is lower than 05 these recommendations were issued before 2009 ie before the rule requiring a minimum effort of 05 of GDP per year was introduced The average of the recommended yearly efforts is 11 of GDP
Slightly more than half of the recommendations recommended an annual average fiscal effort lower than or equal to 1 of GDP The vast majority of these are between 05 and 1 of GDP with only about one fifth less than or equal to 05 of GDP (see Graph IVA13) 21 of the recommended average annual efforts are greater than or equal to 15
Over the whole sample of recommendations the average real-time headline deficit for the year when the 3 threshold (159) was breached is 53 of GDP For the year the recommendation was issued the average of the real-time nominal deficit forecasts is 63 of GDP while for the first year of adjustment the average real-time headline deficit forecast based on the assumption that there is no change in policy is 56 of GDP (160) For four recommendations the headline deficit was lower than 3 of GDP two years before the first adjustment year ie the year where the 3 of GDP threshold should be breached so as to lead to the opening of an EDP This is because for those EDP episodes the EDP was opened (or the decision taken to revise the recommendation) on the basis of forecast instead of outturn data
Over the whole sample of recommendations the
average real-time estimate of the structural balance
(159) Or in the case of revised recommendations two years
before the first year of adjustment (160) At the time of the recommendation headline deficit
forecasts are carried out based on a scenario that assumes that there will be no change in policy
Graph IVA12 Distribution of the recommended cumulative structural effort in the sample
Source Commission services
Graph IVA13 Distribution of the recommended annual structural effort in the sample
Source Commission services
European Commission Public finances in EMU - 2015
146
lowast = αprime + βprime HB0 + δprime 0 + ρprime 1
is -38 of GDP for the forecast of the first year of consolidation and -49 of GDP for the year before However there is a very large dispersion around the average value both for the headline balance and for the structural balance in the first adjustment year
A13 MODELS OF EFFORT TOBIT MODEL
The model determining the average recommended fiscal effort has to take into account the restriction on the annual recommended fiscal effort (and therefore also on the average recommended effort) which should exceed 05 of GDP This restriction has been imposed only since 2009 but given the size of our sample we cannot split it into two sub-samples and still maintain a fair explanatory power for the estimations 70 of the EDP recommendations in our sample occurred later than 2009
With depending on several variables representing nominal or structural fiscal positions economic conditions etc
1)
2)
= lowast lowast ge 0505 lowast le 05
lowast
lowast = α + β SB0 + γ ∙ (ε ∙ OG0) + θ ∙ OO0 + δ 0 + ρ 1
Part IV Characterising the Councilrsquos recommended fiscal reaction to excessive deficits in excessive deficit procedures
147
μ = minusln(M)( = )5
1 = 1 (αk + βk + γk )51
= 1sum (αk + βk + γk )51
sum ( = )51 = 1
P(ni = k)51 = 1P(n isin 1 5 ) = 1
A14 MULTINOMIAL LOGIT REGRESSION
A141 Ordinal logit
As the length of the EDP recommendation consists of the number of years between the first year of the recommendation and the deadline n in the following it can take only discrete values greater than 1 which requires the use of logistic regressions This model will allow us to assess the impact of the fiscal position and the economic environment on the relative probability for n to take any value greater than 1 For the sake of simplicity we will make the hypothesis that n cannot take values greater than 5 We define a series of odds as follows
This ordinal logistic model (lsquomodel 1rsquo in the following) then reads as follows
with isin 1 4 and where is the structural deficit of year 0 (the year before the first year of recommended fiscal effort) and is the real-time output gap forecast for year 1 (the first year of the recommendation) Whileα is specific to each group the effect of the structural balance and the output gap on the odds ratio (resp β and γ) are the same for the different groups Indeed the model requires the assumption that the effect of an exogenous variable does not depend on the logit function (ie on j) In other words under this assumption an improvement in the structural balance by 1 point will have the same impact on the probability that n is lower than 2 as it has on the probability than n is lower than 3 Also as sum ( = k) = 1 (due to our assumption that le 5) there is no odds ratio associated with = 5 In other words the five probabilities cannot be independently identified The results are usually expressed in the form of odds ratios respectively
e and e for the sake of simplicity Model 1 can be rewritten as follows
A 1 point better structural balance multiplies the odds by e Similarly a 1 point better output gap multiplies the odds by e
By their very nature the odds ratios are not linear if the structural balance (respectively the output gap) were to deteriorate by two points then the odds ratio would be multiplied by 45 as 179 =320 (respectively 174 as 132 = 174)
A142 Multinomial non-ordered logit
The parallel odds assumption has not been rejected by the Wald test However other tests such as a likelihood ratio or score tests give more ambiguous results We also checked the robustness of our model against a generalised multinomial logit model where the parallel odds assumption is not needed The non-ordered model reads as follows
However so
These constraints can be taken into account by re-writing this equation by defining μ and α such
that
We can then define M such that
giving us
M can then be chosen such that
by choosing
So for all k in 1 5 we have
1 = ( gt 1)( = 1)2 = ( gt 2)( le 2)3 = ( gt 3)( le 3)4 = ( = 5)( le 4)
ln = α + β 0 + γ 1
= eα ∙ e 0 ∙ (eγ) 1
ln ( = 1) = α2 + β2 + γ2ln ( = 2) = α3 + β3 + γ3ln ( = 3) = α4 + β4 + γ4ln ( = 4) = α5 + β5 + γ5ln ( = 5) = α5 + β5 + γ5
α = μ + α
( = k) = exp(αk + βk + γk )sum exp(αk + βk + γk )51
European Commission Public finances in EMU - 2015
148
( = 1) ( gt j)( le j minus 1)
with
is entirely determined by the four other equations Therefore there are only four independent equations and the model finally reads as
A15 TEST OF THE PROPORTIONAL ODDS ASSUMPTION AND ALTERNATIVE ESTIMATIONS
The main hypothesis underlying an ordered logit is that an change in an exogenous variable by 1 point will have the same impact on the probability ratios
regardless of the value of j This hypothesis which is called the lsquoproportional odds assumptionrsquo or lsquoparallel odds assumptionrsquo is needed to perform ordered logit estimations
The use of this estimation method is supported by the fact that the proportional odds assumption cannot be rejected by the Wald test (see Table IVA12) In order to test the proportional odds assumption we used the Wald test This test takes as a null hypothesis that the relationships between all pairs of the odds ratio are the same Therefore the model is valid only if the test shows that the null hypothesis cannot be rejected Table Table IVA13 shows the results of the Wald test for our model (1rsquo)
However other tests give more ambiguous results (161) We also checked the robustness of our model against a generalised multinomial logit model where the parallel odds assumption is not needed The downside of this alternative method is that we lose the information that the possible values of n are ordered Moreover as the method preforms multiple regressions it is not optimal for small samples such as ours
Nevertheless this method gives similar results to the first method (see Table IVA13)
(161) See Buis and Williams (2013) for an analysis of the
performance of tests for the parallel regressions assumption in ordered logit models
αprimek equiv αk minus α1βprimek equiv βk minus β1γprimek equiv γk minus γ1( = 1) = 11 + sum (αprimek + βprimek + γprimek )52
Table IVA12 Result for the Wald test for Model 1
Source Commission services Note The null hypothesis that the odds are proportional cannot be rejected by the Wald test
Chi2 PgtChi2 1892 0218
ln ( = 2)( = 1) = μ + αprime2 + βprime2 + γprime2ln ( = 3)( = 1) = μ + αprime3 + βprime3 + γprime3ln ( = 4)( = 1) = μ + αprime4 + βprime4 + γprime4ln ( = 5)( = 1) = μ + αprime5 + βprime5 + γprime5
Part IV Characterising the Councilrsquos recommended fiscal reaction to excessive deficits in excessive deficit procedures
149
Exogenous variables (1) (1 bis) (2) (3) (4) (5) (6)
structural balance
(t=0) -022 -024 -022 -022 -022 -020
cyclical component εmiddotOG (t=0)
-014 -018 -014 -014 -014 -014
one-offs 005 006 005 006 005 005 nominal balance
(t=0) -007
real growth (t=1) -005 -011 -005 -005 -004 -004
debt-to-GDP ratio
(t=0) 000 000 000 000 000 000 000
dummy for crisis years 002 dummy for programme
countries 010
extension 015 constant -008 -029 078 008 -003 -009 009
R2 043 040 017 043 043 044 065
Odds ratio 1 2 3 4 5 structural balance (t=0) 047 041 047 046cyclical component εmiddotOG -(t=0) 038 037 038 036one-offs 037 032 037 037nominal balance (t=0) 045 real growth (t=1) 094 092 081 095 098 debt-to-GDP ratio (t=0) 100 100 099 100 100 dummy for crisis years 017 dummy for programme countries 132 extension 193 Log likelihood -68 -69 -65 -68 -67
Exogenous variables Odds ratio Std error Pgt|z| 95 confidence interval
n=2 structural balance (t=0) 021 014 002 006 075cyclical component εmiddotOG (t=0) 011 010 002 002 065 one-offs (t=0) 022 024 017 003 188real growth (t=1) 072 022 028 039 131debt-to-GDP ratio (t=0) 100 002 083 096 105constant 000 000 003 000 059
n=3 structural balance (t=0) 010 007 000 003 037cyclical component εmiddotOG (t=0) 003 003 000 000 021 one-offs (t=0) 008 009 003 001 075real growth (t=1) 079 025 046 042 148debt-to-GDP ratio (t=0) 100 002 090 096 105constant 000 000 000 000 002
n=4 structural balance (t=0) 009 007 000 002 037cyclical component εmiddotOG (t=0) 057 078 068 004 836 one-offs (t=0) 000 001 000 000 011real growth (t=1) 058 020 012 029 115debt-to-GDP ratio (t=0) 097 003 041 092 104constant 000 000 002 000 019
n=5 structural balance (t=0) 000 000 099 - -cyclical component εmiddotOG ndash(t=0) 000 000 099 - - one-offs (t=0) 000 000 099 - -real growth (t=1) 000 038 099 - -debt-to-GDP ratio (t=0) 106 5670 100 - -constant 000 000 099 - -
A16 ROBUSTNESS CHECKS
Table IVA14 Other specifications for the determinants of the average effort (with the debt-to-GDP ratio)
Source Commission services Significant at 90 level Significant at 95 level Significant at 99 level The exogenous variable is the average recommended effort of the EDP episode N=68 All estimations apart from number (6) are Tobit estimations In these models 16 observations have been left-censored as the average effort was less than or equal to 05
Table IVA15 Other specifications for the determinants of the length of the EDP
Source Commission services Significant at 90 level Significant at 95 level Significant at 99 level The exogenous variable is the recommended length of the EDP episode N=68
Table IVA13 Results of the estimation of Model 1 using the non-ordered multinomial logit method
Source Commission services Note Significant at 90 level Significant at 95 level Significant at 99 level n=1 is the base outcome N=68 Likelihood ratio -49
Part V Resources
1 ABBREVIATIONS AND SYMBOLS USED
152
Member States
BE Belgium
BG Bulgaria
HR Croatia
CZ Czech Republic
DK Denmark
DE Germany
EE Estonia
EI Ireland
EL Greece
ES Spain
FR France
IT Italy
CY Cyprus
LV Latvia
LT Lithuania
LU Luxembourg
HU Hungary
MT Malta
NL The Netherlands
AT Austria
PL Poland
PT Portugal
RO Romania
SI Slovenia
SK Slovakia
Part V Resources
153
FI Finland
SE Sweden
UK United Kingdom
EA Euro area
EU European Union
EU-28 European Union 27 Member States
EA-18 European Area 17 Member States
Other
AMECO Macro-economic database of the European Commission
ATE Average treatment effects
AWG Ageing Working Group
CAB Cyclically Adjusted Budget Balance
CAPB Cyclically-adjusted primary balance
COFOG Classification of the functions of government
COM Commission
CSR Country-Specific Recommendations
DBP Draft Budgetary Plan
DFE Discretionary Fiscal Effort
DG ECFIN Directorate-General Economic and Financial Affairs
DRM Discretionary Revenue Measures
EC European Commission
ECB European Central Bank
ECON Council and to the Economic and Financial Committee
EDP Excessive Deficit Procedure
EERP European Economic Recovery Plan
EFC Economic and Financial Committee
EFSF European Financial Stability Facility
European Commission Public finances in EMU - 2013
154
EMU Economic and Monetary Union
EPC Economic Policy Committee
ESA European System of National and Regional Accounts
EA Euro Area
EU European Union
FBFL Federal Budgetary Framework Law
FE Fiscal Effort
FPC Fiscal Policy Committees
GDP Gross Domestic Product
GFKF Gross Fixed Capital Formation
GFCF Gross Fixed Capital Formation
HICP Harmonized Index of Consumer Prices
IFI Independent Fiscal Institutions
IMF International Monetary Fund
ICTU Irish Congress of Trade Unions
MLSA Minimum Linear Structural Adjustment
MTBF Medium-Term Budgetary Framework
MTFS Medium-Term Fiscal Strategy
MTO Medium-Term budgetary Objective
NCPI National Consumption Price Index
NAWRU Non-accelerating Wage Rate of Unemployment
NRP National Reform Programme
OECD Organisation of Economic Co-operation and Development
OG Output Gap
OGWG Output Gap Working Group
PFR Public Finance Report
pp Percentage Points
Part V Resources
155
RA Regression-Adjusted estimators
RampD Research and Development
ROG Representative Output Gap
SB Structural Balance
SCPs Stability or Convergence Programmes
SDP Significant Deviation Procedure
SGP Stability and Growth Pact
SOE State Owned Enterprise
SPB Structural Primary Balances
TSCG Treaty on Stability Coordination and Governance
TFEU Treaty on the Functioning of European Union (TFEU)
2 GLOSSARY
156
Asset management company Public or private body aiming at restructuring recovering or disposing of nonperforming assets
Automatic stabilisers Features of the tax and spending regime which react automatically to the economic cycle and reduce its fluctuations As a result the budget balance in percent of GDP tends to improve in years of high growth and deteriorate during economic slowdowns
Budget balance The balance between total public expenditure and revenue in a specific year with a positive balance indicating a surplus and a negative balance indicating a deficit For the monitoring of Member State budgetary positions the EU uses general government aggregates See also structural budget balance primary budget balance and primary structural balance
Budgetary rules Rules and procedures through which policy-makers decide on the size and the allocation of public expenditure as well as on its financing through taxation and borrowing
Budgetary sensitivity The variation in the budget balance in percentage of GDP brought about by a change in the output gap In the EU it is estimated to be 05 on average
Candidate countries Countries that wish to accede to the EU Besides the accession countries they include Croatia and Turkey
Close-to-balance requirement A requirement contained in the old Stability and Growth Pact according to which Member States should over the medium term achieve an overall budget balance close to balance or in surplus was replaced by country-specific medium-term budgetary objectives in the reformed Stability and Growth Pact
Code of Conduct Policy document endorsed by the ECOFIN Council of 11 October 2005 setting down the specifications on the implementation of the Stability and Growth Pact and the format and content of the stability and convergence programmes
COFOG (Classification of the Functions of Government) A statistical nomenclature used to
break down general government expenditure into its different functions including general public services defence public order and safety economic affairs environmental protection housing and community amenities health recreation culture and religion education and social protection
Convergence programmes Medium-term budgetary and monetary strategies presented by Member States that have not yet adopted the euro They are updated annually according to the provisions of the Stability and Growth Pact Prior to the third phase of EMU convergence programmes were issued on a voluntary basis and used by the Commission in its assessment of the progress made in preparing for the euro See also stability programmes
Crowding-out effects Offsetting effects on output due to changes in interest rates and exchange rates triggered by a loosening or tightening of fiscal policy
Cyclical component of budget balance That part of the change in the budget balance that follows automatically from the cyclical conditions of the economy due to the reaction of public revenue and expenditure to changes in the output gap See automatic stabilisers tax smoothing and structural budget balance
Cyclically-adjusted budget balance See structural budget balance
Demand and supply shocks Disturbances that affect the economy on the demand side (eg changes in private consumption or exports) or on the supply side (eg changes in commodity prices or technological innovations) They can impact on the economy either on a temporary or permanent basis
Deposit Guarantee Schemes reimburse a limited amount of deposits to depositors whose bank has failed From the depositors point of view this protects a part of their wealth from bank failures From a financial stability perspective this promise prevents depositors from making panic withdrawals from their bank thereby preventing severe economic consequences
Part V Resources
157
Direct fiscal costs (gross net) of a financial crisis The direct gross costs are the fiscal outlays in support of the financial sector that increase the level of public debt They encompass for example recapitalisation purchase of troubled bank assets pay-out to depositors liquidity support payment when guarantees are called and subsidies The direct net costs are the direct gross cost net of recovery payments such as through the sale of acquired assets or returns on assets Thus the net direct fiscal costs reflect the permanent increase in public debt
Direct taxes Taxes that are levied directly on personal or corporate incomes and property
Discretionary fiscal policy Change in the budget balance and in its components under the control of government It is usually measured as the residual of the change in the balance after the exclusion of the budgetary impact of automatic stabilisers See also fiscal stance
Early-warning mechanism Part of the preventive elements of the Stability and Growth Pact It is activated when there is significant divergence from the budgetary targets set down in a stability or convergence programme
Economic and Financial Committee (EFC) Formerly the Monetary Committee the EFC is a Committee of the Council of the European Union set up by Article 114 of the Its main task is to prepare and discuss (ECOFIN) Council decisions with regard to economic and financial matters
Economic Policy Committee (EPC) Group of senior government officials whose main task is to prepare discussions of the (ECOFIN) Council on structural policies It plays an important role in the preparation of the Broad Economic Policy Guidelines and it is active on policies related to labour markets methods to calculate cyclically-adjusted budget balances and ageing populations
Effective tax rate The ratio of broad categories of tax revenue (labour income capital income consumption) to their respective tax bases
Effectiveness The same concept as efficiency except that it links input to outcomes rather than outputs
Efficiency Can be defined in several ways either as the ratio of outputs to inputs or as the distance to a production possibility frontier (see also Free Disposable Hull analysis Data Envelope analysis stochastic frontier analysis) Cost efficiency measures the link between monetary inputs (funds) and outputs technical efficiency measures the link between technical inputs and outputs Output efficiency indicates by how much the output can be increased for a given input input efficiency indicates by how much the input can be reduced for a given input
Emergency Liquidity Assistance (equivalent to lender-of-last- resort) the most traditional tool available to a central bank for dealing with financial instability It includes both the provision of liquidity to the financial system as a whole through market operations as well as emergency lending to individual banks Not all liquidity injections aimed at preventing the spread of a liquidity problem relate to a crisis as central banks routinely offer liquidity against specified collateral requirements in order to support the orderly functioning of markets
ESA2010ESA95 ESA79 European accounting standards for the reporting of economic data by the Member States to the EU As of 2000 ESA95 has replaced the earlier ESA79 standard with regard to the comparison and analysis of national public finance data
European Financial Stability Facility is a company owned by Euro Area Member States created following the decisions taken in May 2010 by the Council EFSF is able to issue bonds guaranteed by EAMS for up to euro 440 billion for on-lending to EAMS in difficulty subject to conditions negotiated with the European Commission in liaison with the European Central Bank and International Monetary Fund and to be approved by the Eurogroup EFSF has been assigned the best possible credit rating AAA by Standard amp Poorrsquos and Fitch Ratings Aaa by Moodyrsquos
European semester European semester New governance architecture approved by the Member States in September 2010 It means that the EU and the euro zone will coordinate ex ante their budgetary and economic policies in line with both the Stability and Growth Pact and the Europe 2020
European Commission Public finances in EMU - 2015
158
strategy Based on previous discussions on Commissions Annual Growth Survey each summer the European Council and the Council of ministers will provide policy advice before Member States finalise their draft budgets
Excessive Deficit Procedure (EDP) A procedure according to which the Commission and the Council monitor the development of national budget balances and public debt in order to assess andor correct the risk of an excessive deficit in each Member State Its application has been further clarified in the Stability and Growth Pact See also stability programmes and Stability and Growth Pact
Expenditure rules A subset of fiscal rules that target (a subset of) public expenditure
Fiscal consolidation An improvement in the budget balance through measures of discretionary fiscal policy either specified by the amount of the improvement or the period over which the improvement continues
Fiscal decentralisation The transfer of authority and responsibility for public functions from the central government to intermediate and local governments or to the market
Fiscal federalism A subfield of public finance that investigates the fiscal relations across levels of government
Fiscal governance Comprises all rules regulations and procedures that impact on how the budget and its components are being prepared The terms fiscal governance and fiscal frameworks are used interchangeably in the report
Fiscal impulse The estimated effect of fiscal policy on GDP It is not a model-free measure and it is usually calculated by simulating an econometric model The estimates presented in the present report are obtained by using the Commission servicesrsquo QUEST model
Fiscal rule A permanent constraint on fiscal policy expressed in terms of a summary indicator of fiscal performance such as the government budget deficit borrowing debt or a major component thereof See also budgetary rule expenditure rules
Fiscal stance A measure of the effect of discretionary fiscal policy In this report it is defined as the change in the structural (or structural primary) budget balance relative to the preceding period When the change is positive (negative) the fiscal stance is said to be expansionary (restrictive)
General government As used by the EU in its process of budgetary surveillance under the Stability and Growth Pact and the excessive deficit procedure the general government sector covers national government regional and local government as well as social security funds Public enterprises are excluded as are transfers to and from the EU Budget
Government budget constraint A basic condition applying to the public finances according to which total public expenditure in any one year must be financed by taxation government borrowing or changes in the monetary base In the context of EMU the ability of governments to finance spending through money issuance is prohibited See also stock-flow adjustment sustainability
Government contingent liabilities Obligations for the government that are subject to the realization of specific uncertain and discrete future events For instance the guarantees granted by governments to the debt of private corporations bonds issued by enterprise are contingent liabilities since the government obligation to pay depend on the non-ability of the original debtor to honour its own obligations
Government implicit liabilities Government obligations that are very likely to arise in the future in spite of the absence of backing contracts or law The government may have a potential future obligation as a result of legitimate expectations generated by past practice or as a result of the pressure by interest groups Most implicit liabilities are contingent ie depend upon the occurrence of uncertain future events
Growth accounting A technique based on a production function approach where total GDP (or national income) growth is decomposed into the various production factors and a non-explained part which is the total factor productivity change also often termed the Solow residual
Part V Resources
159
Indirect taxation Taxes that are levied during the production stage and not on the income and property arising from economic production processes Prominent examples of indirect taxation are the value added tax (VAT) excise duties import levies energy and other environmental taxes
Integrated guidelines A general policy instrument for coordinating EU-wide and Member States economic structural reforms embedded in the Lisbon strategy and which main aim is to boost economic growth and job creation in the EU
Interest burden General government interest payments on public debt as a share of GDP
Maastricht reference values for public debt and deficits Respectively a 60 general government debt-to-GDP ratio and a 3 general government deficit-to-GDP ratio These thresholds are defined in a protocol to the Maastricht Treaty on European Union See also Excessive Deficit Procedure
Maturity structure of public debt The profile of total debt in terms of when it is due to be paid back Interest rate changes affect the budget balance directly to the extent that the general government sector has debt with a relatively short maturity structure Long maturities reduce the sensitivity of the budget balance to changes in the prevailing interest rate See also public debt
Medium-term budgetary objective (MTO) According to the reformed Stability and Growth Pact stability programmes and convergence programmes present a medium-term objective for the budgetary position It is country-specific to take into account the diversity of economic and budgetary positions and developments as well as of fiscal risks to the sustainability of public finances and is defined in structural terms (see structural balance)
Minimum benchmarks The lowest value of the structural budget balance that provides a safety margin against the risk of breaching the Maastricht reference value for the deficit during normal cyclical fluctuations The minimum benchmarks are estimated by the European Commission They do not cater for other risks such as unexpected budgetary developments and interest rate shocks
They are a lower bound for the medium-term budgetary objectives (MTO)
NAIRU Non-Accelerating Inflation Rate of Unemployment
One-off and temporary measures Government transactions having a transitory budgetary effect that does not lead to a sustained change in the budgetary position See also structural balance
Output gap The difference between actual output and estimated potential output at any particular point in time See also cyclical component of budget balance
Performance-based budgeting A budgeting technique that links budget appropriations to performance (outcomes results) rather than focusing on input controls In practice performance-informed budgeting is more common which basis decisions on budgetary allocation on performance information without establishing a formal link
Policy-mix The overall stance of fiscal and monetary policy The policy-mix may consist of various combinations of expansionary and restrictive policies with a given fiscal stance being either supported or offset by monetary policy
Potential GDP The level of real GDP in a given year that is consistent with a stable rate of inflation If actual output rises above its potential level then constraints on capacity begin to bind and inflationary pressures build if output falls below potential then resources are lying idle and inflationary pressures abate See also production function method and output gap
Primary budget balance The budget balance net of interest payments on general government debt
Primary structural budget balance The structural budget balance net of interest payments
Private pension schemes The insurance contract specifies a schedule of contribution in exchange of which benefits will be paid when the members reach a specific retirement age The transactions are between the individual and the insurance provider and they are not recorded as government revenues or government expenditure and
European Commission Public finances in EMU - 2015
160
therefore do not have an impact on government surplus or deficit
Pro-cyclical fiscal policy A fiscal stance which amplifies the economic cycle by increasing the structural primary deficit during an economic upturn or by decreasing it in a downturn A neutral fiscal policy keeps the cyclically-adjusted budget balance unchanged over the economic cycle but lets the automatic stabilisers work See also tax-smoothing
Production function approach A method to estimate the level of potential output of an economy based on available labour inputs the capital stock and their level of efficiency Potential output is used to estimate the output gap a key input in the estimation of cyclical component of the budget
Public debt Consolidated gross debt for the general government sector It includes the total nominal value of all debt owed by public institutions in the Member State except that part of the debt which is owed to other public institutions in the same Member State
Public investment The component of total public expenditure through which governments increase and improve the stock of capital employed in the production of the goods and services they provide
Public-private partnerships (PPP) Agreements that transfer investment projects to the private sector that traditionally have been executed or financed by the public sector To qualify as a PPP the project should concern a public function involve the general government as the principal purchaser be financed from non-public sources and engage a corporation outside the general government as the principal operator that provides significant inputs in the design and conception of the project and bears a relevant amount of the risk
Sensitivity analysis An econometric or statistical simulation designed to test the robustness of an estimated economic relationship or projection given various changes in the underlying assumptions
Significant divergence A sizeable excess of the budget balance over the targets laid out in the stability or convergence programmes that triggers
the Early warning procedure of the Stability and Growth Pact
Size of the public sector Typically measured as the ratio of public expenditure to nominal GDP
lsquoSnow-ballrsquo effect The self-reinforcing effect of public debt accumulation or decumulation arising from a positive or negative differential between the interest rate paid on public debt and the growth rate of the national economy See also government budget constraint
Social security contributions (SSC) Mandatory contributions paid by employers and employees to a social insurance scheme to cover for pension health care and other welfare provisions
Sovereign bond spread The difference between risk premiums imposed by financial markets on sovereign bonds for different states Higher risk premiums can largely stem from (i) the debt service ratio also reflecting the countries ability to raise their taxes for a given level of GDP (ii) the fiscal track record (iii) expected future deficits and (iv) the degree of risk aversion
Stability and Growth Pact (SGP) Approved in 1997 and reformed in 2005 the SGP clarifies the provisions of the Maastricht Treaty regarding the surveillance of Member State budgetary policies and the monitoring of budget deficits during the third phase of EMU The SGP consists of two Council Regulations setting out legally binding provisions to be followed by the European Institutions and the Member States and two Resolutions of the European Council in Amsterdam (June 1997) See also Excessive Deficit Procedure
Stability programmes Medium-term budgetary strategies presented by those Member States that have already adopted the euro They are updated annually according to the provisions of the Stability and Growth Pact See also Convergence programmes
Stock-flow adjustment The stock-flow adjustment (also known as the debt-deficit adjustment) ensures consistency between the net borrowing (flow) and the variation in the stock of gross debt It includes the accumulation of financial assets changes in the value of debt
Part V Resources
161
denominated in foreign currency and remaining statistical adjustments
Structural budget balance The actual budget balance net of the cyclical component and one-off and other temporary measures The structural balance gives a measure of the underlying trend in the budget balance See also primary structural budget balance
Sustainability A combination of budget deficits and debt that ensure that the latter does not grow without bound While conceptually intuitive an agreed operational definition of sustainability has proven difficult to achieve
Tax elasticity A parameter measuring the relative change in tax revenues with respect to a relative change in GDP The tax elasticity is an input to the budgetary sensitivity
3 REFERENCES
162
Aghevli B and Khan MS (1980) lsquoGovernment Deficits and the Inflationary Process in Developing Countriesrsquo in W Coats and DR Khatkhate (eds) Readings on Money and Monetary Policy in Less Developed Countries Pergamon Press Oxford
Alesina A Favero C and Giavazzi F (2015) lsquoThe output effect of fiscal consolidation plansrsquo Journal of International Economics 96 (S1) S19-S42
Baldi G and Staehr K (2013) lsquoThe European Debt Crisis and Fiscal Reaction Functions in Europe 2000-2012rsquo Discussion Papers of DIW Berlin 1295 DIW Berlin German Institute for Economic Research
Beyer A Haug A and Dewald W G (2009) lsquoStructural Breaks Cointegration and the Fisher Effectrsquo ECB Working paper series 1013
Bohn H (1998) lsquoThe Behaviour of US Public Debt and Deficitsrsquo Quarterly Journal of Economics 113 949-963
Buis ML and Williams R (2013) lsquoUsing simulation to inspect the performance of a test in particular tests of the parallel regressions assumption in ordered logit modelsrsquo presented at the 11th German Stata Usersrsquo meeting on 6 June 2013 in Potsdam
Celasun O Debrun X and Ostry JD (2007) lsquoPrimary Surplus Behavior and Risks to Fiscal Sustainability in Emerging Market Countries A lsquoFan-Chartrsquo Approachrsquo IMF Staff Papers 53(3)
Cimadomo J (2012) lsquoFiscal Policy in Real Timersquo Scandinavian Journal of Economics 114(2) 440-465
Cooray A (2002) lsquoThe Fisher Effect A Review of the Literaturersquo Research Papers 0206 Macquarie University Department of Economics
Cugnasca A and Rother P (2015) lsquoFiscal multipliers during consolidation evidence from the European Unionrsquo ECB Working Paper Series 1863
De Castro F Perez J and Rodriguez-Vives M (2013) lsquoFiscal Data Revisions in Europersquo
Journal of Money Credit and Banking Volume 45 (6) 1187-1209
Commission Staff Working Document SWD (2015) 400 final Challenges to Member States Investment Environments
European Central Bank (2014) lsquoThe current weakness in euro area investment compared with past crisis episodesrsquo Monthly Bulletin December 2014
European Commission (2006) lsquoDefinition and identification of one-off and temporary measuresrsquo Report on Public Finances in EMU Section II42
European Commission (2011) lsquoDebt sustainability in the EUrsquo Report on Public Finances in EMU Part IV
European Commission (2012) lsquoFiscal Sustainability Report 2012rsquo European Economy 8
European Commission (2013) lsquoEvolving budgetary surveillancersquo Report on Public Finances in EMU
European Commission (2014a) lsquoThe 2015 Ageing Report Economic and budgetary projections for the 28 EU Member States (2013-2060)rsquo European Economy 3
European Commission (2014b) lsquoThe Economic Adjustment Programme for Portugal 2011-2014rsquo European Economy Occasional Papers 202
European Commission (2015a) lsquoThe euro-area recovery in perspectiversquo Quarterly report on the euro area 14(3)
European Commission (2015b) lsquoThe 2015 Stability and Convergence Programmes An overviewrsquo European Economy Institutional Papers 002
Eurostat (2014) Manual on the changes between ESA 95 and ESA 2010 Eurostat manuals and guidelines
Fiscal Discipline Council of Latvia (2015) Fiscal discipline monitoring report 2015
Part V Resources
163
Available online at httpfiscalcouncillvfilesuploadedFDP_1_01_691_20150925_Monitoring_report_with_Annexespdf
Fournier J-M and Fall F (2015) lsquoMacroeconomic uncertainties prudent debt targets and fiscal rulesrsquo OECD Economics Department Working Papers 1230
Furceri D and A Mourougane (2009) lsquoThe effect of financial crises on potential output new empirical evidence from OECD countriesrsquo OECD Economics Department Working Papers 699
Ghosh A M Qureshi and Tsangarides C (2013) lsquoIs Exchange Rate Regime Really Irrelevant for External Adjustment rsquo Economics Letters 118(1) 104-109
Golinelli R and Momigliano S (2006) lsquoReal-Time Determinants of Fiscal Policies in the Euro Arearsquo Journal of Policy Modeling 28 943-964
Golinelli R and Momigliano S (2009) lsquoThe Cyclical Reaction of Fiscal Policies in the Euro Area The Role of Modelling Choices and Data Vintagesrsquo Fiscal Studies 30 39-72
Heinemann F (2000) lsquoAfter the Death of Inflation Will Fiscal Drag Surviversquo ZEW Discussion Papers 00-19
Hofmans HMJ and van de Coevering C R (2014) lsquoHow to deal with contingent liabilities ndash Lessons from the Dutch experiencersquo OECD Journal on Budgeting 1
IMF Fiscal Affairs Department (2007) Manual on Fiscal Transparency Fiscal Affairs Dept International Monetary Fund Washington DC Available at httpwwwimforgexternalnppp2007eng101907mpdf
IMF Fiscal Affairs Department (2014) The Fiscal Transparency Code Available online at httpblog-pfmimforgfilesft-codepdf Immervoll H (2005) lsquoFalling Up The Stairs The Effects Of Bracket Creep On Household Incomesrsquo The Review of Income and Wealth 51 (1) 37ndash62
International Public Sector Accounting Board (IPSASB) (2014) Handbook of International Public Sector Accounting International Federation of Accountants New York
Jordagrave O Schularick M HP Taylor AM (2013) lsquoSovereigns versus banks credit crises and consequencesrsquo NBER Working Paper19506
Larch M and Salto M (2005) lsquoFiscal Rules Inertia and Discretionary Fiscal Policyrsquo Applied Economics 37 (10) 1135-1146
Legrenzi G and Milas C (2013) lsquoModelling the Fiscal Reaction Functions of the GIPS based on State-Varying Thresholdsrsquo Working Paper Series 16_13 The Rimini Centre for Economic Analysis
Lindwall P (2013) lsquoBudgeting for Contingent Liabilitiesrsquo Discussion Paper 34th Annual Meeting of Oecd Senior Budget Officials OECD Conference CentreParis 3-4 June 2013 Available online at httpwwwoecdorgofficialdocumentspublicdisplaydocumentpdfcote=GOVPGCSBO(2013)7ampdoclanguage=en)
Lukkezen J and Rojas-Romagosa H (2012) lsquoWhen is debt sustainablersquo CPB Discussion Paper 212
Mauro P Romeu R Binder A J and Zaman A (2013) lsquoA Modern History of Fiscal Prudence and Profligacyrsquo IMF Working Papers 135
Medeiros J (2012) lsquoStochastic debt simulation using VAR models and a panel fiscal reaction function results for a selected number of countriesrsquo European Commission Economic Papers 459
Mertens K and Ravn M O (2011) lsquoUnderstanding the Aggregate Effects of Anticipated and Unanticipated Tax Policy Shocksrsquo Review of Economic Dynamics 14(1) 27mdash54
OECD (2002) lsquoOECD Best Practices for Budget Transparencyrsquo OECD Journal on Budgeting Available online at httpwwwoecdorggovbudgetingbest-practices-budget-transparencyhtm)
European Commission Public finances in EMU - 2013
164
OECD (2007) lsquoSpecial feature tax reforms and tax burdens 2000-2006rsquo in OECD Tax Wage Report
Polackova Brixi H and Mody A (2002) lsquoDealing with Government Fiscal Risk An Overviewrsquo in eds Polackova Brixi H and Schick A Government at risk World Bank and Oxford University Press
Ramey V (2011a) lsquoIdentifying Government Spending Shocks Itrsquos All in the Timingrsquo Quarterly Journal of Economics 126 (1) 1-50
Ramey V (2011b) lsquoCan Government Purchases Stimulate the Economyrsquo Journal of Economic Literature 49(3) 673-685
Reinhart CM and Rogoff KS (2008) lsquoIs the 2007 US sub-prime financial crisis so different An international historical comparisonrsquo American Economic Review 98(2) 339-344
The Swedish National Debt Office (2015) Guarantees amp lending Available online at httpswwwriksgaldenseenaboutsndoGuarantees-and-lending1
Weichenrieder A and Zimmer J (2013) lsquoEuro Membership and Fiscal Reaction Functionsrsquo CESifo Working Paper Series 4255
Westerlund J (2008) lsquoPanel cointegration tests of the fisher effectrsquo Journal of Applied Economics 23 193ndash233
4 USEFUL INTERNET LINKS
165
European Union
European Commission eceuropaeu
Directorate-General for Economic and Financial Affairs
eceuropaeueconomy_financeindex_enhtm
Eurostat eppeurostateceuropaeu
European Council consiliumeuropaeu
European Parliament wwweuroparleuropaeu
Economics and Finance Ministries
Belgium wwwtreasuryfgovbeinterthes Ministegravere des Finances - Ministerie van Financen
Bulgaria wwwminfinbg Ministry of Finance
Croatia wwwmfinhr Ministry of Finance
Czech Republic wwwmfcrcz Ministry of Finance
Denmark wwwfmdk Ministry of Finance
Germany wwwbundesfinanzministeriumde Bundesministerium der Finanzen
Estonia wwwfinee Ministry of Finance
Ireland wwwirlgoviefinance Department of Finance
Greece wwwmnecgren Ministry of Economy and Finance
Spain wwwminecoes Ministerio de Economiacutea y Hacienda
France wwwfinancesgouvfr Ministegravere Eacuteconomie Finances et lIndustrie
Italy wwwtesoroit Ministero dellrsquoEconomia e delle Finanze
Cyprus wwwmofgovcy Ministry of Finance
Latvia wwwfmgovlv Ministry of Finance
Lithuania wwwfinminlt Ministry of Finance
European Commission Public finances in EMU - 2013
166
Luxembourg wwwetatluFI Ministegravere des Finances
Hungary wwwp-mhu Ministry of Finance
Malta financegovmt Ministry of Finance and Economic Affairs
Netherlands wwwminfinnl Ministerie van Financien
Austria wwwbmfgvat Bundesministerium fuumlr Finanzen
Poland wwwmofnetgovpl Ministry of Finance
Portugal wwwmin-financaspt Ministeacuterio das Financcedilas
Romania wwwmfinantero Ministry of Finance
Slovenia wwwgovsimf Ministry of Finance
Slovak Republic wwwfinancegovsk Ministry of Finance
Finland wwwvnfivm Ministry of Finance
Sweden finansregeringense Finansdepartementet
United Kingdom wwwhm-treasurygovuk Her Majestys Treasury
EU fiscal surveillance framework
Stability and Growth Pact
httpeceuropaeueconomy_financeeconomic_governancesgpindex_enhtm
Excessive deficit procedure
httpeceuropaeueconomy_financeeconomic_governancesgpcorrective_armindex_enhtm
Stability and convergence programmes
httpeceuropaeueconomy_financeeconomic_governancesgpconvergenceindex_enhtm
Sustainability of public finances
httpeceuropaeueconomy_financearticleseu_economic_situationarticle15994_enhtm
EUROPEAN ECONOMY INSTITUTIONAL SERIES
European Economy Institutional series can be accessed and downloaded free of charge from the following address httpeceuropaeueconomy_financepublicationseeipindex_enhtm Titles published before July 2015 can be accessed and downloaded free of charge from bull httpeceuropaeueconomy_financepublicationseuropean_economyindex_enhtm
(the main reports eg Economic Forecasts) bull httpeceuropaeueconomy_financepublicationsoccasional_paperindex_enhtm
(the Occasional Papers) bull httpeceuropaeueconomy_financepublicationsqr_euro_areaindex_enhtm
(the Quarterly Reports on the Euro Area)
Alternatively hard copies may be ordered via the ldquoPrint-on-demandrdquo service offered by the EU Bookshop httpbookshopeuropaeu
HOW TO OBTAIN EU PUBLICATIONS Free publications bull one copy
via EU Bookshop (httpbookshopeuropaeu) bull more than one copy or postersmaps
- from the European Unionrsquos representations (httpeceuropaeurepresent_enhtm) - from the delegations in non-EU countries (httpeeaseuropaeudelegationsindex_enhtm) - by contacting the Europe Direct service (httpeuropaeueuropedirectindex_enhtm) or calling 00 800 6 7 8 9 10 11 (freephone number from anywhere in the EU) () () The information given is free as are most calls (though some operators phone boxes or hotels may charge you)
Priced publications bull via EU Bookshop (httpbookshopeuropaeu)
KC-BC-15-014-EN-N
- NEW_IP_index_enpdf
-
- EUROPEAN EconomY institutional SERIES
-

European Economy Institutional Papers are important reports and communications from the European Commission to the Council of the European Union and the European Parliament on the economy and economic developments
LEGAL NOTICE Neither the European Commission nor any person acting on its behalf may be held responsible for the use which may be made of the information contained in this publication or for any errors which despite careful preparation and checking may appear This paper exists in English only and can be downloaded from httpeceuropaeueconomy_financepublications
Europe Direct is a service to help you find answers to your questions about the European Union
Freephone number ()
00 800 6 7 8 9 10 11 () The information given is free as are most calls (though some operators phone boxes or hotels may charge you)
More information on the European Union is available on httpeuropaeu Luxembourg Publications Office of the European Union 2015
KC-BC-15-014-EN-N (online) KC-BC-15-014-EN-C (print) ISBN 978-92-79-48624-1 (online) ISBN 978-92-79-48623-4 (print) doi102765455670 (online) doi102765979849 (print)
copy European Union 2015 Reproduction is authorised provided the source is acknowledged
European Commission Directorate-General for Economic and Financial Affairs
Report on Public Finances in EMU 2015
EUROPEAN ECONOMY Institutional Paper 014
ACKNOWLEDGEMENTS
ii
This report was prepared in the Directorate-General for Economic and Financial Affairs under the
direction of Marco Buti Director-General Servaas Deroose Deputy Director-General Lucio Pench
Director for Fiscal Policy and Gilles Mourre Head of Unit for Fiscal Policy and Surveillance
M Salto was the editor of the report Contributors were Gerrit Bethuyne (Chapter II3) Joao Capella
Ramos (Chapter I2) Julia Lendvai (Part IV) Anton Mangov (Part III) Eloise Orseau (Chapters I1 II2
and II4) Lucia Rodriguez-Munoz (Chapter III2) Ralph Schmitt-Nilson (Chapter III2) Ingrid Toming
(Chapter II5) Adrien Zakhartchouk (Chapter III2 and Part IV)
Information on the sensitivity of budgetary items to inflation for individual Member States and useful
comments were provided by Frode Aasen Emiel Afman Wojciech Balcerowicz Barbara Bernardi
Stefan Bohner Ivan Csaba Marek Dobrovolnik Raffaele Fargnoli Luis Garcia Lombardero Maria
Gerhardt Michael Grams Oskar Grevesmuhl Valeska Gronert Zoltan Gyenes Renata Hruzova Robert
Kraemer Juho Kostiainen Jessica Larsson Dimitri Lorenzani Mart Maivali Janis Malzubris Dan Matei
Fabrizio Melcarne Olivia Mollen Marie Mulvihill Christos Paschalides Nicolas Philiponnet Dominik
Pripuzic Vito Ernesto Reitano Giedrius Sidlauskas Peeter Soidla Vladimir Solanic Henk van Noten
Alessandra Cepparulo was responsible for statistical support layout and IT support
The report benefitted from comments and suggestions by Johannes Bahrke Nicolas Carnot Stefan
Ciobanu Servaas Deroose Jean-Paul Keppenne Jakub Koniecki Gilles Mourre Lucio Pench and
Alexander Schwan
Editing and communication support was provided by Johannes Bahrke Nicolas Carpentiers Sarka
Novotna Leila Fernandez Stembridge Peter Koh Iciar Rodriguez-Miranda and the DGT team co-
ordinated by Nika Truhacev
Comments on the report would be gratefully received and should be sent by mail or e-mail to the editor
Matteo Salto
European Commission
Directorate-General for Economic and Financial Affairs
Directorate Fiscal Policy
Unit Fiscal Policy and Surveillance
Office CHAR 12103
Rue de la Loi 170
B-1000 Brussels
e-mail matteosaltoeceuropaeu
CONTENTS
iii
Communication from the Commission 1
Part I Current developments and prospects 6 1 Current developments and prospects 6
11 Economic developments and perspective on consolidation 6 12 Assessment of short-term fiscal developments 7 13 Developments in debt 13 14 Composition of the adjustment 14
2 Implementation of fiscal surveillance 17 21 The Excessive Deficit Procedure 17 22 The European semester and the fiscal Country -Specific Recommendations 20 23 Closing the fiscal surveillance cycle in the euro area Draft Budgetary Plans 21
A1 Assumptions underlying the assessment of fiscal stance 26 A11 Calculation of the indicative structural primary effort implied by sustainability
needs 26 A12 Calculation of the indicative structural primary effort implied by stabilisation
needs 26 A13 An alternative target for stabilisation needs 27
A2 Overview of EDP steps and Country-Specific fiscal Recommendations 29
Part II Recent development in fiscal surveillance 35 1 Introduction 36 2 The functioning of the preventive arm of the SGP an overview
after the Communication on flexibility 38 21 The legal basis for the preventive arm 40 22 The Medium-term budgetary objective (MTO) and the adjustment path
towards it 41 23 Assessment of compliance under the preventive arm 44
3 One-offs measure ndashclassification principles used in fiscal surveillance 52 31 Introduction 52 32 Guiding principles for the classification of one-off measures 52 33 An indicative list of lsquotypicalrsquo one-off measures with justifications for the
classification of each 56 34 Standard cases not to be considered one-offs 62
4 The communication on making the best use of flexibility within the Stability and Growth Pact 66 41 Taking into account structural reforms in the preventive arm the structural
reform clause 67 42 Taking investment into account in the preventive arm the investment clause 72 43 The Ecofin Council of 8 December 2015 74 44 Consequences of the guidance given in the Commission communication on
flexibility within the SGP for the corrective arm 74 5 Fiscal risks and contingent liabilities 76
51 Fiscal risk and the role of contingent liabilities 76
iv
52 New data requirements supporting fiscal surveillance in the eu 78 53 New dataset on contingent liabilities in Eurostats database 78 54 Conclusion 86
Part III Negative inflation surprises how much of a bad thing 89 1 Introduction 90 2 Country-by-country analysis of the reaction of budget to the
inflation surprise of 2014 92 21 Inflation elasticities in 2014 and 2015 according to Commission staff 93 22 Results on inflation sensitivity 96 23 Impact of inflation on interest expenditure 104
3 Impact of an inflation shock on fiscal effort under the SGP 111 31 The preventive arm 112 32 The corrective arm 113 33 The debt rule 115 34 Conclusion and implications for fiscal surveillance 116
A1 Survey 117 A2 Main country-specific features characterizing the impact of inflation on the budget
balance 118 A3 Impact of an inflation shock on interest expenditure 121 A4 Analytical decomposition of the impact of an inflation shock on fiscal effort
indicators 123 A41 Preventive arm of the SGP 123 A42 Corrective arm of the SGP 124 A43 The debt rule 127
Part IV The EUs stylized fiscal reaction function 129 1 The EUs stylized fiscal reaction function 130
11 Introduction 130 12 EDP episodes an overview 132 13 The determinants of the average effort 134 14 The determinants of the deadline 139 15 Conclusions 142
A1 Sample data and robustness checks 144 A11 List of EDP recommendations used in the analysis 144 A12 Description of the EDP sample 144 A13 Models of effort Tobit Model 146 A14 Multinominal Logit regression 147 A15 Test of the proportional odds assumptions and alternative estimations 148 A16 Rubustness checks 149
Part V Resources 151 1 Abbreviations and symbols used 152 2 Glossary 156 3 References 162 4 Useful Internet Links 165
v
LIST OF TABLES I11 Budget balance in EU Member States ( of GDP) 8 I12 Euro area-general government budget balance ( of GDP) 8 I13 Composition of changes in the government debt ratio in EU Member States ( of
GDP) 13 I14 Government revenue and expenditure( of GDP) 15 I21a Overview of individual Commission Opinions on the DBPs ndash Member States currently
under the preventive arm of the SGP 24 I21b Overview of individual Commission opinions on the DBPs ndash Member States currently
under the corrective arm of the SGP 25 IA11 Total fiscal adjustment needed in 2016-2020 according to the S1 indicator ( as of
GDP) 26 IA12 Change in the SPB implied by stabilisation and sustainability needs and in the
Commission forecast (as of GDP) 27 IA13 Change in the SPB implied by an alternative computation of stabilisation needs
(as of GDP) 28 IA21 Overview EDP steps ndash Euro area Member States 29 IA22 Overview EDP steps ndash Non-euro area Member States 30 IA23 Greece 31 IA24 Overview of Council country-specific recommendations relating to fiscal policy 32 II21 Matrix for determining the annual fiscal adjustment towards the MTO required under
the preventive arm 43 II22 Possible outcomes of the overall assessment under the preventive arm of the SGP 49 II41 Overview of the clauses relevant to the preventive arm 68 II51 Availability of indicators required under Council Directive 201185EU in Eurostats
database (as at the end of 2015) 80 III21a Decomposition of expenditures with the ESA 2010 classification 94 III21b Decomposition of revenues with the ESA 2010 classification 94 IV11 Main characteristics of the EDP recommendations 134 IV12 Results of the estimation of Model 1 137 IV13 Results of the estimation of Model 2 138 IV14 Results of the estimation of Model 1 140 IV15 Estimation of the results of Model 2 143 IVA11 List of EDP recommendations 144 IVA12 Result for the Wald test for Model 1 148 IVA13 Results of the estimation of Model 1 using the non-ordered multinomial logit
method 149 IVA14 Other specifications for the determinants of the average effort (with the debt-to-
GDP ratio) 149 IVA15 Other specifications for the determinants of the length of the EDP 149
LIST OF GRAPHS I11 Composition of real GDP growth 6 I12 Fiscal stance in the euro area vs euro area output gap level nand change 10 I13 Change in SPB in the Commission forecast and as implied by stabilisation and
sustainability needs euro area 11
vi
II51 Outstanding guarantees by level of government 2013 of GDP 81 II52 Off-balance PPPs the stock of adjusted capital value by level of governments
2013 of GDP 83 II53 Liabilities of public financial institutions by controlling government level 2013 or 2012
of GDP 84 II54 Liabilities of non-financial public corporations by controlling government level 2013
or 2012 of GDP 85 III21a 2014 HICP estimation from forecast (2013 autumn forecast) and outturn data
(2015 spring forecast) 92 III21b Inflation surprise for 2014 from forecast (2013 autumn forecast) to outturn data
(2015 spring forecast) 93 III22 Elasticity of revenues with respect to inflation surprise in 2014 in the EU Member
States 97 III23 Elasticity of primary expenditures with respect to inflation surprise in 2014 in the EU
Member States 98 III24 Semi-elasticity of primary balance to inflation surprise in 2014 in the EU Member
States 99 III25 Semi-elasticity of primary deficit in 2014 and 2015 to the inflation surprise in 2014 and
contributions of revenues and expenditures 99 III26 Elasticity of different revenue items to inflation surprise in 2014 100 III27 Elasticity of different expenditure items to inflation surprises in 2014 103 III28 Share of debt sensitive to inflation in the EU Member States 105 III29 Market-based inflation expectations in the euro area 106 III210 Elasticity of interest expenditure to inflation in the EU Member States 107 III211 Semi-elasticity of primary deficit in 2014 and 2015 to the inflation surprise in 2014
and contributions of revenues and expenditures(primary and interest) States ( of GDP) 107
III212 Impact on budget balance of the negative inflation surprise in 2014 in the EU Member 108
III213 Change in structural (primary) balance and in interest expenditure over 2012-16 government 110
IV11 Probability of recommended deadlines 141 IVA11 Distribution of the length of the EDP recommendations in the sample 144 IVA12 Distribution of the recommended cumulative structural effort in the sample 145 IVA13 Distribution of the recommended annual structural effort in the sample 145
LIST OF BOXES II21 The calculation of the minimum MTO 42 II22 The main factors explaining possible differences between the two pillars 50 II41 The adjustment path under the structural reform clause 71 II42 The adjustment path under the investment clause 73 II43 Use of the structural reform and investment clauses during the 2015 European
Semester (to benefit from a temporary deviation in 2016) 75 II51 Provisions in the EU budgetary framework on the reporting of fiscal risks 79 III21 The current low interest rate environment 109 IV11Comparability of pre-2009 and post-2009 recommendations 136
EDITORIAL
vii
After a number of difficult years when policy-makers were sometimes faced with the alternative between front-loaded consolidation and the risk of losing market access we are now starting to see the fruits of years of large fiscal efforts maturing with the negative short-term impact of the consolidation packages waning and a moderate recovery taking hold in the euro area On the back of the recovery the headline budget deficit is projected to continue to decrease through 2016 in the euro area and public debt will after peaking in 2014 at almost 95 of GDP keep falling at a slow pace even though the fiscal stance is expected to remain broadly neutral
An economically sound approach to the fiscal stance demands taking into account short-term stabilisation of the economy and long-term sustainability of public finances This is what we do in Part I of this report The shift to a broadly neutral fiscal stance for the Euro area as a whole for the period 2015-2016 is appropriate against the background of historically low interest rates and a large external surplus pointing to the need for some demand support Yet sustainability is essential and our rules are designed to improve it by reducing public debt in particular when the economy is performing well Indeed the economic literature and policy experience indicate that this is the best strategy to rebuild the necessary fiscal buffers and thereby allow for an effective counter-cyclical policy in future downturns To put it succinctly we can only make room for counter-cyclical policy in the bad times also if we apply it consistently in the good times This is one of the main lessons of the financial crisis while the crisis was not fiscal in origin the lack of fiscal buffer in many countries prevented an active use of the fiscal instrument when and where it was most needed
We recognise that the fiscal rules have become very complex At the same time the Commission is committed to clarifying the operation of the rules and increasing transparency in their application In this respect Part II of the report provides a comprehensive summary of how the Stability and Growth Pact accommodates cyclical fluctuations and structural reforms following the recent Commission Communication on Flexibility in the SGP It is also fair to say the depth and smart features of the surveillance framework have allowed it to take into account the unexpected negative inflation shock of recent years in a reasonable manner
We know that when inflation turns out to be lower than expected the achievement of budgetary objectives is affected in the short term since unlike revenues primary expenditures adjust only partially and with some time lag to an inflation surprise Part III of the report shows that the budgetary impact of the negative inflation shock of 2014 was relatively sizable and that the fiscal effort measured by the indicators used in surveillance was distorted in different directions as a result this shock In this regard the careful analysis of all indicators and all relevant factors led to relevant surveillance decisions This illustrates the importance of not fully tying our hands in the implementation of surveillance because the complexities of economic developments require an intelligent use of the existing surveillance indicators to adapt to an ever-changing reality
This also applies to recommendations given to Member States in the context of the Excessive Deficit Procedure Part IV of the report shows that the fiscal effort required by the EU Council in its recommendations is determined mostly on the basis of the headline deficit in line with the original legislation with some consideration also given to the specific fiscal impact of the economic situation The 2011 reform of the SGP went in this direction providing for a better implementation of the surveillance framework
Marco Buti
Director General Economic and Financial Affairs
SUMMARY
1
The recovery continues in line with expectations at a relatively moderate pace Supported by low oil prices and favourable policy conditions GDP growth in the euro area is expected to rise to 16 in 2015 (EU 19) and 18 in 2016 (EU 20) This outlook is subject to risks that are tilted to the downside While internal demand is already driving the current recovery the risks related to the global environment imply that growth may depend even more crucially on it In this improved economic context the large consolidation efforts of the past that have substantially reduced fiscal deficits are paying off the debt to GDP ratio is expected to fall in both the euro area and the EU for the first time since the beginning of the crisis albeit relatively slowly from high levels
As a consequence there are now only seven euro area Member States still in the Excessive Deficit Procedure (of which two Cyprus and Greece are under an economic adjustment programme) and two other EU Member States
In the euro area the aggregate headline budget deficit is expected to decline from 26 of GDP in 2014 to 18 in 2016 compared to 30 and 20 for the EU as a whole However the aggregate balance in structural terms ie adjusted for cyclical factors and excluding one-off measures is expected to remain broadly unchanged from last year The structural primary balance meanwhile is expected to deteriorate slightly
The economic appropriateness of the fiscal stance can be assessed against two objectives the need to stabilise the economy in the short-term and the long-term sustainability of public finances In terms of stabilisation the neutral fiscal stance expected in the euro area (as measured by the change in the structural balance) appears broadly appropriate as it should avoid hampering the recovery Indeed the pause in consolidation over 2015 and 2016 takes place at a time when there is considerable slack in the economy and downside risks to the growth outlook Nominal interest rates at historic lows and the high external surplus suggest the need for some degree of demand support However high debt countries face a risk which will materialize when interest rates begin to normalise again
As shown in Part I of the report some very heavily indebted Member States may find that they may need to increase their efforts in order to secure the medium-term sustainability of their public finances and strengthen their fiscal buffers once the recovery has gained pace
The preventive arm of the Stability and Growth Pact provides the framework to improve sustainability as it encourages budgetary savings to reduce public debt during times of economic strength The preventive arm of the pact aims to improve underlying budgetary positions by ensuring that government expenditures do not grow faster than potential GDP Economic studies and past experience show that this is the most effective strategy for rebuilding necessary fiscal buffers and thereby enabling effective counter-cyclical
The economic recovery in the euro area and the EU as a whole has continued this year at a moderate pace Government deficits continue to fall and debt levels have stabilised By 2016 most Member States are expected to be outside the EDP
The aggregate fiscal stance is broadly neutral which is overall appropriate given the fragile recovery and the risks attached to the economic environmenthellip
hellip while fiscal challenges related to sustainability remain high and long term risks have to be monitored
Member States should abide by the preventive arm of the SGP which aims to secure sound public financeshellip
European Commission Public finances in EMU - 2015
2
policies Accordingly improvements in budgetary positions have to be made in structural terms ie correcting for cyclical fluctuations and excluding measures which only have a one-off impact (see Part II of the Report)
The Commission Communication on flexibility within the SGP presented in Part II provides an operationalization of the prescriptions of the preventive arm by indicating how the convergence path to a sound medium-term budgetary position has to be modulated to take into account cyclical developments The same Communication also operationalizes the provision of the preventive arm which allows for a temporary deviation from the Medium-Term budgetary Objective or the adjustment path towards it to support structural reforms and investments that benefit the sustainability of public finances including by raising potential growth
The structural reform clause allows for a temporary deviation only under well-defined conditions One set of conditions relates to the nature of the reforms eligible for consideration Such reforms must be major in scope and plausibly conducive to an improvement in the sustainability of public finances A second set of conditions regards the status of the reforms in terms of implementation a reform must be credibly planned implemented or at least adopted by government Finally a third set of conditions concerns the situation of the Member State in question with respect to SGP requirements in order to ensure a safety margin with respect to the 3 of GDP deficit threshold of the Treaty and the convergence towards their MTO
The unexpected drops in inflation can make it harder for governments to meet their budgetary objectives because it affects revenues and expenditures differently Chapter III1 looks into the impact on the budget balance of the unexpected inflation shock of 2014
The analysis finds that the effect of inflation turning out to be just over 1 pp less than expected led to a deterioration in the deficit of around 01 pps of GDP in the euro area and almost 04 pps of GDP in certain Member States This is not a small impact especially if compared to the change and not the level of the deficit
The result is driven by the fact that unlike revenues primary expenditures adjust only partially and with a lag to an inflation surprise at least over a two-year horizon Specifically while the elasticity of revenues to the negative inflation surprise was an estimated 05 in 2014 and almost 06 over 2014 and 2015 in the euro area the corresponding figures for the elasticity of primary expenditures is estimated to have been less than 02 in 2014 and to have increased only to 03 cumulatively in 2015
The partial or complete removal of indexation mechanisms eg on wages and rigidities of downward nominal adjustment are important reasons why the elasticities of primary expenditures to price developments were found to be particularly low in 2014 These effects are thus very specific to 2014 because in this year the negative inflation shock overlapped with an already low-inflation environment and with the suspension of earlier practice for example concerning wages which in the past had generated relatively large short-term effects
hellipwhile benefitting from the flexibility present in the preventive arm identified by the Commission in its Communication on Flexibility in the SGP of Januaryhellip
which is allowed under well-specified conditions
helliphellip Inflation turning out lower than expected can hinder improvements in budgetary positionshellip
Summary
3
These results confirm that unexpected price developments can have an influence on whether or not a country meets its fiscal targets Chapter III3 sheds more light on the interplay between inflation surprises and fiscal effort as measured by the top-down and bottom-up metrics used in assessing compliance with the SGP In particular it shows that as the structural balance implicitly assumes full adjustment of revenues and expenditures to changes in inflation inflation surprises result in an underestimation of the fiscal effort delivered by governments when inflation proves lower-than-expected By contrast in the same case bottom-up measures of the fiscal effort will result in an overestimation of the fiscal effort as they implicitly assume that primary expenditures have zero elasticity with respect to inflation changes relative to the scenario in the fiscal recommendation The careful analysis of all indicators and all relevant factors is therefore essential in surveillance decisions as it allows to correctly gauging them This was the case in 2015
Compliance with the debt rule is affected by inflation shocks and by low inflation in general The debt reduction benchmark does not take into account inflation developments Therefore negative inflation shocks risk to translate into more demanding efforts related to lower-than-planned outcomes
Beyond inflation and growth growth developments also matter for attaining fiscal targets Part IV of the report looks at the determinants of the fiscal efforts prescribed in Excessive Deficit Procedure recommendations since the inception of the SGP Between 2003 and 2014 of the EUrsquos 28 Member States 26 have been concerned by at least one recommendation and 22 Member States received more than one recommendation This makes for a total of 69 EDP recommendations analysed in detail in the report The analysis indicates that fiscal recommendations use the room for manoeuvre existing in the Treaty by allowing differentiated fiscal effort and a progressive adjustment over several years rather than a correction over one year
The analysis shows that the Commission and the Council do take into consideration the impact of the economic situation in Member States when setting their recommendations This concerns both the required fiscal effort and the deadline to bring government deficits below the 3 of GDP threshold In line with the requirements of the Treaty and of the SGP since its inception the Commission and the Council give prominence to the headline public deficit level but they do differentiate between the structural and cyclical components of the deficit so that recommendations are not mechanically determined on the basis of the headline deficit level Other considerations such as the debt-to-GDP ratio do not seem to play a significant role in determining the efforts recommended by the Council This however could be because the operationalisation of the debt criterion followed the 2011 reform of the SGP and is therefore not adequately reflected in our sample
helliphellipwhich can distort the indicators of fiscal effort used for surveillance purposes
A thorough analysis of the EDP recommendations shows that most Member States received at least one EDP recommendation andhellip
hellipoverall economic conditions are relevant factors duly taken into account by the Commission and the Council when deciding the recommendations to be given to Member States under the EDP
Part I Current developments and prospects
1 CURRENT DEVELOPMENTS AND PROSPECTS
6
11 ECONOMIC DEVELOPMENTS AND PERSPECTIVE ON CONSOLIDATION
The economic recovery that started in the euro area and the EU as a whole in 2013 has continued this year supported by tailwinds amid more challenging global conditions Although it has been relatively timid compared with previous recoveries (as is often the case following major financial crises) (1) the recovery has so far proven resilient It has benefited in particular from a conjunction of tailwinds including low oil prices a relatively weak external value of the euro and policy support stemming from the ECBrsquos highly accommodative monetary policy and a neutral fiscal stance On the other hand economic growth has been muted by several factors in particular the recent sharp fall in global trade growth in a context of slowdown in emerging market economies geopolitical tensions subdued investment activity (especially due to economic and policy uncertainty) and lingering corporate deleveraging pressures in some Member States
The outlook for moderate but increasing output growth in the Commissionrsquos autumn 2015 forecast largely confirms expectations from the spring It points to further modest recovery with real GDP growth improving from 16 in 2015 to 18 in 2016 in the euro area and from 19 to 20 in the EU as a whole For both the euro area and the EU this is marginally more favourable than expected in the spring forecast for 2015 (as in the first half of the year GDP in the EU grew slightly faster than expected) and marginally less so for 2016
The aggregate growth figures mask sizeable differences across Member States While real GDP growth is expected to pick up in most Member States in 2016 it is projected to slow down in six euro area Member States (Ireland Spain Malta Portugal Slovenia and Slovenia) and five other Member States (Bulgaria the Czech Republic Hungary Sweden and the United Kingdom) though still likely to remain above EU average in most of these countries
(1) For comparisons with previous recoveries see for instance
Reinhart and Rogoff (2008) Furceri and Mourougane (2009) Jordagrave et al (2013) European Central Bank (2014) European Commission (2015a)
As regards its composition growth is likely to be driven by stronger domestic demand while net exports are expected to contribute hardly at all Private consumption has been stimulated by the favourable impact on purchasing power of low oil prices and a continued rise in nominal income thus becoming the main driver of economic growth Investment has been lagging but is expected to strengthen on the back of a rebound in residential investment favourable financing conditions improved profit margins and a brighter demand outlook Exports are likely to rebound with world trade growth expected to recover in 2016 underpinning an expansion of EU export markets However as the profile of import growth is projected to be similar to that of exports the contribution of net exports to growth is expected to be broadly neutral (see Graph I11)
The rebalancing from external towards internal demand is in line with a stabilisation of the euro arearsquos current-account surplus This surplus is set to decline marginally in 2016 after peaking in 2015 In 2015 it is expected to increase by 07 pp to 37 of GDP as a result of the shrinking oil trade deficit improvements in the terms of trade and subdued domestic demand It is then expected to edge down to 36 of GDP in 2016
Re-launching investment to support domestic demand is one of the Commissionrsquos priorities for 2016 especially with the operationalisation
Graph I11 Composition of real GDP growth
Source Commissionrsquos 2015 autumn forecast
-5
-4
-3
-2
-1
0
1
2
3
2008 2009 2010 2011 2012 2013 2014 2015 2016
Domestic demand Net exports
Inventories GDP (y-o-y)
forecastpps
Part I Current developments and prospects
7
at the beginning of the year of the Investment Plan for Europe It is aimed at mobilising new investments of over EUR 315 billion to address the investment shortage induced by the crisis Substantial progress has been made in building financial capacity with the setting-up of the European Fund for Strategic Investments and in selecting projects This needs to be accompanied by dismantling barriers to investment(2) Further steps are needed not only to complete Banking Union and Capital Markets Union so that the financial sector can focus on lending to the real economy but also to remove distortions in taxation that impede investment and invest in human capital and social infrastructure
The recovery has also benefited from support from monetary policy The combination of quantitative easing and credit easing by the ECB has reduced financing costs and contributed to a rebound in credit growth
The outlook is subject to risks that are tilted to the downside in particular on the external side World trade could deteriorate further and spillovers from the slowdown in emerging markets could turn out larger than expected which would increase the need for the euro area to turn from external to domestic sources of growth An additional external risk relates to a possible increase in volatility on financial markets On the domestic side the legacy of the crisis may continue to weigh on investment more heavily than expected At the same time the risks relating to the uncertainty in Greece have receded following the political agreement reached in the summer Upside risks include a stronger-than-expected rebound in global growth and foreign demand and more favourable impacts from structural reforms
12 ASSESSMENT OF SHORT-TERM FISCAL DEVELOPMENTS
121 Budget deficits
Following large consolidation efforts in 2011-2013 deficits have been substantially reduced From 2011 to 2013 and (more slowly) in 2014 (2) See Commission Staff Working Document SWD (2015)
400 final Available online at httpeceuropaeueurope2020pdf2016ags2016_challenges_ms_investment_environments_enpdf
sizeable consolidation was implemented in the euro area and the EU as a whole (Table I11) This reduced markedly the structural deficit in the EU from 46 of GDP in 2010 to 17 in 2014 and in the euro area from 43 to 10 In the same period headline deficit ratios also fell considerably by around 35 of GDP to 30 in the EU and 26 in the euro area in 2014 At country level while only five Member States recorded deficits below the 3 of GDP reference threshold in 2010 14 did so in 2014
Looking ahead the aggregate headline budget balance is expected to improve further in 2015 and 2016 In the euro area the deficit is projected to decrease to 20 of GDP in 2015 and 18 in 2016 A slightly faster reduction is expected in the EU as a whole to 25 in 2015 and 20 in 2016 These falls correspond to average annual improvements (by 04 and 05 of GDP respectively) amounting to half of the average observed in 2011-2013
This improvement is mainly due to lower interest rates improved growth and past consolidation efforts while the aggregate structural balance is expected to remain broadly unchanged and the structural primary balance is expected to deteriorate Following four years of improvement the structural balance (ie the headline balance corrected for cyclical factors one-offs and other temporary measures) is projected to edge down to -11 of GDP in 2015 and -12 in 2016 in the euro area and to hover at around -17 in the EU as a whole The difference vis-agrave-vis the evolution of the headline balance corresponds mainly to the impact of the cycle (which is expected to improve both headline balances by 04 pp per year) along with a positive expected impact of one-offs in 2015 Interest expenditure is expected to drop by 03 of GDP in both areas over the same period but this is expected to be offset by a deterioration in the structural primary balance cumulatively by roughly the same amount in the EU and by 05 of GDP in the euro area (Table I12)
European Commission Public finances in EMU - 2015
8
2012 2013 2014 2015 2016 2012 2013 2014 2015 2016 2012 2013 2014 2015 2016BE -41 -29 -31 -27 -26 -34 -27 -28 -25 -21 01 06 03 04 07DE -01 -01 03 09 05 -01 03 08 09 07 22 23 26 24 21EE -03 -01 07 02 02 -01 -04 03 03 02 00 -03 04 04 03IE -80 -57 -39 -22 -15 -64 -43 -32 -30 -21 -24 00 08 03 09EL -88 -124 -36 -46 -36 -04 20 06 -11 -03 47 60 45 32 38ES -104 -69 -59 -47 -36 -33 -19 -18 -25 -26 -04 15 16 06 03FR -48 -41 -39 -38 -34 -43 -35 -28 -27 -24 -17 -13 -06 -07 -03IT -30 -29 -30 -26 -23 -13 -09 -11 -10 -15 39 40 36 33 26
CY -58 -49 -89 -07 01 -51 -17 20 04 02 -22 14 49 32 27LV -08 -09 -15 -15 -12 00 -09 -18 -21 -19 16 05 -03 -08 -06LT -31 -26 -07 -11 -13 -26 -23 -14 -12 -14 -06 -05 02 04 01LU 02 07 14 00 05 25 21 21 07 09 30 25 25 11 13MT -36 -26 -21 -17 -12 -36 -25 -24 -21 -17 -07 04 05 06 08NL -39 -24 -24 -21 -15 -23 -09 -05 -11 -14 -06 06 09 03 -02AT -22 -13 -27 -19 -16 -18 -12 -07 -06 -10 09 14 18 18 12PT -57 -48 -72 -30 -29 -31 -25 -14 -18 -23 18 23 35 31 22SI -41 -150 -50 -29 -24 -21 -22 -27 -27 -25 -01 04 04 03 04SK -42 -26 -28 -27 -24 -36 -17 -21 -21 -20 -18 02 -01 -05 -05FI -21 -25 -33 -32 -27 -11 -10 -18 -17 -15 03 03 -05 -06 -04
EA-19 -37 -30 -26 -20 -18 -21 -14 -10 -11 -12 09 14 16 14 12BG -06 -08 -58 -28 -27 -05 -08 -25 -26 -24 03 00 -16 -16 -14CZ -40 -13 -19 -19 -13 -15 01 -08 -20 -14 00 14 05 -08 -02DK -36 -13 15 -33 -25 00 -02 06 -23 -14 19 16 21 -08 -01HR -53 -54 -56 -49 -47 -41 -36 -39 -35 -38 -07 -01 -04 01 -02HU -23 -25 -25 -23 -21 -14 -15 -25 -23 -26 32 31 15 12 07PL -37 -40 -33 -28 -28 -40 -34 -26 -30 -26 -14 -09 -07 -12 -10RO -32 -22 -14 -12 -28 -20 -11 -06 -08 -27 -03 07 10 08 -12SE -09 -14 -17 -14 -13 01 -02 -08 -10 -10 10 06 -01 -04 -03UK -83 -57 -57 -44 -30 -66 -45 -52 -45 -33 -37 -17 -25 -20 -09
EU-28 -43 -33 -30 -25 -20 -27 -18 -17 -18 -16 02 09 08 05 06
Budget balance Structural balance Structural primary balance
Consolidation efforts varied across Member States in 2014 The fiscal effort in 2014 as measured by the change in the structural balance points to a broadly equal number of Member States consolidating or loosening with large differences across countries Consolidation ranged from over 3 pp in Cyprus to a loosening of at least 1 pp in Bulgaria Greece and Hungary Ireland and Portugal implemented fiscal efforts of slightly above 1 pp Of the remaining Member States around half implemented an effort of 0-1 pp and the other half a loosening of 0-1 pp
Over 2015 and 2016 most Member States are projected to implement no or negative fiscal efforts on average with respect to 2014 Consolidation is expected to take place in only seven countries with a maximum of 09 pp per year (average in the UK) over the two years In the other consolidating countries (Ireland Belgium Malta France Slovenia and Finland) the projected average effort is expected to reach 05 pp
per year at most The structural balance is expected to remain unchanged in six Member States (Bulgaria Slovakia Hungary Poland Lithuania and Latvia) It is expected to deteriorate in the
Table I11 Budget balances in EU Member States ( of GDP)
Source Commission services figures for 2015 and 2016 are from the Commissions autumn 2015 forecast Note The structural budget balance is calculated on the basis of the commonly agreed production function method (European Commission (2004))
Table I12 Euro area ndash general government budget balance ( of GDP)
Source Commission services figures for 2015 and 2016 are from the Commissions autumn 2015 forecast Note Differences between the total and the sum of individual items are due to rounding
2011 2012 2013 2014 2015 2016Total revenue (1) 449 461 466 468 466 462Total expenditure (2) 491 497 496 494 486 480Actual balance (3) = (1) - (2) -42 -37 -30 -26 -20 -18Interest (4) 30 30 28 27 24 23Primary balance (5) = (3) + (4) -12 -06 -02 01 04 05One-offs (6) 00 -04 -01 -02 01 00Cyclically adjusted balance (7) -36 -25 -14 -12 -10 -12Cyclically adj prim balance = (7) + (4) -06 05 14 14 14 11Structural budget balance = (7) - (6) -36 -21 -14 -10 -11 -12Structural primary balance = (7)-(6)+(4) -06 09 14 16 14 12Change in actual balance 05 07 04 06 02of which - Cycle -06 -04 01 04 04 - Interest (reverse sign) 00 02 01 02 01 - One-offs -04 03 -01 03 -01 - Structural primary balance 15 05 02 -03 -02Change in cycl adj primary balance 12 08 01 00 -03Change in structural budget balance 15 07 03 -01 -01
Part I Current developments and prospects
9
remaining 15 with the largest loosening by 11 pp per year expected in Romania while in most cases the decline is not expected to exceed 05 pp a year However in several Member States these averages conceal significant differences in the fiscal effort between the two years
122 Assessing the euro arearsquos fiscal stance
The fiscal stance in the euro area can be assessed against the twin criteria of long-term sustainability of public finances and short-term macroeconomic stabilisation Long-term sustainability requires that public debt is put and maintained on a sustainable path taking into account the current level of debt and projected future expenditures relating to population ageing Macroeconomic stabilisation could be expressed in terms of closing the output gap at an appropriate pace in the short to medium term while in the current situation also ensuring a shift from external to domestic sources of growth(3)
Assessed against stabilisation needs the expected neutral fiscal stance in the euro area as measured by the change in the structural balance can be considered broadly appropriate After substantial fiscal consolidation was achieved from 2011 to 2013 the adjustment effort slowed down in 2014 and is expected to come to a halt in 2015 and 2016 corresponding to a broadly neutral fiscal stance (Graph I12) This is in a context of an output gap that has been negative since 2009 (although it has been narrowing since 2013) For both 2015 and 2016 a broadly unchanged structural balance is expected with the output gap improving at the same pace As the output gap is expected still to be negative by the end of 2016 (for the eighth year in a row) such a neutral fiscal stance in both years appears broadly appropriate in that it is not likely to hinder the projected substantial cumulative narrowing of the output gap (by 14 pp) while avoiding procyclicality It also appears suitable given the historically low interest rates and the high external surplus which would indicate a need for some degree of demand support Nevertheless because they are non-permanent savings from low interest
(3) This is consistent with the concept of responsible fiscal
policies as presented in the 2016 Annual Growth Survey (httpeceuropaeueurope2020pdf2016ags2016_annual_growth_surveypdf) ie policies that ensure growth-friendly fiscal consolidation
payments could represent a risk if used to increase government spending or cut taxes permanently
At the same time further consolidation is needed to address sustainability needs The euro area still faces considerable challenges as regards the sustainability of public finances Aggregate general government debt in the euro area remains high at over 90 of GDP and well above that level in certain Member States and it is decreasing only slowly This points to a need for further consolidation to bring and keep debt on a sustainable path also in view of the future increase in expenditures associated with population ageing
The previous analysis can be refined by referring to the S1 indicator (4) for sustainability and to a robustness check for stabilisation For the sake of transparency sustainability and stabilisation needs are estimated separately For this purpose the fiscal stance has to be expressed in terms of the change in structural primary balance (SPB) ie excluding interest payments This enables us to assess it against sustainability needs as measured on the basis of the S1 indicator which shows the total change in SPB required from 2016 to 2020 to bring debt to 60 of GDP by 2030 also taking into account contingent liabilities relating to ageing For the calculations it is assumed that 25 of this total adjustment is implemented in 2016 Stabilisation needs are expressed on the basis of the Keynesian idea that fiscal policy should be countercyclical and can be so with various degrees of ambition depending in particular on country-specific conditions Thus the needs are computed in terms of closing the output gap at a more or less rapid pace in 2016 namely by 25 to 50 as compared with its 2015 level Annex I1 provides further details on the methodology
(4) The Commission services use the S1 indicator to carry out
systematic and harmonised public-debt sustainability analysis for EU Member States It measures in structural terms net of interest payments the fiscal adjustment needed to bring the debt ratio to the reference threshold of 60 of GDP by 2030
European Commission Public finances in EMU - 2015
10
This analytical exercise does neither substitute for the SGP nor is to be seen as supporting fiscal fine-tuning It should be made clear that the intention is only to provide deeper positive analysis of budgetary developments not to suggest fiscal fine-tuning or draw normative conclusions The only relevant legal framework for policy recommendations is strict implementation of the SGP
Certain methodological limitations call for prudence in interpretation This is a tentative assessment which still has to be refined In particular it relies on real-time estimation of the output gap which is a notoriously difficult exercise the quantification of sustainability and stabilisation needs is illustrative the calculations use a single multiplier irrespective of the country and measures considered and they do not incorporate any spillover effects across countries Moreover the definition of stabilisation needs could be refined to depend on the number of consecutive years that the output gap has already been positive or negative
Graph I13 presents an assessment of the forecast fiscal stance in the euro area as a whole and in individual Member States against sustainability and stabilisation needs It compares the projected fiscal stance (red crosses)
with the changes in SPB that would be necessary to address sustainability needs (green squares) and stabilisation needs (the vertical bars bookended by a blue bar identifying a 25 reduction of the output gap and a black bar identifying a 50 reduction)
For the euro area as a whole this analysis confirms that the projected broadly neutral fiscal stance for 2016 is consistent with moderate stabilisation and less restrictive than implied by sustainability needs The Commission forecast expects a small deterioration in SPB by 02 pp in 2016 By comparison the sustainability needs would point to a need to improve the SPB by 03 pp As regards the stabilisation needs a consolidation effort of 02 pp in terms of change in SPB would be compatible with a reduction of the output gap by 25 while a loosening of 04 pp would be needed to reduce it by 50 in one year Overall the projected fiscal stance is located towards the middle of the vertical stabilisation bar indicating that it is consistent with an output gap reduction of more than 25 and less than 50 and it is less restrictive than suggested by sustainability needs Alternatively a limited improvement in SPB by around 02 pp would broadly address sustainability needs while allowing for some reduction of the output gap
Graph I12 Fiscal stance in the euro area vs euro area output gap level and change
Source Commission services Note In the left-hand chart the projected fiscal stances for both 2015 and 2016 follow the same plot as changes in structural balance and in output gap are expected to be the same in both years
2008
2010
2011
2012
2013
2014
20152016
-1 -05 00 105 15
-15
-10
-05
00
05
10
15
20
Ch
ange
in t
he
stru
ctu
ral b
alan
ce
Change in the output gap
2009
-5
2009
2010
2011
2012
2013
2014
201500-05-1-15-2-25-3-35 20
-15
-10
-05
00
05
10
15
20
Ch
ange
in t
he s
tru
ctu
ral b
alan
ce
Output gap
20082008
2016
Part I Current developments and prospects
11
123 Assessing the fiscal stance in euro area Member States
1231 A useful graphical tool
The following paragraphs provide more detailed explanations on how to read Graph I13 for all Member States
From the point of view of stabilisation needs Graph I13 shows two groups of euro area Member States depending on the sign of their expected output gap in 2015 In those in which the output gap is negative (ie the majority of euro area Member States) stabilisation involves improving the output gap and the fiscal stance consistent with a 50 reduction of the output gap is mechanically more expansionary than that consistent with a reduction of only 25 In
Graph I13 this means that the black bar (50 reduction) is below the blue bar (25 reduction) By contrast for countries in which the output gap is positive (Estonia Latvia Lithuania Malta and Ireland) narrowing the output gap would mean slowing down economic growth The reduction would be greater with a more restrictive fiscal stance For these countries the black bar is therefore above the blue bar
The length and position of the vertical bars can be interpreted as follows
- the length of the bars is an indication of the size of the output gap An output gap close to zero translates into limited stabilisation needs indicated by a short vertical bar For instance in Germany where the output gap in 2015 is estimated at -04 of GDP it does not make
Graph I13 Change in SPB in the Commission forecast and as implied by stabilisation and sustainability needs euro area
Source Commission services Notes (1) How to read this chart for the euro area as a whole the Commissionrsquos 2015 autumn forecast expects a deterioration in the SPB by 02 pp in 2016 (red cross) By comparison the sustainability needs would point to a need to improve the SPB by 03 pp (green square) As regards stabilisation needs a consolidation effort of 02 pp in terms of change in SPB would be compatible with a 25 reduction of the output gap (long blue bar) while it would take a loosening of 04 pp to reduce the output gap by 50 in one year (short black bar) Overall the projected fiscal stance is located on the vertical stabilisation bar indicating that it is consistent with a reduction of the output gap by more than 25 and less than 50 and it is less restrictive than suggested by sustainability needs (2) The change in SPB that would be mechanically consistent with the considered changes in the output gap is calculated assuming a (fairly large) fiscal multiplier of 08 (3) The calculations take into account the change in output gap entailed in the Commission forecast once it has been corrected for the impact of the projected fiscal stance (ie the change in output gap recalculated under a zero-change in the SPB scenario ceteris paribus) (4) Portugal has not yet submitted budgetary plans for 2016
-15
-10
-05
00
05
10
15
20
25
-15
-10
-05
00
05
10
15
20
25
EA LU DE NL SK CY AT ES IT SI FI BE PT FR EL EE LV LT MT IE
Change in the SPB consistent with a reduction of the OG by 25 Change in the SPB consistent with a reduction of the OG by 50
Change in the SPB in the Commission forecast Change in the SPB implied by sustainability needs
Member States with a negative OG in 2015 Member States with a positive OG in 2015
Euro area
broadly neutral fiscal
stance
(-31)
European Commission Public finances in EMU - 2015
12
much difference to the required level of fiscal adjustment whether it is closed by 25 or 50 Conversely with Spainrsquos output gap of -39 of GDP in 2015 the implied change in SPB differs substantially depending on whether the output gap is to be reduced by 1 pp or 2 pp This is shown by a long vertical bar
- the position of the bars indicates what change in SPB is suggested by the stabilisation needs this depends on how the output gap is projected to evolve ceteris paribus The calculations incorporate the evolution of the output gap that is implicit in the Commission forecast on the basis of identical assumptions for variables other than fiscal Only the fiscal stance is modulated so as to show what change in SPB would be consistent with a given change in the output gap via the operation of a given fiscal multiplier In most cases including for the euro area as a whole the forecast already foresees a significant reduction of the output gap even without fiscal policy intervention (see Annex I1) and a broadly neutral fiscal stance would be sufficient to reduce the output gap by at least 25 If the underlying reduction in the output gap is large enough some stabilisation can still be achieved even if it is partially offset by procyclical fiscal policy (eg in Cyprus Spain and Slovenia) If on the other hand the underlying closure of the output gap is limited or the output gap is expected to widen active countercyclical policy may be needed
The effort implied by sustainability needs depends on current and outlook debt levels In a majority of euro area Member States debt is projected to remain above 60 of GDP and further consolidation is needed to reduce it to 60 by 2030 this is indicated by green squares above the horizontal axis By contrast in other countries debt already stands below 60 of GDP (Estonia Latvia Luxembourg and Slovakia) or is expected to fall below 60 before 2030 (Germany the Netherlands) and is combined with a low projected increase in ageing-related expenditure This implies that up to a point debt could still remain at or below 60 of GDP by 2030 even with some deterioration in SPB In other words these Member States have scope for expansionary policies in response to stabilisation needs In
Graph I13 this is shown by green squares below the horizontal axis
The shaded area indicates a zone where the fiscal stance can be considered broadly neutral It corresponds to a change in SPB of between -02 pp and 02 pp The euro area as a whole Luxembourg Slovakia Slovenia Finland Estonia Latvia and Malta can be considered to have a broadly neutral fiscal stance in 2016 on the basis of the Commission forecast while Greecersquos Irelandrsquos and (to a lesser extent) Belgiumrsquos and Francersquos stance can be considered restrictive An expansionary fiscal stance is projected in the remaining euro area Member States
1232 Main messages
The analysis shows that in most cases sustainability and stabilisation needs do not necessarily conflict but tensions appear when the stabilisation targets are more ambitious There are no conflicts when the sustainability markers (green squares) are located on the stabilisation bar or below it as for Luxembourg Germany the Netherlands Slovakia Cyprus Spain Slovenia and all Member States with a positive output gap in these cases there is room for fiscal policy to address both needs simultaneously even if not necessarily with the SGP This is also the case to a lesser extent when stabilisation needs (at least measured by the least ambitious reduction target) point in the same direction as sustainability needs in terms of improving or lsquodisimprovingrsquo the SPB This is the case for the euro area as a whole Italy Finland Belgium and France in such cases both needs may not be fully addressed but do not conflict for limited stabilisation targets However tensions between stabilisation and sustainability needs appear if the targeted reduction of the output gap is more ambitious Finally there are only three cases of conflict Greece Portugal and to a much more limited extent Austria
The projected fiscal stance for most Member States in 2016 reflects at least partly stabilisation needs in Member States with a negative output gap in some cases at the expense of sustainability needs Among the countries with a negative output gap a deterioration of SPB is expected in seven (Germany the Netherlands Cyprus Austria
Part I Current developments and prospects
13
Spain Italy and Portugal) (5) in most cases coinciding with a substantial improvement in the output gap Of these it is only in Germany and the Netherlands that the fiscal expansion does not come at the expense of sustainability needs in all the other cases sustainability issues would suggest instead a need for an improvement in SPB (Spain Italy and Portugal) or an unchanged SPB (Cyprus and Austria) At the same time four Member States with a negative output gap are expected to have a broadly neutral fiscal stance For Luxembourg and Slovakia this is in line with both sustainability and stabilisation needs for Finland this partly addresses both needs for Slovenia it would take a more restrictive stance to address both needs The three remaining countries with a negative output gap are expected to improve their SPB somewhat which would mitigate both needs
(5) Portugal has not yet submitted budgetary plans for 2016
given the gap (Belgium and France) or conflict (Greece) between them
13 DEVELOPMENTS IN DEBT
At aggregate level the debt ratio is set to start declining after having peaked in 2014 thanks to past efforts and a favourable snowball effect Average debt in the EU peaked at 886 of GDP in 2014 and after seven years of continued increase it is expected to edge down to 878 in 2015 and 871 in 2016 (Table I13) Similarly in the euro area the debt ratio is projected to decline marginally from its peak of 945 in 2014 to 940 in 2015 and 929 in 2016 In the EU as a whole the expected decline in the debt ratio in 2015 and 2016 is driven entirely by a smaller snowball effect which combines the impact of lower interest expenditure and higher nominal GDP growth partly offset by some stock-flow
Table I13 Composition of changes in the government debt ratio in EU Member States ( of GDP)
Source Commission services figures for 2015 and 2016 are from the Commissions autumn 2015 forecast Note Differences between the total and the sum of individual items are due to rounding
Change in debt ratio
2011 2012 2013 2014 2015 2016 2014-16Primary balance
Interest ampgrowth
contribution
Stock-flow adjustment
BE 1022 1041 1051 1067 1067 1071 05 -04 08 00DE 784 797 774 749 714 685 -64 -43 -22 00EE 59 95 99 104 100 96 -08 -06 -06 05IE 1093 1202 1200 1075 998 954 -120 -26 -78 -17EL 1720 1594 1770 1786 1948 1997 211 -02 143 70ES 695 854 937 993 1008 1013 20 22 -10 08FR 852 896 923 956 965 971 15 31 01 -17IT 1164 1232 1288 1323 1330 1322 -02 -35 36 -03
CY 658 793 1025 1082 1067 987 -95 -47 32 -79LV 428 414 391 406 383 411 05 02 -08 11LT 372 398 388 407 429 408 01 -09 13 -03LU 192 221 234 230 223 239 09 -13 -09 30MT 698 676 696 683 659 632 -50 -22 -30 02NL 617 664 679 682 686 679 -03 10 -18 05AT 822 816 808 842 866 857 15 -11 04 22PT 1114 1262 1290 1302 1282 1247 -54 -35 18 -36SI 464 537 708 808 842 809 01 -05 07 -01SK 433 519 546 535 527 526 -09 20 -06 -23FI 485 529 556 593 625 645 52 36 02 14
EA-19 867 913 934 945 940 929 -16 -10 -05 -02BG 153 176 180 270 318 328 58 34 06 18CZ 399 447 452 427 410 410 -17 09 -09 -17DK 464 456 450 451 402 393 -58 30 01 -89HR 637 692 808 851 892 917 66 23 39 04HU 808 783 768 762 758 745 -17 -24 01 06PL 544 540 559 504 514 524 19 22 -06 03RO 342 374 380 399 394 409 10 08 -07 09SE 369 372 398 449 447 440 -09 14 -29 06UK 818 853 862 882 883 880 -02 26 -19 -09
EU-28 816 852 873 886 878 871 -15 00 -21 06
Gross debt ratioChange in the debt ratio in
2014-16 due to
European Commission Public finances in EMU - 2015
14
adjustments In the euro area by contrast the main driver of the expected reduction in the debt ratio is the projected improvement in the primary surplus along with a smaller snowball effect and to a more limited extent stock-flow adjustments
Aggregate figures mask considerable variation in the evolution of debt-to-GDP ratios across Member States Although all Member Statesrsquo ratios in 2014 were higher than in 2008 in most cases the increase was not continuous but interrupted by reduction episodes notably in Greece (as a result of debt restructuring) The rise was continuous in 12 Member States Belgium Spain France Italy Cyprus the Netherlands Portugal Slovenia Finland Croatia Romania and the UK In five of these (Belgium Spain France Finland and Croatia) and in Greece Bulgaria and Poland debt ratios are expected to increase further in both 2015 and 2016 By contrast the debt ratios of five Member States are expected to remain on the downward trend initiated in recent years (Hungary in 2012 Germany and Ireland in 2013 Malta and Slovakia in 2014) Reductions are also expected for both 2015 and 2016 in Estonia Cyprus Portugal Denmark and Sweden In the remaining countries the debt ratio is projected to increase in one year and decline in the other Overall the largest reduction is expected in Ireland (-120 pp) followed by Cyprus (-95 pp) and the largest increase in Greece (211 pp)
Debt levels continue to vary widely across Member States The debt-to-GDP ratios of six Member States (Belgium Greece Spain Italy Cyprus and Portugal) are expected to exceed 100 in 2015 In Greece the ratio is expected to increase markedly to close to 200 by the end of 2016 while in Belgium Spain and Italy it should broadly stabilise and in Portugal and Cyprus it should decline In seven Member States (Ireland France Austria Slovenia Croatia Hungary and the UK) ratios are projected to remain well above 60 but below 100 (just below in the case of France) Debt in Germany Malta the Netherlands and Finland is expected to be between 60 and 70 of GDP by the end of 2016 with an increasing trend in the case of Finland In the remaining 11 Member States debt is expected to remain below the 60 of GDP threshold
Primary surpluses higher nominal growth and lower interest expenditure are set to have a
more favourable impact on debt developments than in previous years The snowball effect that pushed debt up in highly indebted Member States in recent years is expected to be eroded by lower interest payments the economic recovery and higher inflation expectations and may even turn negative in some countries It remains very large in Greece (143 pp in cumulated terms in 2015 and 2016) however although far below 2011-2012 levels In addition the primary surpluses projected for most euro area countries and Hungary are expected to help reduce debt ratios while primary deficits in Spain France the Netherlands Slovakia Finland and most non-euro area Member States are expected to weigh on debt dynamics Finally debt developments are expected to be affected by some stock-flow adjustment measures the largest mainly reflecting bank recapitalisation costs in Greece in 2015 privatisation proceeds in Cyprus in 2016 and a temporary change in the financing of public debt in Denmark in 2015
14 COMPOSITION OF THE ADJUSTMENT
Between 2011 and 2014 fiscal consolidation was driven mainly by revenue increases in the euro area but based on revenue increases and cuts in expenditure in non-euro area Member States on aggregate In the EU as a whole the revenue-to-GDP ratio increased until 2013 and stabilised at 452 in 2014 18 pp above its 2010 level (Table I14) At the same time the expenditure-to-GDP ratio was 17 pp lower in 2014 (482 ) than in 2010 In the euro area the rise in revenues to the peak of 2014 was slightly stronger by 25 pp while the expenditure ratio fell by 1 pp indicating that consolidation took place primarily on the revenue side
For 2015 and 2016 consolidation is expected to be driven by the expenditure side The decline in the expenditure ratio is expected to accelerate somewhat with cumulated drops of 16 pp in 2015-2016 in the EU and 14 pp in the euro area This is likely to be partially offset by a decline in the revenue ratio by 06 pp in both areas thus reversing the increasing trend of previous years
The reduction in the expenditure ratio in the euro area has been supported by a climate of low interest rates since the end of 2013 Sovereign bond yields in the euro area have fallen
Part I Current developments and prospects
15
sharply since the end of 2013 and reached historical lows in the first half of 2015 Despite some increase during the summer months yields still remain well below long-term averages As a result interest expenditure has also fallen from 29 of GDP in 2012 to 23 in 2015 and is expected to remain unchanged in 2016
Most of the decline in the revenue ratio appears to be of a structural nature while this is only partly the case on the expenditure side The drop in the structural revenue ratio is broadly identical to the change in nominal terms suggesting that the expected decline mainly reflects the impact of recent reforms in a number of Member States to lower the tax burden on labour income On the expenditure side however only 07 pp of the decline in the nominal expenditure ratio in the EU (04 pp in the euro area) is estimated to be structural This reflects the diverse nature of the main factors driving the expenditure ratio namely
the impact of the economic recovery on automatic stabilisers contained developments in public wages and lower interest expenditure On the other hand this reduction could be partly offset by additional budgetary costs associated with the arrival of a substantial number of asylum-seekers in some Member States
Despite some differences in magnitude the expenditure ratio is set to decline in a vast majority of Member States accompanied in most cases by a drop in the revenue ratio Projected cumulated changes in the revenue ratio in 2015 and 2016 range from a 68 pp decline in Denmark to a 12 pp increase in Estonia The expected changes in the expenditure ratio differ even more ranging from -103 pp in Cyprus to 17 pp in Germany Expenditures are however projected to decline as a ratio to GDP in all Member States except Estonia Greece Lithuania and Luxembourg In these four countries as well
Table I14 Government revenue and expenditures ( of GDP)
Source Commission services figures for 2015 and 2016 are from the Commissionrsquos autumn 2015 forecast
2011 2012 2013 2014 2015 2016 2011 2012 2013 2014 2015 2016BE 503 516 527 520 516 513 544 558 556 551 543 539DE 438 444 444 446 444 443 447 444 445 443 435 438EE 386 388 381 387 401 400 374 391 383 380 399 397IE 330 338 340 344 340 328 455 418 397 382 362 343EL 440 463 483 464 469 474 542 552 608 499 516 510ES 362 375 382 386 387 387 456 480 451 445 434 423FR 508 520 529 536 534 533 559 568 570 575 572 568IT 456 478 481 482 482 473 491 508 510 512 508 496
CY 368 361 365 404 396 391 425 419 414 493 403 390LV 356 361 359 356 349 346 390 369 368 371 364 357LT 335 330 329 341 346 345 425 361 356 348 357 358LU 438 447 440 438 436 439 433 446 433 424 436 434MT 383 389 400 419 423 404 409 425 426 440 440 416NL 427 432 440 439 426 418 470 471 464 462 447 433AT 483 489 496 500 502 497 508 511 509 527 521 512PT 426 429 451 445 449 442 500 485 499 517 479 471SI 434 444 453 448 448 434 500 486 603 498 477 458SK 364 360 384 389 399 374 405 401 410 416 427 398FI 533 540 550 549 549 554 544 561 576 583 581 581
EA-19 449 461 466 468 466 462 491 497 496 494 486 480BG 321 340 369 363 367 362 341 347 376 421 395 389CZ 402 405 413 406 410 404 429 445 426 426 429 418DK 548 552 558 584 525 517 568 588 571 569 558 541HR 410 417 425 426 431 432 488 471 478 482 480 479HU 443 463 470 474 471 442 497 486 495 499 494 463PL 388 389 384 388 391 388 436 426 424 421 419 416RO 337 333 330 335 354 314 391 365 352 349 366 341SE 505 507 510 501 499 501 505 517 524 518 514 513UK 392 384 392 382 384 386 469 468 449 439 428 416
EU-28 440 448 453 452 449 446 486 490 486 482 474 466
Revenue Expenditure
European Commission Public finances in EMU - 2015
16
as in Denmark and Romania the budget balance is expected to remain unchanged or to deteriorate in 2016 as compared with 2014 By contrast of the 22 Member States for which an improvement in the budget balance is foreseen 17 are expected to see both ratios decline (with the decline in expenditures exceeding that of revenues) while the other five (Spain Finland Croatia Sweden and the UK) are expected to combine a higher revenue ratio with a lower expenditure ratio
2 IMPLEMENTATION OF FISCAL SURVEILLANCE
17
The EU fiscal framework as laid down by the Stability and Growth Pact (SGP) aims at ensuring budgetary discipline through two main requirements First Member States are required by the Treaty to keep their general government deficit and debt positions not above the reference values of 3 and 60 of GDP respectively and to prompt their correction if these two criteria are temporarily not fulfilled (6) (7) Second they are required by the preventive arm of the SGP to achieve and maintain their medium-term budgetary objective (MTO) which corresponds to a cyclically-adjusted target for the budget balance net of one-offs and temporary measures (8) Country-specific MTOs are defined so as to secure the sustainability of public finances and allow the automatic stabilisers to operate without breaching the reference value for the deficit as defined in the Treaty
21 THE EXCESSIVE DEFICIT PROCEDURE
The Excessive Deficit Procedure (EDP) ensures that Member States correct their excessive deficit and debt positions measured against the reference values of 3 and 60 of GDP thus operationalising the requirements set in the Treaty (9)
(6) Article 126 TFEU lays down the Excessive Deficit
Procedure which is further specified in Council Regulation (EC) 146797 on speeding up and clarifying the implementation of the excessive deficit procedure amended in 2005 and 2011 which represents the corrective arm of the SGP Relevant legal texts and guidelines can be found at httpeceuropaeueconomy_financesgplegal_textsindex_enhtm
(7) In particular a Member State is not compliant with the debt criterion if its general government gross debt is greater than 60 of GDP and it is not sufficiently diminishing and approaching 60 of GDP at a satisfactory pace
(8) The preventive arm of the SGP is contained in Council Regulation (EC) 146697 on the strengthening of the surveillance of budgetary positions and the surveillance and coordination of economic policies which was amended in 2005 and 2011 Together with the procedure for the avoidance of excessive government deficit laid down in Article 126 TFEU further specified in Council Regulation (EC) 146797 in European Parliament and Council Regulation (EU) No 11752011 Council Regulation (EU) No 11772011 and Regulation (EU) No 11732011 on the effective enforcement of budgetary surveillance in the euro area form the SGP
(9) The concept of sufficiently diminishing and satisfactory pace is crucial in the assessment of compliance with the
This section focuses on the implementation of the EDP since the last Report on Public Finances was published in December 2014 The country-specific developments are summarised in Tables IA21-A23 in Annex I2 (10)
Currently nine Member States are in EDP two of which are under an economic adjustment programme (Cyprus and Greece)
211 Euro area Member States
While no new EDPs were opened in the course of 2015 the EDP was abrogated in the case of Malta and a new recommendation was issued to France Table I A21 shows the steps taken under the EDP for euro area countries
On 27 February 2015 on the basis of its 2015 winter forecast the Commission adopted Reports in accordance with Article 126(3) of the Treaty for Belgium Italy and Finland
In the case of Belgium the Report concluded that the estimated general government deficit of 32 of GDP in 2014 was above but close to 3 of GDP Moreover the estimated excess over the reference value which was notably due to methodological changes related to the introduction of ESA2010 and statistical clarifications could be qualified as exceptional in the meaning of the SGP and could in addition be considered as temporary On that basis the Report concluded that the deficit criterion of the Treaty was fulfilled Belgium was also projected to make insufficient progress
debt criterion for Member States whose general government gross debt is greater than 60 of GDP These requirements are specified in Regulation 146797 as being fulfilled if the differential [of the general government gross debt] with respect to the reference value has decreased over the previous three years at an average frac12th per year as a benchmark The Regulation then specified that the requirement under the debt criterion shall also be considered to be fulfilled if the budgetary forecasts of the Commission indicate that the required reduction in the differential will occur over the three-year period encompassing the two years following the final year for which data are available It further indicates that the influence of the cycle on the pace of debt reduction should be taken into account
(10) All the country-specific developments regarding the Excessive Deficit Procedure can be followed up at httpeceuropaeueconomy_financeeconomic_governancesgpcorrective_armindex_enhtm
European Commission Public finances in EMU - 2015
18
towards compliance with the debt reduction benchmark through the Minimum Linear Structural Adjustment (MLSA) during the transition period in 2014 and 2015 (11) The analysis presented in the Report suggested that following the assessment of all the relevant factors (12) the debt criterion should be considered as complied with at that stage
Similarly as regards Italy it appeared that based on both the Draft Budgetary Plan (DBP) for 2015 and the Commission 2015 winter forecast the required progress towards compliance with the debt reduction benchmark through the MLSA in the transitional period in 2014 and 2015 was neither planned nor foreseen to be fulfilled The analysis in the Report which took into consideration all the relevant factors (13) suggested that the debt criterion should be considered as complied with at that stage
Finally as for Finland on the basis of both the DBP for 2015 and the Commission 2015 winter forecast the general government gross debt was expected to stand above the reference value at 612 of GDP in 2015 The conclusions of the Report also suggested that the debt criterion should be considered as complied with at that stage owing to the fact that the plannedforecast excess of the general government gross debt over 60 of GDP in 2015 was fully explained by the countrys financial support to safeguard financial stability in the euro area (14)
(11) While the Draft Budgetary Plan of Belgium for 2015 did
not contain sufficient information to assess planned compliance with the Minimum Linear Structural Adjustment the Draft Budgetary Plan for 2015 targeted a recalculated change in the structural balance of 07 of GDP which exceeded the effort recommended by the Council in the Country-specific recommendations to Belgium of 2 June 2014 which was supposed to also ensure compliance with the Minimum Linear Structural Adjustment
(12) The set of relevant factors comprised (i) the unfavourable economic conditions which made the respect of the debt rule particularly demanding at that stage (ii) the expectation that compliance with the required adjustment towards the medium-term budgetary objective was broadly ensured and (iii) the expected implementation of ambitious growth-enhancing structural reforms in line with the authorities commitments which was expected to contribute to debt reduction in the mediumlong term
(13) Idem (14) The Report also took into consideration that the level of
general government gross debt in Finland had been influenced by (i) large purchases of financial assets by the
On 12 May 2015 on the basis of its 2015 spring forecast the Commission adopted a new Report for Finland in accordance with Article 126(3) of the Treaty which was triggered by the fact that the preliminary general government deficit had turned out above 3 of GDP at 32 of GDP in 2014 Moreover on the basis of the Stability Programme for 2016 submitted by the authorities on 2 April 2015 which was prepared under a no-policy-change assumption pending the formation of a new government the general government deficit was planned not to be below the reference value over the forecast horizon Overall the Report concluded that both the deficit and the debt criteria were not to be considered to be complied with
Following the 19 April 2015 elections the new incoming government announced fiscal policy measures to be implemented over 2016-2019 in its Strategic Programme On that basis the Commission published on 10 June 2015 an assessment of the announced measures and their budgetary impact thereby updating its initial assessment At the time of this assessment the Commission considered that the DBP for 2016 and the updated Stability Programme for 2016 to be submitted simultaneously would provide the opportunity to fully assess the fiscal policy measures envisaged by Finland in order to bring the general government deficit below 3 of GDP and to put the general government gross debt ratio on an appropriate downward path On that grounds and based on its 2015 autumn forecast the Commission therefore adopted on 16 November 2015 a new Report in accordance with Article 126(3) of the Treaty which indicated that the general government deficit was projected at 33 of GDP in 2015 but expected to fall below 3 of GDP in 2016 As a result the excess over the reference value could be considered as close and temporary while it could also be qualified as exceptional in the meaning of the SGP in 2014 but not in the period 2014-2016 For this reason the Report suggested that the deficit criterion was fulfilled Regarding the general government gross debt the Report confirmed that the planned breach of the debt criterion was still fully explained by Finlands financial support to safeguard financial
Social Security funds resulting in the accumulation of asses in parallel to the increase of debt and (ii) the effects of the countrys projected cyclical position at that stage
Part I Current developments and prospects
19
stability in the euro area in 2015 while this conclusion appeared not to hold in 2016 The Report which considered all the relevant factors and in particular the expectation that compliance with the required adjustment towards the MTO was then broadly ensured suggested that the debt criterion should also be considered as complied with at that stage
As regards France on 10 March 2015 following a Recommendation issued by the Commission in end-February according to which the available evidence minus in particular its 2015 autumn forecast minus did not allow to conclude on no effective action the Council adopted a revised Recommendation with a view to bringing an end to the excessive deficit thereby setting 2017 as the new deadline for correction In addition the Council established the deadline of 10 June 2015 for France to take effective action to comply with the Recommendation and to report in detail on the consolidation strategy that was envisaged to achieve the targets therein On 1 July 2015 based on a Report submitted by the authorities the Commission issued a Communication which concluded that the procedure was deemed to be put in abeyance as the targets for the general government deficit were expected to be fulfilled in both 2015 and 2016 even though the fiscal effort according to all metrics was projected to fall short of the recommended in those years However the Commission considered that the budgetary strategy pursued by France which relied primarily on the improving cyclical conditions and a continuation of the low-interest environment would need to be further reinforced in order to ensure a timely and durable correction of the excessive deficit
Finally concerning Malta on 19 June 2015 following a Recommendation issued by the Commission in mid-May the Council adopted a Decision abrogating the EDP as the correction of the excessive deficit had been achieved in a durable manner and the debt ratio fulfilled the forward-looking element of the debt benchmark
212 Non-euro area Member States
While no new EDPs were opened in the course of 2015 the EDP was abrogated in the case of Poland and a new recommendation was issued to the
United Kingdom Table IA22 shows the steps taken under the EDP for non-euro area countries
On 19 June 2015 following a Recommendation issued by the Commission in mid-May the Council adopted a Decision abrogating the EDP of Poland Even though its preliminary general government deficit amounted to 32 of GDP in 2014 above the reference value of the Treaty Poland was eligible to the specific provisions regarding systemic pension reforms (15) Although Poland had in December 2013 reversed a pension reform introduced in 1999 the net costs of this reform continued until the end of July 2014 (16) and were estimated at 04 of GDP which was sufficient to explain the excess over the reference value in 2014 Moreover on the basis of the Commission 2015 spring forecast the correction of the excessive deficit was deemed to be durable Also on 19 June 2015 following a Recommendation by the Commission issued in mid-May the Council adopted a Decision establishing that the United Kingdom had not taken effective action in response to the Council Recommendation of 2 December 2009 in the light of a general government deficit of 52 of GDP in 2014-15 notified to Eurostat and non-adherence to the recommended average fiscal effort of 1frac34 of GDP over the EDP period Therefore on that same date the Council adopted a new Recommendation
(15) The provisions regarding systemic pension reforms are laid
down in Article 2(7) of Regulation (EC) 146797 according to which [in] the case of Member States where the excess of the deficit over the reference value reflects the implementation of a pension reform introducing a multi-pillar system that includes a mandatory fully funded pillar the Council and the Commission shall also consider the cost of the reform when assessing developments of deficit figures in excessive deficit procedures as long as the deficit does not significantly exceed a level that can be considered close to the reference value and the debt ratio does not exceed the reference value provided that overall fiscal sustainability is maintained
(16) According to the specifications on the implementation of the Stability and Growth Pact and guidelines on the format and content of Stability and Convergence Programmes of 3 September 2012 [the] net cost of the reform is measured as its direct impact on the general government deficit This impact stems from the fact that revenue which used to be recorded as government revenue is diverted to a pension fund which is fully-funded and classified in a sector other than general government and that some pensions and other social benefits which used to be government expenditure will be after the reform paid by the pension scheme Thus net costs do not include interest expenditure that is linked to the higher accumulation of debt due to forgone social contributions or other revenues
European Commission Public finances in EMU - 2015
20
defining 2016-17 as the new deadline for correction of the excessive deficit In addition the Council set the deadline of 15 October 2015 for the United Kingdom to take effective action and report in detail the consolidation strategy that was envisaged to achieve the targets Subsequently on the basis of a report submitted by the authorities and its 2015 autumn forecast the Commission adopted a Communication on 16 November 2015 according to which the procedure for the United Kingdom could be put in abeyance since the targets for both the general government deficit and the underlying improvements in the structural balance were projected to be fulfilled over the EDP period
On 16 November 2015 on the basis of its 2015 autumn forecast the Commission also adopted Reports in accordance with Article 126(3) of the Treaty for Bulgaria and Denmark
In the case of Bulgaria the provisional general government deficit reached 58 of GDP in 2014 above and not close to 3 of GDP The excess over the reference value was assessed as temporary and could be qualified as exceptional in the meaning of the SGP as it was largely driven by the sizeable support to the financial sector minus amounting to about 3 of GDP Therefore the Report suggested that the deficit criterion could be considered as complied with
As for Denmark the general government deficit was planned to reach 33 of GDP in 2015 above but close to 3 of GDP The excess over the reference value was considered as temporary as the general government deficit was projected to return to below 3 of GDP as of 2016 and exceptional in the meaning of the SGP given that it resulted from extraordinary and unexpected losses in tax revenue in the period 2013-2015 related to technical errors in an automatic tax collection system On that basis the Report suggested that the deficit criterion was fulfilled
22 THE EUROPEAN SEMESTER AND THE FISCAL COUNTRY -SPECIFIC RECOMMENDATIONS
Member States submitted the 2015 Stability or Convergence Programmes (SCPs) in April this
year thereby bringing their medium-term fiscal plans up to date (17)
In their 2015 programmes Member States projected growth to strengthen in 2015 and 2016 with SCPs expecting positive real growth in 2015 in all Member States and with an output gap projected to shrink in 2015 and 2016 in both the euro area and the EU These projections are in line with the Commission 2015 autumn forecast ndash with the exception of Greece ndash which also confirms the relative expansion of internal demand a positive indication for some tax-richness of growth
All Member States planned a deficit below the 3 threshold by the end of the programme period while the general government deficit both at the euro area level and the EU was expected to remain below 3 of GDP in 2015 Moreover debt was set to start decreasing after a peak in 2015 driven by a reversed snowball effect and the achievement of primary surpluses The beginning in the decrease of debt ratios in 2015 is confirmed by the Commission 2015 autumn forecast as presented in Chapter I1
A significant slowdown in the pace of fiscal consolidation was already planned in the SCPs with the cumulative improvement in the structural balance over the programme horizon amounting to 04 of GDP in the euro area and 11 of GDP in the EU Overall for 2016 some moderate fiscal consolidation was planned in the 2015 programmes However in the euro area specifically this was no longer the case on the basis of both the SCPs and the DBPs presented in October (see Section I23 below) Fiscal consolidation was planned to resume at a moderate pace in the period 2017-2018 at around one quarter of GDP per year in both the euro area and the EU
Overall the 2015 SCPs planned to reduce revenues by about 12 percentage points of GDP over the programmes period and to reduce expenditures by around 2 percentage points of GDP in both areas with the composition public finances being slightly less biased against public investment than in the past However a substantial part of the expenditure effort projected for both the euro area
(17) For an overview of Member States plans see European
Commission (2015b)
Part I Current developments and prospects
21
and the EU was expected to stem from reduced interest payments
The broad picture of structural adjustment at the aggregate level masks considerable differences across Member States with the programmes of several individual Member States not at their country-specific MTO falling short of the requirements under the SG
On 14 July 2015 the Council adopted Country-Specific Recommendations (CSRs) and Opinions on economic employment and fiscal policies planned by Member States based on the information provided in the 2015 SCPs (and in the National Reform Programmes) thereby formally concluding the annual policy monitoring process entailed by the 2015 European Semester (18) The 2015 CSRs were addressed to 26 of the EUs 28 Member States and to the euro area as a whole To avoid duplication there were no CSRs for Greece and Cyprus as these were both still subject to economic adjustment programmes
In the area of fiscal policy Member States were invited to comply with the requirements of the SGP The Member States in EDP were recommended to ensure the timely and durable correction of their excessive deficits by fully implementing and where necessary reinforcing the planned budgetary strategies The Member States in the preventive arm of the SGP were recommended to ensure sufficient progress towards or stay at their country-specific MTOs with each Recommendation providing guidance on the specific structural adjustment to be delivered in 2015-2016 Where available Member States were also invited to use windfall gains to make further progress towards putting the general government debt-to-GDP ratios on an appropriate downward path Some general guidelines to achieve these goals included increasing the efficiency and control of public spending enhancing the efficiency of the tax system and broadening the tax base increasing the efficiency of tax compliance revising tax expenditures and cadastral values improving the coordination across sub-sectors of general government and strengthening medium-term budgetary frameworks
(18) An overview of the 2015 European Semester can be found
athttpeceuropaeueurope2020making-it-happencountry-specific-recommendations
All in all the 2015 CSRs aimed at adapting public finances to make them more supportive to growth while ensuring that Member States pursue responsible fiscal policies in line with the requirements of the SGP
Table IA24 provides an overview of the Country-specific Opinions and Recommendations in the area of fiscal policy that the Council issued in July
23 CLOSING THE FISCAL SURVEILLANCE CYCLE IN THE EURO AREA DRAFT BUDGETARY PLANS
This autumn marks the third time that the Commission carried out an assessment of the DBPs for the forthcoming year This monitoring procedure was introduced by the Two-Pact with the aim of enhancing the surveillance and coordination of budgetary and economic policies within the euro area
Every year most euro area Member States are thereby expected to submit their DBPs to the Commission and to the Eurogroup by the statutory deadline of 15 October 2015 (19) (20) However given that economic adjustment programmes per se already imply close fiscal monitoring Greece and Cyprus were exempted from submitting DBPs for 2016 (21) All the remaining euro area Member States complied with the requirement with the exception of Portugal which did not submit a plan as prescribed by the legislation
The overall picture emerging from the analysis of the sixteen euro area DBPs for 2016 is mixed
(19) In respect of the deadline and requirements laid down by
Article 6 of Regulation (EU) 4732013 (20) In particular in view of forthcoming general elections
Spain submitted its Draft Budgetary Plan for 2016 on 11 September 2015 significantly ahead of the deadline of 15 October Therefore to underpin its assessment the Commission prepared an ad-hoc forecast with a cut-off date of 29 September 2015
(21) Regulation (EU) 4722013 put forward the legal basis ensuring consistency between the fiscal surveillance framework laid down in the Stability and Growth Pact and the programme policy conditionality for euro area Member States under an economic adjustment programme On that basis during the programme the monitoring of compliance with the Stability and Growth Pact takes place within the regular programme surveillance provided for by Article 7(4) of the Regulation and is based on the concerned Member States complying with the specific policy requirements contained in its programme
European Commission Public finances in EMU - 2015
22
in line with Chapter I1 the plans confirm that the economic recovery is progressing although subject to a number of downside risks with GDP projections broadly in line with those of the spring and a continuing decrease in the general government deficit in the euro area to 17 of GDP in 2016 This is reflected in a planned neutral fiscal stance again in line with Member States projections in the spring
On the basis of the DBPs themselves the Commission did not identify any case of particularly serious non-compliance with the provisions of the SGP (22) Notwithstanding there were some DBPs according to which the planned fiscal efforts is clearly insufficient in view of the existing imbalances That is why the assessments of the DBPs flagged different degrees of risk and requested where needed appropriate action by the Member States in order to ensure compliance with the SGP
In order to provide benchmarks for the Opinions of the Commission DBPs were allocated to three categories depending on the strength of Member States compliance with their obligations vis-agrave-vis the SGP (i) compliant (ii) broadly compliant and (iii) at risk of non-compliance These categories have a different meaning depending on whether the concerned Member State is under the preventive or the corrective arm of the SGP
Five DBPs were found to be compliant with the provisions of the SGP These were submitted (22) The following non-exhaustive list of situations in which
particularly serious non-compliance could be found is presented in the specifications on the implementation of the Two-Pact and guidelines on the format and content of draft budgetary plans economic partnership programmes and debt issuance reports (i) if an obvious breach of the criteria laid down in Article 126(2) of the TFEU would follow from the implementation of the DBP (ii) for Member States in the preventive arm of the SGP if the fiscal effort envisaged in the DBP falls clearly short of the fiscal effort recommended by the Council in accordance with existing Council recommendation issued in accordance with Article 121(4) of the TFEU (iii) for Member States in the corrective arm of the SGP if the fiscal effort envisaged in the DBP ie the forecast change in the structural balance falls clearly short of the recommended fiscal effort by the Council in accordance with Article 126(7) or 126(9) of the TFEU (iv) where the implementation of the initial budgetary plan would put at risk the financial stability of the Member State concerned or risk jeopardizing the proper functioning of the economic and monetary union
by the following Member States under the preventive arm minus Germany Estonia Luxembourg the Netherlands and Slovakia For these Member States there was no need to adapt the plans within the national budgetary procedure to ensure compliance with the rules of the SGP
By the same token concerning the DBPs submitted by the remaining countries the Commission considered that the planned fiscal effort risked falling short of what is required by the SGP As a result the Commission invited the authorities of the remaining eleven countries to take the necessary measures within their national budgetary processes in order to ensure that the 2016 budgets wold be compliant with the SGP
In further detail the DBPs of seven countries were found to be broadly compliant with the SGP This concerned minus Ireland Slovenia and France minus currently under the corrective arm of the SGP minus and Belgium Latvia Malta and Finland minus under the preventive arm In the case of France while the targets for the general government deficit in years 2015 and 2016 were projected to be met on the basis of the Commission 2015 autumn forecast the fiscal effort was projected to fall significantly short of the recommended level according to all metrics For the remaining Member States the Commission considered that the plans might result in some deviation from the required adjustment path towards the respective country-specific MTOs in 2016
Finally the DBPs of four countries were found to be at risk of non-compliance with rules of the SGP This was the case of Spain minus under the corrective arm of the SGPminus as well as of Italy Austria and Lithuania minus under the preventive arm Spain was not expected to ensure compliance with the targets set in the Council Recommendation of 21 June 2013 for the general government deficit and the change in the structural balance in years 2015 and 2016 (23) Similarly the
(23) In light of the compliance risks and the fact that the Draft
Budgetary Plan did not include up-to-date and fully specified measures for regional governments the national authorities were also invited by the Commission to submit an updated plan including fully-specified regional measures as soon as possible The new Draft Budgetary Plan should take into account the Commission Opinion of 12 October 2015 in order to fully comply with the Stability and Growth Pact
Part I Current developments and prospects
23
DBPs of Italy (24) Austria (25) and Lithuania might result in a significant deviation from the required adjustment path towards the respective country-specific MTOs
Tables I21a and I21b provide overviews of individual Commission Opinions on the DBPs of Member States currently under the preventive and corrective arm of the SGP respectively
(24) In its Opinion the Commission conveyed its intention to
continue to closely monitor Italys compliance with the obligations under the Stability and Growth Pact notably in connection with the assessment of the next Stability Programme In the context of the overall assessment of a possible deviation from the adjustment path towards the Medium-term Budgetary Objective the Commission will take into account the above considerations on Italys possible eligibility for flexibility under the Stability and Growth Pact Particular attention will be paid to whether a deviation from the adjustment path is being effectively used for the purposes of increasing investments to the existence of credible plans for the resumption of the adjustment path towards the Medium-term Budgetary Objective and to progress with the structural reform agenda taking into account the Council Recommendations
(25) However if the current estimate of the increase in refugee-related expenditure were excluded the assessment would point to a risk of some deviation from the Medium-term Budgetary Objective
European Commission Public finances in EMU - 2015
24
Table I21a Overview of individual Commission Opinions on the DBPs ndash Member States currently under the preventive arm of the SGP
Source The Report in accordance Article 126(3) of the TFEU of 27 February 2015 concluded that the debt criterion should be considered as complied with at that time In case the current estimate of the budgetary impact of the exceptional inflow of refugees would be excluded from the assessment the projected deviation from the recommended adjustment path would no longer be significant As the notified deficit for 2014 and the planned deficit and debt for 2015 were above the Treaty reference values the Commission issued a Report in accordance with Article 126(3) of the TFEU on 16 November 2015 concluding that both the deficit and the debt criteria should be considered as complied with
Part I Current developments and prospects
25
Table I21b Overview of individual Commission opinions on the DBPs ndash Member States currently under the corrective arm of the SGP
Source Commission services The country is currently under the corrective arm but could move to the preventive arm from 2016 if a timely and sustainable correction is achieved The Commission adopted an Opinion on Spains DBP on 12 October Portugal did not submit a DBP for 2016 by 15 October
ANNEX 1 ASSUMPTIONS UNDERLYING THE ASSESSMENT OF FISCAL STANCE
26
Gap to the debt-
stabilizing primary balance
Cost of delaying
adjustment
BE 34 -05 04 32 02DE -13 -26 -02 07 08EE -36 -04 -04 -33 05IE 39 -09 05 27 16EL 88 00 13 84 -09ES 16 -01 02 26 -11FR 38 08 05 24 00IT 24 -21 03 46 -03
CY 01 -20 00 28 -07LV -14 06 -02 -14 -04LT 03 -01 00 -10 13LU -32 -14 -04 -28 14MT 04 -10 00 04 09NL -07 -05 -01 06 -07AT 02 -20 00 18 04PT 35 -17 05 42 05SI 26 01 04 15 06SK -05 00 -01 -05 01FI 27 05 04 02 17
EA 14 -11 02 22 01
S1 (2015
scenario)
Due to
Initial budgetary position
Debt requirement
Ageing costs
This annex provides more detailed information on the methodology underlying the assessment of the fiscal stance in the euro area as a whole and in individual euro area Member States that is presented in Chapter I1
The calculations are based on the Commissions autumn 2015 forecast
The projected fiscal stance is assessed against both long-term sustainability needs and short-term macroeconomic stabilisation needs Long-term sustainability needs are reflected in the fiscal adjustment required to put or maintain public debt on a sustainable path while macroeconomic stabilisation is defined as the need to ensure that the output gap closes at an appropriate pace Simple and transparent calculations are used to estimate illustrative changes in the structural primary balance (SPB) implied by each of these two types of needs
A11 CALCULATION OF THE INDICATIVE STRUCTURAL PRIMARY EFFORT IMPLIED BY SUSTAINABILITY NEEDS
Long-term sustainability requires that public debt is put and maintained on a sustainable path taking into account the current level of debt and projected future expenditures related to population ageing This is measured by the S1 indicator under the so-called 2015 scenario which indicates what cumulative change in the SPB over the period 2016-2020 would be needed to bring debt to 60 of GDP by 2030 based on the Commission forecast and taking the 2015 structural primary balance as a baseline Table IA11 reports the value of S1 under this scenario for all the euro area Member States and for the euro area as a whole as well as the breakdown of S1 as background information
To compute the indicative the change in the SPB implied by the sustainability needs of the various Member States a slightly frontloaded adjustment is assumed with 25 of this total effort (therefore S1 divided by four) to be achieved in 2016 This is reported under Sustainability needs in Table I A12
Table IA11 Total fiscal adjustment needed in 2016-2020 according to the S1 indicator (as of GDP)
Source Commission services
A12 CALCULATION OF THE INDICATIVE STRUCTURAL PRIMARY EFFORT IMPLIED BY STABILISATION NEEDS
Macroeconomic stabilisation is defined as the need to ensure that the output gap closes at an appropriate pace in the short to medium term For this purpose a reduction of the output gap by 25 in one year is considered in line with the assumption that length of an average half cycle is about four years A more ambitious reduction by 50 is also envisaged to provide some sensitivity analysis of fiscal policy with respect to stabilisation targets This is also motivated by the fact that in the euro area as a whole the output gap has been negative since 2009
The change in the SPB implied by these stabilisation needs ndash ie the one that would be needed to reduce the output gap by a certain proportion compared to its level of 2015 ndash is equal to the change in the SPB projected in the Commission forecast for 2016 (ΔSPBbaseline) minus the difference between the considered change in the output gap (ΔOG) and the projected change in the output gap (ΔOGbaseline) divided by the fiscal multiplier micro
Part I Current developments and prospects
27
SUSTAINABILITY NEEDS
EA 02 -04 03 -02 -18 07 06LU 03 -02 -08 02 -15 04 06DE -04 -05 -03 -03 -04 01 -02NL 04 -01 -02 -04 -16 10 07SK 00 -03 -01 00 -12 03 03CY 14 03 00 -04 -36 24 21AT -02 -06 01 -05 -12 05 01ES 12 00 04 -03 -39 22 19IT 02 -07 06 -07 -29 14 09SI 13 11 06 02 -05 11 12FI 00 -07 07 02 -25 05 07BE 00 -02 08 03 -09 01 03PT -03 -10 09 -09 -23 11 04FR 02 -03 09 04 -18 03 06EL -06 -31 22 06 -79 10 15EE -01 00 -09 -01 05 -01 -02LV 10 15 -03 02 17 02 04LT 03 04 01 -03 04 03 01MT 07 09 01 02 06 02 04IE 11 15 10 06 12 01 06
STABILISATION NEEDSChange in the SPB consistent
with a reduction of
the OG by 25
Change in the SPB consistent
with a reduction of
the OG by 50
Change in the SPB implied by the
sustainability needs
COMMISSION FORECAST
Change in the SPB in
2016(ΔSPB baseline )
OG in 2015ΔOG in 2016(ΔOG baseline )
Recalculated ΔOG in 2016 with ΔSPB=0
(ΔOGdeg )
ΔSPB = ΔSPB baseline ndash (ΔOG - ΔOGbaseline)micro
where micro is assumed to be equal to 08 which seems reasonable in the current environment ΔSPBbaseline and ΔOGbaseline are reported in Table IA12 under Commission forecast Two measures of ΔSPB corresponding to reductions by 25 and 50 are reported in the same table under Stabilisation needs
A13 AN ALTERNATIVE TARGET FOR STABILISATION NEEDS
An alternative way to envisage stabilisation needs is to compute the change in the SPB that would be needed to further reduce the output gap (by eg 25) in addition to the projected change in the output gap if there were no fiscal effort Indeed given that macroeconomic policy instruments are currently constrained with nominal interest rates close to the zero limit in a very low inflation
environment this context places further emphasis on the importance of fiscal policy to stabilise the economy
The first step is to correct the Commission forecast for the impact of the projected fiscal stance This requires calculating the change in the output gap under a zero-fiscal-effort scenario ndash ie assuming no change in the SPB ndash and given a certain value of the fiscal multiplier All the other assumptions in the forecast remain however unchanged
Concretely this is done as follows taking the example of the euro area The change in the output gap that is projected in the baseline scenario of the Commission forecast (ΔOGbaseline = 07 of GDP in 2016) already includes the impact of the projected change in the SPB (ΔSPBbaseline = -02 of GDP ie a negative effort which has a positive impact on GDP) To correct for the impact of the fiscal stance we add back to the projected change in the output gap the change in the SPB multiplied
Table IA12 Change in the SPB implied by stabilisation and sustainability needs and in the Commission forecast (as of GDP)
Source Commission services Note For consistency the Member States are listed in the same order as in Graph I14 of Chapter I1 ie grouped according to the sign of their output gap in 2015 and then sorted by increasing sustainability needs
European Commission Public finances in EMU - 2015
28
ΔSPBBE -02DE -02EE 01IE 06EL -20ES -06FR -04IT -06CY -05LV 06LT 02LU -03MT 03NL -03AT -03PT -06SI 02SK -03FI -06EA-19 -04
by the fiscal multiplier micro We thus calculate the change in the output gap that would result from no change in the SPB all other assumptions remaining unchanged
ΔOGdeg = ΔOGbaseline + ΔSPBbaseline micro
Here ΔOGdeg = 06 corresponding to an output gap improving from -18 of GDP in 2015 to -12 in 2016 ΔOGdeg is reported for all Member States in Table AI2 under Commission forecast
The second step is to compute the change in the SPB as defined under the alternative stabilisation scenario For the euro area this scenario consists in reducing the output gap by an additional 25 compared to -12 of GDP ie to -09 of GDP The corresponding change in the SPB is equal to the output gap in 2016 assuming no fiscal effort (ie the output gap in 2015 OG2015 plus the change in the output gap assuming no fiscal effort ΔOGdeg) divided by the fiscal multiplier micro and multiplied by the additional correction considered ie 25
ΔSPB = 025 (OG2015 + ΔOGdeg)micro
This is found to require a fiscal loosening by 04 of GDP in terms of change in the SPB for the euro area as a whole The computations for all euro area Member States are reported in Table IA13
Table IA13 Change in the SPB implied by an alternative computation of stabilisation needs (as of GDP)
Source Commission services Note ΔSPB is the change in the SPB consistent with a further reduction of the output gap in 2016 by 25 in addition to the implicit change in the output gap assuming zero fiscal effort as recalculated on the basis of the Commissions autumn 2015 forecast
AN
NEX 2 O
VERV
IEW O
F EDP STEPS A
ND
CO
UNTRY-SPEC
IFIC
FISCA
L RECO
MM
END
ATIO
NS
29
Table IA
21 O
verview E
DP
steps - Eu
ro area Mem
ber S
tates
Source C
omm
ission services
p
Treaty Art
IE FR ES LV MT LT BE DE IT NL AT PT SI SK CY FI MT
Commission adopts EDP-report = start of the procedure 126(3) 18022009 18022009 18022009 18022009 13052009 13052009 07102009 07102009 07102009 07102009 07102009 07102009 07102009 07102009 12052010 12052010 21052013Economic and Financial Committee adopts opinion 126(4) 27022009 27022009 27022009 27022009 29052009 29052009 27102009 27102009 27102009 27102009 27102009 27102009 27102009 27102009 27052010 27052010 21062013Commission adopts opinion on existence of excessive deficit 126(5) recommendation for Council decision on existence of excessive deficit 126(6) recommendation for Council recommendation to end this situation 126(7)Council adopts decision on existence of excessive deficit 126(6) recommendation to end this situation 126(7) deadline for correction of excessive deficit 2013 2012 2012 2012 2010 2011 2012 2013 2012 2013 2013 2013 2013 2013 2012 2011 2014
Commission adopts communication on action taken 27012010 15062010 15062010 15062010 15062010 15062010 15062010 15062010 15062010 27012011 27012011 15112013Commission adopts recommendation for NEW Council recommendation to end situation of excessive deficit
126(7)11112009 11112009 11112009 27012010 27012010 29052013 27092012
Council adopts recommendation for NEW Council recommendation to end situation of excessive deficit
126(7)02122009 02122009 02122009 16022010 16022010 21062013 09102012
new deadline for correction of excessive deficit 2014 2013 2013 2011 2012 2014 2014
Commission adopts communication on action taken 15062010 15062010 15062010 06012011 21092010 11012012 15112013 11012012Commission adopts recommendation for Council decision establishing inadequate action
126(8)29052013
Council adopts decision establishing inadequate action 126(8) 21062013Commission adopts recommendation for a Council decision to give notice 126(9) 29052013Council adopts decision to give notice 126(9) 21062013Commission adopts recommendation for NEW Council recommendation to end situation of excessive deficit
126(7)03122010 29052013 06072012 29052013 29052013 07052013
Council adopts recommendation for NEW Council recommendation to end situation of excessive deficit
126(7)07122010 21062013 10072012 21062013 21062013 16052013
new deadline for correction of excessive deficit 2015 2015 2014 2013 2015 2015 2016
Commission adopts communication on action taken 24082011 15112013 14112012 15112013 15112013 06092013Commission adopts recommendation for NEW Council recommendation to end situation of excessive deficit
126(7)27022015 29052013
Council adopts recommendation for NEW Council recommendation to end situation of excessive deficit
126(7)10032015 21062013
new deadline for correction of excessive deficit 2017 2016
Commission adopts communication on action taken 01072015 15112013
Commission adopts recommendation for Council decision abrogating existence of excessive deficit
126(12) 29052013 14112012 29052013 02062014 30052012 29052013 02062014 02062014 02062014 29062011 12052015
Council adopts decision abrogating existence of excessive deficit 126(12) 21062013 04122012 21062013 20062014 22062012 21062013 20062014 20062014 20062014 12072011 19062015
24062009
07072009 02122009 1307201007072009 02122009 02122009 02122009 13072010
29052013
21062013
15062010 1506201011112009
02122009 02122009 02122009 02122009
11112009 11112009 11112009 11112009 11112009
Steps in EDP procedure
Follow-up
Member State
02072009
07072009
24062009 11112009 1111200924032009
27042009
Abrogation
27042009
Starting phase
24032009
27042009
24032009
European Commission Public finances in EMU - 2015
30
Treaty Art
HU UK PL RO CZ BG DK HR
Commission adopts EDP-report = start of the procedure 126(3) 12052004 11062008 13052009 13052009 07102009 12052010 12052010 15112013Economic and Financial Committee adopts opinion 126(4) 24052004 25062008 29052009 29052009 27102009 27052010 27052010 29112013Commission adopts opinion on existence of excessive deficit 126(5) recommendation for Council decision on existence of excessive deficit 126(6)recommendation for Council recommendation to end this situation 126(7)Council adopts decision on existence of excessive deficit 126(6) recommendation to end this situation 126(7) deadline for correction of excessive deficit
2008 fin year 200910 2012 2011 2013 2011 2013 2016
Commission adopts communication on action taken 03022010 15062010 27012011 27012011 02062014Commission adopts recommendations for Council decision establishing inadequate action
126(8)22122004 24032009
Council adopts decision establishing inadequate action 126(8) 18012005 27042009Commission adopts recommendation for NEW Council recommendation to end excessive deficit situation
126(7)16022005 24032009 08022010
Council adopts NEW recommendation to end excessive deficit situation 126(7) 08032005 27042009 16022010 new deadline for correction of excessive deficit 2008 fin year
201314 2012
Commission adopts communication on action taken 13072005 11012012 21092010Commission adopts recommendations for Council decision establishing inadequate action
126(8)20102005
Council adopts decision establishing inadequate action 126(8) 08112005Commission adopts recommendation for NEW Council recommendation to end excessive deficit situation
126(7)26092006 11112009
Council adopts NEW recommendation to end excessive deficit situation 126(7) 10102006 02122009 new deadline for correction of excessive deficit 2009 fin year
201415Commission adopts communication on action taken 13062007 06072010Commission adopts recommendations for Council decision establishing inadequate action
126(8)12052015
Council adopts decision establishing inadequate action 126(8) 19062015Commission adopts recommendation for NEW Council recommendation to end excessive deficit situation
126(7)24062009 12052015 29052013
Council adopts NEW recommendation to end excessive deficit situation 126(7) 07072009 19062015 21062013 new deadline for correction of excessive deficit 2011 fin year
201617 2014
Commission adopts communication on action taken 27012010 16112015Commission adopts recommendations for Council decision establishing inadequate action
126(8)11012012 15112013
Council adopts decision establishing inadequate action 126(8) 24012012 10122013Commission adopts recommendation for NEW Council recommendation to end excessive deficit situation
126(7)06032012 15112013
Council adopts NEW recommendation to end excessive deficit situation 126(7) 13032012 10122013 new deadline for correction of excessive deficit 2012 2015
Commission adopts communication on action taken 30052012 02062014
Commission adopts recommendation for Council decision abrogating existence of excessive deficit 126(12)
29052013 12052015 29052013 02062014 30052012 02062014
Council adopts decision abrogating existence of excessive deficit 126(12) 21062013 19062015 21062013 20062014 22062012 20062014
Abrogation
Steps in EDP procedure
Starting phase
Follow-up
0207200824062004 24062009 11112009 06072010
Member State
24062009
21012014
15062010 10122013
05072004 08072008 07072009 07072009 02122009 13072010 13072010
Table IA22 Overview EDP steps - Non-euro area Member States
Source Commission services
Part I Current developments and prospects
31
Treaty Art
Greece
Commission adopts EDP-report = start of the procedure 126(3) 18022009Economic and Financial Committee adopts opinion 126(4) 27022009Commission adopts opinion on existence of excessive deficit 126(5) recommendation for Council decision on existence of excessive deficit 126(6) recommendation for Council recommendation to end this situation 126(7)Council adopts decision on existence of excessive deficit 126(6) recommendation to end this situation 126(7) deadline for correction of excessive deficit 2010
Commission adopts recommendations for Council decision establishing inadequate action
126(8) 11112009
Council adopts decision establishing inadequate action 126(8) 02122009Commission adopts Council recommendation for decision to give notice 126(9) 03022010Council decision to give notice 126(9) 16022010 new deadline for correction of the excessive deficit 2012
Commission adopts communication on action taken 09032010Council adopts conclusions thereon 16032010Commission adopts recommendation for NEW Council decision to give notice 126(9) 04052010Council decision to give notice 126(9) 10052010 new deadline for correction of the excessive deficit 2014
Commission adopts communication on action taken 19082010Commission adopts recommendation for Council decision amending the Council decision to give notice 126(9) 19082010Council decision amending the Council decision to give notice 126(9) 07092010
Commission adopts communication on action taken 09122010Commission adopts recommendation for Council decision amending the Council decision to give notice 126(9) 09122010Council decision amending the Council decision to give notice 126(9) 20122010
Commission adopts communication on action taken 24022011Commission adopts recommendation for Council decision amending the Council decision to give notice 126(9) 24022011Council decision amending the Council decision to give notice 126(9) 07032011
Commission adopts communication on action taken 01072011Commission adopts recommendation for Council decision amending the Council decision to give notice 126(9) 05072011Council decision amending the Council decision to give notice 126(9) 12072011
Commission adopts communication on action taken 26102011Commission adopts recommendation for Council decision amending the Council decision to give notice 126(9) 26102011Council decision amending the Council decision to give notice 126(9) 08112011
Commission adopts communication on action taken 09032012Commission adopts recommendation for Council decision amending the Council decision to give notice 126(9) 09032012Council decision amending the Council decision to give notice 126(9) 13032012
Commission adopts communication on action taken 30112012Commission adopts recommendation for Council decision amending the Council decision to give notice 126(9) 30112012Council decision amending the Council decision to give notice 126(9) 04122012 new deadline for correction of the excessive deficit 2016
Follow-up - Second Adjustment Programme
Follow-up - 1st review
Follow-up
Follow-up - Second Adjustment Programme
24032009
27042009
Steps in EDP procedure
Starting phase
Follow-up - 5th review
Follow-up - 2nd review
Follow-up - 3rd review
Follow-up - 4th review
Table IA23 Greece
Source Commission services
European Commission Public finances in EMU - 2015
32
Table IA24 Overview of Council Country-Specific Recommendations relating to fiscal policy
(Continued on the next page)
Part I Current developments and prospects
33
Table (continued)
(Continued on the next page)
European Commission Public finances in EMU - 2015
34
Table (continued)
Source Commission services
Part II Recent developments in fiscal surveillance
1 INTRODUCTION
36
Member States that exit the Excessive Deficit Procedure automatically fall under the lsquopreventive armrsquo of the Stability and Growth Pact (SGP) which requires a convergence towards a sound Medium-Term budgetary Objective (MTO) in order to secure long-term sustainability of public finances As shown in Part I a majority of Member States have reduced their government deficit below the 3 threshold and moved to the preventive arm of the SGP in the recent years The preventive arm aims at making use of periods when the economy is strong to improve sustainability and bring government finances to a situation in which automatic stabilisers have the room to fully play their role without entailing a breach of the 3 threshold In order to secure this objective Member States have to improve their structural budget to attain the lsquomedium-term budgetary objectiversquo or MTO In addition since the reform of the Stability and Growth Pact in 2011 Member States have to implement the Treaty requirement that government debt in excess of 60 of GDP must be reduced
Subsequent to the 2011 reform the Commission published a Communication on flexibility within the SGP in January 2015 (26) In this Communication the Commission provided an interpretation on the degree of flexibility in the existing rules of the preventive arm of the SGP Firstly the Commission decided that the preventive arm of the SGP needed to take better account of the economic cycle in individual Member States In that sense the Commission provided an operationalization of the provision of article 5 of Regulation (EC) No 146697 according to which the rate at which the Member State is required to reach its MTO is determined according to its economic situation
In this Communication the Commission provided an operationalization of the provision of the structural reform and investment clauses also contained in article 5 of Regulation (EC) No 146697 Improving long-term sustainability mdash the main objective of the preventive arm mdash indeed requires more than the implementation of sound budgetary policy on a year-by-year basis Investments and structural reforms are also needed
(26) COM(2015) 12 of 13 January 2015
to bring government finances under control and to boost potential growth
The two clauses are presented in Chapter II4 below These clauses provide incentives for Member States to
bull introduce structural reforms and
bull protect investments that potentially have the same effects as structural reforms in difficult economic times In this respect Member States are encouraged to make investments linked to national expenditure on projects co-funded by the EU under the Structural and Cohesion policy including the Youth Employment Initiative Trans-European Networks and Connecting Europe Facility and under the new European Fund for Strategic Investments (EFSI)
The structural balance is the main common analytical tool for measuring a countryrsquos budgetary situation and the convergence towards the MTO Both the MTO and the fiscal targets set in Council recommendations relate to the structural balance Since 2005 the Commission and the Member States have agreed that the structural balance is calculated by deducting the cyclical component one-off measures and other temporary measures from the deficit ratio The strengths and weaknesses of the cyclical correction and the usefulness of parallel indicators when assessing fiscal policy measures adopted are discussed in the 2013 Public Finance Report Chapter II3 presents the practice of implementation of the concept of one-off measures
In 2006 (27) the Commission introduced a number of transparent rules for determining whether or not the measures taken by the government should be classified as one-off In particular
i) one-off measures have a transitory budgetary effect that does not lead to a sustained change in the budgetary position
(27) European Commission (2006)
Part II Recent development in fiscal surveillance
37
ii) as a rule deliberate policy actions that increase the deficit do not qualify as one-offs
The rationale for removing the impact of one-off measures when assessing a Member Statersquos budgetary position has been to better identify underlying trends and in particular to provide incentives to policymakers to pursue fiscal consolidation on the basis of measures that lead to a sustained improvement of government finances Chapter II3 provides a picture of the existing practice on the treatment of one-offs to take into account a decade of case-law and to clarify how this treatment has been adapted to changes to statistical procedures in particular the introduction of the new ESA2010 national accounting system which entered into force in autumn 2014 Although decisions still require some degree of judgement there are a number of guiding principles the Commission applies when assessing the one-off nature of measures These are presented in Section II32 The following sections explain how the main stylised cases are treated based on the guiding principles and past decisions
Although sustainability can be assessed ex ante on the basis of explicit government liabilities such as government debt implicit and contingent liabilities are also a major risk to government finances It is therefore necessary to develop an understanding of the potential losses that government finances could suffer The 2011 reform introduced a reporting requirement designed to make this possible (28) The implicit liabilities related to population ageing are relatively predictable and can therefore be taken into account when implementing the preventive arm (29) Other implicit liabilities which have a very uncertain impact on government finances cannot however be explicitly taken into account in the debt figure An example of this type of liability is potential government intervention in the banking sector in times of crisis There are only model-based estimates available for the potential cost to the government sector of implicit liabilities
(28) See Article 14 of Council Directive 201185EU of
8 November 2011 on requirements for budgetary frameworks of the Member States (OJ L 306 23112011 p 41)
(29) The definition of the MTO takes into account projected ageing-related costs (see Box II21)
of this kind being realised and these estimates depend on a large number of assumptions (30)
The value of contingent liabilities can be assessed with more precision even if the likelihood of a particular liability being realised is too difficult to estimate to require Member States to account for these liabilities as government debt It is however necessary to monitor such liabilities in order to have an accurate picture of the long-term sustainability of government debt For this reason the Six-Pack (31) imposed reporting obligations on Member States and Eurostat has started collecting data on some liabilities of this type These include
minus guarantees issued by the government which can be called if the original borrower is not in a position to repay the debt
minus the financial liabilities of state-controlled entities the government being potentially liable to cover any potential losses
minus liabilities of off-balance public-private partnerships (PPPs) which can nonetheless represent potential liability for the government and
minus non-performing loans
Chapter II5 presents and reviews the data on liabilities of this type It also provides the additional information needed in order to be able to interpret this data correctly
(30) See Fiscal Sustainability Report 2012 Available online at
httpeceuropaeueconomy_financepublicationseuropean_economy2012pdfee-2012-8_enpdf
(31) Council Directive 201185EU
2 THE FUNCTIONING OF THE PREVENTIVE ARM OF THE SGP AN OVERVIEW AFTER THE COMMUNICATION ON FLEXIBILITY
38
The preventive arm of the Stability and Growth Pact (SGP) is expected to gain in prominence in the coming years in terms of both country coverage and procedure As seen in Part I of this report majority of Member States have exited or the others are expected to exit the corrective arm of the SGP and come under the preventive arm In addition the preventive arm has recently undergone several changes which have strengthened its role and made its implementation more accurate but also more complex
This chapter aims at explaining in detail the functioning of the preventive arm It provides an overall view of the economic rationale and the legal basis as well as the practical implementation and the monitoring process without dwelling at length on the most technical aspects (32) Two features of the preventive arm namely the structural reform clause and the investment clause which were operationalised following the January 2015 Commission Communication on Flexibility within the SGP (33) are presented more specifically in Chapter II4
The rationale of the preventive arm is to promote sound public finances in a forward-looking way Forward-looking policymaking has clear benefits For countries exiting the corrective arm continuing to improve structural balance positions and thereby reducing excessive levels of debt represents a commitment to a prudent forward-looking economic policy planning rather than a continuation of the correction of past errors The preventive arm is designed to ensure that when the next downturn arrives Member States public finances are in a position that allows them to make use of counter-cyclical fiscal policy ndash ie a fiscal policy that smooths the business cycle
(32) A more comprehensive description including all technical
aspects can be found in the Vade mecum on the Stability and Growth Pact that is available on the European Commissions website
httpeceuropaeueconomy_financepublicationsoccasional_paper2013pdfocp151_enpdf
(33) Making the best use of the flexibility within the existing rules of the Stability and Growth Pact COM (2015) 12 of 13 January 2015 Available online at httpeceuropaeueconomy_financeeconomic_governancesgppdf2015-01-13_communication_sgp_flexibility_guidelines_enpdf
instead of amplifying it thus supporting the economy and limiting job losses during difficult economic times
Sound public finances are a precondition for stabilising the economy and achieving fiscal sustainability Bringing public finances to a sound position and maintaining this position allows fiscal policy to play its counter-cyclical role over the course of the economic cycle while ensuring that the budget position remains within the boundaries of the 3 of GDP reference threshold This policy also preserves the sustainability of public finances in the long term more precisely ensuring that the debt ratio is reduced to the 60 of GDP reference value and kept below this level
The role of fiscal policy in stabilising the economy can only be effective if Member States are in a sound fiscal position thus allowing automatic fiscal stabilisers to operate fully In good economic times the operation of automatic stabilisers tends to cause general government revenue to increase as a result of more vigorous economic activity while expenditure related to unemployment falls Member States are therefore expected to use these good times to accumulate savings thus ensuring that automatic stabilisers will be able to work in the opposite direction during downturns Implementing prudent fiscal policy in good times is essential to avoid the repetition of mistakes made in the years prior to the economic crisis when the pro-cyclical policies implemented in good times ultimately deprived certain Member States from a margin of manoeuvre to support the economy when this was needed in the recession
As regards long-term sustainability the preventive arm is a key means to tackle debt reduction Illustrative simulations show that for Member States whose debt is above 60 of GDP and that are currently in the preventive arm adhering strictly to the requirements of the preventive arm in terms of improvement in the structural balance would also ensure that they reduce their debt in compliance with the debt rule
Part II Recent development in fiscal surveillance
39
ndash ie the debt criterion of the SGP ndash by 2017 at the very latest (34)
The cornerstone of the preventive arm since its inception has been the country-specific medium-term budgetary objectives (MTOs) that Member States should aim for achieve and maintain The MTO represents a sound budgetary position expressed in structural terms ie corrected for the impact of the economic cycle and net of one-off and temporary measures It is calculated in such a way as to take into account each individual countrys needs to ensure the long-term sustainability of its public finances including with regard to the impact of ageing populations It is also defined so as to provide in the short to medium term a safety margin with respect to the 3 of GDP reference value so that excessive deficits are avoided even in bad economic times Furthermore the preventive arm lays down requirements for the adjustment path towards the MTO which is expressed in terms of changes in the structural balance and modulated depending on the countrys cyclical conditions and debt level
Under normal economic circumstances there is consistency of methodology between the MTO and the debt rule There is a need however to ensure that it is the case in all circumstances For this reason the October 2015 Commission Communication on Steps towards completing Economic and Monetary Union (35) indicated that when updating the lower limits for the MTOs (see Box II21) that Member States can set the Commission will ensure the consistency of such values with the respect of the debt rule in the medium term
(34) The simulations use the Commission forecast for the first
year of the forecast and assume that the adjustment towards the MTO starts in the second year of the forecast They also assume that the nominal long-term interest rate on newly issued or rolled over government debt converges to 5 by 2025 that the fiscal multiplier is equal to 075 over one year and that both nominal and real GDP growth converge to the pace seen in normal economic circumstances
(35) Communication from the Commission to the European Parliament the Council and the European Central Bank on steps towards Completing Economic and Monetary Union COM(2015) 600 of 21 October 2015 Available online at httpeceuropaeuprioritieseconomic-monetary-uniondocssingle-market-strategycommunication-emu-steps_enpdf
Several reasons have motivated the recent changes to the preventive arm First following lessons learned from the economic crisis the preventive arm has been reinforced by providing tools to make the analysis of budgetary developments more accurate and more comprehensive Second the preventive arm faces some methodological issues related in particular to the estimation of the structural balance in real time the identification of revenue windfalls and shortfalls and their impact Lastly the Commission has provided guidance on the implementation of the preventive arm to make use of the flexibility existing within the rules by allowing the economic cycle and the budgetary impact of certain types of investment expenditure and structural reforms to be taken into account
The surveillance process through which the Commission and the Council regularly monitor progress towards the MTO has also been strengthened As a consequence of the Six-Pack and Two-Pack reforms (see Section II21) fiscal monitoring has been integrated into the annual surveillance cycle coordinated with the European Semester and aiming at providing guidance to Member States As part of the surveillance process Member Statesrsquo compliance with the preventive arm for any given year is conducted several times namely ex ante in-year and ex post The information to be provided by Member States has been enhanced with all Member States having to submit in spring detailed multi-annual budgetary plans in their stability or convergence programmes and euro area Member States submitting in addition in autumn their draft budgetary plans for the following year
The main challenge for the preventive arm in the coming years will be to avoid repeating past errors Since the inception of the SGP policy errors have been made reflecting both weaknesses in the institutional framework and methodological difficulties associated with assessing the situation in real time but also limited political will to comply with the agreed fiscal rules especially in good economic times In the future it will be crucial not to repeat these errors both for the credibility of the framework and for fiscal policy to be able to play an effective role In particular close monitoring will be necessary to prevent renewed unsustainable trends in public expenditure and pro-cyclical fiscal policies in good times
European Commission Public finances in EMU - 2015
40
Similarly Member States need to be more prudent than in the past regarding the use of unexpected windfalls in particular those resulting from reduced interest payments in the current environment of low interest rates
This chapter is organised as follows After a reminder of the legal basis of the preventive arm in Section II21 Section II22 describes how the MTO is defined and at what pace Member States are required to progress towards it The last section deals with the assessment of compliance presenting both the methodology and the practical implementation of the surveillance process
21 THE LEGAL BASIS FOR THE PREVENTIVE ARM
The legal basis for the preventive arm comes from both primary and secondary legislation It is based primarily on Article 121 of the Treaty on the Functioning of the European Union (TFEU) which requires Member States to coordinate their economic policies and introduces multilateral surveillance in this regard (36) The actual implementation of the preventive arm is governed by secondary legislation specifically Council Regulation (EC) No 146697 (37) and its subsequent amendments This Regulation requires Member States to submit information on their medium-term budgetary plans in April each year as part of either their stability programmes (in the case of euro area countries) or convergence programmes (in the case of non-euro area countries) The programmes are then assessed by the Commission and the Council The requirements relating to the stability and convergence programmes (SCPs) are set out in a harmonised framework namely the Code of Conduct on the SGP (38)
(36) All relevant legislation is available at
httpeceuropaeueconomy_financeeconomic_governancesgplegal_textsindex_enhtm
(37) Council Regulation ( EC ) No 146697 of 7 July 1997 on the strengthening of the surveillance of budgetary positions and the surveillance and coordination of economic policies (OJ L 209 281997 p 1)
(38) The Code of Conduct whose full title is Specifications on the implementation of the Stability and Growth Pact and guidelines on the format and content of the stability and convergence programmes is an opinion of the Economic and Financial Committee (EFC) endorsed by the Ecofin Council on the technical implementation of the SGP The
Surveillance and coordination under the preventive arm have been strengthened over the last ten years The Regulation was first amended in 2005 with the introduction of the requirement that each Member State set a country-specific MTO and an adjustment path towards it (39) A further set of amendments were adopted in 2011 (40) as part of the Six-Pack These introduced sizeable changes such as the European Semester the expenditure benchmark and the modulation of the adjustment path towards the MTO according to the position in the economic cycle The Six-Pack also introduced a procedure for correcting significant deviations from the requirements of the preventive arm along with the possibility of sanctions for euro area countries that repeatedly fail to comply with the recommendations under the preventive arm (41) and set out requirements to reinforce national budgetary frameworks in particular regarding statistics forecasts numerical fiscal rules medium-term planning and transparency (42)
Although formally outside the SGP the Fiscal Compact and the Two-Pack have also strengthened the fiscal framework in the euro area The Fiscal Compact is the fiscal part of the Treaty on Stability Coordination and Governance (TSCG) a public international law treaty which entered into force on 1 January 2013 The Fiscal Compact which is only binding for euro area countries enshrines in national legislation the provisions of the Six-Pack It does not only mirror them but also makes them more stringent in some aspects in particular by setting a higher minimum requirement for the MTOs The Two-Pack which entered into force in May 2013 and is also specific to euro area countries does not add any new requirements but strengthens surveillance More
EFC is a committee set up to promote policy coordination on economic and financial matters among Member States It is composed of senior officials from national administrations and central banks the ECB and the Commission
(39) Council Regulation (EC) No 10552005 of 27 June 2005 (OJ L 174 772005 p 1)
(40) Regulation (EU) No 11752011 of the European Parliament and of the Council of 16 November 2011 (OJ L 306 23112011 p 12)
(41) Regulation (EU) No 11732011 of the European Parliament and of the Council of 16 November 2011 (OJ L 306 23112011 p 1) adopted on the basis of Article 136 TFEU
(42) Council Directive 201185EU
Part II Recent development in fiscal surveillance
41
precisely it requires Member States to submit to the Commission and the Eurogroup their draft budgetary plans (DBPs) in October for the forthcoming year It also gives independent national institutions a key role in preparing or endorsing macroeconomic forecasts as well as in assessing compliance with numerical fiscal rules (43)
22 THE MEDIUM-TERM BUDGETARY OBJECTIVE (MTO) AND THE ADJUSTMENT PATH TOWARDS IT
221 The MTO
The MTO is at the core of the preventive arm It represents a sound budgetary position which ensures strong public finances both in the short and long term Under the preventive arm Member States are required to progress towards their MTOs at an appropriate pace and to maintain this position
The MTO is defined in structural terms This means that it is based on the general government budget balance corrected for the estimated impact of the economic cycle (the cyclically-adjusted balance) and net of one-off and other temporary measures as these do not necessarily imply an improvement in a countrys inter-temporal budgetary position This correction therefore allows the underlying budgetary position to be assessed more accurately
The MTO presented by each Member State must fulfil the following requirements (44)
(i) It must provide a safety margin with respect to the reference value of 3 of GDP for the deficit
(ii) It needs to ensure that public finances are sustainable or are rapidly progressing towards a sustainable position
(43) Regulation (EU) No 4732013 of the European Parliament
and of the Council of 21 May 2013 on common provisions for monitoring and assessing draft budgetary plans and ensuring the correction of excessive deficit of the Member States in the euro area (OJ L 140 2752013 p 11) adopted on the basis of Article 136 TFEU
(44) Council Regulation (EC) 146697
Taking these two first conditions into account the MTO must allow sufficient room for budgetary manoeuvre to let automatic stabilisers operate fully (in particular to allow welfare spending to increase and tax revenues to decline mechanically during downturns) while keeping the budget balance within the limit of a deficit of 3 of GDP and the debt under control Only if a country is above its MTO it has fiscal space for additional discretionary measures
(iii) In addition euro area and ERM2 Member States must have an MTO of at least -1 of GDP Contracting parties to the TSCG have committed themselves to MTOs of at least -05 of GDP unless their debt ratio is significantly below 60 of GDP and the risks for the long-term sustainability of public finances are low (in which case the lower limit may remain at -1 of GDP)
To ensure compliance with these requirements the Commission regularly estimates country-specific lower bounds For each country the lower bound (the minimum MTO) is determined by taking the most stringent of the three values corresponding to the three requirements set out above This is done using a commonly agreed methodology that is described in the Code of Conduct and presented here in Box II21 The calculations are updated every three years following the publication of the Ageing Report(45) thereby incorporating the latest available projections on the budgetary and economic impact of ageing populations
Each Member State sets its MTO in its stability or convergence programme (SCP) The MTO must be at least in line with the minimum MTO calculated by the Commission rounded to the most favourable frac14 of a percentage point Member States are however free to set more ambitious MTOs if they feel that circumstances warrant it They are required to revise their MTOs at least every three years Additional revisions can also take place on a case-by-case basis if a country implements a structural reform with a major impact on the sustainability of public finances such as a major reform of the pension system The MTOs currently in place range from a deficit of 17 of GDP to a surplus of 075 of GDP with most countries
(45) See European Commission (2014a)
European Commission Public finances in EMU - 2015
42
MTOs falling between a deficit of 1 of GDP and a balanced budget
222 The adjustment path towards the MTO
Under the SGP Member States must achieve and maintain the MTO or be on an appropriate adjustment path towards it A country is assessed to be at its MTO if its structural balance is at least as tight as its MTO As a matter of convention the structural balance is considered to
be in line with the MTO if the distance to the MTO is within a margin of 025 of GDP This is to account for uncertainty when estimating the output gap in real time If the Member State is not at its MTO it must follow an appropriate path towards it in terms of change in the structural balance
The appropriate adjustment path depends on each countrys situation Following the 2005 reform cyclical conditions are taken into account in the implementation of the SGP making it more
Part II Recent development in fiscal surveillance
43
Required annual fiscal adjustment
Condition Debt le 60 and lowmedium sustainability risks
Debt gt 60 or high sustainability risks
Exceptionally bad times
Real growth lt 0 or output gap lt -4 No adjustment needed
Very bad times -4 le output gap lt -3 0 025
Bad times -3 le output gap lt -15 0 if growth below potential
025 if growth above potential
025 if growth below potential
05 if growth above potential
Normal times -15 le output gap lt 15 05 gt 05
Good times Output gap ge 15 gt05 if growth below potential
ge075 if growth above potential
ge075 if growth below potential
ge1 if growth above potential
demanding in good economic times while giving more flexibility in bad times The Commission has detailed more precisely how the required annual adjustment is modulated by means of a matrix annexed to the 2015 Communication on flexibility within the SGP The modulation takes into consideration both the economic cycle and the countrys debt level and sustainability needs As a benchmark euro area and ERM2 Member States should plan to improve their structural balance each year by 05 of GDP in what is defined in the matrix as normal times In good economic times however a faster adjustment is required This also applies to Member States with debt in excess of 60 of GDP and Member States whose debt has been assessed as being at high risk of not being sustainable Conversely the effort may be reduced during bad times and when sustainability risks are limited In addition the required effort takes into account the direction into which the economy is moving ie whether the economic situation is improving or deteriorating This is assessed by looking at whether real GDP growth exceeds or falls short of the country-specific potential growth rate Overall the required adjustment ranges between zero and more than one percentage point of GDP The various cases are presented in the matrix of requirements (Table II21)
The matrix of requirements includes a waiver from structural adjustment in exceptionally bad times The background for the
waiver is the definition (borrowed from the corrective arm of the SGP) of an exceptionally severe economic downturn as a negative annual GDP volume growth rate or (hellip) an accumulated loss of output during a protracted period of very low annual GDP volume growth relative to its potential (46) More specifically it is considered that in years when real GDP growth is negative or when the output gap is lower than -4 of GDP in the Member State in question the downturn is so severe that the Member State cannot be required to improve its structural balance (47)
The two requirements of the preventive arm ndash namely achieving the MTO and implementing more consolidation effort in good times and less in bad times ndash are not always compatible There is a tension in the spirit of the Regulation in this regard Within the spirit of the SGP which privileges sustainability the current Commission in its Communication on flexibility within the SGP (see footnote 2) has increased the prominence of cyclical conditions and the modulation of effort This can at times prevail over the requirement of reaching the MTO within four years (48)
(46) Regulation (EC) 146797 as modified by Regulation (EC)
10562005 (47) Finland benefitted from the waiver for 2012 and 2014 and
so did Italy for 2014 due to negative growth in those years (48) While the matrix of requirements is in principle compatible
with the principle of achieving the MTO within four years it may lead in case of a protracted period of bad economic
Table II21 Matrix for determining the annual fiscal adjustment towards the MTO required under the preventive arm
Source European Commission All figures are in percentage points of GDP Sustainability risks are assessed on the basis of the S1 indicator which represents the change in the structural primary balance required by 2020 to bring the debt-to-GDP ratio to 60 by 2030
European Commission Public finances in EMU - 2015
44
223 Allowed temporary deviations from the MTO or the adjustment path towards it
The Communication on flexibility within the SGP has presented two clauses allowing temporary deviations from the MTO or the adjustment path towards it Their aim is to provide the necessary flexibility to support structural reforms and investment without compromising fiscal responsibility The structural reform clause allows Member States that implement major structural reforms to deviate temporarily from the MTO or the adjustment path towards it The idea is to cater for possible short-term costs of reforms that are expected to have positive budgetary effects in the long-term including through the expected positive impact on potential output Under the investment clause Member States may similarly be allowed temporary deviations from the adjustment path in this case to finance specific investment expenditure on projects co-funded by the EU that have positive direct and verifiable long-term effects on growth and on the sustainability of public finances
Both clauses are subject to specific conditions and are presented in more detail in Chapter II 4 In particular the Member State must remain in the preventive arm it must preserve an appropriate safety margin with respect to the 3 of GDP deficit limit and the Member States budgetary position must be expected to return to the MTO within the period of four years covered by the SCP In addition for the investment clause to apply the Member State must be in bad economic times or worse as defined in the matrix
In 2011 a general escape clause was included by the legislator in the preventive arm (and in the corrective arm) in order to accommodate exceptional conditions It reflects the same spirit as the waiver described above as it allows for a temporary deviation from the adjustment path providing that this does not endanger fiscal sustainability in the medium term This clause is however of a more general nature It is applicable in two possible situations i) a severe economic downturn affecting the euro area or the EU as a
conditions to requiring an adjustment that may not be sufficient to reach the MTO within this time horizon
whole (49) ii) an unusual event outside the control of the Member State concerned which has a major impact on the financial position of the general government (50) In view of the wide range of situations that could lead to the application of this clause the Commission and the Council have to assess each case individually in order to decide whether it qualifies This clause has so far not been applied It is indeed meant to remain limited to exceptional carefully circumscribed situations to minimise the risk of moral hazard (51)(52)
23 ASSESSMENT OF COMPLIANCE UNDER THE PREVENTIVE ARM
231 The two-pillar approach
Before the adoption of the Six-Pack progress towards the MTO was only assessed in terms of change in the structural balance This first pillar of the preventive arm had been introduced in 2005 alongside the MTO and involves assessing the change in the structural balance against the required annual adjustment Given its close connection with the MTO the first pillar remains a crucial element of the preventive arm
(49) It is recalled that the waiver referred to in the previous
section makes reference to economic conditions in the Member State itself
(50) Council Regulation (EC) No146697 as amended as part of the Six-Pack
(51) It reflects however de facto the same logic as the one underpinning the recovery plan in 2008 under which the adjustment paths were redesigned and Member States agreed on a coordinated temporary fiscal stimulus package in response to extraordinary economic conditions namely the financial crisis and the recession See the Commission Communication A European economic recovery plan COM (2008) 800 of 26 November 2008 Available online athttpeur-lexeuropaeulegal-contentENALLuri=CELEX52008DC0800
(52) The Commission is willing to use these provisions to accommodate the incremental spending resulting from the exceptional inflow of refugees in certain Member States as this is considered an unusual event outside the control of government It will monitor the situation closely on the basis of observed data as provided by the authorities of the Member States concerned to determine eligible amounts This information will be used when assessing (ex post) possible temporary deviations from the SGP requirements for 2015 and 2016 This means that deviations deriving only and directly from the net extra costs of the refugee crisis will not lead to any stepping up in the procedures This applies also to the opening of an Excessive Deficit Procedure provided that the general government deficit remains close to 3 of GDP in case of a breach of that threshold
Part II Recent development in fiscal surveillance
45
The Six-Pack has introduced a second pillar to operate in parallel to the structural balance the expenditure benchmark (53) Experience has shown that monitoring the structural balance alone is not sufficient to provide an accurate and comprehensive picture of budgetary developments and two main weaknesses have been identified First failure to meet fiscal targets tends to result mainly from the dynamics of expenditure while revenue tends to follow GDP Second as mentioned above real-time estimates of the structural balance are highly uncertain especially in periods of large shocks to the economy ndash on the positive or negative side (54) This is particularly true for revenue and may result in times when the economy is strong in revenue windfalls which Member States tend to spend rather than save to build fiscal buffers This is also the case for revenue shortfalls in downturns Controlling expenditure allows Member States to run a more counter-cyclical fiscal policy
The aim of the expenditure benchmark is to prevent increasing trends in the expenditure-to-GDP ratio which are not properly backed by revenue measures While government revenues (mainly taxes and social contributions) are largely driven by macroeconomic developments expenditure depends more directly on government decisions Keeping expenditure growth under control is therefore essential for steering public finances towards sound positions over the medium term This is the case if expenditure grows at the same pace as potential GDP ie if the ratio of expenditure to potential GDP remains unchanged The level of the expenditure-to-GDP ratio itself is however not constrained governments remain free to choose their preferred size of government as long as increases in expenditure are matched by additional revenues ndash which must result from measures not windfalls It is for this reason that
(53) A longer presentation is available in European Commission
(2011) (54) Indeed the estimate of the structural balance is based on
estimates of many unobservable variables including the output gap proxies for tax bases and elasticities of tax receipts to the tax bases In addition to the general uncertainty related to the imperfections of these real-time estimates the assessment of the structural balance may be affected by unexpected developments in tax revenues which are decoupled from the evolution of standard tax bases For more details see European Commission (2013) Part III Available online at httpeceuropaeueconomy_financepublicationseuropean_economy2013pdfee-2013-4pdf
the regulation refers to a net growth rate of government expenditure ie a growth rate that is net of discretionary revenue measures and of revenue increases mandated by law
Operationally in order to capture only items that are mostly under the control of government the expenditure aggregate is recalculated Certain expenditure items are netted out from the aggregate because they are not considered to be discretionary spending (1) the cyclical component of unemployment benefits as it depends on cyclical conditions (2) interest payments as they are not directly within the governments control and (3) expenditure matched by EU funds as it is not funded by general government Furthermore public investment is smoothed over four years to avoid the calculation being affected by peaks related to the public investment cycle This corrected expenditure aggregate is then adjusted for discretionary revenue measures and revenue increases mandated by law On this basis the growth of net public expenditure in nominal terms is computed It is then deflated using the change in the GDP deflator to obtain the growth rate in real terms Similarly the nominal expenditure figures submitted by Member States in their SCPs are converted into real terms by the Commission to allow comparison with the benchmark
The real growth of net expenditure is compared to that of potential GDP averaged over ten years ndash the reference rate This is a reference medium-term rate of potential GDP growth that is both backward- and forward-looking (covering the years t-5 to t+4) and updated on a yearly basis It reflects a medium-term time horizon that is long enough to reduce the bias of short-term fluctuations in growth while being short enough to remain of relevance for policymaking
The maximum net growth of expenditures allowed depends on the distance to the MTO (and the effort required from the Member State as explained in Section II22) Member States that have attained their MTO are required to ensure that expenditure growth does not exceed the reference rate or that any excess is funded by discretionary measures (55) Over time this will
(55) Articles 5(1) and 9(1) of Council Regulation (EC) No
146697
European Commission Public finances in EMU - 2015
46
result in both government revenue and spending increasing at the same pace thus keeping the structural balance stable at the MTO (56) By contrast countries that are not yet at their MTO are required to contain net expenditure growth at a lower rate below potential GDP growth thus expenditure will decline as a ratio to GDP the structural balance will strengthen and the gap with the MTO will close over time (57) Both the reference rate and the lower rate are revised on a yearly basis In addition to the constraint on net expenditure growth any discretionary reduction of government revenue items needs to be matched by cuts in expenditure or by discretionary increases in other government revenue items
Overall the expenditure benchmark has enriched the EU fiscal surveillance toolbox It reduces the uncertainty surrounding the structural budget balance and it strengthens effectiveness and transparency as the budgetary aggregates under consideration are observable and under the control of government and the relationship between the outcome of the assessment and the measures to be taken is direct The expenditure benchmark is meant to refine the assessment as an indicator of the fiscal effort that a Member State has effectively implemented in parallel to the analysis in terms of change in the structural balance As both pillars are based on different although complementary concepts and variables elements that are not captured in the structural balance will show in the comparison between the expenditure aggregate and the change in the structural balance with the two indicators giving opposite signals This comparison is performed in the so-called overall assessment which is described in more detail below
(56) However the Code of Conduct states that countries that
have overachieved their MTO are allowed to deviate from the expenditure benchmark as long as the MTO is not jeopardised over the programme period taking into account the possibility of significant revenue windfalls
(57) The difference between the reference rate and the lower rate is referred to as the convergence margin Its size is country-specific and depends on the size of the public sector (the share of government primary expenditure in GDP) and on the required tightening of the structural balance under the first pillar (a higher adjustment requirement translating into a larger convergence margin)
232 The surveillance process
The Commission and the Council assess compliance with the SGP through the surveillance process In particular they assess whether Member States converge towards the MTO (or maintain it for Member States that have already reached it) and comply with the Council recommendations with the view of possibly deciding whether it is necessary to open a Significant Deviation Procedure (SDP)
Timing of the assessment
Budgetary plans and outcomes are regularly assessed against the requirements of the preventive arm within a multilateral surveillance framework The assessment is carried out by the Commission and the Council on the basis of information provided by Member States and Commission forecasts Following the adoption of the Six-Pack the assessment takes place along an annual surveillance cycle in which Member States are given guidance for the current year the following year and the medium-term and procedural steps can be taken in case non-compliance is observed ex post
Member States are required to submit their budgetary plans for assessment with additional requests for euro area Member States(58) Member States must submit their SCPs to the Commission and the Council each year in April The SCPs provide detailed information on the outturn of year t-1 and on budgetary medium-term plans up to year t+3 according to a standardised format and content This includes in particular the MTO and the planned adjustment path towards it a range of economic and budgetary data and a quantified description of the envisaged budgetary strategy especially with regard to the intended policy measures Since the entry into force of the Two-Pack euro area Member States have in addition been required to submit their Draft Budgetary Plans (DBPs) for the following year in autumn each year
In terms of procedure the most important assessment is the ex post assessment which is conducted in spring of each year It consists in (58) Euro area Member States which are under a
macroeconomic adjustment programme are however not required to submit a stability programme
Part II Recent development in fiscal surveillance
47
assessing whether each Member State complied with the requirements of the preventive arm during the previous year and over the last two years on average based on outturn data In case a Member State fails to comply further analysis establishes whether non-compliance is significant which would trigger an SDP An SDP can only be launched on the basis of outturn data which only becomes available in the spring This is therefore the only time in the surveillance cycle when an SDP can be initiated (see Sub-section II233)
In addition the ex-ante and in-year assessments are intended to alert Member States of possible risks of deviations from the requirements and thus provide guidance for further adjustments In this way guidance is provided to Member States throughout the whole budgetary cycle In spring of each year along with the ex-post assessment compliance is also assessed by the Commission for the current year and over the medium term (59) on the basis of the SCPs and the Commissions spring forecast As part of the European Semester the Council then adopts opinions on the SCPs and issues policy guidance in the form of fiscal country-specific recommendations (CSRs) addressed to Member States following Commission recommendations Member States subsequently take the CSRs into account when preparing the budgets for the following year during the second half of the year For euro area Member States this is completed in autumn by an ex ante assessment for year t+1 as well as a further in-year assessment for year t on the basis of both the DBPs and the Commissions autumn forecast This assessment feeds into the Commissions opinion on the DBPs If the Commission identifies particularly serious non-compliance in a DBP it shall request in its opinion a revised DBP on which it will adopt a new opinion
The freezing principle
To ensure the predictability of the ex post assessment and allow Member States to plan ahead the appropriate measures the requirements are frozen over the assessment cycle Predictability is crucial in a context where a significant deviation from the requirements will
(59) Ex-ante evaluation for year t+1 and qualitative assessment
for years t+2 and t+3
lead to procedural consequences which eventually include financial sanctions for euro area Member States Yet the requirements in terms of structural adjustment and expenditure growth depend on economic conditions forecast in the Member State in particular its output gap Given the intrinsic volatility of output gap estimates these requirements could turn out to change between the ex-ante and ex-post assessments for a given year In order to keep the outcome of the ex-post assessment predictable and to preserve the guidance spirit of the preventive arm the requirements are therefore frozen More precisely the required adjustment path for a given year is set in the spring of the previous year and it remains the reference against which developments are assessed in the following years There are however two cases for which the requirements based on outturn data prevail over the frozen ones The first case is when the output gap turns out to deteriorate and be larger than -3 of GDP (ie the Member State is found to be in very bad times or exceptionally bad times) because the initially required adjustment turns out to be too large The other case is when the Member State is found to have achieved its MTO because the required adjustment is no longer necessary
In technical terms several variables are frozen at the level at which they are forecast in the spring of year t-1
- First the structural balance and therefore the distance from the MTO both for year t-1 are frozen and used to assess whether a country is at its MTO as a starting point ndash if it is no adjustment will be required (60)
- For the assessment under the first pillar the freezing regards the debt-to-GDP ratio and the sustainability risk indicator S1 both also for year t-1 as well as real GDP growth and the output gap both for year t as these are used to determine where the Member State stands in the matrix of requirements for year t and therefore what change in the structural balance is required On this basis the required adjustment for year t is formulated in
(60) However in each forecast round the structural balance for
year t-1 as fixed in the spring of year t-1 is compared to its level for the same year according to the new forecast and the more favourable of the two is used to identify the starting point
European Commission Public finances in EMU - 2015
48
t-1 and compliance is assessed both in years t and t+1
- Freezing is applied in a similar way for the assessment against the expenditure benchmark The reference rate the applicable convergence margin and the resulting lower rate for year t are communicated in the spring of year t-1 and frozen until the ex post assessment in year t+1 This means that the benchmark for the net growth of expenditure is not affected by the subsequent yearly updates of the reference rate and the convergence margin
The assessment of compliance in practice
The first step of the assessment whether ex ante in-year or ex post regards the distance to the MTO After checking that the MTO defined by the Member State considered is at least as demanding as the minimum MTO as calculated in Box II21 the Commission assesses whether the MTO has been achieved This is the case if the Member State has a structural balance at least as tight as its MTO As a convention a country is considered to be at its MTO if it is within a margin of tolerance of 025 of GDP to account for uncertainty in the measurement of the structural balance Member States which have achieved their MTO are required to maintain this position and Member States which have overachieved it have some fiscal space available
Compliance with the preventive arm is assessed against the required adjustment as defined in the matrix possibly corrected for the impact of the relevant clauses If the conditions are met the flexibility clauses ndash the structural reform clause and the investment clause ndash may allow a Member State to temporarily deviate from its MTO or the adjustment path towards it as described in Chapter II4 The general escape clause may also apply if it is assessed that the conditions are met
The assessment of compliance builds on an overall assessment combining the two pillars Both the structural balance and the expenditure benchmark are taken into account (61) For each
(61) As stated in Regulation 146697 The only exception
regards Member States that have overachieved their MTO in which case only the structural balance is relevant and compliance with the expenditure benchmark does not need to be assessed
pillar three outcomes are possible either the Member State complies with the requirements or it deviates from them but to a limited extent or it deviates significantly A significant deviation from the MTO or the adjustment path towards it is defined for the first pillar as a deviation of the structural balance of at least 05 of GDP over one year or cumulatively in two consecutive years (ie at least 025 of GDP on average per year in two consecutive years) Similarly for the expenditure benchmark a significant deviation is a deviation in the net expenditure developments that has an impact on the government balance of at least 05 of GDP over one year or cumulatively over two consecutive years (62) The ex post assessment is therefore conducted not only in respect of the year t-1 under consideration but also taking into account the preceding year t-2 to check the cumulative deviation over the two years The aim is to avoid small deviations (below 05) from cumulating year after year and sum up to a large deviation
In-depth analysis is needed in case of conflicting signals between the two indicators As the structural balance and the expenditure benchmark are based on different concepts and variables they can send out different messages They each provide a partial evaluation of the situation meaning that neither can be considered as being the right indicator The expenditure benchmark is nonetheless in general a preferable and less endogenous indicator of fiscal effort in so far as the bottom-up evaluation of measures is not distorted and hidden non-regulatory government actions are absent (63) On the other hand the two indicators are complementary and taken together they provide a comprehensive picture of a Member States fiscal position The overall assessment should therefore systematically analyse the factors explaining the differences between the two pillars in order to identify which reflects better the specific situation under consideration and conclude accordingly These factors are presented in Box II22
The outcome of the overall assessment depends on how the two pillars combine The Code of
(62) Articles 6(3) and 10(3) of Council Regulation (EC) No
146697 (63) A typical case is tolerated tax evasion or elusion which
may be practised by certain governments in certain circumstances
Part II Recent development in fiscal surveillance
49
Change in the structural
balance
Expenditure
benchmark
Adjustment delivered Deviation Breach of the threshold of significance
Benchmark complied with Compliance Overall assessment needed Overall assessment
needed
Deviation Overall assessment needed Overall assessment needed Overall assessment
needed
Breach of the threshold of significance
Overall assessment needed Overall assessment needed Significant deviation
Conduct specifies that a deviation is considered significant if indicators point to deviations that reach the threshold for significance as defined
above In case the deviation reaches the threshold for significance for only one of the indicators the deviation is considered significant if the overall assessment also shows some deviation although below the significance threshold with respect to the other condition As a result several cases are possible as shown in Table II22 When both indicators show compliance with the required adjustment (green cell) or both indicate a significant deviation from it (red cell) the conclusion of the assessment is straightforward When the messages provided by the two indicators differ (yellow and pink cells) the conclusion will be based on an in-depth analysis assessing the differences between the two indicators and deciding whether the deviation can be considered significant overall It is only possible to conclude that there is a significant deviation and therefore that an SDP should be launched for the Member State in question if the deviation from at least one indicator has reached the threshold of significance (corresponding to the red and pink cells) By contrast the cases represented by the yellow cells cannot lead to an SDP
233 The significant deviation procedure (SDP)
The SDP was introduced as part of the Six-Pack as a way of making the requirements of the preventive arm more binding It builds on
the lessons learnt from the past as peer pressure alone proved insufficient to avoid persistent non-compliance with the preventive arm The general aim of the SDP is to give Member States stronger incentives to make sufficient progress towards the MTO in particular when economic circumstances allow it Unlike the Excessive Deficit Procedure which is opened on the basis of objective conditions (relating to the evolution of the debt and deficit ratios) the SDP is intended to make sure that the Member State in question complies with the fiscal recommendations issued publicly by the Council during the European Semester If a euro area Member State repeatedly fails to comply with a recommendation it may face financial sanctions under the preventive arm
The successive procedural steps start with a warning in the spring and may lead to a financial sanction in November of the same year
- If a significant deviation is observed in the ex post assessment in the spring (conducted on the basis of data for the year t-1) the first step is for the Commission to issue a warning under Article 121(4) TFEU thus launching an SDP
- Within one month the Council adopts a recommendation based on a Commission recommendation on the policy measures that the Member State must take to address the deviation
- At most five months later (or in very severe cases at most three months later) the Member
Table II22 Possible outcomes of the overall assessment under the preventive arm of the SGP
Source Commission services Note The column Deviation corresponds to some deviation that remains below the threshold to conclude on a significant deviation
European Commission Public finances in EMU - 2015
50
(Continued on the next page)
Part II Recent development in fiscal surveillance
51
State reports on action taken If the Member State is found to have failed to take appropriate action the Commission immediately recommends that the Council adopt by qualified majority voting a decision establishing that no effective action has been taken The Commission may also recommend that the Council adopt a revised recommendation on the appropriate measures to be taken
- If the Council does not adopt the decision on no effective action and the Member State in question persists in not taking appropriate action the Commission issues a new recommendation for a Council decision on no effective action within one month of the previous one This new recommendation is subject to reverse simple majority voting in the Council (64)
- In the case of euro area Member States within 20 days the Commission recommends to the Council to adopt a decision requiring an interest-bearing deposit of 02 of GDP (65)
(64) This means that the decision is adopted unless a majority of
Member States votes against it (65) Regulation (EU) 11732011 of the Parliament and the
Council based on Article 136 TFEU
- Finally the Council votes on the adoption of this decision by reversed qualified majority voting within 10 days (66)
Given the consecutive steps this decision would be taken by November of the year in which the SDP was launched
(66) The Council may also vote to amend the Commissions
recommendation and adopt the amended text as a Council decision by qualified majority voting
Box (continued)
3 ONE-OFF MEASURE-CLASSIFICATION PRINCIPLES USED IN FISCAL SURVEILLANCE
52
31 INTRODUCTION
Since the 2005 reform of the Stability and Growth Pact (SGP) the concept of lsquostructural balancersquo ie the cyclically-adjusted balance net of lsquoone-off and other temporary measuresrsquo has become a cornerstone of fiscal surveillance The rationale for removing the impact of one-off and other temporary measures (referred to here collectively as lsquoone-off measuresrsquo) when assessing a Member Statersquos budgetary position has been to better identify underlying trends and in particular to reduce the incentive for national authorities to resort to lsquofiscal gimmickryrsquo ie improving budgetary results in the short term by means of easy-to-implement measures that do not lead to a sustained improvement of the general government balance In general terms one-off measures could therefore be defined as lsquomeasures having a transitory budgetary effect that does not lead to a sustained change in the budgetary positionrsquo
The ability to correctly identify lsquoone-off measuresrsquo as defined in the SGP is thus crucial for carrying out fiscal surveillance The definition provided above can however only be a starting point for the actual process of identifying individual such measures More specific guidance including an indicative and open list of one-off measures was developed in the wake of the 2005 SGP reform and published in the 2006 Report on Public Finance in the EMU The Commission has since been using this guidance as a point of reference for its surveillance activities
There are several reasons to review the guidance laid down in the 2006 Report on Public Finance in the EMU First it has become apparent that the existing guidance is not always conclusive often leaving substantial scope for interpretation in particular in relation to measures not mentioned explicitly in the indicative and open list of measures Second the classification of one-off measures has necessarily been a learning process New cases have appeared that the guidance did not cater for and principles as to how to treat certain cases have been refined over time Finally a number of statistical revisions (in particular the introduction of ESA2010) have made
it necessary to update the indicative and open list contained in the 2006 Report for example because some of the transactions included are now regarded as financial transactions (ie no longer affect the headline deficit)
These factors illustrate the need for both updated guidance on typical cases and also further work on the theoretical basis (the lsquoguiding principlesrsquo) A better developed set of guiding principles for classifying transactions as one-offs will make the criteria used by the Commission in its fiscal surveillance more transparent It will also form a more solid basis for decisions on the one-off nature of future as yet unknown cases The classification of a measure needs to be based on an overall assessment of that measure against the guiding principles presented below In some cases a certain degree of judgement may still need to be used in particular in cases where different guiding principles appear to point to different decisions (for instance when determining the boundary between lsquonormal economic fluctuationsrsquo and the impact of an lsquoexceptional eventrsquo)
This chapter develops such guiding principles and examines how they can be used in determining the lsquoone-offrsquo nature of a measure It is structured as follows Section II32 explains the guiding principles used for assessing the one-off nature of a measure Section II33 provides examples of frequently occurring one-offs and explains the rationale for their treatment based on the guiding principles set out in the previous section and Section II34 discusses a number of measures that have lsquoborderlinersquo characteristics and explains why they have ultimately however not been considered one-off measures
32 GUIDING PRINCIPLES FOR THE CLASSIFICATION OF ONE-OFF MEASURES
321 Principle I One-off measures are intrinsically non-recurrent
One-off measures are transactions that have by their very nature only a temporary non-recurrent impact on general government
Part II Recent development in fiscal surveillance
53
revenue or expenditure For this to be the case a one-off measure must have an inherent characteristic that makes its impact temporary ie a characteristic that means that it cannot have a sustained impact on the budgetary position As a rule a maximum of two years could be considered a reasonable length of time for defining temporariness Great care needs to be taken however in assessing the duration of the effect of a measure In particular if similar one-off measures are introduced repeatedly over the course of several years this does not change the fact that each individual measure has a temporary impact that cannot lead to a sustained improvement in the budgetary position A government can for example sell a series of non-financial assets over a period of time (ie repeating a particular type of transaction) but this does not alter the fact that a systematic liquidation of such assets can never become a sustainable source of government financing as the stock of assets is depleted further with every sale In such cases the measures in question should still be considered individually as one-off measures (67) Ultimately it is the intrinsic inability of a measure to lead to a sustained change in the budgetary position that determines its one-off nature
Measures identified as one-offs are very often although not always of one of the following types
a) Measures creating short-term benefits accompanied by a significant reduction in government assets or a build-up of future liabilities The implicit reasoning is that systematically running down non-financial assets (such as land or buildings) or building up liabilities can in principle never become a permanent source of government financing and should therefore be considered a one-off measure even in cases where there is a sequence of similar transactions taking place over a period of several years The impact of such measures would therefore be considered one-off
b) Measures entailing a short-term lump-sum benefit at the expense of a recurrent future cost
(67) For a more detailed discussion on the sale of non-financial
assets see also Section II335 An important factor in the classification of this example as a one-off would be the fact that there is a systematic depletion of the stock of assets
In certain situations policymakers may create a very short-term gain which also creates recurrent costs in the future (either in the form of lower revenue or increased expenditure) A typical example would be a case where the government is systematically substituting for ownership with rental contracts (68) The future cost is also often somewhat hidden This is particularly the case when the general government receives a payment in one year in return for services or entitlements it will provide over a longer period of time In such cases the recurrent future cost consists of the loss of revenue that would have been collected had the services or entitlements been granted on an annual basis In general the short-term benefits would be produced either through the treatment of the measure in national accounts or as a result of the behaviour of economic agents This would be the case for example when firms or consumers derive some benefit from early or advanced payments creating a very short-term peak in government revenue Irrespective of how the gain is generated when a lump-sum benefit of this type is created at the expense of a recurrent future cost the short-term gain should be considered one-off as it cannot become a permanent source of government financing On the other hand once the measure has been taken the future costs also created are recurrent and therefore structural
c) Measures implying a change in the timing of revenue or expenditure that create a temporary peak (positive or negative) in revenue or expenditure patterns Changes in the timing of recurrent revenue or expenditure patterns also often create very short-term transitional effects For example if a tax administration is able to considerably shorten the period between the occurrence of a taxable transaction and the settlement of the tax there would be a temporary increase in tax revenue in the year the measure is introduced A temporary impact of this kind should be considered one-off (any permanent effect of course being structural) The justification for this treatment lies in the transient nature of the peak it
(68) This example also illustrates that classification of a
measure as a one-off does not necessarily imply a judgement on the quality of the measure substituting ownership with rental contracts may mdash depending on the contractual arrangements mdash reflect very sound and cost-saving policies by the government This does not however affect the one-off nature of the budgetary impact of the sale
European Commission Public finances in EMU - 2015
54
being essentially a temporary side effect of a transition from one steady state to another
d) Measures introduced in direct response to lsquoexceptional eventsrsquo and that have a very short-term impact Exceptional events are defined for this purpose as specific occurrences that can be regarded as being beyond the control of the government and that have an often sudden impact on the revenueexpenditure or assetsliabilities of the general government or of the country that is temporary by nature and significantly exceeds normal economic fluctuations The fact that an exceptional event may have occurred unexpectedly and that its impact could not have been foreseen by policymakers when drafting their budgetary plans is not relevant to the assessment of the one-off nature of measures taken in response to it The critical factor is that the impact of the measure is inherently temporary and does not have the potential to affect the budgetary position in a more permanent manner It is often although not always the case that the one-off budgetary impact of a measure taken in response to an exceptional event results from implicit or even hidden liabilities that have been building up over several years and that materialise as a result of the measure A typical example would be a court ruling that a tax collected over a number of years is unlawful and needs to be repaid The classification as one-off is justified by the transient nature of the budgetary impact of the exceptional event In the example of a court ruling the entire budgetary impact may be accrued in a single year even though the tax was collected over many years prior to this The direct link to the exceptional event needs to be interpreted in a restrictive manner ie only those measures that have been introduced as an inevitable consequence of the event or that are strictly necessary to prevent the event from having an even greater negative impact can be considered one-offs (69) (see also Principle IV below)
(69) It should also be noted that all transactions classified as
one-offs are considered to be lsquofiscal policy measuresrsquo ie interventions by the government to change past policy orientations that are specified in sufficient detail adopted or credibly announced and that have a direct incremental budgetary impact even though some of these transactions may not be fully under the control of the government (such as the implementation of court rulings or decisions taken by EU authorities) In other words for budgetary surveillance purposes these actions are conventionally considered as fiscal policy measures despite their somewhat less discretionary nature
Furthermore the occurrence of exceptional events should as a rule be evaluated at micro level The term lsquoexceptional eventsrsquo should not be interpreted as covering a general worsening of the economic or environmental conditions throughout the year but should be understood to mean punctual events such as the default of a systemic bank nation-wide flooding caused by a single unusually severe storm or court decisions with significant budgetary impact
An additional difficulty may arise due to the fact that exceptional events can have a permanent as well as a temporary effect In the previous example of a court ruling the repayment of unjustified taxes would create a very short-term impact but the court ruling may also have an effect on the future tax base This would thus be a structural (ie not a one-off) effect Unlike in this example however the distinction may not always be immediately clear while some of the effects of an exceptional event may remain very short term (ie not extending beyond the standard two-year period) the impact could ultimately at least in part also become recurrent In such cases it may be necessary to review the one-off nature ex post and possibly reclassify at least part of the budgetary impact as structural When the budgetary impact of an exceptional event extends beyond the two-year period there should be a strong presumption that at least part of the impact is of a structural nature and therefore needs to be deducted from the one-off effect As a rule the impact recorded after the end of the two-year period should not be classified as part of the one-off effect Such revisions are similar to statistical revisions of the actual deficit figure and should be avoided as much as possible as they may hinder effective policy surveillance (see also Principle II hereafter)
Where a measure is not of one of the types listed as cases (a) to (d) above it could still be classified as a lsquoone-offrsquo but use of this label should nonetheless be restricted In particular the attribution of the one-off label should always be based on a careful assessment of (i) the likelihood of recurrence (ii) the level of control the government has (see Principle IV below) and (iii) the risk of giving the wrong incentive to policymakers with respect to the transparency and overall soundness and sustainability of public finances In particular it is important to avoid
Part II Recent development in fiscal surveillance
55
creating a situation where the possible recognition of a potentially sizeable transaction as a one-off would provide an incentive to policymakers to build up arrears or accumulate losses or to present specific categories of intrinsically structural expenditure (such as gross fixed capital formation) as one-off expenditure The exceptional size of the impact of a measure or event is not alone a sufficient condition for classifying it as a one-off measure
322 Principle II The one-off nature of a measure cannot be decreed by law or by an autonomous government decision
In order to ensure timely and effective policy surveillance it should be possible to evaluate the one-off nature of a measure unambiguously upon its announcement For that reason the one-off nature of a measure should not depend on whether the policymaker announces the measure as temporary or permanent Policy measures announced as temporary often later become permanent (even when their temporary nature is enshrined in legislation) whilst measures announced without an expiration date may be terminated shortly after their entry into force Making the one-off nature of a measure dependent on the way it is announced would lead to inconsistencies two otherwise identical measures could be assessed differently purely because of the way they have been announced This would be neither meaningful nor acceptable Furthermore the frequent ex post revision of classifications that would be needed on any occasion where the actual course of events differed from the announcement would make the concept of one-off measures unusable for real-time fiscal surveillance
For this reason the one-off nature of a measure cannot depend on the way it has been announced by policymakers Since it is not practical to wait and see to what extent the impact of a measure really is temporary the classification as a one-off needs to rely exclusively on the inherent characteristics of the measure (mentioned under Principle I) that prevent it from having a sustained impact on the budgetary position This is particularly the case for changes in tax or contribution rates or in aggregate expenditure levels that are announced (or legislated) by policy makers to be temporary Apart from very short-
term transitional effects as referred to under Principle I(c) above the impact of changes to tax or contribution rates or to aggregate expenditure levels should always be considered as structural even if the change is reversed shortly after its initial introduction In such cases the reversal of the initial measure also qualifies as a structural measure A corollary to this principle is that temporariness alone is not a sufficient condition for identifying a one-off measure many temporary measures are not in fact one-off
323 Principle III Volatile components of revenue or expenditure should not be considered one-off
The concept of one-offs should not be lsquomisusedrsquo as a way of smoothing the volatility of particular components of government revenue or expenditure It is clear that the cyclical part of revenue or expenditure (ie the part that is correlated to the output gap) should not be considered as a one-off as its impact is already corrected for via the cyclical adjustment of the general government balance But even after this cyclical adjustment revenue or expenditure components may still exhibit a significant degree of volatility The concept of one-offs is not however primarily intended to smooth time series and should therefore not be used to correct for this kind of volatility Identifying one-offs is instead intended to filter out certain transactions that intrinsically cannot lead to a sustained improvement of the government balance Moreover the volatility of some components of revenue and expenditure does not even result from a policy measure and also for this reason does not qualify as a one-off measure Nevertheless it may not always be easy to distinguish between the intrinsic volatility of revenue and expenditure and measures taken in response to an exceptional event (Principle I(d))
324 Principle IV Deliberate policy actions that increase the deficit do not as a rule qualify as one-offs
The provisions on one-offs were primarily introduced in order to avoid policy measures that do not lead to a sustained improvement of the budget balance being treated as structural In order to give policymakers the right incentive to fully recognise the permanent budgetary impact of
European Commission Public finances in EMU - 2015
56
their actions there is therefore a strong presumption that deliberate policy actions that increase the deficit are of a structural nature These measures should only exceptionally be classified as one-offs in cases where it can be unambiguously demonstrated that they have an intrinsic temporary nature
As a result the principles listed above need to be implemented in a restrictive manner for deficit-increasing measures This holds in particular for deficit-increasing one-off measures introduced in response to lsquoexceptional eventsrsquo as described in Principle I(d) Only measures designed to counter the very direct impact of an exceptional event that can be considered to be strictly outside the governmentrsquos control should be eligible for potentially being classified as one-offs By contrast when the government has been building up implicit andor contingent liabilities which could reasonably be expected to materialise at some point in time (eg by giving guarantees to loss-making public companies) the event triggering the liability should not be considered exceptional and the resulting budgetary impact should also not be considered a one-off Great care should also be taken to avoid a situation where the concept of one-off measures creates an incentive for policymakers to deliberately accumulate payment arrears or losses in the hope that these could all subsequently be settled simultaneously without affecting the structural balance Lump-sum upfront expenditure resulting from a deliberate policy action (ie unrelated to an exceptional event) aimed at reducing expenditure in the future would as a rule also not qualify as a one-off
325 Principle V Only measures having a significant impact on the general government balance should be considered one-offs
As a rule measures worth less than 01 (rounded) of GDP should not be considered one-offs Widening the definition to a larger number of measures would considerably increase the complexity of the task of monitoring government finances Moreover smaller measures are also more likely to be part of the day-to-day management of government finances and use of such measures would therefore mainly contribute to the normal volatility of public finances (see also Principle III)
Nonetheless one-off measures are not strictly limited to only those worth at least 01 of GDP First in cases where a number of similar measures can be logically grouped together (by nature of the measure or as a result of having similar adoption procedures eg a reform package) and have a combined impact of at least 01 of GDP the aggregated impact could be classified as a one-off Second measures worth less than 01 may be classified as one-offs for reasons of consistency across Member States in particular when an exceptional event affects several Member States in a similar way An example of this is major statistical revisions The impact of the introduction of ESA2010 on Member Statesrsquo contributions to the EU budget has been treated as a one-off in all Member States even though the effect was less than 01 of GDP in some Member States Finally the impact of some measures may be recorded statistically in two successive years but the classification of the measure should remain the same If the measure has the inherent characteristics of a one-off listed in Principle I it would be sufficient that the measure has an impact of at least 01 of GDP in one year for it to be classified as a one-off for both years (ie the budgetary impact attributed to the other year would still be recognised as a one-off even though it may be less than 01 of GDP in that year)
33 AN INDICATIVE LIST OF lsquoTYPICALrsquo ONE-OFF MEASURES WITH JUSTIFICATIONS FOR THE CLASSIFICATION OF EACH
This section presents a list of stylised examples of one-off measures compiled on the basis of the experience gathered over the last decade in the classification of one-off measures The list is not designed to be exhaustive but provides a broad sample of frequently occurring cases together with the reasoning as to why (or why not) these measures should be considered one-offs with explicit reference being made to the general principles set out above These cases should serve as guidance for assessing the measures actually being used by governments Nevertheless it should be emphasised that expert judgement is still required as the characteristics of each individual measure need to be examined carefully on the basis of the general principles listed above
Part II Recent development in fiscal surveillance
57
331 Tax amnesties and other similar arrangements that generate a lump-sum tax revenue
Tax amnesties (and other similar arrangements) often include incentives for taxpayers that may lead to exceptional peaks in government revenue Measures of this type may therefore qualify as one-offs Tax amnesties (and other similar arrangements) are understood here to mean any government decision allowing private or corporate taxpayers to regularise their position vis-agrave-vis the tax authorities on relatively favourable terms (which may include a temporary reduction of administrative fines or the authorities removing the threat of criminal prosecution) Tax amnesties may involve a significant group of taxpayers being offered an incentive to regularise their position before a given point in time (after which the conditions for a settlement are likely to become considerably less attractive) thereby effectively creating an exceptional peak in revenue just before the arrangement is expected to expire The incentive for taxpayers to act is usually created by the scheme having a pre-defined expiration date but it could also result from the high risk (as perceived by the taxpayers) that an existing scheme will be discontinued at a specific point in time If such an exceptional peak in revenue occurs it can be classified as a one-off The treatment as a one-off measure is justified on the basis of Principle I(b)
The above reasoning does not exclude the possibility that some tax amnesties (and other similar arrangements) may also have a permanent impact or be in themselves of a permanent nature Successful tax amnesties may in some cases contribute to a permanent increase of the tax base thereby also generating a permanent increase in tax revenue (in addition to the possible one-off effect) This impact is clearly of a structural nature Similarly open-ended tax settlement schemes in which taxpayers can come forward to regularise their position (in exchange for payment of an administrative fine for example) and which do not have a pre-defined (or generally understood) ending date would also not normally generate exceptional peaks in government revenue The introduction of an open-ended scheme would qualify as a structural fiscal policy measure and would have a permanent impact from its first year in force The critical distinguishing feature here is
the presence of incentives that lead to an exceptional peak in revenue
332 Peaks in tax collection triggered by the introduction or expected introduction of new tax rules
In a similar way to tax amnesties with a fixed expiration date the announcement of new tax rules may also generate significant one-off peaks in tax collection In some cases if the tax regime being introduced is considerably less favourable taxpayers may be allowed to advance their settlements to before the entry into force (or expected entry into force) of the new rules thereby benefiting from the more favourable regime for a certain number of transactions that would otherwise have come under the new regime In such cases the general government balance may profit from some exceptional revenue in the year preceding the year in which the new tax rule is applied This effect may have been created intentionally or unintentionally by the government but is usually at the expense of future revenue from after the date on which the new tax regime is actually implemented If the temporary peak in revenue is significant and clearly observable the excess revenue can be considered as a one-off A concrete example would be when the government announces a significant increase in the tax rate paid on reserved profits when a company goes into liquidation The announcement of this increase may prompt in particular owners of micro-companies close to retirement age to advance the liquidation of their company in order to ensure that they still benefit from the lower tax rate This would create a peak in the revenue collected from this liquidation tax in the year before the tax increase is introduced The treatment as a one-off measure is justified on the basis of Principle I(b)
A possible temporary reduction in tax revenue immediately following the introduction of the less favourable tax regime would not normally be classified as a one-off effect After the introduction of the new less favourable tax regime it may be normal for tax revenue to be lower for a certain period possibly up to several years This can be understood as the logical counterpart to the one-off peak in tax collection seen prior to the reform The change in tax revenue after the introduction of the reform is likely to be less pronounced however as the loss in revenue
European Commission Public finances in EMU - 2015
58
may be spread over a longer period of time The effect of lower tax revenue is deficit-increasing and may also be more difficult to quantify given the uncertainty as to what is the new steady state following the introduction of the new tax regime For these reasons the change in revenue is considered part of normal volatility and not a one-off effect
Nonetheless there are many tax reforms that may not generate a peak in tax collection If no pronounced peak in tax collection can be identified the measure should not be classified as a one-off This may be the case where for example the announced increase in the tax rate is small (eg a marginal increase in VAT) or is part of a wider tax reform where the impact of different aspects of the reform cannot be clearly distinguished
333 Permanent changes to the timing of recurrent revenue or expenditure
Permanent changes to the timing of items of recurrent revenue or expenditure may create exceptional peaks that qualify as one-offs A typical example would be a decision to permanently bring forward the settlement of income tax which would cause additional revenue to be generated from income tax in the first year following its entry into force Although the measure is permanent it creates an exceptional and temporary peak in tax revenue in its first year which should be recorded as a one-off effect A similar logic also applies to decisions to permanently delay the timing of certain categories of recurrent expenditure For example if the government usually approves a certain investment grant towards the end of the year it could at some point decide to delay the approval of applications for grants and from then on not approve them until the beginning of the following year If the expenditure were recorded as being at the date of the governmentrsquos decision to issue the grant there would be a one-off gain in the first year in which the new schedule is in force (70) The treatment as a one-off measure is justified on the basis of Principle I(c)
(70) For many transactions however changes in timing of this
type may only be visible in cash terms As a general rule following the accrual principle capital transfers in cash should be recorded as occurring at the time the liability is established regardless of the payment schedule
When a particular item of expenditure is permanently accelerated however the potential temporary effect should not be considered as a one-off This follows the logic of Principle IV the measure would be fully under the control of the government and is deficit-increasing Moreover it might be difficult to maintain that the increase in expenditure is a temporary effect resulting only from a shift in timing and to exclude entirely the possibility that it may lead to a permanent increase in the level of expenditure It is therefore prudent not to consider a measure of this type as a one-off
334 Exceptional changes to the timing of recurrent revenue or expenditure
Decisions to exceptionally shift the timing of items of recurrent expenditure or revenue also sometimes constitute one-off measures A typical example would be a decision to exceptionally shift the timing of the payment of an annually recurring investment grant thus not paying it out one year while paying it twice the following year If the government subsequently resumes its normal payment structure a transaction of this type creates a temporary fall in expenditure in the first year which is fully offset by a symmetrical temporary increase in expenditure the following year Both the deficit-reducing impact in the first year and the deficit-increasing impact the following year should be classified as one-off effects The treatment as a one-off measure is justified on the basis of Principle I(c) For the deficit-increasing part an exception to Principle IV is justified on the basis of the strict symmetry between the deficit-increasing and deficit-reducing effect of the measure
An important distinction should be made between the cases described above and decisions to shift the timing of non-recurrent items of expenditure or revenue which normally do not create one-off effects This can be illustrated using the example of a government that is planning to make an investment in a project but then subsequently postpones its plans by one year The question as to how to treat the postponement of the investment decision depends on how the investment decision was originally recorded (in particular whether the investment was considered to be a policy measure or part of the no-policy-change baseline projection) If the initial investment decision was considered to be part of the no-policy-change baseline projection
Part II Recent development in fiscal surveillance
59
(because the investment was not of exceptional size and did not alter the trend projection of investment) then the postponement of the project should also not be considered a fiscal policy measure and a fortiori also not a one-off If on the other hand the project was of such magnitude that it would have altered the no-policy-change government investment path the initial investment decision should be considered as a fiscal policy measure A decision to delay the investment to the next year would simply lead to the cancellation of the measure in the first year and the re-introduction of the same measure in the next year neither of which should be considered one-offs
335 Sales of non-financial assets (71)
A common example of a one-off measure is the sale of real estate (eg land and buildings) However it is to be noted that not all real-estate sales have the characteristics of a one-off In particular real-estate transactions that are part of the day-to-day management of government assets in which some buildings may be sold to be replaced by more suitable ones generally do not qualify as one-offs The classification of a sale as a one-off should be based on the following two criteria (i) whether the transaction contributes to a significant aggregate drop in government assets of the same type (ie the government is systematically selling off buildings or land in net terms) andor (ii) whether the measure will lead to higher recurrent costs in the future (for instance because the government is systematically substituting for ownership with rental contracts) For cases such as these the treatment as a one-off measure is justified on the basis of Principle I(a) or I(b) respectively
Payments for licences and concessions also often used to be classified as one-offs under ESA95 but their importance as a source of one-off transactions is much reduced under the ESA2010 accounting treatment Very often governments issuing licences or concessions for a number of years receive a lump-sum payment at the time when the licence or concession is granted Under ESA95 accounting rules the entire payment
(71) This paragraph refers exclusively to non-financial assets
(eg buildings land licences and concessions) as according to ESA2010 accounting rules the disposal of financial assets does not affect the general government balance
was recorded as negative expenditure at the time when this transaction took place Accordingly the payment was considered to be a one-off However the prevalence of such cases has been reduced considerably with the introduction of the ESA2010 accounting standard In particular in most cases the proceeds will now be distributed in accrual terms over the lifetime of the license (in most cases recorded as lsquoRentrsquo ESA2010 code D45) even if on cash basis the government receives the payment as a lump-sum The rent is then a recurrent source of government revenue and is obviously not a one-off Only in the remaining cases where payments are still recorded as negative expenditure (Acquisitions less disposals of non-produced non-financial assets ESA2010 code NP) at the time of the payment the transaction should be considered one-off For those cases the treatment as a one-off measure is justified on the basis of Principle I(b)
The sale of several other types of non-financial asset could also fall under this same general heading The sale of CO2 emission rights (lsquoAssigned Amounts Unitsrsquo under the Kyoto Protocol) is one of a number of clear cases in which the government is selling assets and thus generating one-off revenue at the time of the transaction Another example would be the sale of non-financial assets that the government has acquired in the context of a bank rescue operation
336 Exceptional revenue from the taking over of the assets and liabilities of pension schemes of entities classified as being outside general government
Under ESA95 accounting rules the takeover of pension funds was a frequent source of one-offs When a government takes over the assets and liabilities of pension schemes of entities classified as being outside the general government significant lump-sum payments may be made from that entity to the general government in return for the government covering future pension liabilities Under ESA95 the transfer of the assets of the fund was recorded in a single year as a deficit-improving capital transfer which was considered to be a one-off measure
Changes in the accounting treatment brought in under ESA2010 are likely to mean that transactions of this type are a much less
European Commission Public finances in EMU - 2015
60
frequent source of one-offs Providing the assets transferred to the government and the actuarial value of the pension schemersquos future liabilities are balanced under ESA2010 the lump-sum payment received by the government should now be recorded as a financial transaction that does not have an impact on the general government deficit In accrual terms the revenue will very generally speaking be distributed over the years in which the liabilities of the scheme materialise Overall the general government balance is not affected by a balanced pension fund transfer and the impact on revenue and expenditure will be recurrent
In the case of an unbalanced pension fund transfer however any assets transferred to the general government in excess of the liabilities would still qualify as a one-off When the assets of the pension fund are greater than the liabilities the excess transfer of assets (ie the part not matched by liabilities) would be recorded as a deficit-improving capital transfer at the time of the takeover This would imply that the government was generating lump-sum revenue by drawing on its assets (or those of public companies under its control) and the revenue should therefore be recorded as a one-off The treatment as a one-off measure is justified on the basis of Principle I(a)
When the assets of the pension scheme are smaller than the liabilities the resulting capital transfer should not be considered a one-off This treatment is justified by the fact that the transfer is in this case deficit-increasing and fully under the control of the government not classifying this as a one-off is fully consistent with Principle IV
337 Temporary peaks in revenue or expenditure resulting from a ruling issued by a court or another independent authority or from major statistical revisions
Court rulings (and decisions issued by other independent authorities) may give rise to significant and very short-term positive or negative peaks in government revenue or expenditure which qualify as one-offs Court rulings often lead to lump-sum payments designed to compensate for damages or implicit liabilities that have accumulated over a long period of time (often without the government being aware of
them) These rulings can usually be considered to be lsquoexceptional eventsrsquo as defined above and any peak in government revenue or expenditure directly resulting from them can therefore be classified as a one-off Important issues to consider in assessing the one-off nature are (i) whether the ruling or decision can be considered as an exceptional event (which may require a certain degree of judgement) and (ii) whether the resulting revenueexpenditure measures were directly prompted by the ruling or decision (the effect of any decision made by the government in excess of what is ordered by the court would normally not qualify as a one-off) Typical examples would be the reimbursement of taxes or subsidies that were found to be unlawful Any recurrent impact the court ruling may have would also of course not qualify as a one-off A very similar justification could also be given for fines paid following a decision taken by another independent authority (such as the EU) The treatment as a one-off measure is justified on the basis of Principle I(d)
A similar conclusion could be reached for reimbursements from or additional payments to the EU budget made necessary by major statistical revisions or changes in EU legislation When such reimbursements or additional payments exceed the level of normal fluctuations and are linked to over- or underpayments from several years there would be clear grounds for qualifying them as one-offs The major statistical revision or change in EU legislation that triggers the reimbursementpayment could be considered an exceptional event with budgetary implications that are beyond the control of a single Member State (a circumstance which also justifies the classification as a one-off in the case of deficit-increasing payments) When major statistical revisions of this type affect all Member States simultaneously the impact of such revisions is classified as one-off for all Member States for the sake of consistency even if the 01 of GDP criteria is not met for some countries The treatment as a one-off measure is justified on the basis of Principle I(d) An exception to Principle V is also justified for reasons of equal treatment
The one-off nature of reimbursements of or financial corrections to EU funds by Member States following a decision issued by an EU institution (eg in cases where not all conditions
Part II Recent development in fiscal surveillance
61
attached to the funding have been met) may be more difficult to assess On the one hand such reimbursements or corrections may occur quite frequently as the Commission reviews the eligibility of operational programmes and funded projects and whether they are meeting the conditions of the funding on a continuous basis The reimbursements and corrections may also involve relatively small amounts In view of this these payments should be considered a normal recurrent feature of government finances (ie part of normal volatility) and do not qualify as one-offs according to Principle III On the other hand in exceptional cases (in particular towards the end of a programming period) the Commission may undertake a more extensive audit potentially covering a wide range of projects (eg all the projects being carried out under a specific operational programme) and in particular a number of successive years The results of the audit could lead to very short-term reimbursements or corrections of a higher value connected with irregularities that have been accumulating over a much longer period of time In such cases the audit could be considered an exceptional event in a similar way to a court ruling and the resulting reimbursements or corrections would therefore qualify as one-off measures In summary a reimbursement or correction must meet all of the following criteria simultaneously in order to be classified as a one-off (i) the reimbursement or correction should be linked to a single exceptional event (ii) the impact should exceed the level of normal fluctuations (iii) the reimbursement or correction should relate to irregularities that have accumulated over several years and (iv) the impact is recorded in at most two successive years in accrual terms When the above conditions are met the treatment as a one-off measure is justified on the basis of Principle I(d)
Given however the complexity of these cases the temporary nature of reimbursements of or corrections to EU funding may be difficult to assess ex ante It is conceivable that for practical reasons (such as the capacity of the audit service to screen a large number of projects in a short period of time) the reimbursements or corrections take place over a longer period of time which would give grounds for a strong presumption that at least part of the impact has a more structural nature An ex post review of the one-off nature may therefore
be required This could lead to a reclassification or partial reclassification of a measure
338 Short-term costs associated with emergency response to major natural disasters or other exceptional events
The short-term cost of emergency measures taken by a government in response to a major natural disaster may be considered as a one-off even if these measures are deficit-increasing The classification as a one-off depends on all conditions for an exceptional event being fulfilled In particular the exceptional event must (i) be a specific punctual occurrence (eg an unusual amount of rainfall throughout the year would not normally qualify whereas a specific storm of exceptional magnitude could) and (ii) have a sudden impact on the revenueexpenditure or assetsliabilities of the general government or the country exceeding the level of normal fluctuations meaning that the government is forced to react Consistent with the general approach to exceptional events only costs that are directly and immediately caused by the disaster can be considered one-offs ie the cost of the measures needed in order to limit the damage to the government or to the country and to prevent the disaster from having an even more significant impact (eg direct medical relief and shelter for victims and the cost of limiting pollution or destruction) As a rule compensatory payments to households or businesses which are not directly triggered by the exceptional event and for which the government has a larger degree of discretion would not be considered as one-offs Generally expenditures that follow with a considerable delay after the exceptional event are less likely to be true emergency costs even though they may still be linked (indirectly) to the event The exceptional nature of such costs depends on the size of the country and on country-specific factors These are therefore the factors which should be considered when deciding whether to classify a measure as a one-off (For example a forest fire of a certain magnitude might be considered as an exceptional event if it occurs in a particularly small Member State but not if it is in a very large Member State) The treatment as a one-off measure is justified on the basis of Principle I(d)
Short-term emergency costs may also relate to events other than natural disasters A case in
European Commission Public finances in EMU - 2015
62
point is a capital transfer by the government to systemic banks to prevent them from collapsing The potential collapse of a systemic bank can be considered an exceptional event that is beyond the control of the government and could potentially have a major impact on the economy Furthermore the action taken by the government to prevent systemic damage to the financial system and the economy as a whole can be considered as a direct response to this exceptional event which as stated the government could not have avoided Note however that in the wake of the 2008 financial crisis no explicit distinction was made between government intervention to prevent the collapse of systemic and non-systemic financial institutions all deficit-increasing capital injections into distressed financial institutions have been treated as one-offs (72) The treatment as a one-off is justified on the basis of Principle I(d)
34 STANDARD CASES NOT TO BE CONSIDERED ONE-OFFS
This section sets out a number of measures generally not considered to be of a one-off nature This list should be read in conjunction with the list of measures that are typically one-offs provided in the previous section It contains a variety of measures that have a number of borderline characteristics This section explains the reasons why on the basis of the principles listed above and after careful consideration these measures have not however been classified as one-offs
341 Participation in large-scale military operations
The potentially considerable budgetary cost of participation in large-scale military operations does not generally qualify as a one-off In particular international conflicts do not generally qualify as exceptional events as referred to in Principle I as (i) the event triggering the intervention does not usually have an immediate and sudden impact on expenditure or on the assets of the government or the country but instead has
(72) Also in the opposite case when following a bank rescue
operation the government is recovering part of the injected capital in the form of a capital transfer from the financial corporation this transaction would be considered one-off
an impact in the medium term (ii) the cost of the intervention is often recurring or spread over several years (despite large-scale operations often being announced as temporary) and Member States often engage in several operations (of varying scale and budgetary impact) simultaneously or in rapid succession further substantiating the conclusion that this cost is a structural feature of government expenditure and (iii) given that the measure is deficit-increasing it should also be taken into consideration that many of these operations are for the most part within the control of the government The rejection as a one-off measure is justified on the basis of Principles I and IV
342 Large-scale infrastructure works and acquisition of military equipment
In the same way as any other form of government investment large-scale infrastructure works and expenditure on military equipment are considered a structural component of government expenditure Even if the budgetary impact of individual transactions is sufficiently sizeable to be considered a deviation from the no-policy-change baseline and therefore recorded as a fiscal policy measure such measures are not considered as one-offs as they are deficit-increasing and fully under the control of the government The rejection as a one-off measure is justified on the basis of Principles I and IV
343 Exceptional dividends from state-owned enterprises and central banks
Property income (including dividends from state-owned enterprises (SOEs) and central banks) is a regular and structural source of government income Although property income can show a certain degree of volatility changes in revenue from property (including dividends) that occur as a result of normal economic fluctuations should not be categorised as one-offs Such fluctuations are moreover not a fiscal policy measure The rejection as a one-off measure is justified on the basis of Principle III
Fluctuations in dividends may not be caused only by volatility in the underlying profits but also by changes in the lsquonormalrsquo dividend policy Dividend policies (which the government as the owner of the company may have significant
Part II Recent development in fiscal surveillance
63
influence on) could for example include a rule that a certain fraction of the entrepreneurial profit is paid out to the companyrsquos shareholders A decision to change the fraction of profits to be paid out even temporarily although qualifying as a policy measure should however not be considered as a one-off The reason for this lies in the general principle that one-offs cannot be decreed by law or by an autonomous government decision Opening up the possibility to classify cases of this type as one-offs would inevitably lead to multiple ex post revisions as temporary deviations from the lsquonormalrsquo policy can be repeated and may eventually replace the lsquonormalrsquo policy A similar reasoning would apply to cases where SOEs do not have a lsquonormalrsquo dividend policy (ie where the dividend is fixed every year on an ad hoc basis) Changes made to the dividend of these SOEs would also not qualify as one-offs The rejection as a one-off measure is justified on the basis of Principle II
Changes in the profits of corporate or central banks may nonetheless qualify as one-offs if they are the result of an exceptional event Whereas the 2006 Report on Public Finances in the EMU mentioned lsquoexceptional dividends of state-owned companiesrsquo as part of the lsquoindicative and open list of one-off measuresrsquo the current provisions clarify that normal volatility and changes in dividend policy do not qualify as lsquoexceptionalrsquo Instead a dividend being classified as one-off is strictly linked to the existence of an exceptional event in accordance with Principle I(d) It should however be noted that such cases are likely to remain rare in view of the ESA2010 provisions on lsquosuper dividendsrsquo According to ESA2010 a dividend payment exceeding the lsquoEntrepreneurial income (ESA2010 code B4) excluding holding gainsrsquo of a state-owned enterprise should be recorded as a financial transaction (lsquoCapital withdrawalrsquo ESA2010 code F5) not affecting the general government balance In practice many lsquoexceptionalrsquo dividends may therefore turn out to be super dividends thus precluding possible classification as a one-off
344 Exceptionally high tax revenue not attributable to changes or announced changes to tax rules
Exceptionally high tax revenue that is not the result of changes or announced changes to tax
rules is not a one-off In some cases exceptionally high tax revenue (in particular from corporate taxation or wealth taxes) can be attributed to significant fluctuations in the tax base unrelated to any change or announced change to tax rules or to any other policy measure This is the case for example if taxes are only levied when certain profits are paid out or when certain holding gains materialise In such cases profits or holding gains that have accumulated over many years may become taxable in a single year giving rise to a potentially significant peak in tax revenue The absence of any change in tax legislation or of a link to a policy measure introduced before or after the peak supports the view that such variations are part of the lsquonormalrsquo economic fluctuations inherent to the design of the tax system (although they can have a very sizeable temporary impact) and should not be confused with (one-off) fiscal policy measures The rejection as a one-off measure is justified on the basis of Principle III
345 Hosting major events including major sports events
The budgetary impact of hosting major events including major sports events should not be considered a one-off The organisation of events of this type is fully under the control of the government and therefore does not qualify as a potential one-off The rejection as a one-off measure is justified on the basis of Principle IV
346 Revenue from the exploitation of non-renewable natural resources
Revenue resulting from the exploitation of non-renewable natural resources is not considered a one-off Strictly speaking it could be argued that revenue resulting from the exploitation of non-renewable natural resources (such as oil coal and gas) goes hand-in-hand with a depletion of the stock of these resources and therefore that it has one of the particular characteristics of a one-off (see Principle I(a) above) Nevertheless given the typically very long period of time over which it is generated (usually several decades) regular revenue from the exploitation of non-renewable natural resources is considered to be recurrent The rejection as a one-off measure is justified on the basis of Principle I
European Commission Public finances in EMU - 2015
64
347 Costs related to the EU presidency
Costs related to the EU presidency are not considered to be a one-off but are viewed as a structural component of EU membership In particular costs related to the EU presidency should not be considered exceptional events as defined in Principle I(d) as the costs are at least partly under the control of the government and in practice rarely exceed what could be considered normal fluctuations Moreover the expenditure is deficit-increasing An additional consideration is that in practice it is very difficult to distinguish costs related to the EU presidency from other administrative costs which complicates the task of estimating their impact The rejection as a one-off measure is justified on the basis of Principles I and IV
348 Financial support to SOEs including loss-making SOEs
Providing financial support to loss-making state-owned enterprises is as a rule not considered a one-off This can be explained by considering the statistical treatment of expenditure of this type whenever the government provides funds while receiving something of equal value in return and expecting to earn a sufficient rate of return this is recorded as a financial transaction (eg loans or the acquisition of equity) Since this does not affect the general government balance it can also not be considered a one-off The cases that do not fall into this category are mainly transactions that are recorded as lsquoCapital transfersrsquo (ESA2010 code D9) ie transactions where the government either (i) does not receive equal value in exchange (ii) does not expect a sufficient rate of return or (iii) provides funds to a corporation that has shown a series of losses in the recent past In many cases the loss-making nature of the SOE receiving the transfer is a structural feature which would preclude qualifying its need for financial support as an exceptional event In addition allowing financial support to SOEs to potentially be classified as a one-off measure would actually create an incentive for policymakers to let losses accumulate until the point where they are large enough to be absorbed in the form of a one-off measure Moreover the decision to grant support to the SOE under the conditions mentioned above is fully under the control of the government and clearly deficit-increasing Overall these arguments
clearly support a decision not to classify such transactions as one-offs The rejection as a one-off measure is justified on the basis of Principles I and IV
One possible exception could be government expenditure directly related to the privatisation or voluntary liquidation of an SOE (termination costs) The aim of this expenditure is very specifically to allow the privatisation of a loss-making SOE or to terminate its operations entirely In these exceptional cases the deficit-increasing impact of the underlying transaction(s) could be accepted as a one-off provided that (i) the government has entirely renounced control of the company and will have no further financial involvement or the company itself ceases to exist (therefore precluding a possible recurrence of the transaction) or (ii) the transaction can be unequivocally demonstrated to be beneficial for public finances by virtue of the fact that it permanently cleans up the accounts of the loss-making SOE (for instance by closing down loss-making subsidiaries or business units) and permanently halts the recurrent stream of liabilities originating from it
An additional complication may arise when support to SOEs including loss-making SOEs takes the form of guarantees which may be called at some point in time Whilst a guarantee has not been called it forms a contingent liability for the government Once it has been called it creates a capital transfer which is economically very similar to that which occurs when a government provides support to a loss-making SOE by means of a direct capital injection especially in terms of the expected change in the financial situation of the company and the budgetary impact of the transaction for the government Differentiating between the two types of transaction in terms of their one-off treatment may therefore lead to regulatory arbitrage with the method that is subject to less stringent treatment in terms of budgetary surveillance becoming the preferred way to provide financial support to SOEs Similarly to capital injections into SOEs including loss-making SOEs these transactions should thus as a rule not be considered as one-offs The rejection as a one-off measure is justified on the basis of Principles I and IV
Part II Recent development in fiscal surveillance
65
A call of guarantees could nonetheless constitute a one-off if it has been prompted by the occurrence of an exceptional event As the classification of this measure as a one-off would however still depend on (i) the company being in good financial shape when it received the guarantee (ie not loss-making) (ii) the call and the release of the guarantee being connected to an exceptional event as referred to in Principle I (in particular an event which is beyond the control of the government and with an impact that significantly exceeds normal economic fluctuations) (iii) government guarantees of this kind being an exceptional practice in the sector or in the economy in general and (iv) the company not having previously benefited from similar guarantees Non-compliance with any of these requirements would constitute a strong argument against considering the call as a one-off measure
4 THE COMMUNICATION ON MAKING THE BEST USE OF FLEXIBILITY WITHIN THE STABILITY AND GROWTH PACT
66
This chapter presents the rationale behind and the practical implications in the context of the preventive arm of the SGP (see Chapter II2) of the Commission Communication Making the best use of flexibility within the existing rules of the Stability and Growth Pact (73) issued on 13 January 2015 The Communication provided new guidance on the implementation of the Stability and Growth Pact (SGP) with the aim of ensuring that best possible use is made of the flexibility that is built into the existing rules of the SGP rather than changing these rules As a result no legislative steps were needed and the Commission was able apply this new guidance immediately (74)
The new guidance is designed to strengthen the link between structural reforms investment and fiscal responsibility in order to support jobs and growth Its three specific aims are (1) to encourage the effective implementation of structural reforms (2) to promote investment also through the new European Fund for Strategic Investment (EFSI) (75) and (3) to better take into account the economic cycle in individual Member States The last of these three points is discussed in Section II22 of this report The aim of the first two points is to take into account the short-term budgetary cost of major structural reforms and of certain types of government expenditure on investment provided that they improve the sustainability of public finances including through the expected positive impact on potential output Overall the new guidance should thus contribute to a more growth-friendly fiscal stance in the euro area (76)
(73) COM(2015) 12 of 13 January 2015 (74) Some details relating to the implementation have been
recently discussed in the Committees See Section II43 (75) The EFSI set up jointly by the Commission and the
European Investment Bank (EIB) offers a new risk-bearing capacity which allows the EIB to invest in equity subordinated debt and higher risk tranches of senior debt and to provide credit enhancements to eligible projects
(76) See ECB President Mario Draghirsquos speech of 22 August 2014 [T]he existing flexibility within the rules could be used to better address the weak recovery and to make room for the cost of needed structural reforms [hellip] [I]t may be useful to have a discussion on the overall fiscal stance of the euro area Unlike in other major advanced economies our fiscal stance is not based on a single budget voted for by a single parliament but on the aggregation of eighteen [as of 1 January 2015 19] national budgets and the EU budget Stronger coordination
This guidance clarifies that equal treatment under the SGP does not mean taking a lsquoone-size-fits-allrsquo approach Equal treatment for all Member States and the predictability of the rules are central principles of the SGP The Commission Communication on flexibility within the SGP is of an interpretative nature (77) as it provides additional guidance without changing or replacing the existing rules As such it does not in any way modify the SGP itself but clarifies that its implementation needs to be combined with an economic assessment of each countryrsquos requirements as determined by the situation in that particular country
It is also on purpose that some discretion is left within the agreed rules for the Commission and the Council to assess the soundness of public finances in the light of country-specific circumstances in order to recommend the best course of action based on the latest developments and information
Nonetheless flexibility is subject to safeguards and conditions Member States can only take advantage of flexibility if they meet certain conditions in an ex ante assessment In addition delivery of the planned reforms on the basis of which the Member State has met the ex-ante conditions is checked in an ex post assessment Failure to implement announced structural reforms or to co-finance investment projects can result in the revocation of the additional flexibility granted and ultimately lead to sanctions This ensures that the credibility and effectiveness of the SGP in upholding fiscal responsibility are preserved
The degree of flexibility allowed depends on whether a Member State is in the preventive or the corrective arm of the SGP The aim of the
among the different national fiscal stances should in principle allow us to achieve a more growth-friendly overall fiscal stance for the euro area
(77) For another example of an interpretative Communication see Commission interpretative communication on certain aspects of the provisions on televised advertising in the lsquoTelevision without frontiersrsquo Directive OJ C 101 2842004 p 2
Part II Recent development in fiscal surveillance
67
preventive arm as mentioned in Chapter II2 of this report is to ensure that Member States have sound and sustainable public finances thus allowing fiscal policy to perform its counter-cyclical role when needed Given its forward-looking perspective the preventive arm can accommodate under certain conditions temporary and limited deviations from the medium-term budgetary objective (MTO) or the adjustment path towards it provided that these deviations are the result of measures that are ultimately expected to strengthen the sustainability of public finances This is the case for certain types of government expenditure on investment and for certain structural reforms In contrast the main purpose of the corrective arm is to ensure the prompt correction of existing excessive deficits Implementing structural reforms or additional spending on investment cannot therefore be accepted as lsquomitigating factorsrsquo to excuse a lack of effective action to correct an existing excessive deficit Structural reforms and contributions to the EFSI can however be taken into account as relevant factors at particular stages of the procedure in particular when deciding whether to open an Excessive Deficit Procedure (EDP) when setting or extending the deadline to correct the excessive deficit and when closing an EDP
The remainder of this section focuses on the guidelines on the treatment of structural reforms and investment It first presents the implementation of the provision of the SGP mdash which go under the name of the lsquostructural reform clausersquo and the lsquoinvestment clausersquo mdash as proposed by the Commission describing their legal basis the eligibility conditions and the procedure for their activation including the various safeguards that apply to this (Sections II41 and II42) Section II43 indicates how flexibility relating to structural reforms and investment expenditure is managed under the corrective arm of the SGP
41 TAKING INTO ACCOUNT STRUCTURAL REFORMS IN THE PREVENTIVE ARM THE STRUCTURAL REFORM CLAUSE
411 Legal background and eligibility conditions
The preventive arm provides the flexibility needed to support structural reforms without
compromising prudent fiscal policy making The SGP allows Member States implementing major structural reforms to deviate temporarily from the MTO or the adjustment path towards it in recognition of the short-term costs of reforms that will have positive budgetary effects in the long term including by increasing potential growth (78) The SGP thereby provides a form of budgetary incentive for implementing major structural reforms thus supporting this process
The structural reform clause allows a temporary deviation subject to clearly defined conditions These are of three types the first group of conditions relates to the nature of the reforms in terms of their impact the second group relates to the status of the reforms with respect to implementation and the third group relates to the Member Statersquos compliance with some explicit requirements displayed in the SGP These conditions are set out in more detail below and are summarised in Table II41 which also describes the procedure for allowing a deviation and the limits of the deviation itself
Conditions relating to the nature of reforms
Structural reforms need to meet a number of conditions relating to their impact and in order to be considered eligible They must (i) have a verifiable positive impact on the long-term sustainability of public finances and (ii) have a major impact
Whether structural reforms have an impact on the long-term sustainability of public finances is arguably difficult to assess It is neither possible (from a legal or an economic perspective) nor desirable to set up an exhaustive list of structural reforms that qualify for the temporary deviation Providing some broad guidance can however restrict the type of reforms which may be eligible There are two possible channels through which reforms can affect public finances in the long run First some structural reforms may generate a direct budgetary impact as is the case for example for pension reforms healthcare reforms and reforms to the civil service In addition some structural reforms may improve the sustainability of public finances via an indirect
(78) Article 5 of Council Regulation (EC) No 146697
European Commission Public finances in EMU - 2015
68
effect as they help to create higher potential output and thus lead to higher future government revenue At the same time some structural reforms may also generate budgetary costs particularly in the short run A qualitative assessment of a reformrsquos impact on the sustainability of public finances should therefore encompass all these possible budgetary effects
This assessment is to be conducted by the Commission and the Council on the basis of information provided by Member States The Code of Conduct of the SGP (79) states that the effects of the reforms over time lsquoare to be assessed by the Commission and the Council in a prudent way making due allowance of the margin of uncertainties associated to such an exercisersquo In practice the Commissionrsquos assessment builds on the information provided by the Member State on both the costs and savings directly caused by the reform and on the indirect budgetary impact it may have as a result of its potential effect on output Annex 1 to the Code of Conduct of the SGP which details the structure of the stability and convergence programmes (SCPs) stipulates
(79) Specifications on the implementation of the Stability and
Growth Pact and guidelines on the format and content of the stability and convergence programmes
that Member States should include information on the implications of major structural reforms for growth and public finances when submitting their economic and budgetary projections On the basis of the information provided by the Member State (80) the Commission makes an informed judgement as to whether the reform meets the condition that it must improve the sustainability of public finances
The second condition is that reforms must have a major impact The combined effect of a number of reforms can be considered when assessing whether this condition has been met While some individual reforms such as pension reforms may have a major positive impact on growth and the long-term sustainability of public finances well-designed and comprehensive packages of reforms addressing structural weaknesses can also be equally effective This is notably the case when the reforms introduced are mutually reinforcing thanks to an appropriate policy mix and effective sequencing of their implementation
(80) Member States applying for the use of the structural reform
clause are also requested to include in both their SCP and their National Reform Plan a table with a detailed description (including the budgetary impact) of each structural reform
Table II41 Overview of the clauses relevant to the preventive arm
Source Commission services
Part II Recent development in fiscal surveillance
69
Conditions relating to the implementation of reforms
Reforms can only be considered for eligibility for the clause after they have been adopted and their implementation must be monitored (81) It may however take time for the reform to show an effect and its implementation may be subject to delays and setbacks Where the reform in question has not yet been fully implemented the Commission will therefore monitor its implementation (82) This is to ensure that the reform is being enforced correctly and that it is having the intended effect
This condition is subject to a safeguard designed to prevent moral hazard If it is found ex post that a Member State has failed to implement the agreed reforms the allowed deviation from the MTO or the adjustment path towards it will no longer be considered as justified If in such cases there has been a significant deviation from the MTO or the path towards it the Commission will launch a Significant Deviation Procedure (SDP) (see Chapter II2 above)
Conditions relating to the Member Statersquos compliance with the requirements of the SGP
In order to ensure as far as possible that Member States respect the requirement to reach the MTO within the period covered by the SCP and that they maintain a margin of safety relative to the 3 -of-GDP threshold three additional eligibility conditions relating to Member Statesrsquo budgetary situation are attached to the clause These conditions place various limits on the headline and structural balances allowed when a Member State deviates from its MTO or the adjustment path towards it (83) The structural reform clause can only be
(81) Code of Conduct of the SGP p 7 lsquoOnly adopted reforms
should be considered provided that sufficient detailed information is provided in the Stability and Convergence Programmesrsquo
(82) While the SGP does not provide the means for monitoring the enforcement of structural reforms the legal framework in which the SGP operates mdash notably the European Semester exercise and the Excessive Imbalances Procedure (Regulation (EU) No 11762011 of the European Parliament and of the Council) mdash allows the Commission and the Council to assess the challenges and imbalances requiring structural reforms and to monitor action taken by the Member States
(83) Council Regulation (EC) No 146697
applied if all three of the conditions listed below are met and continue to be met once the clause is in application
bull the Member State remains in the preventive arm of the SGP
bull the Member State maintains a safety margin relative to the 3 -of-GDP deficit threshold (84) and
bull the budgetary position is expected to return to the MTO within the duration of the programme (ie by the year t+4 at the latest with t being the year in which the SCP is submitted)
This last condition is considered to be fulfilled if i) the initial distance from the MTO does not exceed 15 of GDP and the Member State respects its minimum benchmark (85) To ensure that a Member State returns to the MTO within the four-year period while allowing a maximum deviation of 05 of GDP a maximum initial distance that the Member State can be from the MTO at the time of applying for the clause must be set It is however not possible to determine with certainty four years in advance in which year a Member State is supposed to reach its MTO This is because for each year the adjustment required from a Member State is set only in the previous year in line with the matrix of requirements To overcome this uncertainty the Commission assumes as a simplification that the benchmark adjustment mdash the adjustment required in lsquonormal timesrsquo as explained in Table II22 mdash will apply namely an annual adjustment of 05 of GDP On this basis the maximum initial distance from the MTO is 15 of GDP in the year that the Member State applies to be allowed to use the clause
In addition a Member State that has benefited from the structural reform clause will not be
(84) The Code of Conduct stipulates that this safety margin
should be determined so as to take account of past output volatility and budgetary sensitivity to fluctuations in output This implies that the structural balance should be equal to or above the minimum benchmark (see Chapter II2 of this report)
(85) The minimum benchmark is a level of structural balance which takes into account past output volatility and budgetary sensitivity to output fluctuations With a structural balance at the minimum benchmark a Member State is likely to still respect the 3 deficit limit in case of economic downturn
European Commission Public finances in EMU - 2015
70
allowed to apply for it again until it has reached its MTO This restriction maintains the integrity of the MTO as the cornerstone of the preventive arm If the clause were allowed to be applied multiple times or more than once concurrently this could in effect negate the requirement for Member States to achieve their MTOs in the medium term This conclusion is supported by the record of Member Statesrsquo success in achieving their MTOs since the inception of the SGP Several Member States have consistently failed to meet their MTOs
412 Activation of the structural reform clause
Procedural requirements
The structural reform clause is activated on the request of the Member State concerned subject to compliance with the eligibility conditions Member States that wish to apply for the structural reform clause are required to present a comprehensive and detailed medium-term structural reform plan on the basis of which compliance with the eligibility criteria is assessed ex ante The plan mdash which can be included in the National Reform Programme and must be presented in the SCP together with the request for application of the clause mdash must include well-specified measures and must set credible timelines for their adoption and delivery The implementation of the reforms is then closely monitored as part of the European Semester exercise If the Member State is subject to an Excessive Imbalances Procedure (EIP) and has submitted a Corrective Action Plan containing the information required the implementation of the reforms is monitored within the EIP In both cases Member States are expected to provide in-depth and transparent documentation This documentation should quantify the impact of the reforms proposed both on the medium-term budgetary plans and on potential growth and should provide details of the timetable for implementation of the reforms
Pension reforms are subject to a specific assessment by Eurostat Pension reforms that introduce a multi-pillar system including a mandatory fully-funded pillar constitute a specific case and are therefore subject to slightly different conditions than other structural reforms For reforms of this type the allowed deviation is equal to the direct incremental impact of the reform on
the general government balance (86) The basis for this is that some contributions and other items of revenue that used to be recorded as government revenue are now being diverted to a pension scheme that is classified as being outside the general government sector thus causing an immediate increase of the deficit At the same time the corresponding outstanding pension obligations and other social benefits which used to be items of government expenditure are taken over by the pension scheme If a Member State wishes to make use of the clause allowing deviation from the MTO or the adjustment path towards it on the grounds of a pension reform it must liaise with Eurostat to verify the eligibility of the reforms envisaged It must also include in its SCP the cost incurred in the first year following the introduction of the reform and any annual incremental costs that will be incurred in subsequent years
The allowed deviation
The allowed deviation is effective from the year following the Member Statersquos application for the clause As indicated in Chapter II2 of this report the adjustments required each year to both the structural balance and the expenditure benchmark are set on the basis of the previous yearrsquos spring forecast The temporary deviation allowed on the basis of structural reforms included in the update of the SCP submitted in year t is effective from year t+1 onwards
The Communication on flexibility within the SGP differentiates between pension reforms and other types of structural reforms when determining the size of the deviation allowed In the case of a pension reform the allowed deviation from the adjustment path towards the MTO or from the MTO itself is equal to the direct incremental impact of the reform on the general government balance There is therefore no numerical cap on the magnitude of the allowed deviation In the case of other structural reforms however the allowed deviation cannot exceed 05 of GDP It is recognised that the costs and benefits of these other types of structural reforms cannot be estimated with certainty hence the need to put a cap on the allowed deviation The costs associated with pension reforms are however
(86) In accordance with Council Regulation (EC) No 146697
Part II Recent development in fiscal surveillance
71
directly measurable and can be verified by Eurostat
Box II41 explains how the adjustment path is determined when the structural reform clause is applied If a Member State is at the MTO it can depart from it for a period of three years by the amount of the allowed deviation If a Member State is converging towards the MTO a temporary deviation from the convergence path towards the MTO is allowed between year t+1 and year t+3 (87) As from the fourth year the Member State
(87) This also implies that a Member State adjusting towards
the MTO would be entitled to halt that adjustment if while
cannot deviate anymore from the MTO or the convergence path In the benchmark case of a 05 of GDP adjustment this mechanism implies a return of the Member State to its MTO As shown in Box II41 the method described reflects the fact that the allowed deviation is effective from year t+1 and that the Member State concerned is expected to achieve its MTO by the year t+4 at the latest
being entitled to the deviation they reach the point where they are at a distance from their MTO equal to the size of the temporary deviation)
European Commission Public finances in EMU - 2015
72
42 TAKING INVESTMENT INTO ACCOUNT IN THE PREVENTIVE ARM THE INVESTMENT CLAUSE
421 Legal background and eligibility conditions
Certain types of investment that increase potential growth are deemed to be equivalent to major structural reforms and may under certain conditions justify a deviation from the requirements set out in the preventive arm In a letter of 3 July 2013 from former Commission Vice-President Olli Rehn to the EU finance ministers the Commission provided some initial guidance on the application of the provisions allowing this deviation(88) This guidance commonly referred to as the lsquoinvestment clausersquo was further refined and formalised in the Commission Communication on flexibility within the SGP As a result a temporary deviation from the MTO or the adjustment path towards it may be permitted if it allows a Member State to finance certain specific investments that have positive direct and verifiable long-term effects on growth and on the sustainability of public finances
In the same way as the structural reform clause the investment clause is also subject to certain conditions These are of three types the first group of conditions relates to the nature of the investment in question the second group relates to the Member Statersquos economic situation and the third group common to both clauses relates to the Member Statersquos compliance with compliance with the requirements of the SGP These conditions are set out in more detail below and are summarised in Table II41 which also describes the procedure for allowing a deviation and the limits of the deviation itself
Conditions relating to the nature of government investment
The deviation must be the result of national expenditure on projects co-funded by the EU This includes expenditure on projects funded under the Structural and Cohesion policy (89) the Trans-
(88) In accordance with Article 5(1) of Council Regulation (EC)
No 146697 (89) Including projects co-financed through the Youth
Employment Initiative
European-Network and the Connecting Europe Facility and national co-financing of investment projects also co-financed by the EFSI EU-sponsored government investment relates to projects whose overarching objective is to promote long-term sustainable growth These projects are expected to have positive direct and verifiable effects on growth and therefore on the sustainability of public finances
Moreover co-financed expenditure should not be being used to substitute for nationally financed investment This condition is included in order to ensure that total public investment is not reduced given that the aim of the investment clause is not to deter public investment but on the contrary to encourage Member States to pursue productive investment in difficult economic conditions To assess whether this condition is being met the Commission checks that there will not have been any decline in gross fixed capital formation over the first year that the clause is applied on the basis of its economic forecasts
Conditions relating to the Member Statersquos economic situation
To be eligible for this clause a Member State needs to be considered to be in lsquobad economic timesrsquo or worse As defined in the matrix used in the SGP for determining the adjustments Member States are required to make this means that GDP growth is negative or that output is sufficiently below its potential to result in a negative output gap of over 15 of GDP This condition relates to the year for which the Member State requests application of the clause (90)
Conditions relating to the Member Statersquos compliance with the requirements of the SGP
As in the case of the structural reform clause the Member Statersquos headline and structural balance must remain within certain limits if the investment clause is being applied The relevant
(90) In contrast to the approach described in the guidance
previously given on the original investment clause introduced in 2013 the Commission will now apply the clause irrespective of the economic situation in the euro area or in the EU as a whole thus making it dependent only on the cyclical conditions faced by individual Member States The countries to have benefited from the investment clause are Bulgaria (2013 and 2014) and Slovakia (2014)
Part II Recent development in fiscal surveillance
73
conditions are identical to those presented in Subsection II412
Furthermore as was the case for the structural reform clause a Member State already benefiting from some allowed deviation cannot apply for the investment clause until the MTO has been achieved
422 Activation of the investment clause
Procedural requirements
The investment clause is activated ex ante when a Member State makes a request in its SCP It is subject to compliance with the eligibility conditions To be eligible to benefit from the clause in the year t+1 Member States should include the following information in their SCPs for year t i) the forecast path of national co-financing expenditure ii) detailed information on the positive direct and verifiable long-term budgetary effects of the expenditure covered by the clause and iii) the lsquocorrected pathrsquo that the structural balance would follow were the clause applied Moreover in the year following the year during which the clause has applied the Member State should report on the actual level of co-financing in its SCP
The allowed deviation
The temporary deviation allowed ex ante depends on the commitments made from the EU structural funds in favour of the Member
State concerned and on the level of planned co-financing The allowed deviation from the MTO or the adjustment path towards it is equal to the total amount of co-financing in the first year of application of the clause In the following years given that the national co-financing of EU-funded projects constitutes recurrent expenditure only positive incremental changes would be added to the temporary deviation originally allowed provided that the Member State continues to meet the other eligibility criteria This is intended to give Member States an incentive to increase investment and to take into account the proportion of investment that could potentially be co-funded in eligible Member States Incremental increases to the temporary deviation allowed are assessed and granted on the same basis as the initial temporary deviation ie Member States need to request an increase in their SCPs the previous year
As a safeguard the allowance will be reviewed ex post to allow the actual level of co-financing to be taken into account If the actual level of co-financing as shown in data available in year t+2 falls short of the projected level a correction reflecting the difference between the actual and the expected level will be added to the required change in the structural balance This could potentially lead to the opening of an SDP
Box IV42 explains how the adjustment path is determined when the investment clause is applied As for the structural reform clause the method described reflects the fact that the Member State concerned is expected to converge towards
European Commission Public finances in EMU - 2015
74
the MTO by the year t+4 at the latest the allowed deviation having been applied from year t+1
43 THE ECOFIN COUNCIL OF 8 DECEMBER 2015
The ECOFIN Council on 8 December 2015 confirmed a common position on the implementation of flexibility within the SGP on the basis of the draft agreed by the Economic and Financial Committee (91) The commonly agreed position specifies
minus The deviation allowed to Member States benefitting from the investment clause is capped at 05 of GDP The cumulative deviation allowed to Member States benefitting from the investment clause and the structural reform clause is capped at 075 of GDP
minus The possibility to request the application of the flexibility clauses also in autumn after the relevant Country-Specific Recommendation has been set by the Council in the spring provided that the allowed deviation from the existing budgetary requirement is made explicit through a revised CSR The Member State can apply for the clauses in its Draft Budgetary Plans or in ad hoc documents
minus By the end of June 2018 the Commission will carry out a review on the application of the structural reform and investment clauses taking full account of the economic situation at that time and the achievement of its objectives
44 CONSEQUENCES OF THE GUIDANCE GIVEN IN THE COMMISSION COMMUNICATION ON FLEXIBILITY WITHIN THE SGP FOR THE CORRECTIVE ARM
As the main purpose of the corrective arm of the SGP is to ensure the prompt correction of excessive deficits the room for flexibility is
(91) Council document number 1434515 available at
httpdataconsiliumeuropaeudocdocumentST-14345-2015-INITenpdf
more limited The rules relating to the corrective arm do not include detailed provisions allowing structural reforms or investment to be taken into account when assessing whether a country has taken effective action in response to the Councilrsquos recommendations to correct the excessive deficit Structural reforms are however recognised as a relevant factor in the corrective arm when deciding on various steps within the EDP when opening an EDP when setting or extending a deadline for the correction of the excessive deficit and in the case of systemic pension reform when closing an EDP
First structural reforms can be relevant factors at the point of deciding whether to open an EDP When making this decision the Commission carefully analyses all the relevant information relating to medium-term economic budgetary and debt developments (92) These lsquorelevant factorsrsquo may in certain cases lead the Commission to decide not to open an EDP (93) The Commission Communication on flexibility within the SGP clarifies that Member Statesrsquo contributions to the EFSI and the implementation of structural reforms (eg in accordance with recommendations from the European Semester or an EIP) fall under the appropriate categories (94) and should therefore be considered as relevant factors
Second relevant factors are also taken into account when recommending the deadline by which the excessive deficit must be corrected While an excessive deficit is as a rule expected to be corrected within a year of its detection implementing structural reforms is a factor that can be taken into account when setting the deadline or fixing the length of any extension to that deadline
Third when closing an EDP the Commission considers where relevant the direct cost of pension reforms As is the case under the preventive arm this relates to reforms introducing
(92) This analysis is presented in the report prepared by the
Commission under Article 126(3) TFEU (93) According to Council Regulation (EC) No 146797 (OJ L
209 281997 p 6) for Member States whose debt stands below 60 of GDP the relevant factors are considered irrespective of the level of the deficit For a Member State with debt above 60 of GDP however the relevant factors are only considered if the breach of the deficit criterion is small and temporary
(94) As defined in Council Regulation (EC) No 146797 (OJ L 209 281997 p 6)
Part II Recent development in fiscal surveillance
75
a multi-pillar system that includes a mandatory fully-funded pillar Specifically an EDP can be closed even if the deficit is still larger than 3 of GDP provided that i) the excess is entirely due to the costs of implementing the pension reform and ii) the deficit has been reduced substantially and continuously and has reached a level close to the reference value ie 3
The Communication on flexibility within the SGP states that structural reforms can be taken into account on an ex ante basis when considering them as relevant factors The Commission also indicated in the Communication that it would take account of reforms that have not yet been fully implemented The conditions for taking reforms into account within the corrective arm are similar to those required for the activation of the structural reform clause under the preventive arm In particular the reforms need to be clearly specified as part of a structural reform plan already adopted by the government andor national Parliament and there must be a credible timetable for their implementation For Member States with excessive macroeconomic imbalances the Corrective Action Plan would normally serve this purpose
If a Member State fails to implement the agreed reforms the Commission will consider this an aggravating factor This applies both to the Commissionrsquos assessment of the action taken by the Member State in response to the EDP recommendation and to the setting of a deadline for the correction of the excessive deficit Failure to take effective action will lead to a stepping up of the procedure and the possible suspension of European Structural and Investment Funds (95) For euro area Member States the Commission will also recommend that the Council imposes a fine
(95) Article 23 of Regulation (EU) No 13032013 of the
European Parliament and of the Council (OJ L 347 20122013 p 320)
5 FISCAL RISKS AND CONTINGENT LIABILITIES
76
It is not unusual for the general government deficit or debt to be significantly and unexpectedly affected by the materialisation of fiscal risks associated with contingent liabilities Examples of situations in which this can occur include calls being made on guarantees issued by the government or the government stepping in to cover the obligations of a public corporation experiencing financial difficulties A distinctive feature of such events is that they result from some explicit or implicit obligation that the state has previously established (ie a guarantee contract or majority ownership) The extent and the timing of the impact of such events cannot however be determined in advance with any degree of certainty The liabilities leading to these events are called contingent liabilities as it is only under certain specific conditions that they result in transactions and they are not recorded in core national accounts Nevertheless the potential impact of these liabilities on public deficit and debt means that they cannot be ignored in the management of public finances
Understanding and mitigating the risks created by contingent liabilities depends firstly on having comparable information for different Member States Eurostat recently published a new time series providing information on Member Statesrsquo contingent liabilities It covered in particular i) government guarantees ii) the liabilities related to public-private partnership agreements (PPPs) that are recorded off the government balance sheet iii) the liabilities of government-controlled institutional units outside the government sector and iv) non-performing loans issued by the government The following sections provide a review of the new dataset They discuss the factors that need to be taken into account when interpreting the data explore the ways in which contingent liabilities can materialise as actual losses for the government and give some examples of how the fiscal risks associated with contingent liabilities can be mitigated
51 FISCAL RISK AND THE ROLE OF CONTINGENT LIABILITIES
lsquoFiscal riskrsquo is a broad term that encompasses a variety of reasons why fiscal outcomes may be different from the targeted (or forecast) levels
These reasons are usually associated with either macroeconomic developments that have an impact on fiscal variables or with situations where the government has to make unexpected payments ie payments not included in the budget or in any other ex-ante estimate of expenditure
The overview presented here is limited to a narrower category of fiscal risks mdash those associated with contingent liabilities It does not cover fiscal risks that result from changes in macroeconomic variables but concentrates instead on public liabilities that would under certain conditions necessitate a response from the government which would in turn lead to changes in the expected deficit and debt levels The degree of discretion the government can exercise in responding to these events varies but a common feature is the existence of an underlying commitment which may or may not be formalised Polackova and Mody (2002) develop a lsquogovernment fiscal risk matrixrsquo where they distinguish firstly between explicit liabilities (government liabilities as recognised by a law or contract eg loans and guarantee agreements) and implicit liabilities (the governmentrsquos moral obligations which may reflect pressure from the public or from specific interest groups eg obligations relating to future state pensions or public investment projects) and secondly between direct liabilities (obligations that exist in any event eg expenditure defined in existing laws) and contingent liabilities (obligations that exist only if a particular event occurs eg intervention in the event of a failure of a public or private entity) Implicit and contingent liabilities are thus not mutually exclusive categories but different dimensions of categorisation
The terminology is also subject to rather diverse interpretations For example the definition of contingent liabilities in the lsquogovernment fiscal risk matrixrsquo above is macroeconomic in nature and it differs from definitions used in national accounts (ESA2010 508-511) or accounting (IAS 37 IPSAS 19) In particular this macroeconomic framework also covers the subset of implicit contingent liabilities for example government interventions in the context of bank failures to avoid or reduce systemic risk in the banking sector (beyond deposit or unemployment insurance) where no explicit
Part II Recent development in fiscal surveillance
77
obligation exists for the state and only macroeconomic estimates of their magnitude can be made for a specified set of assumptions The scope of implicit liabilities is difficult to define but this does not mean that they can be ignored by policymakers For example the approaches to estimating cost of ageing are presented in the 2015 Ageing Report (96) while contingent liabilities linked to public support to the banking sector estimated using SYMBOL model were presented in the 2012 Fiscal Sustainability Report (97)
The availability of information on potential exposure is the first step in assessing impact of a contingent liability The availability of information on the extent of potential exposure is the necessary precondition and a starting point for the quantification of the risk However even where the potential exposure can be assessed (which can only be done with sufficient degree of certainty for some types of contingent liabilities as discussed above) quantifying the risk itself also requires an estimate of the probability of the risk materialising This information cannot usually be easily obtained for individual cases For certain classes of explicit contingent liabilities that involve large numbers of homogenous contracts (eg export guarantees or student loan guarantees) the probability of guarantees being called can however be established with a sufficient degree of certainty at the aggregate level This means that the risk can be quantified and recorded appropriately in statistics on government finance Under ESA2010 standardised guarantees of this type are recorded by analogy to non-life insurance with fees treated similarly to insurance premiums and the transaction shown as creating financial assets and liabilities (Eurostat 2014)
The need for transparency with regard to contingent liabilities is widely recognised especially as relates to explicit contingent liabilities (98) The IMFrsquos Fiscal Transparency Code (IMF 2014) for example includes a separate section on the management of fiscal risks in which it provides a number of principles for the
(96)httpeceuropaeueconomy_financepublicationseuropean
_economy2014pdfee8_enpdf (97)httpeceuropaeueconomy_financepublicationseuropean
_economy2012pdfee-2012-8_enpdf (98) This conclusion is less straightforward in the case of
implicit contingent liabilities due to the risk of moral hazard See eg IMF (2007)
disclosure and management of the governmentrsquos exposure to risks resulting from guarantees and public-private partnerships (PPPs) Likewise the OECDrsquos Best Practices for Budget Transparency (OECD 2002) recommends that (i) all significant contingent liabilities should be disclosed in the budget in the mid-year report and in the annual financial statements and (ii) where feasible the following should be disclosed a) the total amount of contingent liabilities together with a breakdown of this total by nature of the liability b) historical information on the defaults occurring in each of these categories In cases where contingent liabilities cannot be quantified they should be listed and described International Public Sector Accounting Standard (IPSAS) No 19 on provisions contingent liabilities and contingent assets requires that unless the possibility of any outflow in settlement is remote an entity should provide for each class of contingent liability a brief description of the nature of the liability and where practicable an estimate of its financial effect (IPSASB 2014) While these internationally agreed standards and guidelines provide a basis for improving the availability of information on contingent liabilities the requirements remain non-binding and no precise data specifications exist thus limiting the potential comparability of data published at national level
Several countries and international organisations have also started developing ways to mitigate the fiscal risks associated with contingent liabilities A recent OECD discussion paper (OECD 2013) suggests that one of the main approaches taken in policy reforms designed to mitigate the risks arising from guarantees is to promote neutrality This is most often done in one of two ways i) by ensuring that policymakers have sufficient information to compare the effects of the risks arising from guarantees with the effects of direct budgetary appropriations and ii) by levying market-based fees that reflect the expected cost of such liabilities for the government The discussion paper also advocated full and transparent disclosure of the potential costs of these risks It encouraged governments to reduce the level of implicit liabilities either by eliminating them in a credible way or by converting them into explicit liabilities
Some Member States have already introduced reforms in the area of contingent liabilities In
European Commission Public finances in EMU - 2015
78
the Netherlands for example the approach to the issuance of guarantees has been to make the default position that it is not allowed ie there has to be a specific reason to justify the issuance of guarantees for example if risk cannot be insured on the market Where guarantees are issued they are subject to a premium which is treated in the budgetary process as a provision for future losses (Hofmans and van de Coevering 2014) In Sweden the Budget Act adopted in 2011 contains clearer rules on government guarantees and new provisions relating to government lending that entails credit risk The rules aim to ensure that these commitments are self-financed in the long run with fees corresponding to expected costs (Swedish National Debt Office 2015) In Latvia the Fiscal Discipline Law provides that a fiscal risk declaration must be prepared annually and must include a quantification of the fiscal risks This quantification then determines the size of the fiscal safety reserve set in the budget (Fiscal Discipline Council of Latvia 2015) In Portugal a separate unit with specialised expertise has been set up whose task it is to assess and monitor PPPs and to mitigate the risks arising from these contracts (European Commission 2014b)
Improvements to the statistics on government finances can also help to mitigate the risks associated with contingent liabilities The statistical framework is constantly evolving and a significant number of improvements have been introduced in recent years notably through ESA2010 which came into force in September 2014 These changes include qualitative aspects of control which led to the reclassification of several government-controlled entities such that they are now considered as being within general government ii) the introduction of a revised approach to standardised guarantees which takes expected losses into account at inception of the contract and iii) changes to the rules on determining the economic owner of a PPP asset As a result of these changes a number of risks are now captured at an earlier stage For example losses incurred by a government-controlled company classified as being inside general government would affect general government net borrowing gradually as they occur rather than being postponed until some point in the future at which time a large capital injection would then be needed
52 NEW DATA REQUIREMENTS SUPPORTING FISCAL SURVEILLANCE IN THE EU
Analysis and reporting related to contingent liabilities has been considerably strengthened in the EU as a result of the adoption of the Six-Pack in 2011 and subsequently of the Two-Pack for the euro area These packages of legislation were designed to strengthen economic governance in the EU and budgetary analysis now includes closer examination of contingent liabilities in recognition of the risks they entail The reporting requirements for these liabilities were also made more stringent (see Box II51) In particular under the corrective arm of the SGP contingent liabilities are now taken into account when the Commission prepares a report under Article 126(3) of the TFEU For euro area countries subject to an Excessive Deficit Procedure (EDP) the Commission may now request that the Member State submit additional information including on the financial risks associated with contingent liabilities that could have a potentially significant impact on the government budget Under the preventive arm contingent liabilities are mainly analysed as potential risks to the budgetary targets
In response to the requirements introduced by Council Directive 201185EU on budgetary frameworks Eurostat has begun publishing a new data series on contingent liabilities for all EU Member States The specific requirements relating to the coverage of the data (which Member States are required to submit pursuant to Article 14(3) of the above Directive) and the timing of its publication were agreed between the Member States and the European Commission in 2013 and Member States submitted the first set of time series to Eurostat in late 2014 Eurostat published this information and an accompanying press release (99) in February 2015
53 NEW DATASET ON CONTINGENT LIABILITIES IN EUROSTATS DATABASE
Eurostatrsquos publication (as referred to above) covers three classes of contingent liabilities as well as non-performing loans
(99)httpeceuropaeueurostatdocuments299552166164492-
10022015-AP-ENpdf
Part II Recent development in fiscal surveillance
79
European Commission Public finances in EMU - 2015
80
The information provided on contingent liabilities relates to (i) guarantees (ii) public-private partnerships recorded off government balance sheet and (iii) the liabilities of government-controlled entities classified outside general government These categories are described in further detail below Eurostatrsquos dataset also includes information on non-performing loans issued by the government A dedicated webpage (100) provides additional information including the legal basis for the data collection country-specific footnotes and reports The summary table below gives an overview of the information currently available in Eurostatrsquos database In most cases Member States are required to send the updated annual time series for the previous year(s) to Eurostat before the end of the year Each additional year is expected to be added to the time series early in the year t+2 eg information for 2014 will be sent to Eurostat by the end of 2015 and added to the current time series in early 2016
The publication of this data at EU level is accompanied by the publication of information at national level While Eurostat publishes a
(100) httpeceuropaeueurostatwebgovernment-finance-
statisticscontingent-liabilities
number of time series that are based on commonly agreed standard definitions Member States are encouraged to publish more detailed national information and several Member States are currently doing so In addition to providing more detail on contingent liabilities Member States national publications also include other information required by Council Directive 201185EU notably information on the participation of the general government in the capital of private and public corporations high-frequency fiscal data produced according to the national public accounting methodology and the reconciliation table explaining how this high-frequency data is converted into data that is ESA-compliant The national publications are often tailored to the specific situation of the country and do not easily allow cross-country comparison Eurostat maintains a list of the national websites where this information is published (101) National publications can improve fiscal transparency at national level thus contributing to improved oversight of fiscal policy by national monitoring institutions and by society as a whole Not all Member States have yet made full use of this
(101)httpeceuropaeueurostatdocuments10150356850409L
isting-of-national-websitespdf
Table II51 Availability of indicators required under Council Directive 201185EU in Eurostatrsquos database (as at the end of 2015)
Source European Commission Note S13 = General government S1311 = Central government (excluding social security funds) S1312 = State government (excluding social security funds) S1313 = Local government (excluding social security funds) S1314 = Social security funds
Sectors Years(compulsory)
Units
Contingent liabilities1 Guarantees - Total stock of government guarantees 1A One-off guarantees - Total stock of guarantees excluding debt assumed by government of which guarantees to public corporations Memo item guarantees to financial corporations 1B Standardised guarantees - Total stock of government guarantees
2 Adjusted capital value of off-balance private-public partnerships (PPPs)
S13S1311S1312S1313
T-1(2013)
Millions of national currency
Percent of GDP3 Total outstanding liabilities of government controlled entities classified outside generalgovernment 3A Liabilities of units involved in financial activities 3B Liabilities of units involved in other activities of which liabilities of loss-making non-financial unitsAssets that can result in losses
4 Stock of non-performing loans provided by government
S13S1311S1312S1313S1314
T-1(2013)
Millions of national currency
Percent of GDP
S13S1311S1312S1313
T-4 T-3 T-2 T-1(2010-2013)
Millions of national currency
Percent of GDP
S13S1311S1312S1313S1314
T-1 (T-2 if not available)
(2013 or 2012 if not available)
Millions of national currency
Percent of GDP
Part II Recent development in fiscal surveillance
81
opportunity to improve transparency limiting their publication to the small number of variables on which they are required to report
Government guarantees
Guarantees issued by the government in respect of the liabilities (and sometimes assets) of third parties constitute the most common form of contingent liabilities Only explicit or formal obligations set down in the form of a law or a contract are covered by Eurostatrsquos dataset (102) A debt guarantee for example is an arrangement in which a guarantor (in this case the government) agrees to pay a creditor if a debtor defaults Guarantees on assets meanwhile mean that the government has made a commitment to cover any losses resulting from a decrease in value of the assets Both public and private corporations and households can benefit from government guarantees The aim of a government guarantee is usually to allow the beneficiary to borrow at a lower interest rate in doing so potentially contributing to achieving certain policy objectives An example of this is a government providing guarantees on student loans in order to improve access to higher education Government guarantees are also used to improve access to markets an example of this being the use of export guarantees or guarantees issued to financial institutions in times of financial distress
Eurostatrsquos publication includes several subsets of data which facilitates analysis For some subsets however the reported data are not complete andor are not exhaustive The publication distinguishes between standardised and one-off guarantees (103) (see also Table II51
(102) According to the agreed data specifications data do not
include i) government guarantees issued within the guarantee mechanism created under the European Financial Stability Facility (as these liabilities are predominantly already included in Member Statesrsquo debt) ii) derivative-type guarantees (providing they meet the definition of a financial derivative and are recorded accordingly in the national accounts) iii) deposit insurance guarantees and compatible schemes (as these are covered by separate frameworks) and iv) guarantees issued on events the occurrence of which is very difficult to cover via commercial insurance (such as earthquakes large-scale flooding nuclear accidents and certain art exhibitions) as a result of the very high degree of uncertainty associated with any estimate of the value of such guarantees
(103) As explained in the introductory section ESA2010 distinguishes between standardised guarantees (which are characterised by frequent repeated transactions with similar
above) In most (but not all) Member States the latter category is by far the more significant one The separate time series relate respectively to guarantees issued to public corporations and to guarantees issued to financial (public and private) corporations Only guarantees issued to units classified outside general government are covered by the reporting As can be seen from Graph II51 central governments issue the largest proportion of guarantees although guarantees issued by state or local government also form a significant part of the total in some countries The time series currently cover four years 2010-2013 and are reported at nominal value They show the total stock of outstanding guarantees excluding the debt already assumed by the government There are however gaps in the reporting for example information on standardised guarantees is missing for Belgium Croatia and Portugal and information on guarantees issued by local government has not been provided by France Croatia or Slovenia Other notes relating to specific Member States are included under lsquoCountry-specific footnotesrsquo (104)
Contingent liabilities associated with guarantees will become actual costs if the guarantees are called Guarantees constitute contingent liabilities and are therefore not recorded
features and a pooling of risks and for which the average loss can be estimated) and one-off guarantees (which are individual agreements for which it is not possible to provide reliable estimates of the likely losses)
(104)httpeceuropaeueurostatdocuments10150356611302Contingent-Liabilities-Footnotespdf
Graph II51 Outstanding guarantees by level of government2013 of GDP
Source Eurostat
European Commission Public finances in EMU - 2015
82
in core national accounts except in the cases described below The treatment of a guarantee in government accounting depends on whether it is a one-off or a standardised guarantee In ESA2010 when a standardised guarantee is granted a liability should be recorded in governments balance sheet that is equal to the present value of expected calls under the guarantees net of any recoveries For one-off guarantees fees related to the issuance of the guarantee constitute revenue for the government while in the case of standardised guarantees fees are recorded as a financial prepayment to cover future losses (105)
When the risks materialise and a guarantee is called a call on a standardised guarantee gives rise to a financial (deficit-neutral) transaction whereas a partial or full call on a one-off guarantee is recorded as a capital transfer (debt assumption) which worsens the governmentrsquos budgetary position Moreover the rules in place specify that the full amount of an outstanding one-off guarantee must be recorded as a capital transfer after the third partial call on the guarantee The same treatment ie debt assumption equal to the full amount of the one-off guarantee applies when the likelihood of a guarantee being called is very high at inception (106)
The recent financial crisis had a significant effect on the issuance and calling of government guarantees in several Member States The stock of outstanding guarantees relating to financial corporations was particularly high in Ireland in 2013 (at 32 of GDP thus accounting for almost the whole stock of outstanding guarantees) and also in Spain and Austria The stock of guarantees issued to the financial sector is however now on a clear declining trend Eurostatrsquos reporting on the financial crisis (107) provides some insight into the effect that guarantees have on public finances It illustrates for example the effect that calls on guarantees issued to financial institutions in the
(105) If government charges no fees or fees are far from
covering present value of expected calls a capital transfer (deficit-increasing transaction) is recorded for government reflecting the unrequited nature of the transaction
(106) For a more detailed overview of the recording of guarantees see the Manual on Government Deficit and Debt (httpeceuropaeueurostatwebgovernment-finance-statisticsmethodologymanuals) Section VII4
(107) httpeceuropaeueurostatwebgovernment-finance-statisticsexcessive-deficitsupplemtary-tables-financial-crisis
context of the financial crisis have had in recent years on the budgetary position of the governments of Belgium Denmark Spain Latvia and Portugal
Liabilities related to public-private partnerships (PPPs) recorded off government balance sheet
As the name suggests public-private partnerships (PPPs) involve two partners that belong to different sectors of the economy These partnerships are long-term contractual arrangements (lasting at least five years and usually significantly longer) between a government unit and a private partner under which the latter builds or renovates a dedicated fixed asset and uses that asset to deliver services to the government unit or directly to the public in exchange for a periodic payment from the government (108)
The main issue for national accounts is determining the economic owner of the asset ie determining whether this is the private partner or the government unit The assets related to the PPP will be recorded on the balance sheet of the economic owner thus affecting that unitrsquos expenditure (and balance) over the construction period and its debt According to ESA2010 the economic owner of an asset is the unit that bears the largest proportion of the risks and is entitled to receive the largest proportion of the rewards related to the use of the asset The three main risk categories considered for this purpose are i) construction risk (risk related to the construction process and its costs) ii) availability risk (risk related to the availability of the asset for use after the construction phase) and iii) demand risk (risk related to the demand for the services that the asset contributes to providing) A number of other conditions of the contract are also closely analysed These include the allocation of the assets at the end of the contract the compensation and termination clauses and the existence of government financing and guarantees
(108) A distinction is made in national accounts between PPPs
and concessions on the basis of who pays the fees to the partner the term PPP is used for contracts where the government is paying all or most of the fees associated with the use of the asset to a private partner whereas in concession agreements it is the final users that make the majority of payments
Part II Recent development in fiscal surveillance
83
While information related to on-balance PPPs is
directly reflected in the general government deficit and debt this is not the case for off-balance PPPs However the latter may create potential liabilities for the government In cases where the government is judged to be the economic owner of the PPP and the asset is therefore recorded on the governmentrsquos balance sheet this will mean that all expenditure revenue and financial obligations associated with that asset affect the general government deficit and debt directly throughout the period during which the asset is being constructed or renovated This is not the case for PPPs where the private partner is deemed to be the economic owner of the asset In these cases the impact on the governmentrsquos deficit and debt would be more gradual reflecting periodic payments to the partner Should the private partner fail however there is a risk that the government may need to take over the asset during the life of the contract and this eventuality constitutes a contingent liability for the government
The dataset published by Eurostat shows that off-balance sheet PPPs do play a role in some countries As can be seen from Graph II52 the stock of off-balance sheet PPPs only exceeds 1 of GDP in a small number of Member States with the highest values recorded in Portugal and Cyprus These partnerships are almost exclusively concluded by central governments although in countries that have a federal government structure state governments do also play a role Member
States were only required to provide data for 2013 and the coverage is generally good there being only a small number of country-specific gaps A large majority of countries also reported figures for the years 2010-2012 on a voluntary basis When interpreting the data it should be kept in mind that
the figures for each year reflect the current value of the project at that time They can therefore be understood to represent an estimate of the impact there would be on investment expenditure and on debt were the government to need to take the asset over The current value increases rapidly during the construction phase of a project reflecting investments being made and then subsequently decreases progressively during the exploitation phase reflecting the economic depreciation of the asset The current value does not therefore reflect the amount of investment needed to finalise the asset if a project had encountered difficulties already during the construction phase
Liabilities of government-controlled entities
Governments often choose to set up corporations outside the budgetary perimeter A part of these entities is nevertheless classified as being inside general government for the purposes of national accounts There are a variety of reasons why governments may decide to set up entities outside the budgetary perimeter These entities may be created with a legal status that is different from traditional budgetary units (eg as limited liability companies) and they may combine commercial and public interest objectives The extent to which governments make use of this approach ie setting up entities outside general government varies considerably across Member States and no clear generalisations can be made as to the advantages they offer compared to direct procurement of goods and services Wherever such entities are controlled by the government (109) they belong to the public sector Whether a public sector unit is classified for statistical purposes as part of general government
(109) This control may take the form of i) the right to appoint
veto or remove a majority of the governing board or senior members of staff ii) ownership of the majority of the voting interest (most commonly ownership of over 50 of shares) iii) rights given by special shares and options iv) rights to control the company via contractual arrangements agreements or permissions to borrow or via excessive regulation or v) another form of control
Graph II52 Off-balance PPPs the stock of adjusted capital value by level of government 2013 of GDP
Source Eurostat
European Commission Public finances in EMU - 2015
84
or as part of the public corporations sector depends on the nature of the unit Units involved in non-market activities are classified as part of general government whilst those involved in market activities are classified as public corporations The term corporation must be understood here in a broad sense as it may include entities that do not have the legal status of a corporation
Units classified as being inside general government are covered by regular reporting on government deficit and debt This is not the case for government-controlled units outside general government whereas their debt represents a potential liability for the government If a public sector unit is classified in the general government sector its revenue expenditure and debt are added to those of the rest of the government sector and thus affect the government balance and debt directly As stated above the same treatment is not however applied for public corporations whether financial or non-financial that are by nature market units and which thus remain outside general government Participation in the capital of public corporations could nonetheless represent a potential liability for the government when the corporation is experiencing difficulties the government may need to step in its capacity as a controlling entity or majority owner This liability is contingent ie it will only lead to actual costs if some specific event occurs The cost of an intervention and the likelihood of such action being necessary cannot however in most cases be determined in advance A government may also decide to intervene for reasons other than financial difficulties In the case of a planned privatisation of a public company for example the government may decide to lsquocleanrsquo the companyrsquos balance sheet by assuming certain obligations including the obligations relating to an occupational pension scheme When such interventions take the form of an unrequited payment (ie when the government does not receive a payment of an equal value in return and is not expecting to earn a sufficient rate of return on its investment) they will worsen the governmentrsquos budgetary position (110)
(110) The application of lsquothe capital injection testrsquo including the
definition of a sufficient rate of return is described in Section III2 of the Manual on Government Deficit and Debt
Eurostatrsquos publication on the liabilities of government-controlled entities classified outside general government is the first of its kind but the data provided should be interpreted with caution Eurostatrsquos recent publication is the first step towards developing comparable time series on potential liabilities associated with government-controlled entities classified outside general government The data nevertheless reflects the high degree of variability in the approaches taken by different Member State governments to the role of public corporations and this should be taken into account when interpreting the information There are also a number of other considerations that need to be kept in mind Firstly the data reflect gross liabilities ie the figures show debt alone rather than debt offset against assets Secondly the reporting is non-consolidated ie part of the debt shown could be debt owed to another unit in the same institutional sector (For example if two public corporations have liabilities towards each other both amounts would be captured in the data and it will also cover subsidiarys debt towards its holding unit) Thirdly there are some gaps in the data submitted by Member States In particular the information on the liabilities of financial corporations is missing or incomplete for Belgium Greece Spain Cyprus and Luxembourg and information on corporations controlled by local government is missing or incomplete for Belgium Ireland Greece and
httpeceuropaeueurostatdocuments38595985937189KS-GQ-14-010-ENPDF
Graph II53 Liabilities of public financial institutions by controlling government level 2013 or 2012 of GDP
Source Eurostat
Part II Recent development in fiscal surveillance
85
Cyprus
Despite these caveats the information published by Eurostat allows analysing risks associated with the governmentrsquos participation in financial and non-financial corporations As shown in Graphs II53 and II54 the gross liabilities of public financial corporations are as a rule much higher than those of public non-financial corporations These liabilities must however also be interpreted differently in the case of financial and non-financial institutions The
former tend to have large balance sheets and thus also large gross liabilities but their obligations are usually balanced by assets of a comparable size Moreover financial institutions both public and private are covered by specific regulations such as those on prudential supervision and deposit insurance which reduce the need for owner intervention In addition the database available on Eurostatrsquos website also includes a separate subset of data on the liabilities of loss-making non-financial corporations (see Table II51) Given that companies experiencing occasional losses may drop in or out of this data in any given year any conclusions drawn on the basis of the single set of results that is currently available could be misleading and this data subset is therefore not presented here In most cases it can also be assumed that the government would not go as far as to cover all the liabilities of a corporation in difficulties The reported liabilities should therefore be understood as the maximum loss theoretically possible rather than as a likely scenario
Non-performing loans
Although not part of their traditional role governments do sometimes issue loans Various government units may decide to provide loans to other economic sectors or to the rest of the world Their motivations for doing this are for example to achieve a particular objective in the area of socioeconomic policy or international relations or to manage the accumulated assets in a cost-effective manner Eurostat publishes quarterly information on general government financial accounts In particular it provides data on the stock of government assets in the form of loans including by counterpart (ie debtor) sector for central government and social security funds The data shows for example that loans account for a relatively high proportion of central government assets in the Nordic countries (and of social security funds assets in the case of Finland)
The stock of general government assets taking the form of loans can also indicate the presence of non-market financial institutions inside general government It is not unusual especially in the aftermath of the recent financial crisis for public financial institutions to cease performing traditional financial intermediation activities and to subsequently be classified inside general government due to their non-market nature In some cases the inclusion of these units is a corollary to the more precise definitions given in ESA2010 for delimitation of the general government sector compared to the earlier national accounts standards The institutions to which this could apply include defeasance structures (lsquobad banksrsquo) asset management companies and special purpose entities if they are controlled by government and do not place themselves at risk The inclusion of units of this type in general government will have an effect on the statistics on government assets as has been seen in recent years for Ireland Spain Latvia the Netherlands Austria the UK and a number of other Member States
The loans issued by the government may become non-performing and in some cases may result in losses for the government Loans are considered non-performing when i) interest or principal have not been paid 90 days or more after their due date ii) interest payments equal to 90 days have been capitalised refinanced or delayed by agreement or iii) there are other good reasons (such as the debtor filing for bankruptcy) to doubt
Graph II54 Liabilities of non-financial public corporations by controlling government level 2013 or 2012 of GDP
Source Eurostat
European Commission Public finances in EMU - 2015
86
that the payments due will be made in full Non-performing loans may lead to full or partial non-recoverability of the debt and potentially to losses for the government These losses can take a number of forms A debt cancellation agreement in favour of the debtor for example would directly worsen the governmentrsquos balance A write-off of debts after the debtor unit has been liquidated meanwhile would not affect the balance directly but would imply an indirect increase in the creditorrsquos debt level (as its borrowing needs would be higher than they would have been had the principal and interest been fully repaid) According to Eurostatrsquos publication at the end of 2013 the total stock of non-performing loans issued by Member State governments was highest in Ireland (at around 11 of GDP) This was due to the inclusion of the Irish Bank Resolution Corporation in the general government The second-highest level of around 3 was recorded in Slovenia where the inclusion of the Bank Assets Management Company had contributed to the stock of non-performing loans In the majority of Member States however the amounts were negligible When the proportion of non-performing loans is high as a result of defeasance structures being classified as part of general government the situation is usually expected to change in the medium term and the amounts tend to decline rapidly as positions are wound down
The data reported by Member States remains incomplete Belgium France Croatia Cyprus and Slovakia have not provided any data on non-performing loans while Spain Italy and Finland have only partly met the reporting requirements Reporting of data on non-performing loans was only compulsory for 2013 but a number of countries also provided information for 2010-2012
54 CONCLUSION
It is through a better understanding of the fiscal risks associated with contingent liabilities that policymakers will be able to improve their countriesrsquo performance relative to budgetary targets Fiscal risk is a broad concept encompassing various reasons why fiscal outcomes can deviate from the targeted or forecast levels Contingent liabilities are one of the factors creating fiscal risk They are potential obligations for the state that materialise as actual losses and
higher debt only if and when certain events occur Because of this it is often very difficult to estimate in advance the potential impact they could have on deficit and debt and to predict the timing of the events that would cause the potential loss to materialise Irrespective of these difficulties contingent liabilities cannot be ignored as has also been demonstrated by the economic crisis Making information on contingent liabilities publicly available is an essential first step towards developing a better understanding of contingent liabilities and mitigating the risks associated with them
The requirements for reporting on contingent liabilities at EU level have recently been strengthened with the aim of increasing transparency As demonstrated by these changes there is a strong recognition of the importance of developing a better understanding of the fiscal risks associated with contingent liabilities both for the purpose of EU budgetary surveillance and more generally The new measures include in particular the introduction of new statistical reporting by Eurostat and the publication of more detailed information at national level in accordance with the requirements of Council Directive 201185EU on budgetary frameworks These new reporting requirements relate to i) government guarantees ii) liabilities related to public-private partnerships (PPPs) recorded off government balance sheet iii) liabilities of government-controlled entities and iv) non-performing loans
While recognising the country-specific nature of contingent liabilities the new data series allow some cross-country comparison They also show that contingent liabilities tend to be high when they relate to the financial sector The reasons why Member States choose to use contingent liabilities instead of carrying out direct budgetary interventions often reflect historical circumstances and established institutional frameworks which makes cross-country comparison less straightforward Nevertheless as mentioned above it can be seen that contingent liabilities tend to be higher if they relate to the financial sector The liabilities of public financial corporations for example were above 50 of GDP in 2013 in some cases while those of non-financial public corporations reached a maximum of around 25 of GDP Guarantees to financial institutions
Part II Recent development in fiscal surveillance
87
(public and private) were also as high as 30 of GDP in 2013 (the most recent year for which data is available) These findings are not surprising given the considerable impact that the financial stabilisation measures adopted by governments have had on the deficit and debt levels in many countries Where data series cover more than one year it can however also be seen that the liabilities associated with the financial sector are now on a declining trend Both contingent liabilities related to off-balance sheet PPPs and the stock of non-performing loans are currently of macroeconomic relevance in only a small number of countries
The next steps to be taken include improving the coverage and comparability of the data and finding the best ways to mitigate the fiscal risks associated with contingent liabilities While the recent Eurostat publication represents a considerable step forward in terms of improving the availability of comparable data in the EU there continue to be a number of gaps in reporting Moreover the length of the time series is still very limited in most cases Both the quality of data and the length of the time series are expected to improve over time thanks to the efforts being made by the EU statistical community The international organisations and the EU Member States have also started working on developing ways to mitigate the fiscal risks associated with contingent liabilities The most promising avenues involve making such liabilities self-financing or budgetary neutral in the longer run by charging fees and making provisions that reflect the expected future losses Strengthening the institutional and statistical frameworks and improving transparency are among the other strategies proposed for mitigating these risks
Part III Negative inflation surprises how much of a bad thing
1 INTRODUCTION
90
Price developments may affect public finances in a number of ways Inflation has a direct bearing on tax revenues through consumption wages property income etc Primary expenditure is also affected as government spending can be formally linked to changes in prices (eg through an indexation mechanism) or naturally reflect such changes (eg through government purchases of goods and services and public investment) Interest expenditure is directly affected by price developments as well In turn the stock of government debt can be influenced both in absolute terms and relative to the size of the economy
It is generally acknowledged that tax bases and hence tax revenues are faster to adjust to price developments than primary expenditure Indeed revenues evolve broadly in line with inflation developments but often with some time lag depending on how fast tax bases adjust as well as on tax rules and tax collection While the effects of inflation on government spending are slower to materialise it is also less straightforward to capture the precise impact Some items are often linked to inflation while others are not at least not in the short run Most importantly given that (nominal) expenditure ceilings are often set well ahead of the budgets adoption and actual implementation changes in the rate of inflation with respect to forecasts may not translate into lower or higher spending
Unexpected inflation shocks have a different impact on the budget than shocks which are fully anticipated by the government To the extent that inflation developments are anticipated and provided that budgetary appropriations are adjusted accordingly they should be neutral for public finances in the sense that governments can in principle secure the planned fiscal targets By contrast as discussed above unexpected price developments may have a material impact on the government balance in that revenues and expenditures may be affected differently That said a protracted period of low inflation even when fully anticipated may imply cost savings difficult to implement if revenues are to be continuously offset by ever stricter spending norms especially if these come at odds with underlying trends eg in the areas of healthcare or
age-related expenditure or imply cuts in absolute terms (as opposed to nominal freezes)
In addition inflation developments can give a biased picture of a governments fiscal policy In some cases price developments may help a country meet or make it more difficult to achieve fiscal targets In such cases the meeting of requirements may be wrongly seen as the country delivering on policy commitments and vice versa In that respect the way inflation developments affect compliance with the rules of the EUs Stability and Growth Pact is a relatively new topic also because most of the latter have been built under the implicit assumption of price stability evidenced by annual inflation closely fluctuating around 2 since the inception of the SGP
In this context Part III looks into the impact of an unexpected inflation shock on the budget balance and the consequences this might have in terms of fiscal surveillance focusing on the 2014 shock As is the case for fiscal multipliers the specific circumstances under which the unexpected inflation shock occurs are relevant for the actual value of the elasticity of the budget balance with respect to inflation For example the response of economic variables such as wages to inflation may be different in crisis periods than in boom periods and the same holds for interest rates
Specifically Chapter III2 provides a semi-quantitative impact assessment of the 2014 downward inflation surprise on Member States budgets and their components according to DG ECFINs desks and an analysis of the reaction of interest expenditure and shows that the budgetary impact of this shock was in many cases of the order of 01-02 of GDP
In order to interpret these results it should be considered that while such an impact of the inflation shock on the overall balance may seem small in size relative to a given deficit level (eg the 3 of GDP Treaty reference value) it may not be so in terms of the annual change in the deficit Similarly the impact may be all the more significant when compared with 05 of GDP which constitutes the maximum theoretical impact of a 1 inflation shock whereby revenues adjust one for one to inflation while expenditures remain unchanged Chapter III3 sheds more light on the
Part III
91
interplay between inflation surprises and fiscal effort as measured by the various metrics that are used when assessing compliance with the rules of the SGP
2 COUNTRY-BY-COUNTRY ANALYSIS OF THE REACTION OF BUDGET TO THE INFLATION SURPRISE OF 2014
92
In 2014 all EU Member States experienced a negative inflation surprise Inflation was revised downward for all EU Member States between the forecast prepared at the time of the adoption of national budgets (autumn 2013) and the first estimation of outturn data (spring 2015 EDP notification) The revision of the harmonised index of consumer prices (HICP) between the Commissions 2013 autumn forecast and outturn data for 2014 ranges from -01 pp (Czech Republic) to -30 pps (Bulgaria) and the EU average is -10 pp (see Graph III21a and III21b) For 5 Member States (Bulgaria Spain Cyprus Portugal and Slovakia) the revision even led to a change of sign (from positive to negative) in the HICP according to the 2013 autumn forecast only one Member State (Greece) was expected to be in deflation in 2014 while outturn data showed that 6 Member States ultimately faced deflationary developments that year
This chapter aims at analysing the impact of the
downward inflation surprise on the EU Member States budgets and their components based on a tailor-made survey For this purpose this Part collects the relevant information from DG ECFINs country desks and looks at both the expenditure and the revenue side Our methodology is described in Section 1 Section 2 shows the assessment of DG ECFIN to shed light on the Member States reaction to an inflation surprise and through which channels this surprise affects revenues and expenditures Section 3 discusses the particular cases of interest expenditure given their very specific link to inflation
This chapter aims at analysing the impact of the downward inflation surprise on the EU Member States budgets and their components based on a tailor-made survey For this purpose this Part collects the relevant information from DG ECFINs country desks and looks at both the
Graph III21a 2014 HICP estimation from forecast (2013 autumn forecast) and outturn data (spring 2015 EDP notification)
Source Commission services
Part III
93
expenditure and the revenue side
Our methodology is described in Section 1 Section 2 shows the assessment of DG ECFIN to shed light on the Member States reaction to an inflation surprise and through which channels this surprise affects revenues and expenditures Section 3 discusses the particular case of interest expenditure given its very specific link to inflation
21 INFLATION ELASTICITIES IN 2014 AND 2015 ACCORDING TO COMMISSION STAFF
Forecasts in DG ECFIN are produced by Commission staff Their preparation combines a geographically decentralised approach with central guidance and consistency checks The actual forecast figures are provided by country desks (teams of economists covering each Member State) using expert judgement combined with quantitative analysis which takes country
specificities into account Euro area and EU figures are generated by aggregation The central forecast team ensures the arithmetic and economic consistency of forecast figures prepared by the country desks and steers the forecast process to ensure convergence between the top-down and bottom-up views This part collects the information available across desks about the reaction of budgets to inflation
211 The coverage
An exhaustive dataset of EU Member States reaction to the 2014 inflation surprise in 2014 and 2015 was constructed by collecting the relevant information from DG ECFINs country desks The existing literature usually focuses on an EU-wide analysis sometimes complemented by examples mostly from the four largest economies (Germany France Italy and Spain) By contrast in this chapter each Member State is analysed individually The present analysis of EU level sensitivity to inflation is based on the exhaustive
Graph III21b Inflation surprise for 2014 from forecast (2013 autumn forecast) to outturn data ( spring 2015 EDP notification )
Source Commission services
European Commission Public finances in EMU - 2015
94
Type of item Name of the item Non-weighted average share among Member States in 2014
Revenue taxes on production and imports 33 Revenue current taxes on income and wealth 25 Revenue social contributions 27
Revenue sales and other current revenue capital transfers received 15
aggregation for the reactions of the twenty-eight Member States All of ECFIN country desks were involved in building the dataset through a survey that was fully answered In addition to a complete coverage of EU Member States the analyses made by country desks allow for a thorough assessment of the inflation surprise using both quantitative and qualitative analysis The survey is split into revenue and expenditure items along the ESA 2010 classification Seven expenditure categories and four revenue categories are retained (see Table III21a and Table III21b)
For all Member States the three most important revenue items are indirect taxation (taxes on production and imports) current taxes on income and wealth and social contributions Depending on the Member State these items represent between 77 and 91 of total revenues and are the focus of the present study (111)
The main expenditure aggregates are compensation of employees intermediate consumption and social transfers Social transfers in kind were in addition distinguished from the rest of the social transfers as their behaviour with respect to inflation is very different For all Member States these items represent from 69 to 83 of the total expenditures and are the focus of the present study (112)
Sales and other current revenue capital transfers received and other capital expenditure were treated differently given their small size and different behaviour These three items have a very specific behaviour and include different categories with heterogeneous economic and cyclical patterns Thus the consistency of answers among respondents to the survey could not be ensured Also they account for a relatively small share of overall expenditure and revenue It was then assumed that the behaviour of these items were similar to the one of the other items Sales and other current revenue and capital transfers are assumed to follow the average patterns of other revenues Other capital expenditures which represents less than 4 of GDP in all Member
(111) Shares are based on the Commissions 2015 spring
forecast (112) For Cyprus the effect of bank recapitalisation operations in
2014 (amounting to 86 of GDP) has been netted out
States was aggregated with subsidies and other current expenditures for the sake of simplicity
The sensitivity of interest payments was estimated separately They were not part of the survey given their very specific behaviour Interest payments depend strongly on the share of debt sensitive to inflation Short-term debt foreign-currency denominated debt and debt with variable interest rates are mechanically very sensitive to inflation while long-term domestic-currency denominated non-indexed debt is not Section 3 sheds more light on the link between inflation and interest payments and provides a quantitative assessment of the likely impact of an inflation shock
Table III21a Decomposition of expenditures with the ESA 2010 classification
Source Commission services
Table III21b Decomposition of revenues with the ESA 2010 classification
Source Commission services
212 Main elements of the survey
The questions of the survey were chosen in order to ensure consistency between Member States while taking into account country specificities For each item four main types of questions were asked concerning the influence of inflation on public finances
The first two questions refer to the impact of the inflation surprise in 2014 respectively in the first year and in the second year Specifically the questions consist in asking if the revenue or expenditure item is very sensitive to the inflation surprise in 2014 (corresponding to an elasticity
Part III
95
higher than 075) quite sensitive (corresponding to an elasticity between 05 and 075) weakly sensitive (corresponding to an elasticity between 025 and 05) or not sensitive (corresponding to an elasticity lower than 025) The first question bears on the contemporaneous effect in 2014 (assessment of the effect in the first year) while a second question refers to the assessment of the cumulated and total sensitivity at the end of 2015 They correspond to a semi-quantitative assessment of the elasticity of each main expenditure or revenue item to the inflation surprise in 2014 from the perspective of the 2014 and of the cumulated 2015 outcome respectively
A second series of questions relate to the mechanisms behind the sensitivity of revenue and expenditure items to inflation Though multiple stylised answers were proposed (see Annex III1) desks were encouraged to provide any possible clarifications including several specific features such as
minus Symmetry Elasticity to inflation is often thought as the reaction of a variable to a rise in inflation of 1 percentage point As the inflation surprise in 2014 was actually a downward revision respondents were asked to provide precisions if the sensitivity of an item would be symmetric for a downside and upside inflation surprise
minus Indexation Respondents were asked to indicate the possible existence of an automatic indexation mechanism to inflation Automatic mechanisms can be legal rules or less formal arrangements and the indexation provided for may be total or partial Respondents were also invited when relevant to indicate the index used for indexation (eg annual average CPI growth year-on-year lagged growth of CPI etc)
The last question concerns how indexation mechanisms and thus the sensitivity to inflation has evolved since the 2008-2009 crisis Since the Great Recession and the subsequent need for fiscal consolidation many Member States have modified or suspended indexation formulas of social transfers or public wages on the expenditure side or tax brackets on the revenue side The goal was to reduce expenditures and increase revenues
Respondents were asked for each item when relevant whether the automatic indexation rule was changed recently in particular whether a former indexation rule was abolished or frozen
213 Deriving the dataset on inflation surprises from the survey
The survey allows building a dataset which includes both a quantitative and qualitative assessment First this dataset contains a semi-quantitative assessment of sensitivity to inflation for all twenty-eight Member States for the five expenditure items and the three revenue items considered The assessment is used to estimate the elasticity of each item for each Member State in the first year and in the second year To do so the average of the proposed range of possible values for elasticity is assigned to every answer For instance if the respondent answered weakly sensitive (elasticity between 025 and 05) to the first question the elasticity in the first year of this item of this Member State is considered to be 0375 This treatment leads to quantitative results but has some weaknesses as pointed out in the next section Finally the dataset also includes a qualitative assessment of the mechanisms and its recent evolution for almost each Member State and each main revenue and expenditure item stemming from comprehensive comments received from respondents Main results per country are reported in Annex III2
214 Note of caution
The effects of a disinflation surprise are particularly difficult to measure also given the singularity of the event The 2014 disinflation shock coincided with low levels of inflation in some cases even deflation Inflation levels were already relatively low in 2013 thereby limiting the room for nominal adjustments due to price and wage rigidities as their growth rates approach zero It is thus challenging to disentangle effects from the disinflation surprise from the effects of low levels of inflation Moreover conclusions on the symmetric case of an inflation surprise should be drawn cautiously
The study is based on expert knowledge rather than direct quantitative measurement The dataset aggregates the assessment and experience of twenty-eight country desks in a bottom-up
European Commission Public finances in EMU - 2015
96
fashion However the semi-quantitative nature of the survey leaves some room for interpretation which leads to a potential issue of consistency among questionnaires Moreover the degree of detail provided varies across Member States As a consequence the information that can be gathered from the questionnaires results is asymmetrical between countries Comparisons between countries can thus not be used for assessing policy implications and are mainly provided to help gauging the level of heterogeneity within Member States In order to tackle this issue the methodology was framed and different possible answers were suggested to every question in order to have the highest possible degree of consistency among questionnaires
The method cannot provide precise estimation of the individual elasticities and involves even greater uncertainties after their aggregation This is due to the computation of elasticities from semi-quantitative assessments in which we take arbitrarily the median of the proposed interval of possible values This also raises issues of aggregation when building synthetic indicators Under the further assumption that the true elasticity is uniformly distributed around the average of the interval the aggregation gives a typical interval of possible value of 025 around the average elasticity (ie a confidence interval of plusmn0125 around the average) Similarly at the EU level elasticity is built by summing the elasticities weighted by the share of Member States public expenditure in total public expenditure of the European Union In the following for the sake of simplicity only average values are presented but the reader should keep in mind that the interval of possible values is to be considered To put it differently in the following the statement the elasticity of this item is of x has to be understood that the elasticity belongs typically to the interval[ minus 0125 + 0125]Overall the conclusions derived from the results should be interpreted carefully This is a first attempt to estimate the sensitivity of the various expenditure and revenue categories to inflation directly from an exhaustive country-by-country analysis The analysis is complementary to other studies and cannot substitute for further quantitative exercises
22 RESULTS ON INFLATION SENSITIVITY
The results at the aggregate level are in line with the economic literature Concerning the relationship between inflation and public finances the economic literature tends to focus on the impact of inflation on debt rather than on deficit developments However the impact of inflation on the public deficit and its components has been studied by several authors Aghevli and Khan (1980) is one of the few examples of articles estimating the impact of inflation separately on expenditure and revenue They found that expenditure adjusts less rapidly than revenue in response to unanticipated inflation Moreover in a context of low inflation sensitivity tends to be lower than in periods of high inflation rate OECD (2007) and Immervol (2005) have both further reached the conclusion that even at low inflation rates the size of revenue effects can be substantial The results of the following sections are consistent with these findings and bring further precisions and quantification on the size of these effects
On an item-by-item basis the results presented here are broadly in line with the literature Heinemann (2001) studied the impact of low inflation on public finances for OECD countries and found that inflation has not the same impact across categories of revenue and expenditure indirect taxes (taxes on production and imports) adjust slightly more than total income taxes (including individual and corporate taxes) but both significantly less than social contributions We depart from this analysis as we find an effect on indirect taxes much larger than other revenue items Moreover this analysis brings both quantitative and qualitative evidence of channels through which these mechanisms occur and their recent evolutions
This section presents first the main results and then describes the more detailed findings by items
221 Results for aggregate revenue and primary expenditure and on the primary deficit
Revenues are more sensitive to inflation than primary expenditures The contemporaneous sensitivity is in line with what the literature suggests significantly higher for revenues than for primary expenditures This corresponds to the
Part III
97
economic intuition that tax bases and thereby revenues adjust fast whereas expenditure policy is set well ahead of the actual execution of the budget For primary expenditures the estimated elasticity in the first year ranges from 01 to 04 among Member States while it ranges from 01 to 09 for revenues (cf Graphs III22 and III23) At the EU level the elasticity of primary expenditure to inflation is 02 versus 06 for revenues Member States elasticities for revenues are thus on average more than three times higher than the ones for primary expenditures (113)
In general unlike revenues primary expenditures adjust with a lag While the elasticity of revenues to inflation does not change significantly between the contemporaneous estimation for 2014 and the following year the sensitivity of primary expenditures at the end of 2015 is higher for all Member States On the expenditure side elasticity to inflation ranges from
(113) Country-specific and EU-wide elasticities were obtained by
weighting revenue and expenditure categories with the respective amounts (collected and spent)
01 to 04 in the first year and increases to a (cumulated) elasticity of up to 08 for some Member States in the second year The overall elasticity for the EU increases from below 02 in the first year and to more than 03 in the second year On the contrary there is no such difference between estimations in the first year and in the second year when it comes to revenues the estimated elasticity ranges from 01 to 09 in both years and the elasticity at EU level is estimated at 06 in both years as well This means that the gap between revenue and primary expenditure elasticities decreases from the assessment in the first year to the one in the second year In 2014 the estimation of the EU level revenue elasticity is three times higher than the one for primary expenditures while this ratio drops to two for the estimation at the end of 2015 The ratio of revenue elasticity to expenditure elasticity ranges from 1 to 6 across Member States in both periods but it falls in the second year for three Member States out of four
Graph III22 Elasticity of revenues with respect to inflation surprise in 2014 in the EU Member States
Source Commission services
European Commission Public finances in EMU - 2015
98
= minus ∙ minus ∙
The partial or complete removal of indexation mechanisms and rigidities of a downward adjustment are two main reasons why elasticities of primary expenditures are particularly low in 2014 These two elements will be further detailed item by item
This general assessment is valid at the country level with little exceptions Revenues are more sensitive than primary expenditures to inflation for twenty-six Member States for the estimation in the first year and for twenty-three Member States for the estimation in the second year Moreover for twenty-six Member States the change in elasticity of revenues is lower than 01 point between the two assessments (effects in the first year and in the second year) while for more than half of the Member States the difference between the two assessments on primary expenditures is greater than 01 The increase of expenditure elasticity between the two estimations is even very high (gt05) for five Member States
Graphs III24 and III25 show that a downward inflation surprise of 1 percentage point increased the primary budgetary deficit-to GDP ratio by 02 percentage point in the first year (2014) and by 01 point in the second year (2015) The impact on the primary deficit-to-GDP ratio writes
with E and R respectively the level of expenditure and revenues d the primary deficit-to-GDP ratio and the rate of inflation As the expenditure elasticity picks up in the second year the effect on the deficit will be higher in the first year than in the second year
The effect of the inflation surprise on the deficit in the first year ranges from 0 to 04 of GDP Thirteen Member States show a deficit semi-elasticity of at least 02 in the first year but it is the case for only five of them in the second year
Graph III23 Elasticity of primary expenditures with respect to inflation surprise in 2014 in the EU Member States
Source Commission services
Part III
99
According to these results the inflation surprise of 1 percentage point in 2014 at the EU level let to an increase in the 2014 headline deficit of 02 point The effect of the 2014 inflation surprise is still expected to be visible in 2015 but should be lower than in 2014 as it would only increase the deficit by 01 point
222 Revenues
The sensitivity of income taxes and social contributions is high The elasticity of both items (current taxes on income and wealth and net received social contributions) was of 05 at the EU level in the first year (see Graph III26 below) Social contributions are found in the survey as not sensitive for nine Member States while income taxes are found not sensitive for five Member States Both items are found as very sensitive for one-third of the Member States The elasticity of both items at the EU level in the second year is slightly higher than in the first year (from 05 to 06) The difference between the two estimations
(in the first year and in the second year) is thus limited and is mainly explained by four Member States for which the sensitivity shifts from quite sensitive or weakly sensitive to very sensitive
Graph III24 Semi-elasticity of primary balance to inflation surprise in 2014 in the EU Member States
Source Commission services
Graph III25 Semi-elasticity of primary deficit in 2014 and 2015 to the inflation surprise in 2014 and contributions of revenue and expenditures
Source Commission services
European Commission Public finances in EMU - 2015
100
for taxes on income and wealth between the first and the second year
Stickiness of income keeps the sensitivity of income taxes and social contributions below 1 against moderate fiscal drag Firstly the crucial question is to which extent wages adjust to an inflation surprise One would expect productivity and price developments to be the main drivers of nominal wage developments The survey results support the expectation that wages are sticky downward in particular in cases when nominal wage increases are already small or zero The impact of an inflation surprise is further lowered since wages might adjust with a time lag Also the wage setting process might be affected by other country specific aspects Secondly when the income tax payments are based on previous years incomes the impact of lower wages occurs with a lag Thirdly the elasticity of income tax to inflation is increased by fiscal drag ie when fixed tax brackets entail an increase in average tax rates linked to inflation even if the real wage remains constant Fiscal drag is linked to lagged indexation of tax brackets or a non-indexation of tax brackets
Yet fiscal drag is rather limited as many Member States have put in place a regular indexation For instance in the Netherlands the tax framework itself is indexed with inflation meaning that there is a lower fiscal drag than in other Member States However if both wages (and thus income) and tax brackets are sticky downward the fiscal drag has overall a limited role However the effects of fiscal drag can be observed with a lag in the second year if tax brackets are frozen and that income tax is based on previous years income A freezing of income tax brackets was observed for example in Ireland and in France since the crisis Still in the majority of Member States absence of strong fiscal drag and stickiness of income to a downward revision of inflation also explains why the elasticity of revenues to the 2014 inflation surprise is lower than 1 both in the first year and in the second year
As expected the elasticity of indirect taxation to the inflation surprise is higher than the one of overall revenues At the EU level the elasticity of taxes on production and imports (including VAT) is 07 both in the first year and in the second year
Graph III26 Elasticity of different revenue items to inflation surprise in 2014
Source Commission services
Part III
101
According to our survey this item is not sensitive to inflation only in two Member States while it is very sensitive for almost half of the Member States Taxes on production and imports are directly linked to inflation developments even in case of an inflation surprise However the fact that the elasticity as estimated in the survey is below 1 can be explained by two main factors First consumers react to a smaller increase in prices by increasing their consumption level (in real term) This effect is stronger in the first year (ie before the downward wages adjustment) but can carry on in the second year when wages are sticky with respect to a negative inflation surprise Secondly part of the taxes on import and production are in fact excise duties Thus they are affected by inflation only to the extent that the quantity of consumed goods does not compensate the price decrease and the link between volume (and thus product of the tax) and downward inflation surprise is negative This means that except when excise duties are being indexed to inflation (which happens only in few cases like Belgium (since 2015) for example they tend to lower the overall elasticity of the whole item taxes on imports and production In other words the elasticity of taxes on imports and production excluding excise duties should be closer to 1
223 Indexation of public wages and social transfers
Due to the need for fiscal consolidation the sensitivity of public wages and social transfers has dramatically changed since the financial crisis The purchasing power of households is directly affected by public employees compensation and social transfers That is why in the majority of Member States these expenditure items are frequently adjusted to inflation whether through automatic legal mechanism or following ad hoc decisions However the need for fiscal adjustments in almost all EU Member States in the aftermath of the economic crisis led Member States to remove partially or totally ndash though often temporarily ndash the indexation mechanisms or to freeze the adjustment for several years
Until recently public wages were automatically or semi-automatically indexed to inflation in around one-third of Member States In these Member States there was a legal framework of automatic indexation mechanism to inflation for
compensation of public employees For example in Slovenia compensation of employees was automatically indexed to the national consumption price index (NCPI) In Belgium the indexation is not periodical but public wages increase by 2 each time the reference index ndash NCPI excluding tobacco alcohol and fuels ndash has increased by 2
In other Member States indexation of public wages is less systematic and takes place non-automatically through negotiation or ad hoc decisions For around 20 of the Member States the sensitivity of public wages to inflation developments comes from a negotiated agreement Interesting examples are the Netherlands where trade unions take inflation on board in determining the wage demands but without automatic indexation In Italy the benchmark in the bargaining with Unions is the forecast of the Italian National Institute of Statistics for HICP inflation net of imported energy prices In the other Member States (slightly less than 50) reaction of public wages to inflation is based on an ad hoc decision that takes into account inflation developments but for which the link with inflation is somehow less mechanical For instance in Bulgaria the evolution of public wages follows ad hoc decisions based on a variety of political and economic factors In Lithuania public wages are weakly sensitive to inflation and there is no formal obligation to consider inflation developments
Social transfers were even more frequently indexed to inflation In most cases pensions (that represent the largest share of social transfers) are fully or partially indexed to inflation In more than 70 of the Member States there is an automatic legal mechanism setting the reaction of pensions to inflation developments However in the majority of the cases pensions are indexed to both inflation and real wage developments In Slovakia for instance pension indexation is based on a combination of wage growth and so-called pensioners inflation (ie inflation reflecting a consumption basket of retired people) even though a gradual transition towards pure indexation to pensioners inflation has been introduced In Romania pensions are indexed to a combination of inflation and real wages but with a lag of two years In these cases the link between social transfers and inflation developments strongly varies among Member States and is challenging to quantify as it is both direct and
European Commission Public finances in EMU - 2015
102
indirect (via the impact of inflation on wages which depends on the characteristics of the labour market and wage formations in the Member States) Concerning other social transfers these usually also reflect inflation developments
In the case of social transfers in kind sensitivity to price developments is often limited to the service component in the health sector Specifically in some countries components of health benefits are explicitly indexed to prices and in general inputs of the service such as wages of personnel can be linked to inflation The link between prices for medicines and inflation is often fairly indirect since the evolution of prices for pharmaceuticals and health services is mostly separated from overall inflation developments The price setting for medicines is not a pure market outcome and inflation indexation is not common being in general influenced or substituted for by administrative mechanisms In Hungary for example most of the medicines reimbursed by public health insurance are priced on the basis of a form of a reference pricing or a bidding process but prices are not indexed explicitly In Greece and Romania inflation does not impact expenditure on pharmaceuticals as it is capped via a claw-back mechanism In Belgium the health care budget is annually adapted to the health index an adjusted inflation index leading to higher price sensitivity
However only two Member States have not frozen their public wage indexation in recent years Taking again the example of Slovenia the mechanism was frozen in both 2014 and 2015 This is the case also for pensions although the indexation mechanism was more stable than for public wages in recent years Some social benefits have not caught up with inflation in recent years in several Member States such as in Italy where several recent budget laws have limited the indexation of higher pensions in the Czech Republic where indexation of pensions was temporarily suspended in 2013-2014 or in Spain where the 2013 pension reform reduced the incidence of inflation indexation
In addition pensions and public wages tend to be less sensitive to inflation in case of downward surprises compared with upward revisions For fourteen Member States pensions public wages or both are declared less sensitive in that case For example in Spain there is a minimum
rate of pension increase This limits the possible reaction to a downward surprise in inflation since among low inflation and fiscal consolidation pension increases are already close to or at the minimum rate In Hungary if inflation turns out to be lower than anticipated at the time of the pension increase then there is no downward adjustment in the pension increase On the contrary if inflation turns out to be higher than anticipated in the budget then pensioners are compensated during the course of the year In Latvia pensions below the average pay are linked to inflation and wages developments but the indexation is only applied if the value is positive
These recent evolutions of inflation adjustment decisions and asymmetric indexation explain why the sensitivity of compensation of employees and social transfers is quite low even in the second year (2015) The estimated elasticity of compensation of employees to inflation is particularly low (the EU average is 01 in the first year see Graph III27) Concerning the estimated effect in the first year only three desks answered weakly sensitive and all the others answered not sensitive Social transfers (other than in kind) have a slightly higher elasticity to inflation (only ten desks considered them to be not sensitive in the first year while 40 of them assessed them as weakly sensitive or very sensitive) confirming that inflation adjustment has been more preserved than for public wages However at the EU level elasticity of social transfers (other than in kind) stands at 02 in the first year Indeed the fact that many indexation mechanisms are based on past inflation or forecasts (with possibly an error correction in the following year) inflation surprises cannot be taken into account contemporaneously in most cases However elasticities are still quite low in the second year they stand at 03 for public wages and 04 for social transfers (other than in kind) In both cases for more than half of the Member States the item is considered not sensitive to inflation in the first year Still the diversity of mechanisms ndash and of recent evolutions of them ndash leads these results to be particularly diverse among Member States (see more details in Annex III2 which covers main findings of the survey by country) For both social transfers and compensation of employees around one-third and one-half of the answers in the respective categories stick to not sensitive in the second year while the rest of the answers is
Part III
103
distributed more or less equally over the three other possibilities
224 Intermediate consumption investment and other expenditures
Intermediate consumption has a slightly higher elasticity than the rest of the expenditures The elasticity of intermediate consumption at the EU level is 03 in the first year and 04 in the second year This is explained by the fact that intermediate consumption is directly related to price developments The sensitivity is higher in the second year because part of the dedicated budget for intermediate consumption is fixed in nominal terms on a yearly basis so adjustments to inflation surprises can only be done the year after Indeed at the stage of budgetary planning the amount dedicated to intermediate consumption is often linked to the inflation forecast and once the budget is adopted the expenditure ceilings assigned to specific government entries can rarely be exceeded However even in the second year the
sensitivity is rather low While some longer term service contracts may have an indexation clause there are many Member States in which no automatic mechanism of compensation for past inflation forecast errors are envisioned in the budgetary process Downward adjustments of the budget to compensate past lower inflation are indeed rarely observed Finally lower prices could result in higher volume of purchased goods rather than lower total spending Moreover it is difficult in particular for this item to distinguish inflation from other factors which are often judged to be far more important
Gross fixed capital formation is influenced by inflation but the link is much weaker than for intermediate consumption The elasticity of this item to inflation at the EU level is estimated at 02 for both the first and the second year As it concerns mainly long-term contracts the link with inflation is lagged and much weaker Investments are typically discrete events where the price is determined on the basis of public procurement Ex
Graph III27 Elasticity of different expenditure items to inflation surprise in 2014
Source Commission services
European Commission Public finances in EMU - 2015
104
Dtminus1 δ
ante (before a supplier is selected) bidders take into account their costs including anticipated inflation Ex post (once a supplier is selected) the treatment of inflation depends on the actual contract Unless the project duration is particularly long inflation risks are likely to be absorbed by the suppliers but there is no universal rule Moreover an important share of gross fixed capital formation (GFCF) is composed of EU funds in particular for those Member States which acceded to the EU in 2004 or later As EU funds-related spending is part of a different process link to inflation developments is quite weak on a year-on-year basis Finally a large share of GFCF concerns the construction sector so its evolution could be more linked to construction prices which have their own cycle than to consumption price index For example in Italy the price of public procurement for capital goods is usually set in advance However according to the Italian Civil Code the price of public procurement contracts may be subject to revision in case the direct or indirect costs borne by the supplier change (including but not only due to inflation) by more than 10 upwards or downwards making it more difficult to quantify the impact of an inflation surprise
23 IMPACT OF INFLATION ON INTEREST EXPENDITURE
An inflation shock may affect the cost of servicing debt through inflation-linked bonds as well as newly issued and variable rate debt Interest payments are sensitive to in-year inflation developments to the extent that inflation-linked bonds and newly issued or variable rate debt are affected by price changes Inflation-linked bonds are directly influenced in that the annual coupon payments or the principal payment or both are adjusted in line with movements in the level of prices Newly issued debt is affected insofar as higher or lower inflation leads to a change in inflation expectations which may in turn affect bond spot rates This is also the case for variable rate debt Finally while in theory interest payments on foreign currency-denominated debt are sensitive to inflation this depends on the validity both of the Purchasing Power Parity relation ndash which states that price levels are equalized across countries once account is taken of the Balassa-Samuelson effect ndash and the validity of
the Uncovered Interest Parity relation in financial markets Thus empirically in the short term the relationship between inflation and a countrys exchange rate and relative interest rate is complex and very difficult to estimate In what follows it is considered that foreign-denominated debt is not affected by an inflation surprise
Therefore the amount of interest payments in year t can be expressed as follows
(1)
Where is the amount of outstanding debt at the end of year t-1 is the share of in-year inflation sensitive debt (that is the sum of debt with a residual maturity of less than one year inflation-linked debt and variable rate debt) it δ is the implicit interest rate on that share and it1-δ is the implicit interest rate on the remaining stock of debt (that is non-inflation-linked fixed rate debt with a residual maturity of more than one year) It can be shown from the above that the elasticity of interest expenditure with respect to prices (and hence to an inflation shock) can be approximated by (114)
Where it is the aggregate implicit interest rate on debt A 1 percentage point decrease in inflation
will thus lead to a percent decline in the amount of interest payments This implies that in case of smaller implicit interest rate the elasticity will be higher since the same change in the implicit interest rate relates to a smaller initial level Note that when inflation expectations are revised in line with inflation surprises and provided that spot interest rates adjust fully to inflation expectations (the so-called Fisher effect see below) the elasticity is simply given by
(114) By definition = minus 1 and = Therefore
equiv times = times times
In addition it follows from equation (1) that = times times Therefore
= times times times = times times times (1 + ) cong times times
= times + (1 minus ) times 1minus times minus1
001 times δ times partitδpartπt times 1it
η cong times times 1
Part III
105
Annex III3 provides a disaggregated representation of how inflation impacts upon interest payments
The portion of debt that is sensitive to inflation can be derived using alternative andor complementary data sources Available data sources do not allow for comprehensive and consistent measurement of inflation-sensitive debt across EU Member States A two-step approach is used here Eurostat data which covers all general government sub-sectors and includes both debt securities and loans are used to compute the proportion of short-term debt However the time structure of debt in Eurostat data is computed on the basis of its initial maturity rather than its maturity structure at each moment in time which would be a more adequate figure for the purpose of this analysis Therefore Bloomberg data are used to assess the proportion of long-term debt that was
to be rolled over in 2014 (115) The shares of inflation-indexed and variable-rate debt are estimated separately using OECD data (116) Altogether this gives a proxy of the share of debt that could be influenced by in-year inflation developments
The portion of debt that is sensitive to inflation varies significantly from one Member State to another The share of debt (at the end of 2013) with a residual maturity of less than one year inflation-linked debt and variable rate debt can be considered at least partly sensitive to inflation and ranges from around 5 to slightly above 50 (see Graph III28) (117) The share of debt with less
(115) Data compiled by Bloomberg cover central government
debt and for some Member States central government-guaranteed debt However public debt of subnational governments and other entities classified in general government as well as loans are not always covered
(116) The relevant OECD database was used even though it was not updated since 2010 because no alternative comprehensive data source is available
(117) Limitations in the data set imply that the mentioned subsets may partly overlap in practice In addition Greece and
η =1 cong times 1
Graph III28 Share of debt sensitive to inflation in the EU Member States
Source Commission services
European Commission Public finances in EMU - 2015
106
than one year of remaining maturity ranged from around 5 to slightly less than 35 across Member States averaging close to 20 This share was below 10 only in three Member States The share of inflation-linked bonds exceeds 5 only for a couple of countries The UK and Sweden show the highest values around 20 (118)
The impact of an inflation shock on interest payments will depend on how much spot interest rates are affected by (actual and forecast) inflation developments The so-called Fisher effect states that there will be a one-for-one adjustment of the nominal interest rate to the expected inflation rate The implication of the conjectured constant real rate is that monetary policy will have no effect on the real economy However empirical evidence (119) suggests that at least in the short run changes in the expected inflation rate do not only have monetary effects but also affect real variables Thus the nominal interest rate and the expected inflation rate are
Cyprus the remaining euro area countries under a macroeconomic adjustment programme are not included in the analysis of the sensitivity of interest rates with respect to inflation Indeed interest rate conditions are in these cases subject to a specific agreement and can to a large extent be considered disconnected from inflation developments
(118) Missing data points were replaced with EU averages The composition of debt was thus aligned with EU averages
(119) An overview of recent studies can be found in Beyer et al (2009) and in Westerlund (2008) For a review of the literature on the Fisher effect see Cooray (2002)
positively correlated but there is not a one-for-one relationship A Fisher effect of 05 was chosen as a baseline assumption in this analysis As to the relationship between the actual and forecast rate of inflation at the current juncture the recent movements in inflation swaps (see Graph III29) suggest that medium- and long-term inflation expectations have fallen to a large extent in line with current inflation
Under the assumptions made the elasticity of interest payments (see Graph III210) with respect to inflation is found to be significantly larger than 1 Assuming 50 pass-through from inflation (expectations) to interest rates a 1 percentage point decrease in inflation is estimated to reduce interest payments in the EU as a whole by 39 in the first year and 35 in the second year (in cumulative terms-) We assume that on average debt is rolled uniformly over the year hence there is a carry-over effect in the following year for the share of debt that comes to renewal However the impact is decreasing in the second year as we consider the impact of the 2014 inflation shock as if the rate of inflation in the second year remained unchanged from the baseline (120) In turn this implies that spot interest rates in the second year and hence the amount of debt to be redeemed is not affected by the inflation shock Note that similarly interest payments on inflation-linked and variable rate debt are left unchanged from the baseline in the second year
Assuming the Fisher hypothesis in full leads to higher elasticity Under the assumption that the inflation shock filters into the interest rate one for one the elasticity of interest expenditure is estimated at 59 in the first year and 70 in the second year for the EU as a whole Note that independent of the assumption regarding the Fisher effect interest payments on inflation-linked bonds are assumed to adjust one-to-one with movements in the level of prices
(120) This choice reflects the focus on the impact of lower
inflation in 2014 on interest expenditure in 2014 and in 2015 and does not mean that the shock is necessarily temporary Irrespectively we assume that the effect of the Fisher effect (partly) holds as even in the case of a temporary shock interest expenditure would be affected through interest paid on short-term debt This lends further support to a partial (as opposed to a full) application of the Fisher effect
Graph III29 Market-based inflation expectations in the euro area
Source Eurostat Bloomberg and Commission services calculations Notes Curves represent inflation expectations as derived from inflation swap rates over different horizons Lines represent the y-o-y rate of core inflation
Part III
107
The results vary from one country to another depending on the portion of inflation sensitive debt The in-year elasticity of interest expenditure is found to vary from very small values in Luxembourg Malta Austria and Slovenia to around 11 in Sweden and around six in the UK assuming that the 50 pass-through Fisher effect holds (Graph III210) Sweden and the UK hold significant amounts of inflation or interest indexed debt leading to a decrease in the elasticity in the second year to around 9 and 25 Relatively long maturities for Luxembourg Malta Austria and Slovenia debt in combination with low share of indexed bonds lead to fairly low elasticities
The actual developments in interest expenditure over the last few years in a sub-set of EU Member States is summarised in Box III21
Savings in interest expenditure cushion the increase in the deficit induced by a downward inflation surprise Graph III211 shows savings in interest expenditure amount linked to a deflationary surprise of 1 pp amount to around 01 of GDP in the first and the second year Compared to the analysis in 21 the deficit increase is thus reduced to 01 of GDP in the
first year and below that in the second year The deficit is even slightly reduced following the inflation surprise for two countries in the first year and for seven countries in the second year
Assuming the Fisher hypothesis in full leads to an even smaller aggregate impact of inflation on the headline balance However the difference with the baseline scenario is relatively small in size (approximately 005 of GDP in the first year
Graph III210 Elasticity of interest expenditure to inflation in the EU Member States
Source Commission services
Graph III211 Semi-elasticity of deficit in 2014 and 2015 to an inflation surprise in 2014 Contributions of revenue and expenditures (primary and interest)
Source Commission services
European Commission Public finances in EMU - 2015
108
and01 in the second year)
The impact of the 2014 inflation surprise on the overall balance varies significantly across Member States At the country level the overall impact of a 1 pp negative inflation shock on the budget balance is comprised between -01 of GDP and 03 of GDP (see Graph III212) implying that it could have a material impact in terms of the annual change in the headline balance
This is all the more evident when comparing these estimates with what can be reasonably seen as theoretical maximum impact of a 1 pp inflation shock of around 04-05 of GDP (121) where by revenues adjust one for one while expenditures remain unchanged The maximum impact is even slightly smaller when taking into account the likely
(121) Indeed assuming that revenues evolve strictly in
proportion to nominal GDP and that primary expenditure is set by budget law and invariant to real-time movements in inflation changes in the primary balance will mirror those in the ratio of nominal primary expenditure to nominal GDP For example if the primary expenditure ratio is 50 a pp fall in inflation will automatically translate into a deterioration of the primary balance of 05 of GDP
fall in interest expenditure For example France and Italy are estimated to see their headline balances deteriorate by 03 and 02 of GDP respectively in the first year following a 1 pp drop in inflation versus a theoretical impact of up to 04 and 03 of GDP respectively
Graph III212 Impact on budget balance of the negative inflation surprise in 2014 in the EU Member States ( of GDP)
Source Commission services
Part III
109
(Continued on the next page)
European Commission Public finances in EMU - 2015
110
Box (continued)
3 IMPACT OF AN INFLATION SHOCK ON FISCAL EFFORT UNDER THE SGP
111
Chapter III2 showed that revenues evolve broadly in line with inflation developments possibly with a short time lag depending on how fast tax bases adjust as well as on tax rules and tax collection By contrast it is less straightforward to measure the impact on government spending Indeed some items are often linked to inflation while others are not at least not in the short run (eg items indexed on the basis of the inflation rate observed in the previous year or on the basis of expected inflation) Most importantly countries implementing nominal expenditure ceilings pay freezes cuts in social transfers etc as part of (predetermined multi-year) consolidation packages will find it difficult to adjust plans to take inflation surprises into account
This chapter sheds more light on the interplay between inflation surprises and fiscal effort as measured by the various metrics that are used when assessing compliance with the rules of the Stability and Growth Pact Indeed the way inflation developments affect compliance with the rules is a relatively new topic also because most of the latter have been built under the implicit assumption of price stability evidenced by annual inflation (almost) continuously around 2 since the inception of the SGP
In principle only unanticipated inflation shocks may affect the assessment of compliance with the SGP rules Indeed the way fiscal effort is measured for the purposes of EU fiscal surveillance implies that price developments that are not anticipated at the time of policy advice (eg a Council recommendation under the excessive deficit procedure) may lead to an overly positivenegative picture of the governments course of action in the subsequent assessments By contrast inflation developments should be surveillance-neutral as long as they (and their impact on the budget balance) are anticipated This said because revenues and expenditures may not be equally responsive to price developments a protracted period of low inflation ndash even if fully anticipated and thus with no impact on measuring fiscal effort ndash raises the question as to whether or not it is appropriate to take the inflation outlook into account when formulating policy recommendations This chapter focuses on
unexpected inflation shocks thus leaving the issue of the appropriateness of requirements in a low inflation environment aside
While not directly observable the concept of fiscal effort plays a central role in evaluating the extent to which government action impacts upon the budget balance Traditionally fiscal effort is gauged by (the change in) the structural budget balance which can be referred to as a top-down method of measuring the governments influence on the budget balance An alternative bottom-up approach which has been developed more recently seeks to account separately for the effects of individual policy initiatives on the budget balance Currently both approaches are used to assess compliance with the SGP whether under the preventive or the corrective arm of the SGP
This chapter shows that inflation surprises affect the top-down and bottom-up techniques in an opposite fashion In particular the implications in terms of the (relative) relevance of the different indicators used and hence in terms of policy surveillance depend crucially on how sensitive revenue and expenditure aggregates are to inflation
A disinflation shock that leads to a worsening in the budget balance will likewise lead to a worsening in the structural balance thereby showing an overly negative picture of the orientation of fiscal policy A negative inflation shock will typically impact negatively on the headline government balance as revenues will decrease more as a result of lower inflation than expenditures will do (see Chapter III2) The cyclical correction method used to transform the headline balance into a structural balance does not correct for inflation surprises Therefore a disinflation shock that affects the headline budget balance will also affect the structural balance and ultimately lead to underestimating the fiscal effort implemented by the country concerned
By contrast bottom-up estimates of fiscal effort will likely be inflated following a disinflation shock A negative inflation surprise will also affect the returns from discretionary fiscal measures
European Commission Public finances in EMU - 2015
112
However the way individual measures are aggregated for the purposes of fiscal surveillance (a truly bottom-up approach on the revenue side an essentially top-down method regarding expenditures) implies that inflation developments will act differently on revenue measures than on expenditures savings While the returns from revenue measures will be impacted by lower inflation this effect will be relatively marginal since it is only a base effect on the additional revenue provided by the measure This will likely be more than compensated for by the expenditure estimate since any fall in expenditures due to lower inflation will be assessed on the full expenditure base rather than a specific measure
Compliance with the debt rule can also be affected by inflation shocks The debt reduction benchmark specified in the Code of Conduct on the SGP and the methodology for assessing progress during the three-year transition period take account of cyclical conditions as far as the real economy is concerned but not inflation developments Negative inflation shocks can therefore translate into higher requirements if only through a denominator effect and jeopardise compliance with the debt rule
The chapter is organised as follows Sections III21 and III22 look at how inflation shocks affect the assessment of compliance with the preventive and the corrective arm of the SGP respectively Section III23 looks into the impact on the debt rule including during the transition period More detailed explanations are provided in Annex III4 Section III24 draws the implications for fiscal surveillance
31 THE PREVENTIVE ARM
Structural budget balances play a key role when assessing compliance with the preventive arm of the SGP They represent cyclically-adjusted general government budget positions net of one-off and other temporary measures They are used to assess whether the country-specific medium-term budgetary objectives (MTOs) also defined in structural terms are achieved or appropriate progress is made (see Chapter II1)
The structural balance pillar is complemented by an analysis of the growth rate of
expenditures net of discretionary revenue measures through the so-called expenditure benchmark This requires that for countries at their MTO any excess growth of expenditures over a medium-term reference rate of potential GDP growth be matched by discretionary revenue measures Countries on their adjustment path must contain their net expenditure growth at a rate lower than medium-term potential GDP growth again unless matched by discretionary revenue measures
Based on the results of Chapter III2 a disinflation shock will likely cause the structural balance to underestimate fiscal effort whereas the expenditure benchmark will be inflated The following subsections describe the channels through which inflations shocks impact upon the two indicators used
311 Impact on structural balance
A negative inflation shock which causes revenues to underperform while expenditures remain on target or adjust by less than revenues will lead to a worsening in the headline balance compared to the baseline where by baseline we mean no inflation shock
This in turn will lead to a worsening in the structural balance as the cyclical component of the budget balance is not influenced by inflation developments
This can be summarised as
πdarrrarr|ΔREV|gt|ΔEXP|rarr[GGBdarr and ΔOG=0]rarr SBdarrrarrΔSBdarr
Where π stands for inflation REV and EXP for general government revenues and expenditures GGB for general government balance OG for output gap and SB for structural balance
The quantitative impact will crucially depend on the relative response or elasticity of revenues and expenditures with respect to inflation Assuming that revenues adjust fully to inflation while only half of expenditures do so a rough calculation suggests that a 1 pp surprise in inflation will lead to a 02-03 pp of GDP worsening in the structural balance compared with the baseline
Part III
113
Therefore in the likely case where revenues adjust faster andor to a larger extent than expenditures to a negative inflation shock the change in the structural balance will tend to underestimate fiscal effort and thus paint an overly negative picture of the governments policy action
312 Impact on expenditure benchmark
The expenditure benchmark ie the reference rate against which the growth rate of expenditures (net of discretionary revenue measures) is assessed is frozen ex ante and thus remains unchanged for the in-year and ex post assessments of compliance For example a country that is at the MTO and whose medium-term potential GDP growth and GDP deflator for year t are estimatedforecast in year t-1 at 1 and 2 respectively should make sure that expenditures grow by not more than 3 And it is this 3 reference rate that will be used for the in-year and ex-post assessments
The effect of a negative inflation shock will mainly depend on whether andor to what extent expenditures adjust to lower inflation as the impact on discretionary revenue measures is expected in general to be negligible If the growth rate of expenditures remains unchanged from the baseline compliance with the expenditure benchmark (the 3 reference rate in the example) will not be affected and the distance to the benchmark whether positive or negative will provide an appropriate picture of the underlying fiscal effort
Conversely if expenditures adjust if only slightly to lower inflation this will make it easier for the country to comply with the benchmark In this case the expenditure benchmark approach will tend to overestimate fiscal effort
As a consequence the extent to which compliance with the expenditure benchmark is affected by inflation surprises will crucially depend on the elasticity of expenditures with respect to inflation Assuming that half of expenditures adjust to inflation while the returns from revenue measures are materially unaffected a rough calculation suggests that a 1 pp negative surprise in inflation will lead to a 02-03 pp of GDP improvement in fiscal effort as measured by the expenditure benchmark approach compared with the baseline
This can therefore be summarised as
πdarrrarr[ΔEXP=0 and ΔREVmeasures=0]rarr DEBharr
rarr [ΔEXPlt0 and ΔREV measures=0] rarr DEBuarr
Therefore in the likely case where expenditures adjust if only slightly to lower inflation the expenditure benchmark approach will tend to overestimate fiscal effort and thus paint an overly positive picture of the governments policy action
32 THE CORRECTIVE ARM
If a Member State that is subject to the excessive deficit procedure is not compliant with the headline deficit targets an assessment of effective action is undertaken Similarly to the preventive arm as a first step the assessment of effective action revolves around the comparison between the required change in the structural balance and the observed change in the structural balance
The structural balance is complemented by a bottom-up quantification of measures This is done by quantifying the budgetary impact of the (new) measures the Member State has introduced to raise revenues and to cut spending since the EDP recommendation was issued The effort on the revenue side is measured by adding up the returns from individual revenue measures The amount of expenditure savings is estimated as the difference between the outturn growth of expenditures and the growth expected at the time of recommendation ie the change in expenditures if no further measures had been taken
Conceptually the two indicators are very similar to those used in the preventive arm and will thus be affected by inflation surprises in a similar fashion The following subsections describe the channels through which inflations shocks impact upon the indicators used in the corrective arm
321 Impact on (corrected) structural balance
While conceptually very similar to the structural balance pillar used in the preventive arm in the corrective arm the observed change in the
European Commission Public finances in EMU - 2015
114
structural balance is corrected for effects outside the control of government (other than the normal working of the cycle that is captured by the cyclical component of the budget balance) In particular the change in the structural balance is adjusted to net out the effect of possible revisions to potential GDP growth estimates and unexpected shortfallswindfalls in revenues relative to the macroeconomic scenario underpinning the EDP recommendation through the so-called α and β adjustors
As already indicated the (non-adjusted) change in the structural balance will tend to underestimate fiscal effort as long as revenues adjust to inflation to a larger extent than expenditures In general this effect will not be corrected for by the α and β adjustors meaning that the adjusted changed in the structural balance used under the corrective arm will be distorted as well Indeed the α adjustor will remain materially unchanged as inflation surprises should not affect potential output growth estimates The β adjustor will also be unaffected as long as revenues adjust fully to the inflation shock
The process can therefore be summarised as
πdarr rarr |ΔREV| gt |ΔEXP| rarr [GGBdarr and ΔOG=0] rarr SBdarr rarr [ΔSBdarr and αβharr] rarr ΔSBdarr
A disinflation shock will as a rule distort the adjusted change in the structural balance so that the top-down approach will tend to underestimate fiscal effort This is similar to what happens with the structural balance pillar under the preventive arm
322 Impact on bottom-up approach
Conceptually the bottom-up approach is very similar to the expenditure benchmark except that in one case the reference growth rate for expenditures is medium-term potential GDP growth or a lower rate (expenditure benchmark) while in the other the reference rate is the growth rate of expenditures (net of discretionary revenue measures) expected at the time of the EDP recommendation (bottom-up approach)
Therefore the effect of a negative inflation shock will be very similar ndash a fall in expenditures due to lower inflation will translate into higher fiscal effort as this will affect the growth differential
between the outturn and the EDP recommendation while the returns from discretionary revenue measures will generally remain unchanged However here again any fall in interest payments will not distort the bottom-up approach
323 The impact of inflation on fiscal effort the case of France
As part of the normal EU surveillance process Member States compliance with the rules of the SGP is assessed after each Commissions forecast and may have procedural consequences After its 2015 winter forecast the Commission made a formal assessment of Frances compliance with the Council Recommendation of 21 June 2013 under the Excessive Deficit Procedure and recommended that the Council extend the deadline for bringing the deficit below 3 of GDP by two years to 2017
In its assessment the Commission took account of the lower-than-expected inflation observed in 2014 as measured by the deflator of GDP Indeed in the baseline scenario underpinning the Council Recommendation of 21 June the GDP deflator had been forecast to increase by 17 in 2014 while the Commissions 2015 winter forecast estimated the increase in the GDP deflator to have been 09 pp lower
The Commissions assessment showed that the lower-than-expected rate of inflation affected fiscal effort as measured by the corrected change in the structural balance (top-down approach) and the bottom-up approach Partly as a consequence of this the two indicators provided diverging signals thus calling for a careful analysis
The Commission assessed that the (corrected) structural balance indicator had been strongly affected by the inflation shock less so the bottom-up indicator The Commissions Report (122) showed that the negative inflation shock had an adverse impact on tax bases and led to downward revisions in tax revenues By comparison expenditures were found less sensitive to the inflation revision especially given that public expenditures are partly guided by norms set in
(122) Available online at
httpeceuropaeueurope2020pdfcsr2015cr2015_france_enpdf
Part III
115
nominal terms In addition a number of expenditures notably public wages and social transfers related to pensions and housing were frozen in nominal terms in 2014 making the achievement of further savings more difficult The resulting deterioration in the headline deficit led to a worsening in the structural balance thus leading to an estimated lower effort according to the top-down assessment This appears in line with the results of the survey set out in Chapter III2 Indeed the elasticity of primary expenditures with respect to the inflation surprise was found to be approximately 01 while that of revenues around 08 implying that primary expenditures remained virtually unchanged while revenues adjusted almost in proportion with the inflation shock
By contrast the bottom-up assessment was found less sensitive to the inflation revision than the top-down assessment The Commissions report indicated that the direct quantification of the discretionary revenue measures adopted in 2014 had only been marginally impacted by the lower-than-expected rate of inflation while a large part of expenditures did not adjust to lower inflation as expenditure targets had been set in nominal terms The overall impact of the downward revision in inflation on the bottom-up effort was found limited Again the results of the survey tend to confirm that the bottom-up estimate of fiscal effort was much less affected than the top-down estimate with primary expenditures virtually unaffected by the inflation shock
Overall the gap between the two indicators that could be attributed to the inflation surprise was estimated at 06 of GDP For the reasons indicated above this 06 of GDP difference was found to come almost exclusively from the corrected change in the structural balance being negatively affected by the lower than expected rate of inflation The bottom-up estimate was thus deemed to provide a broadly accurate picture of the fiscal effort delivered by France in 2014
33 THE DEBT RULE
A Member State is non-compliant with the debt criterion if its general government debt is greater than 60 of GDP and is not sufficiently diminishing and approaching 60 of GDP at a satisfactory pace This means that the gap between
the Member States debt level and the 60 reference threshold needs to be reduced by 120th annually (on average over three years) This in turn is translated into a debt reduction benchmark which is set out in the Code of Conduct on the SGP A breach of the debt criterion is judged by considering the debt reduction benchmark in three configurations a backward-looking version a forward-looking one and by taking into account the impact of the economic cycle Only if a country is in breach of all these conditions is the debt criterion considered breached and an Article 126(3) TFEU report is written
The debt benchmark takes the cyclical conditions into account as far as the real economy is concerned By contrast inflation developments and in particular low inflation are not accounted for in this methodology This also applies to the methodology used for calculating the MLSA ie the minimum linear structural adjustment that ensures ndash if followed ndash compliance with the debt rule at the end of the three-year transition period foreseen for those Member States that were in EDP at the time of adoption of the so-called 6-pack piece of legislation
Negative inflation surprises can therefore translate into a more demanding debt benchmark mainly through a denominator effect That is all things equal a disinflation shock can make it harder for Member States to comply with the debt rule both during the transition period and once this is over and the full debt rule is applied
Whether the impact of an inflation shock on the debt benchmark will be material will crucially depend on the nature and timing of the shock In particular in the case of a temporary inflation shock compliance with the debt benchmark (and the MLSA) will only be affected if the shock occurs during the period covered by the least stringent of the backward-looking the forward-looking and the cyclically-adjusted components To put it differently given the specification of the debt rule as long as the shock does not affect the least stringent component of the debt benchmark or in the case of the least stringent component it only affects the initial debt position ndash but not the dynamics underpinning the three-year average ndash compliance with the debt benchmark will not be influenced (and the MLSA will remain broadly unchanged)
European Commission Public finances in EMU - 2015
116
Another consequence is that the impact on the debt benchmark (and the MLSA) for year t of a shock in year t will be larger than the impact of an equal shock in year t-1
Also note that here we simply look at the denominator effect neglecting any possible impact of inflation on the numerator and in particular on the general government balance In particular as already seen a disinflation shock will likely lead to a worsening in the government balance which will in turn make compliance with the debt rule (and the MLSA) even more demanding
34 CONCLUSION AND IMPLICATIONS FOR FISCAL SURVEILLANCE
The above analysis suggests that the structural balance indicators might in some cases underestimate fiscal effort in the event of a negative inflation surprise By contrast the expenditure benchmark and the bottom-up approach will tend to provide an overly positive picture of the governments policy action However the extent to which the various the various metrics of fiscal effort are affected will very much depend on the countrys specificities As already discussed while it can generally be expected that revenues will respond more quickly to a negative inflation shock than expenditures the extent of this divergence will depend on domestic structures such as the extent and design of indexation arrangements or the use of nominal expenditure ceilings
In light of the findings from Chapter III2 both sets of indicators have likely been affected by the lower inflation observed in 2014 calling for an informed economic judgement The results presented in Chapter III2 suggest that for most Member States the disinflation shock observed in 2014 caused both revenues and expenditures to underperform though with revenues affected to a slightly larger extent This in turn implies that both sets of indicators ((corrected) structural balance on the one hand expenditure benchmark and bottom-up approach on the other) were generally affected by a disinflation shock meaning that none of them should be taken at face value but instead both should be qualified This should be done through
the so-called overall assessment in the preventive arm and the careful analysis in the corrective arm
The assessment of compliance should also consider whether the inflation shock could have been anticipated and most importantly the budget (namely expenditure ceilings) adjusted accordingly From this perspective only unanticipated shocks should in principle be considered a mitigating factor In all other cases and all things equal the structural balance indicators which implicitly assume that headline balances are unaffected by inflation developments would remain a valid measure of fiscal effort
The distinction between anticipated and unanticipated shocks appears relevant also when it comes to compliance with the debt rule As explained above low inflation makes it harder for Member States to meet the debt criterion and can lead to requirements which can be prohibitive While it is true that relevant factors can be taken into account in determining whether a numerical breach of the debt criterion should lead to the opening of an EDP in the case of inflation there is the specific difficulty that it remains unclear what should be considered as normal inflation This implies that the assessment of the role of inflation in the breach of the debt criterion is not possible per se but can only be conducted with respect to inflation surprises
While the current framework allows dealing with a temporary inflation shock that occurs after SGP recommendations are issued through an informed economic judgement a prolonged period of low inflation or negative inflation may raise the question of the appropriateness of new recommendations Indeed because low inflation makes it more difficult to reach a given improvement in the structural balance ndash in the sense that a larger amount of measures is necessary to reach this under the assumption of downward rigidity of expenditures ndash the required levels might need to be downgraded accordingly
ANNEX 1 SURVEY
117
For the main categories of revenue and expenditure the survey presented the following questions and proposed stylised answers Desks were invited to specify and substantiate their replies in comment fields
1) Sensitivity of the item to inflation as for 2014
1 Not sensitive (elasticity lower than 025)
2 Faintly sensitive (elasticity between 025 and 05)
3 Quite sensitive (elasticity between 05 and 075)
4 Very sensitive (elasticity greater than 075)
2a revenue) Through which main channels the item is impacted by inflation
1 Inflation impacts wages that in turn impact the item
2 Inflation impacts households consumption that in turn impacts the item
3 Fiscal drag
4 Automatic legal mechanism
5 Several of the above (precisions in comments)
6 Other channels (precisions in comments)
2b expenditure) Through which main channels the item is impacted by inflation
1 Inflation impacts wages in the private sector that in turn impact wages in the public sector
2 Automatic mechanism of indexation
3 Inflation-index bonds (for interests)
4 Several of the above (precisions in comments)
5 Other channels (precisions in comments)
3) Are there automatic mechanism driving the effect of inflation on the item
1 Yes full or almost full indexation of the item
2Yes but only partially (precisions in comments)
3Other mechanisms (precisions in comments)
4 No automatic mechanism
4) On which indicator the automatic mechanism is based
1 HICP
2 GDP deflator
3 Other (precisions in comments)
5) Is the indexation symmetric
1 Yes the indexation is symmetric
2 No the indexation is not symmetric (precision in comments)
3 Other (precisions in comments)
4 No indexation
6) Is there a lag in the indexation mechanism
1 No the item is indexed with current inflation
2 Yes the item is indexed on the previous year inflation
3 Yes (other lag precisions in comments)
4 No indexation
7) How the automatic mechanisms have evolved between 2009 and 2014
1 The mechanism did not change since 2009
2 New measures increased sensitivity to inflation (main measures in comments)
3 New measures decreased sensitivity to inflation (main measures in comments)
4 Sensitivity evolved for other reasons (precisions in comments)
ANNEX 2 MAIN COUNTRY-SPECIFIC FEATURES CHARACTERIZING THE IMPACT OF INFLATION ON THE BUDGET BALANCE
118
According to DG ECFINs analysis in the vast majority of countries there was hardly any real-time adjustment of primary expenditures to the inflation shock of 2014 At the same time in nearly two-third of the cases the in-year sensitivity of revenues was assessed to have been relatively strong This suggests that in 2014 budget balances were negatively affected by the negative inflation surprise In 2015 there has been some additional adjustment of primary expenditures but the picture remains broadly unchanged
As to the channels of transmission on the expenditure side a clear link to inflation developments can be seen for social transfers other than in kind which contain pensions through indexation mechanisms and for public wages mostly indirectly via private sector wage developments Government purchases of goods and services are also affected by price developments but not without differences across countries and often with a time lag For all other sub-categories of expenditures the link is less straightforward
On the revenue side not surprisingly the main channels are consumption taxes where the tax base directly reflects price developments (VAT) and taxes affected by wage developments (direct taxes and social contributions) In a number of countries (eg BE HU CZ FR IT MT AT PL RO and UK) revenues were found to be largely responsive to inflation In others (eg in BG DE EE EL ES HR CY PT and FI) the impact of the 2014 inflation surprise proved limited with private sector wages mostly driven by labour market developments It is noteworthy that in a number of countries (DE EL HR and CY) the lower than expected rate of inflation did not affect VAT receipts significantly
Fiscal drag due to no or suspended indexation was reported in DE IE ES CY LU PL SI In countries with a flat PIT system (ie one single rate) such as HU and RO the issue of fiscal drag is largely avoided
The main country-specific features characterizing the impact of inflation on the budget balance and notably on government expenditure according to DG ECFINs desks are the following
BG Public sector wages and social benefits are not automatically linked to inflation with increases decided on an ad hoc basis Most other expenditure items are also weakly sensitive to inflation developments
BE Most expenditure categories are very sensitive to inflation developments though often with a time lag mainly through automatic indexation mechanisms Virtually all revenues are also very sensitive to inflation with wages being the main channel of transmission
CZ Only social benefits appear sensitive to inflation developments with legislation providing for an automatic indexation of pensions (together with possible ad hoc adjustments) adjust to a large extent to inflation through the wage setting process (though no automatic link)
DK Apart from social benefits expenditures are not sensitive to inflation developments VAT and income tax receipts react to inflation(123)
DE According to DG ECFIN there is no evidence of inflation affecting the fiscal position of the country in the current context of relatively strong increases in real incomes and consumption leading to buoyant direct and indirect tax revenues Indeed while inflation can affect the wage setting process both in the public and in the private sector with knock-on effects on the public wage bill tax receipts and social benefits (whose indexation is linked to wages) the impact of the current low inflation environment on wages appears to be limited so far
EE The budget balance is weakly sensitive to inflation Indeed there are no indexation mechanisms except for pensions Any increase in public sector wages is conditional upon budgetary constraints
IE Most expenditure items are weakly if at all sensitive to inflation not least because of the temporary freeze in public sector wages and social benefits over 2013-16 decided as part of the so-called Haddington Road Agreement
(123) It should be noted that in Denmark social contributions
account for a negligible part of total revenues
Part III
119
EL Public sector wages have been frozen and automatic indexation of social benefits suspended as part of the macroeconomic adjustment programme
ES In the absence of an automatic mechanism high unemployment over the last few years together with fiscal consolidation needs have held back wage pressures in the public sector Pensions are no longer linked automatically to inflation at least not as long as the system continues to run deficits On the revenue side income tax and social contributions have been only partly affected by inflation with private sector wages also constrained by high unemployment
FR Public wages have been frozen since 2010 While automatically linked to inflation pensions were left unchanged in 2014 In 2015 the indexation mechanism would have led to a decrease in social benefits a possibility that was rejected
HR The budget balance is weakly if at all sensitive to changes in the level of prices with the exception of VAT receipts The indexation mechanism for regular pensions was modified leading to smaller increases whereas special and privileged pension schemes are only adjusted once the growth and deficit outlook improves significantly
IT Although there is no automatic indexation of public sector wages forecast inflation is the benchmark in the collective bargaining process Pensions are adjusted in line with the previous years inflation but recent budget laws have limited the indexation of higher pensions
CY Automatic indexation has been suspended until end-2016 both for public sector wages and public sector pensions Private sector pensions have been frozen as well
LV Most expenditure categories react only weakly to inflation in contrast with revenues Public sector wages are set discretionarily by the government though with the aim of narrowing the gap with private sector wages to 80 Pensions below the average pay are linked to inflation and real wage growth but this cannot result in negative indexation
LT Public wages and social benefits are only weakly sensitive to price developments with no formal obligation to consider inflation Intermediate consumption and gross fixed capital formation are quite sensitive though with a time lag
LU Public (and private) sector wages pensions and several other types of social benefits are increased each time the reference index increases by at least 25 implying that low inflation postpones such mechanical increases In turn this affects receipts from income tax and social contributions
HU Nominal wage freezes have prevailed since 2008 with only some ad hoc wage increases targeted at specific subsectors Pensions are indexed to (forecast) inflation with a subsequent adjustment in case of a higher than expected increase in prices
MT Most expenditure items are to a large extent sensitive to price developments often with a time lag either through an indexation mechanism (wages and social benefits) or through the price of government purchases
NL In general government expenditure is weakly sensitive to inflation Public wages and social benefits are linked to inflation via the gross minimum wage which is linked to private sector wage developments In recent years however policy decisions to cap spending growth have engendered a de-linking of public wages from inflation
AT Public wages and social benefits are indexed to lagged inflation
PL The largest expenditure items are affected by inflation though with a lag in case of unexpected shocks The main channels are (quasi) automatic indexation (wages and social benefits)
PT There is no automatic indexation of public sector wages automatic indexation of social benefits has been suspended since 2009 and intermediate consumption is only gradually affected by inflation
RO Recent inflation developments had little effect on government expenditure either due to the
European Commission Public finances in EMU - 2015
120
absence of a direct link or because of lagged indexation (in Romania pensions are indexed to year T-2 inflation)
SI While there is generally full indexation of public sector wages and social transfers this has been suspended since 2012
SK Inflation is one factor among others in pay agreements with public sector trade unions Pension indexation combines wage growth and inflation measured on a typical basket of goods and services for pensioners Other expenditure categories are weakly if at all sensitive to inflation in contrast with revenues
FI (Forecast) inflation is taken into account when building the budget Pension indexation is also based on inflation though the government has the right not to apply it in some years (which has been the case in 2015)
SE The budget balance is found to be only temporarily influenced by inflation in that both expenditures and revenues adjust to price developments though at a different pace
UK Apart from social benefits (pensions are subject to a triple lock meaning the higher rate of CPIearnings25 is applied) expenditure categories are only to a limited extent sensitive to price developments In particular as part of the fiscal consolidation plans public sector wages were frozen from 2010 and increased on average by 1 in later years with no visible link to inflation
ANNEX 3 IMPACT OF AN INLFATION SHOCK ON INTEREST EXPENDITURE
121
= (1 minus ) times times times minus1
Under the simplifying assumption that only the stock of debt at the end of year t-1 brings interest payments in year t the amount of interest expenditure in year t can be expressed as follows
(1)
is the interest paid on inflation-linked debt This
item can be rewritten as
where is the share of inflation-linked debt and
is the (nominal) implicit interest rate on that
share
- is the interest paid on the fraction of debt
not linked to inflation and coming to maturity
within year This item can be rewritten as
where is the share of debt with a residual
maturity of less than one year and is the
implicit interest rate on that share Note that
because we assume that changes in spot interest
rates will affect newly issued debt and the stock
of variable interest rate debt in the same manner
can be seen as covering both categories
- is the interest paid on the remaining
fraction of debt ie non-inflation-linked fixed
rate debt with a residual maturity of more than
one year This item can be rewritten as
where is the implicit interest rate on this
share of debt
Therefore can be written as
(2)
An inflation shock will impact differently upon
these three terms Note that equation (1) is a
simplified representation of equation (2)
Impact of an inflation shock on
By definition (124) the interest paid on inflation-
linked bonds will adjust fully with movements in
the level of prices
Impact of an inflation shock on
Debt which comes to maturity within the current
year needs to be refinanced in the current market
conditions Therefore the interest paid will depend
on the extent to which bond spot rates react to
inflation
Where is the sensitivity of bond spot rates to
inflation assumed to lie between 0 and 1
(124) Note that depending on the bond type the index to which
the bond is linked may apply only to the annual coupon similarly to variable interest instruments the principle payment or to both of these However whatever the specific design of the bond is the implicit aim is to hedge the inflation risk Therefore the implicit nominal interest
rate can be expressed as In this respect the ESA 2010 standard of national accounts states that the change in value of the instrument due to the index during an accrual period is treated as interest accruing in this period in addition to the normal interest accrued over this period
= + +
= times times minus1
= (1 minus ) times times times minus1
= (1 minus ) times (1 minus ) times times minus1
) times (1 minus ) times ] times minus1
= times minus1
= (1 minus ) times times times minus1
= +
= [ times + (1 minus ) times times + (1 minus
European Commission Public finances in EMU - 2013
122
Impact of an inflation shock on
The interest paid on non-inflation-linked fixed
rate debt with a residual maturity of more than one
year is not affected by movements in prices in year
Overall effect
Therefore the overall effect of an inflation shock
on the amount of interest expenditure in year is
The sensitivity is 0 if
bull = 0 and = 0 That is there is no
inflation-linked debt and there is no variable
rate debt or debt to be redeemed during the
year
bull = 0 and = 0 That is there is no
inflation-linked debt and market rates are not
influenced by inflation
The sensitivity is 1 if
bull = 1 That is the whole stock of debt is
indexed to inflation
bull = 0 and = 0 That is the whole stock of
debt is to be redeemed during the year
(andor is composed of variable rate
instruments) and there is full pass-through
from inflation to market rates
= = 0
= [ + (1 minus ) times times ] times minus1
ANNEX 4 ANALYTICAL DECOMPOSITION OF THE IMPACT OF AN INLFATION SHOCK ON FISCAL EFFORT
123
A41 PREVENTIVE ARM OF THE SGP
Structural balance
The cyclically-adjusted balance is computed as the difference between the headline balance-to-GDP ratio and an estimated cyclical component The structural balance is in turn the cyclically-adjusted balance excluding one-off items In algebraic terms
Where and stand for government revenues and expenditures respectively and for nominal GDP real GDP and potential GDP respectively and ε is the so-called budgetary semi-elasticity to the output gap The output gap ( ) is computed in real terms and is therefore not influenced by inflation developments (125)
It follows from the above that any change in the headline balance ratio following an inflation shock
will translate into a one-to-one change in the structural balance
(We assume that = 0) (126)
Basically the less expenditures adjust to lower inflation compared to revenues the more the headline balance and hence fiscal effort as measured by the change in the structural balance
(125) Note that here we do not look at possible effects of
inflation on the real economy which could in turn affect fiscal effort
(126) For the sake of simplicity we also neglect any denominator effects Indeed given that the various measures of fiscal effort are expressed as a of GDP any revision to the GDP deflator will also affect the denominator However the impact will generally be fairly small For example assuming an initial effort of 1 of GDP a 1 pp inflation shock will affect this by roughly 1 times 1 or 001 of GDP through the denominator effect
will be affected By contrast if revenues and expenditures adjust to the same extent following an inflation shock the headline balance and hence fiscal effort will remain unchanged
Expenditure benchmark
The expenditure benchmark to which is compared the change in the expenditure aggregate for year t is computed as follows (127)
(a)
Where and are respectively the so-called lower rate reference medium-term rate of potential GDP growth and convergence margin
The net expenditure growth rate for year t is computed as follows
(b)
Where and ∆ are respectively the net expenditure growth rate the modified expenditure aggregate and the estimated impact of revenue measures having an incremental effect on revenues
The net expenditure growth in real terms is computed as follows
(c)
Where lowast is the GDP deflator This is the average GDP deflator from the Commissions year t-1 spring and autumn forecasts implying that the reference rate is known with certainty in the autumn of year t-1
It follows from the above that any change in following an inflation shock will affect the net expenditure growth rate of year t Note that the impact on ∆ will generally be negligible Given that the expenditure benchmark itself (ie the medium-term reference rate of potential GDP
(127) See Chapter II2 for more details on the different steps of
the calculations
= minus minus times= minus minus
= minus
= minus
= minus ∆ minus minus1minus1
= 1 +1 + lowast minus 1
= minus minus times minus
European Commission Public finances in EMU - 2015
124
growth or for countries not yet at the MTO a lower rate) is frozen in year t-1 any change in inflation developments in year t that affects expenditures will affect compliance with the expenditure benchmark as well
In algebraic terms the deviation from the expenditure benchmark can be derived from (a) (b) and (c)
Let an inflation shock in year t Compliance with the expenditure benchmark will be affected as follows (remember that lowast is fixed)
It can be further shown that
With standing for the elasticity of expenditures with respect to the inflation shock (128)
It follows from the above that the extent to which (compliance with) the expenditure benchmark is affected will crucially depend on the extent to which expenditures are affected by the inflation shock Indeed
minus If the net expenditure aggregate remains unchanged following a disinflation shock ( = 0) the growth rate of this aggregate
(128) By definition Therefore and assuming that ∆ = 0
Plugging this in and rearranging the equation gives
will be unchanged as well and will not be affected
minus Alternatively if expenditures adjust if only slightly to lower inflation (0 lt le 1) this will translate into higher meaning that fiscal effort as measured by the expenditure benchmark will be positively affected Note that as already discussed while the returns from revenue measures will be impacted by lower inflation this effect will be relatively marginal since it is only a base effect on the additional revenue provided by the measure This will likely be more than compensated for by the expenditure estimate since any fall in expenditures due to lower inflation will be assessed on the full expenditure base rather than a specific measure
A42 CORRECTIVE ARM OF THE SGP
Top-down approach
The change in the structural balance is adjusted in the following way
minus The adjustor measures the impact of revisions in potential output growth compared to forecast underlying the EDP recommendation All other things equal a higher (or a lower) rate of potential output growth in year t would lead to a higher (or a lower) change in the structural balance
minus The adjustor measures the impact of revisions on the composition of economic growth or of other windfallsshortfalls on revenues This captures the fact that the response of revenues (the so-called elasticity) can differ from that expected at the time of the EDP recommendation for reasons outside the control of government
minus The adjustor captures the impact of other unexpected events under very unusual and significant circumstances
Analytically the adjustor corrects for the impact of the potential growth outturns being different from those forecast It is defined as
= ( minus ) times minus1
= minus times minus1 = minus 1 + lowast times minus1
= lowast = minus (1 + lowast)2 times
= minus1 minus 1= times minus1minus1 = times minus1minus1 times times = times times minus1minus1
= minus1 + lowast times times minus1minus1 times minus1 = minus1 + lowast times 11 + times= lowast = minus (1 + lowast)2 times
Part III
125
= (Δ minus minus [ + ( minus 1) times Δ ] times minus1)
= minus times minus1
minus(Δ minus minus [ + ( minus 1) times Δ ] times minus1)
Where stands for the structural expenditure
ratio in year t-1 and and for the outturn and forecast potential growth estimates
It follows from the above that theα adjustor is not affected by inflation developments (except for the
second-order impact through on the α adjustor
for year t+1)
(Remember that here we do not look at possible second-round effects of inflation on the real economy which could be sizeable and affect fiscal effort)
The adjustor corrects for the impact of the response of revenues with respect to nominal GDP being different from that forecast It is defined as
Where and ∆ stand for the level of revenues and the annual change in revenues for the amount of discretionary revenue measures (incremental effect on revenues in year t) and for nominal GDP and nominal GDP growth ∆ for the change in the output gap and for the standard revenue elasticity used for the computation of cyclically-adjusted balances
Let an inflation shock in year t In algebraic terms the adjustor will be affected as follows
Assuming that = 0 (as already discussed
while the returns from revenue measures will be
impacted by lower inflation this effect will be relatively marginal since it is only a base effect on the additional revenue provided by the measure)
It can be further shown that
With standing for the elasticity of revenues with respect to the inflation shock(129)
It follows that as long as revenues adjust fully to the inflation shock ( = 1) the parameter will be left (broadly) unchanged
Note that the impact of a disinflation shock on the corrected change in the structural balance will actually be broadly the same whether revenues adjust fully or only partly to the shock Indeed
ndash If revenues adjust fully following a disinflation shock ( = 1) the headline balance will deteriorate accordingly and so will the structural balance the uncorrected change in the structural balance and the corrected change in the structural balance
ndashAlternatively if revenues adjust only partly to lower inflation ( lt 1) the headline balance will deteriorate by less than in the previous case and so will the structural balance and the uncorrected change in the structural balance
However in this case lt 0 implying larger
windfalls or smaller shortfalls in revenues so that the corrected change in the structural balance will deteriorate by more than the uncorrected change All in all the deterioration in the corrected change will be broadly the same whether = 1 or lt 1
(129) By definition = minus 1 Therefore
Plugging this in and rearranging the equation gives
= minus1minus1 times ( minus minus1 )
= 0
= (Δ minus minus [ + ( minus 1) times Δ ] times minus1)
cong minus 11 + times
= times minus1 = times minus1 times times = times 1 += 1 += minus (1 + ) times (1 + ) times minus11 + times cong minus 11 + times
European Commission Public finances in EMU - 2015
126
Bottom-up
The annual bottom-up fiscal effort is defined as follows
Where
minus stands for the estimated budgetary impact of the discretionary revenue measures additional to the ones already included in the baseline as estimated at the time of assessment net of one-off measures implemented in year t (or under the relevant sub-period of time under scrutiny)
minus ∆ stands for the change in total nominal expenditure in year t net of one-off measures non-discretionary changes in interest payments non-discretionary changes in unemployment benefits and public investment matched by EU funds as estimated at the time of assessment as well as other country-specific effects in limited cases
minus ∆ is the change in the total nominal expenditure in year t as forecast in the baseline corrected for statistical revisions net of one-off measures non-discretionary changes in interest payments non-discretionary changes in unemployment benefits and public investment matched by EU funds as estimated at the time the EDP recommendation was issued as well as other country-specific effects in limited cases
minus stands for nominal GDP in year t as estimated at the time of assessment of effective action
The resulting total fiscal effort delivered since the recommendation was issued is then compared to the annual amount of discretionary fiscal measures specified in the recitals of the EDP recommendation or notice on a cumulative basis
Similarly to the expenditure benchmark approach under the preventive arm any change in ∆ following an inflation shock will affect the expenditure component one-to-one As is the case
with the expenditure benchmark the impact on will generally be negligible In
consequence any change to the inflation outlook since the EDP recommendation that affects expenditures will affect fiscal effort as measured by the bottom-up approach as well
Let an inflation shock in year t In algebraic terms the bottom-up measure of fiscal effort will be affected as follows
Assuming that = 0 (as already discussed
while the returns from revenue measures will be impacted by lower inflation this effect will be relatively marginal since it is only a base effect on the additional revenue provided by the measure)
It can be further shown that
With standing for the elasticity of expenditures with respect to the inflation shock (130)
As in the case of the expenditure benchmark the extent to which fiscal effort as measured by the bottom-up approach is affected will crucially depend on the extent to which expenditures are affected by the inflation shock Indeed
minus If the expenditure aggregate remains unchanged following a disinflation shock ( = 0) the growth rate of this aggregate
(130) By definition = minus 1 Therefore
Plugging this in and rearranging the equation gives
= minus ∆ minus∆
= minus ∆ = minus
= minus1 + times
= times minus1 = times minus1 times times =
= 1 += minus (1 + ) times (1 + ) times minus11 + times cong minus 11 + times
Part III
127
will be left unchanged as well and will not be affected
minus Alternatively if expenditures adjust if only slightly to lower inflation (0 lt le 1) this will translate into higher meaning that fiscal effort as measured by the bottom-up approach will be positively affected
A43 THE DEBT RULE
The backward-looking component of the debt reduction benchmark is defined as follows
Where stands for the debt-to-GDP ratio in year t
The gap to the backward-looking component is then
Let an inflation shock in year i The gap to the backward-looking component will be affected as follows
Assuming that affects the debt ratio only through the denominator implies that
Therefore an inflation shock will affect the gap to (or compliance with) the backward-looking component of the debt reduction benchmark for year t as follows
It follows from the above that only inflation shocks in years t t-1 and t-2 will have a material impact on compliance with the backward-looking component of the debt benchmark for year t with a shock in year t having a larger impact than a shock in year t-1
The forward-looking component of the debt reduction benchmark is defined as
The same reasoning as for the backward-looking component applies It follows that a temporary inflation shock will affect either the backward-looking component or the forward looking component for year t but not both at the same time unless the shock occurs in year t
Finally the cyclically-adjusted component of the debt benchmark is defined as
= 60+ 0953 times ( minus1 minus 60) + 09523times ( minus2 minus 60) + 09533times ( minus3 minus 60)
minus = minus 60minus 0953times ( minus1 minus 60) minus 09523times ( minus2 minus 60) minus 09533times ( minus3 minus 60)
( minus ) = minus 0953 times minus1 minus 09523times minus2 minus 09533 times minus3
cong minus1 cong cong =
minus1minus1 = minus2minus2 = = 0
( minus )
cong = 1 minus 0953 times = minus 11 minus 0953 minus 09523 times = minus 2
1 minus 0953 minus 09523 minus 09533 times le minus 3
+2 = 60 + 0953 times ( +1 minus 60)+ 09523 times ( minus 60)+ 09533 times ( minus1 minus 60)
= +sum minus2=0minus3 times prod (1 + minusℎ ) times (1 + minusℎ)2ℎ=0
European Commission Public finances in EMU - 2015
128
Where stands for debt for GDP at current prices for potential growth for the price deflator of GDP and for the cyclical part of the budget balance The equation can be rewritten as
Where stands for real growth The gap to the cyclically-adjusted component is then
Let an inflation shock in year i The gap to the cyclically-adjusted component will be affected as follows
Note that in general is expected to be close to 1
(ratio of two gross growth rates) and close to 0
Therefore an inflation shock will in general affect the gap to the cyclically-adjusted component of the debt benchmark to the same extent as it will affect the gap to the backward-looking component of the benchmark for any year t
This is consistent with the very purpose of the cyclically-adjusted component which is to remove the effect of real growth being different from potential growth ndash not to correct for inflation developments
Note that the MLSA will be affected in a similar manner However given that by definition the MLSA implies that the additional adjustment implemented is frontloaded (in order to ensure compliance with the debt reduction benchmark at the end of the transitional period) the overall adjustment is lower than if it had to be implemented in the last year of the transitional period To put it differently back loading fiscal effort necessarily implies a higher stock of debt in any year t
= timesprod (1 + minusℎ)2ℎ=0prod (1 + minusℎ )2ℎ=0+ sum minus2=0minus3 times prod (1 + minusℎ ) times (1 + minusℎ)2ℎ=0
equiv times +
minus = times + minus 60minus 0953times ( minus1 minus 60) minus 09523times ( minus2 minus 60) minus 09533times ( minus3 minus 60)
( minus ) = times + minus 0953times minus1 minus 09523 times minus2minus 09533 times minus3
( minus ) cong ( minus )
Part IV The EUs stylized fiscal reaction function
1 THE EUS STYLIZED FISCAL REACTION FUNCTION
130
11 INTRODUCTION
In this section we will analyse the factors that determined the Councilrsquos recommendations in excessive deficit procedures (EDPs) over the past 15 years
The EDP is one of the two arms of the common European budgetary rules which are defined in the Stability and Growth Pact (SGP) The aim of the EDP is to ensure that Member States correct their lsquoexcessive deficitsrsquo (131) Article 126 of the Treaty on the Functioning of the European Union (TFEU) requires that Member States avoid excessive government deficits and requires that the developments of the budgetary situation and of the stock of government debt in the Member States be monitored In particular the compliance of Member States with budgetary discipline has to be examined on the basis of i) whether the ratio of the planned or actual government deficit to gross domestic product exceeds a reference value (132) and ii) whether the ratio of government debt to gross domestic product exceeds 60 unless the ratio is sufficiently diminishing and approaching the reference value at a satisfactory pace
When a Member Statersquos general government deficit andor debt do not fulfil the criteria in the Treaty this triggers a procedure with the following main steps first the Commission prepares a report on the countryrsquos budgetary situation if the Commission considers that an excessive deficit in a country exists or may occur it informs the Member State and the Council about it After that the Council can on a proposal from the Commission and having considered any observations which the Member State concerned may wish to make decide whether an excessive deficit exists Finally in case the Council decides that an excessive deficit exists it adopts on a recommendation from the Commission recommendations addressed to the Member State
(131) The expression lsquoexcessive deficitrsquo is used both to refer to a
situation of excessive government borrowing and also to a government debt above 60 of GDP that is not diminishing at a satisfactory pace
(132) hellipunless either the ratio has declined substantially and continuously and reached a level that comes close to the reference value or alternatively the excess over the reference value is only exceptional and temporary and the ratio remains close to the reference value
concerned with a view to bringing that situation to an end within a given period (133)
The recommendations set the fiscal targets that the Member State has to achieve to correct its excessive deficit The targets are expressed in terms of general government headline deficit (134) There are two reasons for this approach first headline deficit is a governmentrsquos main operational variable Second the Treaty threshold for what qualifies as an excessive deficit is defined as the headline deficit-to-GDP ratio so it is natural that the targets in the recommendations should be given in the same unit of measurement
Over time the Council recommendations and the precise requirements have changed in form The initial version of the SGP focused on Member States attaining the required reduction in the headline deficit ratio within the shortest possible time whereas successive amendments acknowledged that it was better to take into account economic circumstances and country-specific characteristics This was achieved by increasing the use of the structural balance (2005) and by giving Member States more specific intermediate objectives and since 2011 bringing in a gradual enforcement mechanism identifying the fiscal effort necessary to respond to the Council recommendation Since 2009 EDP recommendations are also systematically expressed as improvements in the structural balance which are used as the main indicator of fiscal effort This makes it possible to give guidance deemed less dependent on economic cycles Finally to increase the weight of the recommendations a gradual enforcement mechanism was introduced in 2011
In the implementation of the SGP the Council has allowed Member States where necessary to depart from the one-year rule for bringing deficit below
(133) In practice the Commission recommendations for a
Council recommendation are followed by the Council in most cases Therefore the recommendations analysed in this Chapter are both the Commission and the Council recommendations For ease of exposition we will refer to these as Council recommendations throughout the whole chapter
(134) See Article 3(4) of Council Regulation No 146797 of 7 July 1997on speeding up and clarifying the implementation of the excessive deficit procedure (OJ L 209 281997 p 6)
Part IV Characterising the Councilrsquos recommended fiscal reaction to excessive deficits in excessive deficit procedures
131
the 3 threshold This gives the Council some discretion in balancing the need for fast reduction in the excessive deficit against the risk of weakening economic growth or even exacerbating recession during an economic crisis (135)
The EUs fiscal reaction to excessive deficits in the Member States through successive EDPs is complex taking into account both fiscal and economic factors There are two approaches that the Council can take when making its EDP recommendations the lsquonominalistrsquo approach and the lsquostructuralistrsquo approach
Under the nominalist approach the Council has to respect the letter and the spirit of the traditional view of the SGP which puts the emphasis on correcting the lsquoexcessive deficitrsquo in the shortest possible time
By contrast the structuralist approach gives a larger role to the countryrsquos economic situation when determining the requirements of the EDP recommendations This approach distinguishes between the structural and the cyclical component of the balance privileges requirements set as change in the structural balance so as to allow automatic stabilisers to play and modulates requirements depending on the countryrsquos economic situation and other relevant factors
Starting with Bohnrsquos 1998 paper a large body of literature has been written on lsquofiscal reaction functionsrsquo The literature on fiscal reaction functions investigates the behaviour of governments when setting fiscal policy as a function of the fiscal and the macroeconomic situation at the time the fiscal decisions are taken This is generally obtained by estimating the reaction of government deficits to debt levels past deficits and economic variables like cyclical conditions Studies in this field thus estimate lsquoex-post reaction functionsrsquo and use them to calculate a governmentrsquos fiscal space or to assess debt sustainability (136) This is assessed by checking whether when a governmentrsquos debt increases the government increases the (primary) balance enough to comply with its intertemporal budget constraint a result almost always borne out in
(135) Article 3(4) quoted sets a minimum annual requirement in
structural terms of 05 of GDP as a benchmark (136) See eg Gosh et al (2013)
advanced economies since the original Bohn paper Recent developments in the literature check for non-linearity in the relationship between the debt and the (primary) balance (137) or a lack of stability over time in this relationship for example against the backdrop of the recent Great Recession (138) or the accession to the euro (139)
Unlike the existing literature on the subject this chapter estimates the reaction function of the Council rather than of the national governments We will focus on what determined the fiscal requirements the Council issued to Member States over the past 12 years under the EDP By implication we will also be looking at the degree to which these rules enable the Council to take account of the economic environment and of country specificities and risks We will look specifically at the 38 EDPs opened between 2003 and 2014 (of which 11 were still ongoing at the end of 2014) (140) focusing on the 69 accompanying EDP recommendations the Council issued Of the EUrsquos 28 Member States 26 have been concerned by at least one of these recommendations and 22 Member States were addressed by more than one recommendation over the entire 12-year period
The use of real-time data mdash available in past economic forecasts published by the European Commission or in the Councilrsquos recommendations and accompanying documents themselves mdash makes it possible to accurately assess the influence of cyclical conditions on the choices made by the Council and the Commission In general estimates of fiscal reaction functions are based on ex post observations that are not representative of real-time information available at the time the decisions are taken This is particularly relevant when studying the cyclicality of the policy decisions (141) indeed fiscal plans might be significantly different from ex post outcomes This is because government decisions are based on data
(137) See eg Gosh et al (2013) Medeiros (2012) Lukkezen
and Rojas-Romagosa (2012) Celasun et al (2007) Fournier and Fall (2015) Legrenzi and Milas (2013) Mauro et al (2013)
(138) See eg Weichenrieder and Zimmer (2013) and Baldi and Staehr (2015)
(139) See eg Weichenrieder and Zimmer (2013) (140) By end 2015 two more Member States have seen their EDP
abrogated (141) See eg Larch and Salto (2005) Golinelli and Momigliano
(2006) and Cimadomo (2012)
European Commission Public finances in EMU - 2015
132
available in real-time which are often considerably revised over time (142) on forecast data on estimations of the cyclical position and on the multipliers which are uncertain by nature Another important factor is uncertainty over actual implementation as governments do not have complete control over the implementation of their budgets
A second major way in which this paper differs from the traditional literature on fiscal reaction functions is that we will analyse fiscal policy recommendations issued before the policy choices are made and before the outcome that they aim to influence By analysing what determines the recommended fiscal effort as opposed to the implemented fiscal effort that tends to be explored in the existing literature we do not face the problem of reverse causality between economic conditions and fiscal effort (143)
As an alternative to looking at the reaction function of the recommended fiscal effort we also performed an analysis of the number of years granted to Member States to correct their excessive deficit Indeed the length of the recommendation can be considered as a tool to modulate the recommended annual fiscal effort during the adjustment period
The results of the analysis indicate that the Council adopts a reaction function which combines both the nominalist and structuralist approaches described above The reaction function can be considered lsquonominalistrsquo in that the recommended average effort tends to be higher both where the initial deficit was structural and permanent or only cyclical and transitory At the same time lsquostructuralistrsquo considerations also seem to matter as suggested by the finding that cyclical economic conditions do play a role in the recommendations Specifically a worse initial fiscal position leads all things being equal to higher fiscal effort requirements and a higher probability of a longer deadline Worse cyclical economic conditions tend
(142) See eg de Castro et al (2013) (143) This problem of endogeneity is also present in the analysis
of fiscal multipliers where only a very limited number of papers distinguish between plans and outcomes see eg Ramey (2011a and 2011b) Mertens and Ravn (2011) Alesina et al (2015) Cugnasca and Rother (2015) use Council recommendations as instruments for the estimation of fiscal multipliers
to reduce the average recommended effort and to increase the probability of receiving a longer deadline
No other variables are found to have played a significant role in determining the recommendations The debt ratio in particular does not seem to have played any role in determining the fiscal effort required which is interesting considering not only that debt is the centre of focus of the existing literature on the fiscal reaction function but also considering the legislation itself which states that the medium-term debt position (its dynamics and sustainability) constitutes a relevant factor in determining the recommendation
The structure of the rest of this chapter is as follows Section IV12 presents the data providing an overview of the different EDP episodes the associated recommendations and the macroeconomic environment faced by the Member States Section IV13 shows the results of the analysis of the determinants of the required effort Section IV14 presents an analysis of the deadlines granted to Member States to put an end to their excessive deficits Section IV15 provides some conclusions
12 EDP EPISODES AN OVERVIEW
In our analysis we will characterise EDP recommendations by the total improvement in the structural balance recommended by the Council In the recommendation this total improvement is by design determined by the recommended headline deficit path and the macroeconomic scenario underlying each recommendation (144) The total recommended change in the structural balance can be broken down into two elements the recommended average annual effort and the number of years granted to correct the excessive deficit (ie the length of the recommendation) These two aspects form the main subject of this study
(144) When the Council recommendation is only given in terms
of a nominal target or an additional nominal effort relative to the plans included in the budget as is the case for most pre-2009 recommendations we carried out a special calculation to translate it into the corresponding change in structural balance For a precise description of this method see Box IV11
Part IV Characterising the Councilrsquos recommended fiscal reaction to excessive deficits in excessive deficit procedures
133
In total the dataset comprises 69 EDP recommendations issued by the Council for 38 distinct EDP episodes between the first excessive deficit procedure in 2003 and the final year in the sample 2014 (for a full list of all the recommendations see Table IVA11 in Annex IV1) (145) Slightly less than half of all the recommendations in the sample were new recommendations ie recommendations immediately following the opening of an EDP while slightly more than half were revised recommendations revising the length andor nominal path and structural effort of the original recommendation (146)
Real-time outturn and forecast data are used as available to the Council when it makes its recommendation This is important for two reasons First there can be significant differences between ex ante forecasts and ex post outturns Second the outturn may itself be influenced by the policy action actually implemented whereas the forecast is based on the assumption that no further policy changes are made (no-policy-change assumption henceforth) and on other information available at the time of the recommendation Therefore using real-time data allows us to better capture the Councilrsquos reaction to fiscal and economic aggregates even if these aggregates turn out to be different ex post The real-time data are collected from the relevant Commission and
(145) The EDP recommendation to Germany in 2003 is part of
the descriptive analysis but is not taken into account in the analysis (see Box IV11)
(146) Revised recommendations are issued when the Member State has failed to achieve the previously recommended targets This can happen in two scenarios First the Council decides that effective action was taken but unexpected adverse economic events with major adverse consequences for government finances prevented the government from reaching the targets Second the Council issues a new recommendation having established that the Member State took inadequate action In the second scenario the Council can decide to step up the EDP procedure for euro area Member States with stricter requirements and also eventually financial sanctions New recommendations and revised recommendations following unexpected adverse economic events are issued on the basis of Article 126(7) TFEU (previously Article 104(7) TEC) The decision establishing that a Member State has taken inadequate action is based on 126(8) TFEU (previously Article 104(8) TEC) If the Council decides to step up the procedure for euro area Member States it gives notice to the Member State on the basis of Article 126(9) TFEU (previously Article 104(9) TEC)
Council documents which are available on DG ECFINrsquos website (147)
The picture of the EDP recommendations shows that the lsquoaveragersquo recommendation issued in year Y follows a headline deficit outturn of 55 of GDP in the preceding year with projected headline deficits of 63 and 57 of GDP respectively for the years Y and Y+1 based on the no- policy-change assumption The average recommendation asks for a cumulative structural effort of 30 of GDP The average deadline is set by the Council at between two and three years after the recommendation (25 years) Therefore starting from a structural balance of -51 in the year of the recommendation the average annual recommended effort is 11 of GDP per year
Under the legislation the main determinants of EDP recommendations are expected to be the level of the headline balance andor its three components ie the level of the structural balance the level of the cyclical component and the level of one-off measures (lsquoone-offsrsquo) Other variables may play a role reflecting the discretion given to the Council and the relevant factors indicated in the legislation (148) Such variables include
minus the government debt ratio at the time of the recommendation which captures the initial fiscal risks and conditions
minus the projected GDP growth which captures the expected economic conditions
minus dummy variables to capture the specific features of recommendations issued before and after the financial crisis or the specificities of revised versus initial recommendations
The average output gap is estimated to be -24 in year Y and expected to fall to -29 in year Y+1 Therefore the average cyclical component of the budget balance is -11 of GDP in year Y
(147) Commission forecasts which constitute the basis for the
technical analysis and the baseline scenarios are available at httpeceuropaeueconomy_financepublicationscategoriesforecasts_enhtm while legal documents are available at httpeceuropaeueconomy_financeeconomic_governancesgpcorrective_armindex_enhtm
(148) See Council Regulation (EC) No 146797 Article 2
European Commission Public finances in EMU - 2015
134
Characteristics All recommendations
Excluding recommendations issued in the crisis
years
Excluding revised recommendations
average length of the recommendation 25 23 23
average cumulated effort 30 22 22
average annual effort 11 10 09
average headline deficit in year Y -63 -48 -55
average structural balance in year Y -51 -44 -46
average output gap in year Y -24 -18 -21
average cyclical balance in year Y -11 -08 -10
Average debtGDP ratio in year Y 686 733 611
Average real GDP growth forecast (in year Y for Y+1) is 08 and the debt ratio on average amounts to 686 of GDP in year Y
An average EDP episode (ie from the procedurersquos opening to its abrogation) lasts between three and four years (the average being 33) and often includes revised recommendations Most EDP recommendations include one revised recommendation before they are abrogated
Recommendations issued to seven Member States (Greece Poland Hungary France Malta Portugal and Spain) account for 48 of the total number of EDP recommendations and 34 of the total number of EDP episodes
The distribution of EDP recommendations across the 12 years covered by the dataset is irregular About half of all the recommendations were issued in the crisis years of 2009 and 2010 and only three Member States were not concerned by an EDP recommendation in those years (149) If we compare the average EDP recommendations without the crisis years 2009 and 2010 against the average recommendations including the crisis years we find a number of differences
First the initial conditions during the crisis years were clearly worse than during the non-crisis years as confirmed by the difference in the initial structural balance (-51 of GDP in year Y including crisis years compared with -44 of GDP in year Y excluding the crisis) and the output (149) The countries concerned were Estonia Luxembourg and
Sweden Croatia was not yet a Member State
gap in the year of the recommendation (-24 including the crisis years versus -18 excluding the crisis)
As a result the average cumulated structural effort recommended was significantly larger including the crisis years (30 of GDP) than the average recommendation excluding the crisis years (22 of GDP)
At the same time the length of the average recommendation including the crisis years was somewhat longer than if we exclude the crisis Therefore the recommended average annual structural effort (11 and 10 percentage points respectively) is not significantly different whether we include or exclude the crisis years This suggests that although initial conditions were more adverse during the crisis years the recommendations were trying to avoid increasing the required effort Table IV11 sums up the main characteristics of the EDP recommendations
Finally there are also some differences between the new and the revised recommendations In the subsample of initial recommendations (ie excluding the revised recommendations see Table IV11 column 3) the recommended cumulative structural effort is significantly lower than in the full sample that also includes the revised recommendations Also both the length of the recommendations and recommended average annual effort are lower in new recommendations than in the full sample suggesting that the revised recommendations tend to be more demanding than the new recommendations A longer description of the characteristics of the EDP recommendations and their potential determinants is given in Annex IV12
The following section uses this dataset to estimate the Councilrsquos ex ante fiscal recommendation function
13 THE DETERMINANTS OF THE AVERAGE EFFORT
This section focuses on the determinants of the average recommended effort over the period covered by an EDP recommendation Each recommendation is characterised by a (recommended) nominal deficit path which
Table IV11 Main characteristics of the EDP recommendations
Source Commission services
Part IV Characterising the Councilrsquos recommended fiscal reaction to excessive deficits in excessive deficit procedures
135
corresponds to a series of annual fiscal efforts running from the first year of the recommendation to the deadline These fiscal effort targets expressed as improvements in the structural balance as a percentage of potential GDP have been explicitly included in the recommendations since 2009 (150) For pre-2009 recommendations the required structural fiscal effort can be retrieved using a calculation involving the real-time series of output gaps and one-off measures (see Box IV11) The analysis of this section is conducted on the determinants of the average recommended effort which summarises all the information on the fiscal effort over the timeframe of the recommendation in one variable As the fiscal effort path recommended in the context of the EDP is usually quite smooth over the whole EDP period it is possible to focus on the average without losing too much information The next section will focus on the determinants of the number of years granted for the correction of the excessive deficit
EDP recommendations are a priori based on an assessment of the Member Statersquos need and capacity to reduce its deficit This means that a recommendation will be determined by both the Member Statersquos fiscal position and its economic conditions If the effort required depends mostly on the deficit ratio observed at the time of the recommendation with the aim being to reduce it below 3 as soon as possible this reflects the nominalist approach present in the SGP since its inception If however the effort required depends mostly on the economic conditions this would reflect the structuralist logic introduced into the SGP since the reform of 2005
Put differently under the nominalist approach the recommendation would be purely based on the initial headline balance without distinguishing whether the starting headline deficit is structural or cyclical Thereby the recommended average effort can be expected to react similarly to the initial structural and cyclical deficits By contrast under the structuralist approach economic conditions would be taken into account and therefore the recommended average effort would react
(150) Since 2013 recommendations also contain the
corresponding effort as measured in a bottom-up fashion centred on measures to be taken See European Commission (2013)
differently depending on whether the initial deficit is structural or cyclical
The equation we estimate is as follows
(1)
where SB stands for the structural balance at the time of the recommendation The parameter denotes the semi-elasticity of the headline balance to the output gap and OG stands for the output gap at the time of the recommendation
In other words the term εOG is the cyclical component of the balance at the time of the recommendation One-offs as a ratio of GDP at the time of the recommendation are denoted by OO In addition to these three components of the headline balance the equation also includes other potentially relevant factors is the debt-to-GDP ratio at the time of the recommendation and is real GDP growth in the first year of the recommendation
The model allows for a differentiated reaction of the recommended average annual structural effort to the different components of the headline balance Theoretically under a purely or mainly nominalist approach the recommended average effort can be expected to decrease both in the initial structural balance and in the initial cyclical balance ie the coefficients of these components of the headline balance are negative In addition under the purely nominalist approach the coefficients of the structural balance and the cyclical component would be equal ie = reflecting a situation where the policy-maker does not differentiate between the components of the deficit
By contrast where the policy-maker is taking structuralist considerations into account the average effort can be expected to react stronger to the structural balance than to the cyclical component of the balance ie |β| ge |γ| with βγ le 0 Indeed such a reaction would suggest that the Council requires the Member State to undertake more structural effort to eliminate the structural deficit than to eliminate the cyclical deficit which would be automatically eliminated once the output gap closes Moreover since the cyclical component is a function of the output gap
= α + β SB0 + γ(εOG0) + φOO0 + δ 0 + ρ 1 +
European Commission Public finances in EMU - 2015
136
(Continued on the next page)
Box IV11 Comparability of pre-2009 and post-2009 recommendations
An EDP recommendation consists of a path of fiscal deficit targets conducive to the achievement of the final budgetary objective within a given deadline The final budgetary objective is set in most cases at 3 of GDP unless the debt-reduction benchmark requires a budgetary objective below the 3 threshold
Regulation (EC) 146797 requires the yearly fiscal effort expressed as the improvement in the structural balance in terms of potential GDP to be such that for all The recommendation can therefore be summarised by two main parameters
bull the number of years between the first year of the recommendation and the deadline (n in the following)
bull the average recommended effort over the EDP period ( in the following)
The total recommended structural effort E over the EDP period is largely determined by the headline deficit at the beginning of the EDP period There is an implicit constraint on and n as the combination of the two parameters should allow E to be high enough to allow the deficit to come back below the 3 threshold given the projected economic conditions assumed multipliers and spontaneous trends in
expenditures and revenues Algebraically where the total cumulative effort is itself a function of the number of years granted and conditional on other parameters denoted by In order to ensure the comparability of pre-2009 and post-2009 recommendations we followed the strategy used by Cugnasca amp Rother (2015) which converts the nominal targets into a structural balance path using real-time output gap estimates to retrieve the fiscal effort implicit in the pre-2009 recommendations This approach is based on the assumptions of zero multipliers (ie taking the output gap estimates of the no-policy-change forecast as a given) and no one-offs In episodes where the pre-2009 recommendations explicitly stated the fiscal path in cyclically-adjusted terms the value of that fiscal path was used
Each recommendation can be seen as a path of required efforts resulting in a change in the structural balance where n is the length of the recommendation Therefore for t=1hellipn corresponds to the recommended change in the structural balance between year t-1 and t
Similarly to Cugnasca amp Rother (2015) for every recommendation j of every country i issued in year the fiscal path is
where is the structural effort recommended to Member State i for year t is the difference between the nominal target (namely the ratio of government balance to GDP) recommended to Member State i in t and t-1
ε is the semi-elasticity of Member State i as used in the Commission projections
is the real-time estimate of the change in the output gap between t and t-1 In order to retrieve the unspecified structural effort in pre-2009 recommendations lasting three years or longer the following
assumption had to be made as is generally not known for t ge 3 it is assumed that the output gap closes progressively over the years following the last year of the forecast horizon
As regards the timing convention we denote by t=1 the first year of the recommendation defined as the year after the recommendation was issued In practice this convention implied that one recommendation had to be dropped from the sample namely the recommendation addressed to Germany in 2003 which set
etet ge 05 et (e1hellip en)
= sum1 = ( | )
(e1hellip en) et
= ∆ minus ∆ lt 2009∆ lt 2009∆ ge 2009
∆ ∆
∆ ∆
Part IV Characterising the Councilrsquos recommended fiscal reaction to excessive deficits in excessive deficit procedures
137
Coefficient Std error Pgt|t| 95 confidence intervalConstant -008 022 072 -051 036Structural balance (SB0) -022 003 000 -028 -017 Cyclical component ( 0) -014 006 002 -026 -002 One-offs 005 002 001 001 010Expected growth (g1) -005 003 006 -010 000 Public debt-to-GDP (d0) 000 000 031 -001 000
its coefficient also captures the reaction of the policy-maker to the cyclical conditions in the economy Therefore the observation that |β| ge|γ| can also capture the intention of policy-makers to require less structural effort when cyclical conditions are worse in this way avoiding negative feedback loops Theoretically in a purely structuralist approach the coefficient of the cyclical component could even turn positive
The results of the estimation of model (1) suggest that the recommended effort is based on both nominalist and structuralist considerations (151) On the one hand we find that both the coefficients of the initial structural balance and of the initial cyclical balance are negative and significant in determining the recommended average structural effort pointing to a nominalist approach (see Table IV12 column 1) On the other hand the coefficients of the structural and cyclical components of the headline balance are different In fact we find that the recommended average effort reacts more to changes in the initial structural balance than to changes in the cyclical component pointing to a structural approach
A one-percentage-point worse initial structural balance increases the average recommended effort by 022 percentage points A one-percentage-point worse initial cyclical component (152) increases the average recommended effort by 014 points ie 30 less than the change in the structural balance The estimates are however not very precise as 95 -error bands of the coefficients of the structural balance and cyclical component overlap to a large extent (but not at 90 ) This can be caused by the limited number of observations We must therefore introduce a note of caution when interpreting the results
The fact that the recommended average structural effort is influenced by the initial cyclical
(151) See Annex IV13 for more details on the method used for
the estimation (152) A one-percentage point change in the cyclical component
corresponds to a change in the output-gap between 16 and 36 percentage points depending on the value of the semi-elasticity
component points to the fact that a higher starting headline deficit systematically leads to more demanding recommendations At the same time by reacting less to the cyclical component than to the structural balance when determining the recommended structural adjustment path the Council acknowledges the role of automatic stabilisers and allows them to take effect even if only partially
A drop in the headline balance due to one-off measures (all other things being equal) is by definition temporary and its impact on the headline balance fades out in the year after We find that there is a significant but quantitatively very small positive effect from the one-offs on the recommended structural effort This points to some overshooting in the average recommended structural effort in the presence of one-off measures
The model including the total headline balance rather than its components performs more poorly than the previous model (see Table IV13) (153) Specifically model (2) can be considered a restricted form of model (1) where the condition β = γ = θ is imposed The explanatory power of this model is significantly lower (with a coefficient
(153) The estimated equation has the form
(2) = αprime + βprime HB0 + δprime 0 + ρprime 1
Box (continued)
Table IV12 Results of the estimation of Model 1
Source Commission services Number of observations 68 Pseudo R2 043 Significant at 90 level Significant at 95 level Significant at 99 level Note Given that since 2009 the restriction e ge05 has been officially imposed by the regulations a censored regression model has to be used (model II Tobit) See A13
European Commission Public finances in EMU - 2015
138
Exogenous variables
coefficient Std error Pgt|z| 95 confidence interval
Constant 078 023 000 030 126Headline balance (HB0)
-007 002 000 -010 -003
Expected growth (g1)
-011 003 000 -018 -004
Public debt-to-GDP (d0) 000 000 042 -000 000
of determination less than half that of the estimation of model (1)) This supports our choice to distinguish the effect of the structural fiscal position from the cyclical component The value of the coefficient of the headline balance is significant but lower than both the coefficient of the structural balance and the coefficient of the cyclical component in the previous model
The relatively low value of the headline balance coefficient is likely to be explained by the effect of the one-offs The one-offs are very volatile and poorly correlated with the two other components of the headline balance in our sample However they are strongly correlated with the headline deficit and their positive effect on the average recommended effort possibly causes this low coefficient for the headline balance We can confirm this result by running an estimation in which we distinguish one-offs from the two other components of the headline balance (see also Annex IV16) The poor performance of this model confirms that the model that distinguishes between the structural and cyclical components is more informative
Other determinants of the average effort
It is important to test whether other variables determine the choice of the average effort recommended by the Council as the legislation gives the Council the discretion to take into account relevant factors such as the government debt ratio or the growth outlook when setting the requirements This analysis also provides a second robustness check of the previous results
The main outcome is that there is little space for other determinants of the average effort of the recommendations Specifically there is some evidence that expected economic conditions play a
minor role in determining the recommended effort beyond what we see when we measure the cyclical component of the government balance The results of the estimation show a negative though very small and little significant effect from the forecast GDP growth a one point lower GDP growth forecast increases the average recommended effort over the EDP period by 005 points However the point estimate of the coefficient of expected GDP growth is likely to be imprecise and its degree of significance distorted by multicollinearity through the correlation between the cyclical component and growth itself (154) Therefore we should not over-interpret this result In addition the estimation has been tested excluding the growth variable The results of this estimation showed similar results (see Annex IV16)
We found no evidence that the debt-to-GDP ratio has a strong influence on the EDP recommendation This can have various explanations first all EDP recommendations were issued on the basis of the established existence of excessive deficit Even if in some cases the debt criterion was breached as well the main concern behind the recommendation was the excessive deficit This is in part because the lsquodebt rulersquo - which makes operational the requirement in the Treaty that the government debt ratio has to be below 60 or sufficiently decreasing ndash was only introduced in 2011 and has been applied only once since (to Malta in 2013) It may also reflect the fact that as already mentioned the fiscal deficit can be considered as an intermediate target for controlling the debt meaning that the initial deficit indirectly captures concerns about the debt Moreover while a high debt-to-GDP ratio is always a matter of concern this indicator does not always reflect the sustainability of the debt which depends on long-term variables such as potential growth future expected costs of ageing future interest rates and others Estimations of other specifications of the model also lead to a non-significant debt-to-GDP ratio
No other characteristics of the Member Statesrsquo public finances and economy have been found to have a significant effect on the recommended average effort A series of models which include dummies have been tested (see Annex IV16) However neither the model including a dummy
(154) The correlation between the two variables is 039
Table IV13 Results of the estimation of Model 2
Source Number of observations 68 Pseudo R2 017 Significant at 90 level Significant at 95 level Significant at 99 level
Part IV Characterising the Councilrsquos recommended fiscal reaction to excessive deficits in excessive deficit procedures
139
for the crisis years nor the model tested with a dummy variable for the revised recommendations nor a dummy for Member States under a financial assistance programme suggest that these variables are significant We also tested the model with a simple ordinary least square (OLS) estimation method which also gives very similar results
14 THE DETERMINANTS OF THE DEADLINE
This section looks at what determines the number of years a Member State is granted to correct the excessive deficit As already discussed the legislation requires the excessive deficit to be corrected as fast as possible Nevertheless when the Council sets the deadline of the correction it can also weigh up fiscal and economic considerations
From a given starting fiscal position the Council can require a higher average annual effort over a shorter period or smaller average annual effort over a longer period of time Indeed the timeframe allowed by the Council can be considered as a tool for controlling the recommended average annual effort and consequently mirrors it In principle we would expect the Council to recommend longer deadlines for a very bad starting fiscal position (the nominalist approach) and where there were worse cyclical conditions (the structuralist approach) (155) As was the case in the previous estimate we can detect the structural approach through the difference in the odds ratio of the structural balance and the cyclical balance Since the coefficient of the cyclical balance captures both the impact of the initial headline balance and the cyclical economic conditions and better (worse) economic conditions should lead to a shorter (longer) deadline if they are taken into account the structuralist approach is reflected by a lower odds ratio or equivalently a larger inverse odds ratio of the cyclical balance than of the structural balance
(155) Strictly speaking the fact that the deadline is longer when
the initial headline balance is worse could already be considered a structuralist approach because the longer deadline itself contributes to containing the required annual average effort However our discussion will abstract from this consideration and stick to the more restrictive definition
While there is a negative relation between the recommended average annual effort and the recommended deadline there is no perfect mapping between them Therefore analysing the length of the recommendations separately may produce complementary results to what we found when we analysed the average recommended effort This is partly because the length of the recommendation is set in integer years ie a discrete variable therefore it cannot serve to precisely fine-tune the recommended average annual effort Also the absence of a one-to-one relationship between the recommended average effort and the deadline is due to the fact that the cumulative structural effort required to reach the 3 of GDP headline-deficit threshold is contingent on economic conditions over the duration of the EDP recommendation Given that the economic outlook is forecast to improve over most EDP episodes granting an additional year to correct the excessive deficit can reduce the cumulative structural improvement required Consequently the additional year more than proportionately reduces the average annual fiscal effort
A further different reason to run this analysis is that it also serves as a check on the previous results One may suspect the results of the previous section to be driven by the existence of an algebraic relation between the effort required by the Council and the deficit In fact this section shows that there is a genuine reaction function of the Council in giving recommendations under the SGP which goes beyond the algebraic relationship
In this section the relative probability that the Council recommends a deadline that is one year longer is modelled as a function of the initial fiscal position and the economic conditions captured by the variables included in the estimation of the recommended average structural effort (156)
The results of this estimation show that as with the results of the previous section a worse initial structural balance and a worse cyclical component
(156) By construction the length of the EDP recommendation
(the number of years between the first year of the recommendation and the deadline n in the following) can take only discrete values This requires the use of a lsquomultinomial ordinal logistic modelrsquo (further details of this model in A14)
European Commission Public finances in EMU - 2015
140
ln = α + β SB0 + γ(εOG0) + φ ∙ OO0 + δ 0 + ρ 1 isin 14
Exogenous variables
Odds ratio Odds ratio-
1 Std error Pgt|z| 95 confidence interval
Structural balance (SB0)
047 213 007 000 035 063
Cyclical component ( ∙ 0)
038 263 011 000 022 066
One-offs 037 270 012 000 019 071Expected growth (g1) 094
106012 064 073 121
Public debt-to-GDP (d0) 100
100
001 084 098 101
tend to increase the length of the EDP recommendation (see Table IV14)
Specifically all other things being equal a one percentage-point better initial structural balance broadly halves the probability of receiving a one year longer deadline (see odds ratio in Table IV14 column 1) by the same token a one-percentage-point worse structural balance more than doubles the odds of a longer deadline (see the inverse of the odds ratio in Table IV14 column 2)
Similarly a one-percentage-point better initial cyclical balance multiplies the odds by 038 which means that a one-percentage-point worse cyclical balance (or output gap) multiplies the odds by the inverse 26
Overall these results indicate once more that the Council follows a nominalist approach combined with structuralist considerations The finding that the odds ratios of the headline balance components are found to be significant ndash and moreover are all in the same ballpark ndash suggests that the Council primarily determines the deadline on the basis of the initial headline balance Still the probability of a longer deadline is somewhat higher for a one-percentage-point worse cyclical balance than for a one-percentage-point worse structural balance As discussed above once more the coefficient of the cyclical balance captures both the impact of the initial headline balance and the cyclical economic conditions in these estimates Therefore this finding suggests that the Council does give some consideration of the economic conditions beyond the purely nominalist approach However as in the case of the average effort estimates the difference is not significant
Interestingly the probability that the Council gives a longer correction deadline for a one percentage point balance-deteriorating one-off is similar to that for a one percentage point worse cyclical balance This finding is somewhat surprising as the cyclical component can be expected to be more persistent than the one-off the impact of which dissipates after one year At the same time this finding is consistent with the slight overshooting of the average effort in reaction to one-offs (ie the finding that where the initial headline deficit is deteriorated by one-offs the average effort required tends to be slightly lower than otherwise) The
finding could also be interpreted as evidence of some bias towards the nominalist approach suggesting that the Council mostly looks at the headline balance when determining the deadline At the same time the fact that the impact on the average effort is very small in contrast to the reaction in the deadline could also suggest that the one-offs capture some presumably longer-lasting characteristics which are not captured by the output gap but which are taken into account by the Council An example could be large capital injections during the crisis years into loss-making financial institutions which were signalling distress in the financial sector and therefore may have been accorded a longer deadline
The results displayed in Table IV14 are derived using the following equation (157)
(1rsquo)
where are the ratios of probability (the odds) that the length of the recommendation would be lower than or equal to a certain value j ( =( )( )) Whileα is specific to each value of j the
effect of the other variables on the odds ratio (β γφ δand ρ) does by construction not depend on j This hypothesis mdash called the lsquoproportional
(157) As indicated in the previous footnote the technical details
are found in Annex IV14
Table IV14 Results for the estimation of Model 1
Source Commission services Note Number of observations 68 Log likelihood -68 Significant at 90 level Significant at 95 level Significant at 99 level The odds ratio (column 1) is interpreted as the relative probability of a longer deadline relative to the shorter deadline for a unit increase in the independent variable The inverse of the odds ratio (column 2) is interpreted as the relative probability of a longer deadline relative to a shorter deadline for a unit decrease in the independent variable
Part IV Characterising the Councilrsquos recommended fiscal reaction to excessive deficits in excessive deficit procedures
141
odds assumptionrsquo or the lsquoparallel odds assumptionrsquo mdash is needed to perform an ordered logit estimation (158) The results of our test of this assumption can be found in Annex IV15
The results presented in Table IV14 and Table IV15 are expressed in the form of odds ratios (ie the exponential function applied to the coefficients) an increase by 1 unit in the value of a variable multiplies the odds by the value of the odds ratio For instance an improvement by one point in the structural balance multiplies the odds by e and an improvement by one point in the cyclical balance multiplies the odds by e
Another way to illustrate these findings is to calculate the probability of the length of the deadline n=1hellip5 for a given structural balance and for a given cyclical balance all things being equal These are shown in Graph IV11 The graph indicates that for both the structural balance and the cyclical balance the better the balance the higher the probability the Member State will be granted a shorter deadline The worse the conditions the higher the probability of longer deadlines As a result getting a one-year deadline is the most likely outcome for the range of the initial structural balance between -4 and 0 A
(158) Also the five probabilities cannot be independently
identified as sum ( = j) = 1sum ( = j) = 1 making it necessary to choose a baseline value for the variable of interest here n=1
three-year deadline becomes dominant over the range of structural balance between -4 and -95 while a four-year deadline is the most likely only below a -95 starting structural balance Two-year and the five-year deadlines are never the most likely outcomes over the initial structural balance range of the sample
Similarly looking at the initial cyclical balance getting a one-year deadline is the most likely outcome for the range of -05 to 1 while a three-year deadline is the most likely over the range of -5 to -05 The other outcomes are less likely over the range of the cyclical balance in our sample In addition the range of the cyclical balance over which the three-year deadline is the most likely outcome is to the right of the range of the structural balance This also confirms that the Council tends to grant longer deadlines in case of worse economic conditions in addition to reacting to the initial headline balance
As in the previous section we also estimated a model (model 2rsquo) in which the Member Statersquos fiscal position is represented only by the headline balance (ie without distinguishing between structural cyclical and one-off components) This model can be read as
(2rsquo) ln = αprime + βprime HB0 + δprime 0 + ρprime 1 isin 14
Graph IV11 Probability of recommended deadlines
Source Commission services Note The figures display the probability of recommended deadlines as a function of the initial structural balance (left-hand panel) and the initial cyclical balance (right-hand panel) Outcome=i i=1hellip5 shows the probability of a deadline of i years The calculations are based on the estimation results of model (1rsquo) Probabilities are displayed with 95 confidence intervals
European Commission Public finances in EMU - 2015
142
The likelihood ratio is similar to the one for the estimation of model (1rsquo) Moreover the odds ratio for the headline balance is of the same order of magnitude as the coefficients of its three components The odds ratio shows that a one point worse headline balance more than doubles the probability of a longer deadline This suggests that the above-discussed differences in the coefficients of the various headline balance components are relatively small and that the structuralist approach is not highly significant
Other determinants of the deadline
The results of the estimations of models 1rsquo and 2rsquo also show that economic growth has no significant effect beyond what is captured by the initial cyclical balance Indeed the GDP growth forecast for the year after the recommendation (ie the first year of fiscal adjustment) is not significant neither in the model with the distinction between the three components of the budget balance nor in the model with only the headline balance This could be due to the correlation between the initial output gap and the expected growth forecast for the first year of the recommendation As in the previous section the debt-to-GDP ratio does not seem to have an impact on the length of the recommendation either
Finally evidence suggests that recommendations issued in 2010 are more likely to have a longer deadline The recommendations issued in 2010 (following a breach of the deficit criterion in 2009) are on average slightly longer than the others (average length of 28 years for the 2010 recommendations compared with 24 for the others) When we include in our model a dummy for EDP recommendations issued in 2010 this variable seems to act as a determinant of the deadline (see Annex IV16) Specifically the odds ratio associated with this variable (017) suggests that recommendations issued in 2010 are 83 more likely to have a longer deadline than other recommendations Put differently all other things being equal deadlines were longer during the crisis This may reflect some more-than-proportionate reaction of the Council to the substantial economic slack in the crisis years and or may also be explained by the Councils consideration of the fact that many Member States simultaneously experienced a downturn leading to negative spill-over effects during the crisis years
15 CONCLUSIONS
The excessive deficit procedure was introduced more than 20 ago by the Maastricht Treaty For the first time since then we analyse the Council recommendations on the basis of an exhaustive dataset of past EDP episodes and provide a quantitative assessment of their main determinants While the objectives of these recommendations are straightforward ie that the Member State put an end to its excessive deficit situation as early as possible they are based on a much broader assessment than simply looking at the excess of deficit over the 3 of GDP threshold That is why it is worth estimating and quantifying the extent to which the Councilrsquos EDP recommendations are influenced by the Member Statesrsquo fiscal positions (both nominal and structural) and macroeconomic environment
Firstly the analysis shows that the Council uses the flexibility in the Treaty when making fiscal recommendations There is flexibility in the number of years allowed as three quarters of the recommended fiscal adjustment path is planned to last two years or more There is also flexibility in the average recommended effort which ranges from a recommended annual adjustment of 05 of GDP in 13 recommendations to 2 of GDP or more in seven recommendations
Secondly by characterising the recommendations according to the average structural effort recommended and the deadline granted to the Member State to reduce its excessive deficit we found the following tentative results
The Council adopts a reaction function which combines both nominalist and structuralist approaches The Councilrsquos reaction is nominalist in that the recommended average effort tends to be higher both if the initial deficit is structural and permanent or cyclical and transitory only
Structuralist considerations seem also to matter as the Councilrsquos reaction makes some differentiation between a structural deficit and a cyclical deficit The recommended average effort reacts less to the cyclical deficit than to the structural deficit In addition worse cyclical economic conditions tend to increase the probability of receiving a longer deadline This shows that while a worse initial fiscal position implies larger requirements in line
Part IV Characterising the Councilrsquos recommended fiscal reaction to excessive deficits in excessive deficit procedures
143
Exogenous variables
Odds ratio
Odds ratio-1
Std error Pgt|z| 95 confidence interval
Headline balance (HB0)
045 222 007 000 033 060
Expected growth (g1)
092 109 011 050 073 117
Public debt-to-GDP (d0)
100 100 001 092 098 102
with the Treaty the recommendations also take into account the difficulties associated with large and swift fiscal adjustment by giving to the Member State more time to meet the 3 to GDP threshold However because the limited number of observations does not allow for a statistically precise analysis this result should not be over-interpreted
Other potentially relevant variables such as expected growth or the debt-to-GDP ratio are not found to play a significant role in determining the Councilrsquos recommendations The debt ratio does not seem to play any role in determining the fiscal effort required This is interesting first considering the legislation itself which states that the medium-term debt position (its dynamics and sustainability) constitutes a relevant factor when deciding on the recommendation and second in light of the relevance of debt position when assessing sustainability and the consequent importance of debt in determining the fiscal stance as reflected in the literature
The 2008 financial crisis and its aftermath led to several EDPs being opened in 2009 and to revised recommendations for Member States already under an EDP in response to the rapid deterioration of macroeconomic and fiscal conditions that year However the specific features of the crisis period do not change the main results presented above While the particularities of the crisis period significantly increased the recommended deadline for closing the EDP they did not significantly increase the recommended average effort This is another confirmation of structuralist considerations in the Councilrsquos reaction function
Even though fiscal governance in the EU has evolved over time it remains the outcome of decisions based on a nominalist approach that
stresses the importance of meeting headline deficit requirements However there is also room for a structuralist view that stresses the importance of meeting structural deficit requirements while allowing for automatic stabilisers to operate
Table IV15 Estimation of the results of Model 2
Source Commission services Notes Number of observations 68 Log likelihood -69 Significant at 90 level Significant at 95 level Significant at 99 level
ANNEX 1 SAMPLE DATA AND ROBUSTNESS CHECKS
144
A11 LIST OF EDP RECOMMENDATIONS USED IN THE ANALYSIS
A12 DESCRIPTION OF THE EDP SAMPLE
A121 The deadline
The lengths of the recommendations range from one to five years (see Graph IVA11) The average length of a recommendation (regardless of whether it is an initial recommendation or not) is 24 years Of all the recommendations 88 call on the Member State to correct its excessive deficit in three years or less while only 26 call for a correction within one year Interestingly initial recommendations tend to favour shorter deadlines the average length of initial recommendations is only 23 years with 53 of recommendations lasting two years or less the average length of revised recommendations is 26 with 42 of recommendations lasting two years or less
The lengths of the 38 EDP episodes range from one to eight years The average length is 33 years and 58 of the procedures last between two and four years 16 of the procedures were ended within one year
Although the SGP clearly says that lsquoas a rulersquo the length of the EDP recommendation should be set at one year and a longer deadline should only be set if there are lsquospecial circumstancesrsquo only a quarter of all recommendations set the deadline for the year after the recommendation However this can be explained by the very large proportion of EDP episodes that were opened in 2008 or 2009 ie during the economic crisis Indeed almost three quarters of recommendations longer than one year concerned breaches of the deficit threshold in
Table IVA11 List of EDP recommendations
Source Commission services
Graph IVA11 Distribution of the length of the EDP recommendations in the sample
Source Commission services
date of the recommendation country deadline origin of the
recommendation ended withhellip
28012003 DE 2003 new EDP new recommendation 18062003 FR 2004 new EDP new recommendation 25112003 FR 2005 revised recommendation closing of the EDP 02062004 NL 2005 new EDP closing of the EDP 05072004 CY 2005 new EDP closing of the EDP 05072004 CZ 2008 new EDP new recommendation 05072004 EL 2005 new EDP new recommendation 05072004 MT 2006 new EDP closing of the EDP 05072004 PL 2007 new EDP new recommendation 05072004 SK 2007 new EDP closing of the EDP 07072004 HU 2008 new EDP new recommendation 09022005 EL 2006 revised recommendation closing of the EDP 08032005 HU 2008 revised recommendation new recommendation 20092005 IT 2007 new EDP closing of the EDP 20092005 PT 2008 new EDP closing of the EDP 24012006 UK 2006 new EDP closing of the EDP 14032006 DE 2007 revised recommendation closing of the EDP 09102006 HU 2009 revised recommendation new recommendation 23022007 PL 2007 revised recommendation closing of the EDP 06112007 CZ 2008 revised recommendation closing of the EDP 08072008 UK 2010 new EDP new recommendation 06042009 EL 2010 new EDP new recommendation 06042009 ES 2012 new EDP new recommendation 06042009 IE 2013 new EDP new recommendation 06072009 HU 2011 revised recommendation new recommendation 06072009 LT 2011 new EDP new recommendation 06072009 LV 2012 new EDP closing of the EDP 06072009 MT 2010 new EDP new recommendation 06072009 PL 2012 new EDP new recommendation 06072009 RO 2011 new EDP new recommendation 30112009 AT 2013 new EDP closing of the EDP 30112009 BE 2012 new EDP new recommendation 30112009 CZ 2013 new EDP closing of the EDP 30112009 DE 2013 new EDP closing of the EDP 30112009 ES 2013 revised recommendation new recommendation 30112009 FR 2013 new EDP new recommendation 30112009 IE 2014 revised recommendation new recommendation 30112009 IT 2012 new EDP closing of the EDP 30112009 NL 2013 new EDP new recommendation
30112009 PT 2013 new EDP new recommendation 30112009 SI 2013 new EDP new recommendation 30112009 SK 2013 new EDP closing of the EDP 02122009 UK 2015 revised recommendation ongoing 03022010 EL 2012 revised recommendation new recommendation 09022010 LT 2012 revised recommendation closing of the EDP 09022010 MT 2011 revised recommendation closing of the EDP 12022010 RO 2012 revised recommendation closing of the EDP 10052010 EL 2014 revised recommendation new recommendation 06072010 CY 2012 new EDP new recommendation 06072010 DK 2013 new EDP closing of the EDP 09072010 BG 2011 new EDP closing of the EDP 13072010 FI 2011 new EDP closing of the EDP 07122010 IE 2015 revised recommendation ongoing 13032012 EL 2014 revised recommendation new recommendation 13032012 HU 2012 revised recommendation closing of the EDP 09072012 ES 2014 revised recommendation new recommendation 02092012 PT 2014 revised recommendation new recommendation 04122012 EL 2016 revised recommendation ongoing 07052013 CY 2016 revised recommendation ongoing 18062013 NL 2014 revised recommendation closing of the EDP 18062013 PL 2014 revised recommendation new recommendation 18062013 PT 2015 revised recommendation ongoing 18062013 SI 2015 revised recommendation ongoing 20062013 ES 2016 revised recommendation ongoing 21062013 BE 2013 revised recommendation closing of the EDP 21062013 FR 2015 revised recommendation ongoing 21062013 MT 2014 new EDP ongoing 10122013 PL 2015 revised recommendation ongoing 21012014 HR 2016 new EDP ongoing
Part IV Characterising the Councilrsquos recommended fiscal reaction to excessive deficits in excessive deficit procedures
145
2008 or 2009 while 60 of the one-year recommendations were issued before or after the crisis years Excluding the crisis years 42 of the recommendations set the deadline for the year after the recommendation
A122 The recommended structural effort
The recommended cumulative fiscal efforts over the adjustment period range from 05 to 11 of GDP with an average of 3 Of all the recommended cumulative efforts 28 are lower than or equal to one percentage point and around one quarter are greater than three percentage points (cf Graph IVA12) The cumulative recommended effort and the length of the recommendation are positively correlated (correlation of 074) The cumulative structural effort is on average 08 percentage point when the deadline is fixed for the year after the recommendation was issued (ie length of one year) 19 when the EDP is planned to last two years and 45 when the recommended length is planned to last more than two years
The annual average structural efforts per recommendation range from 03 to 32 percentage points For three observations the recommended annual average fiscal effort is lower than 05 these recommendations were issued before 2009 ie before the rule requiring a minimum effort of 05 of GDP per year was introduced The average of the recommended yearly efforts is 11 of GDP
Slightly more than half of the recommendations recommended an annual average fiscal effort lower than or equal to 1 of GDP The vast majority of these are between 05 and 1 of GDP with only about one fifth less than or equal to 05 of GDP (see Graph IVA13) 21 of the recommended average annual efforts are greater than or equal to 15
Over the whole sample of recommendations the average real-time headline deficit for the year when the 3 threshold (159) was breached is 53 of GDP For the year the recommendation was issued the average of the real-time nominal deficit forecasts is 63 of GDP while for the first year of adjustment the average real-time headline deficit forecast based on the assumption that there is no change in policy is 56 of GDP (160) For four recommendations the headline deficit was lower than 3 of GDP two years before the first adjustment year ie the year where the 3 of GDP threshold should be breached so as to lead to the opening of an EDP This is because for those EDP episodes the EDP was opened (or the decision taken to revise the recommendation) on the basis of forecast instead of outturn data
Over the whole sample of recommendations the
average real-time estimate of the structural balance
(159) Or in the case of revised recommendations two years
before the first year of adjustment (160) At the time of the recommendation headline deficit
forecasts are carried out based on a scenario that assumes that there will be no change in policy
Graph IVA12 Distribution of the recommended cumulative structural effort in the sample
Source Commission services
Graph IVA13 Distribution of the recommended annual structural effort in the sample
Source Commission services
European Commission Public finances in EMU - 2015
146
lowast = αprime + βprime HB0 + δprime 0 + ρprime 1
is -38 of GDP for the forecast of the first year of consolidation and -49 of GDP for the year before However there is a very large dispersion around the average value both for the headline balance and for the structural balance in the first adjustment year
A13 MODELS OF EFFORT TOBIT MODEL
The model determining the average recommended fiscal effort has to take into account the restriction on the annual recommended fiscal effort (and therefore also on the average recommended effort) which should exceed 05 of GDP This restriction has been imposed only since 2009 but given the size of our sample we cannot split it into two sub-samples and still maintain a fair explanatory power for the estimations 70 of the EDP recommendations in our sample occurred later than 2009
With depending on several variables representing nominal or structural fiscal positions economic conditions etc
1)
2)
= lowast lowast ge 0505 lowast le 05
lowast
lowast = α + β SB0 + γ ∙ (ε ∙ OG0) + θ ∙ OO0 + δ 0 + ρ 1
Part IV Characterising the Councilrsquos recommended fiscal reaction to excessive deficits in excessive deficit procedures
147
μ = minusln(M)( = )5
1 = 1 (αk + βk + γk )51
= 1sum (αk + βk + γk )51
sum ( = )51 = 1
P(ni = k)51 = 1P(n isin 1 5 ) = 1
A14 MULTINOMIAL LOGIT REGRESSION
A141 Ordinal logit
As the length of the EDP recommendation consists of the number of years between the first year of the recommendation and the deadline n in the following it can take only discrete values greater than 1 which requires the use of logistic regressions This model will allow us to assess the impact of the fiscal position and the economic environment on the relative probability for n to take any value greater than 1 For the sake of simplicity we will make the hypothesis that n cannot take values greater than 5 We define a series of odds as follows
This ordinal logistic model (lsquomodel 1rsquo in the following) then reads as follows
with isin 1 4 and where is the structural deficit of year 0 (the year before the first year of recommended fiscal effort) and is the real-time output gap forecast for year 1 (the first year of the recommendation) Whileα is specific to each group the effect of the structural balance and the output gap on the odds ratio (resp β and γ) are the same for the different groups Indeed the model requires the assumption that the effect of an exogenous variable does not depend on the logit function (ie on j) In other words under this assumption an improvement in the structural balance by 1 point will have the same impact on the probability that n is lower than 2 as it has on the probability than n is lower than 3 Also as sum ( = k) = 1 (due to our assumption that le 5) there is no odds ratio associated with = 5 In other words the five probabilities cannot be independently identified The results are usually expressed in the form of odds ratios respectively
e and e for the sake of simplicity Model 1 can be rewritten as follows
A 1 point better structural balance multiplies the odds by e Similarly a 1 point better output gap multiplies the odds by e
By their very nature the odds ratios are not linear if the structural balance (respectively the output gap) were to deteriorate by two points then the odds ratio would be multiplied by 45 as 179 =320 (respectively 174 as 132 = 174)
A142 Multinomial non-ordered logit
The parallel odds assumption has not been rejected by the Wald test However other tests such as a likelihood ratio or score tests give more ambiguous results We also checked the robustness of our model against a generalised multinomial logit model where the parallel odds assumption is not needed The non-ordered model reads as follows
However so
These constraints can be taken into account by re-writing this equation by defining μ and α such
that
We can then define M such that
giving us
M can then be chosen such that
by choosing
So for all k in 1 5 we have
1 = ( gt 1)( = 1)2 = ( gt 2)( le 2)3 = ( gt 3)( le 3)4 = ( = 5)( le 4)
ln = α + β 0 + γ 1
= eα ∙ e 0 ∙ (eγ) 1
ln ( = 1) = α2 + β2 + γ2ln ( = 2) = α3 + β3 + γ3ln ( = 3) = α4 + β4 + γ4ln ( = 4) = α5 + β5 + γ5ln ( = 5) = α5 + β5 + γ5
α = μ + α
( = k) = exp(αk + βk + γk )sum exp(αk + βk + γk )51
European Commission Public finances in EMU - 2015
148
( = 1) ( gt j)( le j minus 1)
with
is entirely determined by the four other equations Therefore there are only four independent equations and the model finally reads as
A15 TEST OF THE PROPORTIONAL ODDS ASSUMPTION AND ALTERNATIVE ESTIMATIONS
The main hypothesis underlying an ordered logit is that an change in an exogenous variable by 1 point will have the same impact on the probability ratios
regardless of the value of j This hypothesis which is called the lsquoproportional odds assumptionrsquo or lsquoparallel odds assumptionrsquo is needed to perform ordered logit estimations
The use of this estimation method is supported by the fact that the proportional odds assumption cannot be rejected by the Wald test (see Table IVA12) In order to test the proportional odds assumption we used the Wald test This test takes as a null hypothesis that the relationships between all pairs of the odds ratio are the same Therefore the model is valid only if the test shows that the null hypothesis cannot be rejected Table Table IVA13 shows the results of the Wald test for our model (1rsquo)
However other tests give more ambiguous results (161) We also checked the robustness of our model against a generalised multinomial logit model where the parallel odds assumption is not needed The downside of this alternative method is that we lose the information that the possible values of n are ordered Moreover as the method preforms multiple regressions it is not optimal for small samples such as ours
Nevertheless this method gives similar results to the first method (see Table IVA13)
(161) See Buis and Williams (2013) for an analysis of the
performance of tests for the parallel regressions assumption in ordered logit models
αprimek equiv αk minus α1βprimek equiv βk minus β1γprimek equiv γk minus γ1( = 1) = 11 + sum (αprimek + βprimek + γprimek )52
Table IVA12 Result for the Wald test for Model 1
Source Commission services Note The null hypothesis that the odds are proportional cannot be rejected by the Wald test
Chi2 PgtChi2 1892 0218
ln ( = 2)( = 1) = μ + αprime2 + βprime2 + γprime2ln ( = 3)( = 1) = μ + αprime3 + βprime3 + γprime3ln ( = 4)( = 1) = μ + αprime4 + βprime4 + γprime4ln ( = 5)( = 1) = μ + αprime5 + βprime5 + γprime5
Part IV Characterising the Councilrsquos recommended fiscal reaction to excessive deficits in excessive deficit procedures
149
Exogenous variables (1) (1 bis) (2) (3) (4) (5) (6)
structural balance
(t=0) -022 -024 -022 -022 -022 -020
cyclical component εmiddotOG (t=0)
-014 -018 -014 -014 -014 -014
one-offs 005 006 005 006 005 005 nominal balance
(t=0) -007
real growth (t=1) -005 -011 -005 -005 -004 -004
debt-to-GDP ratio
(t=0) 000 000 000 000 000 000 000
dummy for crisis years 002 dummy for programme
countries 010
extension 015 constant -008 -029 078 008 -003 -009 009
R2 043 040 017 043 043 044 065
Odds ratio 1 2 3 4 5 structural balance (t=0) 047 041 047 046cyclical component εmiddotOG -(t=0) 038 037 038 036one-offs 037 032 037 037nominal balance (t=0) 045 real growth (t=1) 094 092 081 095 098 debt-to-GDP ratio (t=0) 100 100 099 100 100 dummy for crisis years 017 dummy for programme countries 132 extension 193 Log likelihood -68 -69 -65 -68 -67
Exogenous variables Odds ratio Std error Pgt|z| 95 confidence interval
n=2 structural balance (t=0) 021 014 002 006 075cyclical component εmiddotOG (t=0) 011 010 002 002 065 one-offs (t=0) 022 024 017 003 188real growth (t=1) 072 022 028 039 131debt-to-GDP ratio (t=0) 100 002 083 096 105constant 000 000 003 000 059
n=3 structural balance (t=0) 010 007 000 003 037cyclical component εmiddotOG (t=0) 003 003 000 000 021 one-offs (t=0) 008 009 003 001 075real growth (t=1) 079 025 046 042 148debt-to-GDP ratio (t=0) 100 002 090 096 105constant 000 000 000 000 002
n=4 structural balance (t=0) 009 007 000 002 037cyclical component εmiddotOG (t=0) 057 078 068 004 836 one-offs (t=0) 000 001 000 000 011real growth (t=1) 058 020 012 029 115debt-to-GDP ratio (t=0) 097 003 041 092 104constant 000 000 002 000 019
n=5 structural balance (t=0) 000 000 099 - -cyclical component εmiddotOG ndash(t=0) 000 000 099 - - one-offs (t=0) 000 000 099 - -real growth (t=1) 000 038 099 - -debt-to-GDP ratio (t=0) 106 5670 100 - -constant 000 000 099 - -
A16 ROBUSTNESS CHECKS
Table IVA14 Other specifications for the determinants of the average effort (with the debt-to-GDP ratio)
Source Commission services Significant at 90 level Significant at 95 level Significant at 99 level The exogenous variable is the average recommended effort of the EDP episode N=68 All estimations apart from number (6) are Tobit estimations In these models 16 observations have been left-censored as the average effort was less than or equal to 05
Table IVA15 Other specifications for the determinants of the length of the EDP
Source Commission services Significant at 90 level Significant at 95 level Significant at 99 level The exogenous variable is the recommended length of the EDP episode N=68
Table IVA13 Results of the estimation of Model 1 using the non-ordered multinomial logit method
Source Commission services Note Significant at 90 level Significant at 95 level Significant at 99 level n=1 is the base outcome N=68 Likelihood ratio -49
Part V Resources
1 ABBREVIATIONS AND SYMBOLS USED
152
Member States
BE Belgium
BG Bulgaria
HR Croatia
CZ Czech Republic
DK Denmark
DE Germany
EE Estonia
EI Ireland
EL Greece
ES Spain
FR France
IT Italy
CY Cyprus
LV Latvia
LT Lithuania
LU Luxembourg
HU Hungary
MT Malta
NL The Netherlands
AT Austria
PL Poland
PT Portugal
RO Romania
SI Slovenia
SK Slovakia
Part V Resources
153
FI Finland
SE Sweden
UK United Kingdom
EA Euro area
EU European Union
EU-28 European Union 27 Member States
EA-18 European Area 17 Member States
Other
AMECO Macro-economic database of the European Commission
ATE Average treatment effects
AWG Ageing Working Group
CAB Cyclically Adjusted Budget Balance
CAPB Cyclically-adjusted primary balance
COFOG Classification of the functions of government
COM Commission
CSR Country-Specific Recommendations
DBP Draft Budgetary Plan
DFE Discretionary Fiscal Effort
DG ECFIN Directorate-General Economic and Financial Affairs
DRM Discretionary Revenue Measures
EC European Commission
ECB European Central Bank
ECON Council and to the Economic and Financial Committee
EDP Excessive Deficit Procedure
EERP European Economic Recovery Plan
EFC Economic and Financial Committee
EFSF European Financial Stability Facility
European Commission Public finances in EMU - 2013
154
EMU Economic and Monetary Union
EPC Economic Policy Committee
ESA European System of National and Regional Accounts
EA Euro Area
EU European Union
FBFL Federal Budgetary Framework Law
FE Fiscal Effort
FPC Fiscal Policy Committees
GDP Gross Domestic Product
GFKF Gross Fixed Capital Formation
GFCF Gross Fixed Capital Formation
HICP Harmonized Index of Consumer Prices
IFI Independent Fiscal Institutions
IMF International Monetary Fund
ICTU Irish Congress of Trade Unions
MLSA Minimum Linear Structural Adjustment
MTBF Medium-Term Budgetary Framework
MTFS Medium-Term Fiscal Strategy
MTO Medium-Term budgetary Objective
NCPI National Consumption Price Index
NAWRU Non-accelerating Wage Rate of Unemployment
NRP National Reform Programme
OECD Organisation of Economic Co-operation and Development
OG Output Gap
OGWG Output Gap Working Group
PFR Public Finance Report
pp Percentage Points
Part V Resources
155
RA Regression-Adjusted estimators
RampD Research and Development
ROG Representative Output Gap
SB Structural Balance
SCPs Stability or Convergence Programmes
SDP Significant Deviation Procedure
SGP Stability and Growth Pact
SOE State Owned Enterprise
SPB Structural Primary Balances
TSCG Treaty on Stability Coordination and Governance
TFEU Treaty on the Functioning of European Union (TFEU)
2 GLOSSARY
156
Asset management company Public or private body aiming at restructuring recovering or disposing of nonperforming assets
Automatic stabilisers Features of the tax and spending regime which react automatically to the economic cycle and reduce its fluctuations As a result the budget balance in percent of GDP tends to improve in years of high growth and deteriorate during economic slowdowns
Budget balance The balance between total public expenditure and revenue in a specific year with a positive balance indicating a surplus and a negative balance indicating a deficit For the monitoring of Member State budgetary positions the EU uses general government aggregates See also structural budget balance primary budget balance and primary structural balance
Budgetary rules Rules and procedures through which policy-makers decide on the size and the allocation of public expenditure as well as on its financing through taxation and borrowing
Budgetary sensitivity The variation in the budget balance in percentage of GDP brought about by a change in the output gap In the EU it is estimated to be 05 on average
Candidate countries Countries that wish to accede to the EU Besides the accession countries they include Croatia and Turkey
Close-to-balance requirement A requirement contained in the old Stability and Growth Pact according to which Member States should over the medium term achieve an overall budget balance close to balance or in surplus was replaced by country-specific medium-term budgetary objectives in the reformed Stability and Growth Pact
Code of Conduct Policy document endorsed by the ECOFIN Council of 11 October 2005 setting down the specifications on the implementation of the Stability and Growth Pact and the format and content of the stability and convergence programmes
COFOG (Classification of the Functions of Government) A statistical nomenclature used to
break down general government expenditure into its different functions including general public services defence public order and safety economic affairs environmental protection housing and community amenities health recreation culture and religion education and social protection
Convergence programmes Medium-term budgetary and monetary strategies presented by Member States that have not yet adopted the euro They are updated annually according to the provisions of the Stability and Growth Pact Prior to the third phase of EMU convergence programmes were issued on a voluntary basis and used by the Commission in its assessment of the progress made in preparing for the euro See also stability programmes
Crowding-out effects Offsetting effects on output due to changes in interest rates and exchange rates triggered by a loosening or tightening of fiscal policy
Cyclical component of budget balance That part of the change in the budget balance that follows automatically from the cyclical conditions of the economy due to the reaction of public revenue and expenditure to changes in the output gap See automatic stabilisers tax smoothing and structural budget balance
Cyclically-adjusted budget balance See structural budget balance
Demand and supply shocks Disturbances that affect the economy on the demand side (eg changes in private consumption or exports) or on the supply side (eg changes in commodity prices or technological innovations) They can impact on the economy either on a temporary or permanent basis
Deposit Guarantee Schemes reimburse a limited amount of deposits to depositors whose bank has failed From the depositors point of view this protects a part of their wealth from bank failures From a financial stability perspective this promise prevents depositors from making panic withdrawals from their bank thereby preventing severe economic consequences
Part V Resources
157
Direct fiscal costs (gross net) of a financial crisis The direct gross costs are the fiscal outlays in support of the financial sector that increase the level of public debt They encompass for example recapitalisation purchase of troubled bank assets pay-out to depositors liquidity support payment when guarantees are called and subsidies The direct net costs are the direct gross cost net of recovery payments such as through the sale of acquired assets or returns on assets Thus the net direct fiscal costs reflect the permanent increase in public debt
Direct taxes Taxes that are levied directly on personal or corporate incomes and property
Discretionary fiscal policy Change in the budget balance and in its components under the control of government It is usually measured as the residual of the change in the balance after the exclusion of the budgetary impact of automatic stabilisers See also fiscal stance
Early-warning mechanism Part of the preventive elements of the Stability and Growth Pact It is activated when there is significant divergence from the budgetary targets set down in a stability or convergence programme
Economic and Financial Committee (EFC) Formerly the Monetary Committee the EFC is a Committee of the Council of the European Union set up by Article 114 of the Its main task is to prepare and discuss (ECOFIN) Council decisions with regard to economic and financial matters
Economic Policy Committee (EPC) Group of senior government officials whose main task is to prepare discussions of the (ECOFIN) Council on structural policies It plays an important role in the preparation of the Broad Economic Policy Guidelines and it is active on policies related to labour markets methods to calculate cyclically-adjusted budget balances and ageing populations
Effective tax rate The ratio of broad categories of tax revenue (labour income capital income consumption) to their respective tax bases
Effectiveness The same concept as efficiency except that it links input to outcomes rather than outputs
Efficiency Can be defined in several ways either as the ratio of outputs to inputs or as the distance to a production possibility frontier (see also Free Disposable Hull analysis Data Envelope analysis stochastic frontier analysis) Cost efficiency measures the link between monetary inputs (funds) and outputs technical efficiency measures the link between technical inputs and outputs Output efficiency indicates by how much the output can be increased for a given input input efficiency indicates by how much the input can be reduced for a given input
Emergency Liquidity Assistance (equivalent to lender-of-last- resort) the most traditional tool available to a central bank for dealing with financial instability It includes both the provision of liquidity to the financial system as a whole through market operations as well as emergency lending to individual banks Not all liquidity injections aimed at preventing the spread of a liquidity problem relate to a crisis as central banks routinely offer liquidity against specified collateral requirements in order to support the orderly functioning of markets
ESA2010ESA95 ESA79 European accounting standards for the reporting of economic data by the Member States to the EU As of 2000 ESA95 has replaced the earlier ESA79 standard with regard to the comparison and analysis of national public finance data
European Financial Stability Facility is a company owned by Euro Area Member States created following the decisions taken in May 2010 by the Council EFSF is able to issue bonds guaranteed by EAMS for up to euro 440 billion for on-lending to EAMS in difficulty subject to conditions negotiated with the European Commission in liaison with the European Central Bank and International Monetary Fund and to be approved by the Eurogroup EFSF has been assigned the best possible credit rating AAA by Standard amp Poorrsquos and Fitch Ratings Aaa by Moodyrsquos
European semester European semester New governance architecture approved by the Member States in September 2010 It means that the EU and the euro zone will coordinate ex ante their budgetary and economic policies in line with both the Stability and Growth Pact and the Europe 2020
European Commission Public finances in EMU - 2015
158
strategy Based on previous discussions on Commissions Annual Growth Survey each summer the European Council and the Council of ministers will provide policy advice before Member States finalise their draft budgets
Excessive Deficit Procedure (EDP) A procedure according to which the Commission and the Council monitor the development of national budget balances and public debt in order to assess andor correct the risk of an excessive deficit in each Member State Its application has been further clarified in the Stability and Growth Pact See also stability programmes and Stability and Growth Pact
Expenditure rules A subset of fiscal rules that target (a subset of) public expenditure
Fiscal consolidation An improvement in the budget balance through measures of discretionary fiscal policy either specified by the amount of the improvement or the period over which the improvement continues
Fiscal decentralisation The transfer of authority and responsibility for public functions from the central government to intermediate and local governments or to the market
Fiscal federalism A subfield of public finance that investigates the fiscal relations across levels of government
Fiscal governance Comprises all rules regulations and procedures that impact on how the budget and its components are being prepared The terms fiscal governance and fiscal frameworks are used interchangeably in the report
Fiscal impulse The estimated effect of fiscal policy on GDP It is not a model-free measure and it is usually calculated by simulating an econometric model The estimates presented in the present report are obtained by using the Commission servicesrsquo QUEST model
Fiscal rule A permanent constraint on fiscal policy expressed in terms of a summary indicator of fiscal performance such as the government budget deficit borrowing debt or a major component thereof See also budgetary rule expenditure rules
Fiscal stance A measure of the effect of discretionary fiscal policy In this report it is defined as the change in the structural (or structural primary) budget balance relative to the preceding period When the change is positive (negative) the fiscal stance is said to be expansionary (restrictive)
General government As used by the EU in its process of budgetary surveillance under the Stability and Growth Pact and the excessive deficit procedure the general government sector covers national government regional and local government as well as social security funds Public enterprises are excluded as are transfers to and from the EU Budget
Government budget constraint A basic condition applying to the public finances according to which total public expenditure in any one year must be financed by taxation government borrowing or changes in the monetary base In the context of EMU the ability of governments to finance spending through money issuance is prohibited See also stock-flow adjustment sustainability
Government contingent liabilities Obligations for the government that are subject to the realization of specific uncertain and discrete future events For instance the guarantees granted by governments to the debt of private corporations bonds issued by enterprise are contingent liabilities since the government obligation to pay depend on the non-ability of the original debtor to honour its own obligations
Government implicit liabilities Government obligations that are very likely to arise in the future in spite of the absence of backing contracts or law The government may have a potential future obligation as a result of legitimate expectations generated by past practice or as a result of the pressure by interest groups Most implicit liabilities are contingent ie depend upon the occurrence of uncertain future events
Growth accounting A technique based on a production function approach where total GDP (or national income) growth is decomposed into the various production factors and a non-explained part which is the total factor productivity change also often termed the Solow residual
Part V Resources
159
Indirect taxation Taxes that are levied during the production stage and not on the income and property arising from economic production processes Prominent examples of indirect taxation are the value added tax (VAT) excise duties import levies energy and other environmental taxes
Integrated guidelines A general policy instrument for coordinating EU-wide and Member States economic structural reforms embedded in the Lisbon strategy and which main aim is to boost economic growth and job creation in the EU
Interest burden General government interest payments on public debt as a share of GDP
Maastricht reference values for public debt and deficits Respectively a 60 general government debt-to-GDP ratio and a 3 general government deficit-to-GDP ratio These thresholds are defined in a protocol to the Maastricht Treaty on European Union See also Excessive Deficit Procedure
Maturity structure of public debt The profile of total debt in terms of when it is due to be paid back Interest rate changes affect the budget balance directly to the extent that the general government sector has debt with a relatively short maturity structure Long maturities reduce the sensitivity of the budget balance to changes in the prevailing interest rate See also public debt
Medium-term budgetary objective (MTO) According to the reformed Stability and Growth Pact stability programmes and convergence programmes present a medium-term objective for the budgetary position It is country-specific to take into account the diversity of economic and budgetary positions and developments as well as of fiscal risks to the sustainability of public finances and is defined in structural terms (see structural balance)
Minimum benchmarks The lowest value of the structural budget balance that provides a safety margin against the risk of breaching the Maastricht reference value for the deficit during normal cyclical fluctuations The minimum benchmarks are estimated by the European Commission They do not cater for other risks such as unexpected budgetary developments and interest rate shocks
They are a lower bound for the medium-term budgetary objectives (MTO)
NAIRU Non-Accelerating Inflation Rate of Unemployment
One-off and temporary measures Government transactions having a transitory budgetary effect that does not lead to a sustained change in the budgetary position See also structural balance
Output gap The difference between actual output and estimated potential output at any particular point in time See also cyclical component of budget balance
Performance-based budgeting A budgeting technique that links budget appropriations to performance (outcomes results) rather than focusing on input controls In practice performance-informed budgeting is more common which basis decisions on budgetary allocation on performance information without establishing a formal link
Policy-mix The overall stance of fiscal and monetary policy The policy-mix may consist of various combinations of expansionary and restrictive policies with a given fiscal stance being either supported or offset by monetary policy
Potential GDP The level of real GDP in a given year that is consistent with a stable rate of inflation If actual output rises above its potential level then constraints on capacity begin to bind and inflationary pressures build if output falls below potential then resources are lying idle and inflationary pressures abate See also production function method and output gap
Primary budget balance The budget balance net of interest payments on general government debt
Primary structural budget balance The structural budget balance net of interest payments
Private pension schemes The insurance contract specifies a schedule of contribution in exchange of which benefits will be paid when the members reach a specific retirement age The transactions are between the individual and the insurance provider and they are not recorded as government revenues or government expenditure and
European Commission Public finances in EMU - 2015
160
therefore do not have an impact on government surplus or deficit
Pro-cyclical fiscal policy A fiscal stance which amplifies the economic cycle by increasing the structural primary deficit during an economic upturn or by decreasing it in a downturn A neutral fiscal policy keeps the cyclically-adjusted budget balance unchanged over the economic cycle but lets the automatic stabilisers work See also tax-smoothing
Production function approach A method to estimate the level of potential output of an economy based on available labour inputs the capital stock and their level of efficiency Potential output is used to estimate the output gap a key input in the estimation of cyclical component of the budget
Public debt Consolidated gross debt for the general government sector It includes the total nominal value of all debt owed by public institutions in the Member State except that part of the debt which is owed to other public institutions in the same Member State
Public investment The component of total public expenditure through which governments increase and improve the stock of capital employed in the production of the goods and services they provide
Public-private partnerships (PPP) Agreements that transfer investment projects to the private sector that traditionally have been executed or financed by the public sector To qualify as a PPP the project should concern a public function involve the general government as the principal purchaser be financed from non-public sources and engage a corporation outside the general government as the principal operator that provides significant inputs in the design and conception of the project and bears a relevant amount of the risk
Sensitivity analysis An econometric or statistical simulation designed to test the robustness of an estimated economic relationship or projection given various changes in the underlying assumptions
Significant divergence A sizeable excess of the budget balance over the targets laid out in the stability or convergence programmes that triggers
the Early warning procedure of the Stability and Growth Pact
Size of the public sector Typically measured as the ratio of public expenditure to nominal GDP
lsquoSnow-ballrsquo effect The self-reinforcing effect of public debt accumulation or decumulation arising from a positive or negative differential between the interest rate paid on public debt and the growth rate of the national economy See also government budget constraint
Social security contributions (SSC) Mandatory contributions paid by employers and employees to a social insurance scheme to cover for pension health care and other welfare provisions
Sovereign bond spread The difference between risk premiums imposed by financial markets on sovereign bonds for different states Higher risk premiums can largely stem from (i) the debt service ratio also reflecting the countries ability to raise their taxes for a given level of GDP (ii) the fiscal track record (iii) expected future deficits and (iv) the degree of risk aversion
Stability and Growth Pact (SGP) Approved in 1997 and reformed in 2005 the SGP clarifies the provisions of the Maastricht Treaty regarding the surveillance of Member State budgetary policies and the monitoring of budget deficits during the third phase of EMU The SGP consists of two Council Regulations setting out legally binding provisions to be followed by the European Institutions and the Member States and two Resolutions of the European Council in Amsterdam (June 1997) See also Excessive Deficit Procedure
Stability programmes Medium-term budgetary strategies presented by those Member States that have already adopted the euro They are updated annually according to the provisions of the Stability and Growth Pact See also Convergence programmes
Stock-flow adjustment The stock-flow adjustment (also known as the debt-deficit adjustment) ensures consistency between the net borrowing (flow) and the variation in the stock of gross debt It includes the accumulation of financial assets changes in the value of debt
Part V Resources
161
denominated in foreign currency and remaining statistical adjustments
Structural budget balance The actual budget balance net of the cyclical component and one-off and other temporary measures The structural balance gives a measure of the underlying trend in the budget balance See also primary structural budget balance
Sustainability A combination of budget deficits and debt that ensure that the latter does not grow without bound While conceptually intuitive an agreed operational definition of sustainability has proven difficult to achieve
Tax elasticity A parameter measuring the relative change in tax revenues with respect to a relative change in GDP The tax elasticity is an input to the budgetary sensitivity
3 REFERENCES
162
Aghevli B and Khan MS (1980) lsquoGovernment Deficits and the Inflationary Process in Developing Countriesrsquo in W Coats and DR Khatkhate (eds) Readings on Money and Monetary Policy in Less Developed Countries Pergamon Press Oxford
Alesina A Favero C and Giavazzi F (2015) lsquoThe output effect of fiscal consolidation plansrsquo Journal of International Economics 96 (S1) S19-S42
Baldi G and Staehr K (2013) lsquoThe European Debt Crisis and Fiscal Reaction Functions in Europe 2000-2012rsquo Discussion Papers of DIW Berlin 1295 DIW Berlin German Institute for Economic Research
Beyer A Haug A and Dewald W G (2009) lsquoStructural Breaks Cointegration and the Fisher Effectrsquo ECB Working paper series 1013
Bohn H (1998) lsquoThe Behaviour of US Public Debt and Deficitsrsquo Quarterly Journal of Economics 113 949-963
Buis ML and Williams R (2013) lsquoUsing simulation to inspect the performance of a test in particular tests of the parallel regressions assumption in ordered logit modelsrsquo presented at the 11th German Stata Usersrsquo meeting on 6 June 2013 in Potsdam
Celasun O Debrun X and Ostry JD (2007) lsquoPrimary Surplus Behavior and Risks to Fiscal Sustainability in Emerging Market Countries A lsquoFan-Chartrsquo Approachrsquo IMF Staff Papers 53(3)
Cimadomo J (2012) lsquoFiscal Policy in Real Timersquo Scandinavian Journal of Economics 114(2) 440-465
Cooray A (2002) lsquoThe Fisher Effect A Review of the Literaturersquo Research Papers 0206 Macquarie University Department of Economics
Cugnasca A and Rother P (2015) lsquoFiscal multipliers during consolidation evidence from the European Unionrsquo ECB Working Paper Series 1863
De Castro F Perez J and Rodriguez-Vives M (2013) lsquoFiscal Data Revisions in Europersquo
Journal of Money Credit and Banking Volume 45 (6) 1187-1209
Commission Staff Working Document SWD (2015) 400 final Challenges to Member States Investment Environments
European Central Bank (2014) lsquoThe current weakness in euro area investment compared with past crisis episodesrsquo Monthly Bulletin December 2014
European Commission (2006) lsquoDefinition and identification of one-off and temporary measuresrsquo Report on Public Finances in EMU Section II42
European Commission (2011) lsquoDebt sustainability in the EUrsquo Report on Public Finances in EMU Part IV
European Commission (2012) lsquoFiscal Sustainability Report 2012rsquo European Economy 8
European Commission (2013) lsquoEvolving budgetary surveillancersquo Report on Public Finances in EMU
European Commission (2014a) lsquoThe 2015 Ageing Report Economic and budgetary projections for the 28 EU Member States (2013-2060)rsquo European Economy 3
European Commission (2014b) lsquoThe Economic Adjustment Programme for Portugal 2011-2014rsquo European Economy Occasional Papers 202
European Commission (2015a) lsquoThe euro-area recovery in perspectiversquo Quarterly report on the euro area 14(3)
European Commission (2015b) lsquoThe 2015 Stability and Convergence Programmes An overviewrsquo European Economy Institutional Papers 002
Eurostat (2014) Manual on the changes between ESA 95 and ESA 2010 Eurostat manuals and guidelines
Fiscal Discipline Council of Latvia (2015) Fiscal discipline monitoring report 2015
Part V Resources
163
Available online at httpfiscalcouncillvfilesuploadedFDP_1_01_691_20150925_Monitoring_report_with_Annexespdf
Fournier J-M and Fall F (2015) lsquoMacroeconomic uncertainties prudent debt targets and fiscal rulesrsquo OECD Economics Department Working Papers 1230
Furceri D and A Mourougane (2009) lsquoThe effect of financial crises on potential output new empirical evidence from OECD countriesrsquo OECD Economics Department Working Papers 699
Ghosh A M Qureshi and Tsangarides C (2013) lsquoIs Exchange Rate Regime Really Irrelevant for External Adjustment rsquo Economics Letters 118(1) 104-109
Golinelli R and Momigliano S (2006) lsquoReal-Time Determinants of Fiscal Policies in the Euro Arearsquo Journal of Policy Modeling 28 943-964
Golinelli R and Momigliano S (2009) lsquoThe Cyclical Reaction of Fiscal Policies in the Euro Area The Role of Modelling Choices and Data Vintagesrsquo Fiscal Studies 30 39-72
Heinemann F (2000) lsquoAfter the Death of Inflation Will Fiscal Drag Surviversquo ZEW Discussion Papers 00-19
Hofmans HMJ and van de Coevering C R (2014) lsquoHow to deal with contingent liabilities ndash Lessons from the Dutch experiencersquo OECD Journal on Budgeting 1
IMF Fiscal Affairs Department (2007) Manual on Fiscal Transparency Fiscal Affairs Dept International Monetary Fund Washington DC Available at httpwwwimforgexternalnppp2007eng101907mpdf
IMF Fiscal Affairs Department (2014) The Fiscal Transparency Code Available online at httpblog-pfmimforgfilesft-codepdf Immervoll H (2005) lsquoFalling Up The Stairs The Effects Of Bracket Creep On Household Incomesrsquo The Review of Income and Wealth 51 (1) 37ndash62
International Public Sector Accounting Board (IPSASB) (2014) Handbook of International Public Sector Accounting International Federation of Accountants New York
Jordagrave O Schularick M HP Taylor AM (2013) lsquoSovereigns versus banks credit crises and consequencesrsquo NBER Working Paper19506
Larch M and Salto M (2005) lsquoFiscal Rules Inertia and Discretionary Fiscal Policyrsquo Applied Economics 37 (10) 1135-1146
Legrenzi G and Milas C (2013) lsquoModelling the Fiscal Reaction Functions of the GIPS based on State-Varying Thresholdsrsquo Working Paper Series 16_13 The Rimini Centre for Economic Analysis
Lindwall P (2013) lsquoBudgeting for Contingent Liabilitiesrsquo Discussion Paper 34th Annual Meeting of Oecd Senior Budget Officials OECD Conference CentreParis 3-4 June 2013 Available online at httpwwwoecdorgofficialdocumentspublicdisplaydocumentpdfcote=GOVPGCSBO(2013)7ampdoclanguage=en)
Lukkezen J and Rojas-Romagosa H (2012) lsquoWhen is debt sustainablersquo CPB Discussion Paper 212
Mauro P Romeu R Binder A J and Zaman A (2013) lsquoA Modern History of Fiscal Prudence and Profligacyrsquo IMF Working Papers 135
Medeiros J (2012) lsquoStochastic debt simulation using VAR models and a panel fiscal reaction function results for a selected number of countriesrsquo European Commission Economic Papers 459
Mertens K and Ravn M O (2011) lsquoUnderstanding the Aggregate Effects of Anticipated and Unanticipated Tax Policy Shocksrsquo Review of Economic Dynamics 14(1) 27mdash54
OECD (2002) lsquoOECD Best Practices for Budget Transparencyrsquo OECD Journal on Budgeting Available online at httpwwwoecdorggovbudgetingbest-practices-budget-transparencyhtm)
European Commission Public finances in EMU - 2013
164
OECD (2007) lsquoSpecial feature tax reforms and tax burdens 2000-2006rsquo in OECD Tax Wage Report
Polackova Brixi H and Mody A (2002) lsquoDealing with Government Fiscal Risk An Overviewrsquo in eds Polackova Brixi H and Schick A Government at risk World Bank and Oxford University Press
Ramey V (2011a) lsquoIdentifying Government Spending Shocks Itrsquos All in the Timingrsquo Quarterly Journal of Economics 126 (1) 1-50
Ramey V (2011b) lsquoCan Government Purchases Stimulate the Economyrsquo Journal of Economic Literature 49(3) 673-685
Reinhart CM and Rogoff KS (2008) lsquoIs the 2007 US sub-prime financial crisis so different An international historical comparisonrsquo American Economic Review 98(2) 339-344
The Swedish National Debt Office (2015) Guarantees amp lending Available online at httpswwwriksgaldenseenaboutsndoGuarantees-and-lending1
Weichenrieder A and Zimmer J (2013) lsquoEuro Membership and Fiscal Reaction Functionsrsquo CESifo Working Paper Series 4255
Westerlund J (2008) lsquoPanel cointegration tests of the fisher effectrsquo Journal of Applied Economics 23 193ndash233
4 USEFUL INTERNET LINKS
165
European Union
European Commission eceuropaeu
Directorate-General for Economic and Financial Affairs
eceuropaeueconomy_financeindex_enhtm
Eurostat eppeurostateceuropaeu
European Council consiliumeuropaeu
European Parliament wwweuroparleuropaeu
Economics and Finance Ministries
Belgium wwwtreasuryfgovbeinterthes Ministegravere des Finances - Ministerie van Financen
Bulgaria wwwminfinbg Ministry of Finance
Croatia wwwmfinhr Ministry of Finance
Czech Republic wwwmfcrcz Ministry of Finance
Denmark wwwfmdk Ministry of Finance
Germany wwwbundesfinanzministeriumde Bundesministerium der Finanzen
Estonia wwwfinee Ministry of Finance
Ireland wwwirlgoviefinance Department of Finance
Greece wwwmnecgren Ministry of Economy and Finance
Spain wwwminecoes Ministerio de Economiacutea y Hacienda
France wwwfinancesgouvfr Ministegravere Eacuteconomie Finances et lIndustrie
Italy wwwtesoroit Ministero dellrsquoEconomia e delle Finanze
Cyprus wwwmofgovcy Ministry of Finance
Latvia wwwfmgovlv Ministry of Finance
Lithuania wwwfinminlt Ministry of Finance
European Commission Public finances in EMU - 2013
166
Luxembourg wwwetatluFI Ministegravere des Finances
Hungary wwwp-mhu Ministry of Finance
Malta financegovmt Ministry of Finance and Economic Affairs
Netherlands wwwminfinnl Ministerie van Financien
Austria wwwbmfgvat Bundesministerium fuumlr Finanzen
Poland wwwmofnetgovpl Ministry of Finance
Portugal wwwmin-financaspt Ministeacuterio das Financcedilas
Romania wwwmfinantero Ministry of Finance
Slovenia wwwgovsimf Ministry of Finance
Slovak Republic wwwfinancegovsk Ministry of Finance
Finland wwwvnfivm Ministry of Finance
Sweden finansregeringense Finansdepartementet
United Kingdom wwwhm-treasurygovuk Her Majestys Treasury
EU fiscal surveillance framework
Stability and Growth Pact
httpeceuropaeueconomy_financeeconomic_governancesgpindex_enhtm
Excessive deficit procedure
httpeceuropaeueconomy_financeeconomic_governancesgpcorrective_armindex_enhtm
Stability and convergence programmes
httpeceuropaeueconomy_financeeconomic_governancesgpconvergenceindex_enhtm
Sustainability of public finances
httpeceuropaeueconomy_financearticleseu_economic_situationarticle15994_enhtm
EUROPEAN ECONOMY INSTITUTIONAL SERIES
European Economy Institutional series can be accessed and downloaded free of charge from the following address httpeceuropaeueconomy_financepublicationseeipindex_enhtm Titles published before July 2015 can be accessed and downloaded free of charge from bull httpeceuropaeueconomy_financepublicationseuropean_economyindex_enhtm
(the main reports eg Economic Forecasts) bull httpeceuropaeueconomy_financepublicationsoccasional_paperindex_enhtm
(the Occasional Papers) bull httpeceuropaeueconomy_financepublicationsqr_euro_areaindex_enhtm
(the Quarterly Reports on the Euro Area)
Alternatively hard copies may be ordered via the ldquoPrint-on-demandrdquo service offered by the EU Bookshop httpbookshopeuropaeu
HOW TO OBTAIN EU PUBLICATIONS Free publications bull one copy
via EU Bookshop (httpbookshopeuropaeu) bull more than one copy or postersmaps
- from the European Unionrsquos representations (httpeceuropaeurepresent_enhtm) - from the delegations in non-EU countries (httpeeaseuropaeudelegationsindex_enhtm) - by contacting the Europe Direct service (httpeuropaeueuropedirectindex_enhtm) or calling 00 800 6 7 8 9 10 11 (freephone number from anywhere in the EU) () () The information given is free as are most calls (though some operators phone boxes or hotels may charge you)
Priced publications bull via EU Bookshop (httpbookshopeuropaeu)
KC-BC-15-014-EN-N
- NEW_IP_index_enpdf
-
- EUROPEAN EconomY institutional SERIES
-