report on punctuality drivers at major european airports - eurocontrol
TRANSCRIPT

Report commissionedby the Performance Review Commission
Report on Punctuality Driversat Major European Airports
Prepared by the Performance Review Unit - May 2005

BACKGROUND
This Report has been commissioned by the Performance Review Commission (PRC) and prepared by the Performance Review Unit.
The PRC was established in 1998 by the Commission of EUROCONTROL, in accordance with the ECAC Institutional Strategy (1997).
One objective in this Strategy is "to introduce strong, transparent and independent performance review and target setting to faci-litate more effective management of the European ATM system, encourage mutual accountability for system performance andprovide a better basis for investment analyses and, with reference to existing practice, provide guidelines to States on economicregulation to assist them in carrying out their responsibilities."
The PRC’s website address is http://www.eurocontrol.int/prc
NOTICE
The Performance Review Unit (PRU) has made every effort to ensure that the information and analysis contained in this documentare as accurate and complete as possible. Should you find any errors or inconsistencies we would be grateful if you could pleasebring them to the PRU’s attention.
The PRU’s e-mail address is [email protected]
© Cover photo ©Werner Hennies/FMG
DOCUMENT IDENTIFICATION SHEET
DOCUMENT DESCRIPTION Document Title
Punctuality drivers at major European airports
DOCUMENT REFERENCE: EDITION: EDITION DATE:
PRC Final Report May 2005 ABSTRACT
This report analyses the drivers of punctuality at major European airports. It addresses the following areas:
• Air traffic scheduling and air traffic management processes; • Measuring air transport operational performance; • Drivers of variabiliy before push back (pre-departure delays); • Drivers of variability after push-back; and, • Possible action areas to reducing variability of flight operations.
Keywords
EUROCONTROL Performance Review Commission - punctuality drivers - ATFM delays - drivers of air transport variability - air traffic scheduling - declared airport capacity - service quality at airports - sustainability of arrival capacity during bad weather - measuring operational air transport performance
CONTACT: Performance Review Unit, EUROCONTROL, 96 Rue de la Fusée, B-1130 Brussels, Belgium.
Tel: +32 2 729 3956, e-mail: [email protected] - http://www.eurocontrol.int/prc
DOCUMENT INFORMATION TYPE STATUS DISTRIBUTION
Performance Review Report Draft General Public Report commissioned by the PRC Proposed Issue EUROCONTROL Organisation PRU Technical Note Released Issue Restricted


TABLE OF CONTENTS
1. INTRODUCTION ............................................................................................................................ 1 1.1. Objectives and scope of the report ..................................................................................... 1 1.2. Data sources and working methods.................................................................................... 2 1.3. Definitions ........................................................................................................................... 3 1.4. Organisation of the report ................................................................................................... 3 1.5. Acknowledgements............................................................................................................. 4
2. AIR TRAFFIC SCHEDULING AND ATM PROCESSES ......................................................................... 5 2.1. The role of the airport community (airport, local ATC, airlines) .......................................... 6
2.1.1. Finding the “right” airport scheduling capacity to meet air traffic demand...................... 6 2.1.2. Sustainability of airport arrival capacity during bad weather .......................................... 9
2.1.2.1. Vulnerability of airport operations to strong winds/thunderstorms....................... 10 2.1.2.2. Vulnerability of airport operations to reduced visibility......................................... 11 2.1.2.3. Quality of MET products and integration of MET information.............................. 11
2.2. The role of the airline scheduling departments................................................................. 12 2.3. The ATM en-route community’s role in preparing/managing en-route capacity............... 14 2.4. Day of operations: The role of ATM units in managing the arrival sequence................... 15
2.4.1. En route sequencing..................................................................................................... 15 2.4.2. Circular airborne holdings to stock arrival demand ...................................................... 16 2.4.3. Combined use of circular and linear holdings to stock and sequence arrival demand 16 2.4.4. Separations on final approach and traffic bunching ..................................................... 17 2.4.5. Use of ATFM airport regulations to protect the airport short term capacity.................. 17
3. MEASURING AIR TRANSPORT OPERATIONAL PERFORMANCE........................................................ 19 3.1. Air transport punctuality .................................................................................................... 19 3.2. Punctuality as a measure of service quality in air transport ............................................. 20 3.3. High level framework for the analysis of air transport operational performance .............. 21 3.4. Origin of variability of flight phases ................................................................................... 23 3.5. Punctuality at major European airports............................................................................. 24
4. DRIVERS OF VARIABILITY BEFORE PUSH-BACK (PRE-DEPARTURE DELAYS) ................................. 27 4.1. ATFM regulations and delays ........................................................................................... 27
4.1.1. Inbound traffic affected by en-route and airport ATFM delays ..................................... 27 4.1.2. Airport ATFM delays caused by the analysed airports................................................. 28
4.1.2.1. Decision making process when managing arrival flows at airports ..................... 29 4.1.2.2. Causes of ATFM regulations ............................................................................... 31 4.1.2.3. Excessive use of ATFM regulations .................................................................... 32 4.1.2.4. Accuracy and cancellation of ATFM regulations.................................................. 35 4.1.2.5. Performance of ATFM regulations and quality assurance................................... 36
4.2. Airline, airport and other causes ....................................................................................... 36 4.3. Reactionary delays ........................................................................................................... 37
5. DRIVERS OF VARIABILITY AFTER PUSH BACK............................................................................... 39 5.1. Variability of flight operations: taxi times........................................................................... 39 5.2. Variability of flight operations: airborne times ................................................................... 40
5.2.1. Variations in en-route transit times ............................................................................... 40 5.2.2. Variations in en-terminal transit times .......................................................................... 40
6. CONCLUSIONS ........................................................................................................................... 43 7. POSSIBLE ACTION AREAS FOR IMPROVING AIR TRANSPORT PUNCTUALITY...................................... 45
7.1. Network issues.................................................................................................................. 46 7.1.1. Establish a better understanding of “network effects” .................................................. 46 7.1.2. Post event analysis of ATFM performance .................................................................. 46 7.1.3. Introduction of a “serve by schedule” bias.................................................................... 46 7.1.4. En-route sequencing..................................................................................................... 47
7.2. Local airport community issues......................................................................................... 47 7.2.1. Airport capacity declaration and slot allocation ............................................................ 47 7.2.2. Collaborative Decision Making Programmes ............................................................... 48 7.2.3. Improved sustainability of airport arrival capacity during bad weather......................... 48 7.2.4. Controlling arrival flows into airports............................................................................. 48
8. GLOSSARY ................................................................................................................................ 49 9. REFERENCES ............................................................................................................................ 52

LIST OF TABLES
Table 2-1: Service quality criteria used for capacity declaration.......................................................... 8 Table 2-2: Standard minima radar separation on approach/same runway (miles) ............................ 11 Table 3-1: IFR movements and aircraft mix ....................................................................................... 24
LIST OF FIGURES
Figure I: Arrival capacity reductions due to bad weather in 2004 ........................................................ II Figure II: Distribution of block times ..................................................................................................... II Figure III: High level conceptual framework for the analysis of air transport performance................. III Figure IV: Variability of flight phases................................................................................................... IV Figure V: Imbalance between demand and capacity .......................................................................... IV Figure VI: Arrival airport ATFM delays by cause of delay................................................................... IV Figure VII: ATFM arrival regulations due to ATC/Aerodrome at Milan-Malpensa................................V Figure 1-1: Overview of the data available for analysis ....................................................................... 2 Figure 1-2: Methodology used for the analysis of variability ................................................................ 3 Figure 2-1: Air traffic scheduling and ATM planning processes in Europe .......................................... 5 Figure 2-2: Reacting to stochastic perturbations.................................................................................. 6 Figure 2-3: Relationship between scheduled runway capacity and delays ......................................... 8 Figure 2-4: Airport scheduling and reduced capacity during bad weather........................................... 9 Figure 2-5: Arrival capacity reductions due to bad weather in 2004.................................................. 10 Figure 2-6: Variability of operations, distribution of block times and targeted punctuality ................. 12 Figure 2-7: Block times and pre-departure delays ............................................................................. 13 Figure 2-8: Distribution of block times................................................................................................ 13 Figure 2-9: Circular holdings at London Heathrow airport ................................................................. 16 Figure 2-10: Linear and circular holdings at Frankfurt airport ............................................................ 17 Figure 3-1: Evolution of air transport punctuality and underlying drivers........................................... 19 Figure 3-2: Punctuality and air transport operations .......................................................................... 20 Figure 3-3: High-level conceptual framework for the analysis of air transport performance.............. 21 Figure 3-4: Variability of flight phases (eCoda) .................................................................................. 23 Figure 3-5: Variability of flight phases by month (eCoda) .................................................................. 24 Figure 3-6: Arrival and departure punctuality ..................................................................................... 25 Figure 3-7: Mutual influence of departure and arrival punctuality ...................................................... 26 Figure 4-1: ATFM delays affecting inbound traffic into the analysed airports.................................... 28 Figure 4-2: Evolution of traffic and arrival airport ATFM delays (2003-04) ........................................ 29 Figure 4-3: Imbalance between demand and capacity ...................................................................... 30 Figure 4-4: Selecting the most appropriate tools to balance capacity and demand .......................... 30 Figure 4-5: Arrival airport ATFM delays by cause of delay (2002-04) ............................................... 31 Figure 4-6: Breakdown of arrival ATFM regulated days in 2003 and 2004 ....................................... 32 Figure 4-7: Distribution of airport ATFM arrival delay durations in 2004 ........................................... 33 Figure 4-8: ATC/Aerodrome capacity related airport regulations at Frankfurt ................................... 34 Figure 4-9: ATC/Aerodrome capacity related airport regulations at Milan Malpensa ........................ 34 Figure 4-10: The impact of cancelled ATFM regulations on departing flights.................................... 35 Figure 4-11: Cancelled airport ATFM arrival regulations ................................................................... 35 Figure 4-12: Processes affecting air transport operations before departure ..................................... 37 Figure 4-13: Distribution of departure delay by time of day .............................................................. 38 Figure 5-1: Standard deviation of taxi times at the 11 airports (2004) ............................................... 39 Figure 5-2: Holding time into London Heathrow (September 2004) .................................................. 41 Figure 7-1: Action areas for improving air transport punctuality ........................................................ 45 Figure 7-2: Rule of ATFM priority ....................................................................................................... 47

- I -
EXECUTIVE SUMMARY Punctuality drivers at major European airports
INTRODUCTION
Air transport punctuality1 in Europe is one of the major concerns for the industry and a constant source of complaints from the passengers. Not only are unpunctual flights a major inconvenience for the passengers, especially when connections are missed, but they also induce large “tactical2” and “strategic3” costs for airlines and the airline community as a whole. Hence, reducing air transport delays to the minimum is of major importance for passengers, airlines and airports. Air transport punctuality is the “result” of a complex interrelated system, which requires detailed study for a better understanding of the underlying performance drivers, the costs involved, as well as the data needed to analyse and evaluate them. The aim of this report, which has been commissioned by the EUROCONTROL Performance Review Commission (PRC), is to improve the understanding of the various drivers affecting air transport punctuality, with a particular focus on ATM related issues. The report measures punctuality at eleven major European airports and identifies related performance drivers. The eleven airports are: Amsterdam Schiphol, Barcelona, Paris Charles de Gaulle, Rome Fiumicino, Frankfurt, London Heathrow, Madrid, Munich, Milan Malpensa, Vienna and Zurich. The report was prepared and validated in interaction with the 11 airport communities, i.e. airport authorities, airlines and ATM at those airports. In addition, the report’s preliminary findings and conclusions were discussed at a workshop held in open 1 Air transport punctuality is usually defined as the
proportion of flights delayed by more than 15 min. compared to published departure and arrival times (off-block/on-block vs. scheduled times) .
2 “Tactical costs of delay” are related to disruptions in airline and airport operations of the day. This is for example the costs for additional fuel burn.
3 “Strategic costs of delay” are costs associated with time “buffers” which are often included in airline schedules to maintain a good punctuality record.
forum on 20 April 2005, at which there was a representative cross sample of interested parties. The Performance Review Unit gratefully acknowledges the contributions received from everyone concerned. The underlying analysis was made possible by the recent availability of punctuality data from EUROCONTROL’s Central Office for Delay Analysis (CODA), covering now more than 50% of scheduled flights and by linking this data with CFMU data.
AIR TRAFFIC SCHEDULING AND AIR TRAFFIC PLANNING PROCESSES
The scheduling of air transport operations is the result of three inter-related processes: ► Airport scheduling: (Airport capacity
declaration and slot allocation) ; ► Airline scheduling; and, ► ATM en-route capacity planning. Each of these independently managed processes takes place in different phases up to the day of operations and has its own logic and aims. The airport scheduling process matches airline demand and airport capacity at strategic level. At coordinated airports, airport capacity is often insufficient to fulfil airline demand during peak hours. Therefore, airport capacity is declared and airport slots are then allocated to airlines according to rules laid out in EC Regulation 95/1993, amended by EC Regulation 793/2004. Declared airport scheduling capacity is one of the most important parameters of an airport. Many different infrastructural, political and environmental factors affect an airport’s declared capacity. However, arguably one of the most critical factors is runway capacity. There is high value in finding the “right” runway capacity and thus in maximising the use of scarce capacity at congested airports. Where runway scheduling capacity is understated, high value is lost. Where runway scheduling capacity is overstated,

- II -
EXECUTIVE SUMMARY Punctuality drivers at major European airports
excess of demand will inevitably cause local delays which may introduce variability and disruption in the air transport network. Consequently, the declared runway capacity is a trade-off between maximisation of runway utilisation under local weather conditions and the level of delays considered as locally acceptable. This trade-off is agreed between the airport operator, the airlines and the local ATC There is a clear relationship between declared runway capacity and the level of delays. Fixing airline demand, airport capacity and quality of service (i.e. average delay, punctuality) at coordinated European airports appears to be not only important for local airport operations but also for overall performance of the European air transport network. Delays resulting from local decisions may propagate throughout the European network, creating reactionary delays and introducing variability in daily operations at other airports. Individual airlines and airports are not in a position to anticipate the overall network implications of their scheduling decisions. The impact of different scheduling approaches on the European air transport network is not known at this stage and should be further analysed. Of particular relevance is the sustainability of arrival capacity during bad weather. As there is generally a significant capacity gap between good and bad weather capacity, aircraft operators may experience long delays and/or cancellations. Figure I shows significant differences in the magnitude of arrival capacity reductions during bad weather at the analysed airports.
0
10
20
30
40
50
60
70
80
Am
ster
dam
(AM
S)
Par
is (C
DG
)
Mun
ich
(MU
C)
Rom
e (F
CO
)
Lond
on(L
HR
)
Vie
nna
(VIE
)*
Fran
kfur
t(F
RA
)
Mila
n (M
XP)
Mad
rid(M
AD)
Zuric
h (Z
RH
)
Bar
celo
na(B
CN
)
Declared peak hour arrival capacityWeighted average arrival capacity when weather regulated (2004)Minimum arrival capacity when weather regulated (2004)
Data source: EUROCONTROL, ANSPs and Airport Authorities
Hou
rly a
rriva
l cap
acity
* value not used for airport slot calculation
Figure I: Arrival capacity reductions due to
bad weather in 2004
The main drivers of reduced weather capacity can be grouped into three categories: ► Vulnerability of airport operations to strong
winds/thunderstorms; ► Vulnerability of airport operations to
reduced visibility (runway layout, equipment, processes/ policies); and,
► MET forecast quality and integration of MET information in the ATFM/ATC decision making process.
Airline schedules are usually based on previously flown block times and company punctuality targets. It appears that airline schedules generally do not consider pre-departure delays. Pre-departure delays however introduce a significant shift in the distribution of arrival times, as shown in Figure II (red: block to block with pre-departure delays, blue: without).
Distribution of block times with and without pre-departure delays (AMS-LHR)
050
100150200250300350400450500
<50
58-5
9
68-6
9
78-7
9
88-8
9
98-9
9
108-
109
118-
119
128-
129
138-
139
148-
150
Minutes
Num
ber o
f flig
hts
in 2
004
Distribution of actual block times
Distribution of actual block times + pre-departure delays Figure II: Distribution of block times
ATM en-route capacity planning starts several months before the actual day of operation. Although it is linked with airport and airline scheduling, it is presently independent of it.
- III -
EXECUTIVE SUMMARY Punctuality drivers at major European airports
MEASURING AIR TRANSPORT
OPERATIONAL PERFORMANCE
The generally accepted performance indicator for the operational performance of airlines and airport is “punctuality”. Air transport punctuality is usually defined as the proportion of flights delayed by more than 15 minutes compared to airline scheduled departure and arrival times. In this study, early arrivals (i.e. more than 15 minutes ahead of schedule) are also examined as this can be a problem as well for air transport operations. There are many factors contributing to the punctuality of a flight, on which aircraft operators or airports have limited or no influence. In reality, air transport punctuality is the “end product” of a complex interrelated system, involving many different stakeholders of the aviation community. Due to the high degree of public interest, it is in an airline’s best competitive interest to operate flights within the commonly accepted 15-minute punctuality window of its published schedule times. To achieve an acceptable level of punctuality, airlines often include “strategic” time buffers in their schedules in order to account for a predictable level of delay. From an analytical point of view, this adjustment of schedules to compensate for expected congestion and/or flight operation variability makes air transport punctuality only of limited use for the measurement of operational air transport performance. Punctuality is a valid indicator from a passenger viewpoint. However, punctuality alone is not, of itself, a sufficient indicator to assess individual airport or ATC performance. Instead, this report focuses on the variability of operations when analysing operational air transport performance.
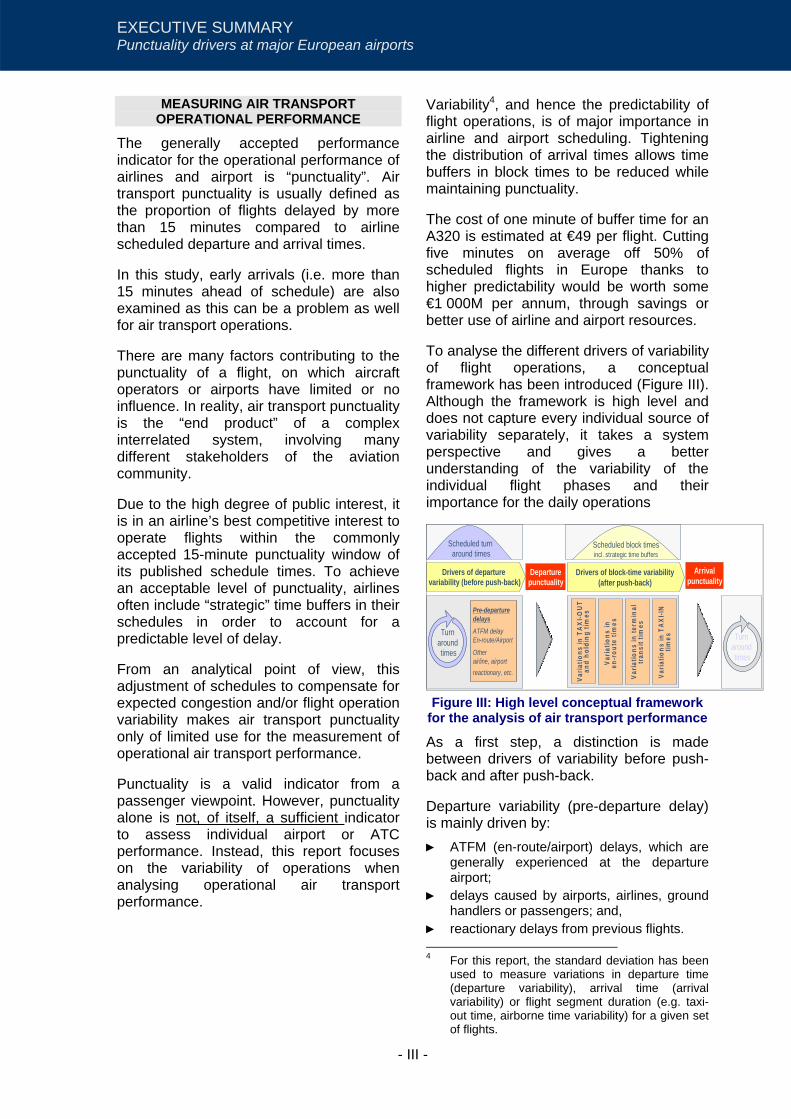
Variability4, and hence the predictability of flight operations, is of major importance in airline and airport scheduling. Tightening the distribution of arrival times allows time buffers in block times to be reduced while maintaining punctuality. The cost of one minute of buffer time for an A320 is estimated at €49 per flight. Cutting five minutes on average off 50% of scheduled flights in Europe thanks to higher predictability would be worth some €1 000M per annum, through savings or better use of airline and airport resources. To analyse the different drivers of variability of flight operations, a conceptual framework has been introduced (Figure III). Although the framework is high level and does not capture every individual source of variability separately, it takes a system perspective and gives a better understanding of the variability of the individual flight phases and their importance for the daily operations
Turn aroundtimes
Varia
tions
in T
AX
I-OU
Tan
d ho
ldin
gtim
es
Varia
tions
in
en-r
oute
times
Varia
tions
in T
AX
I-IN
tim
es
Departurepunctuality
Varia
tions
in te
rmin
altr
ansi
ttim
es
Pre-departuredelaysATFM delayEn-route/Airport
Otherairline, airportreactionary, etc.
Scheduled block timesincl. strategic time buffers
Arrivalpunctuality
Drivers of departurevariability (before push-back)
Drivers of block-time variability(after push-back)
Turn aroundtimes
Scheduled turn around times
Figure III: High level conceptual framework
for the analysis of air transport performance
As a first step, a distinction is made between drivers of variability before push-back and after push-back. Departure variability (pre-departure delay) is mainly driven by: ► ATFM (en-route/airport) delays, which are
generally experienced at the departure airport;
► delays caused by airports, airlines, ground handlers or passengers; and,
► reactionary delays from previous flights. 4 For this report, the standard deviation has been
used to measure variations in departure time (departure variability), arrival time (arrival variability) or flight segment duration (e.g. taxi-out time, airborne time variability) for a given set of flights.
- IV -
EXECUTIVE SUMMARY Punctuality drivers at major European airports
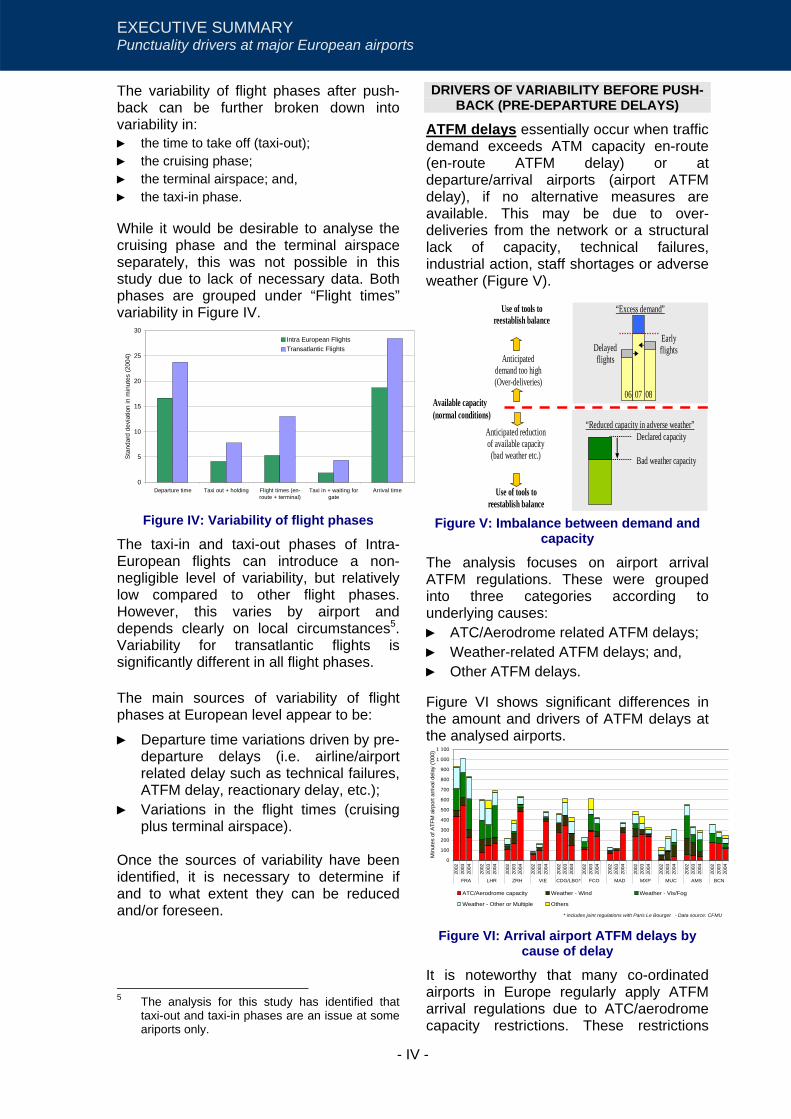
The variability of flight phases after push-back can be further broken down into variability in: ► the time to take off (taxi-out); ► the cruising phase; ► the terminal airspace; and, ► the taxi-in phase. While it would be desirable to analyse the cruising phase and the terminal airspace separately, this was not possible in this study due to lack of necessary data. Both phases are grouped under “Flight times” variability in Figure IV.
0
5
10
15
20
25
30
Departure time Taxi out + holding Flight times (en-route + terminal)
Taxi in + waiting forgate
Arrival time
Sta
ndar
d de
viat
ion
in m
inut
es (2
004)
Intra European FlightsTransatlantic Flights
Figure IV: Variability of flight phases
The taxi-in and taxi-out phases of Intra-European flights can introduce a non-negligible level of variability, but relatively low compared to other flight phases. However, this varies by airport and depends clearly on local circumstances5. Variability for transatlantic flights is significantly different in all flight phases.
The main sources of variability of flight phases at European level appear to be:
► Departure time variations driven by pre-departure delays (i.e. airline/airport related delay such as technical failures, ATFM delay, reactionary delay, etc.);
► Variations in the flight times (cruising plus terminal airspace).
Once the sources of variability have been identified, it is necessary to determine if and to what extent they can be reduced and/or foreseen.
5 The analysis for this study has identified that
taxi-out and taxi-in phases are an issue at some ariports only.
DRIVERS OF VARIABILITY BEFORE PUSH-BACK (PRE-DEPARTURE DELAYS)
ATFM delays essentially occur when traffic demand exceeds ATM capacity en-route (en-route ATFM delay) or at departure/arrival airports (airport ATFM delay), if no alternative measures are available. This may be due to over-deliveries from the network or a structural lack of capacity, technical failures, industrial action, staff shortages or adverse weather (Figure V).
Anticipated demand too high (Over-deliveries)
Anticipated reduction of available capacity
(bad weather etc.)
“Excess demand”
Delayed flights
Early flights
06 07 08
Use of tools to reestablish balance
Use of tools to reestablish balance
Available capacity (normal conditions)
“Reduced capacity in adverse weather” Declared capacity
Bad weather capacity
Figure V: Imbalance between demand and
capacity
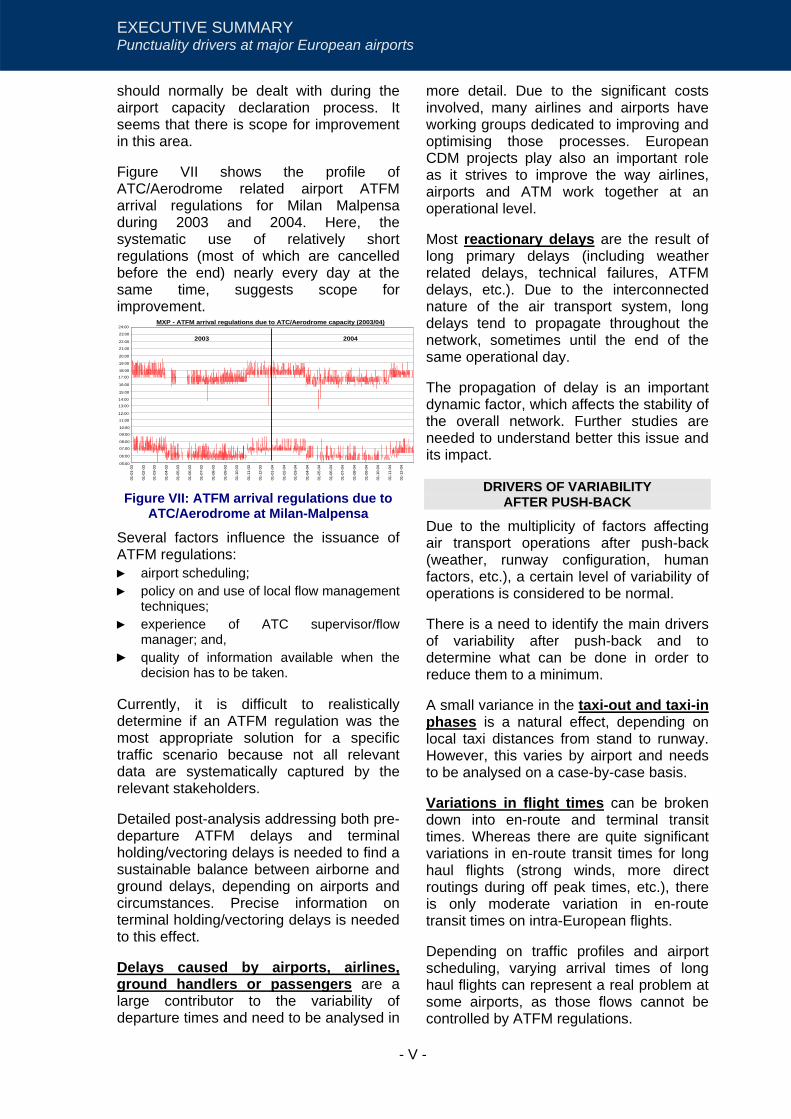
The analysis focuses on airport arrival ATFM regulations. These were grouped into three categories according to underlying causes: ► ATC/Aerodrome related ATFM delays; ► Weather-related ATFM delays; and, ► Other ATFM delays. Figure VI shows significant differences in the amount and drivers of ATFM delays at the analysed airports.
0
100
200
300
400
500
600
700
800
900
1 000
1 100
2002
2003
2004
2002
2003
2004
2002
2003
2004
2002
2003
2004
2002
2003
2004
2002
2003
2004
2002
2003
2004
2002
2003
2004
2002
2003
2004
2002
2003
2004
2002
2003
2004
FRA LHR ZRH VIE CDG/LBG* FCO MAD MXP MUC AMS BCN
Min
utes
of A
TFM
airp
ort a
rriva
l del
ay ('
000)
ATC/Aerodrome capacity Weather - Wind Weather - Vis/Fog
Weather - Other or Multiple Others
* includes joint regulations with Paris Le Bourget - Data source: CFMU Figure VI: Arrival airport ATFM delays by
cause of delay
It is noteworthy that many co-ordinated airports in Europe regularly apply ATFM arrival regulations due to ATC/aerodrome capacity restrictions. These restrictions
- V -
EXECUTIVE SUMMARY Punctuality drivers at major European airports
should normally be dealt with during the airport capacity declaration process. It seems that there is scope for improvement in this area. Figure VII shows the profile of ATC/Aerodrome related airport ATFM arrival regulations for Milan Malpensa during 2003 and 2004. Here, the systematic use of relatively short regulations (most of which are cancelled before the end) nearly every day at the same time, suggests scope for improvement.
300
360
420
480
540
600
660
720
780
840
900
960
1020
1080
1140
1200
1260
1320
1380
1440
01-0
1-03
01-0
2-03
01-0
3-03
01-0
4-03
01-0
5-03
01-0
6-03
01-0
7-03
01-0
8-03
01-0
9-03
01-1
0-03
01-1
1-03
01-1
2-03
01-0
1-04
01-0
2-04
01-0
3-04
01-0
4-04
01-0
5-04
01-0
6-04
01-0
7-04
01-0
8-04
01-0
9-04
01-1
0-04
01-1
1-04
01-1
2-04
05:00
06:00
07:00
08:00
09:00
10:00
11:00
12:00
13:00
14:00
15:00
16:00
17:00
18:00
19:00
20:00
21:00
22:00
23:00
24:00MXP - ATFM arrival regulations due to ATC/Aerodrome capacity (2003/04)
2003 2004
Figure VII: ATFM arrival regulations due to
ATC/Aerodrome at Milan-Malpensa
Several factors influence the issuance of ATFM regulations: ► airport scheduling; ► policy on and use of local flow management
techniques; ► experience of ATC supervisor/flow
manager; and, ► quality of information available when the
decision has to be taken. Currently, it is difficult to realistically determine if an ATFM regulation was the most appropriate solution for a specific traffic scenario because not all relevant data are systematically captured by the relevant stakeholders. Detailed post-analysis addressing both pre-departure ATFM delays and terminal holding/vectoring delays is needed to find a sustainable balance between airborne and ground delays, depending on airports and circumstances. Precise information on terminal holding/vectoring delays is needed to this effect. Delays caused by airports, airlines, ground handlers or passengers are a large contributor to the variability of departure times and need to be analysed in
more detail. Due to the significant costs involved, many airlines and airports have working groups dedicated to improving and optimising those processes. European CDM projects play also an important role as it strives to improve the way airlines, airports and ATM work together at an operational level. Most reactionary delays are the result of long primary delays (including weather related delays, technical failures, ATFM delays, etc.). Due to the interconnected nature of the air transport system, long delays tend to propagate throughout the network, sometimes until the end of the same operational day. The propagation of delay is an important dynamic factor, which affects the stability of the overall network. Further studies are needed to understand better this issue and its impact.
DRIVERS OF VARIABILITY AFTER PUSH-BACK
Due to the multiplicity of factors affecting air transport operations after push-back (weather, runway configuration, human factors, etc.), a certain level of variability of operations is considered to be normal. There is a need to identify the main drivers of variability after push-back and to determine what can be done in order to reduce them to a minimum. A small variance in the taxi-out and taxi-in phases is a natural effect, depending on local taxi distances from stand to runway. However, this varies by airport and needs to be analysed on a case-by-case basis. Variations in flight times can be broken down into en-route and terminal transit times. Whereas there are quite significant variations in en-route transit times for long haul flights (strong winds, more direct routings during off peak times, etc.), there is only moderate variation in en-route transit times on intra-European flights. Depending on traffic profiles and airport scheduling, varying arrival times of long haul flights can represent a real problem at some airports, as those flows cannot be controlled by ATFM regulations.

- VI -
EXECUTIVE SUMMARY Punctuality drivers at major European airports
Airborne terminal holdings appear to vary significantly among airports. It was not possible to analyse this in depth, however, as the requisite data are only published for London airports.
CONCLUSIONS
This report is a first attempt to establish a link between air transport, airport and Air Traffic Management (ATM) performance. It identifies and measures an initial set of air transport punctuality drivers at major European airports, seen from an ATM perspective. This report was prepared and validated in interaction with the airport communities concerned, i.e. airport authorities, airlines and ATM at those airports. This interaction proved to be very fruitful and hopefully results in high added value for everyone. In addition, the report’s preliminary findings and conclusions were discussed at a workshop held in open forum on 20 April 2005, at which there was a representative cross-sample of interested parties. The Performance Review Unit gratefully acknowledges the very valuable contributions from all those involved. Beyond measuring punctuality and understanding underlying delay causes, the variability of flight operations emerged as an important issue towards improving air transport performance. A reduction of variability directly translates into improved punctuality and/or reduced costs to meet the same punctuality target. The PRC’s eighth Performance Review Report (PRR 8) states that compressing half of flight schedules by five minutes would be worth some € 1000 million per annum. The report measures the “variability of flight operations” globally, per airport and in the different phases of flight. It attempts to trace the variability in arrival delays to variability in departure time, “time-to-take-off” (taxi-out), flight time and taxi-in. It identifies the following as significant drivers of “variability of flight operations”: ► Airport and airline scheduling processes; ► the management of bad weather at
European airports;
► flow management strategies into airports. Observed cases of daily ATFM airport arrival regulations to address predictable excess demand at airports are a signal of airport scheduling issues and/or inadequate use of ATFM regulations. ATFM/ airport quality control should monitor this issue on an ongoing basis, with visibility for all concerned stakeholders.
► Management of long haul flights bound for Europe.
The study also gives some clues as to the propagation of delays from flight to flight, and hence as to ways to improve reactionary delays.
POSSIBLE ACTION AREAS FOR IMPROVING AIR TRANSPORT
PUNCTUALITY
The report raises many issues, which should be further explored with a view to improving air transport punctuality in Europe. During the workshop on 20 April, it became clear that further action is needed at local level by the individual airport communities. Action is also needed at European level by the EUROCONTROL Organisation and possibly by the European Commission. The need for a cultural change to a more proactive, transparent, no-blame management of air transport operations was highlighted during the workshop. Airlines, airports and the ATC and ATFM community need to move from an “insular perspective” to a more general focus on overall air transport performance. At local level, this means that the entire airport community should work more closely together in order to develop a common understanding of objectives, which includes mutually agreed and clearly defined measurable targets. Data access and quality are the key to developing a comprehensive performance measurement framework. The CFMU and CODA data provide essential information for progress in analysing air transport performance at European and at airport level. Reporting into CODA should be further improved for a comprehensive coverage of scheduled flights and delay causes, possibly under EC rules, and to

- VII -
EXECUTIVE SUMMARY Punctuality drivers at major European airports
enable analysis from a network perspective to be conducted. Building on this report, key drivers of air transport performance need to be further analysed. Comparable indicators need to be developed at local and network level for continuous performance monitoring. Broadly, the areas of action can be grouped according to their origin (local airport community/ network) and their nature (strategic/tactical). Network issues ► Establish a better understanding of
“network effects”: Despite the large share of reactionary delay, there is currently only a limited knowledge on how individual airline (scheduling of block and turn around times) or airport strategies (airport scheduling, use of ATFM regulations, demand capacity ratios) affect the air transport network.
► Post event analysis of ATFM performance: Consideration should be given by the CFMU to extending its procedures for the management of critical events (e.g. bad weather) and post-event analysis of ATFM performance, with involvement of all concerned parties. A first important step would be a compulsory recording of actual demand when an ATFM regulation is issued.
► Introduction of a “serve by schedule” bias: In order to reduce variations against schedule, it would be interesting to explore to what extent a modification of the rule of ATFM priority could help improving overall punctuality whilst reducing the amount of reactionary delay, provided that safety is maintained
► En-route sequencing: More continuous and accurate delivery of arrival flows from the network has the potential to improve flight efficiency and environmental friendliness in terminal areas and would offer the possibility to better use airport capacity and, as a consequence, to compress airline schedules thanks to reduced variability of operations.
Local airport community issues ► Airport capacity declaration and slot
allocation: There is a need to evaluate capacity declaration processes and airport schedules at some airports, learning from experience elsewhere (e.g. de-peaking during certain times of the day). The level of visibility may need to be improved.
► Collaborative Decision Making: CDM should be further promoted and applied for arrival, turn-around and departure phase.
► Improved sustainability of airport arrival capacity during bad weather: airport communities should strive to minimise the gap between declared peak arrival capacity and actual experienced arrival capacity due to bad weather. The feasibility and economic viability of MLS and time based sequencing tools should be further explored and results should be shared with all interested parties.
► Controlling arrival flows into airports: There is a need for data and performance indicators concerning delays in the TMA, to assess the balance between ATFM departure delays and TMA holding.

- VIII -

- 1 -
INTRODUCTION Punctuality drivers at major European airports
1. INTRODUCTION Air transport punctuality6 in Europe is a major concern for the industry and a frequent source of complaints from passengers. Not only are unpunctual flights a major inconvenience for passengers – especially when connections are missed - they also induce large “tactical7” and “strategic8” costs for airlines and the airline community as a whole [see also Ref.i]. Hence, reducing air transport delays to the minimum is of major importance for passengers, airlines and airports. Air transport punctuality is the result of a very complex system, which requires detailed study for a better understanding of the underlying performance drivers, the costs involved, as well as the data needed to analyse and evaluate them. The target audience of this report is aviation professionals who have responsibility for air traffic management, ATM capacity, airline and airport operations, planning.
1.1. Objectives and scope of the report The aim of this report is to improve the understanding of the various drivers affecting air transport punctuality with a particular focus on ATM related issues. It also formulates recommendations for future work. It represents a first attempt to establish a link between air transport, airport and air traffic management performance. The report was prepared by the Performance Review Unit (PRU)9 at the request of the Performance Review Commission (PRC) of EUROCONTROL. It was validated in interaction with the airport communities (airlines, airport, ATM), which proved to be very fruitful. An initial review of ATFM delay at eight major European airports was included in the PRC’s Seventh Performance Review Report (PRR 7) [Ref.ii]. This report deepens the analysis and extends it to eleven airports: Amsterdam Schiphol, Barcelona, Paris Charles de Gaulle, Rome Fiumicino, Frankfurt, London Heathrow, Madrid, Munich, Milan Malpensa, Vienna and Zurich. These airports generated the highest ATFM delays in 2003. All of these airports are coordinated. According to EC Regulation 95/1993 [Ref iii] , amended by EC Regulation 793/2004 [Ref. iv], the term “coordinated airport” means any airport where, in order to land or take-off, it is necessary for an air carrier or any other aircraft operator to have been allocated a slot by a coordinator, with the exception of State flights, emergency landings and humanitarian flights. For each of these 11 airports, data for 2003 and 2004 have been collected and processed. PRR 8 [Ref.v] contains the key findings of this present report. This report is voluntarily limited to reviewing punctuality within existing airport capacity. It is beyond the scope of this report to look at the requirement to expand airport capacity, e.g. through new infrastructure such as additional runways or terminals.
6 Air transport punctuality is usually defined as the proportion of flights delayed by more than 15 minutes
compared to published departure and arrival times (off-block / on-block versus scheduled times) . 7 “Tactical costs of delay” are related to disruptions in airline and airport operations of the day. This is for
example the costs for additional fuel burn. 8 “Strategic costs of delay” are costs associated with time “buffers” which are often included in airline
schedules to maintain a good punctuality record. 9 The Performance Review Unit’s Terms of reference require it to “propose, monitor and report on ATM-
related performance parameters which could include compliance with ATM procedures, airlines slot wastage (e.g. multiple flight planning); airlines ATM delay inducement (e.g. near simultaneous flight scheduling for same route(s)); airports (e.g. inadequacy of airside facilities); and other related factors” (PRU ToR, 2b).
- 2 -
INTRODUCTION Punctuality drivers at major European airports
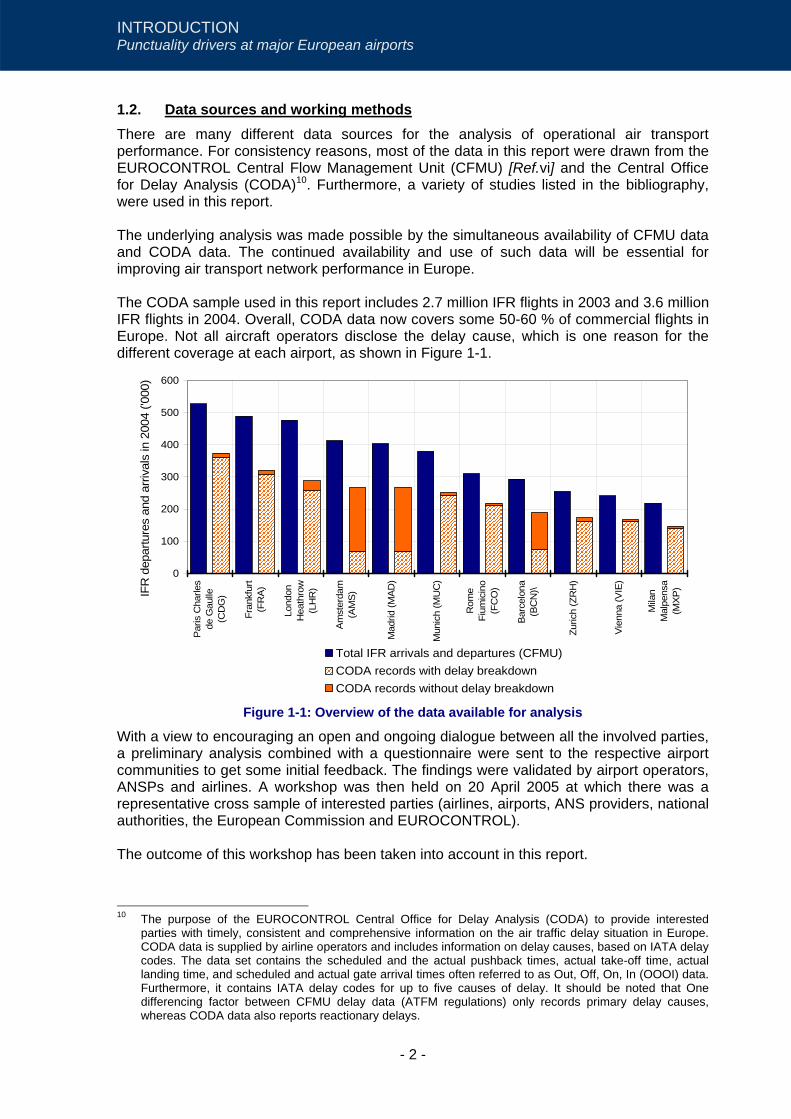
1.2. Data sources and working methods There are many different data sources for the analysis of operational air transport performance. For consistency reasons, most of the data in this report were drawn from the EUROCONTROL Central Flow Management Unit (CFMU) [Ref.vi] and the Central Office for Delay Analysis (CODA)10. Furthermore, a variety of studies listed in the bibliography, were used in this report. The underlying analysis was made possible by the simultaneous availability of CFMU data and CODA data. The continued availability and use of such data will be essential for improving air transport network performance in Europe. The CODA sample used in this report includes 2.7 million IFR flights in 2003 and 3.6 million IFR flights in 2004. Overall, CODA data now covers some 50-60 % of commercial flights in Europe. Not all aircraft operators disclose the delay cause, which is one reason for the different coverage at each airport, as shown in Figure 1-1.
0
100
200
300
400
500
600
Par
is C
harle
sde
Gau
lle(C
DG
)
Fran
kfur
t(F
RA
)
Lond
onH
eath
row
(LH
R)
Am
ster
dam
(AM
S)
Mad
rid (M
AD)
Mun
ich
(MU
C)
Rom
eFi
umic
ino
(FC
O)
Bar
celo
na(B
CN
)\
Zuric
h (Z
RH
)
Vien
na (V
IE)
Mila
nM
alpe
nsa
(MXP
)IFR
dep
artu
res
and
arriv
als
in 2
004
('000
)
Total IFR arrivals and departures (CFMU)CODA records with delay breakdownCODA records without delay breakdown
Figure 1-1: Overview of the data available for analysis
With a view to encouraging an open and ongoing dialogue between all the involved parties, a preliminary analysis combined with a questionnaire were sent to the respective airport communities to get some initial feedback. The findings were validated by airport operators, ANSPs and airlines. A workshop was then held on 20 April 2005 at which there was a representative cross sample of interested parties (airlines, airports, ANS providers, national authorities, the European Commission and EUROCONTROL). The outcome of this workshop has been taken into account in this report.
10 The purpose of the EUROCONTROL Central Office for Delay Analysis (CODA) to provide interested
parties with timely, consistent and comprehensive information on the air traffic delay situation in Europe. CODA data is supplied by airline operators and includes information on delay causes, based on IATA delay codes. The data set contains the scheduled and the actual pushback times, actual take-off time, actual landing time, and scheduled and actual gate arrival times often referred to as Out, Off, On, In (OOOI) data. Furthermore, it contains IATA delay codes for up to five causes of delay. It should be noted that One differencing factor between CFMU delay data (ATFM regulations) only records primary delay causes, whereas CODA data also reports reactionary delays.

- 3 -
INTRODUCTION Punctuality drivers at major European airports
1.3. Definitions Flight leg: All occurrences of a scheduled flight (e.g. AF 3451) on a given origin-destination (e.g. Brussels to Lyon).
Variability of flight operations: Variability and predictability of flight operations are closely linked and essential factors in airport and airline scheduling. The wider the spread of arrival times, the more difficult it is to predict the duration of a given flight leg during the scheduling phase. For this report, the standard deviation11 has been used to measure variations in departure time (departure variability), arrival time (arrival variability) or flight segment duration (e.g. taxi-out time, airborne time variability) for a given set of flights. Mean and standard deviation were computed for the whole flight sample and for individual flight legs (see Figure 1-2). The variability of flight times12 for a given flight leg is called the intra-flight variability. Intra-flight variability is the relevant parameter from a scheduling point of view and is therefore used for analyses of variability of flight operations in this report.
CODADatabase
Applied filters for data analysis:Dep/Arr PCT: between -90 and 360 min.Taxin out/in: between 1 and 90 min.Flighttime: >15 min.
Overall variability of flight phases
(Mean of individual intra-flight variabilities)
Intra-flight variability(aggregation per sub-group/ month)
Applied aggregation criteria:Identical operator, Sched. DEP & ARR time
Origin & destination airports> than 20 services per month
Figure 1-2: Methodology used for the analysis of variability
1.4. Organisation of the report The report is organised as follows:
• Chapter 2 describes processes and issues involved in air transport operations. It also shows the capacity issues at the 11 airports.
• Chapter 3 discusses the use and suitability of punctuality as performance indicators for air transport operations and introduces a high-level framework for the analysis of operational performance. The chapter the analyses the variability of flight phases before looking at the arrival and departure punctuality at the 11 major European airports.
• Chapter 4 analyses the drivers of operational variability before push back (pre-departure delays) in more detail.
11 A statistic used as a measure of the dispersion or variation in a distribution, equal to the square root of the
arithmetic mean of the squares of the deviations from the arithmetic mean. 12 Sub-groups were calculated on a monthly basis. Only flights with the same parameters (operator,
scheduled departure/arrival time, origin/destination) and with a frequency of 20 or more flight per month were included in the calculation.

- 4 -
INTRODUCTION Punctuality drivers at major European airports
• Chapter 5 examines the drivers of operational variability after push-back. • Chapter 6 summarises the main conclusions. • Chapter 7 discusses possible areas for future work in order to reduce the variability
of air transport operations, with a particular focus on ATM related issues.
1.5. Acknowledgements In undertaking this study, the Performance Review Unit has been assisted by a large number of people in the aviation industry, including airports, airlines, organisations and others. The PRU would like to thank everybody who contributed to this report for their invaluable co-operation.
- 5 -
AIR TRAFFIC SCHEDULING AND ATM PROCESSES Punctuality drivers at major European airports
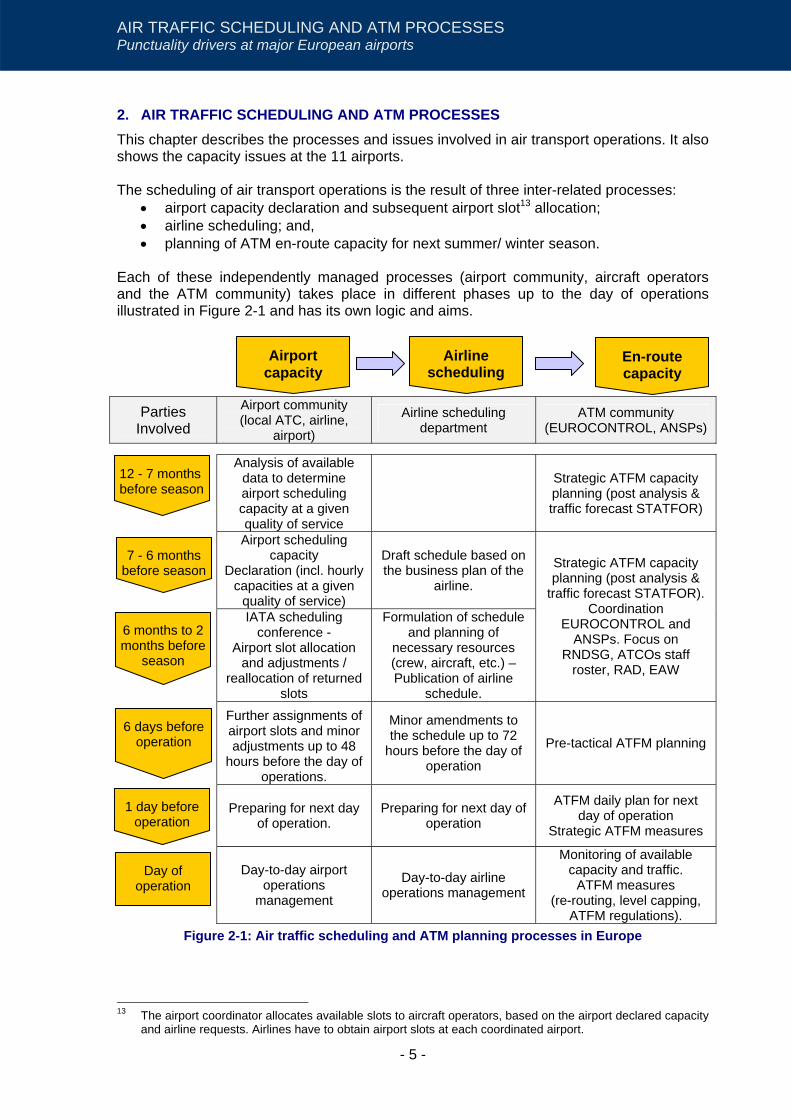
2. AIR TRAFFIC SCHEDULING AND ATM PROCESSES This chapter describes the processes and issues involved in air transport operations. It also shows the capacity issues at the 11 airports. The scheduling of air transport operations is the result of three inter-related processes:
• airport capacity declaration and subsequent airport slot13 allocation; • airline scheduling; and, • planning of ATM en-route capacity for next summer/ winter season.
Each of these independently managed processes (airport community, aircraft operators and the ATM community) takes place in different phases up to the day of operations illustrated in Figure 2-1 and has its own logic and aims.
Parties Involved
Airport community (local ATC, airline,
airport)
Airline scheduling department
ATM community (EUROCONTROL, ANSPs)
Analysis of available data to determine airport scheduling capacity at a given quality of service
Strategic ATFM capacity planning (post analysis & traffic forecast STATFOR)
Airport scheduling capacity
Declaration (incl. hourly capacities at a given
quality of service)
Draft schedule based on the business plan of the
airline.
IATA scheduling conference -
Airport slot allocation and adjustments /
reallocation of returned slots
Formulation of schedule and planning of
necessary resources (crew, aircraft, etc.) – Publication of airline
schedule.
Strategic ATFM capacity planning (post analysis &
traffic forecast STATFOR). Coordination
EUROCONTROL and ANSPs. Focus on
RNDSG, ATCOs staff roster, RAD, EAW
Further assignments of airport slots and minor adjustments up to 48
hours before the day of operations.
Minor amendments to the schedule up to 72
hours before the day of operation
Pre-tactical ATFM planning
Preparing for next day of operation.
Preparing for next day of operation
ATFM daily plan for next day of operation
Strategic ATFM measures
Day-to-day airport operations
management
Day-to-day airline operations management
Monitoring of available capacity and traffic.
ATFM measures (re-routing, level capping,
ATFM regulations). Figure 2-1: Air traffic scheduling and ATM planning processes in Europe
13 The airport coordinator allocates available slots to aircraft operators, based on the airport declared capacity
and airline requests. Airlines have to obtain airport slots at each coordinated airport.
Airline scheduling
Airport capacity
En-route capacity
12 - 7 months before season
6 days before operation
1 day before operation
Day of operation
7 - 6 months before season
6 months to 2 months before
season
- 6 -
AIR TRAFFIC SCHEDULING AND ATM PROCESSES Punctuality drivers at major European airports
All actors share the interest to maintain safe, orderly and sustainable operations and to improve overall network performance. However, individual interests may be competing for the same resources: airport slots, airspace, ATC capacity. These conflicting requirements have to be resolved by airport co-ordinators, airline conferences and ATFCM processes.
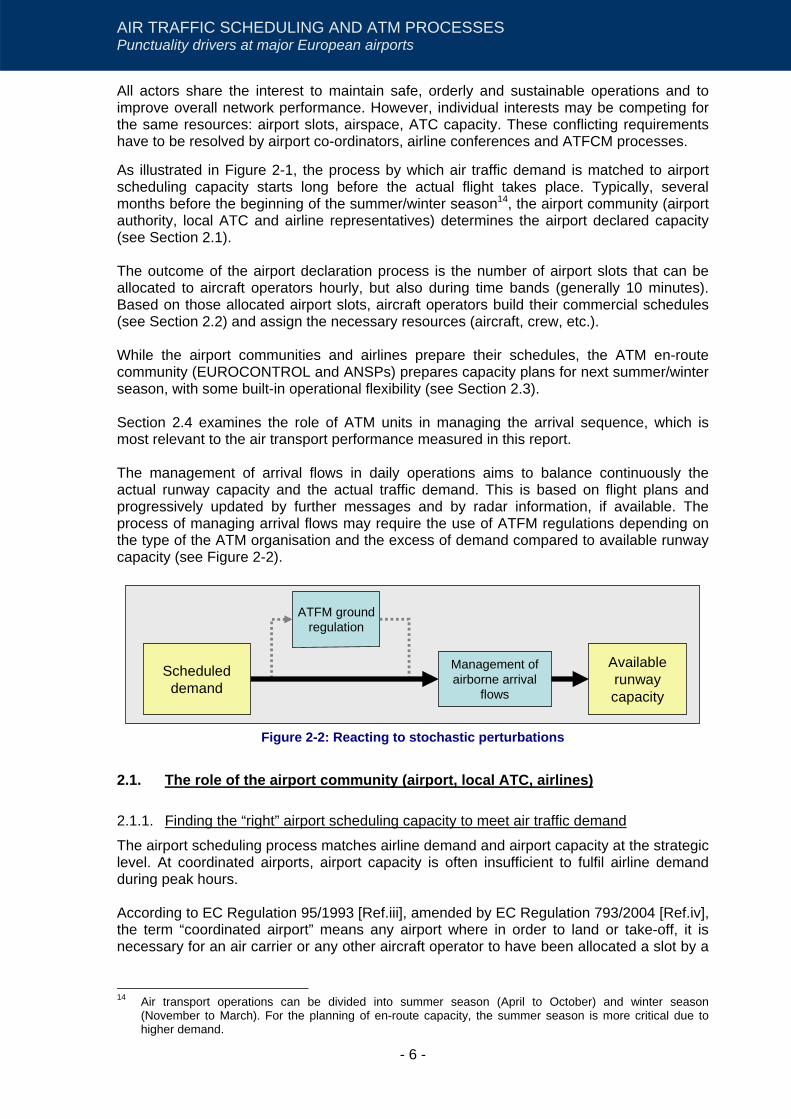
As illustrated in Figure 2-1, the process by which air traffic demand is matched to airport scheduling capacity starts long before the actual flight takes place. Typically, several months before the beginning of the summer/winter season14, the airport community (airport authority, local ATC and airline representatives) determines the airport declared capacity (see Section 2.1). The outcome of the airport declaration process is the number of airport slots that can be allocated to aircraft operators hourly, but also during time bands (generally 10 minutes). Based on those allocated airport slots, aircraft operators build their commercial schedules (see Section 2.2) and assign the necessary resources (aircraft, crew, etc.). While the airport communities and airlines prepare their schedules, the ATM en-route community (EUROCONTROL and ANSPs) prepares capacity plans for next summer/winter season, with some built-in operational flexibility (see Section 2.3). Section 2.4 examines the role of ATM units in managing the arrival sequence, which is most relevant to the air transport performance measured in this report. The management of arrival flows in daily operations aims to balance continuously the actual runway capacity and the actual traffic demand. This is based on flight plans and progressively updated by further messages and by radar information, if available. The process of managing arrival flows may require the use of ATFM regulations depending on the type of the ATM organisation and the excess of demand compared to available runway capacity (see Figure 2-2).
ATFM ground
regulation
Management of airborne arrival
flows
Available runway capacity
Scheduled demand
Figure 2-2: Reacting to stochastic perturbations
2.1. The role of the airport community (airport, local ATC, airlines)
2.1.1. Finding the “right” airport scheduling capacity to meet air traffic demand
The airport scheduling process matches airline demand and airport capacity at the strategic level. At coordinated airports, airport capacity is often insufficient to fulfil airline demand during peak hours. According to EC Regulation 95/1993 [Ref.iii], amended by EC Regulation 793/2004 [Ref.iv], the term “coordinated airport” means any airport where in order to land or take-off, it is necessary for an air carrier or any other aircraft operator to have been allocated a slot by a
14 Air transport operations can be divided into summer season (April to October) and winter season
(November to March). For the planning of en-route capacity, the summer season is more critical due to higher demand.
- 7 -
AIR TRAFFIC SCHEDULING AND ATM PROCESSES Punctuality drivers at major European airports
coordinator, with the exception of State flights, emergency landings and humanitarian flights. Airport scheduling at a coordinated airport is based on two distinct but interrelated local processes. In the first step, the airport authority declares its airport scheduling capacity and in a second step the airport slot coordinator allocates airport slots15 to airlines, according to rules laid out in EC Regulation 95/1993, amended by EC Regulation 793/2004. These EC rules have endorsed the IATA Worldwide Scheduling Guidelines [Ref.vii] and take into account the principles of transparency, neutrality and non-discrimination. The local ATC capacity (including the arrival runway throughput) should be taken into account when determining the declared airport capacity and subsequently the airport slots allocated to aircraft operators. The airport capacity declaration process is generally based on analysis involving a large amount of data. Essentially, the declared capacity of coordinated airports tries to maximise the use of available airport capacity whilst keeping delays at locally acceptable levels. The capacity declaration process requires an objective analysis of scenarios to accommodate the air traffic demand, taking into account all the issues that may restrict airport capacity. Without any doubt, declared airport scheduling capacity is one of the most important parameters of an airport. There are different methods to determine airport declared capacity but all approaches usually consider the following parameters:
• runway capacity under different meteorological conditions; • terminal ATC capacity; • apron/taxiways; • traffic mix (wake vortex categories of aircraft); • passenger terminals/gates; • environmental and/or political restrictions (i.e. cap of annual movements); and, • service quality parameters (average delay, punctuality).
One of the most critical factors of airport capacity is the runway capacity (arrival capacity in particular). There is high value in finding the “right” runway capacity and thus in maximising the use of scarce capacity at congested airports. Where runway scheduling capacity is understated, high value is lost16 [for further reading see Ref. viii]. Where runway scheduling capacity is overstated, excess of demand will inevitably cause local delays which may introduce variability and disruption in the air transport network. It is a trade-off between maximisation of runway utilisation under local weather conditions (the quantity of airport slots) and the level of delays considered as locally acceptable (i.e. the quality of airport slots). This trade-off is agreed between the airport operator, the airlines and the local ATC (see Figure 2-3, right side).
15 The term “airport slot” refers to the permission given by a coordinator in accordance with EC Regulation
793/2004 to use the full range of airport infrastructure necessary to operate an air service at a coordinated airport on a specific date and time for the purpose of landing or take-off as allocated by a coordinator.
16 One hourly airport slot is worth several million Euro per annum at a main European hub.

- 8 -
AIR TRAFFIC SCHEDULING AND ATM PROCESSES Punctuality drivers at major European airports
Delay criteriaTheoretical runway capacity
Influencing factors: • Airport layout• Runway configuration• Runway occupancy• Weather• Scheduling and traffic mix• Separation minima• Wake vortex separation• Airspace and ATC procedures• Environmental constraints
Averagedelay
10min
2min
Scheduling rate (mvts/ hr)
Declared AirportRunway Capacity
Number of AirportSlots
Quality of AirportSlots
Figure 2-3: Relationship between scheduled runway capacity and delays
According to the queuing theory, airport throughput is maximised when there is a sufficient number of aircraft ready to land during peak times. This implies that a certain level of delay is unavoidable if runway throughput is to be maximised. There is a clear relationship between declared runway capacity and the level of delays (see Figure 2-3, centre). As the volume of the traffic increases, delays remain relatively low until a certain point is reached at which delays increase disproportionately [for further reading see Ref. ix]. An airport’s scheduled arrival capacity is usually declared at a given level of service quality (see Table 2-1). At some airports, the service quality criterion is punctuality. At others, it is the average arrival delay or the average holding time. There are currently no consistent criteria to give aircraft operators an indication of the “quality” of the allocated airport slot, neither is it possible to compare airport slot quality across airports.
Airport Service quality criteria Weather considerations Comment
AMS average arrival delay Normal day 4 minutes average delay from entry of AMS FIR to landing, based on peak arrival periods during 3 months in the summer. Taxi times are excluded.
BCN punctuality (>15 min.) Scheduled arrival compared to on block time FRA punctuality (>15 min.) IATA scheduled arrival compared to on block time
LHR average arrival delay Normal day 10 min. average target based on 6 “normal days” – holding stack to threshold (taxi time not incl.)
MAD punctuality (>15 min.) Scheduled arrival compared to on block time
MXP zero delays17 In accordance with CFMU parameters. No monitoring of airborne and taxi delays.
MUC average arrival delay/ punctuality (>15 min.)
Difference between actual and estimated time of arrival (ETA). The ETA is calculated by adding a Standard Approach Time. Furthermore, punctuality is monitored by airlines and airport.
CDG average arrival delay 6 min. average target <2004 >
FCO zero delays18 In accordance with CFMU parameters. No monitoring of airborne and taxi delays.
VIE punctuality Flight plan ETA vs. actual time of arrival ZRH punctuality (>15 min.) Scheduled arrival compared to on block time
Table 2-1: Service quality criteria used for capacity declaration
Airports also use different time bands as part of the airport slot allocation process18. The wider the time band, the more likely is “bunching” of schedules, especially at the beginning of each hour.The impact of this practice on punctuality has yet to be analysed in detail (see also 2.2).
17 See Aeronautical Information Publication (AIP) 18 For example one airport might use 10 minute intervals whereas the next airport uses 30 minute intervals for
the allocation of airport slots.

- 9 -
AIR TRAFFIC SCHEDULING AND ATM PROCESSES Punctuality drivers at major European airports
Fixing airline demand, airport capacity and quality of service (i.e. average delay, punctuality) at coordinated European airports appears to be not only important for local airport operations but also for overall performance of the European air transport network. Delays resulting from local decisions may propagate through the European network creating reactionary delays and introducing variability in daily operations at other airports. However, if such local delays are predictable, aircraft operators can take them into account in their scheduling, in which case propagation throughout the network reduces. Individual airlines and airports are not in a position to anticipate overall network implications of their scheduling decisions. The impact of different scheduling approaches on the European air transport network is not known at this stage and should be further analysed.
2.1.2. Sustainability of airport arrival capacity during bad weather
Optimum use of airport capacity has high value for airspace users and airports. In order to reduce weather-related disruptions to a minimum, airports need to focus on measures that mitigate the impact of weather. Of particular relevance is the sustainability of arrival capacity during bad weather. As there is generally a significant capacity gap between good and bad weather capacity, especially when the trade-off between bad and good weather capacity has been chosen at a high level of capacity, aircraft operators may experience long delays and/or cancellations. As already pointed out, local delays are also likely to affect other airports in the European network in the form of reactionary delays. To some extent, the capacity reduction during bad weather operations is influenced by the assumed service quality criterion (i.e. average delay of 5 or 10 minutes) that was used during the airport capacity declaration process. For example, operations at an airport which has factored-in a high average delay during the capacity declaration process are likely to be affected more severely during adverse weather than operations at an airport which has factored-in a moderate average delay.
Figure 2-4: Airport scheduling and reduced capacity during bad weather
However, the capacity reduction during bad weather is clearly more significantly influenced by the preparedness of the airport for bad weather (equipment and processes in place) and by the given airport layout and relevant usage (i.e. independent or dependent parallel runways, direction of runways). In order to provide an overview of the main influencing factors, the following areas are addressed in the next sections:
1. Vulnerability of airport operations to strong winds/thunderstorms; 2. Vulnerability of airport operations to reduced visibility;
o Use of dependent or independent parallel runways o Equipment: navigational aids o Processes: arrival separations applied on the same runway
3. MET forecast quality and integration of MET information in the ATFM/ATC decision-making process.
Declared capacity (10min. avg. delay)
mvts/hr
Declared capacity (5min. avg. delay)
Available capacity during bad weather
Capacity gap 1
Capacity gap 2
Duration of weather phenomenon

- 10 -
AIR TRAFFIC SCHEDULING AND ATM PROCESSES Punctuality drivers at major European airports
If weather conditions are anticipated to significantly reduce the airport capacity, ATFM airport regulations can be issued in order to limit the number of flights arriving at the airport. The challenge is to determine accurately the period of loss of capacity and to sustain the highest achievable runway arrival rates while maintaining safety at all times. Figure 2-5 examines the relation between airport declared peak hour arrival capacity and ATFM rates issued by airports when weather regulated (including all causes, i.e. strong winds, low visibility etc.). The observed capacity gap gives a first idea of the airport’s vulnerability to bad weather conditions. Figure 2-5 shows significant differences in the magnitude of arrival capacity reductions during bad weather. When affected by severe weather conditions during peak times, airports such as Amsterdam, Paris Charles de Gaulle, Munich and Rome Fiumicino are more likely to cause extensive local delays and some disruptions to the European network in form of reactionary delays than airports such as Frankfurt and London Heathrow.
0
10
20
30
40
50
60
70
80
Am
ster
dam
(AM
S)
Par
is (C
DG
)
Mun
ich
(MU
C)
Rom
e (F
CO
)
Lond
on(L
HR
)
Vie
nna
(VIE
)*
Fran
kfur
t(F
RA)
Mila
n (M
XP)
Mad
rid(M
AD
)
Zuric
h (Z
RH
)
Bar
celo
na(B
CN
)
Declared peak hour arrival capacityWeighted average arrival capacity when weather regulated (2004)Minimum arrival capacity when weather regulated (2004)
Data source: EUROCONTROL, ANSPs and Airport Authorities
Hou
rly a
rriv
al c
apac
ity
* value not used for airport slot calculation
Figure 2-5: Arrival capacity reductions due to bad weather in 200419
2.1.2.1. Vulnerability of airport operations to strong winds/thunderstorms
Airport vulnerability to strong winds is influenced by the runway layout and the wind directions typically experienced at the airport. For example, at one airport, strong winds might only lead to a marginal capacity reduction whilst at another airport the need to change from the most efficient runway configuration to a less favourable one results in a significant capacity reduction. It should be pointed out that runway selection is not only affected by surface winds but also by winds in the altitude band 1000-4000ft, as those winds can severely affect aircraft on approach. Some analysed airports consider a cross wind20 of 20 knots as the critical value which requires a change from the optimal to a sub-optimal runway configuration (Rome Fiumicino, Amsterdam). The use of a less optimal runway configuration often results in a significant reduction of airport capacity (for example Rome Fiumicino) and/or an increase in taxi times because the alternate runway is further from the terminal, as is the case at Amsterdam airport.
19 The minimum arrival capacity is the average of the 5 weather related ATFM airport arrival regulations with
the lowest arrival capacities in 2004. 20 Gusting winds were not analysed in more detail.
- 11 -
AIR TRAFFIC SCHEDULING AND ATM PROCESSES Punctuality drivers at major European airports
The critical value for tail wind varies from 5 to 10 knots depending on the airport in question. If those wind conditions are reached, the runway is changed from the optimal configuration to a less optimal configuration in order to preserve the safety of operations. Some airports (such as Rome FCO) reduce the runway capacity due to the lack of rapid exits serving the second best runway configuration, which increases the runway occupancy time during strong tail wind. Strong head winds on final approach reduce the ground speed of the aircraft and hence increase the time between landings, thus reducing the available arrival capacity. This will impact on any airport with high traffic intensity.
2.1.2.2. Vulnerability of airport operations to reduced visibility
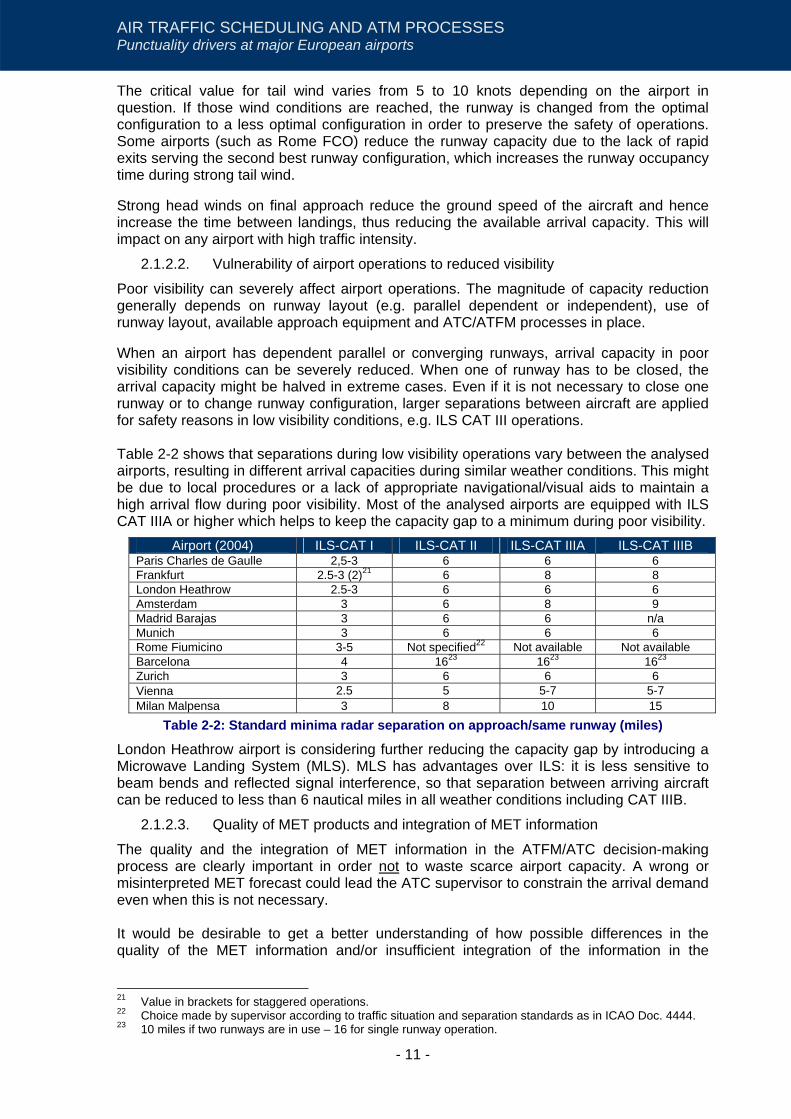
Poor visibility can severely affect airport operations. The magnitude of capacity reduction generally depends on runway layout (e.g. parallel dependent or independent), use of runway layout, available approach equipment and ATC/ATFM processes in place. When an airport has dependent parallel or converging runways, arrival capacity in poor visibility conditions can be severely reduced. When one of runway has to be closed, the arrival capacity might be halved in extreme cases. Even if it is not necessary to close one runway or to change runway configuration, larger separations between aircraft are applied for safety reasons in low visibility conditions, e.g. ILS CAT III operations. Table 2-2 shows that separations during low visibility operations vary between the analysed airports, resulting in different arrival capacities during similar weather conditions. This might be due to local procedures or a lack of appropriate navigational/visual aids to maintain a high arrival flow during poor visibility. Most of the analysed airports are equipped with ILS CAT IIIA or higher which helps to keep the capacity gap to a minimum during poor visibility.
Airport (2004) ILS-CAT I ILS-CAT II ILS-CAT IIIA ILS-CAT IIIB Paris Charles de Gaulle 2,5-3 6 6 6 Frankfurt 2.5-3 (2)21 6 8 8 London Heathrow 2.5-3 6 6 6 Amsterdam 3 6 8 9 Madrid Barajas 3 6 6 n/a Munich 3 6 6 6 Rome Fiumicino 3-5 Not specified22 Not available Not available Barcelona 4 1623 1623 1623 Zurich 3 6 6 6 Vienna 2.5 5 5-7 5-7 Milan Malpensa 3 8 10 15
Table 2-2: Standard minima radar separation on approach/same runway (miles)
London Heathrow airport is considering further reducing the capacity gap by introducing a Microwave Landing System (MLS). MLS has advantages over ILS: it is less sensitive to beam bends and reflected signal interference, so that separation between arriving aircraft can be reduced to less than 6 nautical miles in all weather conditions including CAT IIIB.
2.1.2.3. Quality of MET products and integration of MET information
The quality and the integration of MET information in the ATFM/ATC decision-making process are clearly important in order not to waste scarce airport capacity. A wrong or misinterpreted MET forecast could lead the ATC supervisor to constrain the arrival demand even when this is not necessary. It would be desirable to get a better understanding of how possible differences in the quality of the MET information and/or insufficient integration of the information in the
21 Value in brackets for staggered operations. 22 Choice made by supervisor according to traffic situation and separation standards as in ICAO Doc. 4444. 23 10 miles if two runways are in use – 16 for single runway operation.

- 12 -
AIR TRAFFIC SCHEDULING AND ATM PROCESSES Punctuality drivers at major European airports
decision-making processes affect bad weather operations at an airport. It would therefore be interesting to explore the following issues in more detail:
• What is the quality of the available MET forecast? • What are the drivers of the quality of MET products (expertise, models, technology) • Are the most suitable MET products available to decision-makers? • Are MET products efficiently used in the ATC/ATFM decision-making processes?
One proactive initiative to reduce weather impact on daily operations is the Capacity Prognosis Schiphol tool (CPS). CPS is a joint project of the AMS airport community involving LVNL (ATC), KNMI (MET-provider), KLM and the airport authority. It is the result of an initiative to establish the probability of a capacity reduction at AMS Schiphol Airport and to enable the respective parties to act and prepare accordingly. The key idea is to make optimum use of available capacity by anticipating the most likely capacity scenario, based on a tailor made weather forecast by KNMI.
2.2. The role of the airline scheduling departments As already pointed out in previous paragraphs, flights may suffer delays and yet be on time, if predictable delays (variations in block-to-block times24) are catered for through “time buffers” in flight scheduling. Extending buffers improves punctuality and hence customer satisfaction, as illustrated in Figure 2-6, but entails high additional costs [for further reading see Ref. i]. The “buffer” or “strategic delay” included in airline schedules depends on quality of service targets set by the airline. The predictability of arrival times is essential information in scheduling flights for the next season.
Median
Time
Buffer 1
Buffer 2
80% 80%
Nr. of flights
Figure 2-6: Variability of operations, distribution of block times and targeted punctuality
The calculation of the scheduled block time is usually based on the observed previously flown block times. The schedule is set by applying a percentile target to the distribution of previously flown block times. In the example in Figure 2-6, the punctuality target is set so that around 80% of flights will arrive on time at the arrival airport. The wider the distribution (and hence the higher the level of variation), the more difficult and costly it gets for airlines to meet the punctuality target, as more “strategic” buffer is required. Depending on the airline, the calculated block time is often used for the entire scheduling period, for all times of the day and for all weather conditions as observed in Figure 2-7.
24 Block time is generally referred to as the time between off-block at the departure airport and on-block at the
destination airport.

- 13 -
AIR TRAFFIC SCHEDULING AND ATM PROCESSES Punctuality drivers at major European airports
100
110
120
130
140
150
Jan Feb Mar Apr May Jun Jul Aug Sep Oct Nov Dec
min
utes
100
110
120
130
140
150
Average delay before going off block (actual versus scheduled off-block)Actual block times (average gate-to-gate)
Scheduled block times (average gate-to-gate)
Block times (actual and scheduled) and pre-departure delays on a typical Intra-European city pair
Figure 2-7: Block times and pre-departure delays
Since schedules for the new season are based on previously flown block times, Figure 2-7 suggests that some airlines may not adjust their schedules to account for pre-departure delays25, e.g. ATFM delays. In most cases, scheduled block times closely correspond to actual average block times, resulting in a worsening of punctuality when pre-departure delays occur.
Distribution of block times with and without pre-departure delays (AMS-LHR)
050
100150200250300350400450500
<50
58-5
9
68-6
9
78-7
9
88-8
9
98-9
9
108-
109
118-
119
128-
129
138-
139
148-
150
Minutes
Num
ber o
f flig
hts
in 2
004
Distribution of actual block timesDistribution of actual block times + pre-departure delays
Figure 2-8 illustrates how pre-departure delays affect actual travel times between two airports. The blue area in Figure 2-8 shows the distribution of actual flown block-to-block times26. The distribution of the total travel times including pre-departure delays is represented by the red line. As can be observed, pre-departure delays have a significant influence on the distribution of actual block-to-block times, different for each flight leg.
Distribution of block times with and without pre-departure delays (LHR-VIE)
0
50
100
150
200
250
300
<100
108-
109
118-
119
128-
129
138-
139
148-
149
158-
159
168-
169
178-
179
188-
189
198-
199
208-
209
218-
219
228-
229
238-
240
Minutes
Num
ber o
f flig
hts
in 2
004
Distribution of actual block timesDistribution of actual block times + pre-departure delays
Figure 2-8: Distribution of block times
25 Delays which occur before push back (e.g. delay due to late boarding, ATFM delay, reactionary delay) 26 Duration between off-block at departure airport and on-block at the destination airport.

- 14 -
AIR TRAFFIC SCHEDULING AND ATM PROCESSES Punctuality drivers at major European airports
Airlines take other factors into account when scheduling services, e.g. the level of competition, the type of operation (hub and spoke versus point to point), and the (network) value of payload on that route. Some computer reservation systems list flights according to scheduled travel time, which may encourage airlines to choose a shorter scheduled travel time to gain better visibility in the reservation system.
The same holds true for airport slots. Airlines might decide to schedule a specific block time for a flight due to the lack of a suitable pair of corresponding departure and arrival airport slots. This may occur when the length of time band and its characteristics differ between both airports.
2.3. The ATM en-route community’s role in preparing/managing en-route capacity Months in advance, ANSPs and EUROCONTROL plan the ATM capacity that will be made available during the next summer/winter season. This process is independent of the previously described two processes of airport and airline scheduling. Post analyses are based on previously flown flight plan data rather than on scheduled data. EUROCONTROL STATFOR statistics are used as traffic forecast data. The outcome of the airport and airline scheduling processes could be available in November and in January respectively, but they are not taken into account. The following processes are concerted actions, which are meant to ensure that enough ATM capacity will be made available during the next season:
1. The Future ATM Profile (FAP) simulations led by EUROCONTROL verify that the planned en-route capacity for each European ACC is in line with the ATFM en-route delay target of one minute. There are 2-3 iterations in order to assess the impact of additional ACC plans, should the first simulation identify capacity gaps.
2. The Route Network Development Sub-Group (RNDSG) agrees and implements route design changes for reducing ATC complexity and re-distributing the traffic in high-density areas and for improving flight efficiency where possible.
3. The Airspace Utilisation Sub-Group reviews busy weekends in order to request to the relevant military authorities timely access to weekend routes (EAW).
4. The ACCs decide on staff rostering, taking into account staff roster rules, the forecast traffic and previous ATFM en-route delays generated by combined sectors.
5. The CFMU reviews the Route Utilisation Scheme (RAD) during the strategic phase in order to better structure the traffic and/or to re-distribute it. This measure normally replaces pre-tactical or tactical ATFM measures, which are frequently used. Currently there are no practical, measurable and transparent criteria to decide when a strategic measure is better than a pre-tactical or tactical ATFM measure.
On the day preceding actual operations, the CFMU compares the planned demand with the available capacity. After having discussed minor capacity adjustments with ACCs, the CFMU issues the ATFM daily plan for the next day. This plan contains all ATFM measures, which are implemented in order to manage the network efficiently, taking into account the demand and the available ACC and, possibly, when known in advance, airport capacities. ATFM measures that can be used to manage the European network are:
1. Compulsory level capping; 2. Voluntary or compulsory re-routing; and, 3. ATFM regulations.
On the same day, the CFMU also issues an Airspace Use Plan (AUP), which provides the availability of conditional routes through temporary reserved airspace. The use of ATFM airport regulations to protect short-term airport capacity is discussed in the next paragraph.

- 15 -
AIR TRAFFIC SCHEDULING AND ATM PROCESSES Punctuality drivers at major European airports
2.4. Day of operations: The role of ATM units in managing the arrival sequence As already discussed, airport throughput is maximised when there is a sufficient number of aircraft ready to land, during peak times. This implies that a certain level of delay is unavoidable if runway throughput is to be maximised. However, as already seen, in this type of situation the service quality is likely to decrease very rapidly with the increase of the demand. Maximising the use of runway capacity typically requires an accuracy of a few seconds in delivering aircraft at the final approach fix. Saving 5/6 seconds per movement could represent 4-5 additional operations during a busy time-period, which is the most valued by passengers and airlines. Clearly, only a good organisation of the arrival flow can maximise runway throughput whilst keeping delays at a minimum. The management of arrival flows into airports is driven by a multitude of factors and developing the best strategy appears to be a network as well as a local issue. There are several important issues, which will be addressed in the following sections:
• Delivering traffic from the network to airports as close to the scheduled times as possible;
• Techniques to maintain a continuous stock of arrival traffic close to the airport; • Seamless movement from the holding areas to the final approach; • Optimisation of the traffic mix, i.e. wide bodies should be grouped in order to
minimise the time interval between landing aircraft; • Separation on final approach should be as close as possible (but not less than) the
minimum separation that can be applied in the given circumstances; and, • Use of ATFM airport regulations to protect the airport’s available capacity.
2.4.1. En route sequencing
At present, there is almost no en-route sequencing in Europe. Where it exists, it results from specific agreements between neighbouring ACCs. En-route speed control with required time of arrival (RTA) could for example reduce variations in arrival times on transatlantic flights27, provided RTA is applied well in advance. En-route sequencing is common practice in the US where it is called either Miles in Trail (MIT) or Times in Trail. Miles in Trail describes the number of miles required between two consecutive aircraft on a given traffic flow, which is in most cases defined on the basis of flights with the same arrival destination. MIT is used to organise a steady flow, as well as to provide space for additional traffic (merging or departing). MIT can also affect aircraft on the ground when an En-route Spacing Program (ESP) is activated. If an aircraft is about to take-off from an airport to join a traffic flow on which a MIT restriction is active, the aircraft needs specific clearance for take-off. The aircraft is only released by ATC when it is possible to enter into the sequenced flow. The impact of MIT on quality of service could be either airborne or taxi-out delays. The benefits for the airport arrival flow are high. Firstly, there is very limited interruption in the upstream flow so that a continuous arrival flow is ensured. Secondly, MIT is designed in a way that traffic is streamed well before arriving at the last approach ATC unit.
27 Eastbound transatlantic traffic is not affected by ATFM regulations as the departure airports are not in the
EUROCONTROL area. Some flights from dep airports outside the CFMU area may be subject to ATFM slot allocation.

- 16 -
AIR TRAFFIC SCHEDULING AND ATM PROCESSES Punctuality drivers at major European airports
2.4.2. Circular airborne holdings to stock arrival demand
In Europe, some airports use circular airborne holdings to stock traffic in order to supply the airport with continuous demand. In general, the amount of aircraft that can be stocked depends on the number of holdings and the ability of en-route ATC sectors to ensure a continuous traffic flow bound for circular holdings. Due to such airspace and ATC organisation, UK NATS are able to maintain at least 10-15 aircraft in holdings close to London Heathrow airport. Figure 2-9 shows the circular holdings at London Heathrow airport, Although circular holdings are available at all IFR airports in Europe, many airports use these holdings only where there is a sudden unavailability of runway capacity (e.g. unexpected deteriorations of weather or unpredicted excess of demand or in case of change of runway configuration). Circular holdings are always associated to given entry points in the terminal airspace. If a holding becomes too busy, it then becomes necessary to move traffic in less crowded holdings. This can easily be done if the airspace design is appropriate and when all entry points are managed by the same ACC.
Figure 2-9: Circular holdings at London Heathrow airport
Stack switching requiring real-time co-ordination between ACCs is not applied in Europe. Therefore, when there is a foreseeable risk that a given holding pattern becomes overloaded, ATFM regulations are usually imposed.
2.4.3. Combined use of circular and linear holdings to stock and sequence arrival demand
Linear stacks combined with circular holdings are useful to stack and to sequence the arrival traffic at the same time. This avoids potential wastage of capacity when directing the demand from the circular holdings to the final approach. An efficient use of linear stacks requires the use of approach sequencing tools.
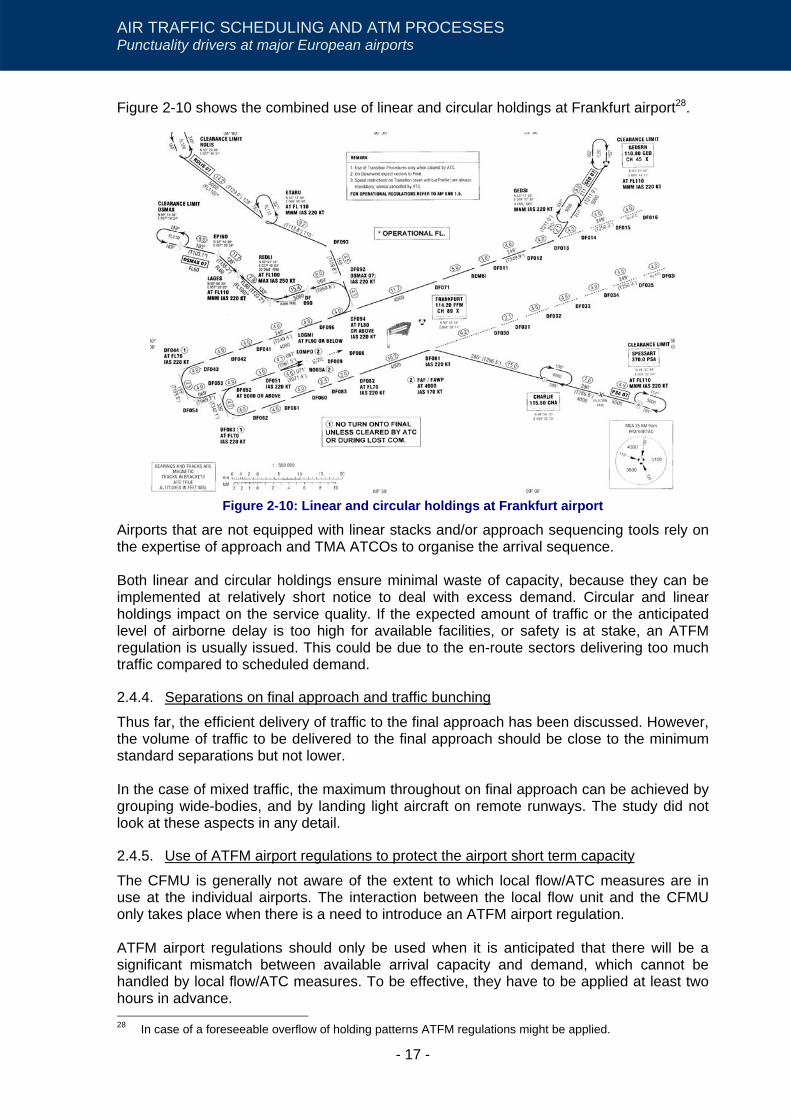
- 17 -
AIR TRAFFIC SCHEDULING AND ATM PROCESSES Punctuality drivers at major European airports
Figure 2-10 shows the combined use of linear and circular holdings at Frankfurt airport28.
Figure 2-10: Linear and circular holdings at Frankfurt airport
Airports that are not equipped with linear stacks and/or approach sequencing tools rely on the expertise of approach and TMA ATCOs to organise the arrival sequence. Both linear and circular holdings ensure minimal waste of capacity, because they can be implemented at relatively short notice to deal with excess demand. Circular and linear holdings impact on the service quality. If the expected amount of traffic or the anticipated level of airborne delay is too high for available facilities, or safety is at stake, an ATFM regulation is usually issued. This could be due to the en-route sectors delivering too much traffic compared to scheduled demand.
2.4.4. Separations on final approach and traffic bunching
Thus far, the efficient delivery of traffic to the final approach has been discussed. However, the volume of traffic to be delivered to the final approach should be close to the minimum standard separations but not lower. In the case of mixed traffic, the maximum throughout on final approach can be achieved by grouping wide-bodies, and by landing light aircraft on remote runways. The study did not look at these aspects in any detail.
2.4.5. Use of ATFM airport regulations to protect the airport short term capacity
The CFMU is generally not aware of the extent to which local flow/ATC measures are in use at the individual airports. The interaction between the local flow unit and the CFMU only takes place when there is a need to introduce an ATFM airport regulation. ATFM airport regulations should only be used when it is anticipated that there will be a significant mismatch between available arrival capacity and demand, which cannot be handled by local flow/ATC measures. To be effective, they have to be applied at least two hours in advance. 28 In case of a foreseeable overflow of holding patterns ATFM regulations might be applied.

- 18 -
AIR TRAFFIC SCHEDULING AND ATM PROCESSES Punctuality drivers at major European airports
When an ATFM airport arrival regulation is in place, aircraft are held at the departure airports, which reduces traffic demand significantly at the airport that has issued the regulation. ATFM airport regulations are not designed to ensure a continuous traffic demand to the arrival airport which is necessary to maximise airport operations.

- 19 -
MEASURING AIR TRANSPORT OPERATIONAL PERFORMANCE Punctuality drivers at major European airports
3. MEASURING AIR TRANSPORT OPERATIONAL PERFORMANCE This chapter presents the concept of “air transport punctuality” as currently used to measure performance. It discusses the suitability of “punctuality” to measure air transport performance. It then introduces a high-level framework for the analysis of operational air transport performance. The chapter also contains analysis of departure and arrival punctuality at 11 major European airports, to set the scene for more detailed analysis.
3.1. Air transport punctuality The generally accepted performance indicator for the operational performance of airlines and airports is “punctuality”. Air transport punctuality is usually defined as the proportion of flights delayed by more than 15 minutes compared to airline scheduled departure and arrival times. Since air transport punctuality is measured with respect to the airline schedule, two key values are usually measured:
• Departure punctuality: the difference between the actual off block time and the scheduled off block time; and,
• Arrival punctuality: the difference between the actual on-block time and the scheduled on block time.
In 2004, on average 23% of outbound flights (departure punctuality) and 20% of inbound flights (arrival punctuality) had a delay higher than 15 minutes compared to the schedule29. Overall, punctuality is affected by a large number of different drivers, as illustrated in Figure 3-1 below. After a continuous improvement of overall punctuality between 2000 and 2003, punctuality decreased in 2004.
0%
5%
10%
15%
20%
25%
30%
2000 2001 2002 2003 2004% o
f flig
hts
with
arr
ival
del
ay >
15
min
ReactionaryOther CausesLocal drivers at destination airportEn-route delayLocal drivers at departure airport (airlines, airport, security, etc.)
data source: AEA (->2001), eCODA
AEA eCODA
Figure 3-1: Evolution of air transport punctuality and underlying drivers
Reactionary delay30 and local drivers at departure airports (airline, airport, security, etc.) appear to be the key drivers of punctuality. The contribution of en-route delays (ATFM) could be reduced steadily between 2000 and 2004. It can also be noted that the contribution of local drivers at arrival airports increased rapidly between 2000 and 2004 to become higher than en-route delays in 2004.
29 Source: eCoda 2004 which covers approximately 50-60% of commercial air traffic in Europe. 30 Reactionary delays are caused by the late arrival of aircraft or crew from previous journeys.

- 20 -
MEASURING AIR TRANSPORT OPERATIONAL PERFORMANCE Punctuality drivers at major European airports
In almost all aviation publications, a flight is “on-time” when it is less than 15 minutes behind schedule. This report considers another dimension, namely flights arriving more than 15 minutes ahead of schedule. This can, depending on the airports concerned, be also a problem for air transport operations.
In order to explore this dimension further, the following section analyses the data in three separate groupings:
• Flights more than 15 minutes ahead of schedule; • Flights on time (-15 / +15 minutes); and, • Flights more than 15 minutes behind schedule.
3.2. Punctuality as a measure of service quality in air transport From a passenger viewpoint, safety, price and adherence to the published schedule (punctuality) are among the most important selection criteria when choosing an airline. There are many factors contributing to the punctuality of a flight, on which aircraft operators or airports have limited or no influence. In reality, air transport punctuality is the “end product” of a complex interrelated system, involving many different stakeholders of the aviation community. Due to the high degree of public interest, it is in an airline’s best competitive interest to operate flights within the commonly accepted 15-minute punctuality window of its published schedule times. To achieve an acceptable level of punctuality, airlines often include “strategic” time buffers in their schedules in order to account for a predictable level of delay. Consequently, if a flight frequently experiences delays, which has an adverse impact on the punctuality record, the airline will adjust the scheduled time for the flight to reflect this. The addition of a larger schedule “buffer” allows the airline to maintain a good on-time performance (punctuality record), even though some flights routinely encounter congestion and delays. Hence, the “scheduled” time for a flight (block-to block) is not the same as the actual amount of time that is required to make the trip in normal conditions and without any delays or congestion. There are many factors contributing to a flight’s punctuality and it is important to understand the difference between airline schedules, which form the basis for the measurement of punctuality, and actual travel times. From an analytical point of view, the adjustment of schedules to compensate for expected congestion and/or flight operation variability makes air transport punctuality only of limited use for the measurement of operational air transport performance. Punctuality targets or equivalent quality of service parameters are airline business decisions, varying among airlines. The “masking” of the true amount of flight operation variability by including strategic time buffers into schedules makes it difficult to measure accurately the effect of new processes and strategies intended to improve system performance.
Figure 3-2: Punctuality and air transport operations
Schedule
Early arrival
OUT OFF ON IN
Buffer
Late arrival
AirborneTaxi Out Taxi In
Behind schedule
Ahead of schedule
Delay
ON Time

- 21 -
MEASURING AIR TRANSPORT OPERATIONAL PERFORMANCE Punctuality drivers at major European airports
Punctuality is a valid indicator from a passenger viewpoint. However, punctuality alone is not an appropriate indicator to measure and to improve operational air transport performance. It is better to focus on the variability of operations. It is normal that flights in daily operations are subject to a certain level of variability, due to the stochastic nature of air transport (weather, technical failures, etc.) and the multiplicity of stakeholders involved (operational procedures, sequencing criteria, etc.) [for further reading see Ref. x]. Consequently, a specific flight leg is not entirely predictable. Furthermore, the late arrival of an aircraft often causes delays in the next departure of this aircraft, and sometimes delays for connecting flights. Such delays are referred to as reactionary delays. Variability, and hence the predictability of flight operations, is of major importance in airline and airport scheduling. Tightening the distribution of arrival times around an optimum value allows time buffers in block times to be reduced while maintaining punctuality. The stakes are high. The cost of one minute of buffer time for an A320 is estimated at €49 per flight. Cutting five minutes on average off 50% of schedules thanks to higher predictability would be worth some €1 000M per annum, through savings or better use of airline and airport resources.
3.3. High level framework for the analysis of air transport operational performance Although the reduction of variability of flight operations does not necessarily improve punctuality (as block times are adjusted by airlines according to their punctuality target), considerable savings could be realised because of the reduced need for strategic buffers in flight schedules. To analyse the different drivers of variability of flight operations, a conceptual framework is introduced. Although the framework is high level and does not capture every individual source of variability separately, it takes a system perspective and gives a better understanding of the variability of the individual flight phases and their importance for the daily operations (see Figure 3-3).
Turn aroundtimes
Varia
tions
in T
AXI-
OUT
and
hold
ing
times
Varia
tions
in
en-r
oute
times
Varia
tions
in T
AXI-
IN
times
Departurepunctuality
Varia
tions
in te
rmin
altra
nsit
times
Pre-departuredelaysATFM delayEn-route/Airport
Otherairline, airportreactionary, etc.
Scheduled block timesincl. strategic time buffers
Arrivalpunctuality
Drivers of departurevariability (before push-back)
Drivers of block-time variability(after push-back)
Turn aroundtimes
Scheduled turn around times
Figure 3-3: High-level conceptual framework for the analysis of air transport performance
In a first step, a distinction is made between drivers of variability before push-back (“pre-departure delays”) and variability of flight phases after push-back (after the aircraft has left the gate).

- 22 -
MEASURING AIR TRANSPORT OPERATIONAL PERFORMANCE Punctuality drivers at major European airports
Using IATA delay categories as a basis, “pre-departure delay” is further broken down in this report according to its origin:
• Pre-departure delay (airport, airline, local ATC, other primary delay, reactionary31); • Delays due to en-route ATFM regulations; and, • Delays due to ATFM regulations at the destination airport.
The study does not intend to go into a more detailed level of analysis at this stage. More sophisticated analysis based on more comprehensive data beyond the IATA delay coding would be required. Many airports and airlines already scrutinise their internal processes in order to improve their performance. European Collaborative Decision making (CDM) projects should be mentioned here, as they strive to improve the way airlines, airports and ATM work together at operational level at airports. The variability of flight phases after the flight goes “off-block” is further broken down according to the operational environment:
1. Variability in the “time to take-off”32 at the departure airport. This variability is affected by the departure terminal, runway configuration33, taxiway congestion, de-icing, runway separations, wake vortex mix, etc.
2. Variability in the cruising phase. The cruising phase is mainly affected by route availability, route selection (e.g. longer route with cheaper route charges or less ATFM delay) and strong winds (long haul).
3. Variability in the terminal airspace. This phase is affected by the trade off between maximising runway capacity and airborne delay (which has been set during the scheduling phase), actual arrival flow and the management of bad weather conditions.
4. Variability in the “taxi-in”34 phase. The taxi-in phase is mainly related to the runway configuration in use, taxiway congestion and gate availability.
While it would be desirable to analyse the cruising phase and the terminal airspace separately, it was not possible in this study to make this distinction due to the lack of necessary data. Both cruising phase and terminal airspace are included in “flight times” variability. Previous analysis however suggests that, with the exception of long-haul traffic, variations in the terminal airspace are more significant than variations in the cruising phase. Data on transit times in major terminal areas will be required for more detailed analysis with a view to performance improvement. The next section presents an initial evaluation of time variability in flight phases (departure, taxi out, airborne and arrival), in order to identify the main influencing flight phases.
31 Reactionary delays are a special case. They are the result of primary delays most likely experienced at
different airports. 32 From off-block to take-off. 33 When the wind is blowing from the East, a flight from Paris to Brest needs at least 6 minutes more in the
terminal areas than when wind is blowing from the West. 34 From landing to on-block.
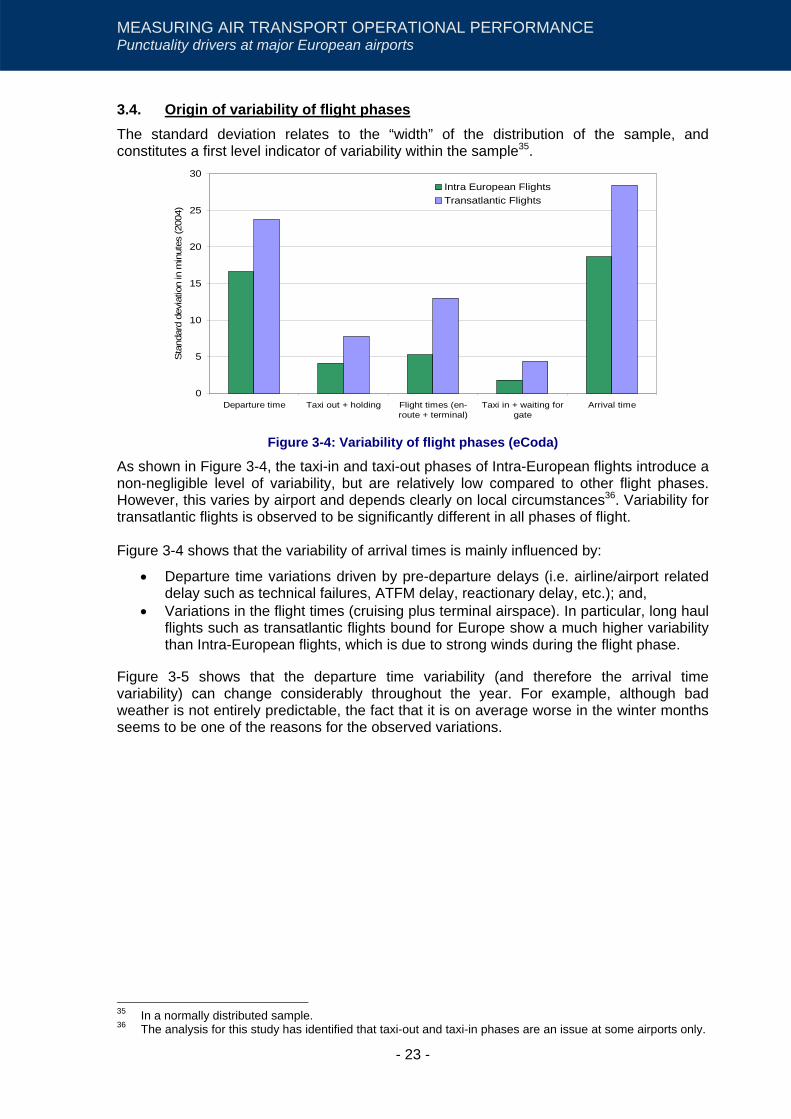
- 23 -
MEASURING AIR TRANSPORT OPERATIONAL PERFORMANCE Punctuality drivers at major European airports
3.4. Origin of variability of flight phases The standard deviation relates to the “width” of the distribution of the sample, and constitutes a first level indicator of variability within the sample35.
0
5
10
15
20
25
30
Departure time Taxi out + holding Flight times (en-route + terminal)
Taxi in + waiting forgate
Arrival time
Sta
ndar
d de
viat
ion
in m
inut
es (2
004)
Intra European FlightsTransatlantic Flights
Figure 3-4: Variability of flight phases (eCoda)
As shown in Figure 3-4, the taxi-in and taxi-out phases of Intra-European flights introduce a non-negligible level of variability, but are relatively low compared to other flight phases. However, this varies by airport and depends clearly on local circumstances36. Variability for transatlantic flights is observed to be significantly different in all phases of flight. Figure 3-4 shows that the variability of arrival times is mainly influenced by:
• Departure time variations driven by pre-departure delays (i.e. airline/airport related delay such as technical failures, ATFM delay, reactionary delay, etc.); and,
• Variations in the flight times (cruising plus terminal airspace). In particular, long haul flights such as transatlantic flights bound for Europe show a much higher variability than Intra-European flights, which is due to strong winds during the flight phase.
Figure 3-5 shows that the departure time variability (and therefore the arrival time variability) can change considerably throughout the year. For example, although bad weather is not entirely predictable, the fact that it is on average worse in the winter months seems to be one of the reasons for the observed variations.
35 In a normally distributed sample. 36 The analysis for this study has identified that taxi-out and taxi-in phases are an issue at some airports only.

- 24 -
MEASURING AIR TRANSPORT OPERATIONAL PERFORMANCE Punctuality drivers at major European airports
0
5
10
15
20
25
30
Jan
Feb
Mar
Apr
May Jun
Jul
Aug
Sep Oct
Nov
Dec Jan
Feb
Mar
Apr
May Jun
Jul
Aug
Sep Oct
Nov
Dec Jan
Feb
Mar
Apr
May Jun
Jul
Aug
Sep Oct
Nov
Dec
2002 2003 2004
Departure times Taxi inTaxi out & holding Arrival timesFlight phase (en-route & terminal)
Average monthly variability of flight phases (2002 -2004)
Sta
ndar
d de
viat
ion
(min
utes
)
Figure 3-5: Variability of flight phases by month (eCoda)
In summary, the main drivers of variability of flight operations appear to be: • departure time variability driven by pre-departure delays (local airline/airport related
issues, ATFM delay, and reactionary delay). • variations in flight times which includes the cruising phase (in particular for long-haul
flights) and variations in terminal airspace transfer times. Once the sources of variability have been identified, it is necessary to determine if and to what extent they can be reduced and/or foreseen. Variability of flight operations may be the result of causes which cannot be controlled or of causes that could be removed or at least reduced by implementing new processes and policies. The study focuses on ATM related issues. For the sake of completeness, issues such as airport or airline drivers will also be briefly touched upon. Punctuality at major European airports The following section provides an overview of operations and aircraft mix at the 11 analysed airports (see Table 3-1). It then looks at departure and arrival punctuality.
Airport Active Runways
Total IFR mvts. (2004)
Peak daily mvts. (2004) Heavy Medium Light
Amsterdam - AMS 5 412,810 1,303 18.3% 80.8% 0.9%Barcelona - BCN 2 293,025 963 1.6% 96.2% 2.2%Paris/Charles-De-Gaulle - CDG 4 526,471 1,666 20.4% 79.5% 0.1%Rome/Fiumicino - FCO 4 310,086 990 7.9% 92.1% 0.0%Frankfurt - FRA 3 488,823 1,475 27.3% 72.2% 0.5%London/Heathrow - LHR 2 476,100 1,378 32.8% 67.1% 0.1%Madrid/Barajas - MAD 3 403,171 1,305 10.0% 89.8% 0.2%Munich - MUC 2 379,625 1,267 6.6% 91.9% 1.5%Milan/Malpensa - MXP 2 218,399 750 13.2% 86.0% 0.7%Vienna - VIE 2 241,151 845 4.8% 92.0% 3.2%Zurich - ZRH 3 254,995 815 8.8% 87.0% 4.2%
Table 3-1: IFR movements and aircraft mix

- 25 -
MEASURING AIR TRANSPORT OPERATIONAL PERFORMANCE Punctuality drivers at major European airports
Airport infrastructure and traffic mix affect punctuality at airports. A comparatively higher share of heavy traffic (wake vortex category) is observed at London Heathrow and Frankfurt, which corresponds to higher intercontinental traffic. Intercontinental traffic causes variations in airport capacity (higher wake vortex separations) and generates higher variability. While almost no flights depart early (Figure 3-6 right side), a considerable number of flights arrive more than 15 minutes ahead of schedule (yellow bars, Figure 3-6 left side). Early arrivals appear to be an issue at some airports. Early arrivals can put additional pressure on airport, airline, ATC and handler resources: the local ATC has to cope with an unexpected demand profile, gates are occupied longer than planned, and additional resources are needed to cope with unforeseen workload (e.g. baggage handling). More importantly, a combination of late arrivals in the preceding period and of early arrivals in the following period can lead to excess demand in a particular period, as illustrated in Figure 4-3.
28%
22%
22%
21%
21%
21%
18%
18%
18%
17%
16% 28
%
24%
26%
19% 23%
24%
25%
20%
20% 26
%
18%
63%
70%
70%
71%
70%
73%
74%
75%
70%
67% 76
%
72%
76%
73%
81% 77%
76%
74%
80%
80% 74
%
82%
8%
16%12
%7%8%6%
10%8%8%8%9%
0%
10%
20%
30%
40%
50%
60%
70%
80%
90%
100%
LH
R
VIE
ZR
H
FRA
MA
D
FCO
CD
G
BC
N
MX
P
AM
S
MU
C
LH
R
VIE
ZR
H
FRA
MA
D
FCO
CD
G
BC
N
MX
P
AM
S
MU
C
% o
f flig
hts (
2004
)
Flights more than 15 min. ahead of scheduleFlights within -/+15 min. of scheduleFlights more than 15 min. behind schedule
Arrival Punctuality (all inbound flights) Dep. Punctuality (all outbound flights)
Data source: EUROCONTROL/ eCODA Figure 3-6: Arrival and departure punctuality
Figure 3-6 raises some interesting questions:
1. What is a good level of punctuality? 2. What resources and processes are needed to maintain a good level of punctuality? 3. If the variability of operations is reduced, will the punctuality improve or will the
block times get adjusted while maintaining a similar level of punctuality?
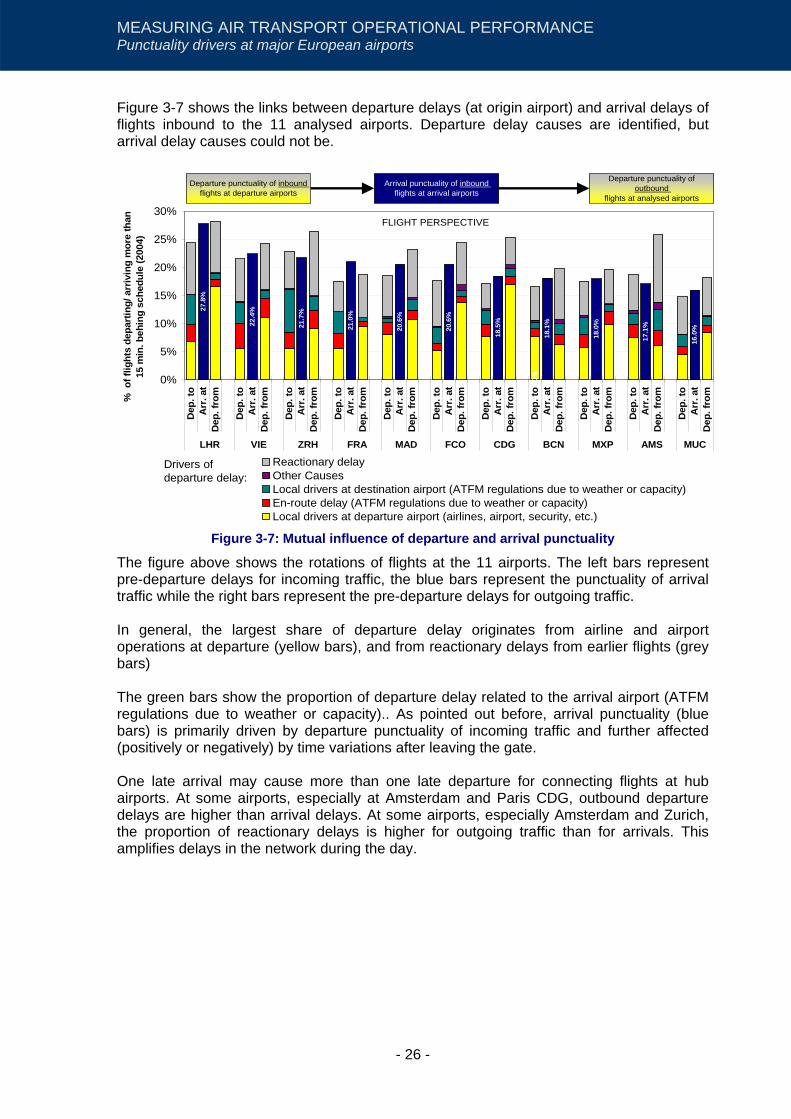
- 26 -
MEASURING AIR TRANSPORT OPERATIONAL PERFORMANCE Punctuality drivers at major European airports
Figure 3-7 shows the links between departure delays (at origin airport) and arrival delays of flights inbound to the 11 analysed airports. Departure delay causes are identified, but arrival delay causes could not be.
27.8
%
22.4
%
21.7
%
21.0
%
20.6
%
20.6
%
18.5
%
0.0%
18.1
%
18.0
%
17.1
%
16.0
%
0%
5%
10%
15%
20%
25%
30%
Dep
. to
Arr
. at
Dep
. fro
m
Dep
. to
Arr
. at
Dep
. fro
m
Dep
. to
Arr
. at
Dep
. fro
m
Dep
. to
Arr
. at
Dep
. fro
m
Dep
. to
Arr
. at
Dep
. fro
m
Dep
. to
Arr
. at
Dep
. fro
m
Dep
. to
Arr
. at
Dep
. fro
m
Dep
. to
Arr
. at
Dep
. fro
m
Dep
. to
Arr
. at
Dep
. fro
m
Dep
. to
Arr
. at
Dep
. fro
m
Dep
. to
Arr
. at
Dep
. fro
m
LHR VIE ZRH FRA MAD FCO CDG BCN MXP AMS MUC
Reactionary delayOther CausesLocal drivers at destination airport (ATFM regulations due to weather or capacity)En-route delay (ATFM regulations due to weather or capacity)Local drivers at departure airport (airlines, airport, security, etc.)
% o
f flig
hts
depa
rtin
g/ a
rriv
ing
mor
e th
an
15 m
in. b
ehin
g sc
hedu
le (2
004)
Departure punctuality of inbound flights at departure airports
Departure punctuality of outbound
flights at analysed airports
Arrival punctuality of inbound flights at arrival airports
FLIGHT PERSPECTIVE
Drivers of departure delay:
Figure 3-7: Mutual influence of departure and arrival punctuality
The figure above shows the rotations of flights at the 11 airports. The left bars represent pre-departure delays for incoming traffic, the blue bars represent the punctuality of arrival traffic while the right bars represent the pre-departure delays for outgoing traffic. In general, the largest share of departure delay originates from airline and airport operations at departure (yellow bars), and from reactionary delays from earlier flights (grey bars) The green bars show the proportion of departure delay related to the arrival airport (ATFM regulations due to weather or capacity).. As pointed out before, arrival punctuality (blue bars) is primarily driven by departure punctuality of incoming traffic and further affected (positively or negatively) by time variations after leaving the gate. One late arrival may cause more than one late departure for connecting flights at hub airports. At some airports, especially at Amsterdam and Paris CDG, outbound departure delays are higher than arrival delays. At some airports, especially Amsterdam and Zurich, the proportion of reactionary delays is higher for outgoing traffic than for arrivals. This amplifies delays in the network during the day.

- 27 -
DRIVERS OF VARIABILITY BEFORE PUSH BACK Punctuality drivers at major European airports
4. DRIVERS OF VARIABILITY BEFORE PUSH-BACK (PRE-DEPARTURE DELAYS) The following sections analyse the sources of departure time variations (before the flight goes off-block) in accordance with the analytic framework in Section 3.3:
• ATFM regulations and delays; • Airline, airport and other causes; and, • Reactionary delay.
4.1. ATFM regulations and delays ATFM regulations and hence ATFM-related delays essentially occur when traffic demand exceeds ATM capacity en-route (en-route ATFM delay) or at departure/arrival airports (airport ATFM delay), if no alternative measures are available. This may be due to over-deliveries from the network or a structural lack of capacity, technical failures, industrial action, staff shortages or adverse weather. ATFM measures applied to en-route sectors include re-routing, level capping and ATFM regulations. It is important to understand that aircraft subject to ATFM regulations are always held at the departure airport according to “ATFM slots” allocated by the CFMU. The ATFM delay of a given flight is allocated to the most constraining ATC unit, either en-route (en-route ATFM delay) or departure/arrival airport (airport ATFM delay). As pointed out previously, ATFM delays are pre-departure delays and do not necessarily correspond to the total delay as perceived by the passengers. It is possible to measure accurately ATFM delays, because they are centrally managed by the CFMU (see Section 1.2.). The level of ATFM delay can be used as an indicator to identify areas where improvements should be made to the ATM system. ATFM delays can have a significant “knock-on” effect and hence cause extensive reactionary delays to the network (see Section 4.3). It is important to clarify that ATFM delays do not correspond to the total delay attributable to ATC operations.
4.1.1. Inbound traffic affected by en-route and airport ATFM delays
Figure 4-1 shows the impact of ATFM regulations on arrival punctuality, which is particularly high at London Heathrow, Zurich and Vienna. The en-route ACC(s) causing the delay could be anywhere along the planned flight path, but also in the vicinity of the airport itself. Where high levels of en-route delays are observed, it might be interesting for the airport to trace the exact source of the problem in order to see whether it can be resolved or mitigated.

- 28 -
DRIVERS OF VARIABILITY BEFORE PUSH BACK Punctuality drivers at major European airports
0%
5%
10%
15%
20%
25%
30%
LHR VIE ZRH FRA MAD FCO CDG BCN MXP AMS MUCOther delays (airline, airport, reactionary, technical etc.)En-route ATFM regulationAirport ATFM regulation (due to weather)Airport ATFM regulation (due to ATC/Aerodrome capacity)
Data source: EUROCONTROL/ eCODA
Flig
hts
with
an
arriv
al d
elay
>1
5 m
in. (
2004
)
Figure 4-1: ATFM delays affecting inbound traffic into the analysed airports
At some airports, more than 5% of arrival flights are delayed because of a lack of actual capacity at the arrival airport (airport ATFM regulations due to weather or local ATC/aerodrome capacity). The high level of weather-related arrival delays at some airports deserves to be further investigated.
4.1.2. Airport ATFM delays caused by the analysed airports
Almost all airport ATFM delays are caused by regulations at the arrival airport. This is why this report concentrates on arrival airport ATFM delays. Paris Charles de Gaulle is the only airport showing a significant level of ATFM airport departure delay. This phenomenon should be further investigated. Figure 4-2 shows a year on year comparison of ATFM airport arrival delays at the 11 airports analysed in this report. In 2004, those 11 airports accounted for 25% of aircraft arrivals in Europe; however, they generated 75% of all arrival airport ATFM delays.

- 29 -
DRIVERS OF VARIABILITY BEFORE PUSH BACK Punctuality drivers at major European airports
London/Heathrow
Barcelona
AmsterdamMunichMilan/Malpensa
Madrid/BarajasRome/Fiumicino Paris/Charles-De-Gaulle
Vienna
Zurich
Frankfurt
0
100
200
300
400
500
600
700
800
900
1 000
1 100
0 50 100 150 200 250 300
2003 20044 min.
3 min.
2 min.
1 min.
Arrival Traffic ('000 flights)
Arriv
al A
TFM
airp
ort d
elay
('00
0 m
inut
es)
Aver
age
arriv
al A
TFM
airp
ort
dela
y
Data source: EUROCONTROL
Figure 4-2: Evolution of traffic and arrival airport ATFM delays (2003-04)
This figure highlights the high level of delays originating from some airports, eg more than 3 minutes per flight at Frankfurt while the average airport ATFM arrival delay was 0.8 minutes in 2004. Despite a significant reduction in airport ATFM arrival delays, Frankfurt still generated the highest level of airport ATFM arrival delay in 2004, followed by London Heathrow, Zurich and Vienna. Airport ATFM arrival delays increased significantly at Vienna, Zurich, Madrid37 and London Heathrow airport. The delay increase at Vienna is related to a significant increase in traffic (+13%), not matched by a corresponding increase in terminal area capacity. Zurich had 1% less traffic and 59% more ATFM delays, mostly due to heavy environmental restrictions. The most significant improvements are observed at Paris CDG (increased staff in approach), Rome Fiumicino (resolved inconsistency between the ATC capacity and the airport capacity), Milan Malpensa and Frankfurt.
4.1.2.1. Decision making process when managing arrival flows at airports
A capacity/demand imbalance normally originates from temporary excess demand or reduced capacity, as shown in Figure 4-3. There may also be cases of overscheduling.
37 The analysis of ATFM airport arrival delay at Madrid airport includes regulations allocated to an en-route
reference location in the vicinity of the airport to protect the airport’s arrival capacity.
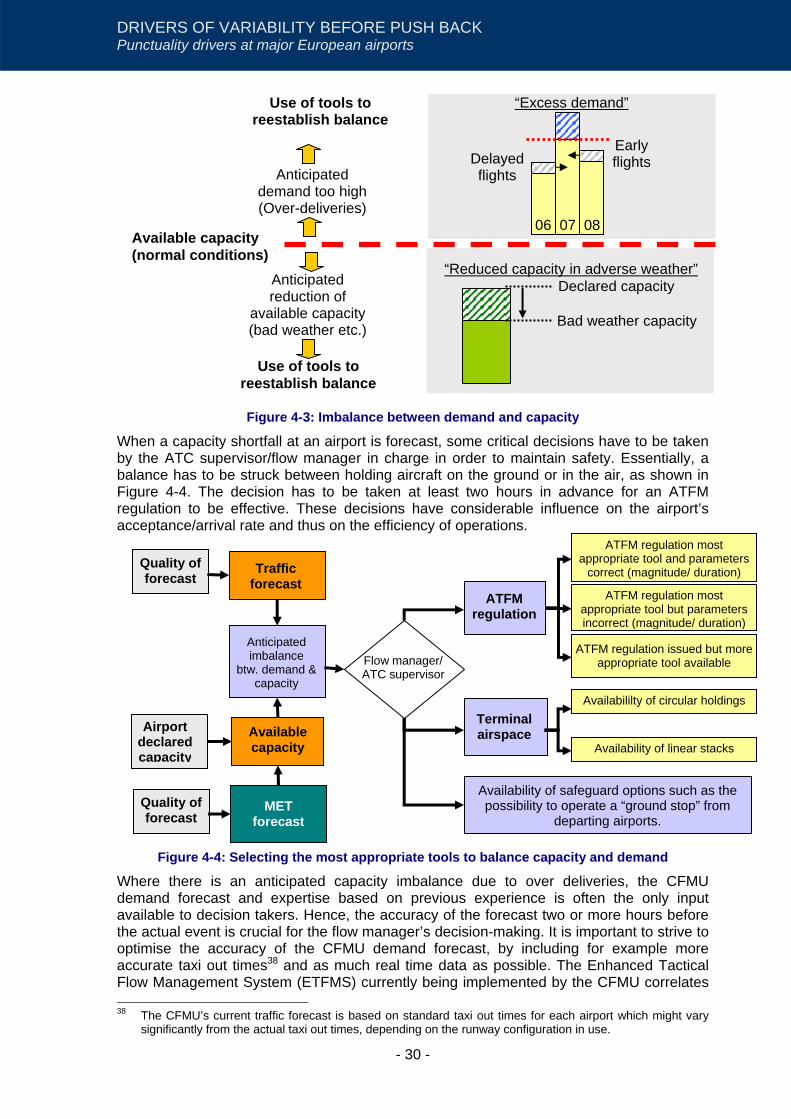
- 30 -
DRIVERS OF VARIABILITY BEFORE PUSH BACK Punctuality drivers at major European airports
Figure 4-3: Imbalance between demand and capacity
When a capacity shortfall at an airport is forecast, some critical decisions have to be taken by the ATC supervisor/flow manager in charge in order to maintain safety. Essentially, a balance has to be struck between holding aircraft on the ground or in the air, as shown in Figure 4-4. The decision has to be taken at least two hours in advance for an ATFM regulation to be effective. These decisions have considerable influence on the airport’s acceptance/arrival rate and thus on the efficiency of operations.
Figure 4-4: Selecting the most appropriate tools to balance capacity and demand
Where there is an anticipated capacity imbalance due to over deliveries, the CFMU demand forecast and expertise based on previous experience is often the only input available to decision takers. Hence, the accuracy of the forecast two or more hours before the actual event is crucial for the flow manager’s decision-making. It is important to strive to optimise the accuracy of the CFMU demand forecast, by including for example more accurate taxi out times38 and as much real time data as possible. The Enhanced Tactical Flow Management System (ETFMS) currently being implemented by the CFMU correlates 38 The CFMU’s current traffic forecast is based on standard taxi out times for each airport which might vary
significantly from the actual taxi out times, depending on the runway configuration in use.
Anticipated demand too high (Over-deliveries)
Anticipated reduction of
available capacity (bad weather etc.)
“Excess demand”
Delayed flights
Early flights
06 07 08
Use of tools to reestablish balance
Use of tools to reestablish balance
Available capacity (normal conditions)
“Reduced capacity in adverse weather” Declared capacity
Bad weather capacity
Anticipated imbalance
btw. demand & capacity
Available capacity
MET forecast
Airport declared capacity
Traffic forecast
ATFM regulation
ATFM regulation most appropriate tool but parameters incorrect (magnitude/ duration)
ATFM regulation most appropriate tool and parameters
correct (magnitude/ duration)
ATFM regulation issued but more appropriate tool available
Terminal airspace
Flow manager/ ATC supervisor
Availabililty of circular holdings
Availability of linear stacks
Availability of safeguard options such as the possibility to operate a “ground stop” from
departing airports.
Quality of forecast
Quality of forecast
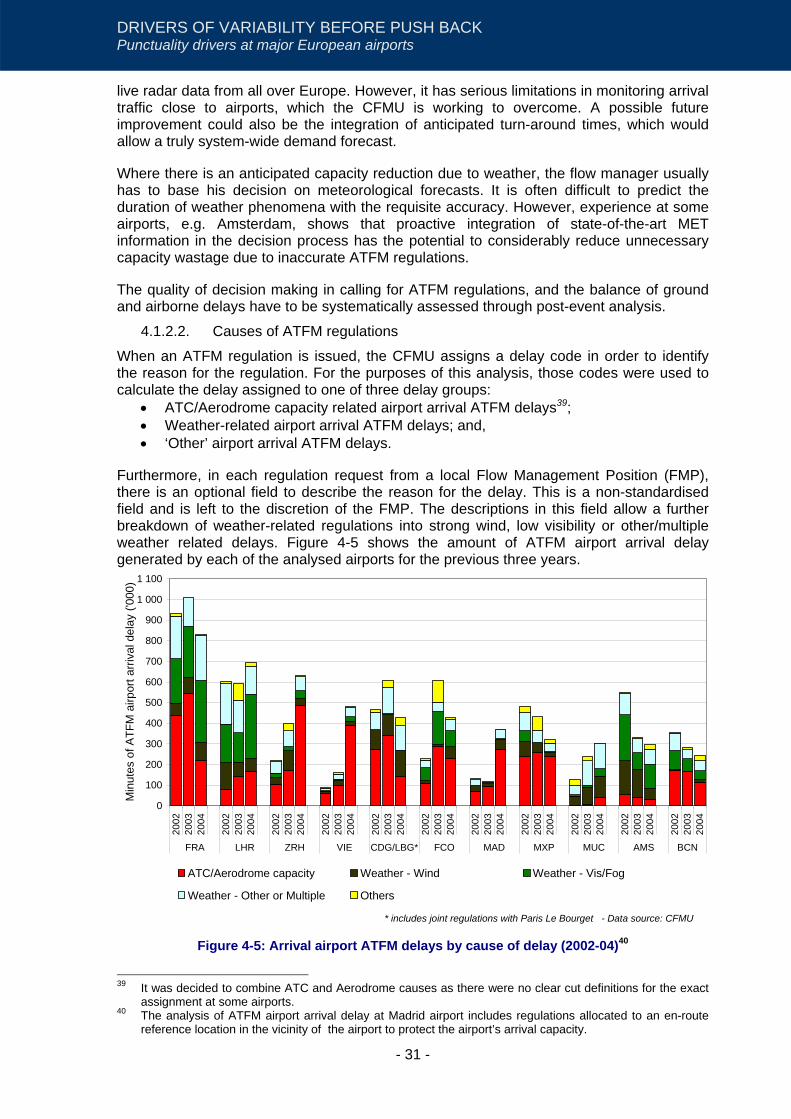
- 31 -
DRIVERS OF VARIABILITY BEFORE PUSH BACK Punctuality drivers at major European airports
live radar data from all over Europe. However, it has serious limitations in monitoring arrival traffic close to airports, which the CFMU is working to overcome. A possible future improvement could also be the integration of anticipated turn-around times, which would allow a truly system-wide demand forecast. Where there is an anticipated capacity reduction due to weather, the flow manager usually has to base his decision on meteorological forecasts. It is often difficult to predict the duration of weather phenomena with the requisite accuracy. However, experience at some airports, e.g. Amsterdam, shows that proactive integration of state-of-the-art MET information in the decision process has the potential to considerably reduce unnecessary capacity wastage due to inaccurate ATFM regulations. The quality of decision making in calling for ATFM regulations, and the balance of ground and airborne delays have to be systematically assessed through post-event analysis.
4.1.2.2. Causes of ATFM regulations
When an ATFM regulation is issued, the CFMU assigns a delay code in order to identify the reason for the regulation. For the purposes of this analysis, those codes were used to calculate the delay assigned to one of three delay groups:
• ATC/Aerodrome capacity related airport arrival ATFM delays39; • Weather-related airport arrival ATFM delays; and, • ‘Other’ airport arrival ATFM delays.
Furthermore, in each regulation request from a local Flow Management Position (FMP), there is an optional field to describe the reason for the delay. This is a non-standardised field and is left to the discretion of the FMP. The descriptions in this field allow a further breakdown of weather-related regulations into strong wind, low visibility or other/multiple weather related delays. Figure 4-5 shows the amount of ATFM airport arrival delay generated by each of the analysed airports for the previous three years.
0
100
200
300
400
500
600
700
800
900
1 000
1 100
2002
2003
2004
2002
2003
2004
2002
2003
2004
2002
2003
2004
2002
2003
2004
2002
2003
2004
2002
2003
2004
2002
2003
2004
2002
2003
2004
2002
2003
2004
2002
2003
2004
FRA LHR ZRH VIE CDG/LBG* FCO MAD MXP MUC AMS BCN
Min
utes
of A
TFM
airp
ort a
rriva
l del
ay ('
000)
ATC/Aerodrome capacity Weather - Wind Weather - Vis/Fog
Weather - Other or Multiple Others
* includes joint regulations with Paris Le Bourget - Data source: CFMU
Figure 4-5: Arrival airport ATFM delays by cause of delay (2002-04)40
39 It was decided to combine ATC and Aerodrome causes as there were no clear cut definitions for the exact
assignment at some airports. 40 The analysis of ATFM airport arrival delay at Madrid airport includes regulations allocated to an en-route
reference location in the vicinity of the airport to protect the airport’s arrival capacity.

- 32 -
DRIVERS OF VARIABILITY BEFORE PUSH BACK Punctuality drivers at major European airports
The reasons why airports issue arrival ATFM regulations vary significantly among the analysed airports. Whereas in Amsterdam almost all of the airport ATFM arrival delay is due to weather-related ATFM regulations, most of the delay at Milan Malpensa is the result of ATC/ Aerodrome capacity limitations. ‘Other’ ATFM airport arrival delay represents the smallest share of ATFM airport arrival delays. It refers generally to special or unforeseen events, such as ATC equipment failure or an increase in air traffic due to a major sporting event.
4.1.2.3. Excessive use of ATFM regulations
Figure 4-6 shows a breakdown of ATFM regulations applied during 2003 and 2004 at the eleven airports in question. With the exception of Munich, Amsterdam, London Heathrow and Frankfurt, most airports apply ATFM regulations due ATC/aerodrome restrictions nearly every day.
0
50
100
150
200
250
300
350
2003
2004
2003
2004
2003
2004
2003
2004
2003
2004
2003
2004
2003
2004
2003
2004
2003
2004
2003
2004
2003
2004
MUC AMS LHR FRA BCN MAD FCO CDG* MXP VIE ZRH
ATC/Aerodrome related regulation Weather onlyWeather and other Other and Multiple causesNo ATFM regulation
* includes joint regulations with Le Bourget Airport - Data source: CFMU
Nr.
of d
ays
with
ATF
M a
irpor
t ar
rival
regu
latio
ns
Figure 4-6: Breakdown of arrival ATFM regulated days in 2003 and 200441
It is noteworthy that many co-ordinated airports in Europe regularly apply ATFM arrival regulations due to ATC/aerodrome capacity restrictions. These restrictions should normally be dealt with during the airport capacity declaration process. It seems that there is scope for improvement in this area. Excessive use of ATC/Aerodrome related airport arrival ATFM regulations might be due to:
• A misunderstanding of the effectiveness of ATFM regulations. They can neither create a continuous demand nor finally control flows when demand slightly exceeds capacity (see Ref. ii);
• A lack of knowledge of the high impact of pre-departure delay on the level of punctuality;
• A lack of arrival tools and procedures to handle and prepare a steady arrival flow; • A lack of interaction in the strategic phase between the ANSP, airports and airlines.
During the airport capacity declaration process, it might not be clear to the airport community how demand exceeding the runway capacity will be handled by the local ATC:
• Over-statement of scheduling capacity. 41 The analysis of ATFM airport arrival delay at Madrid airport includes regulations allocated to an en-route
reference location in the vicinity of the airport to protect the airport’s arrival capacity.

- 33 -
DRIVERS OF VARIABILITY BEFORE PUSH BACK Punctuality drivers at major European airports
Figure 4-7 shows the distribution of airport ATFM arrival delayed flights in 2004 by delay duration and delay cause for the analysed airports. Overall, weather-related airport ATFM arrival regulations (right side) tend to be longer than ATC/Aerodrome-related regulations (left side). At Barcelona, Paris Charles de Gaulle, Amsterdam and Milan Malpensa, the proportion of flights with short airport ATFM delays (less than 10 minutes) is particularly high42. Short ATFM delays are unable to reduce a slight excess of demand and generate a significant level of delay (see Section 4.7 of PRR 7 [Ref. ii]).
0%
10%
20%
30%
40%
50%
60%
70%
80%
90%
100%
FRA
LHR
AMS
BC
N
CD
G
MX
P
FCO
ZRH
% o
f flig
hts
with
airp
ort A
TFM
arri
val d
elay
01-10 (min.) 11-30 (min.)31-60 (min.) >60 (min.)
0%
10%
20%
30%
40%
50%
60%
70%
80%
90%
100%
FRA
LHR
AM
S
BC
N
CD
G
MX
P
FCO
ZRH
ATC/Aerodrome related ATFM regulations Weather-related ATFM regulations
Figure 4-7: Distribution of airport ATFM arrival delay durations in 2004
In 2004, a substantial proportion of flights was delayed by more than 60 minutes, mostly due to weather related ATFM airport arrival regulations. This proportion is relatively higher in Rome Fiumicino, Amsterdam, Milan Malpensa and Paris Charles de Gaulle, as shown in Figure 4-7. These long ATFM delays generally cause strong knock-on effects to airline and airport operations, and to the European network (reactionary delays). In order to keep weather-related delays to a minimum whilst maintaining safety at all times, the drop of capacity during bad weather should be minimised and ATFM regulations applied as accurately as possible (see also chapter 2.1.2). The use of ATC/Aerodrome capacity related airport ATFM arrival regulations due to an anticipated over-delivery in normal conditions is a different matter. They should not occur frequently at a coordinated airport, and then only in exceptional circumstances (i.e. closure of a runway, technical failures).
The following section uses Frankfurt and Milan Malpensa as examples. Figure 4-8 shows the distribution of ATC/Aerodrome related ATFM airport arrival regulations at Frankfurt during 2003 and 2004. Frankfurt is interesting because there was a change in policy leading to a more cautious use of ATC/Aerodrome related ATFM regulations in 2004. Detailed analysis of demand patterns combined with co-ordinated action such as the de-peaking of scheduled arrival demand at Frankfurt confirmed that a considerable number of those regulations were avoidable.
42 However, it should be pointed out that Amsterdam has a comparatively small amount of ATC/Aerodrome
related ATFM arrival delay compared to the other airports (see also Figure 4-5).

- 34 -
DRIVERS OF VARIABILITY BEFORE PUSH BACK Punctuality drivers at major European airports
The number of regulations issued at Frankfurt due to ATC/Aerodrome related reasons could be reduced significantly in the second half of 2004, yielding positive results in terms of ATFM delays. However as pointed out previously, it is important to monitor terminal holding delays as there has to be a balance between ground and airborne delays.
300
360
420
480
540
600
660
720
780
840
900
960
1020
1080
1140
1200
1260
1320
1380
1440
01-0
1-03
01-0
2-03
01-0
3-03
01-0
4-03
01-0
5-03
01-0
6-03
01-0
7-03
01-0
8-03
01-0
9-03
01-1
0-03
01-1
1-03
01-1
2-03
01-0
1-04
01-0
2-04
01-0
3-04
01-0
4-04
01-0
5-04
01-0
6-04
01-0
7-04
01-0
8-04
01-0
9-04
01-1
0-04
01-1
1-04
01-1
2-04
05:00
06:00
07:00
08:00
09:00
10:00
11:00
12:00
13:00
14:00
15:00
16:00
17:00
18:00
19:00
20:00
21:00
22:00
23:00
24:00FRA - ATFM arrival regulations due to ATC/Aerodrome capacity (2003/04)
2003 2004
Figure 4-8: ATC/Aerodrome capacity related airport regulations at Frankfurt
Figure 4-9 shows the profile of ATC/Aerodrome capacity related airport ATFM arrival regulations for Milan Malpensa during 2003 and 2004. Here, the systematic use of relatively short regulations of which a high number are cancelled before the end (see next section) at almost the same time of the day suggests scope for improvement.
300
360
420
480
540
600
660
720
780
840
900
960
1020
1080
1140
1200
1260
1320
1380
1440
01-0
1-03
01-0
2-03
01-0
3-03
01-0
4-03
01-0
5-03
01-0
6-03
01-0
7-03
01-0
8-03
01-0
9-03
01-1
0-03
01-1
1-03
01-1
2-03
01-0
1-04
01-0
2-04
01-0
3-04
01-0
4-04
01-0
5-04
01-0
6-04
01-0
7-04
01-0
8-04
01-0
9-04
01-1
0-04
01-1
1-04
01-1
2-04
05:00
06:00
07:00
08:00
09:00
10:00
11:00
12:00
13:00
14:00
15:00
16:00
17:00
18:00
19:00
20:00
21:00
22:00
23:00
24:00MXP - ATFM arrival regulations due to ATC/Aerodrome capacity (2003/04)
2003 2004
Figure 4-9: ATC/Aerodrome capacity related airport regulations at Milan Malpensa
“Schedule drifts”, especially on long-haul flights, may influence the arrival flow during certain times of the day and the use of ATFM airport regulations might be necessary to manage those occasional peaks of demand. Nevertheless, the systematic daily use of

- 35 -
DRIVERS OF VARIABILITY BEFORE PUSH BACK Punctuality drivers at major European airports
ATC/Aerodrome capacity related ATFM regulations during the same time should not take place at coordinated airports.
4.1.2.4. Accuracy and cancellation of ATFM regulations
The use of ATFM airport arrival regulations as well as the applied parameters (magnitude and duration of capacity drop) play an important role in avoiding unnecessary delays. If conditions improve significantly, then regulations are usually cancelled. When ATFM regulations are cancelled at short notice, flights which are already airborne, or are close to their ATFM slot time, cannot avoid delays (see Figure 4-10). Furthermore, the airport that issued the ATFM regulation might not be able to use a part of its available capacity until the traffic demand is back to normal.
Figure 4-10: The impact of cancelled ATFM regulations on departing flights
Figure 4-11 shows that not only the number of regulations but also the frequency of cancellations vary considerably from airport to airport. A large number of airport ATFM arrival regulations are cancelled before their planned end time, typically between 1 and 3 hours before the scheduled end of the regulation, as shown in Figure 4-11. A significant number of regulations were cancelled less than 2 hours before the planned start of the regulation. By then, most regulated flights cannot avoid ATFM delays.
-
200
400
600
800
1 000
1 200
1 400
1 600
1 800
FRA
MU
C
LHR
AM
S
BC
N
MA
D
CD
G/L
BG
*
MX
P
FCO
VIE
ZRH
Num
ber o
f airp
ort A
TFM
arr
ival
regu
latio
ns
cancelled less than 2hrs before start cancelled more than 2 hrs before end
cancelled less than 2hrs before end Not cancelled
ATC/Aerodrome related ATFM regulations Weather-related ATFM regulations
-
200
400
600
800
1 000
1 200
1 400
1 600
1 800
FRA
MU
C
LHR
AM
S
BC
N
MA
D
CD
G/L
BG
*
MX
P
FCO
VIE
ZRH
Figure 4-11: Cancelled airport ATFM arrival regulations
As far as ATC/Aerodrome related airport ATFM arrival regulations are concerned, the high number of cancellations for some airports might be due to flow management strategy, airport scheduling issues, genuine schedule drifts, inaccurate demand forecasts or inappropriate use of ATFM regulations. For example, Milan Malpensa applies ATFM
Planned start of
regulation
Cancel time after start of regulation
Planned End of regulation
Cancel time before start of regulation
~2hrs
Departing flights from origin airports within EUROCONTROL area
ATFM regulation
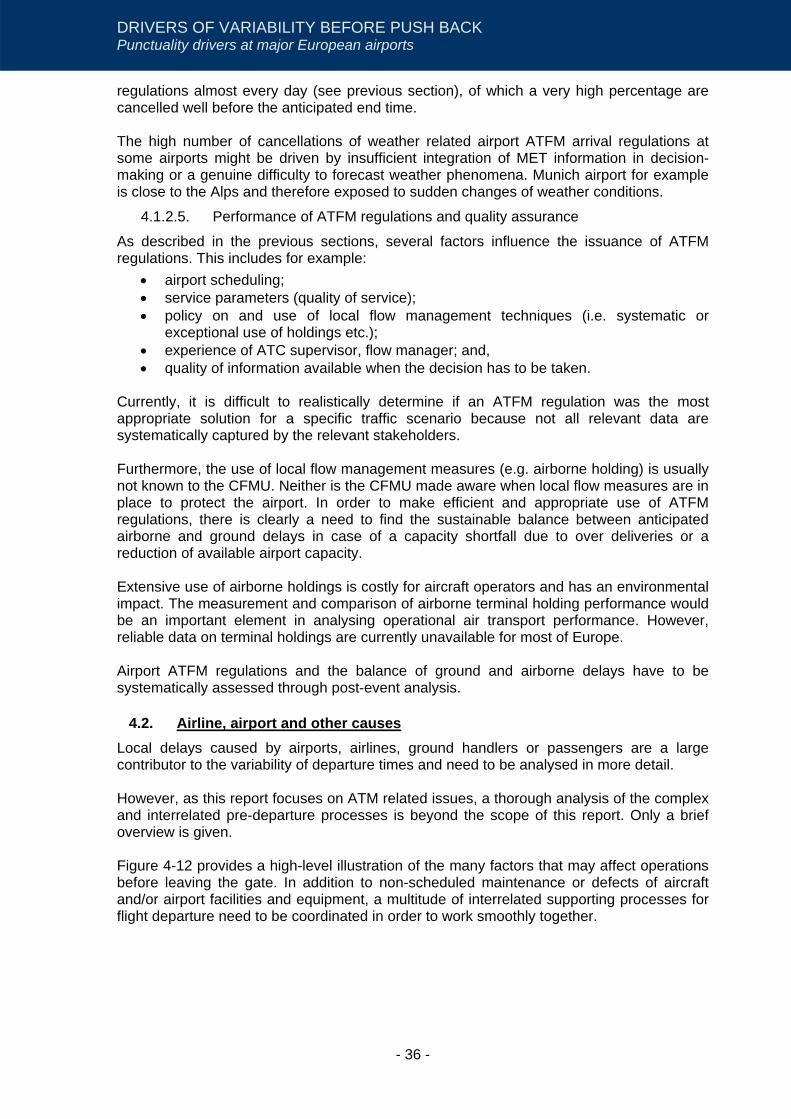
- 36 -
DRIVERS OF VARIABILITY BEFORE PUSH BACK Punctuality drivers at major European airports
regulations almost every day (see previous section), of which a very high percentage are cancelled well before the anticipated end time. The high number of cancellations of weather related airport ATFM arrival regulations at some airports might be driven by insufficient integration of MET information in decision-making or a genuine difficulty to forecast weather phenomena. Munich airport for example is close to the Alps and therefore exposed to sudden changes of weather conditions.
4.1.2.5. Performance of ATFM regulations and quality assurance
As described in the previous sections, several factors influence the issuance of ATFM regulations. This includes for example:
• airport scheduling; • service parameters (quality of service); • policy on and use of local flow management techniques (i.e. systematic or
exceptional use of holdings etc.); • experience of ATC supervisor, flow manager; and, • quality of information available when the decision has to be taken.
Currently, it is difficult to realistically determine if an ATFM regulation was the most appropriate solution for a specific traffic scenario because not all relevant data are systematically captured by the relevant stakeholders. Furthermore, the use of local flow management measures (e.g. airborne holding) is usually not known to the CFMU. Neither is the CFMU made aware when local flow measures are in place to protect the airport. In order to make efficient and appropriate use of ATFM regulations, there is clearly a need to find the sustainable balance between anticipated airborne and ground delays in case of a capacity shortfall due to over deliveries or a reduction of available airport capacity. Extensive use of airborne holdings is costly for aircraft operators and has an environmental impact. The measurement and comparison of airborne terminal holding performance would be an important element in analysing operational air transport performance. However, reliable data on terminal holdings are currently unavailable for most of Europe. Airport ATFM regulations and the balance of ground and airborne delays have to be systematically assessed through post-event analysis.
4.2. Airline, airport and other causes Local delays caused by airports, airlines, ground handlers or passengers are a large contributor to the variability of departure times and need to be analysed in more detail. However, as this report focuses on ATM related issues, a thorough analysis of the complex and interrelated pre-departure processes is beyond the scope of this report. Only a brief overview is given. Figure 4-12 provides a high-level illustration of the many factors that may affect operations before leaving the gate. In addition to non-scheduled maintenance or defects of aircraft and/or airport facilities and equipment, a multitude of interrelated supporting processes for flight departure need to be coordinated in order to work smoothly together.
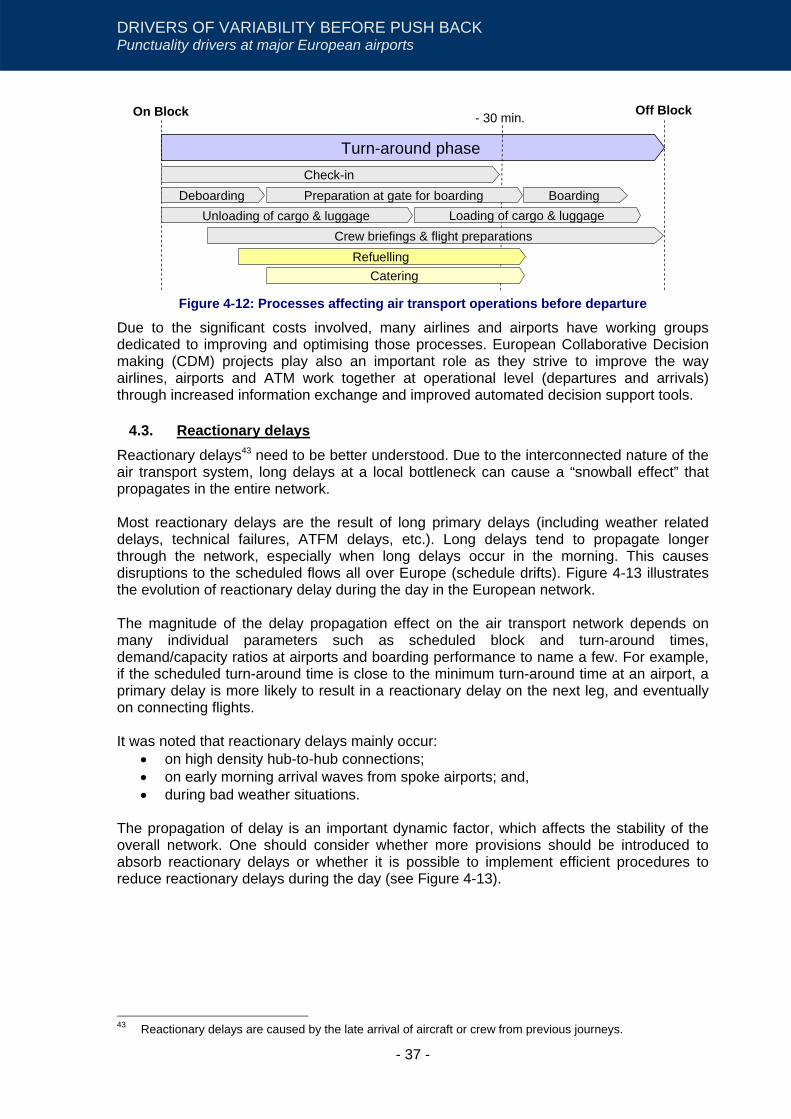
- 37 -
DRIVERS OF VARIABILITY BEFORE PUSH BACK Punctuality drivers at major European airports
Turn-around phase
On Block
Check-in
Off Block- 30 min.
Deboarding BoardingUnloading of cargo & luggage
Preparation at gate for boarding
RefuellingCatering
Crew briefings & flight preparationsLoading of cargo & luggage
Figure 4-12: Processes affecting air transport operations before departure
Due to the significant costs involved, many airlines and airports have working groups dedicated to improving and optimising those processes. European Collaborative Decision making (CDM) projects play also an important role as they strive to improve the way airlines, airports and ATM work together at operational level (departures and arrivals) through increased information exchange and improved automated decision support tools.
4.3. Reactionary delays Reactionary delays43 need to be better understood. Due to the interconnected nature of the air transport system, long delays at a local bottleneck can cause a “snowball effect” that propagates in the entire network. Most reactionary delays are the result of long primary delays (including weather related delays, technical failures, ATFM delays, etc.). Long delays tend to propagate longer through the network, especially when long delays occur in the morning. This causes disruptions to the scheduled flows all over Europe (schedule drifts). Figure 4-13 illustrates the evolution of reactionary delay during the day in the European network. The magnitude of the delay propagation effect on the air transport network depends on many individual parameters such as scheduled block and turn-around times, demand/capacity ratios at airports and boarding performance to name a few. For example, if the scheduled turn-around time is close to the minimum turn-around time at an airport, a primary delay is more likely to result in a reactionary delay on the next leg, and eventually on connecting flights. It was noted that reactionary delays mainly occur:
• on high density hub-to-hub connections; • on early morning arrival waves from spoke airports; and, • during bad weather situations.
The propagation of delay is an important dynamic factor, which affects the stability of the overall network. One should consider whether more provisions should be introduced to absorb reactionary delays or whether it is possible to implement efficient procedures to reduce reactionary delays during the day (see Figure 4-13).
43 Reactionary delays are caused by the late arrival of aircraft or crew from previous journeys.
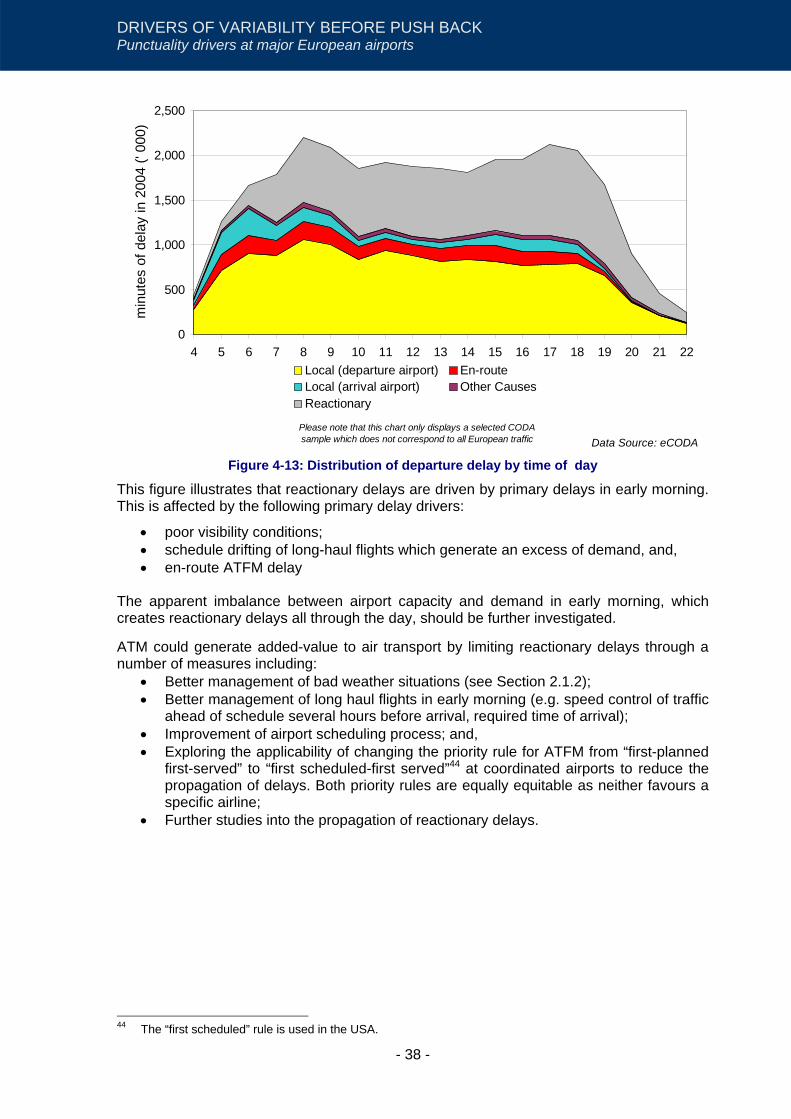
- 38 -
DRIVERS OF VARIABILITY BEFORE PUSH BACK Punctuality drivers at major European airports
0
500
1,000
1,500
2,000
2,500
4 5 6 7 8 9 10 11 12 13 14 15 16 17 18 19 20 21 22
min
utes
of d
elay
in 2
004
(' 00
0)
Local (departure airport) En-routeLocal (arrival airport) Other CausesReactionary
Please note that this chart only displays a selected CODA sample which does not correspond to all European traffic Data Source: eCODA
Figure 4-13: Distribution of departure delay by time of day
This figure illustrates that reactionary delays are driven by primary delays in early morning. This is affected by the following primary delay drivers:
• poor visibility conditions; • schedule drifting of long-haul flights which generate an excess of demand, and, • en-route ATFM delay
The apparent imbalance between airport capacity and demand in early morning, which creates reactionary delays all through the day, should be further investigated.
ATM could generate added-value to air transport by limiting reactionary delays through a number of measures including:
• Better management of bad weather situations (see Section 2.1.2); • Better management of long haul flights in early morning (e.g. speed control of traffic
ahead of schedule several hours before arrival, required time of arrival); • Improvement of airport scheduling process; and, • Exploring the applicability of changing the priority rule for ATFM from “first-planned
first-served” to “first scheduled-first served”44 at coordinated airports to reduce the propagation of delays. Both priority rules are equally equitable as neither favours a specific airline;
• Further studies into the propagation of reactionary delays.
44 The “first scheduled” rule is used in the USA.

- 39 -
DRIVERS OF VARIABILITY AFTER PUSH BACK Punctuality drivers at major European airports
5. DRIVERS OF VARIABILITY AFTER PUSH BACK Before looking at more detail at the individual drivers of variability after the aircraft has left the gate, it should be pointed out that, due to the nature of aviation, a certain level of variability of operations is considered to be normal. This “natural” variability can be the result of many influencing factors (weather, different runway configurations, pilot performance, etc.). In this context, it is important to identify if and to what extent the drivers of variability represent a problem and to isolate the ones which could realistically be reduced.
5.1. Variability of flight operations: taxi times45 Figure 5-1 shows the distribution of standard deviations for taxi-out and taxi-in times for each flight-leg with 20 or more trips per month. This method is used to account for airline specific gate allocations, congestion during certain times of the day, aircraft type and, in some cases, for runway configuration (see also section 1.2). A small variance of taxi times is a natural effect, depending on local taxi distances from stand to runway. Figure 5-1 shows that while the distribution of taxi-in times is fairly tight (with the exception of London Heathrow and Amsterdam46), the distribution of “time to take off” is much wider at the analysed airports, introducing some variability and unpredictability in the network.
0%
10%
20%
30%
40%
50%
60%
70%
80%
90%
100%
AMS
BCN
CD
G
FCO
FRA
LHR
MA
D
MU
C
MX
P
VIE
ZRH
0-2.5 2.5-5 5-7.57.5-10 >10
0%
10%
20%
30%
40%
50%
60%
70%
80%
90%
100%
AM
S
BC
N
CD
G
FCO
FRA
LHR
MA
D
MU
C
MXP VIE
ZRH
"Taxi in time" variations 2004
Grouping of standard deviation in minutes per monthly scheduled service (more than 20 flights per month)
"Time to take off" variations 2004
Figure 5-1: Standard deviation of taxi times at the 11 airports (2004)
The “time to take off” seems to be least predictable at London Heathrow, Rome Fiumicino, Paris Charles de Gaulle and Madrid. Good levels of predictability are observed at Zurich, Frankfurt and Vienna.
45 Taxi times include time spent waiting for a gate at the arrival end of the flight and the time waiting to take
off. It is important to note that no attempt is made to determine the cause of delay. 46 At Amsterdam airport the observed variation might be due to the new runway which doubles taxi times
when a change of runway configuration is required. At London Heathrow airport the variations in taxi-in times are likely to be due to congestion in the terminal area.
- 40 -
DRIVERS OF VARIABILITY AFTER PUSH BACK Punctuality drivers at major European airports
It would be important to understand the drivers of taxi time variability. Detailed analysis carried out by the individual airport communities and sharing best practice with other communities can potentially reduce the variability of taxi times. High variability in the “time to take off” can affect the effectiveness of ATFM regulations. Aircraft subject to ATFM regulations are supposed to take-off within a given window (-5,+10 minutes) around the assigned ATFM slot. Compliance with this slot is difficult to achieve when there is already a queue of aircraft waiting for take-off. It would be worth examining if take-off times could be better controlled using departure management tools and processes. Furthermore, in the CFMU system, taxi times are considered as fixed values for the flight progress calculation. As shown above, there can be significant variations in the time to take off and the fixed values used in the CFMU system for the calculation of flight progress might produce inaccurate data. However, it should be pointed out that a better integration of more accurate taxi times in the CFMU system would improve the system significantly but it would not reduce variability of taxi times as such.
5.2. Variability of flight operations: airborne times Variations in flight times can be broken down into en-route and terminal transit times.
5.2.1. Variations in en-route transit times
Whereas there are quite significant variations in en-route transit times for long haul flights (jet stream, more direct routing during off peak times), there is only moderate variation in en-route transit times on intra-European flights [Ref.ii] At some airports, the varying arrival times of long haul flights can represent a real problem, as those flights cannot be controlled by ATFM regulations. For example, major hubs such as Frankfurt and London Heathrow are often subject to schedule drifts. Long-haul traffic arrives in the morning with a tolerance of approximately ±25 minutes (dependent on jet stream and routing), which might require intensive application of wake vortex separations and consequently reduce the available arrival capacity. If such schedule drifts of long haul traffic is experienced when arrival capacity is already reduced due to bad weather (i.e. fog in the morning), airports might have to issue an ATFM airport arrival regulation to restrict the European traffic flow.
5.2.2. Variations in en-terminal transit times
Airborne holding appears to vary significantly among airports. Airborne terminal holdings appear to vary significantly among airports. It was not possible to analyse this in depth, however, as the requisite data are only publicly available for London airports. This lack of data represents a serious limitation when doing the post analysis in preparation for the next season. UK NATS however publishes relevant information in its monthly performance bulletins. Figure 5-2 shows holding times for flights into London Heathrow in September 2004 as an example of information that would be expected from major airports on a regular basis.

- 41 -
DRIVERS OF VARIABILITY AFTER PUSH BACK Punctuality drivers at major European airports
Hold Time And Arrivals By Hour of Day
0200400600800
1000120014001600
0 2 4 6 8 10 12 14 16 18 20 22
Arr
ivin
g A
ircra
ft
0246810121416
Ave
rage
Hol
d Ti
me
Arriving Aircraft Average Hold Time
Ave
rage
hol
d tim
e
Hol
d tim
e an
d m
onth
ly a
rriv
als Monthly hold time and arrivals (Sep. 2004)
Arriving aircraft Average hold timeHour of day
Source: NATS
Distribution Delay
7352
2624
253 12 1
9683
0
2000
4000
6000
8000
10000
12000
0-10
10-20
20-30
30-40
40-50
50-60
60+
Time Held
Airc
raft
Figure 5-2: Holding time into London Heathrow (September 2004)
Beside improvements in punctuality and flight time savings, there would be significant environmental benefits (reduced noise, emissions and fuel burn) if holding in terminal areas could be reduced by more accurate flow control into airports. One option might be the introduction of en-route sequencing, which is currently not applied in Europe.

42

- 43 -
CONCLUSIONS Punctuality drivers at major European airports
6. CONCLUSIONS This report is a first attempt to establish a link between air transport, airport and Air Traffic Management (ATM) performance, at the initiative of EUROCONTROL’s Performance Review Commission (PRC). It identifies and measures an initial set of air transport punctuality drivers at major European airports, seen from an ATM perspective. The eleven airports are: Amsterdam Schiphol, Barcelona, Paris Charles de Gaulle, Rome Fiumicino, Frankfurt, London Heathrow, Madrid, Munich, Milan Malpensa, Vienna and Zurich. This report was prepared and validated in interaction with the airport communities concerned, i.e. airport authorities, airlines and ATM at those airports. This interaction with airport communities proved to be very fruitful and hopefully results in high added-value for everyone. In addition, the report’s preliminary findings and conclusions were discussed at a workshop held in open forum on 20 April 2005, at which there was a representative cross-sample of interested parties. The Performance Review Unit gratefully acknowledges the contributions received from everyone concerned. The underlying analysis was made possible by the recent availability of punctuality data from EUROCONTROL’s Central Office for Delay Analysis (CODA), covering now more than 50% of scheduled flights and by linking this data with data from the EUROCONTROL Central Flow Management Unit (CFMU).
• The continued availability of such data will be essential to extract the high potential value of this database for individual parties and for the wider interest of air transport policy.
• Many parties could benefit from controlled access to the CODA information. EUROCONTROL should identify with interested parties what services it could/should offer in this respect, e.g. standard queries through the Internet.
• Punctuality and related delay causes could be measured in a uniform way. Local and network drivers could be distinguished.
Beyond measuring punctuality and understanding underlying delay causes, the variability of flight operations emerged as an important issue towards improving air transport performance. A reduction of variability directly translates into improved punctuality and/or reduced costs to meet the same punctuality target. The PRC’s eighth Performance Review Report (PRR 8) states that compressing half of flight schedules by five minutes would be worth some € 1000 million per annum. The report measures the “variability of flight operations” globally, per airport and in the different phases of flight. It attempts to trace the variability in arrival delays to variability in departure time, “time-to-take-off”, flight time and taxi-in. It identifies the following as significant drivers of “variability of flight operations”:
• Airport and airline scheduling processes; • the management of bad weather at European airports; • flow management strategies into airports. Observed cases of daily ATFM airport
arrival regulations to address predictable excess demand at airports are a signal of airport scheduling issues and/or inadequate use of ATFM regulations. ATFM/airport quality control should monitor this issue on an ongoing basis, with visibility for all concerned stakeholders;
• Management of long haul flights bound for Europe. The study also gives some clues as to the propagation of delays from flight to flight, and hence as to ways to improve reactionary delays.

- 44 -
CONCLUSIONS Punctuality drivers at major European airports
This report remains mostly descriptive. More work is needed to extract the full value of the new field it opens. It does however point to many possible improvements in airline, airport, ATM and ATFM operations, and in their interaction through e.g. Collaborative Decision Making (CDM), which warrants further action by the EUROCONTROL Organisation and others. For its part, the PRC will endeavour to reach more definitive conclusions and to build recommendations on the basis of this further work.

- 45 -
POSSIBLE ACTION AREAS FOR IMPROVING AIR TRANSPORT PUNCTUALITY Punctuality drivers at major European airports
7. POSSIBLE ACTION AREAS FOR IMPROVING AIR TRANSPORT PUNCTUALITY The report attempts to establish a link between air transport, airport and air traffic management performance and raises many issues which should be further explored with a view to improving air transport punctuality in Europe. During the workshop held on 20 April 2005, it became clear that further action is needed at local level by the individual airport communities. Action is also needed at European level by the EUROCONTROL Organisation, and possibly by the European Commission. The need for a cultural change to a more proactive, transparent, no-blame management of air transport operations was highlighted during the workshop. Airlines, airports and the ATC and ATFM community need to move from an “insular perspective” to a more general focus on overall air transport performance. At local level, this means that the entire airport community should work closely together in order to develop a common understanding of objectives, which includes mutually agreed and clearly defined measurable targets. Building on this report, key drivers of air transport performance need to be further analysed and appropriate. Comparable indicators need to be developed at local and network level for continuous performance monitoring. Broadly, the areas of action can be grouped according to their origin (local airport community/ network) and their nature (strategic/tactical), as shown in Figure 7-1.
Figure 7-1: Action areas for improving air transport punctuality
Data access and quality are the key to developing a comprehensive performance measurement framework. CFMU and CODA data provide essential information for progress in analysing air transport performance at European and at airport level. Reporting into CODA should be further improved for a comprehensive coverage of scheduled flights and delay causes, possibly under EC rules, and to enable analysis from a network perspective to be conducted. Moreover, data quality and accessibility for the comparison of terminal holding times should be improved in order to get a clearer understanding of variability in the terminal transit times.
Strategic and tactical network issues
(to be addressed by transnational working
groups)
Strategic and tactical local issues
(to be addressed by airport community)
Cultural change
Data availability and quality to clearly identify the main
drivers of air transport variability
Collaborative Decision Making
(CDM)
Sharing of Best practice Proactive air traffic
management

- 46 -
POSSIBLE ACTION AREAS FOR IMPROVING AIR TRANSPORT PUNCTUALITY Punctuality drivers at major European airports
7.1. Network issues
7.1.1. Establish a better understanding of “network effects”
Network effects and reactionary delay need to be better understood. Despite the large share of reactionary delay, there is currently only a limited knowledge on how individual airline (scheduling of block and turn around times) or airport strategies (airport scheduling, use of ATFM regulations, demand capacity ratios) affect the air transport network. Most reactionary delays are the result of long primary delays, especially when those delays occur in the morning. It appears that the European air transportation network is not able nor has the contingencies to absorb or reduce reactionary delays during the day.
7.1.2. Post event analysis of ATFM performance
Consideration should be given by the CFMU to extending its procedures for the management of critical events (e.g. bad weather) and post-event analysis of ATFM performance, with involvement of all concerned parties. Overly penalising regulations for flights with a flying time of 2-3 hours should be reviewed. A first important step would be the obligatory recording of the actual demand situation when an ATFM regulation is issued by the FMP. This would enable ex-post analysis and form the basis for a quality management system for ATFM regulations. This would benefit the whole European air transport system. Alternative options could be explored by all involved parties when a systematic use of ATFM regulations is identified. In the US, post operations evaluation tools and associated data are available to any user. to explore a variety of standardised performance metrics including departure, en-route and arrival delays. The tools offer powerful data mining capabilities to assist the user in recognising patterns and trends. Some of the patterns currently recognised include circular airborne holding, arrival fix swaps, and flown routes that differ significantly from the routes filed. Another tool enables users to assess the performance of Ground Delay Programs (GDP), which are similar to the European ATFM delay programme. Performance reports show whether the GDP is delivering the requested rate and indicate why the desired rate is not being achieved. A post analysis component allows for in-depth analysis after a GDP has terminated. It provides GDP performance metrics and trend analysis features, which compares the current GDP against past GDPs, allowing the user to identify patterns or anomalies.
7.1.3. Introduction of a “serve by schedule” bias
In order to reduce variations against schedule, it would be interesting to explore to what extent a modification of the rule of ATFM priority could help improving overall punctuality whilst reducing the amount of reactionary delay, provided that safety is maintained With radar data provided by UK NATS, BAA modelled a simple process by which the ICAO rule of "First Come - First Served" was biased to give a preference to on-schedule operation. illustrates the outcome from one day's operations, which was typical of outcomes observed for the sample week. This "Serve-by-Schedule" procedure (which is applied in the US) permitted the controller to sequence aircraft from the stacks with a preference toward on-schedule operation. This discretion was constrained to limit the delay of any one aircraft to a specified maximum holding in the stack. A period of 25 minutes was assumed for this example. The outcome was that, while the total terminal holding time remained unchanged, on-schedule and delayed aircraft experienced less terminal holding at the expense of flights that arrived prior to their schedule. This improved the punctuality on the airport at zero overall cost.
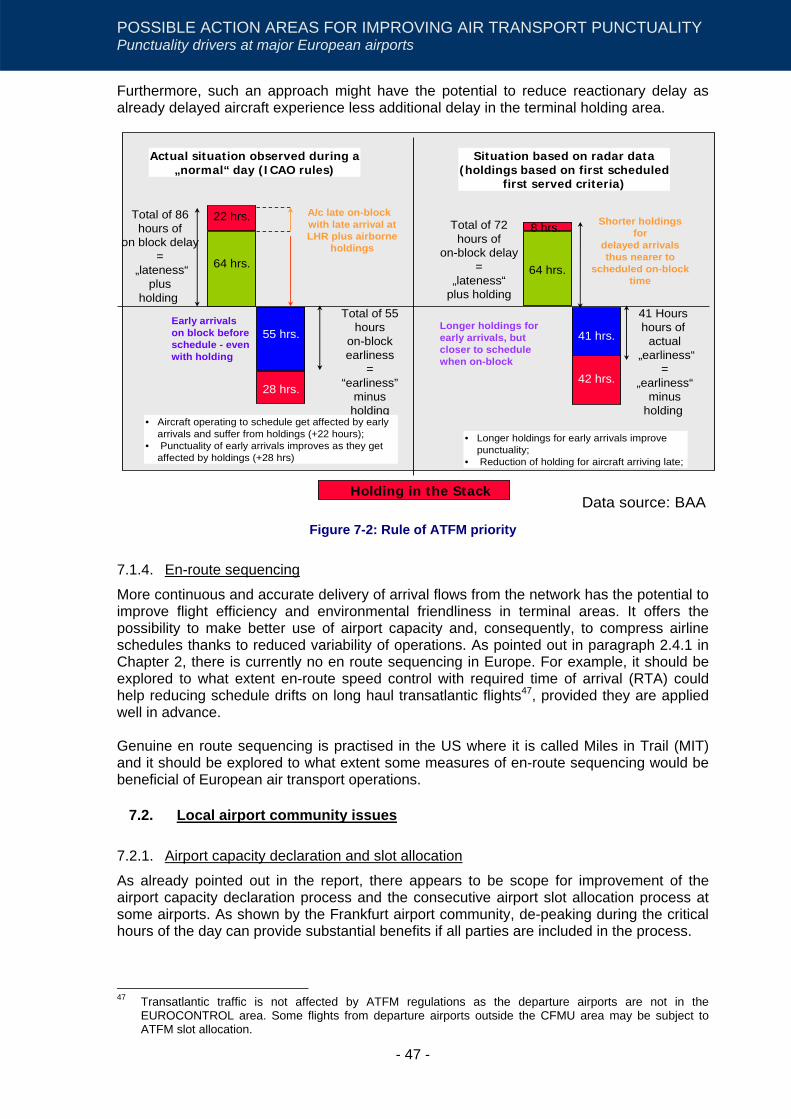
- 47 -
POSSIBLE ACTION AREAS FOR IMPROVING AIR TRANSPORT PUNCTUALITY Punctuality drivers at major European airports
Furthermore, such an approach might have the potential to reduce reactionary delay as already delayed aircraft experience less additional delay in the terminal holding area.
Actual situation observed during a„normal“ day (ICAO rules)
Situation based on radar data(holdings based on first scheduled
first served criteria)
64 hrs.
Total of 86hours of
on block delay=
„lateness“plus
holdingTotal of 55
hourson-blockearliness
=“earliness”
minusholding
22 hrs.
55 hrs.
28 hrs.
A/c late on-blockwith late arrival atLHR plus airborne
holdings
64 hrs.
8 hrs.
41 hrs.
42 hrs.
Longer holdings forearly arrivals, butcloser to schedulewhen on-block
Total of 72hours of
on-block delay=
„lateness“plus holding
41 Hourshours of
actual„earliness“
=„earliness“
minusholding
• Longer holdings for early arrivals improvepunctuality;
• Reduction of holding for aircraft arriving late;
• Aircraft operating to schedule get affected by earlyarrivals and suffer from holdings (+22 hours);
• Punctuality of early arrivals improves as they getaffected by holdings (+28 hrs)
Early arrivalson block beforeschedule - evenwith holding
Shorter holdingsfor
delayed arrivalsthus nearer to
scheduled on-blocktime
Holding in the StackData source: BAA
Figure 7-2: Rule of ATFM priority
7.1.4. En-route sequencing
More continuous and accurate delivery of arrival flows from the network has the potential to improve flight efficiency and environmental friendliness in terminal areas. It offers the possibility to make better use of airport capacity and, consequently, to compress airline schedules thanks to reduced variability of operations. As pointed out in paragraph 2.4.1 in Chapter 2, there is currently no en route sequencing in Europe. For example, it should be explored to what extent en-route speed control with required time of arrival (RTA) could help reducing schedule drifts on long haul transatlantic flights47, provided they are applied well in advance. Genuine en route sequencing is practised in the US where it is called Miles in Trail (MIT) and it should be explored to what extent some measures of en-route sequencing would be beneficial of European air transport operations.
7.2. Local airport community issues
7.2.1. Airport capacity declaration and slot allocation
As already pointed out in the report, there appears to be scope for improvement of the airport capacity declaration process and the consecutive airport slot allocation process at some airports. As shown by the Frankfurt airport community, de-peaking during the critical hours of the day can provide substantial benefits if all parties are included in the process.
47 Transatlantic traffic is not affected by ATFM regulations as the departure airports are not in the
EUROCONTROL area. Some flights from departure airports outside the CFMU area may be subject to ATFM slot allocation.
- 48 -
Additional information from the slot user could also prove beneficial for the airport capacity declaration process. At the moment, once a slot has been declared, it can be used by any type of aircraft (heavy to light wake vortex) to any destination by the slot owner. Hence, the exact traffic mix and preferential departure routes are not known to the airport operators at the scheduling stage.
7.2.2. Collaborative Decision Making Programmes
Collaborative Decision Making (CDM) should be further promoted and applied for arrival, turn-around and departure phase. For example, knowledge transfer and consultation between FMP, local ATC and airport before an ATFM airport regulation is issued might help reducing ATFM related delays.
7.2.3. Improved sustainability of airport arrival capacity during bad weather
Airport communities should strive to minimise the gap between declared peak arrival capacity and actual experienced arrival capacity due to bad weather. Better integration of MET expertise in the ATFM/ATC decision-making process offers substantial benefits. An interesting experience can be observed at Amsterdam Schiphol Airport where LVNL (ATC), KNMI (MET provider), KLM and the airport authority jointly developed a tool to establish the probability of a capacity reduction at AMS airport on the next operational day. The key idea is to make optimum use of available capacity by enabling the respective parties to plan for the most likely scenario. There appear to be considerable differences between airports regarding procedures applied during bad weather conditions (separation minima on final approach at reduced visibility, acceptable crosswind values, etc). Airport communities should be encouraged to identify and share best practice procedures. Moreover, the feasibility and economic viability of MLS and time based sequencing tools should be further explored and results should be shared with all interested parties.
7.2.4. Controlling arrival flows into airports
ATFM regulations are not a suitable to “fine-tune” arrival flows as they are implemented several hours in advance and only achieve an accuracy in the order of 5 to 10 minutes. In contrast, airborne techniques such as linear and circular holdings are usually available at short notice and can therefore target small excesses in demand effectively with minimal capacity wastage. The optimum solution appears to be a strategy which combines and balances the following techniques in order to enhance the quality of the arrival flow into airports:
• realistic airport scheduling (and de-peaking of schedules if necessary) to ensure that the mean traffic flow does not exceed the airport departure and arrival capacities, hence avoiding delays built-in to schedules (see also previous section);
• ATFM take-off slots (15 minutes wide) in exceptional cases, when there is a significant imbalance between demand and available capacity;
• en-route flight sequencing in the tactical phase (ATC delivery accuracy better than 1 minute); and,
• local sequencing tools such as vectoring/ holding to smooth the residual variance. Well balanced airport strategies combined with a continuous, pre-sequenced high quality arrival flow have the potential to reduce ground delays to nearly zero in normal conditions. Traffic flow peaks and troughs would be balanced principally at high altitude and only marginally the terminal area. This would be less costly in fuel burn and environmental impact than holding at low altitude. Further work is also required in order to find strategies, which balance economic and environmental interests.
POSSIBLE ACTION AREAS FOR IMPROVING AIR TRANSPORT PUNCTUALITY Punctuality drivers at major European airports
- 49 -
8. GLOSSARY
ACC Area Control Centre AEA Association of European Airlines AIP Aeronautical Information Publication
Airport Slot The permission given by a coordinator in accordance with EC Regulation 793/2004 to use the full range of airport infrastructure necessary to operate an air service at a coordinated airport on a specific date and time for the purpose of landing or take-off as allocated by a coordinator.
AMS Amsterdam Airport Schiphol, The Netherlands ANM ATFM Notification Message
ANS Air Navigation Service. A generic term describing the totality of services provided in order to ensure the safety, regularity and efficiency of air navigation and the appropriate functioning of the air navigation system.
ANSP Air Navigation Services Provider
ATC Air Traffic Control. A service operated by the appropriate authority to promote the safe, orderly and expeditious flow of air traffic.
ATCO Air Traffic Controller ATCSCC Air Traffic Control System Command Centre ATFCM Air Traffic Flow and Capacity Management
ATFM
Air Traffic Flow Management. ATFM is established to support ATC in ensuring an optimum flow of traffic to, from, through or within defined areas during times when demand exceeds, or is expected to exceed, the available capacity of the ATC system, including relevant aerodromes. SES definition: “A function established with the objective of contributing to a safe, orderly and expeditious flow of air traffic by ensuring that ATC capacity is utilised to the maximum extent possible, and that the traffic volume is compatible with the capacities declared by the appropriate air traffic service providers”.
ATFM delay (CFMU) The duration between the last Take-Off time requested by the aircraft operator and the Take-Off slot given by the CFMU
ATFM measure Refers to all type of flow management measures (e.g. level-capping etc). ATFM regulations Refers to ATFM measures which hold the aircraft at the airport of departure.
ATM
Air Traffic Management. A system consisting of a ground part and an air part, both of which are needed to ensure the safe and efficient movement of aircraft during all phases of operation. The airborne part of ATM consists of the functional capability which interacts with the ground part to attain the general objectives of ATM. The ground part of ATM comprises the functions of Air Traffic Services (ATS), Airspace Management (ASM) and Air Traffic Flow Management (ATFM). Air traffic services are the primary components of ATM.
AUP Airspace Use Plan
Bad weather For the purpose of this report, “bad weather” is defined as any weather condition (e.g. strong wind, low visibility, snow) which causes a significant drop in the available airport capacity.
BCN Barcelona Airport, Spain Block time The time between off-block at the departure airport and on-block at the destination airport CAA Civil Aviation Authority CASA Computer Allocated Slot Allocation CDG Paris Charles de Gaulle Airport, France CDM Collaborative Decision Making. http://www.euro-cdm.org/ CFMU EUROCONTROL Central Flow Management Unit CODA EUROCONTROL Central Office for Delay Analysis
Co-ordinated airport Any airport where, in order to land or take-off, it is necessary for an air carrier or any other aircraft operator to have been allocated a slot by a coordinator, with the exception of State flights, emergency landings and humanitarian flights.
CPS Capacity Prognosis tool developed at Amsterdam airport Schiphol
- 50 -
CTOT Calculated Take-Off Time EAW Early Access to Weekend Routes eCODA Enhanced Central Office for Delay Analysis (EUROCONTROL) EC European Commission EOBT Estimated Off Block Time ESP En-route Spacing Program ETA Estimated Time of Arrival ETFMS Enhanced Tactical Flow Management System
EUROCONTROL The European Organisation for the Safety of Air Navigation. It comprises Member States and the Agency
FAA Federal Aviation Administration, United States FAP Future ATM Profile FCO Rome Fiumicino Airport, Italy
FIR Flight Information Region. An airspace of defined dimensions within which flight informantion service and alerting service are provided
FMP Flow Management Position FPL Filed Flight Plan FRA Frankfurt Airport, Germany FSA Flight Schedule Analyzer GDP Ground Delay Program (US) IATA International Air Transport Association
IFR Instrument Flight Rules. Properly equipped aircraft are allowed to fly under bad weather conditions following instrument flight rules
ILS Instrument Landing System KPI Key Performance Indicator LHR London Heathrow Airport, United Kingdom LVNL Luchtverkeersleiding Nederland, ANS Provider in The Netherlands MAD Madrid Barajas Airport, Spain MET Meteorology MIT Miles in Trail MLS Microwave Landing System MUC Munich Airport, Germany MXP Milan Malpensa Airport, Italy NATS National Air Traffic Services, ANS Provider in United Kingdom POET Post operations Evaluation Tool PRC Performance Review Commission
Primary delay The result of initial delays caused to a given flight. Delay causes are usually grouped into categories such as weather, ATC, etc
PRR Performance Review Report PRU Performance Review Unit
Punctuality The proportion of flights delayed by more than 15 minutes compared to published departure and arrival times (off-block / on-block versus scheduled times)
RAD Route Availability Document Reactionary delay Delay caused by the late arrival of aircraft or crew from previous journeys RNDSG Route Network Development Sub-Group RPL Repetitive Flight Plan RTA Requested Time of Arrival
Schedule drifts Is the difference between the actual and scheduled arrival or departure times, which may be caused by a number of reasons (e.g. weather, technical problems, ATFM reasons).
Separation minima Separation Minima is the minimum required distance between aircraft. Vertically usually

- 51 -
1000 ft below flight level 290, 2000 ft above flight level 290. Horizontally, depending on the radar, 3NM or more. In the absence of radars horizontal separation is achieved through time separation (e.g. 15 minutes between passing a certain navigation point).
Slot (ATFM) A time window assigned to an IFR flight for ATFM purposes STATFOR Specialist Panel on Air Traffic Statistics and Forecast Taxi-in For the purpose of this report, the time from touch-down to arrival block time
Taxi-out For the purpose of this report, the time from off-block to take-off, including eventual holding before take-off
TMA Terminal Management Area TWR Traffic Controlled Tower UK United Kingdom US United States of America
VFR Visual Flight Rules. Under clear weather conditions (VMC), aircraft are allowed to fly using visual navigation. Most small aircraft use visual navigation as they do not have proper equipment to permit IFR navigation.
VIE Vienna Airport, Austria ZRH Zurich Airport, Switzerland

- 52 -
9. REFERENCES
i University of Westminster “Evaluating the true cost to airlines of one minute of airborne or ground delay” (2004), http://www.eurocontrol.int/prc/index.html.
ii Performance Review Commission, Seventh Performance Review Report (PRR 7), An assessment of Air Traffic Management in Europe during the calendar year 2003 (April 2004), http://www.eurocontrol.int/prc/index.html.
iii Council Regulation (EC) No 95/93 of 18 January 1993 on common rules for the allocation of slots at Community airports Official Journal L 014 , 22/01/1993 P. 0001 – 0006.
iv Regulation (EC) No 793/2004 of the European Parliament and of the Council of 21 April 2004 amending Council Regulation (EEC) No 95/93 on common rules for the allocation of slots at Community airports Official Journal L 138 , 30/04/2004 P. 0050 - 0060
v Performance Review Commission, Eighth Performance Review Report (PRR 8), An assessment of Air Traffic Management in Europe during the calendar year 2004 (April 2005), http://www.eurocontrol.int/prc/index.html.
vi CFMU Operations Executive Summary – Edition 2002.
vii IATA Worldwide Scheduling Guidelines, 10th Edition, Effective 1 July 2004.
viii The Institute of Economic Affairs, “A market in airport slots”, London 2003.
ix UK NATS, “A guide to runway capacity”, 2003.
x EUROCONTROL, “Tasking Support for the consistency between airport slots, FPL and ATFM slots”, 2004.

© European Organisation for the Safety of Air Navigation (EUROCONTROL)EUROCONTROL, 96, rue de la Fusée, B-1130 Brussels, Belgium
http://www.eurocontrol.int
This document is published in the interest of the exchange of information and may be copied in whole or in part providing that the copy-right notice and disclaimer are included. The information contained in this document may not be modified without prior written per-mission from the Performance Review Unit.
The views expressed herein do not necessarily reflect the official views or policy of EUROCONTROL, which makes no warranty, eitherimplied or express, for the information contained in this document, neither does it assume any legal liability or responsibility for theaccuracy, completeness or usefulness of this information.