report on susceptibility of salmonella serotypes in
TRANSCRIPT

CODA-CERVA
Veterinary and Agrochemical Research Centre
Report on susceptibility of Salmonella serotypes in Belgium, 2013
P. Butaye
Introduction
Salmonella is one of the most important bacterial zoonotic agents in Belgium as well as in the rest of
Europe (EFSA Journal 2014; 12(2):3547). Though in general, infections in humans do not require treatment,
in some cases, treatment may be lifesaving in some cases. Therefore, surveillance for resistance in
Salmonella from animals is of importance. Next to this direct resistance transfer, indirect resistance
transmission may happen: resistance genes on mobile genetic elements may be transferred from
Salmonella spp. to commensal human bacteria and eventually to human pathogens.
Salmonella may cause also health problems in animals as has been shown in bovines and to a lesser extend
in pigs.
Materials and methods
Salmonella strains were sent to CODA-CERVA by diagnostic laboratories for serotyping and antimicrobial
susceptibility testing. Part of them were in the framework of the official program FAVV-AFSCA (Poultry,
pigs, adult cattle and calves). Care was taken for the susceptibility testing to include only one strain of a
certain serotype per farm/animal/“other source” (i.e. for which the origin was not well described) per
sampling point. An official epidemiological surveillance programme based on isolation was on-going in
poultry in 2013. In pigs, the control programme was mainly based on serology with occasional bacterial
isolations.
Strains were plated on Columbia agar with 5% sheep blood, and 1 to 3 colonies were suspended in sterile
distilled water to an optical density of 0.5 McFarland. Ten microliter of this suspension was inoculated in
11ml cation adjusted Mueller Hinton broth with TES buffer and susceptibility was tested using a micro
broth dilution method (Trek Diagnostics). Fifty microliter of the Mueller-Hinton broth with bacteria was
brought on a micro-titer plate with the antimicrobials lyophilised (EUMSV2 plate as produced by Trek
Diagnostics, using the auto-inoculating system of Trek Diagnostics). The concentrations tested are indicated
in Table 2 (grey zones are the concentrations tested).
Plates were incubated 18-24 hours at 35°C and read. The Minimal Inhibitory Concentration (MIC) was
defined as the lowest concentration by which no visible growth could be detected. MICs were semi-
automatically recorded by the Trek Vision system using the SWIN software. Results were automatically
exported to an Excel file.

CODA-CERVA
Scientific research at the service of safe food production and animal health
2/24
Analysis of data
Data from the Excel file containing the MIC results were merged with the administrative data from
CODA/CERVA’s LIMS and further validated for consistency. The Excel file was then imported into Access in
which the numbers of strains “having a MIC for a certain antibiotic” were calculated. These data were
subsequently exported to a second Excel file and interpreted for susceptibility using breakpoints based on
the EUCAST ECOFFs or as defined by the EU reference laboratory on antimicrobial resistance (DTU).
The number of resistant strains was counted and resistance percentages were calculated. Confidence
intervals for the binomial distribution were calculated using a visual basic application in Excel. A 95%
symmetrical two-sided confidence interval was used with p=0.05. The lower and upper bound of
confidence interval for the population proportion was calculated.
Based on the Pearsons chi-square test, and where appropriate the Fischer exact test, significance of the
differences were calculated. This was also done to compare the data between the different years.
Multi-resistance was determined by transforming the MIC data into resistant (R) and susceptible (S).
Number of antimicrobials to which a strain was resistant was counted and cumulative percentages were
calculated. The modal number of antimicrobials to which 50% of the strains was resistant was calculated.
Graphical representations were prepared in Excel.
Table 1. Abbreviations of antibiotics
Abbreviation
AMP Ampicillin CHL Chloramphenicol CIP Ciprofloxacin COL Colistin FFN Florfenicol FOT Cefotaxime GEN Gentamicin KAN Kanamycin NAL Nalidixic acid SMX Sulphonamide STR Streptomycin TAZ Ceftazidime TET Tetracycline TMP Trimethoprim

CODA-CERVA
Scientific research at the service of safe food production and animal health
3/24
Results
The susceptibility data of Salmonella are presented in different ways. Table 2 gives a general overview of all
strains tested, followed by the presentation of the resistance by serotype (Table 3). In Table 4 the
resistance is shown by origin of the strains (animal species) and finally Table 5 shows the multi-resistance
amongst Salmonella isolates. Tables 6 to 8 show the evolution of resistance since 2011.
All Salmonella
The results on all Salmonella isolates (Table 2) largely depend on the distribution of the different serotypes:
some serotypes do not seem to acquire resistances easily, while others are frequently multi-resistant.
Overall, 42.3% of Salmonella was susceptible against the 14 molecules tested.
Most resistance was found against sulphonamides (39.8%) and ampicillin (34.7%). Slightly lower is
streptomycin resistance (32.5%) and significantly lower are the other antibiotics. Resistance against
trimethoprim and tetracycline is approximately 30%, while resistance against chloramphenicol,
ciprofloxacin and nalidixic acid is between 10 and 20% (respectively 11.0%, 18.0% and 15.5%). Resistance
against other molecules is below 5% except for colistin resistance which was approximately 7%. However, it
should be noted that some serotypes have a natural lower susceptibility for this antibiotic (such as S.
Enteritidis and S. Dublin) and the high prevalence should be abstracted from the prevalence of these
serotypes in the sample. The more S. Enteritidis and S. Dublin present, the higher the resistance of all
Salmonella against this antibiotic.
The combination of sulphonamide and trimethoprim resistance, as calculated from the data obtained by
the separate compounds, was 23.8%. This figure is quite similar to what was obtained for trimethoprim
alone (29.5%).
The number of cephalosporin resistance strains is much lower than in former years with only 24 strains
being resistant, most of them originating from poultry and some from pigs. One strain was isolated from
feed. The serotype most involved was S. Paratyphi B (16 strains). Two S. Typhimurium and two monophasic
variant isolates were also cephalosporin resistant. The other serotypes involved were S. Enteritidis, S.
Anatum, S. Derby and S. Agona (each one strain).
High level ciprofloxacin resistance (MIC >4 µg/ml) is limited to one strain. Twenty-six strains were resistant
to ciprofloxacin while nalidixic acid susceptible. This may be explained by the presence of plasmid mediated
quinolone resistance. Frequently, the plasmids on which these genes are located are carrying multiple
resistance genes. In the strains analysed, this multi-resistance was not evident. A large diversity of
serotypes was involved of which S. Typhimurium and its monophasic variant were the most frequently
encountered serotypes. Further studies on this resistance should bring more clarity into the situation.
Chloramphenicol resistance remains relatively high, with 11.0% of the strains being resistant. It should be
noted that florfenicol resistance was at a little more than 3%, and this type of resistance gives cross-
resistance to chloramphenicol. However, 8% is still attributed to the “old gene” that only inactivates
chloramphenicol (Schwarz eta l., 2004). Florfenicol resistance is found mainly in S. Typhimurium and its
monophasic variant, which can be due to the presence of the Salmonella Genomic Island. Aminoglycoside
resistance, with the exception of streptomycin, remains low.

CODA-CERVA
Scientific research at the service of safe food production and animal health
4/24
Salmonella serotypes
In Table 3, resistance according to the different Salmonella serotypes is presented. Specific serotypes were
chosen based on their prevalence and on their importance for animal and public health. S. Typhimurium
(n=174), monophasic S. Typhimurium (n=55), S. Derby (n=92) and S. Paratyphi B (n=87) are the most
prevalent serotypes. As compared to 2012 (n=95), the number of S. Enteritidis has dropped to 62 strains.
This serotype, together with S. Dublin, belongs to the most susceptible Salmonella and likewise influences
significantly the overall resistance when analysing all serotypes together. Other serotypes were far lower in
numbers. Amongst the group “others” (i.e. for which the origin was not well described) are numerous
strains with few strains per serotype. As the confidence interval for the prevalence of resistance of these
serotypes is quite large, these results are of little information.
S. Typhimurium, S. Paratyphi B and monophasic S. Typhimurium are amongst the most resistant serotypes
with highest resistance against ampicillin (>40%) and by large also for sulphonamides (>50%), streptomycin
(>40%) and tetracyclines (>30%). Comparing S. Typhimurium and its monophasic variant, resistance in the
latter is higher. Striking is the resistance against (fluoro)quinolones (85.1%) and trimethoprim (97,7%)
which are extremely high in S. Paratyphi B and not in S. Typhimurium (14.3% and 26.2%, respectively) nor
its monophasic variant (13.0% and 53.7%, respectively). S. Paratyphi B is also the serotype in which
cephalosporin resistance is highest (>18%). Cephalosporin resistance in S. Typhimurium was a little more
than 1%, which is substantially lower than in 2012.
The clonal spread of the resistance to ciprofloxacin and nalidixic acid in S. Paratyphi B shows that it is very
well integrated into the population and that it will only disappear by eliminating the strains rather than by
other means. It should be noted however that none of the strains had high level of resistance (MICs were
≤2 µg/ml) suggesting that there are no strains having the two typical mutations associated with high level
resistance (Giraud et al., 2006). The higher number of resistance against ciprofloxacin (85.1%) compared to
nalidixic acid (83.9%) may be explained by the presence of plasmid mediated quinolone resistance.
While last year S. Minnesota was quite an abundant serotype (n= 128 in 2012), this is not the case in 2013
(n=20). S. Derby is now the third most prevalent serotype (n=92). Contrary to S. Minnesota, S. Derby
originates mainly from pigs. This serotype is quite susceptible to most antibiotics with the notable
exceptions of sulphonamides (44.6%) and streptomycin (29.3%). Of notice is also the rise of S. Livingstone
(n=26, 55 and 71 in 2011, 2012 and 2013 respectively), also associated with both poultry and pigs.
Resistance in this serotype is of a similar level as S. Enteritidis: very few resistance was found. It should be
noted that the high level of colistin resistance in S. Enteritidis (54.8%), and also S. Dublin (85.7%), is because
their normal susceptibility towards this antibiotic is lower than for other Salmonella serotypes, and as such
this should not be regarded as acquired resistance.
In S. Infantis, cephalosporin resistance has disappeared completely.
Strain origin
Table 4 shows the results of the Salmonella isolates per animal species. Most strains originated from
poultry (n=443). In this animal species there is an official Salmonella control programme based on isolation.
In pigs, from which the second largest group of strains originate (n= 322), the control programme is mainly
based on serology with occasional bacterial isolations. It is clear that resistance is highest is strains from

CODA-CERVA
Scientific research at the service of safe food production and animal health
5/24
pigs, which is due to the abundance in pigs of serotypes most associated with resistance (S. Typhimurium
and monophasic S. Typhimurium). Of notice is the significantly higher resistance against fluoroquinolones in
poultry as compared to pig isolates (27.8%; 6.8% in pig strains). Also cephalosporin resistance (FOT and
TAZ: 4.1%; 1.6% in pig strains) is higher in poultry, albeit non-significant.
Few strains are from pigeons (n=14) and cattle (n=39) and these are mainly isolated for diagnostic reasons.
For feed (n=100) there is a quality control programme in which feed is checked for the presence of
pathogens and contaminants, amongst them Salmonella. Few resistance are present in the Salmonella
isolated from feed.
Overall, more than 40% of the strains remained susceptible to all antibiotics tested (Table 5), Which is
marginally lower to what has been found in 2012 (29.2%). Multi-resistance (defined as resistant to 3 or
more antibiotics) was seen in approximately 35% of the strains. Taking into account that S. Enteritidis and S.
Dublin strains should not be regarded as resistant, 45.9% of the strains are fully susceptible, but the multi-
resistance did not change (due to the fact that this was mostly the only resistance in these strains).
The strain resistant to eleven of the antibiotics tested was a monophasic S. Typhimurium and of the 4
strains resistant to 10 antibiotics, 3 were S. Paratyphi B and one was a S. Typhimurium O5-. Typically these
strains were susceptible to colistin. The 12 strains resistant to 9 antibiotics were all but two S. Paratyphi B
and all were susceptible to gentamicin. One strain was colistin resistant and most were resistant to
cephalosporins. Most of these strains were from poultry origin.
Comparison 2011, 2012 and 2013
Table 6 summarizes the data of overall resistance found in Salmonella from the period 2011-2013. In 2013
the number of strains analysed has decreased by approximately 20% (n=1163 in 2012; n=931 in 2013). Due
to the variation in the rates of serotypes amongst the tested strains, the table should be interpreted with
care. By and large resistance prevalence remained the same. The difference found for colistin may be
explained by the fact that in 2012, quite more S. Dublin strains were tested. The decline in cephalosporin
resistance may be explained in by the fact that fewer S. Paratyphi B strains were tested. The large variability
in (fluoro)quinolone resistance may be influenced by the fact that this resistance is not transferable and
spreads clonally. The large variation in the origin of Salmonella isolates, as well as the sample that is each
year different (as demonstrated by the multitude of serotypes and different resistance profiles) may cause
such variations.
Table 7 gives an overview of resistance data in the most frequently isolated Salmonella serotypes from
2011 to 2013. Numbers of strains tested were sometimes low causing large confidence intervals,
complicating the interpretation of results. There are also large variations between years, especially for S.
Derby of which the numbers tested increased substantially in 2013 (n=18, 19 and 92 in 2011, 2012 and
2013, respectively) and S. Livingstone (n=26, 55 and 71, respectively) and monophasic S. Typhimurium
(n=55, 65 and 123, respectively) that are present in larger mount since 2011. Serotypes that decreased in
number are S. Paratyphi B, S. Rissen, S. Minnesota and S. Typhimurium. Some striking features were the
disappearance of fluoroquinolone resistance in S. Enteritidis (7.9%; 21.1% and 0.0%, respectively),
suggesting that other clones are present in the population. Also in this serotype, the resistance against

CODA-CERVA
Scientific research at the service of safe food production and animal health
6/24
cephalosporins (FOT: 1.6%, 14.7% and 1.6%, respectively, TAZ: 0.0%, 13.7% and 1.6%, respectively) has
diminished albeit non-significantly (p 0.0732). Also resistance against other antibiotics seem to have
diminished although also not significantly. In S. Infantis, fluoroquinolone resistance seems to increase
(4.9%, 15.2% and 27.3%, respectively). This may be due to the spread of a specific clone, as has been shown
before for S. Infantis and other serotypes (Cloeckaert et al., 2007; Butaye et al., 2006). The numbers of S.
Livingstone increased over the years, but resistance in this serotype remains low. The numbers of S.
Minnesota in the sample dropped substantially in 2013 and this does not allow to observe eventual
differences in resistance figures in this species. Looking at the data of S. Paratyphi B, where the number of
strains in 2013 was about half that in 2011 and 2012, there are quite some differences. Resistance against
ampicillin dropped substantially (81.1%, 74.8% and 43.7%, respectively) concomitant with cephalosporin
resistance although for the latter, there was no significant difference. Chloramphenicol resistance increased
from about 2% to nearly 37%. This increase was not caused by an increase in florfenicol resistance (this
resistance is cross-resistant with chloramphenicol resistance, but the other way round is not true). It should
be noted that chloramphenicol is not used since a long time, and thus there should be a co-resistance
selection involved. This was not clear from the database, however, it should be noted that strains resistant
to chloramphenicol are in general resistant to at least 4 different antibiotics. Also streptomycin (28.3%,
34.2% and 46.0%, respectively) and tetracycline resistance (13.2%, 25.2% and 33.3%, respectively)
increased over the 3 years. Trimethoprim resistance remains at an extremely high prevalence with nearly
all the strains being resistant (> 90%). The number of monophasic S. Typhimurium nearly doubled last 3
years, but here are no striking evolutions: resistance remains high and the differences seen are not
significant. Contrary to the monophasic S. Typhimurium, the number of S. Typhimurium (both O5+ and O5-)
decreased over the period 2011 to 2013, also here resistance remained largely the same with only non-
significant differences.
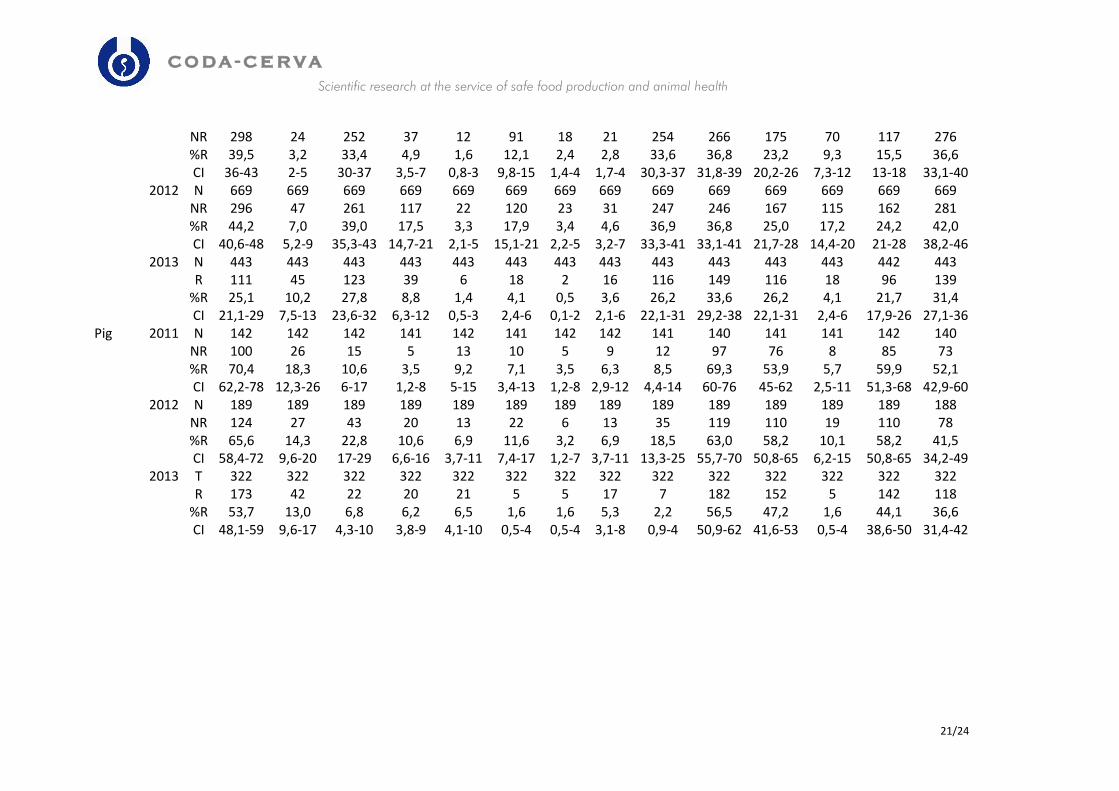
Looking at the differences according to the animal species (Table 8), β-lactam resistance in strains from
poultry decreased (AMP: 39.5%, 44.2% and 25.1%, respectively) while chloramphenicol resistance
increased (3.2%, 7.0% and 10.2%, respectively), which is mainly caused by the evolution of S. Paratyphi B.
The evolution of colistin resistance should be disregarded since this is mainly caused by the proportion of S.
Enteritidis, which is intrinsically less susceptible to colistin. No striking other evolutions were noted. As in
poultry, ampicillin resistance declined in pigs (70.4%, 65.6% and 53.7%, respectively) but this was without
an increase of chloramphenicol resistance. The number of strains from bovines is too low to make any
conclusion. Strains from pigeons, albeit the numbers are also low, remain susceptible to most antibiotics.
The strains from feed, important since they can bring in new resistance genes in animal production, are at
the low side with no obvious evolution apart from a decrease in ampicillin resistance.
Conclusions of report
The evaluation of resistance in Salmonella is hampered by the different serotypes present as these have
their own behaviour in the different animal populations. There are some major changes in prevalence of
the different serotypes which influence the overall analysis of the data.
It seem that overall, β-lactam resistance has diminished, which may be due to the fact that cephalosporin
use in poultry has stopped. On the other hand, this type of resistance decreased also among pig strains.
Striking is that the reduction of β-lactam resistance in poultry isolates was concomitant with an increase in

CODA-CERVA
Scientific research at the service of safe food production and animal health
7/24
chloramphenicol resistance, an antibiotic not used anymore for more than 20 years. This evolution was not
observed in pigs.
The highest levels of resistance were seen in Salmonella strains from poultry and pigs, though from other
animal species, few strains were isolated and care should be taken with the interpretation.
The interaction of the different resistances and the complex epidemiology of the different serotypes make
the analysis very complicated and a better interpretation of the data can only be obtained by more in depth
molecular epidemiological studies.

CODA-CERVA
Scientific research at the service of safe food production and animal health
8/24
Tables
Table 2. Antimicrobial susceptibility of Salmonella serotypes of all origins Concentration AMP CHL CIP COL FFN FOT GEN KAN NAL SMX STR TAZ TET TMP
<=0.008 0 0 0 0 0 0 0 0 0 0 0 0 0 0
0.015 0 0 170 0 0 0 0 0 0 0 0 0 0 0 0.03 0 0 553 0 0 0 0 0 0 0 0 0 0 0 0.06 0 0 40 0 0 384 0 0 0 0 0 0 0 0
0.12 0 0 12 0 0 447 0 0 0 0 0 0 0 0 0.25 0 0 72 0 0 67 261 0 0 0 0 442 0 0 0.5 2 0 55 0 0 9 627 0 0 0 0 445 0 640
1 326 0 21 0 0 0 32 0 0 0 0 19 73 14 2 262 10 7 863 30 0 1 0 0 0 21 1 550 2
4 18 110 0 51 489 0 1 875 713 0 61 2 28 0
8 1 640 1 17 328 24 1 12 56 6 325 3 9 2
16 1 69 0 0 54 0 3 6 18 15 135 0 4 1
32 4 10 0 0 12 0 2 0 3 55 86 19 15 3
64 317 24 0 0 10 0 3 1 4 275 44 0 20 269 128 0 68 0 0 8 0 0 4 137 166 48 0 231 0 256 0 0 0 0 0 0 0 33 0 43 211 0 0 0
512 0 0 0 0 0 0 0 0 0 16 0 0 0 0 1024 0 0 0 0 0 0 0 0 0 6 0 0 0 0
>1024 0 0 0 0 0 0 0 0 0 349 0 0 0 0 Total tested 931 931 931 931 931 931 931 931 931 931 931 931 930 931
NR 323 102 168 68 30 24 10 44 144 371 303 24 270 275 %R 34,7 11,0 18,0 7,3 3,2 2,6 1,1 4,7 15,5 39,8 32,5 2,6 29,0 29,5 CI 31,6-38 9-13 15,6-21 5,7-9 2,2-5 1,7-4 0,5-2 3,5-6 13,2-18 36,7-43 29,5-36 1,7-4 26,1-32 26,6-33
Grey colour: concentrations tested; Line: breakpoint; N: Number; NR: Number resistant; %R per cent resistant; CI: confidence interval

CODA-CERVA
Scientific research at the service of safe food production and animal health
9/24
Table 3. Prevalence of resistance amongst selected serotypes
AMP CHL CIP COL FFN FOT GEN KAN NAL SMX STR TAZ TET TMP
Agona R 4 0 0 0 0 1 1 1 0 3 4 1 2 1
G 24 28 28 28 28 27 27 27 28 25 24 27 26 27 T 28 28 28 28 28 28 28 28 28 28 28 28 28 28
%R 14,3 0,0 0,0 0,0 0,0 3,6 3,6 3,6 0,0 10,7 14,3 3,6 7,1 3,6 CI 4-33 0-12 0-12 0-12 0-12 0,1-18 0,1-18 0,1-18 0-12 2,3-28 4-33 0,1-18 0,9-24 0,1-18
Derby R 17 3 3 1 2 1 0 0 1 41 27 1 13 16
G 75 89 89 91 90 91 92 92 91 51 65 91 79 76 T 92 92 92 92 92 92 92 92 92 92 92 92 92 92
%R 18,5 3,3 3,3 1,1 2,2 1,1 0,0 0,0 1,1 44,6 29,3 1,1 14,1 17,4 CI 11,1-28 0,7-9 0,7-9 0-6 0,3-8 0-6 0-4 0-4 0-6 34,2-55 20,3-40 0-6 7,7-23 10,3-27
Dublin R 0 3 2 6 0 0 0 0 2 3 2 0 0 0
G 7 4 5 1 7 7 7 7 5 4 5 7 7 7 T 7 7 7 7 7 7 7 7 7 7 7 7 7 7
%R 0,0 42,9 28,6 85,7 0,0 0,0 0,0 0,0 28,6 42,9 28,6 0,0 0,0 0,0 CI 0-41 9,9-82 3,7-71 42,1-100 0-41 0-41 0-41 0-41 3,7-71 9,9-82 3,7-71 0-41 0-41 0-41
Enteritidis R 4 0 0 34 0 1 0 0 0 4 3 1 2 3
G 58 62 62 28 62 61 62 62 62 58 59 61 60 59 T 62 62 62 62 62 62 62 62 62 62 62 62 62 62
%R 6,5 0,0 0,0 54,8 0,0 1,6 0,0 0,0 0,0 6,5 4,8 1,6 3,2 4,8 CI 1,8-16 0-6 0-6 41,7-68 0-6 0-9 0-6 0-6 0-6 1,8-16 1-13 0-9 0,4-11 1-13
Havana R 3 0 1 0 0 0 0 0 1 1 0 0 0 1
G 9 12 11 12 12 12 12 12 11 11 12 12 12 11 T 12 12 12 12 12 12 12 12 12 12 12 12 12 12
%R 25,0 0,0 8,3 0,0 0,0 0,0 0,0 0,0 8,3 8,3 0,0 0,0 0,0 8,3 CI 5,5-57 0-26 0,2-38 0-26 0-26 0-26 0-26 0-26 0,2-38 0,2-38 0-26 0-26 0-26 0,2-38

CODA-CERVA
Scientific research at the service of safe food production and animal health
10/24
Table 3 continued.
AMP CHL CIP COL FFN FOT GEN KAN NAL SMX STR TAZ TET TMP
Idikan R 2 0 0 1 0 0 0 0 0 2 2 0 1 1
G 9 11 11 10 11 11 11 11 11 9 9 11 10 10 T 11 11 11 11 11 11 11 11 11 11 11 11 11 11
%R 18,2 0,0 0,0 9,1 0,0 0,0 0,0 0,0 0,0 18,2 18,2 0,0 9,1 9,1 CI 2,3-52 0-28 0-28 0,2-41 0-28 0-28 0-28 0-28 0-28 2,3-52 2,3-52 0-28 0,2-41 0,2-41
Infantis R 2 2 9 0 1 0 0 0 7 8 3 0 7 1
G 31 31 24 33 32 33 33 33 26 25 30 33 26 32 T 33 33 33 33 33 33 33 33 33 33 33 33 33 33
%R 6,1 6,1 27,3 0,0 3,0 0,0 0,0 0,0 21,2 24,2 9,1 0,0 21,2 3,0 CI 0,7-20 0,7-20 13,3-46 0-11 0,1-16 0-11 0-11 0-11 9-39 11,1-42 1,9-24 0-11 9-39 0,1-16
Livingston R 5 3 3 0 0 0 0 1 2 9 4 0 3 7
G 66 68 68 71 71 71 71 70 69 62 67 71 68 64 T 71 71 71 71 71 71 71 71 71 71 71 71 71 71
%R 7,0 4,2 4,2 0,0 0,0 0,0 0,0 1,4 2,8 12,7 5,6 0,0 4,2 9,9 CI 2,5-17 0,9-13 0,9-13 0-5 0-5 0-5 0-5 0-8 0,4-11 6,4-24 1,7-15 0-5 0,9-13 4,4-21
Mbandaka R 3 3 1 0 0 0 0 2 1 4 3 0 3 3
G 21 21 23 24 24 24 24 22 23 20 21 24 21 21 T 24 24 24 24 24 24 24 24 24 24 24 24 24 24
%R 12,5 12,5 4,2 0,0 0,0 0,0 0,0 8,3 4,2 16,7 12,5 0,0 12,5 12,5 CI 2,7-32 2,7-32 0,1-24 0-14 0-14 0-14 0-14 jan/27 0,1-24 4,7-32 2,7-32 0-14 2,7-32 2,7-32
Minnesota R 9 1 4 1 1 0 0 1 2 10 5 0 4 9
G 11 19 16 19 19 20 20 19 18 10 15 20 16 11 T 20 20 20 20 20 20 20 20 20 20 20 20 20 20
%R 45 5 20 5 5 0 0 5 10 50 25 0 20 45 CI 23,1-68 0,1-25 5,7-44 0,1-25 0,1-25 0-17 0-17 0,1-25 1,2-32 27,2-73 8,7-49 0-17 5,7-44 23,1-68

CODA-CERVA
Scientific research at the service of safe food production and animal health
11/24
Table 3 continued.
AMP CHL CIP COL FFN FOT GEN KAN NAL SMX STR TAZ TET TMP
Paratyphi B R 38 32 74 2 3 16 1 12 73 53 40 16 29 85
G 49 55 13 85 84 71 86 75 14 34 47 71 58 2 T 87 87 87 87 87 87 87 87 87 87 87 87 87 87
%R 43,7 36,8 85,1 2,3 3,4 18,4 1,1 13,8 83,9 60,9 46,0 18,4 33,3 97,7 CI 33,1-55 26,7-48 75,8-92 0,3-8 0,7-10 10,9-28 0-6 7,3-23 74,5-91 49,9-71 35,2-57 10,9-28 23,6-44 91,9-100
Rissen R 5 4 1 0 1 0 0 0 0 6 3 0 9 5
G 17 18 21 22 21 22 22 22 22 16 19 22 13 17 T 22 22 22 22 22 22 22 22 22 22 22 22 22 22
%R 22,7 18,2 4,5 0,0 4,5 0,0 0,0 0,0 0,0 27,3 13,6 0,0 40,9 22,7 CI 7,8-45 5,2-40 0,1-23 0-15 0,1-23 0-15 0-15 0-15 0-15 10,7-50 2,9-35 0-15 20,7-64 7,8-45
Monophasic S. Typhimurium variant R 100 17 16 7 8 2 3 11 11 108 100 2 97 66
G 23 106 107 116 115 121 120 112 112 15 23 121 25 57 T 123 123 123 123 123 123 123 123 123 123 123 123 122 123
%R 81,3 13,8 13,0 5,7 6,5 1,6 2,4 8,9 8,9 87,8 81,3 1,6 79,5 53,7 CI 73,3-88 8,3-21 7,6-20 2,3-11 2,8-12 0,2-6 0,5-7 4,5-15 4,5-15 80,7-93 73,3-88 0,2-6 70,6-86 44,4-63
Typhimurium R 99 28 22 8 13 2 3 12 17 81 77 2 70 41
G 55 126 132 146 141 152 151 142 137 73 77 152 84 113 T 154 154 154 154 154 154 154 154 154 154 154 154 154 154
%R 64,3 18,2 14,3 5,2 8,4 1,3 1,9 7,8 11,0 52,6 50,0 1,3 45,5 26,6 CI 56,2-72 12,4-25 9,2-21 2,3-10 4,6-14 0,2-5 0,4-6 4,1-13 6,6-17 44,4-61 41,8-58 0,2-5 37,4-54 19,!-34
Others R 40 12 39 8 2 2 2 4 31 48 36 2 41 47
G 174 202 175 206 212 212 212 210 183 166 178 212 173 167 T 214 214 214 214 214 214 214 214 214 214 214 214 214 214
%R 18,7 5,6 18,2 3,7 0,9 0,9 0,9 1,9 14,5 22,4 16,8 0,9 19,2 22,0 CI 13,7-25 2,9-10 13,3-24 1,6-7 0,1-3 0,1-3 0,1-3 0,5-5 10,1-20 17-29 12,1-23 0,1-3 14,1-25 16,6-28

CODA-CERVA
Scientific research at the service of safe food production and animal health
12/24
Table 4. Antimicrobial resistance in Salmonella serotypes according to their origin
AMP CHL CIP COL FFN FOT GEN KAN NAL SMX STR TAZ TET TMP
Poultry R 111 45 123 39 6 18 2 16 116 149 116 18 96 139
G 332 398 320 404 437 425 441 427 327 294 327 425 346 304 T 443 443 443 443 443 443 443 443 443 443 443 443 442 443
%R 25,1 10,2 27,8 8,8 1,4 4,1 0,5 3,6 26,2 33,6 26,2 4,1 21,7 31,4 CI 21,1-29 7,5-13 23,6-32 6,3-12 0,5-3 2,4-6 0,1-2 2,1-6 22,1-31 29,2-38 22,1-31 2,4-6 17,9-26 27,1-36
Pigs R 173 42 22 20 21 5 5 17 7 182 152 5 142 118
G 149 280 300 302 301 317 317 305 315 140 170 317 180 204 T 322 322 322 322 322 322 322 322 322 322 322 322 322 322
%R 53,7 13,0 6,8 6,2 6,5 1,6 1,6 5,3 2,2 56,5 47,2 1,6 44,1 36,6 CI 48,1-59 9,6-17 4,3-10 3,8-9 4,1-10 0,5-4 0,5-4 3,1-8 0,9-4 50,9-62 41,6-53 0,5-4 38,6-50 31,4-42
Bovines R 20 6 12 7 2 0 1 3 12 15 14 0 10 6
G 19 33 27 32 37 39 38 36 27 24 25 39 29 33 T 39 39 39 39 39 39 39 39 39 39 39 39 39 39
%R 51,3 15,4 30,8 17,9 5,1 0,0 2,6 7,7 30,8 38,5 35,9 0,0 25,6 15,4 CI 34,8-68 5,9-31 17-48 7,5-34 0,6-17 0-9 0,1-39 1,6-21 17-48 23,4-55 21,2-53 0-9 13-42 5,9-31
Pigeons R 1 0 0 1 0 0 0 0 0 1 1 0 1 1
G 13 14 14 13 14 14 14 14 14 13 13 14 13 13 T 14 14 14 14 14 14 14 14 14 14 14 14 14 14
%R 7,1 0,0 0,0 7,1 0,0 0,0 0,0 0,0 0,0 7,1 7,1 0,0 7,1 7,1 CI 0,2-34 0-23 0-23 0,2-34 0-23 0-23 0-23 0-23 0-23 0,2-34 0,2-34 0-23 0,2-34 0,2-34
Feed R 13 8 10 0 1 1 2 8 8 20 15 1 17 10
G 87 92 90 100 99 99 98 92 92 80 85 99 83 90 T 100 100 100 100 100 100 100 100 100 100 100 100 100 100
%R 13 8 10 0 1 1 2 8 8 20 15 1 17 10 CI 7,1-21 3,5-15 4,9-18 0-4 0-5 0-5 0,2-7 3,5-15 3,5-15 12,7-29 8,6-24 0-5 10,2-26 4,9-18

CODA-CERVA
Scientific research at the service of safe food production and animal health
13/24
Table 5. Multi-resistance in Salmonella isolates
N antimicrobials N strains N strains cumulative % strains % strains cumulative
0 394 394 42,3 42,3 1 106 500 11,4 53,7 2 50 550 5,4 59,1 3 60 610 6,4 65,5 4 104 714 11,2 76,7 5 85 799 9,1 85,8 6 57 856 6,1 91,9 7 36 892 3,9 95,8 8 22 914 2,4 98,2 9 12 926 1,3 99,5
10 4 930 0,4 99,9 11 1 931 0,1 100,0 12 0 931 0,0 100,0 13 0 931 0,0 100,0 14 0 931 0,0 100,0

CODA-CERVA
Scientific research at the service of safe food production and animal health
14/24
Table 6. Comparison of antimicrobial susceptibility of Salmonella serotypes of all origins (2011 versus 2012).
AMP CHL CIP COL FFN FOT GEN KAN NAL SMX STR TAZ TET TMP
2011 N 1159 1160 1160 1158 1160 1158 1160 1158 1158 1158 1158 1157 1160 1156
NR 471 69 298 64 36 111 24 33 297 446 306 85 262 386 %R 40,6 5,9 25,7 5,5 3,1 9,6 2,1 2,8 25,6 38,5 26,4 7,3 22,6 33,4 CI 37,8-44 4,7-7 23,2-28 4,3-7 2,2-4 7,9-11 1,3-3 2-4 23,2-28 35,7-41 23,9-29 5,9-9 20,2-25 30,6-36
2012 N 1163 1163 1163 1163 1163 1163 1163 1163 1163 1163 1163 1163 1163 1162
NR 513 139 393 241 50 161 40 62 374 490 371 147 339 418 %R 44,1 12,0 33,8 20,7 4,3 13,8 3,4 5,3 32,2 42,1 31,9 12,6 29,1 36,0 CI 41,2-47 10,1-14 31,1-37 18,4-23 3,2-6 11,9-16 2,5-5 4,1-7 29,5-35 39,3-45 29,2-35 10,8-15 26,5-32 33,2-39
2013 N 931 931 931 931 931 931 931 931 931 931 931 931 930 931
NR 323 102 168 68 30 24 10 44 144 371 303 24 270 275 %R 34,7 11,0 18,0 7,3 3,2 2,6 1,1 4,7 15,5 39,8 32,5 2,6 29,0 29,5 CI 31,6-38 9-13 15,6-21 5,7-9 2,2-5 1,7-4 0,5-2 3,5-6 13,2-18 36,7-43 29,5-36 1,7-4 26,1-32 26,6-33

CODA-CERVA
Scientific research at the service of safe food production and animal health
15/24
Table 7. Comparison of prevalence of resistance amongst selected serotypes (2011, 2012, and 2013).
AMP CHL CIP COL FFN FOT GEN KAN NAL SMX STR TAZ TET TMP
S. Agona 2011 N 24 24 24 24 24 24 24 24 24 24 24 24 24 24
NR 4 0 2 1 0 1 0 0 2 3 2 1 0 3
%R 16,7 0,0 8,3 4,2 0,0 4,2 0,0 0,0 8,3 12,5 8,3 4,2 0,0 12,5
CI 4,7-37 0-14 1-27 0,1-21 0-14 0,1-21 0-14 0-14 1-27 2,7-32 1-27 0,1-21 0-14 2,7-32
2012 N 19 19 19 19 19 19 19 19 19 19 19 19 19 19
NR 4 0 2 0 0 1 1 1 2 3 4 1 2 2
%R 21,1 0,0 10,5 0,0 0,0 5,3 5,3 5,3 10,5 15,8 21,1 5,3 10,5 10,5
CI 6,1-46 0-18 1,3-33 0-18 0-18 0,1-26 0,1-26 0,1-26 1,3-33 0,8-91 6,1-46 0,1-26 1,3-33 1,3-33
2013 N 28 28 28 28 28 28 28 28 28 28 28 28 28 28
R 4 0 0 0 0 1 1 1 0 3 4 1 2 1
%R 14,3 0,0 0,0 0,0 0,0 3,6 3,6 3,6 0,0 10,7 14,3 3,6 7,1 3,6
CI 4-33 0-12 0-12 0-12 0-12 0,1-18 0,1-18 0,1-18 0-12 2,3-28 4-33 0,1-18 0,9-24 0,1-18
S. Derby 2011 N 18 18 18 18 18 18 18 18 18 17 18 18 18 18
NR 3 2 3 0 1 2 0 0 3 8 4 2 7 4
%R 16,7 11,1 16,7 0,0 5,6 11,1 0,0 0,0 16,7 47,1 22,2 11,1 38,9 22,2
CI 3,6-41 1,4-35 3,6-41 0-19 0,1-27 1,4-35 0-19 0-19 3,6-41 21,5-69 6,4-48 1,4-35 17,3-64 6,4-48
2012 N 19 19 19 19 19 19 19 19 19 19 19 19 19 19
NR 3 1 3 0 0 1 0 0 4 8 3 1 5 4
%R 15,8 5,3 15,8 0,0 0,0 5,3 0,0 0,0 21,1 42,1 15,8 5,3 26,3 21,1
CI 3,4-19 0,1-26 3,4-19 0-18 0-18 0,1-26 0-18 0-18 6,1-46 20,3-67 3,4-19 0,1-26 9,1-51 6,1-46
2013 N 92 92 92 92 92 92 92 92 92 92 92 92 92 92
R 17 3 3 1 2 1 0 0 1 41 27 1 13 16
%R 18,5 3,3 3,3 1,1 2,2 1,1 0,0 0,0 1,1 44,6 29,3 1,1 14,1 17,4
CI 11,1-28 0,7-9 0,7-9 0-6 0,3-8 0-6 0-4 0-4 0-6 34,2-55 20,3-40 0-6 7,7-23 10,3-27

CODA-CERVA
Scientific research at the service of safe food production and animal health
16/24
Table 7 continued.
AMP CHL CIP COL FFN FOT GEN KAN NAL SMX STR TAZ TET TMP
S. Enteriditis 2011 N 64 64 63 63 64 63 64 64 63 63 63 63 64 63
NR 5 2 5 39 0 1 1 0 5 8 5 0 2 3
%R 7,8 3,1 7,9 61,9 0,0 1,6 1,6 0,0 7,9 12,7 7,9 0,0 3,1 4,8
CI 2,6-17 0,4-11 2,6-17 47,9-73 0-6 0-8 0-8 0-6 2,6-17 5,6-23 2,6-17 0-6 0,4-11 1,0-13
2012 N 95 95 95 95 95 95 95 95 95 95 95 95 95 95
NR 22 8 20 77 2 14 3 4 18 18 16 13 14 14
%R 23,2 8,4 21,1 81,1 2,1 14,7 3,2 4,2 18,9 18,9 16,8 13,7 14,7 14,7
CI 15,1-33 3,7-16 13,4-31 71,7-88 0,3-7 8,3-23 0,7-9 1,2-10 11,6-28 11,6-28 9,9-26 7,5-22 8,3-23 8,3-23
2013 N 62 62 62 62 62 62 62 62 62 62 62 62 62 62
R 4 0 0 34 0 1 0 0 0 4 3 1 2 3
%R 6,5 0,0 0,0 54,8 0,0 1,6 0,0 0,0 0,0 6,5 4,8 1,6 3,2 4,8
CI 1,8-16 0-6 0-6 41,7-68 0-6 0-9 0-6 0-6 0-6 1,8-16 1-13 0-9 0,4-11 1-13
S. Infantis 2011 N 41 41 41 41 41 41 41 41 41 39 41 41 41 41
NR 11 0 2 0 0 7 0 0 2 10 4 7 1 1
%R 26,8 0,0 4,9 0,0 0,0 17,1 0,0 0,0 4,9 25,6 9,8 17,1 2,4 2,4
CI 14,2-43 0-9 0,6-17 0-9 0-9 7,2-32 0-9 0-9 0,6-17 13-42 2,7-23 7,2-32 0,1-13 0,1-13
2012 N 33 33 33 33 33 33 33 33 33 33 33 33 33 33
NR 7 0 5 4 0 4 3 2 5 6 3 4 2 5
%R 21,2 0,0 15,2 12,1 0,0 12,1 9,1 6,1 15,2 18,2 9,1 12,1 6,1 15,2
CI 9-39 0-11 5,1-32 3,4-28 0-11 3,4-28 1,9-24 0,7-20 5,1-32 7-35 1,9-24 3,4-28 0,7-20 5,1-32
2013 N 33 33 33 33 33 33 33 33 33 33 33 33 33 33
R 2 2 9 0 1 0 0 0 7 8 3 0 7 1
%R 6,1 6,1 27,3 0,0 3,0 0,0 0,0 0,0 21,2 24,2 9,1 0,0 21,2 3,0
CI 0,7-20 0,7-20 13,3-46 0-11 0,1-16 0-11 0-11 0-11 9-39 11,1-42 1,9-24 0-11 9-39 0,1-16

CODA-CERVA
Scientific research at the service of safe food production and animal health
17/24
Table 7 continued.
AMP CHL CIP COL FFN FOT GEN KAN NAL SMX STR TAZ TET TMP
S. Livingstone 2011 N 26 26 26 26 26 26 26 26 26 26 26 25 26 26
NR 3 1 1 1 0 0 0 1 1 3 2 0 1 3
%R 11,5 3,8 3,8 3,8 0,0 0,0 0,0 3,8 3,8 11,5 7,7 0,0 3,8 11,5
CI 2,4-30 0,1-20 0,1-20 0,1-20 0-13 0-13 0-13 0,1-20 0,1-20 2,4-30 0,9-25 0-13 0,1-20 2,4-30
2012 N 55 55 55 55 55 55 55 55 55 55 55 55 55 55
NR 12 2 12 5 1 13 4 4 10 8 11 13 12 13
%R 21,8 3,6 21,8 9,1 1,8 23,6 7,3 7,3 18,2 14,5 20,0 23,6 21,8 23,6
CI 11,8-35 0,4-13 11,8-35 3-20 0-10 13,2-37 2-18 2-18 9,1-31 6,5-27 10,4-33 13,2-37 11,8-35 13,2-37
2013 N 71 71 71 71 71 71 71 71 71 71 71 71 71 71
R 5 3 3 0 0 0 0 1 2 9 4 0 3 7
%R 7,0 4,2 4,2 0,0 0,0 0,0 0,0 1,4 2,8 12,7 5,6 0,0 4,2 9,9
CI 2,5-17 0,9-13 0,9-13 0-5 0-5 0-5 0-5 0-8 0,4-11 6,4-24 1,7-15 0-5 0,9-13 4,4-21
S. Mbandaka 2011 N 21 21 21 21 21 21 21 21 21 20 21 21 21 21
NR 3 1 3 1 1 1 1 1 3 3 3 1 5 2
%R 14,3 4,8 14,3 4,8 4,8 4,8 4,8 4,8 14,3 15,0 14,3 4,8 23,8 9,5
CI 3-21 0,1-24 3-21 0,1-24 0,1-24 0,1-24 0,1-24 0,1-24 3-21 3-21 3-21 0,1-24 8,2-47 1,2-30
2012 N 29 29 29 29 29 29 29 29 29 29 29 29 29 29
NR 2 1 3 4 1 0 1 1 3 2 3 0 4 4
%R 6,9 3,4 10,3 13,8 3,4 0,0 3,4 3,4 10,3 6,9 10,3 0,0 13,8 13,8
CI 0,8-23 0,1-18 2,2-27 3,9-32 0,1-18 0-12 0,1-18 0,1-18 2,2-27 0,8-23 2,2-27 0-12 3,9-32 3,9-32
2013 T 24 24 24 24 24 24 24 24 24 24 24 24 24 24
R 3 3 1 0 0 0 0 2 1 4 3 0 3 3
%R 12,5 12,5 4,2 0,0 0,0 0,0 0,0 8,3 4,2 16,7 12,5 0,0 12,5 12,5
CI 2,7-32 2,7-32 0,1-24 0-14 0-14 0-14 0-14 1,0-27 0,1-24 4,7-32 2,7-32 0-14 2,7-32 2,7-32

CODA-CERVA
Scientific research at the service of safe food production and animal health
18/24
Table 7 continued.
AMP CHL CIP COL FFN FOT GEN KAN NAL SMX STR TAZ TET TMP
S. Minnesota 2011 N 78 78 78 78 78 78 78 78 78 68 78 78 78 77
NR 17 5 8 1 3 6 1 1 7 20 14 6 9 13
%R 21,8 6,4 10,3 1,3 3,8 7,7 1,3 1,3 9,0 29,4 17,9 7,7 11,5 16,9
CI 13,2-33 2,1-14 4,5-19 0-7 0,8-11 2,9-16 0-7 0-7 3,7-18 16,4-37 10,2-28 2,9-16 5,4-21 9,2-27
2012 N 128 128 128 128 128 128 128 128 128 128 128 128 128 128
NR 57 14 29 5 5 22 4 5 26 56 26 18 33 42
%R 44,5 10,9 22,7 3,9 3,9 17,2 3,1 3,9 20,3 43,8 20,3 14,1 25,8 32,8
CI 35,7-54 6,1-18 15,7-31 1,3-9 1,3-9 11,1-25 0,9-8 1,3-9 13,7-28 35-53 13,7-28 8,6-21 18,5-34 24,8-42
2013 N 20 20 20 20 20 20 20 20 20 20 20 20 20 20
R 9 1 4 1 1 0 0 1 2 10 5 0 4 9
%R 45 5 20 5 5 0 0 5 10 50 25 0 20 45
CI 23,1-68 0,1-25 5,7-44 0,1-25 0,1-25 0-17 0-17 0,1-25 1,2-32 27,2-73 8,7-49 0-17 5,7-44 23,1-68
S. ParatyphiB 2011 N 159 159 159 159 159 159 159 159 159 157 159 159 159 159
NR 129 3 133 1 1 46 2 9 132 95 45 35 21 155
%R 81,1 1,9 83,6 0,6 0,6 28,9 1,3 5,7 83,0 60,5 28,3 22,0 13,2 97,5
CI 74,2-87 0,4-5 77-89 0-3 0-3 22-37 0,2-4 2,6-10 76,3-89 51,7-67 21,5-36 15,8-29 8,4-19 93,7-99
2012 N 155 155 155 155 155 155 155 155 155 155 155 155 155 155
NR 116 10 141 13 3 46 4 11 141 80 53 41 39 145
%R 74,8 6,5 91,0 8,4 1,9 29,7 2,6 7,1 91,0 51,6 34,2 26,5 25,2 93,5
CI 67,2-81 3,1-12 85,3-95 4,5-14 0,4-6 22,6-38 0,7-6 3,6-12 85,3-95 43,5-60 26,8-42 19,7-34 18,5-33 88,5-97
2013 T 87 87 87 87 87 87 87 87 87 87 87 87 87 87
R 38 32 74 2 3 16 1 12 73 53 40 16 29 85
%R 43,7 36,8 85,1 2,3 3,4 18,4 1,1 13,8 83,9 60,9 46,0 18,4 33,3 97,7
CI 33,1-55 26,7-48 75,8-92 0,3-8 0,7-10 10,9-28 0-6 7,3-23 74,5-91 49,9-71 35,2-57 10,9-28 23,6-44 91,9-100

CODA-CERVA
Scientific research at the service of safe food production and animal health
19/24
Table 7 continued.
AMP CHL CIP COL FFN FOT GEN KAN NAL SMX STR TAZ TET TMP
S. Rissen 2011 N 62 63 63 62 63 62 63 63 62 61 62 62 63 62
NR 13 4 2 0 0 2 4 2 3 13 5 1 9 13
%R 21,0 6,3 3,2 0,0 0,0 3,2 6,3 3,2 4,8 21,3 8,1 1,6 14,3 21,0
CI 11,7-33 1,8-16 0,4-11 0-6 0-6 0,4-11 1,8-16 0,4-11 1-13 11,7-33 2,7-18 0-9 6,9-26 11,7-33
2012 N 35 35 35 35 35 35 35 35 35 35 35 35 35 35
NR 12 3 6 0 0 6 0 1 6 10 4 5 10 9
%R 34,3 8,6 17,1 0,0 0,0 17,1 0,0 2,9 17,1 28,6 11,4 14,3 28,6 25,7
CI 19,1-52 1,8-23 6,6-34 0-10 0-10 6,6-34 0-10 0,1-15 6,6-34 14,6-46 3,2-27 4,8-30 14,6-46 12,5-43
2013 N 22 22 22 22 22 22 22 22 22 22 22 22 22 22
R 5 4 1 0 1 0 0 0 0 6 3 0 9 5
%R 22,7 18,2 4,5 0,0 4,5 0,0 0,0 0,0 0,0 27,3 13,6 0,0 40,9 22,7
CI 7,8-45 5,2-40 0,1-23 0-15 0,1-23 0-15 0-15 0-15 0-15 10,7-50 2,9-35 0-15 20,7-64 7,8-45
S. O4,5,12:i:- 2011 N 55 55 55 55 55 55 55 55 55 52 55 55 55 55
NR 44 4 16 3 2 6 0 2 15 44 38 5 30 37
%R 80,0 7,3 29,1 5,5 3,6 10,9 0,0 3,6 27,3 84,6 69,1 9,1 54,5 67,3
CI 67-90 2-18 17,6-43 1,1-15 0,4-13 4,1-22 0-6 0,4-13 16,1-41 67-90 55,2-81 3-20 40,6-68 53,3-79
2013 N 65 65 65 65 65 65 65 65 65 65 65 65 65 64
NR 56 7 22 14 1 10 4 5 17 55 51 7 51 35
%R 86,2 10,8 33,8 21,5 1,5 15,4 6,2 7,7 26,2 84,6 78,5 10,8 78,5 54,7
CI 75,3-93 4,4-21 22,6-47 12,3-33 0-8 7,6-26 1,7-15 2,5-17 16-39 73,5-92 66,5-88 4,4-21 66,5-88 41-66
2013 N 123 123 123 123 123 123 123 123 123 123 123 123 122 123
R 100 17 16 7 8 2 3 11 11 108 100 2 97 66
%R 81,3 13,8 13,0 5,7 6,5 1,6 2,4 8,9 8,9 87,8 81,3 1,6 79,5 53,7
CI 73,3-88 8,3-21 7,6-20 2,3-11 2,8-12 0,2-6 0,5-7 4,5-15 4,5-15 80,7-93 73,3-88 0,2-6 70,6-86 44,4-63

CODA-CERVA
Scientific research at the service of safe food production and animal health
20/24
Table 7 continued.
AMP CHL CIP COL FFN FOT GEN KAN NAL SMX STR TAZ TET TMP
S. Typhimurium 2011 N 227 227 227 227 227 227 227 227 227 216 227 227 227 226
NR 141 36 29 4 25 11 2 7 30 142 115 10 103 80
%R 62,1 15,9 12,8 1,8 11,0 4,8 0,9 3,1 13,2 65,7 50,7 4,4 45,4 35,4
CI 55,5-60 11,4-21 8,7-18 0,5-4 7,3-16 2,4-9 0,1-7 1,2-6 9,1-18 55,6-69 44-57 2,1-8 38,8-52 29-42
2012 N 190 190 190 190 190 190 190 190 190 190 190 190 190 190
NR 136 36 40 15 25 17 5 10 33 126 108 17 104 70
%R 71,6 18,9 21,1 7,9 13,2 8,9 2,6 5,3 17,4 66,3 56,8 8,9 54,7 36,8
CI 64,6-78 13,6-25 15,5-28 4,5-13 8,7-19 5,3-14 0,9-6 2,6-9 12,3-24 59,1-73 49,5-64 5,3-14 47,4-62 30-44
2013 T 154 154 154 154 154 154 154 154 154 154 154 154 154 154
R 99 28 22 8 13 2 3 12 17 81 77 2 70 41
%R 64,3 18,2 14,3 5,2 8,4 1,3 1,9 7,8 11,0 52,6 50,0 1,3 45,5 26,6
CI 56,2-72 12,4-25 9,2-21 2,3-10 4,6-14 0,2-5 0,4-6 4,1-13 6,6-17 44,4-61 41,8-58 0,2-5 37,4-54 19,!-34
Other 2011 N 266 266 264 266 266 266 266 266 266 252 266 266 266 266
NR 74 9 55 13 3 20 4 8 56 75 40 13 42 59
%R 27,8 3,4 20,8 4,9 1,1 7,5 1,5 3,0 21,1 29,8 15,0 4,9 15,8 22,2
CI 22,5-34 1,6-6 16-26 2,6-8 0,2-3 4,7-11 0,4-4 1,3-6 16,3-26 24,2-36 11-20 2,6-8 11,6-21 17,3-28
2012 N 193 193 193 193 193 193 193 193 193 193 193 193 193 193
NR 64 13 57 21 8 19 6 9 56 58 45 21 51 59
%R 33,2 6,7 29,5 10,9 4,1 9,8 3,1 4,7 29,0 30,1 23,3 10,9 26,4 30,6
CI 26,6-40 3,6-11 23,2-37 6,9-16 1,8-8 42156 1,1-7 2,2-9 22,7-36 23,7-36 17,5-30 6,9-16 20,4-33 24,2-38
2013 T 214 214 214 214 214 214 214 214 214 214 214 214 214 214
R 40 12 39 8 2 2 2 4 31 48 36 2 41 47
%R 18,7 5,6 18,2 3,7 0,9 0,9 0,9 1,9 14,5 22,4 16,8 0,9 19,2 22,0
CI 13,7-25 2,9-10 13,3-24 1,6-7 0,1-3 0,1-3 0,1-3 0,5-5 10,1-20 17-29 12,1-23 0,1-3 14,1-25 16,6-28
Table 8. Comparison of antimicrobial resistance in Salmonella serotypes according to the animal isolated from (2011
versus 2012).
AMP CHL CIP COL FFN FOT GEN KAN NAL SMX Str TAZ TET TMP
Poultry 2011 N 755 756 755 755 756 755 756 756 755 722 755 754 756 754
CODA-CERVA
Scientific research at the service of safe food production and animal health
21/24
NR 298 24 252 37 12 91 18 21 254 266 175 70 117 276
%R 39,5 3,2 33,4 4,9 1,6 12,1 2,4 2,8 33,6 36,8 23,2 9,3 15,5 36,6
CI 36-43 2-5 30-37 3,5-7 0,8-3 9,8-15 1,4-4 1,7-4 30,3-37 31,8-39 20,2-26 7,3-12 13-18 33,1-40
2012 N 669 669 669 669 669 669 669 669 669 669 669 669 669 669
NR 296 47 261 117 22 120 23 31 247 246 167 115 162 281
%R 44,2 7,0 39,0 17,5 3,3 17,9 3,4 4,6 36,9 36,8 25,0 17,2 24,2 42,0
CI 40,6-48 5,2-9 35,3-43 14,7-21 2,1-5 15,1-21 2,2-5 3,2-7 33,3-41 33,1-41 21,7-28 14,4-20 21-28 38,2-46
2013 N 443 443 443 443 443 443 443 443 443 443 443 443 442 443
R 111 45 123 39 6 18 2 16 116 149 116 18 96 139
%R 25,1 10,2 27,8 8,8 1,4 4,1 0,5 3,6 26,2 33,6 26,2 4,1 21,7 31,4
CI 21,1-29 7,5-13 23,6-32 6,3-12 0,5-3 2,4-6 0,1-2 2,1-6 22,1-31 29,2-38 22,1-31 2,4-6 17,9-26 27,1-36
Pig 2011 N 142 142 142 141 142 141 142 142 141 140 141 141 142 140
NR 100 26 15 5 13 10 5 9 12 97 76 8 85 73
%R 70,4 18,3 10,6 3,5 9,2 7,1 3,5 6,3 8,5 69,3 53,9 5,7 59,9 52,1
CI 62,2-78 12,3-26 6-17 1,2-8 5-15 3,4-13 1,2-8 2,9-12 4,4-14 60-76 45-62 2,5-11 51,3-68 42,9-60
2012 N 189 189 189 189 189 189 189 189 189 189 189 189 189 188
NR 124 27 43 20 13 22 6 13 35 119 110 19 110 78
%R 65,6 14,3 22,8 10,6 6,9 11,6 3,2 6,9 18,5 63,0 58,2 10,1 58,2 41,5
CI 58,4-72 9,6-20 17-29 6,6-16 3,7-11 7,4-17 1,2-7 3,7-11 13,3-25 55,7-70 50,8-65 6,2-15 50,8-65 34,2-49
2013 T 322 322 322 322 322 322 322 322 322 322 322 322 322 322
R 173 42 22 20 21 5 5 17 7 182 152 5 142 118
%R 53,7 13,0 6,8 6,2 6,5 1,6 1,6 5,3 2,2 56,5 47,2 1,6 44,1 36,6
CI 48,1-59 9,6-17 4,3-10 3,8-9 4,1-10 0,5-4 0,5-4 3,1-8 0,9-4 50,9-62 41,6-53 0,5-4 38,6-50 31,4-42

CODA-CERVA
Scientific research at the service of safe food production and animal health
22/24
Table 8. Continued
AMP CHL CIP COL FFN FOT GEN KAN NAL SMX Str TAZ TET TMP
Bovines 2011 N 29 29 29 29 29 29 29 29 29 28 29 29 29 29
NR 8 5 2 11 1 0 0 1 3 16 10 0 9 4
%R 27,6 17,2 6,9 37,9 3,4 0 0 3,4 10,3 57,1 34,5 0 31 13,8
CI 12,7-47 5,8-36 0,8-23 20,7-58 0,1-18 0-12 0-12 0,1-18 2,2-27 37,2-76 17,9-54 0-12 15,3-51 3,9-32
2012 N 121 121 121 121 121 121 121 121 121 121 121 121 121 121
NR 37 54 51 83 12 8 6 9 54 74 54 4 24 15
%R 30,6 44,6 42,1 68,6 9,9 6,6 5,0 7,4 44,6 61,2 44,6 3,3 19,8 12,4
CI 22,5-40 35,6-54 33,2-51 59,5-77 5,2-17 2,9-13 1,8-10 3,5-14 35,6-54 51,9-70 35,6-54 0,9-8 13,1-28 7,1-20
2013 N 39 39 39 39 39 39 39 39 39 39 39 39 39 39
R 20 6 12 7 2 0 1 3 12 15 14 0 10 6
%R 51,3 15,4 30,8 17,9 5,1 0,0 2,6 7,7 30,8 38,5 35,9 0,0 25,6 15,4
CI 34,8-68 5,9-31 17-48 7,5-34 0,6-17 0-9 0,1-39 1,6-21 17-48 23,4-55 21,2-53 0-9 13-42 5,9-31
Pigeon 2011 N 16 16 16 16 16 16 16 16 16 13 16 16 16 16
NR 2 1 2 0 1 1 0 0 1 4 1 1 2 3
%R 12,5 6,3 12,5 0 6,3 6,3 0 0 6,3 30,8 6,3 6,3 12,5 18,8
CI 1,6-38 0,2-30 1,6-38 0-21 0,2-30 0,2-30 0-21 0-21 0,2-30 7,3-52 0,2-30 0,2-30 1,6-38 4-46
2012 N 10 10 10 10 10 10 10 10 10 10 10 10 10 10
NR 4 3 3 1 0 2 0 0 4 5 2 1 4 4
%R 40,0 30,0 30,0 10,0 0,0 20,0 0,0 0,0 40,0 50,0 20,0 10,0 40,0 40,0
CI 12,2-74 6,7-65 6,7-65 0,3-45 0-31 2,5-56 0-31 0-31 12,2-74 18,7-81 2,5-56 0,3-45 12,2-74 12,2-74
2013 N 14 14 14 14 14 14 14 14 14 14 14 14 14 14
R 1 0 0 1 0 0 0 0 0 1 1 0 1 1
%R 7,1 0,0 0,0 7,1 0,0 0,0 0,0 0,0 0,0 7,1 7,1 0,0 7,1 7,1
CI 0,2-34 0-23 0-23 0,2-34 0-23 0-23 0-23 0-23 0-23 0,2-34 0,2-34 0-23 0,2-34 0,2-34

CODA-CERVA
Scientific research at the service of safe food production and animal health
23/24
Table 8. Continued
AMP CHL CIP COL FFN FOT GEN KAN NAL SMX Str TAZ TET TMP
Feed 2011 N 122 122 119 122 122 122 122 122 122 119 122 122 122 122
NR 45 12 8 6 8 4 0 1 8 41 34 3 32 19
%R 36,9 9,8 6,7 4,9 6,6 3,3 0 0,8 6,6 34,5 27,9 2,5 26,2 15,6
CI 28,3-46 5,2-17 2,9-13 1,8-10 2,9-13 0,9-8 0-3 0-4 2,9-13 25,3-43 20,1-37 0,4-7 18,7-35 9,6-23
2012 N 100 100 100 100 100 100 100 100 100 100 100 100 100 100
NR 31 3 12 9 1 3 4 7 10 25 20 2 19 23
%R 31,0 3,0 12,0 9,0 1,0 3,0 4,0 7,0 10,0 25,0 20,0 2,0 19,0 23,0
CI 22,1-41 0,6-9 6,4-20 4,2-16 0-5 0,6-9 1,1-10 2,9-14 4,9-18 16,9-35 12,7-29 0,2-7 11,8-28 15,2-32
2013 N 100 100 100 100 100 100 100 100 100 100 100 100 100 100
R 13 8 10 0 1 1 2 8 8 20 15 1 17 10
%R 13 8 10 0 1 1 2 8 8 20 15 1 17 10
CI 7,1-21 3,5-15 4,9-18 0-4 0-5 0-5 0,2-7 3,5-15 3,5-15 12,7-29 8,6-24 0-5 10,2-26 4,9-18
Other 2011 N 95 95 94 95 95 95 95 95 95 90 95 95 95 95
NR 18 1 19 5 1 5 1 1 19 22 10 3 17 11
%R 18,9 1,1 20,2 5,3 1,1 5,3 1,1 1,1 20 24,4 10,5 3,2 17,9 11,6
CI 11,6-28 0-6 12,5-29 1,7-12 0-6 1,7-12 0-6 0-6 12,5-29 15,1-33 5,2-19 0,7-9 10,8-27 5,9-20
2012 N 67 67 67 67 67 67 67 67 67 67 67 67 67 67
NR 19 5 19 9 2 6 1 2 20 18 15 6 18 15
%R 28,4 7,5 28,4 13,4 3,0 9,0 1,5 3,0 29,9 26,9 22,4 9,0 26,9 22,4
CI 18-41 2,5-17 18-41 6,3-24 0,4-10 3,4-18 0-8 0,4-10 19,3-42 16,8-39 13,1-34 3,4-18 16,8-39 13,1-34
2013 N 214 214 214 214 214 214 214 214 214 214 214 214 214 214
R 40 12 39 8 2 2 2 4 31 48 36 2 41 47
%R 18,7 5,6 18,2 3,7 0,9 0,9 0,9 1,9 14,5 22,4 16,8 0,9 19,2 22,0
CI 13,7-25 2,9-10 13,3-24 1,6-7 0,1-3 0,1-3 0,1-3 0,5-5 10,1-20 17-29 12,1-23 0,1-3 14,1-25 16,6-28

CODA-CERVA
Scientific research at the service of safe food production and animal health
24/24
References
Molecular basis of bacterial resistance to chloramphenicol and florfenicol. Schwarz S, Kehrenberg C, Doublet B, Cloeckaert A. FEMS Microbiol Rev. 2004. 519-42.
Resistance to fluoroquinolones in Salmonella: emerging mechanisms and resistance prevention strategies. Giraud E, Baucheron S, Cloeckaert A. Microbes Infect. 2006, 1937-44.
Dissemination of an extended-spectrum-beta-lactamase blaTEM-52 gene-carrying IncI1 plasmid in various Salmonella enterica serovars isolated from poultry and humans in Belgium and France between 2001 and 2005. Cloeckaert A, Praud K, Doublet B, Bertini A, Carattoli A, Butaye P, Imberechts H, Bertrand S, Collard JM, Arlet G, Weill FX. Antimicrob Agents Chemother. 2007, 1872-5..
The clonal spread of multidrug-resistant non-typhi Salmonella serotypes. Butaye P, Michael GB, Schwarz S, Barrett TJ, Brisabois A, White DG. Microbes Infect. 2006, 1891-7.