report on the results of operations for bear valley...
TRANSCRIPT

Docket Exhibit Number Commissioner ALJ Witness
: : : : :
A.17-05-004 ORA-10 Rechtschaffen Ayoade Renaghan
OFFICE OF RATEPAYER ADVOCATES CALIFORNIA PUBLIC UTILITIES COMMISSION
Report on the Results of Operations
for Bear Valley Electric Service Division
General Rate Case Test Years 2018
Cost of Capital
San Francisco, California
September 29, 2017
i
TABLE OF CONTENTS
I. INTRODUCTION ..................................................................................... 1
II. SUMMARY OF RECOMMENDATIONS................................................... 1
III. DISCUSSION/ANALYSIS OF CAPITAL STRUCTURE ........................... 2
A. Overview of BVES’ Proposal ............................................................... 2
B. ORA’s Analysis ................................................................................... 2
IV. DISCUSSION/ANALYSIS OF RETURN ON COMMON EQUITY ............. 5
A. Overview of BVES Proposal ................................................................ 5
B. ORA’s Analysis .................................................................................... 5
C. Proxy Group ........................................................................................ 6
D. Discounted Cash Flow (DCF) ............................................................. 7
E. ORA’s DCF Model ............................................................................. 12
F. Historic Risk Premium (HRP) ............................................................ 17
G. ORA’s Historic Risk Premium Model ................................................. 20
H. Capital Asset Pricing Model .............................................................. 23
I. ORA’s Capital Asset Pricing Model ................................................... 27
J. Comparable Earnings ........................................................................ 29
K. ORA’s Approach ............................................................................... 30
L. Cost of Equity Summary .................................................................... 32
V. DISCUSSION/ANALYSIS OF COST OF LONG-TERM DEBT ............... 33
VI. WITNESS QUALIFICATIONS ................................................................ 33
1
BEAR VALLEY ELECTRIC SERVICE DIVISION 1
COST OF CAPITAL 2
I. INTRODUCTION 3
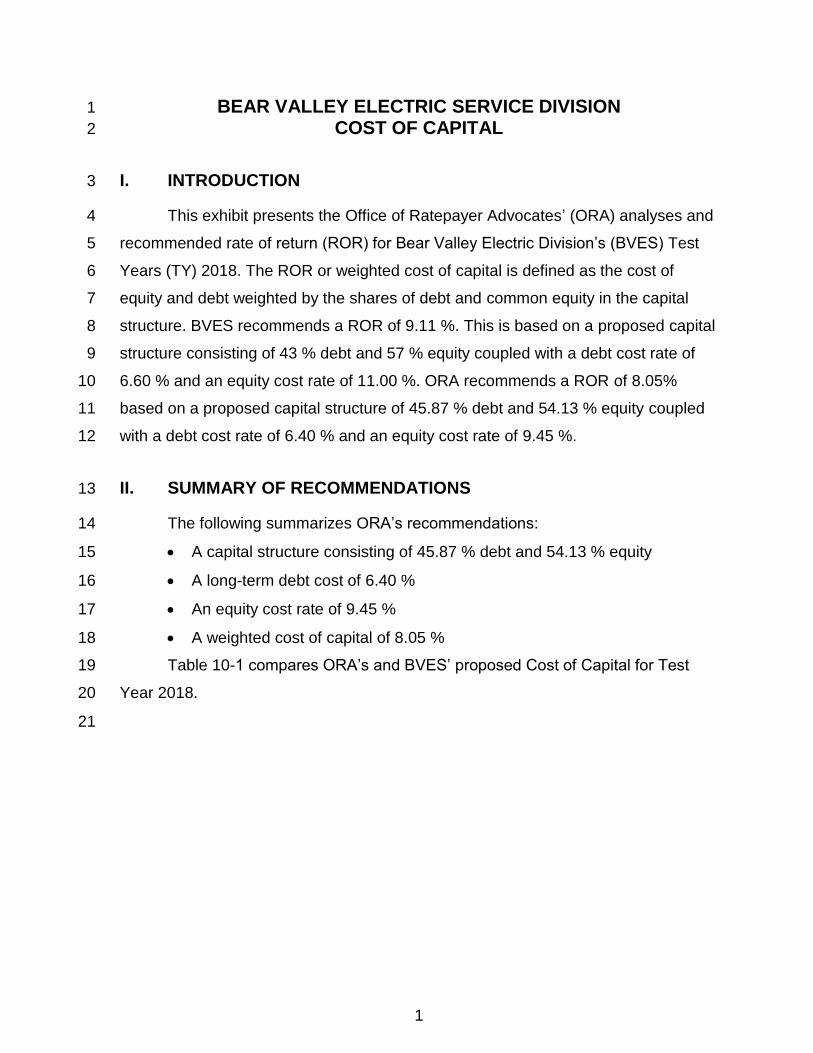
This exhibit presents the Office of Ratepayer Advocates’ (ORA) analyses and 4
recommended rate of return (ROR) for Bear Valley Electric Division’s (BVES) Test 5
Years (TY) 2018. The ROR or weighted cost of capital is defined as the cost of 6
equity and debt weighted by the shares of debt and common equity in the capital 7
structure. BVES recommends a ROR of 9.11 %. This is based on a proposed capital 8
structure consisting of 43 % debt and 57 % equity coupled with a debt cost rate of 9
6.60 % and an equity cost rate of 11.00 %. ORA recommends a ROR of 8.05% 10
based on a proposed capital structure of 45.87 % debt and 54.13 % equity coupled 11
with a debt cost rate of 6.40 % and an equity cost rate of 9.45 %. 12
II. SUMMARY OF RECOMMENDATIONS 13
The following summarizes ORA’s recommendations: 14
A capital structure consisting of 45.87 % debt and 54.13 % equity 15
A long-term debt cost of 6.40 % 16
An equity cost rate of 9.45 % 17
A weighted cost of capital of 8.05 % 18
Table 10-1 compares ORA’s and BVES’ proposed Cost of Capital for Test 19
Year 2018. 20
21

2
Table 10-1 1 BVES and ORA Proposed 2
Cost of Capital 3 Test Year 2018 4
5
Description DRA Recommended BVES Proposed1
Component (a)
Weight (b)
Rate (c)
Wtd. Cost (d=b*c)
Weight (e)
Rate (f)
Wtd. Cost (g=e*f)
Long-Term Debt 45.87 % 6.40 % 2.94 % 43.00 % 6.60 % 2.84 %
Preferred Equity 0.00 % 0.00 % 0.00 % 0.00 % 0.00 % 0.00 %
Common Equity 54.13 % 9.45 % 5.11 % 57.00 % 11.00 % 6.27 %
Total 100.00 % 8.05 % 100.00 % 9.11 %
III. DISCUSSION/ANALYSIS OF CAPITAL STRUCTURE 6
A. Overview of BVES’ Proposal 7
BVES recommends a capital structure consisting of 43% debt and 57% 8
equity. 9
B. ORA’s Analysis 10
ORA recommends that the Commission adopt a capital structure for 11
BVES consisting of 45.87% debt and 54.13% equity. This recommendation is 12
based on and consistent with ORA Water Division’s current Cost of Capital 13
Proceeding for the San Jose Water Company, Golden State Water Company, 14
California American Water, and California Water Service Company.2 In his 15
testimony, ORA witness Mr. Dawadi explains that his “recommendations are 16
based on the actual capital structures that applicants have reported to the 17
Commission in the corrected Annual Reports”.3 Mr. Dawadi notes that Golden 18
State Water Company, (GSWC), had added $11.8 million “to the amount of 19
1 Direct Testimony of Paul Moul, Bear Valley Electric Service, May 2017, Schedule 1, p. 1 of 2.
2 Direct Testimony of Mukunda Dawadi, Cost of Capital Proceeding, A.17-04-001, August 1, 2017.
3 Direct Testimony of Mukunda Dawadi, Office of Ratepayer Advocates, Cost of Capital Proceeding, A.17-04-001, August 1, 2018, p. 5.

3
equity they propose to use in their capital structures for ratemaking purposes, 1
which results in an artificial distortion of their actual capital structures.”4 2
Decision (D.)09-05-019 addressed this issue of the appropriate capital 3
structures for Water Utilities in California. D.09-05-019 concluded that: “we 4
find equity components in excess of 50% to be problematic and have 5
concerns about equity ratios less than 45%.”5 While D.09-05-019 primarily 6
pertained to Water Utilities, D.09-05-019 took “note that recently Southern 7
California Edison Company (SCE), San Diego Gas & Electric, (SDG&E), and 8
Pacific Gas and Electric Company (PG&E) were authorized equity ratios of 9
48%, 49% and 52%, respectively, all lower than…Golden State.”6 More 10
recently, D.12-12-034 established equity shares of 48% for SCE and 52% for 11
SDG&E, PG&E, and Southern California Gas Company (SoCalGas).7 The 12
equity share of 54.13% proposed by ORA is above the currently authorized 13
equity shares of the three major California electric utilities. 14
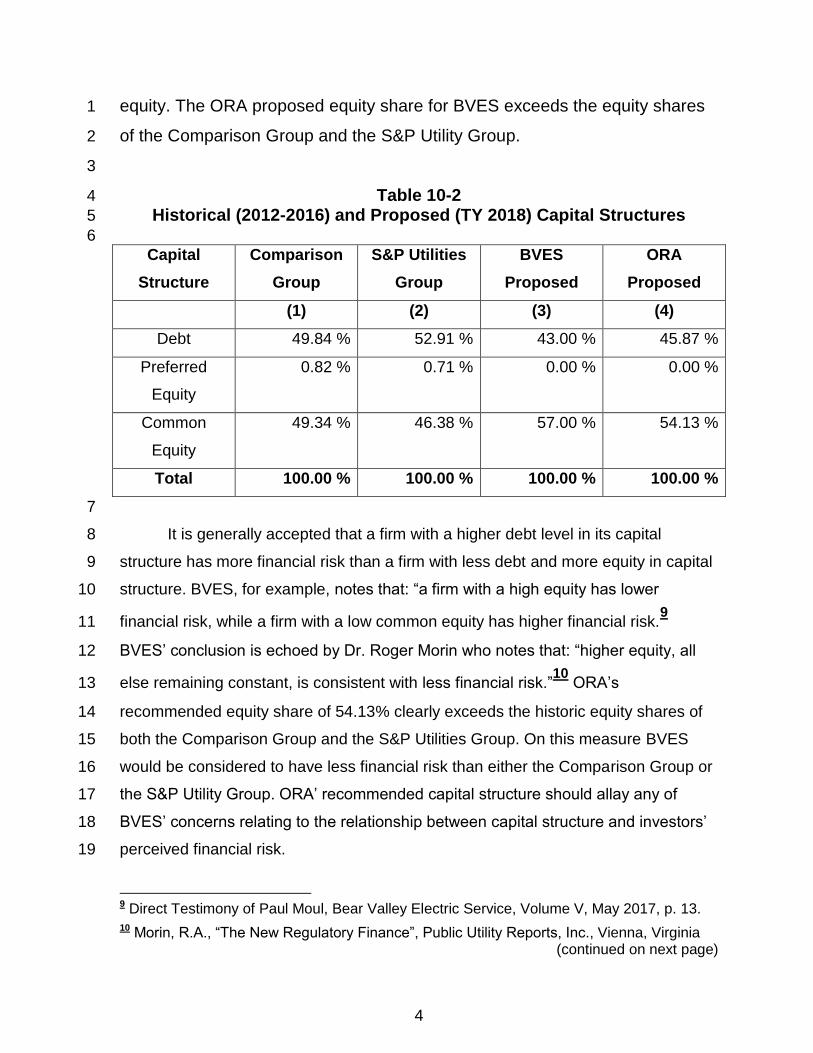
Table 10-2 compares BVES’ proposed capital structure to the average 15
capital structures of the Comparison Group and Standard & Poor’s Utility 16
Group over the period 2012 through 2016.8 Over this period the capital 17
structure of the Comparison Group averaged 49.84% long-term debt, 0.82% 18
preferred equity and 49.34% common equity. For the S&P Utility Group, long-19
term debt averaged 52.91%, preferred equity 0.66% and 46.38% common 20
4 Direct Testimony of Mukunda Dawadi, Office of Ratepayer Advocates, Cost of Capital Proceeding, A.17-04-001, August 1, 2018, p. 9.
5 D.09-05-019, Mimeo, May 7, 2009, p. 9.
6 D.09-05-019, Mimeo, May 7, 2009, p. 9.
7 D1.12-12-034, Mimeo, December 20, 2012, pp. 52-53.
8 BVES choice of the appropriate is discussed in greater detail in the Cost of Equity section of this testimony. BVES’ comparison group is based on the Utility West group of firms as defined by Value Line Investment Services.
4
equity. The ORA proposed equity share for BVES exceeds the equity shares 1
of the Comparison Group and the S&P Utility Group. 2
3
Table 10-2 4
Historical (2012-2016) and Proposed (TY 2018) Capital Structures 5
6
Capital
Structure
Comparison
Group
S&P Utilities
Group
BVES
Proposed
ORA
Proposed
(1) (2) (3) (4)
Debt 49.84 % 52.91 % 43.00 % 45.87 %
Preferred
Equity
0.82 % 0.71 % 0.00 % 0.00 %
Common
Equity
49.34 % 46.38 % 57.00 % 54.13 %
Total 100.00 % 100.00 % 100.00 % 100.00 %
7
It is generally accepted that a firm with a higher debt level in its capital 8
structure has more financial risk than a firm with less debt and more equity in capital 9
structure. BVES, for example, notes that: “a firm with a high equity has lower 10
financial risk, while a firm with a low common equity has higher financial risk.9 11
BVES’ conclusion is echoed by Dr. Roger Morin who notes that: “higher equity, all 12
else remaining constant, is consistent with less financial risk.”10
ORA’s 13
recommended equity share of 54.13% clearly exceeds the historic equity shares of 14
both the Comparison Group and the S&P Utilities Group. On this measure BVES 15
would be considered to have less financial risk than either the Comparison Group or 16
the S&P Utility Group. ORA’ recommended capital structure should allay any of 17
BVES’ concerns relating to the relationship between capital structure and investors’ 18
perceived financial risk. 19
9 Direct Testimony of Paul Moul, Bear Valley Electric Service, Volume V, May 2017, p. 13.
10 Morin, R.A., “The New Regulatory Finance”, Public Utility Reports, Inc., Vienna, Virginia (continued on next page)

5
IV. DISCUSSION/ANALYSIS OF RETURN ON COMMON EQUITY 1
A. Overview of BVES Proposal 2
To arrive at its recommended cost of equity of 11.0%, BVES relies upon 3
the results taken from several financial models. Specifically, BVES relies upon 4
the Discounted Cash Flow, (DCF), the Historic Risk Premium, (HRP), the 5
Capital Asset Pricing Model, (CAPM), and the Comparable Earnings, (CE), 6
models. BVES concludes that: “The average of all methods is 11.29%, 7
excluding flotation costs, and 11.40% including flotation costs. The median 8
values are 11.02%, excluding flotation costs, and 11.17% including flotation 9
costs. From these results, a reasonable return for the company would be at 10
least 11.0%.”11
11
B. ORA’s Analysis 12
ORA generally followed BVES’ approach, basing its cost of common 13
equity recommendations on the results obtained from the DCF, HRP and 14
CAPM models. ORA, however, does not rely upon the Comparable Earnings 15
approach to estimating the cost of equity capital. Relying upon the results 16
obtained from a variety of financial models is consistent with the approach 17
taken by the Commission in past decisions. D.09-05-019, for example, noted 18
that: “[T]he Commission has historically reviewed an array of models with 19
varied assumptions before exercising its judgment in adopting a return on 20
equity.”12
21
22
(continued from previous page) (2006), p. 91.
11 Direct Testimony of Paul Moul, Bear Valley Electric Service, Volume V, May 2017, p. 6.
12 D.09-05-019, Mimeo, May 7, 2009, p.15.
6
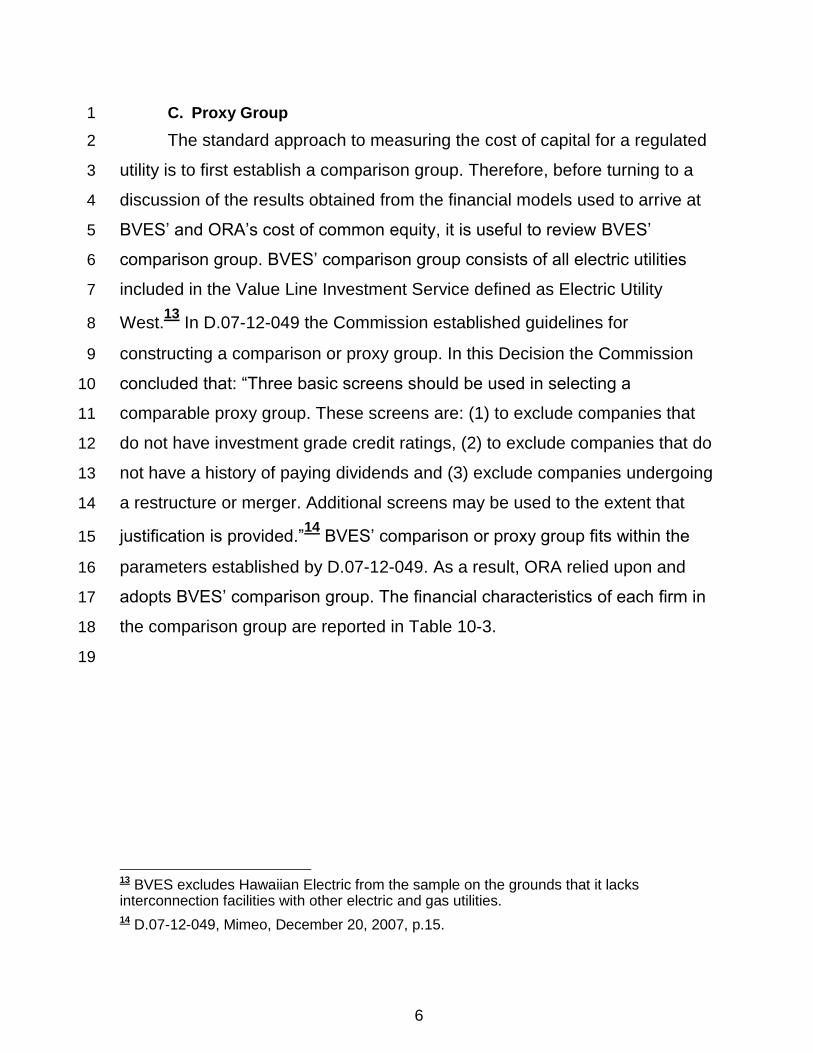
C. Proxy Group 1
The standard approach to measuring the cost of capital for a regulated 2
utility is to first establish a comparison group. Therefore, before turning to a 3
discussion of the results obtained from the financial models used to arrive at 4
BVES’ and ORA’s cost of common equity, it is useful to review BVES’ 5
comparison group. BVES’ comparison group consists of all electric utilities 6
included in the Value Line Investment Service defined as Electric Utility 7
West.13
In D.07-12-049 the Commission established guidelines for 8
constructing a comparison or proxy group. In this Decision the Commission 9
concluded that: “Three basic screens should be used in selecting a 10
comparable proxy group. These screens are: (1) to exclude companies that 11
do not have investment grade credit ratings, (2) to exclude companies that do 12
not have a history of paying dividends and (3) exclude companies undergoing 13
a restructure or merger. Additional screens may be used to the extent that 14
justification is provided.”14
BVES’ comparison or proxy group fits within the 15
parameters established by D.07-12-049. As a result, ORA relied upon and 16
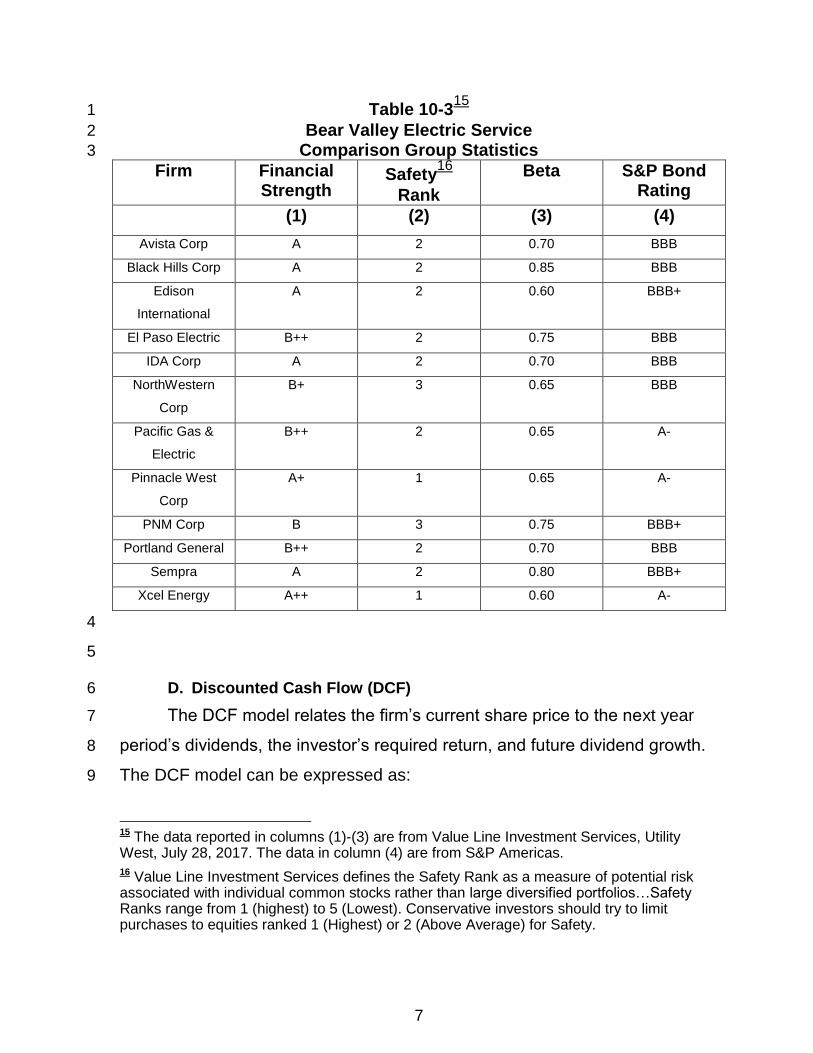
adopts BVES’ comparison group. The financial characteristics of each firm in 17
the comparison group are reported in Table 10-3. 18
19
13 BVES excludes Hawaiian Electric from the sample on the grounds that it lacks interconnection facilities with other electric and gas utilities.
14 D.07-12-049, Mimeo, December 20, 2007, p.15.
7
Table 10-315
1
Bear Valley Electric Service 2
Comparison Group Statistics 3
Firm Financial Strength
Safety16
Rank
Beta S&P Bond Rating
(1) (2) (3) (4)
Avista Corp A 2 0.70 BBB
Black Hills Corp A 2 0.85 BBB
Edison
International
A 2 0.60 BBB+
El Paso Electric B++ 2 0.75 BBB
IDA Corp A 2 0.70 BBB
NorthWestern
Corp
B+ 3 0.65 BBB
Pacific Gas &
Electric
B++ 2 0.65 A-
Pinnacle West
Corp
A+ 1 0.65 A-
PNM Corp B 3 0.75 BBB+
Portland General B++ 2 0.70 BBB
Sempra A 2 0.80 BBB+
Xcel Energy A++ 1 0.60 A-
4
5
D. Discounted Cash Flow (DCF) 6
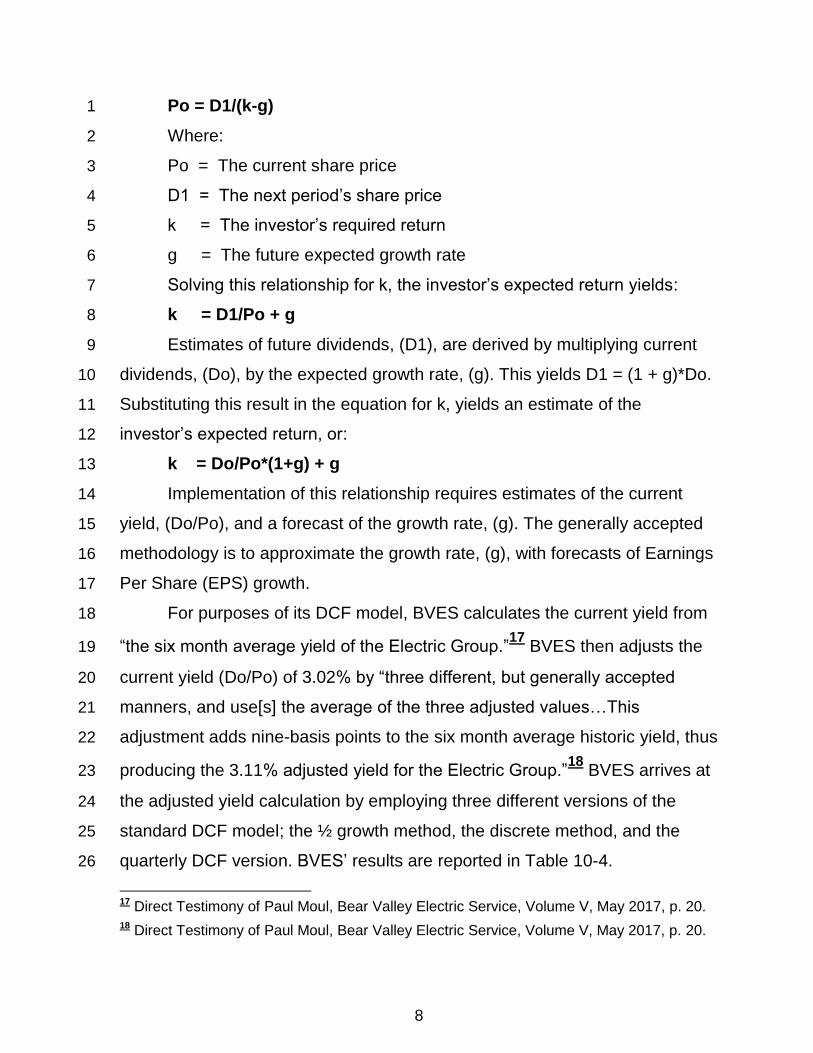
The DCF model relates the firm’s current share price to the next year 7
period’s dividends, the investor’s required return, and future dividend growth. 8
The DCF model can be expressed as: 9
15 The data reported in columns (1)-(3) are from Value Line Investment Services, Utility West, July 28, 2017. The data in column (4) are from S&P Americas.
16 Value Line Investment Services defines the Safety Rank as a measure of potential risk associated with individual common stocks rather than large diversified portfolios…Safety Ranks range from 1 (highest) to 5 (Lowest). Conservative investors should try to limit purchases to equities ranked 1 (Highest) or 2 (Above Average) for Safety.
8
Po = D1/(k-g) 1
Where: 2
Po = The current share price 3
D1 = The next period’s share price 4
k = The investor’s required return 5
g = The future expected growth rate 6
Solving this relationship for k, the investor’s expected return yields: 7
k = D1/Po + g 8
Estimates of future dividends, (D1), are derived by multiplying current 9
dividends, (Do), by the expected growth rate, (g). This yields D1 = (1 + g)*Do. 10
Substituting this result in the equation for k, yields an estimate of the 11
investor’s expected return, or: 12
k = Do/Po*(1+g) + g 13
Implementation of this relationship requires estimates of the current 14
yield, (Do/Po), and a forecast of the growth rate, (g). The generally accepted 15
methodology is to approximate the growth rate, (g), with forecasts of Earnings 16
Per Share (EPS) growth. 17
For purposes of its DCF model, BVES calculates the current yield from 18
“the six month average yield of the Electric Group.”17
BVES then adjusts the 19
current yield (Do/Po) of 3.02% by “three different, but generally accepted 20
manners, and use[s] the average of the three adjusted values…This 21
adjustment adds nine-basis points to the six month average historic yield, thus 22
producing the 3.11% adjusted yield for the Electric Group.”18
BVES arrives at 23
the adjusted yield calculation by employing three different versions of the 24
standard DCF model; the ½ growth method, the discrete method, and the 25
quarterly DCF version. BVES’ results are reported in Table 10-4. 26
17 Direct Testimony of Paul Moul, Bear Valley Electric Service, Volume V, May 2017, p. 20.
18 Direct Testimony of Paul Moul, Bear Valley Electric Service, Volume V, May 2017, p. 20.

9
Table 10-4 1
BVES Adjusted Yield Calculations 2
DCF Model Do/Po Growth D1/Po
(1) (2) (3) = (1)*(2)
½ Growth 3.02 % 1.03 19
3.11 %
Discrete 3.02 % 1.03722720
3.13 %
Quarterly 0.7550 %21
1.01467422
3.10 %23
Average 3.11 %
3
The results reported in Table 10-4 reflect an underlying growth rate of 4
6%. This growth rate is based on forecasted EPS growth rates from several 5
sources. Specifically, BVES explains that the: “projected earnings per share 6
growth rates for the Electric Group are 5.51% by IBES/First Call, 5.39% by 7
Zack’s, 5.56% by Morningstar, 6.15% by SNL, and 6.13% by Value Line.”24
8
Based on these projections, BVES concludes “that an investor expected 9
growth rate of 6% is a reasonable estimate of investor expected growth…”25
10
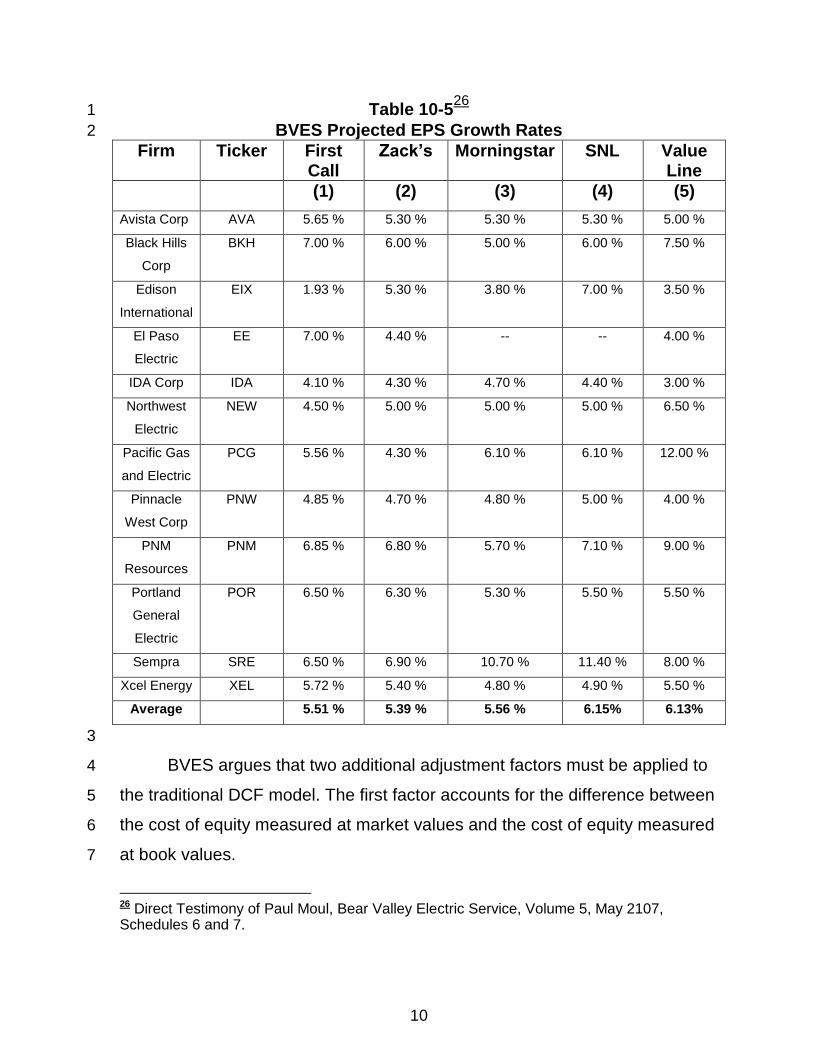
BVES’ projected EPS growth rates are reported in Table 10-5. 11
12
19 1.03 = (0.5*1.06)
20 1.037227 = (1.06)^.25 + (1.06)^.50 + (1.06)^.50 + (1.06)^1
21 0.7550 % = (3.02%/4)
22 1.014674 = (1.06)^0.25
23 3.10 % = (1+0.0075*1.01467)^.25 * 3.02 %
24 Direct Testimony of Paul Moul, Bear Valley Electric Service, May 2017, p. 27.
25 Direct Testimony of Paul Moul, Bear Valley Electric Service, Volume V, May 2017, p. 28.
10
Table 10-526
1
BVES Projected EPS Growth Rates 2
Firm Ticker First Call
Zack’s Morningstar SNL Value Line
(1) (2) (3) (4) (5)
Avista Corp AVA 5.65 % 5.30 % 5.30 % 5.30 % 5.00 %
Black Hills
Corp
BKH 7.00 % 6.00 % 5.00 % 6.00 % 7.50 %
Edison
International
EIX 1.93 % 5.30 % 3.80 % 7.00 % 3.50 %
El Paso
Electric
EE 7.00 % 4.40 % -- -- 4.00 %
IDA Corp IDA 4.10 % 4.30 % 4.70 % 4.40 % 3.00 %
Northwest
Electric
NEW 4.50 % 5.00 % 5.00 % 5.00 % 6.50 %
Pacific Gas
and Electric
PCG 5.56 % 4.30 % 6.10 % 6.10 % 12.00 %
Pinnacle
West Corp
PNW 4.85 % 4.70 % 4.80 % 5.00 % 4.00 %
PNM
Resources
PNM 6.85 % 6.80 % 5.70 % 7.10 % 9.00 %
Portland
General
Electric
POR 6.50 % 6.30 % 5.30 % 5.50 % 5.50 %
Sempra SRE 6.50 % 6.90 % 10.70 % 11.40 % 8.00 %
Xcel Energy XEL 5.72 % 5.40 % 4.80 % 4.90 % 5.50 %
Average 5.51 % 5.39 % 5.56 % 6.15% 6.13%
3
BVES argues that two additional adjustment factors must be applied to 4
the traditional DCF model. The first factor accounts for the difference between 5
the cost of equity measured at market values and the cost of equity measured 6
at book values. 7
26 Direct Testimony of Paul Moul, Bear Valley Electric Service, Volume 5, May 2107, Schedules 6 and 7.
11
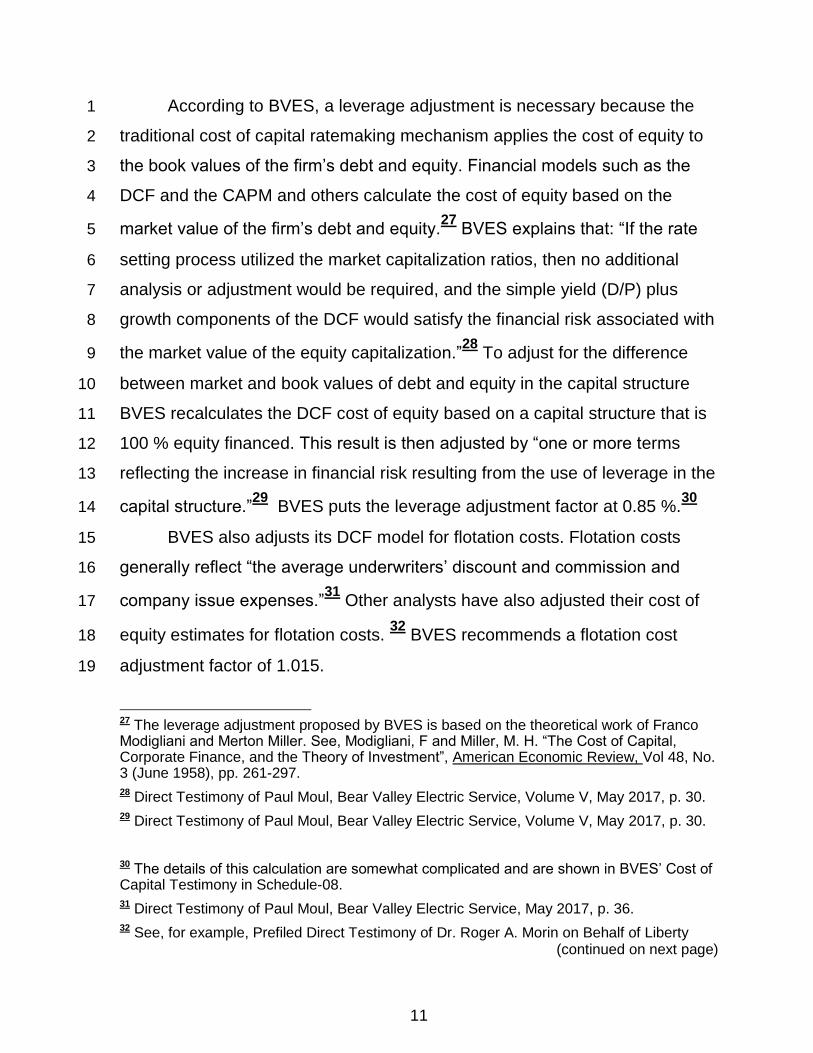
According to BVES, a leverage adjustment is necessary because the 1
traditional cost of capital ratemaking mechanism applies the cost of equity to 2
the book values of the firm’s debt and equity. Financial models such as the 3
DCF and the CAPM and others calculate the cost of equity based on the 4
market value of the firm’s debt and equity.27
BVES explains that: “If the rate 5
setting process utilized the market capitalization ratios, then no additional 6
analysis or adjustment would be required, and the simple yield (D/P) plus 7
growth components of the DCF would satisfy the financial risk associated with 8
the market value of the equity capitalization.”28
To adjust for the difference 9
between market and book values of debt and equity in the capital structure 10
BVES recalculates the DCF cost of equity based on a capital structure that is 11
100 % equity financed. This result is then adjusted by “one or more terms 12
reflecting the increase in financial risk resulting from the use of leverage in the 13
capital structure.”29
BVES puts the leverage adjustment factor at 0.85 %.30
14
BVES also adjusts its DCF model for flotation costs. Flotation costs 15
generally reflect “the average underwriters’ discount and commission and 16
company issue expenses.”31
Other analysts have also adjusted their cost of 17
equity estimates for flotation costs. 32
BVES recommends a flotation cost 18
adjustment factor of 1.015. 19
27 The leverage adjustment proposed by BVES is based on the theoretical work of Franco Modigliani and Merton Miller. See, Modigliani, F and Miller, M. H. “The Cost of Capital, Corporate Finance, and the Theory of Investment”, American Economic Review, Vol 48, No. 3 (June 1958), pp. 261-297.
28 Direct Testimony of Paul Moul, Bear Valley Electric Service, Volume V, May 2017, p. 30.
29 Direct Testimony of Paul Moul, Bear Valley Electric Service, Volume V, May 2017, p. 30.
30 The details of this calculation are somewhat complicated and are shown in BVES’ Cost of Capital Testimony in Schedule-08.
31 Direct Testimony of Paul Moul, Bear Valley Electric Service, May 2017, p. 36.
32 See, for example, Prefiled Direct Testimony of Dr. Roger A. Morin on Behalf of Liberty (continued on next page)
12
Combining the yield, (D/P), the growth rate, (g), the leverage 1
adjustment, and flotation costs yields BVES’ recommended cost of equity 2
from the DCF mode. BVES’ DCF estimate equals: 3
3.11 % + 6.00 % + 0.85 % = 9.96 % x 1.015 = 10.11 % 4
5
E. ORA’s DCF Model 6
ORA’s approach to estimating the cost of equity from the DCF model 7
differs slightly from BVES’ methodology. ORA calculated the current yield 8
differently from BVES and employed a slightly lower EPS growth rate. 9
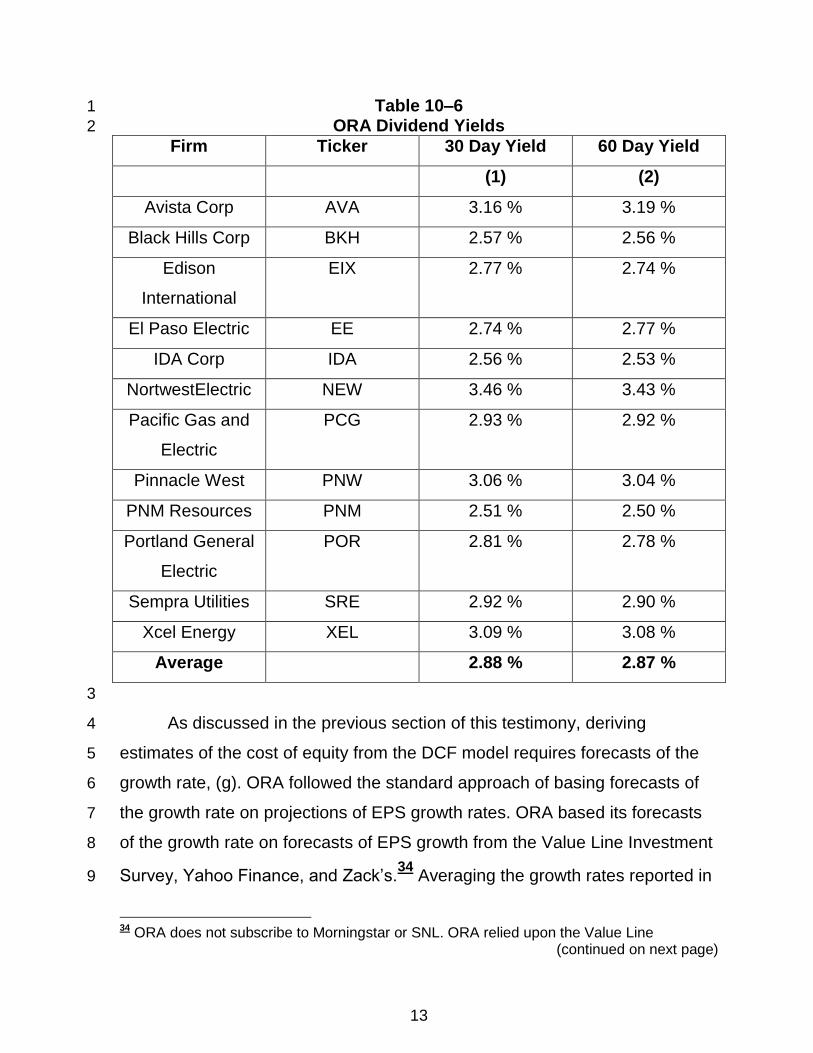
ORA calculated the dividend yields for each firm in the comparison 10
group by dividing the most recent estimates of quarterly dividends as reported 11
by Value Line Investment Services by the most recent 30 day average of 12
security prices.33
Quarterly dividends were annualized by simply multiplying 13
the quarterly dividend by four. Based on this approach ORA estimates the 14
average yield for the comparison group to be 2.88%. ORA also calculated 15
average yields based on the average of the past sixty days of closing stock 16
prices. The results were slightly different from relying upon the past 30 days of 17
closing stock prices. Table 10-6 reports the average yields for the comparison 18
group based on 30 and 60 day average of closing stock prices. 19
(continued from previous page) Utilities (CalPeco Electric), Exhibit 2, Cost of Capital/Return on Equity/Rate of Return, May 1, 2015, p. 2-53).
33 Specifically, ORA relied upon the Value Line Investment Survey of July 28, 2017. Daily closing security prices over the period July 1st through July 31 were downloaded directly from Yahoo Finance.
13
Table 10–6 1
ORA Dividend Yields 2
Firm Ticker 30 Day Yield 60 Day Yield
(1) (2)
Avista Corp AVA 3.16 % 3.19 %
Black Hills Corp BKH 2.57 % 2.56 %
Edison
International
EIX 2.77 % 2.74 %
El Paso Electric EE 2.74 % 2.77 %
IDA Corp IDA 2.56 % 2.53 %
NortwestElectric NEW 3.46 % 3.43 %
Pacific Gas and
Electric
PCG 2.93 % 2.92 %
Pinnacle West PNW 3.06 % 3.04 %
PNM Resources PNM 2.51 % 2.50 %
Portland General
Electric
POR 2.81 % 2.78 %
Sempra Utilities SRE 2.92 % 2.90 %
Xcel Energy XEL 3.09 % 3.08 %
Average 2.88 % 2.87 %
3
As discussed in the previous section of this testimony, deriving 4
estimates of the cost of equity from the DCF model requires forecasts of the 5
growth rate, (g). ORA followed the standard approach of basing forecasts of 6
the growth rate on projections of EPS growth rates. ORA based its forecasts 7
of the growth rate on forecasts of EPS growth from the Value Line Investment 8
Survey, Yahoo Finance, and Zack’s.34
Averaging the growth rates reported in 9
34 ORA does not subscribe to Morningstar or SNL. ORA relied upon the Value Line
(continued on next page)

14
Table 10-7 yields an overall EPS growth rate of 5.74 %. ORA’s DCF cost of 1
equity results reflect this 5.74% growth rate. ORA’s EPS growth forecasts are 2
reported in Table 10-7. 3
4
(continued from previous page) Investment Survey of July 28, 2017. The forecasts of EPS growth taken from Yahoo Finance and Zacks’ are also of July 28, 2017.

15
Table 10-7 1
ORA EPS Forecasted Growth Rates 2
Firm Ticker Value Line Zack’s Yahoo Finance
Average
(1) (2) (3) (4) (5)
Avista Corp AVA 2.50 % -- 5.65 % 4.08 %
Black Hills
Corp
BKH 7.50 % 5.00 % 11.98 % 8.16 %
Edison
International
EIX 4.00 % 6.17 % 4.11 % 4.76 %
El Paso
Electric
EE 5.00 % 7.55 % 6.50 % 6.35 %
IDA Corp IDA 3.50 % 4.50 % 4.00 % 4.00 %
NorthWestern
Corp
NEW 4.50 % 3.40 % 3.02 % 3.64 %
Pacific Gas
and Electric
PCG 9.50 % 4.37 % 4.20 % 6.02 %
Pinnacle West
Corp
PNW 5.50 % 5.17 % 6.08 % 5.58 %
PNM
Resources
PNM 9.00 % 6.37 % 7.35 % 7.57 %
Portland
General
Electric
POR 6.00 % 3.85 % 5.55 % 5.13 %
Sempra
Energy
SRE 8.00 % 8.67 % 9.35 % 8.67 %
Xcel Energy XEL 4.50 % 5.43 % -- 4.97 %
Average 5.79 % 5.50 % 6.16 % 5.74 %
3
ORA adjusted the expected growth rates for the quarterly payment of 4
dividends by multiplying the expected EPS growth rate by one-half (½). This 5
approach has been adopted by several recent utility cost of capital studies. 6
Southwest Gas, for example, explains that: “since utility companies tend to 7
increase their quarterly dividends at different times throughout the year, it is 8
reasonable to assume that dividend increases will be evenly distributed over 9

16
calendar quarters. Given that assumption, it is appropriate to calculate the 1
expected dividend yield by applying one-half of the long-term growth rate to 2
the current dividend yield.”35
This approach has also been adopted by J. 3
Randall Woolridge of the Pennsylvania State University as well as by analysts 4
at the Federal Energy Regulatory Commission (FERC).36
ORA also used this 5
methodology in its analysis of the cost of capital for Liberty Utilities 6
(CalPeco).37
7
ORA excludes any adjustment for leverage. BVES’ proposed leverage 8
adjustment to the DCF model is a misapplication of the Modigliani-Miller (M-9
M) propositions. Modigliani and Miller’s Proposition I held that: “the value of a 10
firm to be independent of its capital structure…”38
and “Proposition II, which 11
showed that when Proposition I held, the cost of equity capital was a linear 12
increasing function of the debt/equity ratio…Our propositions implied that the 13
weighted average of these cost of capital to a firm would remain the same no 14
matter what combination of financing sources the firm actually chose.”39
This 15
implies that BVES’ proposed distinction between the capital structure used for 16
regulatory purposes and the market based capital structure will not impact the 17
firm’s overall weighted average cost of capital. 18
35 Direct Prepared Testimony of Robert B. Hevert on Behalf of the Southwest Gas Corporation, A.12-12-024, Volume 3, p.20 and Direct Testimony of Robert B. Hevert, Cost of Capital, On Behalf of NSTAR Electric, Western Massachusetts Electric, Commonwealth of Massachusetts, Department of Public Utilities, January 17, 2017, p. 25 of 174.
36 See DRA Report on the Cost of Capital 2013 (2012), p. 4-33. Prepared Direct and Answering Testimony of Staff Witness, Midwest System Operator, Inc. and Ameren Illinois Co, FERC No.ER-277-00, at Appendix B, February 17, 2012.
37 Report on the Results of Operations for Liberty Utilities, ORA-09, November 9, 2015.
38 Miller, Merton, H, “The Modigliani-Miller Propositions After Thirty Years”, Journal of Economic Perspectives, Volume 2, No. 4, Fall 1988, p. 99.
39 Miller, Merton, H, “The Modigliani-Miller Propositions After Thirty Years” Journal of Economic Perspectives, Volume 2, No. 4, Fall 1988, p. 100.

17
ORA has also excluded any adjustments for flotation costs. This policy 1
is consistent with D.11-12-034. D.12-12-034 rejected “consideration of a 2
flotation cost adjustment in this proceeding.”40
3
Combining the expected yield and the forecasted growth rate yields 4
ORA’s estimate of the cost of equity from the DCF model. 5
(D1/Po) + g) 6
(3.02 % + 5.74 %) = 8.76% 7
3.02 % = 2.94 % *(1 + 0.5*5.74 %) 8
9
F. Historic Risk Premium (HRP) 10
The historic risk premium model is based on the notion that “common 11
equity is exposed to greater investment risk than debt capital.”41
BVES 12
develops its estimate of the cost of equity from the historic risk premium 13
model (HRP) by coupling forecasts of the yield on A rate Utility Bonds and a 14
measure of the historic risk premium. In this model BVES measures the equity 15
risk premium as the difference between the return on large common stocks 16
and the return on corporate bonds over the period 1926 through 2015.42
17
BVES develops a forecast of the yield “on A-rated public utility debt by 18
using the Blue Chip Financial Forecasts along with…the long-run spread in 19
yields between the A-rated public utility bonds and long-term Treasury 20
bonds.”43
BVES concludes that the recent “yields on A-rated public utility 21
bonds have exceeded those on Treasury bonds by 1.34% on a twelve month 22
40 D.12-12-034, Mimeo, December 26, 2012, p. 34.
41 Direct Testimony of Paul Moul, Bear Valley Electric Service, Volume V, May 2017, p. 36.
42 The source for the data underlying the calculation of historic risk premium is Ibbotson, Roger, G., “ 2016 SBBI Yearbook, Stocks, Bonds, and Bills and Inflation”, John Wiley & Sons, Inc., Hoboken, New Jersey.
43 Direct Testimony of Paul Moul, Bear Valley Electric Service, Volume V, May 2017, pp. 37-38.

18
average basis, 1.27% on a six month average basis, 1.22% on a three month 1
average basis. From these averages, 1.25% represents a conservative 2
spread on the yield on A-rated public utility bonds over Treasury bonds.”44
3
This 1.25% yield spread is then applied to BVES’ forecast of the 30 year 4
Treasury yield. BVES’ quarterly forecast results are reported in Table 10-8. 5
Table 10-8 6
Bear Valley Electric Service 7
Forecast of A-Rated Public Utility Bonds 8
Year Quarter 30 Year Treasury Forecast
Historic Spread Factor
A-Rated Public Utility Bond Yield
(1) (2) (3)=(1)+(2)
2017 1 3.10 % 1.25 % 4.35 %
2017 2 3.20 % 1.25 % 4.45 %
2017 3 3.30 % 1.25 % 4.55 %
2017 4 3.50 % 1.25 % 4.75 %
2018 1 3.60 % 1.25 % 4.85 %
2018 2 3.70 % 1.25 % 4.95 %
9
Based on the results reported in Table 10-8 and the fact that “the longer 10
term forecasts by Blue Chip will go up from the levels from the near term 11
forecasts”45
BVES concludes that: “a 5.00% yield on A-rated public utility 12
bonds represents a conservative benchmark.”46
13
To arrive at an estimate of the cost of equity from the HRP model BVES 14
combines the forecast of the A-rated public utility bond of 5% with a measure 15
of the historic risk premium. BVES concludes that an appropriate measure of 16
44 Direct Testimony of Paul Moul, Bear Valley Electric Service, Volume V, May 2017, p. 37.
45 Direct Testimony of Paul Moul, Bear Valley Electric Service, Volume V, May 2017, p. 39.
46 Direct Testimony of Paul Moul, Bear Valley Electric Service, Volume V, May 2017, p. 40.
19
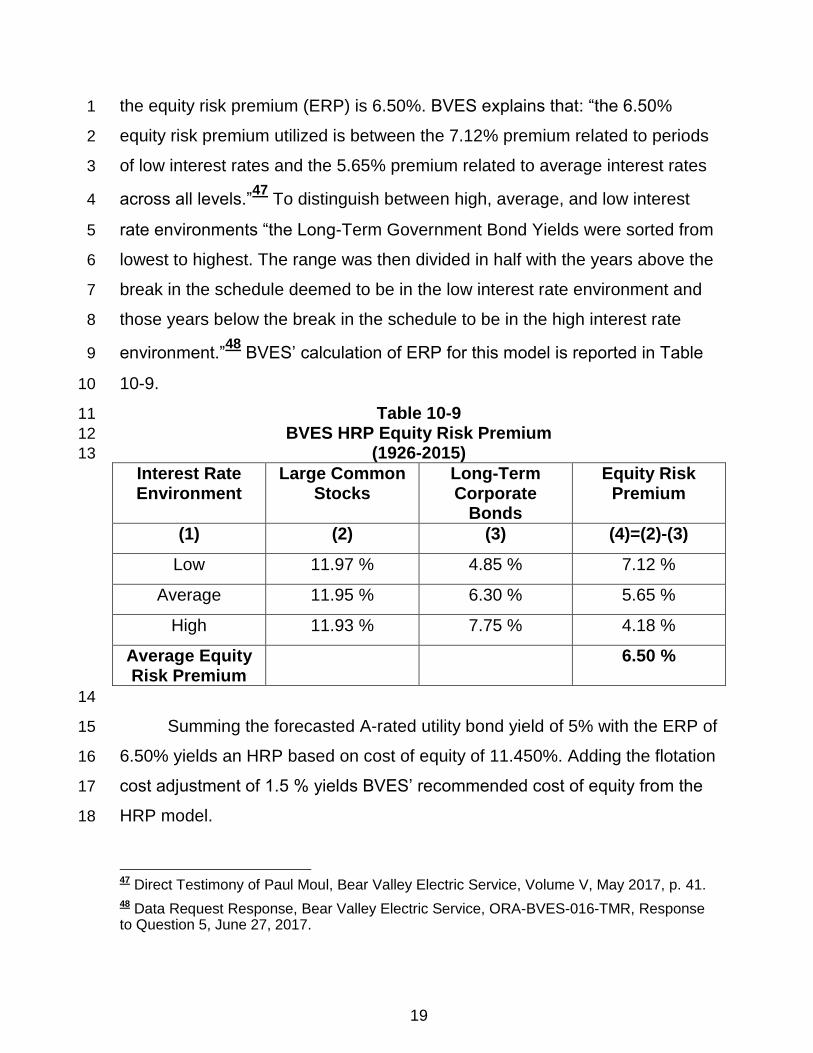
the equity risk premium (ERP) is 6.50%. BVES explains that: “the 6.50% 1
equity risk premium utilized is between the 7.12% premium related to periods 2
of low interest rates and the 5.65% premium related to average interest rates 3
across all levels.”47
To distinguish between high, average, and low interest 4
rate environments “the Long-Term Government Bond Yields were sorted from 5
lowest to highest. The range was then divided in half with the years above the 6
break in the schedule deemed to be in the low interest rate environment and 7
those years below the break in the schedule to be in the high interest rate 8
environment.”48
BVES’ calculation of ERP for this model is reported in Table 9
10-9. 10
Table 10-9 11
BVES HRP Equity Risk Premium 12
(1926-2015) 13
Interest Rate Environment
Large Common Stocks
Long-Term Corporate
Bonds
Equity Risk Premium
(1) (2) (3) (4)=(2)-(3)
Low 11.97 % 4.85 % 7.12 %
Average 11.95 % 6.30 % 5.65 %
High 11.93 % 7.75 % 4.18 %
Average Equity Risk Premium
6.50 %
14
Summing the forecasted A-rated utility bond yield of 5% with the ERP of 15
6.50% yields an HRP based on cost of equity of 11.450%. Adding the flotation 16
cost adjustment of 1.5 % yields BVES’ recommended cost of equity from the 17
HRP model. 18
47 Direct Testimony of Paul Moul, Bear Valley Electric Service, Volume V, May 2017, p. 41.
48 Data Request Response, Bear Valley Electric Service, ORA-BVES-016-TMR, Response to Question 5, June 27, 2017.
20
G. ORA’s Historic Risk Premium Model 1
ORA’s approach to deriving estimates of the cost of equity from the 2
HRP model parallels BVES’ approach. Following BVES’ approach, ORA 3
estimated its HRP model by coupling forecasts of the A-rate public utility bond 4
yield with its measure of the historic ERP. 5
ORA forecasts an A- rate public utility bond yield of 4.95%. This is 6
based on a forecast of the 30-year Treasury yield plus the historic yield 7
spread between the A-rated public utility bond yield and the 30-year Treasury 8
yield. 9
ORA’s forecast of the 30-year Treasury yield was taken from the July 10
2017 IHS Economics, U.S. Economic Outlook. For the forecast period 2017, 11
2018, and 2019, IHS Economics forecasts 30-year Treasury yields of 3.11%, 12
3.77%, and 4.36%, respectively. IHS Economics recently commented that: “In 13
the bond market, government bond yields have been on a downward 14
trajectory since March, with the yield on the 10-year Treasury note declining 15
from 2.4% at the end of March to as low as 2.14% by the last week of June, 16
before spiking up at the end of June, when a more hawkish tone from central 17
bankers caused a sell-off.”49
IHS also noted that yield spreads have also 18
been declining. The July forecast issue concluded that: “The spread between 19
the yields on the 10-year and 2-year notes has narrowed from 123 basis 20
points in January to 85 points in June.”50
21
To arrive at a forecast of the A-rated public utility bond yield ORA 22
added a spread factor of 1.17 % to the IHS July forecast of the 30 year 23
Treasury yield. ORA’s spread factor was derived from a series of monthly 24
spreads between the A-rated public utility bond yield and the 30 year Treasury 25
49IHS Markit, US Economic Outlook, July 2017, p. 78.
50 IHS Markit, US Economic Outlook, July 2017, p. 78.
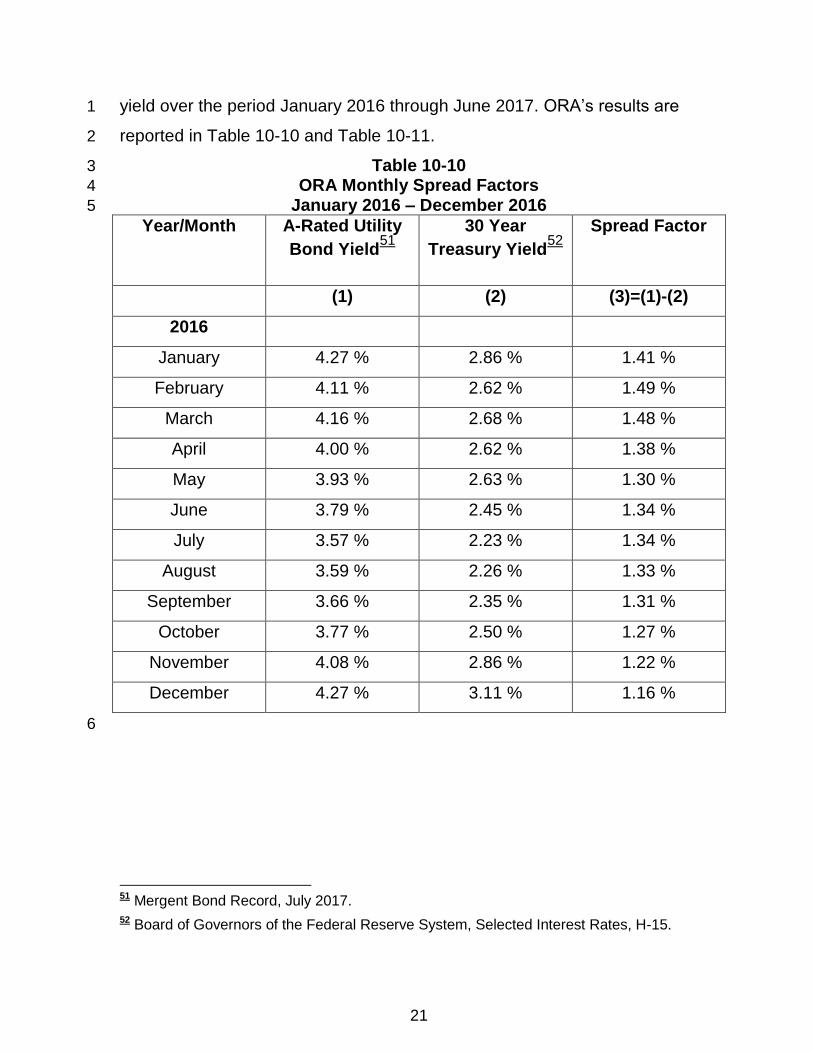
21
yield over the period January 2016 through June 2017. ORA’s results are 1
reported in Table 10-10 and Table 10-11. 2
Table 10-10 3
ORA Monthly Spread Factors 4
January 2016 – December 2016 5
Year/Month A-Rated Utility
Bond Yield51
30 Year
Treasury Yield52
Spread Factor
(1) (2) (3)=(1)-(2)
2016
January 4.27 % 2.86 % 1.41 %
February 4.11 % 2.62 % 1.49 %
March 4.16 % 2.68 % 1.48 %
April 4.00 % 2.62 % 1.38 %
May 3.93 % 2.63 % 1.30 %
June 3.79 % 2.45 % 1.34 %
July 3.57 % 2.23 % 1.34 %
August 3.59 % 2.26 % 1.33 %
September 3.66 % 2.35 % 1.31 %
October 3.77 % 2.50 % 1.27 %
November 4.08 % 2.86 % 1.22 %
December 4.27 % 3.11 % 1.16 %
6
51 Mergent Bond Record, July 2017.
52 Board of Governors of the Federal Reserve System, Selected Interest Rates, H-15.
22
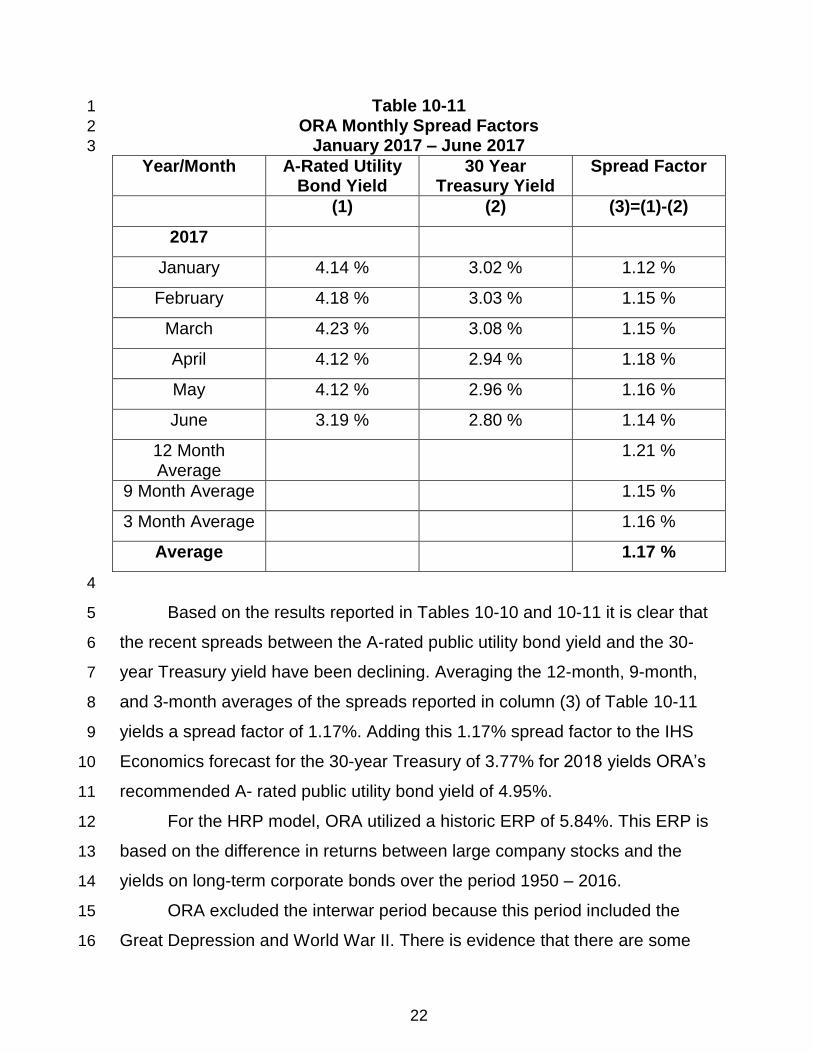
Table 10-11 1
ORA Monthly Spread Factors 2
January 2017 – June 2017 3
Year/Month A-Rated Utility Bond Yield
30 Year Treasury Yield
Spread Factor
(1) (2) (3)=(1)-(2)
2017
January 4.14 % 3.02 % 1.12 %
February 4.18 % 3.03 % 1.15 %
March 4.23 % 3.08 % 1.15 %
April 4.12 % 2.94 % 1.18 %
May 4.12 % 2.96 % 1.16 %
June 3.19 % 2.80 % 1.14 %
12 Month Average
1.21 %
9 Month Average 1.15 %
3 Month Average 1.16 %
Average 1.17 %
4
Based on the results reported in Tables 10-10 and 10-11 it is clear that 5
the recent spreads between the A-rated public utility bond yield and the 30-6
year Treasury yield have been declining. Averaging the 12-month, 9-month, 7
and 3-month averages of the spreads reported in column (3) of Table 10-11 8
yields a spread factor of 1.17%. Adding this 1.17% spread factor to the IHS 9
Economics forecast for the 30-year Treasury of 3.77% for 2018 yields ORA’s 10
recommended A- rated public utility bond yield of 4.95%. 11
For the HRP model, ORA utilized a historic ERP of 5.84%. This ERP is 12
based on the difference in returns between large company stocks and the 13
yields on long-term corporate bonds over the period 1950 – 2016. 14
ORA excluded the interwar period because this period included the 15
Great Depression and World War II. There is evidence that there are some 16

23
distinct differences between the pre- and post-World War II economy. J. 1
Bradford DeLong and Lawrence Summers, for example, note that: “the 2
amplitude of cyclical fluctuations is much lower than it was before World War 3
II.”53
This result is not necessarily limited to the U.S. macro-economy. In a 4
study of stock returns over the period 1927-1991 Kim, Nelson, and Startz 5
concluded that: “The evidence suggests a change in the structure of returns at 6
the end of World War II.”54
Furthermore, the period 1950 through 2016, 7
represents a time frame “long enough to smooth out short-term aberrations, 8
and to encompass several business and interest cycles.”55
9
Over the period 1950 through 2016 large company stock returns 10
averaged 12.64% while the yield on long-term corporate bonds averaged 11
6.80%. Subtracting the average long-term corporate bond yield from the 12
average return on large common stocks yields an historic risk premium of 13
5.84%. 14
Coupling the forecast of the A-rate public utility bond yield of 4.95 % 15
with an estimate of the historic risk premium of 5.84% yields ORA’s 16
recommended cost of equity derived from the HRP model of 10.79% (i.e., 17
4.95 % + 5.84 %). 18
H. Capital Asset Pricing Model 19
The traditional Capital Asset Pricing Model or CAPM, relates the 20
investor’s required return to the risk-free rate, (Rf), the riskiness of the asset 21
53 DeLong, J.B., and Summers, L.H., “The Changing Variability of Economic Activity in the United States”, (1984), National Bureau of Economic Research, Working Paper No, 1450, p. 1).
54 Kim, J.K., Nelson, C.R., and Startz, R’, “Mean Revision in Stock Prices ? A Reappraisal of the Empirical Evidence”, (1991), Review of Economic Studies, Vol 59, May, p. 516.
55 Morin, R.A., “The New Regulatory Finance”, Public Utility Reports, Vienna, Virginia, (2006), p. 114.

24
relative to the entire market, as measured by beta, (β), and the market risk 1
premium (Rm – Rf). The CAPM model can be expressed as: 2
k = Rf + β*(Rm – Rf) 3
Three inputs are required to implement the traditional CAPM; the risk-4
free rate, (Rf), the riskiness of the security relative to the market, (β), and a 5
measure of the equity risk premium (Rm-Rf). 6
BVES uses a “3.75% risk-free rate rate of return for CAPM purposes.”56
7
BVES explains that: “forecasts published by Blue Chip on January 1, 2017 8
indicate that yields on long-term Treasury bonds are expected to be in the 9
range of 3.1 to 3.7 during the next six quarters. The longer term 10
forecasts…show that the yields on 30 year Treasury bonds will average 4.2% 11
from 20-18 through 2022 and 4.5% from 2023 to 2027.”57
12
The term β in the CAPM model is a measure of the relative riskiness of 13
a security relative to the entire market. Firms with a high β are very sensitive 14
to changes in market conditions and display a relatively high degree of 15
systematic risk. Firms with a low β, i.e., less than one, are less responsive to 16
changes in market conditions. 17
The average β for the comparison group is 0.72. BVES argues that 18
these “Value Line betas cannot be used directly in the CAPM, unless these 19
betas are applied to a capital structure measured with market values.”58
To 20
account for the difference between market and book values of debt and equity 21
the Value Line “Betas have been unleveraged and releveraged for the book 22
value common equity ratios…”59
23
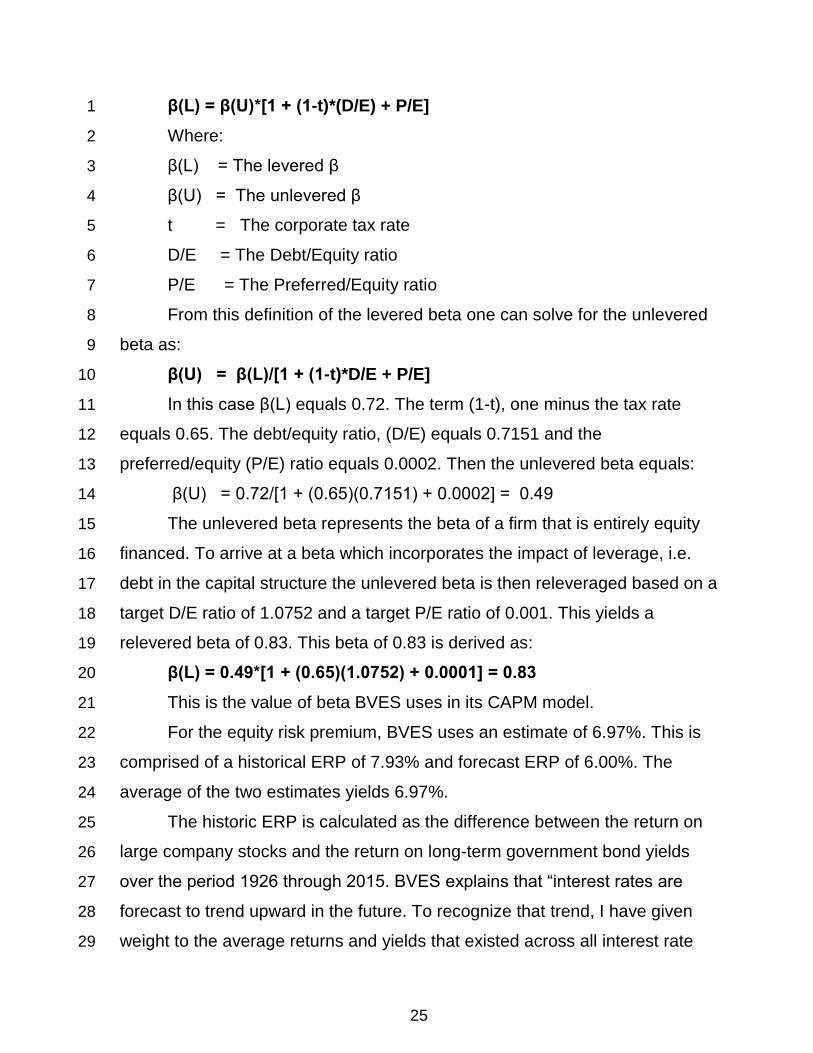
To implement this procedure, the levered β must first be defined as: 24
56 Direct Testimony of Paul Moul, Bear Valley Electric Service, Volume V, p. 44.
57 Direct Testimony of Paul Moul, Bear Valley Electric Service, Volume V, p. 45.
58 Direct Testimony of Paul Moul, Bear Valley Electric Service, Volume V, May 2017, p. 43.
59 Direct Testimony of Paul Moul, Bear Valley Electric Service, Volume V, May 2017, p. 43.
25
β(L) = β(U)*[1 + (1-t)*(D/E) + P/E] 1
Where: 2
β(L) = The levered β 3
β(U) = The unlevered β 4
t = The corporate tax rate 5
D/E = The Debt/Equity ratio 6
P/E = The Preferred/Equity ratio 7
From this definition of the levered beta one can solve for the unlevered 8
beta as: 9
β(U) = β(L)/[1 + (1-t)*D/E + P/E] 10
In this case β(L) equals 0.72. The term (1-t), one minus the tax rate 11
equals 0.65. The debt/equity ratio, (D/E) equals 0.7151 and the 12
preferred/equity (P/E) ratio equals 0.0002. Then the unlevered beta equals: 13
β(U) = 0.72/[1 + (0.65)(0.7151) + 0.0002] = 0.49 14
The unlevered beta represents the beta of a firm that is entirely equity 15
financed. To arrive at a beta which incorporates the impact of leverage, i.e. 16
debt in the capital structure the unlevered beta is then releveraged based on a 17
target D/E ratio of 1.0752 and a target P/E ratio of 0.001. This yields a 18
relevered beta of 0.83. This beta of 0.83 is derived as: 19
β(L) = 0.49*[1 + (0.65)(1.0752) + 0.0001] = 0.83 20
This is the value of beta BVES uses in its CAPM model. 21
For the equity risk premium, BVES uses an estimate of 6.97%. This is 22
comprised of a historical ERP of 7.93% and forecast ERP of 6.00%. The 23
average of the two estimates yields 6.97%. 24
The historic ERP is calculated as the difference between the return on 25
large company stocks and the return on long-term government bond yields 26
over the period 1926 through 2015. BVES explains that “interest rates are 27
forecast to trend upward in the future. To recognize that trend, I have given 28
weight to the average returns and yields that existed across all interest rate 29
26
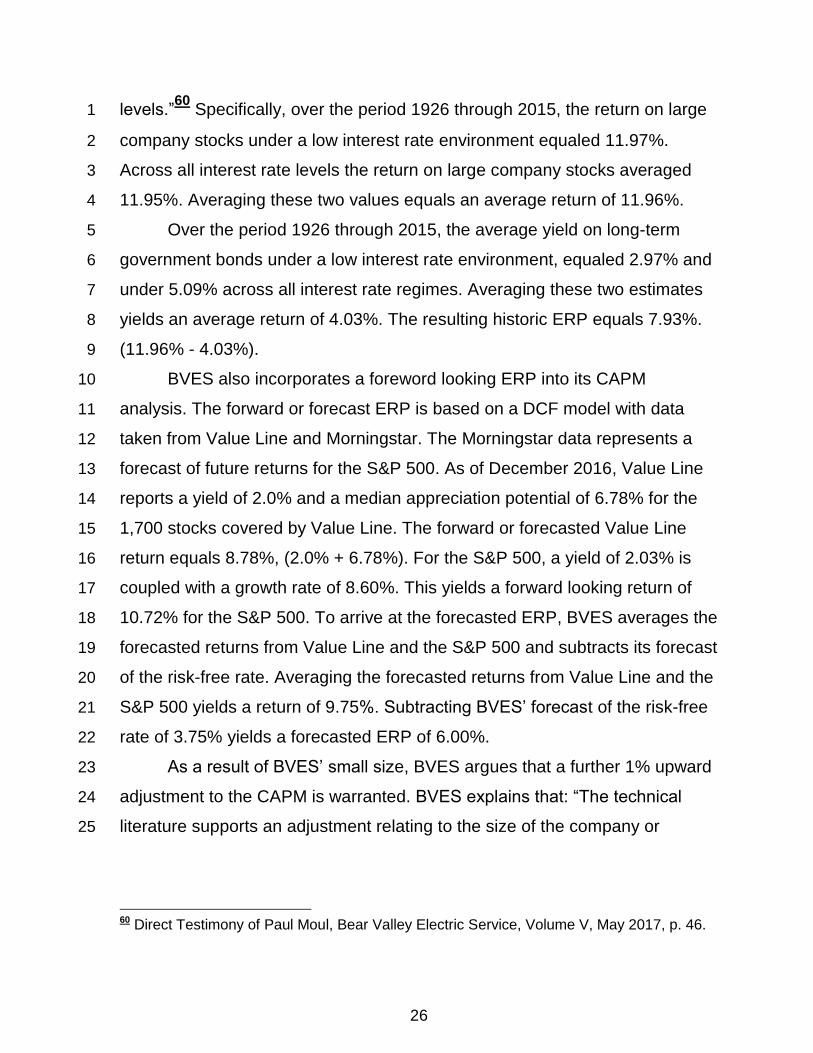
levels.”60
Specifically, over the period 1926 through 2015, the return on large 1
company stocks under a low interest rate environment equaled 11.97%. 2
Across all interest rate levels the return on large company stocks averaged 3
11.95%. Averaging these two values equals an average return of 11.96%. 4
Over the period 1926 through 2015, the average yield on long-term 5
government bonds under a low interest rate environment, equaled 2.97% and 6
under 5.09% across all interest rate regimes. Averaging these two estimates 7
yields an average return of 4.03%. The resulting historic ERP equals 7.93%. 8
(11.96% - 4.03%). 9
BVES also incorporates a foreword looking ERP into its CAPM 10
analysis. The forward or forecast ERP is based on a DCF model with data 11
taken from Value Line and Morningstar. The Morningstar data represents a 12
forecast of future returns for the S&P 500. As of December 2016, Value Line 13
reports a yield of 2.0% and a median appreciation potential of 6.78% for the 14
1,700 stocks covered by Value Line. The forward or forecasted Value Line 15
return equals 8.78%, (2.0% + 6.78%). For the S&P 500, a yield of 2.03% is 16
coupled with a growth rate of 8.60%. This yields a forward looking return of 17
10.72% for the S&P 500. To arrive at the forecasted ERP, BVES averages the 18
forecasted returns from Value Line and the S&P 500 and subtracts its forecast 19
of the risk-free rate. Averaging the forecasted returns from Value Line and the 20
S&P 500 yields a return of 9.75%. Subtracting BVES’ forecast of the risk-free 21
rate of 3.75% yields a forecasted ERP of 6.00%. 22
As a result of BVES’ small size, BVES argues that a further 1% upward 23
adjustment to the CAPM is warranted. BVES explains that: “The technical 24
literature supports an adjustment relating to the size of the company or 25
60 Direct Testimony of Paul Moul, Bear Valley Electric Service, Volume V, May 2017, p. 46.
27
portfolio…As the size of the company decreases, its risk and required return 1
increases.”61
2
Combining BVES’ forecast of the risk-free rate, beta, the ERP, the 3
proposed size adjustment along with the flotation cost adjustment yields: 4
3.75 % + (0.83)(6.97%) + 1.00 % = 10.54 % + 0.15 % = 10.69% 5
I. ORA’s Capital Asset Pricing Model 6
ORA’s estimates of the cost of equity from the CAPM model differ from 7
BVES’ results because ORA relied upon different values for the risk-free rate, 8
beta, and the ERP. Furthermore, ORA excludes a small firm size adjustment 9
from its CAPM model. ORA’s CAPM results are based on a risk-free rate of 10
3.77%, a beta of 0.81, and an ERP of 6.22%. 11
ORA’s risk-free rate of 3.77% is taken from the July 2017 IHS Markit 12
U.S. Economic Outlook. For 2018, 2019 and 2020, IHS forecasts the yields on 13
30-year Treasuries at 3.77%, 4.36%, and 4.57%, respectively. An important 14
factor influencing the future trajectory of interest rates is Federal Reserve 15
policy. The July 2017 IHS Review of the U.S. Economy noted that: “There is a 16
discrepancy between Fed interest projections and market expectations, 17
suggesting that the market thinks unfolding events may cause the Fed to 18
moderate the pace of either rate increases or portfolio shrinkage.”62
19
ORA’s beta estimate of 0.81 is based on BVES’ methodology. ORA, 20
however, updated BVES’ methodology with data taken from each comparison 21
group’s 2016 SEC Form 10-K.63
For the levered beta ORA relied upon the 22
average beta of the comparison group as of July 28, 2017 as reported by 23
Value Line. This equals 0.70. ORA’s estimate of the unlevered beta equals: 24
β(U) = 0.70/[1 + (0.65)*(0.7472) + 0.0000} = 0.47 25
61 Direct Testimony of Paul Moul, Bear Valley Electric Service, May 2017, p. 47.
62 IHS Markit, U.S. Economic Outlook, July 2017, p. 67.
28
Following BVES’ approach ORA then relevered this beta with a target 1
debt/equity (D/E) ratio of 1.1229 and a target preferred/equity (P/E) ratio of 2
0.0001. This yields a levered beta of 0.81, i.e.: 3
β(L) = 0.47*[1+ (0.65)*(1.1229) + 0.0001] = 0.81 4
This resulting levered beta is very close to BVES’ levered beta of 0.83. 5
Similar to BVES, ORA’s ERP is based on an average of the historic and 6
forecast ERP’s. ORA’s historic ERP is based on the difference between the 7
return on large company stocks and long-term government bond yields. As in 8
the case of its HRP analysis, ORA focuses on the period 1950 through 2016. 9
Over the period 1950 through 2016, the return on large company stocks 10
averaged 12.64% while the yield on long-term government bonds averaged 11
5.90%. This yields an historic ERP of 6.74%. (12.64% - 5.90%). For the 12
forecast period ORA estimates the ERP to average 5.70%. Averaging the 13
historic ERP of 6.74% with the forecast ERP of 5.70% yields an overall ERP 14
of 6.22%. 15
ORA’s forecast ERP is based on data taken from Value Line and the 16
July 2017 IHS Markit U.S. Economic Outlook. The July 7, 2017 Value Line 17
Summary and Index reports a yield of 2.1 % and a potential price appreciation 18
potential of 7.79% 64
for the 1,700 stocks they cover. Combining the yield 19
and potential price appreciation yields a forecasted return of 9.89 %. To 20
estimate the prospective returns on the S&P 500, ORA relied upon forecasts 21
of the yield and growth from IHS Markit U.S. Economic Outlook. IHS Markit 22
reports a 2.0% yield for the S&P 500 Index and a growth rate of 7%. Applying 23
the traditional DCF to these estimates yields a forecasted return of 9.06%. 24
Averaging the Value Line and S&P 500 future returns equals 9.48%. 25
(continued from previous page) 63 The details of ORA’s calculation are reported in its workpapers in Schedule 08_Updated.
64 This is calculated as (1.35)^.25-1.
29
Subtracting the forecasted risk free rate of 3.77% from these average returns 1
yields a forecasted ERP of 5.70%. 2
ORA’s CAPM results do not included a “small” firm size adjustment. 3
There is some controversy in the finance literature on whether such 4
adjustments are warranted. For example, Aswath Damodaran notes that: 5
“Much of the premium is generated in one month of the year: 6
January…eliminating that month from our calculations would essentially 7
dissipate the entire small stock premium. That would suggest that size itself is 8
not the source of risk…”65
Damodaran concludes: “In summary, while the 9
empirical evidence over a very long period supports the notion that small cap 10
stocks have earned higher returns after adjusting for beta risk than large cap 11
stocks, it is not as conclusive, nor as clean as it was initially thought to be. 12
The argument that there is, in fact, no small cap premium and that we have 13
observed over time is just an artifact of history should be given credence.”66
14
ORA’s final CAPM cost of equity results are based on a risk-free rate of 15
3.77%, a beta of 0.81, and an ERP of 6.22% . This yields: 16
3.77% + (0.81)*(6.22) % = 8.81% 17
18
J. Comparable Earnings 19
BVES also includes a model known as the comparable earnings 20
approach to estimating the cost of equity. With this approach the analyst 21
seeks to determine “a fair return on equity by comparing returns realized by 22
non-regulated companies to returns that a public utility with similar risks 23
65 Damodaran, A., Equity Risk Premiums (ERP): Determinants, Estimation and Implications-The 2017 Edition” March 2017, New York University, Stern School of Business, p. 48.
66 Damodaran, A., Equity Risk Premiums (ERP): Determinants, Estimation and Implications-The 2017 Edition” March 2017, New York University, Stern School of Business, p. 51.
30
characteristics would need to realize in order to complete for capital.”67
In 1
order to implement this approach it is necessary to select a comparable group 2
of firms. BVES describes its selecting criteria as “based on upon…the [Value 3
Line] rankings of the companies in the Electric Group. The items considered 4
were: Timeliness Rank, Safety Rank, Financial Strength, Price Stability, Value 5
Line betas, and Technical Rank.”68
BVES’ sample consists of approximately 6
51 unregulated firms.69
BVES then calculated the average historical rate of 7
return for these firms over the period 2011 through 2015 and for the forecast 8
period 2019-2021. BVES concludes that: “The average historical return on 9
book common equity was 12.9%...The average forecasted rate of return as 10
published by Value Line is 13.4%.70
Averaging the historical and forecasted 11
returns from the sample of firms yields an average cost of equity of 13.15%. 12
13
K. ORA’s Approach 14
ORA did not use the Comparable Earnings approach principally 15
because this Commission has not endorsed its use. The Commission has a 16
long history of basing its authorized cost of equity on the DCF, HRP, and 17
CAPM models. Other Public Utility Commissions in the United States have not 18
explicitly endorsed the Comparative Earnings (CE) approach. For example, 19
the Michigan Public Service Commission recently noted that: “The 20
Commission…concludes that the Staff’s cost of equity analysis should not be 21
discounted simply because the Staff failed to compare the results of that 22
analysis using the CE model.”71
The Commission has a history of rejecting 23
67 Direct Testimony of Paul Moul, Bear Valley Electric Service, May 2017, p. 48.
68 Direct Testimony of Paul Moul, Bear Valley Electric Service, May 2017, p. 50.
69 The firms are listed on Schedule 13 of BVES’ workpapers.
70 Direct Testimony of Paul Moul, Bear Valley Electric Service, May 2017, p. 52.
71 Michigan Public Service Commission, Case No. U-17895, Mimeo, September 8, 2016, p. (continued on next page)
31
novel and untested models in the past. For example, in D.07-12 049 1
the Commission rejected the California energy utilities request to use the 2
Fama-French model to estimate the cost of equity. It should also be noted that 3
the recommended cost of equity estimates derived from the Comparable 4
Earnings model far exceed the recommended cost of equity from the DCF, 5
HRP and CAPM models. One of the reasons cited by the Commission in 6
rejecting the Fama-French model was that: “Fama-French continue to appear 7
unrealistically high in comparison to results of SCE’s and SDG&E’s other 8
financial models…”72
9
Finally, it should be noted that BVES’ CE results are not particularly 10
robust with respect to the screening criteria. One of BVES’ screening criteria 11
is for the included firm to have a Value Line Technical rank of 2 or 3. Value 12
Line defines Technical Rank as: “A prediction of relative price movement, 13
primarily over the next three to six months. It is a function of price action 14
relative to all stocks followed by Value Line. Stocks ranked 1 (Highest) or 2 15
(above Average) are likely to outpace the market. Those ranked 4 (Below 16
Average), or 5 (Lowest) are not expected to outperform most stocks over the 17
next six months.”73
The firms included in the BVES CE sample now have a 18
Value Line Technical Rank of 4. Specifically, AptarGroup, (ATR), Ball 19
Company, (BLL), Bio Techne (TECH), Commercial Bankshares, (CBSH), 20
Intercontinental Exchange (ICE), The Kroger Company, (KR), Rollins Inc., 21
(ROL), and Waste Management, (WM), have Value Line Technical Rankings 22
of 4. In other words, as the Value Line ranks change so would the potential 23
firms in the sample change. 24
(continued from previous page) 20.
72 D.07-12-049, Mimeo, December, 21, 2007, p. 26.
73 Direct Testimony of Paul Moul, Bear Valley Electric Service, May 2017, Schedule 13, p. 3 of 3.
32
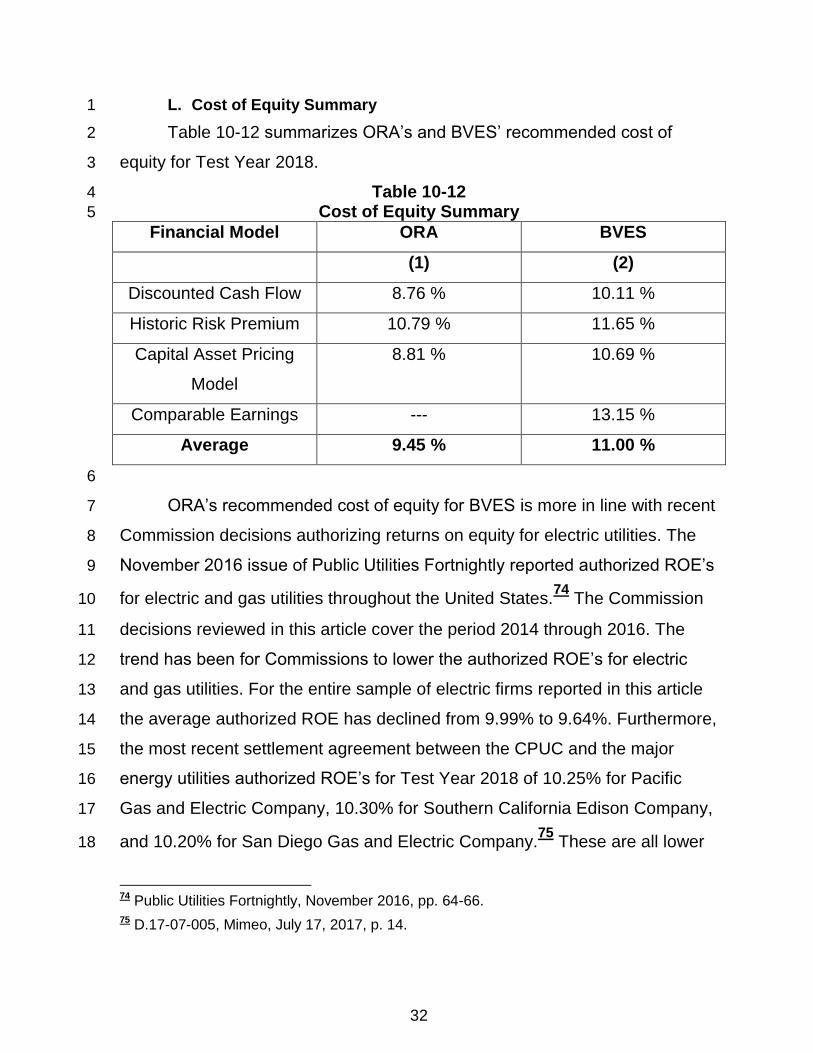
L. Cost of Equity Summary 1
Table 10-12 summarizes ORA’s and BVES’ recommended cost of 2
equity for Test Year 2018. 3
Table 10-12 4
Cost of Equity Summary 5
Financial Model ORA BVES
(1) (2)
Discounted Cash Flow 8.76 % 10.11 %
Historic Risk Premium 10.79 % 11.65 %
Capital Asset Pricing
Model
8.81 % 10.69 %
Comparable Earnings --- 13.15 %
Average 9.45 % 11.00 %
6
ORA’s recommended cost of equity for BVES is more in line with recent 7
Commission decisions authorizing returns on equity for electric utilities. The 8
November 2016 issue of Public Utilities Fortnightly reported authorized ROE’s 9
for electric and gas utilities throughout the United States.74
The Commission 10
decisions reviewed in this article cover the period 2014 through 2016. The 11
trend has been for Commissions to lower the authorized ROE’s for electric 12
and gas utilities. For the entire sample of electric firms reported in this article 13
the average authorized ROE has declined from 9.99% to 9.64%. Furthermore, 14
the most recent settlement agreement between the CPUC and the major 15
energy utilities authorized ROE’s for Test Year 2018 of 10.25% for Pacific 16
Gas and Electric Company, 10.30% for Southern California Edison Company, 17
and 10.20% for San Diego Gas and Electric Company.75
These are all lower 18
74 Public Utilities Fortnightly, November 2016, pp. 64-66.
75 D.17-07-005, Mimeo, July 17, 2017, p. 14.
33
than the previous authorized ROE’s for these utilities.76
ORA’s recommended 1
cost or return on equity is clearly within this range. 2
V. DISCUSSION/ANALYSIS OF COST OF LONG-TERM DEBT 3
ORA’s recommended cost of debt of 6.40% is based on the 4
recommendations of ORA staff witness Mukunda Dawadi. In the recent ORA 5
cost of capital testimony for San Jose Water Company, Golden State Water 6
Company, California American Water and California Water Service Company 7
Mr. Dawadi recommended a cost of debt for Golden State Water Company of 8
6.40%.77
9
VI. WITNESS QUALIFICATIONS 10
Q.1 Please state your name and address. 11
A.1 My name is Thomas M. Renaghan. My business address is 505 Van Ness 12
Avenue, San Francisco, California. 13
Q.2 By whom are you employed and in what capacity? 14
A.2 I am employed by the California Public Utilities Commission as a Public 15
Utilities Regulatory Analyst V in the Office of Ratepayer Advocates Energy 16
Cost of Service and Natural Gas Branch. 17
Q.3 Briefly describe your educational background and work experience. 18
A.3 I have a Bachelor of Arts Degree in Economics from California State 19
University, Hayward and a Ph.D. in Economics from the University of 20
California, Davis. 21
76 The results of this calculation are reported in ORA’s workpapers.
77 Direct Testimony of Mukunda Dawadi, Cost of Capital Proceeding, A.17-04-001, August 1, 2017, p. 1.

34
I have been employed with the Commission since January 1984. My 1
experience with the Commission has been in the areas of labor and non-labor 2
escalation, energy demand forecasting, measurement of total factor 3
productivity for electric, gas and telecommunications firms, and cost of 4
capital. 5
Q.4 What is your area of responsibility in this proceeding? 6
A.4 I am responsible for Exhibit ORA-10, Cost of Capital. 7
Q.5 Does that complete your prepared testimony? 8
A.5 Yes, it does. 9