report on the revenue neutral rate and structure of rates
TRANSCRIPT
Report on the Revenue Neutral Rate and
Structure of Rates for the Goods and Services Tax
(GST)
December 4, 2015

Content Page No.
Foreword I
I Introduction 1
II Benefits of Proposed GST 3
Governance 3
Make in India by Making one India 4
The growth effect via the boost to investment 11
III Current Structure of Indirect Tax : Highlights 12
Centre 12
States 13
Centre and States 15
IV Estimating India's Revenue Neutral Rate (RNR) under the GST 15
Macro Approach 16
Indirect Tax Turnover Approach 17
Direct Tax Turnover Approach 18
V Recommendations 20
The Magnitude of the RNR 20
Critical assessment of the methodology of the three approaches 21
Recommendations and validation 23
A risk analysis 28
Allocation of RNR between Centre and states 30
The structure of rates 31
Exemptions 31
Lower, standard and “demerit” rates 32
Assigning products to rates 35
Exemptions threshold 38
Rates or Rate Bands and the issue of fiscal autonomy of States under the GST 39
Potential price impact of GST 40
Current taxes on the consumption basket 41
Distribution of taxes by income groups 43
The price impact of the GST Regime 44
Concluding observations 48
Compensation 49
Other issues 51
VI Conclusion 52
Tables Page No.
Table 1 : Comparison of Federal VAT Systems 2
Table 2: Impact of the Central Sales Tax 5
Table 3: Effect of Countervailing Duty (CVD) Exemptions: An Illustration 9
Table 4: Summary of India's Indirect Tax System 14
Table 5: Summary of approaches to estimating RNR 19
Table 6: Committee’s recommendations compared with other approaches to estimating
RNR 25
Table 7: RNR and Standard Rate structure for Centre and states (per cent) 34
Table 8: Gold rate and it impact on Standard Rate 34
Table 9: Exemptions Thresholds: Current and Proposed 39
Table 10: Summary of Recommended Rate Options (in percent) 53
Figures Page No.
Figure 1: Collection-efficiency in Major VAT/GST Economies 26
Figure 2: Standard rate of VAT in High and Emerging Market Economies 28
Figure 3: Comparing “Desirable” Taxation with Actual Taxation of Selected
Commodities 37
Figure 4: Food, rent and clothing have high weight in CPI 42
Figure 5: A large part of CPI is exempt from Excise/VAT 42
Figure 6: Only 15% of CPI is taxed at a "normal" rate 43
Figure 7: Low average tax rate on most large categories 43
Figure 8: Average tax rates by category for top 60% 44
Figure 9: Average tax rates by category for bottom 40% 44
Figure 10: CPI would have high sensitivity to single RNR 46
Figure 11: Scenario 1: some categories to see inflation 46
Figure 12: Dual rate sensitivity (Normal on 11% of CPI) 47
Figure 13: Scenario 2: Less than 3% inflation for items seeing price rise 47
Figure 14: Scenario 3: Only health to see high inflation 47
Boxes Page No.
Box 1: Estimating the association between rates and compliance 58
Box 2: Will There be Large Compensation Requirements? An Illustrative Exercise 61
Box 3: Evidence-based tax policy? Incorporating social policy objectives in the GST 64

Annexure Page No.
Annex 1: Macro-Approach to Estimating RNR 74
Annex 2: Indirect Tax Turnover-based Approach to Estimating RNR 77
Annex 3: Direct Tax Turnover Approach to Estimating RNR 85
Annex 4 : The possible impact of the GST on Small Scale Industries 94
Annex 5: Effective tax rates by commodities under 3 GST scenarios 95
References 96

Foreword
Ahead of the possible implementation of the Goods and Services Tax (GST), the government
appointed a Committee with the following terms of reference:
(a) The Committee may recommend possible tax rates under GST that would be consistent
with the present level of revenue collection of Centre and States.
(b) While recommending GST rates the Committee may develop a dynamic model to
assess the impact of the following parameters on the tax rates viz. expected levels of
growth of economy, different levels of compliance and broadening of tax base under
GST.
(c) Analyse the sector-wise and State-wise impact of GST on the economy.
(d) The Committee may invite experts and stakeholders for consultations as it deems fit.
The composition of the Committee is the following:
Dr. Arvind Subramanian, Chief Economic Adviser, Ministry of Finance (Chairman)
Dr. W R Reddy, Principal Secretary, Taxes, Government of Kerala
Dr. P D Vaghela, Commissioner, Commercial Taxes, Government of Gujarat
Shri K Rajaraman, Principal Secretary and Commissioner, Commercial Taxes,
Government of Tamil Nadu (since transferred from the post)
Shri Ritvik Pandey, Commissioner, Commercial Taxes, Government of Karnataka
Shri Udai Singh Kumawat, Joint Secretary, Department of Revenue
Shri Alok Shukla, Joint Secretary, Tax Research Unit, Central Board of Excise and
Customs
Shri Upender Gupta, Commissioner, GST, Department of Revenue
Ms. Aarti Saxena, Deputy Secretary, State Taxes, Department of Revenue
The Committee met several times and had wide ranging consultations with experts in the field.
The experts included Arbind Modi and G D Lohani from the Department of Revenue, Kavita
Rao from the National Institute of Public Finance and Policy, Neelkanth Mishra from Credit
Suisse, Satya Poddar from Ernst and Young, Rinku Murgai, Fredrico Gil Sander and Urmila
Chatterjee from the World Bank, and Mario Mansour and David Wentworth from the Fiscal
Affairs Department of the IMF. I would like place on record my deep appreciation for the
consultations and material provided by the Committee members and other experts. These

insights have served as valuable inputs for the Report. The comments from the members of the
Committee have been appropriately reflected in the Report.
I would also like to thank Aakanksha Arora, Antony Cyriac, Narendra Jena, Kapil Patidar,
Pradyut Kumar Pyne, and Arvinder S. Sachdeva of Economic Division of the Department of
Economic Affairs for their efforts in the preparation of the Report.
(Arvind Subramanian)
Chief Economic Adviser
&
Chairman of the Committee

1
I. INTRODUCTION
1.1 As the world economy slows, and increasing financial volatility and turbulence become
the “newest normal,” only a few economies have the resilience to be a refuge of stability and the
potential to be an outpost of opportunity. India is one of those few. As oil and commodity prices
continue to be soft, and in the wake of actions taken by the government and the Reserve Bank of
India, macro-economic stability seems reasonably assured for India. This bedrock of stability
coupled with reforms to unleash the entrepreneurial energies of India can create the policy
credibility and business environment that India is indeed seizing the historic opportunity afforded
by domestic and international developments to propel the economy to a high growth trajectory.
Key amongst these reforms is the goods and services tax (GST), which has, in some ways, been
“priced” into expectations of the government’s reform program.
1.2 For nearly ten years, India has been on the verge of implementing a GST. But now, with
political consensus close to being secured, the nation is on the cusp of executing one of the most
ambitious and remarkable tax reforms in its independent history. Implementing a new tax,
encompassing both goods and services, to be implemented by the Centre, 29 States and 2 Union
Territories, in a large and complex federal system, via a constitutional amendment requiring
broad political consensus, affecting potentially 2-2.5 million tax entities, and marshalling the
latest technology to use and improve tax implementation capability, is perhaps unprecedented in
modern global tax history.
1.3 It is easy to overlook how ambitious the Indian GST will be, and a cross-country
comparison highlights the magnitude of ambition. According to the World Bank (2015), over
160 countries have some form of value added tax (VAT), which is what the GST is. But the
ambition of the Indian GST experiment is revealed by a comparison with the other large federal
systems—European Union, Canada, Brazil, Indonesia, China and Australia--that have a VAT
(the United States does not have a VAT).
1.4 As Table 1 highlights, most of them face serious challenges. They are either overly
centralized, depriving the sub-federal levels of fiscal autonomy (Australia, Germany, and
Austria); or where there is a dual structure, they are either administered independently creating

2
too many differences in tax bases and rates that weaken compliance and make inter-state
transactions difficult to tax (Brazil, Russia and Argentina); or administered with a modicum of
coordination which minimizes these disadvantages (Canada and India today) but does not do
away with them.
Table 1: Comparison of Federal VAT Systems
Nature of VAT Country Examples Disadvantages
Independent VATs at Centre
and States
Brazil, Russia, Argentina Differences in base and rates
weaken administration and
compliance. Inter-state
transactions difficult to
manage.
VAT levied and administered
at Centre
Australia, Germany, Austria,
Switzerland, etc.
State government relieved of
responsibility of raising taxes
which also takes away fiscal
discretion of States
Dual VAT Canada and India today A combination of the above
two and hence limits both
their disadvantages
“Clean” dual VAT India’s GST Common base and common
or similar rates facilitate
administration and
compliance, including for
inter-state transactions, while
continuing to provide some
fiscal autonomy to States Source: World Bank (2015)
1.5 The Indian GST is expected to represent a leap forward in creating a much cleaner dual
VAT which would minimize the disadvantages of completely independent and completely
centralized systems. A common base and common rates (across goods and services) and very
similar rates (across States and between Centre and States) will facilitate administration and
improve compliance while also rendering manageable the collection of taxes on inter-state sales.
At the same time, the exceptions—in the form of permissible additional excise taxes on sin
goods (petroleum and tobacco for the Centre, petroleum and alcohol for the States)—will
provide the requisite fiscal autonomy to the States. Indeed, even if they are brought within the
scope of the GST, the states will retain autonomy in being able to levy top-up taxes on these
“sin/demerit” goods.

3
1.6 Provided it can be reasonably well-designed, the Indian GST will be the 21st century
standard for VAT in federal systems.
1.7 It is, therefore, imperative to ensure that the design and implementation of this policy is
done right. And, one important, perhaps critical, dimension of this is the level and structure of
tax rates on which this Committee has been asked to make recommendations.
II.BENEFITS OF PROPOSED GST
2.1 Many benefits are claimed for the GST: that it will increase growth1; that it will increase
investment by making it easier to take advantage of input tax credits for capital goods; and that it
will reduce cascading.2 While these are important, in our view three benefits stand out in today’s
context: governance/institutional reform and “Make in India by Making one India,” which are
two key pillars of the government’s reform efforts. The investment, and hence growth, benefits
could also be substantial.
Governance
2.2 The government has placed a great deal of emphasis on curbing black money reflected in
the Black Money Bill. These measures can be very significantly complemented by a GST,
which, especially if it is extended to as many goods and services as possible (especially alcohol,
real estate and precious metals), can be a less intrusive, more self-policing, and hence more
effective way of reducing corruption and rent-seeking.
2.3 Under the GST, this can happen in two ways. The first relates to the self-policing
incentive inherent to a valued added tax. To claim input tax credit, each dealer has an incentive
to request documentation from the dealer behind him in the value-added/tax chain. Provided, the
chain is not broken through wide ranging exemptions, especially on intermediate goods, this self-
policing feature can work very powerfully in the GST.
1 An oft-cited study by the NCAER (2010) suggested that growth would increase by 0.9-1.7 per cent of GDP, purely based on the
elimination of the cascading of taxes on exports. What is unclear is the quantitative importance of the elimination of the
embedded taxes on exports under the GST relative to the current regime of zero-rating of exports. In other words, how
incomplete is the current zero-rating of exports and how much will the GST improve upon it are questions that need further
investigation. 2 Whether cascading is a serious problem and why is discussed by Keen (2013).

4
2.4 According to Pomeranz (2013), “The Value Added Tax (VAT) is a stark example of a tax
believed to facilitate enforcement through a built-in incentive structure that generates a third-
party reported paper trail on transactions between firms, which makes it harder to hide the
transaction from the government (e.g. Tait, 1972; Burgess and Stern, 1993; Agha and Haughton,
1996; Kopczuk and Slemrod, 2006). This belief has contributed to one of the most significant
developments in tax policy of recent decades (Keen and Lockwood, 2010): a striking increase in
VAT adoption from 47 countries in 1990 to over 140 today (Bird and Gendron, 2007).”
2.5 The best evidence of the impact of the paper trail on evasion comes from an experiment
in Chile which shows that firms that are part of the VAT chain are less responsive (in terms of
evasion) to announcements of an increase in audit, suggesting that being part of the VAT itself
performs the self-auditing function (Pomeranz, 2013). Moreover, the study finds that increasing
the audit probability of firms suspected of evasion generates spillovers up the VAT paper trail
that lead to an increase of their suppliers' tax payments. In a sense, the supplier, because of the
paper trail left by the VAT, knows that his evasion will be more likely to be detected once his
client is audited.
2.6 Second, the GST will in effect have a dual monitoring structure—one by the States and
one by the Centre. Hence, there will be a greater probability that evasion will be detected. Even
if one set of tax authorities overlooks and/or fails to detect evasion, there is the possibility that
the other overseeing authority may not.
Make in India by Making one India
2.7 The current tax structure unmakes India, by fragmenting Indian markets along state lines.
This has the collateral consequence of also undermining Make in India, by favouring imports and
disfavouring domestic production. The GST would rectify it not by increasing protection but by
eliminating the negative protection favouring imports and disfavouring domestic manufacturing.
2.8 These distortions are caused by three features of the current system: the central sales tax
(CST) on inter-state sales of goods; other numerous inter-state taxes that will be replaced by the
(one) GST; and the extensive nature of countervailing duty (CVD) exemptions.

5
CST3
2.9 The 2 per cent CST on inter-state sales of goods leads to inefficiencies in supply chain of
goods. Goods produced locally within the jurisdiction of consumption attract lower tax than
those produced outside. This tax encourages geographic fragmentation of production. The tax
can be avoided partially through branch/stock transfers by manufacturers. However, the tax
savings from branch transfers get substantially offset by the incremental costs of logistics and
warehousing of goods in multiple locations.
2.10 Consider a simple example, where intermediate goods produced in Maharashtra go to
Andhra Pradesh for production of a final good which in turn is sold in Tamil Nadu. Effectively,
the goods will face an additional tax of 4 per cent, which will reduce the competitiveness of the
goods produced in Andhra Pradesh compared with goods that can be imported directly to say
Chennai from South and East Asian sources.
2.11 How quantitatively significant is the impact of the CST? We have some suggestive
evidence based on data provided by six States: Maharashtra, Andhra Pradesh, Karnataka,
Gujarat, Tamil Nadu and Kerala. In these States, stock transfers, on average, account for as
much of inter-state trade as the trade subject to the CST (in the case of Gujarat and Andhra
Pradesh, stock transfers are more than twice as much) (Table 2). In other words, the distortion
affects fifty per cent of the total trade that flows between States.
Table 2: Impact of the Central Sales Tax (In Rs. Crore)
Maharashtra Tamil
Nadu
Kerala Karnataka Andhra
Pradesh
Gujarat Total
Taxable turnover 316598 214771 293151 186045 60669 304479 1375713
Non-taxable turnover
(stock transfer +
consignment sales)
241319 142321 44683 98300 160910 651620 1339154
Ratio of non-taxable to
taxable turnover
76% 66% 15% 53% 265% 214% 97%
Source- Respective States Government’s Revenue Division.
3 The proposed Constitutional Amendment bill provides for a 1 percent duty on inter-state sales for a limited period.
We strongly recommend that this provision be deleted for the very reason that the CST militates against Make in
India.

6
Eliminating other inter-state taxes
2.12 Currently, there are a number of inter-state taxes that are levied by the States in addition
to the CST. These include: entry tax not in lieu of octroi and entry tax in lieu of octroi.
2.13 Under the GST, all these taxes would be folded into the GST with enormous benefits.
What are the benefits?
2.14 There is ample evidence to suggest that logistical costs within India are high. One study
suggests that, for example, in one day, trucks in India drive just one-third of the distance of
trucks in the US (280 kms vs 800 kms). This raises direct costs (wages to drivers, passed on to
firms), indirect costs (firms keeping larger inventory), and location choices (locating closer to
suppliers/customers instead of lowest-cost location in terms of wages, rent, etc.). Further, only
about 40 per cent of the total travel time is spent driving, check points and other official
stoppages take up almost one-quarter of total travel time. Eliminating check point delays could
keep trucks moving almost 6 hours more per day, equivalent to additional 164 kms per day –
pulling India above global average and to the level of Brazil. So, logistics costs (broadly defined,
and including firms’ estimates of lost sales) are higher than the wage bill or the cost of power,
and 3-4 times the international benchmarks. 4
2.15 Another study shows that inter-state trade costs exceed intra-state trade costs by a factor
of 7-16, thus pointing to clear existence of border barriers to inter-state movement of goods.
Further, inter-state trade costs in India exceed inter-state costs in the US by a factor of 6,
suggesting that India’s border effects are large by international comparison. Bringing India’s
inter-state trade costs down to the US level (reducing by a factor of 6) increases welfare by 15
per cent; conversely, completely eliminating intra-state trade frictions raises welfare by 5 per
cent.5
2.16 All of these barriers to inter-state trade become even more important in India because the
share of roads in freight traffic is high (about 72 per cent) and much higher than in comparable
countries and rising over time because of under-investment in the Railways (Economic Survey,
4 JPS Associates ( 2011), “Economic Cost of Inter-State Barriers in Goods Traffic,” 5 Leemput (2014), “A Passage to India: Quantifying Internal and External Barriers to Trade.”

7
2015, pp.92-94). The implication is that it is especially important for India to reduce costs to
inter-state trade because of the excessive reliance on roads for movement of goods.
2.17 Now, all of these costs are not due to taxes. But, the World Bank estimates that about 20-
30 per cent are (World Bank).6 It is these costs that can be expected to decline with the
introduction of the GST, providing a boost to inter-state trade and hence productivity growth
within India.7
CVD and SAD Exemptions
2.18 It is insufficiently appreciated that India’s border tax arrangements undermine Indian
manufacturing and the “Make in India” initiative. Eliminating exemptions in the countervailing
duties (CVD) and special additional duties (SAD) levied on imports will address this problem.
How so?
2.19 It is a well-accepted proposition in tax theory that achieving neutrality of incentives
between domestic production and imports requires that all domestic indirect taxes also be levied
on imports. So, if a country levies a sales tax, VAT, or excise or GST on domestic
sales/production, it should also be levied on imports. In India, this is achieved through the
CVD/SAD which is levied on imports to offset the impact of the excise duty levied on
domestically manufactured goods.
2.20 However, CVD/SAD exemptions act perversely to favour foreign production over
domestically produced goods; that is, they provide negative protection for Indian manufacturing.
Table-3 illustrates the impact of CVD/SAD and excise exemptions. When there are no
CVD/SAD and excise exemptions (Scenario 1), neutrality of incentives between domestic goods
and imports is achieved which is desirable. In scenario 2, there is no excise exemption but there
is a CVD/SAD exemption which results in a large penalty on domestic producers (of 12.36 per
cent under certain assumptions about costs). But the important and subtle point relates to
scenario 3 when the excise and CVD/SAD are both exempted. This may seem apparently neutral
between domestic production and imports but it is not. The imported good enters the market
6 World Bank (2014), “Supply Chain Delays and Uncertainty in India: The hidden constraint on manufacturing growth.” Report
No: ACS14223, Republic of India Manufacturing Plan Implementation. 7 There will also be gains stemming from simplification of the documentation requirements under the GST.

8
without the CVD/SAD imposed on it; and, because it is zero-rated in the source country, is not
burdened by any embedded input taxes on it. The corresponding domestic good does not face the
excise duty, but since it has been exempted, the input tax credit cannot be claimed. The domestic
good is thus less competitive vis-à-vis the foreign good because it bears input taxes which the
foreign good does not. In the example, the penalty on domestic producers is over 6 per cent. In
effect, a policy designed to promote domestic manufacturing through excise exemption creates a
perverse incentive for the exempt industry and its eventual decline.
2.21 The CVD/SAD, which is levied to offset the excise duty imposed on domestic producers,
is not applied on a whole range of imports. These exemptions can be quantified. The effective
rate of excise on domestically-produced non-oil goods is about 9 per cent. The effective
collection rate of CVDs should theoretically be the same but is in actual fact only about 6 per
cent. The difference not only represents the fiscal cost to the government of Rs 40,000 crore, it
also represents the negative protection in favour of foreign produced goods over domestically
produced goods.
2.22 Two defenses of CVD exemptions are typically made. First, that CVD exemptions on
inputs help manufacturers by reducing their input costs. But under the current system and in
future when the GST is implemented, the CVD on inputs can always be reclaimed as an input tax
credit. So, CVD exemptions do not provide additional relief. In fact, they help collection
efficiency because they are levied at customs. 8
2.23 The second rationale advanced for exempting many imported goods from CVD is that
there is no competing domestic production. This argument is faulty because the absence of
competing domestic production may itself be the result of not having the neutrality of incentives
that the CVD creates. Domestic producers may have chosen not to enter because the playing
field is not level.
8 The CVD exemption strips the tax from its effective way of taxing the informal sector – where imported inputs are used directly
or indirectly by the sector.

9
Table 3: Effect of Countervailing Duty (CVD) Exemptions: An Illustration
Scenario 1:
No excise exemption for
domestically produced good, no
CVD exemption for imported
good
Scenario 2:
No excise exemption for
domestically produced good,
CVD exemption for imported
good
Scenario 3:
Excise exemption for
domestically produced good,
CVD exemption for imported
good
Domestic good Imported good Domestic good Imported good Domestic good Imported good
Cost of raw materials 100 100 100 100 100 100
Input tax 1/ 12.36 NA 12.36 NA 12.36 NA
Total cost of raw materials 2/ 100 100 100 100 112.36 100
Value added 100 100 100 100 100 100
CVD (@12.36 per cent) 3/ NA 24.72 NA 0 NA 0
Excise duty (@12.36 per cent) 24.72 NA 24.72 NA 0 NA
Total cost 224.72 224.72 224.72 200 212.36 200
Protection for domestic good 0.0%
-12.36%
-6.16%
1/ Excise tax rate = 12.36 per cent. Input tax does not apply for imported good because it is zero rated in the exporting country
2/ In scenarios 1 and 2, total cost of raw materials for domestic good is unaffected by input tax because there is no excise exemption and hence credit is available for the
tax. Customs duty is assumed to be 0 per cent
3/ CVD applied on total base of 200; 12.36 % of 200 = 24.72
Source: Committee’s calculations

10
2.24 Indian tax policy is therefore effectively penalising domestic manufacturing. How can
this anomaly be remedied? Simply by enacting an exemptions-free GST. In one stroke the
penalties on domestic manufacturing would be eliminated because the GST (central and state)
would automatically be levied on imports to ensure neutrality of incentives. In effect, India
would be promoting domestic manufacturing without becoming protectionist and without
violating any of its international trade obligations under the World Trade Organization (WTO) or
under India’s free trade agreements (FTAs).
2.25 In the meantime, the effect of the GST can be partially simulated even now by
eliminating the exemptions applied to CVD/SAD. The default situation should be an
exemptions-free regime. If particular sectors seek relief from the CVD/SAD, they should be
required to make their case at the appropriate forums.
2.26 In a sense, India finds itself in a de facto state of negative protection on the one hand, and
calls for higher tariffs on the other. It is win-win to resist these calls that would burnish India’s
openness credentials and instead eliminate the unnecessary and costly penalty on domestic
producers.
2.27 All these three sets of costs—the CST, the CVD exemptions, and other inter-state taxes—
should be viewed as undermining Make in India because in all cases, they favour foreign
production to domestic production. GST can then be thought of as a trade and productivity shock
and one that can be harnessed without recourse to protectionism: in effect, the GST will be
eliminating negative protectionism.
2.28 This increase in inter-state trade will then have another powerful consequence. A
common market will help attain convergence within India because production can be based on
comparative advantage. In other words, implementing the GST will help the lagging regions
catch up with the more advanced regions by making the former more profitable production
destinations.

11
The growth effect via the boost to investment
2.29 Under the current tax system, while the Union excise duties and State VAT applies to all
capital goods, input tax credits are generally limited to manufacturing plant and equipment. For
example, no input tax credits are allowed for the Union excise duties on capital equipment
acquired for use in transportation, infrastructure, distribution, or construction sectors because
these sectors are all outside the scope of excise duties which are applicable to manufacturing
only. Similarly, no credit is allowed for the State VAT on capital goods acquired by the service
sector (e.g., telecommunications, transportation, finance, insurance, and IT services).
2.30 Estimates vary on how much of current investment in a given year suffers from non-
creditable excise duties and/or VAT. For example, indirect tax collection data for 2014-15
indicate that the total amount of capital goods purchases for which CENVAT credit was claimed
was Rs. 1.6 lakh crore, divided between goods (Rs. 1 lakh crore) and services (Rs. 0.6 lakh
crore). National income accounts data suggests that investment in plant and equipment for the
same year by the non-government, non-household sector was about Rs. 7.4 lakh crore.
Apparently, the blocked input taxes could amount to as much as 75 per cent of total investment.
What could account for the difference and could the GST fill this gap?
2.31 If the GST could provide for a more seamless and efficient crediting of taxes paid on
capital goods, then capital goods prices would become effectively 12-14 per cent cheaper
(because they are taxed at the standard rate of 12.5 per cent currently by the Centre), increasing
the demand for capital goods, raising investment and hence growth.
2.32 Assuming an elasticity of investment demand with respect to price to be -0.5, GST, by
allowing full input tax credit for capital goods, could higher investment in capital goods by 6 per
cent, resulting in 2 per cent higher investment (as machinery and equipment account for around
one-third of total investment), which in turn could lead to incremental GDP of 0.5 per cent,
assuming an incremental capital output ratio of 4.
2.33 Prior to the introduction of GST in 1991, Canada also had an excise duty regime similar
to that in India. Studies for Canada estimated this beneficial impact of GST to be 0.5 per cent as

12
a result of the GST at the federal level only. The extent of tax cascading in India is much greater
because of more stringent rules in India for claiming tax credits.
2.34 In sum, investment is discouraged under the current system through the application of
excise duties and VAT to capital goods, for which no set off or input tax credit is provided. This
increases the cost of capital goods and reduces investment, which in turn leads to lower
employment and output.
III. CURRENT STRUCTURE OF INDIRECT TAXES: HIGHLIGHTS
3.1 This section describes briefly the structure of current rates of domestic indirect taxes at
the Centre and the States. The key takeaways are that the current tax structure is highly complex,
highly leaky (riddled with exemptions in goods that we estimate to be about 2.7 per cent of GDP
for the Centre and States together) characterized by significant differences between the Centre
and the States, and by a rate structure that does not confirm to what the evidence suggests might
be good policy. The GST, therefore, affords a unique opportunity to simplify and rationalize the
structure and also eliminate serious anomalies to make it consistent with policy objectives (see
paragraphs 5.56 to 5.60 and Box 3).
3.2 The details, also summarized in the Table 4, are the following:
Centre
3.3 In relation to goods, the Centre has a very complicated tax structure (Table-4), more
complex than that of most of the States, characterized by:
a multiplicity of rates, including central excise (the most important), cesses,
countervailing and special additional duties;
a multiplicity of central excise rates-8 ad valorem and several specific rates;
extensive exemptions, amounting to about 300 items compared to say 90 for most of
the States. These exemptions amount to about 1.8 lakh crore, amounting to about 1.5
per cent of GDP;
an incomplete base that stops at the manufacturing stage; and

13
an exemptions threshold of 1.5 crore with exports and exempted goods not counting
towards the threshold
3.4 In relation to services too, the Centre has a complicated rate structure. Although there is
one statutory rate, in practice, there are 10 other rates because of so-called “abatement” which
amounts to fixing a rate different from the standard rate and not allowing further input tax
credits. Abatement is necessitated in some part because of uncertainty in the base, and
specifically being unable to distinguish “goods” from “services.” The exemptions threshold is
Rs. 10 lakh.
3.5 At the Centre, there is incomplete provision of input tax crediting for goods, and
incomplete cross-crediting between goods and services.
States
3.6 In relation to goods, the States have structures characterized by:
a base that is complete in extending all the way to the retail stage
an exemptions threshold that varies across States between 5 and 10 lakh with a
provision for “compounding” that also varies across States in design9
a multiplicity of rates, including the VAT but additional taxes on inter-state trade
(octroi, entry tax)
fewer VAT rates (4 plus) and fewer exemptions (than at the Centre), with both rates
and exemptions varying across States. On exemptions, there is both a set that is
broadly common to all States and some state-specific ones like agriculture equipment,
aquatic feed, cereals and pulses are mostly common across the States whereas Agate
(Akik) stones and articles are state specific.
a standard VAT rate for goods that in most of the States is typically about 12.5-15 per
cent (compared with the standard rate of 12 per cent at the Centre)
9 Compounding refers to the exemption of firms from the VAT chain; instead they are charged a small turnover tax
without allowing for any input tax credits

14
Table 4: Summary of India’s Indirect Tax System
Type Base Number of Threshold 3/
Rates 1/ Standard Lower Standard Lower Standard Lower Base-weighted Collections-weighted Exempted Lower rate Higher rate Number 4/ value
Goods 5/
Centre (Excise) manufacturing 8 12.0 6.0 59.2 39.6 84.9 11.1 8.4 11.7 Food
Textiles, mobile
phones;
fertilizers;
some
intermediates
Tobacco,
petroleum
products,
automobiles,
aerated
water 1.5 crores 300
1.8
lakh
crore (a)
States (VAT) up to retail 3+ 12.5-14.5 4-5.5 28.5 67 32.8 54.8 7.5 9.6
Food, goods
of local
importance
Intermediates;
capital goods;
gold & precious
metals
Alcohol,
petroleum,
tobacco 5-10 lakhs 90
1.5
lakh
crore(b)
Services
Centre negative list 11 12.4 4.1 65.2 34.8 86.2 13.8 9.4 11.2
Education,
health,
public
services
construction,
work contract,
restaurant,
transport, life
insurance 10 lakhs
States 7/ None None
1/ Number of ad valorem rates. There are also numerous specific rates on goods charged by the centre. For services, there is one standard rate and 10 abatements.
2/ At the centre, there are 2 lower rates which are akin to a turnover tax; the states levy a lower rate of 1 percent on gold; the center levies higher rates on luxury xars and aerated drinks
3/ Does not apply to exports and exempted goods for goods at the centre
4/ Approximate; precise amounts vary by state. Exemption lists are not identical across states.
5/ Other excises on goods include cesses, countervailing duties and special additional duties (at the Centre) and octroi (in the States).
6/ Incomplete provision of input tax crediting for goods, incomplete cross-crediting between goods and services.
7/ Authority to tax services rests with the Centre but states tax services de facto, e.g. restaurants.
xx/ negative list of services includes health care services, veterinary clinic, charitable activities (under section 12AA of the Income tax Act, 1961) and others.
(a) From tax expenditure statement.
(b) Estimated by the committee
(*)=based only on Gujarat data
Rates (%) 2/ Base (%) Collections (%) Average rate (%) Description of Commodities xx/ Exemptions
Source: Compiled by Committee.

15
Centre and States
3.7 Another key difference between the Centre and the States, with implications for any
future standard rate is that the States have a much larger portion of the base (more than 65 per
cent) 10 taxed at the lower rate while the comparable number for the Centre is about 40 per cent.
One reason is that States typically place intermediate goods in the lower rate category. The
higher standard rate is therefore almost compelled by the fact of placing so much of the base at
the lower rate.
3.8 One corollary is that the weighted average statutory rate for goods is 8.4 per cent and 7.5
per cent for the Centre and States, respectively.
IV.ESTIMATING INDIA’S REVENUE NEUTRAL RATE (RNR) UNDER THE GST
4.1 The Committee had the benefit of 3 technical approaches to estimating the RNR which
are described in detail in Annexes 1-3. These will constitute the basis for the Committee’s
recommendations on the RNR.11 These are briefly summarised in this section.
4.2 Before describing the recommendations, it is important to make a point relating to
terminology. Throughout this report, the term RNR will refer to that single rate, which preserves
revenue at desired (current) levels. In practice, there will be a structure of rates, but for the sake
of analytical clarity and precision but also to facilitate comparisons across methodologies, it is
more useful and appropriate to think of the RNR as a single rate. It is a given single rate that gets
converted into a whole rate structure, depending on policy choices about exemptions, what
commodities to charge at a lower rate (if at all), and what to charge at a very high rate. That
single rate will be the focal point for the RNR. The RNR should be distinguished from the
“standard” rate defined as that rate in a GST regime (which has more than one rate), which is
applied to all goods and services whose taxation is not explicitly specified. Typically, the
10 Based on data for Karnataka, Maharashtra, Andhra Pradesh, Gujarat, Tamil Nadu, Bihar, Odisha, Chhattisgarh,
Delhi, Uttar Pradesh, Jharkhand, Rajasthan, Madhya Pradesh, West Bengal, Harayana and Puducherry
accounting for 78.5 per cent of the VAT base. 11 There have been other attempts at estimating the RNR, including by the Thirteenth Finance Commission and
NIPFP, We restrict the scope of our technical inputs to the three studies described in this section as they are the
most recent by way of data and methodology; they are also the three that were discussed within the Committee.

16
majority of the base will be taxed at the standard rate, although this is not true for the States
under the current regime.
4.3 The essence of calculating the RNR is highlighted in the simple equation:
t=R/B
where t is the RNR, R is equal to revenues (both Centre and state) generated from existing sales
and excise taxes, which will be replaced by the GST. The revenues to be replaced are estimated
to be Rs. 3.28 lakh crore for the Centre, and Rs. 3.69 lakh crore for the States, including the
revenues that will have to be compensated for the elimination of the Central Sales Tax (CST).
The total amounts to Rs. 6.97 lakh crore (excluding revenues from petroleum and tobacco for the
Centre, and from petroleum and alcohol for the States) or 6.1 per cent of GDP, with all numbers
pertaining to 2013-14 (the date chosen for all the technical studies) and for 29 States and 2 UTs.
What all the RNR exercises attempt to do is to calculate B, the total tax base for generating the
required GST revenues. The three approaches presented to the Committee can be called,
respectively, the macro, the indirect tax turnover (ITT), and the direct tax turnover (DTT) based
approaches.
Macro approach
4.4 The macro approach—presented by the staff of the International Monetary Fund--makes
use of national income accounts data and supply-use tables to arrive at the base B. It uses the
following formula:
𝐵 =∑(𝑌 +𝑀 − 𝑋) − [(1 − 𝑒)∑(𝑁 + 𝐼)]
Where B is the potential GST base; Y is domestic output, (M-X) is net imports (imports minus
exports); (N+I) is consumption of intermediate and capital inputs; e is the exempt output ratio
(i.e. the tax base associated with inputs used in the production of exempt final consumption); and
the summation is over 140 goods and services and 66 sectors, based on the 2011-12 national
accounts. The following assumptions were made: (1) full compliance; (2) full pass-through of the

17
GST into prices; (3) no behavioral response; (4) the GST has a single positive rate, and a zero
rate on exports.
4.5 Under a standard scenario exempting health, education, financial intermediation and
public administration, the GST’s potential base is 59 per cent of GDP. Exempting basic food
items in addition (essentially unprocessed foods) reduced the potential base to 55 per cent of
GDP. However, exempting petroleum or electricity increases the potential base to 67 per cent of
GDP—given that such items are largely consumed as inputs rather than final consumption, their
exemption increases the base due to cascading. Assuming that the maximum revenue to be
replaced is 6.1 per cent of GDP, these estimates for the GST tax base, ranging from 55 per cent
to 67 per cent of GDP, suggest that the GST RNR rate, itself ranges between 9.1 (0.061/0.67)
and 11.1 per cent (0.061/.55).
4.6 Losses in the order of 10 to 20 per cent of potential revenues are common in OECD
countries; assuming 20 per cent increases the range of the RNR from 9-11 per cent to 11-14 per
cent.
4.7 In summary, this analysis suggests that the GST RNR rate ranges between 11 to 14 per
cent, depending on key policy choices regarding exemptions. The scenario that corresponds
closest to the proposed Constitutional Amendment bill yields an RNR of 11.6 percent after
factoring in a compliance rate of about 80 per cent of potential GST revenues.
Indirect Tax Turnover Approach
4.8 This approach, presented by the National Institute of Public Finance and Policy, estimates
the base in a three step process. First, it estimates the goods base at the level of the States. This
base is estimated by converting data on actual collections and statutory rates into a goods base.
In other words, the effective rate becomes the basis for the estimation of the goods base. In the
absence of data for all the States, the key assumption is that States collect revenues at the three
rates (1 per cent, 6 per cent, and 14 per cent) in such a proportion so as to yield a total taxable
base of Rs. 30.8 lakh crore.
18
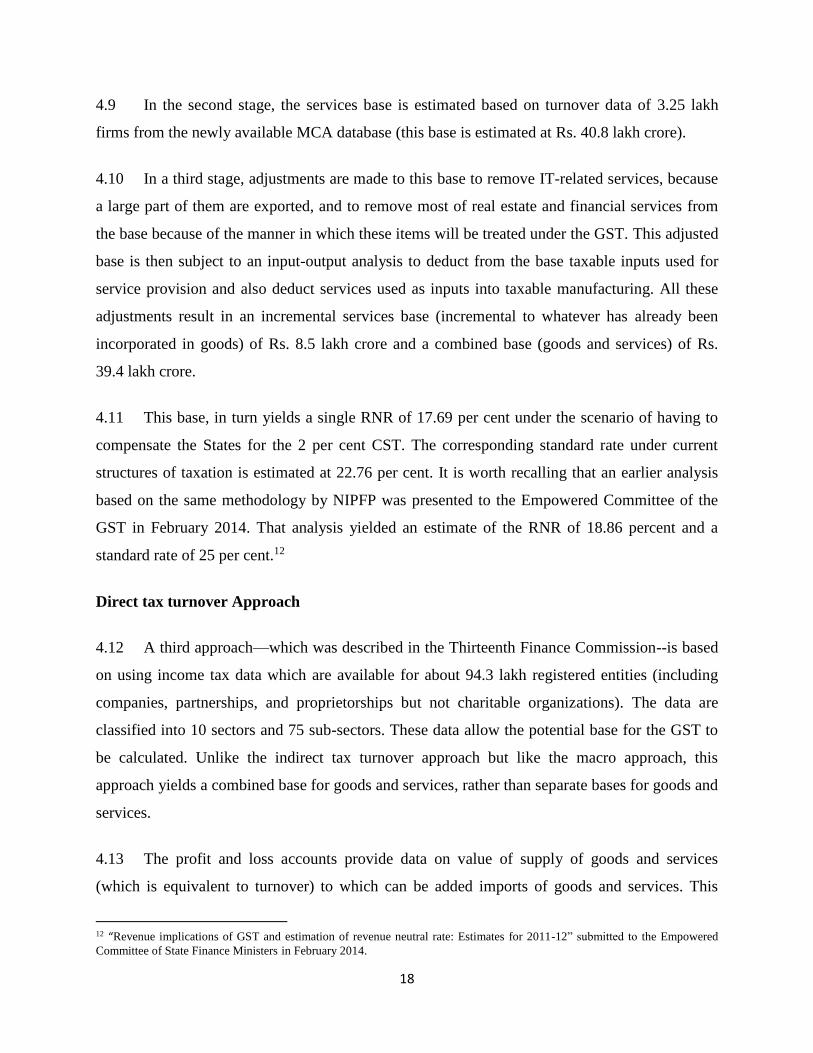
4.9 In the second stage, the services base is estimated based on turnover data of 3.25 lakh
firms from the newly available MCA database (this base is estimated at Rs. 40.8 lakh crore).
4.10 In a third stage, adjustments are made to this base to remove IT-related services, because
a large part of them are exported, and to remove most of real estate and financial services from
the base because of the manner in which these items will be treated under the GST. This adjusted
base is then subject to an input-output analysis to deduct from the base taxable inputs used for
service provision and also deduct services used as inputs into taxable manufacturing. All these
adjustments result in an incremental services base (incremental to whatever has already been
incorporated in goods) of Rs. 8.5 lakh crore and a combined base (goods and services) of Rs.
39.4 lakh crore.
4.11 This base, in turn yields a single RNR of 17.69 per cent under the scenario of having to
compensate the States for the 2 per cent CST. The corresponding standard rate under current
structures of taxation is estimated at 22.76 per cent. It is worth recalling that an earlier analysis
based on the same methodology by NIPFP was presented to the Empowered Committee of the
GST in February 2014. That analysis yielded an estimate of the RNR of 18.86 percent and a
standard rate of 25 per cent.12
Direct tax turnover Approach
4.12 A third approach—which was described in the Thirteenth Finance Commission--is based
on using income tax data which are available for about 94.3 lakh registered entities (including
companies, partnerships, and proprietorships but not charitable organizations). The data are
classified into 10 sectors and 75 sub-sectors. These data allow the potential base for the GST to
be calculated. Unlike the indirect tax turnover approach but like the macro approach, this
approach yields a combined base for goods and services, rather than separate bases for goods and
services.
4.13 The profit and loss accounts provide data on value of supply of goods and services
(which is equivalent to turnover) to which can be added imports of goods and services. This
12 “Revenue implications of GST and estimation of revenue neutral rate: Estimates for 2011-12” submitted to the Empowered
Committee of State Finance Ministers in February 2014.

19
yields the tax base of at about Rs. 222 lakh crore in turnover terms. Deducting the exempt sectors
from this base (petroleum, land component of real estate, the interest component of the financial
sector, electricity, gem and jewellery, education, health, and agricultural produce) narrows the
output tax base down to about Rs. 194 lakh crore.
4.14 Next, purchases are divided into 2 categories, those that reduce the base because of the
availability of input tax credits and those that add to the base either because they are purchases
by or from exempt sectors.13 The former include intermediate goods and services (Rs. 183 lakh
crore) and capital goods (Rs. 6 lakh crore). The latter include purchases by exempt sectors (Rs.
25 lakh crore), purchases of primary goods (Rs. 11 lakh crore) and purchases from unregistered
dealers Rs. 24 lakh crore). This yields an input tax base of Rs. 130 lakh crore.
4.15 Further adjustments are made to take account of the value added of firms that will fall
below the exemptions threshold (removed from the taxable base); of the alcohol sector (removed
from the taxable base); and the rail sector (added to the base because this sector is not part of the
data set in the first place).
4.16 Putting all these together gives a potential tax base of Rs. 58.2 lakh crore, yielding a
combined RNR of 11.98 per cent.
4.17 Table 5 highlights the estimated GST base and corresponding RNR of the three
approaches to estimating RNR.
Table 5: Summary of approaches to estimating RNR
Approach GST Base
(in lakh crore)
RNR
(per cent)
Macro 59.9 11.6
ITT 39.4 17.7
DTT 58.2 12.0
ITT= Indirect Tax Turnover
DTT=Direct Tax Turnover
Source: Based on three approaches to estimating RNR
13 The export sector is exempt with full refund (i.e. zero-rated).
20
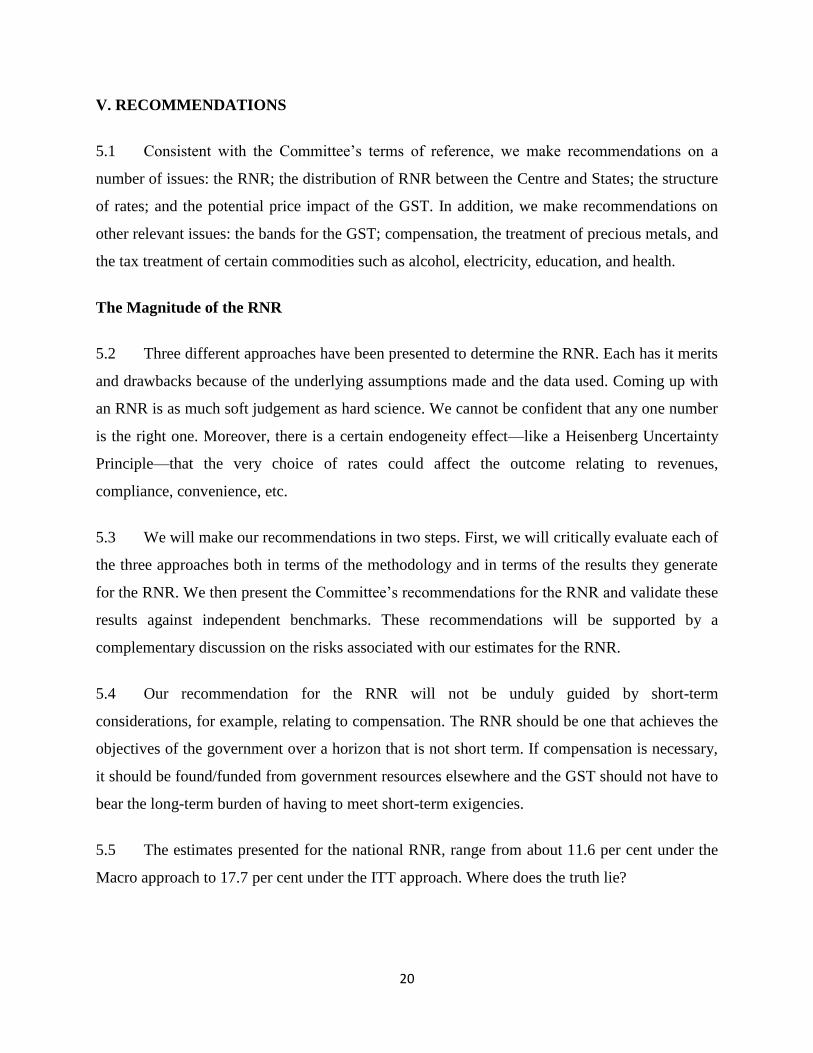
V. RECOMMENDATIONS
5.1 Consistent with the Committee’s terms of reference, we make recommendations on a
number of issues: the RNR; the distribution of RNR between the Centre and States; the structure
of rates; and the potential price impact of the GST. In addition, we make recommendations on
other relevant issues: the bands for the GST; compensation, the treatment of precious metals, and
the tax treatment of certain commodities such as alcohol, electricity, education, and health.
The Magnitude of the RNR
5.2 Three different approaches have been presented to determine the RNR. Each has it merits
and drawbacks because of the underlying assumptions made and the data used. Coming up with
an RNR is as much soft judgement as hard science. We cannot be confident that any one number
is the right one. Moreover, there is a certain endogeneity effect—like a Heisenberg Uncertainty
Principle—that the very choice of rates could affect the outcome relating to revenues,
compliance, convenience, etc.
5.3 We will make our recommendations in two steps. First, we will critically evaluate each of
the three approaches both in terms of the methodology and in terms of the results they generate
for the RNR. We then present the Committee’s recommendations for the RNR and validate these
results against independent benchmarks. These recommendations will be supported by a
complementary discussion on the risks associated with our estimates for the RNR.
5.4 Our recommendation for the RNR will not be unduly guided by short-term
considerations, for example, relating to compensation. The RNR should be one that achieves the
objectives of the government over a horizon that is not short term. If compensation is necessary,
it should be found/funded from government resources elsewhere and the GST should not have to
bear the long-term burden of having to meet short-term exigencies.
5.5 The estimates presented for the national RNR, range from about 11.6 per cent under the
Macro approach to 17.7 per cent under the ITT approach. Where does the truth lie?

21
Critical assessment of the methodology of the three approaches
5.6 Each approach has advantages and shortcomings that are described below. The
Empowered Committee of the GST has had the benefit of familiarity only with the ITT approach
of the NIPFP and we will dwell to some extent on this analysis. The Committee would
underscore that the focus on the ITT approach does not signify that it is superior to the other two;
indeed, focusing on one approach can be limiting and misleading.
5.7 Five key features drive the results of the ITT approach:
i. The assumptions of collections at the different rates determine the goods base for the
States. We have obtained the actual data on such collections for16 States (Karnataka,
Maharashtra, Andhra Pradesh, Gujarat, Tamil Nadu, Bihar, Odisha, Chhattisgarh, Delhi,
Uttar Pradesh, Jharkhand, Rajasthan, Madhya Pradesh, West Bengal, Haryana and
Puducherry) that together account for about 78.5 per cent of all States’ VAT base. These
data vary significantly from the assumptions underlying the ITT approach. Specifically,
our data suggest that the aggregate base is distributed between the three different rates—1
per cent, 2-6 per cent, 12-15 per cent and higher rate--in the ratio of 11.6 per cent, 55.4
per cent, 28.5 per cent and 4.7 per cent. In contrast, the ITT assumed—without analyzing
actual data--tax base proportions of 2 per cent, 56.15 per cent, and 41.85 per cent at the 1
per cent, 5 per cent, and 14-15 per cent, respectively.
ii. The estimation of the services base by the ITT approach does not make any allowance for
purchases from the unorganized sector. Such purchases will lead to an increase in the
base—via cascading--because the final value will reflect the embedded taxes which
cannot be set off as input tax credit.
iii. The estimation of the services base also ignores one potentially important issue.
Currently, States tax most intermediate goods at the lower rate. If these goods were
shifted to the normal rate—as States have indicated they might be willing to do—there
would be an effective expansion of the tax base. It may be noted that taxes on
intermediates in a GST system are like withholding—collecting early on in the value
added chain but refunding them later on. So, in principle, this shift of intermediate goods
should not yield any additional taxes. But to the extent that the unorganized sector buys

22
intermediates from the organized sector, this shifting will result in greater taxes because
the withheld taxes on intermediates will not be refunded later in the chain because the
buyer is outside the tax chain. The lost base from these two effects—cascading and
withholding—is difficult to estimate. But we cannot assume, as the ITT approach does,
that this estimate should be zero. Corporate income tax data allows a guesstimate of the
cascading effect.
iv. A similar withholding type effect would come into play with the elimination of all CVD
exemptions which the ITT approach does not fully take into account.14
v. The ITT approach also does not fully incorporate into the base, sugar products and
textiles15 that are sold directly to the consumer.16
5.8 The DTT approach on the other hand is subject to two uncertainties: whether the output
tax base has sufficiently taken account of exempted sectors, and whether the estimates of
purchases from the unorganized sector—a key input that drives the final result—are reasonable.
5.9 The macroeconomic approach of the IMF suffers from being too aggregate in nature and
the implied tax base of Rs. 59.9 lakh crore seems to be on the high side. One particular source of
worry is that the tax base seems to increase substantially account of the exclusion of electricity
and petroleum. This seems unlikely given that in both cases, there is some considerable sales to
the final consumer.
5.10 But these two approaches have two important merits. They help provide a cross-check for
the ITT approach; perhaps more significantly, they highlight the need to validate the estimates
generated by all three approaches. We turn to this validation in the next section.
14 The ITT approach also does not include in the base that component of imports of goods and services that is sold directly to
consumers outside the dealer network. The Committee has not been able to quantify this omission. 15 There has been some uncertainty whether the states tax textiles products, especially man-made fibres. But it appears that
most—even a preponderance of--states do not. In that case, the tax base could be substantially under-estimated. Textiles going
as inputs into clothing would not add to the base as clothing products are subject to tax. But textiles going into other textiles
production or sold directly to the consumer would add to the potential future tax base. The uncertainty on textiles taxation
stems from the fact that the Centre gave up most of its power to tax textiles (in the form of Additional Excise Duties) to the
States. For example, in 2002-03, the Centre collected Rs. 4369 crore in AEDs (the nominal value of this was estimated at about
Rs. 8800 crore in 2014-15), which has since shrunk to about Rs. 600-800 crores. It appears that the States did not take up the
power ceded by the Centre, resulting in virtually no State-level taxation of textiles. 16 Another issue--a technical one—is that the calculation of the base uses the statutory rate of excise of 12.36% rather than the
effective rate of 9%.

23
5.11 All three approaches implicitly assume that there will be no benefits to the base and/or
revenues from improving compliance and or improved growth consequent upon implementing
the GST. But the macro approach does not assume current levels of compliance—as the other
two approaches do—but a theoretical one which may or may not correspond to current reality.
Recommendations and validation
5.12 Our recommendation is based first on making adjustments to the ITT approach:17 Rs.
3.12 lakh crore for the data-based revision to the States’ VAT base; Rs. 30,000 crore for the
omission of sugar; Rs. 45,000 crore for the cascading effect; and Rs. 95,000 crore for the choice
of the statutory rather than effective excise rate in quantifying the base. Then, we add an
adjustment for compliance efficiency gains (Rs. 2 lakh crore).
5.13 What is the basis for these adjustments?
5.14 Note that the ITT approach was based on a pure assumption about the States’ VAT base
which we have improved upon by collecting the relevant data for 16 States, accounting 78.5 per
cent of the entire VAT base of the states.
5.15 The adjustment for sugar is based on the national income estimate for value-added in the
sugar sector of Rs. 40,000 crore. We conservatively adjust this down to Rs. 30,000 crore.
5.16 Note that the authors of the ITT approach acknowledge that the withholding, cascading
and compliance effects are important. But they chose to ascribe a value of zero to these effects
because of uncertainty about arriving at a quantitative estimate. But that is clearly biased
downwards as the authors of the approach would themselves acknowledge. We have chosen to
address this bias by making some conservative estimates about the magnitude of these effects.
5.17 For the cascading effect, the ITT approach had earlier estimated an addition to the base of
10% of the incremental services base. The DTT approach estimates an addition to the base of
17 It is worth emphasizing that the ITT approach has itself undergone revision from a previous version. Some of the
important revisions in the latest version were adding real estate in to GST base and removing additional base on
account of unorganized sector, sugar and textile.

24
about 16%. We, conservatively, estimate that the under-statement of the base would be half that
assumed by the ITT approach which amounts to 45,000 crore.
5.18 For the compliance effect we draw upon cross-country experience. In Box 1, econometric
analysis of that experience yields an estimate that a 1 percentage point reduction in the standard
rate would increase the collection efficiency by 1 percent. The GST would lead to about a 4.1
percentage point reduction in the standard rate (in weighted terms) which would translate into a
4.1 percentage point increase in the C-efficiency or 9.3% increase in collection efficiency (based
on the current C-efficiency of 0.44). This is equivalent to an expansion in the tax base of Rs. 4.3
lakh crore. Again, we assumed, conservatively, and after consulting with the CBEC, that just
under half of this compliance improvement (Rs. 2 lakh crore) would be realized.
5.19 To summarize, our adjustments to the ITT approach are conservative in the following
ways:
We do not make any adjustments for the ITT approach understating the contribution of
textiles to the tax base which could be substantial. The magnitude of this omission is
suggested by the fact that the gross value of output and gross value added of textiles and
cotton ginning are 5.9 lakh crore and 1.7 lakh crore, respectively.
We do not increase the tax base to take account of the withholding effect;
We include only half of the NIPFP’s previous estimates of the magnitude of the
cascading effect; and
We incorporate under half the change of the compliance-enhancing effect suggested by
our econometric analysis;
We incorporate nothing for the impact of the possible growth-enhancing effect of the
GST
5.20 Under GST, the compliance gains would be the following:
At the Centre, the rate structure will be significantly simplified from more than 10 rates
(for both goods and services) and numerous exemptions to 2-3 rates and fewer
exemptions;
25
At the Centre and the States, significant improvements in compliance will result because
of the IT systems under which matching of supplier and purchase invoices will be
electronic and instantaneous, reducing the scope for fraud and evasion; this will also
improve compliance for direct taxes;
General compliance will improve because of dual monitoring by the Centre and the
States; and
The comprehensive definition of taxation of goods and services should result in a smaller
amount of the base falling through the cracks between “goods” and “services” as happens
currently. The elimination of abatements on services will reduce overstatement of input
tax credits.
5.21 The experience of all countries suggests improvements over time in GST implementation,
and in India’s case, a number of design features should contribute to such improvements in
efficiency. These are not improvements that will take years to materialize.
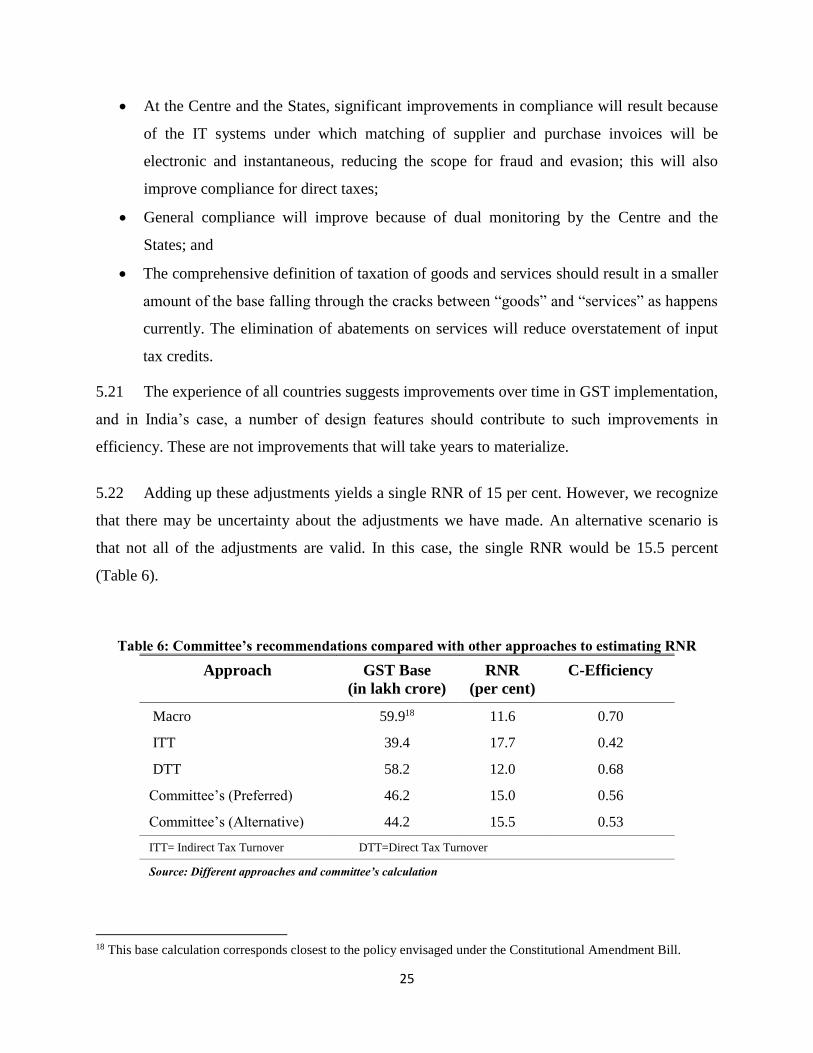
5.22 Adding up these adjustments yields a single RNR of 15 per cent. However, we recognize
that there may be uncertainty about the adjustments we have made. An alternative scenario is
that not all of the adjustments are valid. In this case, the single RNR would be 15.5 percent
(Table 6).
Table 6: Committee’s recommendations compared with other approaches to estimating RNR
Approach GST Base
(in lakh crore)
RNR
(per cent)
C-Efficiency
Macro 59.918 11.6 0.70
ITT 39.4 17.7 0.42
DTT 58.2 12.0 0.68
Committee’s (Preferred) 46.2 15.0 0.56
Committee’s (Alternative) 44.2 15.5 0.53
ITT= Indirect Tax Turnover DTT=Direct Tax Turnover
Source: Different approaches and committee’s calculation
18 This base calculation corresponds closest to the policy envisaged under the Constitutional Amendment Bill.

26
5.23 Our recommendation for the RNR is, therefore, a range for the RNR of 15-15.5%, with a
strong preference for the lower end of that range.
5.24 Next we validate this recommendation. Since there is the possibility of error in all the
approaches, including our recommendation, we must independently validate them against other
benchmarks. One important benchmark for validation relates to the efficiency of the tax system.
A commonly-used measure of performance of a VAT system is to compute a C-efficiency ratio.
This is measured as:
C-eff=R/(S*C)
where R stands for revenues collected, S is the standard rate and C is total final consumption (net
of value-added taxes). The denominator is a measure of the potential revenues that can be
potentially collected and the numerator actual collections. C-efficiency is simply a measure of
comparing actual against potential. The C-efficiency implied by the three approaches and the
Committee’s recommendations are then compared against C-efficiency in a number of other
countries and this comparison is shown in Figure 1.
Figure 1: Collection-efficiency in Major VAT/GST Economies
Source-IMF and Committee’s calculations
0
0.1
0.2
0.3
0.4
0.5
0.6
0.7
0.8
0.9
1
ITA
ES
PG
BR
FR
AB
EL
CA
NH
UN
FIN
SW
ED
NK
AU
TM
LT
JPN
CH
EN
ZL
CIV
ME
XP
HL
CO
LR
OM
UR
YP
ER
BR
AL
VA
MA
RC
HL
BG
RID
NG
EO
PR
YT
HA
ITT
CO
M(A
)C
OM
(P)
DT
TM
acro
TG
OT
CD
BE
NC
AF
UG
AR
WA
BG
DT
ZA
KE
NN
PL
ML
IZ
WE
KH
MB
FA
High Income Emerging Market Economies Low Income
Average= 0.60 Average= 0.57 India
Average=0.31

27
5.25 The average C-efficiency is about 0.6 for high income countries and 0.57 for emerging
market countries, and 0.31 for low income countries. The C-efficiency implied by the macro and
DDT estimates for the RNR (of 0.70 and 0.68 respectively) would place India above other
emerging market countries. In contrast, the c-efficiency implied by the ITT approach of 0.40
would put India well below the average of emerging market countries and only somewhat above
that for low-income countries.
5.26 Put differently, if the RNR, and the associated standard rate, of the ITT approach were
reasonably estimated, it would imply that India has either come up with an effective policy base
under the GST that is unusually narrow and/or Indian indirect tax administration is unusually
poor relative to comparator countries. This inference would be puzzling, if not problematic, not
least for implying that India’s tax efficiency is closer to that of Mali than of Brazil, Chile,
Indonesia or Thailand. This cross-country comparison is important evidence that the RNR
estimated by the ITT approach is too high.
5.27 In contrast, the RNR estimates for the other two approaches would place India at levels
comparable to other countries.19 Our recommendations yield estimates for the RNR that are at or
below the average of other EMEs. In that sense, they are conservative estimates for the RNR
because they too imply similar levels of efficiency of the Indian tax system. 20
5.28 Another consideration can be invoked to support the RNR of 15-15.5 per cent. Suppose
this RNR requires to be operationalized in a two rate GST structure with a lower rate of say 12
per cent and a standard rate of 17-19 per cent, depending on how goods are allocated between the
lower and standard rate.
5.29 Figure-2 shows data on the standard rate of VAT in selected high income and large
emerging market economies. It shows that the average standard rate for comparable EMEs is
19 It is worth noting that the exclusion of intermediates such as petroleum and power from the GST base tend to make India’s C-
efficiency better than it actually is. Excluding these inputs essentially lower the standard rate by more than it lowers the
foregone revenues from taxing these inputs: the measured C-efficiency improves as a result. 20 At the center, there are likely to be large revenue and base-enhancing effects which will increase C-efficiency. These include:
a decrease in the magnitude of exemptions from 300 items to 90 items in line with the recommendations of the Empowered
Committee. Currently about Rs. 1.8 lakh crore are lost in central excise exemptions of which a substantial proportion can be
recovered; expansion of tax base from manufacturing to retail level; bringing precious metals, gold, etc. into the tax base and
taxed at the lower rate; reduction in the exemptions threshold from Rs. 1.5 crore in the case of goods to Rs. 25 lakh; this will
offset the raising of the exemptions threshold for services from the current level of Rs. 10 lakh. Offsetting some of these effects
will be the fact that cascading could decline because of better administrative efficiency.

28
14.4 per cent and the highest standard rate is 19 per cent; and even for the high-spending and
therefore high-taxing advanced economies it is 16.8 per cent. An RNR of anything beyond 15 -
15.5 per cent will likely result in a standard rate of about 19-21 per cent which would make India
an outlier amongst comparable emerging economies. For example, the ITT approach’s RNR of
17.7 per cent would translate into a standard rate of 22.8 per cent, identifying India as having the
highest GST tax rate amongst emerging market economies. Our recommendations would still
place India at the upper end of the standard rates found across comparable countries. It is worth
emphasizing that the GST is intrinsically a regressive tax and the higher the rate the greater the
regressivity. Countries that have well developed social safety nets can better offset this
regressivity but India at a lower level of development is less able to do so and hence needs to be
especially mindful of rates that are out of line with international ones.
Figure 2: Standard rate of VAT in High and Emerging Market Economies
Source-IMF, Credit Suisse and Committee’s own calculation
A risk analysis
5.30 Since we cannot be certain of the RNR—it is after all our best assessment or best guess—
a risk assessment framework poses the question: should we err on the side of an RNR that is a
little low or a little high?
0
5
10
15
20
25
CA
N
JPN
AU
S
NZ
L
SP
A
GE
R
NL
D
FR
A
UK
ITA
NO
R
SW
E
MA
L
IND
ON
KO
R
PH
IL
ME
X
CH
IN
RU
S
CH
ILE
BR
A
MA
CR
O
DT
T
CO
M (
P)
CO
M (
A)
ITT
High income countries EMEs India
Average: 16.8 Average: 14.11

29
5.31 One risk of setting an RNR that is low is the re-emergence of a trust deficit between the
Centre and the States as happened in relation to compensation for lost CST revenues after the
global financial crisis. If revenues fall short, and the fiscal position of the Centre and States is
affected, the Centre will face a double whammy, with weak revenues for itself and an additional
burden of having to compensate the States. And, if as a result, compensation is delayed or
diluted, a trust deficit could re-emerge.
5.32 The second risk of setting a low RNR is that it could interact with slower growth and/or
weaker buoyancy going forward to magnify the revenue shortfall.
5.33 On the other hand, some of these risks can be overcome. In the event of a revenue
shortfall, the Centre and the States can both raise non-GST taxes (petroleum, tobacco and
tobacco products, and alcohol); they can together raise GST rates; and, as a last resort, the Centre
could even afford to relax its deficit target, based on the fact that was actually an investment for
implementing unprecedentedly ambitious tax reform with enormous long-run gains; moreover, a
moderately higher deficit due to a low GST will benefit consumers, especially poorer ones.
5.34 Second, given the unavoidable teething troubles that will afflict GST implementation, it
seems inadvisable to further burden the initial stages of implementation with higher rates that
will increase taxpayer displeasure, reduce compliance and increase disaffection. On balance,
lower rates will facilitate compliance as our evidence in Box 1 shows. The econometric analysis
suggests that a 1 percentage point reduction in the standard rate will lead to an improvement in
administrative efficiency (and compliance) of 1 percentage point which in the GST setting would
translate into an efficiency gain of about 15 percent.
5.35 Further, the improvement in compliance will not be restricted to indirect tax collections.
The paper trail of the GST will also help direct tax administration and improve compliance in
collections of corporate income taxes.
5.36 Third, the price consequences of a GST will be small, especially under a dual rate
structure with essential food items exempted. As the analysis in Section V reveals, an RNR in the
15-15.5 per cent range with a lower rate of 12 per cent and a standard rate of 18 per cent would
have no aggregate inflation impact. But a higher RNR with a lower rate of 12 per cent and a

30
standard rate of 22 per cent would increase inflation by between 0.3-0.7 percent. Care will have
to be taken to ensure that the GST does not become the target of popular disaffection on the
grounds that it fed higher inflation. In that respect a lower RNR is safer than a higher one,
especially considering that the GST is inherently regressive relative to direct income taxes.
5.37 Fourth, there is also a perception issue. Today’s GST rate is 14.36 per cent for services
(now nearly 15 per cent with the Swacch Bharat cess). If the RNR is greater than 15-15.5 per
cent, the rate for services will be in the 20-22 percent range which will make the GST seem like
a substantial tax increase when it strictly speaking is not and should not (after all, the new rate
should be revenue neutral). Optically, the GST as a rate hike should be avoided to the greatest
extent possible. A lower rate will be seen as more politically acceptable and will help taxpayer
compliance.
5.38 Fifth, even if the proposed RNR is on the side of being a little low, all the evidence
suggests that over time, compliance will improve, so that the GST will become a buoyant source
of revenue. This could happen even in the short run as discussed earlier. A marginally lower rate,
if it turns out to be that way, will signal the government’s confidence in the GST as a medium
term tax reform. This would re-inforce the signal that the government has already sent—in a
sense under-writing the GST—by committing to compensation for five years (despite the fact
that when the state VATs were implemented, compensation was not required beyond the second
year.)
Allocation of RNR between Centre and States
5.39 The Committee’s recommendations on rates are all national rates, comprising the sum
of central and state GST rates. How these combined rates are allocated between the center and
states will be determined by the GST Council. This allocation must reflect the revenue
requirements of the Centre and states so that revenues are protected. For example, a standard rate
of 17% would lead to rates at the Centre and states of say 8 percent and 9 percent, respectively
because that is roughly the ratio of GST revenues that would have to be generated by the centre
and states assuming that the 2013-14 data on which these estimates are calculated remain valid.

31
It would be preferable to keep all other rates identical between the center and states to minimize
distortions and facilitate compliance.
The structure of rates
Exemptions
5.40 Given the historic opportunity afforded by the GST, the aim should be to clean up an
Indian tax system that has effectively become an “exemptions raj” with serious consequences for
revenues but also governance. According to the government’s own figures, excise tax
exemptions (and taxing goods at low rates) result in foregone revenues of Rs. 1.8 lakh crore or
nearly 80 per cent of actual collections. Tentative estimates by the Committee suggest that the
comparable figure for the States is about Rs. 1.5 lakh crore. Together, India loses about 2.7 per
cent of GDP because of exemptions.
5.41 The Committee cannot state this in any stronger terms: if the GST is to be a success—
with an uninterrupted value chain that facilitates compliance and a buoyant source of revenue—
these exemptions must be plugged. Using exemptions as selective industrial policy has led to
generous un-selective policy, and proliferating exemptions. The road to exemptions hell is paved
with the good initial intention of restricting exemptions to a few industries.
5.42 It is also worth emphasizing that exemptions need not, and often do not, result in low or
zero tax burdens. If a product is exempted, the effective tax burden will depend on all the
embedded taxes on inputs going into that product. If the move to the GST results in lower rates
of taxation, it is possible that eliminating exemptions might actually reduce the effective tax
burden. This is especially likely in relation to small scale industries (SSIs) which are likely to
come within the scope of the GST because of reductions in the exemptions thresholds. The
combination of input tax credits that they can reap combined with lower standard rates might
result in SSIs facing lower tax burdens. Another hidden cost of exemptions is that it leads to
effective tax burdens that can vary widely across goods, leading to a multiplicity of effective tax
rates.
5.43 We would recommend that:

32
The exemptions list be narrow, restricted to a few goods, that are merit goods which
feature prominently in the consumption basket of the poor such as food items (see
Box 3 for a detailed analysis of which items deserve exemption status);
Exemptions should also be confined to final goods because taxes on intermediates are
in any case reclaimable as input credits;21
Exemptions must be common across the Centre and States;
Precious metals not be exempted to the extent they are for reasons described below;
Area-based and CVD exemptions be phased out.
5.44 For the dual GST system to be a success, the tax base must be common across the Centre
and States, otherwise tax administration becomes fiendishly complicated. Hence the importance
of the recommendation that the exemptions list be common across the Centre and the States.
Lower, standard and “demerit” rates
5.45 Ideally, the GST should aspire to a single rate, which would then also be the standard
rate. Since 2000, about 90 per cent of countries that have adopted a VAT have chosen to have a
single rate. The tax administration benefits of having a single rate are substantial. However, in
the years ahead, it may not be feasible to adopt a single rate GST system for social reasons. A 2-
rate structure (or a modified 2-rate structure) may therefore be adopted. What should be the
lower rate and the standard rate, and the demerit rate which would apply to a small group of
luxury items?
5.46 Consider the following simple formula for determining the structure of rates:
R = αLG + βSG + γSS + µDG
Where R is the RNR, LG is the lower rate on goods, SG is the standard rate on goods, SS the
standard rate on services; and DG the demerit rate on goods; α, β, γ, and µ are the respective
shares of these four rates in the underlying tax base, and together add up to 1.
21 Taxing intermediates will, however, have the advantage of increasing the tax base via the “withholding effect”
discussed earlier.

33
5.47 The first point to note is that the standard rate for goods and services must be the same
because that is the raison d’etre of the GST—to provide a common base for goods and services,
obviating the need for defining goods and services separately.
Thus: SG = SS = (R - αLG - µDG) / (β + γ)
5.48 The next point to note is that for any given RNR (that has been estimated), and a given
higher rate (discussed below), the lower is the lower rate, the higher will be the standard rate.
5.49 Ideally, the lower rate should not be far lower than the RNR for two reasons. The lower
the rate and the more the commodities that are taxed at this lower rate, the higher will be the
standard rate just as a matter of arithmetic. In fact, this is the pattern in the States. Lower rates of
4-5 per cent with a large part of the base taxed at these rates (about 60-70 per cent) results in the
necessity of high standard rates of 14-15 per cent. High standard rates make compliance
considerably more difficult.
5.50 The second reason for having lower rates that are close to the RNR relates to political
economy. The temptation to push commodities to the lower rate increases the lower is the low
rate. The benefit for any industry group of seeking to reduce the tax on its output is directly
proportional to the tax advantage: moving a product from 14 per cent to 6 per cent is worth more
than moving a product from 14 to 12 per cent. And in fact the pattern in the States reflects this
political economy at work.
5.51 So, if the RNR is close to 15 per cent, the effort should be to keep the low rate at about
12 (6 +6 each for the Centre and States) per cent.
5.52 As discussed earlier, a lot will depend on the magnitude of exemptions and decisions
about what goods are taxed at the lower rate and at the demerit rate. One of the major items
either exempted or taxed at a very low rate currently is gold, silver, and precious metals. If the
Centre moves to the smaller list as recommended and the States shift more of their tax base,
especially intermediate goods, toward the standard rate also as recommended, the pattern of
standard rates will look roughly as follows in table 7.

34
5.53 To illustrate the impact of policy choices on the standard rate, we present in Table 7, the
consequences for the standard rate (for the given RNR of 15 per cent) of the treatment of gold
and precious metals (for details on the tax treatment of these commodities, see Box 3). As the
table shows, the lower the rate that these commodities are taxed, the higher will be the standard
rate that is applied to all commodities. For example, if gold is taxed at 4 percent the standard rate
will be 17.3 percent. In contrast, if gold is taxed at 6 per cent, the standard rate can come down to
as much as 16.9 per cent (table-8).
Table 7: RNR and Standard Rate structure for center and states (per cent)
RNR Lower
Rate
Standard
Rate (a)
Higher
Rate
Goods
Center 7 6.0 8.0 20
States 8 6.0 9.0 20
Services
Center 7 - 8.0 -
States 8 - 9.0 -
Source: Committee’s calculation.
a: This corresponds to committee’s preferred scenario with rate on precious metal at 6per cent.
Table 8: Gold rate and it impact on Standard Rate
RNR
Rate on
precious
metals
"Low"
rate
(goods)
"Standard"
rate
(goods and
services)
"High/Demerit"
rate or Non-GST
excise (goods)
Preferred 15
6
12
16.9
40 4 17.3
2 17.7
Alternative 15.5
6
12
18.0
40 4 18.4
2 18.9 Source: Committee’s calculation.
5.54 It is now growing international practice to levy sin/demerit rates—in the form of excises
outside the scope of the GST--on goods and services that create negative externalities for the
economy (for example, carbon taxes, taxes on cars that create environmental pollution, taxes to

35
address health concerns etc.). As currently envisaged, such demerit rates—other than for alcohol
and petroleum (for the states) and tobacco and petroleum (for the Centre)—will have to be
provided for within the structure of the GST. The foregone flexibility for the center and the states
is balanced by the greater scrutiny that will be required because such taxes have to be done
within the GST context and hence subject to discussions in the GST Council.
5.55 We recommend one demerit rate and that rate should be such that the current revenues
from that high rate are preserved. Accordingly, we recommend that this sin/demerit rate be fixed
at about 40 percent (Centre plus States) and apply to luxury cars, aerated beverages, paan masala,
and tobacco and tobacco products (for the states). The Centre can, of course, levy an additional
excise on tobacco and tobacco products over and above this high rate. These goods are final
consumer goods and should be of high value (so that small retail outlets are not burdened with
the complication of having to deal with multiple rates) and clearly identifiable so that there are
no issues related to classification that could complicate tax compliance.
Assigning products to rates
5.56 Typically, the assignment of goods to different tax categories will be motivated by
considerations of equity. Goods that account for a large share of expenditures of poorer
households—for example, food-- will typically be merit goods and will either be exempt or
placed in a lower rate category. A related feature will be that this share will decline for richer
households.
5.57 But even if a good is a merit good, warranting an exemption or lower rate, policy makers
will want to ask how effective that decision will be based on how well targeted the implicit
subsidy will be, where the implicit subsidy is the difference between taxing a good at the
standard tax rate and the lower or zero rate: if the poor also account for a large fraction of total
expenditure on the merit good, then the subsidy will be well targeted; if, on the other hand, they

36
account for a small share of the total expenditure, then the subsidy decision will come with the
cost that most of the benefits of the subsidy will accrue to the relatively better off. 22
5.58 So, one can think of a commodity-wise benefit-cost analysis for determining the rate
structure. The benefit could be thought of as the subsidy rate for the target group, say the bottom
four deciles of the population.23 The subsidy essentially measures how much the expenditure of
the target group would be increased by exempting a good rather than taxing it at the standard
rate.
5.59 The cost could be measured in relation to the principle of effective targeting. The cost is
simply that proportion of the total subsidy for any particular good that does not reach the target
group and instead “leaks” to the non-target group, in this case, the top 6 deciles.
5.60 When we do a benefit-cost analysis of different commodities and compare it against the
actual structure of rates, a few broad policy conclusions emerge captured in Figure 3 (Box 3 has
a detailed analysis).
A number of commodities are treated fairly under the current system. Thus, merit goods
such as food items, especially cereals, pulses, edible oils, vegetables, and fuel are
appropriately taxed at zero or low rates (in Figure 3, these commodities have high
benefit-cost ratios and attract low taxes).
22 Ideally, of course, if governments had well-designed transfer programs, they would achieve the desired objective of helping
poorer households by providing cash transfers and sparing the tax system from having to attain equity objectives. In practice,
this is not always possible and in India DBTs are still a work-in-progress. See Keen (2015). 23 The analysis can be re-worked for other target groups, say the bottom 3 or 5 deciles.

37
Figure 3: Comparing “Desirable” Taxation with Actual Taxation of Selected Commodities
Source: NSS,CBEC, World Bank and Committee’s calculation
But there are a number of anomalies. The most glaring is gold, silver and precious
metals. They are a strong demerit good: the very rich consume most of it (see Table 2 in
Box 3 which shows that the top 2 deciles account for roughly 80 percent of total
consumption) and the poor spend a small fraction of their total expenditure on it;
moreover, they have become a source of macro-economic instability and less important
as a savings vehicle. Indeed, it is inconsistent for the government to actively promote
schemes (gold bonds and gold monetization) to wean consumers away from gold, on the
one hand, and also give highly concessional tax rates to buy gold, on the other. For all
these reasons, these commodities should in principle be taxed at the standard rate:
instead they are taxed at about 1-1.6 percent (center plus States). This anomalous
treatment must be rectified at least by raising current tax levels to 4 or 6 percent (see Box
3).
Education, health (excluding medicines), and electricity are also not appropriately
treated. They are all commodities that prima facie seem to be merit goods, warranting
zero or low tax burdens. However, in India, they are mostly consumed by the rich, and
Food
Food(excluding PDS subsidy)
Cereals(excluding PDS
subsidy)
Fuel and light excluding
electricity Fuel and light (excluding PDS
subsidy)Clothing
Medicine
ElectrcityEducation Beverages Tobacco Intoxicants and paan
Health except medicine
Gold
Cereals
0.0
10.0
20.0
30.0
40.0
50.0
-40.0 -30.0 -20.0 -10.0 0.0 10.0 20.0 30.0 40.0 50.0 60.0
Ben
eifi
t-C
ost
Rta
io
Effective tax rate
T6
B4
Under-Taxed?
Top six deciles
Bottom four deciles

38
many are largely privately provided. In the case of education, the current tax structure
turns out also to be regressive, with the bottom 4 deciles effectively paying greater taxes
than the top 6 deciles They deserve to be taxed more like standard goods. Yet, most
education and health services will be exempted under the GST. Electricity is planned to
be excluded from the GST. These exemptions and exclusions—which are bad from a tax
policy and administration perspective because they will break down the value added
chain--merit reconsideration.
Conversely, a number of demerit goods such as alcohol and tobacco are appropriately
taxed at high rates. But the case for alcohol’s inclusion in the GST relates to governance
and reducing corruption. A similar argument applies to including real estate in its
entirety in the GST.
Exemptions threshold
5.61 The current situation and proposed thresholds are described in Table 8. (Compounding
refers to the exemption of firms from the VAT chain; instead they are charged a small turnover
tax without allowing for any input tax credits). Setting an exemptions threshold has to balance
three considerations.
5.62 First, minimizing the burden on small taxpayers would call for higher thresholds. Second,
a high threshold also achieves social objectives because poorer households are more likely to buy
from smaller outlets (such as kirana shops). Third, on the other hand, a high threshold not only
risks foregoing revenues but also undermines the value-added chain that is so critical for the
governance benefits of having a GST. The current proposal is to have a common threshold of Rs.
25 lakh for goods and services combined but raising this threshold say upto Rs. 40 lakh may be
considered.

39
Table 9: Exemption Thresholds: Current and Proposed
Current Proposed under GST
Goods Services Compounding
Goods plus Services Compounding
Center 1.5 crore;
exports and
exempted
goods
excluded from
threshold
10 lakh not permissible 25 lakh combined
with no exemptions
and aggregated at the
level of legal entity
to be decided; but
possibility of
compounding from
exemptions
threshold (25 lakh)
up to 1 crore
States 5-10 lakh not
applicable
permissible in
some States for
some items and
at varying rates
same as above same as above
Source: Department of Revenue
5.63 Corporate income tax data suggests that between for turnover in the Rs. 25-40 lakh crore
range, there are 3.26 lakh registered entities (0.22 corporate and 3.04 non-corporates),
accounting for just over Rs. 1.04 lakh crore in total turnover. The benefit cost ratio of
minimizing the compliance burden relative to the revenue foregone may need to be considered.
Also, the option should be given to firms to be part of the GST chain even if they are below the
exemption threshold.
5.64 That said, the concern that reducing the threshold will raise the tax burden faced by small
scale industries (SSIs) may need to be reviewed. Under plausible scenarios, the effective burden
on SSI plants can actually decline, if the standard rate (currently around 25-26% in goods for the
center and States combined) comes down, as envisaged by the Committee (see the illustrative
example in the Annex Table).
Rates or Rate Bands and the issue of fiscal autonomy of States under the GST
5.65 The proposed GST bill provides for States to have a band of 2 per cent above the
standard GST rate so that they have some fiscal flexibility to adapt to state-level conditions.
There are two reasons why this flexibility may need to be reassessed. First, the argument for
fiscal flexibility/autonomy becomes less compelling: under the proposed GST, the States still
retain considerable flexibility because alcohol and petroleum—the biggest sources of revenues
for the States about 29 per cent of overall States’ indirect tax revenue and about 41.8 per cent of

40
the total revenue of States to be subsumed under GST—as well as power, real estate, health and
education remain outside the scope of the GST. Even if petroleum, alcohol and tobacco are
subsumed in the GST, States will retain the right to levy top-up excises on them.
5.66 In other words, the design of the GST is such that states will continue to have
considerable autonomy under the proposed GST either in its current form (which has a number
of exemptions and exclusions) or in a future GST regime that reduces these exemptions and
exclusions because there will be scope for states to levy top-up excises. That is the sense in
which, the Committee argued earlier that the Indian GST has the potential to marry the best of
centralized and decentralized features of VATs in large federal systems.
5.67 Second, if States exercise this flexibility, there would be varying rates for a given
product, which would create distortions across States and reduce efficiency and increase
compliance costs, especially for companies planning multi-state activities. These distortions and
costs must be seen against the fact that they will not lead any meaningful additional fiscal
autonomy to the states.
5.68 Rate bands would also create another complication for administering the CVD: under
World Trade Organization (WTO) rules, the CVD has to be the lowest of the state rates.
Supposing one state charged 8 per cent and another 12 per cent. The CVD would have to be
based on 8 per cent, which would immediately disadvantage production in the state charging the
higher rate, undermining Make in India programme.
Potential price impact of GST24
5.69 In principle, the GST should have no aggregate impact on inflation and the price level
because the new rate will be a revenue neutral one. Revenue neutrality may, however, not be
enough to guarantee that there will be no price impact across all categories of goods and
services. This is because the weights of commodities in the consumption basket (on which the
CPI is based) are different from their contribution to indirect tax collections. The impact on
particular goods and services will depend on the current structure of taxation (including
24 The analysis in this section should not be considered definitive because it is based on a number of assumptions. The caveats are
noted in greater detail in footnote 27 in Box 3.

41
exemptions) and the future structure of the GST both at the Center and the states. To estimate the
impact on future inflation, we need to begin with understanding the current structure of taxes.
Current taxes on the consumption basket
5.70 The average effective tax rate on consumption as measured by the Consumer Price Index
(CPI) is 10.4%. Excluding items outside GST coverage, the rate drops to 7%, as the excluded
items (e.g. alcohol, petrol and diesel) have very high tax rates. This relatively low rate reflects a
number of key features.
5.71 First, categories like food and beverages, rent and clothing have large weights in CPI
basket (Figure 4). These are categories that are either exempted or taxed at low rates. For
example, 75% of CPI is exempt from excise, and 47% of CPI is exempt from sales tax (Figure
5)25. Excluding taxed items that are outside GST (e.g. alcohol, petrol and diesel), 54% of the CPI
would be GST exempt.
5.72 Second, most items, where not exempted are taxed at a lower rate. Thus, in addition to
exempted commodities, a further 32% is taxed at a low rate, and only 15% at a normal rate
(Figure 6). The 4% taxed at a high rate are mostly the items excluded from GST, like petrol,
diesel and alcohol.
25 We use the Excise schedule from CBEC. Sales tax rates were provided by four states: Tamil Nadu, Karnataka, Kerala and
Gujarat. Items exempt from VAT in three of the four states are assumed to be exempt for this analysis.

42
Figure 4: Food, rent and clothing have high
weight in CPI
Figure 5: A large part of CPI is exempt from
Excise/VAT
Source: CMIE Source: CBEC, State Governments, Estimates
5.73 The taxation of some essential commodities in the CPI is shown in Figure 7. Most of the
categories with a large CPI weight have traditionally been taxed at low rates to reflect
distributional concerns; that is, these are goods and services which are important for poorer
sections of society and hence are taxed at zero or low rates. In some cases, while the headline tax
rate is zero, the effective tax rate is higher given the taxes on inputs. For example, the headline
average tax rate on cereals is 2.3%, and vegetables and fruits is 0.5%, but adjusted for the taxes
paid on inputs, the effective tax rate on cereals and vegetables rises to 4.8% and 1.1%
respectively. The same holds true for electricity: this is not taxed explicitly, but the effective tax
rate is 8.8%. Even after these adjustments however, these effective rates are low. Further, to
some extent, even these numbers do not truly reflect the net tax burden because of the subsidies
provided by the public distribution system (PDS) as described below.
Food,
Beverages
46%
Tobacco,
Alcohol
2%
Clothing
7%
Housing
10%
Fuel, Light
7%
Health
6%
Transport,
Comm.
9%
Education
4%
Others
9%
75.4%
47.3% 47.1%
6.7%
0%
10%
20%
30%
40%
50%
60%
70%
80%
Exempt from Excise Exempt from Sales
Tax
Exempt from GST*
* Items exempted from both excise and sales tax, to which are added
alcohol, tobacco, petroleum products

43
Figure 6: Only 15% of CPI is taxed at a
"normal" rate
Figure 7: Low average tax rate on most large
categories
Source: CBEC, State Governments, Estimates Source: CBEC, State Governments, Estimates
Distribution of taxes by income groups
5.74 These commodity-specific taxes can in turn be disaggregated by broad income groups
using consumption data from the 2011-12 NSS. Figures 8 and 9 present these for the top 60
(T60) per cent of the population and bottom 40 per cent (B40) of the population, respectively.
5.75 Taxes on food are about 4 per cent for both groups. This is because even though many
food items are exempt in most states, there are embedded taxes in food items such as fuel. This is
an important point to emphasize: exemptions do not lead to zero taxation because embedded
taxes via inputs cascade into the final product.
5.76 Because of the PDS, however, these taxes are offset by food subsidies so that the net tax
rate is negative for the B40 and close to zero for the T60. The magnitude of the impact of the
PDS, however, varies by states—high in Tamil Nadu and low in Gujarat. A similar pattern of
negative net taxes on the B40 can be observed in fuel and light because the PDS covers kerosene.
5.77 Taxes on health turn out to be among the highest (Figure 8): and the burden is higher for
the bottom 40 per cent, as bulk of healthcare expenditure is on medicines (which are taxed at a
higher rate than medical services), and particularly so for the bottom 40 per cent (Figure 9).
Education taxes also turn out to be regressive, as the consumption of books and school supplies
Zero
49%
Low
32%
Normal
15%
High
4%
Low= 0 - 12.4% Normal = 12.4 - 29.4% High= 29.4% +
4.8%
13.9%
8.8%9.5%
1.7% 1.1% 1.6%
6.1%
2.6%
8.8%
10.8%
2.3%
0%
2%
4%
6%
8%
10%
12%
14%
16%
18%
20%

44
is a higher part of education spend for the bottom 40%, and tuition (mostly tax exempt) is a
higher spend for the top 60%.
5.78 For clothing the average tax rates are relatively similar—about 9 %--between the two
groups, and across states. In fuel and light, overall taxes are progressive but because electricity
comprises a higher share of consumption of the top 60%, the exemption given to electricity
benefits the top 60% more than the bottom 40%.
Figure 8: Average tax rates by category for top
60%
Figure 9: Average tax rates by category for
bottom 40%
Source: NSSO, CBEC, State Governments, World Bank Estimates Source: NSSO, CBEC, State Governments, World Bank Estimates
These are an aggregate of five states: Tamil Nadu, Kerala, Karnataka, Gujarat and Andhra Pradesh. Estimates do not take in CST, and do not
also factor in inter-state movements (the numbers were calculated for each state and then added up to get a national proxy).
The price impact of the GST Regime
5.79 We analyse scenarios for both a single rate (of 14%) and two scenarios involving a dual
rate GST (12% and 18%; and 12% and 22%, respectively). In the dual rate scenarios, we apply a
high tax rate of 35% to about 1% of CPI (that relate to luxury goods).
5.80 In the single rate scenario, we assume that whatever attracts any duty right now would be
taxed. In the dual rate scenarios, we assume that most food items are exempt except where
processing is involved (e.g. cooked meals, biscuits, sugar, tea, papad, bhujia). We assume that
-10.0
-5.0
0.0
5.0
10.0
15.0
Per
cent
Top 60
Average Tax Rate Subsidy Net Tax Rate
-15.0
-10.0
-5.0
0.0
5.0
10.0
15.0
Per
cent
Bottom 40
Average Tax Rate Subsidy Net Tax Rate

45
processed food is taxed at the low rate of 12% (this is 9.6% of the 45.9% of CPI that is food &
beverages). We also assume that textiles and clothing are taxed at a low rate. We find that the
normal tax rate would then apply to about 11.2% of CPI.
5.81 The category-wise effective tax rates for major categories in these scenarios are shown in
Annex-5 (Figures 1-2), and the inflation impacts in Figures 10-14.
5.82 While assessing inflation, for each scenario we look at two outcomes: one if there is no
input-tax credit26, and the second with input-tax credit. In each of the three scenarios, we assume
that a change in the tax rate would drive the supplier to change pricing. In some cases, even if the
headline tax rate does not change (particularly for the exempt categories) if the taxes on inputs
go up, the producer may be motivated to raise prices. For example, if taxes on fertilizers go up,
the rice or cotton producer may take price increases. The reality may fall between the two
alternatives: even if GST credits start flowing in relatively fast, some producers may still price
on the headline rate.
5.83 We have also not factored in producers’ pricing power in assessing the impact on
inflation: some may not have the pricing power to take price increases (e.g. prices that are
determined globally, say a cotton farmer that sees an increase in input prices), while others, like
producers of personal products, may not cut prices even if they see a reduction in their tax rates.
26 We use the CSO's Input-Output Table (IOT) for 2007-08 (this is the latest available); the 299 CPI items were then manually
mapped to the 130 IOT categories.

46
Figure 10: CPI would have high sensitivity to
single RNR
Figure 11: Scenario 1: some categories to see
inflation
Source: CBEC, State Governments, Estimates Source: CBEC, State Governments, some Estimates
Category codes: HE = Healthcare (excluding Medicines); HEM: Healthcare (Medicines); FL = Fuel & Light; CL = Clothing; FB = Food & Beverages; TR = Transport & Communication; ED = Education; HO = Housing; OT = Others (personal products, etc); PT = Paan & Tobacco
5.84 Single-rate GST: The higher the single rate, the greater the price impact. For example, a
14% rate would drive CPI higher by 1.0% if the producers don't factor in the input-tax credit and
0.7% if they do. An 18% single rate would increase prices by 2.5% with or without input tax
credits. (Figure 10 shows the sensitivity to various rates). The items that may see the largest
increase in prices are clothing and medicines (Figure 11). The (small) increase in food and
beverages is largely because a number of even primary food items are currently taxed in some
states (though not in all). As we have assumed the current tax rate to be an average of state tax
rates, the average tax rate jumps from low single digits to the RNR, a substantial increase.
5.85 Dual-rate GST with a lower rate of 12 per cent and a standard rate of 18 per cent: This
rate structure would correspond broadly to an RNR of about 15-15.5 per cent. As one can expect,
this has low inflation impact given the small part of CPI that gets taxed at the normal tax rate
(Figure 12 shows the sensitivity). An 18% standard rate would impact CPI by -0.1% if all
producers reacted to headline tax changes and 0% if they reacted after adjusting for input tax
credits as well. Under this dual rate structure, food and beverages would see virtually no price
increase and neither would fuel and light, which would be especially important for protecting
poorer consumers (Figure 13).
0.2%
1.0%
1.8%
2.5%
3.3%
-0.2%
0.7%
1.6%
2.5%
3.4%
-0.5%
0.0%
0.5%
1.0%
1.5%
2.0%
2.5%
3.0%
3.5%
4.0%
12% 14% 16% 18% 20%
Single Rate Single Rate with Input Credit
-6%
-4%
-2%
0%
2%
4%
6%
CL FB HE HEM ED HO PT FL FLE TR OT
Single Rate Single Rate with Input Credit
CPI impact at RNR=14%

47
Figure 12: Dual rate sensitivity (Normal on
11% of CPI)
Figure 13: Scenario 2: Less than 3% inflation
for items seeing price rise
Source: CBEC, State Governments, some Estimates Source: CBEC, State Governments, some Estimates
5.86 Dual-rate GST with a lower rate of 12% and standard rate of 22%: This rate structure
would correspond broadly to an RNR of about 17-18%. The inflation impact in this scenario lies
in between the first and second scenarios: a 22% standard rate would drive a CPI increase of
0.3% if all producers reacted to headline tax changes and by 0.7% if they adjusted for input
taxes: the increase is a reflection of hidden taxation, i.e. the headline taxes may be low, but an
increase in input taxes would raise inflation. Health (excluding medicines) would see the highest
increases (Figure 14).
Figure 14: Scenario 3: Only health to see high inflation
Source: CBEC, State Governments, some Estimates
-0.5%
-0.1%
0.3%
0.6%
1.0%
-0.6%
0.0%
0.7%
1.3%
1.9%
-1.0%
-0.5%
0.0%
0.5%
1.0%
1.5%
2.0%
2.5%
14.0% 18.0% 22.0% 26.0% 30.0%
Dual Rate Dual Rate with Input Credits
Dual Rates: Low Rate = 12%
-4%
-3%
-2%
-1%
0%
1%
2%
3%
4%
5%
6%
HE HEM FL FLE FB PT ED HO TR CL OT
Dual Rate Dual Rate with Input Credits
Dual Rate: Low rate 12%,
Normal Rate 18%
-4%
-3%
-2%
-1%
0%
1%
2%
3%
4%
5%
HE HEM FL FLE FB PT ED HO TR CL OT
Dual Rate Dual Rate with Input Credits
Dual Rate: Low rate 12%,
Normal Rate 22%

48
Concluding observations
5.89 The experience in a number of economies like Australia, New Zealand and Canada, was
that GST implementation drove a step increase in prices: this boosted inflation for a year, and
once these prices came into the base, inflation declined, indicating low persistence of this
inflation.
5.90 For India, one broad conclusion is that under a dual rate GST, the aggregate impact on
inflation will depend on the RNR and the standard rate. An RNR in the 15-15.5 % range with a
lower rate of 12% and a standard rate of 18 percent would have negligible inflation impact. A
higher RNR with a lower rate of 12% and a standard rate of 22 percent would have 0.3-0.7%
impact on aggregate inflation. However, under both these scenarios, if food and fuel and light
were exempted, and with the PDS in operation, the price impact on these items of consumption
for the poor can be minimal.
5.91 These aggregate calculations would depend on a number of details in the design of the
eventual GST, including:
a) Final synchronized exemption lists;
b) The choice of categories to which low-rates are applied;
c) Exemption threshold for enterprises: a low threshold would mean that more
producers/sellers pay GST, and thus re-price their goods/services, whereas a high
threshold would bring that down (some categories like food could be particularly
sensitive to this choice). In many categories the bulk of the goods/service are accessed
through suppliers/outlets that don't pay tax (e.g. if all barbers/beauticians paid service tax,
collections would be Rs 5000-plus crore, but the collections are about Rs. 100 crore);
d) How many suppliers react just to the headline rate and have the pricing power to either
take price increases or hold on to prices even when they are net beneficiaries of GST
implementation;
e) Given the large impact of PDS on food and fuel and light, the impact on the bottom 40%
can be offset by state governments making changes to the PDS.

49
f) New GST features: currently excise and VAT cannot be offset, and cascade; in addition,
VAT credits cannot be carried across states. Both these characteristics would change in
the GST regime, and affect the eventual inflation.
5.92 However, to ensure that producers do not take advantage of the GST, the government
might consider setting up mechanisms to monitor the price impact, especially of sensitive items,
as was done by Australia. The Competition Commission of India should be especially vigilant in
identifying anti-competitive producer behavior that hurts consumers via excessive price
increases.
Compensation
5.93 Under the proposed agreement on the GST, the Centre has agreed to compensate the
States for any shortfall in their indirect tax collections in the transition from the current state
VAT and other taxes to the unified GST. This compensation will be provided for 5 years. In the
earlier experience of implementing the state VATs the Centre provided compensation for three
years but at a declining rate: 100 per cent of the shortfall in 2005-06, 75 per cent and 50 per cent
in the following two years respectively.
5.94 In the aggregate, of course, the States should not suffer any loss in revenues because that
is intrinsic to the calculation of a revenue neutral rate. That is, if the RNR for the States is set
appropriately, States as a whole should have the same revenue as before. But there are two
situations why shortfalls may arise. First, the aggregate RNR might be set too low. In this case,
of course, the GST Council may have to decide to raise rates going forward but interim shortfalls
will have to be compensated.
5.95 A more likely scenario is for shortfalls to be experienced by individual States even if
States as a whole experience revenue neutrality. Now, by definition, the move from the status
quo to the GST will involve a shift in revenues from producing States to consuming States, from
manufacturing to services, and within manufacturing from intermediate and capital goods toward
final goods. This distributional shift is unavoidable because it is in some ways intrinsic to the
move to the GST. Most States will stand to gain and it is likely that poorer States will be

50
beneficiaries because they consume more, on average, than they produce; and their economies
are more services-than manufacturing-based.
5.96 But pinning down exactly which particular States will gain is not easy because
disaggregated state-wise data that would allow reliable computation of the current and future tax
base for the States is simply not possible. Moreover, the taxable base of States will also depend
on rules on supply of goods and services and changing behavior of firms in response to these
rules (for example, headquarters and where supplied). For these reasons, this report has chosen
not to provide state-wise RNR calculations.
5.97 But we undertake an illustrative exercise in Box 2 to show that anxieties of some of the
major States may be unwarranted and that the compensation requirements may well turn out to
be minimal. We project the likely future tax base of goods consumption using NSS data and
likely future tax base of services by estimating urban incomes. We find that the share of the
future tax base for States is very similar to their share in current GST revenues. For those States
that receive a large share of current revenue because they have a large manufacturing base, their
anxieties can be reassured on the grounds that such States are also likely to have a large base in
services going forward.
5.98 Notwithstanding the above, there need to be clear rules on compensation to avoid glitches
and controversy in the implementation of GST and to reassure the States so that they too can
embark on GST implementation with enthusiasm and confidence.
5.99 Compensation will have to be provided for the shortfall between the actual level of
collection (RA) in any particular year and the collection level to be protected (RP) in that year.
The challenge will be in identifying the latter.
5.100 Under the system used to provide compensation for the transition to the state VAT, the
formula used for compensation was the following: the three best annual growth rates of revenue
collected in the previous six years was taken, was averaged, and then used for the calculation of
RP, namely the future revenue to be protected. This method had the virtue of simplicity because
state governments knew in advance the actual revenue they could expect to receive in the coming
year and could hence plan accordingly.
51
5.101 Going forward, there might be one issue in applying the same methodology to GST
compensation. In some of the last five years, revenues witnessed unusually high levels of growth
because of the combination of high real GDP growth and high inflation. The average of the
highest three revenue growth figures for the last three years (for the States as a whole) was over
16.8 per cent; and the corresponding average of highest three nominal GDP growth figures was
13.4 per cent.
5.102 Looking ahead, this picture could change dramatically both because real GDP growth has
slowed but more important because inflation has declined dramatically and is expected to remain
low. For example, in FY2016, nominal GDP growth is expected to be about 9.5 per cent and the
forecast for the period ahead is in the range of 11 per cent and rising slowly on expectations of a
pick-up in real GDP growth. Now, if historical buoyancy prevails, this will lead to substantially
lower collections which would be normal and which should not be attributed to the GST and
hence would not necessarily need to be compensated.
5.103 Hence, the formula for GST compensation going forward would have to take account of
two factors: on the one hand, erring on the side of generous compensation would provide
reassurance and certainty to the States on revenue availability and help them better plan their
expenditures; on the other hand, the formula should take account of the dramatically changed
outlook for nominal GDP and hence revenue growth for both the Centre and the States.
Other issues
5.104 The Committee has not been asked explicitly to analyze all issues relating to GST, some
of which have been reflected in the Constitutional Amendment Bill. But the Committee would be
remiss if it did not state its views on some important issues, for example, the exclusion of
alcohol from the scope of taxable items in the Constitutional Bill. Political compulsions may
require the exclusion of alcohol in the current conjuncture. But this is at odds with the aim of
improving governance and reducing rent-seeking which is pervasive in relation to alcohol.
5.105 Leaving that aside, there is still little reason to exclude alcohol constitutionally. Far better
to leave it in, and to allow the Centre and States at some future date to decide collectively to

52
bring alcohol within the GST net—like foreseen for petroleum products. To leave it out is to rule
out even the possibility of choice for all time which cannot be good policy.
5.106 Another misconception pervades discussions of bringing alcohol in the GST. Bringing
alcohol into the scope of the GST need not take away the right of States to tax alcohol. As is
envisaged for tobacco, it is perfectly possible—and indeed desirable—for some basic tax to be
levied on alcohol within the GST, and allow States to levy top-up sin taxes on alcohol for other
revenue or social reasons. In other words, bringing alcohol within the scope of GST would not
curtail States’ fiscal autonomy in this area.
5.107 The same applies to real estate which is also a major arena of rent-seeking. Bringing
electricity into the GST could also improve the competitiveness of Indian manufacturing. And,
as argued in detail in Box 3, reducing the exemptions on health and education services in the
GST would be more consistent with social policy objectives than the status quo.
VI. CONCLUSIONS
6.1 This is a historic opportunity for India to implement a game-changing tax reform.
Domestically, it will help improve governance, strengthen tax institutions, facilitate “Make in
India by Making One India,” and impart buoyancy to the tax base. It will also set the global
standard for a value-added tax (VAT) in large federal systems in the years to come.
6.2 The GST has been an initiative that has commanded broad consensus across the political
spectrum. It has also been a model of cooperative federalism in practice with the Centre and
states coming together as partners in embracing growth and employment-enhancing reforms. It is
a reform that is long awaited and its implementation will validate expectations of important
government actions and effective political will that have, to some extent, already been “priced
in.”
6.3 Getting the design of the GST right is therefore critical. Specifically, the GST should aim
at tax rates that protect revenue, simplify administration, encourage compliance, avoid adding to
inflationary pressures, and keep India in the range of countries with reasonable levels of indirect
taxes.

53
6.4 There is first a need to clarify terminology. The term revenue neutral rate (RNR) will
refer to that single rate, which preserves revenue at desired (current) levels. In practice, there will
be a structure of rates, but for the sake of analytical clarity and precision it is appropriate to think
of the RNR as a single rate. It is a given single rate that gets converted into a whole rate
structure, depending on policy choices about exemptions, what commodities to charge at a lower
rate (if at all), and what to charge at a very high rate. The RNR should be distinguished from the
“standard” rate defined as that rate in a GST regime which is applied to all goods and services
whose taxation is not explicitly specified. Typically, the majority of the base (i.e., majority of
goods and services) will be taxed at the standard rate, although this is not always true, and indeed
it is not true for the states under the current regime.
6.5 Against this background, we would draw a few important conclusions.
Because identifying the exact RNR depends on a number of assumptions and
imponderables; because, therefore, this task is as much soft judgement as hard science;
and finally also because the prerogative of deciding the precise numbers will be that of
the future GST Council, this Committee has chosen to recommend a range for the RNR
rather than a specific rate. For the same reason, the Committee has decided to recommend
not one but a few conditional rate structures that depend on policy choices made on
exemptions, and the taxation of certain commodities such as precious metals. The
summary of recommended options is provided in Table 10 below.
Table 10: Summary of Recommended Rate Options (in per cent)
RNR
Rate on
precious
metals
"Low"
rate
(goods)
"Standard"
rate
(goods and
services)
"High/Demerit"
rate or Non-GST
excise (goods)
Preferred 15
6
12
16.9
40 4 17.3
2 17.7
Alternative 15.5
6
12
18.0
40 4 18.4
2 18.9 Source: Committee’s calculations.
Note : All rates are the sum of rates at center and states

54
On the RNR, the Committee’s view is that the range should between 15 percent and 15.5
percent (Centre and states combined) but with a preference for the lower end of that
range based on the analysis in this report. The Committee has noted the risks both of
setting rates that are marginally high and low. On balance, however, it is easier to address
the consequences of erring on the side of marginally low rates.
On structure, in line with growing international practice and with a view to facilitating
compliance and administration, India should strive toward a one-rate structure as the
medium-term goal.
Meanwhile, we recommend a three-rate structure. In order to ensure that the standard rate
is kept close to the RNR, the maximum possible tax base should be taxed at the standard
rate. The Committee would recommend that lower rates be kept around 12 per cent
(Centre plus states) with standard rates varying between 17 and 18 per cent.
It is now growing international practice to levy sin/demerit rates—in the form of excises
outside the scope of the GST--on goods and services that create negative externalities for
the economy. As currently envisaged, such demerit rates—other than for alcohol and
petroleum (for the states) and tobacco and petroleum (for the Centre)—will have to be
provided for within the structure of the GST. The foregone flexibility for the center and
the states is balanced by the greater scrutiny that will be required because such taxes have
to be done within the GST context and hence subject to discussions in the GST Council.
Accordingly, the Committee recommends that this sin/demerit rate be fixed at about 40
percent (Centre plus states) and apply to luxury cars, aerated beverages, paan masala, and
tobacco and tobacco products (for the states).
This historic opportunity of cleaning up the tax system is necessary in itself but also to
support GST rates that facilitate rather than burden compliance. Choices that the GST
Council makes regarding exemptions/low taxation (for example, on gold and precious
metals, and area-based exemptions) will be critical. The more the exemptions that are
retained the higher will be the standard rate. There is no getting away from a simple and
powerful reality: the broader the scope of exemptions, the less effective the GST will be.
For example, if precious metals continues to enjoy highly concessional rates, the rest of
the economy will have to pay in the form of higher rates on other goods, including
essential ones. As the table shows, very low rates on precious metals would lead to a high

55
standard rate closer to 20 percent, distorting the economy and adding to inflationary
pressures. On the other hand, moderately higher taxes on precious metals, which would
be consistent with the government’s efforts to wean consumers away from gold, could
lead to a standard rate closer to 17 percent. This example illustrates that the design of the
GST cannot afford to cherry pick—for example, keeping a low RNR while not limiting
exemptions--because that will risk undermining the objectives of the GST.
The GST also represents a historic opportunity to rationalize the tax system that is
complicated in terms of rates and structures and has become an “Exemptions Raj,” rife
with opportunities for selectivity and discretion. Tax policy cannot be overly burdened
with achieving industrial, regional, and social policy goals; more targeted instruments
should be found to meet such goals, for example, easing the costs of doing business,
public investment, and direct benefit transfers, respectively; cesses should be reduced and
sparingly used. Another problem with exemptions is that, by breaking up the value-
added chain, they lead in practice to a multiplicity of rates that is unpredictable, obscured,
and distortionary. A rationalization of exemptions under the GST will complement a
similar effort already announced for corporate taxes, making for a much cleaner overall
tax system.
The rationalization of exemptions is especially salient for the center, where exemptions
have proliferated. Indeed, revenue neutrality for the center can only be achieved if the
base for the center is similar to that of the states (which have fewer exemptions—90
products versus 300 for the center). If policy objectives have to be met, instruments other
than tax exemptions such as direct transfers could be deployed.
The Committee’s recommendations on rates summarized in the table above are all
national rates, comprising the sum of central and state GST rates. How these combined
rates are allocated between the center and states will be determined by the GST Council.
This allocation must reflect the revenue requirements of the Centre and states so that
revenues are protected. For example, a standard rate of 17% would lead to rates at the
Centre and states of say 8 percent and 9 percent, respectively. The Committee considers
that there are sound reasons not to provide for an administration-complicating “band” of
rates, especially given the considerable flexibility and autonomy that states will preserve
under the GST, including the ability to tax petroleum, alcohol, and other goods and

56
services. Even in the future, when these products are brought into the GST, states should
and will retain fiscal autonomy by being able to levy top-up taxes on demerit goods.
Implementing the GST will lead to some uncharted waters, especially in relation to
services taxation by the states. Preliminary analysis in this report indicates that there
should not be large shifts in the tax base in moving to the GST, implying that overall
compensation may not be large. Nevertheless, fair, transparent, and credible
compensation will create the conditions for effective implementation by the states and for
engendering trust between the Centre and states;
The GST also represents a historic opportunity to Make in India by Making One India.
Eliminating all taxes on inter-state trade (including the 1 percent additional duty) and
replacing them by one GST will be critical to achieving this objective;
Analysis in the report suggests that the proposed structure of tax rates will have minimal
inflationary consequences. But careful monitoring and review will be necessary to ensure
that implementing the GST does not create the conditions for anti-competitive behavior;
Complexity and lags in GST implementation require that any evaluation of the GST—
and any consequential decisions—should not be undertaken over short horizons (say
months) but over longer periods say 1–2 years. For example, if six months into
implementation, revenues are seen to be falling a little short, there should not be a hasty
decision to raise rates until such time as it becomes clear that the shortfall is not due to
implementation issues. Facilitating easy implementation and taxpayer compliance at an
early stage—via low rates and without adding to inflationary pressures--will be critical.
In the early stages, if that requires countenancing a slightly higher deficit, that would be
worth considering as an investment which would deliver substantial long-run benefits.
Moreover, the counterpart of revenues falling short will be gains to consumers, especially
poorer ones.
Finally, the report has presented detailed evidence on effective tax burdens on different
commodities which highlights that in some cases they are inconsistent with policy
objectives. It would be advisable at an early stage in the future, and taking account of the
experience of the GST, to consider bringing fully into the scope of the GST commodities
that are proposed to be kept outside, either constitutionally or otherwise. Bringing alcohol
and real estate within the scope of the GST would further the government’s objectives of

57
improving governance and reducing black money generation without compromising on
states’ fiscal autonomy. Bringing electricity and petroleum within the scope of the GST
could make Indian manufacturing more competitive; and eliminating the exemptions on
health and education would make tax policy more consistent with social policy
objectives.
6.6 There is a legitimate concern that policy should not be changed easily to suit short term
ends. But there are enough checks and balances in the parliamentary system and enough
pressures of democratic accountability to ensure that. Moreover, since tax design is profoundly
political and contingent, it would be unwise to encumber the Constitution with the minutiae of
policy that limits the freedom of the political process in the future: the process must retain the
choice on what to include in/exclude from the GST (for example, alcohol) and what rates to levy.
The credibility of the macroeconomic system as a whole is undermined by constitutionalising a
tax rate or a tax exemption. Setting a tax rate or an exemptions policy in stone for all time,
regardless of the circumstances that will arise in future, of the macroeconomic conditions, and of
national priorities may not be credible or effective in the medium term. This is the reason
India—and most credible polities around the world--do not constitutionalise the specifics of tax
policy. The GST should be no different.
6.7 The nation is on the cusp of executing one of the most ambitious and remarkable tax
reforms in its independent history. Implementing a new tax, encompassing both goods and
services, to be implemented by the Centre, 29 states and 2 union territories, in a large and
complex federal system, via a constitutional amendment requiring broad political consensus,
affecting potentially 2-2.5 million tax entities, and marshalling the latest technology to use and
improve tax implementation capability, is perhaps unprecedented in modern global tax history.
The time is ripe to collectively seize this historic opportunity.

58
Box 1. Estimating the association between rates and compliance
Many considerations will go into the determination of the revenue neutral rate, but one of them
will also be the impact of rates on compliance. Theory suggests that increases in rates will lead
to reduced tax compliance. But is there any evidence from the experience of VAT itself?
Based on data provided by the IMF, the Committee undertook a simple econometric analysis
to test whether tax rates and compliance were correlated. Data was provided for 86 countries,
developed and developing. Compliance was measured in two ways: collection efficiency (CE)
and revenue productivity (RP). CE is measured as:
C-eff = R/(S*C)
where R stands for revenue collected, S is the standard rate and C is total final consumption
net of VAT collections. The denominator is a measure of the potential revenues that ought to
be collected and the numerator actual collections. C-efficiency is simply a measure of
comparing actual against potential. Revenue productivity (RP) simply replaces final
consumption with GDP in the denominator.
Simple regressions of the following form were run:
CE (RP) = α + A*S + B*ln(Y) + DUM+µ
Where the left hand side is either collection efficiency or revenue productivity; α is the
intercept term; S is the standard rate; Y is the per capita GDP of a country which controls for
other factors—such as quality of tax administration--that can affect collection efficiency; and
DUM is a dummy for country groups arranged according to income to again control for certain
group characteristics that might affect compliance; and µ is the standard error term.
The regressions are shown in Tables 1 and 2. There is a very strong association between the
standard tax rate and all measures of compliance even after controlling for per capita GDP and
group dummies (Figure 1). For example, for collection efficiency the coefficient (A) is about
(-) 1.22. This suggests that a 1 percentage point increase in the standard rate worsens

59
compliance by 1.22 percentage points.27
Figure 1: Regression of collection efficiency on standard rate, after controlling for per
capita GDP and group dummies for income groups
Source: Committee’s calculation
This has an important implication for the RNR in India. It suggests that a lower RNR will not
lead to as much of a loss in revenue as a simple calculation suggests. For example, if the
standard rate were reduced by say 4.1 percentage points in weighted terms that should increase
C-efficiency by 4.1 percentage points (using the conservative regression estimate of 1 rather
than 1.22) which amounts to about 9.3 per cent given the current C-efficiency ratio of 0.44.
Better compliance could therefore fetch potential additional revenues of nearly Rs 4.3 lakh
crore.
27 The same regressions were carried out for more recent data (for the year 2012) for a set of 36 countries. The
results are similar with a strong and significant negative association between collection efficiency and standard
rates, although the coefficient is slightly smaller (close to 1).

60
Table 1: Regression Results of Collection Efficiency (1) (2)
Estimation 1 Estimation 2
Log per capita GDP 7.16*** 7.20**
(1.40) (2.89)
Standard Rate -1.24*** -1.22*** (0.33) (0.35)
Constant 2.15 -0.64
(13.04) (24.85)
Income Group FE No Yes
Observations 84 84 Adjusted R2 0.293 0.276 Standard errors in parentheses * p < 0.10, ** p < 0.05, *** p < 0.01 Collection efficiency (Revenue/(Standard Rate* Consumption))
Table 2: Regression Results of Productivity
(1) (2)
Estimation 3 Estimation 4
Log per capita GDP 2.66* 1.02
(1.34) (2.46)
Standard Rate -0.81*** -0.85*** (0.29) (0.31)
Constant 27.87** 38.29*
(12.53) (21.51)
Income Group FE No Yes
Observations 84 84 Adjusted R2 0.088 0.076
Standard errors in parentheses * p < 0.10, ** p < 0.05, *** p < 0.01 Productivity (Revenue/(Standard Rate* GDP))

61
Box 2: Will There be Large Compensation Requirements? An Illustrative Exercise
The GST will necessarily entail some shift in revenues from production to consumption and from
manufacturing toward services. This shift is desirable but has raised concern especially from the
major manufacturing producing States that they might suffer some loss in revenues. As noted
earlier, it is nearly impossible to construct reliable tax bases—both new and old—at the level of
the States, especially for consumption of services. Hence, this report has refrained from
estimating state-specific RNRs.
But we can shed some light on this question by looking at proxies for the likely future tax base of
States. This future tax base will be based on consumption rather than production. So, we need to
find proxies for the States’ share in consumption of taxable goods and taxable services. We turn
to the NSS—which measures consumption--to calculate taxable goods consumption. We define
each state’s share in taxable consumption of goods as SGi where G the superscript refers to
goods and i the subscript refers to the State.
Since it is difficult to distinguish taxable from non-taxable services in the NSS, we turn to urban
incomes as a proxy for taxable services. After all, urban incomes will be a key determinant of
spending on business-to-consumer (B2C) services such as financial services, restaurants,
advertising, real estate, professions services etc all of which are taxable.
We compiled data on urban populations of the major States and on urban income, the latter by
multiplying urban population by state per capita domestic product28. This will under-estimate
urban incomes to the extent that urban per capita incomes are disproportionately greater than
rural per capita incomes especially in more urbanized States. We define, analogously to goods,
each state’s share in total consumption of services as SSi .
Then each state’s share of the total potential GST tax base (goods and services) can be defined
as:
STi = α SGi + (1-α) SS
i
28 At current market prices for 2011-12.

62
Where α refers to the share of goods and (1-α) the share of services, respectively in the overall
GST base.
We plot in Figure 1 below, each state’s share in the total GST revenues to be compensated (on
the y-axis) (current tax base) against the state’s share of total potential GST tax base (future tax
base) as defined above (on the x-axis). In this figure the weights assigned to goods and services
are 45 per cent and 55 per cent, respectively. A 45 degree line is also fitted to the chart which
shows points on the line where the current and future tax base are likely to be the same. All
points above the line denote States that will potentially need to be compensated. The chart has
two interesting and potentially significant implications for compensations:
Figure 1: Share of revenues to be compensated and share of potential GST base
Source: NSS, CSO and Committee own calculations
First, most of the points are below or close to the 45 degree line, and where they are
above the line, they are not very far above it. This suggests that on aggregate there will
not be a huge re-shuffling of taxable revenues
Second, the largest manufacturing States and the ones that currently get a lion’s share of
revenues either lie below the line, suggesting that far from needing compensation they
0
2
4
6
8
10
12
14
16
18
20
0 2 4 6 8 10 12 14 16 18 20
Shar
e in
tax
es t
o b
e co
mp
ensa
ted
Share in future GST base
To be compensated
Not to be compensated

63
will actually be benefitting from the move to the GST; or in the one case, where it is
above, it is actually very close to the line, implying a small compensation requirement.
We do a sensitivity analysis by changing the goods and services base to 50-50 and the results are
shown in Figure 2. In this case, too, the main conclusions described above continue to hold.
Figure 2: Share of revenues to be compensated and share of potential GST base
(robustness)
Source: NSS, CSO and Committee own calculations
In sum, we cannot be sure that the GST will lead to large shifts in the tax base away from the
advanced manufacturing States but the evidence presented above should provide some
reassurance that these shifts will not be seriously adverse for the country as a whole and also for
the large manufacturing States because they will also be substantial consumers of services.
0
2
4
6
8
10
12
14
16
18
20
0 2 4 6 8 10 12 14 16 18 20
Shar
e in
tax
es t
o b
e co
mp
ensa
ted
Share in future GST base
Not to be compensated
To be compensated

64
Box 3. Evidence-based tax policy? Incorporating social policy objectives in the GST
Once the RNR is known, it has to be operationalized by making decisions relating to:
exemptions, the structure of rates, including how many rates to have, and whether to have a
separate lower rate for merit/essential goods and a higher rate for de-merit or sin goods; and the
threshold below which firms will not have to be part of the GST tax administration.
Typically, the assignment of goods to different tax categories will be motivated by
considerations of equity. Goods that account for a large share of expenditures of poorer
households—for example, food--will either be exempt or placed in a lower rate category. But
these decisions have to be underpinned by analysis and evidence. This section undertakes such
an analysis and then compares the outcome of this analysis with current policy. In other words,
the question is whether current tax policy is consistent with social objectives in relation to a
number of key commodity groups:
Food and beverages (and sub-groups)
Clothing
Fuel and light (excluding power)
Medicines
Gold and precious metals
Power
Education
Non-medical health
Alcohol
Tobacco
These groups have been chosen because they are of special interest in the context of the GST:
either they are exempted (food, gold (Centre), power, non-medicine health, and education); or
they are taxed at a lower rate (clothing, gold (States), medicines); or they are charged at very
high, demerit rates (petroleum, tobacco, and alcohol).
Two concepts provide the starting point for making policy decisions based on evidence: equity
and effectiveness.
Equity allows for categorization of goods as merit/essential/sensitive (hereafter “merit”), etc.

65
Goods that account for a high share of expenditure of the poorer households will typically be
merit goods; and a related feature will be that this share will decline for richer households.
But even if a good is a merit good, warranting a lower or zero rate, policy makers will want to
ask how effective that decision will be based on how well targeted the implicit subsidy will be,
where the implicit subsidy is the difference between taxing a good at the standard tax rate and
the lower or zero rate: if the poor also account for a large fraction of total expenditure on the
merit good, then the subsidy will be well targeted; if, on the other hand, they account for a small
share of the total expenditure, then the subsidy decision will come with the cost that most of the
benefits of the subsidy will accrue to the relatively better off. 29
So, one can think of a commodity-wise benefit-cost analysis for determining the rate structure.
The benefit could be thought of as the subsidy rate for the target group, say the bottom four
deciles of the population.30 The subsidy essentially measures how much the expenditure of the
target group would be increased by exempting a good rather than taxing it at the standard rate.
The cost could be measured in relation to the principle of effective targeting. The cost is simply
that proportion of the total subsidy for any particular good that does not reach the target group
and instead “leaks” to the non-target group, in this case, the top 6 deciles.
We depict this benefit cost analysis graphically in Figure-1 for different group of commodities.
We want to focus on the groups (and related sub-groups) that are going to be the focus of
important policy choices in the GST mentioned earlier. The data are from the 2011-12 thick NSS
household expenditure survey.
The vertical axis measures the benefit—the effective subsidy rate, which is the subsidy as a share
of the total expenditure of the target group. The horizontal axis depicts the costs measured as the
share of total subsidy on any given product that leaks to the non-target group.
Three circles are drawn to highlight desirable evidence-based choices: commodities in the north-
29 Ideally, of course, if governments had well-designed transfer programs, they would achieve the desired objective of helping
poorer households by providing cash transfers and sparing the tax system from having to attain equity objectives. In practice,
this is not always possible and in India DBTs are still a work-in-progress. See Keen (2015). 30 The analysis can be re-worked for other target groups, say the bottom 3 or 5 deciles.

66
west corner of the graph circled in red are socially worthy of exemption because the benefits are
high and the costs are low. These include cereals, vegetables, pulses, edible oils, and fuel and
light (excluding electricity). Conversely, commodities in the south-east corner of the graph,
circled in blue are less worthy of being treated favorably in tax terms because the benefits are
low and the costs high. These include gold, non-medicine health services, education, and power.
In the middle are commodities, circled in green, that lie somewhere in between that are perhaps
worthy of being included at the lower tax rate. These include milk, poultry products and perhaps
clothing.31
Figure 1- Benefit Cost Calculus of Exempting Selected Commodities from GST
CER: Cereals EDU: Education CLO: Clothing
F&LXE: Fuel & Light ex. Electricity ELEC: Electricity MED NI: Medicine
MED I: Health except Medicine TOBA: Tobacco TOI: Toilet articles
OHCs: Other household consumables INTOX: Intoxicants GOLD: Gold
S&S: Salt and sugar PAN: Pan CONV: Conveyance
Source: NSS 68th round data
31 Strictly speaking, the benefit calculation should deduct the extra burden on the target group because the RNR will
go up as a result of the implicit subsidy. The RNR will go up to a greater extent the more the leakage that occurs to
non-target households.
CER
F&LXE
CLO
EDOILMED NI
EDUELEC
TOBAINTOX MED I
PANGOLD0
0.005
0.01
0.015
0.02
0.025
0.6 0.65 0.7 0.75 0.8 0.85 0.9 0.95 1
Ben
efit
: S
ub
sid
y a
s a
shar
e o
f to
tal
ho
seh
old
exp
end
itu
re
Cost: Fraction of total subsidy that "leaks" to non-target groups
Exemptable commodities
Commodities taxable at
low rate
Commodites
taxable at
standard rate

67
The data that underlie this graph are presented in Table 1 for the commodities of policy interest.
In each table, the share of each commodity in total expenditure of the target group (bottom 40
percent, B40) and the non-target group (the top 60 percent, T60) is presented. This is a measure
of equity.
Table 1: Categorizing Commodities according to Equity and Effectiveness Criteria
Commodity
EQUITY: Expenditure on
commodity as share of total
expenditure on all commodities
EFFECTIVENESS: Share of
total expenditure on commodity
accounted for by target group
Bottom 4
deciles
Top 6
deciles
Bottom 4
deciles
Top 6
deciles
Food 38.3% 25.9% 24.7% 75.3%
excluding PDS subsidy 36.5% 25.5% 24.2% 75.8%
Cereals 15.7% 7.0% 33.4% 66.6%
excluding PDS subsidy 14.2% 6.6% 30.1% 62.8%
Fuel & Light ex. Electricity 9.9% 4.4% 33.5% 66.5%
excluding PDS subsidy 9.0% 4.1% 32.5% 67.5%
Clothing 7.1% 5.4% 22.6% 77.4%
Medicines 4.5% 5.0% 16.8% 83.2%
Education 2.2% 6.6% 6.9% 93.1%
Electricity 2.0% 3.0% 13.1% 86.9%
Beverages(non-alcoholic) 1.6% 1.9% 16.3% 83.7%
Tobacco 1.3% 0.9% 25.8% 74.2%
Intoxicants including pan 1.2% 1.0% 21.3% 78.7%
Health (except medicine) 1.0% 2.5% 7.9% 92.1%
Gold 0.2% 1.2% 2.9% 97.1%
Note:
1) The consumption categories are arranged in the decreasing order of benefit-cost ratio.
2) The category "food" includes cereals, cereal substitutes, pulses and products, egg, fish and meat;
vegetables, fruits, processed food, packaged food, salt and sugar
3) The category "Fuel and light excluding PDS subsidy excludes the consumption of Kerosene (PDS)
4) The category Cereals excluding PDS subsidy excludes consumption of Rice-PDS and Wheat/Atta-PDS
Source: NSS
The table 1 also presents the share of the total expenditure on a commodity group that is
accounted for by the target and non-target groups. This provides a measure of effectiveness
because the greater the expenditure accounted for by the non-target group the more the subsidy
will not reach the target group.

68
We can then compare how these commodities should be treated in terms of equity and
effectiveness and how they are in terms of the current effective tax rate on these same
commodities (Figure 2).
When measuring the tax on an exempted good, it is important to remember that the effective tax
need not be zero. If a good is exempted, it will not be able to claim tax credits on the taxes
embedded in it by way of the inputs that have gone into it. If rice flour is exempted, for example,
the tax paid on milling will be reflected in the price paid by the final consumer. This, of course,
would not be the case, if that good were charged a lower tax rate because in this case input tax
credits would be availed of. In other words, the difference between a good being taxed at a lower
rate say, 5 per cent and exempted could be less than 5 per cent (5-0) because of embedded
taxes.32
How do we measure embedded taxes? As part of inputs for this Committee, the World Bank, as
an illustrative exercise, computed the embedded taxes for 11 categories of goods for the bottom 4
and top 6 deciles based on input-output tables and detailed data for five large States: Andhra
Pradesh, Gujarat, Kerala, Karnataka, and Tamil Nadu.33 In Figure 2, the benefit cost ratio of
exempting a good is shown on the Y axis and the effective tax rate on the X axis. In principle,
the higher the benefit cost ratio, the lower should be the tax. The line of best fit is downward
sloping, indicating that tax policy is broadly sensible.
Food, fuel, and clothing
A number of commodities are treated fairly under the current system. Thus, merit goods such as
32 So, for example, if the embedded taxes on a commodity is e (expressed in per cent), and t is the standard rate, then the effective
subsidy rate of exempting a good is (t-e)/E, where E is the total expenditure of the target group. In contrast, if that good is taxed
at the lower rate l, then the subsidy rate is (this ratio should be (t-(l-e))/E instead) because input tax credits will be available on
the embedded taxes. 33 The calculations in Figure 2 are somewhat tentative and subject to a number of caveats. There remains some uncertainty about
the assignment of tax rates to commodities in the data in the National Sample Survey, CPI and the Input-Output table. This
would have to be reviewed and refined in future work. Second, a key benefit of the GST will be the ability for producers to
claim input tax credits regardless of where their inputs are produced. The calculations have not fully reflected the input taxes
(except for petroleum products), and given that not all input taxes can currently be claimed this means that current tax rates are
effectively higher than what is reflected. Third, another factor that would increase the effective tax rates is central sales tax on
the movement of goods between States. In future work, this will need to be captured. Fourth, the calculations use 2011-12
consumption aggregates but 2015 tax rates. Finally, the calculations assume not only perfect compliance, but also ignored
threshold effects. Businesses below the VAT/Excise thresholds are not liable to collect tax, and this leads taxes to be over-
estimated, especially for the B40 who would be more likely to shop in businesses below the threshold.

69
food items, especially cereals, pulses, edible oils, vegetables, and fuel are appropriately taxed at
zero or low rates. Conversely, a number of demerit goods such as alcohol and tobacco are
appropriately taxed at high rates.
Figure 2: Comparing “Desirable” Taxation with Actual Taxation of Selected Commodities
Source: NSS,CBEC, World Bank and Committee’s calculation
In the case of food and fuels, the PDS system helps make the system fair. For example, taking
account of the PDS, the effective tax rate on the bottom 4 deciles is -7.4% for food as a whole, -
32% for cereals, and – 5.7% for fuel and light excluding power. The PDS has therefore served as
reasonably effective social policy.
Clothing is also an anomaly but not as striking as the other commodities mentioned above. It is
taxed currently at about 3-3.5 percent even though it does not constitute as large an expenditure
item for the poor. On balance, it warrants being taxed at the lower rate by both the center and the
States.
Gold, silver and precious metals
Currently, gold, silver and precious metals face no central excise and most States tax these
Food
Food(excluding PDS subsidy)
Cereals(excluding PDS
subsidy)
Fuel and light excluding
electricity Fuel and light (excluding PDS
subsidy)Clothing
Medicine
ElectrcityEducation Beverages Tobacco Intoxicants and paan
Health except medicine
Gold
Cereals
0.0
10.0
20.0
30.0
40.0
50.0
-40.0 -30.0 -20.0 -10.0 0.0 10.0 20.0 30.0 40.0 50.0 60.0
Ben
eifi
t-C
ost
Rta
io
Effective tax rate
T6
B4
Under-Taxed?
Top six deciles
Bottom four deciles

70
commodities at the non-standard rate of 1 per cent. There could be two reasons to under-tax
these metals: for reasons of equity and to promote savings. Consider each in turn.
It turns out that there is very little achieved by way of equity and a high cost is paid for
exempting these commodities from taxation. Figures 3 and Table 2 illustrate these points. Gold
as a consumption good constitutes a small portion of the total expenditure of the poor and a
much higher share of the expenditure of the rich (Figure 3). It has the characteristics of a luxury
good than an essential good. For example, the richest decile spends 3.5 per cent of its
expenditures on gold, silver, and precious metals. In contrast the poorest decile spends about
0.03 per cent.
Table 2 highlights how ineffective or unfair is the implicit gold subsidy. It shows the expenditure
of these commodities of each decile as a share of total gold expenditures. The top decile accounts
for over 63 per cent of total gold expenditure. And this is a serious under-estimate because we
know that NSS is very ineffective at capturing the expenditure of the very rich. Cumulatively,
the top 2-3 deciles account for an overwhelming share of total gold consumption and therefore
appropriate nearly all the subsidy given to gold.
Table-2 Share of Different Deciles in Gold Consumption
Decile % share in gold
consumption
Cumulative
share
Top
Bottom
1 63.4 63.4
2 16.4 79.7
3 6.9 86.6
4 4.5 91.1
5 3.4 94.5
6 2.6 97.1
7 1.3 98.4
8 0.9 99.4
9 0.4 99.8
10 0.2 100.0
Source: NSS, committee’s calculation
A second reason for favouring gold and precious metals could be to promote savings. At a time
when there were few savings instruments, it may have made sense to incentivize the purchase of

71
gold via a lower rate in order to promote savings. But today, this objective has been overtaken by
two developments: on the one hand, the emphasis is on proper financial inclusion via the Jan
Dhan Yojana which would also serve as the more effective means of promoting savings; on the
other hand, gold far from being a desired savings instrument has become a problem, with large
gold purchases and imports becoming a cause of macro-economic instability.
Figure 3- Share of Gold in the Total Consumption Expenditure of Different Deciles
Source: NSS, committee’s calculation
Recognizing this, the government has recently tried to wean consumers away from gold via the
gold monetization and gold bond schemes. It would be perverse and contradictory to use taxes to
incentivize the holding of gold, and undo what the government is trying to do via these gold
schemes. At the very least, tax policy should be neutral on consuming precious metals.
Thus, on grounds of equity and effectiveness of targeting, on grounds of consistency of policy,
gold should be taxed at the standard rate (bullion can be exempted from the GST). Instead, it is
taxed at 1 percent, dramatically highlighting the incongruity of policy.
The final point to make, of course, is that the more rational gold taxation can be, the lower will
be the standard rate which will be critical in creating a buoyant and compliance friendly GST. As
3.49%
1.57%
0.75%
0.54%0.43%
0.35%0.18% 0.13% 0.06% 0.03%
0.0%
0.5%
1.0%
1.5%
2.0%
2.5%
3.0%
3.5%
1 2 3 4 5 6 7 8 9 10
Go
ld c
onsu
mp
tio
n a
s p
er c
ent
of
tota
l
consu
mp
tio
n
Top Bottom

72
shown in Table 8, the standard rate could come down to as much as 16.8 per cent if gold is taxed
at 12 (6+6) per cent.
There might be concerns that increasing taxes on gold will lead to increased smuggling and
evasion. This is a legitimate concern. But there is some evidence on how serious the impact of
increased taxes might be. Import duties have been increased several times in the recent past on
gold. These too are tax increases. In Figure 4 below, we plot the imports of official gold since
2011-12 and highlight the timing of import duty increases. The chart clearly shows that there is
no seriously deleterious impact on gold imports in response to tariff increases. To some extent,
there will be declines in consumption and imports if taxes increase but these are modest and
manageable. The notion that there will be rampant evasion and smuggling if the taxation of gold
is increased is not borne out by the data.
Figure 4: Gold imports in India (in MT)
Source: CBEC
Power, health, and education
400
500
600
700
800
900
1000
1100
1200
Import duty
increased from
2% to 4% w.e.f.
17.03.2012
Import duty
increased from
4% to 6% w.e.f.
21.01.2013
Import duty
increased
from 6% to
8% w.e.f.
05.06.2013
Import duty
increased from
8% to 10% w.e.f.
13.08.2013
Number for 2015-16 is annualized

73
Some key sectors have been excluded or exempt from the scope of GST. These include power,
health and education probably on the grounds that these are public goods, publicly provided, and
of importance to relatively poorer sections of the population. But what evidence do we have on
the underlying assumptions justifying such a policy?
Figure 2 suggests that these sectors are perhaps under-taxed currently (They lie well below and
to the left of the line of the best fit). The design of tax policy, thus, needs to more carefully take
account of evidence. For all three sectors, the benefits of exemptions (even without taking
account of any embedded taxes) for the poorer sections is small because these items constitute a
small share of their total expenditure. For the top 6 deciles, these sectors are three times as
important as they are for the bottom 4 deciles. Moreover, the top 6 deciles also consume such an
overwhelming large share of these services (probably privately provided) that nearly all the
benefits of the implicit subsidy go to the relatively well off. In the case of education, the current
tax structure turns out also to be regressive, with the bottom 4 deciles effectively paying greater
taxes than the top 6 deciles. These commodities deserve to be taxed more like standard goods.
Yet, today, they face low taxes and they are planned to be excluded from the GST.
Thus, tax policy in the name of the poor turns out to be poor or ineffective social policy. And the
cost is a tax base that is narrow, exemptions-ridden, and in the case of power, the cost also
includes breaking up the value added chain because it is an important intermediate input. In the
medium run, of course, direct benefit transfers or better public provision of essential services
would relieve tax policy of the burden of having to meet social objectives. But even in the short
run, greater attention needs to be devoted to finding better instruments of social policy, and
leaving tax policy to meet broad macro-economic objectives.

74
Annex 1: Macro-Approach to Estimating RNR
The contemplated GST is a consumption tax of the VAT type. It would tax value added at each
stage of the production-distribution chains of goods and services, with a credit/refund for taxes
on inputs. The provision of a credit/refund to intermediate and capital inputs is the single most
important design element of the GST; and, given the assumption of revenue neutrality, it is what
mostly distinguishes it from the current system of federal/States sales and excise taxes, and what
makes it a fundamental reform of the indirect tax system in India.
The revenue implication of such reform can be analyzed using a simple macroeconomic
framework, written as t=R/(C+G), where: t is the tax rate to be estimated, R is the revenue target,
and C and G are, respectively, private and government final consumption of goods and services.
In India’s case, given the revenue neutrality assumption, R is equal to revenues (both federal and
state) generated from existing sales and excise taxes, which India wants to replace with the GST.
Assuming that R is known, policy decisions on the GST base become the Centre of policy
discussions and design, and are intimately linked to the estimation of the RNR.
National accounts data on final consumption, or supply and use tables can be used to estimate the
equation above. They should yield similar results, but the latter provides more insight into how
the GST is likely to affect various sectors of the economy, and is particularly relevant, if not
necessary, when exemptions or lower rates are part of the options considered during the design
phase.
The macroeconomic approach to estimating the RNR has a number of advantages relative to a
methodology based on firm-level data, from tax returns or other sources. First, the existing
system of sales and excise taxes, which combines federal and state level taxes, produce
insufficient information for estimating value added at the firm level for the whole economy,
mainly because it is riddled with exemptions and exceptions, and administrative data are of poor
quality. National accounts data provide a more accurate picture of sectoral value-added and final
consumption.
Second, firm-level data do not always separate intermediate and capital inputs, which may
receive different tax treatment under the GST – the methodology by A. Modi, which relies on tax

75
returns of the corporate income tax, is interesting in that it uses depreciation schedules for
income tax purposes as proxies for long-term capital consumption. Third, firm-level data rarely,
if ever, contain a clear separation between supplies to export markets (which would be taxed at
zero per cent under the GST), and supplies to domestic markets, which would be fully or
partially taxed. Again, this is easily addressed with national accounts data.
One of the main disadvantages of the macroeconomic approach is that national accounts data do
not reflect misreporting of the tax base and the tax liability, while tax returns do (implicitly).
Another disadvantage is that sectoral analysis using national accounts data is usually limited,
relative to firm-level data—where, for example, mixed supplies such as taxed/exempt by the
same firm can be analyzed more effectively.
As noted above, estimating the RNR requires clarity on policies regarding the revenues to be
subsumed by the GST and the GST base; but these are still the subject of some debate, and are
likely to remain until late in the policy process. A useful analysis then consists in examining the
potential revenue impact of the GST for India as a whole under various base scenarios, starting
first with a very broad base. The macro approach outlined above was applied using the following
formula:
PB=∑(Y+M-X)-(1-e)∑(N+I)
PB is the potential GST base; Y is domestic output, (M-X) is net imports (imports minus
exports); (N+I) is consumption of intermediate and capital inputs; e is the exempt output ratio
(i.e. the tax base associated with inputs used in the production of exempt final consumption); and
the summation is over 140 goods and services and 66 sectors, based on 2011-12 national
accounts. The following assumptions were made: (1) full compliance; (2) full pass-through of the
GST into prices; (3) no behavioral response; (4) the GST has a single positive rate, and a zero
rate on exports.
Under a standard scenario exempting health, education, financial intermediation and public
administration, the GST potential base is 59 of GDP. Exempting basic food items in addition
(essentially unprocessed foods) reduced the potential base to 55 of GDP. However, exempting
petroleum or electricity increases the potential base to 67 of GDP—given that such items are

76
largely consumed as inputs rather than final consumption, their exemption increases the base due
to cascading. These estimates suggest that the GST RNR rate, assuming maximum revenue to be
replaced of 6 of GDP, ranges between 9 and 11.
Among the assumptions listed above, compliance is perhaps the most important factor to
consider. Although the design of the GST is likely to improve compliance—even assuming no
changes in administration, the federal/state coordination of the GST will improve information for
cross-verification, especially regarding inter-state transactions—experience suggests that some
losses to poor compliance and enforcement should be expected. Losses in the order of 10 to 20 of
potential revenues are common in OECD countries; assuming 20 increases the range of the RNR
from 9-11 to 11-14.
In summary, this analysis suggests that the GST RNR rate ranges between 10 to 15, depending
on key policy choices regarding exemptions, and a compliance rate of about 80 of potential GST
revenues.

77
Annex 2: Indirect Tax Turnover-based approach to estimating RNR
The taxes to subsumed into GST and the corresponding revenues earned are summarised in
Tables 1 and 2 below. The reported revenue for the Centre includes the entire revenue from
Tobacco products. However, since a part of the revenue on tobacco products is to be realized
through non-rebatable excises, for the purposes of the present exercise, it is assumed that one
fourth of the revenue from tobacco products would be realized from GST.
Table 1: Summary of Revenue to be compensated for all States combined
(Rs crore)
Tax Heads Revenue to be Compensated
CST (including ITC adjustment) 38338
VAT & Sales Tax (excluding Non-VAT) 278232
Non VAT (collected on services/works contract) 1047
Entertainment Tax 2138
Lottery, Betting & Gambling 608
Luxury Tax 1946
Entry Tax not in lieu of octroi 15896
Entry Tax in lieu of octroi 20772
Toll tax not in lieu of service charges 552
Cesses & Surcharges 4742
Advertisement Tax 1
Purchase Tax 4559
ITC Reversal 11677
TOTAL 535722
Revenue to be Compensated (4 per cent) 407167
Revenue to be Compensated (2 per cent) 368829
To derive the tax base for GST, we have broken down the exercise into two parts – one, to derive
the base corresponding to goods, we have used the revenue collections from individual States,
the tax rates applicable in these States and some assumptions based on discussions with States
regarding the composition of turnover taxable by the 1 per cent rate, the lower rate and the
standard rate. The assumptions adopted are 2 per cent of total base taxable at 1 per cent, 56.15
per cent taxable at the lower rate and the rest taxable at the standard rate. For each state, taxes
have been classified into two groups – taxes, the base of which can be added to the taxable base
in GST and taxes, whose base might not add to the taxable base under GST. The first category
we have VAT, entry tax not in lieu of octroi, entertainment tax. Rest of the levies are classified
in the second category. This is because, taxes such as entry tax in lieu of octroi would be levied

78
over and above VAT or GST and hence would not provide additional base to the tax. Similar
would be the case of purchase tax for instance. VAT revenue is further bifurcated into revenue
from commodities which will be brought into tax under GST and those that would remain
outside the base, i.e, liquor, diesel, petrol and ATF. We have used weighted average tax rates for
the estimation of taxable turnover from the data on tax collected under entry tax not in lieu of
octroi and VAT excluding those which would not form part of the GST, viz., liquor, diesel,
petrol and ATF. Further, since state VAT is applied on a base inclusive of excise duty, the base
is deflated by 1.1236 to derive the base net of taxes.34 To this is added an estimate of the likely
base from entertainment tax assuming the tax rate is 30 per cent. This gives us the base
corresponding to the taxation of goods under GST. Adding across all States, we get a base for the
goods part of GST.
Table 2: Revenues of the Central Government: 2013-14 (Rs crore)
S.
No.
Type of duty Shared with
States
Not shared with States Total
Tobacco
Correction
Basic NCCD Education
cess*
Others
1 CE duty
a) Non Pol
(excluding
Tobacco products)
53672 1913 2441 2675 60701
b) Tobacco products 14855 1319 528 1153 17855 44637.5
Total CE duty
{Non Pol} [a)+b)] 68527 3232 2969 3828 78556
2 CVD (Non-Pol) 77965 479 3663 883 82990
3 SAD (Non-Pol) 24837 0 0 0 24837
4 Service Tax 150417 0 4319 0 154736
5 TOTAL 321746 3711 10951 4711 341119
6 Total revenue to
be compensated 327728
6i
Non Tobacco
revenues to be
compensated 323264
6ii
Tobacco
products revenue
at 10 per cent 4463.75 Note: * includes secondary and higher education cess.
Source: Provided by CBEC.
34 The headline rate of tax for central excise was 12.36 per cent in 13-14.
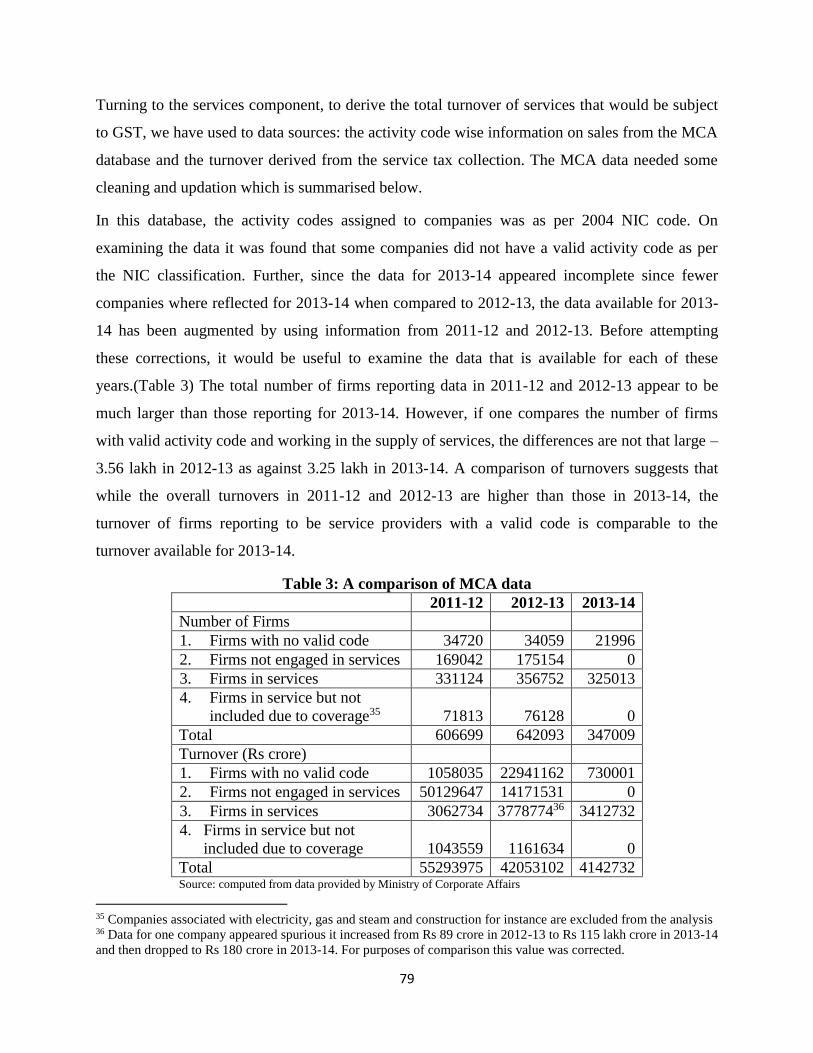
79
Turning to the services component, to derive the total turnover of services that would be subject
to GST, we have used to data sources: the activity code wise information on sales from the MCA
database and the turnover derived from the service tax collection. The MCA data needed some
cleaning and updation which is summarised below.
In this database, the activity codes assigned to companies was as per 2004 NIC code. On
examining the data it was found that some companies did not have a valid activity code as per
the NIC classification. Further, since the data for 2013-14 appeared incomplete since fewer
companies where reflected for 2013-14 when compared to 2012-13, the data available for 2013-
14 has been augmented by using information from 2011-12 and 2012-13. Before attempting
these corrections, it would be useful to examine the data that is available for each of these
years.(Table 3) The total number of firms reporting data in 2011-12 and 2012-13 appear to be
much larger than those reporting for 2013-14. However, if one compares the number of firms
with valid activity code and working in the supply of services, the differences are not that large –
3.56 lakh in 2012-13 as against 3.25 lakh in 2013-14. A comparison of turnovers suggests that
while the overall turnovers in 2011-12 and 2012-13 are higher than those in 2013-14, the
turnover of firms reporting to be service providers with a valid code is comparable to the
turnover available for 2013-14.
Table 3: A comparison of MCA data
2011-12 2012-13 2013-14
Number of Firms
1. Firms with no valid code 34720 34059 21996
2. Firms not engaged in services 169042 175154 0
3. Firms in services 331124 356752 325013
4. Firms in service but not
included due to coverage35 71813 76128 0
Total 606699 642093 347009
Turnover (Rs crore)
1. Firms with no valid code 1058035 22941162 730001
2. Firms not engaged in services 50129647 14171531 0
3. Firms in services 3062734 377877436 3412732
4. Firms in service but not
included due to coverage 1043559 1161634 0
Total 55293975 42053102 4142732 Source: computed from data provided by Ministry of Corporate Affairs
35 Companies associated with electricity, gas and steam and construction for instance are excluded from the analysis 36 Data for one company appeared spurious it increased from Rs 89 crore in 2012-13 to Rs 115 lakh crore in 2013-14
and then dropped to Rs 180 crore in 2013-14. For purposes of comparison this value was corrected.

80
Using the concordance tables, companies first are classified as per the NIC code for 2008.
Further, since it was noted that a number of companies which filed returns in 2012-13 did not file
returns in 2013-14, an attempt is made to undertake some corrections to get a more
comprehensive base for 2013-14. These are discussed below.
Step 1: For all companies reporting information in 2012-13 but not for 2013-14 and had a valid
activity code, the data from 2012-13 has been extrapolated using the average growth rate for
2013-14 when compared to 2012-13.
Step 2: For all companies for which there was no description and/or no valid activity code, all
companies with turnover above Rs 100 crore have been individually explored and classified into
an appropriate activity code. These companies account for 89.88 per cent of the total turnover of
uncoded companies.
Table 4 below summarises the numbers after each of these steps and Table 7 provides estimates
of the size of the additional base subsequent to all corrections using MCA database.
Table 4: Computing Total Turnover for the year 2013-14 (Rupees in crore)
Steps Turnover
1.Data provided for 2013-14 3412732
2.Including companies for which data from 2012-13 was
extrapolated for companies with valid activity code 3974753
3.Turnover without activity code in 2012-13 1511747
4.Turnover classified through assigning activity codes in 2012-13 1358755
5.Taxable turnover from step 4 (in 12-13 prices) 377204
6.Taxable turnover in 13-14 prices 405707
7.Total turnover from MCA after all corrections (2013-14) 4083607
This information relates to companies alone. Since the tax would be payable by non-corporate
service providers as well, we have used information from service tax collection to correct any
shortfall from the MCA related estimates. Further, for all the services, two kinds of adjustments
have been made, viz., deduction for taxable inputs used for service provision and deduction of
services provided when used as inputs into taxable activities. For these corrections, the input-
output table for 2006-07 has been used to derive service specific input-output ratios (see table 5).

81
In addition to the above, there are three sector specific corrections made in the data
1. For computer related services, it has been argued that a sizeable part of the turnover
is associated with exports- this component will not add to the taxable base for GST.
Based on an IBEF study, the domestic supply of computer services is 30 per cent of
total sales value of computer related activities and hence this 30 per cent is included
in this study for arriving at the net additional base available for taxation.
2. From decisions taken so far, it appears that taxation in the real estate sector would
be limited to the extent to which it is taxed today through taxation of works
contracts and pre-completion sales of properties. To incorporate this view, the
turnover from service tax collections is given primacy.
3. For financial services, there are two difficulties. First, the coverage of financial
services tends to be incomplete being largely limited to fee based services. The
present regime of taxation of financial services within Service Tax too is of this
form. There is no clear indication to suggest that a radically new approach would be
adopted in the proposed GST regime. Therefore, the base corresponding to the
present service tax regime is considered a more appropriate base to incorporate into
GST RNR estimation in both cases- PROWESS and MCA based estimates. Second,
as per the input output table, more than 80 per cent of total financial services are
used as inputs. But since a significant part of financial services are in the form of
embedded services, the possibility of taking input tax credit can be limited. So
using the ratio of FISIM to total financial services, the extent of financial services
used as inputs is reduced from 80 per cent to 50 per cent.
In addition to the above, since services provided by railways are not captured within either of
these methods, the base is augmented to the extent of passenger services and transport of exempt
services.37
37 Transport of taxable services is not included since this would be a wash transaction – while railways would collect
revenue, the taxpayer who pays this tax would claim credit against subsequent transactions.

82
Table 5: Input Coefficients and the Adjusted Base: MCA Database
NIC 2008 Range
Taxable
i-o ratio
Share of
sales
used as
inputs
Net
additional
base
available
for taxation
19 Bottling of LPG/CNG 1 0
35 Power transmission line infrastructure 1 0
46 Trade 1 0
47
Commission agent services & Retail
outlets 1 0
491 Rail Transport 0.1582 0.8175 1553
492 Road Transport 0.1130 0.5328 24979
493 Transport via Pipeline 0.1130 0.5328 16376
50 Water Transport 0.1803 0.4931 5778
51 Air Transport 0.2265 0.4523 24462
521 Storage and Warehousing 0.0739 0.9894 1397
522 Other transport service activities 0.0624 0.6605 4910
55 Hotel and Restaurant 0.1833 0.1887 36394
61 Post & Telecommunication 0.1020 0.7716 49069
62 & 63 Computer related activities 0.0425 0.1256 116242
64, 65 & 66 Banking and other financial services 0.0361 0.6151 110927
42, 68, 77 Real Estate 0.5523 0.4202 126995
72 & 85 Research & Development and Education 0.0075 0.0112 50295
70, 73, 74,
78, 79, 80 &
82 Business services 0.0788 0.9947 7550
84 Public administration 0.0000 0.0000 3781
86 Health 0.2256 0.0231 2177
93, 94 O.com, social & personal services 0.1123 0.4170 43668
Others / Undifferentiated services 0.0765 0.3567 118838
Total 745390
Total after all corrections38 853235
The total base for GST from the above methods therefore can be summarised as;
The RNR corresponding to the proposed design, with CST compensated at 2 per cent is
summarised in the table below. The results presented contain four scenarios. The GST bill
proposes that in the short term, the States would be enabled to levy a 1 per cent tax on inter-state
38 Two corrections are incorporated here – correction for revenue from railways and for base corresponding to
restaurants which is already included in the base for goods computed from the state side.

83
sale of goods. Scenario 1 presents a case where there is no such levy while scenario 2 presents
the case where such a levy does exist. Further, in each of these cases, the results report an RNR
for whether there is a single rate GST or a two rate GST. In single rate case, the entire base is
taxed at the same rate. In the two rate case, the base currently taxed at the lower rate and 1 per
cent in the States is retained in the same categories and the rest of the base is taxable at the
standard rate. The lower rate is assumed to be 6 per cent for Centre and 6 per cent for the States.
Table 6: Additional base for GST: Alternative estimates
Value (Rs crore) As of relevant GVA
Incremental Services Base (MCA) 853235 15.87
Services GVA (2011-12 series) 5376045
Total GST Base (MCA) 3936610 37.57
GVA Total 10477140
Table 7: Revenue Neutral Rates: Alternative Scenarios
2 per cent
Single rate Standard rate
Scenario 1
Centre 8.33 10.42
State (Average) 9.37 12.34
Total 17.69 22.76
Scenario 2
Centre 8.33 10.42
State (Average) 8.88 11.44
Total 17.21 21.86
To consider an alternative case within scenario 1, if one proposes a 30 per cent tax on all
transport vehicles (15 per cent for the Centre and 15 per cent for the States), and retain only the 1
per cent tax on gold and bullion, what will the RNR look like. From the National Accounts
Statistics, output of manufacturing in organised sector in transport equipment is Rs 652251 crore.
Assuming that value added subsequent to manufacturing, including trader margins and transport
costs is 10 per cent of this value, the value of sales of transport vehicles is Rs 717476 crore.39
Assuming that this part of the base is taxed at 15 per cent each by both Centre and States, the
39 The figures for exports and imports for transport vehicles suggest that there is a net export in this segment. If this
be the case then the downward correction in the RNR would be smaller.

84
RNR got the rest of the base would be 6.81 per cent for the Centre, 8.09 per cent for the States
adding up to 14.91 per cent overall as compared to 17.69 per cent reported above.
To understand what these numbers indicate, it would be useful to look at the composition of the
revenues from the States. The composition indicates that 19 per cent of the revenue to be
compensated is not adding to the taxable base for the States. Now if the RNR exercise were to be
undertaken only with the first set of taxes, then the RNR for the States would turn out to be
considerably lower than if we sought to find the resources to compensate for all the other taxes in
category II as well. (Table 9)
Table 8: Decomposition of state revenues
I. Revenue adding to base, of which 297312
a. VAT 279278
b. Entry tax not in lieu of octroi 15896
c. Entertainment tax 2138
II. Revenue not adding to the base, of which 71517
a. CST 38338
b. Lottery, betting and gambling 608
c. Luxury tax 1946
d. Entry tax in lieu of octroi 20772
e. toll taxes 552
f. cesses and surcharges 4742
g. Advertisement tax 1
h. purchase tax 4559
Considering the single rate case in scenario 1 above, the RNR excluding revenues from II above
would be 7.55 per cent with the overall RNR being 15.88 per cent. Assuming that the rate
structure for taxation in the state is 1 per cent, 5 per cent and 12.5 per cent, on bullion, lower rate
and standard rate, the corresponding average statutory tax rate would be 9.05 per cent
incorporating the fact that VAT is levied on a base inclusive of excise. In other words, the RNR
gets placed below the average tax rate. On the other hand, if one sought to find resources for all
the taxes incorporated in category II, then the RNR increases to 9.37 for the States and 17.69
overall.
Table 9: Impact on RNR of design of GST
State rate Overall rate
RNR excluding II 7.55 15.88
Effective tax rate for States 9.05
RNR for finding revenue for II as well 9.37 17.69

85
Annex 3: Direct Tax Turnover Approach to Estimating RNR
At the producer level, the GST base is equivalent to the value added which is the value that a
producer adds to his raw materials or purchases before selling the new or improved product or
service. That is, the inputs (the raw materials, transport, rent, advertising, and so on) are bought,
people are paid wages to work on these inputs and, when the final good or service is sold, some
profit is left. So value added can be looked at from the additive side (wages plus profits) or from
the subtractive side (output minus inputs).
2. Value added = wages + profits = output – input. If the tax rate on this value added is‘t’,
there are four basic forms that can produce an identical result:
1) t (wages + profits) : the additive – direct (accounts) method;
2) t (wages) + t (profits): the additive – indirect method40,
3) t (output – input) : the subtractive – direct (accounts) method; and
4) t (output) – t (input) : the subtractive – indirect (the invoice or credit) method.
3. While there are four possible ways of levying a VAT, in practice, the method used
(number 4) never actually calculates the value added; instead, the tax rate is applied to a
component of value added (output and inputs) and the resultant tax liabilities are subtracted to
get the final net tax payable. This is sometimes called the “indirect” way to assess the tax on
value added. Since in actual practice, input tax credit will be allowed only on the basis of
invoice, we use the subtractive – indirect method for calculating the GST base and the
consequential, revenue neutral rate (RNR). The present exercise is an attempt to calculate the
single RNR using this method. Mathematically,-
Total Revenues (R) = t* (output) – t*(inputs)
= t* (output – inputs)
= t* (Base)
or, Single RNR, ‘t’ = R / Base
40
This method is so called because value added itself is not calculated but only the tax liability on the components of
value added is calculated.

86
4. For the purpose of estimating the RNR, we use the extensive producer level data in the
form of profit and loss accounts available with the Income Tax Department. These accounts
relate to 94, 31, 508 business entities for the financial year ending on 31st March, 2013
(financial year 2013-14)41. These entities comprise of all companies, partnership firms and
proprietorships but do not include charitable organizations. The activities of these entities are
classified into 10 sectors and further sub classified into 75 sub-sectors. We assume that these 94,
31, 508 entities constitute the universe of the GST taxpayers. This sample does not include
taxpayers who have filed their tax returns in paper form42 or engaged in charitable activities or
wholly engaged in agriculture. The summary of the data is presented in Table 1.
5. The computation of the GST base under the SI method involves the following steps:
a. The receipt items on the credit side of the Profit and Loss Account, which would be
liable to output tax, are identified and appropriately adjusted for indirect taxes to arrive
at the ‘value of supply of domestically produced goods and services (net of indirect
taxes)’ (hereinafter referred to as ‘net value of supply of domestically produced
goods and services’);
b. Since imports are liable to GST at the point of importation, the ‘value of imports’ is
aggregated with the ‘net value of supply of domestically produced goods and
services’ to arrive at the ‘net value of domestically available goods and services’.
c. Since exports are zero rated in a GST regime, the value of exports is reduced from the
‘net value of domestically available goods and services’ to arrive at the ‘net value of
goods and services available for domestic consumption’ or the ‘aggregate output
tax base’.
d. Similarly, the expense items on the debit side of the Profit and Loss Account, in respect
of which input tax credit would be potentially available, are identified and appropriately
adjusted for indirect taxes to arrive at the ‘value of purchase of intermediate goods
and services’.
e. Under the GST Model, full and immediate input credit is proposed to be allowed for
GST paid on purchase of capital goods in the year of purchase. Therefore, the ‘value of
41 These accounts have been electronically filed with the Income Tax Department along with their return of income
for assessment year 2014-15. They relate to returns filed up to 30th June , 2015. 42 This does not affect the estimation results since these are very small taxpayers with low turnover; therefore, they
are likely to be below the threshold limit of Rs 40 lakh envisaged under the GST.

87
purchase of capital goods’ is aggregated with the ‘value of purchase of intermediate
goods and services’ to arrive at ‘gross value of purchase of intermediate goods and
services’.
f. Since no input tax credit would be available in respect of purchases made from
unregistered dealers, the ‘value of purchases from the unregistered dealers’ is
reduced from the ‘gross value of purchase of intermediate goods and services’ to
arrive at the ‘aggregate input tax base’.
g. Under the proposed GST Model, several sectors will be exempt from the scope of GST;
these are petroleum, land component of real estate, the interest component in the
financial sector, electricity, gem and jewellery, education and health services, and
agricultural produce. Reflecting this, appropriate downward adjustments have been
made to both the output and input tax base.
h. The threshold limit is proposed to be increased to Rs 40 lakh for both goods and
services. Therefore, appropriate downward adjustment to the GST base is made to also
reflect this.
i. The ‘aggregate output tax base’ is reduced by the ‘aggregate input tax base’ to arrive
at the ‘GST Base’.

88
A Sample Size in nos 9431508 9087529
B Net value of supply of domestically produced goods and services
1 Sale of Goods Rs. In crs 18055276 15180098
2 Sale of Services Rs. In crs 2818183 2764294
3 Other operating revenues Rs. In crs 896139 889567
4 Financial services (in case of finance company) excluding interest Rs. In crs 49998 49991
5 Commission Rs. In crs 63526 63480
6
Other income
(excluding rent, interest, dividend, profit on sale of fixed assets, profit on
sale of securities liable to STT, profit on sale of other investments,
agricultural income and profit on account of currency fluctuation) Rs. In crs
336661 332841
7 Total Rs. In crs 22219783 19280272
C Purchases from Primary and Secondary Sector
1 Purchases (net of refunds and duty or tax, if any) including primary goods Rs. In crs 14879025 12969557
D Specified services
1 Freight Rs. In crs 300557 282113
2 Consumption of stores and spare parts Rs. In crs 241393 214741
3 Repairs to building Rs. In crs 23320 21642
4 Repairs to machinery Rs. In crs 99921 81977
5 Insurance Rs. In crs 31067 28232
6 Workmen and staff welfare expenses Rs. In crs 46761 43121
7 Entertainment Rs. In crs 1469 1401
8 Hospitality Rs. In crs 1385 1336
9 Conference Rs. In crs 2421 2306
10 Sales promotion including publicity (other than advertisement) Rs. In crs 55018 53507
11 Advertisement Rs. In crs 67801 66471
12 Commission Rs. In crs 65424 63818
13 Royalty Rs. In crs 36562 34021
14 Professional / Consultancy fees / Fee for technical services Rs. In crs 102244 93883
15 Hotel , boarding and Lodging Rs. In crs 12055 11943
16 Traveling expenses other than on foreign traveling Rs. In crs 69477 66842
17 Foreign traveling expenses Rs. In crs 12656 12387
18 Conveyance expenses Rs. In crs 24968 23963
19 Telephone expenses Rs. In crs 27831 27003
20 Guest House expenses Rs. In crs 499 449
21 Club expenses Rs. In crs 137 128
22 Festival celebration expenses Rs. In crs 1200 1166
23 Gift Rs. In crs 414 374
24 Audit fee Rs. In crs 7290 7042
25 Total (D1 to D24) Rs. In crs 1231869 1139866
E Miscellaneous Services
1 Other expenses Rs. In crs 2211903 1723601
F Rs. In crs 18322797 15833024
Table 1: Summary of Data
Total value of inputs on which input tax credit could be available
All SectorsTaxable
SectorsUnitDescriptionSl. No.

89
6. The “net value of supply of domestically produced goods and services” is the
aggregate of the value of (i) sale of goods; (ii) sale of services; (iii) other operating expenses; (iv)
financial services (excluding interest) provided by financial companies; (v) Commission; and
(vi) other income. The item ‘other income’ as reported in the accounts excludes rent, interest,
dividend, profit on sale of fixed assets, profit on sale of securities liable to STT, profit on sale of
other investments, agricultural income and profit on account of currency fluctuation. In practice,
a large number of professional entities report their gross receipts under this item since they do
not view themselves as carrying on business or engaged in sales. Since all goods and services
(except a small negative list) are proposed to be included in the GST base, the value of supply of
goods and services must therefore, include the item ‘other income’. However, receipts by way of
rent, dividend, interest, profit on sale of fixed assets, profit on sale of investment liable to STT,
profit on other investment, profit on currency fluctuation and agricultural income have been
excluded from the value of the supply of goods and services because either they represent
accretion to savings or have been effectively netted out in the calculation of the input base
eligible for input tax credit.
7. The “net value of supply of domestically produced goods and services” by all sectors
is estimated to be Rs. 222,19,873 crore in the financial year 2013-14. However, diamond
cutting, petroleum, rice and flour mill and power and energy sectors (hereafter collectively
referred to as “exempt sectors”) are proposed to be exempt from GST. After adjusting for the
“exempt sectors”, the “net value of supply of domestically produced goods and services” for
the taxable sectors is estimated to be Rs 192, 80,272 crore.
8. Input tax base comprises of all goods and services used as intermediate inputs in the
production of goods and services and on which output tax has been paid. The ‘value of
purchases of intermediate goods and services’ by all sectors is the aggregate of the
expenditure on items listed in Table-1. These purchases can be classified as purchases from the
primary sector, secondary sector and tertiary sector. The aggregate of purchases by all entities
from these three sectors is estimated to be Rs 183, 22,797 crore during the financial year 2013-
14. After adjusting for the exempt sectors, the aggregate of purchases by taxable sectors is
estimated to be Rs 158, 33,024 crore.

90
9. In the case of purchases from the primary sector (i.e. primary goods) like cereals and
plantation crops, no input tax credit would be allowed since these goods would be exempt from
GST. If for some reason, the agriculturist falls within the scope of the GST, he would be liable to
collect GST for which the purchaser in our sample would be eligible to claim input credit.
However, agriculturists do not ordinarily file an income tax return, and therefore, their sales do
not form part of the output base estimated above. In either case, purchases of primary goods in
this exercise would not be entitled to any input tax credit. The value of such purchases by the
taxable sectors is estimated to be Rs.11, 04,545 crore during the financial year 2013-14.
10. As regards purchases from secondary sector is concerned, they are generally made
from both registered and unregistered dealers. To the extent these are acquired from registered
dealers, full input tax credit would be available. However, where purchases of trading goods and
raw materials are made from unregistered dealers, no input tax credit would be available since no
output tax would have been paid by the registered dealer purchaser. Since there is no bifurcation
of purchases from registered and unregistered dealers in the Profit and Loss Accounts, the
amount of purchases from unregistered dealer needs to be estimated. Based on anecdotal
information, it is estimated that 10 per cent of the purchases of trading goods and raw materials
from the secondary sector is acquired from unregistered dealers on which no input credit would
be available. The value of such purchases from unregistered dealers, by taxable sectors, is
estimated to be Rs 11, 86,501 cores during the financial year 2013-14.
11. Similarly, value of specific services and miscellaneous services purchased by taxable
sectors, from unregistered dealers, are estimated to be 25 per cent and 40 per cent, respectively.
This translates to Rs 4, 36,619 crore and Rs 6, 89,440 crore, for specific services and
miscellaneous services, respectively. The aggregate purchase of services from unregistered
dealers is determined at Rs 11, 26,059 crore.
12. Accordingly, the ‘value of purchases from unregistered dealers’ in 2013-14 for
taxable sectors is determined at Rs.23, 12,560 crore. Since no input tax credit would be allowed

91
on these purchases, the same is deducted from the value of purchases of intermediate goods and
services for determining the GST base.
13 In the design of the GST, several exemptions are envisaged. In particular, these relate to
primary goods including unprocessed food, health, education, petroleum, land component of real
estate, alcohol and power and energy. The impact of these exemptions has been factored in the
calculation of GST. In the case of some of these exemptions, the producers are not required to
file their income tax returns and, therefore, do not form part of the sample. Accordingly, while
no adjustment is required to be made to the output tax base, a downward adjustment has been
made to the input tax base. In all other cases, downward adjustment has been made to both the
output tax and input tax base.
14. In terms of the proposed GST Model, the tax base will include real estate to the extent
that the present scheme of taxation will continue. In the light of this, the value of rental services
has been excluded from both the output tax and the input tax base. However, in the case of land,
no information is separately available for the amount embedded in real estate services. Since the
value of land is included in both the output tax and input tax base, this amounts to a wash
transaction having no impact on the GST base.
15. Under the GST, a threshold exemption is proposed to be provided for registration of
dealers. Since no decision has yet been taken on the level of the threshold exemption, we assume
that the same will be fixed at Rs 40 lakh. Table -2 shows the distribution of taxpayers across
turnover. As would be noted, there are 7442736 dealers with turnover below Rs 40 lakh
accounting for a total turnover of Rs 3,00,377 crore only. Effectively, 79 per cent of the total
dealers accounting for approximately 1.35 per cent of the total turnover base will remain outside
the GST net. Calculated on a pro-rata basis, the value addition by these dealers is estimated at Rs
63,109 crore and the GST base is reduced accordingly.

92
16. The comprehensive GST is intended to bring within its fold rail transport services also.
The rail transportation sector is entirely under the Ministry of Railways which is not required to
file a tax return. Therefore, the sample does not include rail services. Accordingly, based on the
information contained in the National Accounts (2014), the GST Base in respect of rail services
is estimated at Rs 79,759 crore.
17. In the light of the aforesaid discussions, the step-wise calculation of the GST Base for
base year 2013-14 is presented in Table -3. As would be noted, the GST base is determined at
Rs 58, 15,262 crore. The implicit value addition is estimated to be 31 per cent of the total output
tax base. Consequently, the RNR for the Centre and the State is estimated to be 5.64 per
cent and 6.34 per cent, respectively. The combined RNR is determined at 11.98 per cent.
Number
of cases
Total
Turnover
(in Rs. crs)
Number
of cases
Total
Turnover
(in Rs. crs)
Number
of cases
Total
Turnover
(in Rs. crs)
Less than 0 0 0 0 0 0 0
Between 0 and Rs 10 lakh 356036 3186 6077867 81777 6433903 84964
Between Rs 10 lakh and Rs 25 lakh 35152 5898 647707 105854 682859 111751
Between Rs 25 lakh and Rs 40 lakh 21875 7010 304099 96652 325974 103662
Between Rs 40 lakh and Rs 1 crore 51385 34476 616905 412195 668290 446671
Between Rs 1 crore and Rs 2 crore 41455 59682 461638 653155 503093 712837
Between Rs 2 crore and Rs 5 crore 48910 158340 378129 1182874 427039 1341213
Between Rs 5 crore and Rs 10 crore 31696 226691 155235 1081062 186931 1307752
Between Rs 10 crore and Rs 100 crore 60571 1891079 124932 2800947 185503 4692026
Above Rs 100 crore 14130 12579433 4186 1146675 18316 13726108
Total 661210 14965794 8770698 7561190 9431908 22526984
Turnover
TotalNon-CorporateCorporate
Table 2: Distribution across Turnover

93
Unit Amount
A Sample Size Nos 9431508
B Output Tax Base
1 Net value of supply of domestically produced goods and services Rs. In crs 22219783
2 Value of imports Rs. In crs 1744465
3 Total value of goods and services (1+2) Rs. In crs 23964248
4 Value of supply by exempt sectors Rs. In crs 2939511
5 Value of exports Rs. In crs 2177633
6 Aggregate Output Tax Base (3-4-5) Rs. In crs 18847105
C Input Tax Base
1 Value of purchase of Capital goods Rs. In crs 606609
2 Value of purchase of intermediate goods and services Rs. In crs 18322797
3 Gross value of intermediate goods and services (1+2) Rs. In crs 18929406
4 Value of purchases by exempt sectors Rs. In crs 2489773
5 Value of purchases of primary goods Rs. In crs 1104545
6 Value of purchases from unregistered dealers Rs. In crs 2312560
7 Aggregate Input Tax Base (3-4-5-6) Rs. In crs 13022528
D Estimated value addition by dealers below threshold exemption of Rs 40 lakhs Rs. In crs 63109
E Estimated value addition attributable to alcohol sector Rs in crs 25965
F Estimated value addition by Rail Sector 79759
G GST Base (B6-C7-D-E+F) Rs. In crs 5815262
H Revenues to be compensated
1 Centre Rs. In crs 327728
2 States Rs. In crs 368829
3 Combined (1+2) Rs. In crs 696557
I Revenue Neutral Rate (RNR)
1 Centre in percent 5.64
2 State in percent 6.34
3 Combined in percent 11.98
J GST Productivity Ratio 11345056 0.51
K GST C-Efficiency Ratio 9698671 0.60
Table 3: Estimate of RNR for GST: SI Method

94
Annex 4: The Possible Impact of the GST on Small Scale Industries (SSIs)
Sl. No. Description Existing
Position
Under
GST
Remarks
1 Central tax rate
a. Output 12 8 We assume that the GST rate would be 8
percent each for Centre and States
b. Input 12 8
2 State tax rate
a. Output 13.5 8
b. Input 5 8
3 Base value of Inputs 60 60
4 UED on Inputs 7.2 4.8
5 Value of inputs for State VAT
purposes
(Row 3 +Row 4)
67.2 60
6 Input VAT 3.36 4.8
7 Value Addition 32.8 32.8 We assume that the value addition is 32.8
8 Base value of Output (Row 3 +
Row 7 )
100 92.8 In the existing regime, the output is exempt
and no input credit is allowed. UED on
inputs become a cost for the taxpayer and
therefore included as part of value addition. 9 UED on Output 0 7.42 The output is exempt and therefore there is
no UED on output
10 Output VAT (Row 8 * Row 2a) 13.5 7.42
11 Aggregate Value addition
(excluding embedded taxes, if any)
(Row 3 + Row 7)
92.8 92.8
12 Price to the consumer
(Row 8 + Row 9 + Row 10)
113.5 107.65
13 Combined Tax Incidence
(Row 9 + Row 10 plus Row 4 if
Row 9 is zero)
20.7 14.85
14 Rate of tax incidence
(Row 13 divided by Row 11) 22.31% 16.00%
Note: Under GST, the tax incidence on small-scale industries would be lower in spite of withdrawal of exemption. Similarly the price of the
products manufactured by SSIs would be lower under the GST regime if the SSIs pass on the benefit of lower tax incidence to consumers.
Alternatively, their profitability would increase. Therefore, the new GST regime without SSI exemption will be more beneficial to SSIs.

95
Annex 5: Effective tax rates by commodities under 3 GST scenarios
Figure 1 (Scenario 1: a single rate GST of 14%)
Figure 2 (Scenario 2: a dual-rate GST, with a low rate of 12%, a standard rate of 18%, and a high
rate of 35%)
Figure 3 (Scenario 3: Scenario 2 with just the standard rate changed to 22%).
Figure 1: Effective tax rates in Scenario 1 Figure 2: Effective tax rates in Scenario 2
Source: CBEC, State Governments, Estimates Source: CBEC, State Governments, Estimates
Figure 3: Effective tax rates in Scenario 3
Source: CBEC, State Governments, Estimates
5.0%
14.4%
8.6%
13.1%
2.9%
1.2%2.5%
14.0%14.0%
9.1%
14.0%
3.3%
0%
4%
8%
12%
16%
20%
Cer
eals
an
d p
rod
uct
s
Fu
el &
lig
ht
Ele
ctri
city
Clo
thin
g &
fo
otw
ear
Mil
k a
nd
pro
du
cts
Veg
etab
les
Fru
its
Oil
s an
d f
ats
Pu
lses
an
d p
rod
uct
s
Hea
lth
Med
icin
e
Eg
g, fi
sh a
nd
mea
t
RNR 14%
4.5%
14.3%
9.2%
13.1%
1.8% 1.3% 1.5%
4.7%
2.4%
11.3%12.0%
2.5%
0%
4%
8%
12%
16%
20%
Cer
eals
an
d p
rod
uct
s
Fu
el &
lig
ht
Ele
ctri
city
Clo
thin
g &
fo
otw
ear
Mil
k a
nd
pro
du
cts
Veg
etab
les
Fru
its
Oil
s an
d f
ats
Pu
lses
an
d p
rod
uct
s
Hea
lth
Med
icin
e
Eg
g, fi
sh a
nd
mea
t
Dual Rate with Normal Rate 18%
5.0%
14.6%
9.9%
13.8%
2.1%1.5% 1.7%
5.5%
2.8%
13.6%
12.0%
3.0%
0%
4%
8%
12%
16%
20%
Cer
eals
an
d p
roduct
s
Fu
el &
lig
ht
Ele
ctri
city
Clo
thin
g &
foo
twea
r
Mil
k a
nd p
roduct
s
Veg
etab
les
Fru
its
Oil
s an
d f
ats
Pu
lses
and p
rodu
cts
Hea
lth
Med
icin
e
Egg, fi
sh a
nd m
eat
Dual Rate with Normal Rate 22%

96
References
1. National Council for Applied Economic Research, “Moving to Goods and Services Tax in
India: Impact on India’s Growth and International Trade,” 2009.
2. Keen, Michael, “Targeting and Indirect Tax Design,” Inequality and Fiscal Policy,
International Monetary Fund, 2015.
3. Keen, Michael, “Targeting, Cascading, and Indirect Tax Design,” International Monetary
Fund, WP/13/57, 2013.
4. Keen, Michael, “The Anatomy of the VAT,” International Monetary Fund, WP/13/111,
2013.
5. World Bank, “Fiscal Policy for Equitable Growth,” India Development Report, 2015.
6. Pomeranz, Dina, “No Taxation without Information: Deterrence and Self-Enforcement in the
Value Added Tax,” Harvard University and NBER, 2013.
7. GTCDR South Asia, “Republic of India Manufacturing Plan Implementation Supply Chain
Delays and Uncertainty in India: The hidden constraint on manufacturing growth”, 2014.
8. Rao, Kavita, “Revenue Implications of GST and Estimation of Revenue Neutral Rate:
Estimates for 2011-12”, National Institute of Public Finance and Policy, New Delhi, 2014.