report on the slovenian real property market … · surveying and mapping authority of the republic...
TRANSCRIPT
Surveying and Mapping Authority of the Republic of Slovenia May 2017
REPORT ON THE SLOVENIAN REAL PROPERTY MARKET for the year 2016
2016
TABLE OF CONTENTS
SLOVENIAN REAL PROPERTY MARKET 4 Supply and demand 4 Real property Sales Volume 5THE REGIONAL REAL PROPERTY MARKETS 7 Central Slovenia 8 The Gorenjska region 14 The Gorica region 16 The Coastal region 18 The Karst region 21 The Notranjska region 22 The Dolenjska region 23 The Posavje region 24 The Savinja region 25 The Koroška region 26 The Štajerska region 27 The Pomurje region 30MARKET OVERVIEW ACCORDING TO TYPES OF REAL PROPERTY 32 RESIDENTIAL REAL PROPERTY 32 Flats 32 Houses 38 COMMERCIAL REAL PROPERTY 41 Officespace 43 Bar and retail premises 44 GARAGES AND PARKING SPACES 45 BUILDING LAND 46 FARM AND FOREST LAND 48 Farm land 48 Forest land 50FINAL COMMENT 51Appendix 1STATISTICAL INDICATORS 52 Number and value of real property sales contracts recorded 52 The number of sales of real property in recorded sales contracts 53 Statisticalindicatorsoftherealpropertymarketfor2016 54Appendix 2 IMAGES OF AREAS FOR ANALYSIS 57Appendix 3RECORDED SALES OF REAL PROPERTY TO FOREIGNERS IN 2016 58
2
3
• The report is based on verified and improved data on concluded real property purchases recorded in the Real Property Market Register (ETN) managed by the Surveying and Mapping Authority of the Re-public of Slovenia since 2007.
• A sales trade is a single sales contract which can comprise one or several sales of real property. Sold real property can comprise a building with as-sociated land, a part of the building with floor own-ership or land, comprising one or several land plots of the same type.
• Legally appointed reporters send data to the ETN. The Financial Administration of the Republic of Slo-venia is obliged to send data to the ETN on sales transactions which are taxed with real property transfer tax (DPN). Data on sales transactions that are subject to value added tax (VAT) must be sent by vendors. VAT applies to all new buildings and parts of buildings in floor ownership, building land sold by persons liable for VAT, and transactions involving any real property between entities liable for VAT if they submit an appropriate statement to the Finan-cial Administration of the Republic of Slovenia, i.e. that VAT is charged for the subject transaction.
• Due to inconsistent data on real property transfer tax returns and because the vendors do not report transactions that are subject to VAT, the number of transactions recorded is usually lower than the number of realised transactions. We estimate that approximately 95 per cent of all real property sales transactions in the free market and at public auc-tions were recorded in the ETN in 2016.
• Experts at the mass real property Valuation Office review the data on concluded sales transactions; if necessary, they improve them with data collected during field visits to sold real property and filter the data for further analyses. Only transactions that show which and what real property was subject to the transaction and if the total contractual price was the market price of real property are used for mar-ket analyses and the calculation of statistical indi-cators. The analyses exclude all sales not made in
the free market between independent vendors and buyers or at public auctions or through other public sales methods, all sales of non-functional shares of land plots and buildings, as well as all sales of unfin-ished buildings. By types of real property in 2016, the following shares of transactions were suitable for market analyses by types of real property: 72 per cent of recorded sales of flats, 52 per cent of sales of houses, 30 per cent of sales of business real prop-erty, 55 per cent of sales of land for the construction of buildings, 37 per cent of sales of farm land and 49 per cent of sales of forest land. The sample size data show how many data were used to calculate statisti-cal indicators of the real property market.
• Due to the systemic delay in recording sales from real property transfer tax returns and delays in ven-dors' reporting about concluded sales transactions including VAT, data on transactions and prices of real property for the previous year are still provisional data. Therefore, the final data in annual reports for the year preceding the previous year usually differ from preliminary data published for the same year in the preliminary annual report.
• In the report, the comparison of average prices per square metre is used to calculate the percentage changes in prices. The interpretation of percentage changes in prices must consider that the compari-son of average prices is not the most accurate indi-cator, due to the changing average structure of real property sold. This also applies to relatively small statistical samples available, since the accuracy of the indicator is inversely related to the sample size. If the sample size comprises at least 100 sales per year, percentage changes relatively reliably show the direction and strength of the price trend. In most cases, a zero to two per cent change means stagnation, a three to five per cent change a weak trend, a six to eight per cent change a moderate trend, and nine or more per cent a relatively strong trend of price changes. Graphic symbols – which are explained in appendix 1 – are used to indicate the direction and strength of trends.
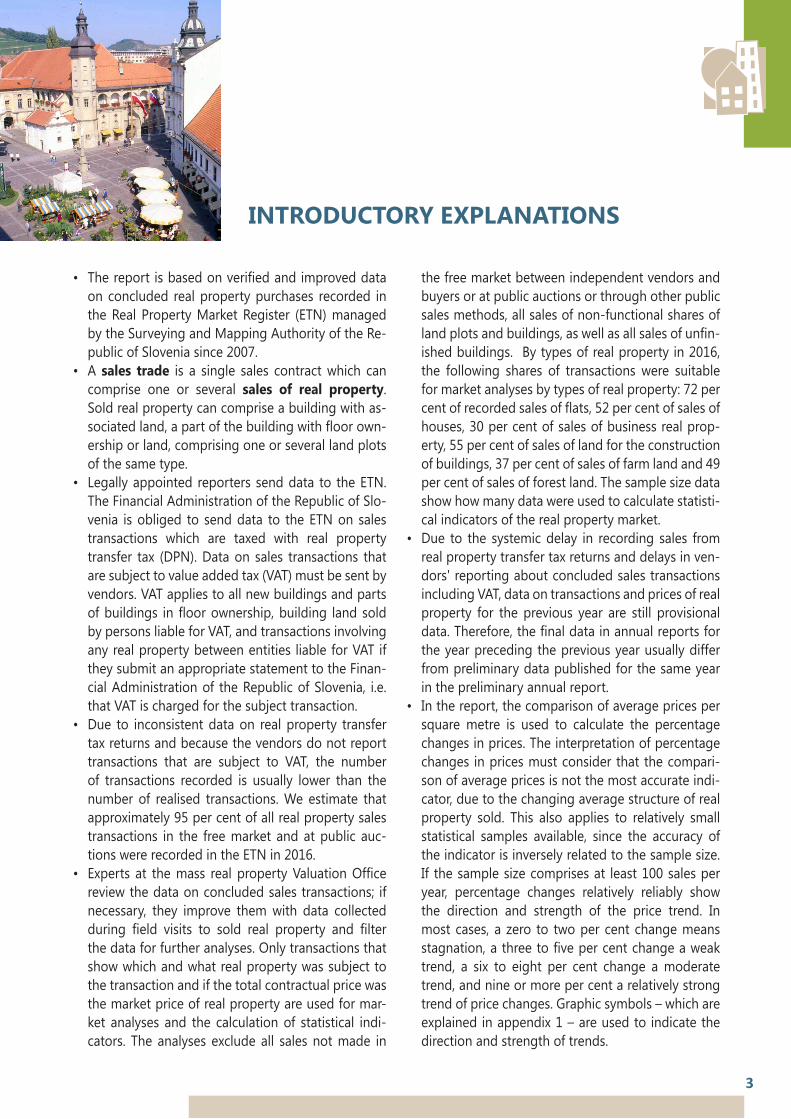
INTRODUCTORY EXPLANATIONS

4
SUPPLY AND DEMAND
In 2016, the growth in sales continued in the Slovenian real property market, especially due to the growth in the number of sales of residential real property and construction land, and the growth started with an intensive revival of the market in 2014. While prices of residential real property hit bottom in 2015, last year, they increased to such an extent showing a turnaround in prices in the Slovenian residential market.
SLOVENIAN REAL PROPERTY MARKET
Positive economic conditions and climate continue to stimulate growth in the demand for real property. This applies mainly to residential real property and land for building construction. The main factors impacting the growth in demand for residential real property include low interest rates and modest growth of residential loans which has been evident in the past three years, the increase in employment and the rise in salaries and fall in prices of flats during the crisis. Besides loans for purchasing or individual construction1, low interest rates stimulate investments in real property as an alternative to saving or risk investments. The demand for building land has also increased due to the greater interest of potential investors in building new residential units for the market.
The Slovenian real property market is expecting the beginning of a new investment and construction cycle, since supply will try to follow increased demand. This is also supported by a significant increase in the number of building permits issued for residential and non-residential buildings, although the number is still quite low in comparison to the pre-crisis period. According to the provisional data of the Statistical Office of the Republic of Slovenia, last year after an eight-year decrease, the number of building permits issued for the construction of buildings in multi-dwelling buildings in comparison to 2015, when it hit bottom (building permits were issued for the construction of only around 100 new flats), increased by almost 150 per cent (building permits were issued for more than 250 new flats). Although the absolute number of issued permits is still small (to compare: in 2007, permits were issued for almost 4900 new flats), such an increase indicates more construction in the future. This is also supported by the fact that the number of building permits for building one- and two-flat buildings that were issued to businesses (from slightly more than 100 in 2015 to over 180 last year – in 2007, building permits were issued to business for almost 600 residential houses).
The stock of new apartments built during the crisis has been more or less emptied and cannot satisfy the increasing demand for new flats. Almost no new large buildings are on the market, neither residential nor commercial buildings.
1 Individual building on own building land.

5
SUPPLY AND DEMAND REAL PROPERTY SALES VOLUME
Table 1: Thevalueandsharesofrealpropertytransactionsbytypesofrealpropertyinthefreemarketandatpublicauctions,Slovenia,2016
It can be expected that in larger cities, investors will start reviving major projects that were halted by the crisis, plan new projects and build small multi-dwelling buildings. Most investments are currently being made in the capital, where there are more and more small residential new buildings, and there are also some individual purchases of building land plots and buildings that have not been finished due to incomplete projects.
Type of property Transactions in million EUR Share of total transaction value
Flats 836 39.2%
Houses 483 22.7%
Building land 210 9.9%
Retail, service and hospitality premises 137 6.4%
Offices 126 5.9%
Industrial real property 105 4.9%
Built-up land 91 4.3%
Farm land 49 2.3%
Garages and car parks 29 1.4%
Forest land 14 0.7%
Other real property 49 2.3%
According to provisional data, 32 thousand real property sales were concluded in 2016 in the free market or at public auctions. The number of buildings, parts of buildings and land sold almost reached the number in the record year of 2007 according to individual types of real property.
The total value of real property sales last year amounted to approximately EUR 2.1 billion, and reached EUR 2 billion for the first time since the record year of 2007, when it amounted to around EUR 2.3 billion.
In 2016, approximately 62 per cent of transactions involved residential real property (flats in multi-dwelling buildings and houses with surrounding land), around 17 per cent involved commercial real property (offices, industrial real property, retail, service and hospitality premises), around 10 per cent involved land for building construction, 3 per cent involved agricultural and woodland, and the remaining 8 per cent of transactions involved other types of real property.

6
The number of sales last year was the highest since 2007, when we started with systematic monitoring. Compared to 2015, the number increased by almost one tenth; compared to 2009, when the number was lowest, it increased by almost 60 per cent.
Compared to 2015, the total contractual value of recorded sales increased by approximately one fourth, which is the highest increase since the start of our monitoring process. Compared to 2013, when the value of sales amounted to approximately EUR 1.3 billion, thus being the smallest since the start of our monitoring process, it grew by almost two thirds.
According to provisional data for 2016, we can expect that the final number of residential real properties sold will come close to the record value registered in 2007. The increase in the number of sales of residential real property continued last year for the third year in a row. Contrary to 2015, when the number of sales of residential real property increased mostly due to the sale of flats in multi-dwelling buildings, last year the number of house sales significantly increased. Compared to 2015 the number of recorded sales of flats and houses jointly increased by 13 per cent. Compared to 2013, the number of sales of residential real property increased by 60 per cent and was only around 5 per cent lower compared to 2007.
Figure 1: The number and value of recorded sales of real property in the free market and atpublicauctions,Slovenia,2007–2016
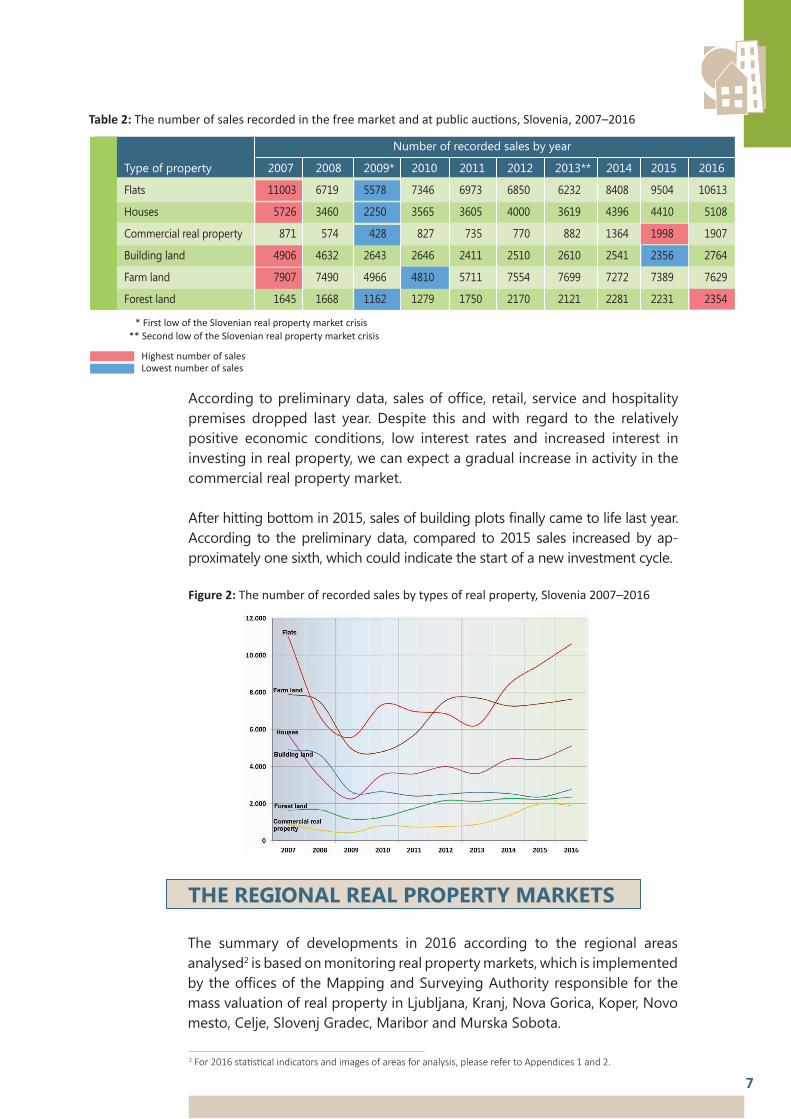
According to preliminary data, sales of office, retail, service and hospitality premises dropped last year. Despite this and with regard to the relatively positive economic conditions, low interest rates and increased interest in investing in real property, we can expect a gradual increase in activity in the commercial real property market.
After hitting bottom in 2015, sales of building plots finally came to life last year. According to the preliminary data, compared to 2015 sales increased by ap-proximately one sixth, which could indicate the start of a new investment cycle.
7
THE REGIONAL REAL PROPERTY MARKETS
The summary of developments in 2016 according to the regional areas analysed2 is based on monitoring real property markets, which is implemented by the offices of the Mapping and Surveying Authority responsible for the mass valuation of real property in Ljubljana, Kranj, Nova Gorica, Koper, Novo mesto, Celje, Slovenj Gradec, Maribor and Murska Sobota.
Figure 2: The number of recorded sales by types of real property, Slovenia 2007–2016
Table 2: The number of sales recorded in the free market and at public auctions, Slovenia, 2007–2016
* First low of the Slovenian real property market crisis** Second low of the Slovenian real property market crisis
Highest number of sales Lowest number of sales
2For2016statisticalindicatorsandimagesofareasforanalysis,pleaserefertoAppendices1and2.
Type of property 2007 2008 2009* 2010 2011 2012 2013** 2014 2015 2016
Flats 11003 6719 5578 7346 6973 6850 6232 8408 9504 10613
Houses 5726 3460 2250 3565 3605 4000 3619 4396 4410 5108
Commercial real property 871 574 428 827 735 770 882 1364 1998 1907
Building land 4906 4632 2643 2646 2411 2510 2610 2541 2356 2764
Farm land 7907 7490 4966 4810 5711 7554 7699 7272 7389 7629
Forest land 1645 1668 1162 1279 1750 2170 2121 2281 2231 2354
Number of recorded sales by year

8
Central Slovenia
Ljubljana
Approximately 2950 flats were sold in multi-dwelling buildings in Ljubljana, or 8 per cent more than in the preceding year. One fifth of these flats were sold with appertaining garages or one or more parking spaces. The number of sales began to stagnate in the second half of the previous year, showing a weak growth trend. The average price of a used flat was around EUR 117,000, or EUR 2,180 per square metre of useful floor surface, 7 per cent higher compared to the preceding year. The prices of used flats in Ljubljana showed a constant trend of moderate growth from the beginning of the previous year. Compared to the peak in prices in 2008, prices last year were 20 per cent lower.
In 2016, the following was recorded in Central Slovenia:▪ 4072 sales of flats, or 13 per cent more than in 2015;▪ 1108 sales of houses, or 11 per cent more than in 2015;▪ 642 sales of building land, or 16 per cent more than in 2015;▪ 879 sales of farm land, or 6 per cent more than in 2015;▪ 323 sales of forest land, or 17 per cent more than in 2015;▪ 478 sales of offices, 115 of sales of retail and service premises, and 38 sales of hospitality premises.
The trend in the growth in the number of transactions made with residential real property is continuing in the area of Central Slovenia. The prices of flats and houses after hitting bottom at the start of 2015 show a more obvious rising trend. There has been a turnaround in the market of building land. After nine years of decline, the number of sales and prices show a strong growth trend.
Last year, sales of farm and forest land also increased in the area of Central Slovenia. The value of market sales of farm land in comparison with the previous year increased by more than one fifth and reached almost EUR 3.2 million. The average price of farm land was EUR 2.10/m2 and did not change.
The value of market sales of forest land last year reached almost EUR 1.4 million, a drop of one fifth in comparison with the preceding year. This decrease in sales was due to a decline of 36 per cent in total area of forest land sold last year. The average price of forest land, which was EUR 0.48/m2 last year, increased by one fifth in comparison with the preceding year.
Sales of commercial real property are mostly concentrated in Ljubljana, where last year we recorded 84 per cent of all sales of offices and 53 per cent of all sales of other businesses premises in Central Slovenia. There was a low number of transaction with commercial premises; prices fluctuate greatly every year.
9
Central Slovenia
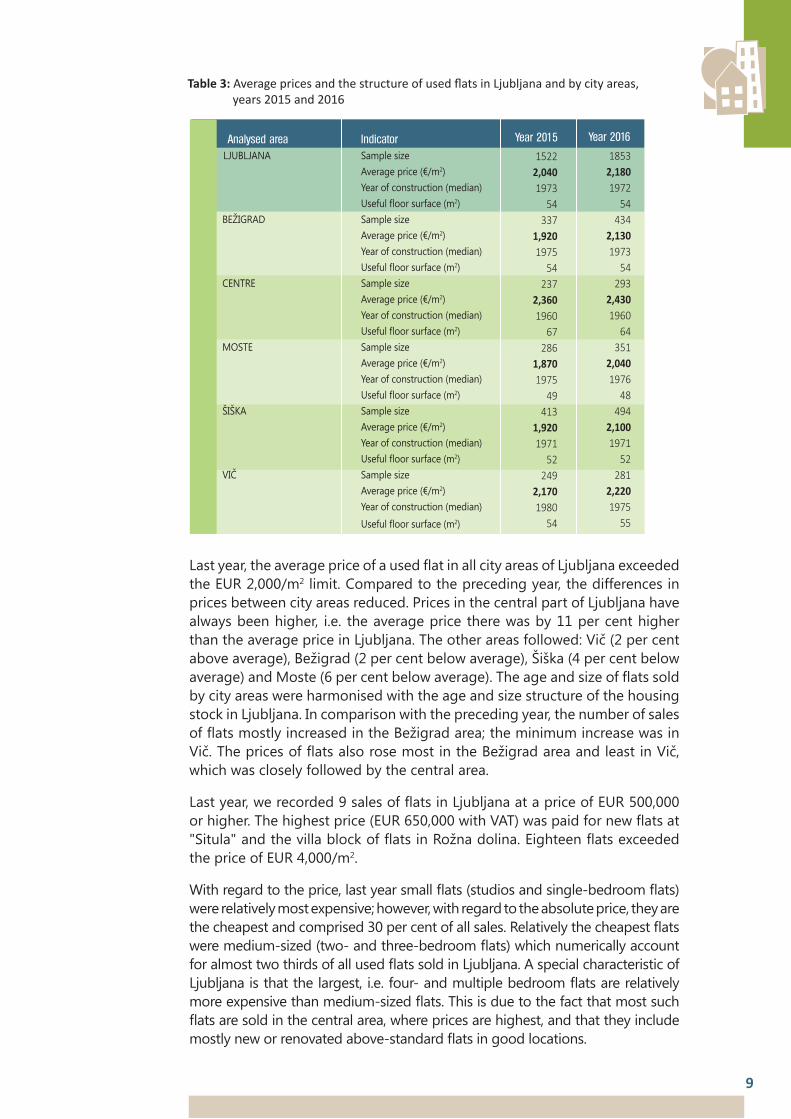
Last year, the average price of a used flat in all city areas of Ljubljana exceeded the EUR 2,000/m2 limit. Compared to the preceding year, the differences in prices between city areas reduced. Prices in the central part of Ljubljana have always been higher, i.e. the average price there was by 11 per cent higher than the average price in Ljubljana. The other areas followed: Vič (2 per cent above average), Bežigrad (2 per cent below average), Šiška (4 per cent below average) and Moste (6 per cent below average). The age and size of flats sold by city areas were harmonised with the age and size structure of the housing stock in Ljubljana. In comparison with the preceding year, the number of sales of flats mostly increased in the Bežigrad area; the minimum increase was in Vič. The prices of flats also rose most in the Bežigrad area and least in Vič, which was closely followed by the central area.
Last year, we recorded 9 sales of flats in Ljubljana at a price of EUR 500,000 or higher. The highest price (EUR 650,000 with VAT) was paid for new flats at "Situla" and the villa block of flats in Rožna dolina. Eighteen flats exceeded the price of EUR 4,000/m2.
With regard to the price, last year small flats (studios and single-bedroom flats) were relatively most expensive; however, with regard to the absolute price, they are the cheapest and comprised 30 per cent of all sales. Relatively the cheapest flats were medium-sized (two- and three-bedroom flats) which numerically account for almost two thirds of all used flats sold in Ljubljana. A special characteristic of Ljubljana is that the largest, i.e. four- and multiple bedroom flats are relatively more expensive than medium-sized flats. This is due to the fact that most such flats are sold in the central area, where prices are highest, and that they include mostly new or renovated above-standard flats in good locations.
Table 3: Average prices and the structure of used flats in Ljubljana and by city areas, years 2015 and 2016
Analysed area Indicator LJUBLJANA Sample size Average price (€/m2) Year of construction (median) Useful floor surface (m2) BEŽIGRAD Sample size Average price (€/m2) Year of construction (median) Useful floor surface (m2) CENTRE Sample size Average price (€/m2) Year of construction (median) Useful floor surface (m2) MOSTE Sample size Average price (€/m2) Year of construction (median) Useful floor surface (m2) ŠIŠKA Sample size Average price (€/m2) Year of construction (median) Useful floor surface (m2) VIČ Sample size Average price (€/m2) Year of construction (median) Useful floor surface (m2)
Year 2015
15222,0401973
54337
1,9201975
54237
2,3601960
67286
1,8701975
49413
1,9201971
52249
2,1701980
54
Year 2016
18532,1801972
54434
2,1301973
54293
2,4301960
64351
2,0401976
48494
2,1001971
52281
2,2201975
55

10
Table 4: Average prices of sold used flats with regard to useful floor surface, Ljubljana, 2016
Useful floor surface Sample size
To 20 m2 34 2,250
From 20 to 40 m2 527 2,320
From 40 to 60 m2 653 2,160
From 60 to 90 m2 524 2,090
From 90 to 120 m2 89 2,250
120 m2 and more 26 2,270
Total 1853 2,180
Average price (€/m2)
Last year, approximately 270 flats were sold in enforcement or bankruptcy procedures. The sale of new flats almost halved in comparison with the preceding year, because there was no new offer of flats, with the exception of housing stock in Brdo, Vič. The Housing Fund of the Republic of Slovenia published a public tender offering 85 flats under the "Zeleni gaj" project. These flats were finished last year and almost all were sold by the end of the year. Other sales were made with the last flats in the "Situla" and "Savski Breg" residential areas. Thus, the sale of 226 flats in "Situla" and 149 flats in "Savski Breg" residential areas was completed.
Therefore, the availability of unsold flats from previous years is decreasing. With regard to the demand and prices of flats from previous housing stock, there are no such flats available. The Ljubljana housing market is therefore in desperate need of new flats. Above-standard flats under the "Eco srebrna hiša" project in the Bežigrad area and some last flats of various projects are still available for sale. In October last year, BAMC (Bank Assets Managing Company) finally started selling the flats from the major remaining failed "Celovški dvori" project. In the first phase, i.e. the public call for bids, BAMC offered 56 flats, which were sold by the end of the year. This year, the sale continues successfully, and we can expect that the remaining 168 flats will be sold this year.
Considering the lack of new flats and increasing demand, some projects that were abandoned due to the crisis were activated last year. Currently, 195 flats are being built in the "Belle Vie Tivoli" residential area, 108 flats in the "Zelene Jarše" residential area, 101 above-standard and sheltered flats in Murgle, and 132 flats in the next phase of the Housing Fund's project "Zeleni gaj". Flats in the "Zelene Jarše" and "Zeleni gaj" residential areas will be finished in 2017; the "Belle vie Tivoli" residential area and sheltered flats in Murgle will be ready for occupation in 2018.
The Ljubljana house market which was strongly affected by the real property market crisis revived last year after many years. We recorded around 400 sales of houses with appertaining land, or 8 per cent more than in the preceding year. Approximately 56 per cent of sold houses were independent single- or double-dwelling houses; 30 per cent were dwelling units in terraced houses; 14 per cent of them were dwelling units in semi-detached houses.

The average contractual price was EUR 235,000 and increased by 12 per cent in comparison with the preceding year. Last year, average sold houses were 5 years older and had 50 square metres more appertaining land. The prices of houses fluctuated during the year and do not reflect a stable rising trend, unlike the prices of flats. The average price of a house in Ljubljana last year was by 36 per cent lower than the price peak in 2008.
Although the offer of building land in the city is limited, the increase in demand in the real property market last year in Ljubljana also stimulated trading in land intended for construction. The number of recorded sales increased after a long time, i.e. by 8 per cent, and the average increase in prices was 20 per cent. Most sales were of building land for residential houses. The average price of land for the construction of residential houses amounted to EUR 214/m2 (considering 55 sales, the average area of land sold was 710 m2). In comparison with preceding years, the number of sales of building land for commercial and industrial purposes and small multiple-dwelling facilities also increased. The average price of building land for commercial purposes amounted to EUR 360/m2 (considering 12 sales, the average area of sold land was 7860 m2). The average price of building land for commercial purposes amounted to EUR 89/m2 (considering 11 sales, the average area of land was 5700 m2). Three major transactions involving building land were implemented last year: the sale of land for a multi-purpose complex in the area of the former Kolizej in the city centre, the sale of land for the construction of IKEA store Ljubljana, and building land for the construction of the second tower block of the northern Ljubljana portal at Bavarski dvor, including the hotel project.
The situation in the Ljubljana commercial real property market remains unchanged. The offer of commercial premises still exceeds demand, and there are no signs of a market revival. The number of recorded sales of office premises even decreased last year in comparison with the preceding year, because the relatively high number of offices for rent means strong competition with office premises for sale. Last year, realised prices for office premises ranged from EUR 290/m2 (for 20 square metres large office in an older business building in Moste) to EUR 3470/m2 (for 75-square-metre office in Zupančičeva jama). The average price of offices in Ljubljana last year amounted to EUR 1420/m2 (94 sales were considered, the median year of construction of premises was 1974, and the average effective surface area was 170 m2), thus showing a weak rising trend.
The average price of retail and service premises amounted to EUR 980/m2 (147 sales were considered, the median year of construction of premises was 1987, and the average effective surface area was 130 m2). The price shows a relatively strong negative trend, considering that in comparison with the preceding year, premises sold were on average 6 years younger and 10 per cent smaller. The average price of hospitality premises last year was EUR 980/m2 (42 sales were considered, the median year of construction of sold premises was 1980, the average effective surface area was 125 m2), thus showing a moderate negative trend, whereas in the preceding year premises were on average 4 years older and 9 per cent larger.
11

Ljubljana Surrounding Area
Last year, over 900 flats sold in multi-dwelling buildings or 28 per cent more than in the preceding year were recorded in the analysed Ljubljana Surrounding Area. The average price of a used flat was EUR 1710/m2, or 6 per cent more than in the preceding year. Compared to Ljubljana, the price was more than 20 per cent lower, and flats sold in Ljubljana's surroundings were on average 24 years younger. Compared to the price peak in 2008, the prices of used flats in Ljubljana's surroundings last year were on average 20 per cent lower, or the same as in Ljubljana.
Among urban settlements in the Ljubljana Surrounding Area, the highest prices of used flats were in Grosuplje, where the newest flats were sold on average. Vrhnika ranked second according to prices, where compared to the preceding year, the flats were in average 17 years younger and 3 square metres smaller. Vrhnika is followed by Domžale, Medvode and Kamnik as well as Litija and Logatec which are the farthest from Ljubljana.
Some failed real property projects in Ljubljana last year (the "Dalmatinka" business and residential building in the centre of Ljubljana, Dalmatinova ulica street) and this year (e.g. the "Črnuška gmajna" residential area) acquired new owners and investors that plan to finish them as soon as possible. This year, the hotel in the tower block at Bavarski dvor, which acquired a new owner in 2015, will be finished. Some major projects still require investors. The majority of the aforementioned projects were planned before the crisis, but the crisis halted their implementation. These projects are also promoted by the Ljubljana City Municipality, and investors are being sought mostly abroad. These projects are: "Emonika" – 20.5 hectares of land alongside the main railway station for a shopping centre and a new railway and bus station; "Žitna vrata" – 9.6 hectares of land for business and residential activity in the area of the Žito factory near the BTC shopping centre; "Stolp Stožice" – 9.1 hectares of land for a shopping and business centre near the Stožice Hall; "Kamna Gorica" residential area – 2.5 hectares of land in Podutik; "Geriatrični center Ljubljana" – two hectares of land for sheltered flats and a medical centre for the elderly near the Soča rehabilitation centre; "Tobačna mesto" – 0.8 hectares of land and a building pit for a residential and business area in the area of the former Tobačna factory; "Šumi" – 0.5 h of land for a multi-purpose area in the city centre opposite the Drama theatre in Ljubljana.
12

13
Table 5: Average prices and the structure of used flats sold in Central Slovenian towns excluding Ljubljana, and settlements in the Ljubljana Surrounding Area for the years 2015 and 2016
Analysed area Indicator
DOMŽALE Sample size Average price (€/m2) Year of construction (median) Useful floor surface (m2) GROSUPLJE Sample size Average price (€/m2) Year of construction (median) Useful floor surface (m2) KAMNIK Sample size Average price (€/m2) Year of construction (median) Useful floor surface (m2) LITIJA-ŠMARTNO Sample size Average price (€/m2) Year of construction (median) Useful floor surface (m2) MEDVODE Sample size Average price (€/m2) Year of construction (median) Useful floor surface (m2) VRHNIKA Sample size Average price (€/m2) Year of construction (median) Useful floor surface (m2) LOGATEC Sample size Average price (€/m2) Year of construction (median) Useful floor surface (m2) OKOLIŠKA NASELJA * Sample size Average price (€/m2) Year of construction (median) Useful floor surface (m2)
2015
791,6901982
4830
1,7201995
56103
1,5401982
5037
1,0901975
5231
1,6601978
4834
1,5401980
5228
1,4201985
57135
1,6302002
59
Year
*TheSurroundingsSettlementsincludes:Brezovica,Ig,Škofljica,Lavrica,DolpriLjubljani,Trzin,Mengeš,Radomlje,MosteandKomenda.
2016
911,7401982
5058
1,8402004
56103
1,6101982
5238
1,0801974
5031
1,6501976
5650
1,7501998
4936
1,4001982
55203
1,7002003
58
Year
The fund of unsold flats dispersed in Ljubljana's surroundings almost emptied in 2014 and 2015. The Housing Fund of the Republic of Slovenia last year practically concluded the sale of 53 flats in Borovnica, which were initially intended for rental and were offered on the market at the end of 2015. For the past two years, smaller multi-dwelling buildings have been built in Škofljica ("Lanovo" project) which are quickly sold. 27 new flats were sold last year. There is almost no other major offer of new flats in Ljubljana's surroundings.
Last year, 440 sales of houses with surrounding land were recorded in the market analysed area of the Ljubljana's surroundings. Approximately 76 per cent of houses sold were detached one- or two-flat houses; 8 per cent were dwelling units in terraced houses; 16 per cent of them were dwelling units in semi-detached houses. Compared to the preceding year, the number of recorded sales increased by 10 per cent. The average price of a house was EUR 166,000, and rose by 7 per cent compared to the preceding year, whereas on

14
The Gorenjska region
In 2016, the following was recorded in the Gorenjska region:▪ 959 sales of flats, or 23 per cent more than in 2015;▪ 421 sales of houses, or 21 per cent more than in 2015;▪ 203 sales of building land, or 3 per cent more than in 2015;▪ 365 sales of farm land, or 2 per cent more than in 2015;▪ 189 sales of forest land, or 6 per cent more than in 2015;▪ 66 sales of offices, 18 of sales of retail and service premises, and 8 sales of hospitality premises.
Last year, trading with residential real property flourished in the Gorenjska region. In comparison with the preceding year, the recorded number of flats sold in multi-dwelling buildings increased by almost 25 per cent, and the number of houses by more than 20 per cent. The average prices of used flats and houses stagnated and remained at the lowest level of the preceding year.
New flats comprised a weak tenth of sales of flats in multi-dwelling buildings. Mainly flats in buildings built years ago were sold, since there are currently no new flats in the Gorenjska region. There are practically no major new buildings currently being built, with the exception of Vurnikov trg residential area in Radovljica, which will probably be finished this year and will provide almost 100 new flats. The sale of flats from the fund from previous years is quite slow. In some places this is due to high prices, in other places there is no demand for flats that have been stigmatised as failed projects. We estimate that at the end of the previous year, approximately 60 new flats built from 2008 to 2013 had not been sold in Gorenjska, and they cannot cover the increasing demand for new flats. Flats are being sold within the scope of various projects, but these will soon be sold. Most flats, i.e. around 20, are still available at "Dvorec Jelen" in Kranj.
average, the houses sold were two years older and 10 square metres bigger, and had 40 square metres less appertaining land.
Three house sales with surrounding land were recorded in the Ljubljana Sur-rounding Area which were priced at EUR 400,000 or higher (Dobeno, Zgornje Gameljne and near Radomlje).
As the distance from Ljubljana increases, the prices of houses drop rapidly and the average construction year and area of appertaining land rise significantly. Last year, the prices of houses on the market analysed area of the Ljubljana Surrounding Area were around 30 per cent lower than prices in Ljubljana, and 45 to 60 per cent lower in the area of Central Slovenia excluding Ljubljana and Ljubljana Surranding Area. Compared to the price spike in 2008, the prices of residential houses in the Ljubljana Surrounding Area last year, were around 30 per cent lower.

15
The average prices of used flats in Kranj, Škofja Loka and Radovljica remained on the same level last year, amounting to slightly above EUR 1,600/m2. As usual, the prices were much lower Tržič and Jesenice, where sold flats are on average around ten years older. The average prices in Radovljica, Škofja Loka and Kranj rose in comparison with 2015; in Jesenice prices remained almost the same, and in Tržič, they fell slightly. The most expensive flats in the Gorenjska area were sold in Kranjska Gora, where prices ranged from EUR 2,060 to 3,000/m2. The average price was EUR 2,240/m2 (by considering 12 sales). In Bled, the prices of flats only slightly exceeded prices in Škofja Loka, Radovljica and Kranj. The average price was EUR 1,700/m2 (by considering 15 sales) for the second year in a row.
Houses in Gorenjska also sold more outside the urban centres. Their prices on average ranged from EUR 100,000 to 250,000. The most expensive house last year was sold in Bled, i.e. for EUR 650,000. There were houses available for sale in the price range around EUR 100,000 in the areas of central and north Gorenjska, from Škofja Loka to Mojstrana. Houses in the price class of EUR 250,000 were sold in the area of Kranjska Gora, Bohinj, Bled's surroundings, Radovljica, Kranj and its surroundings.
The recorded sales of commercial premises were quite modest. The prices of offices ranged between EUR 570 and 1,625/m2; the range of surfaces was from 15 to 960 square metres. The most expensive office premises were sold in Jesenice (EUR 1,625/m2). These premises covered 400 square metres.
Table 6: Average prices and the structure of sold used flats for selected local areas, Gorenjska region, 2015 and 2016
Analysed area Indicator
KRANJ Sample size Average price in €/m2 Median year of construction Average useful floor surface in m2
ŠKOFJA LOKA Sample size Average price in €/m2 Median year of construction Average useful floor surface in m2
RADOVLJICA Sample size Average price in €/m2 Median year of construction Average useful floor surface in m2
TRŽIČ Sample size Average price in €/m2 Median year of construction Average useful floor surface in m2
JESENICE Sample size Average price in €/m2 Median year of construction Average useful floor surface in m2
2015
1781,5601974
49 53
1,5401978
48 37
1,5201976
4532
1,1601968
4570
1,0301964
50
Year 2016
2241,6101974
50 52
1,6301976
49 52
1,6201976
47 60
1,1101967
50 97
1,0401966
49
Year

16
The Gorica region
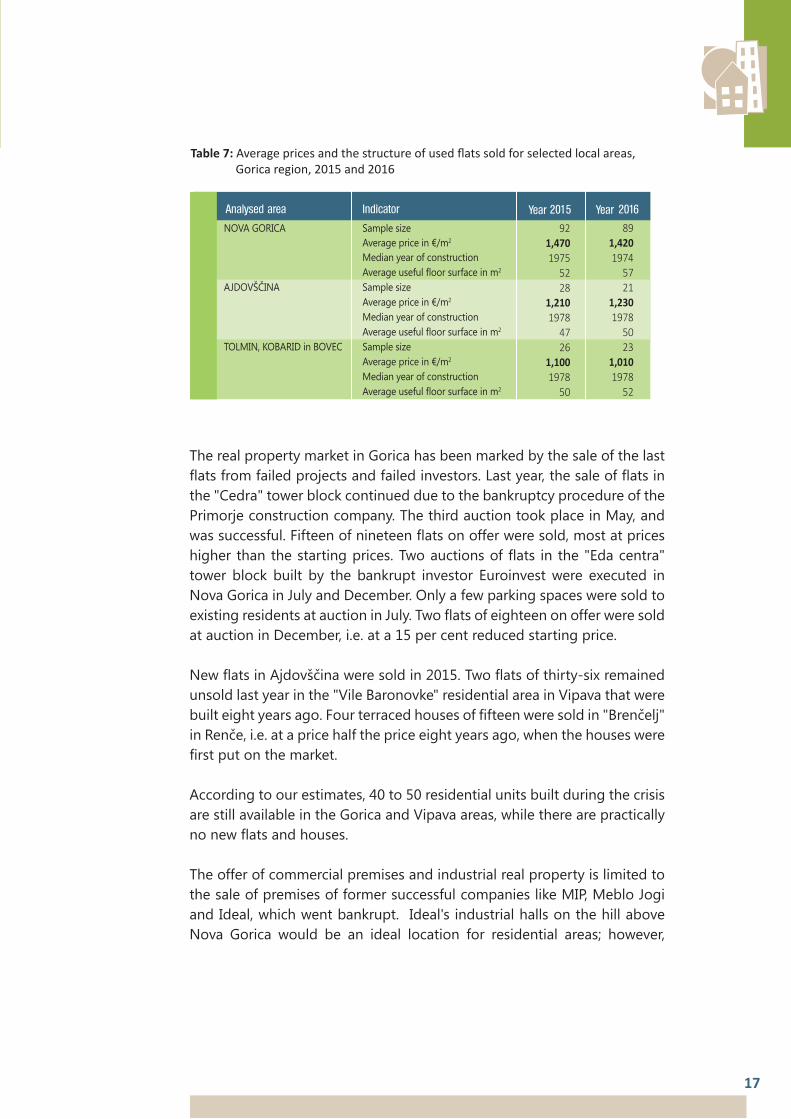
In 2016, the following was recorded in the Gorica region:▪ 311 sales of flats, or 8 per cent more than in 2015;▪ 317 sales of houses, or 29 per cent more than in 2015;▪ 112 sales of building land, or 27 per cent more than in 2015;▪ 476 sales of farm land, or 21 per cent more than in 2015;▪ 166 sales of forest land, or 14 per cent more than in 2015;▪ 49 sales of offices, 10 of sales of retail and service premises, and 11 sales of hospitality premises.
In the analysed Gorica region, the volume of sold real property started indicating a growth trend in 2015 following the previous stagnation. The number of flats sold shows a moderate rise, and the number of residential houses sold a strong growth trend. The prices of used flats continued to indicate a slight negative trend, while the prices of houses with surrounding land are stagnating.
However, despite increasing demand, there was no real revival of the market in building land in Gorenjska. This is due to the lack of appropriate building land for sale. In preceding years, the municipalities in Gorenjska adopted spatial plans needed for infrastructural projects and did not provide building land for residential or commercial use, for which there was no demand for quite some time. The average price of building land was EUR 102/m2, and rose by 10 per cent compared to the preceding year. The prices of residential building land ranged from EUR 45/m2 in Jesenice to EUR 430/m2 along Lake Bled. The prices of building land for commercial purposes ranged from EUR 90/m2 in Škofja Loka and its surroundings to EUR 220/m2 in the area of Bled and Lesce.
The number of sales of farm land did not significantly change in comparison to 2015. The average price was EUR 4.20/m2. Farm land plots sold best in the flat area of Gorenjska, mostly in the wider Kranj Surrounding Area. In this area, the average price of a square metre of farm land was EUR 5.10; in hilly areas the price was EUR 1.50.
Sales of forest land dropped last year and prices stagnated. The average price of forest land in the Kranj Surrounding Area was EUR 1.07/m2, in hilly areas EUR 0.58/m2, and on the Pokljuka, Mežakla and Jelovica plateaus, the price was EUR 0.75/m2. The reduction in sales of forest land was expected to some extent. In previous years, the number of sales increased because owners were not able to eliminate the consequences of the catastrophic glaze ice in 2014.
17
Table 7: Average prices and the structure of used flats sold for selected local areas, Gorica region, 2015 and 2016
Analysed area Indicator
NOVA GORICA Sample size Average price in €/m2 Median year of construction Average useful floor surface in m2
AJDOVŠČINA Sample size Average price in €/m2 Median year of construction Average useful floor surface in m2
TOLMIN, KOBARID in BOVEC Sample size Average price in €/m2 Median year of construction Average useful floor surface in m2
2015
921,4701975
52 28
1,2101978
47 26
1,1001978
50
Year 2016
891,4201974
57 21
1,2301978
50 23
1,0101978
52
Year
The real property market in Gorica has been marked by the sale of the last flats from failed projects and failed investors. Last year, the sale of flats in the "Cedra" tower block continued due to the bankruptcy procedure of the Primorje construction company. The third auction took place in May, and was successful. Fifteen of nineteen flats on offer were sold, most at prices higher than the starting prices. Two auctions of flats in the "Eda centra" tower block built by the bankrupt investor Euroinvest were executed in Nova Gorica in July and December. Only a few parking spaces were sold to existing residents at auction in July. Two flats of eighteen on offer were sold at auction in December, i.e. at a 15 per cent reduced starting price.
New flats in Ajdovščina were sold in 2015. Two flats of thirty-six remained unsold last year in the "Vile Baronovke" residential area in Vipava that were built eight years ago. Four terraced houses of fifteen were sold in "Brenčelj" in Renče, i.e. at a price half the price eight years ago, when the houses were first put on the market.
According to our estimates, 40 to 50 residential units built during the crisis are still available in the Gorica and Vipava areas, while there are practically no new flats and houses.
The offer of commercial premises and industrial real property is limited to the sale of premises of former successful companies like MIP, Meblo Jogi and Ideal, which went bankrupt. Ideal's industrial halls on the hill above Nova Gorica would be an ideal location for residential areas; however,
18
The Coastal region
In 2016, the following was recorded in the Coastal region:▪ 777 sales of flats, or 7 per cent more than in 2015;▪ 239 sales of houses, or 14 per cent more than in 2015;▪ 105 sales of building land, or 46 per cent more than in 2015;▪ 250 sales of farm land, or 13 per cent less than in 2015;▪ 39 sales of forest land, or 40 per cent more than in 2015;▪ 67 sales of offices, 28 of sales of retail and service premises, and 23 sales of hospitality premises.
While the coastal area in 2015 was the only area where the number of real property units sold dropped, there was some indication of growth in sales last year. We can also notice a moderate trend of price increases in real property, which is strengthening.
Around 780 flats were sold in 2016, one fifth of which were sold in the primary market. The number of sales increased by 7 per cent compared to the preceding year. The average price of flats also increased by the same percentage.
the municipal spatial plan would have to be significantly altered for this purpose and there is currently no interest in this. The Pipistrel Company in Ajdovščina, which increased the number of employees due to the expansion of its operation, purchased the former building of Primorje from BAMC (Bank Assets Management Company).
Real property in the Posočje region last year was impacted by the sale of the "Kanin" hotel. The new owner, i.e. Alpe Adria Hoteli, immediately started to renovate it. Together with the finishing works on the Kanin cable car system and the reopening of the Kanin ski resort, this shows the revival of tourism and better times for the Posočje region. There are practically no other residential units from the fund available in the Posočje region. The unfinished block of nine flats in Poljubin remains unsold. Despite repeated auctions and a 20 per cent reduction in the starting price, no investors are interested in this property.

19
Table 8: Average prices and the structure of used flats sold for selected local areas, Coastal region, 2015 and 2016
Analysed area Indicator
KOPER – old city Sample size Average price in €/m2 Median year of construction Average useful floor surface in m2
KOPER – Semedela and Sample size Šalara Average price in €/m2 Median year of construction Average useful floor surface in m2
ANKARAN Sample size Average price in €/m2 Median year of construction Average useful floor surface in m2
IZOLA Sample size Average price in €/m2 Median year of construction Average useful floor surface in m2
PIRAN Sample size Average price in €/m2 Median year of construction Average useful floor surface in m2
PORTOROŽ and LUCIJA Sample size Average price in €/m2 Median year of construction Average useful floor surface in m2
2015
461,6801900
57 123
1,8401978
52 27
2,1901987
54 95
2,0301973
48 50
2,0201900
42 69
2,3001979
50
Year 2016
521,9201900
54 158
1,9901979
51 17
2,0501983
55 83
2,2201973
51 50
2,2501900
49 74
2,3801980
57
Year
The housing market was also impacted by the sale of 190 flats in the "Residenca Livade" residential area in Izola, thus ending a period of several years when no new flats were sold in this area. The flats were finished last spring; most were pre-sold, and almost all of them had been sold by the end of the preceding year. Sales prices ranged from EUR 2,080 to 2,800/m2 including VAT3. According to investor's data, half of the buyers were from the coastal area; the other half purchased the flats for vacation purposes.
Flats in the "Oltra" residential area in Ankaran which are located directly by the sea were also sold. There was quite a lot of interest in the third public auction of flats that were built in 2009. Therefore, the prices exceeded the starting prices. Prices ranged from EUR 1,500 to 3,600/m2 including VAT depending on the size and micro location of the flat and on whether the buyers also decided to purchase a place in the garage.
The highest price paid last year, i.e. EUR 430,000 (EUR 4,780/m2) was for an flat in Portorož. The highest price per square metre of useful floor surface, i.e. EUR 5,300/m2, was also for a flat sold in Portorož.
3Thepriceiscalculatedonthebasisoftheusefulfloorsurfaceoftheflatandincludesoneortwogarages,dependingonthesizeoftheflat.
20
Foreigners bought 28 flats in the Coastal Region. They purchased them directly as EU citizens, or via their own companies founded in Slovenia. Most of these buyers were Russian citizens, and some Ukrainians (a total of 10 sales). Most of the flats purchased were in Portorož and Piran. Austrians made 5 purchases and Italians 4. Other foreign buyers came from Norway, Switzerland, France, Bosnia and Croatia. Approximately 420 new flats in the area of Koper Municipality were available for sale at the end of 2016. Most of these were in the "Nokturno" residential area. In February 2017, BAMC (Bank Assets Management Company) successfully initiated their sale by collecting bids. Prices for flats with parking spaces range from EUR 1,900/m2 to EUR 2,800/m2 with VAT. There are currently no other new flats except for some flats in Piran available in the coastal area.
Last year, around 240 houses with surrounding land were sold in the coastal area. Compared to the preceding year, sales increased by almost 15 per cent. House prices show a slightly stronger rising trend than the prices of flats.
The most expensive houses were sold in Portorož, i.e. each for EUR 900,000. Both houses measure over 200 square metres and are renovated. One is located directly by the sea, while the other is slightly located farther from the sea with a view of the Strunjan and Portorož bays.
Foreigners bought 15 houses via their Slovenian companies. Eleven buyers were Russian citizens, three were Ukrainians and one was Macedonian. Russian buyers purchased 4 houses in the old city centre of Piran, 4 in Portorož, three in Izola and one in Parecag. Russian citizens indirectly bought six of seven houses, sold at EUR 600,000 or more.
Although not many sales were made, building land sales are also slowly reviving in the coastal area. Eight per cent more sales were made last year compared to the preceding year. The highest prices were for plots in Izola (EUR 457/m2) and Piran (EUR 280/m2). The highest price reached in the coastal hinterland was EUR 85/m2.
The commercial real property market in the coastal area is still not intensive. The sale of "Planet Tuš" shopping centre in Koper was by far the most lucrative transaction last year, because it sold for EUR 55 million.

21
The Karst region
In 2016 the following was recorded in the Karst region:▪ 123 sales of flats, or 6 per cent more than in 2015;▪ 96 sales of houses, or 23 per cent more than in 2015;▪ 53 sales of building land, or 10 per cent less than in 2015;▪ 209 sales of farm land, or 29 per cent more than in 2015;▪ 13 sales of forest land, or 10 sales more than in 2015;▪ 23 sales of offices, 10 sales of retail and service premises, and 1 sale of hospitality premises.
The Karst area typically has the smallest property fund of all the analysed regional areas and has no larger towns; it does not have much forest land and relatively little f agricultural land.
The average price of used flats in the Karst area was EUR 1,270/m2, displaying a stagnation trend. Compared to the preceding year, flats that were on average three years younger and three square metres larger were sold. The most expensive used flat was sold in Sežana (EUR 2,700/m2). The average price of a used flat in Sežana amounted to EUR 1,360/m2 (a total of 48 sales were considered).
The average house price was EUR 123,000, showing moderate growth trend. The most expensive house built in 2012 was sold near Kozina for EUR 315,000. Five more houses, mostly located near Sežana, were sold at a price exceeding EUR 200,000.
Currently, there are no signs of major investments in the Karst area. There is also no increased demand for building land. Not many building plots were sold last year; prices were around EUR 30 per square metre. The most expensive building plot was sold near Sežana at a price of EUR 96/m2 and was 675 square metres in area.
There are practically no major new houses or flats in the Karst area; properties from the real property fund from previous years are slowly being sold. The bankrupt construction company Kraški zidar built a block of 72 (sheltered) flats in 2010 in Sežana, which was called "Soseska Resje". The receiver offered the flats at several consecutive auctions. At the last auction held at the beginning of 2017, almost all the flats were sold as normal flats (not sheltered), i.e. at prices ranging from EUR 1,100 to 1,600/m2. After the Stavbenik company went bankrupt, the receiver is also completed the sale of flats in the "Brinje" residential area in Kozina. Divača has the the most residential units available. Around 50 flats are on sale in a block near the railway station. After the bankruptcy of Factor Bank, the BAMC (Bank Assets Management Company) assumed ownership of 14 terraced houses and 8 flats, which will be available for sale. Fifteen houses located near the transformer station are still for sale. They were built to the third construction phase in 2008.
22
The Notranjska region
In 2016, the following was recorded in the Notranjska region:▪ 202 sales of flats, or 4 per cent less than in 2015;▪ 102 sales of flats, or 2 houses less than in 2015;▪ 163 sales of building land, or 7 per cent more than in 2015;▪ 323 sales of farm land, or 5 per cent less than in 2015;▪ 136 sales of forest land, or 27 per cent more than in 2015;▪ 12 sales of offices and 14 sales of retail and service premises.
The Notranjska analysed area has no large towns, similarly to the Karst area. Therefore, the housing and commercial real property stock is quite small.
The average price of used flats in the Notranjska area was precisely EUR 1,000/m2, displaying moderate growth. Compared to 2015, the average size and age of sold flats practically did not change. The average price of a used flat in Postojna last year amounted to EUR 1,110/m2 (a total of 66 sales were considered).
The average price of a house with appertaining land was EUR 73,000, and despite a lower number of transactions the price is slightly increasing. Compared to the preceding year, the houses sold were on average 15 years older; their size and area of surrounding land did not change greatly in the Notranjska area. The highest price, i.e. EUR 300,000, was paid for a house in Postojna, built in 2013 and almost 200 square metres in area, including 1100 square metres of appertaining land.
The real property market in Notranjska remains relatively inactive. The building land market has not expanded, although the number of sales shows a moderate rising trend.
The fund of unfinished residential units from previous years in Notranjska is almost empty, and there are currently no new investment projects. The "Postojnski biser" residential area in Postojna, built in 2012, still offers five of twenty-six new flats. The prices (including VAT), including an outdoor parking space, range from EUR 92,000 for a one-bedroom flat (54 m2) to EUR 103,000 for a three-bedroom flat (76 m2).
23
The Dolenjska region
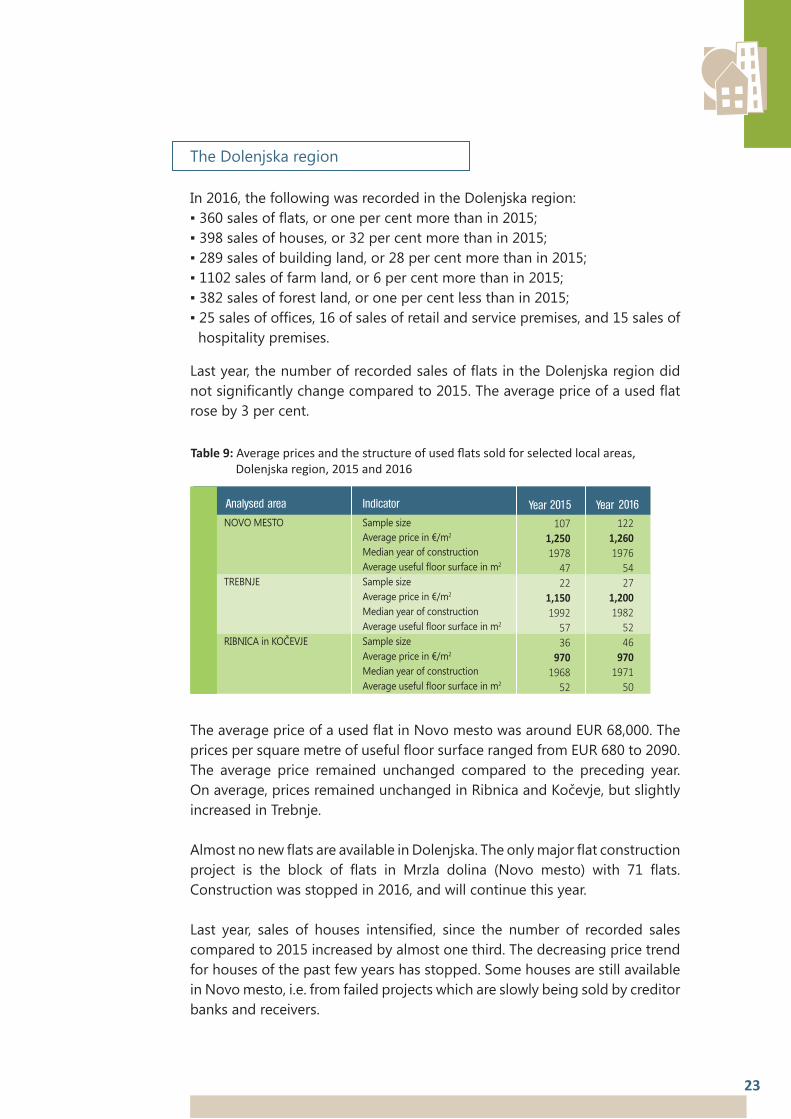
Table 9: Average prices and the structure of used flats sold for selected local areas, Dolenjska region, 2015 and 2016
Analysed area Indicator
NOVO MESTO Sample size Average price in €/m2 Median year of construction Average useful floor surface in m2
TREBNJE Sample size Average price in €/m2
Median year of construction Average useful floor surface in m2
RIBNICA in KOČEVJE Sample size Average price in €/m2 Median year of construction Average useful floor surface in m2
2015
1071,2501978
47 22
1,1501992
57 36
9701968
52
Year 2016
1221,2601976
54 27
1,2001982
52 46
9701971
50
Year
In 2016, the following was recorded in the Dolenjska region:▪ 360 sales of flats, or one per cent more than in 2015;▪ 398 sales of houses, or 32 per cent more than in 2015;▪ 289 sales of building land, or 28 per cent more than in 2015;▪ 1102 sales of farm land, or 6 per cent more than in 2015;▪ 382 sales of forest land, or one per cent less than in 2015;▪ 25 sales of offices, 16 of sales of retail and service premises, and 15 sales of hospitality premises.
Last year, the number of recorded sales of flats in the Dolenjska region did not significantly change compared to 2015. The average price of a used flat rose by 3 per cent.
The average price of a used flat in Novo mesto was around EUR 68,000. The prices per square metre of useful floor surface ranged from EUR 680 to 2090. The average price remained unchanged compared to the preceding year. On average, prices remained unchanged in Ribnica and Kočevje, but slightly increased in Trebnje.
Almost no new flats are available in Dolenjska. The only major flat construction project is the block of flats in Mrzla dolina (Novo mesto) with 71 flats. Construction was stopped in 2016, and will continue this year.
Last year, sales of houses intensified, since the number of recorded sales compared to 2015 increased by almost one third. The decreasing price trend for houses of the past few years has stopped. Some houses are still available in Novo mesto, i.e. from failed projects which are slowly being sold by creditor banks and receivers.
24
The Posavje region
In 2016, the following was recorded in the Posavje region:▪ 396 sales of flats, or the same as in 2015;▪ 280 sales of houses, or 4 per cent more than in 2015;▪ 110 sales of building land, or 15 per cent more than in 2015;▪ 616 sales of farm land, or 4 per cent less than in 2015;▪ 198 sales of forest land, or 5 per cent more than in 2015;▪ 49 sales of offices, 27 of sales of retail and service premises, and 2 sales of hospitality premises.
Prices in the Posavje area are traditionally the lowest of all regional analysed areas, while the average age of flats sold is highest. The reason for this is the relatively old housing stock, especially in the Zasavje area.
The number of sales in the Posavje area and prices last year remained almost unchanged. The average price of a used flat was EUR 770/m2. The average price of a used flat in Zasavje (Zagorje ob Savi, Trbovlje, Hrastnik, Izlake, Kisovec) was EUR 700/m2 (a total of 157 sales were considered; the median
The situation in the Dolenjska market of commercial real property remains unchanged. The supply for purchase or lease of offices and trade businesses still exceeds demand, so sales are rare. No new commercial premises are being built for the market, and only a few investors are building commercial premises for own use. Currently, businesses are choosing to rent commercial premises due the the extensive offer and low rents.
After many years of stagnation, the building land market in Dolenjska also became more active last year. This was mostly due to greater demand for land for the construction of individual family houses, while there was no major demand for building land for large residential or commercial buildings and projects. The average price of building land in Trebnje was from EUR 34/m2 (a total of 14 sales were considered, the average area of land was 3660 m2) and EUR 22/m2 in Novo mesto (19 sales, 2830 m2) to EUR 16/m2 in Bela Krajina (30 sales, 1300 m2).
The number of sales of farm land recorded last year increased by 6 per cent compared to 2015. The average price increased by 3 per cent and amounted to EUR 1.20/m2 for the Dolenjska area. Farm land in the area of Dolenjska, excluding Novo mesto, on average reached EUR 1.30/m2 (271 sales were considered; the average area of land was 4800 m2), in the Kočevje area (35; 3700 m2) and Bela Krajina (151; 3100 m2) the price was EUR 1.00/m2.
Recorded sales of forest land, for which demand was relatively high, remained at the 2015 level. The prices rose by 9 per cent on average. The average price of forest land in the Dolenjska area excluding Novo mesto last year was EUR 0.54/m2 (132 sales were considered, the average area was 1 hectare), in Kočevje area the price was EUR 0.53/m2 (28; 1.6 ha) and EUR 0.49/m2 in Bela Krajina (83; 1.9 ha).
year of construction was 1965 and the average useful floor surface was 49 m2). The average price of a used flat in Krško and Brežice was EUR 920 /m2 (a total of 85 sales were considered, the median year of construction was 1974 and the average useful floor surface was 53 m2).
Last year, trading and prices of houses in the Posavje region settled after a notable revival of the market and increase in prices in 2015. The average price of a house with surrounding land last year was EUR 57,000 (in 2015, the price was EUR 61,000). The median construction year was 1972 (as in 2015); the average house surface was 140 m2 (160 m2 in 2015), the average area of land was 1120 m2 (as in 2015).
The building land market also intensified in the Posavje area in 2016. The average contractual price of building land last year amounted EUR 26/m2, an increase of 44 per cent in comparison with the preceding year. The average land area was 1260 m2 (or 1790 m2 in 2015).
Sales of farm and forest land in the Zasavje area were quite modest last year. The average price of farm land in the south Posavje area was EUR 1.00/m2 and did not significantly change compared to 2015. The average price of forest land last year amounted to EUR 0.42/m2 and fell slightly in comparison with the preceding year.
The Savinja region
In 2016, the following was recorded in the Savinja region:▪ 1064 sales of flats, or 8 per cent more than in 2015;▪ 658 sales of houses, or 13 per cent more than in 2015;▪ 278 sales of building land, or 9 per cent less than in 2015;▪ 795 sales of farm land, or 2 per cent less than in 2015;▪ 281 sales of forest land, or 34 per cent more than in 2015;▪ 235 sales of offices, 99 of sales of retail and service premises, and 31 sales of hospitality premises.
The relatively high increase in the number of sales of flats can be ascribed entirely to the increase in sales in the secondary market, since there are practically no new buildings or stock of unsold flats.
The average price of a used flat in a multi-dwelling building in the Savinja region last year amounted to EUR 1,050/m2, a rise of 4 per cent compared to the preceding year. In Celje, the price rose by 8 per cent to EUR 1,130/m2 (a total of 290 sales were considered; the median year of construction was 1970; the average useful floor surface was 54 m2). In the Celje Surrounding Area the average price was EUR 1,030/m2 (147; 1876; 50 m2), in the area east of Celje (Šentjur, Šmarje pri Jelšah, Podčetrtek, Rogatec) the price was EUR 960/m2 (79; 1980; 53 m2). Recorded sales in Velenje increased by 15 per cent; the average price of a used flat rose by 2 per cent to EUR 1,030/m2 (179; 1976; 55 m2).
25
In the Savinja area with a relatively extensive housing stock and an active residential houses market, sales intensified last year while house prices stagnated. The average price of a house with appertaining land in Celje was EUR 105,000 (a total of 42 sales were considered; the median construction year was 1968; the average house surface was 165 m2; the average area of surrounding land was 480 m2). The average prices of houses were: near Celje EUR 78,000 (a total of 93 sales were considered; the median construction year was 1973; the average house surface was 152 m2, the average area of appertaining land was 990 m2); in Velenje EUR 125,000 (a total of 19 sales were considered; the median construction year was 1975; the average house surface was 180 m2, the average area of appertaining land was 550 m2); in the Savinja area west of Celje and its surroundings, excluding Velenje, EUR 66,000 (a total of 41 sales were considered; the median construction year was 1963; the average house surface was 136 m2, the average area of appertaining land was 850 m2); in the Savinja area west of Celje and its surroundings the average price was EUR 67,000 (a total of 65 sales were considered; the median construction year was 1977; the average house surface was 154 m2, the average area of appertaining land was 1350 m2). The most expensive house in the Savinja area last year was sold for EUR 483,000 in the western part of Celje Surrounding Area.
Sales of building land dropped significantly in the Savinja region. Investment and construction activities have been relatively slow in the Savinja area for the past few years, so there is also not much demand for land for large construction projects. Most demand has been for land to construct houses outside urban centres. Building land reaches the highest prices in Celje and Velenje, where the offer is modest, so the number of sales is relatively low. The average price of building land near Celje was EUR 33/m2 (a total of 45 sales were considered; the average area of land was 2230 m2). The price was the same in the Savinjska dolina valley (35; 980 m2). In the area east of Celje the price was EUR 30/m2 (30;1250 m2).
The sales and prices of farm land last year did not change significantly. The farm land market was most active in the central Savinja region, where the average price compared to 2015 decreased slightly to EUR 1.90/m2 (a total of 133 sales were considered; the average area of land was 4500 m2). The prices of forest land, which saw more sales, were highest in the central Savinja region, where prices on average reached EUR 0.60/m2. The average price of forest land in the north-west part of the Savinja region was EUR 0.55/m2; in the south-east it was EUR 0.47/m2.
The Koroška region
In 2016 the following was recorded in the Koroška region:▪ 271 sales of flats, or 3 flats less than in 2015;▪ 147 sales of houses, or 56 per cent more than in 2015;▪ 93 sales of building land, or 75 per cent more than in 2015;▪ 125 sales of farm land, or 39 per cent more than in 2015;▪ 48 sales of forest land, or 17 per cent more than in 2015;▪ 34 sales of offices, 11 of sales of retail and service premises, and 7 sales of
hospitality premises.
26

27
The average price of a used flat in the Koroška area was EUR 910/m2, displaying a stagnation trend. The price in Slovenj Gradec was EUR 1,130/m2 (a total of 32 sales were considered; the median construction year was 1976; the average useful floor surface was 61 m2) and was 10 per cent higher compared to 2015. In Prevalje and Ravne na Koroškem, the average price of a used flat was EUR 910/m2 (a total of 67 sales were considered; the median construction year was 1975; the average useful floor surface was 54 m2) and did not significantly change compared to 2015.
Last year, sales of residential houses in Koroška intensified for the first time since the end of the crisis; the average price shows some rising trend.
There are no unsold new flats from the previous year in the Koroška area. No new units have been on the market for a few years. In Slovenj Gradec, technical documentation for the construction of a wooden block of 58 flats in the "S8" residential area is currently in preparation. The area will be inhabitable in 2019.
The offer of commercial real property in the Koroška region has constantly exceeded demand for the past nine years, and there have been only a few sales. This also applied to building land until the number of transactions strongly increased last year. Seventy-five per cent more sales were recorded in 2016 than in 2015. The average price was EUR 19 per square metre and was the lowest in the country, except for the Pomurje area.
There is still enough building land available for the construction of residential houses, business and industrial premises. Land for commercial and residential construction is being sold in the area of Slovenj Gradec, where prices vary from EUR 40 to 50 per square metre; in the area of Prevalje-Ravne, the price ranges from EUR 30 to 40, and in Dravska dolina valley from EUR 25 to 35 per square metre.
Sales of farm and forest land in Koroška were low last year; prices of this land have stagnated.
The Štajerska region
In 2016, the following was recorded in the Štajerska region:▪ 1876 sales of flats, or 20 per cent more than in 2015;▪ 974 sales of houses, or 19 per cent more than in 2015;▪ 490 sales of building land, or 33 per cent more than in 2015;▪ 1223 sales of farm land, or 8 per cent more than in 2015;▪ 335 sales of forest land, or 28 per cent more than in 2015;▪ 188 sales of offices, 68 of sales of retail and service premises, and 32 sales of hospitality premises.
After an eight-year crisis, the real property market in Štajerska came to life last year. The number of sales of all types of real property increased in the Štajerska region compared to 2015. The number of recorded sales of

28
Table 10: Average prices and the structure of sold used flats for selected local areas, Štajerska region, 2015 and 2016
Analysed area Indicator
MARIBOR Sample size Average price in €/m2 Median year of construction Average useful floor surface in m2
SLOVENSKA BISTRICA Sample size Average price in €/m2 Median year of construction Average useful floor surface in m2
PTUJ AND SURROUNDINGS Sample size Average price in €/m2 Median year of construction Average useful floor surface in m2
2015
7951,0501971
51 36
9701986
57 69
9901976
51
Year 2016
8791,0701970
53 46
1,0001983
56 94
9201974
53
Year
Last year, two thirds of all flats in the Štajerska area were sold in Maribor; the average price was EUR 57,000 or EUR 1,070 per square metre of useful floor surface. The recorded number of sales compared to 2015 increased by 13 per cent. In Slovenska Bistrica, the average price was around EUR 56,000 or EUR 1,000 per square metre; sales increased by 22 per cent. In Ptuj, the average price was around EUR 48,000 or EUR 920 per square metre; the increase in the number of sales was 27 per cent.
There are no new flats in the Štajerska area, and flats from failed projects were also almost sold out. Flats built for the "Maistrov dvor", "Mariborska metropola" and "Maj Rogoza" projects as well as flats in the Rače and Miklavž residential areas were almost completely sold out.
Some 980 houses with surrounding land were sold in Štajerska in 2016, or almost 20 per cent more than in 2015. The average price was EUR 82,000, or 2 per cent more than in 2015. On average, the houses were three years younger, while their size and the size of the surrounding land did not significantly change.
The average price of a house with surrounding land in Maribor was EUR 106,000 (a total of 107 sales were considered; the median construction year was 1967; the average house surface was 170 m2; the average area of surrounding land was 550 m2). The most expensive houses in the Štajerska area last year, similarly to previous years, were sold in the Maribor area named "Koroška vrata". House prices decline according to distance from Maribor, their age declines and the area of appertaining land is increases. In the wider Maribor Surrounding Area, the average price of a house was EUR 77,000 (a total of 187 sales were considered; the median construction year was 1979; the average useful floor
residential real property increased by 20 per cent. The prices of residential real property stagnated last year, and no change in prices occurred. The regional economic growth and increased purchasing power will be required.
Last year, trading in flats in multi-dwelling buildings intensified. The average price of a used flat was EUR 1,040/m2, and did not change compared to 2015.

29
surface was 130 m2, the average area of land was 1100 m2); in the area of Dravsko polje, the average price was EUR 60,000 (a total of 74 sales were considered; the median construction year was 1978; the average surface area was 120 m2, the average useful floor surface was 1500 m2); in Ptuj and surroundings, the average price was EUR 91,000 (a total of 30 sales were considered; the median construction year was 1971; the average surface area was 170 m2, the average area of land was 1100 m2).
The commercial real property market in Štajerska is still quite stagnant, since fewer sales were recorded last year than in 2015. Around two thirds of all sales of commercial real property were in Maribor. There were 188 sales of offices (136 in Maribor) recorded in the entire analysed area, and 68 sales of retail and service premises (34 in Maribor). The average price of offices in Maribor was EUR 550/m2 (a total of 31 sales were considered; the median construction year was 1968; the average surface area was 180 m2). The average price for premises in Maribor was EUR 620/m2 (a total of 9 sales were considered; the median construction year was 1991; the average surface area was 125 m2).
Last year, almost 500 sales of building land were recorded in the Štajerska area, which is one third more than in 2015. Sales were mostly limited to the sale of land for the construction of family houses, since the demand for larger plots for the construction of residential and business buildings is quite rare. Last year, only two plots were sold and intended for the construction of commercial premises, with an area of over 5000 square metres. They are located in the Tezno commercial area and in Limbuš. The average price of a building plot was EUR 36/m2, 9 per cent higher than in 2015. The highest prices for building plots were in Maribor, i.e. on average EUR 73/m2 (a total of 49 sales were considered; the average area of land was 660 m2). The highest price, i.e. over EUR 200/m2, was paid for a plot of 280 square metres located at the foot of the Pohorje Hills. In the wider surroundings of Maribor, the average price was EUR 31/m2 (a total of 93 sales were considered; the average area of land was 1020 m2); the average price in Ptuj and surroundings was EUR 42/m2 (a total of 26 sales were considered; the average area of land was 1440 m2); the price in the area of Dravsko polje was EUR 18/m2 (a total of 41 sales were considered; the average area of land was 940 m2).
In 2016, 1200 sales of farm land were recorded in the Štajerska area, or 8 per cent more than in 2015. The average price of farm land was EUR 1.50/m2, unchanged compared to the previous year. The highest prices were in the Ptuj Surrounding Area (EUR 1.95/m2), in the area between Maribor and Slovenska Bistrica (EUR 1.65/m2) and in Dravsko polje (EUR 1.55/m2). The lowest prices were in Haloze, i.e. around EUR 0.85/m2.
In 2016, 350 sales of forest land or 28 per cent more than in 2015 were recorded in the Štajerska region. The average price of forest land increased by 5 per cent and amounted to EUR 0.62/m2. The average area of land sold was 1.14 ha. Forest land in the area of Slovenske Gorice reached the highest price, i.e. EUR 0.75/m2.

30
The Pomurje region
In 2016, the following was recorded in the Pomurje region:▪ 202 sales of flats, or 3 per cent more than in 2015;▪ 368 sales of houses, or 6 per cent more than in 2015;▪ 226 sales of building land, or 22 per cent more than in 2015;▪ 1266 sales of farm land, or 3 per cent less than in 2015;▪ 244 sales of forest land, or 13 per cent more than in 2015;▪ 21 sales of offices, 22 of sales of retail and service premises, and 10 sales of hospitality premises.
In the Pomurje area, including Murska Sobota and its surroundings, Goričko, other parts of the Prekmurje region and the eastern part of Slovenske gorice, the major part of the housing stock comprises family houses, while flats in multi-dwelling buildings account for the minor part.
Sales of flats increased slightly last year, while prices show a weak growth trend, mostly due to the rising prices in Gornja Radgona and Ljutomer, which on average amounted EUR 810/m2. The highest prices were in the Murska Sobota municipality, where the average price of a used flat reached EUR 900/m2. No flats remain from failed projects in Pomurje, and there have been no major new flat construction projects for some time. Last year, a large residential project including two villa blocks with twenty flats was initiated in Murska Sobota;the project will be finished this year. The last major residential project dates back to 2008, when three blocks with 57 flats were built on Cvetkova ulica street.
Similarly to flats, last year there were also more sales of houses, with prices showing a weak rising trend. Despite this, there is more supply than demand for houses, mostly in Murska Sobota. Oversized two-family houses from the 1970s and 1980s are mostly offered for sale in Murska Sobota, and it is quite difficult to find buyers for such houses. Older houses that are not suitable for occupation which are occasionally sold for substitute building are also for sale. The average price of a house with surrounding land in Murska Sobota was EUR 67,000 (a total of 28 sales were considered; the median construction year was 1966; the average house surface was 156 m2; the average area of appertaining land was 910 m2) and is decreasing. In Goričko, where houses are usually the cheapest, because old abandoned houses are on sale, this was not the case last year. The average construction year of houses sold was 1979. With otherwise modest recorded trading, the average price was EUR 47,000 (and EUR 23,000 in the preceding year); the average year of construction was 1950. The highest price for a house in Pomurje last year (EUR 195,000) was in the Murska Sobota area and its surroundings.
After many years of stagnation in Pomurje, there was an intensification of sales of building land, especially on account of purchases for the construction of individual family houses and commercial premises. In the previous year, we

31
recorded around 220 sales of building plots, or 22 per cent more than in 2015. The average price of building land was EUR 11/m2, a decline of more than 25 per cent compared to 2015. The average area of plot sold was 1270 square metres. In Murska Sobota and its surroundings, building land was sold at prices ranging from EUR 9 to 47/m2, in Goričko at around EUR 7, in Slovenske Gorice from EUR 7 to 46/m2, and in the remaining Pomurje area from EUR 4 to 88/m2, for instance in Moravske Toplice.
There were no significant changes last year in the small and dispersed market of commercial real property in Pomurje. Generally, the supply of offices, retail and service premises still exceeds demand. Business entities prefer to rent rather than purchase.
Due to the introduction of industrial zones in Gornja Radgona, Ljutomer, Murska Sobota and Odranci, companies owned by foreigners are more interested in active investment and construction. The Carthago company, which produces caravans, built a new production hall in Odranci last year and is planning to build another one. The Arcont company, which produces residential units and prefabricated mobile units, and the Elrad company, which develops and produces electronic devices, are gradually expanding their production capacities in Gornja Radgona. The same applies to the Xal company, which produces lights in Murska Sobota.
In Pomurje, which is the largest and most agriculturally intensive area in the country, we recorded around 1260 sales of farm land last year, or 3 per cent less than in 2015. The average price of farm land was EUR 1.00/m2 and did not change compared to the preceding year. Thus, the seven-year trend of a moderately increasing average price of farm land stopped. The average area of land sold was 5,700 square metres or 600 square metres more than in 2015. In agricultural areas along the eastern part of Slovenske gorice, the average price of land was EUR 1.50/m2 (a total of 111 sales were considered; the average area of land was 9200 square metres), in Murska Sobota and its surroundings the price was EUR 1.25/m2 (a total of 39 sales were considered; the average area of land was 6200 square metres), in Goričko the price was EUR 0.65/m2 (a total of 168 sales were considered; the average area of land was 6100 square metres), in the remaining part of Prekmurje, the price was EUR 0.95/m2 (a total of 374 sales were considered; the average area of land was 4500 square metres).
There were 244 sales of forest land recorded in 2016 in the Pomurje area. Recorded sales of forest land declined by 13 per cent. The average price was EUR 0.54/m2 and was virtually the same as in 2015. The average area of forest land sold was 5700 square metres.
32
MARKET OVERVIEW ACCORDING TO TYPES OF REAL PROPERTY
Flats
In terms of number and value, the market for residential flats is the largest and most developed real property market in Slovenia. Almost half of the stock of residential flats is concentrated in the five largest cities (Ljubljana 29%, Maribor 11%, Celje 4%, Kranj and Koper 3%, respectively).
Approximately 10,600 sales of flats were recorded in the free market and at public auctions in 2016, i.e. 3.3 per cent of the national fund of flats in multi-dwelling buildings. Approximately 2 per cent were sales of unfinished flats. Some 91 per cent of finished flats were sold in the secondary market (sales of used flats), and 9 per cent in the primary market (sales of new flats).
Twenty-eight per cent of all sales of flats were recorded in Ljubljana, 12 per cent in Maribor, 9 per cent in the Ljubljana Surrounding Area, 5 per cent in the Gorenjska region (excluding Kranj and its surroundings)4, in the Coast region (excluding Koper)5 and in Celje 4 per cent respectively, and in Kranj, Koper and in the area of Maribor Surrounding Area 3 per cent, respectively6. Seventy-one per cent of sales were recorded in the aforementioned areas and 29 per cent in the remaining parts of Slovenia.
After a swift revival of the market at the beginning of 2014, the number of recorded sales of flats rose for the third consecutive year. Compared to 2015, it increased by 12 per cent. Compared to 2009 or at the peak of the first real property crisis, it was 90 per cent higher, and in comparison with 2013 or the second crisis peak, it was 70 per cent higher. Compared to the record year 2007, the number of recorded sales was 4 per cent lower.
RESIDENTIAL REAL PROPERTY
4Themarketanalysedarea"GorenjskaexcludingKranjanditssurroundings"includesthefollowingtowns:Radovljica,Tržič,Jesenice,Bled,BohinjskaBistricaandKranjskaGora.5Themarketanalysedarea"CoastexcludingKoper"includesthefollowingtowns:Portorož,Piran,IzolaandAnkaran.6Themarketanalysedarea"MariborSurroundingArea"includesthefollowingtowns:Šentilj,RačeandRuše.
At the end of 2016, approximately 848,000 residential units were recorded in Slovenia. Around 525,000 units or 62 per cent of the housing stock are flats in independent single-dwelling or two-dwelling houses, terraced houses and semi-detached houses (hereinafter: houses); around 323,000 or 38 per cent are flats in multi-dwelling buildings (hereinafter: flats).
The general market value of residential real property accounts for around 60 per cent of the value of the entire Slovenian real property fund, the general value of which is around EUR 119 billion.
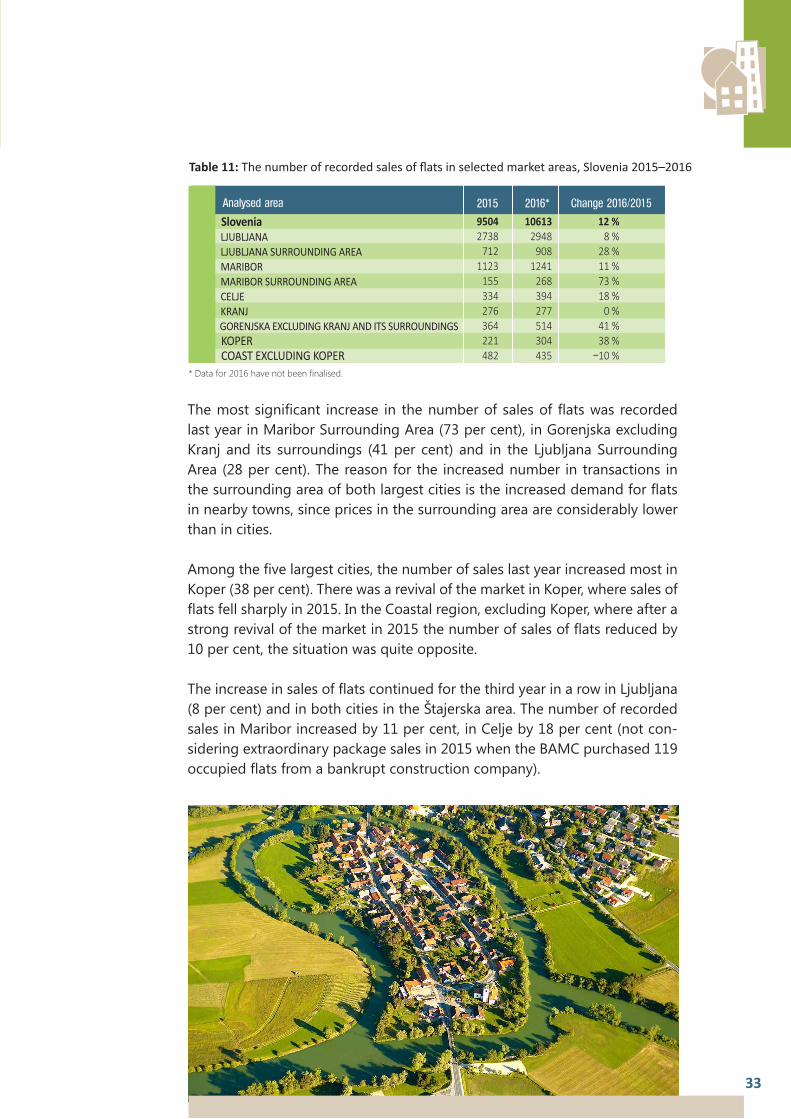
The most significant increase in the number of sales of flats was recorded last year in Maribor Surrounding Area (73 per cent), in Gorenjska excluding Kranj and its surroundings (41 per cent) and in the Ljubljana Surrounding Area (28 per cent). The reason for the increased number in transactions in the surrounding area of both largest cities is the increased demand for flats in nearby towns, since prices in the surrounding area are considerably lower than in cities. Among the five largest cities, the number of sales last year increased most in Koper (38 per cent). There was a revival of the market in Koper, where sales of flats fell sharply in 2015. In the Coastal region, excluding Koper, where after a strong revival of the market in 2015 the number of sales of flats reduced by 10 per cent, the situation was quite opposite.
The increase in sales of flats continued for the third year in a row in Ljubljana (8 per cent) and in both cities in the Štajerska area. The number of recorded sales in Maribor increased by 11 per cent, in Celje by 18 per cent (not con-sidering extraordinary package sales in 2015 when the BAMC purchased 119 occupied flats from a bankrupt construction company).
33
Table 11: The number of recorded sales of flats in selected market areas, Slovenia 2015–2016
Analysed area
Slovenia LJUBLJANA LJUBLJANA SURROUNDING AREA MARIBOR MARIBOR SURROUNDING AREA CELJE KRANJ GORENJSKA EXCLUDING KRANJ AND ITS SURROUNDINGS KOPER COAST EXCLUDING KOPER
2015
95042738
7121123
155334276364221482
2016*
106132948
9081241
268394277514304435
Change 2016/2015
12 %8 %
28 %11 %73 %18 %
0 %41 %38 %–10 %
* Data for 2016 have not been finalised.
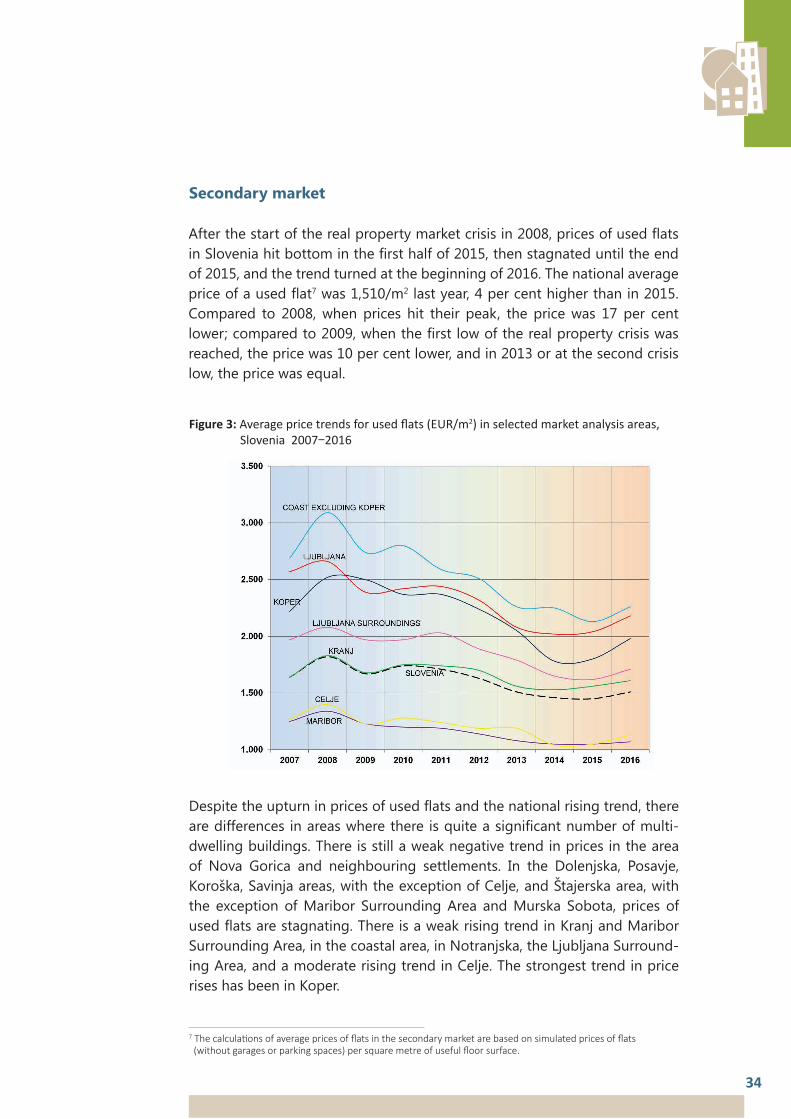
Secondary market
After the start of the real property market crisis in 2008, prices of used flats in Slovenia hit bottom in the first half of 2015, then stagnated until the end of 2015, and the trend turned at the beginning of 2016. The national average price of a used flat7 was 1,510/m2 last year, 4 per cent higher than in 2015. Compared to 2008, when prices hit their peak, the price was 17 per cent lower; compared to 2009, when the first low of the real property crisis was reached, the price was 10 per cent lower, and in 2013 or at the second crisis low, the price was equal.
Figure 3: Average price trends for used flats (EUR/m2) in selected market analysis areas, Slovenia 2007–2016
Despite the upturn in prices of used flats and the national rising trend, there are differences in areas where there is quite a significant number of multi-dwelling buildings. There is still a weak negative trend in prices in the area of Nova Gorica and neighbouring settlements. In the Dolenjska, Posavje, Koroška, Savinja areas, with the exception of Celje, and Štajerska area, with the exception of Maribor Surrounding Area and Murska Sobota, prices of used flats are stagnating. There is a weak rising trend in Kranj and Maribor Surrounding Area, in the coastal area, in Notranjska, the Ljubljana Surround-ing Area, and a moderate rising trend in Celje. The strongest trend in price rises has been in Koper.
34
7Thecalculationsofaveragepricesofflatsinthesecondarymarketarebasedonsimulatedpricesofflats(withoutgaragesorparkingspaces)persquaremetreofusefulfloorsurface.
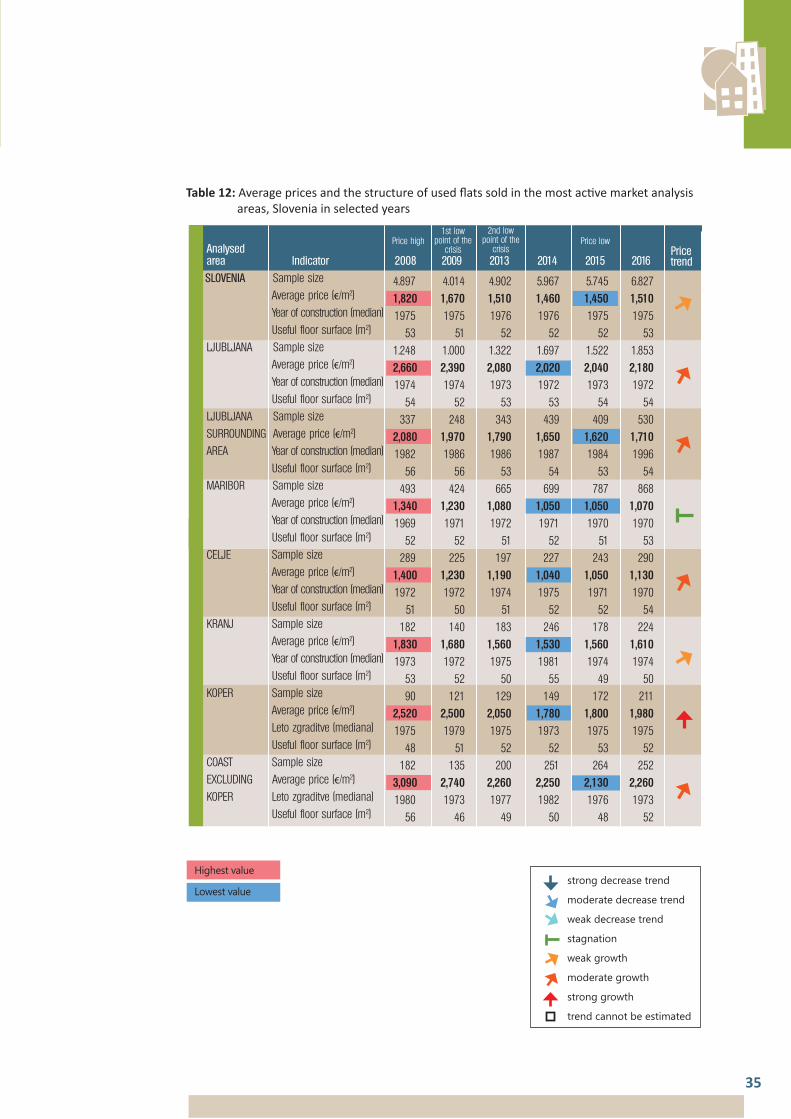
35
Analiti~no
Highest value
Lowest value
Analysed area Indicator 2008 2009 2013 2014 2015 2016
SLOVENIA Sample size Average price (€/m2) Year of construction (median) Useful floor surface (m2) LJUBLJANA Sample size Average price (€/m2) Year of construction (median) Useful floor surface (m2) LJUBLJANA Sample size SURROUNDING Average price (€/m2) AREA Year of construction (median) Useful floor surface (m2) MARIBOR Sample size Average price (€/m2) Year of construction (median) Useful floor surface (m2) CELJE Sample size Average price (€/m2) Year of construction (median) Useful floor surface (m2) KRANJ Sample size Average price (€/m2) Year of construction (median) Useful floor surface (m2) KOPER Sample size Average price (€/m2) Leto zgraditve (mediana) Useful floor surface (m2) COAST Sample size EXCLUDING Average price (€/m2) KOPER Leto zgraditve (mediana) Useful floor surface (m2)
4.897 4.014 4.902 5.967 5.745 6.827 1,820 1,670 1,510 1,460 1,450 1,510 1975 1975 1976 1976 1975 1975 53 51 52 52 52 53 1.248 1.000 1.322 1.697 1.522 1.853 2,660 2,390 2,080 2,020 2,040 2,180 1974 1974 1973 1972 1973 1972 54 52 53 53 54 54 337 248 343 439 409 530 2,080 1,970 1,790 1,650 1,620 1,710 1982 1986 1986 1987 1984 1996 56 56 53 54 53 54 493 424 665 699 787 868 1,340 1,230 1,080 1,050 1,050 1,070 1969 1971 1972 1971 1970 1970 52 52 51 52 51 53 289 225 197 227 243 290 1,400 1,230 1,190 1,040 1,050 1,130 1972 1972 1974 1975 1971 1970 51 50 51 52 52 54 182 140 183 246 178 224 1,830 1,680 1,560 1,530 1,560 1,610 1973 1972 1975 1981 1974 1974 53 52 50 55 49 50 90 121 129 149 172 211 2,520 2,500 2,050 1,780 1,800 1,980 1975 1979 1975 1973 1975 1975 48 51 52 52 53 52 182 135 200 251 264 252 3,090 2,740 2,260 2,250 2,130 2,260 1980 1973 1977 1982 1976 1973 56 46 49 50 48 52
Table 12: Average prices and the structure of used flats sold in the most active market analysis areas, Slovenia in selected years
Price high1st low
point of the crisis
Price lowPrice trend
2nd low point of the
crisis
strong decrease trend
moderate decrease trend
weak decrease trend
stagnation
weak growth
moderate growth
strong growth
trend cannot be estimated
36
Primary market
The first flats from the last two remaining failed projects "Celovški dvori" in Ljubljana and "Nokturno" in Koper were available on the market at the end of last year or at the beginning of this year. They are being sold successfully, and considering the acceptable prices and the interest of buyers, all of flats will probably be sold this year. The stock of unsold flats from previous years is therefore slowly being de-pleted. According to our estimates, around 420 flats were available in the Coastal region (including 215 flats in "Nokturno"), 230 flats in Ljubljana, in-cluding 168 flats in "Celovški dvori", and 60 in the Gorenjska region (around 20 in the "Dvorec Jelen" residential and commercial area in Kranj). Elsewhere, practically no other flats are available. The lack of new buildings can be noted in large urban centres. Despite the stock of flats remaining from previous years, demand for new flats is highest in Ljubljana and in the Coastal region. In 2016, we recorded 825 sales of new flats. Two hundred of them or 22 per cent were sold at compulsory public auctions in bankruptcy and enforcement procedures.
The average price of new flats8 sold on the free market or at voluntary pub-lic auctions was EUR 2,150/m2. The average year of construction was 2012, showing that flats of failed investors are still on sale, since actual new flats are
8Thecalculationsofaveragepricesofflatsintheprimarymarketarebasedonsimulatedpricesofflats(withoutgaragesorparkingspaces)persquaremetreofusefulfloorsurface,includingVAT.
Among the seven analysed areas where the residential market is very active, the average price of used flats last year rose by 10 per cent in Koper, which is the highest rise among the discussed areas. It rose by 8 per cent in Celje, 7 per cent in Ljubljana, 6 per cent in Ljubljana's surroundings and the coastal area, excluding Koper. Price rises below the national average were seen in Kranj (3 per cent) and in Maribor (2 per cent), which is the only one among larger cities where it is difficult to determine that the price trend changed significantly.
Last year, the average prices of used flats in the considered analysed areas were about 20 per cent lower compared to 2008. Kranj and the Coast excluding Koper are exceptions. In Kranj, after the start of the crisis, the prices dropped the least and were only approximately 12 per cent lower last year compared to the top price. In contrast, prices dropped most significantly in the Coast excluding Koper and were still 27 per cent lower last year.

37
quite rare nowadays. Flats built by failed investors and sold at compulsory public auctions were around 30 per cent cheaper (as in 2015) than those sold on the market. The average year of construction was 2009.
Last year, we recorded in Ljubljana 269 sales of flats in the primary market, which is almost 30 per cent of all such sales in the country (34 sales were made at compulsory public auctions). The average price in the free market was EUR 2,660/m2; the average year of construction was 2014. Compared to 2015, the average price of new flats in Ljubljana increased by 6 per cent and the price of used flats increased by the same percentage.
In the Ljubljana Surrounding Area, we recorded 136 sales in the free market and 11 at compulsory public auctions. The average price in the free market was EUR 1930/m2; the average year of construction was 2012.
We recorded a larger number of sales of flats in the primary market in the Coast excluding Koper, i.e. 78 in the free market and 19 at compulsory public auctions. The average price of flats in the free market was EUR 2,110/m2; the average year of construction was 2016.
Fifty-four sales in the free market were recorded in Maribor. The average price in the free market was EUR 1550/m2; the average year of construction was 2009. In the Gorenjska region, excluding Kranj and its surroundings, we recorded 45 sales (8 at compulsory public auctions). The average price in the free market was EUR 1540/m2; the average year of construction was 2010. Forty-four sales in the free market were recorded in Koper. The average price was EUR 2,170/m2, and the year of construction was 2010.

38
Houses
Residential houses with appertaining land account for the biggest share of the Slovenian real property stock. Currently, the Slovenian real property register has 525,000 recorded flats in houses that are suitable for occupation. This includes 429,000 flats in (family) houses with one or two flats (81.7%), around 50,000 in terraced houses (9.5%) and around 46,000 in semi-detached houses (8.8%).
Due to the significant individualisation and dispersed construction of family houses, we cannot refer to the housing market outside major urban centres. Such a house market exists only in large cities and their surrounding areas. The demand for vacation houses on the coast and in tourist destinations in Gorenjska is constant.
In 2016, we recorded around 5100 sales of residential houses with appertaining land in the free market and at public auctions. These included 82 per cent of family houses; 7 per cent were dwelling units in terraced houses and 11 per cent in semi-detached houses.
While the number of house sales stagnated in 2015, it rose by 16 per cent last year. Compared to 2009 or at the height of the first real property crisis, the sales of houses completely halted, while last year, the number of recorded sales was 130 per cent higher, and in comparison with 2013 or the second peak of the crisis, it was more than 40 per cent higher. Compared to record year 2007, sales of houses were approximately 10 per cent lower. Sales of houses increased more slowly than sales of flats.
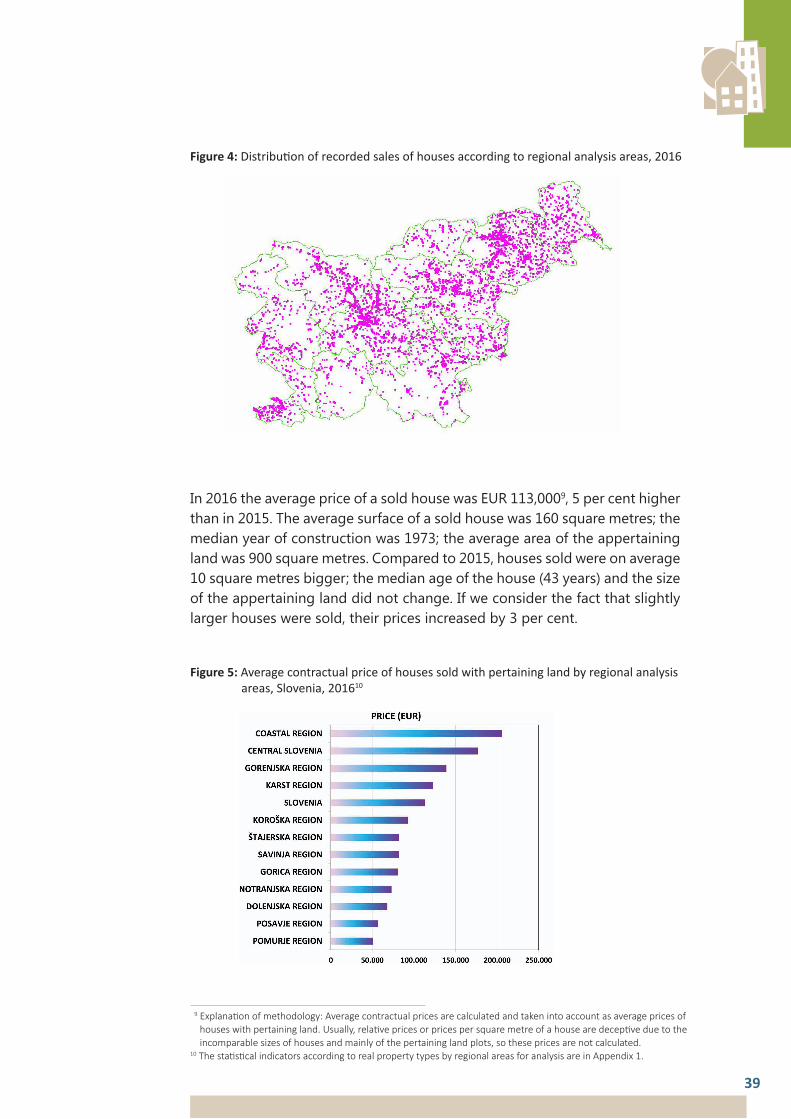
39
Figure 4: Distribution of recorded sales of houses according to regional analysis areas, 2016
9Explanationofmethodology:Averagecontractualpricesarecalculatedandtakenintoaccountasaveragepricesofhouseswithpertainingland.Usually,relativepricesorpricespersquaremetreofahousearedeceptiveduetotheincomparablesizesofhousesandmainlyofthepertaininglandplots,sothesepricesarenotcalculated.10ThestatisticalindicatorsaccordingtorealpropertytypesbyregionalareasforanalysisareinAppendix1.
In 2016 the average price of a sold house was EUR 113,0009, 5 per cent higher than in 2015. The average surface of a sold house was 160 square metres; the median year of construction was 1973; the average area of the appertaining land was 900 square metres. Compared to 2015, houses sold were on average 10 square metres bigger; the median age of the house (43 years) and the size of the appertaining land did not change. If we consider the fact that slightly larger houses were sold, their prices increased by 3 per cent.
Figure 5: Average contractual price of houses sold with pertaining land by regional analysis areas, Slovenia, 201610

40
Analysed area Indicator 2008 2009 2013 2014 2015 2016
SLOVENIA Sample size Average contractual price (€) Year of construction (median) House surface (m2) Area of land (m2) LJUBLJANA Sample size Average contractual price (€) Year of construction (median) House surface (m2) Area of land (m2) LJUBLJANA Sample size SURROUNDING Average contractual price (€) AREA Year of construction (median) House surface (m2) Area of land (m2) MARIBOR Sample size Average contractual price (€) Year of construction (median) House surface (m2) Area of land (m2) MARIBOR Sample size SURROUNDING Average contractual price (€) AREA Year of construction (median) House surface (m2) Area of land (m2)
1688 1293 1750 2144 2131 2653 144,000 128,000 114,000 105,000 108,000 113,000
1969 1972 1971 1971 1972 1973 143 142 147 151 150 160 1.050 1.140 1.050 1.050 900 900 128 79 160 197 223 258 369,000 291,000 233,000 202,000 210,000 235,000
1962 1965 1970 1966 1970 1966 164 179 161 170 180 180 470 410 440 430 410 460 134 96 169 216 229 268 226,000 207,000 172,000 153,000 155,000 166,000
1976 1984 1980 1980 1983 1982 169 175 181 178 170 180 690 580 750 630 710 670 68 46 73 94 82 84 182,000 139,000 100,000 108,000 106,000 108,000
1964 1962 1962 1970 1960 1965 145 160 158 163 160 160 460 560 520 560 510 490 124 121 80 139 123 182 112,000 117,000 99,000 88,000 86,000 87,000
1982 1982 1983 1980 1978 1979 144 135 145 155 160 150 960 1.120 980 1.250 950 890
Table 13: Average prices and the structure of sold houses with appertaining land for selected market analysis areas, Slovenia in selected years
Highest value
Lowest value
The price ratios for houses in various regional analysis areas did not change last year in comparison with 2015. On account of the prices of houses in tourist areas, the most expensive houses were sold in the Coastal region, where the average contractual price was over EUR 200,000. Due to prices in the capital, the Coastal region is followed by Central Slovenia and Gorenjska, where the average price is increased by prices in tourist areas. For the second year in a row, the prices of houses in the Karst region were above average. Here, most houses are purchased by foreigners who are prepared to pay relatively high prices . The prices in other regional analysis areas are below average. The average contractual price in these areas last year was from EUR 55,000 to 95,000. The Pomurje region is an exception, since houses with appertaining land are traditionally the cheapest there. Last year, the average contractual price there was slightly over EUR 50,000, mainly due to low prices in Haloze, Goričko, and Prekmurje, excluding Murska Sobota and its surroundings.
11ThesamplesizefortheKarstareaistoosmalltoberepresentative.
Price trend
Price high1st low
point of the crisis
Price low2nd low
point of the crisis

After a period of decline in house prices since the price peak in 2008, prices in Slovenia reached bottom in the second half of 2014. A weak rising trend in the past two years confirms that there was also an upturn in prices.
By considering the changes in age and size of houses and appertaining land sold, we estimate that compared to the price peak in 2008, prices in Ljubljana were 35 to 40 per cent lower last year, and by 30 per cent in the Ljubljana Surrounding Area. In Maribor, house prices were 40 to 45 per cent lower, and by 20 to 25 per cent in the Maribor Surrounding Area.
41
COMMERCIAL REAL PROPERTY
House price trends vary across the country. In some areas, such as Maribor, the Maribor Surrounding Area and the Savinja region excluding Celje and its surroundings, where the number of sales is increasing, prices are stagnating. Prices in the Ljubljana Surrounding Area and in the Štajerska region excluding Maribor show a moderate rising trend. The largest rises in house prices have been in Ljubljana.
Commercial real property is divided into real property for used for office activities (hereinafter: office space), real property for used for commercial, service, and hospitality activities (hereinafter: bar and retail premises), and real property for industrial activities, i.e. industrial property. Commercial real property also includes so-called special real property, which includes energy facilities, real property for acquiring mineral raw materials, and marinas, ports, and petrol stations.
The general market value of office premises is about 8 per cent of the value of the Slovenian housing stock. The general market value of retail and bar premises is 5 per cent, and industrial real property about 4 per cent of the fund value.
Special real property is very diverse with regard to how it is recorded and with regard to ownership and use. It may refer to entire buildings with one owner and pertaining land or parts of buildings in joint ownership. In addition to standard office spaces, such properties also include front offices and medical practices. Retail and bar premises include facilities ranging from commercial and business centres, large shops and sales outlets to small shops and premises for performing various trades. Hospitality premises include all types of hospitality facilities, ranging from large restaurants and cafeterias to night clubs and small cafés. Industrial real property includes all types and sizes of plants, manufacturing facilities, warehouses, ancillary rooms, and all types of small-trade craft workshops.

42
Figure 6: Distribution of recorded sales of office space according to regional analysis areas, 2016
Due to the diversity of commercial real property, the market is also very fragmented, as the formation of supply and demand for particular property (sub)types and kinds may vary significantly. There is virtually no market for special real property, and industrial real property also does not appear on the free market, with the exception of warehouses. Transfers of ownership of industrial premises and accompanying facilities mainly occur within receivership or liquidation proceedings and in the sale and acquisition of entire companies12.
In Slovenia, markets for the sale of office space and especially of retail, service, and bar premises are relatively small and concentrated in centres of large cities and in large shopping and business centres.
The market for the sale of commercial real property has strong competition from the market of property to let, as the letting of business premises often has certain advantages for economic entities. It allows greater flexibility of economic entities, because the lessee may, especially if office activities are concerned, quickly change locations, replace a lessor for a more competitive one, and allocate funds which would otherwise be used for the purchase of real property for developing his own activities.
12Thisresultsinasmallnumberofrecordedsalesofindividual(sub)typesandkindsofcommercialrealproperty,andrenderstheirstatisticalindicatorsincomparable.Forthisreason,specialrealpropertyisnotdiscussed,andstatisticalindicators are not calculated for industrial real property.

43
At the end of 2016, approximately 39 thousand parts of buildings with a total surface area of about 7.5 million square metres were recorded in the Slovenian Real Property Register under actual use as office space.
Last year, 1247 sales of office spaces were recorded, ranging from the sale of entire office buildings to the sale of smaller offices in office or apartment buildings with multiple owners. Some 73 per cent of sales were in the free market, 18 per cent at voluntary public auctions and 9 per cent at public auctions as part of enforcement or bankruptcy procedures. Eight per cent of all sales of office space or 103 sales were recorded in the primary market. Sixty-three sales were in the free market and 40 at public auctions as part of enforcement or bankruptcy procedures.
After intensive growth in 2015, trading in office space stagnated in 2016. As usual, sales of offices were concentrated in cities or commercial centres, and dispersed in urban areas across Slovenia. Last year, 32 per cent of all office space sales were in Ljubljana (397 recorded sales), 12 per cent in Maribor (121 sales), 10 per cent in Celje (119 sales), 4 per cent in Koper (55 sales) and 1 per cent in Kranj (16 sales).
Last year, the national average price of office space was EUR 1,020/m2 (300 sales were considered, the median year of construction was 1980 and the average useful floor surface was 131 m2), dropping for the third year in a row13 despite the rising price in Ljubljana. Compared to the preceding year, on average offices sold were 5 years older and 9 square metres larger. The decreasing trend in prices of office space continues due to the excessive supply and relatively low rents, so we cannot expect a shift.
Last year, the average price of office space in Ljubljana was EUR 1,420/m2 (94 sales were considered, the median year of construction was 1979 and the average useful floor surface was 168 m2), an increase of 4 per cent compared to the preceding year14. Compared to the preceding year, on average offices sold were 2 years older and 3 square metres larger in Ljubljana.
There was a major sale of office space in Ljubljana last year, i.e. the sale of around 3400 square metres of office space in the centre of Ljubljana for EUR 6.9 million. The following large transactions were also recorded in Ljubljana. The largest sale outside Ljubljana was in the centre of Celje, i.e. the sale of 1000 square metres of office space at a price of EUR 1.7 million.
Office space
13BecausethemajorityofofficespacesweresoldinLjubljanaandbecausetherearemajordifferencesinthestructureofofficespacessold,year-on-yearcomparisonsofaveragepricesatthenationallevelarenotveryusefulforinterpretation.14Becauserecordeddealsincludenotonlyofficespaces,butalsoparkingspaces,garages,convenientstoragerooms,etc.,orbecausetheyrefertoentirebuildingswithdiversepartsofbuildingsandpertainingland,orbecausethepricesofofficespacesarenotevidentfromcontractualprices,onlyonethirdofrecordedsaleswereusedtocalculatestatisticalindicators.OnlyinLjubljanaisthesizeofthestatisticalsampleconsistentlylargeenough,thusenablingcalculatedaveragepricesofofficespacesandtheiryear-on-yearcomparisonstohavesufficientinterpretativevalue.
44
15Becausethesepremisesaresodiverseandbecausetherearegreatdifferencesbetweenregions,averagepricesatthenationallevelandtheiryear-on-yearcomparisonsdonothaverealinterpretativevalue.ThesizeandrepresentativenessofthesampleisalsotoosmallforLjubljana.
At the end of 2016, approximately 26,000 parts of buildings with a total surface area of about 6.6 square kilometres were recorded in the Slovenian Real Property Register as commercial or service premises according to actual use, and approximately 9400 parts of buildings with a total surface area of about 1.9 square kilometres were recorded as hospitality (bar) premises according to actual use.
According to preliminary data, in 2016 we recorded 438 sales of retail and service premises, which includes large shops and sales outlets, small shops and premises for providing various services. Eighty-three per cent of sales were in the free market, 10 per cent at voluntary public auctions and 7 per cent at public auctions as part of enforcement or bankruptcy procedures. There were 91 sales recorded in Ljubljana, 41 in Celje, 34 in Maribor, 14 in Koper and 7 in Kranj.
We registered 178 sales of hospitality premises, of which 23 were in Ljubljana, 15 in Maribor, 9 in Celje, 6 in Novo mesto, 4 in Koper and 2 in Kranj. Nationally, 85 per cent of sales were in the free market, 8 per cent at voluntary public auctions and 7 per cent at public auctions as part of enforcement or bankruptcy procedures.
Unlike in 2015, when sales of retail and service as well as hospitality premises indicate a strong rising trend, a sharp decline was notable in the previous year. The share of sales of bar and retail premises at public auctions in enforcement or bankruptcy procedures is decreasing and the share of sales at voluntary public auctions is increasing.
Last year, the average price of retail and service premises sold was EUR 980/m2 15 (147 sales were considered, the median year of construction was 1987, the average surface was 130 m2). The average price of hospitality premises was the same (42 sales were considered, the median year of construction was 1980, the average surface was 125 m2). The prices of retail and service as well as hospitality premises in general show a downward trend.
The sale of "Planet Tuš" shopping centre in Koper was by far the most lucrative transaction last year, selling for EUR 55 million.
Bar and retail premises
45
At the end of 2016, about 169,000 parts of buildings that are actually garages and parking spaces in buildings were recorded in the Slovenian Real Property Register16. The general market value of garages and parking spaces accounts for around two per cent of the value of the Slovenian housing stock.
Garages and parking spaces are purchased both for personal use and for business purposes. Statistically, in about 90% of sales, buyers are natural entities, who presumably purchase garages or parking spaces for their own use, and in 10% of such transactions, buyers are legal entities, who presumably purchase them for their own (business) use or to let them.
The special feature of the market for garages and parking spaces in residential buildings is that they are usually sold in conjunction with a flat. The independent market for garages and parking spaces is only developed in Ljubljana and in some centres of large cities where there is a lack of privately owned outdoor parking areas near older multi-dwelling buildings. Because supply usually does not satisfy demand, the prices of garages are relatively high, and real property cycles do not affect them significantly. In 2016, there were 2000 sales of garages and more than 2500 sales of parking spaces in residential and commercial car parks. Almost four fifths of flats in the primary market and one tenth of flats in the secondary market were sold in conjunction with garages or parking spaces.
For this reason, private sales of parking spaces in buildings were negligible, and the sale of garages was noteworthy only in Ljubljana and Maribor. In Ljubljana, 590 private sales of garages and parking spaces were recorded. Their average contractual price was EUR 9,700 (88 sales were considered); the price of garages in terraced buildings or joint garages was EUR 9,500 (205) and the price of parking spaces in joint garages was EUR 11,300 (41). In Maribor, 130 independent sales of garages and parking spaces were recorded. The average price of a private garage was EUR 5,700 (47 sales were considered); the samples for garages in terraced buildings and garages as well as parking spaces in joint garages are too small for a credible statistical analysis.
GARAGES AND PARKING SPACES
16Thisclassofrealpropertyincludesgaragesasindependentorterracedbuildings,aswellasgaragesandparkingspaces as parts of buildings in commonhold ownership.
46
Building land varies according to the purpose of construction (for multi-dwelling buildings, family houses, commercial and industrial buildings, etc.), according to its administrative and legal status (level of municipal equipment, building permit), and according to the permitted level of development and height, as well as the suitability for construction with regard to the size and quality of the plot.
In Slovenia, the availability of development sites largely depends on municipal spatial plans (OPN), which must be in accordance with national spatial planning policies and the national strategic spatial plan. Current municipal spatial policies and the schedule for adopting spatial plans play a key role in the area in question with regard to the change of intended use of a plot to a development site.
In the capital and in other major urban areas, the construction of multi-dwelling buildings and residential and office buildings has been predominant for quite some time, since this is the most effective commercial use of space. In town centres, where there is virtually no new undeveloped land, there is also constant demand for developed plots for redevelopment. In suburban areas and in the countryside, demand for development sites is closely related to the tradition of self-building family houses. In these areas, demand for flats is actually redirected to demand for land plots for the construction of residential houses.
The real property crisis, which began in 2008, mainly affected the market for land for building multi-dwelling and office buildings, and only this market segment showed signs of revival last year. Due to the halted investment activity and construction for the market, sales of land for building multi-dwelling and office buildings almost came to a standstill. Building land for family houses also did not avoid the real property market crisis, since sales of this land dropped in 2008 and 2009, then slightly strengthened, and after 2011 stopped at a level relatively lower than before the crisis.
The demand for building land notably increased last year. Last year, we recorded 2800 sales of building land, which is the highest number after 2009, when, after the start of the real property market crisis, investments in building land and new buildings for the market stopped almost completely. Compared to 2015, when the recorded number of sales was the lowest, it increased by 17 per cent. Land for building residential houses accounted for almost 85 per cent of recorded sales, and almost 15 per cent of sales were of land for the construction of industrial and business premises. The number of sales of land for building large multi-dwelling buildings was still negligible.
A more or less strong growth trend in sales of building land was noticeable throughout the country, except in the Savinja and Karst areas, where a moderate declining trend in sales continued. This was mainly due to the increased demand for land for family houses, since the highest rise in the number of sales was recorded in the Štajerska region, and the highest number of sales was in the Maribor Surrounding Area.
BUILDING LAND

47
Figure 7: Distribution of recorded sales of building land according to regional analysis areas, 2016
17Becausebuildingplotsaresoheterogeneouswithregardtopurposeandadministrativestatus,theiraveragepricesandyear-on-yearcomparisonshaveaverylimitedinterpretativevalue.
Figure 8: Average price of building land (in EUR/m2) by regional analysis areas, Slovenia, 2016
In 2016, the average contractual price of building land was EUR 61/m2, one third more than in 201517. The average area of land sold last year was 1350 m2, approximately 250 m2 more than in 2015.
As usual, land prices were higher in areas where demand for building land is higher. In Central Slovenia, the average price was EUR 132/m2; compared to 2015, the price rose by one third and is still showing a strong rising trend. This is followed by the Gorenjska and Coastal regions, where the number of transactions was too small to make a reliable estimate of price trends. The price would be higher in the Coastal area if the supply of appropriate building land were greater.
The prices in other regional analysis areas are below Slovenia's average, and were mostly impacted and increased by the exceptional growth and prices realised in Ljubljana. As usual, the price of building land is lowest in the Pomurje area, (EUR 11/m2) which is due to the very low prices of land and real property there.
Price trends are quite diverse in areas where this can be reliably estimated. While the Central Slovenia and Dolenjska region show a strong rising trend in prices of building land, the Savinjska region shows a weak and the Pomurje region a relatively strong downward trend.

The markets for farm land and forest land are partly regulated. Legislation provides that offers for sale are to be publicly announced and that a pre-emptive right to purchase farm land is to be granted to entities with farmer status, and with regard to the purchase of forest land, in special cases a pre-emptive right18 is to be granted to the Republic of Slovenia.
Buyers who are not farmers, but who wish to purchase farm land or forest land, do not purchase such land for their basic use, but for other purposes (speculative, investment, etc.); therefore, they are willing to pay higher prices. Restricting such purchases enables farmers to be competitive when purchasing ‘genuine’ farm land and forest land that will be used for their basic purposes. When sales of functional land units involve unconnected persons, both markets are still treated as free competitive markets19.
At the end of 2016, approximately 7200 square kilometres of farm land were recorded in the Slovenian Real Property Register under actual use for farming purposes. Farm land covers around 35 per cent of Slovenia's surface, accounting for 6 per cent of the value of the Slovenian real property stock.
Last year, 7600 sales of farm land or three per cent more than in 2015 were recorded in Slovenia. The average price of farm land was EUR 1.05/m2, a rise of two per cent compared to the preceding year.
48
FARM AND FOREST LAND
Farm land
Figure 9: Distribution of recorded sales of farm land according to regional analysis areas, 2016
18TheForestActgrantsapre-emptiverighttopurchaseprotectedwoodlandandwoodlandwithaspecialpurposetotheRepublicofSlovenia,whichisrepresentedbytheFarmlandandForestFundoftheRepublicofSlovenia.
19Mostsalesoffarmlandaresalesofnon-functionalownershipsharesoflandplotsandsalesbetweeninvolvingpersons.

As usual, the highest average price of farm land was in the Coastal region, where the number of sales that are intended for farm production is very low. This is partially the consequence of the high price of real property in this region, and partly the consequence of purchases of farm land for recreational and speculative purposes, which cannot be completely eliminated from statistical analyses. Considering the sample size, we must also neglect the average price of farm land in the Koroška region.
Usually, the highest prices of ‘genuine’ farm land are in the Gorenjska region, and as was also the case last year (EUR 4.20/m2). For the third year in a row, average prices were lower in the Notranjska region (EUR 0.70/m2). The average price in the Pomurje and Posavje regions was EUR 1.00/m2.
Prices of farm land by regional analysis areas, with minor and major annual fluctuations due to changes in the size and quality of land sold, remain relatively stable in the long term.
49
Figure 10: Average price of farm land (in EUR/m2) by regional analysis areas, Slovenia, 2016
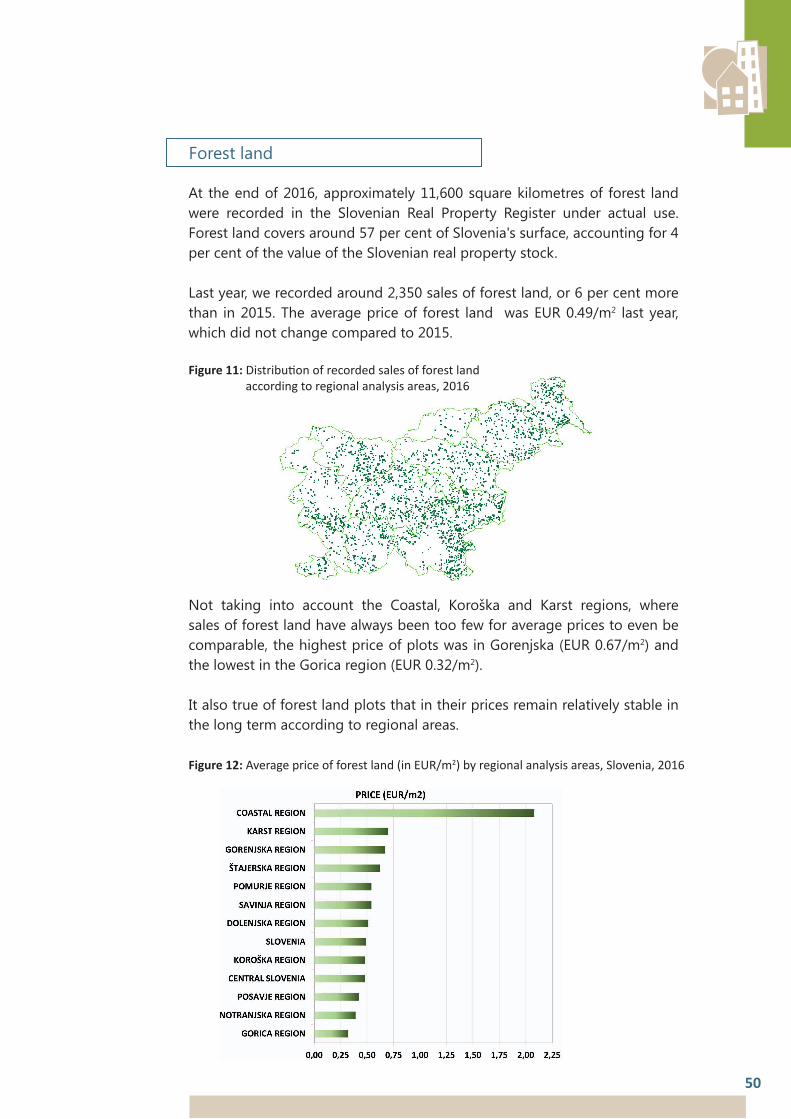
At the end of 2016, approximately 11,600 square kilometres of forest land were recorded in the Slovenian Real Property Register under actual use. Forest land covers around 57 per cent of Slovenia's surface, accounting for 4 per cent of the value of the Slovenian real property stock.
Last year, we recorded around 2,350 sales of forest land, or 6 per cent more than in 2015. The average price of forest land was EUR 0.49/m2 last year, which did not change compared to 2015.
Figure 11: Distribution of recorded sales of forest land according to regional analysis areas, 2016
50
Forest land
Figure 12: Average price of forest land (in EUR/m2) by regional analysis areas, Slovenia, 2016
Not taking into account the Coastal, Koroška and Karst regions, where sales of forest land have always been too few for average prices to even be comparable, the highest price of plots was in Gorenjska (EUR 0.67/m2) and the lowest in the Gorica region (EUR 0.32/m2).
It also true of forest land plots that in their prices remain relatively stable in the long term according to regional areas.
51
The Slovenian real property market is currently in a transition from the revival to growth phase. Although there are differences in the trading and price trends of residential real property between individual regions in the country, the number of market sales of residential real property on average almost reached the number before the real property market crisis; prices are slowly rising. Currently, the prices of apartments and residential houses are even lower than before the crisis, and this enhances the demand for residential real property, along with low interest rates and greater interest in investing in real property.
The last stock of new apartments and houses from previous years are entering the market; however, there are no more sell-outs of flats from failed projects. These remaining flats reach almost normal market prices at auctions and at other forms of public sale mostly due to the increasing demand for ‘new’ flats. There is no actual offer of new flats, and this lack indicates the beginning of a new construction cycle.
The volume of sales of building land has almost exceeded half the volume before the crisis, but the number of sales of building land is increasing relatively fast, which is a good sign of a revival of real property investment activity.
No major activity has been spotted in the commercial real property market, but there is a great probability that trading and prices will slowly follow trends in the housing market.
Considering the high growth of trading in the past three years and the number of sales, this year we can expect a gradual slowing down in the rise in sales of residential real property. We can expect further growth of the price of flats, houses, building land, while there will be some differences in various parts of the country. The fastest rise in prices can be expected in the Coastal region and the Ljubljana Surrounding Area, where there is most demand, which is slowly exceeding the supply due to the lack of new buildings. Gradual rises in prices of residential real property can also be expected in areas that stagnated last year, such as Maribor and Novo mesto Surrounding Areas, or where they fell, such as in the area of Nova Gorica.
FINAL COMMENT

52
Appendix 1
STATISTICAL INDICATORS
• The data on sales reported up to 20 February 2017 by legally determined reporters in the Real Property Market Register were considered. • Data for 2016 have not been finalised.
highest indicator valuelowest indicator value
NUMBER AND VALUE OF REAL PROPERTY SALES CONTRACTS RECORDED
The number and value of recorded sales contracts of real property in the free market and at public auctions, Slovenia, 2007–2016
Year Number (in thousands) Value (in EUR billion)
2007 28 2,32008 22 1,62009 20 1,42010 25 1,62011 25 1,52012 28 1,52013 25 1,32014 28 1,52015 29 1,72016 32 2,1
Type of the transaction Number of contracts Value of contracts in EUR million Share of total value of contracts
Sale in the free market 29,928 1,938 88.5 %Sale at public auction (voluntary) 851 58 2.6 %Sale at public auction in enforcement or bankruptcy 1,213 133 6.1 %Sale between family members or related natural and legal persons 473 31 1.4 %Financial lease (leasing) 38 27 1.2 %Right of superficies – establishment or transfer 100 2 0.1 %
The number and value of sales contracts by type of transaction, Slovenia, 2016
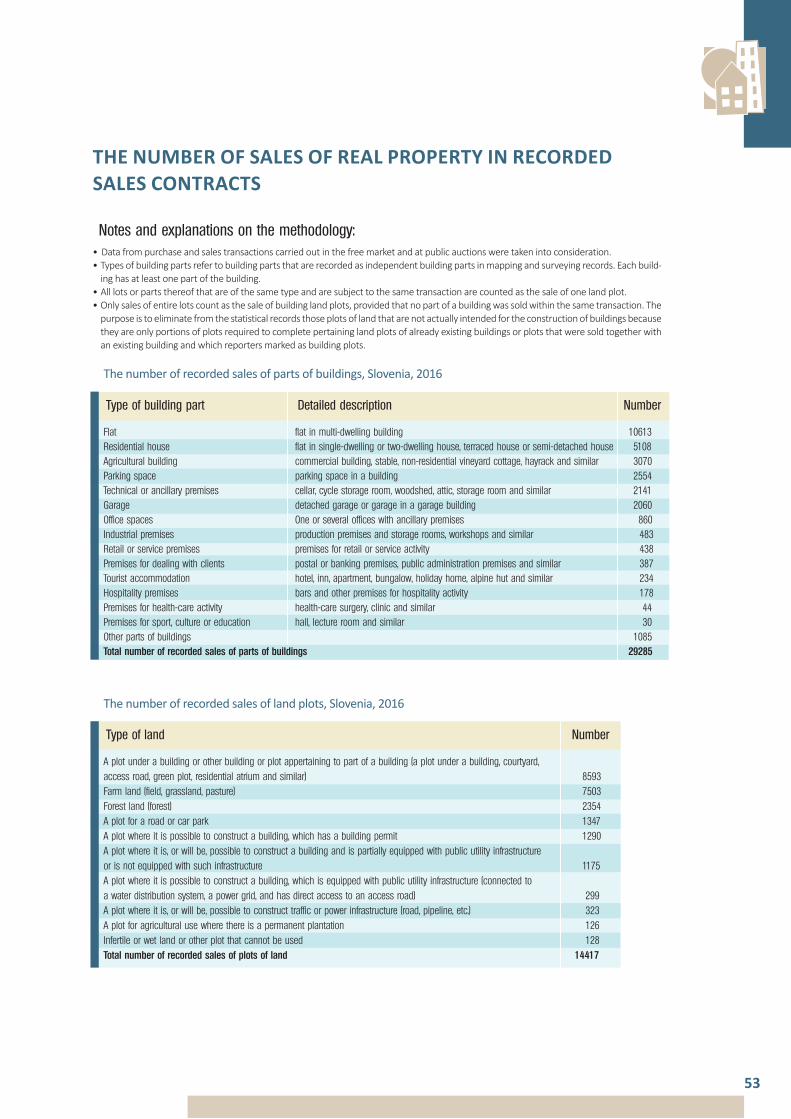
53
• Data from purchase and sales transactions carried out in the free market and at public auctions were taken into consideration.• Types of building parts refer to building parts that are recorded as independent building parts in mapping and surveying records. Each build-
ing has at least one part of the building.•Alllotsorpartsthereofthatareofthesametypeandaresubjecttothesametransactionarecountedasthesaleofonelandplot.•Onlysalesofentirelotscountasthesaleofbuildinglandplots,providedthatnopartofabuildingwassoldwithinthesametransaction.The
purpose is to eliminate from the statistical records those plots of land that are not actually intended for the construction of buildings because they are only portions of plots required to complete pertaining land plots of already existing buildings or plots that were sold together with an existing building and which reporters marked as building plots.
Notes and explanations on the methodology:
Type of building part Detailed description Number
Flat flat in multi-dwelling building 10613Residential house flat in single-dwelling or two-dwelling house, terraced house or semi-detached house 5108Agricultural building commercial building, stable, non-residential vineyard cottage, hayrack and similar 3070Parking space parking space in a building 2554Technical or ancillary premises cellar, cycle storage room, woodshed, attic, storage room and similar 2141Garage detached garage or garage in a garage building 2060Office spaces One or several offices with ancillary premises 860Industrial premises production premises and storage rooms, workshops and similar 483Retail or service premises premises for retail or service activity 438Premises for dealing with clients postal or banking premises, public administration premises and similar 387Tourist accommodation hotel, inn, apartment, bungalow, holiday home, alpine hut and similar 234Hospitality premises bars and other premises for hospitality activity 178Premises for health-care activity health-care surgery, clinic and similar 44Premises for sport, culture or education hall, lecture room and similar 30Other parts of buildings 1085Total number of recorded sales of parts of buildings 29285
The number of recorded sales of parts of buildings, Slovenia, 2016
Type of land Number
A plot under a building or other building or plot appertaining to part of a building (a plot under a building, courtyard, access road, green plot, residential atrium and similar) 8593Farm land (field, grassland, pasture) 7503Forest land (forest) 2354A plot for a road or car park 1347A plot where it is possible to construct a building, which has a building permit 1290A plot where it is, or will be, possible to construct a building and is partially equipped with public utility infrastructure or is not equipped with such infrastructure 1175A plot where it is possible to construct a building, which is equipped with public utility infrastructure (connected to a water distribution system, a power grid, and has direct access to an access road) 299A plot where it is, or will be, possible to construct traffic or power infrastructure (road, pipeline, etc.) 323A plot for agricultural use where there is a permanent plantation 126Infertile or wet land or other plot that cannot be used 128Total number of recorded sales of plots of land 14417
The number of recorded sales of land plots, Slovenia, 2016
THE NUMBER OF SALES OF REAL PROPERTY IN RECORDED SALES CONTRACTS
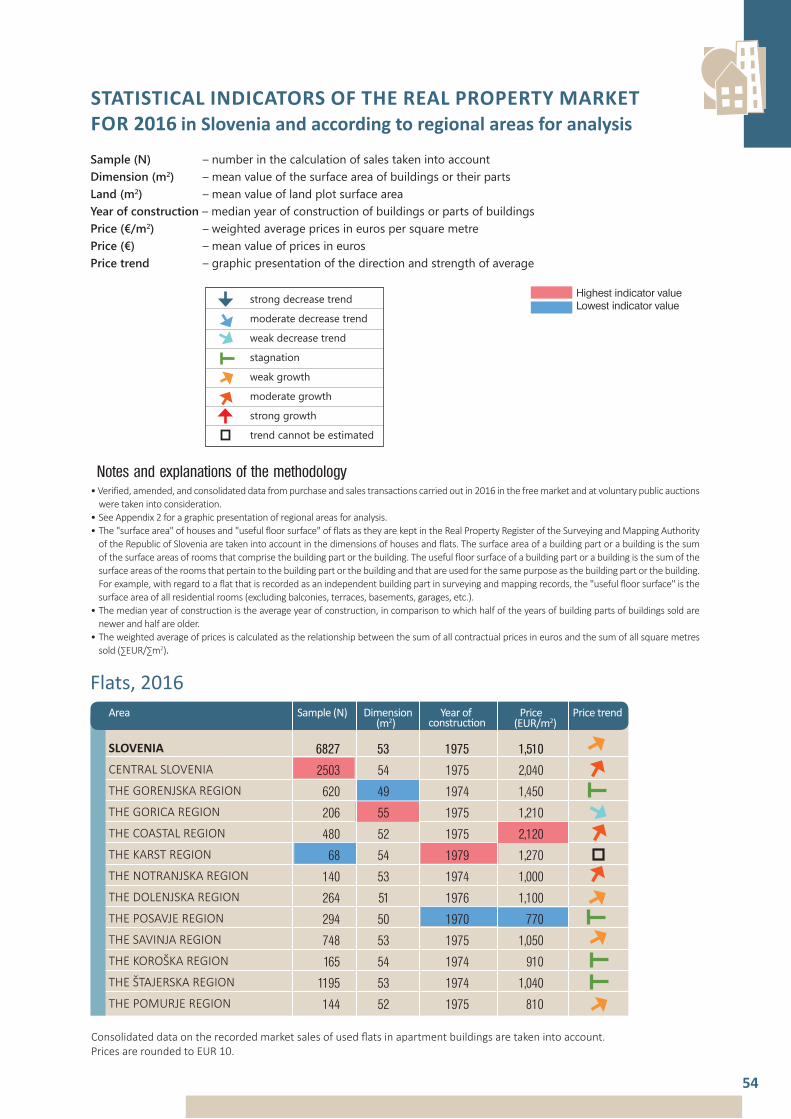
STATISTICAL INDICATORS OF THE REAL PROPERTY MARKET FOR 2016 in Slovenia and according to regional areas for analysis
Sample (N) – number in the calculation of sales taken into accountDimension (m2) – mean value of the surface area of buildings or their parts Land (m2) – mean value of land plot surface areaYear of construction – median year of construction of buildings or parts of buildingsPrice (€/m2) – weighted average prices in euros per square metre Price (€) – mean value of prices in eurosPrice trend – graphic presentation of the direction and strength of average
•Verified,amended,andconsolidateddatafrompurchaseandsalestransactionscarriedoutin2016inthefreemarketandatvoluntarypublicauctionswere taken into consideration.
•SeeAppendix2foragraphicpresentationofregionalareasforanalysis.•The"surfacearea"ofhousesand"usefulfloorsurface"offlatsastheyarekeptintheRealPropertyRegisteroftheSurveyingandMappingAuthority
of the Republic of Slovenia are taken into account in the dimensions of houses and flats. The surface area of a building part or a building is the sum of the surface areas of rooms that comprise the building part or the building. The useful floor surface of a building part or a building is the sum of the surface areas of the rooms that pertain to the building part or the building and that are used for the same purpose as the building part or the building. Forexample,withregardtoaflatthatisrecordedasanindependentbuildingpartinsurveyingandmappingrecords,the"usefulfloorsurface"isthesurfaceareaofallresidentialrooms(excludingbalconies,terraces,basements,garages,etc.).
•Themedianyearofconstructionistheaverageyearofconstruction,incomparisontowhichhalfoftheyearsofbuildingpartsofbuildingssoldarenewer and half are older.
• The weighted average of prices is calculated as the relationship between the sum of all contractual prices in euros and the sum of all square metres sold(∑EUR/∑m2).
Notes and explanations of the methodology
54
Flats, 2016Area Sample (N) Dimension Year of Price Price trend
SLOVENIA
CENTRALSLOVENIA
THEGORENJSKAREGION
THEGORICAREGION
THECOASTALREGION
THEKARSTREGION
THENOTRANJSKAREGION
THEDOLENJSKAREGION
THEPOSAVJEREGION
THESAVINJAREGION
THEKOROŠKAREGION
THEŠTAJERSKAREGION
THEPOMURJEREGION
Consolidateddataontherecordedmarketsalesofusedflatsinapartmentbuildingsaretakenintoaccount.Prices are rounded to EUR 10.
6827 53 1975 1,510
2503 54 1975 2,040
620 49 1974 1,450
206 55 1975 1,210
480 52 1975 2,120
68 54 1979 1,270
140 53 1974 1,000
264 51 1976 1,100
294 50 1970 770
748 53 1975 1,050
165 54 1974 910
1195 53 1974 1,040
144 52 1975 810
Highest indicator value Lowest indicator value
construction(m2) (EUR/m2)
strong decrease trend
moderate decrease trend
weak decrease trend
stagnation
weak growth
moderate growth
strong growth
trend cannot be estimated

55
Residential houses with land, 2016
Consolidateddataonrecordedmarketsalesofcompletedsingle-dwellingandtwo-dwellinghouses(detachedhouses,terracedhouses,andsemi-detachedhouses)withpertaininglandplotsaretakenintoaccount.Housedimensionsandsurfaceareasofpertaining land are rounded to 10 m2 and prices are rounded to EUR 1000.
Area Sample (N) (m2) Land (m2) Price (EUR) Price trend
SLOVENIA
CENTRALSLOVENIA
THEGORENJSKAREGION
THEGORICAREGION
THECOASTALREGION
THEKARSTREGION
THENOTRANJSKAREGION
THEDOLENJSKAREGION
THEPOSAVJEREGION
THESAVINJAREGION
THEKOROŠKAREGION
THEŠTAJERSKAREGION
THEPOMURJEREGION
2653 160 1973 900 113,000
681 170 1975 660 177,000
234 170 1972 680 139,000
154 150 1946 720 81,000
122 150 1966 430 206,000
48 160 1912 860 123,000
48 150 1939 920 73,000
229 150 1975 1320 68,000
134 140 1972 1120 57,000
276 160 1972 930 82,000
61 180 1982 830 93,000
482 150 1976 1060 82,000
184 130 1970 1470 51,000
Land for building construction, 2016
Consolidateddataonrecordedmarketsalesofplotsofbuildingland,regardlessoftheiradministrativeorlegalstatus,aretakenintoaccount.Surfaceareasofplotsareroundedto10m2.
Area Sample (N) Price (EUR/m2) Price trend
SLOVENIA
CENTRALSLOVENIA
THEGORENJSKAREGION
THEGORICAREGION
THECOASTALREGION
THEKARSTREGION
THENOTRANJSKAREGION
THEDOLENJSKAREGION
THEPOSAVJEREGION
THESAVINJAREGION
THEKOROŠKAREGION
THEŠTAJERSKAREGION
THEPOMURJEREGION
1527 1350 61
409 1320 132
83 1840 102
53 1760 29
68 1210 77
37 1780 28
58 780 25
171 1670 24
59 1260 26
125 1540 33
66 1630 19
262 980 36
136 1270 11
Land (m2)
Dimension Year of construction

56
Farm land, 2016
Consolidateddataonrecordedmarketsalesoffarmland,excludingpermanentplantations,aretakenintoaccount.Surface areas of plots are rounded to 100 m2 and prices are rounded to 10 cents.
Area Sample (N) Price (EUR/m2) Price trend
SLOVENIA
CENTRALSLOVENIA
THEGORENJSKAREGION
THEGORICAREGION
THECOASTALREGION
THEKARSTREGION
THENOTRANJSKAREGION
THEDOLENJSKAREGION
THEPOSAVJEREGION
THESAVINJAREGION
THEKOROŠKAREGION
THEŠTAJERSKAREGION
THEPOMURJEREGION
2812 5300 1.50
256 6000 2.10
78 5400 4.20
123 3400 1.80
63 1900 5.70
86 3400 1.10
138 3500 0.70
464 4100 1.20
220 5500 1.00
213 5000 1.60
17 6500 2.10
461 7000 1.50
692 5700 1.00
Forest land, 2016
Consolidated data on recorded market sales of forest land plots are taken into ac-count. Surface areas of plots are rounded to 100 m2.
Area Sample (N) Price (EUR/m2) Price trend
SLOVENIA
CENTRALSLOVENIA
THEGORENJSKAREGION
THEGORICAREGION
THECOASTALREGION
THEKARSTREGION
THENOTRANJSKAREGION
THEDOLENJSKAREGION
THEPOSAVJEREGION
THESAVINJAREGION
THEKOROŠKAREGION
THEŠTAJERSKAREGION
THEPOMURJEREGION
1145 14200 0.49
172 17000 0.48
60 16500 0.67
92 18200 0.32
9 3500 2.08
28 8000 0.70
96 15700 0.39
246 13600 0.51
96 15100 0.42
88 12200 0.54
13 72000 0.48
121 11400 0.62
124 5700 0.54
Land (m2)
Land (m2)

57
Appendix 2:
IMAGES OF AREAS FOR ANALYSIS 1
REGIONAL ANALYSIS AREAS
MARKET ANALYSIS AREAS
1 Regional analysis areas are determined as areas of market impact of urban regional centres and the area between them. Their borders usually run along thebordersofsettlementsasdeterminedintheSlovenianRegisterofSpatialUnits.Regionalanalysisareasarefurtherdividedintomarketanalysisareas,whicharecomprisedofregionalurbancentres,theirsurroundingareasandtheremainingregionalanalysisareas.

58
Appendix 3:
RECORDED SALES OF REAL PROPERTY TO FOREIGNERS IN 2016
Notes and explanations on the methodology• The data on recorded sales of real property to foreigners are based on data from the Real Property Market
Register managed by the Surveying and Mapping Authority of the Republic of Slovenia. The number of recorded sales may be lower than the number of actual transactions.
• Sales of real property to foreigners include all transactions where the buyer is a natural entity with non-Slovenian citizenship or a legal person whose head office is not in Slovenia, regardless of the vendor's citizenship.
• No sales of real property to domestic legal entities owned by foreign natural or legal persons can be identified in the Real Property Market Register, so they are not included in the statistics. Purchasing real property by establishing, buying or taking over a Slovenian company is an established method of purchase, especially for foreigners from non-EU countries with which Slovenia does not have a concluded agreement on reciprocity with regard to real property purchase.
Table 1: The number of recorded sales by types of real property, Slovenia 2016
Real property type
Houses
Flats
Building land
Farm land
Forest land
Total
5108 166 20 3.6
10613 141 25 1.6
2764 25 4 1.0
7629 109 8 1.5
2354 25 3 1.2
28468 466 60 1.8
In 2016, foreigners’ purchases of real property in Slovenia increased conside-rably, since 28 per cent more purchases were recorded compared to 2015. Most purchases in border areas are by foreigners from neighbouring countries. Compared to 2015, the share of purchases of real property increased from 1.6 to 1.8 per cent. Foreigners most frequently purchased a house or flat, while purchases of land plots were negligible.
*Buyers have different foreign citizenships or Slovenian and foreign citizenship. **Buyers with mixed citizenship are considered in the calculation of foreign purchases with regard to all purchases.
Number of all sales
Number of sales to foreigners
Number of sales to buyers with mixed citizenship*
Recorded sales of real property to foreigners
Share of purchases by foreigners (in %)**

59
Table 2: The number of recorded sales by types of real property with regard to buyers' citizenship, Slovenia 2015–2016
COUNTRY 2015 2016 2015 2016 2015 2016 2015 2016 2015 2016 2015 2016 2015 2016
Italy
Austria
Germany
Great Britain
Croatia
Bulgaria
Netherlands
Other EU countries
Serbia
Macedonia
UnitedStatesofAmerica
Other countries
Mixedcitizenship
Total
7 14 35 39 12 5 16 21 4 3 74 82 18.0 15.6
13 12 15 13 2 4 12 26 2 6 44 61 10.7 11.6
7 11 12 20 7 4 5 19 6 31 60 7.5 11.4
4 14 16 26 2 3 1 11 3 23 57 5.6 10.8
17 24 10 9 8 7 11 1 1 43 45 10.4 8.6
10 9 3 9 13 18 3.2 3.4
1 1 4 3 3 2 3 1 10 8 2.4 1.5
16 9 14 21 2 6 4 13 3 36 52 8.7 9.9
15 20 1 5 1 16 26 3.9 4.9
15 12 5 6 20 18 4.9 3.4
1 7 3 1 2 2 1 10 7 2.4 1.3
18 14 12 12 5 2 2 3 1 37 32 9.0 6.1
20 25 18 20 8 4 8 8 1 3 55 60 13.3 11.4
143 166 152 186 50 29 59 117 8 28 412 526 100.0 100.0
Regarding the type of real property, in 2016 foreigners mostly purchased houses with appertaining land. Purchases of houses accounted for 35 per cent of all foreign purchases of real property in Slovenia. Purchases of flats accounted for 32 per cent, purchases of farm land 22 per cent, purchases of building land 6 per cent and purchases of forest land 5 per cent of all purchases of real property by foreigners in Slovenia. Compared to 2015, the number of foreign purchases of building land decreased.
Flats Houses Building land Farm land Forest landTotal real property
Share of purchases by foreigners (in %)
With regard to the citizenship of the country of the buyer's head office among foreign buyers, Italians bought the largest share of real property, although their share was smaller than in 2015. They were followed by Austrians and Germans. According to the share of foreign purchases of real property, Croatians dropped from third to fifth place. Besides Germans, Croatians were also overtaken by buyers from Great Britain. No other share of foreigners reached 10 per cent. Citizens of each of the first five states on the scale purchased more real property last year than in 2015. The number of purchases by foreigners from other EU countries and from Serbia also increased. The share of purchases of foreigners with mixed citizenship was smaller.
Except for Italians, who remain loyal to tradition and purchase real property almost exclusively in the Coastal and Karst regions, buyers from other countries are more dispersed across Slovenia. The British, who purchased houses mainly in Prekmurje years ago, purchased only three units in the Pomurje region last year. They showed greater interest in the Gorenjska region (ten units) and

60
The Karst region was again the most interesting area for purchases of houses with appertaining land by foreigners, since we recorded 35 purchases by foreign citizens and 2 purchases by buyers with mixed citizenship. In 2015, we recorded 19 purchases by foreigners, or less than one fifth of all purchases. Thirty-one houses in the Karst area were purchased by Italians, who are the most frequent buyers in this region. Twenty-two foreigners and 2 buyers with mixed citizenship purchased houses in the Gorica area, which is more than in 2015 and is one eighth of all recorded house sales in this area. Eight buyers were British, followed by Belgians, who purchased four houses. Five Austrian buyers and four German buyers purchased houses in the Pomurje region.
the Gorica region (eight units). Real property in the Štajerska and Pomurje regions attracted Germans and Austrians; Germans also purchased many units in the Gorenjska region, while Austrians favoured the Coastal region. In the main, Maribor and Ljubljana were attractive to Serbians. Australians also bought six units of real property (two in Ljubljana and in Gorenjska, one in Kranj and in Celje, respectively).
Table 3: Recorded number of sales of houses with appertaining land to foreigners according to selected market analysis areas1,Slovenia2016
Analysed area
KARST AREA
GORICA REGION EXCLUDING NOVA GORICA AND SURROUNDINGS
GORENJSKA EXCLUDING KRANJ AND SURROUNDINGS
COAST EXCLUDING KOPER
POMURJE REGION EXCLUDING MURSKA SOBOTA AND SURROUNDINGS
COASTAL REGION EXCLUDING KOPER AND THE COAST
POSAVJE AREA
ŠTAJERSKA AREA EXCLUDING MARIBOR AND SURROUNDINGS
LJUBLJANA
MARIBOR SURROUNDING AREA
MURSKA SOBOTA SURROUNDING AREA
NOTRANJSKA AREA
OTHER PARTS OF SLOVENI
Total Slovenia
96 37 38.5
187 24 12.8
225 18 8.0
102 8 7.8
208 16 7.7
105 4 3.8
280 7 2.5
436 10 2.3
403 9 2.2
363 8 2.2
137 3 2.2
102 2 2.0
2464 40 1.6
5108 186 3.6
1SeeAppendix2forthefigureshowingmarketanalysisareas.
Purchases of residential real property by foreigners
Last year, we recorded 186 purchases of houses by foreigners, comprising 3.6 per cent of all purchases of houses in Slovenia.
* Buyers with mixed citizenship are considered in the calculation of foreign purchases with regard to all purchases.
Number of all sales
Number of sales to foreigners*
Share of purchases by foreigners (in %)

Table 4: Recorded number of sales of flats to foreigners according to selected market analysis areas, Slovenia 2016
Analysed area
COAST EXCLUDING KOPER
GORENJSKA AREA EXCLUDING KRANJ AND SURROUNDINGS
KOPER
MARIBOR
LJUBLJANA
OTHER PARTS OF SLOVENIA
Total Slovenia
435 22 5.1
514 17 3.3
304 9 3.0
1241 25 2.0
2948 38 1.3
5171 55 1.1
10613 166 1.6
Last year, we recorded 166 purchases of flats in multi-dwelling buildings by foreigners, accounting for 1.6 per cent of all purchases of flats in Slovenia.
Last year, the same as in 2015, the largest share of foreign buyers of flats was in the Coast excluding Koper. The share of foreign purchases amounted to more than 5 per cent of all recorded sales of flats in this area. Foreigners purchased 19 flats, of whom seven came from Austria and three from Italy. Three flats were purchased by buyers with mixed citizenship. Flats were purchased in the Coastal region mostly by Russians via their companies founded in Slovenia. They also purchased seven flats: four in Piran municipality and three in Izola.
Most flats were purchased by foreigners in Ljubljana and Maribor, where their share is significantly lower with regard to the number of all sales.
In the Coastal, Karst and Notranjska regions, fifteen houses were purchased by foreign citizens via their companies established in Slovenia (these purchases have not been included in the statistics). Most of them were Russians (11); three founders of companies came from Ukraine and one from Macedonia. It is typical of Russians that they purchase real property in the area of Piran municipality. Prices paid for real property are highest in this area. Russians also immediately start significantly renovating property, regardless of how much they paid for it. By considering foreign purchases via Slovenian companies, they would account for more than one fifth of all house sales in the Coast excluding Koper.
61
* Buyers with mixed citizenship are considered in the calculation of foreign purchases with regard to all purchases.
Number of all sales
Number of sales to foreigners*
Share of purchases by foreigners (in %)

62
Purchases of land plots by foreigners
The absolute number of purchases of land plots by foreigners in Slovenia is relatively small. By considering buyers with mixed citizenship, last year we recorded the highest number of purchases of farm land by foreigners, i.e. 117, approximately 1.5 per cent of all recorded sales of farm land in the country. The largest share of purchases of farm land by foreigners was in the Karst area, amounting to 6 per cent of all recorded sales and purchases of farm land in this area. All 13 foreign buyers except one were Italians. According to the number of purchases, most purchases of farm land by foreigners were recorded in the Pomurje region, excluding Murska Sobota and its surroundings. Foreign buyers purchased 30 land plots; 14 buyers were Austrian and 5 were German; they were followed by Italians, with four purchases. Slovenian companies with foreign owners are also purchasing farm land in this area; however, it is impossible to estimate the volume of these purchases, since they are not evident from the Real Property Market Register.
By considering buyers with mixed citizenship, last year we recorded only 29 purchases of building land by foreigners, making up approximately one per cent of all recorded sales and purchases in the country. Purchases were dispersed across Slovenia.
We recorded only 28 purchases of forest land by foreigners, which is 1.2 per cent of all sales in Slovenia. Purchases of forest land by foreigners were also dispersed across Slovenia.

Surveying and Mapping Authority of the Republic of Slovenia
May 2017
2016