report on the state of water - ammk-rks.net · report on the state of water 2015 prishtinë, 2015...
TRANSCRIPT

REPORT ON THE STATE OF WATER
2015
Prishtinë, 2015
MINISTRY OF ENVIRONMENT AND SPATIAL PLANNINGKOSOVO ENVIRONMENTAL PROTECTION AGENCY

2

3
Foreword
Protection of water resources is a moral, ethical and human obligation of everyone as water is an essential factor to life, health, food, culture, production and renewable energy. The need for fresh water is one of the greatest environmental issues globally today.Data show that more than 1.2 billion people worldwide do not have access to drinking water, while approximately 3 billion people (half the population of the world) do not have appropriate sanitary services. Over 200 diseases originate from polluted water and approximately 6.000 people a day die because of diarrheal diseases. According to the World Health Organization, about 5 million people die every year because of polluted water consumption. In view of the
current urbanization trend in the world, until 2025 approximately 3 billion people will need water supply and more than 4 billion will need to access wastewater services. In Kosovo, as in many other countries of the world, the human health and well-being is increasingly threatened by poor water quality or lack of fresh water. Based on data provided by our institutions, approximately 80 % of the population in Kosovo is supplied from the public water supply system and about 60 % of the population has access to the public sewerage system. Protection, preservation and monitoring of the quality of water resources is one of the greatest environmental challenges of our society. Industrial development, urbanization and intensive agriculture are some of the factors causing water pollution. Despite continuous efforts, uncontrolled use of water resources and damage of river beds remain as factors contributing to the degradation of our water resources. Lack of groundwater monitoring is another problem demanding solution. Special attention and importance should be placed upon water infrastructure improvement, construction of wastewater treatment plants and climatic change adaptation in the water sector. The MESP will continue its commitment to completing the required legislation for the water sector and transpositioning it with European Union directives, while approval of the National Water Strategy remains one of the key priorities of the sector.
Dr. Ferid Agani, Minister of MESP

4
5
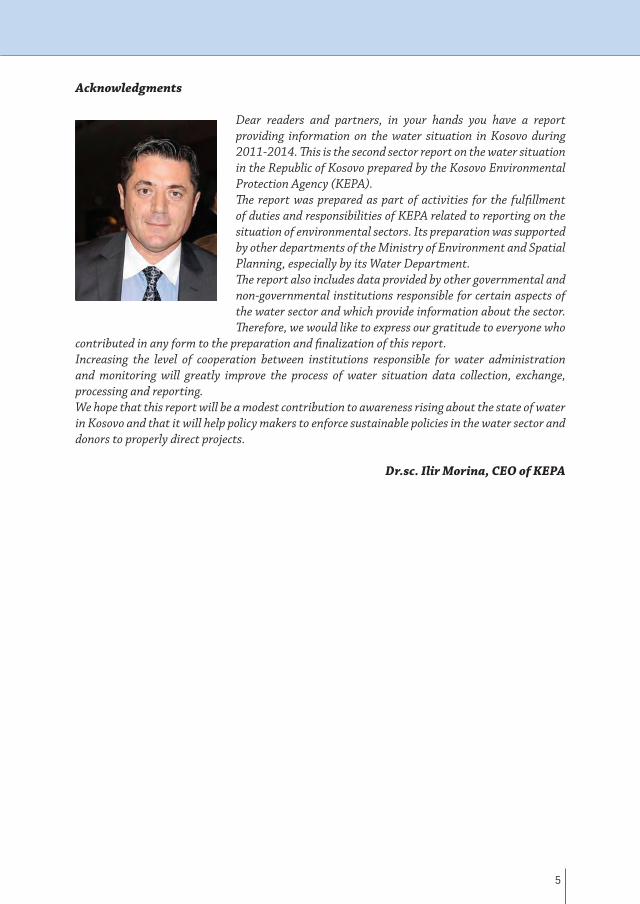
Acknowledgments
Dear readers and partners, in your hands you have a report providing information on the water situation in Kosovo during 2011-2014. This is the second sector report on the water situation in the Republic of Kosovo prepared by the Kosovo Environmental Protection Agency (KEPA).The report was prepared as part of activities for the fulfillment of duties and responsibilities of KEPA related to reporting on the situation of environmental sectors. Its preparation was supported by other departments of the Ministry of Environment and Spatial Planning, especially by its Water Department.The report also includes data provided by other governmental and non-governmental institutions responsible for certain aspects of the water sector and which provide information about the sector. Therefore, we would like to express our gratitude to everyone who
contributed in any form to the preparation and finalization of this report. Increasing the level of cooperation between institutions responsible for water administration and monitoring will greatly improve the process of water situation data collection, exchange, processing and reporting. We hope that this report will be a modest contribution to awareness rising about the state of water in Kosovo and that it will help policy makers to enforce sustainable policies in the water sector and donors to properly direct projects.
Dr.sc. Ilir Morina, CEO of KEPA
6
Abreviations
KEPA Kosovo Environmental Protection AgencyKSA Kosovo Statistical AgencyEU European Union WFD Water Framework Directrive WD Water Department EC European Commision TH Total HardnessGIZ German Society for International CooperationHEC HydrocentralKHI Kosovo Himdrometeorological InstituteNIPH National Institute of Public HealthKGS Kosovo Geological ServiceWWRO Water and Wastewater Regulatory OfficeMESP Ministry of Environment and Spatial PlanningSHUKOS Association of Water and Wastewater Companies of KosovoIPA Instrument for Preaccesion IPPC Integrated Pollution Prevention and Control KEC Kosovo Energy Corporation KFOR Kosovo Forces KFW German Development BankIWC Inter-Ministerial Water CouncilRWC Regional Water Companies MED Ministry of Economical Development PI Public Interprise WHO World Health Organisation EO Economical OperatorPH Hydrogen yon concentrationNP National Park KEAP Kosovo Environmental Action Plan SHA Joint StockSHBO5 Biological Oxygene DemandSHKO Chemica Oxygene DemandTC ThermocentralTCA Thermocentral ATCB Thermocentral BAI Administrativ InstructionUNDP United Nations Development ProgrammVML Maximal Alloved valuesVMM Monthly average valuesVMV Annual average valuesSPA Special Protected Water Area

7
Content
1. INTRODUCTION ...............................................................................................................91.1. Introduction ............................................................................................................................................91.2. General information about Kosovo ............................................................................................10
1.2.1. Geographical position ........................................................................................................101.2.2. Relief .......................................................................................................................................... 101.2.3. Climate ...................................................................................................................................... 101.2.4. Hydrography ..........................................................................................................................111.2.5. Precipitation ............................................................................................................................111.2.6. Demographic structure ......................................................................................................12
2. LEGAL AND STRATEGIC FRAMEWORK ........................................................................132.1. Legal and Strategic Framework ...................................................................................................13
2.1.1. Legal infrastructure in the water ..................................................................................... 132.1.2. Environmental Protection Strategy ................................................................................ 152.1.3. Kosovo National Water Draft Strategy ......................................................................... 152.1.4. Water monitoring plan .......................................................................................................162.1.5. European Union water directives ................................................................................... 16
2.2. Institutional Structure ......................................................................................................................182.2.1. Ministry of Environment and Spatial Planning .......................................................... 182.2.2. Kosovo Environmental Protection Agency (KEPA) ................................................. 182.2.3. National Institute of Public Health (NIPH) .................................................................. 182.2.4. Kosovo Geological Service (KGS).................................................................................... 192.2.5. Water and Wastewater Regulatory Office (WWRO) ............................................... 192.2.6. Local governments - Municipalities .............................................................................. 202.2.7. Publicly owned enterprises / Regional water companies ..................................... 202.2.8. Association of Water and Wastewater Companies of Kosovo (AWWCK) ...... 21
3. SURFACE WATER ...........................................................................................................233.1. Surface Water ......................................................................................................................................23
3.1.1. Rivers and river basins ........................................................................................................233.1.2. Artificial lakes .........................................................................................................................263.1.3. Natural lakes ...........................................................................................................................29
3.2. Groundwater .......................................................................................................................................303.3. Thermo-Mineral Water ....................................................................................................................313.4. Wetlands ...............................................................................................................................................32
4. WATER USE AND WATER RESOURCES ........................................................................354.1. Use of Water for Drinking and household ..............................................................................354.2. Water use for irrigation ...................................................................................................................374.3. Water use in industry and energetics ........................................................................................384.4. Water use for hydro-energy ..........................................................................................................404.5. Exploitation of inert materials in rivers .....................................................................................424.6. Water permits .....................................................................................................................................45
5. FLOODS ...........................................................................................................................475.1. Floods ...................................................................................................................................................475.2. Flood early warning ..........................................................................................................................535.3. Erosion ...................................................................................................................................................55
6. REPORT ON THE STATE OF WATER .............................................................................576.1. Organization of surface water monitoring ..............................................................................57

8
6.1.1. Basin of Drini i Bardhe.........................................................................................................59 6.1.2. Basin of Iber............................................................................................................................60 6.1.3. Basin of Morava e Binces and Lepenc...........................................................................61
6.2. Assessment and monitoring results ...........................................................................................62 6.2.4. Heavy metals monitoring and assessment..................................................................77
6.3. Monitoring of river water quantity .............................................................................................826.4. Drinking water monitoring..............................................................................................................83
7. WATER DISCHARGES .....................................................................................................877.1. Urban wastewater discharge .........................................................................................................877.2. Wastewater discharge from agriculture ...................................................................................897.3. Wastewater discharge from industry .........................................................................................897.4. Wastewater treatment .....................................................................................................................89
8. FEES FOR WATER USE AND WATER SERVICES ...........................................................918.1. Water and wastewater service fees ............................................................................................918.2. Water use fees ....................................................................................................................................92
9. WATER SECTOR INVESTMENTS AND PROJECTS .......................................................959.1. Water sector investments ...............................................................................................................959.2. Regional and transboundary projects .......................................................................................97
10. CONCLUSIONS AND RECOMMENDATIONS ...............................................................9911. REFERENCES ...................................................................................................................1012. ANNEXES ..................................................................................................................... 101
9
INTR
OD
UCTI
ON
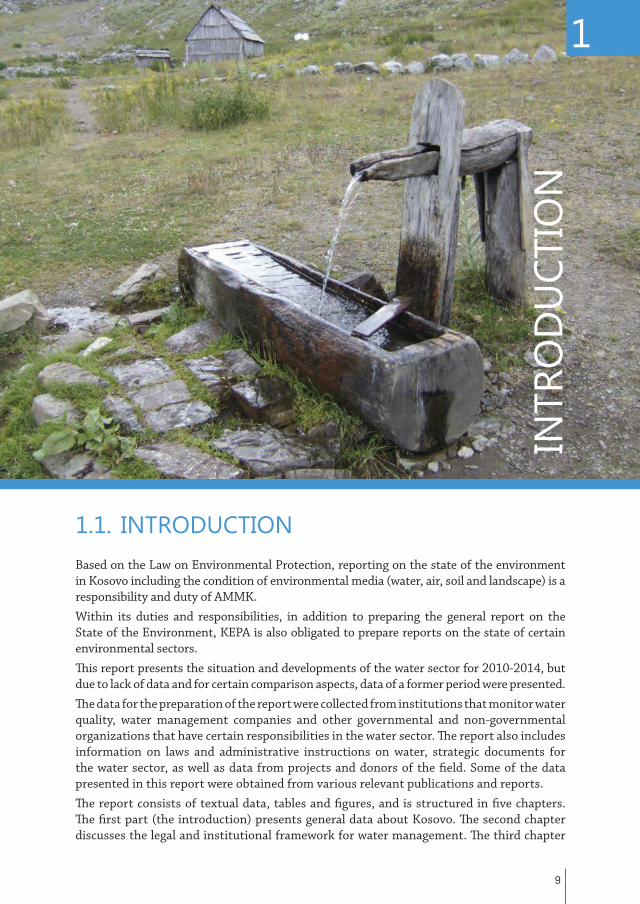
1.1. INTRODUCTIONBased on the Law on Environmental Protection, reporting on the state of the environment in Kosovo including the condition of environmental media (water, air, soil and landscape) is a responsibility and duty of AMMK. Within its duties and responsibilities, in addition to preparing the general report on the State of the Environment, KEPA is also obligated to prepare reports on the state of certain environmental sectors. This report presents the situation and developments of the water sector for 2010-2014, but due to lack of data and for certain comparison aspects, data of a former period were presented. The data for the preparation of the report were collected from institutions that monitor water quality, water management companies and other governmental and non-governmental organizations that have certain responsibilities in the water sector. The report also includes information on laws and administrative instructions on water, strategic documents for the water sector, as well as data from projects and donors of the field. Some of the data presented in this report were obtained from various relevant publications and reports.The report consists of textual data, tables and figures, and is structured in five chapters. The first part (the introduction) presents general data about Kosovo. The second chapter discusses the legal and institutional framework for water management. The third chapter
1

10
provides general information on water resources.The fourth chapter provides information on the use of water in various sectors such as households, agriculture, industry, energy production, etc. The fifth chapter of the report addresses the issue of water pollution and its treatment, while the sixth chapter presents information about water quality based on monitoring of surface and groundwater. Finally, the report also contains a chapter on general aspects related to water management, such as fees, projects and investments in the water sector. The report goes on to provide, in a separate chapter, conclusions and measures taken to improve the situation.
1.2. GENERAL INFORMATION ABOUT KOSOVO
1.2.1. Geographical position Kosovo is located in the center of Balkan Peninsula. It lies between 41°50’58” and 43°51’42” of the northern latitude and between 20°01’30” and 21°48’02” of the eastern latitude. Its geographical positioning gives Kosovo a special economic, cultural and political importance both regionally and globally.
Kosovo has an area of 10.887 km². It borders with Albania (in the southwest), Macedonia (in the southeast), Serbia (in the east, north and northeast) and Montenegro (in the west). Kosovo has an overall border length of 700.7 km.
1.2.2. ReliefThe topographic features of Kosovo include both mountains and plains; its landscape consists of the Kosovo Plain (510-570 m above sea level) and the Dukagjini Plain (350-450 m above sea level). Morphologically, Kosovo represents a real mosaic of hollows of varying sizes, surrounded by medium and high mountains. Its landscape is predominated by mountainous areas made of rocks of different geological ages.
The average altitude in Kosovo is 810 m above sea level, with a lowest point of 270 m and a highest point of 2656 m (Gjeravica). In hypsometric terms, only 16.4 km² of Kosovo›s territory (0.2%) are located below 300 m of altitude; 8754 km² (80.7%) are located at an altitude up to 1000 m; 1872.3 km² (17%) lie at an altitude between 1000 and 2000 m; and 250.6 km² (2.3%) lie at an altitude over 2000 m. The main landscape features of Kosovo are mountains (63%) and hollows (37%).
1.2.3. ClimateKosovo has a mid-continental climate, with a dominant influence of the Adriatic-Mediterranean climate in the Dukagjini Plain through the valley of the Drini i Bardhe river, and with a lesser impact of the changing Adriatic-Aegean climate in the Kosovo Field. The average annual rainfall is 596 mm. The average annual temperature is 10 OC (lowest temperature is -27 OC and highest temperature is 39 OC1 ).
1 Kosovo Hydro-metereologica Institute, 2008
REPORT ON THE STATE OF WATER 2015

11
The main macro climatic factors affecting the climate in Kosovo include: its positioning in relation to land masses (Eurasia and Africa), water masses (Atlantic Ocean and the Mediterranean Sea), air masses (tropic and arctic-maritime or continental), and the positioning of barometric systems (maximum of the Azores and minimum of Island). Main local factors affecting the climate of Kosovo include: landscape, water resources, soil and vegetation.
1.2.4. HydrographyWater resources represent an important factor in the country’s economic and social development. It is estimated that Kosovo has 1600 m3/water/year per capita. In hydrographic terms, Kosovo is divided into 5 river basins: Drini i Bardhe, Ibri, Morava e Binçes, Lepenc and Plava. In an average humidity year, approximately 3.8 x 10⁹ or 121.2 m3 /sec of water flow out of Kosovo’s territory.
The main hydrological feature in Kosovo is the unequal and inadequate distribution of water resources in relation to demand. The water energy potential in Kosovo is very low and it has been used until now to a very modest extent. The main reserves of groundwater are located in the western part of Kosovo, where reserves of surface water are also greater compared to the eastern and southeastern parts where demand for water is very high.
Kosovo has a few natural lakes, while its artificial lakes include: Batllava, Gazivoda, Radoniq, Perlepnica and Badovc. It also has a few irrigation lakes. Kosovo is rich in thermal water resources used for health and recreation.
1.2.5. PrecipitationKosovo has all forms of precipitation. The most important forms of precipitation include rainfall in the valleys and snowfall in high mountainous areas (Bjeshket e Nemuna and Sharr), with an average annual precipitation of 600 mm in the eastern part and over 700 mm in the western part of Kosovo. The largest annual amount of precipitation occurs in the Bjeshket e Nemuna mountains (1750 mm). Snowfall is common in the cold part of the year.
Figure 1: Precipitation in Kosovo 1900-20122
2 Data about precipitation: 1900-2000 from World Bank (http://data.worldbank.org/country/
12
Figura 1: Reshjet në Kosovë 1900-20122
1.2.6. Struktura e popullsisë
Numri i përgjithshëm i popullsisë së Kosovës edhe për kundër shpërnguljeve dhe trysnive të shumta ndaj saj, vazhdimisht është rritur me ritme të ndryshme në periudhën e pas Luftës së Dytë Botërore. Gjatë periudhës 63 vjeçare (1948-2011) popullsia e Kosovës kishte një rritje prej 138.2% nga 727820 (1948) në 17338723. Rritja e numrit të përgjithshëm të popullsisë ka ndikim në mjedis në shumë aspekte, prej të cilave më të rëndësishmet janë: ndikimi në shkallën e prodhimit, shfrytëzimin e resurseve natyrore, mënyrën e shfrytëzimit të tokës, krijimin e mbeturinave dhe ndotjen e mjedisit. Lidhja në mes popullsisë dhe ndikimi në mjedis në shikim të parë është kjo: më shumë njerëz harxhojnë më shumë produkte, potencial natyror, shkaktojnë më shumë dëme dhe prodhojnë më shumë mbeturina.
2Të dhënat për reshjet: 1900-2000 nga Banka Botëerore (http://data.worldbank.org/country/kosovo), 2001-2012 Instituti Hidrometeorologjik i Kosovës 3 Rezultatet e regjistrimit të popullsisë - ASK.
700
720
740
760
780
800
820
840
1900-19301930-1960
1960-19901990-2010
RESH
JET
SASI
A M
M
Reshjet

12
The average length of snowfall is 26 days in lower parts and 100 days in higher areas of Kosovo.
The first precipitation measurement station in the territory of Kosovo started its observations in 1925. The Kosovo Hydro-meteorological Institute conducts precipitation measurements in its observation stations located in several parts of Kosovo.
1.2.6. Demographic structureDespite conflicts and migration, the total population in Kosovo has constantly increased at different rates in the post World War II period. In 63 years (1948-2011), the population of Kosovo saw an increase of 138.2% from 727,820 (1948) to 1,733,8723.
Overall population growth affects the environment in several ways, the most important of which include effects on production rates, use of natural resources, land use, waste production and environmental pollution.
The relation between population growth and environmental influence may be thus presented: more people spend more products and natural resourcesl, causing more damage and producing more waste.
Compared to 1948, rural population in 20044 showed a growth of 110.0%, while urban population had an increase of 1430.8%. Regarding participation in the overall population, the percentage of urban population increased from 9.7% (1948) to 46.7% (2004). This level is controversial since the peripheral parts of Kosovo towns do not usually provide even minimum conditions for urban life.
Figure 2: Overall and urban population in Kosovo 1948-2011
kosovo), 2001-2012 Kosovo Hydro-meteorological Institute3 Population census results - KAS4 Assessment of prof. A. Pushka (2004). “Statistikat vitale të kohës më të re”, Kosovo Agency of Statistics. Prishtina.
13
Në krahasim me vitin 1948, në vitin 20044, popullsia rurale tregon rritje për 110.0%, kurse popullsia urbane tregon rritje prej 1430.8%. Sa i përket pjesëmarrjes në popullsinë e përgjithshme, popullsia urbane ka treguar rritje nga 9.7% (1948) në 46.7% (2004). Ky nivel është mjaft i diskutueshëm pasi që pjesët periferike të qyteteve të Kosovës në të shumtën e rasteve nuk ofrojnë as kushte minimale të jetës urbane.
Figura 2: Popullsia e përgjithshme dhe popullsia urbane në Kosovë 1948-2011
4 Vlerësim i prof. A. Pushka (2004). “Statistikat vitale të kohës më të re”, Enti i Statistikave të Kosovës. Prishtinë.
0
500000
1000000
1500000
2000000
2500000
1948 1953 1961 1971 1981 1991 2011
Pop. e pergj. Pop. urbane
REPORT ON THE STATE OF WATER 2015

13
LEGA
L AN
D ST
RATE
GIC
FRAM
EWO
RK2.1. LEGAL AND STRATEGIC FRAMEWORK The Republic of Kosovo has undertaken the adoption of EU environmental standards and substantial progress has been made in the development of legislation related to environmental protection in general, including water protection. Harmonization of Kosovo legislation with the EU acquis is assessed by monitoring the transpositioning and implementation progress of the legislation. A considerable number of environmental laws have been reviewed and adopted in recent years by the Assembly of Kosovo5 . The MESO has made evident progress in adopting secondary legislation as well (administrative instructions, regulations, decisions, etc.).
2.1.1. Legal infrastructure in the water sector e The legal basis regulating the water management sector in Kosovo consists of primary and secondary legislation.Primary legislation includes the following basic laws:Law No. 04/L-147 on the Waters of Kosovo -The goals of this law include:Ensure the sustainable development and use of water resources, which are essential to
5 http://www.Kuvendi-kosova.org
2

14
public health, environmental protection and social-economic development of Kosovo;Establish procedures and guidelines for optimal allocation of water resources based on
use and purpose;Ensure protection of water resources from pollution, overuse and misuse; andDetermine the institutional framework for administration of water resources.
Law No. 02 /l-79 on Hydro-meteorological activities - Is another important law for the water sector, which aims to regulate hydro-meteorological activities and how they are conducted.Law No. 02/L-78 on Public Health - This law determines institutions responsible for enforcing health policies and stipulates duties of the National Institute of Public Health, which, among others, include drinking water quality monitoring.Law No. 03/L-086 on the Activities of Water, Wastewater and Waste Services Providers - Is an important law that establishes the Water and Waste Regulatory Office (WWRO) and constitutes the legal framework for the economic regulation of public companies providing water and wastewater services.Law No. 02/L-9 on the Irrigation of Agricultural Lands - This law regulates the organization and administration of agricultural land irrigation and drainage in Kosovo; the authority and division of responsibilities of irrigation and drainage subjects; the formation and registration of irrigation companies; the organization of irrigation water users associations and federations; irrigation fees; functioning of associations; and other issues related to irrigation and drainage.
Secondary legislationThe following administrative instructions were drafted and signed as part of obligations deriving from the Law on Waters and the Law on Public Health:Administrative Instruction No. 30/2014 on conditions, manner, parameters and limit
values of wastewater discharge into the public sewage system and the water body,Administrative Instruction No. 26/2013 determining verification and legitimization
of the water inspectorate,Administrative Instruction No. 12/2013 on the water information system,Administrative Instruction No. 16/2012 on the quality of water used for human
consumption,Administrative Instruction No. 28/2013 on protected sanitary zones, Administrative Instruction No. 24/05 on the content, form, conditions and method of
issuing and retaining water permits, Administrative Instruction No. 06/2006 on water payment structure.
REPORT ON THE STATE OF WATER 2015

15
2.1.2. Environmental Protection Strategy 2013-2022The Environmental Protection Strategy comprises an important long-term component of the general development of Kosovo. The strategy includes the following strategic goals for the water sector:
• Complete and harmonize legislation with the EU acquis;• Administer strategies and plans for river basins;• Construct wastewater processing facilities and sewerage connected to them;• Repair and construct new network for drinking water supply;• Manage protection and regulation of river beds;• Improve monitoring of superficial water networks;• Create network for underground water monitoring.
The Environmental Protection Strategy 2014-2022 sets the following priorities for the water sector:• Draft sub-legal acts;• Draft strategy and management plans for river basins management;• Enhance water information system;• Prevent degradation of river ecosystems as a result of gravel and sand excavation;• Protect water enforcing an appropritate strategy, including dikes and water supply
systems, in a way that ensures safety of relevant biodiversity;• Increase cooperation between water and nature inspectorates in enforcing environ-
mental protection legislation;• Enforce Strategic Environmental Assessment and Environmental Impact Assess-
ment procedures, especially when dealing with acitivities in protected valleys and water zones;
• Construct wastewater treatment plants in urban and rural areas and where feasible, include nonformal settlements in public water and wastewater systems.
2.1.3. Kosovo National Water Draft Strategy 2015-2034Pursuant to the provisions of the Law on Waters of Kosovo, the Ministry of Environment and Spatial Planning, in cooperation with relevant government authorities, has prepared the National Water Draft Strategy for the period of 2015-2034.The general purpose of this strategy consists of effective management of water as an essential component of economic development and social well-being in the Republic of Kosovo.Based on the principle of integrated water management, the strategy applies a comprehensive multi-sector approach that tries to incorporate all important aspects related to water management in the Republic of Kosovo, including among others, the provision of water supply, and wastewater collection and treatment services to households and businesses in inhabited areas. The strategy also defines strategic objectives for efficient water use and proper and effective administration of waters.

16
2.1.4. Water monitoring plan The water monitoring plan is a support mechanism for water management and helps other relevant governmental actors in better water management, protection of water from pollution and in the identification of pollution sources from industry, agriculture and other economy sectors.The monitoring network provides sufficient data for establishing a reliable database that could help future planning for different economy sectors and improve the quality of surface and groundwater.The Surface and Groundwater Monitoring Program of the Republic of Kosovo has the following goals:Systematic and coherent quality monitoring of surface and groundwater,Fulfillment of obligations set by local laws and pursuant to WFD 2000/60 EC and EU’s
directives for surface and groundwater,Facilitation of decision-making procedures,Provision of reliable data on the quality of surface and groundwater
The monitoring program for surface and groundwater includes: Grid location of sampling site;Number of sampling frequencies;Physical-chemical parameters (heavy metals and pesticides), and biological elements
presented in table form;Radioactive parameters in the water;Presentation of monitoring sites on the map; andCost and financial analysis of implementation
2.1.5. European Union water directives Water management in European Union member states is regulated with several directives. The following table provides data on the purpose of separate directives, year of adoption and their transposition into Kosovo’s domestic legislation.
Table 1: EU directives for water quality and level of transposition with domestic legislation6
No. Name of directive Year of adoption
Purpose Transposition with domestic legislation (%)6
1 Water framework directive (2000/60/EC)
23 October 2000
Maintain “high status” of water where existing by preventing any degradation of current water situation and achieving at least a “good status” for all waters until 2015.
49%
2 Urban waste water treatment directive (91/271/EEC)
21 May 1991
Protect waters from negative effects due to urban wastewater discharge from some industrial sectors.
44%
6 Progress Report 9 Kosovo, Monitoring transposition and implementation of the EU environmental acquis, EC, 2014
REPORT ON THE STATE OF WATER 2015

17
3 Drinking water directive (98/83/EC)
3 Novembe 1998
Protect waters from negative effects due to urban wastewater discharge from some industrial sectors.
87%
4 Nitrates directive (91/676/EEC)
12 December 1991
Reduce water contamination from agricultural nitrates and prevent further contamination.
25%
5 Bathing water directive(2006/7/EC)
15 February 2006
The purpose of this directive is to maintain, protect and improve environmental quality and protect human health by amending Directive 2000/60 / EC.
0%
6 Directive on environmental quality standards in the field of water policy (2008/105 EC)
16 December 2008
Pursuant to Article 1 of this Directive and Article 4 of Directive 2000/60/EC, member states shall enforce WQS as determined in Part A of Appendix I of this Directive on surface water bodies.
4%
7 Directive on technical specifications for chemical analysis and monitoring of water status (2009/90 EC)
31 July 2009
Flooding risk management plans will address all risk management aspects focusing on prevention, protection and readiness, including flood predictions and early warning systems and considering features of separate river basins.
12%
8 Groundwater directive (2006/118/EC)
12 December 2006
Protection of groundwater from deterioration and chemical pollution. This is especially important for groundwater dependent ecosystems and for using groundwater for human consumption.
36%

18
2.2. INSTITUTIONAL STRUCTURE
2.2.1. Ministry of Environment and Spatial Planning
1.1.1.1. Water DepartmentPursuant to the Law on Waters (Nr. 04/L-147), the Department of Water of the Ministry of Environment and Spatial Planning has the following responsibilities:Enforcement of laws and sub-legal acts on water resources, including other
environmental laws; Development of policies on water resources, as well as of objectives from the
governmental water resources and environmental program; Development of national water strategy and water management plans at river basin
level;Administration and management of all water resources in the Republic of Kosovo; Conducting all duties and administrative, professional, organizational and
developmental activities obligated by this law; Close cooperation with other line ministries in the Republic of Kosovo regarding water
resources and living environment; Cross-border cooperation with neighboring countries and beyond in the field of water
resources.For purposes of water management, Kosovo is treated as a region of river basins. The River Basin Authority is established to manage the region, reporting to the Minister of MESP.
2.2.2. Kosovo Environmental Protection Agency (KEPA)The Kosovo Environmental Protection Agency is a central institution for environmental monitoring. Its duties and responsibilities for the water sector include: Collect and process data on surface and ground water of Kosovo, and store, exchange
and publish these data;Monitor quality of surface and groundwater (lakes, flows and rivers) based on the
monitoring program; Monitor discharge of urban, agricultural and industrial water;Prepare and draft water situation reports and assessments; Predict and warn potential risk from flooding and other natural disasters in the water
sector.
2.2.3. National Institute of Public Health (NIPH)The National Institute of Public Health is a high health, professional and scientific institution in Kosovo. In the field of water, NIPH is responsible for proposing and setting standards of drinking water distributed by water supply providers, and for monitoring the enforcement of such standards. The legal basis for NIPH’s authority and responsibilities consists of Administrative
REPORT ON THE STATE OF WATER 2015

19
Instruction No. 2/99 which regulates the issue of drinking water quality. NIPH’s mission lies in the protection and improvement of the population health by monitoring indicators, preventing diseases and promoting public health.
2.2.4. Kosovo Geological Service (KGS) The Law No. 04/L-232 on Kosovo Geological Service stipulates the following duties and responsibilities for KGS.Conduct geological and geo-chemical surveys of the territory of Kosovo and prepare
maps of different scales, as well as update existing maps with new information about the territory of Kosovo;
Conduct research and assessments of mineral resources, groundwater and mineral and geo-thermal water;
Supply Minerary Cadastre and GIS of ICMM with updated data from the national geological database, the geological archive and other sources;
Provide objective and unbiased analyses to public authorities and private sector organizations within KGS’s scope of expertise;
Research and promote activities aimed at reducing geo-environmental pollution;Create, maintain, enrich and expand national geological database and archive;Conduct qualified services, such as expertise, analysis, counseling, and monitoring for
purposes and fields as determined in this law;Draft programs and research projects for other institutions for purposes and fields as
determined in this law
2.2.5. Water and Wastewater Regulatory Office (WWRO)The Water and Wastewater Regulatory Office (WWRO) is an independent economic regulator for water and wastewater services in Kosovo. WWRO’s role is to ensure provision of quality, efficient and safe services on a non-discriminatory basis to all Kosovo consumers, while taking into consideration environmental and public health protection.WWRO’s duties and responsibilities in the water sector include 7:
License public enterprises providing water and wastewater services;Determine service fees for service providers licensed by WWRO, ensuring fees are fair
and reasonable and that they enable the financial sustainability of service providers;Supervise enforcement of service standards by licensed service providers;Approve and supervise enforcement of the Card of Consumers that determines
reciprocal rights and obligations between consumers and service providers licensed by WWRO;
Establish and support Consumer Counseling Commissions in the seven regions of Kosovo;
Themelimi dhe mbështetja e Komisioneve Këshilluese të Konsumatorëve në shtatë regjionet e Kosovës.
7 Water and Wastewater Regulatory Office
20
2.2.6. Local governments - Municipalities Based on the Law on Water, municipalities have the following duties and responsibilities regarding water management: Issue water permits pursuant to the sub-legal act on water permits and according to
authorization by the Ministry of Environment (Article 14);Construct water facilities and equipment for protection from damaging water effects
or other purposes (Article 40);Protect from water damages, erosion and other harmful activities in urban and
suburban areas, and provide finances for such actions (Article 46);Draft protection program for harmful water effects in cooperation with relevant
governmental authorities (Article 47);Determine erosion spots within urban areas, and finance maintenance and regulation
of flows and erosion protection activities in these areas (Article 51);Manage flow regulation facilities in urban areas and undertake all necessary measures
to regulate flows in urban areas (Article 52);Inform Ministry of Environment and Spatial Planning as soon as possible in cases of
erosion and flooding risks (Article 57);Determine swimming areas based on the relevant sub-legal act, in cooperation with
the Ministry of Environment and Spatial Planning, the Ministry of Health and water supply companies (Article 68).
Furthermore, according to the Law on Local Self Government in Kosovo (No. 03/L-040), municipalities have the authority to provide public water supply services. They execute this authority through Agreements of Service they sign with relevant regional companies..
2.2.7. Publicly owned enterprises / Regional water companies The Law on Publicly Owned Enterprises (No. 03/L-087) categorizes publicly owned enterprises involved in drinking and irrigation water management into three groups: central public enterprises, regional public enterprises and local public enterprises. Below is the list of these enterprises operating in Kosovo8.
• Central publicly owned enterprises o Public enterprise HPE Iber Lepenc JSC;
• Regional irrigation companieso Irrigation Company Drini i Bardhe J.S.C.; o Irrigation Company Radoniqi-Dukagjini J.S.C.
• Regional water companieso Regional Water Company Prishtina J.S.C, Pristinao Regional Water Company Hidrodrini J.S.C, Pejao Regional Water Company Hidroregjioni Jugor J.S.C, Prizreno Regional Water Company Mitrovica J.S.C, Mitrovica
8 Law 03/L-087 on Publicly Owned Enterprises
REPORT ON THE STATE OF WATER 2015
21
o Regional Water Company Hidromorava J.S.C, Gjilano Regional Water Company Radoniqi J.S.C, Gjakove
• Local publicly owned enterpriseso Water and Waste Company Ibar, Zubin Potok o Water Waste Company 24 November, Leposavico Regional Water Company Bifurkacioni J.S.C, Ferizaj/ Kacanik
2.2.8. Association of Water and Wastewater Companies of Kosovo (AWWCK)
SHUKOS is a non-governmental organization established to act as a liaison between its members, and to promote their common interests and fundamental issues of their scope of action. The main members of SHUKOS include all public companies of water and wastewater services in Kosovo.The highest body of the association is the Assembly, which elects the Board of the Association. The Board is made of nine members: seven directors of RWCs, one representative of the Ministry of Finance and one representative of MESP’s Department of Water. SHUKOS has a Director who reports to the Board9.
9 www.shukos.org

22
REPORT ON THE STATE OF WATER 2015

23
3.1. SURFACE WATER Kosovo has limited water resources. Water resources are considered an important factor for the country’s economic and social development.The border between the Dukagjini Plain and the Kosovo Field divides surface waters, which then continue flowing to:
The Black Sea with 50.7% (Iber, Morava e Binces);The Aegean Sea with 5.8% (Lepenc); andThe Adriatic Sea with 43.5% (Drini i Bardhe and Plava).
3.1.1. Rivers and river basinsThe topographic water catchment area in Kosovo is 11.645 km2, while existing accumulation reaches 569.690.00 m². 10 Rivers with the greatest annual flux are located in the basin of Drini i Bardhe in the Dukagjini Plain. In hydrographic terms Kosovo is divided into 5 river basins:Drini i Bardhe with its tributaries (Lumbardhi i Pejës, Lumbardhi i Decanit, Lumi i
10 MESP/AMMK, The state of water Report in Kosovo, 2010
WAT
ER R
ESO
URCE
S
3

24
Erenikut, Lumi i Istogut, Lumi i Klinës, Lumi Mirusha, Lumi Rimniku, Lumi Toplluha and Lumbardhi i Prizrenit),
Iber with its tributaries Sitnica (Gracanica, Prishtevka (Prishtina River), Sllakovaqa, Studime, Sazlia, Caraleva, Llapi, Drenica, Trepça, Smrekovnica, Gojbules, Dumnica), and Lushta, Kozareva, Bajskes, Kamenica, Vuça, Gërkaja, Jashanica, Borogllava, Vraqeva, Trebiçka, Bistrica, Ceraja, Mushnica, Dubrava, Jagnjeniqa, Brusovaqa, Bernjaka, Çeçeva, Zubodolli (Albanik), Zubqana, Drena, Tverdan, Leposaviqi and Sllatina,
Morava e Binces with its tributaries Kriva Reka, Desivojca, Perlepnica, Gjilanit, Livoçi, Cernica, Smira, Pogragja, Vllastica, Ribniku, Svintulbkes, Llapushnica, Pasjani, Zhegra, Letnica, Pakita (Beranica),
Lepenc with its tributaries Nerodime, Ortica, Kavaqeva, Dubrava, Biqeva, Verbeshtica, Suva Reka, Sushica, Ropoti, Prroi i Thatë, Murzhica, Kotlina, Koshtanjeva, Kerveniku.
Plava River with its tributaries Restelica, Brod, Radesha, Kapra, Karaxha, Renci, Belobrada, Brodosava, Bljaqa.
Foto: Rrjedha e Lumit Drenica në fshatin Dobroshec
REPORT ON THE STATE OF WATER 2015

25
Tabl
e 2.
Bas
ic d
ata
on ri
vers
and
rive
r bas
ins 11
Rive
rAr
ea (S)
km2
Leng
th o
f riv
er (L)
km
Flow (Q
)m
3 /s
(q)
l/sek
/km
²Sl
ope
%Pe
rimet
er
of b
asin
(Km
)
Annu
al
flow
x106
(m3 )
Effe
ctiv
e pr
ecip
itatio
n(m
m)
Aver
age
prec
ipita
tion
(mm
)
Coef
ficie
nt
of fl
owFl
ows i
nto
Drin
i i B
ardh
ë43
40.1
411
0.7
61.7
2.1
409.
819
4645
2.5
900
0.50
8Ad
riatic
Se
aSu
shic
a49
.417
.25
9.4
3211
50
LB.P
ejës
464,
857
10.2
124
.13
2.5
128
200.
6676
0.1
1168
0.65
1
LB.D
eçan
it25
9,3
537.
8442
.46
3.2
105
152.
4613
37.4
1530
0.87
4
Eren
iku
519.
351
.74
12.1
626
.73
3.9
109
383.
0484
1.8
1515
0.71
6
Istog
u40
5.3
19.7
46.
984.
587
1200
Klin
a45
8.7
72.1
22.
84.
924.
512
665
.52
154.
975
00.
221
Miru
sha
336,
737
1.66
11.
783
700
Topl
luha
495
34.0
53.
443.
510
810
00
LB.P
rizre
nit
247,
836
.07
6.49
29.6
87.
477
147.
7493
5.1
960
0.97
4
Plav
a, R
este
lic34
1.86
22.1
25.
2520
.79
5.9
90.5
616
5.06
655
1080
0.64
4
Basin
tota
l46
8211
0.7
61.0
12.
140
9.8
1946
452.
590
00.
508
Ibri
4044
.21
89.5
036
.46.
390.
343
6.8
1148
218.
478
20.
301
Blac
k Se
a
Sitn
ica
2912
7813
.94
5.38
1.1
276
439.
1116
9.5
690
0.25
8
M.B
inçe
s15
6476
8.7
5.99
1.5
216
330
188.
873
60.
256
Kriv
a Re
ka64
0.70
44.5
4.43
7.27
1.2
128
139.
5522
9.1
736
0.31
1
Lepe
nci
653
508.
414
.91
4.6
130
190
469.
891
20.
516
Aege
an
Sea
Ner
odim
e20
9.4
38.5
2.1
81.5
750
Tota
l10
907
.00
121.
23.
8*10
6
11
Ado
pted
from
Kos
ovo
Wat
ers M
aste
r Pla
n
26
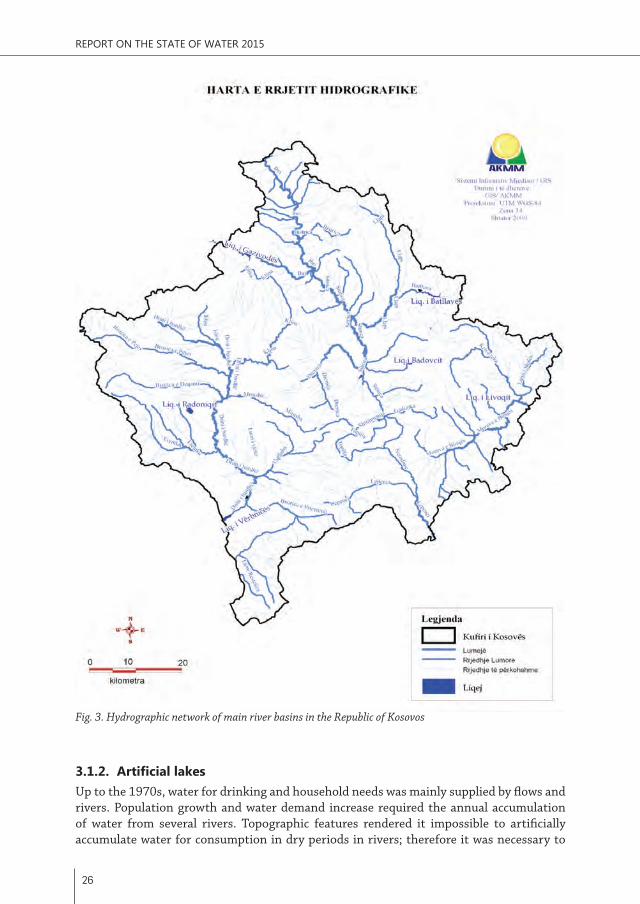
Fig. 3. Hydrographic network of main river basins in the Republic of Kosovos
3.1.2. Artificial lakesUp to the 1970s, water for drinking and household needs was mainly supplied by flows and rivers. Population growth and water demand increase required the annual accumulation of water from several rivers. Topographic features rendered it impossible to artificially accumulate water for consumption in dry periods in rivers; therefore it was necessary to
REPORT ON THE STATE OF WATER 2015

27
intervene technically. Artificial accumulation sites met the water demand, not only for drinking, but for industrial and agricultural needs as well. The main accumulations in Kosovo are.
Gazivoda Lake, Batllava Lake, Badovc Lake,Livoc Lake,Radoniq Lake, Perlepnica Lake.
Table 3. General characteristics of accumulating lakes 12
Rese
rvoi
r
Rive
r
Area
of w
ater
cat
cher
VolumeMillion [m3]
Year
of c
onst
ruct
ion
Hei
ght o
f dik
e
Terri
tory
irrig
ated
by
syst
em
Destination
User
s
Tota
l
Irrig
atio
n
Drin
king
wat
er
Indu
stry
Gazivoda/Ujmani
Ibër 1060 350 390 1979 101 Zubin Potok Mitrovicë Vushtrri
Prishtinë SkenderajDrenas
20000 ha
Yes Yes
Batllava Batllavë 226 25.1 30 1960 46 PrishtinëPodujevë
No Yes Yes
Badovci Graçanicë 103 20 26.4 1963 45 Prishtinë No Yes Yes
Livoç Livoç 53.6 - - - - Gjilan No No No
Radoniq Përrue 130 102 116.6 1982 61 Gjakovë,Rahovec,Prizren
10000 ha
Yes No
Prilepnicë Prilepnicë 62 - - 1982 40 Gjilan No Yes No
Total 1634.6 497.1 563
12 MESP/AMMK, The state of water Report, 2010

28
Photo: Badovc Lake
The amount of water accumulated in lakes currently comprises about 15% of the overall amount of water flows in the territory of Kosovo.However, in order to secure water for drinking, industrial, irrigation and other needs, new accumulations need to be constructed in the future. The table below lists some of the potential accumulations.
Table 4. Basic hydrological features of planned accumulations 13
No. Accumulation River/Flow Area(km2)
Average flow
( m3/s)
Annual fluxmil. m3/
year
Volume in million
m3
1 Drelaj Bistrica e Pejës 173 4.65 146.6 84.52 Kërstovc Binca River 118 3.20 100.96 403 Movë Klina River 239 1.2. 37.80 344 Morinë Llabenica 26 2.25 70.78 385 Ripaj Trava River 59 2.38 74.88 366 Reçan Bistrica e Prizrenit River 155 4.55 143,32 687 Dragaçin Dragacin River 36 0.25 7.92 6.768 Kremenata Kremenata River 56 - 15.90 8.75
13 MESP/AMMK,The state of water Report, 2010

29
9 Binçë Lumi i Madhë (Great River) 72 0.63 19.49 110 Konqul Morava e Binces River 1632 6.86 216.03 12011 Firajë Lepenc River 229 5.34 168.30 16.512 Shtime Topillë River 102 0.66 20.91 11313 Cecelija Lumi i Zi (Black River) 47 0.41 12.92 2114 Makovc Prishtevka River 26 0.19 6.01 1015 Majanc Kançandollit River 88 0.68 21.35 3016 Vaganic Lushta River 46 0.23 7.24 817 Miraçë Tërstena River 31 0.20 6.30 618 Dobroshevc Drenica River 35 1.38 43.4 23.219 Pollata Llap River 111 1.23 38.63 37.520 Bistrica Bistricë e Prizrenit River 159 1.40 44.24 25
3.1.3. Natural lakesKosovo has few natural lakes. They are also known as glacial lakes and their water volume increases depending on season, precipitation and snow melting. The main natural lakes are located in our two national parks: in the National Park “Sharri” and in the National Park “Bjeshket e Nemuna”.
Photo: Lake of Kuqishte in the National Park “Bjeshket e Nemuna”

30
The natural lakes of the National Park “Sharri” include:Natural lake of Livadh,Natural lake of Bogovina,Black natural lake,Natural lake of Jazhinca,Natural lake of Brezna,Upper natural lake.
The natural lakes of the National Park “Bjeshket e Nemuna” include:Big Lake of Gjeravica,Small Lake of Gjeravica,Lake of Kuqishta,Lake of Drela
No studies have been conducted yet about the water amount, area or biodiversity of these natural lakes.
3.2. GROUNDWATERGroundwater reserves in Kosovo are limited and they are mainly found in the western part of the country. As part of the “Development of water resources in southeastern Kosovo” project, geo-physical studies of groundwater were conducted during 2005-2007 in the municipalities of Gjilan and Ferizaj (basin of Morava e Binces). Furthermore, during 2008-2010 as part of activities of the EC supported project on the basin of Drini i Bardhe, groundwater survey sites were planned for this basin. Historical data point out that this zone is richest in groundwater.According to the Kosovo Water Master Plan 1983-2000, the Dukagjini Plain has the greatest groundwater potential.
Table 5. Groundwater accumulations in the Drini i Bardhe basin, their area, volume and capacity
No. Groundwater accumulation
Area of basin (km2)
Usable volume(m3)
Assessed capacity
m3/sek Total (m3)1 Istog 76 12x106 2,8 89x1062 Vrellë 28 14x106 0,600 19x1063 Drini i Bardhe 90 14x106 3,23 102x1064 Lubizhdë 42 45x106 4,2(150) 55x1065 Peja 300 37,5x10⁶ 4,0(150) 52x1066 Decan 144 33x106 3,5(150) 45x1067 Lloqan 39 12x106 1,2(150) 15x106
REPORT ON THE STATE OF WATER 2015

31
8 Krk Bunar 81 10x106 1,6 50x1069 Korisha 18 3,6x10⁶ 0,38 12x10610 Field of Theranda 50 75x106 2 63x106Gjithsej 998 271x106 511x106
3.3. THERMO-MINERAL WATER The Republic of Kosovo has important thermal water resources, which are mainly used for healing and recreation purposes.Research to identify and study the value of these resources and the amount of such water in Kosovo has been scarce. Data point out that there are about 30 identified sources of thermal and mineral water in Kosovo. Detailed research has only been conducted for the sources of such water in Peja, Kllokot and Banjska, which function as thermal treatment spas. These thermal water sources may also be used for thermal energy production. The overall temperature of thermo-mineral water in the Republic of Kosovo ranges from 17 to540 C, with a mineralization scale of 2-5 g/l. Sources of thermal and mineral water in the Republic of Kosovo contain sulfates, hydrocarbon, calcium and Magnesium.
Burimi Banjës së Pejës

32
Table 6. Physical-chemical features of some thermo-mineral sources14
No. Location Ql/sec
t 0C pH Mineralizationg/l
1 Banja e Pejës 4,00 48.9 6.9 2.04
2 Banja e Kllokotit 10,00 32.0 6.6 3.601
3 Banjska 2.50 50.0 6.7 1.356
4 Banja e Runikut 15.00 24.8 7.1 0.598
5 Burimi i Nxehtë i Runiku 5.00 23.0 7.2 0.61
6 Gojbula - 12.0 6.3 2.193
7 Uji i Lluzhanit 0.01 14.0 6.3 1.144
8 Studencia 1.0 25.0 7.1 0.670
9 Deçan 2.00 12.5 6.3 1.433
10 Getnja e Sipërme 0.1 9.0 6.6 2.539
11 Poneshi 0.03 13.0 6.3 3.539
12 Pokleku 1.00 13.0 6.3 3.52
13 Uglari 6.00 25.00 6.8 0.688
14 Zhitija 0.3 20.0 6.5 5.126
15 Dobërçani - 26.8 6.4 -
3.4. WETLANDSSAccording to the definition of the Ramsar Convention (The Convention on Wetlands of In-ternational Importance), wetlands include: areas of marsh, fen, peatland or water, whether natural or artificial, permanent or temporary, with water that is static or flowing, fresh, brackish or salt, including areas of marine water the depth of which at low tide does not exceed six meters.
Wetlands make approximately 6% of the overall area of the globe and represent some of the most productive environments. They are considered a “cradle of biological biodiversity”, providing water and primary productivity for the existence of numerous species of plants and animals. They have a high concentration of mammals, birds, reptilians, terraqueous, fish and non-vertebral species. According to some experts, wetland ecosystem services provide high economic profit amounting to 4.9 billion dollars a year. Thus, rice is a com-mon plant of wetlands and feeds more than half of humankind. Furthermore, about 2/3 of global fishing is tied to the coast and wetland areas. Agriculture, transportation, energy and tourism also benefit from wetlands.
Because of values and benefits of wetlands, countries are committed to preserving them. This is shown in the continuous increase in the number of wetlands of international impor-tance, as well as the increasing number of countries that have signed this convention since 1971.
14 MESP/AMMK, The state of water Report 2010
REPORT ON THE STATE OF WATER 2015

33
The Ramsar Convention was initially signed by 18 countries, scientific institutions and in-ternational organizations, while today it is signed by 160 countries. There are 1911 wet-lands of international importance with a total area of 186 950 196 hectares.
Kosovo has declared a protected zone which is categorized as wetland. The Government of Kosovo in 2013 declared the Henc/Radeva wetland as a special protection bird area because of its special natural values and characteristics, including ornithological, etiological, hydro-geological, botanic, and landscape features. The area includes an area of 109 hectares, 52 ares and 35 meters square, and it expands over the territory of the municipalities of Graca-nica, Lipjan and Fushe Kosova 15.
The professional declaration proposal for this area was prepared by the Kosovo Institute for Nature Protection of the Kosovo Environmental Protection Agency. Goals guiding the declaration of the Henc wetland a Special Protection Area (SPA) include: sustainable use, ecosystem protection, taking measures to rehabilitate damaged ecosystems, rational use of natural resources, increase of scientific, educational, and cultural research opportunities, and other professional activities in accordance with contemporary concepts for the devel-opment of this area.
The wetland of Henc is a very rich zone in terms of zoological diversity. Research conducted in this area has shown that many types of wild fauna live there, dominated by wild birds. Natural habitats of the Wetland of Henc provide shelter to many types of birds, many of which are rare and with an unfavorable protection status in Kosovo and in Europe. Until now 78 types of birds have been recorded, but this number may result higher if a compre-hensive systematic and professional study is conducted in this area16.
Landscape in the Wetland of Henc
15 MESP, Professional proposal for declaring the Wetland of Henc a Special Protection Area16 Professional proposal for declaring the Wetland of Henc a Special Protection Area, MESP/AMMK

34

35
4.1. USE OF WATER FOR DRINKING AND HOUSEHOLD NEEDS
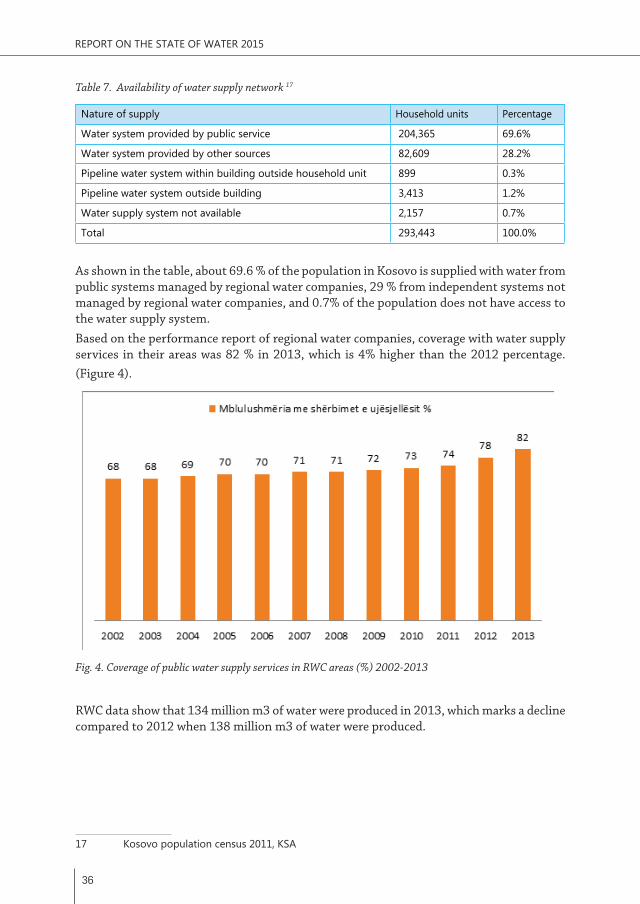
The water supply service means the provision of drinking water to Kosovo’s population by the regional water companies in their coverage zones. In addition to major cities, these companies also provide their services to some villages located within their area of responsibility. Many settlements in Kosovo get water from supply systems outside the authority of regional water companies. Table 7 provides drinking water supply data.
WAT
ER U
SE A
ND
WAT
ER
RESO
URCE
S
4
36
Table 7. Availability of water supply network 17
Nature of supply Household units Percentage
Water system provided by public service 204,365 69.6%
Water system provided by other sources 82,609 28.2%
Pipeline water system within building outside household unit 899 0.3%
Pipeline water system outside building 3,413 1.2%
Water supply system not available 2,157 0.7%
Total 293,443 100.0%
As shown in the table, about 69.6 % of the population in Kosovo is supplied with water from public systems managed by regional water companies, 29 % from independent systems not managed by regional water companies, and 0.7% of the population does not have access to the water supply system.Based on the performance report of regional water companies, coverage with water supply services in their areas was 82 % in 2013, which is 4% higher than the 2012 percentage. (Figure 4).
Fig. 4. Coverage of public water supply services in RWC areas (%) 2002-2013
RWC data show that 134 million m3 of water were produced in 2013, which marks a decline compared to 2012 when 138 million m3 of water were produced.
17 Kosovo population census 2011, KSA
REPORT ON THE STATE OF WATER 2015

37
Fig. 5. Quantity of water spent by public water systems (in million m3/year), 2006-2013
4.2. WATER USE FOR IRRIGATION The use of water for irrigation during 2012 has increased compared to the previous year. According to data of the Kosovo Statistics Agency and the Ministry of Agriculture, Forestry and Rural Development during 2011, approximately 50 million m3 of water have been used for irrigation, which marks a significant increase compared to the previous year. In addition, there has been an increasing trend in the use of water for irrigation from 2001 until 2012, except 2004 and 2009 wherein the use of water for this purpose has declined due to drought. (Figure 6).
Fig. 6. Quantity of water spent for irrigation 2001-201218
18 Kosovo Statistics Agency

38
In addition to the increase in the quantity of water used for irrigation, the number of irrigated areas has increased as well. Approximately 12 thousand and 300 hectares of land were irrigated during 2012, which marks an increase compared to 2011 when approximately 11 thousand and 800 hectares were irrigated. Thus, there has been an increasing trend of irrigated areas from 2001 until 2012. (Figure 7).
Fig. 7. Irrigated areas 2001-2012 19
4.3. WATER USE IN INDUSTRY AND ENERGETICS
Industrial and energetic operators are the greatest users of water. The greatest spenders of water in Kosovo include: KEK, Feronikel and Sharrcem. These operators are mainly supplied with water from superficial accumulating lakes. Some of the smaller industrial operators are supplied with water from the public network, whereas a few of them use well-based independent water supply systems.
Kosovo Energy Corporation
The Kosovo Energy Corporation (KEK) is one of the economic operators that spend most water for energy production purposes. TC Kosova A is supplied with unprocessed water from the Llap River and from HPE Ibar-Lepenc and Batllava Lake when necessary, while TC Kosova B is supplied with unprocessed water from HPE Ibar-Lepenc. According to data provided by KEK, the corporation used 21 million m3 of water for energy production during 2013, which is lower compared to the previous year. (Figure 8).
19 Kosovo Statistics Agency
REPORT ON THE STATE OF WATER 2015

39
Fig. 8. Quantity of water spent by KEK for energy production 20
NewCo Feronikel
NewFeronikel is supplied with water for its technological processes from Bivolak (HPE Ibar-Lepenc), which is located 17 km away from the factory and which supplies water reservoirs located above the factory. Feronikel uses this water for industrial and drinking purposes.The industrial water is mainly used for electrical furnaces cooling, slag granulation, steam production and for gas and dust cleaning systems in convertors and electrical furnaces. The majority of the industrial water used to cool electrical furnaces is re-circulated, while most water is spent in steaming processes (cooling towers, slag granulation).According to data provided by NewCo Feronikel, approximately 1.2 million m3 of water were spent during 2013, which marks a considerable decline compared to the previous year. (See Figure 9).
Fig. 9. Quantity of water spent by NewCo Feronikel, 2009-2013 21
20 Monthly and annual environmental reports of KEK 2009-201321 Monthly and annual environmental reports of NewCo Feronikel 2009-2013

40
Sharrcem
The cement factory Sharrcem in Hani i Elezit operates with a closed water system at all points of the production process. This system is supplied with water from sources of the Lepenc River and Dimca stream. Water is spent in this operator for conditioning furnace gases, for cooling processes in the air conditioning tower and for sanitary purposes.According to data provided by the concrete factory SharrCem, 100 thousand m3 of water were used during 2013, which is lower compared to 160 thousand m3 water spend in the previous year, as shown in the figure below
Fig. 10. Quantity of water spent in Sharrcem, 2009-2013 22
4.4. WATER USE FOR HYDRO-ENERGYThe hydropower plants currently operating in Kosovo include the plant of Ujman with an energy production capacity of 2 x 17 MW and five small plants contributing to the distribution network with a capacity of 11.82 MW. Other small plants include those in Dikanc, Burim and Prizren. Another operational hydroelectric plant in Kosovo is that of Kozhnjer in Decan, which has been given with concession and produces a small amount of energy. Kosovo has numerous rivers and streams with a hydro-energetic potential that may be used to produce electrical energy. The western part of Kosovo has the hydro-energetic potential of Drini i Bardhe, which comprises more than half of the hydro-energetic potential of Kosovo. The most important hydroelectric plant that may be built in Kosovo is that of Zhur located in the flow of Drini I Bardhe with a capacity of 0.377 Twh/year. The flows of rivers Drini i Bardhe, Iber, Morava, Lepenc and Llap have a significant potential for electrical energy production. The table below summarizes the basic data regarding the capacity of planned hydro-plants and their locations have been presented in the map.
22 Monthly and annual environmental reports of SharrCem 2009-2013
REPORT ON THE STATE OF WATER 2015

41
Table 8: Basic data on the capacity of planned hydropower-plants 23
Name of HP Potential capacity [MW]
Planned production GWh
Flow m3/sec
River
Kuqishta 3.9 19.0 6 Peja
Drelaj 6.2 29.6 6.5
Shtupeq 7.6 37.2 8
Bellajë 5.2 26.1 5 Deçani
Deçani 8.3 40.7 6.5
Lloçan 3.1 14.4 1.5 Lloçani
Mali 3 18.6 2.4 Erenik
Erenik 2 9.5 2.4
Jasiq 1.9 9.9 2.6
Dragash 2.2 11.5 5 Plavë
Orçush 5.6 29.2 7
Reçan 1.5 7.9 2.6 Prizreni
Brezovicë 2.1 11.5 4.5 Lepenc
Lepenci 3.5 19.1 7.6
Banjska 0.3 1.7 0.5 Banjska
Batare 1.1 5.6 2.3 Bistrica
Majanc 0.6 3.1 1.5 Kaçandoll
Mirusha 4.6 28.1 45 Drini & Deçani
Total 62.7 322.8
Hydro-plant of Zhur Potential capacity [MW] Planned production GWh
Zhur 1 2x 131 342.2
Zhur 2 42 55.39
Total 305 397.6
23 Sustainable Energy Options for Kosovo,2012, Daniel M. Kammen et al., University of California, Berkeley

42
Figure 11: Distribution of planned hydroelectric power plants
REPORT ON THE STATE OF WATER 2015

43
4.5. EXPLOITATION OF INERT MATERIALS IN RIVERS
Because of the increased demand and need for construction and economic development after 1999, many operators started river sand excavation activities. The inert materials of many rivers in Kosovo were used inappropriately and in a way that exceeded the capacity of riverbeds. This overexploitation has affected ecosystems of rivers and riverbeds, and has also resulted in overflows and floods.To prevent this degradation, the Government of Kosovo brought a decision in 201124 regulating the use of and preventing exploitation of inert materials from riverbeds, river banks and land surrounding rivers in the entire territory of Kosovo. This Decision was enforced during 2012 by MESP and other relevant institutions. However, despite measures for implementing this decision and other activities aimed to stop degradation of rivers and exploitation of inert materials, the intended outcomes have not been achieved yet. Based on data provided by the environmental inspectorate and gathered during field visits, the environmental condition of rivers keeps deteriorating due to sand exploitation activities. The most degraded rivers include the rivers of Drini i Bardhe, Lumbardhi i Pejes, Erenik, Desivojce, Krivareke and Iber.
Table 9: Degraded area by river 25
River Area in ha 2009 Area in ha 2012
Drini i Bardhë 861.1 1011.75
Ibri 2.64 4.5
Morava e Binçës 4.29 4.79
Lumëbardhi i Pejës 93.36 134.5
Ereniku 16.28 19.48
Desivojca 7.76 18.95
Total 1004.77 1219.23
Harmful exploitation methods used by operators while excavating inert materials include:
Digging holes up to 10 m deep near or in rivers;Moving heavy vehicles on riverbeds, which presses the substrate and results in vehicle
oils and chemicals washing into the river; Digging at points of confluence where small tributaries flow into main rivers. This
prevents stabilization of rivers at these sites and slows down natural regulation at lower points of the river because of the interruption of the flow of natural sediments;
24 Decision nr.02/4625 GFO2014, Degradation of rivers in Kosovo; Integrating ecological knowledge into nature conservation and ecosystem management, 44th annual meeting, September 8-12, 2014, Hildesheim, Germany

44
Construction of roads within rivers as a lighter form of exploitation and other forms of riverbed degradation.
The excavation of inert materials from rivers causes the following damages:New water channels are created and the natural river flow is interrupted;Numerous holes deeper than 10 m are have been opened in the flow;River flow direction is changed, increasing the risk of soil erosion;River substrate stability is reduced especially in cases of flooding;Natural changes of river ecosystems, flora and fauna are interrupted26.
Degradation of Drini i Bardhe River
26 MESP/KEPA: State Of Rivers Assessment Report, 2014, Prishtina
REPORT ON THE STATE OF WATER 2015

45
Degradation of Lumbardhi i Pejes riverbed
Degradation of Desivojce riverbed

46
4.6. WATER PERMITS The Ministry of Environment and Spatial Planning is the authority for reviewing water use requests of economic operators. Economic operators meeting the criteria foreseen by the Law on Waters and other laws are issued water permits. During 2011-2013, MESP issued 42 water use permits to economic operators.
Table 10: Water permits issued by MESP, 2011-2013
2011 2012 2013
Water permits 12 16 24
Total 52

47
5.1. FLOODSFloods as a natural phenomenon are often caused by intense precipitation and rapid snowmelt. Rivers in Kosovo are characterized by evident changes between minimum and maximum levels of water. Different morphological features, such as wide fields surrounded by mountains, result in wide range and dynamic floods. Relatively hollow unregulated and unmaintained riverbeds, throwing waste into rivers and uncontrollable use of inert materials from riverbeds result in wider floods in Kosovo.According to the Water Master Plan of 1983 on floods probable to occur once in 100 year, the probability of floods from the river basins in Kosovo is as follows:
Basin of Drini i Bardhe - 50%
Basin of Iber River - 24%
Basin of Lepenc River - 20%
Basin of Morava e Bincces - 6%.
FLOO
DS A
ND E
ROSI
ON
5

48
This assessment shows that the length of Kosovo rivers at flooding risk is about 491 km and only 140 km of them are regulated (28%).Floods in Kosovo usually occur in spring (March and April) and autumn (October and November). The administrative territory of Kosovo is at risk from floods in all its river valleys, such as the valley of Drini i Bardhe and flows joining it, the valley of Sitnica River in the Kosovo Field, the valley of Lakuar River (Kriva Reka) in Dardana, the valley of Morava e Binces River in Gjilan, the valley of Lepenc River in Kacanik – Han i Elezit, the valley of Llap River in Podujeve, the valley of Drenica River in Drenas, the valley of Klina River in Skenderaj and valleys of other streams. The landscape features in Kosovo are such that plain areas of its territory are appropriate for settlements, industrial activities and infrastructure development, while mountains surrounding the plains condition rapid flowing of water in great quantities because of their slopes. This increases the need for protecting these areas from floods. Different morphological features, such as wide fields surrounded by mountains, result in wide range and dynamic floods. Relatively hollow unregulated and unmaintained riverbeds, throwing waste into rivers and uncontrollable use of inert materials from riverbeds result in wider floods in Kosovo. Floods affect fields in Kosovo almost every year causing considerable economic and ecological damages. Most of the riverbeds do not support additional quantities of water leading to wide range floods.
Floods in the basins of Iber and Morava e Binces during 2014
There were floods in the majority of Kosovo municipalities located within the basins of Iber and Morava e Binces in April 2014 because of snowmelt and precipitation. The floods damaged rural infrastructure, mainly roads and bridges. They also affected households and agricultural lands, causing considerable damage to the sector of agriculture.
Floods in Mitrovica
REPORT ON THE STATE OF WATER 2015

49
Floods in Mitrovica
There are also floods near rivers and streams, such as Iber, Sitnica and Lushta, and their tributaries, especially during heavy rainfall. During 2014, the Sitnica River in Mitrovica overflowed its bed flooding tens of houses and endangering tens of others. There were floods in the villages of Frasher, Kçiq and Lisca causing damage to agriculture, households, private firms and motels.In the Municipality of Vushtrri the greatest floods occurred near rivers and streams, such as Sitnica, Llap, Terstena and its tributaries in Pestove, Nedakovc and Prilluzha. After heavy rainfall in Vushtrri, numerous zones near Llap and Sitnica rivers were affected by floods. Families were evacuated in some villages, especially in Stanovc. As a result of floods, land was covered with water, water of wells was contaminated and people had to be evacuated from at-risk locations.In the Municipality of Prishtina floods occurred when the Prishteva River and its tributaries overflowed their beds. The most affected locations in the Municipality of Prishtina included Llukar, Besia, Makofc, Mramor, Keqekolla, Bernica, Prugofc, Vranjevc, Emshir and Hajvali.In the Municipality of Obiliq, floods occurred near Sitnica River and its tributaries. They damaged the infrastructure and bridges in Breznica, Dardhishte and Obiliq i Vjeter. In addition to planted fields damaged by the Llap River, in Millosheve and Babimoc villages houses were damaged as well. In the Municipality of Podujevo, there were floods near the Llap River and its tributaries. Rainfall during 2014 caused floods with considerable material damages in a number of villages in this municipality. The situation was more severe in Repe village, where two bridges were destroyed and because of the dike constructed in the riverbed,

50
the water level increased posing risk to the houses nearby. Agricultural land was also flooded along Llap River in the villages of Doberdol, Bajçina, Gllamnik, Sekiraqa, Siboc, Lluga and Lupç. In addition, the Dumnica River flooded in Dumnice e Poshtme, Shtedim, Balloc, Surkish and Sfeqel. There were also floods along the river in the villages of Halabak, Ternava and Bellopoja.
Llap River in Lluzhan of Podujevo
Llap River in Podujevo, fixed riverbed during floods
REPORT ON THE STATE OF WATER 2015

51
In the Municipality of Viti, Morava e Binces River and its tributaries flooded during 2014 in Viti, Skifteraj, Budrike e Epeme, Remnik, Radivojc and Bince. Floods caused by Morava River were assessed as the most severe, damaging entire areas of agricultural land, especially those planted with potatoes.After floods that occurred in the villages of Budrike and Radivojce, and in the town of Viti, the water in wells was contaminated.In the Municipality of Gjilan, there were floods from Morava e Binces River and its tributaries in Nasala, Velekince, Uglar, Lladov, Zhegra, Haxhaj, Demiraj and Shurdhan. The floods damaged agricultural land and led to water contamination.In the Municipality of Kamenica, floods occurred during 2014 from the rivers Kriva Reka, Lumi i Hogoshtit and Shipashnica, and the tributaries of the latter in Hogosht, Shpashnica, Meshina, Strezovc, Topanica, Muqiverrc, Desivojce and Krileva. Floods affected infrastructure and agriculture, and led to evacuation of inhabitants (Hogosht) and drinking water contamination.In the Municipality of Fushe Kosova, there were floods during 2014 from the rivers of Sitnica, Graçanka and Prishtevka. Floods caused damage to living infrastructure and agriculture, and led to contamination of wells.Protection from floods and regulation of water regimes are complex issues requiring long-term solutions and the participation of numerous sectors and subjects. Activities to address these issues should include the following elements::Probability, range and duration of floods;Prediction of reoccurrence of floods in certain regions;Reviewing administrative issues and constructing hydro-technical facilities;Setting criteria based on comprehensive analyses and projection of costs;Maintenance and financing of construction of hydro-technical infrastructure for
protection from floods.
Needs of regions requiring protection from floods include: Reconstructing existing infrastructure to increase level of safety; and When dealing with protection from floods in wider areas, especially agricultural land,
factors to consider include timing and duration of floods, and density of settlements.
Activities aimed to regulate water flows are grouped into three categories:Activities in flows where no regulation or flood protection works have been conducted
previously;Activities in flows where partial works have been completed and have given positive
results; andActivities in flows where works have been conducted before but without result (due
to different causes).When implementing protection measures against floods and projecting hydro-technical structures in a river basin, it is necessary to consider the magnitude of floods at the return period. Selection of the flood return period depends on the project and safety criteria. The following return periods are usually taken into account.

52
For urban drainage of storm water: 10 to 30 yearsFor small deviation structures and accumulation dikes: 50 to 100 yearsFor urban protection against floods: 100 yearsFor big dikes: 5000 to 10000 years or maximum potential floods
Fig 12: Distribution of risk level from immediate floods in Kosovo 27
27 Assessment of risk from immediate floods, VRAM
REPORT ON THE STATE OF WATER 2015

53
5.2. FLOOD EARLY WARNINGAs part of the Climatic Change Adaptation in the Western Balkan 2012-2014 project supported by GIZ, an early warning system has been established for floods in the basin of Drini. This activity resulted in the installment of measurement meteorological and hydrometric instruments in the Gjonaj hydrometric station in Drini i Bardhe River, in the Gryka e Rugoves station in Bistrica e Pejes River (automatic water level sensor together with the data transfer system connected to the central server in Prishtina through GSM/GPRS), and in three meteorological stations in Peja, Junik and Prizren including automatic rain-meters for precipitation registration and central servers.28 The hydrometric station of Gjonaj located in the Drini i Bardhe River is of special importance as its location near the border with Albania gives it an international character and it covers all waters that drain in the Dukagjini Plain. This station hosts a sensor which automatically registers water levels in time intervals of 15 minutes and supports real time access through GSM/GPRS.The hydrometric station installed in Rugova Canyon in Bistrica e Pejes River also uses a sensor which conducts automatic water level registration in time intervals of 15 minutes and stores data in its data logger, thus enabling non-stop access through the GSM/GPRS system and real time data transfer to the central server of NIPH in Prishtina. The project also installed a central server operating with the Demasdb software for real time data transfer to the central software and for exchanging information with cross-regional hydro-meteorological institutes, in order to ensure effectiveness in early warning in cases of eventual floods.
28 KHI 2014, Report on implementation of the project “Climate Change Adaptation in Western Balkan – Flood Early Warning System in Basin of Drini/Buna” (http://www.ammk-rks.net/repository/docs/RAPORT_MBI_ZBATIMIN_E_PROJEKTIT_1.pdf)

54
Figure 12: Map of hydro-meteorological monitoring stations in basin of Drini/Buna 29
Hydrometric station in Gjonaj
29 KHMI 2014, Report on implementation of the project “Climate Change Adaptation in Western Balkan – Flood Early Warning System in Basin of Drini/Buna”
REPORT ON THE STATE OF WATER 2015

55
5.3. EROSIONErosion is one of the most severe forms of degradation of soil, forests, landscapes, mountain slopes, and residence and road infrastructure.
Table 11: Area of land by category of erosion in Kosovo 30
Category Area in km2 PercentageCategory I – Very strong erosion 714.3 6.6%Category II – Strong erosion 1890.2 17.6%Category III – Medium erosion 3367.7 31.3%Category IV – Weak erosion 3680.2 34.3%Category V – Very weak erosion 1097.5 10.2%Total 10749.9
No complete information is available to assess damages caused by erosion. To prevent erosion, the provisions determined in the Law on Waters need to be enforced and actions foreseen by the Spatial Plan 2010-2020 need to be implemented. Necessary actions include hydro-technical and land management measures.Thus, erosion prevention necessitates a range of technical, program and legal measures, including but not limited to: Limit zones at risk from erosion and develop appropriate measures for each zone.Determine legally zones at risk from erosion.Inform regularly and give instructions to all affected entities.Implement a program that aims law enforcement against violations of provisions
regulating protected areas.
30 Kosovo National Water Strategy 2014 – 2033

56
Table 12. Overview of construction and condition of embankments based on recordings conducted after 2003-2005 31
River Sector
According toMaster Plan
Until1980 After
1980After 2000 Realized
%
Current condition%Projected
area in kmRealizedkm
Realizedkm
Realizedkm
DriniiBardhë
I 20.65II 20.85III 4.54
IV 29.03 13.4 Damaged11.258 Km
Total 75.07 13.4 17.85 84
Istogu19 733 8.188 Damaged
8.188 KmTotal 19.733 8.188 41.49 100
LumbardhiiPejës
I 9.764II 10.130III 10.192IV 4.586 1.685 Damaged Total 34.672 1.685 4.85 5
KlinaKlinëSkenderajTotal
ErenikuUra eTerezive 3.23 Damaged
Total 3.23 20
LumbardhiiLloqanit
Fshat 27.3
Qytet 2.2 1.262 Damaged 2.2 Km
Total 27.3 2.2 1.262 12.68 63
Toplluha
FshatQytetTotali
LumbardhiiPrizrenit
Fshat 7.28
Qytet 1.57 1.25 1.0150.622 Damaged
0.2 KmTotal 8.85 1.25 1.637 32.62 0.07
31 Department of Water, MESP
REPORT ON THE STATE OF WATER 2015

57
SURF
ACE
WA
TER
MO
NIT
ORI
NG
6
6.1. ORGANIZATION OF SURFACE WATER MONITORINGThe monitoring of rivers in the territory of the Republic of Kosovo is conducted by the Kosovo Hydro-meteorological Institute. The quality of these rivers is determined based on physical-chemical analyses and presence of heavy metals. The monitoring network consists of 54 stations. Currently, 10 physical parameters are monitored (11 times a year), 39 chemical parameters (11 times a year) and 8 heavy metals (2 times a year). The complete list of parameters monitored by NIPH is included in Annex 3 of this report. The basin of Drini i Bardhe include 10 rivers with 23 monitoring stations (10 of which are referent stations and are monitored 2 times a year and 13 are located along river flows and are monitored 11 times a year).The basin of Iber includes 8 rivers with 18 monitoring stations (5 of which are referent stations and are monitored 2 times a year and 13 are located along river flows and are monitored 11 times a year). The basin of Morava e Binces included 2 rivers with 6 monitoring stations (2 of which are referent stations and are monitored 2 times a year and 4 are located along river flows and are monitored 11 times a year).

58
The basin of Lepenc includes 2 rivers with 7 monitoring stations (2 of which are referent stations and are monitored 2 times a year and 5 are located along river flows and are monitored 11 times a year).Codes and locations of monitoring stations are presented in Annex 4 of this report. The following map shows the distribution of monitoring stations in Kosovo rivers.
Figure 13: River water quality monitoring stations
REPORT ON THE STATE OF WATER 2015

59
6.1.1. Basin of Drini i BardheThis basin has the greatest area of all river basins in Kosovo. The monitoring network of this basin consists of 23 monitoring stations of the physical and chemical quality. Three of these are base stations belonging to the Drini i Bardhe River: one at the river source in Radavc mountain above Peja, one at the confluence of Istog and Klina rivers in Klina, and the last one at the confluence of the rivers of Lumbardhi i Pejes, Decani, Mirusha, Erenik, Rimnik and Toplluha, located at the bridge in Gjonaj village of Has. The quality of water varies as it flows through stations. Thus, water at the source has a good quality, but at the other two stations there is pollution caused by untreated waters discharged into the main river and into the rivers mentioned above which are sub-basins of this river. Pollution is also caused by water used to wash agricultural land.Results of physical-chemical analyses for the last five years show that the quality of water at all river sources is good. The situation starts to change when approaching settlements due to the discharge of wastewater and water from industrial collectors along the flow of this river basin. Another cause of pollution is the throw of waste especially at locations of bridges. Water has a good quality up to the point of confluence with Istog River. Drastic changes begin in the regions of Zllakuqan–Ruhot and Zllakuqan–Klina. At the point of confluence of Drini i Bardhe and Klina rivers, the quality of water is very poor. To conclude, water of the basin of Drini i Bardhe is polluted by discharges into the sub-basins, which have beforehand been subject to human action. This situation continues up to Vllashnje at the point of flow into Lumbardhi i Prizrenit. Istog River – Originates from the mountain above the town of Istog with a very good quality, which does not change up to its confluence with the Drini i Bardhe River. It is known as the cleanest river in Kosovo.Klina River – The first monitoring station for this river is located in Cerpule, which does not meet the criteria as the first or main source because of its location far from the source. Until water reaches this location it is affected by human activity, therefore its quality at both monitoring stations is poor, as shown in the laboratory tests given in figures. Lumbardhi i Pejes River (Bistrica e Pejes) – It is formed from several sources along the Rugova Canyon, the primary monitoring station of which is located in Drelaj village. It has good physical and chemical quality at the first station, but due to urban and industrial water discharge, this quality worsens. The quality of its water is also affected due to the fact that during the summer irrigation season the river goes dry for approximately two months. The third monitoring station is located near Klina before its confluence with the Drini i Bardhe River, where its quality is very poor. Mirusha River – It is formed in the hills above Bllaca village of Theranda from many small sources. It becomes a full river in the village of Banja e Malisheves (which will be used as a reference point in the future monitoring plan), where it is joined by the powerful surface water source known as Uligja e Banjes. This river is monitored at only one station in Volljak a few meters before it joins the Drini i Bardhe River. Its water has small turbidity, a quantity of dissolved oxygen of 6.41-9.59 mg/l O2, and electrical conductivity of 605-718 µS/cm, therefore it belongs to rivers with medium water quality.Lumbardhi i Decanit River (Bistrica e Decanit) – The first monitoring station of NIPH’s network is located 3 km away from the town above the church, where its quality is very good. The next station is located 10 m before its confluence with the Drini i Bardhe River in Kralan village of Gjakova. Its quality at this station is not very alarming; however,
60
there has been an increase in the values of parameters compared to the first station. There is also turbidity caused because of gravel excavation from its riverbed by private companies operating tens of meters above the monitoring station. Erenik River – The first water quality monitoring station of this river is located in the mountains above the village of Jasiq (Municiality of Junik). There is no human influence on the water at that point; therefore, its quality is very good. The second station is located near the confluence with the Drini i Bardhe River at the Ura e Terzive bridge in Gjakova. The quality of water at this point is poor as analyses showed a presence of detergents. There is always foam on the surface this river, which is supposed to result from textile washing or car-washing activities or other uses of detergents from industries operating in the region and which discharge water without prior treatment. Rimnik River – Its monitoring begins at the place called Zhdrella not far from its source. It is known as a river with a higher conductivity (529 - 770 µS/cm) than all the other river sources and for its considerable quantity of heavy metals. Its next station is located a few meters before its confluence with Drini i Bardhe River in Xerxe, measurements at which show a low quantity of oxygen and a high quantity of Ammonium ions, phosphates, etc.Toplluha River – The first monitoring station for this river is located at the place called Buqalla above the touristic compound SOLID in Theranda. The quality of its water resulted good in all measured parameters. However, this quality is poorer at the second station in Pirana village a few meters before its confluence with the Drini i Bardhe River. It has a permanent high turbidity because of gravel excavation from its riverbed.Lumbardhi i Prizrenit River (Bistrica e Prizrenit) – It originates from Prevalla with a torrent flow. Its first monitoring station is located in the Prevalla Canyon and measurements conducted in it show a good quality of water in all parameters. The second station is located in Vllashnje village 3,5 km before its confluence with the Drini i Bardhe River and the quality of water at this point is considerably poorer because of wastewater discharged into it along the flow.
6.1.2. Basin of IberThe basin of Iber has 18 monitoring stations, three of which belong to the Iber River. Thus, the first station is located in Kushtova and its measurements show a satisfactory water quality. The next station is located at the town exit and monitors water after urban and other discharges resulting in a poorer water quality. The third station is located in Kelmend after its confluence with the Sitnica River, which contains water from all the sub-basins of this river basin. No alarming case has been noticed during this monitoring period.Sitnica River – Starting from Ferizaj and up to Mitrovica, this is the most polluted river in Kosovo. Regarding physical parameters, suspended materials are present and exceed maximum allowed values. This is caused by the flow of Nerodime River, the rivers of Shtime, Graqanka, Prishtevka, Drenica, Llap and Trepca and other smaller streams into it, which contain household and industrial water discharges. The monitoring of chemical parameters such as the quantity of dissolved oxygen and SHBO5 indicate permanent pollution of the river. Llap River – This river is monitored from its source in Murgulla village, then outside the town of Podujevo and finally in Milloshevo before its confluence with the Sitnica River. Based on the monitoring results, the water does not exceed maximum allowed values.Prishtevka River – This river is monitored in Bresje of Fushë Kosova before it flows into
REPORT ON THE STATE OF WATER 2015

61
the Sitnica River. It is one of the most polluted rivers in Kosovo as it collects all urban waste water discharges of Prishtina. The monitoring showed that its water exceeds allowed values of nitrites and suspended materials, chemical and biochemical spending of oxygen, lack of dissolved oxygen, presence of detergents, etc.Graqanka River – The water quality of this river is continuously polluted as a result of water pumping from Kishnica and Artana mines. It has high values of electrical conductivity and sulphate ions. It dries during summer.Drenica River – This river is monitored in Pjetershtica and before its confluence with Sitnica River in Vragoli. Its water has a good quality in spring at the first station, whereas its quality changes at the second station in Vragoli; thus, its electrical conductivity increases by hundreds of units as a result of the discharge of water from KEK’s surface mining.Shtime River – This river is monitored at two stations; at the first station its quality is measured before the river is affected by human activity, resulting in a good quality of water. At the second station, its quality is measured after the discharge of urban wastewater from the town of Shtime and surrounding villages, resulting in a poor water quality.
6.1.3. Basin of Morava e Binces and Lepenc Morava e Binces – The monitoring of this river is conducted in Kurbuliq, then in Kllokot and Uglar (Raniluga), and finally at the border with Serbia in Domorovc. This river joins Kriva Reka River in Dardana. The Urban and industrial waters of Viti, Gjilan and Dardana are discharged into it.Kriva Reka River – This river consists of two flows and at the first monitoring point its water has a good quality, whereas at the second station in Domorovc its quality is poorer because of parameters such as turbidity, ammoniac and nitrites.Lepenc River – This river has two sources, one of which in the Prevalla Mountain and the other in the Brezovica Mountain. The quality of water at both sources is good and this level is maintained until the Silkapor factory discharge site where occasionally water has a higher turbidity as a result of the discharge of waters used for raw materials washing in the factory. The turbidity continues for some kilometers and is observed at the second monitoring station, which is located in Kacanik, before the confluence of Lepenc River with Nerodime River. Finally, the quality of this river is monitored at the third station in Han i Elezit, which is a cross-border station with the Republic of Macedonia. The quality of water at this point is within allowed limits.Nerodime River – This river originates in Jezers Mountains of the Municipality of Ferizaj with a good quality of water. At the second station, the quality falls due to the discharge of urban and other waters of Ferizaj region. Its quality gets poorer at the next station in Kacanik, before the confluence of Nerodime River with Lepenc River.

62
6.2. ASSESSMENT AND MONITORING RESULTS6.2.1. Basin of Drini i BardheFor purposes of interpreting the state of Drini i Bardhe sub-basins, the same variability model will be used at their entry and exit points. The following sections interpret the average annual values (AAV32 ) of each parameter of each river of this basin separately.Quantity of dissolved oxygen (O2) – Is in considerable values along the entire flow of this river (basin). The average value of dissolved oxygen in 2010 was 7.52 mg/l O2. In 2011, the minimum and maximum values of this quantity were 5.99mg/l O2 and 8.99 mg/l O2, respectively. In 2012, the minimum value of dissolved oxygen was 6.61 mg/l O2, whereas the maximum annual average of this quantity was 10.22 mg/l O2.Finally, in 2013 the quantity of dissolved oxygen had a minimum value of 5.92 mg/l O2 and a maximum value of 10.53 mg/l O2.
Figure 14: Quantity of dissolved oxygen in Drini i Bardhe Basin in mg/l O2
Biochemical oxygen demand in 5 days (BOD5) – The figure shows this parameter only for the stations located along river flows. Thus, its value was 7.81 mg/l O2 in 2010 and it fell to 6.20 mg/l O2 in 2011. The minimum and maximum BOD values for 2012 were 2.22 mg/l O2 and 6.95 mg/l O2, respectively. These values for 2013 were 2.25 mg/l O2 and 6.25 mg/l O2.If we compare the average annual values with the values of serial measurements, the BOD values are even higher.
32 AAV were calculated based on serial monthly values.
REPORT ON THE STATE OF WATER 2015

63
Figure 15: Biochemical oxygen demand in Drini i Bardhe Basin in mg/l O2
Regarding quality, it may be said that there is no marked pollution in none of the monitoring stations. Electrical conductivity (EC)– For years 2010, 2011 and 2012, the lowest values were noted in Lumbardhi i Prizrenit River in Prevalla -- 101.6 µs/cm, 112 µs/cm and 166 µs/cm, respectively. Regarding maximum values, the Rimnik River in Xerxe dominated in 2010 with a value of 689 µs/cm, in 2011 the maximum value of 769 µs/cm was measured in the same river but at the sampling site of Zhdrella. The highest value of 695 µs/cm was measured in 2012 in Klina River at the sampling site of Klina.In 2013, the lowest average annual value was noted in Lumbardhi i Prizrenit River in Prevalla at 99.5 µs/cm, whereas the Rimnik River in Xerxe had the highest EC with a value of 730 µs/cm.
Figure 16: Electrical conductivity in Drini i Bardhe Basin
Hydrogen ion concentration (pH) – The Klina River registered the lowest pH value with 7.74 in 2010, whereas the highest value of 8.34 was registered in the Rimnik River in Zhdrella. A wider pH interval was noted in 2011, with the lowest value of 7.45 shown in Lumbardhi i Prizrenit in Prevalla and the highest value of 8.55 registered in the Tophulla River in Buqalla. In 2012, Lumbardhi i Prizrenit had the lowest pH value of 7.8 in Vllashnje, while Lumbardhi i Pejes marked the highest pH value of 8.3 in Peja. Finally, in 2013

64
Lumbardhi i Prizrenit River had the lowest pH value of 7.94 in Vllashnje, whereas the highest value of 8.39 was reached by Lumbardhi i Decanit River in Kralan.
Figure 17: Hydrogen ion concentration in Drini i Bardhe Basin
Nitrogen-nitrate (N-NO3-) – In 2010, limit of quantification was registered in Lumbardhi i Pejes in Drelaj, whereas in the years 2011, 2012 and 2013, limit of quantification was registered in Drini i Bardhe River in Radavc (0.3 mg/l N-NO3-). The average annual values for 2010 and 2011 reached their maximum in the Toplluha River in Pirana -- 1.973 mg/l N-NO3- and 2.363 mg/l N-NO3-, respectively. In 2012, the Rimnik River reached the maximum value of 1.825 mg/l N-NO3- in Xerxe. Finally, in 2013 the Mirusha River in Banja e Malisheves marked a significant increase reaching an average annual value of 4.848 mg/l N-NO3-.
Figure 18: Nitrogen-nitrate in Drini i Bardhe Basin
Nitrogen-nitrite (N-NO2-) – In 2010, limit of quantification (0.009 mg/l N-NO2) was registered in the Rimnik River in Zhdrella, whereas in 2011 and 2012 this limit was registered in Drini i Bardhe River in Radavc. In 2013, Lumbardhi i Pejes River registered the limit of quantification in Drelaj. Average annual values reached their maximum for the years 2010-2013 were registered in the Rimnik River in Zhdrella, ranging between 0.163 and 0.275 mg/l N-NO2.
REPORT ON THE STATE OF WATER 2015

65
Figure 19: Nitrogen-nitrite in Drini i Bardhe Basin, in mg/l N
Ammonium Nitrogen (N-NH4+) - In 2010, the Istog River in Istog registered the lowest AAV of 0.132 mg/l N-NH4+, whereas in 2011 and 2012 Drini i Bardhe River in Radavc registered the limit of quantification (0.015 mg/l N-NH4+). The lowest AAV for 2013 was registered in Lumbardhi i Prizrenit River in Prevalla with a value of 0.116 mg/l N-NH4+. The maximum AAV for the four years of the monitoring period were registered in the Rimnik River at the monitoring station in Xerxe, with a range of 2.072 – 3.144 mg/lN-NH4+.
Figure 20: Ammonium Nitrogen in Drini i Bardhe Basin, in mg/l N
Since allowed values should not exceed 1.5 mg/l, water has a good quality only at river sources, whereas water at other monitoring stations is resulted to be of a medium or low quality.
Orthophosphate as phosphorus (P-PO43-) – The limit of quantification (0.003 mg/l P-PO43-) is registered at these monitoring stations: in 2010 in Erenik River in Jasiq; in 2011 in Lumbardhi i Decanit River in Kralan; and in 2012 in Drini i Bardhe River in Radavc.

66
In 2013, the minimum AAV of 0.005 mg/l P-PO43- was registered in the Toplluha River in Buqalla. The maximum values for the four years of the monitoring period were registered in the Rimnik River in Xerxe with a range of 0.186- 0.394 mg/l P-PO43-.
Figure 21: Orthophosphates in phosphorus ions in Drini i Bardhe River, in mg/l P
Total phosphorus (poly and ortho) – Total phosphorus values in the basin of Drini i Bardhe show a high level of fluctuation (this parameter has only been given for the stations along river flows). The minimum AAVs of phosphorus for 2010 and 2013 were registered in Drini i Bardhe River in Gjonaj, with values of 0.039 mg/l P and 0.062 mg/l P, respectively. For 2011 and 2012, the lowest AAVs of 0.045 mg/l P and 0.048 mg/l P, respectively, were registered in Lumbardhi i Decanit River in Kralan. On the other hand, maximum AAVs for the four years of the monitoring period were registered in the Rimnik River at the sampling site of Xerxe, with a range of 0.346 – 0.545 mg/l P.
Figure 22: Total phosphorus (poly and ortho) in Drini i Bardhe River, in mg/l P
6.2.2. Basin of IberThe following sections present average annual values for a number of parameters measured by NIPH, which help us interpret the water situation in the basin of Iber.Quantity of dissolved oxygen (O2) – It changes from station to station; however, all the rivers of this basin have a sufficient quantity of dissolved oxygen, except the Prishtevka River in Bresje.
REPORT ON THE STATE OF WATER 2015

67
There is no significant change in the values of 2010, 2011 and 2012. Thus, the highest level of O2 was measured in the Iber River in Kushtova, ranging from 9.01 mg/l O2 to 12.48 mg/l O2, whereas the lowest values for 2010, 2011 and 2012 were registered in the Prishtevka River in Bresje, ranging from 3.43 mg/l to 3.98 mg/l. However, these are average annual values, because there were cases during monthly monitoring that there was no dissolved O2 at this monitoring station.
Figure 23: Dissolved oxygen in Iber Basin, in mg/l O22
In 2013, the lowest AAV of 4.23 mg/l O2 was registered in the Sitnica River in Mitrovica, whereas the highest AAV of 8.47 mg/l O2 was registered in the Erenik River in Jasiq.. Based on this four-year trend, the lowest quantity of dissolved oxygen was registered in the Prishtevka River at the sampling site in Bresje.Biochemical oxygen demand in 5 days (BOD5) – This parameter has been shown in the figure only for the monitoring stations located along river flows. The comparison of values of 2010, 2011, 2012 and 2013 shows minor changes, which implies that the water quality of this basin remains constant from year to year and from season to season. The highest BOD values were registered in the Prishtevka River at the Bresje monitoring station, ranging from 19.67 mg/l O2 in 2010, 11.43 in 2011, to 14.18 mg/l O2 in 2012. In 2013, the highest BOD marked an increase in Prishtevka River in Bresje, reaching a value of 14.88 mg/l O2.

68
Figure 24: Biochemical oxygen demand in Iber Basin, in mg/l O2
Electrical conductivity – The overall situation in these four years remained constant. As the sampling site with the lowest AAVs for 2010-2012 regarding electrical conductivity was the Iber River in Kushtova with a range of 303 µs/cm - 335 µs/cm. The lowest AAV for 2013 was registered in the Llap River in Murgulla at 330 µs/cm. On the other hand, the highest AAVs for the four years of the monitoring period were registered in the Graqanka River in Vragoli, with an interval of values between 1522 µs/cm and 1616 µs/cm.
Figure 25: Electrical conductivity in Iber Basin
Hydrogen ion concentration (pH) – The range of pH values in this basin was 7.68 - 8.19 in 2010, from 7.74 to 8.49 in 2011, and between 7.89 and 8.45 in 2012. Finally, the range of pH values was 7.96 – 8.36 in 2013. To summarize, the water of this basin belongs to a low basic environment.
REPORT ON THE STATE OF WATER 2015
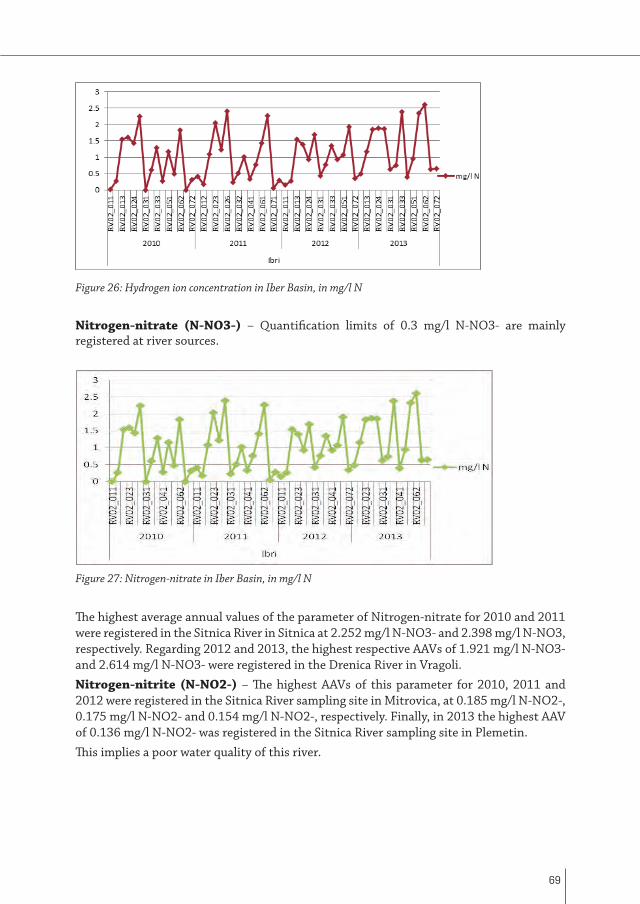
69
Figure 26: Hydrogen ion concentration in Iber Basin, in mg/l N
Nitrogen-nitrate (N-NO3-) – Quantification limits of 0.3 mg/l N-NO3- are mainly registered at river sources.
Figure 27: Nitrogen-nitrate in Iber Basin, in mg/l N
The highest average annual values of the parameter of Nitrogen-nitrate for 2010 and 2011 were registered in the Sitnica River in Sitnica at 2.252 mg/l N-NO3- and 2.398 mg/l N-NO3, respectively. Regarding 2012 and 2013, the highest respective AAVs of 1.921 mg/l N-NO3- and 2.614 mg/l N-NO3- were registered in the Drenica River in Vragoli.Nitrogen-nitrite (N-NO2-) – The highest AAVs of this parameter for 2010, 2011 and 2012 were registered in the Sitnica River sampling site in Mitrovica, at 0.185 mg/l N-NO2-, 0.175 mg/l N-NO2- and 0.154 mg/l N-NO2-, respectively. Finally, in 2013 the highest AAV of 0.136 mg/l N-NO2- was registered in the Sitnica River sampling site in Plemetin.This implies a poor water quality of this river.

70
Figure 28: Nitrogen-nitrite in Iber Basin, in mg/l N
Ammonium Nitrogen (N-NH4+) – The highest values of this parameter were registered in the monitoring station in Bresje for the Prishtevka River for all the years of the monitoring period.
Figure 29: Ammonium Nitrogen in Iber Basin, in mg/l N
The results were the same in 2013, with the highest AAV of 6.237 mg/l N-NH4+ registered in the Prishtevka River in Bresje, whereas the lowest AAVs of this parameter were registered at river sources.Orthophosphates phosphorus (P-PO43-) – The lowest AAVs for 2010, 2011 and 2012 were registered in Drini i Bardhe River in Radavc, with a range from 0.0104 mg/l P-PO43-- 0.0824 mg/l P-PO43-. In 2013, the lowest AAV of 0.0337 mg/l P-PO43- was registered in the Topilla River in Petrova. On the other hand, the highest AAVs of this parameter in the four years of the monitoring period were registered in the Prishtevka River in Bresje, with a range from 0.7771 mg/l P-PO43- to 1.191 mg/l P-PO43-.
REPORT ON THE STATE OF WATER 2015

71
Figure 30: Orthophosphates phosphorus in Iber Basin, in mg/l P
Total phosphorus (poly and ortho) – This parameter has been given only for the monitoring stations along river flows, with the following results: the highest AAVs of total phosphorus for the four years were registered in the Prishtevka River in Bresje, with a range from 0.958 mg/l P – 1.702 mg/l P. The lowest AAVs for 2010, 2012 and 2013 were registered in the Llap River in Millosheva, with a range from 0.159 mg/l P - 0.175 mg/l P, whereas in 2011 the lowest value of 0.128 mg/l P was registered in the Iber River in Mitrovica.
Figure 31: Total phosphorus (poly and ortho) in Iber Basin, in mg/l P
6.2.3. Basins of Morava e Binces and Lepenc In the following sections, average annual values of quality parameters are presented in figures for each separate river of the sub-basins of Morava e Binces and Lepenc.Quantity of dissolved oxygen (DO) – The graph shows a declining tendency of DO values in monitoring station after the discharge of urban wastewater. At upper parts of flows water is clean and rich in oxygen. Oxygen impoverishment of rivers results from oxygen spending due to the discharge of organic matter in the form of urban wastewater.

72
Figure 32: Dissolved oxygen (mg/l O2) in Lepenc and Morava e Binces basins
The DO parameter in the water of the Morava e Binces River in Uglar resulted low in the four years of the monitoring period. The 2010-2012 AAV ranged from 5.86 mg/l O2 to 7.37 mg/l O2. This parameter was registered at its lowest in the Morava e Binces River in Kllokot with a value of 6.35 mg/l O2 in 2013. On the other hand, the highest AAV of 7.02 mg/l O2 was registered in the Morava e Binces in Domorovc.Regarding the Lepenc River Basin, the lowest AAV in the four years of the monitoring period was registered in the Nerodime River in Gerlica, with a range from 4.97 mg/l O2 to 6.96 mg/l O2. On the other hand, the highest AAV was registered in referent stations of rivers; thus, for the Lepenc River, the highest respective AAVs of 9.74 mg/l O2 and 9.69 mg/l O2 for 2010 and 2011 were registered in Prevalla. Finally, in 2013 this parameter was registered at its highest in the Nerodime River in Jezerc, with a value of 9.79 mg/l O2.Biochemical oxygen demand in 5 days (BOD5) – This parameter has been presented only for the monitoring stations along river flows with the following results: it registered its lowest level for 2010, 2011, 2012 and 2013 in the Lepenc River, Kacanik with respective values of 5.27 mg/l O2, 5.69 mg/l O2, 4.48 mg/l O2 and 2.06 mg/l O2. On the other hand, the highest AAVs for the four years of the monitoring period were registered in the Nerodime River in Gerlice at a range from 5.21 mg/l O2 to 9.19 mg/l O2.
REPORT ON THE STATE OF WATER 2015

73
Figure 33: Biochemical oxygen demand (mg/l O2) in Lepenc and Morava e Binces basins
In the Morava e Binces Basin, this parameter registered its lowest level in 2010 in the Kriva Reka River in Domorovc with a value of 3.81 mg/l O2. In 2011, the lowest AAV of 3.55 mg/l O2 was registered in the Morava e Binces River in Uglar. For 2012 and 2013, the lowest AAVs were registered in the Morava e Binces River in Kllokot, 4.7 mg/l O2 and 2.31 mg/l O2, respectively. The highest AAV was registered in the Morava e Binces River in Domorovc for 2010 and 2012, with respective values of 14.12 mg/l O2 and 5.96 mg/l O2. In 2011, the highest AAV of 4.81 mg/l O2 was registered in the Morava e Binces in Uglar, whereas in 2013 this parameter reached its highest value in the Kriva Reka River in Domorovc with 7.79 mg/l O2.Electrical conductivity – Electrical conductivity in 2010 was the lowest in the Lepenc River in Prevalla with a value 86 µs/cm, whereas it was the highest in the Morava e Binces River in Uglar with a value of 503 µs/cm. In 2011, the lowest AAV was also registered in the Lepenc River in Prevalla at 62 µs/cm, whereas it reached its maximum in the Kriva Reka River in Domorovc with a value of 765 µs/cm. In 2012, the lowest value of 116 µs/cm was registered in the Nerodime River in Jezerc, while the highest value of 632 µs/cm was registered in the Kriva Reka River in Domorovc.
Figure 34: Electrical conductivity (µs/cm) in the Lepenc and Morava e Binces basins

74
In 2013, this parameter registered its lowest AAV of 131 µs/cm in the Nerodime River in Jezerc and its highest value of 600 µs/cm in the Kriva Reka River in Domorovc.Hydrogen ion concentration (pH) – The pH values ranged between 7.63 and 8.24 in 2010, between 7.62 and 8.26 in 2011, between 7.73 and 8.32 in 2012 and between 7.9 and 8.24 in 2013.
Figure 35: Hydrogen ion concentration (pH) in the Lepenc and Morava e Binces basins
Nitrogen-nitrate (N-NO3-) – In the Lepenc Basin, the Nitrogen nitrates are present with a quantification limit of (0.3 mg/l N-NO3-), mainly at river sources. In addition, the highest AAV for 2010, 2011 and 2012 was registered in the Nerodime River in Kacanik at 1.35 mg/l N-NO3-, 1.049 mg/l N-NO3- and 0.989 mg/l N-NO3-, respectively. As for 2013, the highest AAV of 1.211 mg/l N-NO3- was registered in the Nerodime River in Hani i Elezit
Figure 36: Nitrogen-nitrate (mg/l N-NO3-) in Lepenc and Morava e Binces basins
In the Morava e Binces Basin, the lowest value for 2010, 2011 and 2012 was registered in the referent sampling site of the Kriva Reka River in Zebinca with a quantification limit of 0.3 mg/l N-NO3-, whereas in 2013 the quantification limit was registered in the Morava e Binces in Kurbuliq. The highest AAV in 2010 was registered in the Kriva Reka River in Domorovc at 1.595 mg/l N-NO3-, in 2011 and 2013 in the Morava e Binces River in Uglar at 1.387 mg/l N-NO3- and 1.619 mg/l N-NO3-, respectively, and
REPORT ON THE STATE OF WATER 2015

75
in 2012 the highest AAV of 1.369 mg/l N-NO3- was registered in the Morava e Binces River in Domorovc.Nitrogen-nitrite (N-NO2-) – In the Lepenc Basin, the quantification limit of 0.009 mg/l N-NO2- was registered in the Lepenc River in Prevalla for the four monitoring years. On the other hand, the highest AAV was registered in the Nerodime River in Kacanik with a range from 0.182 mg/l N-NO2- to 0.259 mg/l N-NO2-.In the Morava e Binces Basin, the Morava e Binces River in Domorovc registered the lowest AAV of 0.035 mg/l N-NO2- in 2010, 0.018 mg/l N-NO2- in 2011, it reached the quantification level (0.009 mg/l N-NO2-) in 2012, whereas the lowest AAV of 0.026 mg/l N-NO2- was noted in the Kriva Reka River in Zebinca.
Figure 37: Nitrogen-nitrite (mg/l N-NO2-) in Lepenc and Morava e Binces basins
On the other hand, the highest AAV for 2010 and 2012 was registered in the Morava e Binces River at the Domorovc monitoring station: 0.125 mg/l N-NO2- and 0.142 mg/l N-NO2-, respectively. In 2011 and 2013, the highest AAV was registered at the Uglar monitoring station of the same river: 0.191 mg/l N-NO2- and 0.146 mg/l N-NO2-, respectively.Ammonium Nitrogen (N-NH4+) – As a pollution factor, it is present in high quantities after the discharge of urban and rural wastewater. In alkaline environments of pH > 10, ammoniac has harmful effects upon the aqueous fauna. Its presence results in a foul smell.

76
Figure 38: Ammonium Nitrogen (mg/lN-NH4+) in Lepenc and Morava e Binces basins
Regarding the Lepenc Basin, the lowest AAV of this parameter in the four monitoring years ranged from 0.05 mg/lN-NH4+ to 0.206 mg/lN-NH4+ and were registered in the Lepenc River in Prevalla. On the other hand, the highest AAV was registered in the Nerodime River in Gerlica and ranged between 3.108 mg/lN-NH4+ and 9.047 mg/l N-NH4+. As for the Morava e Binces Basin, the lowest AAV of this parameter were registered in the Morava e Binces River in Kurbuliq in the four monitoring years, ranging from 0.023 mg/l N-NH4+ to 0.498 mg/l N-NH4+. On the other hand, the highest AAV was registered in the Uglar monitoring station of the same river, ranging from 1.242 mg/l N-NH4+ to 5.597 mg/l N-NH4+.Orthophosphates phosphorus (P-PO43-) – In the Lepenc Basin, the following lowest AAVs were registered in the four monitoring years: 0.006 mg/l P-PO43- in 2010 at the Prevalla monitoring station of the Lepenc River, 0.079 P-PO43- in 2011 at the Kacanik monitoring station of the same river, and 0.006 P-PO43- and 0.004 P-PO43- in 2012 and 2013, respectively, at the Jezer monitoring station of the Nerodime River. On the other hand, the highest AAV in all the years was registered at the Gerlica monitoring statin of the Nerodime River, ranging from 0.316 mg/l P-PO43- to 0.566 mg/l P-PO43-. As for the Morava e Binces Basin, the lowest AAV was registered at a value of 0.143 mg/l P-PO43- in 2011, whereas for the other three years, the minimum level of phosphorus in orthophosphates ranged from 0.004 mg/l P-PO43 to 0.037 mg/l P-PO43-. The highest AAV was registered in the Morava e Binces River at the Uglar monitoring station, ranging from 0.213 mg/l P-PO43- to 0.339 mg/l P-PO43-.
Figure 39: Orthophosphates phosphorus (mg/l P-PO43-) in Lepenc and Morava e Binces basins
REPORT ON THE STATE OF WATER 2015
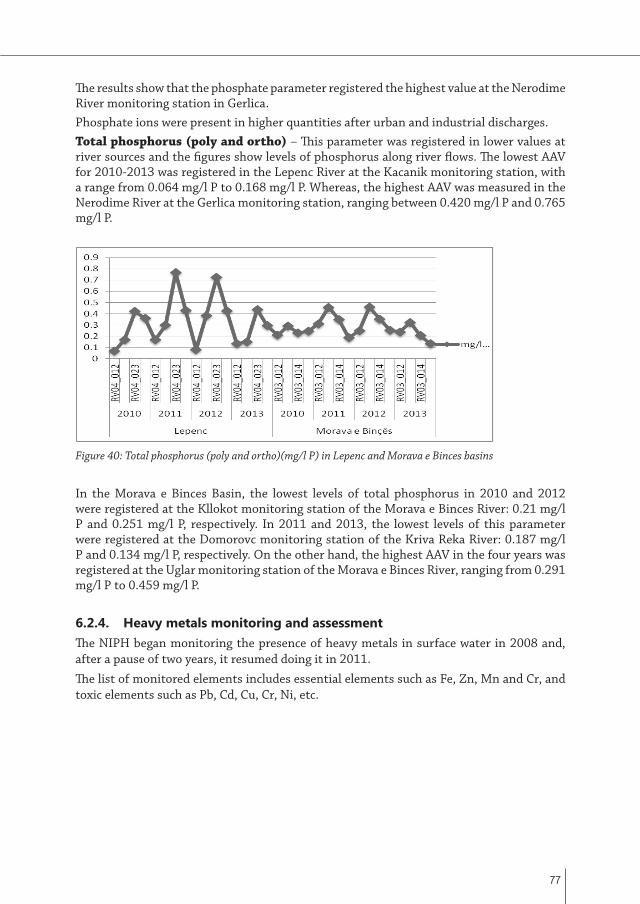
77
The results show that the phosphate parameter registered the highest value at the Nerodime River monitoring station in Gerlica. Phosphate ions were present in higher quantities after urban and industrial discharges.Total phosphorus (poly and ortho) – This parameter was registered in lower values at river sources and the figures show levels of phosphorus along river flows. The lowest AAV for 2010-2013 was registered in the Lepenc River at the Kacanik monitoring station, with a range from 0.064 mg/l P to 0.168 mg/l P. Whereas, the highest AAV was measured in the Nerodime River at the Gerlica monitoring station, ranging between 0.420 mg/l P and 0.765 mg/l P.
Figure 40: Total phosphorus (poly and ortho)(mg/l P) in Lepenc and Morava e Binces basins
In the Morava e Binces Basin, the lowest levels of total phosphorus in 2010 and 2012 were registered at the Kllokot monitoring station of the Morava e Binces River: 0.21 mg/l P and 0.251 mg/l P, respectively. In 2011 and 2013, the lowest levels of this parameter were registered at the Domorovc monitoring station of the Kriva Reka River: 0.187 mg/l P and 0.134 mg/l P, respectively. On the other hand, the highest AAV in the four years was registered at the Uglar monitoring station of the Morava e Binces River, ranging from 0.291 mg/l P to 0.459 mg/l P.
6.2.4. Heavy metals monitoring and assessmentThe NIPH began monitoring the presence of heavy metals in surface water in 2008 and, after a pause of two years, it resumed doing it in 2011.The list of monitored elements includes essential elements such as Fe, Zn, Mn and Cr, and toxic elements such as Pb, Cd, Cu, Cr, Ni, etc.

78
Table 13. Maximum allowed values of some heavy metals in surface water, based on Legislative Decree No. 152 of 11 May 1999 33
No. Metal Symbol Measurement unit MAV
1 Cadmium Cd µg/l 5
2 Chromium Cr µg/l 50
3 Manganese Mn µg/l 50
4 Iron Fe µg/l 200
5 Nickel Ni µg/l 20
6 Lead Pb µg/l 10
7 Copper Cu µg/l 1000
8 Zinc Zn µg/l 3000
The following sections show which heavy metals exceed Maximum Allowed Values (MAV) in the rivers of Kosovo.Drini i Bardhe Basin – According to the Legislative Decree dated 11 May 1999, metals Manganese, Iron and Zink exceed MAVs (See below graphs for these metals).Manganese – In 2011, quantification limits (4.5 µg/l) were mainly registered in referent monitoring stations. On the other hand, MAVs were exceeded along the flows of the Istog River in Zllakuqan, Klina River in Klina, Lumbardhi i Pejes outside Peja, Erenik at Ura e Terzive Bridge, Rimnik River in Xerxce and Toplluha River in Pirana.In 2012, quantification limits were also recorded in referent stations, whereas MAV exceeding of Manganese was recorded at these sampling sites: Gjonaj for Drini i Bardhe River, Klina for Klina River, Peja and Grabanica for Lumbardhi i Pejes, Kralan for Lumbardhi i Decanit, Ura e Terzive Bridge for Erenik River, Xerxe for Rimnik River, Pirana for Toplluha River and Vllashnje for Lumbardhi i Prizrenit.Similarly, in 2013 quantification limits were registered at referent monitoring stations, whereas Managanese levels exceed MAVs at the following monitoring stations: Gjonaj for Drini i Bardhe River, Ura e Terzive Brdige for Erenik River, Xerxe for Rimnik River, Pirana for Toplluha River and Vllashnje for Lumbardhi i Prizrenit River.
33 LEGISLATIVE DECREE No. 152 dated 11 May 1999, Provisions on water protection from pollution, Directive 91/271/EEC for treatment of discharged urban wastewater
REPORT ON THE STATE OF WATER 2015

79
Figure 41: Presence of Manganese in Drini i Bardhe Basin
The highest Manganese contamination in Drini i Bardhe Basin was recorded in the Rimnik River at Xerxe monitoring station for these three years.Iron – In 2011, the quantification limit of 4.5 µg/l was registered at referent stations, whereas MAV exceeding was registered at the following monitoring stations: Zllakuqan for Istog River, Grabanica for Lumbardhi i Pejes River, Ura e Terzive Brdige for Erenik River and Vllashnje for Lumbardhi i Prizrenit River.In 2012, the presence of iron exceeded MAVs in the following monitoring stations: Gjonaj for Drini i Bardhe River, Grabanica for Lumbardhi i Pejes River, Krelan for Lumbardhi i Decanit, Ura e Terzive Bridge for Erenik River, Xerxe for Rimnik River, Pirana for Toplluha River and Vllashnje for Lumbardhi i Prizrenit River.
Figure 42: Presence of iron in Drini i Bardhe Basin
In 2013, the presence of iron exceeded MAVs in the following monitoring stations: Gjonaj for Drini i Bardhe River, Ura e Terzive Bridge for Erenik River, Xerxe for Rimnik River, Pirana for Toplluha River and Vllashnje for Lumbardhi i Prizrenit River.Iber Basin – The presence of heavy metals Chromium, Manganese and Iron was recorded in this basin. The figures below present only the metals that exceed MAVs.

80
Chromium – The quantification limit of 9 µg/l was registered at referent monitoring stations in 2011-2013. In 2011, the presence of Chromium exceeded MAV at the following stations: Kelmend for Iber River, Marinca and Podujeva for Llap River, and Vojnovc for Shtime River. In 2012, MAV exceeding was recorded at the monitoring station in Vragoli for the Drenica River.In 2013, Chromium concentration exceeded MAV in the monitoring stations of Mitrovica and Kelmend along the flow of Iber River, and at Bresje monitoring station of the Prishtevka River.Manganese – Manganese concentration was registered at all monitoring stations of the Iber Basin in these three years. To have a better picture of the Manganese concentration situation, the results recorded at the Vragoli station of the Gracanka River because Manganese concentration was very high in the three monitoring years: Mn2+= 15960 µg/l in 2011, Mn2+= 15961 µg/l in 2012 and Mn2+= 4180 µg/l in 2013. In 2011, Manganese concentration exceeded MAV at the following monitoring stations: Kelmend for Iber River, Vragoli, Plemetin and Mitrovica for Sitnica River, Podujeva for Llap River, Bresje for Prishtevka River, Vragoli for Drenica River and Vojnovc for Shtime River. In 2012, Manganese MAV exceeding was recorded in the following monitoring stations: Kelmend for Iber River, Vragoli and Mitrovica for Sitnica River, Podujeva for Llap Rriver, Bresje for Prishtevka River, Vragoli for Drenica River and Vojnovc for Shtime River.
Figure 43: Presence of Chromium in Iber Basin
Manganese concentration in 2013 exceeded the MAV in the same monitoring stations as in the two previous years: Mitrovica and Kelmend for Iber RIver, Plemetin and Mitrovica for Sitnica RIver, Podujeva and Millosheva for Llap River, Bresje for Prishtevka River and Vragoli for Drenica River.
REPORT ON THE STATE OF WATER 2015

81
Figure 44: Presence of Manganese in Iber Basin
The Graçanka River has the highest Manganese concentration in the three monitoring years.Iron – In 2011, iron concentration MAV exceeding was registered at the Bresje monitoring station of the Prishtevka River and at the Vojnovc station for the Shtime River. In 2012, MAV exceeding was registered at these stations: Bresje for Prishtevka River, Vragoli for Graçanka River and Vojnovc for Shtime River.
Figure 45: Iron concentration in Iber Basin
In 2013, the highest iron concentration was registered in the Prishtevka River at Bresje monitoring station and the Shtime River at Vojnovc station.To summarize, the Prishtevka River resulted as the most iron concentrated river of this basin (average annual value range of 231-397.5 µg/l), followed by the Shtime River (average annual value range of 335-550 µg/l).Basins of Morava e Binces and Lepenc – In these two basins, Manganese and Iron concentration exceeds maximum allowed values according to the EU directive 152/1999, whereas the concentration of other metals is lower than MAVs.
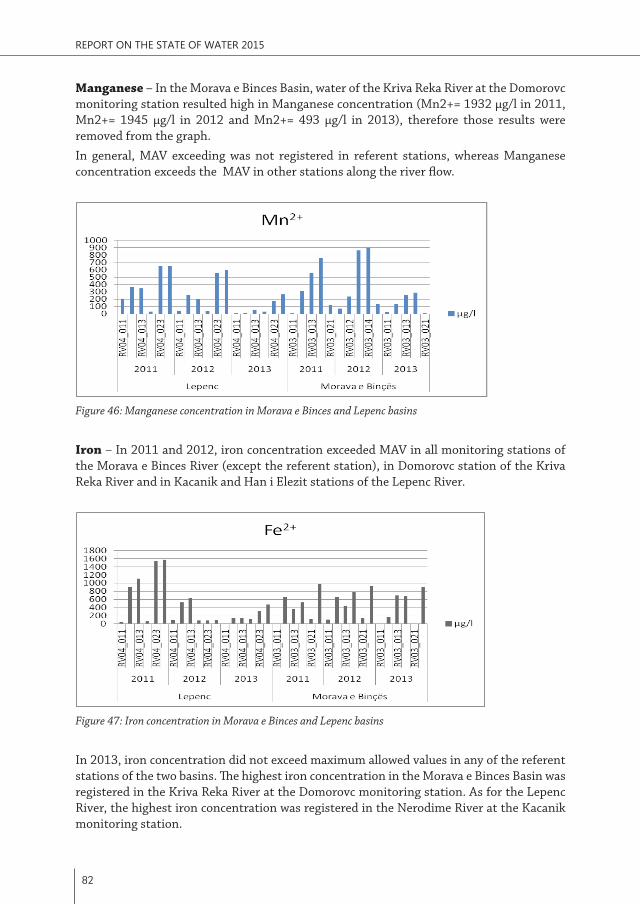
82
Manganese – In the Morava e Binces Basin, water of the Kriva Reka River at the Domorovc monitoring station resulted high in Manganese concentration (Mn2+= 1932 µg/l in 2011, Mn2+= 1945 µg/l in 2012 and Mn2+= 493 µg/l in 2013), therefore those results were removed from the graph.In general, MAV exceeding was not registered in referent stations, whereas Manganese concentration exceeds the MAV in other stations along the river flow.
Figure 46: Manganese concentration in Morava e Binces and Lepenc basins
Iron – In 2011 and 2012, iron concentration exceeded MAV in all monitoring stations of the Morava e Binces River (except the referent station), in Domorovc station of the Kriva Reka River and in Kacanik and Han i Elezit stations of the Lepenc River.
Figure 47: Iron concentration in Morava e Binces and Lepenc basins
In 2013, iron concentration did not exceed maximum allowed values in any of the referent stations of the two basins. The highest iron concentration in the Morava e Binces Basin was registered in the Kriva Reka River at the Domorovc monitoring station. As for the Lepenc River, the highest iron concentration was registered in the Nerodime River at the Kacanik monitoring station.
REPORT ON THE STATE OF WATER 2015

83
6.3. MONITORING OF RIVER WATER QUANTITYThe hydrometric network consists of 22 stations which measure the water quantity in rivers. Some of these stations are out of use due to technical dysfunctions. The parameters of Level (h) and Flux (Q) are measured in these stations. Table 14 presents minimum, medium and maximum values of the annual flux, based on long-term monitoring data of NIPH.
Table 14: Minimum, medium and maximum flux values (Q=m3/s) of hydrometric stations by river basin 34
No. BASIN STATION RIVER Qmin Qmes Qmax
1 DRINI BARDHË Berkovë Istogut 0.48 3.75 1862 Drelaj Bistrica Pejës 0.32 4.20 83.503 Grykë Bistrica Pejës 0.46 5.95 1944 Klinë Klina 000 1.49 49.205 Mirushë Mirusha 0.02 1.21 23.306 Deçan Bistrica e Deçanit 0.60 4.28 58.007 Rakovinë Drini Bardhë 0.80 24.64 3588 Gjakovë Ereniku 0.06 12.33 5429 Piranë Toplluha 0.04 3.47 55.4010 Gjonaj Drini Bardhë 0.10 48.8 111811 Prizren Bistrica Prizrenit 0.03 4.47 42412
IBRI
Drenas Drenica 0.02 1.52 32.8013 Lluzhan Llapi 0.90 5.01 63.8014 Nedakovc Sitnica 0.50 13.62 32815 Milloshevë Llapi 0.00 4.48 82.7016 Prelez Ibri 0.80 13.39 452.8017 Leposaviq Ibri 0.50 30.85 66718
MORAVA BINQËS
Konçul Morava Binçës 0.03 9.21 101219 Domarovc Kriva Reka 0.2 2.6 30.820 Viti Morava Binçës 0.05 1.06 18.7021
LEPENCIKaçanik Nerodime 0.15 4.17 17.50
22 Hani Elezit Lepenci 0.10 10.49 184
Table 15 presents water level data (in cm) for some of the stations which registered measurements levels for 2010-2014.
34 Kosovo Hydrometereological Institute

84
Table 15: Average annual values of water level H (in cm) by measurement station 35
STATION RIVER 2010 2011 2012 2013 2014
Grykë Bistrica Pejës 0.614 0.530 0.669 0.549 -
Drelë Bistrica e Pejës 0.503 0.438 0.515 - -
Prizren Bistrica Prizrenit 0.463 0.361 0.589 0.666 0.593
Mlikë Brod 0.763 0.579 0.638 0.668 0.588
Lluzhan Llapi 1.141 0.843 0.699 0.860 1.042
Milloshëvë Llapi 0.990 0.543 0.566 0.934 -
Viti Morava Binçës 0.333 0.219 0.216 0.193 0.277
Hani Elezit Lepenci 0.692 0.619 0.547 0.630 1.000
Brod Lepenci 0.492 0.397 0.433 0.402 0.480
Gjakovë Ereniku 0.690 0.519 0.597 0.743 0.583
6.4. DRINKING WATER MONITORING The National Institute of Public Health (NIPH) is responsible for monitoring the quality of drinking water in Kosovo, including processed and pumped water provided by the seven regional water companies, water provided by municipal water supply systems in several municipalities, small community providers and bottled source water.The National Institute of Public Health of Kosovo (NIPHK) is also responsible for all health related issues, including the “monitoring and enforcement” of drinking water standards for all water providers in Kosovo, in compliance with provisions of Article 7, Law 2007/02 L78 on Public Health. Water quality standards currently applicable in Kosovo include a number of standards covering microbiological issues comprehensively and a limited number of physical-chemical parameters.Ensuring that provided water is drinkable and of a high quality is essential to the population health and well-being. The quality of drinking water provided by the regional water companies is assessed based on regular monthly reports of NIPHK’s Water Monitoring Center, which is responsible for monitoring and ensuring the quality of water distributed by RWCs. The Center’s assessments show that the water provided by these companies is drinkable and pursuant to legal parameters36. The 2013 performance report for water service providers in Kosovo shows that the water distributed by RWCs complies with several key microbiological and physical-chemical parameters of drinking water quality.The compliance level takes into account the total number of samples analyzed in relation to the number of samples that meet drinking water quality standards. A low compliance may imply a low quality of water.
35 Kosovo Hydrometereological Institute 36 Administrative Instruction No. 16/2012 on drinking water quality for human consumption.
REPORT ON THE STATE OF WATER 2015

85
Microbiological compliance of water37 is the most important indicator with an immediate effect on health. Physical parameters such as color, taste and smell are important for consumer perceptions about the esthetic quality of water. Regarding the bacteriological analysis of water, the test pass rate in 2013 was 98.4%, which is better compared to the pass rate of 97.6% in 2014.The improved performance of the regional water companies of Prishtina, the South Hydrological Station and Mitrovica contributed to the overall result improvement. The performance in other companies remained the same, except RWC Hidrodrini which had a poorer performance this year with a pass rate of 98.6% in bacteriological tests. RWC Radoniqi provided the best quality water in bacteriological terms in 2013 as well.The bacteriological quality of water was mainly compromised by the presence of coliform and E. coli bacteria, which indicated a possible feces contamination of water. The presence of these microorganisms is not allowable in drinking water.
Figure 48: Passed bacteriological and chemical tests (%) by RWC 38
Physical-chemical compliance39 of water quality at sector level during 2013 marked was 97,4%, the same as in 2012.Two RWCs (Mitrovica and South RWC) reported a higher level of physical-chemical noncompliance in 2013.The poor quality of water in physical-chemical terms during 2013 was recorded in the RWC of Mitrovica (covering Mitrovica, Skenderaj and Vushtrri). Compared to 2012, the chemical parameters of Manganese (Mn) and nitrites (NO2) resulted higher than the allowed values. Despite the progress made in 2013, the RWC Hidrodrini still shows high chemical pollution, mainly in the supply area of the Operating Unit in Klina.Water consumption and health effects – Water is an essential natural source for human health and well-being. It is an integral part of almost all economic activities, as well as of aqueous ecosystems. Population growth, environmental degradation, climatic changes,
37 Annual performance report for water service providers in Kosovo, 2013.38 WWRO Annual performance report on water service providers in Kosovo, 201339 Ibid.

86
economic conditions, technological capacity, infrastructure and governance are some of the factors affecting the water situation. The quality of water is directly related to the human health. Improvements in urban wastewater infrastructure and water quality have resulted in a considerable reduction of infective and parasitic diseases. However, poor quality of water remains a threat to public health, especially where the level of hygiene is unsatisfactory. Some infective diseases are directly related to water consumption and quality.Water-borne threats to public health result from various pathogens and microorganisms such as Cyanobacteria related to algae flourishing. Cyanobacteria levels have increased in the majority of European lakes and other water sources used for aquaculture, drinking and recreation. Direct contact with water containing cyanotoxins may cause allergic reaction and skin, eye and ear damages. Insertion of such toxins through water into the body causes gastro-intestinal diseases, liver damaging and also affects the nervous system40.
40 EEA-JRC Report: Environment and human health. Denmark, 2013.

87
7.1. URBAN WASTEWATER DISCHARGEThe collection of urban wastewater includes water of the public service operated by the regional water companies and a number of smaller operators. Based on the Kosovo Statistics Agency census of population, households and dwellings, about 53% of population discharges wastewater into the public sewerage network, 16% into sewerage systems not managed by public companies, 27% use other discharge forms (canals, septic holes, etc.), while 4% does not have access to the sewerage network (See Figure 49).
WAT
ER D
ISCH
ARGE
S
7

88
Figure 49: Population in dwellings by type of wastewater discharge 41
Public service coverage of wastewater collection provided by regional water companies in 2013 was 60%, which marked an increase of 4% compared to 2012. The region of Prishtina has the highest public network coverage with 77.8%, whereas the lowest coverage was registered in the region of Peja with 41.2%.
Figure 50: Sewerage system coverage in Kosovo in RWC service areas 2002-2013 42
41 Kosovo population census 2011, KSA42 Data from performance reports of water service providers 2002-2013, WWRO
107
Mbledhja e ujërave të zeza urbane përfshin ujërat nga shërbimi publik që operohet nga Kompanitë Regjionale të Ujërave dhe një numër i operatorëve tjerë shumë më të vegjël. Sipas të dhënave nga Agjencia e Statistikave të Kosovës, të realizuara nga pyetësori i regjistrimit të popullsisë, ekonomive familjare dhe banesave, rreth 53% e popullsisë e bënë shkarkimin e ujërave të zeza nëpërmjet kanalizimit të lidhur me sistem publik, 16% e bëjnë shkarkimin e ujërave të zeza nëpërmjet kanalizimit që nuk menaxhohet nga kompanitë publike, 27 % e popullsisë përdorin forma tjera të shkarkimit (kanal, grope septike etj), ndërsa 4% nuk ka sistem te kanalizimit. Figura 49.
Figura 49: Popullsia në njësi banesore sipas llojit të shkarkimit të ujërave të zeza41
Mbulushmëria me shërbimet publike të grumbullimit të ujërave të ndotura, që ofrohen nga kompanitë publike të ujërave (KRU) gjatë vitit 2013 ka qenë 60%, që ka shënuar një ngritje për 4 % në krahasim me vitin 2012. Mbulueshmërinë më të lartë me shërbime të ujërave të zeza në zonën e shërbimeve publike për kanalizime e ka regjioni i Prishtinës me 77.8%, ndërsa më të ultë e ka regjioni i Pejës me 41.2 % .
41 Regjistrimi i popullsisë së Kosovës 2011, ASK
REPORT ON THE STATE OF WATER 2015

89
7.2. WASTEWATER DISCHARGE FROM AGRICULTUREThe use of fertilizers in agriculture affects surface waters. Intensification of agricultural production must be accompanied with agricultural-environmental and efficiency measures to minimize pollution risk and to maximize added value. The actual impact of agricultural activities on surface waters is assessed to be low. The average quantity of used fertilizers is 346 kg/ha. The average quantity of used organic fertilizers is 2,845 kg/ha, which is much lower than the rate of use in many EU member states. Supposing that 20% of fertilizers consists of Nitrogen (equivalent to 70 kg per hectare) and the content of 7 kg/T Nitrogen (20 kg per hectare) in organic fertilizers, this implies an equivalent to a combined application Nitrogen rate of 90 kg per hectare, which is much lower than the threshold of 170 kg determined in the Nitrates Directive.43
7.3. WASTEWATER DISCHARGE FROM INDUSTRYWater is important for many industrial processes such as heating, cooling, production, cleaning and rinsing. Industries generate a considerable part of potentially contaminated wastewater. Industrial waters release a big group of complex organic components and heavy metals. The discharge of such waters into surface flows may have harmful effects on the human health and the environment44. The major industrial dischargers in Kosovo include the Kosovo Energy Corporation (KEK), Ferronikel, Sharrcem, Silcapore, and the mines of Trepça, Kishnica and Artana, etc. The polluted water from industries and mines is rich in acidic content and heavy metals.
7.4. WASTEWATER TREATMENTGenerally in Kosovo, there is no wastewater treatment. Wastewater is usually discharged directly into rivers and represents one of the main surface water pollutants. The only wastewater treatment plant is located in Llausha, Skenderaj and it does not function properly due to technical and financial problems. Sipas përmbledhjes së përllogaritjeve në dispozicion nga Studimet e Fizibilitetit për Ujërat e Ndotura nga donatorët, nga Master Plani për ujërat e ndotura për pellgun e lumit Ibër dhe nga Master Plani për komunën e Dragashit i përgatitur nga UNDP, vlerësohet se kostoja totale për trajtimin e ujërave të ndotura arrin rreth 517 milion Euro.However, with the support of foreign donors feasibility studies on wastewater treatment have been conducted in the regions of Prizren, Gjakova, Peja, Gjilan, Ferizaj and Mitrovica. The feasibility studies for Prizren, Gjakova and Peja were financed by KFW (German Bank
43 Kosovo Draft National Water Strategy 2014-2033, MESP44 UNEP, Sick water, The Central Role of Wastewater Management in Sustainable Development, A Rapid response assessment

90
for Development) and the Government of Kosovo, while the studies for Gjilan, Ferizaj and Mitrovica were financed by the European Union.
Wastewater treatment plan in Skenderaj
Based on the summary of available calculations from the feasibility studies on wastewater, the Master Plan of polluted water for the Iber River Basin and the UNDP’s Master Plan for the Municipality of Dragash, the total wastewater treatment costs amount to € 517 million.
Table 16. Wastewater treatment needs assessment
Agglomerate Source of calculation Population equivalent of long-term coverage
Assessed costIn million €
Prishtina KIBP Feasibility Study 625,000 161
Gllogoc Wastewater Master Plan for Iber 70,000 26
Podujeva Wastewater Master Plan for Iber 94,000 30
Shtime Wastewater Master Plan for Iber 27,000 11
Mitrovica - Vushtrri Wastewater Master Plan for Iber 185,000 59
Prizren KfW Feasibility Study 140,000 60
Gjakova KfW Feasibility Study 80,000 54
Peja KfW Feasibility Study 100,000 64
Gjilan KIBP Feasibility Study 140,000 34
Dragash UNDP Master Plan 30,000 18
Total 1,491,000 517.00€
REPORT ON THE STATE OF WATER 2015

91
FEES
FOR
WAT
ER U
SE
AND
WAT
ER SE
RVIC
ES
8
8.1. WATER AND WASTEWATER SERVICE FEES Water and wastewater service fees are set by the WWRO based on principles, criteria and procedures defined in the legal and regulatory framework. Fees for these services are determined based on applications made by regional water companies and on the principle of covering operative and capital costs necessary for service provision.During 2012 - 2014, the fixed consumer service component was 1 Euro per month for household consumers and 3 Euros per month for commercial and institutional consumers. Table 17: Fixed fees in Euros (per consumer per month) for all RWCs 45
Type of consumer 2012 2013 2014
Household 1 1 1
Commercial 3 3 3
Institutional 3 3 3
45 Water and wastewater services fees, WWRO 2012

92
The table below presents the average volumetric fees for all RWCs during 2012-2014.
Table 18: Average volumetric fees for drinking water and wastewater services for 2012 – 2014 (euro/m3) 46
Type of service 2012 2013 2014
Water supply (per m3 of sold water)
Household 0.3141 0.3345 0.3564
Commercial 0.6791 0.6955 0.7016
Institutional 0.6791 0.6955 0.7016
Wastewater (per m3 of water)
Household 0.0593 0.0679 0.0798
Commercial 0.1383 0.1579 0.1828
Institutional 0.1383 0.1579 0.1828
8.2. WATER USE FEESCompensation fees for water use, wastewater discharge and exertion of inert materials from riverbeds and banks is regulated with the Administrative Instruction for Water Payment Structure.The following table provides data on compensation fees for using surface water, groundwater and mineral water as stipulated in this Administrative Instruction.
Table 19: Compensation fees for using surface water, groundwater and mineral water 47
Type of water use Compensation fee
Untreated water used directly 0.001 € për 1m3
Water of drinking quality used for sale To legal entities 0.003 € and citizens 0.0015 € m3
Water of drinking quality used for personal needs 0.003 €
Producers packaging mineral and natural water 0.009 € per liter of sold water
Irrigation of farm land from artificial lakes 10 € per ha
Irrigation of farm land from water flows or natural resources
5 € per ha
Fish ponds 0.15 € per kilogram of sold fish
Electrical energy producers 2.5% of the price per each kilowatt/hour produced in hydro plants 1.7% of the price per each kilowatt/hour produced in closed cooling system power plants
46 Report of fees review findings 2012-2014 for the seven regional companies licensed for providing water and wastewater services, WWRO47,43 Administrative Instruction for Water Payment Structure.
REPORT ON THE STATE OF WATER 2015

93
Data on wastewater discharge compensation are shown in Table 20.
Table 20. Wastewater discharge compensation fees 48
Type of water used Compensation fee
Water used in technical and technological processes related to oil and oil products processing and transportation; ferrous and non-ferrous metallurgy; textile industry; paper industry; leather industry; farms; butchery and meat industry; and vehicle services.
0.03 € për 1 m3;
Water from other industries not mentioned above 0.02 € per 1 m3;
Urban water collected in sewerage systems 0.001 € per 1 m3;
Other types of used waters 0.010 € per 1 m3;
Water used in open cooling system power plants 1.5% € per 1 m3
48 Administrative Instruction for Water Payment Structure.

94

95
WAT
ER S
ECTO
R IN
VEST
MEN
TS A
ND
PR
OJE
CTS
8
9.1. WATER SECTOR INVESTMENTSImportant investments have been made in the water sector49 by the Government of Kosovo and foreign donors. Investment by the Government of Kosovo focused on regulation of rivers and improvement of water infrastructure especially for water and wastewater services.
Table 21. Water sector investments (in million €) for 2000-2012 by the Government of Kosovo 50
Source of investment 2000 2001 2002 2003 2004 2005 2006 2007 2008 2009 2010 2011 2012
Government of Kosovo 1.02 1.64 2.23 0.63 0.96 3.13 4.46 4.17 6.06 14.63 14.18 12.74 13.00
Donor investments also focused mainly on improving water sector services and on feasibility studies for water treatment infrastructure.
49 Water sector refers to drinking water, sewerage, irrigation, accumulations, rivers, administration of water resources, etc.50 Historical trend of water sector investments in Kosovo, Arian Shuku 2012

96
Figure 51: Water sector investments (in million €) for 1999-2014 by foreign donors
Based on available data, total investments in the water sector since 1999 amount to € 255.77 million, out of which € 189.9 million were donations. The main foreign donors include the European Union, the Swiss Government and the KfW (German Development Bank), which together have invested a total of € 154.9 million or 61% from total investments. The highest level of investments was in 2010, with a total of € 26.63 million..
Figure 52: Total investments in the water sector 2000-2012 51
51 Historical trend of water sector investments in Kosovo, Arian Shuku 2012
REPORT ON THE STATE OF WATER 2015

97
9.2. REGIONAL AND TRANSBOUNDARY PROJECTS
7.4.1. Transboundary cooperation for sustainable water managementSustainable water management is an environmental challenge in all countries. Transboundary environmental impact is regulated with international conventions, and host country agreements, directives and other legal acts52. Generally, these international agreements contribute to increased understanding and dialogue encouraging between two or more countries related to the management of transboundary natural resources and the prevention of negative effects. Institutional and transboundary cooperation is necessary to promote integrated management of water resources and solution of transboundary management problems.Kosovo as a territory is part of cross-border basins. All river basins of Kosovo are part of cross-border basins; thus, the basins of Iber and Morava e Binces are transboundary basins of the Danub River Basin, whereas the Drini i Bardhe Basin belongs to the Drini River Basin. Consequently, Kosovo participates in drafting protection policies for cross-border basins of the Drini Basin and is also a member of the Transboundary Basin Protection Commission. Numerous interstate conferences have been organized between Greece, Macedonia, Albania, Kosovo and Montenegro.The main objectives of transboundary cooperation include: integration of water resources, transboundary management of water quality, management of cross-border water resources, and provision of services in transboundary water administration. In order to achieve these objectives, it is important to comply with relevant agreements and directives, which recommend the implementation of common transboundary water management and protection measures, such as: standards regulating transboundary water quality and emissions, water quality monitoring, risk level identification, classification of water bodies, management plans development, public information and public involvement in decision making processes.
8.6.1. Climate Change Adaptation Program in Western Balkans53
The Danube Water Program began its implementation in 2013 with the support of the World Bank. Kosovo participates in this program together with 12 countries of the Danube Region (Austria, Albania, Ukraine, Romania, Moldavia, Bulgaria, Macedonia, Serbia, Croatia, Bosnia and Herzegovina, and Montenegro). This project aims to help these countries in constructing strong and sustainable water and wastewater services. The Work Plan is built on five pillars: policies, tariffs, resource management and investment planning, and service efficiency improvement. The program is implemented using three main instruments: analytical and counseling actions, knowledge sharing platform and capacity development activities.
52 Transboundary Water Management, Climate Change Adaptation in Western Balkan (www.giz.de)53 http://www.danube-water-program.org/
98
8.6.2. The Danube Water Program (IAWD) The Danube Water Program began its implementation in 2013 with the support of the World Bank. Kosovo participates in this program together with 12 countries of the Danube Region (Austria, Albania, Ukraine, Romania, Moldavia, Bulgaria, Macedonia, Serbia, Croatia, Bosnia and Herzegovina, and Montenegro). This project aims to help these countries in constructing strong and sustainable water and wastewater services. The Work Plan is built on five pillars: policies, tariffs, resource management and investment planning, and service efficiency improvement. The program is implemented using three main instruments: analytical and counseling actions, knowledge sharing platform and capacity development activities.
REPORT ON THE STATE OF WATER 2015

99
10. CONCLUSIONS AND RECOMMENDATIONS
10.1. CONCLUSIONSKosovo has not adopted its National Water Strategy yet.Its actual legal basis needs to be amended and harmonized with European Union
directives.Despite marked progress, water sector institutions still face problems and shortcomings.Kosovo is still in the construction phase for infrastructure required for drinking water,
sewerage networking, wastewater treatment, flood protection, etc. Lack of wastewater treatment plants is considered one of key problems in the water
sector.Pollution of surface water is still considered to be high.The surface water monitoring system needs modernization, while there is no
groundwater monitoring system.There is lack of scientific research about water, especially groundwater resources.There is an increased demand for water resources. Despite investments and projects in the water sector, needs and requests for support
remain numerous.
10.2. RECOMMENDATIONSAdopt National Water Strategy as soon as possible.Complete water legislation and harmonize it with European Union directives.Complete and modernize surface water quality monitoring system and establish
groundwater monitoring system. Promote sustainable use of water resources.Build wastewater treatment plants.Establish water saving measures in all sectors.Maintain and expand water supply and sewerage systems.Increase cooperation and information between central and local institutions.Conduct scientific research on water focusing on groundwater resources.Raise awareness and education levels on protection and sustainable use of water
resources.Assess needs for water infrastructure investments and prioritize them.

100
11. REFERENCES • Administrative Instruction for Water Payment Structure, MESP• Assessment of risk from immediate floods, VRAM• Degradation of rivers in Kosovo; Integrating ecological knowledge into nature con-
servation and ecosystem management, 44th annual meeting, GFO2014, Semptember 8-12 th, 2014, Hildesheim, Germany
• EEA-JRC Report; Environment and human health. Denmark, 2013.• GFO2014, Degradation of rivers in Kosovo; Integrating ecological knowledge into na-
ture conservation and ecosystem management, 44th annual meeting, September 8-12, 2014, Hildesheim, Germany
• Historical trend of water sector investments in Kosovo, Arian Shuku 2012• KHI 2014, Report on implementation of the project “Climate Change Adaptation in
Western Balkan – Flood Early Warning System in Basin of Drini/Buna” • Kosovo National Water Strategy 2014 – 2033• Kosovo population census 2011, KSA• Law 03/L-087 on Publicly Owned Enterprises• MESP/KEPA, The state of water Report in Kosovo, 2010• MESP/KEPA: River Situation Assessment Report, 2014, Prishtina• Monthly and annual environmental reports of KEK 2009-2013• Monthly and annual environmental reports of NewCo Feronikel 2009-2013• Monthly and annual environmental reports of SharrCem 2009-2013• Professional proposal for declaring the Wetland of Henc a Special Protection Area,
MESP/KEPA• Progress Report 9 Kosovo, Monitoring transposition and implementation of the EU
environmental acquis, EC, 2014• Report of fees review findings 2012-2014 for the seven regional companies licensed for
providing water and wastewater services, WWRO • Sustainable Energy Options for Kosovo,2012, Daniel M. Kammen et al., University of
California, Berkeley• Transboundary Water Management, Climate Change Adaptation in Western Balkan
(www.giz.de)• The Central Role of Wastewater Magagement in Sustanaible Development, A Rapid
response assessment, UNEP.• UNEP, Sick water, The Central Role of Wastewater Management in Sustainable Deve-
lopment, A Rapid response assessment• WWRO, Annual performance report on water service providers in Kosovo, 2013.
REPORT ON THE STATE OF WATER 2015

101
12. ANNEXES
12.1. ANNEX 1 Index of tablesTable 1: EU directives for water quality and level of transposition with domestic
legislationTable 2: Basic data on rivers and river basinsTable 3: General characteristics of accumulating lakesTable 4: Basic hydrological features of planned accumulationsTable 5: Groundwater accumulations in the Drini i Bardhe basin, their area, volume
and capacityTable 6: Physical-chemical features of some thermo-mineral sourcesTable 7: Availability of water supply networkTable 8: Basic data on the capacity of planned hydro-plantsTable 9: Degraded area by riverTable 10: Water permits issued by MESP, 2011-2013Table 11: Area of land by category of erosion in KosovoTable 12: Overview of construction and condition of embankments based on
recordings conducted after 2003-2005Table 13: Maximum allowed values of some heavy metals in surface water, based on
Legislative Decree No. 152 of 11 May 1999Table 14: Minimum, medium and maximum flux values (Q=m3/s) of hydrometric
stations by river basinTable 15: Average annual values of water level H (in cm) by measurement stationTable 16: Wastewater treatment needs assessmentTable 17: Fixed fees in Euros (per consumer per month) for all WRCsTable 18: Average volumetric fees for drinking water and wastewater services for
2012 – 2014 (euro/m3)Table 19: Compensation fees for using surface water, groundwater and mineral waterTable 20: Wastewater discharge compensation feesTable 21: Water sector investments (in million €) for 2000-2012 by the Government
of Kosovo

102
12.2. ANNEX 2Index of figuresFigure 1: Precipitation in Kosovo 1900-2012Figure 2: Overall and urban population in Kosovo 1948-2011Figure 3: Hydrographic network of main river basins in the Republic of KosovoFigure 4: Coverage of public water supply services in RWC areas (%) 2002-2013Figure 5: Quantity of water spent by public water systems (in million m3/year), 2006-
2013Figure 6: Quantity of water spent for irrigation 2001-2012Figure 7: Irrigated areas 2001-2012Figure 8: Quantity of water spent by KEK for energy productionFigure 9: Quantity of water spent by NewCo Feronikel, 2009-2013Figure 10: Quantity of water spent in Sharrcem, 2009-2013Figure 11: Distribution of planned hydroelectric power plantsFigure 12: Distribution of risk level from immediate floods in KosovoFigure 13: Map of hydro-meteorological monitoring stations in basin of Drini/BunaFigure 14: River water quality monitoring stationsFigure 14: Quantity of dissolved oxygen in Drini i Bardhe Basin in mg/l O2Figure 15: Biochemical oxygen demand in Drini i Bardhe Basin in mg/l O2Figure 16: Electrical conductivity in Drini i Bardhe BasinFigure 17: Hydrogen ion concentration in Drini i Bardhe BasinFigure 18: Nitrogen-nitrate in Drini i Bardhe BasinFigure 19: Nitrogen-nitrite in Drini i Bardhe Basin, in mg/l NFigure 20: Ammonium Nitrogen in Drini i Bardhe Basin, in mg/l NFigure 21: Orthophosphates in phosphorus ions in Drini i Bardhe River, in mg/l PFigure 22: Total phosphorus (poly and ortho) in Drini i Bardhe River, in mg/l PFigure 23: Dissolved oxygen in Iber Basin, in mg/l O2Figure 24: Biochemical oxygen demand in Iber Basin, in mg/l O2Figure 25: Electrical conductivity in Iber BasinFigure 26: Hydrogen ion concentration in Iber Basin, in mg/l NFigure 27: Nitrogen-nitrate in Iber Basin, in mg/l NFigure 28: Nitrogen-nitrite in Iber Basin, in mg/l NFigure 29: Ammonium Nitrogen in Iber Basin, in mg/l NFigure 30: Orthophosphates phosphorus in Iber Basin, in mg/l PFigure 31: Total phosphorus (poly and ortho) in Iber Basin, in mg/l PFigure 32: Dissolved oxygen (mg/l O2) in Lepenc and Morava e Binces basinsFigure 33: Biochemical oxygen demand (mg/l O2) in Lepenc and Morava e Binces
basins
REPORT ON THE STATE OF WATER 2015

103
Figure 34: Electrical conductivity (µs/cm) in the Lepenc and Morava e Binces basinsFigure 35: Hydrogen ion concentration (pH) in the Lepenc and Morava e Binces basinsFigure 36: Nitrogen-nitrate (mg/l N-NO3-) in Lepenc and Morava e Binces basinsFigure 37: Nitrogen-nitrite (mg/l N-NO2-) in Lepenc and Morava e Binces basinsFigure 38: Ammonium Nitrogen (mg/lN-NH4+) in Lepenc and Morava e Binces basinsFigure 39: Orthophosphates phosphorus (mg/l P-PO43-) in Lepenc and Morava e
Binces basinsFigure 40: Total phosphorus (poly and ortho)(mg/l P) in Lepenc and Morava e Binces
basinsFigure 41: Presence of Manganese in Drini i Bardhe BasinFigure 42: Presence of iron in Drini i Bardhe BasinFigure 43: Presence of Chromium in Iber BasinFigure 44: Presence of Manganese in Iber BasinFigure 45: Iron concentration in Iber BasinFigure 46: Manganese concentration in Morava e Binces and Lepenc basinsFigure 47: Iron concentration in Morava e Binces and Lepenc basinsFigure 48: Passed bacteriological and chemical tests (%) by RWCFigure 49: Population in dwellings by type of wastewater dischargeFigure 50: Sewerage system coverage in Kosovo in RWC service areas 2002-2013Figure 51: Water sector investments (in million €) for 1999-2014 by foreign donorsFigure 52: Total investments in the water sector 2000-2012

104
12.3. ANNEX 3Physical, chemical and heavy metals parameters monitored by NIPHK 54
Indicators Symbol UnitFrequency of measurements/Year
Physical parametres
Time h 0:00 11
Weather M Observation 11
Water temperature Tu 0C 11
Air temperature TA 0C 11
Smell Ar Smell 11
Color Ngj Co/Pt 11
Turbidity Tur NTU 11
Electrical conductivity χ µScm-1 11
Dissolved matrers M.tert. mg/l 11
Hydrogen ion concetration pH 0-14 11
CHEMICAL PARAMETRES
Dissolved Oxygen OT mg/l O2 11
Oxygen abundance NgO % 11
Chemical Oxygen Demand SHKO mg/l O2 11
Chemical Oxygen Demand with dichromate SHKO-Cr mg/l O2 11
Biochemical Oxygen Demand SHBO5 mg/l O2 11
Biochemical Oxygen Demand SHBO7 mg/l O2 11
Total Organic Carbon KOT mg/l C 11
Total Suspended Matters MTS mg/l 11
Detergents DET mg/l 11
Nitrate ion NO3- mg/l 11
Nitrate Nitrogen N-NO3- mg/l N 11
Nitrite ion NO2- mg/l 11
Nitrite Nitrogen N-NO2- mg/l N 11
Nitrite ion NH4+ mg/l 11
Ammonium ion N-NH4+ mg/l N 11
Ammonium Nitrogen ATI mg/l N 11
Not ionized ammonium NH3 mg/l 11
Nitrogen of not ionized ammonium N-NH3 mg/l N 11
Total organic+inorganic Nitrogen AT mg/l N 11
Total Organic Nitrogen ATO mg/l N 11
Ortophsfates PO43- mg/l 11
54 Only parameters highlighted in blue are assessed and presented in this report.
REPORT ON THE STATE OF WATER 2015

105
Phosphorus of orto phosphates P - PO43- mg/l P 11
Total Phosphorus (poli+orto) Ptot. mg/l 11
Sulphate Ion SO42- mg/l 11
Total hardness Fp 0dH 11
Calcium hardness Fca mg/l 11
Magnesium hardness FMg mg/l 11
Calcium Ion Ca+ mg/l 11
Magnesium Ion Mg+ mg/l 11
P-Alkalinity Pa ml 0.1 e HCl 11
M-Alkalinity Ma ml 0.1 e HCl 11
Total Alkalinity AT mmol/l HCl 11
Bicarbonates HCO3- mg/l 11
Free chlorines Cl2 mg/l 11
Chlorines Cl- mg/l 11
Silicates SiO32- mg/l 11
Silicon in Silicates Si - SiO32- mg/l Si 11
Chlorophyll a Chlorophyll a µg/l 11
Phenole C6H5OH mg/l 11
Heavy Metals
Chromium Cr3+ µg/l 2
Cadmium Cd2+ µg/l 2
Nickel Ni2+ µg/l 2
Zinc Zn2+ µg/l 2
Manganese Mn2+ µg/l 2
Copper Cu2+ µg/l 2
Iron Fe2+ µg/l 2
Lead Pb2+ µg/l 2
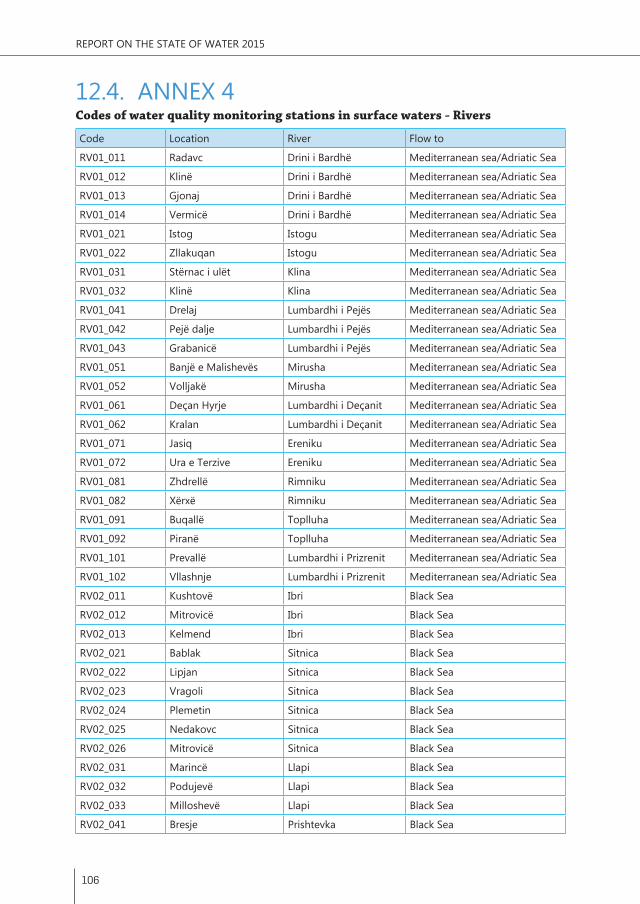
106
12.4. ANNEX 4Codes of water quality monitoring stations in surface waters - Rivers
Code Location River Flow to
RV01_011 Radavc Drini i Bardhë Mediterranean sea/Adriatic Sea
RV01_012 Klinë Drini i Bardhë Mediterranean sea/Adriatic Sea
RV01_013 Gjonaj Drini i Bardhë Mediterranean sea/Adriatic Sea
RV01_014 Vermicë Drini i Bardhë Mediterranean sea/Adriatic Sea
RV01_021 Istog Istogu Mediterranean sea/Adriatic Sea
RV01_022 Zllakuqan Istogu Mediterranean sea/Adriatic Sea
RV01_031 Stërnac i ulët Klina Mediterranean sea/Adriatic Sea
RV01_032 Klinë Klina Mediterranean sea/Adriatic Sea
RV01_041 Drelaj Lumbardhi i Pejës Mediterranean sea/Adriatic Sea
RV01_042 Pejë dalje Lumbardhi i Pejës Mediterranean sea/Adriatic Sea
RV01_043 Grabanicë Lumbardhi i Pejës Mediterranean sea/Adriatic Sea
RV01_051 Banjë e Malishevës Mirusha Mediterranean sea/Adriatic Sea
RV01_052 Volljakë Mirusha Mediterranean sea/Adriatic Sea
RV01_061 Deçan Hyrje Lumbardhi i Deçanit Mediterranean sea/Adriatic Sea
RV01_062 Kralan Lumbardhi i Deçanit Mediterranean sea/Adriatic Sea
RV01_071 Jasiq Ereniku Mediterranean sea/Adriatic Sea
RV01_072 Ura e Terzive Ereniku Mediterranean sea/Adriatic Sea
RV01_081 Zhdrellë Rimniku Mediterranean sea/Adriatic Sea
RV01_082 Xërxë Rimniku Mediterranean sea/Adriatic Sea
RV01_091 Buqallë Toplluha Mediterranean sea/Adriatic Sea
RV01_092 Piranë Toplluha Mediterranean sea/Adriatic Sea
RV01_101 Prevallë Lumbardhi i Prizrenit Mediterranean sea/Adriatic Sea
RV01_102 Vllashnje Lumbardhi i Prizrenit Mediterranean sea/Adriatic Sea
RV02_011 Kushtovë Ibri Black Sea
RV02_012 Mitrovicë Ibri Black Sea
RV02_013 Kelmend Ibri Black Sea
RV02_021 Bablak Sitnica Black Sea
RV02_022 Lipjan Sitnica Black Sea
RV02_023 Vragoli Sitnica Black Sea
RV02_024 Plemetin Sitnica Black Sea
RV02_025 Nedakovc Sitnica Black Sea
RV02_026 Mitrovicë Sitnica Black Sea
RV02_031 Marincë Llapi Black Sea
RV02_032 Podujevë Llapi Black Sea
RV02_033 Milloshevë Llapi Black Sea
RV02_041 Bresje Prishtevka Black Sea
REPORT ON THE STATE OF WATER 2015

107
RV02_051 Vragoli Graqanka Black Sea
RV02_061 Pjetërshticë Drenica Black Sea
RV02_062 Vragoli Drenica Black Sea
RV02_071 Devetak Shtime Mediterranean sea/Adriatic Sea
RV02_072 Vojnovc Shtime Black Sea
RV03_011 Korbuliq Morava e Binçës Black Sea
RV03_012 Kllokot Morava e Binçës Black Sea
RV03_013 Ranilugë Morava e Binçës Black Sea
RV03_014 Domoroc Morava e Binçës Black Sea
RV03_021 Marec Kriva reka Black Sea
RV03_022 Domoroc Kriva reka Black Sea
RV04_011 Prevallë Subain Lepenci Mediterranean sea/Aegean Sea
RV04_012 Kaçanik Lepenci Mediterranean sea/Aegean Sea
RV04_013 Hani i Elezit Lepenci Mediterranean sea/Aegean Sea
RV04_021 Jezerc Nerodimja Mediterranean sea/Aegean Sea
RV04_022 Bifurkaconi Nerodimja Mediterranean sea/Aegean Sea
RV04_023 Gërlicë Nerodimja Mediterranean sea/Aegean Sea
RV04_024 Kaçanik Nerodimja Mediterranean sea/Aegean Sea

108
Report on the state of water 2015 Prepared by the Kosovo Environmental Protection Agency
The report was prepared by experts of the Kosovo Environmental Protection Agency in cooperation with experts of the Water Department at the Ministry of Environment and Spatial Planning and other relevant institutions.
Working group: Tafë Veselaj, Afrim Berisha, Merita Mehmeti, Fatlije Buza, Agron Shala, Hasan Hasani and Përparim Gashi
Cover page photo: Copyright Besnik Matoshi
Report is distributed for free. Electronic version of the Report can be downloaded from www.ammk-rks.net
KEPA address:Luan Haradinaj Street, former Rilindja building floor XV/04Tel. +381 38 200 33 228, email: [email protected]
Printed by:
www.europrinty.net
Katalogimi në botim – (CIP)Biblioteka Kombëtare e Kosovës “Pjetër Bogdani”
504.4(496.51) “2015”614.777(496.51) “2015”
Raport për gjendjen e ujërave në Republikën e Kosovës : 2015 / Agjencia për Mbrojtjen e Mjedisit të Kosovës, 2015. – Prishtinë : Agjencia për Mbrojtjen e Mjedisit të Kosovës. – 129 f. : ilustr. me ngjyra ; 24 cm
Parathënie / Ferid Agani : f. 3. – Referncat : f. 121
ISBN 978-9951-638-05-0