report on y2 activities and new integration strategy · report on y2 activities and new integration...
TRANSCRIPT

FP7-ICT-216863/ORC/R/PU/D15.2
Page 1 of 76
SEVENTH FRAMEWORK PROGRAMME
Report on Y2 activities and new integration strategy
FP7-ICT-216863/ORC/R/PU/D15.2
Project Number: FP7-ICT-2007-1 216863
Project Title: Building the Future Optical Network in Europe (BONE)
Contractual Date of Deliverable: 30/11/09
Actual Date of Delivery: 29/12/09
Workpackage contributing to the Deliverable: WP15 : VCE Transmission Techniques
Nature of the Deliverable Make your choice from: R
Dissemination level of Deliverable Make your choice from: PU
Editors: Partner / names
ORC Francesca Parmigiani ORC Periklis Petropoulos
Abstract: This deliverable reports the activities of the Virtual Centre of Excellence on Transmission Techniques, and the progress achieved during Year 2 of the project.
Keyword list: Optical communications, 100Gb/s transmission, coherent systems, regeneration, highly nonlinear fibres, semiconductor optical amplifiers, erbium doped fibre amplifiers, burst amplification, signal monitoring, Gigabit Ethernet, fibre Bragg gratings, reliability analysis

FP7-ICT-216863/ORC/R/PU/D15.2
Page 2 of 76
Clarification:
Nature of the Deliverable
R Report
P Prototype
D Demonstrator
O Other
Dissemination level of Deliverable:
PU Public
PP Restricted to other programme participants (including the Commission Services)
RE Restricted to a group specified by the consortium (including the Commission Services)
CO Confidential, only for members of the consortium (including the Commission Services)

FP7-ICT-216863/ORC/R/PU/D15.2
Page 3 of 76
Disclaimer The information, documentation and figures available in this deliverable, is written by the BONE (“Building the Future Optical Network in Europe) – project consortium under EC co-financing contract FP7-ICT-216863 and does not necessarily reflect the views of the European Commission

FP7-ICT-216863/ORC/R/PU/D15.2
Page 4 of 76
Table of Contents
CLARIFICATION: ..............................................................................................................2 NATURE OF THE DELIVERABLE .................................................................................................... 2 DISSEMINATION LEVEL OF DELIVERABLE:................................................................................ 2
DISCLAIMER......................................................................................................................3
TABLE OF CONTENTS .....................................................................................................4
1. EXECUTIVE SUMMARY ...........................................................................................6
2. INTRODUCTION.........................................................................................................7 2.1 OUTLINE OF THE REPORT ................................................................................................... 8
3. MANAGEMENT ACTIVITIES ...................................................................................9 3.1 WP TECHNICAL MEETINGS.................................................................................................. 9 3.2 FOCUS GROUPS....................................................................................................................... 9 3.3 QUANTIFIABLE MEASURES OF INTEGRATION .............................................................. 10
4. KEY ISSUES IN 100 GB/S TRANSMISSION (POLITO, HWDE, UCL, ORC, FRAUNHOFER, UPC, CTTC, UNIROMA3)............................................................11
4.1 MLSE-BASED OPTICAL SYSTEMS FOR THE MITIGATION OF LINEAR AND NON-LINEAR FIBER TRANSMISSION EFFECTS .................................................................................. 11
4.1.1 New Branch Metrics for MLSE Receivers Based on Polarization Diversity for PMD Mitigation (PoliTO-HWDE) ...................................................................................................... 11
4.2 TRANSMISSION EXPERIMENTS OVER UNCOMPENSATED INSTALLED FIBER USING NARROW-FILTERED DUOBINARY (POLITO-UCL-ORC)............................................................. 17 4.3 LONG-HAUL WDM TRANSMISSION USING COHERENT RECEIVERS: TOWARDS TERABIT SUPER-CHANNELS......................................................................................................... 20
4.3.1 Transmission Experiments over Uncompensated Installed Fiber Using 100 Gb/s PM-QPSK (PoliTO-UCL-Fraunhofer).............................................................................................. 20 4.3.2 Experimental Investigation of the Impact of Ultra-Narrow Carrier Spacing on the Transmission of a 10-Carrier 1Tb/s Superchannel (PoliTO-UCL) ............................................. 22
4.4 CHIRP ANALYSIS AND MLSE (POLITO-UPC) ................................................................... 23 4.4.1 Introduction ................................................................................................................... 23 4.4.2 Simulation setup............................................................................................................. 24 4.4.3 Simulation results........................................................................................................... 24 4.4.4 Experimental setup........................................................................................................ 25 4.4.5 Experimental results....................................................................................................... 26 4.4.6 Conclusions.................................................................................................................... 27
4.5 SUITABILITY OF TRANSFORM-BASED SIGNAL PROCESSING FOR OPTICAL TRANSMISSION TECHNOLOGIES (CTTC).................................................................................... 27
4.5.1 Novel optical OFDM transmission scheme ..................................................................... 27 4.5.2 Real trigonometric transforms for all-optical signal processing ..................................... 29
4.6 REDUCING THE IMPACT OF INTRACHANNEL NONLINEARITIES BY PULSE-WIDTH OPTIMISATION IN MULTI-LEVEL PHASE-SHIFT-KEYED TRANSMISSION (UCL, HWDE)... 31
4.6.1 Introduction ................................................................................................................... 31 4.6.2 Multi-level Phase-Shift-Keyed Transmission................................................................... 31 4.6.3 Results and Discussion ................................................................................................... 32
4.7 REFERENCES......................................................................................................................... 34
5. SIGNAL REGENERATION (UOE, ORC, UOA, NTUA).........................................37 5.1 FIBER-BASED REGENERATION (UOE, ORC, UOA) .......................................................... 37
5.1.1 Multi-Wavelength Conversion (MWC) using HNLF (UoE, ORC) .................................... 37 5.1.2 Application of MWC-SPM in UHDM Distribution Scenarios.......................................... 43

FP7-ICT-216863/ORC/R/PU/D15.2
Page 5 of 76
5.1.3 Optical logic activities (UoA, ORC) ............................................................................... 45 5.2 SOA-BASED REGENERATION (UOA, NTUA)...................................................................... 45
5.2.1 Single partner - activity description (UoA) ..................................................................... 45 5.2.2 Regeneration properties of SOA-MZI devices (NTUA, UoA)........................................... 46 5.2.3 Cascadability study of 2R NRZ SOA-MZI Wavelength Converter (NTUA, UoA) ............. 51
5.3 REFERENCES......................................................................................................................... 52
6. AMPLIFICATION IN TRANSMISSION (UPC, FT) ...............................................54 6.1 GAIN TRANSIENT MITIGATION IN REMOTE ERBIUM DOPED FIBRE AMPLIFIERS BY BURST PACKET CARVING AT THE ONU FOR EXTENDED POWER BUDGET PONS (UPC-FT) 54
6.1.1 Introduction ................................................................................................................... 54 6.1.2 Packet-Carving technique .............................................................................................. 54 6.1.3 Set-up description .......................................................................................................... 54 6.1.4 Experimental results....................................................................................................... 55
6.2 REFERENCES......................................................................................................................... 56
7. MONITORING (FPMS) .............................................................................................57 7.1 PHASE PORTRAIT IMAGE PROCESSING APPLIED TO OPM (FPMS) ............................ 57 7.2 EVOLUTION OF AN OPM PROTOTYPE FOR IN-BAND OSNR MEASUREMENTS ......... 58
7.2.1 Introduction ................................................................................................................... 58 7.2.2 Experimental set up and results...................................................................................... 58 7.2.3 Conclusion ..................................................................................................................... 59
7.3 REFERENCES......................................................................................................................... 59
8. OTHER TRANSMISSION-RELATED JOINT ACTIVITIES WITHIN BONE .....60 8.1 REDUCTION OF PDL AND DGD IN BRAGG GRATINGS (UPVLC, FPMS) ...................... 60
8.1.1 Context of the work ........................................................................................................ 60 8.1.2 Principle of the technique and results............................................................................. 60
8.2 JOINT PROJECT FOR ESTABLISHING THE RELIABILITY OF FIBRE BRAGG GRATINGS AND COMPARING IT AGAINST NEW QUASI PERIODIC STRUCTURES (ERICSSON, FPMS)........................................................................................................................... 64
8.2.1 Introduction ................................................................................................................... 64 8.2.2 Reliability testing on current Fibre Bragg Gratings ....................................................... 65 8.2.3 Optical Measurement Set up and Test Results ................................................................ 65 8.2.4 Further work during this joint activity ............................................................................ 71
8.3 REFERENCES......................................................................................................................... 71
9. CONCLUSIONS .........................................................................................................73
TABLE OF FIGURES........................................................................................................74

FP7-ICT-216863/ORC/R/PU/D15.2
Page 6 of 76
1. Executive Summary
This document provides a presentation of the activities of the Virtual Centre of Excellence in Transmission Techniques (VCE-T) during the second year of the BONE project. As it was agreed during the first year of the project, the technical activities of VCE-T have been centered around four Focus Groups which reflect research interests which are shared among several of the VCE-T partners. These Focus Groups relate to (a) key issues on 100 Gb/s transmission, (b) signal regeneration, (c) signal amplification and (d) signal monitoring. After a brief introduction and an outline of the management activities of the WP, the technical contributions to this report are organized into four Sections which present in detail the collaborative activities that have been carried out within each of the Focus Groups, whereas a separate Section is devoted to joint activities relating to transmission-related topics which are not covered in the Focus Groups.

FP7-ICT-216863/ORC/R/PU/D15.2
Page 7 of 76
2. Introduction
FPMs HHI UCL UPVLC FT ICCS-NTUA GET
UoA HWDE POLITO UPC FUB TID Ericsson
ISCOM AIT TUE IT PUT KPRC/ ACREO
ORC
UEssex USWAN CTTC UNIROMA3 UC3M UOP CORITEL
Table 1: Acronyms of the VCE-T partners
The aim of the Virtual Centre of Excellence on Transmission Techniques (VCE-T) is to organize and harmonize the transmission-related activities within the BONE project. Table 1 shows the project partners who have been more active in the discussions and technical activities of the workpackage during the first two years of the project, as reflected by their participation in the WP meetings and the work reported in this deliverable. The coordination of the WP activities is taken care by the leadership team (ORC) with the help and consultation of the Advisory Board (AB) of VCE-T. Since the theme of Transmission in Optical Systems is rather broad, the interests of the various partners vary significantly. In order to address the varying background and interests of the partners participating in VCE-T, an extensive AB has been put in place. The AB has been responsible for setting out and updating the integration strategy for the WP and monitoring the progress made towards achieving its goals. The members of the AB and their affiliations are shown below:
Periklis Petropoulos (WP leader) and Francesca Parmigiani (ORC)
Patrice Megret (FPMs)
Karin Ennser (SWANSEA)
Pierluigi Poggiolini (POLITO)
Giorgio Maria Tosi Beleffi (ISCOM)
Michel Morvan (GET)
Oscar Gonzalez (TID)
Erwan Pincemin (FT)
From an early stage in the formation of VCE-T, its main activities have been grouped into four themes, forming four Focus Groups. The Focus Groups act as common forums of discussion within the WP, eventually leading to joint activities between their participants. Although these themes reflect broad areas of research on transmission, which are shared among several of the VCE participants, they are not exclusive, as will become evident further into this deliverable. Additional joint activities are encouraged and monitored within VCE-T, and are used to dynamically steer the emphasis of the Focus Groups. A discussion on the definition of the topics included within the various Focus Groups is revisited regularly, mainly during the WP general meetings.

FP7-ICT-216863/ORC/R/PU/D15.2
Page 8 of 76
VCE-T participants have met two times during Year 2 of the project. The meetings have been useful in reinstating the general integration strategy of the WP, communicating joint results and activities, and acting as networking events, which have actually proven extremely fruitful for the initiation of new joint activities.
2.1 Outline of the report
The aim of this deliverable is to report the actions taken during this past year towards encouraging and fostering integration of the BONE groups working on transmission-related issues. It also provides a comprehensive presentation of the technical activities carried out during Y2, highlighting the high level of collaboration achieved among the various partners in the workpackage. The report is organised as follows.
Section 3 presents the central activities carried out within the WP in order to encourage integration among the VCE-T participants. It also reviews briefly the topics of the Focus Groups, as these had been defined during Y1 of the project. Some quantifiable measures of integration are outlined in this Section.
Sections 4-7 relate to the technical activities of each of the Focus Groups. We have chosen to report only joint activities in this deliverable, with the exception of two entries, which represent some new activities which are of interest to the consortium as a whole, and where the formation of collaborations is currently under progress. Section 4 relates to issues associated with 100 Gb/s transmission, Section 5 is on signal regeneration (both fibre- and SOA-based), Section 6 is on signal amplification and Section 7 is on signal monitoring.
One more joint activity which falls within the VCE-T interests, and which follows on from work carried out during Y1, is presented in Section 8. The report closes with some Conclusions in Section 9, and an outlook to the final year of the project.

FP7-ICT-216863/ORC/R/PU/D15.2
Page 9 of 76
3. Management Activities As in the previous project year, the central activities taking place within VCE-T have been organized so as to create a forum of discussion for certain key research topics within Optical Transmission which are common to several WP partners, and encourage collaboration between the various groups participating in the WP. These activities act as a vehicle to facilitate joint actions between the participating groups, and are presented below. Mention is also given in this Section to the results achieved in terms of integration during this second year, as these can be quantified in terms of mobility actions, joint publications, etc.
3.1 WP Technical Meetings
In order to augment integration and to enhance familiarisation with the research interests of the various groups, it has been considered essential that the WP partners should meet at frequent intervals. Two VCE-T meetings were organised during this year. Both meetings have been collocated with events which have been heavily attended by BONE partners, and have succeeded in ensuring the participation of partners from almost all of the groups in the WP. The WP meetings have acted as the most important medium for initiating integration between the partners, with discussions for several of the joint activities which are reported in the following sections having been initiated during these events. Besides, the meetings have also been used as opportunities for technical presentations of general interest to the VCE-T partners, as well as for the communication of the progress and the results achieved in both the jointly conducted and other single-partner experiments. The WP meetings have also been used as opportunities to increase awareness of the close links between BONE and the sister NoE EURO-FOS.
In addition to the above, a central discussion point in this year’s WP meetings has been the form of the final communication of the WP results. It has been an ambition of the VCE-T partners to produce a final cohesive document stemming from the work conducted within BONE. A large number of project partners are interested in getting involved and contributing in this effort. Two project partners (ISCOM and IT) have volunteered to the act as the editorial team for this document. Several challenges have been identified however, mainly associated with (a) the limited lifetime and the low level of resources available within BONE, (b) the amount of effort required from the editorial and the authoring teams in order to complete the task, and (c) the necessity to harmonise the heterogeneous content of the various partners’ contributions.
The two VCE-T meetings of the year were collocated with ICTON’2009 (Azores, June 2009) and the BONE Plenary meeting (Poznan, October 2009) respectively. As mentioned above, the majority of WP partners were present at these meetings. The meeting minutes and the main presentations have been posted on WP15 area of the BONE website.
3.2 Focus Groups
The role of the Focus Groups is to promote discussion and collaboration around topics of joint interest, and to define the core technical areas of the WP without however restricting the partners’ activities to these areas alone. In addition, the Focus Groups are viewed as dynamic areas, the orientation of which may be reviewed as required during the lifetime of VCE-T. The

FP7-ICT-216863/ORC/R/PU/D15.2
Page 10 of 76
definition of the four Focus Group topics and their moderators had been agreed during an early WP meeting in Y1, and are as follows:
• Key issues in 100Gb/s transmission (moderator: Juan Fernando Palacios, TID)
• Signal regeneration in fibres (moderator: Periklis Petropoulos, ORC) and semiconductor optical amplifiers (moderator: Giorgio Maria Tosi Beleffi, ISCOM)
• Amplification in transmission with emphasis on burst amplification (moderator: Antonio Teixeira, IT)
• Signal monitoring (moderator: Michel Morvan, GET)
The definition of the Focus Groups and the topics covered in them has often been revisited. It has been considered however, that these general topics are still relevant and encompass the activities and interests of most VCE-T partners. The technical activities of the various Focus Groups during Y2 of the project are presented in detail in the following sections of this report.
3.3 Quantifiable measures of integration
The number of joint activities accomplished with Y2 of VCE-T has increased significantly as compared to Y1, as has the number of joint publications. In total, there have been eight mobility actions between partners, and a larger number of joint experiments (facilitated e.g. by the provision of special devices from one partner to another, the exchange of equipment, etc). According to the records that have been uploaded on the BONE Directory Service, there have been fifteen joint papers in Y2, stemming from the various joint activities have already been accepted for publication in journals or conference proceedings.
At the end of Y2, and especially after the second of the WP meetings of the year, the indications are that collaborative activities within VCE-T are due to continue in the final year of the project at an increasing pace.

FP7-ICT-216863/ORC/R/PU/D15.2
Page 11 of 76
4. Key Issues in 100 Gb/s Transmission (POLITO, HWDE, UCL, ORC, Fraunhofer, UPC, CTTC, Uniroma3)
4.1 MLSE-based optical systems for the mitigation of linear and non-linear fiber transmission effects
4.1.1 New Branch Metrics for MLSE Receivers Based on Polarization Diversity for PMD Mitigation (PoliTO-HWDE) Maximum Likelihood Sequence Estimation (MLSE) receivers (Rx) have been shown to be effective for the mitigation of chromatic dispersion and single-channel nonlinear effects [4.1]. On the contrary, they are not equally effective in mitigating polarization mode dispersion (PMD) [4.1], which has emerged as one of the main limiting factors in optical fiber transmission at data rates of 40 Gb/s and beyond. In particular, a very large worst-case penalty of about 5.5 to 6 dB is incurred by MLSE Rx’s when the differential group delay (DGD) approaches one bit-time, irrespective of the number of MLSE states. During this joint activity we demonstrated that the use of a suitable polarization diversity Rx [4.2], also called “Stokes receiver”, together with an MLSE processor based on appropriate parametric branch metrics, can overcome this problem.
Fig. 1: Full ‘Stokes’ polarization diversity receiver - type A and B.
A Stokes Rx can be implemented in two slightly different ways, shown in Fig. 1. The first configuration (Rx A) is composed of three polarizers corresponding to any three orthogonal axes on the Poincaré sphere, such as 1s , 2s and 3s . Each polarizer is followed by a PIN diode
and a post-detection (PD) electrical filter. A fourth branch is used to detect the instantaneous optical power. This receiver requires the use of four analog-to-digital converters (ADCs). The samples of the electrical post-detection signals are then fed to a 4-input MLSE processor. The components on the Poincarè sphere of the Stokes vector associated to the received signal samples are given by: 011
~~2 rrr −= , 022~~2 rrr −= , 033
~~2 rrr −= .
Note that the same quantities r1, r2 and r3 can be directly obtained by using the second receiver configuration (Rx B), shown in Fig. 1. It is composed of three mutually orthogonal (in Stokes space) polarizing beam splitters (PBSs), each followed by a pair of balanced photodetectors and a PD filter. The same post-processing can thus be used for the two Rx configurations, including the MLSE branch metrics. In order to reduce the complexity, we also analyzed the possibility of using a simpler configuration of the receiver (shown in Fig. 2), where only three

FP7-ICT-216863/ORC/R/PU/D15.2
Page 12 of 76
branches and ADCs are used. This kind of Rx is not equivalent to the full Stokes receivers previously described, since it can be shown that it is not possible to derive the components (r1, r2, r3) of the Stokes vector of the received signal starting from the knowledge of the three signals 1
~r , 2~r , and 3
~r at the output of the simplified Stokes Rx. It can be shown [4.3] that
there is a fundamental ambiguity that can be solved only by adding the fourth branch, present in the full Rx of Fig. 1, which provides the information about the total intensity of the received field.
Fig. 2: Simplified ‘Stokes’ polarization diversity receiver - type A and B.
In the following, we propose several branch metrics that can be used by the Stokes receiver. All metrics, except for the last one, are designed to work with the full Rx configuration of Fig. 1, while the last metric is designed for the simplified Rx of Fig. 2.
A4.1.1.1 Exact branch metric
Under the assumptions that the optical signal is affected by Amplified Spontaneous Emission (ASE) noise, modeled as white Gaussian noise with power spectral density N0/2 on each polarization, and that the PD lowpass filters are wide enough not to alter the photodetected signal, the statistical properties of the Rx signal in Stokes space can be evaluated analytically
[4.4]. We define: ( )321 ,, rrrR =r
, the noisy received Stokes vector; ( )321 ,, sssS=r
, the Stokes
vector that would be received in the absence of noise; RRr
= , SSr
= ; θ the angle between Rr
and Sr
:
⋅=RS
RSrr
rr
arccosθ
Then, the exact joint probability density function (PDF) of the received Stokes vector
( )321 ,, rrrR =r
, expressed in the polar coordinates R and θ, is [4]:
( )
=
+−
2cos
16
1,
202
4
2 θσπσ
θ σ RSIe
RRf
RS
Rr
where σ2 is the variance of noise after the Rx optical (σ2 = N0Bo, with Bo the equivalent noise
bandwidth optical filter) and I0 is the modified Bessel function of the first kind and order zero. The optimum branch metrics for the Viterbi algorithm are given by [4.5]:
( )[ ]∑=
−=K
kkikRi Rfm
1,,log θr

FP7-ICT-216863/ORC/R/PU/D15.2
Page 13 of 76
where K is the number of samples/bit used by the MLSE processor, (Rk, θi,k) are the values of R and θ for the k-th signal sample of the received bit and the i-th trellis branch. Substituting
and deleting the term R416
1
πσ which is irrelevant because it is common to all branches, we
get:
∑=
+−
=
K
k
kikikRS
i
SRIem
kki
1
,
2
,
02
2coslog
2, θ
σσ (A)
where Si,k is the modulus of the Stokes vector of the k-th sample of the noiseless received signal corresponding to the i-th trellis branch. Since:
( ) ( )kkikikkikikki
kik RSSRSRSRrr
⋅+=+=
,,,,
,2, 2
1cos1
21
2cos θ
θ
it can be shown that metric (A) can be equivalently written as:
∑=
−
⋅+=K
k
kikkikiki
SRSSRIm
12
,,,20
22
1log
σσrr
Note that the use of the polarization diversity Rx with the exact metric would require the
knowledge of the received samples in the absence of noise, i.e. the vector kiS ,
r
. This makes the
channel estimation procedure more complex and the dynamic update difficult. For this reason, in the following we propose a set of simplified branch metrics, whose goal is to minimize the number of parameters to be estimated and updated during the channel estimation procedure. The performance of the polarization diversity Rx with the exact metric has been used as a benchmark for the other receivers.
A4.1.1.2 Approximated metric
Using the following approximation of the modified Bessel functions [4.6]:
xm e
xxI
π2
1)( ≅ x >> m
and neglecting the logarithmic terms, the metric can be rewritten as:
∑=
−⋅+≅K
k
kikkikiki
SRSSRm
12
,,,2 22
1
σσ
rr
Deleting the factors common to all branches:
{ }∑=
⋅+⋅−−≅K
kkkikikkii RSSRSm
1,,, 2
rr
Finally, replacing the noiseless samples Si,k, which are difficult to estimate, with the mean
values of the noisy signal samples { } ( )321,,,,, ,, Ski
Ski
Skikiki RE µµµρ ==
rr, kiki ,, ρρ = , we obtain:
{ }∑=
⋅+⋅−−≅K
kkkikikkii RRm
1,,, 2
rrρρρ (B)
We have demonstrated by simulation that the performance of an MLSE Rx using metric (B) is only slightly worse than the one using the exact metric (A). The advantage is that the channel

FP7-ICT-216863/ORC/R/PU/D15.2
Page 14 of 76
estimation procedure is now much simpler, since only three parameters need to be estimated and updated, i.e., the average values of the noisy signal samples 1
,Skiµ , 2
,Skiµ , 3
,Skiµ .
A4.1.1.3 Gaussian metric
Another approximated branch metric can be obtained by assuming that the received electrical signal samples have a Gaussian statistical distribution. Assuming that the signal samples r1,k, r2,k and r3,k are independent, the metrics can be evaluated as [4.7]:
( )( ) ( ){ } ( )
( ) ( ){ } ( )( ) ( ){ }∑
=+
−++
−++
−=
K
k
SkiS
ki
SkikS
kiSki
SkikS
kiSki
Skik
i
rrrm
1
2
,2
,
,,32
,2
,
,,22
,2
,
2
,,1 3
3
3
2
2
2
1
1
1
logloglog σσ
µσ
σ
µσ
σ
µ (C)
where r1,k, r2,k, r3,k are obtained from kr ,1~ , kr ,2
~ , kr ,3~ using 011
~~2 rrr −= , 022~~2 rrr −= ,
033~~2 rrr −= ; 1
,Skiµ , 2
,Skiµ , 3
,Skiµ are the average values of the signals r1,k, r2,k, r3,k, corresponding
to branch i and the k-th signal sample within the bit and ( )2
,1Skiσ , ( )2
,2Skiσ , ( )2
,3Skiσ are the
corresponding variances.
A4.1.1.4 VS (variance-stationary) Gaussian metric
The number of channel parameters to be estimated using (C) is six: three mean values and three variances. This number can be reduced to three by assuming that the variance is the same for all samples in all branches (variance stationarity (VS) hypothesis). In this case, metric (C) simplifies to:
[ ] [ ] [ ]∑=
−+−+−=K
k
Skik
Skik
Skikii rrrm
1
2
,,3
2
,,2
2
,,321 µµµ (D)
A4.1.1.5 NLE (non-linear exponent) metric with Full Stokes Rx
In general, the variance of the samples has a non negligible dependence on the considered trellis branch. This means that the VS hypothesis is not very accurate and can lead to a substantial performance degradation. In [4.8] it was shown that the application of a non-linear transformation, such as the square-root (SQRT) operator, to the received samples can increase the stationarity of the variance. The SQRT operator, as well as other similar operators using an exponent α different from 0.5, can be directly applied to positive signals only, thus we chose to apply it to the signals , whose noise statistical distribution is similar to that of a conventional IMDD Rx. The branch metrics can be then evaluated as:
( )[ ] ( )[ ] ( )[ ] ( )[ ]∑=
−+−+−+−=K
k
Skik
Skik
Skik
Skiki rrrrm
1
2
,,3
2
,,2
2
,,1
2
,,03210 ~~~~~~~~ µµµµ αααα (E)
where α is a nonlinear distortion exponent (to be optimized), 0,
~Skiµ , 1
,~S
kiµ , 2,
~Skiµ , 3
,~S
kiµ are the
average values of the signals kr ,0~ , kr ,1
~ , kr ,2~ , kr ,3
~ corresponding to branch i and the k-th signal
sample within the bit. Note that each term in (E) is similar to the IMDD Rx metrics proposed in [4.9].

FP7-ICT-216863/ORC/R/PU/D15.2
Page 15 of 76
A4.1.1.6 NLE (non-linear exponent) metric with Simplified Stokes Rx
In the simplified Stokes Rx shown in Fig. 2, the noise statistical distribution on each of the three signals kr ,1
~ , kr ,2~ , kr ,3
~ is similar to that of a conventional IMDD Rx. Therefore, a metric
similar to (E) can be used. Assuming that the signal samples on the three branches are independent, the metrics can be evaluated as:
( )[ ] ( )[ ] ( )[ ]∑=
−+−+−=K
k
Skik
Skik
Skiki rrrm
1
2
,,3
2
,,2
2
,,1321 ~~~~~~ µµµ ααα (F)
where α is the nonlinear distortion exponent (to be optimized), 1,
~Skiµ , 2
,~S
kiµ , 3,
~Skiµ are the average
values of the signal samples kr ,1~ , kr ,2
~ , kr ,3~ corresponding to branch i and the k-th signal sample
within the bit. The transmitter (Tx) used in simulation consisted of a 43 Gb/s (216-1) Pseudo Random Binary Sequence (PRBS) generator, followed by a 5-pole Bessel filter with bandwidth equal to 0.28 Rb for PSBT and 0.75 Rb for IMDD, where Rb=43 Gb/s is the bit-rate. The filter was followed by an ideal Mach-Zehnder modulator with infinite extinction ratio, driven in the range [-Vπ, Vπ] for PSBT and [0, Vπ] for IMDD. The state of polarization of the optical field can be represented by a point on the Poincaré sphere, characterized by an azimuth angle α and a zenith angle θ. The PMD channel introduces a DGD equal to τ between the two principal states of polarization (PSPs) [4.10], emulating first-order effects only.
ASE noise loading was performed at the Rx to obtain the desired optical signal-to-noise ratio (OSNR), which is computed over a 0.1 nm bandwidth, taking into account noise on both polarizations. A 50 GHz second-order supergaussian optical filter was used as Rx optical filter. The Rx photo-detector and electrical circuitry were assumed ideal and noiseless. The postdetection (PD) filters were 5-pole Bessel filters with bandwidth equal to Rb. The output of the PD filter was sampled and quantized and then sent to an 8-state MLSE processor. The total number of simulated bits was (1.25 · 218) and performance was evaluated through direct error counting. The first 216 bits were used for channel estimation, while the last 218 have been considered for performance evaluation.
In a back-to-back configuration, using a standard direct detection MLSE Rx, the OSNR values needed to achieve a BER value equal to 10-3 are 16 dB for PSBT and 13.9 dB for IMDD, regardless of the state of polarization (SOP) of the signal at the input of the receiver. While the performance of a standard direct-detection receiver is independent of the input SOP, the performance of polarization diversity receivers may depend on it, as shown in [4.3].
Fig. 3 summarizes the worst-case results obtained for PSBT using an 8-state MLSE processor with 2 samples/bit. This means that each point in the plots of Fig. 3 is a worst case result over all possible SOPs and DGD axis orientations. Similar results obtained using the IMDD modulation formats are reported in Fig. 4 for comparison. The performance is shown in terms of OSNR needed to achieve a target bit error rate (BER) of 10-3 as a function of the DGD value τ normalized to the bit time T. The OSNR is computed over a 0.1 nm bandwidth, taking into account noise on both polarizations. The performance of the standard single-input direct detection MLSE receiver is also shown for comparison.

FP7-ICT-216863/ORC/R/PU/D15.2
Page 16 of 76
Fig. 3: OSNR (over 0.1 nm, dB) needed to achieve BER=10-3, vs. DGD normalized to the bit-time for PSBT. The seven curves are shown in two separate figures to increase the readability.
Fig. 4: OSNR (over 0.1 nm, dB) needed to achieve BER=10-3, vs. DGD normalized to the bit-time for IMDD. The seven curves are shown in two separate figures to increase the readability.
When using the polarization diversity Rx with the exact metric, the system incurs no penalty at all up to a value of DGD equal to 3T for IMDD and 4T for PSBT. After that value, the penalty starts to increase due to the fact that the channel memory becomes larger than the Viterbi processor memory. A similar behavior is obtained when using the receiver with Gaussian or VS Gaussian metrics. For PSBT, the penalty in using a Gaussian metric with respect to the exact one is less than 0.5 dB, while it increases to 2.8 dB when using the VS Gaussian metric. For IMDD, the penalty is around 2 dB and 3 dB for the Gaussian and VS Gaussian metrics, respectively. The performance of the same polarization diversity Rx (type A) with the NLE metric is worse than the one achieved using the approximated metric for both IMDD and PSBT, with a maximum penalty around 2 dB. The use of the 3-input Rx would further decrease the complexity (only 3 parameter to be estimated and only 3 ADC needed), but its performance is even poorer: its penalty with respect to the Gaussian metric may be as high as 4 dB for both PSBT and IMDD. Note that the nonlinear distortion exponent in NLE metrics (E) and (F) was

FP7-ICT-216863/ORC/R/PU/D15.2
Page 17 of 76
optimized through simulation, finding optimum values around α = 0.3−0.5 (not critical), depending on the amount of DGD. In conclusion, we have shown that the use of a full Stokes Rx (either type A or B), followed by a multi-input MLSE processor using an appropriate branch metric, can virtually eliminate any PMD penalty for IMDD and PSBT. Out of all the metrics analyzed in this work, the best compromise between complexity and performance is the approximated metric (B), whose complexity is much lower than the exact metric (A) and whose OSNR penalty with respect to (A) is limited (lower than 0.5 dB for both IMDD and PSBT).
4.2 Transmission Experiments over Uncompensated Installed Fiber Using Narrow-Filtered Duobinary (PoliTO-UCL-ORC) The best-fitting of simulation and experimental published results [4.11, 4.12] shows that, for 10.7Gb/s IMDD with SONET-like NRZ pulses, the number of processor states N for large CD values tends to approximately double every 45-55 km of SSMF. This can also be re-phrased by saying that the MLSE processor needs one further bit of memory every 45-55 km. If the transmitted pulses are band-limited and smoothed as much as possible, while avoiding significant eye-closure penalty in btb, the increase of N can be slowed down to one further bit of memory (or doubling of states) every 55-65 km, which appears to represent the limit of MLSE efficiency with NRZ-IMDD.
To further increase the MLSE efficiency, greater Tx pulse band-limiting must be exercised. The eye may then be already closed in btb, but this is not a problem thanks to the MLSE processor in the Rx. Rather, the band-limiting at the Tx mitigates the increase of N vs. CD. This concept was demonstrated in [4.13], where an NRZ IMDD signal was narrow-filtered in transmission and had a closed eye in btb, but reception of the 10 Gb/s signal was possible at 600 km with only 64 processor states. Rescaled to 10.7 Gb/s, this is equivalent to one bit of memory every 87.5 km, to date the record experimental value for MLSE efficiency.
In this work, we start out with a duobinary signal, which is per se substantially band-limited, and then apply drastic further optical filtering at the Rx. The eye in btb is closed but, as mentioned, the MLSE processor can easily deal with it. The narrow optical Rx filtering correlates ASE noise and, to exploit such correlation to improve the BER, we use a noise-correlation-sensitive MLSE Rx [4.14]. This combination of techniques allowed us to greatly improve both on the maximum demonstrated distance, which is pushed to 1300 km at 10.7 Gb/s, and on the MLSE efficiency, which is achieved with one bit of memory every 133 km over the 800 km. The experiment was carried out over the operator FASTWEB’s installed cable plant in the city of Turin, Italy.
A schematic of the experiment is shown in Fig.5. A 220-1 PRBS was used to drive a LiNbO3 modulator, provided by AVANEX, specifically designed for duobinary generation. The modulator has an in-package 5-pole electrical Bessel filter with 2.7 GHz bandwidth. The optical duobinary signal, at 1550 nm, was then sent into a re-circulating loop that used 80 km of installed uncompensated SSMF within the MAN plant of the operator FASTWEB, in the city of Turin. The total fiber loss was 23.5 dB, owing to the many splices and connectors within the installed metropolitan link and the many POPs and miniPOPs transit points. The loop span includes a 4nm optical filter and two low-noise high-gain EDFAs provided by CISCO Photonics.

FP7-ICT-216863/ORC/R/PU/D15.2
Page 18 of 76
10.7 Gb/sPPG
LOOP AOM
TX AOM
80km installed SMF
EDFA EDFA
3dBcoupler
VOA
VOAEDFA
4nm filter
Sampling oscilloscope
EC-TL
Uncompensated span
Duobinarymodulator VOA
OSA
VOARX filter
Pin-TIA
EDFA
Fig. 5: Experimental set-up for 10.7Gb/s narrow-filtered duobinary transmission over installed and uncompensated SSMF fiber.
The signal exiting the loop was passed through a noise-loading stage for precise OSNR adjustment and then into the Rx optical filter, which was Gaussian with 6 GHz FWHM (supplied by Avanex Corp.). The signal was then detected using a PIN-TIA photodetector (supplied by Mitel-Teleoptix, s.r.l.) and digitized using a Tektronix DPO 71604 real-time sampling oscilloscope. The recorded data runs were comprised of two full cycles of the PRBS, i.e., about 2 million bits. The real-time scope was set at its top sampling speed of 50 Gsamples/s, resulting in 4.7 samples/bit. This large oversampling value was used only to simply clock-recovery. The down-sampling to 2 samples per bit was carried out. The re-clocked and down-sampled signal samples were then passed on to the MLSE processor. The signal samples were pre-distorted taking their square-root. This makes the noise statistics more Gaussian-like and less signal-dependent [4.9].
Since the narrow Rx filter correlates noise samples across adjacent bits, we used a noise-correlation sensitive MLSE algorithm. The branch metric we used is the one proposed in [4.14] in the context of magnetic-recording devices. We also processed the data using non-correlation sensitive MLSE, for comparison. We decided to use two values only for the number of processor states: 64 and 2048. The reason for 64 is because it appears to be within reach of the next generation of MLSE processors and because it allows direct comparison with the record-efficiency results of [4.13]. The reason for 2048 was to attempt to improve on the previous record-distance result [4.12], while using a similar number of states as in [4.12]. Trellis instruction was performed over the first million bits of each data run, whereas demodulation was performed over the following million bits.
We also ran computer simulations of the set-up, using the same MLSE post-processing software employed in the experiment, to predict the experiment outcome and assess the impact of set-up impairments and non-idealities. All simulations were carried out using the commercial package OptSim (Rsoft Inc.).
The results of OSNR (over 0.1 nm) needed to achieve BER=10-3, vs. length of SSMF are shown in Fig.6. Conventional MLSE and correlation-sensitive MLSE are used in the left and right plots, respectively.

FP7-ICT-216863/ORC/R/PU/D15.2
Page 19 of 76
0 200 400 600 800 1000 1200 1400
8
9
10
11
12
13
14
15
16
Length of SSMF [km]
OS
NR
ove
r 0.1
nm
[dB
]
64 states - sim2048 states - sim64 states - exp2048 states - expLF duob no MLSE - exp
0 200 400 600 800 1000 1200 14008
9
10
11
12
13
14
15
16
Length of SSMF [km]
OS
NR
ove
r 0.1
nm
[dB
]
64 states - sim2048 states - sim64 states - exp2048 states - expLF duob no MLSE - exp
Fig. 6: OSNR (0.1 nm) for BER=10-3, vs. length of SSMF fiber. Left: conventional MLSE. Right: Correlation-sensitive MLSE. Dashed curves use 64 MLSE states, solid curves use 2048 MLSE states. Lines with markers are experimental results.
The computer simulation performed better in btb than the experiment: the offset was about 1.8 dB for conventional MLSE and 1.2 dB for correlation-sensitive MLSE. These offsets were due to set-up and components non-idealities and impairments. To ease comparison, the simulations curves were upshifted by the amount of btb penalty, so that at zero km experiments and simulations coincide. The diamond marker at zero km is the experimental btb performance of conventional duobinary (or “PSBT”), obtained using the same set-up, taking out the MLSE processor and replacing the 6 GHz Rx optical filter with a 40 GHz one (LF in Fig. 6 stands for “large filter”). We point-out the significantly better btb performance of NF-duobinary vs. conventional duobinary.
The previously established best value of MLSE efficiency was 100 km per bit of MLSE memory at 10 Gb/s, using NF-OOK [4.13], which corresponds to 85 km when scaled to 10.7 Gb/s. As for the longest link length, �arter 1040 km at 10 Gb/s with 4096 states, corresponding to 910 km when scaled to 10.7 Gb/s [4.12]. Figure 6 shows that conventional MLSE with NF-duobinary, at 10.7 Gb/s, already surpasses both. Correlation-sensitive MLSE further improves, achieving a total link length of 1300 km with 2048 states, with an efficiency of 118 km per bit of memory. Using only 64 states, 800 km could be reached, with a remarkable efficiency of 133 km per bit of memory. The efficiency was greater with 64 states at 800 km because clock jitter and non-linearity effects hindered performance with 2048 states at longer lengths. These results suggest that narrow-filtered systems at 10.7 Gb/s, in conjunction with MLSE post-processing, might provide a competitive option for system and link solutions in the 500-1000 km market segment.

FP7-ICT-216863/ORC/R/PU/D15.2
Page 20 of 76
4.3 Long-haul WDM transmission using coherent receivers: towards Terabit super-channels Recently, there have been several demonstrations of ultra-long haul (>2000km) PM-QPSK signal transmission using a digital coherent receiver at data rates from 40 Gbit/s [4.15] to 111 Gbit/s [4.16]. However, most results on 100 Gb/s PM-QPSK reported in literature are tests in laboratory environment, while only a few 100 Gb/s field trials have been reported [4.17], [4.18]. In the framework of the Bone project, we have investigated 100 Gb/s transmission of PM-QPSK signals over more than 2000 km of uncompensated SSMF installed in the Fastweb Metro network of the city of Turin. Two off-line joint experiments have been carried out, described in the following two sections.
4.3.1 Transmission Experiments over Uncompensated Installed Fiber Using 100 Gb/s PM-QPSK (PoliTO-UCL-Fraunhofer) The experimental setup is shown in Fig. 7 and consists of three distinct elements: the transmitter, the recirculating loop, and the coherent receiver. The transmitter with wavelength of 1550 nm and measured linewidth of 100 KHz was operated at 25 Gbaud, with a 215-1 PRBS. The data rate of 100 Gbit/s was achieved using QPSK and polarization multiplexing. Each QPSK signal was generated by modulating a Nested Mach-Zehnder modulator provided by AVANEX, with 20GHz bandwidth and a Vπ voltage equal to 3V.
The 100 Gb/s PM-QPSK signal was then launched into a recirculating loop consisting of 63 km of installed uncompensated SSMF (nominal value of dispersion equal to D=16.3 ps/nm/km) within the MAN plant of the operator FASTWEB, in the city of Turin. The total fiber loss was 16.5 dB, owing to the many splices and connectors within the installed metropolitan link and the many POPs and miniPOPs transit points. The loop span includes a 4 nm optical filter and two low-noise high-gain EDFAs provided by CISCO Photonics (with noise figure NF~4.5 dB) to overcome the loss of the fiber and the loop components, giving a combined NF~5dB. The signal at the loop output was passed through a noise-loading stage for precise OSNR adjustment and then into an optical filter, which was Gaussian with 50 GHz FWHM (supplied by AVANEX).
At the coherent receiver, the signal is passed through a polarization beam splitter and then combined with the local oscillator via two optical 90-degrees hybrids to detect the in-phase and quadrature components of the two polarizations. The eight outputs of the two hybrids are detected using dual-balanced photoreceivers with 30GHz bandwidth. On conversion into the electrical domain, the signal was digitized at 50 Gsample/s using a Tektronix DPO71604 digital storage oscilloscope, with the waveforms then processed off-line in a conventional PC.

FP7-ICT-216863/ORC/R/PU/D15.2
Page 21 of 76
PC
65km
installed
SMF
PC
TX AOM
LOOP AOM
DATA
PBS
BAL
BAL
BAL
BAL
PBS
PC
PC
Tekronix
DPO 71604
LO
50GHz AWG
25Gb/s PPG
DATA
NOISE LOADING
VOA
Digital Coherent RX
PM-QPSK Transmitter RecirculatingLoop
Post
Processing
Nested MZ
ADC
sampling rate
50Gs/s
TE
TM
TE
TM
TE
TM
TETE
SMF dark fibreinstalled byFastWeb
in the city of Turin
EC-TL
Fig. 7: Experimental setup for 100 Gb/s transmission obtained by polarization multiplexing two 50 Gbit/s NRZ-QPSK signals.
The samples were passed through two distinct signal processing stages. A first stage is devoted to chromatic dispersion compensation and consists of two complex FIR filters, one for each polarization. At each distance, the nominal amount of accumulated dispersion (D·L) was blindly compensated for, leaving the compensation of any residual amount to a following second-stage equalizer. The second stage is a fractionally-spaced (TS/2) MIMO adaptive equalizer, consisting of 16 real FIR filters with 11 taps each. This equalizer is initially driven to convergence through an LMS algorithm by evaluating the error with respect to a training sequence. When convergence is reached, it moves into a decision-directed tracking mode. The updating weight (also called step size) of the LMS adaptive filter was properly optimized. Finally a fixed threshold was applied to recover the data bits. A new version with ML decision is currently being tested.
We first performed back-to-back measurements to identify a performance baseline. The required OSNR at BER=10-3 (FEC limit) was 15.8 dB over 0.1 nm, about 3 dB from the theoretical quantum limit. The BER was obtained by counting errors over a total of 1.6 million transmitted bits for each measurement.
The BER measurement was then repeated at different distances and the results are plotted in Fig. 8 together with the constellation diagrams. A transmission distance of 2000 km (32 re-circulations in the loop) was achieved for a launch power of -3 dBm, with a sensitivity penalty at the FEC limit (BER=10-3) of 2 dB with respect to the back-to-back measurements. The penalty can be attributed to non-linear effects and link PDL. Both PDL and non-linear effects were exacerbated by the large number of recirculations (32).

FP7-ICT-216863/ORC/R/PU/D15.2
Page 22 of 76
x
y
x
y
x
y
0 500 1000 1500 200010
12
14
16
18
20
OS
NR
(dB
/0.1
nm) f
or B
ER
= 1
E-3
Transmission distance (Km)
Fig. 8. Receiver sensitivity for BER=10-3 vs. transmission distance (inset are the constellation diagrams for the X & Y polarizations recovered at different transmission distances with -3dBm launch power).
With this experiment, we have demonstrated 100 Gbit/s transmission using PM-QPSK over 2000 km (32 spans of 63 km each) of standard installed fiber with no optical dispersion compensation. A total dispersion of 32,600 ps/nm/km was compensated for using digital signal processing, with an OSNR penalty of 2 dB with respect to back-to-back. The penalty is likely due to non-linear effects and PDL, exacerbated by the large number of spans of the link.
4.3.2 Experimental Investigation of the Impact of Ultra-Narrow Carrier Spacing on the Transmission of a 10-Carrier 1Tb/s Superchannel (PoliTO-UCL) Recently there has been an increasing interest in the investigation of the generation of 1Tb/s “superchannels” in support of an eventual Terabit Ethernet Standard. According to this technique, a number of “carriers” is seamlessly aggregated to form individual superchannels which would be routed optically through the network as a single channel.
In [4.19] and [4.20] the carriers were electrically OFDM (Orthogonal Frequency–Division Multiplexing) modulated and the superchannel reached 600 and 400 km, respectively. In [4.21], 24 carriers were modulated using conventional polarization-multiplexed (PM) QPSK at 12.5 GBaud each. The carriers were spaced exactly at the Baud rate and each carrier was phase-locked and also symbol transition-aligned to all others, thus realizing Coherent Optical OFDM (CO-OFDM) among the carriers themselves. This approach is far less sensitive to phase noise and non-linear propagation effects than the use of electrically OFDM modulated carriers, since OFDM is applied inter-carriers rather than intra-carriers and the resulting symbol rate is large. Also thanks to the use of low-loss and low non-linearity Ultra Large Area Fibre (ULAF) in combination with Raman amplification, [4.21] reached a very remarkable 7,200 km transmission distance. Nonetheless, [4.21] needs frequency and phase synchronization, and symbol transition alignment at the transmitter (Tx), together with broadband receivers (Rx),

FP7-ICT-216863/ORC/R/PU/D15.2
Page 23 of 76
necessarily processing more than one carrier at a time. This makes this approach somewhat challenging to realize in practice.
An alternative approach is that of creating a superchannel by tightly packing conventional WDM channels and achieving low crosstalk not by means of CO-OFDM but using carrier shaping at the Tx. This technique is well-known and has been very widely used in radio links for decades. Theoretically, by means of almost-rectangular carrier filters, Baud-rate spacing is achievable too, same as for CO-OFDM, but with no need for either frequency, phase and transition synchronization, or of broadband receivers.
Current optical filters are not as good as those available for radio links, whose shape is in fact almost ideal. Major progress was however recently made thanks to a MEMS based technology which now allows to shape filters accurately with steep cut-off and it can be foreseen that even better filters can be made in the future using this or alternative technologies. Also, group delay distortion at the edges, if present, is quite irrelevant since DSP equalizers at the Rx would easily take care of it.
In this work, we are investigating the long-haul reach of a 1Tb/s superchannel comprising 10x100Gb/s PM-QPSK modulated carriers. We specifically address carrier spacing and investigate its impact on the transmission reach. A key component for generating the superchannel signal is the optical Finisar filter to pre-shape the carriers and a re-circulating frequency shifter (RFS) circuit to adjust carrier spacing [4.19], [4.21]. Experiments are currently being carried out with extremely tight carrier spacing of 1.2 and 1.1 times the Baud rate, the latter being a record, to the best of our knowledge, for conventional WDM (non-OFDM and non-CO-OFDM) systems. The experiments are being carried out over the operator FASTWEB’s installed cable plant in the city of Turin, Italy, which consists of uncompensated Standard-Single Mode Fiber (SMF) with EDFA in-line amplification. Preliminary results have been submitted to the OFC 2010 conference.
4.4 Chirp analysis and MLSE (PoliTo-UPC)
4.4.1 Introduction
In metropolitan and access networks, cost efficiency and power budget is a must to be considered for driving into high data rates [4.22, 4.23, 4.24]. The light source is one of the most costly devices in optical systems. Direct modulated lasers (DMLs) have become an alternative for short-haul networks [4.25, 4.26, 4.27]. However, their frequency chirp characteristics along with chromatic dispersion (CD) in the fibre limit the maximum distance by a few tens of kilometres at high bitrates due to the high inter-symbol interference (ISI) [4.25, 4.26, 4.28]. Electronic dispersion compensation (EDC) has become a promising solution for overcoming the effects of dispersion [4.29]. MLSE presents the best performance against dispersion among the EDC types, but is also the more complex [4.29, 4.30]. It uses the Viterbi algorithm to take decision upon the received signal samples considering the most probable sequence that has been transmitted.
In this document, we present the simulative results of a study of the performance of a chirped modulator with an MLSE equalizer in the receiver. A comparison of the performance with a traditional receiver and non-chirped modulator is also shown. The evaluation was made in terms of optical signal to noise ratio (OSNR) needed for a required target bit error ratio (BER)

FP7-ICT-216863/ORC/R/PU/D15.2
Page 24 of 76
for different CD values. The results motivated us to perform an experiment with a DML, whose results are presented in the final section.
4.4.2 Simulation setup
Data is generated at a rate of 10Gb/s by a pseudo random binary sequence (PRBS) of 215-1 and passed to a driver to generate non-return to zero (NRZ) pulses which are then filtered by a 4-pole low-pass Bessel filter with bandwidth (BW) of 12.5 GHz. This signal is then fed to a modulator which modules a DFB laser centred at 1550 nm. The optical pulses are sent through single-mode fibre (SMF) with 0.2 dB/km attenuation and 17 ps/nm·km dispersion. After the fibre, amplified spontaneous emission (ASE) noise was added to the signal to simulate the OSNR measured at an optical BW of 0.1nm. The receiver (RX) consists of an optical Gaussian filter with 40 GHz BW simulating the drop of a channel in a 100 GHz spaced grid. It is followed by a PIN photodiode and a 5-pole low-pass Bessel filter with BW of 7.5 GHz. The data obtained is then passed to a MLSE processor with 16 states. We used this number of states because it is a start of the art equalizer physically available [4.29]. Fig. 9 illustrates the system setup.
Fig. 9: Schematic of the simulation set-up.
4.4.3 Simulation results
The required OSNR (rOSNR) for a target BER = 10-3 (enough for getting a BER=10-15 with forward-error correction, FEC) for the chirpless and chirped transmitted (TX) signal against chirp (α) is plotted in Fig. 10(a). The positive chirped signal presents the worst performance because the positive CD acts in the same direction of the chirp, enhancing the ISI. On the other hand, a negative chirp lowers the rOSNR up to a certain total dispersion. This is due to the interaction in opposite directions of the chirp and CD. After that dispersion value, the signal is distorted and its performance becomes worse than the chirpless signal. This can be noticed in the lowest line of Fig. 10(a), especially for α=-2 at a distance of 90 km. To reduce the effects of dispersion and chirp, MLSE was employed. The results using a 16-states MLSE are shown in Fig. 10(b). As noticed in the horizontal axis of Fig. 10(b), the distance reachable has almost doubled. In this case, it is observed that a chirp α=-2 gives the best performance up to 110 km; afterwards, the penalty with respect to the chirp-less signal raises quickly. The same behaviour can be seen with a chirp of α=-1 with an inflexion point at 150 km.

FP7-ICT-216863/ORC/R/PU/D15.2
Page 25 of 76
Fig. 10: OSNR needed to get a BER of 10-3 using different values of α: (a) normal RX, (b) MLSE-RX
4.4.4 Experimental setup
The setup of the experiment is shown in Fig. 11. A DFB-DML NLK5C5E2KA laser biased at 50 mA was directly modulated with NRZ data at 10 Gb/s at a wavelength of 1545.18nm. The data was generated with a pulse pattern generator (PPG) with a PRBS of 215-1. We modified the amplitude of the optical pulses for having an extinction ratio (ER) of 4.7 dB. The optical signal was then sent through spans of SMF, whose loses were recovered by an EDFA followed by a 300 GHz optical filter. At RX, ASE noise was added using an optical amplifier followed by a variable optical attenuator (VOA) to modify the measured OSNR at a resolution of
(a)
(b)

FP7-ICT-216863/ORC/R/PU/D15.2
Page 26 of 76
0.1nm. The RX signal was then detected with an APD, amplified electronically and sent to a bit error ratio tester (BERT). For the MLSE post-processing, a digital storage oscilloscope (DSO) with 6 GHz BW captured 13.1072 µs data sampled at 20 Gsamples/s giving 217 bits with 2 samples/bit. The data was then post-processed using an MLSE algorithm.
Fig. 11: Schematic of the experimental set-up.
4.4.5 Experimental results
Fig. 12: ONSR vs. Fiber length for target BER = 10-3 with ER = 4.7 dB.
Fig. 12 shows the curve for the rOSNR for a target BER of 10-3 using optimum-threshold RX and an MLSE-RX. We present the results using a 4-state MLSE which proved to be enough for our experiment. We tested with 8 and 16 states, as well as with the SQRT data, but the improvement was minimal in all cases. The decreasing slope noted in Fig. 12 after 25 km with an optimum threshold RX is due to the interaction of the transmitted chirped pulses with the

FP7-ICT-216863/ORC/R/PU/D15.2
Page 27 of 76
chromatic dispersion. This causes the signal distortions to smooth out, improving the signal quality [4.25, 4.31]. The MLSE curve performs better by 1 or 2 dB and it also shows a negative slope. This slope is flatter compared with optimum threshold receiver and becomes positive after 75 km. However, the penalty at 100 km with respect to back-to-back (btb) is only of about 0.5dB. This shows the effectiveness of the MLSE since that distance was not reachable with normal RX.
4.4.6 Conclusions
Simulations showed that employing both MLSE and negative chirp can assist in increasing the maximum reachable fibre length. MLSE also helps in reducing the effects of chirp together with CD. An experiment was also performed with a DML. The results illustrated that the overall system penalty is considerable reduced when using MLSE and distances longer than 100 km can be reachable with the use of FEC. The combination of MLSE along with DML source can become an interesting and cost-effective solution in central remote nodes of future optical access networks.
4.5 Suitability of transform-based signal processing for optical transmission technologies (CTTC)
The deployment of high-speed, large-capacity optical systems, able to support the high growth of IP traffic is addressing new technical challenges. As the transmission speed increases, signal degradation issues and transmission impairments, such as chromatic dispersion (CD) and Polarization Mode Dispersion (PMD), severely limit the attainable distance. On the other hand, the electronic bottleneck represents an impairment to achieve higher throughput and fully exploit the optical bandwidth. Suitable signal processing plays a fundamental role in designing efficient and cost-effective solutions for flexible, high-capacity optical networks. A signal processing in the electrical domain takes advantage of the mature technology and capabilities of digital signal processing (DSP); while processing signals directly in the optical domain provides bit-rate and signal-format independent transmission schemes, preserving end-to-end optical transparency.
We have proposed a novel Optical Orthogonal Frequency Division Multiplexing (O-OFDM) transmission system, where the processing in the electrical domain is performed by using a real trigonometric transform in place of the discrete Fourier transform (DFT), on which is based the standard OFDM scheme.
We have also provided all-optical passive architectures to implement discrete real trigonometric transforms for high-speed optical signal processing.
4.5.1 Novel optical OFDM transmission scheme
OFDM is a multi-carrier transmission technique. The signal is transmitted over several lower-rate sub-channels, whose sub-carriers are orthogonal to each other. Therefore, their spectra are allowed to overlap, resulting in high spectral efficiency. The use of OFDM in optical networks meets the twofold requirement of mitigating transmission impairments and providing high data rate transmission. The high tolerance to chromatic dispersion (CD) and polarization mode dispersion (PMD) allows extending the attainable distance before significant distortion to thousands of kilometers [4.32, 4.33].

FP7-ICT-216863/ORC/R/PU/D15.2
Page 28 of 76
The signal processing in the OFDM transmitter/receiver takes advantage of the efficient algorithm of FFT, which enables the use of available DSP devices. The OFDM signal is then modulated on an optical carrier; direct-detection (DD) and coherent schemes can be used, trading simplicity against increased sensitivity. These alternative solutions result from the critical issue of transmitting the complex bipolar OFDM signal in an optical system.
We have proposed a novel DD optical OFDM scheme, depicted in Fig. 13, based on a real trigonometric transform: the discrete Hartley transform (DHT).
For a sequence x(n) the DHT is defined as
( ) ( ) ( ) ( )1
0
1cos 2 / sin 2 / 0,1, , 1
−
=
= + = − ∑ L
N
n
h k x n kn N kn N k NN
π ππ ππ ππ π .
Fig. 13: Optical DHT-based OFDM.
The DHT transform kernel differs from the DFT kernel only for the imaginary unit and the mirror-symmetric sub-bands of DHT ensure subcarriers orthogonality. Therefore, fast Hartley transform (FHT) can advantageously replace the FFT to implement the OFDM modulation/demodulation, as demonstrated for high-speed wireless communications [4.34].
We have exploited the properties of the real trigonometric transform with the aim of streamlining the conventional OFDM scheme, based on FFT, to achieve a lower-cost transmission system. If the input data signal is mapped into a real constellation, the inverse FHT (IFHT) gives real values, so that only the in-phase component, and no imaginary contribution, has to be processed. The number of required electronic devices is reduced, resulting in lower hardware cost and lower power consumption. In fact, the number of digital-to-analog and the analog-to-digital converters (DAC/ADCs) is halved, as shown in Fig. 13, while two DACs and two ADCs are required when OFDM modulation/demodulation is based on standard FFT. Compared to discrete multi-tone modulation (DMT) systems, no Hermitian symmetry constrain is required for the input signal, in fact the IFHT of a real signal is real as well.
Moreover, the direct and inverse Hartley transforms are identical, so that the same device can be used at the transmitter and at the receiver. The computational complexity of FHT is lower than FFT, because only real multiplications have to be calculated and no complex algebra has to be applied, resulting in a faster and simpler algorithm to implement [4.35]. The DHT real
Fiber linkModulatorFilter Filter
DHT-OFDM TX
IFH
T
Par
alle
lto
Ser
ial
Ser
ial t
oP
aral
lel
Re
DA
C
Rea
l Co
nst
ella
tio
nm
app
er
OFDM RX
Dem
app
er
FH
T
Ser
ial t
oP
aral
lel
Par
alle
lto
Ser
ial
AD
C
Fiber linkModulatorFilter Filter
DHT-OFDM TXDHT-OFDM TX
IFH
T
Par
alle
lto
Ser
ial
Ser
ial t
oP
aral
lel
Re
DA
C
Rea
l Co
nst
ella
tio
nm
app
er
OFDM RXOFDM RX
Dem
app
er
FH
T
Ser
ial t
oP
aral
lel
Par
alle
lto
Ser
ial
AD
C

FP7-ICT-216863/ORC/R/PU/D15.2
Page 29 of 76
processing also simplifies the conversion of the OFDM signal into an optical signal to be transmitted over intensity modulated direct detection systems.
4.5.2 Real trigonometric transforms for all-optical signal processing
Discrete Hartley transform (DHT) and discrete cosine transform (DCT) are real trigonometric transforms and can be advantageously used in optical communications exploiting their properties for optical signal processing. They are powerful tools for signal filtering and data compression. The possibility to evaluate both transforms directly in the optical domain is particularly attractive for high-speed optical signal processing.
The Hartley transform is suitable for the analysis of real signals, since the DHT of a real signal is real, while standard Fourier transform performs a complex processing and the phase always carries fundamental information. Furthermore, the real R(k) and imaginary X(k) parts of the Discrete Fourier Transform (DFT) coincide with the even and the negative odd parts of the Discrete Hartley Transform (DHT), respectively. Therefore, DHT is also suitable to calculate power spectra: by using DFT, the power spectrum of the signal ( )x n can be evaluated as
( ) ( ) ( )2 2 2= +S k R k X k , by using DHT it can be more easily and efficiently calculated as
( ) ( ) ( )2 2 2 2 = + − S k h k h N k , being ( )h k the discrete Hartely transform of the sequence
( )x n . DHT can be also advantageously used in place of DFT, to avoid calculations between
complex values. For example, the DHT of a convolution is simply the product between the DHT of the two signals, when one of them presents even symmetry. The convolution theorem for DHT has key relevance in image processing and digital filtering. Similarly, the cross-correlation theorem for DHT does not deal with complex conjugation and the product is performed between real values [4.36].
In optics, complex computations are carried out by the use of phase shifters, not required in the optical implementation of DHT. In fact, the optical circuit implementing an N-order FHT can be simply synthesized with an optical passive fiber network of asymmetric couplers. Instead, phase shifters are required for the optical implementation of FFT. As shown in the block diagram of Fig. 14(a), the N-order FHT optical circuit only requires an additional stage of asymmetric couplers for the odd block, that can be easily derived with a recursive procedure [4.37]. As an example, we have reported in Fig. 14(b) the N=8 FHT circuit. The odd stage is implemented by a single 3dB coupler and two fibers, and it has been merged with the N/2=4 FHT network, according to the design guidelines in [4.37]. The same stage of the optical FFT circuit requires three phase shifters (see Fig. 3 of Ref. [4.38]).
DHT can be also advantageously used to calculate the DCT, with a faster and simpler implementation compared to indirect computation using FFT: complex processing can be avoided and no phase shifters are required for the optical implementation.
Due to its energy compaction property, DCT is suitable for data compression, since it concentrates the signal energy only in its low index coefficients. The high indices can be neglected without affecting the content of the signal. Moreover, DCT is also useful in optical image reconstruction, filtering and feature extraction.

FP7-ICT-216863/ORC/R/PU/D15.2
Page 30 of 76
(a) (b)
Fig. 14: (a) Block diagram of the recursive procedure to implement the optical N-order FHT; ĥe(k) and ĥo(k) indicate the even and odd components in bit reverse order of the transform of the sequence
x(n). (b) Optical circuit scheme of 8-order FHT.
The N-order DCT of a sequence x(n), defined as
( ) ( ) ( )1
0
2( ) cos 2 1 2
−
=
= + ∑N
n
z k b k x n n k NN
ππππ , with 1 2 0
( )1 0 1
== < ≤ −
kb k
k N,
can be simply derived by the N-order FHT of the sequence ( )%x n , with ( ) ( )2=%x n x n and
( ) ( )1 2 1− − = +%x N n x n [35]. Therefore, the design of the N-order DCT optical circuit is very
simple, by means of the DHT-based indirect computation. The first step consists of inverting the input elements to use the FHT optical architecture of the same order; then the design of the butterfly stage/stages, to add at the output of the FHT odd block, is required, according to [35]. As shown in Fig. 15(a), the synthesis can be provided also by a recursive procedure: the reordered inputs are combined with a 3dB couplers bank, the even block is processed by the DCT circuit of order N/2 and the odd block is evaluated by an optical circuit obtained from the modified FHT network. The optical circuit can be further optimized as shown in the example of Fig. 15(b) [4.37].
(a) (b) Fig. 15: (a) Block diagram of the recursive procedure to optically implement the N-order DCT;
(b) 8-order optical DCT.

FP7-ICT-216863/ORC/R/PU/D15.2
Page 31 of 76
4.6 Reducing the Impact of Intrachannel Nonlinearities By Pulse-Width Optimisation in Multi-level Phase-Shift-Keyed Transmission (UCL, HWDE)
4.6.1 Introduction
Higher level modulation formats allow increased spectral efficiency, and have recently attracted much interest [4.39-4.41]. Coherent detection is required to achieve full benefit of digital signal processing (DSP), which is capable of equalizing transmission impairments. It is comparatively easy to compensate for linear impairments such as chromatic dispersion or PMD [4.42], but equalization of nonlinear impairments requires high computational effort and complexity [4.43] to be effective. Another method to decrease the nonlinear influence on a signal is the reduction in duty cycle [4.44], which has been investigated for on-off-keying and differential binary phase shift keying (DBPSK) [4.45-4.46].
For the first time, this paper provides a comprehensive study on the impact of intra-channel nonlinearities and nonlinear phase noise (NLPN) on higher order phase modulated signals with various duty cycles. The transmission performance of four coherently detected DMPSK (M=2,4,8,16) and two directly detected modulation formats (DBPSK and DQPSK) are studied. The nonlinear threshold is used as a performance metric for the different formats with a duty-cycle, varied from 100% to 33%.
4.6.2 Multi-level Phase-Shift-Keyed Transmission
The system performance was investigated by simulation using a 212 bit long De-Bruijn-sequence, differentially precoded to generate driving-signals for the transmitter. The bit-rate was fixed at 40 Gbit/s, leading to a symbol-rate of 40, 20, 13.3 and 10 Gbaud for DPSK, DQPSK, D8PSK and D16PSK, respectively. The electrical transmitter-bandwidth of the data signals driving the modulators is modelled with a 5th order Bessel filter with a 3dB bandwidth of 20 GHz for all formats except DBPSK, which used 32 GHz.
DBPSK was generated by driving a Mach-Zehnder-Interferometer (MZI) with a swing of 2·Vπ around its zero transmission point. To modulate the real- and imaginary parts of the optical field, DQPSK requires a structure of three nested MZIs (or IQ-modulator). For D8PSK, the IQ-modulator was followed by a phase-modulator, which varies the phase between 0 and π/4 rad. To obtain D16PSK another phase-modulator was inserted into the optical path varying the phase between 0 and π/8 rad. A Mach-Zehnder modulator based pulse carver was added to generate duty cycle values of 67%, 50% and 33% (see Fig. 16). In case of 67% the pulse carver introduces a periodic phase-modulation, which leads to an additional offset of π rad within the decoded symbol sequence.
The test transmission link consists of 10 spans of 80km standard single mode fibre (SSMF), optically compensated by dispersion compensating fibre (DCF) placed between dual- stage EDFAs. The fibre parameters used for the simulations are shown in Table 2. Pre-compensation and residual dispersion per span were optimized for RZ-50-DPSK format at 40 Gbit/s to suppress distortion caused by intrachannel nonlinearities. Post-compensation was adjusted to obtain 0ps/nm accumulated dispersion at the receiver.

FP7-ICT-216863/ORC/R/PU/D15.2
Page 32 of 76
Differential Pre-Coding and Gray-Mapping
π/2
π/2
π/2
Vπ /4
Vπ
/8
π/2
Binary Data
Pulse-Carver
Q
II
Q
I
I
Q-Data
I-Data
Fig. 16: Transmitter setup.
SSMF DCF
α [dB/km] 0.2 0.4
D [ps/km/nm] 16 -107
γ [1/W/km] 1.2 5.3
Table 2: Fibre parameters
On the receiver side the optical signal was noise loaded and filtered with a 2nd order Gaussian optical filter with a 3dB bandwidth of 2·symbol-rate. The signals beat with a local oscillator laser (LO) of 100 kHz linewidth inside a fibre coupler to recover the real and imaginary parts of the optical field. The LO and transmitter laser were assumed to have zero frequency offset. The limited bandwidth of the photodiodes was modelled with 5th order Bessel filter with 3dB bandwidth of 0.8·symbol-rate. Digital phase recovery was employed by using the Mth-power algorithm [4.47] to estimate the signal phase. The number of samples over which the phase estimator averages was optimized for every coherently detected modulation format. After hard decision and differential decoding, the bit-error-rate (BER) was determined by counting errors over a range of optical-signal-to-noise-ratios (OSNR) to yield the required OSNR (rOSNR) at a BER of 1·10-3. For comparison, non-coherent detection with optical delay-line-interferometers was also investigated, considering DBPSK and DQPSK.
4.6.3 Results and Discussion
A4.6.3.1 Back-to Back Performance
All modulation formats were investigated in the back-to-back case (Fig. 17(a)). It can be seen, that an increase in the number of constellation points leads to a worsening back-to-back performance, attributed to a reduced distance between neighbouring constellation-points, assuming the same average signal-power. Furthermore, the optimum receiver sensitivity is theoretically independent of the pulse-shape, given a matched filter optimizing the OSNR at the receiver. In our investigation, NRZ always exhibited approximately 1dB higher rOSNR compared to RZ-pulse-shapes, which is due to the receiver filter combination used, achieving an improved matching for RZ-pulses.

FP7-ICT-216863/ORC/R/PU/D15.2
Page 33 of 76
33 50 67 100
10
12
14
16
18
20
rOS
NR
@ B
ER
1x1
0-3 [d
B]
duty-cycle [%]
DBPSK coherent DBPSK DQPSK coherent DQPSK coherent D8PSK coherent D16PSK
-3 -2 -1 0 1 2 3-3-2-10123
c)
b)
Qua
drat
ure
[a.u
.]
Inphase [a.u.]
a)
-3 -2 -1 0 1 2 3-3
-2
-1
0
1
2
3
Qua
drat
ure
[a.u
.]
Inphase [a.u.]
Fig. 17: Back to back performance of the studied phase-shift-keyed modulation formats (a), constellation diagrams of NRZ-D16PSK in the back to back case (b) and after transmission over 800 km (c) at 28.7dB OSNR.
Coherently detected RZ-50-DBPSK shows the best performance, achieving a rOSNR-improvement of 8.8dB relative to RZ-50-D16PSK.
A4.6.3.2 Transmission Performance
A key performance parameter is the nonlinear threshold, defined as the fibre launch power into the SSMF achieving a rOSNR penalty of 1dB with respect to the back to back performance. The NLT evaluated as a function of duty cycle (100% to 33%) for 800 km test link (assuming noise free EDFAs) is shown in Fig. 18(a). A reduction in the duty cycle improves transmission performance in every case. DBPSK exhibits the smallest performance improvement (2 dB from NRZ to RZ-33), while the NLT of D16PSK increases by 9dB from NRZ to RZ-33. The nonlinear penalty is mainly caused by IFWM and increases with decreasing symbol-rate since phase matching between adjacent frequency components increases with smaller bandwidth. Note, that intra-channel cross-phase-modulation is insensitive to the optical phase, and therefore degrades every pulse in a similar way, so does not contribute to the NLT.
Fig. 18(b) shows the NLT for the same test link, but now the impact of nonlinear phase noise [4.48] (NLPN) is also included by setting the EDFAs noise figure to 4.5dB. Direct detection of DPSK and DQPSK show negligible performance-degradation, suggesting that in their case IFWM is the dominant nonlinearity. While coherent DBPSK is also unaffected by NLPN, coherently detected DQPSK shows a penalty of 0.8-1.3dB. When switching from NRZ to RZ-33 performance-improvement ranges from 2.2dB (DBPSK) to 7.8dB (D16PSK).
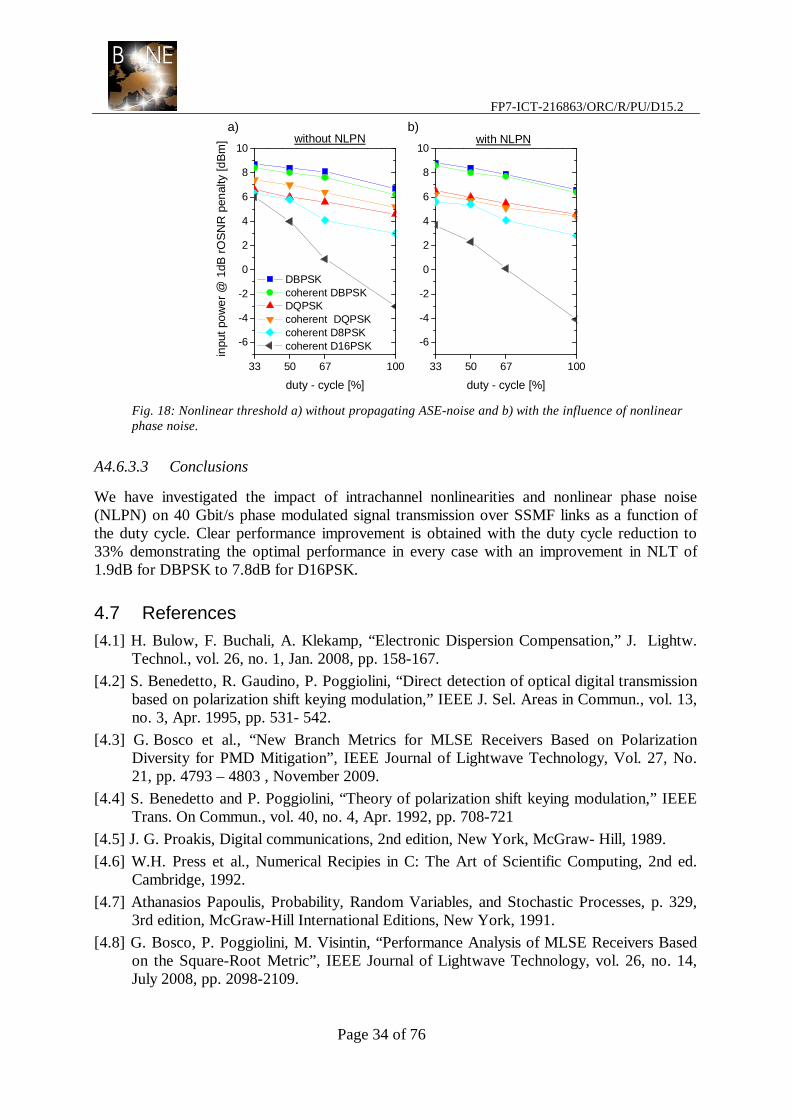
FP7-ICT-216863/ORC/R/PU/D15.2
Page 34 of 76
33 50 67 100
-6
-4
-2
0
2
4
6
8
10
33 50 67 100
-6
-4
-2
0
2
4
6
8
10
inpu
t pow
er @
1dB
rO
SN
R p
enal
ty [d
Bm
]
duty - cycle [%]
duty - cycle [%]
DBPSK coherent DBPSK DQPSK coherent DQPSK coherent D8PSK coherent D16PSK
a)with NLPN
without NLPNb)
Fig. 18: Nonlinear threshold a) without propagating ASE-noise and b) with the influence of nonlinear phase noise.
A4.6.3.3 Conclusions
We have investigated the impact of intrachannel nonlinearities and nonlinear phase noise (NLPN) on 40 Gbit/s phase modulated signal transmission over SSMF links as a function of the duty cycle. Clear performance improvement is obtained with the duty cycle reduction to 33% demonstrating the optimal performance in every case with an improvement in NLT of 1.9dB for DBPSK to 7.8dB for D16PSK.
4.7 References [4.1] H. Bulow, F. Buchali, A. Klekamp, “Electronic Dispersion Compensation,” J. Lightw.
Technol., vol. 26, no. 1, Jan. 2008, pp. 158-167.
[4.2] S. Benedetto, R. Gaudino, P. Poggiolini, “Direct detection of optical digital transmission based on polarization shift keying modulation,” IEEE J. Sel. Areas in Commun., vol. 13, no. 3, Apr. 1995, pp. 531- 542.
[4.3] G. Bosco et al., “New Branch Metrics for MLSE Receivers Based on Polarization Diversity for PMD Mitigation”, IEEE Journal of Lightwave Technology, Vol. 27, No. 21, pp. 4793 – 4803 , November 2009.
[4.4] S. Benedetto and P. Poggiolini, “Theory of polarization shift keying modulation,” IEEE Trans. On Commun., vol. 40, no. 4, Apr. 1992, pp. 708-721
[4.5] J. G. Proakis, Digital communications, 2nd edition, New York, McGraw- Hill, 1989.
[4.6] W.H. Press et al., Numerical Recipies in C: The Art of Scientific Computing, 2nd ed. Cambridge, 1992.
[4.7] Athanasios Papoulis, Probability, Random Variables, and Stochastic Processes, p. 329, 3rd edition, McGraw-Hill International Editions, New York, 1991.
[4.8] G. Bosco, P. Poggiolini, M. Visintin, “Performance Analysis of MLSE Receivers Based on the Square-Root Metric”, IEEE Journal of Lightwave Technology, vol. 26, no. 14, July 2008, pp. 2098-2109.

FP7-ICT-216863/ORC/R/PU/D15.2
Page 35 of 76
[4.9] M. R. Hueda, D. E. Crivelli, H. S. �arter, and O. E. Agazzi, “Parametric estimation of IM/DD optical channels using new closed-form approximations of the signal PDF, J. Lightw. Technol., vol. 25, no. 3, pp. 957-975, Mar. 2007.
[4.10] G.J. Foschini and C.D. Poole, “Statistical theory of polarization dispersion in single mode fibers,” J. Lightwave Technol., vol. 9, pp. 14391456, 1991.
[4.11] T. Kupfer et al., OFC 2008, San Diego, Feb. 2008, paper PDP13.
[4.12] P. Poggiolini et al., ECOC 2006, Cannes, Sept. 2006, paper PD 4.4.6.
[4.13] N. Alic, et al., “Experimental demonstration of 10 Gb/s NRZ extended dispersion-limited reach over 600 km-SMF link without optical dispersion compensation in Proc. Of OFC 2006, Mar. 5-10, paper OWB7, 2006.
[4.14] A.Kavcic et al., IEEE Trans. Magnetics, vol. 34, no. 3, May 1988, pp 763-771.
[4.15] S.J. Savory et al., “Digital Equalisation of 40 Gbit/s per Wavelength Transmission over 2480km of Standard Fibre without Optical Dispersion Compensation,"” ECOC 2006, paper Th2.5.5.
[4.16] C.R.S. Fludger et al., “10 x 111 Gbit/s, 50 GHz Spaced, POLMUX-RZ-DQPSK Transmission over 2375 km Employing Coherent Equalisation,” OFC 2007, paper PDP22.
[4.17] S.L. Jansen et al., “107-Gb/s full-ETDM transmission over field installed fiber using vestigial sideband modulation,” OFC 2007, paper OWE3.
[4.18] K. Schuh et al., “8x85.4 Gbit/s WDM Field Transmission over 421 km SSMF Link Applying an 85.4 Gbit/s ETDM Receiver” ECOC 2005, paper We2.2.2.
[4.19] Y. Ma et al., “1-Tb/s per Channel Coherent Optical OFDM Transmission…” OFC 2009, San Diego, Mar. 2009, paper PDPC1.
[4.20] R. Dischler et al., “Transmission of 1.2 Tb/s Continuous Waveband…,” OFC 2009, San Diego, 22-26 Mar. 2009, paper PDPC2.
[4.21] S. Chandrasekhar et al., “Transmission of a 1.2 Tb/s 24-carrier…,” ECOC 2009, Vienna, Sep. 20-24, 2009, paper PD2.6.
[4.22] Mark. D. Feuer, et al., “Electronic dispersion compensation for a 10-Gb/s link using a directly modulated laser” in IEEE Phot. Technol. Lett., vol. 15, no. 12, pp. 1788-1790, Dec. 2003.
[4.23] I. Tomkos, et al., “10-Gb/s transmission of 1.55-µm directly modulated signal over 100 km of negative dispersion fibre” in IEEE Phot. Tecnhol. Lett., vol. 13, no. 7, pp. 735-737, July 2001.
[4.24] Kenji Sato, Shoichiro Kuwahara, and Yutaka Miyamoto, “Chirp characteristics of 40-Gb/s directly modulated distributed-feedback laser diodes”, in Journal of Lightw. Technol., vol. 23, no. 11, pp. 3790-3797, Nov. 2005.
[4.25] Ioannis Papagiannakis, et al., “Performance improvement for low-cost 2.5 Gb/s rated DML sources operated at 10 Gb/s”, IEEE Phot. Technol. Lett., vol. 20, no. 23, pp. 1983-1985, Dec. 2008.
[4.26] C.R.S. Fludger, et al., “Electronic Equalisation for low cost 10 Gbit/s directly modulated systems”, OFC 2004, Paper WM7.

FP7-ICT-216863/ORC/R/PU/D15.2
Page 36 of 76
[4.27] Robert A. Griffin, et al., “Combination of InP MZM transmitter and monolithic CMOS 8-state MLSE receiver for dispersion tolerant 10 Gb/s transmission”, OFC 2008, Paper OthO2.
[4.28] James Whiteaway, et al., “Review of recent progress in MLSE receiver technologies”, LEOS 2007, Invited paper TuA1.1.
[4.29] T. Kupfer, et al., “Measurement of the performance of 16-states MLSE digital equalizer with different optical modulation formats”, in Proc. of OFC 2008, San Diego, Feb. 2008, paper PDP13.
[4.30] D. Breuer, et al., "Simultaneous compensation of PMD and CD in a 10.7 Gb/s Field Trial based on the MLSE", OECC/IOOC, Yokohama July 2007, Paper 13B2-3
[4.31] S. Mohrdiek, et al., “10-Gb/s standard fibre transmission using directly modulated 1.55-µm quantum-well DFB lasers” in IEEE Phot. Tehcnol. Lett., vol. 7, no. 11, pp. 1357-1359, Nov. 1995.
[4.32] A.J. Lowery, J. Armstrong, “Orthogonal-frequency-division multiplexing for dispersion compensation of long haul optical systems”, Optics Express, vol. 14, pp. 2079-2084, 2006.
[4.33] S. L. Jansen, et al., “Coherent optical 25.8-Gb/s OFDM transmission over 4160-km SSMF”, J. Lightwave Technol., vol. 26, pp. 6-15, 2008.
[4.34] D. Wang, et. al., “A novel DHT-based ultra-wideband system”, in Proc. IEEE ISCIT, Oct. 2005.
[4.35] H. S. Hou, “The fast Hartley transform algorithm”, IEEE Trans. Computers, vol. C-36, pp. 147-156, 1987.
[4.36] R. N. Bracewell, “Discrete Hartley transform”, J. Opt. Soc. Amer., vol. 73, pp.1832-1835, Dec. 1983.
[4.37] M. Svaluto Moreolo, G. Cincotti, “Fiber optics transforms”, in Proc. ICTON 2008, Athens, Greece, July 2008.
[4.38] A. E. Siegman, “Fiber Fourier optics”, Opt. Lett., vol. 19, pp. 1215–1217, 2001.
[4.39] P. Winzer et al., ECOC 2008, paper Th3E5.
[4.40] G. Charlet et al., OFC 2008, paper PDP3.
[4.41] K. Sekine et al., OFC 2008, paper OMI 4.
[4.42] S. Savory, Optics Express, Vol. 16 (2007), 804-817.
[4.43] X. Li et al., Optics Express, Vol. 16 (2008),880-888.
[4.44] A. Mecozzi et al., PTL, Vol. 12 (2000), 392-394.
[4.45] D. Breuer et al., PTL, Vol. 9 (1997), 398-400.
[4.46] R. Dischler et al., OFC 2004, paper TuF4.
[4.47] J.G.Proakis et al., Digital Communications 5th ed., McGraw Hill (2008), pages 313-314.
[4.48] J.P. Gordon et al., Optics Letters, Vol. 15 (1990), 1351-1353.

FP7-ICT-216863/ORC/R/PU/D15.2
Page 37 of 76
5. Signal regeneration (UoE, ORC, UoA, NTUA)
5.1 Fiber-based regeneration (UoE, ORC, UoA)
5.1.1 Multi-Wavelength Conversion (MWC) using HNLF (UoE, ORC)
A5.1.1.1 Introduction
All-optical wavelength conversion reduces the blocking probability of WDM network nodes, increases their transparency, and enables dynamic wavelength assignment and allocation. All-optical multi-wavelength conversion (MWC) has attracted increasing interest in the last decade. While a huge amount of optic-electronic-optic (OEO) transponders and electronics can be saved while implementing the same function, MWC is an attractive technology for making multiple copies directly in the optical domain, an innovative step towards the next-generation intelligent all-optical wavelength-routed or packet/burst switched network. New applications are also emerging from this possibility. In particular, optical layer WDM wavelength multicast and Grid networking are becoming both technically feasible and commercially applicable. MWC for optical multicast is simple and straightforward, and is compatible with all-optical label swapping technologies [5.1]. It is particularly useful for optical wavelength switching nodes that employ passive waveguides such as arrayed waveguide gratings (AWG).
Various all-optical MWC approaches have been reported during the past few years. The most investigated MWC methods such as four-wave mixing (FWM) [5.2], cross-phase modulation (XPM) [5.3], cross-gain modulation (XGM) [5.4], cross-absorption modulation (XAM) [5.5], and fast non-linear polarization switching (NPS) [5.6] have shown promising results for WDM wavelength-routed multicast. Every MWC technique has its advantages and disadvantages. Therefore, not all of them are suitable for adoption in optical switches. For instance, FWM is limited by its low conversion efficiency and wavelength inflexibility. XAM suffers from the large insertion loss of the electro-absorption modulator utilized. XGM by double-stage semiconductor optical amplifiers (SOAs) requires high input signal optical power because of the splitting process to both SOAs [5.7]. XPM depends on power and polarization of the input signal to the converter.
These schemes are generally complicated, require several cw-pumps, and provide usually signals of lower quality than the original signal, and exhibit different degrees of conversion efficiency among the channels produced.
Self-Phase Modulation (SPM) in a highly nonlinear fibre (HNLF) has shown ability for MWC when used in conjunction with an AWG [5.8]-[ 5.9].
However, investigations of the conversion efficiency and the potential regeneration effects, associated with multicasting of a noise distorted signal using SPM, have never been reported. In this report, investigation into the use of a modified configuration of SPM in an HNLF is experimentally demonstrated to provide WDM multicasting functionality as shown in Fig. 19.

FP7-ICT-216863/ORC/R/PU/D15.2
Page 38 of 76
Fig. 19: Concept of MWC using SPM.
A5.1.1.2 Operating Principle
When a data signal propagates in an HNLF, its spectrum is broadened due to SPM. The resulting output spectrum is quite flat, compared to the input, if specific parameters like fibre nonlinearity, dispersion and dispersion slope, as well as input signal’s power are carefully chosen. Subsequent optical filtering at a frequency that is shifted with respect to the input carrier frequency provides a nonlinear step-like transfer function between the input and the output optical power. The step-like function indicates that there is a threshold for the input power; below this threshold output power is minimized, while above the threshold output power remains almost constant.
Due to the step-like transfer function, actual reshaping can be performed including suppression of noise in spaces and suppression of amplitude fluctuations in marks [5.10]. Using this property and incorporating an optical amplifier before the HNLF, a 2R regenerator performing re-amplification and re-shaping can be designed. Since the nonlinear behaviour of the HNLF originates from the Kerr effect, its nonlinear response is practically instantaneous, making this kind of regenerator particularly suitable for future high data rate systems at 40, 160 Gbps, and beyond [5.11].
By appropriately choosing the central wavelengths and the bandwidths of the filters, multiple WDM channels are formed. The original data signal is replicated into these channels, i.e. actual WDM multicasting is performed. When the spectrum is sufficiently flat over the entire bandwidth of the produced channels, only small differences between the channels’ power (0.5dB) are achieved. However, it is feasible if the input power is carefully adjusted, so that some channels are indeed regenerated, and the rest undergo acceptable quality degradation. This makes the specific technique extremely interesting and advantageous over the other WDM multicast techniques mentioned above.
A5.1.1.3 Experimental Set-up
A5.1.1.3.1 10Gbps Signal Replication
The experiment was setup according to the Block Diagram in Fig. 20, below. The laser source used was Erbium Glass Oscillating (ERGO) pulse source with 2ps-pulses at a wavelength of 1546 nm. Amplitude noise was intentionally introduced to the pulses in a controlled fashion using an amplitude modulator, which was driven by a 15 MHz sinusoidal signal. The amplitude jitter could be varied by adjustment of the modulation depth of the sinusoidal signal and modification of the bias voltage of the modulator to a non-optimum position, so as to degrade the extinction ratio between marks and spaces.

FP7-ICT-216863/ORC/R/PU/D15.2
Page 39 of 76
Using this approach, it was possible to add intensity noise to the ‘zero’ and/or the ‘one’ levels of the input pulses in a deterministic and flexible way, which permitted assessment of the performance of the regenerator in terms of amplitude equalization and ghost pulse suppression individually.
The output power of the fibre amplifier was set to +19.35dBm in order to ensure that enough broadening has been achieved. The eye-diagrams of the input signal to the HNLF are shown in Fig. 21. The parameters of the HNLF used to broaden the signal are reported in Table 3.
Fibre Attenuation
(dB/Km)
Dispersion
(ps/nm/Km)
Slope
(ps/nm2/Km)
γ
(W-1.Km-1)
PMD
(ps/Km½)
Length
(m)
HNLF 0.49 -0.64 0.03 20 0.05 490
Table 3: HNLF parameters measured at 1550nm.
Fig. 20: Experimental Setup at 10Gbps.
Fig. 21: Diagrams of the input of the HPFA a) without added noise, b) with added noise.
(a) (b)

FP7-ICT-216863/ORC/R/PU/D15.2
Page 40 of 76
The output power of the HNLF is measured to be around +16dBm. The spectrum of the broadened output is shown in Fig. 22. A range of 16nm is studied to determine the replicas generated. In this range the output power varied from - 3.4dBm at 1546nm to -6.25dBm at 1551.6nm.
Fig. 22: output spectrum after the HNLF. a) 50nm span. b) 16nm span.
The AWG channels used to slice the spectrum and generate the replicas have a 3-dB bandwidth of ~0.62nm and they are spaced by ~0.8nm from each other. Four outputs of the AWG, 1546, 1546.8, 1544.4, and 1542.8nm, were considered for BER measurements. The eye-diagrams of the signals at the central wavelength 1546nm (worst case) 1542.8nm and 1540.4nm (furthest from the central wavelength) are shown in Fig. 23(a), Fig. 23(b) and Fig. 23(c), respectively.
Fig. 23: Eye Diagrams at 1546nm with Vp-p=57mV (a), 1542.8nm with Vp-p=55mV (b) and 1540.4nm with
Vp-p=61mV (c).Vertical Scale 15mV/div.Horizontal scale 20ps/div.
(a) (b)
(c)
(a) (b)

FP7-ICT-216863/ORC/R/PU/D15.2
Page 41 of 76
The MEMS switches in Fig. 20 are used to emulate a mesh network. The performance of the network is measured with respect to the wavelength and number of hops (switches) at different monitor points, emulating different replicas of the original signal undergoing several paths.
A5.1.1.4 Results
A 10Gb/s Bit Error Rate Tester (BERT) was used to measure the BER of several replicas, each at several power levels or different added noise level. The BER Performance of the noise induced signal and the four selected output replicas are displayed in Fig. 24, with added noise of 24% of the Amplitude of the 'ones'.
In order to study and compare the BER Performance of all the outputs of the AWG in the 16nm range selected (1538-1554nm), measurement of the BER of each output at a received power of -20.11 dBm were taken with different added noise level. Figure 7 shows the results of these measurements with amplitude noise of 4%, 12.5%, 24% of the amplitude of the ‘one’.
The minimum BER for the four selected outputs was measured for different numbers of hops, emulated by the MEMS switches, are shown in Fig. 26. The paths were fixed for different output signals in order to study of the effect of the same switches on different wavelength.
Fig. 24: BER curves with 24% Amplitude Noise.
>4dB

FP7-ICT-216863/ORC/R/PU/D15.2
Page 42 of 76
Fig. 25: BER against Wavelength at a constant Received Power of -20.11dBm.
Fig. 26: Minimum BER against number of Hops, for different wavelengths.
A5.1.1.5 Discussion of Results
• It is clear from Fig. 24, that there is up to 6 dB improvement in the sensitivity of the receiver at BER of 10-9 due to 2R-regeneration in all cases. From this experiment, it can be concluded that any change in the number of outputs (Multicast streams) in a certain node won’t affect the signal quality of the rest of the outputs of that node.
• Based on the BER performance at λ=1544.495nm (4dB improvement), coupled with the results in Fig. 25, at least 13 replica outputs can be considered for Optical Multicast using this technique. All the outputs will have more than 4dB improvement in the

FP7-ICT-216863/ORC/R/PU/D15.2
Page 43 of 76
sensitivity of the receiver.
• This experiment was focused on the 16nm span around the central wavelength; however more replicas can be generated outside this range, but some of them have lower power levels.
• The generation of the replicas is ultra-fast; at the output of the AWG, the only delay produced is due to chirp which is in the order of tens or hundreds of pico-seconds. This delay will be overshadowed by the delay caused by the subsequent MEMS switch.
• In terms of the quality of the signals, the MEMS switches only reduce the power level of the input signals due to the switch’s insertion loss, in addition to the switching delay. The switches have different insertion loss, which could be useful to balance the replica outputs’ powers.
• From Fig. 26, if the number of hops – in a path between Multicast switch and destination without 2R regeneration – increases, the more power will be lost due to insertion loss. This will cause in an increase in the Minimum achieved BER. Therefore, it is better to select the path with a lower number of hops. Otherwise, the best available wavelength should be selected.
5.1.2 Application of MWC-SPM in UHDM Distribution Scenarios
The multiple wavelength conversion and 2R regeneration of the original signal that are achieved simultaneously, in combination with the HNLF’s environmental stability, as well as the simplicity of the technique by eliminating the need for additional CW-laser sources, the use of a short length of fibre, and the weak polarization dependence of the SPM induced broadening, clearly reveal the potential use of the HNLF in WDM multicasting in future transparent optical networks.
For instance, consider a WDM Mesh Network such as NSFNET (Fig. 27). Optical multicasting can be achieved by applying this method for the data plane at each node. When using the control plane to set up multicast paths, the selection of the wavelength of the pre-established path between two nodes will be from the available wavelengths of the replicas generated at the multicast node, and depend on the BER performance. For a simple example, if an SHD Movie (7.6Gbps) is streamed from Los Angeles (through node 3) to nodes 4, 5, and 6, a multicast process will be performed at node 4. Three replicas will be generated, one received at node 4, and the other two will be switched by control plane to nodes 5 and 6.
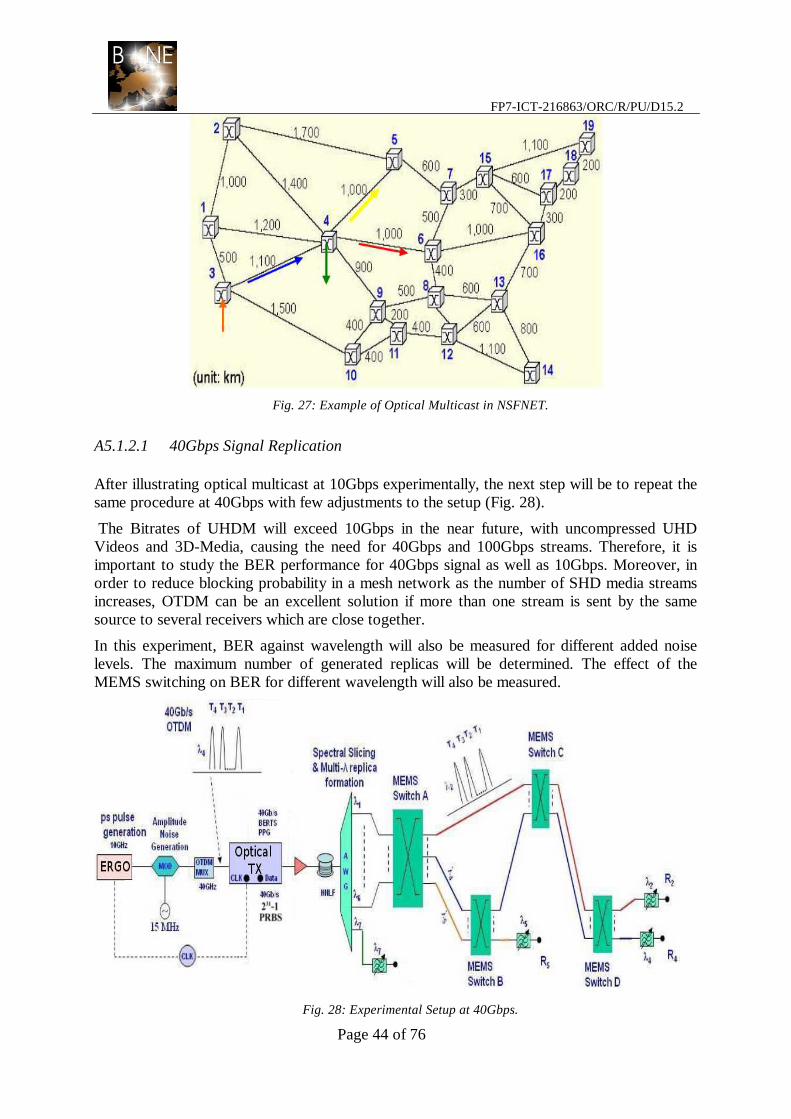
FP7-ICT-216863/ORC/R/PU/D15.2
Page 44 of 76
Fig. 27: Example of Optical Multicast in NSFNET.
A5.1.2.1 40Gbps Signal Replication
After illustrating optical multicast at 10Gbps experimentally, the next step will be to repeat the same procedure at 40Gbps with few adjustments to the setup (Fig. 28).
The Bitrates of UHDM will exceed 10Gbps in the near future, with uncompressed UHD Videos and 3D-Media, causing the need for 40Gbps and 100Gbps streams. Therefore, it is important to study the BER performance for 40Gbps signal as well as 10Gbps. Moreover, in order to reduce blocking probability in a mesh network as the number of SHD media streams increases, OTDM can be an excellent solution if more than one stream is sent by the same source to several receivers which are close together.
In this experiment, BER against wavelength will also be measured for different added noise levels. The maximum number of generated replicas will be determined. The effect of the MEMS switching on BER for different wavelength will also be measured.
Fig. 28: Experimental Setup at 40Gbps.
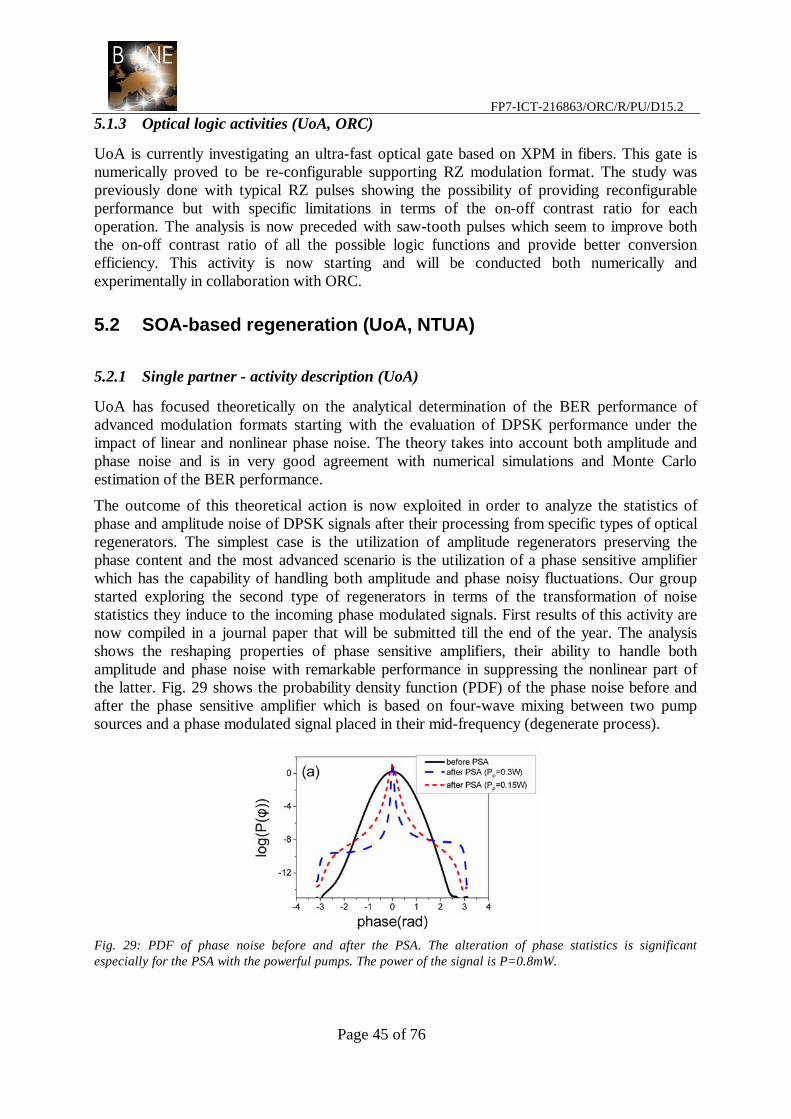
FP7-ICT-216863/ORC/R/PU/D15.2
Page 45 of 76
5.1.3 Optical logic activities (UoA, ORC)
UoA is currently investigating an ultra-fast optical gate based on XPM in fibers. This gate is numerically proved to be re-configurable supporting RZ modulation format. The study was previously done with typical RZ pulses showing the possibility of providing reconfigurable performance but with specific limitations in terms of the on-off contrast ratio for each operation. The analysis is now preceded with saw-tooth pulses which seem to improve both the on-off contrast ratio of all the possible logic functions and provide better conversion efficiency. This activity is now starting and will be conducted both numerically and experimentally in collaboration with ORC.
5.2 SOA-based regeneration (UoA, NTUA)
5.2.1 Single partner - activity description (UoA)
UoA has focused theoretically on the analytical determination of the BER performance of advanced modulation formats starting with the evaluation of DPSK performance under the impact of linear and nonlinear phase noise. The theory takes into account both amplitude and phase noise and is in very good agreement with numerical simulations and Monte Carlo estimation of the BER performance.
The outcome of this theoretical action is now exploited in order to analyze the statistics of phase and amplitude noise of DPSK signals after their processing from specific types of optical regenerators. The simplest case is the utilization of amplitude regenerators preserving the phase content and the most advanced scenario is the utilization of a phase sensitive amplifier which has the capability of handling both amplitude and phase noisy fluctuations. Our group started exploring the second type of regenerators in terms of the transformation of noise statistics they induce to the incoming phase modulated signals. First results of this activity are now compiled in a journal paper that will be submitted till the end of the year. The analysis shows the reshaping properties of phase sensitive amplifiers, their ability to handle both amplitude and phase noise with remarkable performance in suppressing the nonlinear part of the latter. Fig. 29 shows the probability density function (PDF) of the phase noise before and after the phase sensitive amplifier which is based on four-wave mixing between two pump sources and a phase modulated signal placed in their mid-frequency (degenerate process).
Fig. 29: PDF of phase noise before and after the PSA. The alteration of phase statistics is significant especially for the PSA with the powerful pumps. The power of the signal is P=0.8mW.

FP7-ICT-216863/ORC/R/PU/D15.2
Page 46 of 76
The final BER estimation analysis was carried out in a long-haul transmission link and the varying parameters where the power of the propagating phase modulated signal and the position of a single PSA in the link playing the role of a sole regeneration stage along the link. The results are depicted in Fig. 30.
Fig. 30: BER as a function of average transmitted signal power at different positions of the link. The BER enhancement is evident for high power transmitted signals where nonlinear phase noise dominates.
Fig. 30 shows clearly that the PSA has the ability to improve the BER performance at the end of the link, while it is not improving the BER of the incoming signal at its output. This is generally acknowledged as the performance of a typical regenerator which redistributes the noise without improving the BER directly, but contributes to the minimization of the noise build-up in the successive amplifying stages.
5.2.2 Regeneration properties of SOA-MZI devices (NTUA, UoA)
A5.2.2.1 Introduction
Wavelength Conversion (WC) with Return-to-Zero (RZ) data signals using Semiconductor Optical Amplifier-Mach Zehnder Interferometers (SOA-MZI) has been recorded even for data rates that exceed 160 Gb/s [5.12]. Unfortunately, such achievements have not been matched with the NRZ format due to the continuous carrier depletion in the SOAs. At 40 Gb/s two main successful approaches of WC with NRZ signals have been reported. The differential scheme uses a sub-bit period relative time delay between two, identical data control signals [5.13] and the bidirectional scheme uses a counter-propagating arrangement of these identical control signals [5.14]. More recently, we have proposed and demonstrated at 10 Gb/s, a differentially biased SOA-MZI scheme that provides NRZ wavelength conversion with enhanced 2R regenerative characteristics [5.15].
NTUA in collaboration with UoA extended this concept to 40 Gb/s NRZ signal wavelength conversion and show improved 2R regenerative properties. This mobility action is the continuation of a previous one that concerned the performance analysis of all-optical 2R regenerators. In the previous activity the relation between the BER performance and the power transfer characteristics of the 2R regenerator was identified. The study also included comparative analysis between the regenerative properties of one device under different operating conditions and between different types of regenerators including parasitic effects.
In this new mobility action, we extended our previous work, investigating the performance of a newly proposed SOA-MZI based 2R regeneration scheme for 40 Gb/s NRZ data. The scheme is a direct outcome of our previous activity and has already been successfully tested for 10 Gb/s data traffic. Within the frames of this mobility action, an accurate model of a
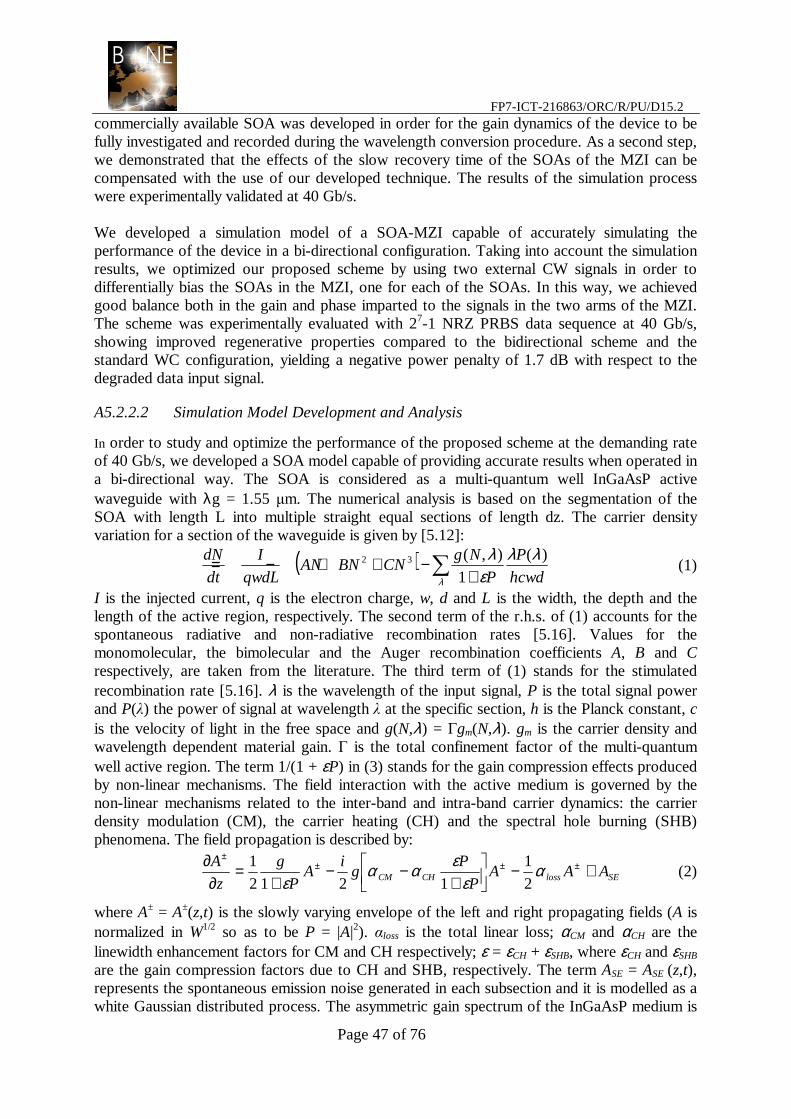
FP7-ICT-216863/ORC/R/PU/D15.2
Page 47 of 76
commercially available SOA was developed in order for the gain dynamics of the device to be fully investigated and recorded during the wavelength conversion procedure. As a second step, we demonstrated that the effects of the slow recovery time of the SOAs of the MZI can be compensated with the use of our developed technique. The results of the simulation process were experimentally validated at 40 Gb/s.
We developed a simulation model of a SOA-MZI capable of accurately simulating the performance of the device in a bi-directional configuration. Taking into account the simulation results, we optimized our proposed scheme by using two external CW signals in order to differentially bias the SOAs in the MZI, one for each of the SOAs. In this way, we achieved good balance both in the gain and phase imparted to the signals in the two arms of the MZI. The scheme was experimentally evaluated with 27-1 NRZ PRBS data sequence at 40 Gb/s, showing improved regenerative properties compared to the bidirectional scheme and the standard WC configuration, yielding a negative power penalty of 1.7 dB with respect to the degraded data input signal.
A5.2.2.2 Simulation Model Development and Analysis
In order to study and optimize the performance of the proposed scheme at the demanding rate of 40 Gb/s, we developed a SOA model capable of providing accurate results when operated in a bi-directional way. The SOA is considered as a multi-quantum well InGaAsP active waveguide with λg = 1.55 µm. The numerical analysis is based on the segmentation of the SOA with length L into multiple straight equal sections of length dz. The carrier density variation for a section of the waveguide is given by [5.12]:
( ) ∑ +−++−=
λ
λλε
λhcwd
P
P
NgCNBNAN
qwdL
I
dt
dN )(1
),(32 (1)
I is the injected current, q is the electron charge, w, d and L is the width, the depth and the length of the active region, respectively. The second term of the r.h.s. of (1) accounts for the spontaneous radiative and non-radiative recombination rates [5.16]. Values for the monomolecular, the bimolecular and the Auger recombination coefficients A, B and C respectively, are taken from the literature. The third term of (1) stands for the stimulated recombination rate [5.16]. λ is the wavelength of the input signal, P is the total signal power and P(λ) the power of signal at wavelength λ at the specific section, h is the Planck constant, c is the velocity of light in the free space and g(N,λ) = Γgm(N,λ). gm is the carrier density and wavelength dependent material gain. Γ is the total confinement factor of the multi-quantum well active region. The term 1/(1 + εP) in (3) stands for the gain compression effects produced by non-linear mechanisms. The field interaction with the active medium is governed by the non-linear mechanisms related to the inter-band and intra-band carrier dynamics: the carrier density modulation (CM), the carrier heating (CH) and the spectral hole burning (SHB) phenomena. The field propagation is described by:
SElossCHCM AAAP
Pg
iA
P
g
z
A +−
+−−
+=
∂∂ ±±±
±
αε
εααε 2
1
1212
1 (2)
where A± = A±(z,t) is the slowly varying envelope of the left and right propagating fields (A is normalized in W1/2 so as to be P = |A|2). αloss is the total linear loss; αCM and αCH are the linewidth enhancement factors for CM and CH respectively; ε = εCH + εSHB, where εCH and εSHB are the gain compression factors due to CH and SHB, respectively. The term ASE = ASE (z,t), represents the spontaneous emission noise generated in each subsection and it is modelled as a white Gaussian distributed process. The asymmetric gain spectrum of the InGaAsP medium is
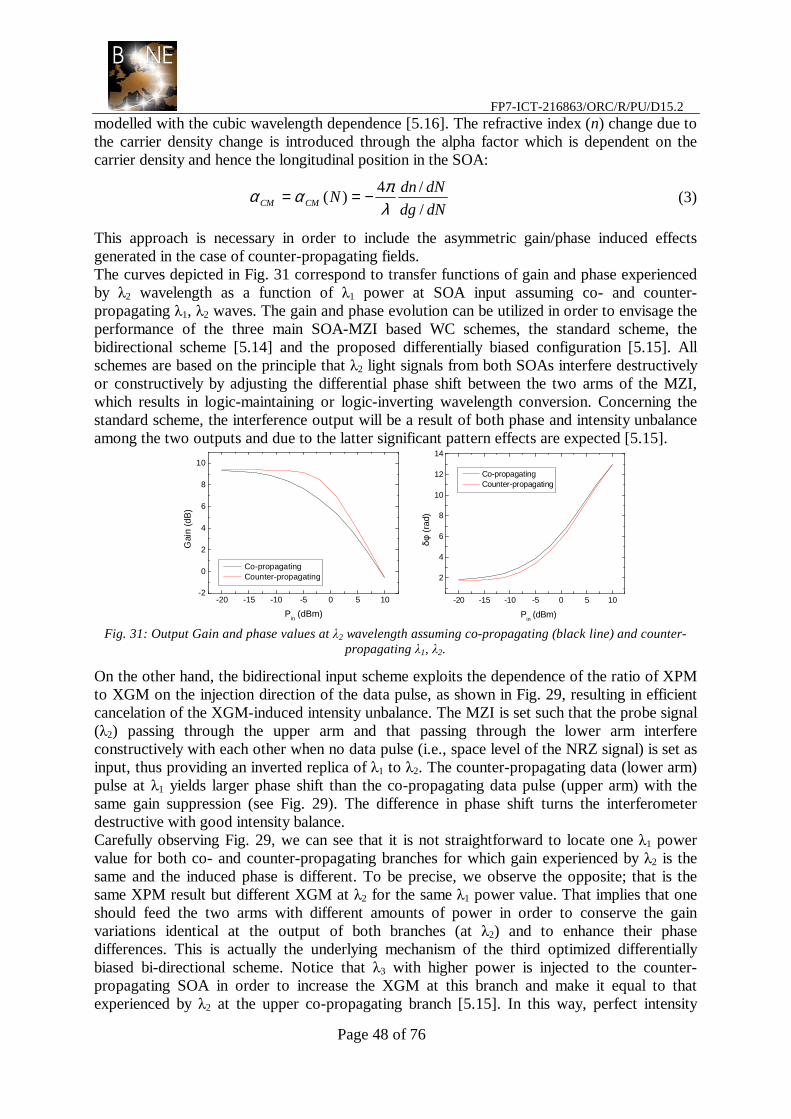
FP7-ICT-216863/ORC/R/PU/D15.2
Page 48 of 76
modelled with the cubic wavelength dependence [5.16]. The refractive index (n) change due to the carrier density change is introduced through the alpha factor which is dependent on the carrier density and hence the longitudinal position in the SOA:
dNdg
dNdnNCMCM /
/4)(
λπαα −== (3)
This approach is necessary in order to include the asymmetric gain/phase induced effects generated in the case of counter-propagating fields. The curves depicted in Fig. 31 correspond to transfer functions of gain and phase experienced by λ2 wavelength as a function of λ1 power at SOA input assuming co- and counter-propagating λ1, λ2 waves. The gain and phase evolution can be utilized in order to envisage the performance of the three main SOA-MZI based WC schemes, the standard scheme, the bidirectional scheme [5.14] and the proposed differentially biased configuration [5.15]. All schemes are based on the principle that λ2 light signals from both SOAs interfere destructively or constructively by adjusting the differential phase shift between the two arms of the MZI, which results in logic-maintaining or logic-inverting wavelength conversion. Concerning the standard scheme, the interference output will be a result of both phase and intensity unbalance among the two outputs and due to the latter significant pattern effects are expected [5.15].
-20 -15 -10 -5 0 5 10-2
0
2
4
6
8
10
Co-propagating Counter-propagating
Gai
n (d
B)
Pin (dBm)
-20 -15 -10 -5 0 5 10
2
4
6
8
10
12
14
Co-propagating Counter-propagating
Pin (dBm)
δφ
(ra
d)
Fig. 31: Output Gain and phase values at λ2 wavelength assuming co-propagating (black line) and counter-
propagating λ1, λ2.
On the other hand, the bidirectional input scheme exploits the dependence of the ratio of XPM to XGM on the injection direction of the data pulse, as shown in Fig. 29, resulting in efficient cancelation of the XGM-induced intensity unbalance. The MZI is set such that the probe signal (λ2) passing through the upper arm and that passing through the lower arm interfere constructively with each other when no data pulse (i.e., space level of the NRZ signal) is set as input, thus providing an inverted replica of λ1 to λ2. The counter-propagating data (lower arm) pulse at λ1 yields larger phase shift than the co-propagating data pulse (upper arm) with the same gain suppression (see Fig. 29). The difference in phase shift turns the interferometer destructive with good intensity balance. Carefully observing Fig. 29, we can see that it is not straightforward to locate one λ1 power value for both co- and counter-propagating branches for which gain experienced by λ2 is the same and the induced phase is different. To be precise, we observe the opposite; that is the same XPM result but different XGM at λ2 for the same λ1 power value. That implies that one should feed the two arms with different amounts of power in order to conserve the gain variations identical at the output of both branches (at λ2) and to enhance their phase differences. This is actually the underlying mechanism of the third optimized differentially biased bi-directional scheme. Notice that λ3 with higher power is injected to the counter-propagating SOA in order to increase the XGM at this branch and make it equal to that experienced by λ2 at the upper co-propagating branch [5.15]. In this way, perfect intensity

FP7-ICT-216863/ORC/R/PU/D15.2
Page 49 of 76
balance can be achieved and the data translation from λ1 to λ2 is largely attributed to phase to amplitude conversions at the output coupler.
A5.2.2.3 Experiment and Results
Fig. 32 illustrates the experimental setup that was used for the performance evaluation of the new wavelength conversion scheme at 40 Gb/s and its comparison with the other NRZ wavelength conversion solutions. The set-up consists of an optical signal generator, a commercially available, hybridly integrated, SOA-MZI regenerator fabricated by CIP Technologies and a 40 Gb/s receiver. The optical signal generator employs a CW signal at 1560 nm (CW1) that was injected into a Ti:LiNbO3 electro-optic modulator (MOD) driven by a 40 Gb/s NRZ pulse pattern generator, producing a 27-1 PRBS data pattern. This pulse train was then inserted into a variable optical attenuator (VOA) and an erbium doped fibre amplifier (EDFA) to degrade its quality in terms of optical signal to noise ratio (OSNR) prior being split into two identical streams that comprise the two MZI control signals, denoted as control 1 (CTR1) and control 2 (CTR2), respectively. The extinction ratio of these signals could also be reduced with the polarization controller prior to the electro-optic modulator. The NRZ data content was wavelength converted to 1553 nm and was finally filtered with a 2 nm bandwidth filter. In the standard WC scheme, only the degraded CTR1 was fed into the MZI as control signal. In the bidirectional scheme, both CTR1 and CTR2 signals were inserted in counter-propagating directions into the upper and lower SOAs, respectively, of the MZI [3]. In the differentially biased bidirectional push-pull scheme, two additional CW signals at 1564 nm (CW3 and CW4) counter-propagate SOA1 and SOA2. They allowed for full and independent adjustment of the gain saturation levels and associated phase shifts induced in the CW2 signal travelling in the two arms of the MZI. Both SOAs were driven at 300 mA. BER measurements were obtained for the wavelength converted signal after electrical de-multiplexing to 10 Gb/s. In the standard scheme, the power of the input CW and of the control signal was 7 dBm. In the bidirectional scheme the respective values were 5.6 dBm for the input CW, 4.7 for CTR1 and 4.3 dBm for CTR2. The injected power of the input CW was 4 dBm in the differentially biased scheme and the control signals power were 6.9 (CTR1) and 4.7 dBm (CTR2). The power of the external CW signals that were used in this scheme were -8.9 (CW3) and 3.2 dBm (CW4).
Fig. 32: Experimental setup for the wavelength conversion.
Fig. 33 and Fig. 34 show the eye diagrams of the degraded input and the wavelength converted signal at the output of each scheme resulting after the numerical and the experimental investigation. An improvement in signal quality is observed for the differentially biased push-pull scheme compared to the standard and bidirectional schemes. The superiority of the differentially biased push-pull scheme is also observed in the Bit Error Rate (BER) measurements of Fig. 35. For an input signal degraded by 2.5 dB with respect to the back-to-back signal, the bidirectional scheme provides 0.4 dB improvement and the differentially biased push-pull scheme provides improvement of 1.7 dB. With respect to the initial back-to-back

FP7-ICT-216863/ORC/R/PU/D15.2
Page 50 of 76
signal, the schemes incur 2.1 and 0.8 dB power penalties and hence the superior performance of the differentially biased push-pull scheme. Finally it should also be noted that for the standard scheme an error floor at 10-3 was obtained even for maximum input power at the receiver.
Fig. 33: Experimental results for all the wavelength conversion schemes. Eye diagram for the: (a) degraded input signal, (b) single control scheme, (c) bidirectional scheme and (d) differentially biased bidirectional scheme.
Fig. 34: Numerical results for all the wavelength conversion schemes. Numerically derived eye diagram of the (a) degraded input and (d) differentially biased bidirectional scheme.
Fig. 35: Bit Error Rate measurements.

FP7-ICT-216863/ORC/R/PU/D15.2
Page 51 of 76
A5.2.2.4 Conclusion
We have presented a new all-optical wavelength conversion scheme for NRZ data signals at 40 Gb/s with improved 2R regeneration capabilities. Our technique utilizes a differentially biased SOA-MZI switch operating in a bidirectional configuration. The experimental results were numerically confirmed. The outcome of this joint activity between NTUA and UoA has been submitted to OFC and a more detailed journal paper is under preparation.
5.2.3 Cascadability study of 2R NRZ SOA-MZI Wavelength Converter (NTUA, UoA)
In this joint activity, ICCS/NTUA and AIT examined the cascade potential of a novel scheme for 2R wavelength conversion with SOA-MZIs. The scheme uses bidirectional data injection and employs an additional external CW signal on one of the SOAs of the MZI to differentially adjust it with respect to the second SOA. In this way, it assists in optimizing and fixing gain and phase conditions in both arms of the interferometer, while further suppressing jitter effects. The performance of the scheme is tested in a fibre loop experiment. It is shown that whilst the standard scheme with a single control for 2R wavelength conversion with SOA-MZI can only support 2 error-free cascades and the push-pull scheme can support 4, the scheme proposed here can extend error-free operation to 8 cascades.
Fig. 36. Eye diagrams at the loop output for (a) standard WC scheme with one control signal, (b) bidirectional push-pull scheme (c) differentially biased bidirectional push-pull scheme. Each loop employs two cascaded wavelength converters in sequence.
Fig. 36 illustrates the change in the eye-diagrams after successive transits of the signal through the loop for the three wavelength conversion schemes, noting that each transit through the loop corresponds to a pair of consecutive wavelength conversions. Fig. 36 (a) depicts the output of the loop for the standard, single control scheme. An almost closed eye is observed after the second transit through the loop, after only 4 wavelength conversions due to the rapid accumulation of amplitude and timing jitter. The performance of the bidirectional push-pull control scheme is shown in Fig. 36 (b) and displays a significant improvement as the counter-propagating control suppresses the accumulation of jitter in amplitude and time. Two transits through the loop are error-free, corresponding to 4 successive wavelength conversions. Finally Fig. 36 (c) shows the performance of the new, differentially biased, bidirectional, push-pull control scheme. It indicates that 4 loop transits are possible corresponding to 8 successive wavelength conversions with error-free signal at the end.

FP7-ICT-216863/ORC/R/PU/D15.2
Page 52 of 76
Fig. 37 (a), (b) and (c) show bit error rate measurements against received power for the single control, the bidirectional push-pull and the differential biased scheme respectively. Error free operation for our scheme is verified even after 8 MZI cascades compared to the 2 and 4 successful cascades for the single and bidirectional schemes.
Fig. 37 (d) shows the degradation in BER for the three schemes against the number of cascades through the wavelength converters. A BER of 10-8 was obtained after 10 cascades using the differential biased bidirectional scheme, while an error floor at 10-4 was measured after 4 and 6 cascades for the standard and the bidirectional operation respectively.
Fig. 37. Bit error rate measurements.
5.3 References
[5.1] IST-LASAGNE Project: http://www.ist-lasagne.org/
[5.2] G. Contestabile et al, “Multiple wavelength conversion for WDM multicasting by FWM in an SOA”, Photonic Tech. Lett. July 2004. Vol. 16, issue no. 7, pp 1775-1777.
[5.3] H.S. Chung et al, “All-optical multi-wavelength conversion of 10 Gbit/s NRZ/RZ signals based on SOA-MZI for WDM multicasting”, Elect. Lett. Mar. 2005 Vol 41, no 7, pp 432-433.
[5.4] G. Contestabile et al, “Double-stage cross-gain modulation in SOAs: an effective technique for WDM multicasting”, Photonic Tech Lett. Jan 2006. Vol 18, issue no. 1, pp 181-183

FP7-ICT-216863/ORC/R/PU/D15.2
Page 53 of 76
[5.5] Xu, L., et al.. “8×40 Gb/s RZ all-optical broadcasting utilizing an electroabsorption modulator”. Proceedings of OFC 2004, MF71
[5.6] Contestabile, G., et al. “Single and multicast wavelength conversion at 40 Gb/s by means of fast nonlinear polarization switching in an SOA”. IEEE Photonic Tech.. Lett. Dec 2005. Vol 17, issue no. 12, pp 2652–2654
[5.7] N. Yan et al.,"All-Optical MultiWavelength Conversion with Negative Power Penalty by a Commercial SOA-MZI for WDM Wavelength Multicast" IEEE OFC/NFOEC. USA 2007
[5.8] H. Sotobayashi and K. Kitayama, “Broadcast-and-select OCDM/WDM network using 10 Gbit/s spectrum-sliced supercontinuum BPSK pulse code sequences,” Electron. Lett., vol. 35, pp. 1966-1967, October 1999.
[5.9] F. Futami and S. Watanabe, “All-optical Wavelength Conversion Using Ultra-Fast Nonlinearities in Optical Fiber,” IEICE Trans. Electron., vol. E85-C, pp. 889-894, 2002.
[5.10] P.V. Mamyshev, “All-optical Data Regeneration based on Self- Phase Modulation Effect,” Eur. Conf. Optical Communications (ECOC’98), pp. 475-476.
[5.11] G. Raybon et al, “40 Gbit/s Pseudo-linear Transmission Over One Million Kilometers,” Optical Fiber Communications (OFC2002), pp. FD10-1 – FD10-3.
[5.1] S. Nakamura et al, “168-Gb/s all-optical wavelength conversion with a symmetric-mach-zehnder-type switch”, IEEE PTL,13, 1091-1093 (2001)
[5.2] S. Nakamura et al., “Bit-rate-transparent non-return-to-zero all-optical wavelength conversion at up to 42 Gb/s by operating Symmetric-Mach-Zehnder switch with new scheme”, presented at OFC 2004, paper FD3
[5.3] M. Hattori, K.Nishimura, R. Inohara, and M. Usami, "Bidirectional Data Injection Operation of Hybrid Integrated SOA–MZI All-Optical Wavelength Converter", IEE/OSA J. Light. Tech., 25, 512-519 (2007)
[5.4] D. Apostolopoulos, K. Vyrsokinos, P. Zakynthinos, N. Pleros, H. Avramopoulos, “An SOA-MZI NRZ Wavelength Conversion Scheme With Enhanced 2R Regeneration Characteristics,” IEEE PTL,21, 1363-1365 (2009)
[5.5] A. E. Willner and W. Shieh, “Optimal spectral and power parameters for all optical wavelength shifting: Single stage, fanout, and cascadability,” J. Lightwave Technol., vol. 13, pp. 771–781, May 1995.

FP7-ICT-216863/ORC/R/PU/D15.2
Page 54 of 76
6. Amplification in Transmission (UPC, FT)
6.1 Gain Transient Mitigation in Remote Erbium Doped Fibre Amplifiers by Burst Packet Carving at the ONU for Extended Power Budget PONs (UPC-FT)
6.1.1 Introduction
Amplification of the burst mode traffic seems to be one of the main challenges for remote amplification using EDFAs, due to the variations in the EDF’s population inversion caused by the burst pattern. These changes in the population inversion can cause gain variations degrading the network performance. Different techniques have been presented to mitigate this undesired effect, such as Automatic Gain Control [6.1] and all-Optical Automatic Gain Control [6.2]. While these techniques are shown to be appropriate for some applications, they present some drawbacks for access networks and PONs, since no active devices can be deployed in the fibre plant and no gain should be wasted amplifying a lasing signal.
We present a novel technique for EDF gain transients’ mitigation, by means of a packet-carving performed at the ONU, in order to pre-compensate the EDF gain overshoot.
6.1.2 Packet-Carving technique
Due to the direct relation between gain of the RSOA and its bias current, the desired pre-distortion of the data packet can be applied by simple electrical filtering of the burst enable signal that is provided to the bias input of the RSOA, Fig. 38:. A first order lowpass was used as the distorting element, whereby a part of the burst signal was left unaffected. The time constant of the lowpass was adjusted according to the given conditions of the desired duty cycle and the expected overshoot of the EDF. The rise time of the packet at its begin was monitored at the output of the RSOA not to loose the first bits due to too strong distortions. A disadvantage of this technique might be that the gain of the RSOA has to be partially reduced to mitigate the later EDF-induced overshoot, increasing the noise figure. Hence, it is necessary to keep track of the OSNR at the OLT receiver. The RSOA used provides a small signal gain of 21.7 dB, an optical 3 dB bandwidth of 54 nm centred at 1550 nm, and has been biased at 70 mA as an average value. The small signal noise figure is 9 dB.
6.1.3 Set-up description
At the OLT transmitter, a Laser Diode (LD1) generates a CW downstream signal at 1551.32 nm with a launched power of 0 dBm. For testing this technique, a PON architecture based in ring+tree Sardana network is used [6.3]. A spool of 50 km of SSMF is used as downstream ring fibre to reach the RN that drops the selected wavelength using thin film add&drops. Remotely pumped amplification in the RN is performed by 15 m of HE980 EDF. The tree section of the PON is composed by 11 km of feeder fibre preceded by a 1/32 splitter. A RSOA acts as the ONU transmitter, generating the burst mode upstream pattern which is then amplified in another 15 m of remotely pumped HE980 EDF in the RN, generating the gain transients under analysis. A second 50 km SSMF spool is used as upstream ring fibre. At the

FP7-ICT-216863/ORC/R/PU/D15.2
Page 55 of 76
OLT receiver, a 50/50 coupler splits the signal to the Optical Spectrum Analyzer and to the Oscilloscope characterizing the OSNR and the gain transients. A PIN diode with a bandwidth of 20 GHz was used in order to avoid the suppression of any fast overshoot. The pump power was 16 dBm at 1480 nm at each EDF. The input power at the RSOA was fixed to -20.4 dBm with an OSNR of 39.3 dB, according to the given power budget.
1/32
RSOA
11km
LD1
50km
50/50 50km
OSA
Osc
OLT Tx
OLT Rx
50/50
50/50
OSA
Osc
ONU
15 m EDF
DS
US
Carved Packet
Original Packet
15 m EDF
RN
a)
+
RSOA
carver
Burst Bias
data
f
b)
Fig. 38: a) Experimental set-up, b) Packet carving circuitry.
6.1.4 Experimental results
To analyze the proposed technique, different packet lengths over a 125 µs frame have characterized. The duty cycles under study were: 3.125%, 6.25%, 12.5%, 30% and 90%, corresponding to relative activity of: 1:32, 1:16, 1:8, 10:32 and 29:32 respectively. For each case, packet characterization with and without packet-carving technique has been carried out, comparing the reduction of the overshoot, defined as: Pout(0)/Pout(∆t), where Pout(0) is the output power at the start of the packet (overshoot) and Pout(∆t) is the output power at the end of the packet. The overshoot reduction can be seen in Fig. 39(a). For the case of the most

FP7-ICT-216863/ORC/R/PU/D15.2
Page 56 of 76
significant overshoots (85% and 50%) corresponding to the smaller packet/duty cycle (1:32 and 1:16), a reduction of 30% of the overshoot can be measured.
0
10
20
30
40
50
60
70
80
90
1:32 1:16 1:8 10:32 29:32
Scenario
ove
rsho
ot %
Overshoot without pulse carving
Overshoot with pulse carving
a)
b)
c)
25
26
27
28
29
30
31
0% 20% 40% 60% 80% 100%
Duty Cycle
OS
NR
[dB
/0.1
nm
]
0
1
2
3
4
5
6
7
8
9
10
Pout
[dB
m]OSNR without pulse carving
OSNR with pulse carving
Pout without pulse carving
Pout with pulse carving
Fig. 39: a) Gain transient overshoot, b) carved packet at ONU output, c) received packet at the OLT
d) OSNR and output power measurements.
As can be seen in Fig. 39(d), the use of the pulse carving technique in the ONU, to mitigate the EDF gain transients, only represents a degradation of less than 0.2 dB in the OSNR when using packet-carving. The input power at the OLT receiver only presents a small decrease of less than 1-1.5 dB when the packet-carving technique is used.
6.2 References
[6.1] H. Nakaji, et al.: Superior high-speed automatic gain controlled erbium-doped fibre amplifiers, Optical fibre technology 9, pp. 25-35, 2003.
[6.2] C.-L. Zhao, et al.:Optical automatic gain control of EDFA using two oscillating lasers in a single feedback loop, Optics communications 225, pp.157-162, 2003.
[6.3] J. A. Lazaro, et al.: Power Budget Improvement for Passive Outside Plant Long Reach High Density Access Network using High Bit Rate RSOA-ONUs, Proc. ECOC 2007, Berlin, Germany, Sept. 2007, paper We.6.4.3

FP7-ICT-216863/ORC/R/PU/D15.2
Page 57 of 76
7. Monitoring (FPMs)
7.1 Phase portrait image processing applied to OPM (FPMs)
The phase portrait [7.1] is now widely known as a useful tool in the frame of optical performance monitoring (OPM) of optical link. Its main advantage compared to classical eye diagram analysis is that clock recovery is not needed as the measurement method is asynchronous.
The basic principle of the phase portrait is to represent in the same graph as a function of time the amplitude of a pair of received signals (referred to as x and y), separated by a certain delay ∆t which can be a (sub)-multiple of the binary period T. As an example, Fig. 40 shows the phase portrait of a simulated transmission (a) without and (b) with chromatic dispersion as well as (c) the evolution of centroïds with distance and (d) the evolution of the area defined by 4 centroïds (fixed distance).
(a) (b)
(c) (d)
Fig. 40: Phase portrait of a simulated transmission without (a) and with (b) chromatic dispersion as well as the evolution of centroïds with distance (c) and the evolution of the area defined by 4 centroïds at fixed
distance (d).
Comparing Fig. 40.(a) and Fig. 40.(b) shows that the curving of the diagonal (∆t = T) as well as the variations around the four corners allow to analyze the effect of chromatic dispersion on

FP7-ICT-216863/ORC/R/PU/D15.2
Page 58 of 76
the optical signal but does not allow to quantify this impairment which is very important in network metrology. Therefore, in the frame of a short term project we tried to apply image processing techniques to quantify the degradation due to the single effect of chromatic dispersion. As data set, several optical links were simulated with only one varying parameter: the link length and therefore, the accumulated chromatic dispersion [ps/nm]. As main result 0, it has been showed that it is possible to apply clustering methods to the phase portrait and to obtain qualified information (i.e. is the dispersion contribution too large or not?) about the impairment. This method (cf. Fig. 40.(c)) consists in defining a certain amount (four, for instance) of starting points (centroïds), in relating each centroïd with the nearest (from an Euclidian distance point of view) data, in defining the new position of each centroïd as the centers of mass of all the related points and in doing these steps as long as these positions significantly change. Then the area of the pattern defined by these centroïds is calculated and displayed as a function of distance (cf. Fig. 40.(d)). It shows that the decrease of the area is more and more pronounced as distance is increasing, which is qualitative information.
7.2 Evolution of an OPM prototype for In-Band OSNR measurements
7.2.1 Introduction
In D15.1 the integration of Polarization-Nulling Method with an OPM prototype for in-band OSNR measurements was described. We present here experimental results achieved in a ROADM-like configuration whereby channels pass through various combinations of filters, amplifiers and fibre sections.
7.2.2 Experimental set up and results
One unfiltered signal at wavelength λ0 is placed in between four signals filtered through a 100 GHz-spacing multiplexer (see Fig. 41). A BroadBand Source (BBS) allows setting reference in-band OSNR values of 20 and 9.5 dB with an Optical Spectrum Analyzer at 0.1 nm resolution for the unfiltered and filtered channels, respectively. Note that our OSA does not perform direct in-band OSNR measurements but the latter are obtained by sequentially switching off the signal and the BBS. The in-band OSNR are finally evaluated individually (only the channel whose OSNR is to be measured is switched on) and collectively (all channels on) with the OPM prototype.
The results are summarized in the following histograms (Fig. 42).
Fig. 41: Experimental set up to measure in-band OSNR in ROADM-like configuration.
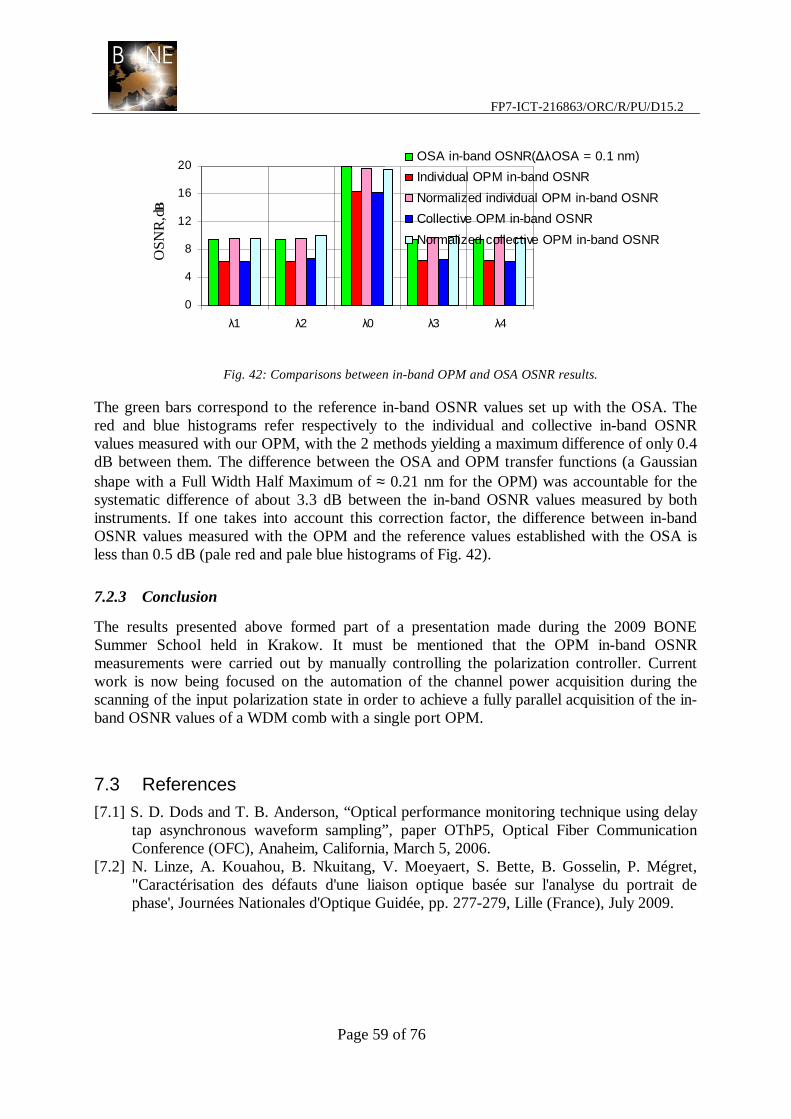
FP7-ICT-216863/ORC/R/PU/D15.2
Page 59 of 76
0
4
8
12
16
20
λ1 λ2 λ0 λ3 λ4
OS
NR
,dBOSA in-band OSNR(∆λOSA = 0.1 nm)
Individual OPM in-band OSNR
Normalized individual OPM in-band OSNR
Collective OPM in-band OSNR
Normalized collective OPM in-band OSNR
Fig. 42: Comparisons between in-band OPM and OSA OSNR results.
The green bars correspond to the reference in-band OSNR values set up with the OSA. The red and blue histograms refer respectively to the individual and collective in-band OSNR values measured with our OPM, with the 2 methods yielding a maximum difference of only 0.4 dB between them. The difference between the OSA and OPM transfer functions (a Gaussian shape with a Full Width Half Maximum of ≈ 0.21 nm for the OPM) was accountable for the systematic difference of about 3.3 dB between the in-band OSNR values measured by both instruments. If one takes into account this correction factor, the difference between in-band OSNR values measured with the OPM and the reference values established with the OSA is less than 0.5 dB (pale red and pale blue histograms of Fig. 42).
7.2.3 Conclusion
The results presented above formed part of a presentation made during the 2009 BONE Summer School held in Krakow. It must be mentioned that the OPM in-band OSNR measurements were carried out by manually controlling the polarization controller. Current work is now being focused on the automation of the channel power acquisition during the scanning of the input polarization state in order to achieve a fully parallel acquisition of the in-band OSNR values of a WDM comb with a single port OPM.
7.3 References [7.1] S. D. Dods and T. B. Anderson, “Optical performance monitoring technique using delay
tap asynchronous waveform sampling”, paper OThP5, Optical Fiber Communication Conference (OFC), Anaheim, California, March 5, 2006.
[7.2] N. Linze, A. Kouahou, B. Nkuitang, V. Moeyaert, S. Bette, B. Gosselin, P. Mégret, "Caractérisation des défauts d'une liaison optique basée sur l'analyse du portrait de phase', Journées Nationales d'Optique Guidée, pp. 277-279, Lille (France), July 2009.

FP7-ICT-216863/ORC/R/PU/D15.2
Page 60 of 76
8. Other transmission-related joint activities within BONE
8.1 Reduction of PDL and DGD in Bragg Gratings (UPVLC, FPMs)
8.1.1 Context of the work
Fibre Bragg gratings (FBGs) have attracted considerable attention in the recent years because of their numerous applications in optical fibre technology [8.1]. Uniform FBGs are characterized by a constant periodic modulation of the core refractive index. In their simplest configuration, FBGs act as band-pass filters centred around the Bragg wavelength. They also allow the achievement of more complex telecommunication components such as channel selection in a multichannel communication system, tuneable optical filtering, gain equalisation filters or dispersion compensators, essential for the implementation of wavelength-division multiplexing (WDM) technology in fibre-optic communication systems.
Nowadays, in the context of high data rate transmissions for which the polarization properties become more and more critical, it is important to obtain components with weak polarization-related properties. In the case of Bragg gratings, theoretical and experimental analyses have been reported, showing that the polarization dependent loss (PDL) and the differential group delay (DGD) of FBGs can reach significant values [8.2-8.4]. Moreover, it has been shown that these PDL and DGD values can induce performance degradations in high bit rate transmission systems [8.5]. It is consequently of high interest to find solutions to reduce PDL and DGD in FBGs.
The PDL and DGD of FBGs come from the presence of birefringence [8.2]. The main source of FBG birefringence is the photo-induced birefringence: it is related to the asymmetry of the manufacturing process, which is mainly due to the single side-written fabrication and the orientation of the polarization state of the UV laser source [8.6]. One way to reduce the gratings PDL and DGD is to minimize the birefringence itself. A reduction of photo-induced birefringence can be obtained by optimizing the polarization of the UV laser and by using a multiple exposure method [8.6, 8.7]. It is also possible to reduce PDL and DGD of optical devices by reducing the effects of the birefringence. This can be obtained by inducing polarization mode coupling (PMC) as it is done for spun fibers [8.8].
In this work, we have investigated the possibility to exploit the PMC to decrease the gratings PDL and DGD. To induce PMC, we have considered an original manufacturing process for which the gratings are written in mechanically twisted fibres; the fibre is then relaxed after the inscription.
8.1.2 Principle of the technique and results
Practically, we use a manufacturing set-up in which the grating is written in a fibre twisted along its axis, see Fig. 43. The orientation of the polarization axes (also called the x and y modes or the grating eigenmodes [8.2]) related to the photo-induced birefringence is constant along the grating. By relaxing the fibre, this orientation will change over the grating length. Compared to the classical technique using untwisted fibre, we obtain an FBG exhibiting an identical local photo-induced birefringence but characterized by a non-negligible PMC, the

FP7-ICT-216863/ORC/R/PU/D15.2
Page 61 of 76
degree of PMC being related to the fibre twist.
PrimeroPrimero: : torsitorsióónn
Segundo: Segundo: iluminaciiluminacióónn
TerceroTercero: : relajacirelajacióónn
(a)
(b)
(c)
PrimeroPrimero: : torsitorsióónn
Segundo: Segundo: iluminaciiluminacióónn
TerceroTercero: : relajacirelajacióónn
(a)
(b)
(c)
First: torsion
Second: illumination
Third: relaxation
PrimeroPrimero: : torsitorsióónn
Segundo: Segundo: iluminaciiluminacióónn
TerceroTercero: : relajacirelajacióónn
(a)
(b)
(c)
PrimeroPrimero: : torsitorsióónn
Segundo: Segundo: iluminaciiluminacióónn
TerceroTercero: : relajacirelajacióónn
(a)
(b)
(c)
PrimeroPrimero: : torsitorsióónn
Segundo: Segundo: iluminaciiluminacióónn
TerceroTercero: : relajacirelajacióónn
(a)
(b)
(c)
PrimeroPrimero: : torsitorsióónn
Segundo: Segundo: iluminaciiluminacióónn
TerceroTercero: : relajacirelajacióónn
(a)
(b)
(c)
First: torsion
Second: illumination
Third: relaxation
Fig. 43: Schematic of the torsion fabrication set up. (a) the fiber suffers a mechanical torsion. (b) the
fiber is illuminated with UV radiation so as to generate the FBG. (c) the fiber is relaxed.
Simulations have been performed to evaluate the performances of our process. For that purpose, we have used the Transfer Matrix Method, the classical method for the simulation of non uniform Bragg gratings. In this case, a 2x2 matrix relates the forward and the backward electrical field at the input and the output of the device. However, it does not take into account the polarization of the electrical field. In order to take into account this feature as well as the polarization mode coupling along the grating, we have adapted this classical matrix method. In our simulation tool, we use a 4x4 matrix representation [8.9]: the matrix then relates the polarization components of both the forward and backward electrical field at the input and the output of the device. The detail of our simulation technique is briefly described in [8.10]. From this analysis, it is confirmed that the FBGs polarization properties present deterministic evolutions directly related to the grating parameters. In Fig.44 it is shown the theoretical evolutions of the transmission, PDL and DGD as a function of the grating length.

FP7-ICT-216863/ORC/R/PU/D15.2
Page 62 of 76
Fig. 44: Evolution of the transmission, PDL and DGD as a function of the grating length.
Furthermore, experimental results are reported in Fig. 45 for a π-shifted FBG and they show a good agreement with the simulated evolutions. Additionally, the comparison between experimental and simulated evolutions allows the estimation of the birefringence value and to obtain its evolution with respect to the grating length and the refractive index modulation. The comparison between experimental and simulated evolutions has allowed confirming that the birefringence value obtained after the writing process is strongly influenced by the fluency used for the grating inscription.
Fig. 45: Comparison between experimental and simulated evolutions for a π-shifted FBG.
In Fig. 46, we present the amplitude, the PDL and the DGD responses of a grating exhibiting different levels of twist (the twist is characterized through the θ parameter, representing the total rotation angle of the polarization axes over the whole grating length L). The grating parameters are: refractive index modulation = 2.10-4; L = 1 cm; birefringence = 4.10-6. As expected, these results globally confirm the decrease of the grating PDL and DGD values when the twist rate increases. Moreover, it must be pointed out that the reduction of the PDL and DGD values is rapid: a 60% reduction of the maximum PDL and DGD values is obtained after a rotation of 180°. In addition, we can observe than the amplitude response is not affected, the grating response remains thus unchanged despite the PDL and the DGD reduction induced by the PMC. All these results consequently demonstrate the potential of this technique.
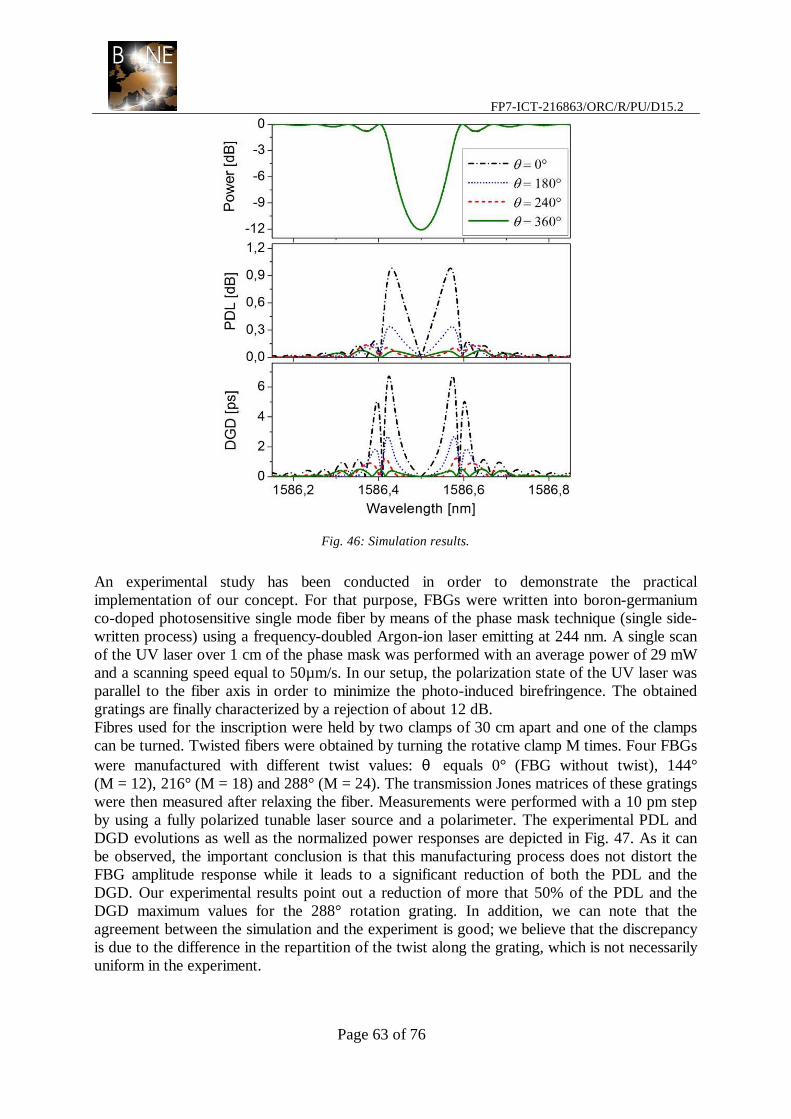
FP7-ICT-216863/ORC/R/PU/D15.2
Page 63 of 76
Fig. 46: Simulation results.
An experimental study has been conducted in order to demonstrate the practical implementation of our concept. For that purpose, FBGs were written into boron-germanium co-doped photosensitive single mode fiber by means of the phase mask technique (single side-written process) using a frequency-doubled Argon-ion laser emitting at 244 nm. A single scan of the UV laser over 1 cm of the phase mask was performed with an average power of 29 mW and a scanning speed equal to 50µm/s. In our setup, the polarization state of the UV laser was parallel to the fiber axis in order to minimize the photo-induced birefringence. The obtained gratings are finally characterized by a rejection of about 12 dB. Fibres used for the inscription were held by two clamps of 30 cm apart and one of the clamps can be turned. Twisted fibers were obtained by turning the rotative clamp M times. Four FBGs were manufactured with different twist values: θ equals 0° (FBG without twist), 144° (M = 12), 216° (M = 18) and 288° (M = 24). The transmission Jones matrices of these gratings were then measured after relaxing the fiber. Measurements were performed with a 10 pm step by using a fully polarized tunable laser source and a polarimeter. The experimental PDL and DGD evolutions as well as the normalized power responses are depicted in Fig. 47. As it can be observed, the important conclusion is that this manufacturing process does not distort the FBG amplitude response while it leads to a significant reduction of both the PDL and the DGD. Our experimental results point out a reduction of more that 50% of the PDL and the DGD maximum values for the 288° rotation grating. In addition, we can note that the agreement between the simulation and the experiment is good; we believe that the discrepancy is due to the difference in the repartition of the twist along the grating, which is not necessarily uniform in the experiment.

FP7-ICT-216863/ORC/R/PU/D15.2
Page 64 of 76
In conclusion, this study point out that our original manufacturing process able to induce PMC leads to a significant decrease of the gratings’ PDL and DGD values which is highly recommended in the context of high bit rate transmission systems.
Fig. 47: Experimental results.
8.2 Joint Project for establishing the reliability of Fibre Bragg Gratings and comparing it against new quasi periodic structures (Ericsson, FPMs)
8.2.1 Introduction
The reliability of the entire communications network and services is dependent on the reliability of each device used in that network. Even though redundant transmission systems allow higher reliability, the maintenance costs can be minimized if reliable components are used. Investigations carried out on optical devices and modules indicate that they have failure mechanisms that are accelerated by both temperature and moisture. In many of the proposed applications, the devices will be located in environments that are subject to both high temperature and potentially high humidities. Information about the accelerating effect of both temperature and humidity is therefore essential to ensure that the devices are fit-for-purpose and for characterizing the service access problem at the network side.
Reliability in Design and new technologies in optical communications is essential as businesses and consumers expect uninterrupted service and fault free operation. This will enable the network services to fulfil the level of connectivity needed by applications. Costs associated with the failure of optical components can be significant. The relative costs of correcting field failures and redesigning are significantly higher than the initial cost of design of the optical component. There is also an additional need to integrate full electronic controls into the earlier

FP7-ICT-216863/ORC/R/PU/D15.2
Page 65 of 76
designs of simple optical components. Increased complexity and capability, leads to increased failure modes. This report reviews the reliability testing that was undertaken on Fiber Bragg Gratings (FBG) Filter for Dense Wavelength Division Multiplexer (DWDM), channel spacing at 50GHz and 100GHz.
8.2.2 Reliability testing on current Fibre Bragg Gratings
The FBGs available were tested for qualification and reliability required by Telcordia GR-1209 CORE demonstrating the performance, reliability and integrity of the device. The tests that have been completed so far are:
Temperature Humidity cycling, high temperature storage testing, Thermal Shock test, low temperature storage. Further tests are yet to be done and these include Temperature cycling, water immersion test, Vibration, Side Pull, Cable Retention and Impact test. Electrical and optical performance tests were conducted prior to and after each reliability test. The change in product performance resulting from the environmental exposure was measured and compared with the established acceptance criteria.
8.2.3 Optical Measurement Set up and Test Results
The optical performance measurement during the tests are measured by Agilent DWDM system with 81640A tunable laser module, 81634B power sensor module, return loss module and polarization controller. A comprehensive summary of the results is shown in the following tables.

FP7-ICT-216863/ORC/R/PU/D15.2
Page 66 of 76
A8.2.3.1 High Temperature Storage Test (Damp Heat)
Temperature 85 deg C
Humidity 85 %
1. Testing criteria
Duration 1000 Hours
2.Measurement Measure center wavelength position after 168, 500, 1000 hours
3. Acceptance level Center wavelength drift < 0.05nm
4. Result:
Damp Heat
-0.07
-0.05
-0.03
-0.01
0.01
0.03
0.05
1 2 3 4 5 6 7 8 9 10 11
Sample
∆C
.W.
(nm
)
168 hrs
500 hrs
1000 hrs
Fig. 48: Result of Damp Heat test
5. Conclusion PASS

FP7-ICT-216863/ORC/R/PU/D15.2
Page 67 of 76
A8.2.3.2 Temperature-Humidity Cycling
Fig. 49: Temperature Humidity cycling profile
Tem
pera
ture
(o C)
-40
21
0
One cycle
75
1 2 3 4 5 6 7 8
Hours

FP7-ICT-216863/ORC/R/PU/D15.2
Page 68 of 76
1. Testing criteria As shown in Figure 49
2.Measurement Measure centre wavelength position once per day during test
3. Acceptance level Centre wavelength drift < 0.05nm
4. Result:
Temperature - Humidity Cycling
-0.050
-0.040
-0.030
-0.020
-0.010
0.000
0.010
0.020
0.030
0.040
0.050
24 Hrs 48 Hrs 72 Hrs 144 Hrs 168 Hrs 192 Hrs 216 Hrs 240 Hrs 264 Hrs 336 HrsTime
Wav
elen
gth
shift
(nm
)
Fig. 50: Results of Temperature Humidity Cycling
5. Conclusion PASS

FP7-ICT-216863/ORC/R/PU/D15.2
Page 69 of 76
A8.2.3.3 Thermal Shock
Temperature Range 0 to 100 deg C
Dwell time 5 min
Transfer Time 10 sec
1. Testing criteria
Number of Cycles 15
2.Measurement Measure centre wavelength position before and after the test
3. Acceptance level Centre wavelength drift < 0.05nm
4. Result:
Thermal Shock
-0.06-0.04-0.02
00.020.040.06
1 2 3 4 5 6 7 8 9 10 11
Sample
ΔC.W
. (nm
)
Fig. 51: Results of Thermal Shock test
5. Conclusion PASS

FP7-ICT-216863/ORC/R/PU/D15.2
Page 70 of 76
A8.2.3.4 Low Temperature Storage Test
Temperature -35 to -45 deg C 1. Testing criteria
Duration 2000 Hours
2.Measurement Measure centre wavelength position after 168, 500, 1000, 2000 hours
3. Acceptance level Centre wavelength drift < 0.05nm
4. Result:
Low Temp. Storage Test
-0.06-0.04-0.02
00.020.040.06
1 2 3 4 5 6 7 8 9 10 11
Sample
ΔC.W
. (nm
)
168 hrs500 hrs1000 hrs2000 hrs
Fig. 52: Results of Low Temperature Storage test
5. Conclusion PASS

FP7-ICT-216863/ORC/R/PU/D15.2
Page 71 of 76
8.2.4 Further work during this joint activity
The following tests are planned to be done as part of this activity:
Temperature -40 to 85 deg C
Dwell time 15 min
Temperature Cycling Test
Number of Cycles 500
Temperature 45 deg C
PH value 5 to 6
Water Immersion
Duration 168 Hours
Per cycle
(10Hz~55Hz~10Hz)
4 min
Max. amplitude 1.52 mm
Vibration
3 Axes 2 hrs
Direction 90 °
Distance 22 ~ 28 cm
Side Pull
Min. tension 230 g
Direction 180 °
Distance 8 ~ 12 cm
Cable Retention
Min. tension 450 g
Height 1.8 m Impact Test
3 Axes 8 Times / Axis
In addition, new quasi periodic structures would be designed and fabricated. After this, reliability tests would be performed on these structures and compared against current FBGs to ensure network reliability when using these quasi periodic structures.
8.3 References [8.1] A. Othonos, K. Kalli, Fiber Bragg gratings: fundamentals and applications in
telecommunications and sensing (Artech House, Norwood, MA, 1999). [8.2] S. Bette, C. Caucheteur, M. Wuilpart, P. Mégret, R. Garcia-Olcina, S. Sales, J.
Capmany, “Spectral characterization of differential group delay in uniform fiber Bragg gratings,” Opt. Exp., vol. 13, 9954-9960, 2005.
[8.3] C. Caucheteur, P. Mégret, T. Ernst, D. Nikogosyan, “Polarization properties of fibre Bragg gratings inscribed by high-intensity femtosecond 264 nm pulses,” Opt. Com., vol. 271, 303-308, 2007.

FP7-ICT-216863/ORC/R/PU/D15.2
Page 72 of 76
[8.4] P. Lu, D. Grobnic, S. Mihailov, "Characterization of the Birefringence in Fiber Bragg Gratings Fabricated With an Ultrafast-Infrared Laser," J. Lightwave Technol., vol. 25, 779-786, 2007.
[5] P. Lu, S. Mihailov, “System impairment of birefringence in fiber Bragg gratings in optical networks,” J. Opt. Netw., vol. 7, n° 4, 277-287, 2008.
[8.6] A. Vengsarkar, Q. Zhong, D. Inniss, W. Reed, P. Lemaire, S. Kosinski, “Birefringence reduction in side-written photoinduced fiber devices by a dual-exposure method,” Opt. Lett., vol. 19, pp. 1260-1262, 1994.
[8.7] V. Garcia-Muñoz, C. Caucheteur, S. Bette, M. Wuilpart, M. Muriel, P. Mégret, “Reduction of polarization related effects in superimposed fiber Bragg gratings,” App. Opt., vol. 48, n° 9, pp. 1635-1641, 2009.
[8.8] D. Nolan, X. Chen, M.-J. Li, “Fibers With Low Polarization-Mode Dispersion,” J. Lightwave Technol., vol. 22, pp. 1066-1077, 2004.
[8.9] P. Yeh, Optical Waves in Layered Media. New York, Wiley, 1988. [8.10]S. Bette, C. Caucheteur, V. Garcia-Munoz, R. Garcia-Olcina, M. Wuilpart, S. Sales, J.
Capmany, P. Mégret, “PDL and DGD Reduction in Bragg Gratings Using Twisted Fibers for the Inscription”, IEEE Photonics Technology Letters, vol. 21, pp. 1689- 1691, 2009.

FP7-ICT-216863/ORC/R/PU/D15.2
Page 73 of 76
9. Conclusions This document has reported the progress that has been achieved during the second year of VCE-T. Central in the integration strategy which was developed during the first year, has been the formation of Focus Groups which investigate separately research topics which are shared among several VCE-T partners. The four active Focus Groups relate to (a) key issues on 100 Gb/s transmission, (b) optical signal regeneration, (c) signal amplification, and (d) monitoring. Besides the activities of these Groups though, there have also been other joint activities within Y2 of the project, mainly related to the reduction of PDL and DGD in fibre Bragg Gratings.
As it was anticipated in Y1, a larger number of joint activities has been initiated and carried out within the second year of the project. Several mobility actions have been carried out during Y2, especially on the topics of signal regeneration and unrepeated signal transmission using maximum likelihood sequence estimation algorithms.
It is planned that there will be a further two WP-wide meetings in Year 3. The first of these will take place in summer 2009 and is planned to be collocated with an event that will be attended by several partners (details are to be confirmed), whereas the second meeting will be collocated with the BONE Annual meeting, which again will ensure a large number of attendees. In the meantime, the VCE-T Advisory Board will be monitoring the progress achieved towards integration throughout the year, and will take corrective actions if required. To this end, the Advisory Board will be reviewing the mobility reports submitted by the various partners, and will discuss any issues either on telephone conferences or via email.

FP7-ICT-216863/ORC/R/PU/D15.2
Page 74 of 76
Table of Figures
Fig. 1: Full ‘Stokes’ polarization diversity receiver - type A and B.......................................11
Fig. 2: Simplified ‘Stokes’ polarization diversity receiver - type A and B.............................12
Fig. 3: OSNR (over 0.1 nm, dB) needed to achieve BER=10-3, vs. DGD normalized to the bit-time for PSBT. The seven curves are shown in two separate figures to increase the readability............................................................................................................................16
Fig. 4: OSNR (over 0.1 nm, dB) needed to achieve BER=10-3, vs. DGD normalized to the bit-time for IMDD. The seven curves are shown in two separate figures to increase the readability............................................................................................................................16
Fig. 5: Experimental set-up for 10.7Gb/s narrow-filtered duobinary transmission over installed and uncompensated SSMF fiber.............................................................................18
Fig. 6: OSNR (0.1 nm) for BER=10-3, vs. length of SSMF fiber. Left: conventional MLSE. Right: Correlation-sensitive MLSE. Dashed curves use 64 MLSE states, solid curves use 2048 MLSE states. Lines with markers are experimental results....................................................19
Fig. 7: Experimental setup for 100 Gb/s transmission obtained by polarization multiplexing two 50 Gbit/s NRZ-QPSK signals.........................................................................................21
Fig. 8. Receiver sensitivity for BER=10-3 vs. transmission distance (inset are the constellation diagrams for the X & Y polarizations recovered at different transmission distances with -3dBm launch power). ......................................................................................................................22
Fig. 9: Schematic of the simulation set-up............................................................................24
Fig. 10: OSNR needed to get a BER of 10-3 using different values of α: (a) normal RX, (b) MLSE-RX.............................................................................................................................25
Fig. 11: Schematic of the experimental set-up......................................................................26
Fig. 12: ONSR vs. Fiber length for target BER = 10-3 with ER = 4.7 dB.............................26
Fig. 13: Optical DHT-based OFDM. .....................................................................................28
Fig. 14: (a) Block diagram of the recursive procedure to implement the optical N-order FHT; ĥe(k) and ĥo(k) indicate the even and odd components in bit reverse order of the transform of the sequence x(n). (b) Optical circuit scheme of 8-order FHT..............................................30
Fig. 15: (a) Block diagram of the recursive procedure to optically implement the N-order DCT; (b) 8-order optical DCT. .............................................................................................30
Fig. 16: Transmitter setup....................................................................................................32
Fig. 17: Back to back performance of the studied phase-shift-keyed modulation formats (a), constellation diagrams of NRZ-D16PSK in the back to back case (b) and after transmission over 800 km (c) at 28.7dB OSNR..........................................................................................33
Fig. 18: Nonlinear threshold a) without propagating ASE-noise and b) with the influence of nonlinear phase noise...........................................................................................................34
Fig. 19: Concept of MWC using SPM...................................................................................38
Fig. 20: Experimental Setup at 10Gbps. ................................................................................39

FP7-ICT-216863/ORC/R/PU/D15.2
Page 75 of 76
Fig. 21: Diagrams of the input of the HPFA a) without added noise, b) with added noise.....39
Fig. 22: output spectrum after the HNLF. a) 50nm span. b) 16nm span................................40
Fig. 23: Eye Diagrams at 1546nm with Vp-p=57mV (a), 1542.8nm with Vp-p=55mV (b) and 1540.4nm with Vp-p=61mV (c).Vertical Scale 15mV/div.Horizontal scale 20ps/div.......40
Fig. 24: BER curves with 24% Amplitude Noise...................................................................41
Fig. 25: BER against Wavelength at a constant Received Power of -20.11dBm...................42
Fig. 26: Minimum BER against number of Hops, for different wavelengths..........................42
Fig. 27: Example of Optical Multicast in NSFNET...............................................................44
Fig. 28: Experimental Setup at 40Gbps................................................................................44
Fig. 29: PDF of phase noise before and after the PSA. The alteration of phase statistics is significant especially for the PSA with the powerful pumps. The power of the signal is P=0.8mW.............................................................................................................................45
Fig. 30: BER as a function of average transmitted signal power at different positions of the link. The BER enhancement is evident for high power transmitted signals where nonlinear phase noise dominates..........................................................................................................46
Fig. 31: Output Gain and phase values at λ2 wavelength assuming co-propagating (black line) and counter-propagating λ1, λ2. ....................................................................................48
Fig. 32: Experimental setup for the wavelength conversion..................................................49
Fig. 33: Experimental results for all the wavelength conversion schemes. Eye diagram for the: (a) degraded input signal, (b) single control scheme, (c) bidirectional scheme and (d) differentially biased bidirectional scheme.............................................................................50
Fig. 34: Numerical results for all the wavelength conversion schemes. Numerically derived eye diagram of the (a) degraded input and (d) differentially biased bidirectional scheme.....50
Fig. 35: Bit Error Rate measurements..................................................................................50
Fig. 36. Eye diagrams at the loop output for (a) standard WC scheme with one control signal, (b) bidirectional push-pull scheme (c) differentially biased bidirectional push-pull scheme. Each loop employs two cascaded wavelength converters in sequence....................................51
Fig. 37. Bit error rate measurements....................................................................................52
Fig. 38: a) Experimental set-up, b) Packet carving circuitry.................................................55
Fig. 39: a) Gain transient overshoot, b) carved packet at ONU output, c) received packet at the OLT d) OSNR and output power measurements..............................................................56
Fig. 40: Phase portrait of a simulated transmission without (a) and with (b) chromatic dispersion as well as the evolution of centroïds with distance (c) and the evolution of the area defined by 4 centroïds at fixed distance (d)............................................................................57
Fig. 41: Experimental set up to measure in-band OSNR in ROADM-like configuration........58
Fig. 42: Comparisons between in-band OPM and OSA OSNR results...................................59
Fig. 43: Schematic of the torsion fabrication set up. (a) the fiber suffers a mechanical torsion. (b) the fiber is illuminated with UV radiation so as to generate the FBG. (c) the fiber is relaxed.................................................................................................................................61

FP7-ICT-216863/ORC/R/PU/D15.2
Page 76 of 76
Fig. 44: Evolution of the transmission, PDL and DGD as a function of the grating length...62
Fig. 45: Comparison between experimental and simulated evolutions for a π-shifted FBG...62
Fig. 46: Simulation results....................................................................................................63
Fig. 47: Experimental results................................................................................................64
Fig. 48: Result of Damp Heat test.........................................................................................66
Fig. 49: Temperature Humidity cycling profile.....................................................................67
Fig. 50: Results of Temperature Humidity Cycling ...............................................................68
Fig. 51: Results of Thermal Shock test..................................................................................69
Fig. 52: Results of Low Temperature Storage test.................................................................70