report preview and sample geoscience workforce …...v acknowledgements the agi geoscience workforce...
TRANSCRIPT

Leila GonzalesChristopher Keane
2011Status of the Geoscience Workforce
ATHE AMERICAN GEOLOGICAL INSTITUTE
GISERVING THE GEOSCIENCES WORLDWIDE
Report Preview and Sample

Status of the Geoscience Workforce 2011Leila Gonzales
Christopher Keane
Published byAmerican Geological InstituteCopyright © 2011. American Geological Institute, all rights reserved
ISBN 978-0-922152-86-5
American Geological InstituteWorkforce Program4220 King StreetAlexandria, VA [email protected]://www.agiweb.org/workforce
THE AMERICAN GEOLOGICAL INSTITUTE
SERVING THE GEOSCIENCES WORLDWIDE
Report Preview and Sample

iv
The “Status of the Geoscience Workforce” ReportThe “Status of the Geoscience Workforce” report provides a comprehensive benchmark of the geoscience profession. The report is based on original data collected by the American Geological Institute as well as from existing data from federal data sources, professional membership organizations, and industry data sources. The report synthesizes all avail-able data for the geosciences, from the supply and training of new students, to workforce demographics and employment projections, to trends in geoscience research funding and economic indicators. The report is available as a complete document, as well as on a per chapter basis. It will be available for download from AGI’s website: http://www.agiweb.org/.
Chapter 1: Trends in K-12 Geoscience EducationThis chapter examines the student participation in geoscience education at the K-12 level and includes data on state requirements for earth science education in middle and high school, and data pertaining to the number of earth science high school teachers. The chap-ter also examines trends in college bound students including SAT scores, aspirations for higher education, and choice of college major.
Chapter 2: Trends in Community College ProgramsThis chapter examines the availability of geoscience education at community colleges and examines the trends in Associate degrees conferred from geoscience programs at these institutions.
Chapter 3: Trends in Geoscience Education at Four-Year InstitutionsThis chapter summarizes all available data pertaining to geoscience enrollments, degrees conferred, field camp attendance, and funding of geoscience undergraduate and graduate students. The chapter also explores trends in department size, faculty numbers and re-search specialties, and funding of geoscience research at the university level.
Chapter 4: Geoscience Employment SectorsThis chapter explores the transition of geoscience graduates into the workforce, age de-mographics of the industries where geoscientists work, and projected workforce demand. Data pertaining to the current number of jobs and projected number of jobs in 2018 is also provided, as is current salary information for each profession.
Chapter 5: Economic Metrics and Drivers of the Geoscience PipelineThis chapter provides data on productive activity (number of oil rigs, mines, etc.), commod-ity pricing and output, gross domestic product, and market capitalization of the industries where geoscientists work.
Appendix A: Defining the GeosciencesThis appendix outlines how geoscience occupations and industries are defined in federal data sources. Additionally, this appendix details the definition proposed by AGI for track-ing the geoscience occupation.
Appendix B: ReferencesA list of the cited references in the report.
Report Preview and Sample

v
AcknowledgementsThe AGI Geoscience Workforce program would like to thank the AGI Foundation for fund-ing of the program and this report. The AGI Geoscience Workforce Program would also like to thank the following people, organizations, companies, and industries that provided data for this report, including:
Dr. Penny Morton, University of Minnesota-Duluth, who provided all field camp atten-dance data; Barry Jay Katz, ChevronTexaco for the “2003 Report on the Status of Aca-demic Geoscience Departments”; American Association of Petroleum Geologists (AAPG); American Geophysical Union; Baker Hughes; College Board; Council of Chief State School Officers (CCSSO); Econostats.com; Energy Information Administration; Google Finance; Indexmundi.com; InflationData.com; Industry and corporate data collaborators; Integrat-ed Postsecondary Education Data System (IPEDS); Kitco.com; National Center for Edu-cation Statistics (NCES); National Ground Water Association (NGWA); National Mining Association; National Science Foundation Division of Science Resources Statistics; Nation-al Science Foundation Award Database; OANDA.com; Office of Personnel Management; Society of Economic Geologists (SEG); Society of Exploration Geophysicists (SEG); U.S. Bureau of Economic Analysis; U.S. Bureau of Labor Statistics; U.S. Department of Educa-tion; U.S. Geological Survey; ACT; U.S. Census Bureau; American Meteorological Society.
Cover Photo Credit: © Marli Miller. Photos pages 1, 27, 43, 131: © iStockPhoto. Photo Page 95: © Marli Miller.
If you have questions concerning this report, please contact:
Leila M. Gonzales
Geoscience Workforce Analyst
The American Geological Institute
4220 King Street
Alexandria, VA 22302 USA
E-Mail: [email protected]
Phone: +1 703 379 2480 x 632
Fax: +1 703 379 7563
Report Preview and Sample

vi
ContentsChapter 1: Trends in K-12 Geoscience Education – Preparing Students for
College Geoscience Programs and Society ............................................................... 1
Overview ................................................................................................................................. 1
Grades K-8 .............................................................................................................................. 2
K-8 Teacher Trends ............................................................................................................... 5
Grades 9-12 ............................................................................................................................ 6
High School Teacher Trends ............................................................................................... 13
College Preparedness ........................................................................................................... 14
SAT Test Taking and Score Trends .................................................................................... 18
ACT Trends .......................................................................................................................... 24
Chapter 2: Trends in Community College Geoscience Programs ......................... 27
Overview ............................................................................................................................... 27
National Benchmarks .......................................................................................................... 28
Geoscience Departments and Faculty ................................................................................ 33
Geoscience Students ............................................................................................................ 36
Geoscience Associate’s Degree Trends ................................................................................ 39
Chapter 3: Trends in Geoscience Education at Four-Year Institutions .............. 43
Overview ............................................................................................................................... 43
Faculty Demographics ......................................................................................................... 45
Research Funding ................................................................................................................ 46
Student Support ................................................................................................................... 46
Geoscience Departments ..................................................................................................... 47
Trends in the Status of Geoscience Departments ............................................................. 47
Geoscience Field Camp Experience ................................................................................... 51
Geoscience Faculty ............................................................................................................... 53
Geoscience Faculty Demographics ...................................................................................... 53
Geoscience Faculty Publication Trends and Research Specialties ................................... 56
Geoscience University Students .......................................................................................... 64
Enrollments and Degrees .................................................................................................... 64
Diversity in Geoscience Enrollments and Degrees ........................................................... 65
Report Preview and Sample
vii
Geoscience Degree Completion Rates ................................................................................. 69
Academic Pathways in Geoscience Education .................................................................... 70
Research Topics of Geoscience Graduates .......................................................................... 71
Funding of the Geosciences at the University Level .......................................................... 73
American Recovery & Reinvestment Act and Geoscience Funding from NSF ................. 87
Funding of Geoscience Students ......................................................................................... 90
Chapter 4: Geoscience Employment Sectors: Trends in Student Transitions and Workforce Dynamics .................................................................................................... 95
The Transition from Student to Professional ..................................................................... 97
Faculty and Student Attitudes about Career Pathways ................................................... 97
Recent Geoscience Graduates – Career Trends ............................................................... 101
Starting Salaries of Recent Geoscience Graduates .......................................................... 104
Skills Used by New Geoscience Master’s and Doctoral Degree Recipients .................... 105
Career Trajectories of Geoscience Degree Recipients ...................................................... 106
Salary Trends for Geoscience Occupations ....................................................................... 108
Demographics of the Geoscience Profession ..................................................................... 109
Workforce Age Demographics ........................................................................................... 112
Geoscience Employment Projections 2008-2018 .............................................................. 121
Chapter 5: Geoscience Metrics and Drivers of the Geoscience Workforce ...... 131
Federal Research Funding of Geoscience Research ......................................................... 133
Industry Research Funding ............................................................................................... 140
Commodity Pricing and Output ........................................................................................ 141
Gross Domestic Product Contribution of Geoscience Industries ..................................... 148
Productive Activity of Geoscience Industries ................................................................... 150
Market Capitalization of Geoscience Industries .............................................................. 157
Appendix A: Defining the Geosciences ...................................................................... 159
Educational Classifications ............................................................................................... 160
Classification of Instructional Programs (CIP) ................................................................ 160
The College Board ............................................................................................................. 162
GeoRef ................................................................................................................................. 163
Occupational Classifications ............................................................................................. 163
Report Preview and Sample

viii
Standard Occupational Classification Codes .................................................................... 163
Office of Personnel Management: Handbook of Occupational Groups and Families .... 166
Industry Classifications ..................................................................................................... 167
North American Industry Classification System (NAICS) .............................................. 167
Energy Information Administration ................................................................................. 168
AGI’s Working Definition of Geoscience Occupations ...................................................... 168
Appendix B: References ................................................................................................ 171
Report Preview and Sample

ix
FiguresFigure 1.1: Percentage of 7th and 8th Graders Enrolled in Selected Science Courses ........ 3
Figure 1.2: Grades 4 and 8 Math Achievement Rates ......................................................... 4
Figure 1.3: Grades 4 and 8 Reading Achievement Rates ................................................... 4
Figure 1.4: Degree Fields of Pre-Kindergarten and Kindergarten Teachers (1993-2006) . 6
Figure 1.5: Degree Fields of Elementary School Teachers (1993-2006) ............................. 6
Figure 1.6: Earth Science education requirements in high school ...................................... 7
Figure 1.7: Percentage of Grade 9 Students Enrolled in Earth Science Courses. ......... 11
Figure 1.8: Percentage of High School Graduates Taking Science Courses in High School ........................................................................................................................................... 11
Figure 1.9: U.S. High School Graduate Science Course-taking Patterns by Gender ..... 12
Figure 1.10: U.S. High School Graduate Science Course-taking Patterns by Race and Ethnicity ........................................................................................................................... 12
Figure 1.11: Number of High School Science Teachers by Discipline .............................. 13
Figure 1.12: Highest Degree Fields of Computer, Math, and Science Secondary School Teachers ............................................................................................................................ 14
Figure 1.13: Percentage of High School Teachers Certified in their Assigned Field ...... 14
Figure 1.14: U.S. High School Graduates Selected Math Course-taking Patterns .......... 15
Figure 1.15: U.S. High School Graduates Selected Math Course-taking Patterns by Race/Ethnicity ............................................................................................................................ 15
Figure 1.16: U.S. High School Graduates Selected Math Course-taking Patterns by Gender ............................................................................................................................... 16
Figure 1.17: U.S. High School Graduates Advanced Placement Course-taking Patterns ... ........................................................................................................................................... 17
Figure 1.18: U.S. High School Graduates Advanced Placement Course-taking Patterns by Race and Ethnicity ........................................................................................................... 17
Figure 1.19: U.S. High School Graduates Advanced Placement Course-taking Patterns by Gender ............................................................................................................................... 18
Figure 1.20: Percentage of SAT Test-takers with Coursework or Experience in Selected Sciences ............................................................................................................................. 19
Figure 1.21: Mean Math SAT Scores for Test-takers with Coursework in Selected Sciences (1996-2009) ......................................................................................................... 19
Figure 1.22 Mean Verbal SAT Scores for Test-takers with Coursework in Selected Sciences (1996-2004) ......................................................................................................... 20
Figure 1.23: Mean Critical Reading SAT Scores for Test-takers with Coursework in Selected Sciences (2006-2009) .......................................................................................... 20
Report Preview and Sample

x
Figure 1.24: Mean Writing SAT Scores for Test-takers with Coursework in Selected Sciences (2006-2009) ......................................................................................................... 21
Figure 1.25: Intended Degree Level of College-bound High School Seniors who took the SAT Test ............................................................................................................................ 22
Figure 1.26: Number of SAT Test-Takers Intending College Degrees in Interdisciplinary Studies or Physical Sciences ............................................................................................ 22
Figure 1.27: Mean Math SAT Scores for SAT Test-Takers Intending College Degrees in Interdisciplinary Studies or Physical Sciences ............................................................... 23
Figure 1.28: Mean Verbal SAT Scores for SAT Test-Takers Intending College Degrees in Interdisciplinary Studies or Physical Sciences (1996-2004)........................................... 23
Figure 1.29: Mean Critical Reading SAT Scores for SAT Test-Takers Intending College Degrees in Interdisciplinary Studies or Physical Sciences (2006-2009) ........................ 24
Figure 1.30: Mean Writing SAT Scores for SAT Test-Takers Intending College Degrees in Interdisciplinary Studies or Physical Sciences (2006-2009) ...................................... 24
Figure 1.31: Percentage of High School Students Meeting ACT College Readiness Benchmarks ...................................................................................................................... 25
Figure 2.1: Age Demographics of Current and Future U.S. College-Age Population ..... 28
Figure 2.2: Fall Enrollments at U.S. Post-secondary Institutions ................................... 29
Figure 2.3: Degrees Conferred from U.S. Post-secondary Institutions by Degree Level 30
Figure 2.4: Participation of Women in College and University Enrollments .................. 31
Figure 2.5: Percentage of Degrees Conferred to Women by Degree Level ...................... 31
Figure 2.6: Underrepresented Minority Enrollments in Colleges and Universities ....... 32
Figure 2.7: Percentage of Degrees Conferred to Underrepresented Minorities by Degree Level .................................................................................................................................. 33
Figure 2.8: Number of Geoscience Departments / Programs at Community Colleges by State .................................................................................................................................. 34
Figure 2.9: Number of Faculty per Geoscience Department / Program at Community Colleges ............................................................................................................................. 35
Figure 2.10: Age Demographics of Community College Geoscience Faculty ................... 35
Figure 2.11: Percentage of Community College Geoscience Faculty Positions Held by Women ............................................................................................................................... 36
Figure 2.12: Four-year University Graduates by Highest Degree Field and Level Who Attended Community College (2003) .............................................................................. 37
Figure 2.13: Four-year University Graduates by Highest Degree Field and Level Who Earned Associate’s Degrees (2003) .................................................................................. 37
Figure 2.14: Four-year University Graduates by Highest Degree Field and Level Who Attended Community College (2006) .............................................................................. 38
Report Preview and Sample

xi
Figure 2.15: Geoscience Graduates by Highest Degree Field and Level Who Attended Community College (2003) .............................................................................................. 39
Figure 2.16: Geoscience Graduates by Highest Degree Field and Level Who Earned Associate’s Degrees (2003) .............................................................................................. 39
Figure 2.17: Geoscience Associate’s Degrees Conferred Annually ................................... 40
Figure 2.18: Percentage of Associate’s Degrees Conferred to Women by Discipline ...... 40
Figure 2.19: Percentage of Associate’s Degrees Conferred to Underrepresented Minorities by Discipline ................................................................................................... 41
Figure 2.20: Location of Minority Serving Institutions Offering Geoscience Associate’s Degree Programs ............................................................................................................. 42
Figure 3.1: Number of Geoscience Departments per State ............................................... 47
Figure 3.2: Number of Students per Tenure Track Faculty Member by State ................ 48
Figure 3.3: Median Size of Geoscience Departments Based on Number of Faculty and Number of Students .......................................................................................................... 50
Figure 3.4: Total Field Camp Attendance 1998 - 2009 ...................................................... 52
Figure 3.5: Percentage of Geoscience Faculty by Rank in Four-Year Institutions .......... 54
Figure 3.6: Number of Geoscience Faculty per Age Group and Rank ............................. 55
Figure 3.7: Percentage of Female Geoscience Faculty by Rank ........................................ 55
Figure 3.8: Trends in Geoscience Publications ................................................................... 56
Figure 3.9: Trends in Geoscience Faculty Specialties (1999-2010) ................................... 57
Figure 3.10: Changes in Faculty Specialties within Geology (1999-2010) ....................... 58
Figure 3.11: Changes in Faculty Specialties within Economic Geology (1999-2010) ...... 58
Figure 3.12: Changes in Faculty Specialties within Geochemistry (1999-2010) .............. 58
Figure 3.13: Changes in Faculty Specialties within Geophysics (1999-2010) .................. 59
Figure 3.14: Changes in Faculty Specialties within Paleontology (1999-2010) ............... 59
Figure 3.15: Changes in Faculty Specialties within Hydrology (1999-2010) ................... 60
Figure 3.16: Changes in Faculty Specialties within Soil Science (1999-2010) ................. 60
Figure 3.17: Changes in Faculty Specialties within Engineering Geology (1999-2010) .. 61
Figure 3.18: Changes in Faculty Specialties within Oceanography (1999-2010) ............. 61
Figure 3.19: Changes in Faculty Specialties within Planetology (1999-2010) ................. 62
Figure 3.20: Changes in Faculty Specialties within Other Geosciences (1999-2010) ...... 62
Figure 3.21: Geoscience Enrollments at U.S. Four Year Universities .............................. 64
Figure 3.22: Geoscience Degrees Conferred at U.S. Four Year Universities ................... 65
Report Preview and Sample

xii
Figure 3.23: Participation of Women in Geoscience Programs ......................................... 66
Figure 3.24: Underrepresented Minority Participation in four-year institutions (Enrollments and Degrees)............................................................................................... 67
Figure 3.25: Percentage of Science and Engineering Degrees Conferred to Underrepresented Minorities ........................................................................................... 67
Figure 3.26: Percentage of Geoscience Bachelor’s Degrees Conferred to Underrepresented Minorities ........................................................................................... 68
Figure 3.27: Percentage of Geoscience Master’s Degrees Conferred to Underrepresented Minorities .......................................................................................................................... 68
Figure 3.28: Percentage of Geoscience Doctoral Degrees Conferred to Underrepresented Minorities .......................................................................................................................... 69
Figure 3.29: Geoscience Undergraduate Enrollment Profile ............................................. 70
Figure 3.30: Bachelor’s Degree Fields of Geoscience Graduates – Broad Fields ............. 71
Figure 3.31: Bachelor’s Degree Fields of Geoscience Graduates – Fine Fields ................ 71
Figure 3.32: Trends in Geoscience Master’s Theses Topics ............................................... 72
Figure 3.33: Trends in Geoscience Doctoral Dissertation Topics ...................................... 72
Figure 3.34: Percentage of Total Federal Research Funding Applied to the Geosciences 74
Figure 3.35: Percentage of University Geoscience Research Funding per Subdiscipline from Selected Federal Agencies ....................................................................................... 74
Figure 3.36: Percentage of University Geoscience Research Funding per Subdiscipline (Department of Agriculture) ............................................................................................ 75
Figure 3.37: Percentage of University Geoscience Research Funding per Subdiscipline (Department of Defense) .................................................................................................. 75
Figure 3.38: Percentage of University Geoscience Research Funding per Subdiscipline (Department of Energy) .................................................................................................... 76
Figure 3.39: Percentage of University Geoscience Research Funding per Subdiscipline (NASA)............................................................................................................................... 76
Figure 3.40: Percentage of University Geoscience Research Funding per Subdiscipline (NSF) ................................................................................................................................. 77
Figure 3.41: Funding of Geoscience NSF Proposals .......................................................... 77
Figure 3.42: Number of Geoscience NSF Proposals and Awards by GEO Division ......... 78
Figure 3.43: Funding of Geoscience NSF Proposals by GEO Division ............................. 78
Figure 3.44: Median Annual Size of Geoscience NSF Awards by GEO Division ............. 79
Figure 3.45: Trends in NSF Atmospheric and Geospace Science Proposals by Subject .. 83
Figure 3.46: Trends in NSF Atmospheric and Geospace Science Awards by Subject ...... 83
Report Preview and Sample
xiii
Figure 3.47: Trends in NSF Atmospheric and Geospace Science Funding Rates by Subject ........................................................................................................................................... 84
Figure 3.48: Trends in NSF Atmospheric and Geospace Science Award Size by Subject ... ........................................................................................................................................... 84
Figure 3.49: Trends in NSF Earth Science Proposals by Subject ..................................... 84
Figure 3.50: Trends in NSF Earth Science Awards by Subject ......................................... 85
Figure 3.51: Trends in NSF Earth Science Funding Rates by Subject ............................. 85
Figure 3.52: Trends in NSF Earth Science Award Size by Subject .................................. 85
Figure 3.53: Trends in NSF Ocean Science Proposals by Subject ..................................... 86
Figure 3.54: Trends in NSF Ocean Science Awards by Subject ........................................ 86
Figure 3.55: Trends in NSF Ocean Science Funding Rates by Subject ............................ 87
Figure 3.56: Trends in NSF Ocean Science Award Size by Subject .................................. 87
Figure 3.57: Median Size of NSF Geoscience ARRA Standard Grant Awards (2009-2010) ........................................................................................................................................... 88
Figure 3.58: Number of Atmospheric and Geospace Science ARRA Awards by Topic (2009-2010) ........................................................................................................................ 89
Figure 3.59: Number of Earth Science ARRA Awards by Topic (2009-2010) ................... 89
Figure 3.60: Number of Ocean Science ARRA Awards by Topic (2009-2010) .................. 90
Figure 3.61: Total U.S. Geoscience Student Aid by Degree Level .................................... 91
Figure 3.62: 2007-2008 Geoscience Student Aid by Discipline ......................................... 91
Figure 3.63: Number of NSF Graduate Fellowships Awarded (2000-2009) ..................... 92
Figure 3.64: Total Funding of Geoscience NSF Fellowships ............................................. 92
Figure 3.65: Geoscience Graduate Fellowships by Field of Study .................................... 93
Figure 4.1: Percentage of Geoscience Students and Advisors with Positive Attitudes Pertaining to Careers in Different Employment Sectors (2006) .................................... 98
Figure 4.2: Percentage of Geoscience Undergraduates Recipients with Positive Attitudes Pertaining to Careers in Different Employment Sectors (2006) .................................... 99
Figure 4.3: Percentage of Geoscience Master’s Students with Positive Attitudes Pertaining to Careers in Different Employment Sectors (2006) .................................... 99
Figure 4.4: Percentage of Geoscience Doctoral Candidates with Positive Attitudes Pertaining to Careers in Different Employment Sectors (2006) .................................. 100
Figure 4.5: Percentage of Geoscience Graduate Degree Recipients Working in Different Employment Sectors ....................................................................................................... 101
Figure 4.6: Percentage of Geoscience Master’s Degree Recipients Working in Different Employment Sectors ....................................................................................................... 102
Report Preview and Sample

xiv
Figure 4.7: Percentage of Geoscience Ph.D. Degree Recipients Working in Different Employment Sectors ....................................................................................................... 102
Figure 4.8: Percentage of Geoscience Ph.D. Degree Recipients Working in Post-Doctoral and Non Post-Doctoral Positions ................................................................................... 103
Figure 4.9: Post-Graduation Plans of Geoscience Doctorates (2007-2009) ..................... 104
Figure 4.10: Employment Sectors of Recent Geoscience Doctorates Employed in Non-Postdoctoral Positions (2007-2009) ................................................................................ 104
Figure 4.11: Knowledge and Skills Used by Geoscience Graduate Degree Recipients .. 105
Figure 4.12: Career Trajectories of All Geoscience Graduates for All Degree Levels (2006) ......................................................................................................................................... 107
Figure 4.13: Career Trajectories of Geoscience Bachelor’s Degree Recipients (2006) ... 107
Figure 4.14: Career Trajectories of Geoscience Master’s Degree Recipients (2006) ...... 108
Figure 4.15: Career Trajectories of Geoscience Doctoral Degree Recipients (2006) ...... 108
Figure 4.16: Mean Annual Salaries of Geoscience Occupations (1999-2009) ................. 109
Figure 4.17: Percentage of Women in Environmental Science and Geoscience Occupations ......................................................................................................................................... 110
Figure 4.18: Percentage of Women in Geoscience and Other Science and Engineering Occupations ..................................................................................................................... 110
Figure 4.19: Percentage of Women in Detailed Geoscience Occupations ....................... 110
Figure 4.20: Percentage of Underrepresented Minorities in Environmental Science and Geoscience Occupations .................................................................................................. 111
Figure 4.21: Percentage of Underrepresented Minorities in Geoscience and Other Science and Engineering Occupations ........................................................................................ 112
Figure 4.22: Percentage of Underrepresented Minorities in Detailed Geoscience Occupations ..................................................................................................................... 112
Figure 4.23: Geoscience Age Demographics by Membership Society ............................. 113
Figure 4.24: Age Distribution of Environmental Engineers in the U.S. Government ... 113
Figure 4.25: Age Distribution of Mining Engineers in the U.S. Government ................ 114
Figure 4.26: Age Distribution of Petroleum Engineers in the U.S. Government ........... 114
Figure 4.27: Age Distribution of Geophysicists in the U.S. Government ....................... 115
Figure 4.28: Age Distribution of Hydrologists in the U.S. Government ......................... 115
Figure 4.29: Age Distribution of Meteorologists in the U.S. Government ...................... 116
Figure 4.30: Age Distribution of Geologists in the U.S. Government ............................. 116
Figure 4.31: Age Distribution of Oceanographers in the U.S. Government ................... 117
Report Preview and Sample

xv
Figure 4.32: Age Distribution of Geoscientists in the U.S. Geological Survey ............... 117
Figure 4.33: Age Distribution of Geoscientists in the Oil and Gas Industry .................. 118
Figure 4.34: Oil & Gas Industry Geoscientist Supply and Demand .............................. 118
Figure 4.35: Age Distribution of Geoscientists in Mining .............................................. 119
Figure 4.36: Age Distribution of Geoscientists in Support Activities for Mining and Oil & Gas .................................................................................................................................. 119
Figure 4.37: Trends in Faculty Rank Distribution at Four-Year Institutions (1980-2009) . ......................................................................................................................................... 120
Figure 4.38: Age Distribution of Geoscience Faculty Members ...................................... 120
Figure 4.39: Employment Projections for Geoscience Occupations (2008-2018) ............ 121
Figure 4.40: Employment Projections for All Geoscience Occupations by Industry Sector (2008-2018) ...................................................................................................................... 122
Figure 4.41: Employment Projections for Detailed Geoscience Occupations (2008-2018) ... ......................................................................................................................................... 122
Figure 5.1: Percentage of Federal Research Funding Applied to the Geosciences ........ 134
Figure 5.2: Total Federal Research Funding of the Geosciences .................................... 134
Figure 5.3: Federal Funding of Basic Research in the Geosciences ................................ 135
Figure 5.4: Federal Funding of Applied Research in the Geosciences ............................ 135
Figure 5.5: Geoscience Research Funding from the Department of Agriculture ........... 136
Figure 5.6: Geoscience Research Funding from the Department of Commerce ............. 136
Figure 5.7: Geoscience Research Funding from the Department of Defense ................. 137
Figure 5.8: Geoscience Research Funding from the Department of Energy .................. 137
Figure 5.9: Geoscience Research Funding from the Department of Interior ................. 138
Figure 5.10: Geoscience Research Funding from the Environmental Protection Agency ...138
Figure 5.11: Geoscience Research Funding from the National Aeronautics and Space Administration ................................................................................................................ 139
Figure 5.12: Geoscience Research Funding from the National Science Foundation ..... 140
Figure 5.13: Distribution of Total Company R&D for the Mining, Extraction & Support Activities Industries ....................................................................................................... 141
Figure 5.14: Price of Oil by Currency and by Gold .......................................................... 142
Figure 5.15: Commodity Price Indices .............................................................................. 143
Figure 5.16: Commodity Prices for Selected Metals and Oil ........................................... 143
Figure 5.17: Commodity Prices for Tin, Nickel, and Oil .................................................. 144
Report Preview and Sample

xvi
Figure 5.18: Commodity Prices for Copper and Oil ......................................................... 144
Figure 5.19: Commodity Prices for Uranium and Oil ...................................................... 144
Figure 5.20: Commodity Prices for Grains and Oil .......................................................... 145
Figure 5.21: Commodity Prices for Beef, Pork and Oil .................................................... 145
Figure 5.22: Commodity Prices for Natural Gas and Oil ................................................ 145
Figure 5.23: Commodity Output for the Mining, Oil and Gas Extraction, and Support Industries ........................................................................................................................ 146
Figure 5.24: Gross Operating Surplus for the Mining, Oil and Gas Extraction, and Support Industries .......................................................................................................... 147
Figure 5.25: Taxes on Production & Imports for the Mining, Oil and Gas Extraction, and Support Industries .......................................................................................................... 147
Figure 5.26: Profit Margin Increases for Independent and Major Energy Companies .. 148
Figure 5.27: Percentage of Geoscience Industry GDP Contributed by Specific Industries . ......................................................................................................................................... 149
Figure 5.28: Average Rotary Rig Counts by World Region ............................................. 151
Figure 5.29: U.S. Rotary Rig Counts ................................................................................ 151
Figure 5.30: U.S. Rotary Rigs by Location ....................................................................... 152
Figure 5.31: U.S. Rigs by Type .......................................................................................... 152
Figure 5.32: Number of Wells Drilled by Type and Drilling Success Rate ..................... 153
Figure 5.33: Average Depth of Wells Drilled by Type .................................................... 153
Figure 5.34: Number of U.S. Mines .................................................................................. 154
Figure 5.35: Material Handled at U.S. Mines .................................................................. 155
Figure 5.36: Mine Waste from U.S. Mines ....................................................................... 156
Figure 5.37: Mine Waste/Materials Handled Ratio at U.S. Mines ................................. 156
Figure 5.38: Value of Non-fuel Mineral Production from U.S. Mines ............................. 157
Figure 5.39: Historical Total Market Capitalization of Selected Representative Companies Across Geoscience Industries...................................................................... 158
Report Preview and Sample

xvii
TablesTable 1.1: Percentage of Students by Race and Ethnicity that performed
“At or above proficiency” in Mathematics for Grades 4 and 8 .......................................... 5
Table 1.2: Percentage of Students by Race and Ethnicity that performed “At or above basic” in Mathematics for Grades 4 and 8 .................................................. 5
Table 1.3: Changes in State-level Earth Science Requirements for Graduation ............... 7
Table 1.4: States Recommending Earth Science Coursework in High School .................... 9
Table 1.5: States Counting Earth Science Coursework Towards Graduation Requirements .................................................................................................................... 10
Table 2.1: Percentage of Community Colleges with Geoscience Programs for Selected States. ................................................................................................................................ 34
Table 3.1: Distribution of Geoscience Departments in the United States ........................ 49
Table 3.2: States with Changes in Geoscience Student to Faculty Member Ratios (2009-2010). ................................................................................................................................ 49
Table 3.3: Percentage of All U.S. Geoscience Undergraduate Students Enrolled in 2009-2010 ................................................................................................................................... 50
Table 3.4: Percentage of All U.S. Geoscience Graduate Students Enrolled in 2009-2010 ... ........................................................................................................................................... 50
Table 3.5: U.S. Geoscience Field Camp .............................................................................. 53
Table 3.6: Top Ten Degree Granting Institutions of U.S. Geoscience Tenure-Track and Tenured Faculty ................................................................................................................ 54
Table 3.7: Top Five Geology Publication Topics 1970-2008 ............................................... 56
Table 3.8: Publication Trends in American Meteorological Society (AMS) and AGI Journals ............................................................................................................................ 57
Table 3.9: Changes in Faculty Specialty Subdisciplines (1999-2010) ............................... 64
Table 3.10: Top Five Geology Theses and Dissertation Topics 1970-2008 ....................... 73
Table 3.11: Top 10 Universities Receiving NSF Earth Science (EAR) Awards (Millions of $USD) (2001-2010) ........................................................................................................... 80
Table 3.12: Top 10 Universities Receiving NSF Atmospheric and Geospace Science (AGS) Awards (Millions of $) (2001-2010) .................................................................................. 82
Table 3.13: Top 10 Universities Receiving NSF Ocean Science (OCE) Awards (Millions $) (2001-2010) ........................................................................................................................ 82
Table 3.14: Organizations Awarded with Ten or More ARRA Awards from the NSF Geoscience Directorate ..................................................................................................... 88
Table 3.15: Top Baccalaureate Institutions of NSF Geoscience Graduate Fellows (2000-2009) .................................................................................................................................. 93
Report Preview and Sample

xviii
Table 3.16: Top Graduate Institutions of NSF Geoscience Graduate Fellows (2000-2009) ........................................................................................................................................... 94
Table 4.1: Percentage of Students and Faculty with Positive Attitudes Pertaining to Students Pursuing Careers in Different Employment Sectors (2006) ........................... 98
Table 4.2: Percentage of Students with Positive Attitudes Pertaining to Careers in Different Employment Sectors (2006) ........................................................................... 100
Table 4.3: Percentage of Students with Positive Attitudes Pertaining to Careers in Different Employment Sectors at less than 1-year prior to and more than 1-year prior to Graduation (2006) ...................................................................................................... 101
Table 4.4: Starting Salaries for New Geoscience Master’s Degree Recipients ............... 105
Table 4.5: Starting Salaries for New Geoscience Ph.D. Degree Recipients .................... 105
Table 4.6: Knowledge and Skills Used by New Geoscience Ph.D. and Master’s Degree Recipients (2006) ............................................................................................................ 106
Table 4.7: U.S. Bureau of Labor Statistics Current and Projected U.S. Geoscience Employment .................................................................................................................... 129
Table 5.1: Geoscience Industry GDP and U.S. Total GDP (2002-2016) ......................... 150
Report Preview and Sample

Chapter 1: Trends in K-12 Education
1
Chapter 1: Trends in K-12 Geoscience Education – Preparing Students for College Geoscience Programs and Society
OverviewK-12 education provides an important formative stage in a student’s education, and the coursework to which students are exposed during this period (especially during high school) influences choices they make with regard to college majors. Mathematics and reading pro-ficiency by grade 8 is impor-tant for preparing students for academic coursework in high school and beyond. Since the passage of No Child Left Behind in 2001, mathematics proficien-cy rates for students in grades 4 and 8 increased markedly by 2009 from 65 to 82 percent for grade 4 students, and from 63 to 73 percent for grade 8 students. Reading proficiency increased slightly for students in grade 4 (62 to 67 percent for years 1998 to 2009), and remained near 75 percent for students in grade 8.
Earth Science education is taught in grades 6 through 8 in the majority of states, although trends over the past 18 years indicate that only 11-15 per-cent of grade 7 and 8 students take an explicit Earth Science course. Integration of earth sci-ence into General Science courses and students fulfilling their Earth Science education requirements in grade 6 are leading factors depressing the middle school Earth Science participation rates.
Trends of degrees of U.S. K-8 teachers between 1993 and 2006 indicate few teachers pos-sess geoscience degrees. In pre-kindergarten and elementary school, teachers most com-monly have their highest degrees in the social sciences or in non-science and engineering disciplines. However, two to three percent of pre-kindergarten and kindergarten teachers have their highest degree in the geosciences compared to between one and two percent for other elementary teachers.
Although Earth Science is generally not a required course in high school, all states and the District of Columbia include earth science in their high school science standards. For the past 26 years, the percentage of high school students taking Earth Science courses has never exceeded 25 percent. (Enrollments in Chemistry and Physics have increased since
Report Preview and Sample

Chapter 1: Trends in K-12 Education
2
1982, and Biology enrollments have remained around 90 percent since 1990). Examina-tion of the most recent diversity data from 2005 indicates that a slightly higher percentage of male high school students take Geology/Earth Science courses than female students. Course-taking patterns by race and ethnicity indicate that Earth Science coursework in high school is lowest for Asian-American/Pacific Islander students (16 percent) and be-tween 20 and 24 percent for underrepresented minorities and non-minority students. Al-though the percentage of high school science teachers in Biology, Chemistry, Physics, and Earth Science has grown in the past 18 years, Earth Science has grown the least at 21 percent. Furthermore, approximately 3 percent of the high school science, math, and com-puter teachers have their highest degree in the geosciences.
The SAT test, a standardized test for college-admission, does not list Geoscience as an in-tended college major choice; however, this discipline is grouped into the Physical Science category. The number of students indicating either Physical Science or Interdisciplinary Studies as their intended college major area increased from 16,061 in 1996 to 19,891 in 2006, and has since dropped to 16,487 in 2009. The interest in these majors has remained at 1.2 percent of all college-bound students (1 percent for Physical Science, 0.2 percent for Interdisciplinary Studies) for the past two of decades. College-bound students indicating Physical Science as their college major outperformed those indicating Interdisciplinary Studies on both the verbal and math sections of the SAT between 1997 and 2006. However, after the redesign of the SAT in 2006, those intending majors in Interdisciplinary Studies consistently out-performed those intending majors in the Physical Sciences on the critical reading and writing sections of the SAT. Additionally, since 2007 mean math scores of intended Interdisciplinary Studies majors have been on par with those intending majors in the Physical Sciences. Furthermore, both groups have historically scored higher mean math and verbal (including critical reading and writing) scores than the total group of SAT test-takers. Interestingly, since 2000, approximately half of all college-bound secondary school students have indicated intent to obtain graduate degrees.
Indicators of college-readiness focus on student course-taking patterns (e.g. advanced mathematics, Advanced Placement / International Baccalaureate, etc.), and comparison of SAT and ACT test scores against national benchmarks (Montgomery County Public Schools, 2010; Kirst and Venezia, 2006). As of 2005, 70 percent of high school graduates completed Algebra II, 30 percent completed Pre-Calculus, and 14 percent completed Cal-culus prior to graduation. Although there is no AP Geology course, AP course-taking pat-terns for other science and math topics indicate a low percentage of high school graduates take AP courses (16 percent AP / honors Biology, 9 percent AP / honors Calculus, 8 percent AP / honors Chemistry, and 5 percent AP / honors Physics). Furthermore, mean math and verbal (including critical reading and writing) scores for those students with coursework or experience in Geology / Earth or Space Sciences have been consistently less than those with coursework or experience in the other natural sciences and less than the national benchmarks. In 2002, one-fifth of ACT test-takers met or exceeded all four subject bench-marks, and in 2009, almost one-quarter (23 percent) met this benchmark.
The College Board’s “Standards for College Success” report (College Board, 2010) provides detailed standards, objectives, and performance expectations for both middle grade and high school students in order to ensure that students are prepared appropriately for col-lege instruction and/or for the workforce. For the first time, Earth Science has been as-signed its own chapter in the “Science Standards for College Success” section of the report. The extent to which this report will increase emphasis for earth science in the middle school curriculum remains to be seen over the coming years.
Grades K-8During grades K-8, students are introduced to basic earth science content, and are pre-pared for more advanced study of these concepts in high school. In most states, earth and
Report Preview and Sample
Chapter 1: Trends in K-12 Education
12
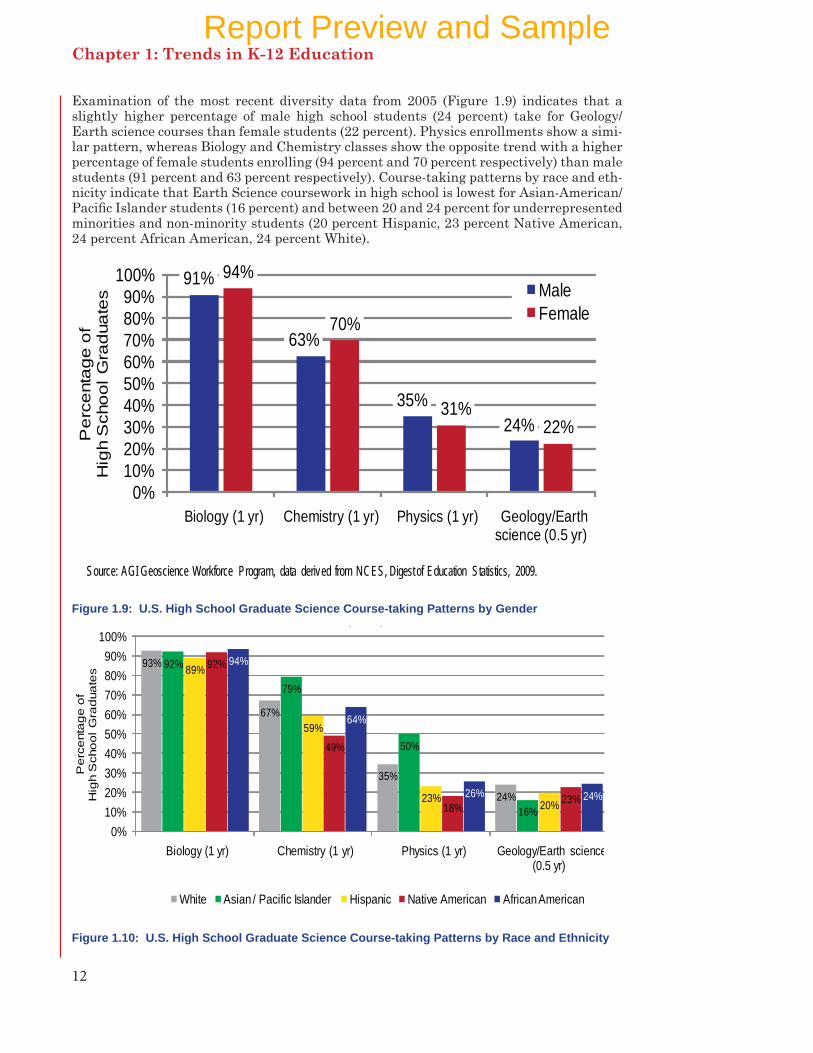
Examination of the most recent diversity data from 2005 (Figure 1.9) indicates that a slightly higher percentage of male high school students (24 percent) take for Geology/Earth science courses than female students (22 percent). Physics enrollments show a simi-lar pattern, whereas Biology and Chemistry classes show the opposite trend with a higher percentage of female students enrolling (94 percent and 70 percent respectively) than male students (91 percent and 63 percent respectively). Course-taking patterns by race and eth-nicity indicate that Earth Science coursework in high school is lowest for Asian-American/Pacific Islander students (16 percent) and between 20 and 24 percent for underrepresented minorities and non-minority students (20 percent Hispanic, 23 percent Native American, 24 percent African American, 24 percent White).
91%
63%
35%24%
94%
70%
31%22%
0%10%20%30%40%50%60%70%80%90%
100%
Biology (1 yr) Chemistry (1 yr) Physics (1 yr) Geology/Earth science (0.5 yr)
Pe
rce
nta
ge
of
Hig
h S
cho
ol
Gra
dua
tes Male
Female
Source: AGI Geoscience Workforce Program, data derived from NCES, Digest of Education Statistics, 2009.
Figure 1.9: U.S. High School Graduate Science Course-taking Patterns by Gender
93%
67%
35%
24%
92%
79%
50%
16%
89%
59%
23% 20%
92%
49%
18%23%
94%
64%
26% 24%
0%10%20%30%40%50%60%70%80%90%
100%
Biology (1 yr) Chemistry (1 yr) Physics (1 yr) Geology/Earth science (0.5 yr)
Pe
rce
nta
ge
of
Hig
h S
cho
ol
Gra
dua
tes
(2005)
White Asian / Pacific Islander Hispanic Native American African American
Source: AGI Geoscience Workforce Program, data derived from NCES, Digest of Education Statistics, 2009.Figure 1.10: U.S. High School Graduate Science Course-taking Patterns by Race and Ethnicity
Report Preview and Sample

Chapter 1: Trends in K-12 Education
19
0%10%20%30%40%50%60%70%80%90%
100%
1996 1998 2000 2002 2004 2006 2008 2009
Selected Years: 1996-2009
Biology Chemistry Physics Geology, Earth, or Space ScienceSource: AGI Geoscience Workforce Program, data derived from the College Board College
-Bound Seniors, Total Group Report, 1996
-2009
Figure 1.20: Percentage of SAT Test-takers with Coursework or Experience in Selected Sciences
508512 514 516 518 518 515 515
460
480
500
520
540
560
580
1996 1998 2000 2002 2004 2006 2008 2009
Me
an
SA
T S
core
All Test TakersBiologyChemistryPhysicsGeology, Earth or Space Science
Source: AGI Geoscience Workforce Program, data derived from the College Board College-Bound Seniors, Total Group Report, 1996-2009
Figure 1.21: Mean Math SAT Scores for Test-takers with Coursework in Selected Sciences (1996-2009)
Report Preview and Sample

Chapter 2: Community Colleges
27
Chapter 2: Trends in Community College Geoscience Programs
OverviewCommunity colleges served nearly 7 million students in 2008. In 2008, fifty-eight percent of community college students were women and 33 percent were underrepresented minori-ties. Community colleges serve a multitude of purposes for the student body ranging from re-tooling for the workforce to completing educational requirements prior to transferring to four-year institutions. For science and engineering fields, community colleges represent a pool of diverse talent that could be tapped to increase diversity in their academic pro-grams and workforce populations.
The community college student population is more diverse than at four-year institutions, and also plays a substantial role in the academic pathway of many four-year degree re-cipients. Nearly half of all Bachelor’s degree holders attended community college, and ap-proximately 20 percent earned Associate’s degrees. At the graduate degree levels, Master’s degree holders have higher rates of community college attendance (36-46 percent) and Associate’s degree attainment (8-16 percent) than Doctorates (attendance: 16-32 percent; Associate’s degrees: 4-13 percent).
Geoscience programs are offered at approximately 17 percent of all community college programs, and are distributed across the nation with the highest concentrations in Cali-fornia and Texas. (Geoscience programs are defined as having at least one geoscience fac-ulty member teaching courses at a given community college.) The majority of community college geoscience programs have fewer than 3 faculty members, and just over half of all community college geoscience faculty are part-time instructors. Although community college geoscience programs have historically produced between 200 and 300 Associate’s degrees per year, the total number of students taught per year is much higher. Geoscience
Report Preview and Sample

Chapter 2: Community Colleges
28
degree conferral rates indicate that women and especially underrepresented minorities are under-recruited relative to the whole population as well as compared to other science and engineering disciplines. In 2008, women earned 36 percent of geoscience Associate’s degrees, and underrepresented minorities earned 12 percent of geoscience Associate’s de-grees. When compared to other science and engineering disciplines, the geosciences confer a higher percentage of Associate’s degrees to women than computer science, engineering, math and physics. However, even at the community college level where the student popu-lation is more diverse, the geosciences still confer a lower percentage of Associate’s degrees to underrepresented minorities than other science and engineering disciplines. Minority Serving Institutions (MSIs) are a bright spot in the issue of diversity in the geosciences. Seventy-nine MSIs offer Associate’s degrees in geoscience disciplines, and in 2008, these programs conferred 10 percent of all geoscience Associate’s degrees. Despite the low num-ber of degrees (29), 16 were earned by Native Americans and 2 by Hispanics, accounting for 62 percent of conferrals to underrepresented minorities.
National BenchmarksWomen and underrepresented minorities represent a large potential pool of talent for the sciences that are needed to expand innovation into the future. Since 2000, women have comprised 51 percent of the total U.S. population and 49 percent of the college-aged adults (e.g. 18-24 year olds), and these rates are expected to remain steady into the future. Underrepresented minorities (e.g. Hispanics, African Americans, and Native Americans) currently comprise 30 percent of the total U.S. population and 36 percent of college-aged adults (e.g. 18 to 24 year olds) (Figure 2.1). By 2050, underrepresented minorities are pro-jected to make up 45 percent of the total U.S. population and 53 percent of college-aged adults. These increases will be primarily driven by expansion of the Hispanic population. By 2050, Hispanics will comprise 30 percent of the total U.S. population and 37 percent of college-aged adults.
63% 61%55%
51% 48%43%
17% 19%25% 29%
33%37%
14% 15% 15% 14% 14% 14%
5% 5% 6% 7% 7% 8%2% 2% 2% 2% 2% 2%
0%
10%
20%
30%
40%
50%
60%
70%
2000 2010 2020 2030 2040 2050
Pe
rce
nta
ge
of
18
-24
ye
ar
old
s
(2000-2050)
White Hispanic African American Asian Native American / Pacific Islander
Source: AGI Geoscience Workforce Program; Data derived from US Census Bureau Population Estimates.
Figure 2.1: Age Demographics of Current and Future U.S. College-Age Population
In 2008, total U.S. college and university enrollments were 19.1 million, and thirty-six percent of total enrollments (approximately 7 million) were community college students (Figure 2.2). Since 1974, community college students have comprised approximately one-third the total college student population enrolled in post-secondary institutions within the United States. In the 1990’s and the early part of 2000’s community college enroll-ments comprised nearly 40 percent of total annual higher education enrollments. Projec-
Report Preview and Sample

Chapter 2: Community Colleges
29
tions from the National Center for Education Statistics (NCES) indicate that by 2018, U.S. college and university enrollments will reach 20.6 million. If the proportion of enrollments by institutional type remains at the 2008 levels, in 2018 there will be 7.4 million students enrolled at community colleges.
Associate’s degree recipients have comprised a quarter of all degree recipients from U.S. post-secondary institutions since 1982. In 2010, a total of 778,000 Associate’s degrees were conferred, and projections from NCES estimate that in 2019 the number of Associate’s degrees conferred will reach 913,000 (Figure 2.3).
0
2,000,000
4,000,000
6,000,000
8,000,000
10,000,000
12,000,000
14,000,000
16,000,000
18,000,000
20,000,000
22,000,000
Num
be
r o
f S
tud
ent
s
-
4-year2-year
Source: AGI Geoscience Workforce Program. Data derived from NCES Digest of Education Statistics, 2009.
Figure 2.2: Fall Enrollments at U.S. Post-secondary Institutions
(Note: Enrollment data by institutional type for 2009-2018 are estimated based on 2009-2018 total enrollment data and 2008 enrollment data by institutional type from NCES.)
Report Preview and Sample

Chapter 2: Community Colleges
30
0
200,000
400,000
600,000
800,000
1,000,000
1,200,000
1,400,000
1,600,000
1,800,000
2,000,000
19
71
19
73
19
75
19
77
19
79
19
81
19
83
19
85
19
87
19
89
19
91
19
93
19
95
19
97
19
99
20
01
20
03
20
05
20
07
20
09
20
112
01
32
01
52
01
72
01
9
Num
be
r o
f D
eg
ree
s C
onf
err
ed
(1971-2019)
Associate'sBachelor'sMaster'sDoctoral
Source: AGI Geoscience Workforce Program. Data derived from NCES Digest of Education Statistics, 2009.
Figure 2.3: Degrees Conferred from U.S. Post-secondary Institutions by Degree Level
Between 1975 and 1980, community college enrollments reached gender parity (50 per-cent), leading four-year university enrollment trends by nearly 10 years (Figure 2.4). At four-year institutions, gender parity in enrollments was reached between 1980 and 1985. As of 2008, women have comprised 58 percent of all community college enrollments and 57 percent of four-year university enrollments.
Women now earn over half of all degrees from two- and four-year institutions (Figure 2.5). The equity point was passed in 1978 for Associate’s degrees, in 1981 for Bachelor’s and Master’s degrees, and in 2007 for doctoral degrees. Currently, women earn 62 percent of all Associate’s degrees, and a slightly lower percentage at four-year institutions (61-55%). Projections from the NCES Digest of Education Statistics indicate that women will earn 65 percent of all Associate’s degrees by 2019, and between 55 and 62 percent of four-year degrees (Bachelor’s: 59%; Master’s: 62%; Doctorates: 55%).
Report Preview and Sample

Chapter 3: Four-Year Institutions
43
Chapter 3: Trends in Geoscience Education at Four-Year Institutions
OverviewThe academic sector is unique in that it serves as both a con-sumer and primary supplier of geoscience human capital. Thus, the health of geoscience academic departments, includ-ing the size of their student body and faculty, directly affect the size and expertise of the future geoscience workforce. Because a Master’s degree is considered the professional de-gree in geoscience occupations, there is approximately a 5 year
lag effect on the geoscience workforce for students who graduate with a geoscience Mas-ter’s degree. Students with Bachelor’s degrees in geoscience disciplines have limited job opportunities, and although there are opportunities available to geoscience doctorates in non-academic employment sectors, over 80 percent of geoscience doctorates pursue careers in academia. As a result, there is approximately a 10 to 15 year lag effect on the geoscience academic workforce depends upon the length of time that geoscience doctorates spend in post-doctoral positions before they begin a faculty position.
Geoscience departments at four-year universities can be found in every state, and the states with the most departments are California, New York, Pennsylvania, Texas, and Ohio. Between 2009 and 2010, twenty-nine states (58 percent of all US states) saw reduc-tions in the number of geoscience departments, and 12 states saw increases in the ratio of student to tenure-track faculty. However, the majority of geoscience departments continue to have relatively low student to tenure-track faculty ratios (6-10 students or less per fac-ulty member) which places geoscience programs in a favorable position from a teaching perspective. Between 1999 and 2007, the median size of departments decreased both in number of faculty (Professors, Associate Professors, Assistant Professors, and Instructors/Lecturers) and number of total students enrolled (undergraduate and graduate). However, since 2007, the median department size based on enrollments has increased from 45 to 56, while the median number of faculty remains near eight.
During the 2009-2010 academic year, the number of geoscience undergraduates enrolled in U.S. institutions reached its highest level in a decade at 23,983 majors. This is a 7 per-cent increase over 2008-2009 enrollments, and a 24.8 percent increase since the 2006-2007 academic year. For the first time in 5 years, graduate geoscience enrollments increased markedly to 9,054, jumping 15.7% from the 2008-2009 academic year. These increases in enrollments are likely linked to continued high prices of commodities, improved recruit-ment of students to the geosciences, and, for graduate enrollments, the perception of a negative job market, especially outside of the core geoscience industries. This perception drives undergraduates into graduate programs, even though geoscience employment op-portunities remain robust.
The number of geoscience degrees conferred by U.S. institutions in the 2009-2010 aca-demic year also increased markedly (Bachelor’s degrees: 3,037, Master’s degrees: 1,078, Doctorates: 668). The number of Bachelor’s degrees conferred increased by 7 percent from the 2008-2009 academic year, and the number of graduate degrees also increased (3 per-
Report Preview and Sample

Chapter 3: Four-Year Institutions
44
cent at the Master’s level and 6.2 percent at the Doctoral level). The increases in degree production are likely tied to prior growth in undergraduate enrollments and the poor state of the economy that is encouraging graduate students to complete their studies at a higher rate rather than seek employment prior to receiving their degree.
The ability to attract the maximum competent workforce to a profession is dependent upon its ability to recruit across gender, racial, and economic divides. Disparity between whole-population level of specific populations and their representation in the profession can be viewed as a first order proxy of the recruitment and sustainability of a discipline. In the geosciences, women currently earn nearly 40 percent of all geoscience degrees. During the 2009-2010 academic year, the geosciences saw a contraction in the percentage of women graduating from geoscience university programs at the Bachelor’s and Doctoral degree levels (Bachelors: -2%, Doctorates: -9%) from the 2008-2009 academic year, yet the per-centage of women enrolled in geoscience programs remain steady at all degree levels. Since 2008, the percentage of geoscience faculty positions held by women has increased by an average of two percent. In 2010, women held 16 percent of tenured and tenure-track geo-science faculty positions and 20 percent of non-tenure track geoscience faculty positions. Participation rates of women in geoscience faculty positions still lag broader science and engineering trends where women hold 28 percent of tenured and tenure-track positions in all science and engineering fields.
Compared to the progress made towards gender parity in the geoscience student popula-tion, the participation of underrepresented minorities in geoscience university programs remains extremely poor. As of 2008, underrepresented minorities comprised 23 percent of all enrolled students and 16 percent of all graduates at four-year universities. Yet, in geoscience university programs, less than 10 percent of geoscience graduates at all de-gree levels are underrepresented minorities. Compared with other science and engineer-ing fields, the geosciences confer the lowest percentage of Bachelor’s and Master’s degrees to underrepresented minorities. However, at the doctoral level, the geosciences confer a slightly higher percentage of degrees to underrepresented minorities than do mathemat-ics, engineering, and computer science.
Overall, Hispanics earn the largest percentage of geoscience degrees conferred to under-represented minorities. This may be partly due to the geographic distribution of geoscience departments which are located in regions where there are large Hispanic populations. This geographic distribution may also account for the low participation rates of African Ameri-cans in geoscience programs. There are few geoscience programs at universities and com-munity colleges in areas where there are large populations of African Americans. Consid-ering that the composition of degree holders within a discipline is an important measure of disciplinary health, the geosciences have much to do to increase the participation rate of underrepresented minorities.
In the geosciences, a Master’s degree is required for the majority of career paths. Examina-tion of the academic degree backgrounds of geoscience graduate students reveals that the majority of geoscience graduate students have a interdisciplinary educational background rather than a traditional pathway (e.g. geoscience Bachelor’s degree to geoscience gradu-ate degree). Although the majority of geoscience graduate students have bachelor degrees in physical sciences or engineering, 27 percent of geoscience Master’s degree recipients and 21 percent of geoscience doctorates hold bachelor degrees in other science disciplines. Furthermore, 9 percent of geoscience Master’s degree recipients and 4 percent of geosci-ence doctorates have bachelor degrees from non-science and engineering fields. Only 42 percent of geoscience Master’s degree recipients and 10 percent of geoscience doctorates hold bachelor’s degrees in the geosciences. Additionally, 9 percent of geoscience Master’s degree recipients and 4 percent of geoscience doctoral degree recipients have earned an Associate degree.
Report Preview and Sample

Chapter 3: Four-Year Institutions
45
Since the 1970s, AGI’s GeoRef database indicates that the majority of geoscience theses and dissertations pertain to geology topics. The change in theses and dissertation top-ics over the past four decades indicate a shift from resource-industry focused research towards environmental and interdisciplinary research, yet distinct differences exists be-tween graduate degree levels. At the Master’s degree level, petrology, stratigraphy, and economic geology have consistently ranked in the five most common theses topics since the 1970s, while at the doctoral level, the top five topics consistently include geophysics and engineering geology. Petrology which has consistently ranked in the top five most common theses topics, ranked fifth in the most common dissertation topic in the 1990s. Hydroge-ology which ranked in the top five dissertation topic since the 1980s, only ranked in the top five theses topics in the 1980s and 1990s. Since the 1990’s, environmental geology has ranked in the top two most common topics for both dissertations and theses, and this trend is concurrent with an increase in the percentage of geoscience federal funding applied to environmental science research at the university level during the same period.
Field camp is historically central to undergraduate geology education. There are currently 88 schools that offer summer field camps at least once every two years. This number is markedly lower than in 1995 when 257 schools offered summer field camp. There are several reasons for the decline in the number of departments offering traditional summer field camp experiences, including the rising costs of liability insurance and the changing face of geoscience departments in smaller schools that are combining with geography and environmental science programs. Also, summer field camps increase overall departmental expenses. Despite the decrease in the number of geoscience departments offering summer field camps, total attendance has increased over the past 10 years, with increases of sever-al hundred students occurring approximately every two years since 1999. The most recent jump in attendance was between 2007 and 2008, when field camp attendance increased by 278 students. In 2009, 1,979 students attended field camp.
Faculty DemographicsBetween 1999 and 2008, the numbers of Emeritus and Assistant Professors remained the same, but the number of all other faculty dropped. The percentage of geoscience faculty per rank has remained relatively steady since 2008. Currently, 58 percent of all four-year faculty are tenured, while 13 percent are untenured, but in tenure-track positions. Since 2008, the percentage of geoscience faculty positions held by women has increased by an average of two percent. In 2010, women held 16 percent of tenured and tenure-track geo-science faculty positions and 20 percent of non-tenure track geoscience faculty positions. Participation rates of women in geoscience faculty positions still lag broader science and engineering trends where women hold 28 percent of tenured and tenure-track positions in all science and engineering fields.
At a national level, the distribution of faculty specialties has remained relatively constant since 1999, despite an overall reduction in the number of faculty per specialty. However, there have been shifts in the distribution of faculty sub-discipline specialties over the same time period. The only faculty specialty category which has seen increases ince 1999 is “Other Geosciences”. These increases are primarily due to the number of faculty teaching Geographic Information Systems, and an increase in the number of faculty teaching Atmo-spheric Science and a small increase in the number of faculty teaching Glaciology.
Research FundingThe steady decline of the percentage of federal research funds applied to the geosciences that began in the mid-1990s finally stabilized at 6 percent in 2007. Although the per-centage of funding declined during this period, the absolute amount of funds applied to geoscience research at universities increased, peaking at $1.1 billion dollars in 2004 and remaining near $1 billion dollars since that time. Since 2006, oceanography has received
Report Preview and Sample

Chapter 3: Four-Year Institutions
46
the largest portion of this funding. Prior to this time, environmental science received the largest percentage of funding for geoscience university research during this decade. While funding for atmospheric science research has remained between 20 and 25 percent during this decade, funding for geological sciences has slowly increased to 20 percent over the same time period.
Between 2001 and 2008, the rate of funding for NSF grant proposals by the NSF Geosci-ence directorate decreased from 40 to 31 percent. This decrease can be attributed to an 18 percent increase in the number of proposals and a 6 percent decrease in the number of awards. With the influx of stimulus funds from the American Recovery & Reinvestment Act, funding rates increased in 2009 to 44 percent as the number of awards increased by 500 while the number of proposals remained steady from the previous year. In 2010, however, the funding rate dropped to 35 percent as the number proposals increased to approximately 4,800 while the number of awards issues tapered to approximately 1,700. Since 2001, the University of Hawaii, Columbia University, and Massachusetts Institute of Technology have consistently ranked in the top 10 of universities receiving the most funding from the NSF Geoscience Directorate across all of its divisions
As a result of the stimulus funding from the American Recovery & Reinvestment Act (ARRA), the NSF Geoscience Directorate funded 804 ARRA proposals. Thirty-six percent of these ARRA awards were given to 17 institutions, with Woods Hole Oceanographic In-stitution being awarded the most at 29 awards. The median size of the ARRA Standard Grant awards ranged from $347,988 for awards from the Atmospheric and Geospace Sci-ences division to $210,474 for awards from the Earth Sciences division. Forty-five percent of ARRA awards from the Atmospheric and Geospace Sciences division were for ICER (“In-tegrative Computing Education and Research” ), atmospheric chemistry, and physical and dynamic meterology proposals. Fifty-one percent of ARRA awards from the Earth Sciences division were for ICER (“Integrative Computing Education and Research” ), petrology and geochemistry, and geophysics proposal, and nearly a third of all ARRA proposals from the Ocean Sciences division were for chemical oceanography, marine geology and geophysics, and biological oceanography proposals.
Student SupportDirect support for geoscience students increased between 2006 and 2008, and that trend looks to continue in 2008-2009 with a projected 6 percent increase in available funds. These opportunities for student support include funds from government agencies (60 per-cent) and non-profit organizations (40 percent, which includes support from private foun-dations and companies). Graduate student support comprises 91 percent of all awards in the 2007-2008 academic year: over $2.4 million distributed among 570 individual awards. The largest student support program is the NSF Graduate Student Fellowship program. This program provided more than $1.13 million (from a total program budget of $40.5 mil-lion) in support to geoscience graduate students during 2007. In 2009, a total of 94 geosci-ence NSF graduate fellowships were awarded, up from 28 fellowships in 2008. With the large increase in the number of fellowships awarded in 2009, the total value of the NSF graduate fellowships awarded to geoscience students jumped from just over $1 million dol-lars in 2008 to $3.8 million dollars in 2009, largely with support from ARRA.
Geoscience Departments
Trends in the Status of Geoscience Departments Although geoscience departments at four-year universities can be found in every state, the states with the most departments are California, New York, Pennsylvania, Texas, and Ohio (Figure 3.1). Between 2009 and 2010, twenty-nine states (58 percent of all US
Report Preview and Sample

Chapter 3: Four-Year Institutions
50
State-level enrollment trends tend to be driven by local factors. In some cases, a strong influence in the local economy related to geosciences, such as resource companies, often supports greater enrollment levels, while in other cases, secondary education systems with upper-level earth science courses or states with a large number of institutions often sup-port a large geoscience major population. In other cases, productive departments with fac-ulty that are consistently winning federal grants allow departments to develop programs that attract and enroll graduate students. Whereas the local economy and large number of institutions may be influential at the undergraduate level, the productivity of a depart-ment may be more influential in attracting graduate students.
0
2
4
6
8
10
12
14
16
0102030405060708090
100
Num
ber o
f Fac
ulty
Num
ber o
f Stu
dent
s
Source: AGI Geoscience Workforce Program, data derived from AGI's Directory of Geoscience Departments and 2003 Report on the Status of Academic Geoscience Departments, Katz, B.J., 2003.
FacultyStudents
Figure 3.3: Median Size of Geoscience Departments Based on Number of Faculty and Number of Students
State Percentage of All Undergraduate Geoscience StudentsTexas 8.7
New York 6.7
Pennsylvania 6.6
California 5.9
Massachusetts 5.7
Colorado 5.2 Table 3.3: Percentage of All U.S. Geoscience Undergraduate Students Enrolled in 2009-2010
(Source: AGI Geoscience Workforce Program) State Percentage of All Graduate Geoscience Students
California 11.1
Texas 8.7
Colorado 5.5
Massachusetts 5.1 Table 3.4: Percentage of All U.S. Geoscience Graduate Students Enrolled in 2009-2010
(Source: AGI Geoscience Workforce Program)
Report Preview and Sample

Chapter 4: Geoscience Employment
95
Chapter 4: Geoscience Employment Sectors: Trends in Student Transitions and Workforce Dynamics
Society is currently facing many issues and challenges that require the application of geoscience knowledge and skills by professional geosci-entists in a myriad of fields and in employment sectors as varied as the energy industry to academia to telecommuni-cations. At any given point in time, the economy requires a certain portfolio of geoscience skills, and whether or not that portfolio is present not only represents a measure of the ef-fectiveness of the profession, but also is a critical predictor of relevance of the discipline. As in any free market system, when human resource capital is lacking for a given profession or discipline, substitution of tal-ent from other disciplines and or importation of human capi-tal from other countries will be used to meet the economic and societal goals.
Given the demonstrable short-age of geoscience talent in the U.S. economy over the last de-cade, the geoscience profession has experienced substantial erosion in regards to public awareness of the profession as
well as in investment in geoscience education. The measuring of the current workforce continues to be a critical part of evaluating the genuine impact of investments in the edu-cational system.
Two critical issues face the geoscience workforce, and subsequently impact both the entire geoscience discipline and the U.S. economy - the rate at which new talent is transitioned into the profession and the rapid loss of experienced talent. This chapter examines both of these issues.
The transition from formal schooling and into a profession is a critical point in an in-dividual’s life. This is also a junction that leads to substantial attrition from what are considered linear, traditional trajectories. Likewise, this transition period is not limited to the moment of decision by a new graduate as to the employment they take, but to their disposition five years following the end of their formal education. This five-year point is a traditional measure of the entry of an individual into a career - many people take their first job in a field related to their education but find personal, professional, and economic issues precipitate changes. To this end, most measures of science, engineering, and mathemat-ics fields indicate that of undergraduate degree recipients in those fields, only about 1 in 4
Report Preview and Sample

Chapter 4: Geoscience Employment
96
will cross that 5 year career threshold in their original field of study. For the geosciences, this rate has historically been approximately 1 in 8. The core of any profession will be the predictable and linear trajectory of education to career. The flux in and out of that system adds substantial depth to the economy, but if the flux is decidedly negative, as it appears to have been in the geosciences, skill shortages and potential economic substitution become measurable risks.
Perceptions of career opportunities and their pathways influence students’ career choice and their major. This is reinforced by the alignment of job search activity and geoscience graduate student perceptions of employment sectors. In an AGI/AGU survey of new gradu-ate students, 81 percent of new geoscience doctorate recipients reported that they searched for jobs in academia, 45 percent in the government, and 31 percent in the private sector. Sixty-seven percent of recent geoscience graduates found jobs in academia, 18 percent in government, and 10 percent in private industry. Geoscience Master’s graduates were less selective in their job search efforts: 58 percent searched for jobs in academia, 55 percent in the government, and 35 percent in the private sector. However, only 24 percent of geo-science Master’s graduates found work in academia, 22 percent in the government, and 50 percent in private industry (21% oil & gas industry, 20% environmental industry, 9% other industry). Since 2006, data from NSF’s Survey of Earned Doctorates indicates a con-tinued increasing percentage of geoscience doctorates moving into postdoctoral positions. For those new geoscience doctorates finding employment in non-postdoctoral positions, between 2007 and 2008, there was a substantial increase in those finding employment in industry and a decrease in the percentage of those finding employment in government and academia.
With approximately 1,500 geoscience graduate degree recipients transitioning into the professional workplace each year, the supply of newly trained geoscientists falls short of geoscience workforce demand and replacement needs. According to the U.S. Bureau of Labor Statistics there were a total of 262,627 U.S. geoscientist jobs in 2008, and in 2018, the projected number of U.S. geoscientist jobs will be 322,683, a 23 percent increase. The increase in job growth will vary among industry with the professional, scientific, and technical services industry having the highest geoscience job growth (50 percent). These projections do not include replacements due to attrition. Given the age demographics of the geoscience discipline, we expect a 12 percent replacement rate for attrition. With this adjustment, aggregate job projections are expected to increase by 35 percent between 2008 and 2018.
Data from NSF’s 2006 SESTAT database indicates that 35 percent of geoscience graduates at all degree levels work in core geoscience occupations. This percentage increases with de-gree level from 30 percent at the Bachelor’s degree level to 68 percent at the doctoral level. Although the majority of geoscience Bachelor’s and Master’s geoscience degree holders work outside of core geoscience occupations, the majority of these graduates work within science and engineering fields. The low percentage of geoscience Bachelor’s degree holders working in core geoscience occupations is likely due to the low number of geoscience jobs available to undergraduate degree holders. Additionally, at the Master’s degree level, the low percentage of geoscience graduates working in core geoscience occupations may be due to the variety of sectors in which graduates search for work and the applicability of a geoscience degree in a variety of occupations.
The majority of geoscientists in the workforce are within 15 years of retirement age. Data from federal sources, professional societies, and industry confirm an imbalance in the age demographic of geoscientists. The percentage of geoscientists between 31 and 35 years of age is less than half of geoscientists between 51 and 55 years old. All geoscientist oc-cupations in the government, with the exception of meteorologists and oceanographers, experienced an age shift towards the 50 to 54 year old age group between 2003 and 2007. Between 2007 and 2009, a marked shift in age distribution from the 50 to 54 year old age
Report Preview and Sample

Chapter 4: Geoscience Employment
97
group to the 55 to 59 year old age group occurred, and a concurrent slight increase in the percentage of geoscientists under the age of 35 in most government geoscience occupations.
Even in oil and gas companies, which typically offer the highest salaries of all geoscience employing industries, the supply of new geoscientists is short of replacement needs. The number of younger geoscientists in their early 30’s is approximately half the number of those nearing retirement age. This number is greater than the data reported from fed-eral agencies and professional societies. Additionally, the supply of geoscientists is not expected to meet the demand for geoscientists over the next 20 years. By 2030, the unmet demand for geoscientists in the petroleum industry will be approximately 13,000 workers for the conservative demand industry estimate.
Support activities for mining and oil and gas is the only geoscience employing industry where the demographics provide for the replacement of the older generation of geoscien-tists who will retire within the next 15 years.
In academia, like other geoscience sectors, those with full professorships are older (late 50’s to mid 70’s), and there are 30 percent fewer assistant and associate faculty than full professors. Between 2008 and 2010, the number of full professor faculty declined slightly as the number of emeritus faculty increased indicating the retirement of more full profes-sors. Given the current age demographics of geoscience academic faculty, we expect this trend to continue for the next 10 to 15 years. In addition to the decline in full professor-ships between 2008 and 2010, there was an overall increase in the number of assistant professors, especially between the ages of 35 and 40. Yet, at the associate professor rank, the number of faculty remained steady over the same time period.
The Transition from Student to Professional
Faculty and Student Attitudes about Career PathwaysStudent perceptions of career opportunities influence how and where they conduct their job searches. Peers, parents, and mentors, including academic advisors shape students’ perceptions of careers and the means to enter that career. Ultimately, these perceptions and the actions based upon them are reflected in the geoscience workforce.
The American Geological Institute conducted a survey from March to April 2006 of 1,358 students and 558 advisors from 262 schools with geoscience departments in order to docu-ment the attitudes of students and academic advisors of the professional pathways for geoscientists. Academic advisors tended to have more positive attitudes than graduate and undergraduate students about most career pathways, especially the environmental industry, petroleum industry, academia, and K-12 education (Figures 4.1-4.4 and Tables 4.1-4.3). However, when the data is analyzed by degree and career experience, it is appar-ent that doctoral students and graduates had a more positive opinion about academia than their advisors.
Report Preview and Sample

Chapter 4: Geoscience Employment
109
Salary growth between 1999 and 2009 for environmental scientists, environmental en-gineers, hydrologists, and mining and geological engineers lagged the national average salary growth for other science occupations. However, mean annual salaries for the major-ity of geoscience occupations increased more than the national average for other science occupations between 2008 and 2009.
$40,000
$50,000
$60,000
$70,000
$80,000
$90,000
$100,000
$110,000
$120,000
$130,000M
ean
Ann
ual S
alar
y (U
SD
)
(1999-2009)
Engineering Managers
Petroleum Engineers
Natural Science Managers
Environmental Engineers
Atmospheric and Space Scientists
Geoscientists
Mining and Geological Engineers
Hydrologists
All Life, Physical, and Social Scientists
Environmental Scientists
Geographers
Source: AGI Gesocience Workforce Program, data derived from the U.S. Bureau of Labor Statistics, National Occupational Employment and Wage Estimates, 1999-2009
Figure 4.16: Mean Annual Salaries of Geoscience Occupations (1999-2009)
Demographics of the Geoscience ProfessionThe percentage of women in the U.S. workforce has remained near 47 percent since 1995, and although women earn nearly 40 percent of all geoscience degrees, the percentage of women in geoscience and environmental science occupations has remained near 30 percent since 2003 (Figure 4.17). In 2006, the representation of women in geoscience occupations lagged other science disciplines, but was higher than engineering disciplines (Figure 4.18). Examination of gender parity in detailed geoscience occupational categories reveals that women have the highest participation rates in oceanography (28 percent) and the lowest in mining and geological engineering (2%) (Figure 4.19).
Report Preview and Sample

Chapter 5: Geoscience Economic Metrics
131
Chapter 5: Geoscience Metrics and Drivers of the Geoscience WorkforceThe fundamental driver of em-ployment in science and technol-ogy fields is investment in re-search and development (R&D) from public and/or private sourc-es. The fortunes of the workforce respond rapidly to changes in R&D investment, but the work-force supply pipeline responds more slowly to these changes, and often rapid changes in invest-ment are echoed in enrollments and degrees awarded years later.
Although the total amount of federal research funding for geoscience research increased steadily between 1970 and 2004, over the past several years there has been a steady decline in the total amount of federal fund-ing invested in the geosciences. Furthermore, the percentage of all federal funding for research and development applied to the geosciences has decreased from nearly 11 percent in 1996 to 6 percent in 2007. Since 1970, the majority of total federal geosci-ence research funding has been applied to atmospheric science research. Of note is the increase in the percentage of funding ap-plied to environmental science research since 1986. Of addition-al interest are the drops in funding for oceanographic research (1989 to 1995) and geologi-cal science research (1995 to 1998) and the less drastic drop in atmospheric research (1995 to 2003) that are most evident in the basic research funding trends.
Information pertaining to industry research funding of geoscience is limited. Data pertain-ing to the trends in company research and development funds are available from the NSF / SRS Industry R&D Funding reports for the mining, extraction & support industries. Unfortunately, this data is aggregated so distinct trends for these three industries cannot be investigated. Of note is the abrupt switch from development to research funding that occurred between 2001 and 2002. This trend is also coincident with the drop in commod-ity output, gross operating surplus, and taxes on production and imports for the oil & gas extraction industry, productive activity (rig counts, a reduction in GDP for all three indus-tries), and a decrease in rig counts and well counts.
A number of geoscience industries are responsible for producing important commodities that keep our society running, such as oil, gas and minerals. In general, commodity price indices follow the energy (fuel) price index. However, with the recent economic shocks, it is interesting to note the independence of some price indices from energy price index. Several
Report Preview and Sample
Chapter 5: Geoscience Economic Metrics
132
metal price indices peaked prior to the energy price peak (e.g. nickel, zinc, lead, nickel and uranium). Of these metal indices, the uranium price index, which peaked one year prior to the oil price crash, took nearly a year and a half longer than the energy index to begin to recover. For grain commodities, it is also interesting to note that wheat prices started to decline in early 2008, about five months prior to the drop in the energy price index. Natu-ral gas prices, although similar in the overall trend to oil prices, have much more vari-ability when compared to oil prices. Natural gas prices have two peaks that occur prior to the large spike in prices at the end of 2008: 1) in late 2000 / early 2001 and 2) in late 2005. The 2000-2001 price spike was primarily due several factors, including increased demand as a result of a colder than average winter, low natural gas stocks, and well head and spot prices that were twice as high as the previous year. The price spike in 2005 was a result of the hurricane season in the Gulf of Mexico (including Hurricanes Katrina and Rita) when approximately four percent of U.S. production shut down. According to the U.S. Energy Information Administration, between 2007 and 2009, U.S. shale gas proved reserves and production nearly tripled. Proved reserves increased from 23,304 Bcf to 60,644 Bcf and production increased from 1,293 Bcf to 3,110 Bcf. Increases in reserves and production in conjunction with the sharp drop in oil prices helped to drive natural gas prices to levels not seen since the early 2000’s. In order to adapt, companies had to shift their focus to the development of shale gas locations that also yielded natural gas liquids and condensates as well as crude oil (e.g. Marcellus Shale and Eagle Ford Shale). The higher prices of these non-shale gas fuels offset the economic impacts of the natural gas prices and thus make the development of these sites more economically feasible. Natural gas prices remain low primarily due to the high production levels and reserve increases of the various domestic shale gas plays. Additionally, demand remained low in 2010 due to a warmer than usual winter and lingering effects of the recent recession.
Total domestic commodity output data for the oil, gas, and mining sectors from 2002 through 2008 indicate a steady increase for all industries followed by a sharp decline in 2009 following the drop in oil prices as a result in depressed demand from the economic cri-sis in 2008-09. The oil & gas extraction and support activities industries also show a drop in commodity output during the prior recession of 2001. Of note is the leveling of output for oil & gas extraction between 2005 and 2006 and the increase in output in the support activities for mining and oil & gas industry. Mining (except oil & gas) output is relatively steady until 2003 when it begins to increase steadily until 2008 largely driven by increased global demand from rapid economic growth in China and India.
Profit margins for major and independent energy companies increased steadily between 2002 and 2007. In the second quarter of 2007, profit margins began a slow decline which ended in the third quarter of 2008 with a spike in profit margins reflecting the oil price spike and increase in rig activity that was then followed by a precipitous decline that bottomed out in the first quarter of 2009 reflecting major losses for producers due to the declines in both oil and natural gas prices and a decrease in drilling activity. Recovery may have been faster for independent energy companies as these are more heavily invested in shale gas plays than are majors. The focus-shift from shale-gas only plays to locations where shale gas, natural gas liquids, condensates and crude oil occur enabled independent companies to offset the low natural gas prices. Major energy companies were able to re-cover through the increase in oil prices and in increase world-wide production which offset domestic production.
The geoscience component of industry gross domestic product (GDP) represents the best first-order economic contribution of geoscientists to the U.S. economy. The geoscience com-ponent of industry GDP more than doubled between 2002 and 2006, and subsequently contracted slightly in 2008. Total geoscience GDP in 2002 was $27.27 billion, $58.93 billion in 2006, and $57.44 billion in 2008, largely driven by increases in commodity prices boost-ing the value of all components of the extraction industries. Additionally, the geoscience component of national GDP, which increased from 0.26 percent in 2002 to 0.44 percent in 2006 declined slightly to 0.40 percent in 2008. Total geoscience industry GDP is projected
Report Preview and Sample

Chapter 5: Geoscience Economic Metrics
133
to increase to $73.2 billion by 2018 with all industries seeing increases in their GDP contri-bution. However, the geoscience component of national GDP is expected to shrink to 0.37 percent by 2018 as total industry GDP grows faster than geoscience industry GDP.
Productive activity in geoscience industries increased steadily over the past decade despite the sharp drop in 2009. Fifty-three percent of the world’s drilling rigs are in the U.S., and even at the lowest level of productive activity in 2009, the U.S. still accounted for 45 per-cent of all drilling rigs in the world. Of all the world regions, Africa did not experience a drop in the number of drilling rigs during the 2008-09 crisis. The majority of the increase in U.S. drilling rigs can be attributed to the increase in onshore (land) and natural gas rigs, and these rigs were impacted the hardest by the 2009 crisis.
Unlike the oil & gas industry, the mining industry has not seen the same amount of pro-ductivity growth. The total growth in this industry was due solely to the increase of 2,500 U.S. sand, gravel, and stone mines between 2001 and 2002. Since 2002, the number of sand, grave, and stone mines have decreased by 1,800. The number of U.S. mineral ore and industrial mineral mines (excluding sand, gravel, and stone mines) slowly decreased between 1997 and 2002. Between 2002 and 2008, the number of metal ore mines remained relatively steady, while the number of industrial mineral mines (excluding sand, gravel, and stone mines) increased by 48.
Sand, gravel, and stone mines increased the amount of material handled between 1994 and 2006 by 1,018 million metric tons. Despite the decrease in the number of industrial mineral and metal ore mines, industrial mineral mines increased the amount of material handled by 810 million metric tons and metal ore mines reduced the material handled by 546 million metric tons between 1994 and 2006. Since 2006, metal ore mines have in-creased the material they handle by 290 million metric tons, while sand, gravel and stone mines have decrease the amount of material handled by 581 million metric tons. Industrial mineral mines only slightly increased the amount of material handled between 2006 and 2008 by 11 million metric tons.
The value of non-fuel mineral production in the U.S. is primarily driven by industrial minerals (including sand, gravel, and stone). Between 2003 and 2006, there was a steady increase in U.S. non-fuel mineral production for both metals and industrial minerals. After 2006, non-fuel production continued to increase for metal ores and industrial minerals (ex-cluding sand, gravel, and stone), and slightly declined for sand, gravel and stone minerals.
Market capitalization of geoscience industries was calculated based on AGI’s geoscience stock index which is comprised of a set of 199 companies from the following industries: Ce-ment & Aggregates, Coal, Environmental, Metals & Mining, Oilfield Services, Oil & Gas (both Integrated and Producing), Precious Metals, Utilities (primarily water). In February 2011, the market capitalization of these companies totaled $2.3 trillion. By far, integrated oil & gas companies contribute the most (approximately $1 trillion) to the total current market capitalization of geoscience industries, followed by oil & gas producers ($442 bil-lion). Water utilities and precious metal companies contribute the least to the total market capitalization at nearly $8 billion. Since June 2010, market capitalization has steadily grown by $588 billion.
Federal Research Funding of Geoscience ResearchFederal research funds are allocated to federal agency programs, industrial firms, univer-sities and colleges, non-profit institutions, and federally-funded research and development centers. Therefore it is not surprising that trends in total research funding and research funding applied to universities vary from the aggregate trends (see Chapter 2 for college and university geoscience funding trends).
Report Preview and Sample

Chapter 5: Geoscience Economic Metrics
134
Although the total amount of federal research funding for geoscience research increased steadily between 1970 and 2004, over the past several years there has been a steady de-cline in the total amount of federal funding invested in the geosciences. Furthermore, the percentage of all federal funding for research and development applied to the geosciences has decreased from nearly 11 percent in 1996 to 6 percent in 2007. Since 1970, the major-ity of total federal geoscience research funding has been applied to atmospheric science research. Of note is the increase in the percentage of funding applied to environmental sci-ence research since 1986. Of additional interest are the drops in funding for oceanographic research (1989 to 1995) and geological science research (1995 to 1998) and the less drastic drop in atmospheric research (1995 to 2003) that are most evident in the basic research funding trends.
0%
2%
4%
6%
8%
10%
12%
14%
Per
cent
of F
eder
al R
esea
rch
Fund
ing
Applied ResearchBasic ResearchAll Geosciences
Source:AGI Geoscience Workforce Program, data derived from NSF/SRS Survey of Federal Funds for Research & Development
Figure 5.1: Percentage of Federal Research Funding Applied to the Geosciences
$0.0
$0.5
$1.0
$1.5
$2.0
$2.5
$3.0
$3.5
$4.0
0%
10%
20%
30%
40%
50%
60%B
illion
s ($
US
D)
Per
cent
of G
eosc
ienc
e Fu
ndin
g
Geoscience Research Funding ($USD) Atmospheric science (%)Geological science (%) Oceanography (%)Environmental science (%)
Source: AGI Geoscience Workforce Program, data derived from NSF/SRS Survey of Federal Funds for Research & Development
Figure 5.2: Total Federal Research Funding of the Geosciences
Report Preview and Sample

Appendix A: Defining the Geosciences
159
Appendix A: Defining the GeosciencesGiven its complexity, the geoscience occupation is difficult to define under existing no-menclature. This is the result of varied educational pathways geoscientists pursue and because of the different industries in which geoscientists work. Additionally, each federal data source (U.S. Bureau of Labor Statistics, U.S. Census Bureau, National Center for Education Statistics, National Science Foundation, U.S. Bureau of Economic Analysis, Of-fice of Personnel Management), professional society, and industry classifies geoscientists differently depending on the intent of the data collection (national occupation trends, sci-ence & engineering trends, education vs. occupation, internal classification codes, etc.), the characteristics of the population surveyed, and the focus of the organization.
U.S. federal policy and funding is partially determined by the economic activity and em-ployment trends of a given profession. Accurate measurement and analysis of the geosci-ence profession are central to successful decisions that support a robust geoscience profes-sion in the U.S.
Unfortunately, the geosciences are not consistently defined across the myriad of data sources collected and used by the federal government and professional societies. In many cases the issues of definition are related to splitting of disciplines, in some cases they are archaic artifacts of early labor policy, and in other, represent a lack of domain knowledge in the agencies setting the definitions. Thought many federal agencies are attempting to improve their classification approach, the current diversity of definitions will continue for the foreseeable future. Unfortunately, the public statistics from this data are used by counselors and individuals seeking career options, and the current state of geosci-ence workforce data usually severely under-represents the size of the profession and the breadth of opportunities.
To address this issue, AGI has established a working definition for the geoscience profes-sion in order to improve comparability of data across sources and time periods. Now that the national census is a rolling monthly survey, the Standard Occupational Classification (SOC) codes will now be updated every 5 to 10 years. This is an opportunity for AGI and its partners to edit the SOC codes so that they capture the depth and breadth of the geosci-ence profession, clearly define it, and estimate employment over at least 5 years. This data can then be included in a proposal to federal data agencies to more accurately represent the occupation.
Many federal data sources use the Classification of Instructional Programs (CIP) codes to classify educational programs, the Standard Occupational Classification (SOC) codes to classify occupations, and the North American Industry Classification System (NAICS) to classify industries. In this appendix we report how each data source defines a geoscientist. The CIP codes are managed by the U.S. Department of Education’s National Center for Education Statistics. The SOC codes were developed by the U.S. Office of Management and Budget and are managed by the Standard Occupational Classification Revision Policy Committee. This committee consists of representatives from the U.S. Bureau of Labor Statistics, the U.S. Bureau of Census, The U.S. Department of Labor (Employment and Training Administration), the Office of Personnel Management, The Defense Manpower Data Center, the National Science Foundation, the National Occupational Information Coordinating Committee, and the Office of Management and Budget. The NAICS was de-veloped under the guidance of the Office of Management and Budget by the U.S. Economic Classification Policy Committee, Statistics Canada, and Mexico’s Instituto Nacional de Estadistica, Geografia e Informatica in order to allow for economic comparisons between North American countries.
Report Preview and Sample