report: research to inform improved ... -...
TRANSCRIPT


(this page is intentionally left blank)

Recycling at Work
i
Table of Contents
Table of Figures ............................................................................................................................. iii Table of Tables ............................................................................................................................... v
Acknowledgements ........................................................................................................................ vi Executive Summary ........................................................................................................................ 1
Background ................................................................................................................................. 1
Project Overview ........................................................................................................................ 3
Results ......................................................................................................................................... 5
Introduction ..................................................................................................................................... 9
Background ................................................................................................................................. 9
Literature Review ..................................................................................................................... 11
Project Goal .............................................................................................................................. 12
Methodology ................................................................................................................................. 13
Project Design ........................................................................................................................... 13
Participants ................................................................................................................................ 13
Bin Placement Conditions ........................................................................................................ 14
Ten Items of Interest ................................................................................................................. 15
Messages ................................................................................................................................... 16
Data Collection ......................................................................................................................... 17
Measures ................................................................................................................................... 19
Results ........................................................................................................................................... 21
Employee Web Survey ............................................................................................................. 21
Recycling and Trash Waste Audit Data .................................................................................... 40
Daily Recycling and Trash Volume .......................................................................................... 57
Conclusions ................................................................................................................................... 60
Equal-size .................................................................................................................................. 60
Recycling Only ......................................................................................................................... 61
Little Trash ................................................................................................................................ 62
Information Only ...................................................................................................................... 62
Conditions—Evaluation ............................................................................................................ 62
Priority Targets for Later Programs .......................................................................................... 63
Spillover .................................................................................................................................... 64
Beverages and Refund .............................................................................................................. 64
Volume ...................................................................................................................................... 64
Challenges and Recommendations ............................................................................................... 65

Recommendations for Office Buildings ................................................................................... 65
Recommendations for Future Researchers ............................................................................... 72
Next Steps: Future Research Questions ........................................................................................ 75
Reference List ............................................................................................................................... 76
Appendices .................................................................................................................................... 77
Appendix A-Recruitment and Project Design Elements .......................................................... 77
Appendix B-Employee Web Survey Documents ..................................................................... 96
Appendix C-Waste Audit Documents .................................................................................... 112
Appendix D-Daily Recycling and Trash Volume Documents ............................................... 116

Recycling at Work
iii
Table of Figures Figure 1. Total Waste Stream in a Typical Office Building by Type ........................................................... 2
Figure 2. Total Waste Stream in a Typical Office Building by Type ......................................................... 10
Figure 3. Research Design and Data Collection Process ............................................................................ 13
Figure 4. Employee Web Survey Process ................................................................................................... 17
Figure 5. General Office Knowledge by Condition from Pre to Post for the Matched Sample .................. 24
Figure 6. Total Specific Office Items Knowledge from Pre to Post for Matched Sample .......................... 25
Figure 7. Total Specific Office Recyclable Items Knowledge from Pre to Post for Matched Sample ....... 26
Figure 8. General Office Recycling Behavior from Pre to Post for Matched Sample ................................ 27
Figure 9. Total Office Specific Item Behavior from Pre to Post for Matched Sample ............................... 28
Figure 10. Total Office Specific Recyclable Items Behavior from Pre to Post for Matched Sample ......... 29
Figure 11. General Difficulty Recycling in the Office for the Matched Sample ........................................ 30
Figure 12. Average Office Specific Recyclable Items Recycling Difficulty from Pre to Post for Matched Sample ........................................................................................................................................................ 31
Figure 13. General Office Recycling Importance from Pre to Post for Matched Sample .......................... 32
Figure 14. Office Specific Recyclable Items Recycling Importance from Pre to Post for the Matched Sample ........................................................................................................................................................ 33
Figure 15. Reported General Home Recycling Knowledge from Pre to Post for the Matched Sample ..... 34
Figure 16. Reported General Public Recycling Behavior from Pre to Post for the Matched Sample ........ 35
Figure 17. Reported General Importance of Recycling in Public Places from Pre to Post for Matched Sample ........................................................................................................................................................ 36
Figure 18. Percentage of Offices with Office Paper by Bin Type over Time ............................................. 41
Figure 19. Percentage of Offices with Plastic Beverage Bottles by Bin Type over Time .......................... 41
Figure 20. Percentage of Offices with Aluminum Beverage Cans by Bin Type over Time ....................... 42
Figure 21. Percentage of Offices with Frozen Dinner Boxes by Bin Type over Time ............................... 42
Figure 22. Percentage of Offices with Soup Cans by Bin Type over Time ................................................ 43
Figure 23. Percentage of Offices with Food Scraps by Bin Type over Time ............................................. 43
Figure 24. Percentage of Offices with Bubble Wrap by Bin Type over Time ............................................ 44
Figure 25. Percentage of Offices with Plastic Eating Utensils by Bin Type over Time ............................. 44
Figure 26. Percentage of Offices with Used Paper Plates by Bin Type over Time .................................... 45
Figure 27. Percentage of Offices with Paper Towels by Bin Type over Time ........................................... 45
Figure 28. Average Total Recycling Weight per Office by Condition over Time ...................................... 47
Figure 29. Average Total Trash Weight per Office by Condition over Time ............................................. 48
Figure 30. Percentage of Recyclables in Recycling over Time .................................................................. 49
Figure 31. Percentage of Recyclables in Trash over Time ......................................................................... 50
Figure 32. Average Office Paper Weight in Recycling over Time ............................................................. 51
Figure 33. Average Office Paper Weight in Trash over Time .................................................................... 52
Figure 34. Average Count of Plastic Beverage Bottles in Recycling over Time ........................................ 53
Figure 35. Average Count of Plastic Beverage Bottles in Trash over Time ............................................... 54
Figure 36. Average Count of Aluminum Beverage Cans in Recycling over Time .................................... 55
Figure 37. Average Aluminum Beverage Can Count in Trash over Time ................................................. 56
Figure 38. Volume of Recycling and Trash by Week for All Conditions .................................................. 57
Figure 39. Volume of Recycling and Trash by Week for the Equal-size Condition .................................. 58
Figure 40. Volume of Recycling and Trash by Week for the Recycling Only Condition .......................... 58

Figure 41. Volume of Recycling and Trash by Week for the Little Trash Condition ................................ 59
Figure 42. Volume of Recycling and Trash by Week for the Information Only Condition ....................... 59

Recycling at Work
v
Table of Tables Table 1. Number of Offices in Each Condition within City ....................................................................... 15
Table 2. List of the Ten Items of Interest .................................................................................................... 15
Table 3. Respondent Age ............................................................................................................................ 21
Table 4. Respondent Gender ....................................................................................................................... 22
Table 5. Respondent Years Worked ........................................................................................................... 22
Table 6. Number of Matched Employee Surveys by Condition ................................................................. 23
Table 7. Number of Matched Employee Surveys by City .......................................................................... 23
Table 8. Number of Beverages Consumed in a Typical Day ...................................................................... 38
Table 9. Correct Knowledge of Beverage Container Refunds by State ...................................................... 39
Table 10. Recyclable and Trash Materials Found in the Wrong Bin .......................................................... 46

Acknowledgements
This project was a collaborative effort between PepsiCo, Keep America Beautiful, Action Research, and CBRE. The following individuals and organizations were integral to the success of this project.
PepsiCo: Keep America Beautiful:
Wenny Ng, R&D Associate Principal Engineer Ed Socci, R&D Director Christian Stolarz, Design Senior Manager Meagan Smith, Supply Chain Engineering Director Jie Yan, R&D Principal Scientist Shalini Vijayarajan, R&D Packaging Engineer Chris Weber, Supply Chain Engineering Director Tim Carey, Supply Chain Engineering Senior Director
Brenda Pulley, Senior Vice President, Recycling Alec Cooley, Director, Recycling Steve Navedo, Vice President, Development
Action Research
(Study and Protocol Design, Data Collection,
Analyses, Reporting)
CBRE
(Provided Participating Office Buildings)
P. Wesley Schultz, Scientific Advisor Lori Large, Director of Research Operations Kaitlin Phelps, Project Manager Joey Schmitt, Project Manager Dani Ballard, Research Associate
Lisa Colicchio, Director of Operations, Sustainability Atlanta CBRE:
Megan Martin, Assistant Real Estate Manager Mark Morgan, Head of Cleaning Crew Boston CBRE:
Kristen O’Brien, Tenant Coordinator Manny Coleta, Head of Cleaning Crew Houston CBRE:
Leslie Kendall, Real Estate Services Coordinator Sonia Fuentes, Head of Cleaning Crew San Diego CBRE:
Ryan Peterson, (former) Senior Real Estate Manager Travis Gorzeman, (former) Senior Real Estate Manager Juan de la Rosa, Head of Cleaning Crew Carlos Hernandez, Head of Cleaning Crew

Recycling at Work
vii
Great Forest
(Waste Audit Data Collection)
Amy Marpman, Chief Operating Officer Christine McCoy, Sustainability Consultant
Atlanta:
Lindy Lucas Hannah Rigdon
Boston:
Joel Dashnaw Alex Davis
Houston:
Brian R. Shmaefsky Sarah Kim
San Diego:
Steven Cauchon Kim Impreso
Our thanks and gratitude to our partner, Great Forest, a leading sustainability consultancy group that develops, implements, and maintains strategies and programs that reduce both environmental impact and costs for corporations and institutions across the United States.


Recycling at Work
1
Executive Summary
Background
Recycling currently adds significant value to the nation’s economy as a whole, and there are numerous opportunities to add still more economic and environmental value by increasing the quantity and quality of material collected. This report addresses office buildings, in which there is great opportunity to unify and improve on recycling infrastructure. Given the hard work of recycling advocates, national recycling rates have increased to 34% for municipal waste. Recycling has produced substantial benefits already, and by increasing or improving recycling opportunities in sectors where it is under- or inefficiently utilized would produce still further benefits. For example:
At the current annual national recycling rate in the U.S., o Carbon dioxide equivalent emissions are reduced by more than 168 million metric tons,
which is comparable to the annual emissions from over 33 million passenger vehicles. o Recycling and composting almost 87 million tons of MSW saves more than 1.1
quadrillion Btu of energy, which is equivalent to the energy consumed by almost 10 million U.S. households in a year.
Increased recycling could help save the estimated $11.4 billion worth of packaging that is currently being discarded.1
Recycling reduces the need for landfills by extending the life of current landfills, saving money for municipalities, businesses, and consumers. In 2013, 14 states calculated total savings of over $2 billion in landfill cost avoided by diverting waste to recycling.
Recycled PET plastic saves 84% of the energy needed for production when used instead of virgin plastic material, but in 2012 only 31% of plastic bottles were recycled.
Recycling 1 ton of aluminum cans conserves more than 153 million Btu, the equivalent of 26 barrels of oil or 1,665 gallons of gasoline, but only 67% of aluminum cans were recycled in 2013.
Recycled paper takes 40% less energy to produce, but in 2010 only 68% of paper was recycled. Recycling supports more than 450,000 jobs with over $87 billion in revenues.2
o A study found that in ME, MA, NY, PA, and DE, there were 11,378 recycling and reuse establishments, employing 104,885 people with an annual payroll of nearly $4.2 billion.3
o In the Southeast, over 200 manufacturing facilities rely on recycled materials, supporting more than 47,525 employees and garnering sales of more than $29.4 billion.4
1 As You Sow, (2012) “Unfinished Business: The Case for Extended Producer Responsibility for Post-Consumer Packaging.” Retrieved from: http://www.asyousow.org/ays_report/unfinished-business-the-case-for-extended-producer-responsibility-for-post-consumer-packaging/ 2 Institute of Scrap Recycling Industries, Inc. (2013) “Economic Impact Study: U.S.-Based Scrap Recycling Industry.” Retrieved from: http://www.isri.org/recycling-industry/jobs-in-the-u-s-scrap-recycling-industry/job-study-analysis 3 DSM Environmental, (2009) “Recycling Economic Information Study Update: Delaware, Maine, Massachusetts, New York, and Pennsylvania,” Northeast Recycling Council. Retrieved from: https://nerc.org/documents/recycling_economic_information_study_update_2009.pdf 4 Southeast Recycling Development Council, (2010)“Factsheet: Understanding Local Recycling Markets” Retrieved from: http://www.serdc.org/Resources/Documents/SERDC%20Recycling%20Markets%20Factsheet.pdf

Benefits for Recycling in the Workplace
For property managers, the benefits of recycling include reduced waste collection and disposal costs and improved tenant satisfaction. Optimizing recycling at the average office building property, depending on local recycling markets, has the potential to save 20-50% on monthly waste disposal fees. Additionally, properties that implement strong recycling programs find that doing so helps market the property to potential tenants. Unlike other green building initiatives, such as energy and water conservation, recycling is inherently visible and participatory, making it an important service to tenants seeking office space, many of whom are increasingly environmentally aware. Additionally, recycling programs are a component of LEED certification, which has numerous other advantages for a building (see Resources in Recommendations for more information.
While there is currently little public data available about how much is recycled in the workplace setting, the size of office buildings and their contributions to municipal waste suggest there could be significant opportunities to increase recycling in the workplace. The results of the 2012 Commercial Building Energy Consumption Survey show that there are at least 5.6 million commercial office buildings in the U.S. with over 87.4 billion square feet of floor space. Moreover, according to the U.S. Environmental Protection Agency, up to 45% of municipal waste is generated in the workplace, and, as noted in Figure 1, the majority of a typical office building’s waste stream can be recycled. Improving workplace recycling infrastructure will ensure that a greater proportion of recyclable office items are diverted from landfill, with substantial benefits to the environment, the economy, and the office buildings themselves.
Figure 1. Total Waste Stream in a Typical Office Building by Type5
As consumers increasingly recognize the importance of recycling for saving resources and energy, more companies are seeking to incorporate recycled materials into their products. Unfortunately, the supply of these recycled materials is limited due to the amount of recycling that is collected. Although recent U.S. recycling rates have been increasing, particularly for cans and bottles, there is still room for improvement. There have been a number of studies conducted regarding fostering consumer recycling behavior and improving recycling programs. Most of this research, however, has been conducted on household recycling rather than workplace recycling. The office environment has unique challenges and benefits to
5 Great Forest average waste audit results (www.greatforest.com)
Mixed Paper37%
Trash35%
Cardboard18%
Plastics7%
Glass2%
Metals1%
Recycling at Work
3
recycling that need to be taken into consideration when designing a workplace recycling program. In order to have a more comprehensive overview of a person’s day-to-day access to recycling, it is important to understand their recycling behaviors, motivators, and barriers while at work.
Project Overview
The goal of the Recycling at Work project was to determine if bin set-up in the office made a significant difference in the quality of recycling collected, and if so, which bin set-up was ideal in terms of increasing correct recycling behavior. To achieve this goal participating offices were recruited from CBRE office buildings with single stream recycling in four cities (Atlanta, Boston, Houston, and San Diego). Their existing recycling and trash bin set-up was replaced with one of the three new bin set-ups and all offices were provided with recycling information. The control group was only provided with recycling information. To assess the impact of the new set-up the team used a combination of surveys, waste audits, and volume assessments. As there is currently little research on recycling in an office environment, a secondary goal was to better quantify the composition of recycling and trash found in an office setting.
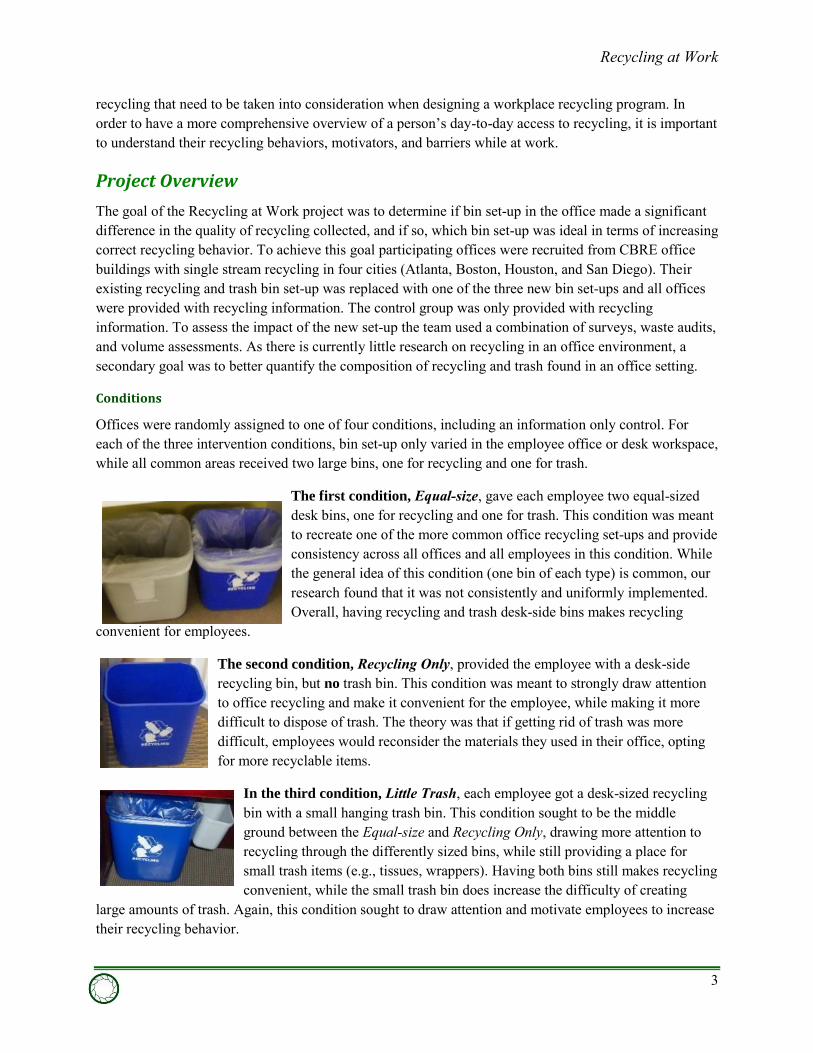
Conditions
Offices were randomly assigned to one of four conditions, including an information only control. For each of the three intervention conditions, bin set-up only varied in the employee office or desk workspace, while all common areas received two large bins, one for recycling and one for trash.
The first condition, Equal-size, gave each employee two equal-sized desk bins, one for recycling and one for trash. This condition was meant to recreate one of the more common office recycling set-ups and provide consistency across all offices and all employees in this condition. While the general idea of this condition (one bin of each type) is common, our research found that it was not consistently and uniformly implemented. Overall, having recycling and trash desk-side bins makes recycling
convenient for employees.
The second condition, Recycling Only, provided the employee with a desk-side recycling bin, but no trash bin. This condition was meant to strongly draw attention to office recycling and make it convenient for the employee, while making it more difficult to dispose of trash. The theory was that if getting rid of trash was more difficult, employees would reconsider the materials they used in their office, opting for more recyclable items.
In the third condition, Little Trash, each employee got a desk-sized recycling bin with a small hanging trash bin. This condition sought to be the middle ground between the Equal-size and Recycling Only, drawing more attention to recycling through the differently sized bins, while still providing a place for small trash items (e.g., tissues, wrappers). Having both bins still makes recycling convenient, while the small trash bin does increase the difficulty of creating
large amounts of trash. Again, this condition sought to draw attention and motivate employees to increase their recycling behavior.

All conditions received an informational flyer on ten items the research team believed were commonly found in an office; five recyclable items (office paper, aluminum beverage cans, plastic beverage bottles, frozen dinner boxes, and soup cans) and five trash items (paper towels, food scraps, plastic eating utensils, used paper plates, and bubble wrap). The recycling bins were stamped with a logo created for the Recycle at Work project. The logo graphically displayed three common recyclable items, an aluminum can, a plastic beverage bottle, and office paper imbedded in chasing arrows. The desk side recycling bins only displayed the logo. On the common-area recycling bin, the logo included the words, Keep America Beautiful and PepsiCo Recycling. The trash bins were also stamped with a logo created for the project. The logo depicted an old-style metal trash can and was marked with the word, landfill.
Measures
The quality of the recycling project was measured using an employee survey (pre- and post-project), monthly waste audits, and daily volume assessments.
Survey
The surveys measured knowledge, behavior, attitude, and perceived difficulty surrounding office recycling. A section that assessed recycling at home and in public helped to identify and evaluate any spillover of new recycling behaviors into additional settings as a result of participation in the project. The surveys also assessed demographics, participant ratings of satisfaction with the project itself, beverage consumption, and beverage container refund awareness and habits. Participant initials were used to create a group of matched respondents, where the same individual could be compared pre- and post-project.
Audit
The waste audit measured the weight of overall trash and recycling, as well as weights and/or counts of the 10 materials included in the flyer. For clarity, the audit data were combined and averaged to create three data points: (1) baseline (two pre-project audits), (2) short term (first two audits), and (3) long term (second two audits). These data were used to look for changes in the following categories over the course of the project:
1. Total collected recycling and trash weight; 2. Weight and percentages of recyclables in the recycling and trash (with a focus on the 10 materials
included in the flyer); 3. Counts of beverage containers in the recycling and trash; and 4. Overall presence of the ten materials in the informational flyer.
Daily Volumes
Over the course of the study the cleaning crews recorded the volume of recycling and trash that was removed from each office every day.

Recycling at Work
5
Results
Conditions are presented below in the order of success, from greatest to least.
Little Trash
Little Trash had statistically significant, desirable changes in almost all survey measures (knowledge, attitude, self-reported behavior, and perceived difficulty), it increased correct disposal of recyclables as demonstrated by the waste audits (more in the recycling bins and less in the trash), decreased the trash in the recycling, and participants reported a positive experience. Overall, Little Trash was the strongest condition, showing a wide range of desirable changes that were statistically significant, meaning they can be attributed to the project, not random chance. This condition could potentially have realized this success by interrupting current habits by changing the physical set up of the bins.
Equal-size
For the Equal-size condition, there were a good number of desirable changes reported in the survey data (knowledge, attitude, self-reported behavior, and perceived difficulty), and participants reported that they liked the project. However, the data did not show as clear an increase in actual recycling behavior. There were more recyclables and less trash material in the recycling bins, but not fewer recyclables material in the trash. So while this condition was successful, it was not as successful as the Little Trash condition.
Information Only
The control, or Information Only, condition, had almost no significant changes in the knowledge, attitude, self-reported behavior, and perceived difficulty of the survey, and no significant changes in their waste audit results. Furthermore, while most respondents rated the project positively, their ratings were still not as positive as in the Little Trash or Equal-size conditions. Overall, these results are telling of the low influence a typical “information only” project has on participants—it is important to go beyond the status quo and create a well-designed program. While periodically providing information about recycling is an important part of a successful recycling program, given that people need to know what bin to place each material, this condition shows that knowledge alone does not lead to behavior change.
Recycling Only
In the Recycling Only condition, survey results were mixed, with some positive changes and some undesirable ones, and many participants did not like the project, both in the survey and prior to implementation. Four offices dropped out of the project because of their assignment to the Recycling Only condition. The audit showed that the participating offices may have been throwing recyclables in the trash that would have ended up in the recycling bin prior to the project (undesirable change), or they may have simply increased the total amount of recyclables in the offices, while making the same disposal decision they made prior to project (no change). The research team cautions against implementing this condition unless changes are made to accommodate employee’s needs to get them on board with the set-up.
Recommendations
Overall, these project results support the following three recommendations for workplace recycling.

Make it Easy
To run a successful recycling program, proper disposal of materials needs to be as easy as possible, which, in an office, means having both trash and recycling bins at the desk. An effective program will also make recycling easier by using simple and straightforward informational signage, displaying signage on or close to the bins, and providing paired recycling and trash bins for common areas. However, it is vital to remember that information alone did not prompt behavior change, thus, for maximum results, the signs should be accompanied by the appropriate bins as described below.
Use Effective Placement
If a building is willing to invest in new bins, the research team recommends the Little Trash set-up, which provides a place for trash, but one that is small enough to discourage both overuse of non-recyclable items and cross-contamination between bins. If the building or office management is unwilling or unable to purchase new bins, the next best set up is the Equal-size bins, which still provides a place to easily recycle and a place to dispose of daily trash items. Buildings should avoid the Recycling Only set-up, as people have nowhere to dispose of their trash items, and may become frustrated or start contaminating their recycling bins with non-recyclable items.
Keep it Consistent
Ideally, recycling programs should be consistent, not just within distinct offices but throughout entire buildings as well. One singular program throughout the building decreases confusion for the cleaning staff, while one program throughout the office decreases confusion for employees. Decreased confusion will help keep the program running smoothly. Establish consistent communication by keeping messaging the same between bins, emails, fliers, and any other materials. Also, it is important to make sure that all cleaning staff receive the same information on the practicalities of the program.

Recycling at Work
7
Frequency of Materials Found
Of the ten priority materials, the priority of materials for an office recycling program is listed below. Priority categories were created based on how frequently each material was found in the INCORRECT bin in participating office during the baseline audits, with higher priorities being found in over 50% of offices.
Below, the materials are listed in order of the most prevalent in the INCORRECT bin to least within each category.
Higher Priority (over 50%)
1. Paper Towels
2. Office paper
3. Aluminum Beverage Cans
4. Food Scraps
5. Plastic Beverage Bottles
Medium Priority (25%-50%)
1. Plastic Eating Utensils
2. Used Paper Plates
Lower Priority (less than 25%)
1. Bubble Wrap
2. Frozen Dinner Boxes
3. Soup Cans

Checklist of Considerations when Planning a Building Recycling Program
This project and recycling programs in general exist in a much larger context than bins in an office. While the results of this single project cannot speak to the best practices of an entire recycling program, a combination of literature review, observation research, and involvement of experts in the recycling field informed the following list of steps and important considerations for planning a recycling program. More detail is available in the report.
Determine relevant stakeholders Determine who is the decision maker for the recycling program Acquire a recycling hauler Locate and distribute educational materials to stakeholders, offices, and cleaning crew about what
can be recycled Decide bin set-up and purchase Introduce program to offices and gain commitment from key building personnel Implement bins and signage Provide introductory and ongoing training to offices Provide introductory and ongoing training to cleaning crew Continually monitor, evaluate, and improve the program Maintain continual contact with hauler about changes to recyclable materials
More resources, tips, signage examples, and recycling activities can be found at: http://recyclingatwork.org
For more information on how recycling ties into LEED certification, visit: http://www.usgbc.org/certification
More specific results, conclusions, and recommendations can be found in the full report.

Recycling at Work
9
Introduction
Background
Recycling currently adds significant value to the nation’s economy as a whole, and there are numerous opportunities to add still more economic and environmental value by increasing the quantity and quality of material collected. This report addresses office buildings, in which there is great opportunity to unify and improve on recycling infrastructure. Given the hard work of recycling advocates, national recycling rates have increased to 34% for municipal waste. Recycling has produced substantial benefits already, and by increasing or improving recycling opportunities in sectors where it is under- or inefficiently utilized would produce still further benefits. For example: With the current annual national recycling rate, the U.S. achieves a reduction of more than 168 million metric tons of carbon dioxide equivalent emissions, which is comparable to the annual emissions from over 33 million passenger vehicles. Recycling and composting almost 87 million tons of MSW saves more than 1.1 quadrillion Btu of energy, which is equivalent to the energy consumed by almost 10 million U.S. households in a year. At the most basic level, recycling prevents valuable materials from going to waste. Recycling could help save the estimated $11.4 billion worth of packaging that is currently being discarded.6 Moreover, recycling reduces the need for landfills by extending the life of current landfills, saving money for municipalities, businesses, and consumers. In 2013, 14 states calculated total savings of over $2 billion in landfill cost avoided by diverting waste for recycling. New landfills are difficult to site and build, such that the cost of a new landfill can exceed $10 million.
Economically, recycling supports more than 450,000 jobs with over $87 billion in revenues.7 A study found that in five Northeastern states, there were 11,378 recycling and reuse establishments, employing 104,885 people with an annual payroll of nearly $4.2 billion.8 In the Southeast, meanwhile, over 200 manufacturing facilities rely on recycled materials, supporting more than 47,525 employees and garnering sales of more than $29.4 billion.9 The recycling rate varies for specific materials, each with room for improvement. Recycled PET plastic saves 84% of the energy needed for production when used instead of virgin plastic material, but in 2012, only 31% of plastic bottles were recycled. Recycling 1 ton of aluminum cans conserves more than 153 million Btu, the equivalent of 26 barrels of oil or 1,665 gallons of gasoline, but only 67% of aluminum cans were recycled in 2013. Paper from recycled materials takes 40% less energy to produce, but only 68% of paper was recycled as of 2010.
Benefits for Recycling in the Workplace
For property managers, the benefits of recycling include reduced waste collection and disposal costs and improved tenant satisfaction. Optimizing recycling at the average office building property, depending on
6 As You Sow, (2012) “Unfinished Business: The Case for Extended Producer Responsibility for Post-Consumer Packaging.” Retrieved from: http://www.asyousow.org/ays_report/unfinished-business-the-case-for-extended-producer-responsibility-for-post-consumer-packaging/ 7 Institute of Scrap Recycling Industries, Inc. (2013) “Economic Impact Study: U.S.-Based Scrap Recycling Industry.” Retrieved from: http://www.isri.org/recycling-industry/jobs-in-the-u-s-scrap-recycling-industry/job-study-analysis 8 DSM Environmental, (2009) “Recycling Economic Information Study Update: Delaware, Maine, Massachusetts, New York, and Pennsylvania,” Northeast Recycling Council. Retrieved from: https://nerc.org/documents/recycling_economic_information_study_update_2009.pdf 9 Southeast Recycling Development Council, (2010)“Factsheet: Understanding Local Recycling Markets” Retrieved from: http://www.serdc.org/Resources/Documents/SERDC%20Recycling%20Markets%20Factsheet.pdf

local recycling markets, has the potential to save 20-50% on monthly waste disposal fees. Additionally, properties that implement strong recycling programs find that doing so helps market the property to potential tenants. Unlike other green building initiatives, such as energy and water conservation, recycling is inherently visible and participatory, making it an important service to tenants seeking office space, many of whom are increasingly environmentally aware. Additionally, recycling programs are a component of LEED certification, which has numerous other advantages for a building (see Resources in Recommendations for more information.
While there is currently little public data available about how much is recycled in the workplace setting, the size of office buildings and their contributions to municipal waste suggest there could be significant opportunities to increase recycling in the workplace. The results of the 2012 Commercial Building Energy Consumption Survey show that there are at least 5.6 million commercial office buildings in the U.S. with over 87.4 billion square feet of floor space. Moreover, according to the U.S. Environmental Protection Agency, up to 45% of municipal waste is generated in the workplace, and, as noted in Figure 2, the majority of a typical office building’s waste stream can be recycled. Improving workplace recycling infrastructure will ensure that a greater proportion of recyclable office items are diverted from landfill, with substantial benefits to the environment, the economy, and the office buildings themselves.
Figure 2. Total Waste Stream in a Typical Office Building by Type10
As consumers increasingly recognize the importance of recycling for saving resources and energy, more companies are seeking to incorporate recycled materials into their products. Unfortunately, the supply of these recycled materials is limited due to the amount of recycling that is collected. Although recent U.S. recycling rates have been increasing, particularly for cans and bottles, there is still room for improvement in recycling rates. There have been a number of studies conducted regarding fostering consumer recycling behavior and improving recycling programs. Most of this research, however, has been conducted on household recycling rather than workplace recycling. The office environment has unique challenges and benefits to recycling that need to be taken into consideration when designing a workplace recycling program. In order to have a more comprehensive overview of a person’s day-to-day access to recycling, it
10 Source: Great Forest average waste audit results (www.greatforest.com)
Mixed Paper37%
Trash35%
Cardboard18%
Plastics7%
Glass2%
Metals1%

Recycling at Work
11
is important to understand their recycling behaviors, motivators, and barriers while at work. Thus, in conjunction with Keep America Beautiful’s “Recycling at Work” program, the study was created to determine whether a particular bin set-up in an office setting would make a significant difference in the quality of a recycling program. Furthermore, the research allows for a better quantification of the composition of recycling and trash in an office setting and a better understanding of factors that may influence recycling in the office. The results from the study will help create criteria for a more robust and effective office recycling program.
Literature Review
Prior to this research, there have only been a few studies conducted on workplace recycling. The state of California does conduct targeted statewide waste characterization studies, with the most recent completed in 2006. This research showed that the average large office building generated 1,998 pounds of waste material per thousand square feet per year. Unfortunately, only 7% of that total is diverted or recycled, even though 34% of material is recyclable paper and another 6% is recyclable glass, metal, and plastic. Only 32% of the large office buildings surveyed had a recycling program in place (Cascadia Consulting Group, 2006).
Humphrey, Bord, Hammond, & Mann (1977) found that office workers were much more receptive to an office paper recycling program when bins were located in their office, rather than only in central areas. Moreover, this research also found that the accuracy of sorting recyclables was significantly higher for desk bin conditions over the central bin condition. Over time the central bin condition’s sorting accuracy decreased at a faster rate than the desk bins (though all did decrease over the 10 week study period) (Humphrey, Bord, Hammond, & Mann, 1977).
In research conducted by Brothers, Krantz, & McClannahan (1994), two paper recycling bin set-ups were compared: a central office bin versus desk side bins, both with memos explaining the program. Only 28% of paper was recycled in the central container condition, but 85% to 94% of all recyclable paper was recycled in the desk side condition. Follow-up assessments, conducted one, two, three, and seven months after the intervention, showed that 84% to 98% of paper continued to be recycled in the desk side set-up. Eight new employees joined the staff at various points before follow-up. The addition of these employees increases the significance of the maintenance data, especially because these participants were not present when memos were distributed. Although it is possible that senior colleagues communicated the definition of recyclable paper to these new employees, it seems quite likely that local containers were relevant discriminative stimuli for recycling (Brothers, Krantz, & McClannahan, 1994).
Though slightly different than office programs, Ludwig, Gray, & Rowell’s research (1998) focused on academic buildings and recycling behavior. During baseline, recycling receptacles were placed in a central location. During the intervention, receptacles were moved into classrooms (where beverages were primarily consumed). After the intervention period, central location only bins were then reinstated. The percentage of cans recycled daily increased during intervention (by 20% to 36%, depending on the building) and returned to near-baseline levels post-intervention. The percentage of cans discarded daily in the trash decreased during the intervention (by 23% to 36%, depending on the building) and increased to near-baseline levels to post intervention (Ludwig, Gray, & Rowell, 1998).

On a more general note, another study tested potential determinates of office recycling behavior through a questionnaire. Their work found that workers classified as frequent recyclers were more likely than infrequent recyclers to say the arrangement of their office supported their recycling. Similarly, frequent recyclers were more likely to report that recycling at their work was convenient than infrequent recyclers. (Marans & Lee, 1993).
Overall, this review suggests that the convenience of bin location is of high importance to an effective workplace recycling program. The current study builds on this body of work by testing a novel bin set-up, using strong research methods to provide more quantitative evidence, and compiling notes on all potential issues that arose to lay the groundwork for future work.
Project Goal
The Recycling at Work project sought to improve recycling, both in quality and quantity of materials collected, in the workplace setting. This particular study focused on the effects of bin placement within an office setting on recycling rates and level of contamination. In addition, the research team collected qualitative information on the potential issues encountered prior to and during implementation, as well as other important factors to consider when setting up a workplace recycling program.
Major Study Activities
The Action Research team collaborated on the research design as well as the outreach materials with the stakeholders from PepsiCo, Keep America Beautiful, CBRE, and Great Forest. Below is a list of the major study activities:
Research design and data collection protocol development;
Recycling and trash bin, and outreach material design;
Recruitment of office building managers and individual office managers;
Recycling and trash bin placement;
Employee web survey design and implementation;
Waste audit and daily volume data collection; and
Analysis and reporting.

Recycling at Work
13
Methodology
Project Design This project consisted of an intervention (bin placement) and three research activities: (1) a pre- and post-intervention employee web survey, (2) waste audits, and (3) daily trash and recycling volume. The employee web survey was conducted two weeks prior to the implementation of the waste audits and daily volume assessment, and again after the last waste audit and daily volume data collection periods were completed. Baseline waste audit data were collected twice before the intervention was put into place. After the bins were placed, the waste audits were conducted four times (once per month for four consecutive months). The trash and recycling volume numbers were collected daily (Monday through Friday) over the same four month period.
Figure 3. Research Design and Data Collection Process
Participants
Office Building Participation
This phase of the project involved recruiting office buildings and then recruiting specific offices within those buildings for participation in the project. Recruitment was made easier since CBRE was a study partner and an introduction to the project was made by the CBRE Director of Sustainability Operations to various buildings that would potentially be interested. One CBRE building was recruited in each city, Boston, Houston, and San Diego, as well as a CBRE office park of three buildings in Atlanta. Building managers were then sent information about the benefits of participating in the Recycling at Work project (see Appendix A).
Current Recycling Program All buildings had single stream recycling. The building wide set-up in Boston, Houston, and San Diego had both recycling and trash bins, though some offices implemented the program slightly differently. The building wide set-up in Atlanta was novel in that it was based off the bin liner (a clear liner for recycling, black liner for trash), rather than any labeling on the bin. The building then set it up so all desk-side bins had clear liners (recycling) and common area bins had bins with both black liners (trash) and clear liners (recycling), meaning employees were supposed to only have recycling by the desk. Therefore, a black bin with a clear liner is actually a recycling bin, not a trash bin. However, through conversations with offices, it was discovered that most employees were unaware of the program and assumed they had a trash bin at their desk.
4 months
Baseline Waste Audits
Bin Placement Post-Survey Pre-Survey
Audit 1 Audit 3 Audit 4 Audit 2

Office Suite Recruitment
Building managers disseminated information about the Recycling at Work project to their tenants in order to recruit interested offices. The building manager then put the research team in touch with the interested offices. A research team member scheduled a time to talk to the office contact about the details of the project and to learn more about the office set-up (e.g., number of employees, office size, number of rooms, etc. The goal was to recruit 40 offices. Office size was originally limited to 50 employees, but when recruiting efforts did not meet the office goal, a few larger offices were contacted after they had initially been turned away. In total, 34 offices were recruited. See Appendix A for recruitment documents.
Cleaning Crew Involvement
Cleaning crews were also contacted early in the recruitment process, as their buy-in was critical to the success of the project. The head of the cleaning crew was contacted at each building by members of the research team to give an overview of the project, as well as to discuss the practicalities of the project. Each crew was given the opportunity to provide feedback on the relevant areas of the project, such as the daily data collection by crews or the timing and location of the waste audits, in order to ensure that the project would run smoothly in their building.
Bin Placement Conditions
In order to learn the effect of bin design on recycling, Recycling at Work tested four bin set-up types. Offices within each city were randomly assigned to one of four conditions. The existing recycling and trash set-up within the offices was replaced with the new set-up below.
The conditions were:
1. Equal-size – same size recycling and trash bins at desk side, and equal-size recycling and trash common-area bins;
2. Recycling Only – One recycling desk-side bin (no trash bin), and equal-size recycling and trash common-area bins;
3. Little Trash – One recycling desk-side bin and a little hanging trash bin, and equal-size recycling and trash common-area bins;
4. Information Only – original bin set-up remains in place.
At intervention if the office refused the randomly assigned bin set-up but still wished to participate in the project, they were reclassified as “Condition 5.” Four of these offices were in Recycling-Only, and one was in the Equal-size Condition. These five offices were excluded from analyses unless otherwise stated.

Recycling at Work
15
The number of offices within each condition and each city is show in the table below. Photos of the bin set-ups can be found in Appendix A.
Table 1. Number of Offices in Each Condition within City
EQUAL-SIZE
RECYCLING
ONLY
LITTLE
TRASH INFO ONLY CONDITION 5
ATLANTA 2 2 2 2 0 BOSTON 2 0 2 2 1
HOUSTON 1 0 0 1 1 SAN DIEGO 3 2 4 4 3
Note: Conditions 1 through 3 received larger paired recycling and trash bins placed in common areas. All conditions received informational messaging.
Originally, Condition 3 was “only trash desk-side bin,” where the employees would only have a trash bin by their desk. However, based on feedback from building managers, the condition was altered to not remove recycling bins that were in place prior to the project. As participating offices were volunteering for a recycling project, building managers raised the issue that they did not want to take away any existing green initiatives. To address this concern, the trash-only condition was replaced with the recycling desk-side bin and a little hanging trash bin. Overall, the research team felt this design was stronger, as it tested a more novel condition where some trash space is available for items such as tissues and small amounts of food waste, but recycling is still the focus.
Ten Items of Interest
The table below displays the ten items of interest for this study. The items were chosen based on research conducted with waste haulers across the four cities in this study. The research activities and project messages targeted only these items.
Table 2. List of the Ten Items of Interest
Recycling Trash
Office paper Food scraps
Plastic beverage bottles Bubble wrap
Aluminum beverage cans Plastic eating utensils
Frozen food boxes Used paper plates
Soup cans Paper towels

Messages
All conditions received educational messaging about the ten items of interest. Bin signs, a flyer, and logos were created in order to communicate the project messages. The signs, flyer, email, and logos can be found in Appendix A.
Signage
The recycling bins were stamped with a logo created for the Recycle at Work project. The logo graphically displayed three common recyclable items, an aluminum can, a plastic beverage bottle, and office paper imbedded in chasing arrows. The desk side recycling bins only displayed the logo. On the common-area recycling bin, the logo included the words, Keep America Beautiful and PepsiCo Recycling. The trash bins were also stamped with a logo created for the project. The logo depicted an old-style metal trash can and was marked with the word, landfill.
Flyer
A flyer was created to show the proper disposal of the ten items in the recycling and trash bins. The flyers were placed on each employee’s desk by the research team at the time of the intervention. Flyers were also posted in common areas such as kitchens and copy rooms.
Bin Signs
Recycling and trash signs were created for the common-area bins. The common-area bins had holders that allowed for the display of an 8 x 11 inch flyer. Separate signs were created for recycling and trash. The flyers displayed in photos and text the proper disposal of the five materials of interest.
Mid-Project Email
In order to keep offices engaged with the project, a mid-project email was sent out to all employees. The email provided information on some common errors that had been observed in the waste audits, as well as answers to questions that had come up from some offices and employees.

Recycling at Work
17
Data Collection This section explains the data collection activities undertaken for this project. This section begins with the employee web survey, and is followed by the recycling and trash waste audits, and daily trash and recycling volumes.
Employee Web Survey
All employees in participating offices were invited to participate in a web survey about recycling and trash attitudes, behavior, and knowledge. The web survey was conducted before and after the office waste audits. As mentioned previously, individual office contacts were identified through building managers.
The office contacts were asked to provide email lists for their employees in order to allow participation in the employee web survey. Most offices did provide employee email lists for direct web survey link distribution, but a few offices with privacy concerns declined to provide email addresses for all employees and instead distributed the web survey link via the internal office contact. Implementation of the web survey followed a multiple-contact design method. Employees were sent a pre-notification email that explained the survey purpose and timing, followed by the web survey link email, and finally, an email to remind employees to complete the survey. Employees were also given a typed note that served as a physical reminder and thank you, along with a free Pepsi coupon to additionally thank employees for taking the survey (or motivate them to complete the survey if they had not already). The web survey support documents can be found in Appendix B.
Figure 4. Employee Web Survey Process
Pre-Notification Email
Survey Link Email
Reminder Email, Note, and Coupon
Pre-AuditWeb
Survey Pre-Notification Email
Survey Link Email
Reminder Email, Note, and Coupon
Post-AuditWeb
Survey

Recycling and Trash Waste Audits
Recycling and trash waste audits were conducted within all 34 offices participating in the study. The audits were conducted in order to (1) identify the types of waste materials found in the office setting, (2) quantify the amount of waste found in recycling and trash bins, (3) measure the accuracy of disposal behaviors, and (4) measure changes in the types and quantity of the materials over the study period.
The audits were conducted six times over the course of the study period. Two baseline audits were conducted within the week prior to implementation and then four additional audits were conducted at one-month intervals following implementation. Action Research project managers conducted the baseline audits in each city working with building managers and cleaning crews to gain access to offices and properly dispose of the sorted materials at the completion of the audits. Action Research project managers trained a Great Forest representative on the protocol, so that the four monthly audits could be conducted by local employees of Great Forest.
The data collection protocol entailed several steps. Before the recycling and trash bags were removed from each office they were tagged with the office suite number. Bags were taken to a central location where the auditors sorted, weighed, recorded, and photographed the materials separately for recycling and trash within each office.
Daily Trash and Recycling Volume
Trash and recycling volume measures were collected in order to learn about the amount of waste collected on a daily basis, as well as measure changes over the study period. Since the cleaning crew removes the recycling and trash from each office on a daily basis, the research team sought their help to collect the volume data. The cleaning staff used a half-page data sheet to provide a daily record of the amount of recycling and trash material collected from each participating office. See Appendix D for the half-page data sheet. One sheet was used per office, per day. Cleaning crew members were trained in-person by the Action Research project managers.

Recycling at Work
19
Measures
This section explains the measures that were used for the employee web survey, daily trash and recycling volumes, and the recycling and trash waste audits.
Employee Web Survey
The main goal of the employee web survey was to measure employee knowledge and attitudes in the home, office, and public setting, as well as self-reported recycling behavior in the office setting. The pre-treatment survey also included items about use of reusable beverage containers and knowledge of deposits. The post-treatment survey included seven questions specific to the participant’s evaluation of the Recycling at Work project. For matching purposes, the pre- and post-treatment surveys asked participants to identify the state in which he/she was located and the name of the company for which he/she works. See Appendix B for the pre- and post-treatment survey instruments. Here are the measures:
General Knowledge, Behavior, and Beliefs about Recycling in the Office; Knowledge about Recycling Specific Items in the Office; Consumption and Self-Reported Disposal Behaviors in the Office (pre-survey only); Importance of Recycling Specific Items in the Office; Difficulty of Recycling Specific Items in the Office; General Knowledge, Behavior, and Beliefs about Recycling at Home; General Knowledge, Behavior, and Beliefs about Recycling in a Public Place; Knowledge and Behaviors Related to Returnable Containers (pre-survey only); Evaluation of the Recycling at Work Project (post-survey only); and Classification Questions.
Recycling and Trash Waste Audit Data
The purpose of the waste audit data collection effort was to itemize the types of materials found in recycling and trash bins and to provide weight measures of recycling and trash (overall and itemized) at the office level. See Appendix C for the data collection documents. The specific measures included:
Pre-sorted weight of recycling bags; Individual weights of the ten items of interest in the recycling; Pre-sorted weight of materials in the trash bags; Weights of specific recyclable items (5) in the trash bins; The presence of specific trash items (5) in the trash bin; and The total weight of the trash items (5) in the trash bins.

Daily Recycling and Trash Volume
The purpose of collecting daily recycling and trash volume measures was to identify possible volume trends. The cleaning crew completed a single data collection sheet for each office each day over the course of the data collection period, starting on the first day the Recycling at Work bins were in place. The sheets included the suite number and date. See Appendix D for the data collection sheets. The sheets included:
The fullness of each recycle bag (one-fourth, one-third, one-half, two-thirds, and three-fourths); The number of full recycling bags; The fullness of each trash bag (one-fourth, one-third, one-half, two-thirds, and three-fourths); The number of full trash bags; and Any other noteworthy items.

Recycling at Work
21
Results
Results for the employee web survey are presented first, followed by the recycling and trash volume study, then waste audits. Where statistical tests were conducted, an asterisk (*) on the figure or table denotes significance at the .05 level.
Employee Web Survey
Demographics—All Respondents
While the number of the post-project respondents is a little over half the number of pre-project respondents, the tables below demonstrate that the demographics between the two groups are similar. Most of the demographic characteristics were similar in the pre- and post- survey.
While this study primarily focused on the effect of bin location set-ups on recycling behaviors, basic information on office workers as a whole was collected. The behavioral items are self-reported and should be considered alongside the results from the waste audits.
The pre-project survey response rate was 43% (197 respondents), while the post-project survey response rate was 24% (109 respondents). These initial demographics reflect all respondents to the survey, except those in Condition 5. As mentioned previously, offices that refused their experimental set-up but still wanted to participate in Recycling at Work were allowed to keep their bins and asked to participate in the post-project survey.
Age
Respondent age ranged from 20 to over 70 years of age.
Table 3. Respondent Age
AGE PRE-PROJECT POST-PROJECT
20-29 17% 15.5% 30-39 18% 14.5% 40-49 19% 17.4% 50-59 11% 11.8% 60-69 8% 8.2% 70+ 1.5% .9% REFUSED 25.4% 29.4% TOTAL 100.0% 99.1%
Note: N= 197 (pre-project) and N=109 (post-project). There was one missing case (post-project).

Gender
There were slightly more female than male respondents (20% more pre, 12% more post).
Table 4. Respondent Gender
GENDER PRE-TREATMENT POST-TREATMENT
MALE 36.0% 39.4% FEMALE 56.3% 51.4% REFUSED 7.6% 9.2%
Note: N= 197 (pre-project) and N=109 (post-project).
Years Worked
The years worked was only assessed on the pre-project survey, but again covered a wide range, with most respondents working for their organization for 10 years or less. The mean number of years worked was 8.14.
Table 5. Respondent Years Worked
YEARS WORKED
LESS THAN 1 1.5% 1-2 14.2% 3-5 10.6% 6-10 21% 11-15 8% 16-25 6% 26-40 2% REFUSED 37.1%
Note: N= 197.

Recycling at Work
23
Matched Employee Pre and Post Surveys
Of the 197 pre and 109 post surveys, 69 were matched based on the information provided by the respondent for that purpose. Matching these surveys allowed for pre to post analyses to determine if the intervention resulted in these participants changing over time. Of the 69 matched surveys, seven were removed from the analyses because their offices did not follow through with the intended intervention. These matched surveys were analyzed from pre-to-post, as these responses allowed the research team to see change (or not) in each participant prior and after the study.
The table below shows the number of matched surveys in each condition.
Table 6. Number of Matched Employee Surveys by Condition
CONDITION MATCHED SURVEYS
Equal-size Desk 32
Recycling Only 7
Little Trash 12
Information Only 11
Total 62
The table below shows the number of matched surveys from each city.
Table 7. Number of Matched Employee Surveys by City
CITY MATCHED SURVEYS
Atlanta 19
Boston 7
Houston 18
San Diego 18
Total 62

At the Office
Knowledge of Recycling at the Office
General Office Knowledge by Condition for Matched Respondents
Participants reported how knowledgeable they were about recycling in their office on a scale from “0” (not at all knowledgeable) to “10” (very knowledgeable).
Figure 5. General Office Knowledge by Condition from Pre to Post for the Matched Sample
Recycling Only and Little Trash experienced a statistically significant increase in knowledge at the .05 level.
0
1
2
3
4
5
6
7
8
9
10
Equal-size Recycling Only* Little Trash* Information Only
Pre
Post
Key Findings: Overall, this section of the survey focused on changes in office recycling. The results show that the Little Trash condition had the largest number of desirable, significant changes in office recycling, followed by Equal-size. The Recycling Only condition primarily had undesirable changes. Information Only had almost no significant changes.

Recycling at Work
25
Office Knowledge of Specific Items by Condition for Matched Respondents
To more specifically assess if participants know where to place certain items in their office they were asked to indicate where each of the ten items should be disposed. For each item participants indicated where they think the item belongs, trash bin, recycle bin, or don’t know. The results were then coded as correct or incorrect, totaled and compared. As there were ten specific items tested, a perfect score would be a “10.”
Figure 6. Total Specific Office Items11 Knowledge from Pre to Post for Matched Sample
All conditions, except for Recycling Only, experienced a statistically significant increase in knowledge of the correct placement of the ten items from pre to post at the .05 level.
11 All 10 targeted items: Office Paper, Aluminum Beverage Containers, Plastic Beverage Containers, Soup Cans, Frozen Dinner Boxes, Paper Towels, Used Paper Plates, Plastic Eating Utensils, Food Scraps, and Bubble Wrap
0
1
2
3
4
5
6
7
8
9
10
Equal-size* Recycling Only Little Trash* Information Only*
Pre
Post

Office Knowledge of Specific Items, Only Recycling by Condition for Matched Respondents
Next, the specific knowledge about the five recyclable items was tested. Again, a total of the correct answers about where the specific recycling items should go in the office (trash bin or recycling bin) was compared from pre to post separately by condition. As there were five recycling items tested, a perfect score would be a “5.”
Figure 7. Total Specific Office Recyclable Items12 Knowledge from Pre to Post for Matched Sample
All conditions experienced a statistically significant increase in knowledge of the correct placement of the five items from pre to post at the .05 level.
Knowledge of Specific Items, Only Trash by Condition for Matched Respondents
Similarly, knowledge about where the five specific trash items should go in the office (landfill bin or recycling bin) was compared from pre to post separately by condition.
Results showed that there were no significant changes in knowledge of the correct placement of the five specific trash items from pre to post.
12 All 5 targeted recyclables items: Office Paper, Aluminum Beverage Containers, Plastic Beverage Containers, Soup Cans, and Frozen Dinner Boxes
0
1
2
3
4
5
Equal-size* Recycling Only* Little Trash* Information Only*
Pre
Post

Recycling at Work
27
Self-Reported Office Recycling Behaviors
General Office Recycling Behavior by Condition for Matched Participants
Participants reported how often they properly dispose of recyclable items while in the office on a scale from “0” (never) to “10” (always).
Figure 8. General Office Recycling Behavior from Pre to Post for Matched Sample
Equal-size and Little Trash experienced a statistically significant increase in frequency of recycling at the .05 level.
0
1
2
3
4
5
6
7
8
9
10
Equal-size* Recycling Only Little Trash* Information Only
Pre
Post

Office Behavior Related to Specific Items, All by Condition for Matched Respondents
Participants were asked to indicate where they placed ten items the last time they used them. For each item participants indicated where they placed the item, in the trash bin, recycle bin, took home, other, or don’t use. The results were then coded as correct or incorrect and totaled.
A total behavior score was compared from pre to post by condition. As there were 10 items tested, a perfect score would be a “10.”
Figure 9. Total Office Specific Item13 Behavior from Pre to Post for Matched Sample
Little Trash experienced a statistically significant increase in correct placement at the .05 level.
13 All 10 targeted items: Office Paper, Aluminum Beverage Containers, Plastic Beverage Containers, Soup Cans, Frozen Dinner Boxes, Paper Towels, Used Paper Plates, Plastic Eating Utensils, Food Scraps, and Bubble Wrap
0
1
2
3
4
5
6
7
8
9
10
Equal-size Recycling Only Little Trash* Information Only
Pre
Post

Recycling at Work
29
Office Behavior Related to Specific Recyclable Items by Condition for Matched Respondents
Next, the total correct placement of the five recyclable items was compared from pre to post separately by condition. As there were five recycling items tested, a perfect score would be a “5.”
Figure 10. Total Office Specific Recyclable Items14 Behavior from Pre to Post for Matched Sample
Little Trash showed a statistically significant increase in correct placement at the .05 level.
Office Behavior for All Trash Items by Condition for Matched Respondents
The total correct placement of the five trash items15 was compared from pre to post separately by condition.
For all conditions, there was no significant change in correct placement of specific trash items at the .05 level.
14 All 5 targeted recyclable items: Office Paper, Aluminum Beverage Containers, Plastic Beverage Containers, Soup Cans, and Frozen Dinner Boxes
15 All 5 targeted trash items: Paper Towels, Used Paper Plates, Plastic Eating Utensils, Food Scraps, and Bubble Wrap
0
1
2
3
4
5
Equal-size Recycling Only Little Trash* Information Only
Pre
Post

Difficulty of Recycling in the Office
General Difficulty of Recycling in the Office by Condition for Matched Respondents
Participants were asked to rate the difficulty of recycling in their office on a scale from “0” (not at all difficult) to “10” (extremely difficult).
Figure 11. General Difficulty Recycling in the Office for the Matched Sample
There were no statistically significant changes in difficulty from pre to post at the .05 level. Little Trash was the only condition that approached a significant decrease in difficulty from pre to post.
0
1
2
3
4
5
6
7
8
9
10
Equal-size Recycling Only Little Trash Information Only
Pre
Post

Recycling at Work
31
Difficulty of Recycling Specific Items by Condition for Matched Respondents
Participants were asked to rate the difficulty of recycling the five recycling items of interest on a scale from “0” (not at all difficult) to “10” (very difficult).
Figure 12. Average Office Specific Recyclable Items16 Recycling Difficulty from Pre to Post for Matched Sample
Equal-size and Little Trash experienced a statistically significant decrease in difficulty at the .05 level.
Difficulty of Recycling Each Item by Condition for Matched Respondents
Finally, each recyclable item was examined individually for changes in difficulty within the matched respondents.
There were no significant differences across conditions for office paper. For the Little Trash condition plastic beverage bottles, aluminum beverage cans, frozen food boxes, and soup cans showed significant decreases in difficulty. The Equal-size condition displayed a significant decrease in difficulty for aluminum beverage cans.
16 All 5 targeted recyclable items: Office Paper, Aluminum Beverage Containers, Plastic Beverage Containers, Soup Cans, and Frozen Dinner Boxes
0
1
2
3
4
5
6
7
8
9
10
Equal-size* Recycling Only Little Trash* Information Only
Pre
Post

Importance of Recycling at the Office
General Importance of Recycling at the Office by Condition for Matched Respondents
Participants were asked to rate the general importance of recycling in their office on a scale from “0” (not at all important) to “10” (very important).
Figure 13. General Office Recycling Importance from Pre to Post for Matched Sample
There were no statistically significant changes in importance from pre to post.
0
1
2
3
4
5
6
7
8
9
10
Equal-size Recycling Only Little Trash Information Only
Pre
Post

Recycling at Work
33
Importance of Recycling Specific Items by Condition for Matched Respondents
Participants were asked to rate the importance of recycling the five recyclable items of interest individually on a scale from “0” (not at all important) to “10” (very important).
Figure 14. Office Specific Recyclable Items17 Recycling Importance from Pre to Post for the Matched Sample
Equal-size experienced a statistically significant increase in importance at the .05 level.
Importance of Recycling Specific Items by Condition for Matched Respondents
Finally, each item was examined individually for changes in importance within the matched respondents.
For the Equal-size condition, the importance of recycling soup cans increased significantly from pre to post. For the Recycling Only condition, the importance of recycling plastic beverage bottles, aluminum beverage cans, and soup cans decreased significantly from pre to post. As mentioned previously, the Recycling Only condition did have a smaller sample size due to offices dropping out when they learned about the bin set-up for the condition, so that has an effect on the generalizability of the data. However, given the sample size was due to people’s dislike of the condition, we believe these results reinforce each other.
17 All 5 targeted recyclable items: Office Paper, Aluminum Beverage Containers, Plastic Beverage Containers, Soup Cans, and Frozen Dinner Boxes
0
1
2
3
4
5
6
7
8
9
10
Equal-size* Recycling Only Little Trash Information Only
Pre
Post

At Home
Knowledge of Recycling at Home
General Knowledge of Recycling at Home by Condition for Matched Respondents
Participants were asked to rate their general knowledge about recycling at home on a scale from “0” (not at all knowledgeable) to “10” (very knowledgeable).
Figure 15. Reported General Home Recycling Knowledge from Pre to Post for the Matched Sample
Interestingly, Recycling Only experienced a statistically significant decrease in knowledge at the .05 level.
Recycling Behavior at Home
General Recycling Behavior at Home by Condition for Matched Respondents
Participants reported generally how often they properly dispose of recyclable items while at home on a scale from “0” (never) to “10” (always).
There were no statistically significant changes from pre to post for recycling behavior at home.
Recycling Difficulty at Home
General Recycling Difficulty at Home by Condition for Matched Respondents
Participants reported generally how difficult it is to recycle in their home on a scale from “0” (not at all difficult) to “10” (very difficult).
There were no statistically significant changes from pre to post for recycling difficulty at home.
Importance of Recycling at Home
General Importance of Recycling at Home by Condition for Matched Respondents
Participants reported generally how important it is to recycle in their home on a scale from “0” (not at all important) to “10” (very important).
0
1
2
3
4
5
6
7
8
9
10
Equal-size Recycling Only* Little Trash Information Only
Pre
Post
Key Findings: Overall, these next two survey result sections demonstrate that there was little spillover from Recycling at Work to home and public recycling measures.

Recycling at Work
35
There were no statistically significant changes from pre to post for recycling importance at home.
In Public
Knowledge of Recycling in Public Places
General Knowledge in Public Places by Condition for Matched Respondents
Participants reported generally how knowledgeable they were about recycling in public places on a scale from “0” (not at all knowledgeable) to “10” (very knowledgeable).
There were no statistically significant changes from pre to post for knowledge in public places.
Recycling Behavior in Public Places
General Behavior in Public Places by Condition for Matched Respondents
Participants reported generally how often they recycle recyclable items in public places on a scale from “0” (never) to “10” (always).
Figure 16. Reported General Public Recycling Behavior from Pre to Post for the Matched Sample
Participants in the Little Trash condition reported significantly more general public recycling behavior from pre to post. No other changes from pre to post were statistically significant at the .05 level.
0
1
2
3
4
5
6
7
8
9
10
Equal-size Recycling Only Little Trash* Information Only
Pre
Post

Difficulty of Recycling in Public Places
General Difficulty of Recycling in Public Places by Condition for Matched Respondents
Participants reported generally how difficult it is to recycle in public places on a scale from “0” (not at all difficult) to “10” (very difficult).
There were no statistically significant changes from pre to post for difficulty of recycling in public places.
Importance of Recycling in Public Places
General Importance of Recycling in Public Places by Condition for Matched Respondents
Participants reported generally how important it is to recycle in public places on a scale from “0” (not at all important) to “10” (very important).
Figure 17. Reported General Importance of Recycling in Public Places from Pre to Post for Matched Sample
Participants in Recycling Only reported a significantly lower rating of importance for public recycling from pre to post.
There were no other statistically significant changes from pre to post for importance of recycling in public places.
0
1
2
3
4
5
6
7
8
9
10
Equal-size Recycling Only* Little Trash Information Only
Pre
Post

Recycling at Work
37
Recycling at Work Specific Questions
Finally, all post-survey respondents, (109 respondents, with Condition 5 participants excluded), were asked several questions about the Recycling at Work project. There were 61 respondents for Equal-size, 11 respondents for Recycling Only, 21 for Little Trash, and 16 for Information Only.
Ease of Recycling
First, respondents were asked whether the Recycling at Work project changed the ease of recycling in their office, on a scale from “0” (much harder) to “10” (much easier). More than half of the respondents rated the project as a 7 or higher: Equal-size (71%) and Little Trash (70%). Of the Information Only respondents, 50% rated ease of recycling in their office as a “7” or higher. However, Recycling Only was more mixed, with only 46% rating it over a 7, and 18% rating it as “0.”
Change in Knowledge
Next, respondents were asked to rate how much the Recycling at Work increased their knowledge of how to recycle on a scale of “0” (Not at all) to “10” (Very much so). A sizeable number of respondents rated their increase in knowledge as a “7” or higher: Little Trash (76%), Information Only (69%), Equal-size (59%), and Recycling Only (54%).
Understandability of Flyer
Finally, respondents were asked to rate how helpful the Recycling at Work flyer was on a scale of “0” (Not at All Helpful) to “10” (Very Helpful). A majority of respondents rated the flyer as “8” or higher: Little Trash (81%), Recycling Only (64%), Equal-size (61%), and Information Only (50%).
Suggestions for Improvement
Participants were also asked to suggest how they thought the project could be improved. Some suggestions included:
“I would also offer some kind of security for recycling office paper...like shredding. We have a ton of paper that has personal information of our clients that should be recycled,
but [it can] not placed in an area that anyone could come upon it.”
“A more comprehensive list of recyclable and non-recyclable materials, since [there are] some items that I'm still not sure how to dispose of.”
“A place to recycle batteries would be helpful.”
“Perhaps a short workshop to engage others [about] how important this is.”
Key Findings: Overall, this section showed that the participants in the Little Trash condition rated the program most positively, followed by Equal-size, then Information Only. The Recycling Only condition participants were more mixed on their ratings of the Recycling at Work program.

Beverage Consumption
The pre-project survey asked participants about beverage consumption at work. The results are from a total of 214 respondents, including participants from Condition 5.
Number of Beverages
First, respondents were asked to identify how many beverages they consumed at work in a typical day, regardless of type.
Table 8. Number of Beverages Consumed in a Typical Day
# OF BEVERAGES AT WORK
0 19.4%
1-2 44.1%
3-4 23.7%
5-9 10.9%
10-18 1.9%
More than three-fourths of respondents had at least one beverage during the work day, with one-third having three or more beverages. Respondents consumed an average of 2.3 beverages in a typical work day.
Vending Machines
Just over one-third of the respondents had access to a vending machine at work (N=82). Respondents with access to a vending machine were then asked a number of follow up questions about their vending machine usage.
Of those with access to a vending machine (N=82), 13% purchase coffee, 19% purchase water and 22% purchase soda from the machine in a typical day. Only 4% purchase juice or energy drinks from a vending machine in a typical day. Although these participants had access to a vending machine, most did not purchase a beverage in a typical day.
Bringing Disposal Beverages in the Office
All respondents (N=214) were asked if they bring in and consume single use beverage containers in a typical day, and if so, how many and what type. Water, coffee, and soda were the beverages of choice, with 23% bringing in at least one water, 19% bringing in at least one coffee, and 15% bringing in at least one soda in a typical day. Very few respondents stated that they bring in juice or energy drinks.
Key Findings: Beverage data showed that soda, water, and coffee, in that order, are the top beverages purchased from vending machines. For single use beverage containers brought into work, water is most popular, followed closely by coffee and soda. For reusable containers, water was the highest by far, followed by coffee. For refunds, the data showed that even though most people in states with bottle bills were aware of the refund, very few returned bottles.

Recycling at Work
39
Consumption of Beverages from Reusable Containers
Finally, respondents were asked about the number of beverages they consume from reusable containers in a typical work day. About three-fourths of respondents had water at least once from a reusable container during their typical work day. Further, one-third had water at least three times from a reusable container. Half of all respondents had coffee at least once per day from a reusable container. Less than 10% reported drinking a soda, and very few reported drinking juices (4%) or energy drinks (1%) from a reusable container.
Deposits/Refunds
All pre-project respondents (N=214), including those in Condition 5, were asked if their state did or did not offer a refund for beverage containers. In California and Massachusetts (both states with refunds) more than two-thirds of respondents were aware that their state did have a refund. However, for the states that did not have a refund (Georgia and Texas) about one-third of respondents were aware there was no refund, while the majority of respondents were unsure. Of the Massachusetts and California respondents who were aware of the refund, nearly all of respondents were aware the refund amount would be between 5 cents and 10 cents.
Table 9. Correct Knowledge of Beverage Container Refunds by State
STATE
ANSWER
(CORRECT IS
HIGHLIGHTED)
GEORGIA
N=55
Yes 1.8%
No 38.2%
Don’t Know 60.0%
MASSACHUSETTS
N=40
Yes 67.5%
No 0% Don’t Know 32.5%
TEXAS
N=73
Yes 6.8% No 34.2%
Don’t Know 58.9%
CALIFORNIA
N=46
Yes 78.3%
No 2.2% Don’t Know 19.6%
Respondents who stated that their state had a refund, were asked to rate their frequency of bottle returns on a scale from “0” (never) to “10” (always). Interestingly, even in states where bottle refunds exist, respondents rarely returned their bottles. In Massachusetts, only 11% of respondents rated their return frequency “5” or greater. In California, the numbers were higher, with 30% rating their return frequency “5” or greater.

Recycling and Trash Waste Audit Data
Audits were conducted on a monthly basis with the assumption that the day would be an average day in that office. However, there were a few occasions when auditors would note that the audit fell on a day that seemed unusual for the office, such as a huge influx of filing folders or an excessive amount of paper. Therefore, office paper weights greater than two standard deviations above the mean were winsorized to equal the mean plus two standard deviations. For continuity, total bag weights were then reduced by the amount of reduced office paper. Subsequent analyses were run using the winsorized weights.
Occasionally, the cleaning crews did not remove recycling and trash bags from an office that was to be audited. In these cases missing data were imputed with the mean weights and counts of items within the matching condition.
Finally, to get a better comparison, audits were averaged into three categories: (1) Baseline (baseline 1 and 2), (2) Short Term (audit 1 and audit 2), and (3) Long Term (audit 3 and audit 4). The averaged terms help accommodate for audits that fell on an unusual day for the office (e.g., office party), as well as provide a more understandable view of the data.
Percentage of Offices with Recyclable Item Type in Recycling and Trash Over Time
To determine the prevalence of each target item in the recycling and trash bags, each item was coded as either present or absent for each office during each audit. This information was used to create a percentage of offices that had that item in either their recycling or trash bins at each audit.
Key Findings: For frequency, office paper, aluminum beverage cans, plastic beverage bottles, paper towels, and food scraps are the most frequently utilized. Plastic eating utensils and used paper plates were fairly common. Frozen dinner boxes, soup cans, and bubble wrap were infrequently found.
Little Trash saw the most desirable, significant changes in increasing correct placement of recyclables. Equal-size also had some desirable changes, but fewer than Little Trash. Recycling Only had changes that were either undesirable or neutral. Information Only saw no meaningful changes.

Recycling at Work
41
Office Paper
Office paper was the most frequently found item in recycling bins. It was also present in fairly high levels in trash bins, though the pattern trended downward over time, found in the trash of 79% of offices at the Baseline and 59% of offices in the Long term.
Figure 18. Percentage of Offices with Office Paper by Bin Type over Time
Plastic Beverage Bottles
Plastic beverage bottles and aluminum beverage cans were also fairly common, with about half to three-fourths of offices having at least one in the recycling bins at each audit. Both were found in similar frequency in the trash bins.
Figure 19. Percentage of Offices with Plastic Beverage Bottles by Bin Type over Time
0%
10%
20%
30%
40%
50%
60%
70%
80%
90%
100%
Baseline Short term Long term
Recycling Trash
0%
10%
20%
30%
40%
50%
60%
70%
80%
90%
100%
Baseline Short term Long term
Recycling Trash

Aluminum Beverage Cans Figure 20. Percentage of Offices with Aluminum Beverage Cans by Bin Type over Time
Frozen Dinner Boxes
Frozen dinner boxes and soup cans were not commonly found in either bin. They were found in recycling bins in less than 10% of the offices in almost every audit. These materials were somewhat more common in the trash bins, indicating potential opportunity for more specific targeting.
Figure 21. Percentage of Offices with Frozen Dinner Boxes by Bin Type over Time
0%
10%
20%
30%
40%
50%
60%
70%
80%
90%
100%
Baseline Short term Long term
Recycling Trash
0%
10%
20%
30%
40%
50%
60%
70%
80%
90%
100%
Baseline Short term Long term
Recycling Trash

Recycling at Work
43
Soup Cans Figure 22. Percentage of Offices with Soup Cans by Bin Type over Time
Percentage of Offices with Trash Item Type in Recycling and Trash Over Time
Food Scraps
At baseline, food scraps were present in recycling bags for half the offices, but declined over the course of the project to below 20%. As a note, food scraps were defined as any material that was a food product at any point, ranging from unopened yogurt to half eaten salads to banana peels.
Figure 23. Percentage of Offices with Food Scraps by Bin Type over Time
0%
10%
20%
30%
40%
50%
60%
70%
80%
90%
100%
Baseline Short term Long term
Recycling Trash
0%
10%
20%
30%
40%
50%
60%
70%
80%
90%
100%
Baseline Short term Long term
Recycling Trash

Bubble Wrap
Finally, finding bubble wrap in the recycling or trash bins was fairly rare. The presence of bubble wrap declined in the long term.
Figure 24. Percentage of Offices with Bubble Wrap by Bin Type over Time
Plastic Eating Utensils
The number of offices with plastic eating utensils and used paper plates in recycling bags decreased, and the number of offices with these materials in the trash increased over the course of the project.
Figure 25. Percentage of Offices with Plastic Eating Utensils by Bin Type over Time
0%
10%
20%
30%
40%
50%
60%
70%
80%
90%
100%
Baseline Short term Long Term
Recycling Trash
0%
10%
20%
30%
40%
50%
60%
70%
80%
90%
100%
Baseline Short term Long term
Recycling Trash

Recycling at Work
45
Used Paper Plates Figure 26. Percentage of Offices with Used Paper Plates by Bin Type over Time
Paper Towels
Nearly all offices had paper towels in the recycling at baseline. Over the course of the study the number of offices with paper towels in the recycling bins decreased to 50% and most offices had consistent levels of paper towels in their trash bins.
Figure 27. Percentage of Offices with Paper Towels by Bin Type over Time
0%
10%
20%
30%
40%
50%
60%
70%
80%
90%
100%
Baseline Short term Long term
Recycling Trash
0%
10%
20%
30%
40%
50%
60%
70%
80%
90%
100%
Baseline Short term Long term
Recycling Trash

Incorrect Disposal
Many offices had other recyclable or trash items disposed of in the wrong bins. The table below displays some of those items.
Table 10. Recyclable and Trash Materials Found in the Wrong Bin18
Trash in Recycling: Recycling in Trash:
Pizza Boxes Shredded Office Paper
Label Backing Assorted Paper Plastic Mailing Envelopes Junk Mail Plastic Bags, Film, Wrap Corrugated Cardboard
Packing Peanuts Aluminum Foil
CDs Not-Empty Drinking Cups Drinking Cups with Straws Leftover Food in Recyclable Plastic Containers
Candy Wrappers Lottery Tickets Styrofoam Chip Bags
18 These materials may be recyclable or not recyclable in different areas, depending on the capacity of the area’s local hauler. For example, pizza boxes are recyclable in many areas—however, in all 4 offices, the hauler listed them as non-recyclable.

Recycling at Work
47
Weight
After looking at the general patterns of the materials present, the next step was to see if the total weights of the recycling and trash materials shifted during the course of the project.
Mean Recycling Weight over Time by Condition
Total recycling weight for each office were collected. The weights were compared by condition over time.
Figure 28. Average Total Recycling Weight per Office by Condition over Time
Recycling Only experienced a statistically significant decrease in total recycling weight over time, f(2,2)=7.85, p=.02. No other condition experienced a statistically significant change at a .05 level.
0
5
10
15
20
25
Equal-size Recycle Only* Little Trash InformationOnly
We
igh
t (l
b)
Baseline
Short term
Long term

Mean Trash Weight over Time by Condition
Total trash weight for each office were collected. The weights were compared by condition over time.
Figure 29. Average Total Trash Weight per Office by Condition over Time
Information Only had a statistically significant change in total trash weight over time, f(2,7)=7.87, p=.02. No other condition had a statistically significant change.
0
2
4
6
8
10
12
14
16
Equal-size Recycle Only Little Trash InformationOnly*
Baseline
Short term
Long term

Recycling at Work
49
Recyclable Items – Percentage
The next step was to look at the percentage of the recycling weight that was made up of recyclable items, as well as the percentage of trash weight that was made up of recyclable items.
Percentage of Recyclable Weight in Recycling by Condition over Time
The amount of recyclable items within the recycle bins was divided by the weight of the total weight of the recycling within office in order to calculate the percent correctness. Since this is total weight of recyclables found in the recycling a greater percentage displays higher accuracy.
Figure 30. Percentage of Recyclables in Recycling over Time
Equal-size saw a statistically significant change in percentage of recyclables in the recycling over time, f(2,6)=6.03, p=.01. Little Trash also had a statistically significant change in percentage of recyclables in the recycling over time, f(6,2)=6.37, p=.03. Recycling Only and Information Only did not have a statistically significant change.
0
10
20
30
40
50
60
70
80
90
100
Equal-size* Recycle Only Little Trash* InformationOnly
Pe
rce
nta
ge
Baseline
Short term
Long term

Percentage of Recyclable Weight in Trash by Condition over Time
The amount of recyclable items within the trash bins was divided by the weight of the total weight of the trash within office in order to calculate the percent correctness. Since this is total weight of recyclables found in the trash a lower percentage displays higher accuracy.
Figure 31. Percentage of Recyclables in Trash over Time
Little Trash experienced a statistically significant change in percentage of recyclable items in the trash, f(6,2)=4.27, p=.04. No other condition experienced a statistically significant change.
0
5
10
15
20
25
30
35
Equal-size Recycle Only Little Trash* InformationOnly
Baseline
Short term
Long term

Recycling at Work
51
Office Paper – Weights
Office Paper Weights in Recycling by Condition over Time
The weight of office paper within recycling for each office was collected. The weights were compared by condition over time.
Figure 32. Average Office Paper Weight in Recycling over Time
Little Trash experienced a statistically significant change in total weight of the collected office paper in recycling over time, f(6,2)=4.22, p=.04. No other condition experienced a statistically significant change.
0
1
2
3
4
5
6
7
8
Equal-size Recycle Only Little Trash* InformationOnly
Baseline
Short term
Long term

Office Paper Weights in Trash by Condition over Time
The weight of office paper within trash for each office was collected. The weights were compared by condition over time.
Figure 33. Average Office Paper Weight in Trash over Time
Little Trash experienced a statistically significant change in the total weight of office paper in trash bags, f(6,2)=7.02, p=.01. No other condition experienced a statistically significant change.
0
0.2
0.4
0.6
0.8
1
1.2
1.4
Equal-size Recycle Only Little Trash* InformationOnly
Baseline
Short term
Long term

Recycling at Work
53
Plastic Beverage Bottles – Counts
In addition to weight, plastic beverage bottles and aluminum beverage cans were counted.
Plastic Beverage Bottle Counts in Recycling by Condition over Time
The number of plastic beverage bottles within recycling for each office was collected. The counts were compared by condition over time.
Figure 34. Average Count of Plastic Beverage Bottles in Recycling over Time
Recycling Only experienced a statistically significant decrease in the count of plastic beverage bottles over time, f(2,2)=9.30, p=.01. No other condition experienced a statistically significant change.
0
1
2
3
4
5
6
Equal-size Recycle Only* Little Trash InformationOnly
Baseline
Short term
Long term

Plastic Beverage Bottle Count in Trash by Condition over Time
The number of plastic beverage bottles within trash for each office was collected. The counts were compared by condition over time.
Figure 35. Average Count of Plastic Beverage Bottles in Trash over Time
The counts of plastic beverage bottles in the trash bags per condition were compared over each audit. No condition experienced a statistically significant change in the count of plastic beverage bottles in the trash over time, though most improved was the Little Trash condition.
0
0.5
1
1.5
2
2.5
3
Equal-size Recycle Only Little Trash InformationOnly
Baseline
Short term
Long term

Recycling at Work
55
Aluminum Beverage Cans – Counts
Aluminum Beverage Can Counts in Recycling by Condition over Time
The number of aluminum beverage cans within recycling for each office was collected. The counts were compared by condition over time.
Figure 36. Average Count of Aluminum Beverage Cans in Recycling over Time
No condition experienced a statistically significant change in the count of aluminum beverage cans in the recycling over time.
0
1
2
3
4
5
6
Equal-size Recycle Only Little Trash InformationOnly
Baseline
Short term
Long term

Aluminum Beverage Can Counts in Trash by Condition over Time
The number of aluminum beverage cans within trash for each office was collected. The counts were compared by condition over time.
Figure 37. Average Aluminum Beverage Can Count in Trash over Time
No condition experienced a statistically significant change in the count of aluminum beverage cans in the trash over time.
0
0.5
1
1.5
2
2.5
3
Equal-size Recycle Only Little Trash InformationOnly
Baseline
Short term
Long term

Recycling at Work
57
Daily Recycling and Trash Volume
Daily Recycling and Trash Volume over Time
For the following graphs, the daily bag counts were summed to the week level. Any missing days were imputed as the average daily volume for the week. Week 1 represents the first week following the intervention for all cities, regardless of the actual start date (e.g., even though Atlanta and Boston’s interventions began on different weeks, their first week, and each week following, is represented on the same point on the graph).
Daily Recycling and Trash Volume over Time – All Conditions
Figure 38. Volume of Recycling and Trash by Week for All Conditions
Overall, there are no discernible differences in the volume of trash and recycling over the course of the experiment. The volume of trash and recycling tend to increase and decrease together.
0
0.5
1
1.5
2
2.5
3
3.5
4
4.5
5
1 2 3 4 5 6 7 8 9 10 11 12 13 14 15 16
Nu
mb
er
of
Bag
s
Week
Recycling
Trash
Key Findings: Daily volume data showed no significant changes or meaningful trends.

Daily Recycling and Trash Volume over Time by Condition
Below are figures of the volume data split by condition. Overall no one condition did better or worse than the others in terms of increasing recycling volume and decreasing trash volume.
Figure 39. Volume of Recycling and Trash by Week for the Equal-size Condition
Figure 40. Volume of Recycling and Trash by Week for the Recycling Only Condition
0
1
2
3
4
5
6
7
8
1 2 3 4 5 6 7 8 9 10 11 12 13 14 15 16
Bag
s P
er
We
ek
Week
Recycling
Trash
0
0.5
1
1.5
2
2.5
1 2 3 4 5 6 7 8 9 10 11 12 13 14 15 16
Bag
s P
er
We
ek
Week
Recycling
Trash

Recycling at Work
59
Figure 41. Volume of Recycling and Trash by Week for the Little Trash Condition
Figure 42. Volume of Recycling and Trash by Week for the Information Only Condition
0
0.5
1
1.5
2
2.5
3
3.5
1 2 3 4 5 6 7 8 9 10 11 12 13 14 15 16
Bag
s P
er
We
ek
Week
Recycling
Trash
0
1
2
3
4
5
6
1 2 3 4 5 6 7 8 9 10 11 12 13 14 15 16
Bag
s P
er
We
ek
Week
Recycling
Trash

Conclusions
Overall, this study had some very desirable outcomes. The conclusion section begins with a summary of the desirable and undesirable results of each condition (undesirable results underlined for emphasis), followed by a comparative evaluation of the conditions. Next, there is a discussion of the priority materials of focus for future office recycling programs. Finally, there is a short overview of trends in the beverage, refund, and daily volume datasets.
There were 10 specific waste items emphasized in the informational flyer: 5 recyclable items and 5 trash items. In the analyses, participants’ scores for knowledge, difficulty, and importance ratings of these specific items were totaled by all 10 items, and by recyclable and trash item groupings (See Appendix A for flyer). These results are called “specific item” or “specific recyclable item results”, as compared to the general results of “recycling knowledge”.
Equal-size
The Equal-size condition involved paired, equally sized recycling and trash bins in each employee’s office or workspace.
From the survey, the matched Equal-size condition respondents had a significant increase in knowledge for all specific items, general recycling behavior, importance of recycling of all specific recyclable items, and a significant decrease in specific recyclable item difficulty. While the condition saw significant increase in the waste audit data for the percentage of recyclables in recycling, there was a corresponding non-significant reduction in the percentage of recyclables in the trash. This suggests that not only were there more recyclables in the recycling, but that they transitioned from the trash to the recycling (rather than simply increasing the volume of recycling, and therefore waste, overall). Finally, it is clear that generally the Equal-size respondents had a positive experience with the project. Overall, while these results did not encompass all potential categories in which changes would ideally occur, all changes observed were desirable in the course of a recycling program. The takeaway from this condition is that it did achieve some improvements in reported knowledge, behavior, importance, and difficulty, as well as increasing recyclables in the recycling rather than the trash. Therefore, two equal-sized bins could be an effective recycling program—however, the Little Trash condition saw a greater number of desirable effects (see Little Trash conclusions). A few comments from Equal-size respondents on the survey:
“[The thing I did differently because of Recycling at Work was…] I could recycle at my desk versus having to go into the kitchen or some other place in the office to recycle
something.”
“[The thing I did differently because of Recycling at Work was…] I recycled more often and with more confidence since I now have a better understanding of what to recycle and
what not to [recycle].”

Recycling at Work
61
Recycling Only
The Recycling Only condition involved each employee’s office having only a recycling bin at his or her desk (the trash bins were available only in common areas).
From the survey, the only desirable significant result for the Recycling Only condition was a significant increase in general office recycling knowledge. While not statistically significant, Recycling Only did see a trend of increasing general difficulty and a trend of decreasing general importance of office recycling. Recycling Only also saw a significant decrease in the importance of several specific office items, home recycling knowledge, and importance of public recycling.
From the audit, Recycling Only had a significant decrease in total recycling bag weight, but there was not a corresponding trend of an increase in total trash bag weight. The condition also saw a non-significant trend of a higher percentage of recyclables in the trash. However, the percentage of recyclables in the recycling stayed about even, though this may relate to the decrease in total weight. Given the lack of a corresponding change in the other bag type for these audit data results, they are not necessarily negative, as it is unclear exactly what is happening to the materials. Similarly, Recycling Only experienced a statistically significant decrease in the count of plastic beverage bottles in the recycling over time—however, again, there was no corresponding significant increase in the count of bottles in the trash. For all of these results, the corresponding categories did not reflect the changes, so it is difficult to say what is happening in the office, whether fewer bottles are being recycled because people are choosing to put them in the trash or because people are simply using fewer bottles and making the same disposal decision as they did before the project. Either way, these results do not show desirable shifts in recycling behavior.
Finally, the Recycling Only respondents were somewhat split on whether they had a positive experience with the project. Moreover, four Recycling Only offices dropped out of the project when they learned about the condition they had been assigned, indicating generally negative feelings about the bin set-up. Overall, this condition produced primarily undesirable or neutral changes —while there was some increase in knowledge, there was no other desirable change. The takeaway from this condition is that it did not produce the ideal result—while the audits did not show concretely negative results, the survey indicated there were quite a number of negative changes, from decreased feeling of importance of recycling to non-significant trends of increased difficulty. This type of bin set-up would likely not produce a successful program. A few comments from the survey:
“[The thing I did differently because of Recycling at Work was…] I used to recycle more because before this program I had a recycling bin and a trash bin at my desk.”
“[One thing I would change about Recycling at Work is…] [I] need to have both trash cans in my office, not just a recycle bin. For example, I eat a banana every day and
having to walk the peel to the kitchen room is a nuisance.”

Little Trash
The Little Trash condition had each employee with a full desk-sized recycling bin and a small hanging trash bin.
From the survey, Little Trash saw significant increases in almost all office knowledge areas, all office behavior categories, and general public recycling behavior. Little Trash saw a significant decrease for the specific recyclable item difficulty and saw a nearly significant decrease for general recycling difficulty. The waste audit data showed a significant increase in the percentage of recyclables in the recycling and a corresponding significant decrease in the percentage of recyclable items in the trash, suggesting more of the recyclable waste in the offices was being properly disposed of in the recycling rather than the trash. Similarly, Little Trash saw a statistically significant increase in office paper in the recycling and a corresponding significant decrease in office paper in the trash. Finally, almost all the Little Trash respondents had a positive experience with the project. Overall, it is clear that Little Trash was the strongest condition, showing a wide range of desirable changes in both the survey and the audit. A few comments from the survey:
“[The thing I did differently because of Recycling at Work was…] I pay more attention
when disposing of anything.”
“[One thing I particularly liked about the Recycling at Work project was the…] different sized bins really helped.”
Information Only
The Information Only condition had no change in bins, with employees only receiving the recycling flyer.
The only significant change for the Information Only condition was an increase in specific item recycling knowledge, with no other significant survey results. From the audit, the only significant change was the total trash weight, though the baseline and audit weights were fairly similar, and there was no corresponding change in total recycling weight. The specific Recycling at Work questions did indicate the most respondents had a positive experience with the project, though not as positive as the Equal-size or Little Trash conditions. Overall, these results are telling of the kind of low influence a typical “information only” program has on the participants, and was a good control situation for this research.
Conditions—Evaluation
The results indicate that the Little Trash condition had the strongest results and would be the best recycling bin set-up out of the conditions tested in this research. While the Equal-size condition saw some desirable results, they did not compare to the results of the Little Trash condition. However, if a building already had equal-size bins and was unable or unwilling to invest in the bins for the Little Trash condition, the Equal-size condition would be the next best. These results also show that the Recycling Only condition does not seem to be an effective strategy—there were almost no desirable changes. Finally, the results of the Information Only condition speak to the importance of going beyond an information-only campaign.

Recycling at Work
63
Priority Targets for Later Programs
The prevalence data demonstrated the frequency of our ten targeted items in the recycling and the trash. Priority was ranked based on how frequently each material was found in the participating office during the baseline audits. While the frequency does not speak to how much of each item was present, this data can provide a big picture view of what items are most important to focus on for an office recycling program. This is not to say that the “lower priority” items should not be included in a recycling program, as they were still found in some offices. However, an ideal program is focused on not overwhelming participants with too many behaviors and too much information. Therefore, a program should start with focusing on a small number of high priority materials that are very likely to both be in the office and be ending up in the wrong bin, and then later starting to messaging on lower priority items.
Percentage of offices during the baseline audit with the material found in INCORRECT bin is noted.
Higher Priority (over 50%)
1. Paper Towels were very frequently ending up in the recycling bin, where the audit team found them in 92% of offices in the baseline audit. It is possible people confuse “paper towels” as paper, which leads to a higher amount of contamination in office settings.
2. Office paper is the most frequently recycled material, but was also found in the trash of 79% of offices during the baseline audit.
3. Plastic Beverage Bottles were found in the trash of 54% of offices during the baseline audit.
4. Food Scraps were found in the recycling bin in 52% of offices in the baseline audit, indicating a fairly high level of contamination.
5. Aluminum Beverage Cans were found in the trash of 50% of offices during the baseline audit.
Medium Priority (25% to 50%)
1. Plastic Eating Utensils were found in the recycling bin in 44% of offices in the baseline audit. 2. Used Paper Plates were found in the recycling bin in 41% of offices in the baseline audit.
Lower Priority
1. Bubble Wrap was only found in the recycling of 22% of offices in the baseline audit. 2. Frozen Dinner Boxes were only found in the trash of 18% of offices in the baseline audit. 3. Soup Cans were only found in the trash of 14% of offices in the baseline audit.
Other Materials
Two other materials were mentioned in the survey comments as things people wanted to recycle at work: Plastic Bags and Batteries. None of the waste haulers at our participating buildings would accept either of these materials, so offices would need to find an outside hauler or group that would remove the materials. Both materials were of interest to office workers, enough perhaps for two shared bins for each floor, one for batteries and one for plastic bags. However, it is important to note that the research team did not track the quantity or present disposal method for these materials.

Spillover
Spillover occurs when a program influences behaviors outside of its direct focus. In this project, spillover was measured through survey items on recycling in the home and in public places to see if a program on recycling in the workplace had any effect on these behaviors. However, the results indicated that there was very little spillover into these realms. While unfortunate, it is logical that the amount of spillover would be low, as the barriers to recycling at home and in public spaces are likely different than those in the office.
Beverages and Refund
Overall, this data was meant to provide a more up-to-date dataset on what is consumed in an office setting, so this information was analyzed from the standpoint of overall trends. Soda, water, and coffee, in that order, are the top beverages purchased from vending machines. For single use beverage containers brought into work, water is most popular, followed closely by coffee and soda. For reusable containers, water was the highest by far, followed by coffee.
If respondents were in a state that offers a beverage refund, they were more likely to be certain that their state had a refund, and were able to accurately state the amount of the refund. Respondents in states without a refund more often reported that they did not know whether beverage container refunds were available in their state. Even in states with a refund and even when office workers were aware of the refund, most reported never returning a bottle to get a refund.
Volume
Overall, the figures show that the total volume of trash and recycling did not change significantly over the course of the study. This data is weakened by the lack of a baseline, but it may still suggest that this is not a strong metric for evaluating office recycling programs. These results makes sense, as one would not expect that the total volume of waste being produced to change dramatically, even as the composition of each bag improves, as some recyclable items are moving from trash to recycling and some trash items are moving from recycling to trash.

Recycling at Work
65
Challenges and Recommendations
In addition to the wealth of quantitative data from the survey, daily volume sheets, and waste audits, the research team also collected qualitative data throughout the project. This information is used throughout the next two sections to identify challenges and recommendations for buildings looking to implement a similar program and researchers looking to replicate and expand upon the initial study. These challenges and recommendations should be used in conjunction with the results listed in the conclusions section for program implementation and future research.
Recommendations for Office Buildings
This first section is focused on what a building manager could learn from this research and use in existing or while initiating recycling programs. Presented in each section below are the challenges faced during the Recycling at Work project implementation. Following the challenges, strategies to overcome them in future programs are proposed. Finally, this section concludes with a list of considerations for planning a recycling program.
It is important to note that these results are most applicable in areas that have single stream recycling, as this project focused on introducing one bin for recycling, not two. There would likely be different barriers and considerations for a program that required separation of materials. During recruitment for this project, Chicago was originally on the list of cities. However, commercial businesses there are legally required to separate paper from other recyclable material, and since our bins were made with single stream recycling in mind, they had to be removed from the project. General recommendations not focused on bins, however, could be used by any building manager.
Infrastructure Challenges
One building level challenge observed with the new small bins was the bin liners. The liners currently purchased and used by buildings (e.g., the ones most buildings typically have available) were too large for the little hanging trash bin. While they could be made to work, the solution (double tying the bags) wasted a large amount of the plastic bag due to the inappropriate size. Additionally, it took more time to make these bigger liners work, which put a burden on the cleaning crew.
A second challenge for the Equal-size condition was that sometimes the small size of the employee’s workspace posed a challenge for fitting both bins in comfortably for the employee. However, without a convenient place to recycle in the office, employees may be unlikely to recycle. A comment from the survey, “My office is too small to contain both a trash bin and recycling bin. Often I combine the two - trash and recycling in hopes the cleaning crew will sort.”
Another building level challenge in implementing a consistent recycling program is the difference between “employee space” and “customer space”. In employee space, such as break rooms and desks, offices were usually fairly flexible about the look of bins and what kind of information could be posted. However, for conference rooms, many offices had invested in very high quality bins that they wanted to retain, as they matched the look of the office. In addition to the challenge of fitting two desk-sized bins in smaller offices, some common areas also had space issues, ending up with the smaller desk-sized bins,

rather than the large common area sized bins, since they did not have enough room for the larger bins intended for common areas.
Recommendations to Overcome Infrastructure Challenges
Small liners: The building would need to invest in correctly sized bin liners when purchasing the little hanging trash bins, or consider whether the bins could be used with no liner.
Implement Little Trash: The Little Trash condition yielded the best overall results in the study. It also overcomes the barrier of limited under-desk space. However, if a building is unable or unwilling to invest in new smaller bins, the next best option would be to implement the Equal-size condition. As a general best practice, no matter what bin set-up is implemented, it is vital to clearly label bins on what can and cannot be recycled/placed in the trash, as well as provide information to employees and cleaning crew on how the program works.
Charge for nicer bins: If buildings provide bins, they could charge a little extra for more aesthetically pleasing paired recycling and trash for use in conference areas, sold as a matched pair to encourage offices to have both in their conference rooms. It is an important area for a recycling bin, as offices often offer water bottles or other drink bottles to guests.
Challenges for Recruiting & Communicating with Offices
Despite building managers’ enthusiasm and feelings that it would be easy to get at least 10 offices in each respective building or complex, recruitment fell short at all buildings except San Diego. Offices communicated several major reasons for this to their building managers. First, they already had some kind of recycling program in place, and saw no reason to change it. They couldn’t see how a program could be better than what they currently had. Second, they believed that everyone in their office already knew everything there was to know about recycling, so there was no gap in knowledge for them. Since we did not interview or directly talk to any offices who refused our study, we cannot say for certain if this was true, but given the complexity of recycling, this seems unlikely. It is more likely that people are unaware of what they don’t know about recycling. Third, some offices indicated to their building managers that despite their interest in participating in the study, they could not commit to the time required as their staff was already overworked. Even with Recycling at Work’s emphasis on the minimal time commitment, there was still a resistance to volunteer. Finally, for some offices, there was a lack of a champion, where the office contact had no interest in engaging their workplace in a recycling program. A comment from the survey, “Recycling is not that important to me, but if it is easy, I try to do it. I do it more at home, because it is easier.”
Another recruitment issue was that given building managers’ busy schedules, the primary method of recruitment was via email, followed by phone calls. Despite the building managers’ valuable role of social influence, given their authority in the building, the passive method of recruitment may have negated this influence.
Finally, in the participating office park in Atlanta, the recycling program in place relied on the color of the liner to indicate the type of bin, where a clear liner meant recycling and black liners meant trash. This baseline bin set-up was very different than the three other participating buildings (San Diego, Boston, and Houston), where the program ran on more traditional bin labeling (either using color or text). The building did not provide bins, so this liner was meant to be their way of creating the same program across

Recycling at Work
67
the building. While an interesting idea, it did not seem to be easily understood, as most offices were not even aware there was a recycling program, even though their desk bin was intended only for recycling. Often offices were unaware and reluctant to believe that was, in fact, their current program. As the research team tried explaining to people about their current existing program, there were a number of negative reactions, as well as disbelief.
Recommendations to Overcome Recruitment and Communication Challenges
Create a norm: Recycling programs may work better if framed as a full building program, where individual offices would opt out if desired rather than being asked to opt in. This sets recycling up as the norm in the building, and given the general acceptance of recycling as a positive behavior, it seems unlikely most offices would take the time and energy to opt out of a program. A norm would potentially also help overcome the need for a champion in the office, since when recycling is the normal thing to do, there is no need for a single person to champion the cause (though it never hurts).
In person recruitment: This kind of recruitment may be necessary to get people on board with a new program. All of the participating buildings already had regular meetings with representatives from offices on building relevant topics, which could provide an opportunity. However, all of our building managers said they go over recycling in these meetings and still faced a number of issues with contaminated or low levels of recycling, speaking to the need for interventions that extend beyond providing information. For example, perhaps buildings could have sustainability interns or a sustainability person who goes from office to office, taking a small portion of a staff meeting to speak to offices about participating in the recycling program, as well as providing information, in a face-to-face setting that may help get people on board. Being invited into the staff meeting would also speak to the support the office administration has for recycling. (see page 74 for a link to Keep America Beautiful’s resources to build a recycling program in the workplace)
Provide clearly labeled bins: While Atlanta’s idea for bins was novel, it seems as though it was generally unsuccessful. Communication about recycling programs is already a challenge. Adding another layer of difficulty, in that people are not used to looking at their bin liners for guidance, simply increased that challenge. While providing bins is certainly an expense for buildings, it may be necessary to run a successful and functional program. A comment from the survey, “[One thing I particularly liked about the Recycling at Work program was the…] description list of what to recycle on bin” (Equal-size) (See Appendix A for labels used in the project).
Observational Takeaways
The research team also made note of observations throughout the implementation process that were not necessarily challenges, but nonetheless important considerations when planning a recycling program.
One such observation was that the relationship between buildings and offices is not straightforward. While the building has the authority to set policies, they also need people to be willing to rent their office spaces. Buildings wouldn’t want to impose a program on offices that they strongly oppose—they need buy in from offices. Therefore, when introducing a program, it’s important to stress that it will be easy and understandable.

A comment from the survey, “[One thing I particularly liked about the Recycling at Work program was the…] ease of use and the fact that it didn't really intrude into normal operations” (Equal-size).
Most office contacts were enthusiastic about recycling and bragged about their other environmental initiatives, which showed that they have pride in these kinds of activities. This attitude would suggest that introducing a recycling program would be a fairly easy process. However, despite their interest, there was a great deal of misunderstanding and missing information about their own recycling programs, which speaks to how concern for the environment and interest in recycling does not directly lead to people taking action to establish a program. Moreover, while information about the recycling program can help clear up misunderstandings, this information alone will not spur a major change in behavior, as demonstrated by the Information Only condition’s lack of chang. This reinforces the importance of going beyond information to make recycling programs easy and understandable, such as by using the best practices for infrastructure and establishing recycling as the building norm.
Checklist of Considerations when Planning a Building Recycling Program
This project sought to address the issue of the best placement of recycling and trash bins within an office setting, as well as collect information on the frequency certain items were found in the trash and recycling waste streams. However, both this project and recycling programs in general exist in a much larger context than bins in an office. While the results of this single project cannot speak to the best practices of an entire recycling program, a combination of literature review, observational research, and involvement of experts in the recycling field did inform the following list of steps and important considerations for planning a recycling program. Where possible and appropriate, the list includes known best practices, other research, and observational comments.
Determine relevant stakeholders o Potential stakeholders include:
Leasing/management office Sustainability manager Head of cleaning crew Facilities manager Representatives from key office tenants
o Input from these stakeholders will help ensure that each group’s needs are met and potential issues or complications are caught early in the process.
o Buy-in is needed from all stakeholders for a successful program. Identify a recycling program coordinator
o Input from stakeholders is important, but for a program to be successful, there needs to be someone who is focused on coordinating the program as a whole.
Acquire a recycling hauler o The building’s current trash hauler may provide recycling services, which is likely the
easiest route. If not, they may have information on who can provide local service. Decide bin set-up and purchase
o Our project results recommend a little hanging trash bin and a regular sized recycling desk side bin, as this set-up had a wide range of desirable results (increased knowledge, fewer recyclables in trash, etc.) through drawing attention to recycling while still providing a place to dispose of trash in the office.
o Consistency is important to avoid confusion within offices and among cleaning staff. Programs will be more consistent if the same bins are provided building-wide (as when implemented by building managers rather than by individual offices independently).

Recycling at Work
69
o A strategic set-up is important in fostering recycling behavior, as information only programs, both in general and in this project, do not generally lead to changes in action.
o Consider whether bin liners are needed for recycling bins and purchase appropriately sized liners for trash bins (such as small liners for hanging bins). Not using liners can provide both cost and time savings.
o Consider whether bin lids are needed, as they can help with collecting specific items (cans, bottles, paper), but may be extra work for the cleaning crew or employees with unusual items (e.g., cardboard boxes).
Locate and distribute educational materials to offices and building staff about what can be recycled
o The hauler or the local government will likely have pre-made flyers on recycling. Keep America Beautiful’s site, www.recyclingatwork.org, also has a number of resources.
o Provide specific and clear information on what materials are and are not acceptable in the recycling program. In this project, the flyer colors matched the bin (recyclable items were on the blue side, trash items were on the grey side, same as the bins).
o Consider increasing clarity by pairing photographs with the text listing common materials used in an office (see Results of Priority Items).
o Avoid confusion about unusual items not pictured by providing training and a link to detailed information if available from the hauler or local government.
Introduce program to offices and gain commitment from key personnel o Use multiple communication methods to ensure all participants are aware of your
program, such as emails, flyers around the building, and announcements during any regular building meetings.
o Ask office leaders (management, office managers, etc.) for their support in promoting the program around the office.
Place bins and signage o Provide clear instructions to crew on how bins should be placed. Research suggests that
recycling behavior happens much more often when it is convenient, so having a bin at each desk will help provide that (e.g. one hanging trash and recycling bin pair per work station, as well as paired bins in every common area).
o Include clear, simple signage with the bin, near the bin, and/or directly to employees to clearly communicate what is and is not recyclable.
o Suggest to offices that they include recycling in their employee manuals by providing a short paragraph on the recycling program.
o Allow offices to opt out if they strongly desire, but treat the program as the building standard.
o Ask for feedback from offices and the cleaning crew for initial feedback on challenges. Provide introductory and ongoing training to offices
o Training sessions can be used to make sure everyone understands the program and convey the importance of recycling (see the Introduction for recycling facts).
o Ask every office to send at least one representative who can then present the information to the staff to provide personal contact. Personal contact with a member of their work community can create a level of social influence, where people want to act because they know recycling is valued and supported by their fellow employees. This person could also be provided with template presentation material from the building
o In order to increase the visibility of the program, consider creating some kind of signage or certificate that the person who went to the training is the office’s recycling ambassador.
o Create a training module so that when new offices rent space, they can be easily trained on the program. Consider running building trainings on a regular basis (every 2 to 6 months) where both new and old employees and offices can attend.

Provide introductory and ongoing training to cleaning crew o Work with the supervisor of the cleaning crew to develop an effective collection system,
such as wheeling around a cart with two large bags, one for recycling and one for trash. o Provide clear training to crew members on which bins will have recycling and which will
have trash, when a recycling bin is considered too contaminated, and where trash and recycling bags should go after collection.
o Provide training materials for cleaning crew to train new employees as they are hired o If any big changes occur with the cleaning crew, such as a change in the head of the crew
or multiple new employees, set-up a new training. Create an evaluation document that is completed at regular intervals – document irregularities, emerging issues, etc. – to ensure program is operating successfully.
Evaluate and improve o For example:
Ask cleaning crew for observational assessments Ask offices for feedback Conduct a waste audit for a more in-depth evaluation beyond self-reported
measures from employees or cleaning crew Maintain contact with hauler about changes to recyclable materials
o As markets change, the list of acceptable materials may change. Touch base with the hauler on a regular basis to inquire about changes.
Resources for Planning a Building Recycling Program
While the list above provides a good overall structure for planning a general recycling program, there may still be further questions or other steps needed to build out a program that fits a building’s specific needs. Keep America Beautiful currently runs the Recycling At Work program, which seeks to provide offices and buildings with the resources, tips, and information they need to implement, run and improve their recycling programs.
More information, example signs, recycling activities, and tips for building and improving a recycling program can be found at: http://recyclingatwork.org
They also have their own 10 steps to a program, listed below:
1. Make Commitment 2. Assemble Team 3. Conduct Audit 4. Develop a Plan 5. Make it Easy 6. Launch Your Program 7. Monitor Progress 8. Publicize Success 9. Buy Recycled-Content 10. Encourage Others
For details on each step, visit: http://recyclingatwork.org/10-step-action-plan/
For more information on how recycling ties into LEED certification, visit: http://www.usgbc.org/certification

Recycling at Work
71

Recommendations for Future Researchers
Prior to this project, the research team found very little previous research on office recycling (see Background for literature review). Therefore, this project’s methodology and results could provide the foundation for a number of future projects on the topic of office recycling. This section seeks to provide future research teams with recommendations for improving the effectiveness and efficiency of their work with offices, and suggest a number of interesting research questions for future study.
Challenges in Buildings
One of the major challenges in this research is the huge amount of variation between buildings, as well as the offices within them. The average number of employees for all offices was 15 people, but offices ranged from 2 to 70 people, which implies there are many other important distinctions, such as different levels of social accountability within the office. A few offices had sensitive documents shredded and removed from their office, which changes the amount of paper that can be recycled. About half the offices that participated in this study were law offices, while the rest comprised a mix of insurance, financial, real estate, consulting, and other types of businesses. The majority of offices had some preexisting knowledge of what was recyclable, either from the building or from common sense. When information about recycling was communicated, it was usually a posted print out of the building’s recycling procedure, though it was sometimes also presented verbally at a building or office meeting. Information was very rarely emailed, and almost no offices had a formal policy about recycling. Identified motivations for recycling in the absence of a formal policy varied from personal desire and a green culture to encouragement from “champions” and unwritten office policy, with no clear winner. Identified barriers were also fairly evenly split between a lack of concern, infrastructure, or time, as well as confusion or forgetfulness. Overall, this wide variation between offices is controlled for by random assignment to conditions—however, it would still be preferable for future research to engage offices that are more similar to each other than this sample.
Recommendations to Overcome Building Challenges
For future research, it may be ideal to focus on recruiting an entire building, which goes along with the idea of creating a “norm” of a recycling program. This could work by having buildings enroll in research, and letting offices opt out if they so desire.
Challenges in Conditions
Next, when the team was putting conditions in place, the introduction of the Recycling Only condition was met with a number of negative reactions or disbelief. People told the team that they needed a trash bin at their desk for tissues, small snacks, gum wrappers, or other items they use at their desk throughout the day and do not want to have to dispose of by walking all the way out to a common area trash bin. These reactions were what led to a number of project dropouts in the Recycling Only condition.
Recommendations to Overcome Condition Challenges
The negative reactions and deterred participation were such a strong point against the Recycling Only condition that it is unlikely any adjustment would overcome this challenge. For future research, these results suggest that this condition should not be tested, as the need for somewhere to put small daily trash items in the office is evident and powerful. Given the non-recyclability of things such as dirty tissues, candy wrappers, and food scraps from lunch eaten at the desk, unless future technology changes what can

Recycling at Work
73
be recycled, there will likely continue to be a need for a personal desk trash area. We could continue to refine this information by conducting a survey on what people throw in their desk trash bins to get a clearer picture of what is in desk trash versus common area trash.
On-site Logistics Challenges
Another challenge was that setting up the bins took multiple days, even for the limited number of offices participating. A number of offices had underestimated their total employees and common areas, and in some offices, even if the estimated number of workers was accurate, the desks and workspaces requiring set-up outnumbered the employees, all of which accounted for set-up taking even more time than anticipated. The research team was preparing for bin set-up remote, so they had to make preparations using the provided estimates. Since the bins had been ordered based on the employee count and a small room for error, this led to the team needing to go back to the storage room to get more bins, even if they had overestimated by a couple pairs. Finally, the time it takes to put a liner in each bin is much longer than the team expected. The research team ended up working late into the night to finish at some buildings.
Conducting the waste audits was also a fairly time consuming process, taking between 2 and 5 hours, depending on the number of team members and offices. Hygiene for the auditors was an obvious concern, despite the unlikelihood that they would encounter used needles, as things like tissues and paper towels could still have contagions or bodily fluids that would be cause for concern. Therefore, all auditors were required to wear gloves and sanitize their hands. Consistency was also an issue, as there were four different audit teams, one in each city.
Overall, interacting with the cleaning crews was fairly easy, despite initial concerns stemming from the fact that the team would need a fair amount of assistance from the crew without offering much in return. Suggestions for how to ensure this ease of interaction are listed in the recommendations section.
Recommendations to Overcome On Site Logistics Challenges
Bin Set-up: If another research team is taking on this amount of bin set-up (or more!), the job is much easier with at least a four person team, as one person can coordinate, one person can assemble bins, while two people set-up the bins around the office.
Waste Audit: It is very important to keep the auditor’s safety top of mind. For future research, the auditors could also take more detailed notes of the quality of recycling. Having a written, straightforward protocol that was distributed to all auditors was helpful, as well as having the same person train each team during the first audit. The list of what can and cannot be recycled in each city was also attached to the back of the auditor’s clipboard as a helpful guide. Sheets were also printed on blue paper for recycling and grey paper for trash to increase accuracy in recording.
Cleaning Crew: The hierarchy is highly defined, so with all supervisors on board, the crew was on board. One anecdotal failure of recycling programs is not engaging the maintenance staff. While it is likely true that most people are not looking for extra work, if they are engaged with the program and know that their feedback is meaningful (such as in this program, where the supervisors knew they could contact the research team, who welcomed their input), the research team found that everyone was very friendly and more than willing to work with them.

Cleaning Crew: The high degree of cooperation from the cleaning crews may have resulted from the fact that the program is set-up to not alter their routine more than necessary, in order to make the program sustainable and to get the crew on board. The supervisors also communicated to the team that they were appreciative of the chance to participate in a meaningful program. Finally, the research team also provided the cleaning crew with coupons for a free 2-liter Pepsi product, which was well received.
Cleaning Crew and other Contacts: As a note, all points of contact (building, cleaning, and office) were also given personal thank you letters for all their effort at the end of the project. The research team would suggest that any future researchers offer similar letters, as these kinds of research projects could not be successful without the hard work of everyone in the building.
Survey Distribution
Finally, getting the office contacts to distribute the surveys throughout the program was a challenge, particularly the post-project survey, when all the new excitement had worn off. It is very understandable that offices wanted to protect the privacy of their employees by not giving out their emails. However, this meant that the research team needed to draft multiple emails, one for distribution by the team and one for distribution by office contacts. It also meant the team needed to set-up a schedule with the office contacts, as the timing of emails needed to be fairly similar between the offices. The team also had to do a large amount of follow up emails and calls to get back in touch with offices, remind them about the emails, and see if they had gone out, which was extremely time consuming, both for the research team and the office contacts. It was likely also stressful for the office contacts, as the survey had to go out at a particular time, which for several fell during busy times of year for them.
Recommendations to Overcome Survey Distribution Challenges
Require email lists: For the sake of time, it is recommend that future teams only allow offices in the study that agree to provide an email list. It was simply too time consuming to keep after office contacts in the way necessary to get emails forwarded, and was not a positive relationship builder between the research team and the office contacts. A potential compromise could be creating a written agreement that addressed any office’s concerns with privacy, where the research team committed to only use the list for this study and destroy it after. Another idea is that a research team could employ technology such as a listserv to protect the identities of participants.

Recycling at Work
75
Next Steps: Future Research Questions
Below is a list of research questions generated through the Recycling at Work project that could serve as guidance for future office recycling research.
1. Should auditors record the quality, as well as the quantity, of the material in recycling bins—for example, is it more meaningful to have a smaller amount of clean paper or a larger amount of dirty paper? Waste audits could separate out clean and dirty material and measure them separately, as well as create a measure for liquids collected.
2. What kind of programs would work best in cities with a separated material recycling program? Would a split recycling bin be functional, would each office need three bins (or more), or would some other design be most effective?
3. Do separated material programs lead to cleaner recycling than single stream, given that plastic materials are usually what have the food or drink material inside?
4. Would freedom of choice lead to more effective programs? For example, if each employee could choose the set-up for their workspace from two or three options, would everyone recycle more effectively? Would it increase engagement in the program in a way that would be worth the initial time commitment?
5. Another point of interest is the need to shred legal documents, as shredding degrades the quality of paper, even if it is eventually recycled (which it was not in all offices). Future research may look into other ways sensitive information could be protected without degrading paper quality en route to recycling.
6. Are office parties and events a major contributor to materials ending up in the incorrect bins? Do these events, which may happen at a somewhat high level of frequency depending on the number of birthdays, holidays, and other special occasions that are celebrated in each office, lead to poorer outcomes for recycling? If so, how could this be alleviated?
7. Would a recycling event or a short presentation in each office’s staff meeting make a significant difference? Is it more meaningful if the information is presented by a fellow employee versus the building manager or a representative from a non-profit?
8. Would a written commitment to recycle by the office make a meaningful difference? By each employee?

Reference List
Brothers, K.J., Krantz, P.J., & McClannahan, L.E. (1994) Office Paper Recycling: A Function of Container Proximity Journal of Applied Behavior Analysis 27: 153-160.
Cascadia Consulting Group (2006, June.) Targeted Statewide Waste Characterization Study: Waste Disposal and Diversion Findings for Selected Industry Groups. California Environmental Protection Agency Integrated Waste Management Board, Retrieved from: http://www.calrecycle.ca.gov/Publications/Documents/Disposal%5C34106006.pdf
Humphrey, C.R., Bord, R.J., Hammond, M.M., & Mann, S.H. (1977) Attitudes and Conditions for Cooperation in a Paper Recycling Program Environment and Behavior 9(1): 107-124.
Ludwig, T.D., Gray, T.W., & Rowell, A. (1998) Increasing Recycling in Academic Buildings: A Systematic Replication, Journal of Applied Behavior Analsys, 31(4): 683-686.
Marans, R.W. & Lee,Y.J. (1993). Linking recycling behavior to waste management planning: a case study of office workers in Taiwan, Landscape and Urban Planning 26: 203-214.

Recycling at Work
77
Appendices
Appendix A-Recruitment and Project Design Elements
Contents
Office Building Recruitment Flyer 78
Office Introductory Email and Telephone Contact 79
Common Area Bin Logos 81
Desk-side Bin Logos 82
Informational Flyer 83
Recycling Bin Sign 84
Trash Bin Sign 85
Mid-project Email 86
Equal Size Pictures 87
Recycling Only Pictures 89
Little Trash Pictures 91
Information Only Pictures 93
Common Area Pictures 94

Office Building Recruitment Flyer

Recycling at Work
79
Office Introductory Email and Telephone Contact
Email:
Hello ___
My name is Katy Phelps, from the Recycling at Work research project your building manager, ___, emailed you about. First, I want to thank you in advance for your participation in this project. I am reaching out to today for the following reasons:
1. Confirm you are the best contact person for your office. If there would be a better contact person, please let me know and if possible, forward this email to them.
2. How many employees work at your office? 3. Finally, I have a few questions about the current set-up of your office’s recycling and trash program.
If possible, I would like to set-up a 15 to 20 minute call to get answers to these questions. If you would prefer, I could also email the questions to you instead. Please let me know a few times that work for you this or next week for a phone call, or if you would prefer an email.
We are extremely excited about this project, as the results will help inform broad recommendations for how to create a high functioning office recycling program. If you have any questions, concerns, or comments, please don’t hesitate to contact me by email, [email protected], or phone, (917) 721-6705.
Thank you and have a wonderful day,
Katy
Telephone:
Hello, is this ___?
My name is Katy Phelps, with Action Research, and part of the team working with CBRE, Keep America Beautiful, and PepsiCo to learn more about how to improve recycling in the workplace. To do this, we wanted to test out a few potential programs that, if successful, would be part of a bigger national set of recommendations. However, for it to be successful, we need offices such as yours to try out the program in its entirety and provide feedback on what was successful and what needs improvement. To be clear, if you like the program, we are happy to have you keep it in place after the study period, but if your office does not like it, we have asked your building to store your old bins so you can return to your previous set-up.
Also so you are aware, as this is a research project, your office may only receive educational material, or you may receive new bins. Once the set-up has been randomly selected for your office, we will inform you of it.
I want to thank your office for participating in this research, and look forward to working together. As I mentioned in my email, prior to the start of the research period, I have a few questions for you about your office. But before we start, do you have any questions for me?
First, just to confirm, are you the best contact for your office?
[if needed: An office contact will:
1. Distribute educational materials 2. Send program announcements, an email for a pre- and post-study online survey, and a reminder email
for the survey (all pre-scripted)

3. Periodically check the placement of trash and recycling bins during the study time period if provided new bins. As this is a research project, not all offices will receive bins, but will receive other program material.
Does this sound like something that would work for you in your office?]
First, I have a few questions to learn how your office currently deals with waste, and how recycling and trash bins are set-up.
Current Cleaning Schedule
1. How often is garbage removed? (Prompts: day[s] of week, time[s] of day) 2. How often is recycling removed? (Prompts: day[s] of week, time[s] of day) 3. Do you have your own cleaning crew that removes garbage or recycling (still ask even if there is a
building crew—to see if they have their own as well) 4. How many recycling bins are currently in your office?
a. Where are those bins located? 5. How many garbage bins are currently in your office?
a. Where are those bins located? 6. Would it be possible for you to snap a photo of each bin type and send to my email? 7. What recycling material is accepted in your office? (prompts: paper, aluminum, steel, plastic [how to
list types], other) a. Where did you get the information on what is acceptable? b. Do you have a link or PDF to a list of accepted material that you could share? c. How do you convey what is acceptable to employees? (prompts: signs on bins, signs near
bins, employee handbook, email, verbal, other) 8. Does your office have a formal recycling policy? If so, can you share it?
a. If not, is there an informal policy (Prompt: What I mean when I say informal policy is that while it’s not written anywhere, there might be a general culture in the office about recycling, or significant support from employees or administration, etc)? If yes, please describe your office’s informal recycling policy
9. Is there anything in particular you’d point to that motivates employees to participate in the recycling program?
10. Are there any particular barriers that make it harder to recycle in your office and if so, have you found any ways to overcome them currently?
Finally, I have a couple of questions about your specific office.
11. How many employees work in your office? 12. What kind of work does your office do? 13. As part of the project, we will be sending a pre and post survey to your employees. Is it possible for
you to provide me with a list of employee emails? (prompt: if no—that’s fine, I understand the need for privacy. For distributing this survey, would it make the most sense for me to send a scripted email to you, and you send it out to your employees)
14. Do you have any questions or comments for me? Thank you for your time! I will be following up with you soon with more details. Please feel free to contact me if you need any further information.

Recycling at Work
81
Common Area Bin Logos

Desk-Side Bin Logos

Recycling at Work
83
Informational Flyer

Recycling Bin Sign

Recycling at Work
85
Trash Bin Sign

Mid-project Email
Hello (name)
I hope this email finds you well! We’re halfway through Recycling At Work, and want to thank you again for participating. We have had some questions from employees about recycling office material not mentioned in our messaging and wanted to send an email to provide information.
If you could distribute the email template below, adding your name, to your coworkers, we would greatly appreciate it. Feel free to customize the language as needed. If you are unable to send it, please let me know.
Please let me know when it has gone out, either by CC-ing/BCC-ing me or dropping me a note, as we want all offices to receive the same information. I will follow up next week if I have not heard from you about the email.
Thank you and have a wonderful day, Katy
TEMPLATE BELOW:
Hello,
Thank you again for participating in the Recycling At Work program: Keep up the great work!
Many Recycling at Work offices across the country have been asking for some additional recycling tidbits, so below are a few tips from the Recycling At Work team:
1. Bottles and Cans: Keep recycling plastic beverage bottles (with caps on) and aluminum beverage cans, but please empty them (no rinsing needed) to avoid getting office paper wet (dry paper is more valuable and easier to recycle than wet paper).
2. Only recyclables: Keep recyclable and non-recyclable materials separate by avoiding things such as stuffing paper towels/candy wrappers in aluminum or plastic beverage containers.
3. Plastic food containers/Food: While plastic food containers can be recycled, please throw any uneaten food in the trash.
4. Labels: The backing sheets of stickers and labels can NOT be recycled.
Recycling allows us to re-use material, conserving natural resources. To achieve this goal, it’s ideal if the material in the recycling bin is clean and dry so it can be turned into high quality new things! Please check with me or the building manager to get a detailed sheet on what can be recycled in our office.
Thank you,
(YOUR NAME)

Recycling at Work
87
Equal-Size Pictures


Recycling at Work
89
Recycling Only Pictures


Recycling at Work
91
Little Trash Pictures


Recycling at Work
93
Info Only Pictures

Common Area Pictures

Recycling at Work
95

Appendix B-Employee Web Survey Documents
Contents
Recycling at Work Employee Pre-Survey 97
Recycling at Work Employee Post-Survey 101
Pre-Test Leave Behind Note and Coupon 110
Post-Test Leave Behind Note and Coupon 111

Recycling at Work
97
Recycling at Work Employee Pre-Survey
PepsiCo, Keep America Beautiful, and CBRE are conducting a study about recycling habits at work. Your office is one of a small number of buildings nationwide participating in this important study. Your responses are critical to this project, as they will be used to develop and improve office recycling programs. Your responses will remain confidential, so please answer honestly. The survey will take about five minutes to complete.
SECTION 0: Pre Questions
TP. To begin . . .
QP1. In what state are you located?
CA GA MA TX
QP2. What is the name of the company you work for?
SECTION 1: General - Office
TGO. This first set of questions is about recycling at your office.
QGO1. Using a scale from zero to ten, where zero equals not at all knowledgeable and ten equals very knowledgeable, how knowledgeable are you about recycling in your office?
0 - - - 1 - - - 2 - - - 3 - - - 4 - - - 5 - - - 6 - - - 7 - - - 8 - - - 9 - - - 10 - - - 98 DK - - 99 REF
QGO2. Using a scale from zero to ten, where zero equals not at all difficult and ten equals very difficult, how difficult is it for you to recycle in your office?
0 - - - 1 - - - 2 - - - 3 - - - 4 - - - 5 - - - 6 - - - 7 - - - 8 - - - 9 - - - 10 - - - 98 DK - - 99 REF
QGO3. Using a scale from zero to ten, where zero equals never and ten equals always, when you have a recyclable item in your office, how often do you recycle it?
0 - - - 1 - - - 2 - - - 3 - - - 4 - - - 5 - - - 6 - - - 7 - - - 8 - - - 9 - - - 10 - - - 98 DK - - 99 REF
QGO4. Using a scale from zero to ten, where zero equals not at all important and ten equals very important, how important to you is recycling in your office?
0 - - - 1 - - - 2 - - - 3 - - - 4 - - - 5 - - - 6 - - - 7 - - - 8 - - - 9 - - - 10 - - - 98 DK - - 99 REF

SECTION 2: Knowledge - Office
TKO. The next set of questions is about where specific types of items get placed within your general office suite. For each of the 10 items, please indicate whether you think the item belongs in the trash or recycling bin.
QKO1. Office Paper Trash Bin Recycle Bin Don’t Know
QKO2. Plastic Beverage Bottles Trash Bin Recycle Bin Don’t Know
QKO3. Aluminum Beverage Cans Trash Bin Recycle Bin Don’t Know
QKO4. Frozen Dinner Boxes Trash Bin Recycle Bin Don’t Know
QKO5. Soup Cans Trash Bin Recycle Bin Don’t Know
QKO6. Food Scraps Trash Bin Recycle Bin Don’t Know
QKO7. Bubble Wrap Trash Bin Recycle Bin Don’t Know
QKO8. Plastic Eating Utensils Trash Bin Recycle Bin Don’t Know
QKO9. Used Paper Plates Trash Bin Recycle Bin Don’t Know
QKO10. Paper Towels Trash Bin Recycle Bin Don’t Know
SECTION 3: Behaviors - Office
TBOa. This set of questions asks about your consumption of beverages while at your office.
QBO1. On a typical work day, how many beverages do you consume while you are at work? ______ [if 0 ►SKIP TO BO6]
QBO2. Do you have access to beverage vending machines while you are at work?
1. YES 2. NO [►SKIP TO BO4] 8. DON’T KNOW [►SKIP TO BO4] 9. REFUSED [►SKIP TO BO4]
QBO3: In a typical work day, approximately how many beverages do you buy from the vending machine?
Water _____ Soda _____ Energy _____ Juice _____ Coffee _____

Recycling at Work
99
QBO4: In a typical work day, approximately how many disposable beverage containers do you bring to work from outside your workplace?
Water _____ Soda _____ Energy _____ Juice _____ Coffee _____
QBO5: In a typical work day, approximately how many beverages do you consume from reusable beverage containers?
Water _____ Soda _____ Juice _____ Coffee _____
TBOb. This next set of questions asks about where you place specific items while at your office.
Thinking about the last time you finished using each item while at your office, where did you put it?
QBO6. Office Paper Recycle Bin Trash Bin Took Home Other________ Don’t Use
QBO7. Plastic Beverage Bottles Recycle Bin Trash Bin Took Home Other________ Don’t Use QBO8. Aluminum Beverage Cans Recycle Bin Trash Bin Took Home Other________ Don’t Use
QBO9. Frozen Dinner Boxes Recycle Bin Trash Bin Took Home Other________ Don’t Use QBO10. Soup Cans Recycle Bin Trash Bin Took Home Other________ Don’t Use
QBO11. Food Scraps Recycle Bin Trash Bin Took Home Other________ Don’t Use QBO12. Bubble Wrap Recycle Bin Trash Bin Took Home Other________ Don’t Use
QBO13. Plastic Eating Utensils Recycle Bin Trash Bin Took Home Other________ Don’t Use QBO14. Used Paper Plates Recycle Bin Trash Bin Took Home Other________ Don’t Use
QBO15. Paper Towels Recycle Bin Trash Bin Took Home Other________ Don’t Use

SECTION 4: Importance - Office
TIO. This set of questions is about how important you believe it is to recycle specific items while at your office.
Using a scale from zero to ten, where zero equals not at all important and ten equals extremely important, how important is it for you to recycle . . .
QIO1. Office Paper?
0 - - - 1 - - - 2 - - - 3 - - - 4 - - - 5 - - - 6 - - - 7 - - - 8 - - - 9 - - - 10 - - - 98 DK - - 99 REF
QIO2. Plastic Beverage Bottles?
0 - - - 1 - - - 2 - - - 3 - - - 4 - - - 5 - - - 6 - - - 7 - - - 8 - - - 9 - - - 10 - - - 98 DK - - 99 REF
QIO3. Aluminum Beverage Cans?
0 - - - 1 - - - 2 - - - 3 - - - 4 - - - 5 - - - 6 - - - 7 - - - 8 - - - 9 - - - 10 - - - 98 DK - - 99 REF
QIO4. Frozen Dinner Boxes?
0 - - - 1 - - - 2 - - - 3 - - - 4 - - - 5 - - - 6 - - - 7 - - - 8 - - - 9 - - - 10 - - - 98 DK - - 99 REF
QIO5. Soup Cans?
0 - - - 1 - - - 2 - - - 3 - - - 4 - - - 5 - - - 6 - - - 7 - - - 8 - - - 9 - - - 10 - - - 98 DK - - 99 REF
SECTION 5: Difficulty - Office
TDO. This set of questions is about how difficult you believe it is to recycle different items while at your office.
Using a scale from zero to ten, where zero equals not at all difficult and ten equals extremely difficult, how difficult is it for you to recycle . . .
QDO1. Office Paper?
0 - - - 1 - - - 2 - - - 3 - - - 4 - - - 5 - - - 6 - - - 7 - - - 8 - - - 9 - - - 10 - - - 98 DK - - 99 REF
QDO2. Plastic Beverage Bottles?
0 - - - 1 - - - 2 - - - 3 - - - 4 - - - 5 - - - 6 - - - 7 - - - 8 - - - 9 - - - 10 - - - 98 DK - - 99 REF
QDO3. Aluminum Beverage Cans?
0 - - - 1 - - - 2 - - - 3 - - - 4 - - - 5 - - - 6 - - - 7 - - - 8 - - - 9 - - - 10 - - - 98 DK - - 99 REF
QDO4. Frozen Dinner Boxes?
0 - - - 1 - - - 2 - - - 3 - - - 4 - - - 5 - - - 6 - - - 7 - - - 8 - - - 9 - - - 10 - - - 98 DK - - 99 REF
QDO5. Soup Cans?
0 - - - 1 - - - 2 - - - 3 - - - 4 - - - 5 - - - 6 - - - 7 - - - 8 - - - 9 - - - 10 - - - 98 DK - - 99 REF

Recycling at Work
101
SECTION 6: General Questions - Home
TGH. This next set of questions is about recycling at your home.
QGH1. Using a scale from zero to ten, where zero equals not at all knowledgeable and ten equals very knowledgeable, how knowledgeable are you about recycling at home?
0 - - - 1 - - - 2 - - - 3 - - - 4 - - - 5 - - - 6 - - - 7 - - - 8 - - - 9 - - - 10 - - - 98 DK - - 99 REF
QGH2. Using a scale from zero to ten, where zero equals not at all difficult and ten equals very difficult, how difficult is it for you to recycle at home?
0 - - - 1 - - - 2 - - - 3 - - - 4 - - - 5 - - - 6 - - - 7 - - - 8 - - - 9 - - - 10 - - - 98 DK - - 99 REF
QGH3. Using a scale from zero to ten, where zero equals never and ten equals always, when you have a recyclable item in your home, how often do you recycle it?
0 - - - 1 - - - 2 - - - 3 - - - 4 - - - 5 - - - 6 - - - 7 - - - 8 - - - 9 - - - 10 - - - 98 DK - - 99 REF
QGH4. Using a scale from zero to ten, where zero equals not at all important and ten equals very important, how important to you is recycling at home?
0 - - - 1 - - - 2 - - - 3 - - - 4 - - - 5 - - - 6 - - - 7 - - - 8 - - - 9 - - - 10 - - - 98 DK - - 99 REF
SECTION 7: General Questions - Public
TGP. This set of questions is about recycling at a park, city center, or other public place.
QGP1. Using a scale from zero to ten, where zero equals not at all knowledgeable and ten equals very knowledgeable, how knowledgeable are you about recycling in public places?
0 - - - 1 - - - 2 - - - 3 - - - 4 - - - 5 - - - 6 - - - 7 - - - 8 - - - 9 - - - 10 - - - 98 DK - - 99 REF
QGP2. Using a scale from zero to ten, where zero equals not at all difficult and ten equals very difficult, how difficult is it for you to recycle in public places?
0 - - - 1 - - - 2 - - - 3 - - - 4 - - - 5 - - - 6 - - - 7 - - - 8 - - - 9 - - - 10 - - - 98 DK - - 99 REF
QGP3. Using a scale from zero to ten, where zero equals never and ten equals always, when you have a recyclable item in public places, how often do you recycle it?
0 - - - 1 - - - 2 - - - 3 - - - 4 - - - 5 - - - 6 - - - 7 - - - 8 - - - 9 - - - 10 - - - 98 DK - - 99 REF
QGP4. Using a scale from zero to ten, where zero equals not at all important and ten equals very important, how important to you is recycling in public places?
0 - - - 1 - - - 2 - - - 3 - - - 4 - - - 5 - - - 6 - - - 7 - - - 8 - - - 9 - - - 10 - - - 98 DK - - 99 REF

SECTION 8: Returnables
TR. The next three questions are about returning beverage containers to receive a refund on a deposit paid when the container was purchased.
QR1. Does [STATE] offer a refund when you return beverage containers?
1. YES 2. NO [►SKIP TO C1] 8. DON’T KNOW [►SKIP TO C1] 9. REFUSED [►SKIP TO C1]
QR2. How much is the refund?
_______ 8. DON’T KNOW 9. REFUSED
QR3. Using a scale from zero to ten, where zero equals never and ten equals always, how frequently do you return beverage containers to get the bottle deposit back?
0 - - - 1 - - - 2 - - - 3 - - - 4 - - - 5 - - - 6 - - - 7 - - - 8 - - - 9 - - - 10 - - - 98 DK - - 99 REF SECTION 9: Classification
TC. This last set of questions is for classification purposes only.
QC1. How would you describe your personal work space?
1. Private office 2. Shared office 3. Cubicle 4. Other_____ 8. DON’T KNOW 9. REFUSED
QC2. In what year were you born?
_______ 8. DON’T KNOW 9. REFUSED
QC3. For how many years have you worked for this company?
_______ Years 8. DON’T KNOW 9. REFUSED
QC4. What is your job title?
_______ 8. DON’T KNOW 9. REFUSED

Recycling at Work
103
QC5. What is your gender?
1. Male 2. Female 3. Other 4. Refused
We are currently working with your building manager to implement a new recycling program. After this program has been implemented, we’ll ask you to complete a similar survey so that we gauge the effectiveness of the new bins and program. In order to match your answers today to your future answers, we would like to ask for your first, middle, and last initials. Providing this information will help us see more details about any changes before and after the recycling program. Again, your answers are confidential, and we will never report results in a way that any single person can be identified.
QC6. Please type your first, middle, and last initial. _ _ _ _ _ _
QC7. Is there anything you would like to mention on the topic of office recycling that was not covered in the survey?___________________________________________
Thank you for your time and participation.

Recycling at Work Employee Post-Survey
Thank you for participating in the PepsiCo, Keep America Beautiful, and CBRE Recycling at Work study! This survey is the last part of our study.
As a refresher, PepsiCo, Keep America Beautiful, and CBRE are conducting a study about recycling habits at work. Your office is one of a small number of buildings nationwide participating in this important study. Your responses are critical to this project, as they will be used to develop and improve office recycling programs. Your responses will remain confidential, so please answer honestly. The survey will only take about five minutes to complete.
SECTION 0: Pre Questions
TP. To begin . . .
QP1. In what state are you located?
CA GA MA TX
QP2. What is the name of the company you work for?
SECTION 1: General - Office
TGO. This first set of questions is about recycling at your office.
QGO1. Using a scale from zero to ten, where zero equals not at all knowledgeable and ten equals very knowledgeable, how knowledgeable are you about recycling in your office?
0 - - - 1 - - - 2 - - - 3 - - - 4 - - - 5 - - - 6 - - - 7 - - - 8 - - - 9 - - - 10 - - - 98 DK - - 99 REF
QGO2. Using a scale from zero to ten, where zero equals not at all difficult and ten equals very difficult, how difficult is it for you to recycle in your office?
0 - - - 1 - - - 2 - - - 3 - - - 4 - - - 5 - - - 6 - - - 7 - - - 8 - - - 9 - - - 10 - - - 98 DK - - 99 REF
QGO3. Using a scale from zero to ten, where zero equals never and ten equals always, when you have a recyclable item in your office, how often do you recycle it?
0 - - - 1 - - - 2 - - - 3 - - - 4 - - - 5 - - - 6 - - - 7 - - - 8 - - - 9 - - - 10 - - - 98 DK - - 99 REF
QGO4. Using a scale from zero to ten, where zero equals not at all important and ten equals very important, how important to you is recycling in your office?
0 - - - 1 - - - 2 - - - 3 - - - 4 - - - 5 - - - 6 - - - 7 - - - 8 - - - 9 - - - 10 - - - 98 DK - - 99 REF

Recycling at Work
105
SECTION 2: Knowledge - Office
TKO. The next set of questions is about where specific types of items get placed within your general office suite. For each of the 10 items, please indicate whether you think the item belongs in the trash or recycling bin.
QKO1. Office Paper Trash Bin Recycle Bin Don’t Know
QKO2. Plastic Beverage Bottles Trash Bin Recycle Bin Don’t Know
QKO3. Aluminum Beverage Cans Trash Bin Recycle Bin Don’t Know
QKO4. Frozen Dinner Boxes Trash Bin Recycle Bin Don’t Know
QKO5. Soup Cans Trash Bin Recycle Bin Don’t Know
QKO6. Food Scraps Trash Bin Recycle Bin Don’t Know
QKO7. Bubble Wrap Trash Bin Recycle Bin Don’t Know
QKO8. Plastic Eating Utensils Trash Bin Recycle Bin Don’t Know
QKO9. Used Paper Plates Trash Bin Recycle Bin Don’t Know
QKO10. Paper Towels Trash Bin Recycle Bin Don’t Know
SECTION 3: Behaviors - Office
TBOb. This next set of questions asks about where you place specific items while at your office.
Thinking about the last time you finished using each item while at your office, where did you put it? QBO6. Office Paper Recycle Bin Trash Bin Took Home Other________ Don’t Use QBO7. Plastic Beverage Bottles Recycle Bin Trash Bin Took Home Other________ Don’t Use QBO8. Aluminum Beverage Cans Recycle Bin Trash Bin Took Home Other________ Don’t Use QBO9. Frozen Dinner Boxes Recycle Bin Trash Bin Took Home Other________ Don’t Use QBO10. Soup Cans Recycle Bin Trash Bin Took Home Other________ Don’t Use QBO11. Food Scraps Recycle Bin Trash Bin Took Home Other________ Don’t Use QBO12. Bubble Wrap Recycle Bin Trash Bin Took Home Other________ Don’t Use QBO13. Plastic Eating Utensils Recycle Bin Trash Bin Took Home Other________ Don’t Use QBO14. Used Paper Plates Recycle Bin Trash Bin Took Home Other________ Don’t Use QBO15. Paper Towels Recycle Bin Trash Bin Took Home Other________ Don’t Use

SECTION 4: Importance - Office
TIO. This set of questions is about how important you believe it is to recycle specific items while at your office.
Using a scale from zero to ten, where zero equals not at all important and ten equals extremely important, how important is it for you to recycle . . .
QIO1. Office Paper?
0 - - - 1 - - - 2 - - - 3 - - - 4 - - - 5 - - - 6 - - - 7 - - - 8 - - - 9 - - - 10 - - - 98 DK - - 99 REF
QIO2. Plastic Beverage Bottles?
0 - - - 1 - - - 2 - - - 3 - - - 4 - - - 5 - - - 6 - - - 7 - - - 8 - - - 9 - - - 10 - - - 98 DK - - 99 REF
QIO3. Aluminum Beverage Cans?
0 - - - 1 - - - 2 - - - 3 - - - 4 - - - 5 - - - 6 - - - 7 - - - 8 - - - 9 - - - 10 - - - 98 DK - - 99 REF
QIO4. Frozen Dinner Boxes?
0 - - - 1 - - - 2 - - - 3 - - - 4 - - - 5 - - - 6 - - - 7 - - - 8 - - - 9 - - - 10 - - - 98 DK - - 99 REF
QIO5. Soup Cans?
0 - - - 1 - - - 2 - - - 3 - - - 4 - - - 5 - - - 6 - - - 7 - - - 8 - - - 9 - - - 10 - - - 98 DK - - 99 REF
SECTION 5: Difficulty - Office
TDO. This set of questions is about how difficult you believe it is to recycle different items while at your office.
Using a scale from zero to ten, where zero equals not at all difficult and ten equals extremely difficult, how difficult is it for you to recycle . . .
QDO1. Office Paper?
0 - - - 1 - - - 2 - - - 3 - - - 4 - - - 5 - - - 6 - - - 7 - - - 8 - - - 9 - - - 10 - - - 98 DK - - 99 REF
QDO2. Plastic Beverage Bottles?
0 - - - 1 - - - 2 - - - 3 - - - 4 - - - 5 - - - 6 - - - 7 - - - 8 - - - 9 - - - 10 - - - 98 DK - - 99 REF
QDO3. Aluminum Beverage Cans?
0 - - - 1 - - - 2 - - - 3 - - - 4 - - - 5 - - - 6 - - - 7 - - - 8 - - - 9 - - - 10 - - - 98 DK - - 99 REF
QDO4. Frozen Dinner Boxes?
0 - - - 1 - - - 2 - - - 3 - - - 4 - - - 5 - - - 6 - - - 7 - - - 8 - - - 9 - - - 10 - - - 98 DK - - 99 REF
QDO5. Soup Cans?
0 - - - 1 - - - 2 - - - 3 - - - 4 - - - 5 - - - 6 - - - 7 - - - 8 - - - 9 - - - 10 - - - 98 DK - - 99 REF

Recycling at Work
107
SECTION 6: General Questions - Home
TGH. This next set of questions is about recycling at your home.
QGH1. Using a scale from zero to ten, where zero equals not at all knowledgeable and ten equals very knowledgeable, how knowledgeable are you about recycling at home?
0 - - - 1 - - - 2 - - - 3 - - - 4 - - - 5 - - - 6 - - - 7 - - - 8 - - - 9 - - - 10 - - - 98 DK - - 99 REF
QGH2. Using a scale from zero to ten, where zero equals not at all difficult and ten equals very difficult, how difficult is it for you to recycle at home?
0 - - - 1 - - - 2 - - - 3 - - - 4 - - - 5 - - - 6 - - - 7 - - - 8 - - - 9 - - - 10 - - - 98 DK - - 99 REF
QGH3. Using a scale from zero to ten, where zero equals never and ten equals always, when you have a recyclable item in your home, how often do you recycle it?
0 - - - 1 - - - 2 - - - 3 - - - 4 - - - 5 - - - 6 - - - 7 - - - 8 - - - 9 - - - 10 - - - 98 DK - - 99 REF
QGH4. Using a scale from zero to ten, where zero equals not at all important and ten equals very important, how important to you is recycling at home?
0 - - - 1 - - - 2 - - - 3 - - - 4 - - - 5 - - - 6 - - - 7 - - - 8 - - - 9 - - - 10 - - - 98 DK - - 99 REF
SECTION 7: General Questions - Public
TGP. This set of questions is about recycling at a park, city center, or other public place.
QGP1. Using a scale from zero to ten, where zero equals not at all knowledgeable and ten equals very knowledgeable, how knowledgeable are you about recycling in public places?
0 - - - 1 - - - 2 - - - 3 - - - 4 - - - 5 - - - 6 - - - 7 - - - 8 - - - 9 - - - 10 - - - 98 DK - - 99 REF
QGP2. Using a scale from zero to ten, where zero equals not at all difficult and ten equals very difficult, how difficult is it for you to recycle in public places?
0 - - - 1 - - - 2 - - - 3 - - - 4 - - - 5 - - - 6 - - - 7 - - - 8 - - - 9 - - - 10 - - - 98 DK - - 99 REF
QGP3. Using a scale from zero to ten, where zero equals never and ten equals always, when you have a recyclable item in public places, how often do you recycle it?
0 - - - 1 - - - 2 - - - 3 - - - 4 - - - 5 - - - 6 - - - 7 - - - 8 - - - 9 - - - 10 - - - 98 DK - - 99 REF
QGP4. Using a scale from zero to ten, where zero equals not at all important and ten equals very important, how important to you is recycling in public places?
0 - - - 1 - - - 2 - - - 3 - - - 4 - - - 5 - - - 6 - - - 7 - - - 8 - - - 9 - - - 10 - - - 98 DK - - 99 REF

SECTION 8: Post
TPT. The next section is about the Recycling at Work program specifically. By “Recycling at Work Program” we mean any recycling or trash bin set-up alterations, flyers (example Below), or recycling emails you have received since April.
QPT1. Using a scale from zero to ten, where zero equals much easier and ten equals much harder, how much did the Recycling at Work program change the ease of recycling in your office?
0 - - - 1 - - - 2 - - - 3 - - - 4 - - - 5 - - - 6 - - - 7 - - - 8 - - - 9 - - - 10 - - - 98 DK - - 99 REF
QPT2. Using a scale from zero to ten, where zero equals not at all and ten equals very much so, how much did the Recycling at Work program increase your knowledge of how to recycle correctly in your office?
0 - - - 1 - - - 2 - - - 3 - - - 4 - - - 5 - - - 6 - - - 7 - - - 8 - - - 9 - - - 10 - - - 98 DK - - 99 REF
QPT3. Using a scale from zero to ten, where zero equals very easy to understand and ten equals very hard to understand, how understandable was the Recycling at Work flyer?
0 - - - 1 - - - 2 - - - 3 - - - 4 - - - 5 - - - 6 - - - 7 - - - 8 - - - 9 - - - 10 - - - 98 DK - - 99 REF
Select the option below that best describes the current recycling and trash bin set-up at your desk:
Equal size trash and recycling bins Regular recycling bin with a smaller hanging trash bin Recycling bin only Trash bin only No bins Other _________
QPT4. Did you do anything differently as a result of the Recycling at Work program?
QPT5. Is there anything you particularly liked about the Recycling at Work program?
QPT6. What is one thing that would help you recycle more in your workplace?
QPT7. Is there anything you would change about the Recycling at Work program?

Recycling at Work
109
SECTION 9: Classification
TC. This last set of questions is for classification purposes only.
QC2. In what year were you born?
_______ 8. DON’T KNOW 9. REFUSED
QC5. What is your gender?
5. Male 6. Female 7. Other 8. Refused
Again, your answers are confidential, and we will never report results in a way that any single person can be identified.
QC6. Please type your first, middle, and last initial. _ _ _ _ _ _
QC7. Is there anything you would like to mention on the topic of office recycling that was not covered in the survey?___________________________________________
Thank you for your time and participation.

Pre-Test Leave Behind Note and Coupon

Recycling at Work
111
Post-Test Leave Behind Note and Coupon

Appendix C-Waste Audit Documents
Contents
Waste Audit Procedure 113
Waste Audit Data Collection Sheet – Recycling 114
Waste Audit Data Collection Sheet – Trash 115

Recycling at Work
113
Waste Audit Procedure
Waste Audit Operating Procedure for Recycling At Work
Adapted from Keep America Beautiful procedure
Procedure:
1. Prepare work area: unroll and cut a sizable area of the plastic sheeting 2. Gather trash and recycling bags from the drop off point. 3. Separate by office, laying the collection sheet for the office by the bags for that office to ensure
results are accurate. 4. Bring the bags for one office to the work space 5. Use the hook scale to weigh the first trash bag (trash bags have silver bag tags) and record the
weight on the data sheet before opening. 6. Write the office number, and a T on the whiteboard. If there is more than one trash bag for the
office put a number next to the T (T1, T2, T…). Place the white board on the edge of the tarp. 7. Open the first bag onto the prepared tarp and spread out slightly. 8. Separate the contents into the 12 designated material types. 9. Photograph the workspace, getting all the piles and the white board in the picture. 10. Weigh each pile individually. Place the pile into a blue handled bag, hook the scale on the loops,
and weigh. Record the weight of the pile on the data sheet. 11. Once a pile has been weighed, transfer it to the end trash or recycling bag. Keep these bags off to
the side so they don’t get mixed in with the sort. To minimize the number of bags, try to re use the bag used for weighing multiple times after it has been emptied.
12. Weigh the rest of the piles 13. Repeat steps 5 to 12 with any other trash bags from this office 14. Repeat steps 5 to 12 with the recycling bags from that office (for step 6 use R instead of T).
Repeat the procedure for each office
When finished: Roll up tarps and place in the trash bag. Remove end trash and recycling bags and dispose of them properly. Hand sanitizer is available

Waste Audit Data Collection Sheet - Recycling
Waste Audit Data Collection RECYCLING
Office Number:_______ Date: _______
Bag Number:_________
Auditors:____________________________________________________________
Bag pre sorted weight: ____________lbs
Recyclable Items Trash Items
Item Weight (lbs) Item Weight (lbs)
Office Paper Food Scraps
Plastic Beverage Bottles Bubble Wrap
Aluminum Beverage Cans Plastic Eating Utensils
Frozen Dinner Boxes Used Paper Plates
Soup Cans Paper Towels
Other recyclable items
See list on back of clipboard for reference
Other trash items
See list on back of clipboard for reference
Other comments/notes:

Recycling at Work
115
Waste Audit Data Collection Sheet - Trash
Waste Audit Data Collection TRASH
Office Number:_______ Date: _______
Bag Number:_________
Auditors:____________________________________________________________
Bag pre sorted weight: ____________lbs
Recyclable Items Trash Items
Item Weight (lbs) Item Yes / No (circle)
Office Paper Food Scraps Yes / No
Plastic Beverage Bottles Bubble Wrap Yes / No
Aluminum Beverage Cans Plastic Eating Utensils Yes / No
Frozen Dinner Boxes Used Paper Plates Yes / No
Soup Cans Paper Towels Yes / No
Other recyclable items
See list on back of clipboard for reference
Other trash items
See list on back of clipboard for reference
Weight lbs
Other comments/notes:

Appendix D- Daily Recycling and Trash Volume Documents
Daily Data Collection Sheet