report resumes - eric · educational theories, behavior rating scales, *effective teaching,...
TRANSCRIPT
REPORT RESUMESED 016 297 24 EA 001 078A MEASUREMENT OF COLLEGE INSTRUCTOR BEHAVIOR.BY- APT, MADELINE HEIKESPITTSBURGH UNIV.. PA.REPORT NUMBER BR-6-8047 PUB DATE 66CONTRACT OEC-6-10-355EDRS PRICE MF-$0.75 HC-$6.60 163P.
DESCRIPTORS- *MEASUREMENT TECHNIQUES, *COLLEGE TEACHERS,*TEACHER BEHAVIOR, TEACHING, STATISTICAL ANALYSIS,EDUCATIONAL THEORIES, BEHAVIOR RATING SCALES, *EFFECTIVETEACHING, *STUDENT OPINION, TEACHER CHARACTERISTICS,HUMANITIES, NATURAL SCIENCES, SOCIAL SCIENCES, PITTSBURGH,OSGOOD SEMANTIC DIFFERENTIAL,
THIS STUDY TESTS THE HYPOTHESIS THAT COLLEGE INSTRUCTORBEHAVIOR CAN BE IDENTIFIED AND MEASURED BY THE USE OF AGRAPHIC RATING SCALE WHEN THE RATER RESPONDS TO COMMONBIPOLAR ADJECTIVES. THE BEHAVIORS WILL YIELD, WHEN SUBJECTEDTO FACTOR ANALYSIS, CLUSTERS OF TRAITS WHICH WOULD IDENTIFYSUBGROUPS OF COLLEGE INSTRUCTORS. STUDENT RATINGS OF COLLEGEINSTRUCTOR BEHAVIOR WERE OBTAINED THROUGH THE USE OF A SCALECOMPOSED OF 12 BIPOLAR ADJECTIVES FROM THE OSGOOD SEMANTICDIFFERENTIAL, 13 SINGLE ADJECTIVES FROM OTHER RESEARCHSTUDIES, AND AN OVERALL GLOBAL RATING OF INSTRUCTION. THE -
SCALE WAS ADMINISTERED TO UNDERGRADUATE LIBERAL ARTS CLASSESOF THE SAME INSTRUCTORS ON TWO OCCASIONS SEPARATED BY A TIMEINTERVAL OF 15 WEEKS. THE TOTAL SAMPLE OF 7,060 STUDENTSRATED 104 INSTRUCTORS IN HUMANITIES, NATURAL SCIENCES, ANDSOCIAL SCIENCES AT THE UNIVERSITY OF PITTSBURGH. IT WASCONCLUDED THAT STUDENTS DISTRIBUTED THEIR JUDGMENTS OFINSTRUCTORS IN A MARKEDLY RELIABLE MANNER, BUT THE VARIANCEOBSERVED DID NOT SIGNIFICANTLY DISCRIMINATE BETWEENINSTRUCTORS ACCORDING TO ACADEM/C DIVISION NOR DID IT RELATEIN ANY APPRECIABLE DEGREE TO GLOBAL ESTIMATES OFEFFECTIVENESS. THE DISCRIMINATIONS EXPECTED WERE NOT WITHINTHE COMPETENCE OF THE OSGOOD SCALE OR OF THE SINGLEADJECTIVES LISTED. THIS DOCUMENT IS ALSO AVAILABLE FROMUNIVERSITY MICROFILMS, ANN ARBOR, MICHIGAN, (MICROFILM NUMBER67,4558), FOR MF $3.00, NC $7.60. (NW)


U.S. DEPUTMENT 01 HEALTH, EDUCATION & WELFARE
OFFICE OF EDUCATION
THIS DOCUMENT HAS BEEN REPRODUCED EXACTLY AS RECEIVED FROM THE
PERSON OR ORGANIZATION ORIGINATING IT. POINTS OF VIEW OR OPINIONS
STATED DO NOT NECESSARILY REPRESENT OFFICIAL OFFICE OF EDUCATION
POSITION OR POLICY.
A MEASUREMENT OF COLLEGE INSTRUCTOR BEHAVIOR
by
Madeline Heikes Apt
B. S., University of Pittsburgh, 1960
M. Ed., University of Pittsburgh, 1962
Submitted to the. Graduate Faculty in the School
of Education in partial fulfillment of
the requirements for the degree of
Doctor of Philosophy
University of Pittsburgh
1966

FOREWORD
The research reported herein was performed pursuant to a con
tract with the United States Department of Health, Education, and
Welfare, Office of Education.
Sincere gratitude is expressed to the members of my committee,
especially Dr. George L. Fahey, Chairman, who offered valuable advice
and encouragement throughout this study.
Appreciation is extended to the University of Pittsburgh fac
ulty members and students who participated in the project. Indebted
ness is acknowledged to the;many graduate students who assisted in the
administration of the rating scales to the participating classes.
ii

TABLE OF CONTENTS
FOREWORD
Page
ii
I. INTRODUCTION 1
A. Education and Society 1
B. Review of Literature Pertaining toTeaching Behaviors 3
1. Criticisms of College and UniversityTeaching 3
2. Suggested Procedures for ImprovingTeaching Behaviors 7
3. Philosophical Judgments of EffectiveTeaching Behaviors 12
4. The Empirical Criterion forMeasuring Behaviors 14
5. Specific Empirical Studies ofTeaching Behaviors 16
6. The Osgood Semantic Differential 52
II. STATEMENT OF PROBLEM AND HYPOTHESIS 56
A. Statement of Problem 56
B. Hypothesis 57
III. PROCEDURE 58
A. Pilot Study 58
1. Experimental Instrument 58
2. Final Instrument 70
B. Current Study 72
C. Sample Characteristics 79
IV. FINDINGS 82
A. Discriminant Analysis 82
B. Intervariable Correlations 84
iii
C. Reliability
D. Factor Analysis
V. DISCUSSION OF FINDINGS
Page
88
89
95
A. Reliability 95
B. Validity, 96
C. Discriminant Analysis 100
D. Factor Analysis 100
VI. SUMMARY OF FINDINGS AND CONCLUSIONS 104
A. Summary of Findings 104
B. Conclusions 106
APPENDICES:
I. Sample Instrument 112
II. Revised Instrument 122
III. Letter Sent to Faculty Members 124
IV. Instructions Read to Students 126
V. Confidential Letter to Faculty 127
VI. Note of Acknowledgment 132
VII. Second Trimester Letter to Faculty 133
VIII. Second Trimester Confidential Letter to Faculty . . 135
IX. Abstract 136
X. Means, Standard Deviations, and Number of Ratersfor Each Rated Variable by Division, FallTrimester
139
XI. Correlation Matrix Representing Ratings forHumanities Division 140
XII. Correlation Matrix Representing Ratings forNatural Science Division 141
iv

Page
XIII. Correlation Matrix Representing Ratings forSocial Science Division 142
XIV. Unnormalized Rotated Factor Loading Matrixfor Humanities Division 143
XV. Unnormalized Rotated Factor Loading Matrixfor Natural Science Division 144
XVI. Unnormalized Rotated Factor Loading Matrixfor Social Science Division 145
BIBLIOGRAPHY 147
,
v

LIST OF TABLES
Table Page
1. Frequency of Selection of Adjectives 61
2. Correlation with Criterion Set of Adjectives"GoodBad" 63
3. Number of Times Adjectives Not Checked 65
4. Rotated Factor Loading Matrix 67
5. Adjectives Represented in Factors 69
6. Participation of Division 74
7. Classes Participating by Division 74
8. Undergraduate Students Completing Rating Scale 75
9. Participation of Division 77
10. Classes Participating by Division 78
11. Undergraduate Students Completing Rating Scale 78
12. Instructor Rank and Years of Teaching 79
13. Student Age and Year 80
14. Academic Rank of Instructors OOOOO OOOOOOO 81
15. Means, Standard Deviations, and Number of Ratingsfor Each Rated Variable by Division Total Sample 85
16. Correlation Matrix Representing Ratings forEntire Sample 87
17. Reliability Coefficients of Fall TriMester Ratings . 90
18. Unnormalized Rotated Factor Loading Matrixfor Entire Sample 91
vi

I. INTRODUCTION
A. Education and Society
In a society which places an unswerving faith in education as
a medium for the fulfillment of the objectives of democracy, the re-
sponsibility of the educator is difficult to exaggerate. While his
most important professional duty to society is to teach in his spe-
cialized field, he must be cognizant that his obligation encompasses
much more than mere transmission of facts.
It seems reasonable to assume that good teachers--thosewho are skillful in developing understanding of the world inwhich man lives, insightful with respect to the ways andmeans of stimulating intellectual appetites, and capable ofpatience, understanding, and sincere feelings for others--may pave the way for an enlightened and productive society.Poor teaching, contrariwise, would seem to be a significantcontributor of its unfortunate share to the perpetuation ofignorance, misunderstanding, and intellectual and culturalstagnation.1
Concomitant with the unquestioned value of education, our so-
ciety has nurtured an unquestioned acceptance of the traditional means
of teaching in our colleges and universities as being effective.
"Young teachers, commencing their careers, naturally began to teach in
the manner in which they themselves had been taught, and thus perpetu-
ated the merits and errors of academic practice."2 Recent protests by
laymen and investigations by professionals have resulted in a possible
1David G. Ryans, Charactellstics of Igachers, American Councilon Education (Menasha, Wisconsin: George Banta Company, Inc., 1960),p. 1.
2Gordon W. Allport, "How Shall We Evaluate Teaching ? " ,A Hand-book for C9llege Teuters. An Informal Guide,, ed. Bernice Brown Cron-khite (Cambridge: Harvard University Press, 1950), p. 37.
1
2
reversal of the belief that instructors are performing efficiently the
task they have chosen for themselves.
Instruction may have been characterized at one time by a "semi
mystical nature,"1 but current investigations into the teaching process
and selfanalyses by educators have begun to demonstrate that a
thorough examination may be needed urgently. Education, as with any
other social institution, is not likely to "suffer from the cautious
search for sources of information, from a rigorous appraisal of what
ever this search turns up, and from its judicious use"2 by the college
instructor. A critical evaluation of higher education may reveal that
society will benefit if the aims of higher education are directed
toward promoting individual needs and away from protecting the tradi
tional.3
Demonstrated shortcomings in the institutions, including in
effective teaching, must be acknowledged, for only through a realistic
appraisal of deficiencies can advances be made toward a realization of
democratic goals.
As a consequence of the profound faith placed in the benefits
of education and the equally profound faith placed in the assumed
teaching abilities of college and university instructors, higher edu
cation finds itself in a position requiring a constant and searching
evaluation of its reasons for existence. Just as important is the
1Ibid., p. 37.
2William R. Wilson, "Students Rating Teachers," The Journal of
Bighajjuication, III (February, 1932), 82.
3Homer P. Rainey, "The Individualization of College Instruc
tion," Asso -t'on of Am Col s B t XVIII (May, 1932),190-95.

3
search for greater efficiency, probably forced upon educators as a con-
sequence of the enrollment explosion.
B. Review of Literature Pertaining toTeaching Behaviors
1. Criticisms of College and University Teaching
While appraisal of teaching depends upon the purpose of the
evaluation, whether for administrative reasons, for individual self
improvement, for student surveys, or for research purposes, the process
reflects a long history of attempts. Early appraisal, carried out
largely on a subjective, intuitive basis, often led to unfortunate,
biased results. Current approaches to the study of the problem of
teaching behavior are characterized by a trend toward systematic and
scientific appraisals. Possibly the growing demands by administrators,
faculty, students, and parents for intensive questioning into the
process of higher education have reinforced this trend.
A proper analysis of the criticisms associated with teaching
behavior in institutions of higher education would be an overwhelming
task, but the magnitude need not prevent a survey of some selected as
pects. One of the frustrations encountered in an attempt to delimit
the complexities of the problem arises from the belief that teaching is
an innate ability and, as such, is not subject to experimentation. The
hint that the process of teaching
. . . stands in need of empirical support is often met with incredulous opposition, and men whose academic work is based upona rigorous testing of accepted ideas, tend to think it somehowindecent to apply the same standard of enquiry to their ownteaching and examining practice. Few university teachers areeven aware that many of their instructional problems have been

4
investigated experimentally, and only a tiny minority take thetrouble to acquaint themselves with the results.1
According to Klapper, "experience repeatedly refutes the com
forting hope that he who knows can teach."2 Eckert wrote. that "thinking
often becomes vague and illdefined when an attempt is made to judge the
success of particular college teachers."3
It is the habit of academic life to pretend such completepreoccupation with the affairs of pure contemplative scholarshipthat one cannot give much attention to the trivialities of college organization or to the task of studying methods of correcting defects in this organization.4
As long as this paradoxical assumption is present among instruc
tors, scientific progress in correcting criticisms will be hampered
seriously.
A second major criticism of college and university teaching is
directed at the institutions themselves. Many analyzers of higher edu
cation have asserted that the main objective of college training is the
production of scholars and researchers while little is done to equip
the graduates with teaching skills. College instructors simply have
not been prepared to teach. Remmers5has written that the accusations
1J. P. Powell, "Experimentation and Teaching in Higher Education," adilsAIlional Rummh, VI (June, 1964), 179.
2Paul Klapper, "The Professional Preparation of the CollegeThe)J:11zinglsjGgazAlgdjasplioDi III (OctoberJuly, 1945-
1949), 229.
3Ruth E. Eckert, "Ways of Evaluating College Teaching," School
,and Society, LXXI (February 4; 1950), 66.
4Charles H. Judd, "The Improvement of Teaching," Thl_jolual.21
pioher Educ &tion, III (December, 1932), 471-72.
H. Remmers, "The College Professor As the Student SeesHim," Pu u Unv st Bull- n Stu 's 'n H' o N s.
7-12 (Lafayette, Indiana: Purdue University, 1926-1929), pp. 1-63.

5
of poor college and university teaching could be a scapegoating mecha
nism but they are true basically since the instructors are prepared for
research while teaching skills are largely ignored.
According to Dodge, 1the biggest barrier to improvement of
teaching lies with the institutions neglecting to recognize their du
ties to the citizens. Because objectives have not been clearly defined,
research activities have been placed ahead of teaching activities. With
teaching relegated to a subsidiary level, institutions are looking more
and more to the benefits of research while experimentation in teaching
tends to be forgotten.
Brearley2 made a similar criticism when he stated that the low
prestige value attached to teaching as compared to research has re
sulted in giving less and less attention to the students.
Until institutions of higher education exhibit a genuine dedi
cation to their primary objective, that of attempting to educate stu
dents through sincere teaching methods, this reversal of considerations
is likely to prevail with the student, upon whom the lifeblood of
higher education is dependent, being pushed even further into ob
scurity.
A third assertion critical of teaching behaviors in colleges
and universities arises from the students who suffer the greatest loss
when teaching is haphazard. Several sources have reported that stu
dents have expressed grave disappointments with much of the instruction
1Homer L. Dodge, "The Improvement of College Teaching," TbgJournal of Higher Education, III (December, 1932), 481-86; 518.
2H. C. Brearley, "College Classroom Teaching--Problems andProcedures," Peabody Journal of Education, XXXVII (July, 1959), 66-76.

6
which they have experienced in higher education. Their complaint of
being poorly taught has been interpreted by parents as contributing to
the failures of many college and university students. Juddl maintained
that a common criticism lies in the instructors' failure to stimulate
intellectual creativity because the teaching has been boring, lacka
daisical, and uninspired.
Students have indicated that they have experienced a feeling of
isolation and a failure to identify with a model while enrolled in
schools. After an investigation of the responses of certain Harvard
graduates to their college experiences, Whitla2
concluded that these
academically average men continued to be accepting of comfortable in
ferences after graduation as an extension of their college instructors'
satisfaction with average performances in the classroom. A frequent
complaint has been related to the failure of the faculty to satisfy the
personal interest need of these students, thus nourishing feelings of
frustration and perhaps withdrawal from challenging academic opportu
nities.
Interest in the effect of educational contacts upon students
has never been so intense as at the present time.3 It has evolved from
experimentation with the idea that higher education institutions may be
1
Judd, op. cit., pp. 470-74; 517-18.
2Dean K, Whitla, "Encounters with Learning," Harvard Educa
tional Review, XXX (Fall, 1960) ,' 331-49.
3Paul Heist, "The Entering College Student--Background and
Characteristics," Review of Educational Research, XXX (October, 1960),285-97.

perceived as actual living complexes with administrators, instructors,
and students all contributing mutually to a shared goal.1
These three criticisms, selected from a wide range of criti
cisms of teaching, suggest that a questioning of the instructional
methods has considerable validity. The voluminous literature concerned
with instruction attests to the importance of the problem as felt by
those who are disturbed with ineffective instruction. Administrators
and faculty, occupying a strategic position in society, are able to
contribute to the public's betterment if they will accept realistically
the assertion that academic immunity is inappropriate and the assertion
that teaching is a skill requiring training. The student, upon whose
future action all democratic institutions rest, is no longer content
with isolation from the educational process.
2. Suggested Procedures for Improving Teaching Behaviors
Numerous procedures have been suggested in the literature for
improving college and university instruction. One of the commonest
methods is an appraisal, through interviews and questionnaires, of ap
proaches reported by administrators and faculty. Cordrey2 reported in
an early study that data collected from eightyone state teachers col
leges and normal schools indicated that the great majority of presidents
questioned felt that efforts should be directed toward improvement of
1Richard J. Medalie, "The Student Looks at College Teaching,"
The Preparation of College T9achers, A Report by the American Councilon Education and the U. S. Office of Education, Series I--Reports ofCommittees and Conferences--Number 42, ed. Theodore C. Blegen andRussell M. Cooper (Washington, D. C.: American Council on Education,July, 1950), XIV, 49-54.
2E. E. Cordrey, "Efforts to Improve Instruction in State Teachers Colleges," Peabody Journal of Education, IX (July, 1931May, 1932),200-208.

8
instruction. Most of these presidents also indicated that their insti
tutions were engaged in such efforts. A number of the most frequently
mentioned methods used included faculty meeting discussions, depart
mental discussions, course outline or syllabi preparation, advanced
graduate study, and curriculum evaluation. While these presidents
agreed that the efforts produced some benefits, they stated that the
biggest barrier to maximum success was traceable to reluctant faculty
attitudes.
As a result of a similar survey, Reed concluded that some of
the common procedures for improving instruction were "periodic restates*
ment of objectives, joint conferences with other departments, recogni
tion of teaching efficiency, and departmental conferences."1 Munro
2
cautioned that the question of effective teaching will probably never
be completely answered because of the extensive number of variables
interacting to produce the behavior. However, he suggested that fac
tors such as hiring policies, alumni evaluations, teaching schedules,
and instructor examinations were worthy of investigation.
Two additional studies, designed by means of the questionnaire
survey method, were reported by Bohannon3
and Byrnes and Jamrich,4
1Anna Y. Reed in collaboration with Frank P. Maguire, William A.
Thomson, and Harriett van der Vate, The Effect,ve and the IneffectiveCollege Teacher (New York: American Book Company, 1935), p. 22.
2William B. Munro, "A SelfStudy of College Teaching," TheJournal of Higher Education, III (December, 1932), 459-63.
3C. D. Bohannon, "Improvement of College Instruction," PhiDelta Kappan, X (April, 1928), 161-73.
4Francis C. Byrnes and John X. Jamrich, "Survey of Policies and
Practices Relating to Improved Instruction," Improvement of Instructionin Higher Education, A Report by the Subcommittee on Improvement of Instruction of the Committee on Studies (Washington, D. C.: The AmericanAssociation of Colleges for Teacher Education, 1962), pp. 19-22.
the conclusions of which are similar to the previously reported publi
cations.
After reviewing twenty studies of policies used to improve
teaching, Kelley1summarized the ideas of the administrators and fac
ulty members. Some of the most often mentioned procedures he found
included supervision of teaching, provision for research, use of out
side experts, and student appraisal of instruction. The total number
of procedures identified was quite extensive, and the suggestions may
be regarded as tentative criteria for educators interested in improving
teaching.
By analyzing the results of approximately 1,800 questionnaires
completed by college teachers, former college teachers, and graduate
students, Gustad2 attempted to determine why persons enter college
teaching and why they leave the profession. He found that many teach
ers left the profession for reasons related to the rewards. They sel
dom knew what kind of teaching job they were doing because evaluation
was haphazard. Evaluation of teaching was based largely on impressions,
hearsay, and subjective opinions despite administrators' contentions
that teaching was vital and was rewarded.
A slightly different approach to the task was taken by Dobbins3
when he predicted success in efficient teaching by providing the
1William Frederick Kelley, "Twenty Studies of InService Education of College Faculty and the Procedures Most Recommended," EducationalAdministration and Supervision, XXXVI (October, 1950), 351-58.
2John W. Gustad, "They March to a Different Drummer: Another
Look at College Teachers," Thg Educational Record, XL (July, 1959),204-11.
3Charles G. Dobbins, "Excellence in College Teaching," School
and Society, LXXXVII (December 19, 1959), 514-15.

10
necessary number of adequately prepared instructors and improving ar
ticulation among the elementary, secondary, and higher educational
levels.
Fahey and Masonerl proposed the merits of a graduate seminar
for students of all disciplines in which real problems, such as learn
ing principles, evaluation methods, material organization, lecture pre
sentation, and educational philosophy are discussed. The justification
for the seminar is one answer to the inadequacies of graduate programs
which fail to provide the future instructor with professional skills
required for good teaching.
In his assertion that the preparation of college teachers is
the most urgent task facing colleges today, Klapper2
proposed that grad-
-uate institutions accept their responsibility for improving teaching by
considering their candidates' potential for effective teaching as well
as professional knowledge. While much of academia still feels that
formalized teacher training courses are not appropriate, Buxton3 sug
gested that the implementation of a training program is necessary be
fore these institutions will be able to fulfill their objectives. The
requisite characteristics of the training program he proposed included
motivation for teaching by the candidate, his possession of knowledge
of teaching skills and subject content, provision of teaching supervi
sion, and opportunities for wide experiences in teaching.
1George L. Fahey and Paul H. Masoner, "An InterdisciplinarySeminar in College Teaching," The Journal of Teacher Education, XI(1960), 391-97.
2Klapper, op. cit., pp. 228-44.
3Claude E. Buxton, "The Pros and Cons of Training for College
Teachers of Psychology," American Psychologist, IV (October, 1949),414-17.

11
Still another procedure suggested for the improvement of teach-
ing behavior is concerned with the stated objectives of the institu-
tions.
procedures and techniques of teaching, like those of anyart, are not to be worked out by reference to ready-made ideas.Rather they are to be devised in terms of the materials and con-ditions at hand, and by reference to discoveries about thesecircumstances and what they require for the achievement of in-tended effects.l
Another step in the process is a measurement of the degree to
which methods are effective in the fulfillment of the desired changes
in student behavior.2
Numerous other procedures have been suggested for improving
teaching behavior, including the undertaking of the institutional self-
study;3
the implementation of a tutorial system;4
the study of and pos-
sible alteration of social, emotional, and intellectual variables;5
and the application of behavioral science principles.6
Attempts by the instructor himself to improve his instruction
by trying the "methods that seem to attain the best results in
1
B. Othanel Smith, "On the Anatomy of Teaching," The Journal ofTeacher Education, VII (December, 1956), 339.
2D. W. Dysinger and W. S. Gregory, "A Preliminary Study of Some
Factors Related to Student Achievement and Grades in the BeginningCourse in Psychology," The Journal of General Psychology, XXIV (firsthalf; January, 1941), 195-209.
3Wilfrid G. Hamlin, "A Collegc Faculty Looks at Itself," The
Journal of Higher Education, XXVIII (April, 1957), 202-206; 236.
4Whitla, op. cit.
5Brearley, op. cit.
6W. J. McKeachie, "Behavioral Sciences Can Improve Teaching,"
NkA Journal, XLIX (September, 1960), 79-81.
12
individual cases"1 is another suggested procedure. According to
Davis,2 increasing involvement by instructors in the improvement of
teaching was indicated.
Each of these methods represents considerable merit and is
worthy of pursuing, but no one general approach has been discovered
that is clearly more effective than the others in the improvement of
teaching behavior. Considering the impact of education upon our so
cial values, it is imperative that continuing efforts be directed
toward the improvement of teaching. The current extensive interest
in the problem is an encouraging sign for it indicates that some edu
cators are courageous enough to face the conclusion that teaching has
not been wholly satisfactory. The wide diversity of the methods sug
gested for improvement leads to the possibility that perhaps the wrong
variables have been scrutinized or perhaps the right variables have
not been studied closely enough. The interaction effects among com
plex variables may also be a contributing factor.
3. Philosophical Judgments of Effective Teaching Behaviors
An analysis of some of the numerous philosophical evaluations
reveals that the underlying logic supporting the various judgments can
be categorized into distinct systems. One approach evaluates effective
teaching in terms of the predominance of the instructorstudent rela
tionships. Illustrative of this approach is Ryans' statement that
William B. Munro, Chairman, "Report of the Committee on College and University Teaching," Bulletin of th- Am ri an Associ tion ofUnivprsitv Professors, XIX (section two; May, 1933), 34.
2Hazel Davis, "Evolution of Current Practices in EvaluatingTeacher Competence," Contemporary Research on Teacher Effectiveness,ed. Bruce J. Biddle and William J. Ellena (New York: Holt, Rinehart,and Winston, Inc., 1964), pp. 41-66.

13
. . . teaching is effective to the extent that the teacher actsin ways that are favorable to the development of basic skills,understandings, work habits, desirable attitudes, value judgments, and adequate personal adjustment of the pupil.1
Brearley2 represented a similar philosophy when he wrote that
the effective instructor serves as an inspiration to his students. The
relationship is reciprocal because the student ranks high in the in
structor's value system. Emphasis on the importance of the impact be
tween teacher and learner has also been asserted by McKeachie3 and
Buch.4
A second philosophy supports the belief that effective teaching
is to be evaluated directly in terms of the desired goals. Examples of
this line of thinking are the following: ". teaching consists of a
succession of acts by an individual whose purpose is either to show
other persons how to do something or to inform them that something is
the case,"5
and "good teaching is the kind of teaching which
gains the end desired. "6
A third philosophy, which holds that appraisal of teaching be
gins with the ambiguous, less discernible characteristics of the in
structor, is illustrated by Kriner when he wrote "that a type of
1David G. Ryans, "Measurement and Prediction of Teacher Effec
tiveness," Invitational Conference on Testing Problems, November 1.1958 (New Jersey: Educational Testing Service, 1959), p. 56.
2Brearley,
3McKeachiel 00. cit.
4Robert Nelson Buch, "A Study of StudentTeacher Relation
ships," Journal of Educational Research, XXXV (May, 1942)1.645-56.
5B. Othanel Smith, op. cit.
6William B. Munro, "A SelfStudy of College Teaching," agJournal of Higher Education, III (December, 1932), 461.
14
scientific mind--as opposed to an artistic temperament; that consist
ency in purpose and action; and that emotional stability, all go far in
determining teacher success."1 Kegel2 stated that great teaching, al
though it cannot be evaluated objectively, is identified by love of
knowledge, dedication to truth, and inspiration of students. Reports
by Whitla,3 Champlin,4 and the biographical study of distinguished
teachers by Lamper5are also examples of this particular philosophy.
The widely divergent conclusions resulting from the separate
philosophical judgments concerning effective instruction leads to the
possibility that an empirical approach may yield more svcific results.
4. The Empirical Criterion for Measuring Behaviors
Evaluating teaching effectiveness adequately is one of the
most perplexing problems facing educators today. The magnitude of the
task is affirmed by the frequency of studies directed toward its solu
tion, and the perplexity of the problem is indicated by the inconclu
siveness of the efforts. Most educators are aware of the problem, and
some are attempting to solve it. Until satisfactory criteria of ef
fective teaching behavior have been developed, little progress can be
anticipated beyond the current stage. "The lack of an adequate,
1Harry L. Kriner, "Second Report on a Five Year Study of Teec.hers College Admissions," Educational Administration and Supervision,XXI (January, 1935), 60.
2Charles H. Kegel, "The Distinguished Teacher," Improving Col
lege and University Teaching, XII (Spring, 1964), 102-104.
3Whitla, op. cit.
4Carroll D. Champlin, "Professors of Education," Education,LXXIII (February, 1953), 346-50.
Neil Lamper, "Characteristics of Great Teachers," Dissertation Abstracts, XXI (1960-61), 3694.

15
concrete, objective, universal criterion for teaching ability is thus
the primary source of trouble for all who would measure teaching."1
Though this was pointed out in 1935, the situation seems not to have
changed in over thirty years.
While a concept as complex as instructor effectiveness cannot
be clarified by a simple pointing out of past errors, awareness of
shortcomings is necessary before positive measures can be taken. In
the final analysis, value judgments form the basis for establishment
of the criterion. Unfortunately judgments do not agree clearly on
examples of good teachers or on specific manifestations of effective
ability. Even before clarifying these problems, educators should de
cide upon the desired outcomes of teaching.
Many studies in the past have tried to deal with the entire
problem rather than throwing light on a single, carefully defined as
pect of the problem. No one study by itself can add much to the final
solution, but "faith is to be placed in a large variety of well planned
studies, each aimed at contributing some essential element of under
standing, and planned so as to afford greater insights by which sub
sequent studies may be guided."2
Hedges and MacDougall3 summarized the various approaches whichV
have been used in the measurement of teaching efficiency by including
1
Helen M. Walker (ed.), The Measurement of Teaching Efficiency(New York: The Macmillan Company, 1935), pp. x and xi.
2N. L. Gage and Jacob S. Orleans, "Guiding Principles in the
Study of Teacher Effectiveness," llisIsIgnalsliuslusulisagsm, III(December, 1952), 296.
3William D. Hedges and Mary Ann MacDougall, "Recording Student
Perceptions of Teacher Behavior by Means of a Student Response Monitor," Journal of Educational Research, LVIII (December, 1964), 163-66.
16
the following: (a) attributes of mostliked and mostdisliked instruc
tors as listed by students, (b) characteristics of effective and inef
fective 3nstructors categorized for careful study of possible common
factors, (c) correlation between training and practice, and (d) evalua
tion by experts.
A characteristic commonly found in the criteria of studies de
signed to measure instructor behavior is the indirectness of the meas
ures used as the criteria. If the ultimate goal of higher education is
a satisfactory adjustment of the student to self and others, then the
logical criterion should be a measure of this adjustment. Since a
statistical appraisal of adjustment after graduation is almost impos
sible to attain, research workers are forced to rely upon criteria
which are assumed to be indirectly related to this ultimate goal. Ac-
cording to Orleans, Clarke, Ostreicher, and Standlee,1the problem
then becomes one of selecting appropriate predictors to serve as ap
proximations to the ultimate objective. The selection involves choos
ing a predictor that is an accurate measure of the final objective and
making a statistical decision concerning the applicability of the cri
terion to other populations.
5. Specific Empirical Studies of Teaching Behaviors
a. Administrator Ratinas. A listing of the various criteria
used in the appraisal of instruction would represent an extensive com
pilation of factors which have been considered to be influential. Some
1Jacob S. Orleans, Daniel Clarke, Leonard Ostreicher, andLloyd Standlee, "Some Preliminary Thoughts on the Criteria of TeacherEffectiveness," Journal of Educational Research, XLV (May, 1952),641-48.

of the criteria are not mutually exclusive, hence overlap is unavoid
able. Nevertheless, a study of some of those which are commonly em
ployed may serve to illuminate the problem.
One of the variety of criteria employed in the evaluation of
instruction is the use of administrative ratings. A characteristic of
the American system of higher education is the priority usually given
to the administrator for making decisions of hiring, dismissal, salary
increases, and promotion in rank. Since the educational structure it
built in this manner, administrators find it necessary to evaluate the
instructors in their departments based upon some conception of perform
ance. Unfortunately, "few systematic plans"1 are available to the ad
ministrator who wants to determine whether or not he has a good fac
ulty. Of those techniques which have been developed, "none has
proved entirely satisfactory, either because of insufficient objec
tivity or because of too great emphasis on quantitative aspects."2
Survey studies, usually of the questionnaire design, reported
in the literature have attempted to ascertain the characteristics of
instructors which administrators consider the most and least desirable.
One of the earliest is by Kelly3 who asked executives and administra
tors of churchaffiliated colleges to identify the individuals whom
these college officials felt to be the outstanding teachers. The
hypothesis supporting his study was that these nominees for greatness
1W. W. Charters, "Sizing Up the Faculty," The Journal of HigherEducattop, XI (December, 1940), 457.
2Henry Beaumont, "The Measurement of Teaching," TJe Journal ofHigher Education, IX (February, 1938), 96.
3Robert L. Kelly, "Great Teachers and Methods of Developing
Them," Association of American Colleges Bulletin, XV (March, 1929),49-67.

18
were largely a product of educators' imaginative idealism and these
individuals achieved their stature in the profession simply because of
circumstantial forces. Some of the results of this study. character
ized the great teachers as having appeared in the present century, as
always having taught the prestigeful subjects, as having demanded pro
ductivity from their students, and as not having been popular with the
students.
Rather than identifying individually distinguished educators
with their accompanying postulated traits, Breed,1 reporting an admin-
istrative analysis of teaching at the University of Chicago, focused
on broad categories which could be used as a basis for appraisal and
selfimprovement. Listed in rank order, the suggestions included sub
ject knowledge, teaching skills, personality characteristics, profes
sional growth, and institutional atmosphere. The administrators ac
knowledged that inefficient teaching, when present, was traceable to
careless hiring practices and poor teaching improvement plans.
Reed in collaboration with Maguire, Thomson, and van der Vate,2
by means of written inquiries or questionnaires sent to liberal arts
colleges, universities, teachers colleges and normal schools, reported
administrators' conceptions of the effective and the ineffective col
lege teacher. Even though the results lacked statistical refinement,
the study has merit in the tabulation and synthesization of administra
tive opinions. For example, the survey showed that the liberal arts
college administrators pictured the effective instructor as presenting
1Frederick S. Breed, "A Guide for College Teaching," School and
Society, XXIV (July 17, 1926), 82-87.
2Reed ,et al., op. cit., pp. 1-344.

19
concise, organized lectures; as exhibiting genuine interest in stu
dents; and as continuing his professional advancements. The person
ality of the effective instructor was stable and coordinated. The in
effective teacher was described generally as manifesting the negative
dimensions of the traits characterizing the effective teacher,
The teachers college administrators surveyed in Reed's study
indicated close agreement with the liberal arts college administrators
concerning traits of effective and ineffective instructors. Highly
desirable descriptions included thorough knowledge of subject, diverse
academic interests, and compassionate feeling toward students. The
ineffective instructor was described as being unable to adjust to pro
fessional demands, to be lacking in scholarship, and to be incapable of
a healthy attitude toward students.
A highly similar classification of positive traits was devel
oped by college executives as reported by Trabue.1 Highest ranking
was given to the instructor's academic record in his teaching field.
Other top ranking characteristics were attitude toward students, sta
bility of emotions, and tolerance toward debatable topics.
Stauffer,2 investigating the relationship between the judgments
of academic deans and young teachers concerning the behaviors of good
college instructors, determined the productmoment coefficient of cor
relation to be .96. Judged to be most important were behaviors related
11A. R. Trabue, "Judgments by 820 College Executives of Traits
Desirable in LowerDivision College Teachers," Journal of Experimental
Education, XXI (June, 1953), 337-41.
2John Nissley Stauffer, "Judgments of Liberal Arts CollegeTeachers and Deans Regarding College Teacher Qualifications," Dissertation Abstracts, XVII (Part 1; 1957), 285-86.

to actual teaching, personal and social life, mental awareness, and
professional issues.
Studies employing the criterion of administrators' ratings for
the evaluation of instruction demonstrate that little systematic evi
dence is available with which to make accurate decisions. Administra
tors have been attempting to find a solution despite the lack of ob
jective means.
b. Ratings by Instructors. As revealed in the literature,
systematic evaluation of the instructional process is more frequent
among the instructors than among the administrators. A basic assump
tion of many research projects is that instructors feel a need to im
prove their teaching behavior because of the ego satisfactions derived
from successful performance. The critical incident technique developed
by Flanagan1'2
for use in the United States Air Force is suggested as a
means of collecting data which could be used for selfimprovement.
Simpson3
reported a list of approaches to selfimprovement used
by 5,303 instructors. The most frequently mentioned devices were eval
uation of one teaching method against a second method, discussion with
other instructors, use of student comments, visitation of other in
structors' classes, and use of student ratings. The author concluded
that teachers were eager to improve their instruction but many were
1John C. Flanagan, "The CriticalRequirements Approach to Educational Objectives," School and Society, LXXI (May 27, 1950), 321-24.
2John C. Flanagan, "The Critical Incident Technique," The
Psychological Bulletin, LI (July, 1954), 327-58.
3Ray H. Simpson, "Use of Teacher SelfEvaluative Tools for the
Improvement of Instruction," Improvement of Instruction in Higher Education, A Report by the Subcommittee on Improvement of Instruction ofthe Committee on Studies (Washington, D. C.: The American Associationof Colleges for Teacher Education, 1962), pp. 49-62.

21
handicapped because of not knowing how to proceed with the process,
thus inferring a deficiency in their professional training and in their
orientation by the employing institution.
A real problem debated by instructors is the implementation of
a rational program to govern advancement and promotion. One such pro
gram was described by Springer.1 The criteria for advancement and
promotion which this faculty group felt were important included the
following: (1) teaching behavior, covering aspects of instruction such
as proficiency in lecturing and in class discussion, effect upon stu
dents, and writing of syllabi; (2) professional contributions, with
emphasis upon publications; (3) service to the institution; (4) commu
nity service; (5) professional activities before present appointment;
(6) longevity at current institution; and (7) concrete indication of
present and future professional leadership.
Criteria such as these, while ambiguous and perhaps subject to
some misinterpretation, do serve to identify some of the main issues
in the teaching evaluation task. Evaluation of instruction by the in
structors themselves is a substantial improvement over purely subjec
tive appraisal provided the process is systematic.
c. Alumni Ratings. If the ultimate goal of higher education
is the successful adjustment of the individual to a democratic society,
then a reasonable assumption is that research on effective teaching
should consider this goal. One criterion suggested is evaluation of
teaching by students and alumni. Student ratings will be discussed in
a later section of this study.
1E. Kent Springer, "Criteria for Advancement and Promotion of
the Teaching Staff," Higher Education, VII (January, 1951), 117-18.

22
While alumni ratings might appear to be a decisive indication
of the effects of instruction, there are several deficiencies inherent
in the approach. With the passage of time and the accumulation of addi
tional experiences, normal humans have a tendency to forget unpleasant
events while, simultaneously, they usually recall more easily the
pleasant events. Unless the instrument devised to assess alumni reac
tions to instruction can be designed to correct for this factor, the
results may be misleading. A difficulty of this method is the sheer
physical task of contacting these individuals. Because of human er
rors in keeping records, mobility of the American citizen, and other
circumstances, the research worker intending to use alumni as subjects
must be aware of the possibility of a biased sample. Fully recogniz
ing that studies employing alumni attitudes toward instruction prob
ably reflect the aforementioned deficiencies, an analysis of several
of them, nevertheless, may be illuminating.
Bogardus 1 reasoned that reports of graduate students and alumni
collected over a time interval of fifteen years would reflect more
stable judgments than the decisions which characterized the undergrad
uate students. The desirable traits which were identified included
knowledge of subject, familiarity with contemporary views, logicality
of presentation, fairness in evaluation, and balance in perspective. A
moralistic approach, lax personal habits, and egocentric attitude were
some of the disliked traits mentioned by these subjects.
All available graduates who had earned the Ph. D. degree or who
had been candidates for the degree at George Peabody College for
1Emory S. Bogardus, "Behavior Patterns of College Teachers,"
Socioloav and Social Research, XXX (JulyAugust, 1946), 484-90.

23
Teachers during the period 1919 to 1950 were asked by Hedgesl to select
the discriminating qualities of the instructor who had affected each
student to the greatest degree. Some of the classes of teaching men
tioned by these subjects, arranged according to rank, were academic
scholarship, student relationships, subject knowledge, outstanding in
struction, and pleasant receptiveness. A total of twentysix broad
classes were identified. The responses were then divided into clus
ters of traits. Three clusters emerged and were arranged according to
instructorstudent interrelationships, academic standing of the in
structor, and classroom expectations of the instructor. Almost one
half of the responses referred to the instructorstudent interrelation
ship, while those relating to the academic standing of the instructor
ranked second and the classroom expectations of the instructor ranked
third. The author concluded that the personal interaction between
teacher and student was of much greater significance in the lives of
these individuals than any other single factor.
Testing the hypothesis that student conceptions of the ele
ments of effective instruction were altered with the passage of time,
Drucker and Remmers2
compared the reactions of undergraduates with
those of alumni. Attempts were made to secure a representative sample
of subjects by limiting the number of alumni and students from each
school and department to a proportion of instructors.represented in
1William D. Hedges, "The Effective Teacher at the Doctoral Levelin Education," Peabody Journal of Education, XXXIX (May, 1962), 351-54.
2A. J. Drucker and H. H. Remmers, "Do Alumni and Students Dif
fer in Their Attitudes Toward Instructors?" Purdue University Bulletin,Studies in Higher Education. Nos. 61-73 (Lafayette, Indiana: PurdueUniversity, 1947-50), pp. 62-74.
24
the sample. A correlation of .92 was found between the ratings of the
two groups, leading to the conclusion that a high positive relationship
existed between the ratings of instructors by alumni and by students.
A major generalization that can be made from studies of alumni
ratings is that alumni ratings are in substantial agreement with stu
dent ratings of effective instruction.
d. Student Changes. A measure judged to be important as a
predictor of the ultimate criterion of education is student change,
measured in a variety of ways such as grades, achievement scores, at
titudes, skills and other behaviors which can be expressed objectively.
If the record of the specific unit of behavior being evaluated is in
quantitative form, the results have an advantage over less exact in
dices. The greater the objectivity present in the measure being used,
the greater the likelihood of reliability and validity. Inversely, as
subjectivity becomes a more potent factor, reliability and validity of
the measurement decrease.
Using the examination performance of about 36,000 students as
the criterion of teaching effectiveness, Cheydleur 1 arrived at the fol
lowing results: (1) Instructors engaged in graduate studies while
teaching simultaneously did not teach as well as those ias+ructors who
were not engaged in graduate studies. (2) Instructors who held the
rank of assistants and instructors did not perform as well as those
who held a higher academic rank. (3) No conclusive evidence existed
to indicate that the sexes differed in teaching effectiveness. (4)
1
Frederic D. Cheydleur, "Judging Teachers of Basic FrenchCourses by Objective Means at the University of Wisconsin--1919-1943,"Journal of Educational Research, XXXIX (November, 1945), 161-92.

25
Instructors born in America were better teachers than those born else
where. (5) Holding other factors constant, teaching was more effective
with small classes. (6) Gradepoint average appeared to be more
closely related to a division of students into upper and lower sec
tions than to either quality of teaching or size of class. (7) Charac
teristics of able instructors showed high positive relationship to stu
dent performance on departmental and standardized examinations, while
less able instructors showed low relationship. (8) Evidence was con
clusive that the superior instructor possessed a thorough knowledge of
the subject taught, showed enthusiasm with his profession, and de
manded quality performance from the students.
Research workers make a continual appeal to the effect that a
respectable study of teaching effectiveness involves the deterenatl:,n
of the relationships between the instructor and the student. Such an
investigation would imply that effectiveness is not unidimensional, but
rather that it is a process of multivariate interaction. Knowing what
kind of instructor is most effective with wnat kind of students would
do much to eliminate the notion that there is only one type of effec
tive teaching. Assuming that the interests and personality traits of
instructors and students interacted with achievement level, Krumm1
collected interest, personality, and achievement scores for 656 stu
dents enrolled in an introductory psychology class and interest and
personality scores ft:L. the eleven instructors. His results demon
strated that the studied personality attributes of the instructors
1Richard L. Krumm, "InterRelationships of Measured Interests
and Personality Traits of Introductory Psychology Instructors andTheir Students as Related to Student Achievement" (unpublished Doctor'sdissertation, University of Pittsburgh, 1952), pp. 1-52.
26
and the students' interests interacted to influence.significantly the
achievement scores.
Another investigation demonstrating the differential effects
of instructors upon student achievement was.conducted by Elliott.1
He
used four criteria: student ratings of teachers, instructor knowledge
of mental hygiene, instructor knowledge of subject, and student achieve-
ment with ability held constant. The sample consisted of thirty-six
instructors of a required general chemistry course. His results were:
(1) student achievement in classes of instructors who adhered closest
to specific teaching methods was lower than in classes where the in-
structor was not so greatly concerned with teaching methods, (2)
achievement of students was negatively related to knowledge of subject
among the graduate students who taught, (3) student achievement was
positively related to student ratings of instructors, (4) the abso-
lute grade did not interact with student ratings of instructors, (5)
instructor knowledge of subject was not correlated with student rat-
ings of teachers, and (6) there was no clear-cut relationship between
ability of student and instructor.
An illustration of the disappointing results which could oc-
cur when achievement scores are used as the criterion is the study by
Novak2 who, in comparing the conventional approach to a project-cen-
tered approach, found no significant differences between the groups
1Donald N. Elliott, "Characteristics and Relationships of Var-ious Criteria of College and University Teaching," Purdue University
Studies VI Higher Education. Nos. 61-73 (Lafayette, Indiana:Purdue University, 1947-50), pp. 5-61.
2Joseph D. Novak, "An Experimental Comparison of a Conventionaland a Project Centered Method of Teaching a College General BotanyCourse," Journal o Ex,nerimental Education, XXVI (March, 1950 , 217-30.

27
except that the conventional group showed a greater retention of facts.
The experimental group displayed greater variability of performance on
the achievement tests. One of the benefits suggested by the author was
the opportunity for individual attention afforded by the experimental
approach.
Variations of the commonly used experiments which manipulate
approach to teaching and measure efficiency by student scores are those
which investigate the relationship between class size and achievement.
Even though there appears to be little theoretical support for using
class size as a variable, the number of studies employing it is quite
large, probably because the statistic is conveniently available. Ac
cording to Powell,1the interest in experimentation with class size
has been motivated by administrators anxious to lower cost of instruc
tion.
In a very early study, Edmonson and Mulder2 found little dif
ference in achievement when a large and small class taught by the same
instructor were compared. Rohrer3 reported that achievement and atti-
tudes were related to the differences in instructors and not to the
differences in the class size. Confirming the conclusion that achieve
ment is related to the studentinstructor interaction and not class
1Powell, op. cit., pp. 179-91.
2J. B. Edmonson and F. J. Mulder, "Size of Class as a Factor in
University Instruction," Jounial of Educational Research, IX (January,1924), 1-12.
3John H. Rohrer, "Large and Small Sections in College Classes,"
The Journal of Higher Education, XXVIII (May, 1957), 275-79.

28
size per se is the exploration cf Cammarosano and Santopolo1who dem.
onstrated that student achievement with ability controlled in a large
class was similar to that in a small class.
Further evidence indicating that decisions based on class size
are probably illadvised is the work of Macomber and Siegel2 who
sought to determine the impact of large classes on achievement. Com
pared were large groups taught by the lecture method, large classes
taught by problemsolving or casestudy methods, groups taught by tele
vision, and groups taught by graduate assistants. Results showed that
the better students performed at the same level regardless of the ap
proach used. The students' preference for instructor was based upon
quality of teaching rather than upon method of teaching or size of
class. The attitude of the student toward the instructor was viewed
as being the crucial variable.
The "EightYear Study"3 is another example comparing student
performance and teaching method. The college records of 1,475 grad
uates from traditional schools were compared with a matched sample of
1,475 graduates from progressive schools. Evidence collected over a
number of years indicated that those students from the progressive
schools were "at least as successful as their more conventionally
1Joseph R. Cammarosano and Frank A. Santopolo, "Teaching Ef
ficiency and Class Size," School and Society, LXXXVI (September 27,1958), 338-41.
2F. G. Macomber and Laurence Siegel, "A Study in LargeGroup
Teaching Procedures," The Educational Record, XXXVIII (July, 1957),220-29.
3Dean Chamberlin, Enid Chamberlin, Neal E. Drought, and
William E. Scott, Did They Suueed in College? (New York: Harper andBrothers, 1942), pp. 1-291.

29
trained matches. ftlWhile the study disclosed that there need not be a
conflict between the progressive and the traditional view of preparing
students for college, several criticisms can be made. of the project.
The selection procedures were different for the two groups.
The students from the experimental group were chosen on the basis of
recommendations from teacher and principals while those from the com
parison group were selected from college admission files by members of
the project staff. In order for the groups to have been matched, the
selection procedures should have been the same for all subjects. Since
the experimental group was chosen on the basis of general potential
while the comparable group was selected initially on the basis of ap
titude test performance, it is likely that the effects of regression
toward the mean showed an overestimated mental ability for the com
parable group.
Because of the differences in emphases between the two school
groups, it is likely that students from the traditional schools were
better prepared for testtaking experiences than those from the pro
gressive schools. The capacity of the experimental group was probably
underestimated, and they did show more success in college.
While the study was designed to measure differences between
the two instructional methods, there is the possibility that differ
ences among the instructors influenced the results. The instructors
from the progressive schools could have been enthusiastic over the
experiment and thus contributed to a Hawthorne effect.
A summarizing statement of the use of student changes as a
measure of teaching effectiveness reiterates previous conclusions
laid., p. 41.

30
that no clearcut breakthroughs have been demonstrated. No really sig
nificant differences among methods can be claimed because of differ
ences among students, instructors, and situations. What appears to be
best for one student is not necessarily the best for another. While
the scores representing student change may be free from subjectivity,
their use as a measure of teaching efficiency cannot be justified com
pletely since the ultimate results are not manifested until years after
the scores have been accumulated and decisions made. The influence of
one instructor upon students probably can never be evaluated fully.
Scores representing student change, whether that change is accumula
tion of knowledge and skills, attitude toward class size or teaching
method, are more a measure of student change than of teaching success.
e. Student Performance and Pgrsistencp in Subseauent Courses.
If the final goal of higher education is adjustment of the student,
then a reasonable criterion of teaching effectiveness should be re
flected in his behavior. Measures of student behavior are almost im
possible to accumulate after graduation, but measures of his behavior
in subsequent courses while still enrolled in the institution may in
dicate certain outcomes of the instruction the student has experienced.
A number of studies have assumed that the quality of work done by stu
dents in later course sequences and the persistence of students in
continuing the sequence .s evidence of the effect of teaching and,
thus, a measure of teaching effectiveness.
An attempt to measure teaching effectiveness by means of stu
dent performance in departmental advanced courses was undertaken by
3.1
Beaumont1who concluded that the results substantiated the existence of
wide variations among the instructors when evaluated.by.student perform
ance in subsequent courses. Readily admitted was the possible.presence
of relevant factors interacting to bring about the variations, but the
ability of students and demands of the specific course. were not judged
to be of greatest influence.'
Using the performance of the group in sequential courses and
the tenacity of the group in pursuing the sequence of courses as cri
teria of teaching outcomes, Lancelot2 confirmed that students did show
variances which were related to different instructors. His subjects
were engineering students who enrolled as freshmen from 1920 to 1928
and the members of the mathematics faculty who taught these students
during the same period of time. By controlling the ability factor, he
demonstrated by inference that, if the best students had been taught
only by the most effective instructors, the grades throughout the se
quence would have been higher than the students actually received and
the percentage of students successfully finishing the sequence would
have been increased.
Studies which use student performance and persistence in sub
sequent courses as the criterion for teaching behavior measure only
one aspect of teaching. Only the shortrange effect of instruction on
a limited dimension of student behavior is investigated. This approach
1Henry Beaumont, "A Suggested Method for Measuring the Effec
tiveness of Teaching Introductory Courses," The Journal of Educational
Psvcholoav, XXIX (November, 1938), 607-12.
2William H. Lancelot, "A Study of Teaching Efficiency as Indicated by Certain Permanent Outcomes," The Meapurement of Teaching
Effjciencv, ed. Helen M. Walker (New York: The Macmillan Company,
1935), pp. 3-69.

32
may have some merit, but it has serious deficiencies also. A safe as
sumption appears to be that the type of interaction between students
and faculty determines, in part, the students' interest in future
courses of study. Completely ignored in this approach to teaching ef
fectiveness are factors such as initial motivation and interest of the
student. The personal influence of the instructor on students' deci
sions to persist in school may be regarded as a tentative index of the
instructor's ability to inspire students to forego immediate benefits
in deference to longrange gratification. A thoroughly conceputalized
study which measured teaching effectiveness by using this criterion
would take account of the inherent deficiencies. While the procedure
could produce objective measures of differences among students who had
been taught by different instructors, the results would be biased un
less factors such as variances in ability, background, motivation,
and other influences were controlled. Unless the groups were similar
in all measurable characteristics, the results would be distorted.
In addition, the investigation would need to be restricted to intro
ductory courses, since the students' experiences in a beginning course
taught by a specific instructor are assumed to be crucial in influ
encing his subsequent choices.
f. Student Comments and Ratinas of Instructors. Only recently
have educators recognized that properly organized and cooperatively
sponsored systems of student evaluation of instruction can contribute
toward improvement of instruction. As the educational structure has
become less authoritarian and more democratic, the privilege of judging
quality of instruction is no longer restricted to the administrators but
has been granted to others.

33
Although still questioned by many persons associated with edu
cation, evaluation of instruction by students appears to be gaining in
support, particularly since objective evidence has accumulated to dem
onstrate its value) Student rating is an attempt. to improve teaching
by a consultation with the students. When used properly, student
rating seems to contribute to improvement since the responsibility for
finding and handling reported weaknesses is usually placed with the
instructor.2
'3
'4
'5
A demonstrated factor of significance in the teaching process
is the nature of the studentinstructor relationship. Student opinion
of the effectiveness of teaching, because it is a reflection of this
interaction, might contribute to clarification of needed steps toward
improvement of teaching. A reasonable hypothesis in regard to student
evaluation is that students are good judges of teaching. They are in
a position to make direct and extended observations of the process,
an activity which few instructors and fewer administrators can pursue.
"There is no better criterion of teaching aptitude than teaching
1Joseph E. Morsh and Eleanor W. Wilder, Identifying the Effpctive Instructor: A Review of the Quantitative Studies. 1900-1952,Research Bulletin AFPTRCTR-54-44 (San Antonio, Texas: Air Force Personnel and Training Research Center, Lackland Air Force Base, October,1954), pp. 1-151.
2W. D. Armentrout, "Improving College Teaching by Consulting
the Consumer," School Executives Magazine, LI (July, 1932), 476-77.
3Jeanette A. Vanderpol, "Student Opinion--Sacred Cow or BoobyTrap?" The Journal of Teacher Education, X (December, 1959), 401-12.
4N. L. Gage, "The Appraisal of College Teaching," The Journalof Higher Education, XXXII (January, 1961), 17-22.
5R. W. Lewis, "A Garland of Ratings, or Just Try to Know Thyself," LAWIWL11911213, XXV (May, 1964), 587-90.

34
performance, and there are no better judges of teaching performance
than students and colleagues. "1
The idea of students rating instructors produces differences of
opinion when it is discussed or proposed as a procedure.. One of the
general sources of criticisms originates with the instructors them
selves, some of whom claim that evaluation 5y students might be deroga
tory to their status.2
According to Brannon,3 student rating of in
structors showed evidence of lack of confidence by students in many
instructors.
Many investigators assert that a study of teaching procedures
is useful for facilitating the educational process. A knowledge of
student opinion toward subjects, toward methods, and other features
could lead to improvements in teaching. Using the relationship between
attitude toward a subject and feeling toward instructor of the subject
as a criterion, Corey and Beery4 determined that student dislike of a
high school teacher of a specific subject was manifested through his
not electing to enroll for the same subject while in college. The
data implied that student feeling toward a subject was closely related
to the feeling toward instructor. This feeling was transferred to the
college situation.
Record,
Journal
1E. R. Guthrie, "The Evaluation of Teaching," The EducationalXXX (April, 1949), 115.
2David G. Ryans, "Notes on the Rating of Teacher Performance,"
of Educational Research, XLVII (May, 1954), 695-703.
3C. H. Brannon, "Professors Are Poor Teachers," School and
kratety, XLVII (April 30, 1938), 576-77.
4Stephen M. Corey and George S. Beery, "The Effect of Teacher
Popularity upon Attitude Toward School Subjects," The Joyrnal of Edw.:AAppal Psvcholooy, XXIX (December, 1938), 665-70.

Instructors may hold an untested assumption that one method of
teaching is more productive than another. These preconceived notions
could be measured objectively by the use of student ratings thus serv
ing as a confirmation or negation. Suspecting that the outcomes of
lecture and discussion methods might represent contrasts, Ruja1hypoth
esized that students in discussion sections would rate their instruc
tors more favorably than would students in lecture sections. Assuming
that students' measured attitudes toward instructors could be diagnosed
as attitudes toward subjects and education generally, he developed and
administered a ninetyitem scale designed to assess emotional reactions
toward instructors. After statistical analysis of the results, he con
cluded the following: (1) students enrolled in discussion classes
showed no greater mastery of subject than students enrolled in lecture
classes, (2) students enrolled in discussion classes exhibited no sig
nificant adjustment gains over students enrolled in lecture classes,
(3) philosophy instructors of lecture and discussion sections were
rated differently by students while no such difference occurred for
psychology instructors, (4) students in discussion sections were able
to become acquainted with one another in greater numbers than in lec
ture sections.
Another assumption, often untested, relates certain methodologi
cal procedure with the development of critical thinking. Factors that
might contribute to development of changes in critical thinking were
1
Harry Ruja, "Outcomes of Lecture and Discussion Procedures inThree College Courses," Journal of Experimental Education, XXII (June,1954), 385-94.

investigated by Lyle.1
Despite the use of experimental and control
groups, he concluded that there were no significant differences between
the students' performance on a test of critical thinking. The experi
mental subjects rated the instructor more favorably while the control
subjects rated the course more favorably. The control group scored
higher on an achievement test of subject knowledge, but the experi
mental subjects displayed more independent thought on a final examina
tion and greater awareness of problems in their term papers.
Student ratings may not be ideal in all situations, but the
instructor could be benefited by evidence indicating that he is per
ceived differently by different groups. Wedeen2 investigated the hy
pothesis that two sections of the same course would react differently
to the same instructor. Opinions were collected at the conclusion of
the semester. One class, which was slightly older in chronological
age and one semester ahead of the second group, reacted to the course
by rating it less favorably than the second group. Differences were
noted in reactions to the personal characteristics of the instructor,
t'e appropriateness of the examinations, and the severity of the grad
ing. The findings indicated that the same instructor teaching the same
course to two sections of students concurrently was rated differently
by the two groups.
lEdwin Lyle, "An Exploration in the Teaching of Critical Thinking in General Psychology," Journal of Educational Research, LII (December, 1958), 129-33.
2Shirley Ullman Wedeen, "Comparison of Student Reaction to
Similar, Concurrent TeacherContent Instruction," Journal of EducationalResearch, LVI (JulyAugust, 1963), 540-43.

37
A common argument against the use of student ratings is that
students are not competent to judge effective teaching.1
Evidence is
found by pointing to the lack of agreement between student ratings and
faculty ratings.2 The low correlation between the two groups of raters
indicated the presence of differences.
When students are asked to list the primary attributes of ef
fective instruction from their viewpoint, the results indicate genuine
and sound suggestions which could be used profitably for the improve
ment of teaching. The qualities which they regard as most important
usually are professionally desirable and are not necessarily ones which
tend to make the course easier or less demanding for them.
The study by Smith3
in which students selected traits asso-
ciated with good university teaching is an example. The qualities
considered to be ranking highest by these subjects included empathy
toward students, balance in perspective, knowledge of subject, contem
porary in outlook, and inspirational in intellect. Those qualities
ranking lowest, from among a total of twentysix traits, were adequate
vocabulary, flexibility, university loyalty, integrity, and acknowl
edgment of responsibility. When the rankings by freshman, sophomore,
junior, and senior students were compared, the agreement that subject
knowledge and organized teaching were among the most desirable traits
11
H. Taylor Morse, "The Improvement of College Instruction,"Americap Association of Colleges for Teacher Education, Twelfth Yearbookof the American Association of Colleges for Teacher Education (Washington, D. C.: American Association of Colleges for Teacher Education,1959), pp. 113,32.
2Guthrie, The Educational Record, XXX, 109-15.
3Allan A. Smith, "College Teachers Evaluated by Students,"
Socioloav and Social Research, XXVIII (JulyAugust, 1944), 471-78.
38
was very close. Smith acknowledged that the investigation would have
been improved considerably if the qualities had been defined.
A survey study of more than 6,600 Brooklyn College .students1
revealed strikingly similar qualities considered of greatest and least
importance. Traits descriptive of professional competence, such as
knowledge of subject, organization of material, and ability to inspire,
were given highest rating, while those descriptive of personal quali
ties, such as speaking ability and pleasing personality, were rated as
of lesser importance to the students.
In a slightly different approach to the problem, Taylor2 at
tempted to discover the characteristics of the "best liked" and "least
liked" teachers according to students' perceptions and the differences
between these two extremes. His design consisted cf responses by 775
seniors and graduate students to unstructured sentences and of responses
to a sixtyitem check list. The results appeared to indicate that these
students looked for a combination of personal and professional traits in
their instructors. Enthusiasm, understanding, and professional pride
were some of the personal characteristics which identified the "best
liked" faculty member, and skillful evaluation, organized classwork,
and careful data analysis described his professional characteristics.
Thl "least liked" instructor was characterized largely in terms of a
personal frame of reference including such undesirable qualities as
egocentrism, authoritarianism, and resentfulness. He was disliked
1Medalie, OD, cit.
2George Flint Taylor, "Characteristics of Best Liked Teacher,
Least Liked Teacher and Most Effective Teacher in Teacher TrainingInstitutions," Dissertation Abstracts, XX (1959-60), 1233.

39
professionally because of emphasis upon rote memorization of. facts.
None of the subjects indicated that the "least liked" teacher was his
"most effective" teacher, but 88 per cent of the students indicated
that their "best liked" instructor was also their "most effective" in
structor.
Some studies have sought to correlate student ratings with fac
ulty ratings for the purpose of comparing judgments. An example of
such a study is the exploration by Yourglich1who assumed that, since
the studentinstructor interaction represented.a vital component of the
teachinglearning situation, both students and instructors behaved with
reference to their conceptualized images of an "Idealteacher" and an
"idealstudent." By means of questionnaires, thirtyfive instructors,
representing all departments of a Pacific Northwest university, all
ranks from instructor to professor, and experience from one to twenty
years, and 101 undergraduates, representing freshmen, sophomores,
juniors, and seniors, were asked to list the traits which they felt
characterized the "idealteacher" and "idealstudent." Yourglich con
cluded that there was less agreement between instructors and students
concerning the "idealteacher" attributes than between instructors and
students concerning the "idealstudent" attributes. The respective co
efficients of correlation were .592 and .888.
Findings such as these, providing they can be replicated, en
able interested persons to pursue statistically the possible reasons
for the differences identified in the traits students assign to
1Anita Yourglich, "Study on Correlations betwee College Teach
ers' and Students' Concepts of 'IdealStudent' and 'IdealTeacher',"Journal of Educational Research, XLIX (September, 1955), 59-64.

40
effective teaching and in those which faculty members assign. A fur
ther investigation into the reasons why there was substantial agreement
concerning the characteristics of the "idealstudent" would be of value
also.
A second study illustrating the benefits which can be gained
from correlating student ratings and instructor ratings was conducted
by Isaacson, McKeachie, and Milhollandl who asked students enrolled in
an introductory psychology class to complete instructor rating forms
evaluating a group of equated teaching fellows. The instructors com
pleted peer group nomination:forms, selfevaluative check lists, and
personality inventories. These scores were compared to the student
rating scores. The only discernible trend was a high relationship be
tween student ratings and a total culture score. The instructors who
were rated as effective by the students were rated by other instruc
tors as "sensitive," "intellectual," "polished," and "imaginative."
Results such as these could lead to the eventual conclusion that eval
uations by students and faculty members are in closer agreement when
cultural factors are investigated.
A third study exemplifying the values that could be attained
with use of student comments is by Allport2who compared student ratings
with observer ratings. The coefficient of correlation between the two
sets of ratings was around .50. Even though there were considerable
divergencies as indicated by the modest correlation, both groups agreed
1Robert L. Isaacson, Wilbert J. McKeachie, and John E. Milhol
land, "Correlation of Teacher Personality Variables and Student Ratings," Journal of Educational Psychology, LIV (1963), 110-17.
2Allport, op. cit., pp. 36-56.

41
that the best instructors exhibited acceptance of the student, gave an
occasional verbal reward, and displayed self,-confidence.in their teach
ing behaviors. The author inserted a qualifying caveat which is ap
plicable to all empirical studies; namely, generalizations should never
be accepted without consideration of the situation and the individual.
Most studies are designed around a specific frame of reference and a
particular set of assumptions which cannot be transferred to other cir
cumstances without some modification. If generalization to another set
of circumstances is desired, acknowledgment must be made of the origi
nal conditions to avoid any possible misinterpretation of conclusions.
Solomon, Bezdek, and RosenbergIused student ratings combined
with observations and tape recordings to investigate the relationship
between teaching behavior and adult learning. The subjects were
twentyfour college and university instructors of night classes. The
scores were factor analyzed producing eight factors. The general con
clusion was that student gains in factual knowledge and in comprehen
sion were affected by different kinds of teaching behavior. Instruc
tors ranking high in "warmth" and "clarity" factors were rated favor
ably by the students.
Recognizing that this earlier study had limitations because of
the small sample, Solomon2 attempted a replication using 229 college
and university instructors of night classes. The factors identified
1Daniel Solomon, William E. Bezdek, and Larry Rosenberg,
Teaching Styles and Learning (Chicago: Center for the Study of LiberalEducation for Adults, 1963), pp. 1-164.
2Daniel Solomon, "Teacher Behavior Dimensions, Course Characteristics, and Student Evaluations of Teachers," American EducotionalResearch Journal, III (January, 1966), 35-47.

42
were similar to those found in the prior study. Significant relation
ships were found between student ratings and instructors who were able
to communicate factual knowledge clearly.
Teaching, as distinguished from the permission of independent
study, is basically an interaction process. There is a substantive
content which is independent of teacher and student but which is medi
ated through both. Teaching effectiveness per se is dependent upon
the strategic management of the content and upon the effects of the
interaction. Instructors may differ in the relative emphasis placed
on these two crucial variables but neither can be reduced to zero.
Student judgment, however collected, is a measure of the impact im
pression of an instructor in a given class. Ratings by supervisors or
by the instructor himself can do no more than infer this impact.
g. Theoreical Logic -nd Statistical Reauirements of Rating
Scales. Examination of the theoretical logic and statistical require
ments of the rating scale, when used to measure the attitudes of stu
dents toward individual instructors, will answer most of the criticisms
which have been directed at the device.
Rating systems are widely used in the armed forces, in civilservice, and in industry as routine methods for evaluating personnel, and such ratings are often the most available criterionrecord. In many cases, no other type of record is readily available or conveniently procurable.)
A subcommittee of the Committee on Personnel Methods of the
American Council on Education, in undertaking a threeyear study of
rating techniques, concluded the work convinced that rating scales
had been demonstrated to be of sufficient value to justify their
1Robert L. Thorndike, Personnel Selection (New York: John
Wiley and Sons, 1949), p. 155.

43
careful use and to warrant further experimentation even though the sub-
committee began the project with a skeptical attitude. The study indi-
cated that the reliability of rating scales may, under favorable condi-
tions, approximate the reliability of good objective tests.'
While there may be several acceptable methods of securing stu-
dents' judgments of teaching effectiveness, the method which employs
rating scales is used at least as frequently as any other recognized
method. Remmers referred to the definition of the rating scale as a
device used to evaluate "products, attitudes, or other characteris-
tics"2 and stated that the rating device is used in educational re-
search more than any other method because teaching is too complex to
be evaluated by any procedure that is less adequate. Guilford wrote
that
the forms of rating scales in common use fall into five
broad categories: numerical, graphic, standard, cumulated
points, and forced choice. Any such classification must neces-sarily be a very loose one, based on shifting principles. The
types are all alike in that they call for the assignment of ob-
jects by inspection, either along an unbroken continuum or in
ordered categories along the continuum. They are all alike in
that the end result is the attachment of numbers to those as-
signments. They differ in the operations of placement of ob-
jects, in the kind and number of aids or cues, and in the fine-
ness of discrimination demanded of the rater.3
Research workers in business and industry have demonstrated the
crucial role of attitudes as opposed to skills in the productivity of'
1Francis F. Bradshaw, "Revising Rating Techniques," Personnel
Journal, X (June, 1931 to April, 1932),,232-45.
;i H. Remmers, "Rating Methods in Research on Teaching,"
Handbook of Research on Teaching, ed. N. L. Gage, The American Educa-
tional Research Association, National Education Association (Chicago:
Rand-McNally and Company, 1963), p. 329.
3J. P. Guilford, Psychometric Methods (2d ed., New York:McGraw-Hill Book Company, Inc., 1954), p. 263.

44
personnel. Student attitudes toward instructors is one variable in the
teachinglearning situation as well, exerting some influence on the
students' ideas of the effectiveness of teaching.
That these attitudes are important in the learning situationand that they profoundly affect both achievement and retentionis the testimony of both common sense experience and many empirical studies in which the experimental approach has been appliedto problems in educational psychology.1
Traits are verbal descriptions of personality characteristics
which individuals are thought to possess, or which individuals have
been demonstrated to possess. Basic to this assumption is the general
agreement of the culture upon the connotation of a particular label
attached to a particular behavior.
The use of the rating scale in the evaluation of teaching rests
upon the assumption that human behaviors have certain common features
which lie within broad extremes, thus human behaviors can be described
in general categories. In addition, each person possesses certain
qualities relatively unique to a degree with him. Hence, an individual
rating will show certain peaks and valleys within the broad pattern.
Both of these characteristics are compatible with rating scale measure
ment.
While much confidence is being placed in the benefits derived
from the use of rating scales, judged by the frequency with which they
are used and the statistical accuracy with which the instrument is ac
claimed, it is incumbent upon the user to be aware of certain
1John A. Creager, "A MultipleFactor Analysis of the PurdueRating Scale for Instructors," Purdue University Bulletin, Studies inHigher Education, Nos. 61-73 (Lafayette, Indiana: Purdue University,1947-50), p. 75.

45
requirements which must be satisfied before the rating scale can be
used appropriately and the results interpreted accurately.
The basic consideration of any instrument designed to measure
some variable is the validity characteristic. Broadly stated, validity
is concerned with the degree to which the instrument measures that
which it has been designed to measure. When a rating scale is used to
measure student attitudes toward the effectiveness of an instructor,
the validity is concerned with the accuracy with which the student at
titudes are being measured. Brandenburg and Remmers1agreed by point
ing out that student reactions to the instructor were being measured
and not student judgment of the true effectiveness of the instructor.
Russell said
. . . that so long as one is interested only in measuring studentevaluation of an instructor or course, then assuming reliabilityof the measure, by definition the measure is valid. However, ifone's interest lies in an evaluation of teacher effectiveness,then studentevaluation measures only one of the many possibleaspects of the criterion. Since one's measure is no longer defining the criterion, then validity is not synonymous with reliability.2
Ideally, student attitudes toward instructors should be corre
lated with some independent criterion of teaching effectiveness, but
no universally accepted objective criterion is available. Hence, re
liance must be placed in the face validity of the instrument. An in
strument has face validity "if it looks valid--particularly if it looks
1G. C. Brandenburg and H. H. Remmers, "Rating Scales for In
structors," Educational Administration and Supervision, XIII (September, 1927), 399-406.
2Harold E. Russell, "Interrelations of Some Indices of Instruc
tor Effectiveness: An Exploratory Study" (unpublished Doctor's dissertation, University of Pittsburgh, 1951), p. 47.

valid to laymen."1
If the items give the impression that they are re-
lated to the criterion, the effect will be likely to increase the mo-
tivation of the student, a highly desirable condition.
Research studies have confirmed the assumption that students
are capable of accurately describing instructors' behavior as it is
manifested in the classroom. Of all segments of the population, stu-
dents are the one group which has the opportunity to observe instruc-
tors over an extended period of time. Because of this lengthy associa-
tion, the student has information not possessed by others for giving
descriptions of the instructors' behavior. Since this is the case,
student attitude is regarded as an accurate reflection of the criterion
being measured. In the final analysis, human judgments form the basis
of social decisions.
If competent judges appraise Individual A as being as muchbetter than individual B is better than Individual C, then itis so, as there is no higher authority to appeal to.2
French3
reported a factor analysis study of the relationship
between student attitudes and instructor characteristics. At least
eight dimensions were considered influential in students' ideas of ef-
fective instruction. Ability to explain, ability to stimulate, and
knowledge of subject were three broad characteristics which students
1
Edward E. Cureton, "Validity," Educational Measurement, ed.E. F. Lindqui,st, American Council on Education, Washington, D. C.(Menasha,Alsconsin: George Banta Publishing Company, 1951), p. 672.
2Truman Lee Kelley, The Influence of Nurture upon Native Dif-
ferences (New York: The Macmillan Company, 1926), p. 9.
3Grace Marian French, "College Students' Concept of Effective
Teaching Determined by an Analysis of Teacher Ratings" (unpublishedDoctor's dissertation, University of Washington, 1957), pp. 1-61.

47
judged to be among the most important. When compared with an earlier
study by Guthriel ttc3 results were highly similar.
Such agreement becomes even more striking when we rememberthat the populations of students in the two studies are morethan a generation apart. Apparently, student notions of goodteaching are rather stable things.2
A second consideration by which an instrument is evaluated for
its adequacy of measurement is that of reliability. A measure pos
sesses reliability to the extent that the scores it yields are free
from error variance. The larger the error, the lower the reliability.
Reliability is increased if duplicated measurements show a high degree
of consistency. The reliability coeffic,,ent of particular concern in
student ratings is stability, a measure of dependability over a time
interval yielded by an administration of the same instrument on two
occasions. Thewprobability of obtaining significant differences be
tween the scores of two administrations of the same instrument is de
creased with lack of reliability, as the presence of error variance
will mask any true variance. In the words of Remmers, "since it is
student judgments that constitute the criterion, reliability and va
lidity in this case are synonymous,"3
and of Russell, "validity is
defined as being synonymous with reliability which, if we are inter
ested in only the 'opinions' or 'attitudes' is a satisfactory defini
tion."4
1E. R. Guthrie, The Evaluation of Teaching: A Progress Report(Seattle: University of Washington, 1954), pp. 1-10.
2French, op. cit., pp. 46-47.
3H. H. Remmers, "Reliability and Halo Effect of High School and
College Students' Judgments of Their Teachers," The Journal of AppliedPsychology, XVIII (1934), 621.
4Russell, 2112_11.1., p. 49.
48
Critics of the rating scale point out that student judgments
lack consistency because of characteristics such as immaturity, subjec
tivity, and naivete, the combined effects of which will operate so as
to lower reliability. Studies which have investigated this criticism
demonstrated that the reliability coefficient of student ratings usu
ally has been found to lie in the respectable range. Voeks and
French1
found the reliability coefficient of student ratings to be
.944, and Guthrie2 arrived at a total reliability coefficient of .93
when he surveyed student ratings of instructors. High reliability of
student ratings was confirmed further by Smeltzer and Harter,3Heilman
and Armentrout,4
Root,5Hayes,
6and Snedeker.
7
Even though the rating scale is widely used and generally ac
cepted as an adequate instrument for measuring human behavior, certain
1Virginia W. Voeks and Grace M. French, "Are StudentRatingsof Teachers Affected by Grades?" The Journal of Higher Education, XXXI(June, 1960), 330-34.
2Edwin R. Guthrie, "Evaluation of Faculty Service," Bulletinof the American Association of University Professors, XXXI (Summer,1945), 255-62.
3C. H. Smeltzer and R. S. Harter, "Comparison of Anonymous andSigned Ratings of Teachers," Educational Outlook, VIII (January, 1934),76-84.
4J. D. Heilman and W. D. Armentrout, "The Rating of College
Teachers on Ten Traits by Their Students," The Journal of EducationalPsychology, XXVII (March, 1936), 197-216.
5Alfred R. Root, "Student Ratings of Teachers," Thg Journal ofHigher Education, II (1931), 311-15.
6Robert Bennett Hayes, "A Measure of Student Attitude TowardsTeaching Effectiveness," Dissertation Abstracts, XXII (1961-62),2265-66.
7John Haggner Snedeker, "The Construction of a ForcedChoice
Rating Scale for College Instruction," Dissertation Abstracts, XX(1959-60), 1273-74.

influences surrounding rating scale measurements could operate so as to
distort the yielded results. One of these influences is the "halo ef
fect."1'2
Lorge3
indicated that the presence of the bias was related to
the method by which the instrument was marked by the rater, pointing
out that the positive correlations found between certain responses of
several specific psychological instruments may be indicative of under
lying personality dimensions. While the influence of the "halo effect"
must be recognized as possibly contributing to the distortion of re
sults, its contribution is not significant as long as the rating scale
is used to measure student descriptions of instructors.
Another bias thought to exert a possible influence on student
ratings measured by rating scales is the relationship between the rat
ings given to instructors and the grades obtained by students from the
instructors rated. The relationship may not be a simple one as evi
den,:ed by Weaver4who found that, while the ratings were biased in
direction of expected grades, most of the bias was aimed at the teaching
skills of the instructor rather than personality dimensions. In addi
tion, those students who expected to earn C grades appeared less
1
Edward L. Thorndike, "A Constant Error in Psychological Ratings," The Journal of Apolied Psvcholoav, IV (March, 1920), 25-29.
2Frederic Lyman Wells, "A Statistical Study of.Literary Merit
with Remarks on Some New Phases of the Method," Ax__I21911:2syglialagy,ed. R. S. Woodworth, Columbia University Contributions to Philosophyand Psychology (New York: The Science Press, I907), XVI, 1-30.
3Irving Lorge, "GenLike: Halo or Reality," The Psvcholooical
Bulletin, XXXIV (October, 1937), 545-46.
4Carl H. Weaver, "Instructor Rating By College Students," _121
Journal of Educational Psychology, LI (1960), 21-25.

50
discriminating than those who anticipated higher grades. Generally,
the conclusion is that the relationship is so insignificant as to cause
little effect on the ratings.1 .2,3,4
Results from rating scales may suffer from sex differences of
the raters. However, investigations which have studied this potential
source of bias demonstrated that no significant differences existed be
tween male and female raters. 5 6
Additional biases which might intervene so as to distort the
measures obtained through the use of rating scales include the rela
tionship between contact of the rater and the rated. Freeberg,7 using
twentythree groups of three unacquainted men in each group, concluded
that ratings were valid only to the degree to which earlier observed
behavior was related to the traits being rated. Investigating the re
lationship between the number of relevant rater contacts and the
1H. H. Remmers, "The Relationship between Students' Marks andStudent Attitude Toward Instructors," School and Society, XXVIII (December 15, 1928), 759-60.
2A. W. Bendig, "The Relation of Level of Course Achievement to
Students' Instructor and Course Ratings in Introductory Psychology,"lact.olpqjauu Ps yAchokirernnt, XIII (Autumn, 1953),437-48.
3Charles M. Garverick and Harold D. Carter, "Instructor Rat
ings and Expected Grades," California Journal of Educational Research,XIII (November, 1962), 218-21.
4Earl Hudelson, "The Validity of Student Rating of Instruc
tors," School and Society, LXXIII (April 28, 1951), 265-66.
5Drucker and Remmers, op. cit.
6George D. Lovell and Charles F. Haner, "ForcedChoice Applied
to College Faculty Rating," Educational and Psychological Measurement,XV (Autumn, 1955), 291-304.
7Norman Edward Freeberg, "Effect of Relevant Contact upon the
Validity and Reliability of Ratings," DUsszat-IALstiagLs, XVI,Part 1 (1956), 789.

51
accuracy of the rating, Bare1found through factor analysis that rat
ings increased in accuracy in proportion to the number of relevant
rater contacts.
Among other sources of bias which must be recognized as pos
sibly contributing to errors in ratings are factors such as the lik ?li
hood of projecting attitudes held by raters toward the instructor;2 the
readiness to recall a greater number of pleasant experiences than un
pleasant experiences;3 the influence of item style on responses ;4 the
tendency of raters to respond with what they believe to be the -ocially
desirable responses5or those that make a good impression.
6The effect
of the human element on the probability of an event's occurrence,7
and
the error of central tendency8 are also possible sources of bias.
1Roderick Hughes Bare, "Bias as Related to Rater Contacts,"Dissertation Abstracts, XX (1959-60), 2883-84.
2lorman M. Chansky, "The Attitudes Students Assign to TheirTeachers," The Journal of Educational Psychology, XLIX (1958), 13-16.
3W. A. Bousfield, "An Empirical Study of the Production of Af
fectively Toned Items," The Journal of General Psychology, XXX (secondhalf; April, 1944), 205-15.
4Lee J. Cronbach, "Response Sets and Test Validity," Educa
tional and Psychological Measurement, VI (1946), 475-94.
5Anne Anastasi, "Some Current Developments in the Measurement
and Interpretation of Test Validity," Proceedings of the 1963 Invitational Conference on Testing Problems (Princeton, New Jersey: Educational Testing Service, 1964), pp. 33-45.
6David R. Saunders, "Moderator Variables in Prediction," EducA
A/zAlADLLElycholoclical Measurement, XVI (Summer, 1956), 209-22.
7Louis D. Goodfellow, "The Human Element in Probability," The
Journal of General Psychology, XXIII (first half; July, 1940), 201-205.
8Guilford, op. cit., p. 278.

52
While the use of student rating scales is subject to the criti
cisms directed against other rating scale uses, when the situation
calls for a description of instructor attributes as reported by stu
dents, many of the criticisms no longer apply.
6. The Osgood Semantic Differential
Most scales used for instructor ratings by students list ob
vious behaviors. In consequence, students gain immediate insight into
the structural design of the instrument, introducing the possibility
of "halo effect." The use of a rating scale possessing less obvious
trait descriptions may help to overcome a concomitant variable of bias
which distorts the correlation between the traits.
The Semantic Differential, devised by Osgood,1is an example
of a rating scale with items which might be effective in reducing the
correlation between traits. Since the scale is composed of common,
bipolar adjectives with clear and precise meanings, the results should
be more satisfactory than would a scale which worded obviousness by
ambiguous and subjective items.
Describing it as a scale that has undergone exacting experi
mentation and as being widely adaptable to the measurement of an almost
infinite number of concepts, Remmers wrote that "its most obvious short-
coming for the naive rater is its apparent lack of 'face validity . "12
1
Charles E. Osgood, George J. Suci, and Percy H. Tannenbaum,The Measurement of Meaning (Urbana, Illinois: University of IllinoisPress, 1957).
2H. H. Remmers, "Rating Methods in Research on Teaching," BAIAbook of Research on Teaching, ed. N. L. Gage, The American Educational
Research Association, National Education Association (Chicago: RandMcNally and Company, 1963), p. 362.

53
The Semantic Differential is basically a graphic scaling proce
dure, each scale consisting of seven units extended over a continuum
with bipolar adjectives at the termination of each scale. The task of
the subject is to differentiate a concept against the adjectives by in
dicating the direction and intensity of his differentiation on the
sevenunit scale. The overt behavior recorded on the instrument is
inferred as representing the cognitive behavior that takes place in
ternally.
Osgood conceived the idea of using opposite adjectives to de
scribe semantic judgments from the results of early research with
music, color, and mood interrelationships. He also made reference to
an anthropological study of five diverse cultures in which linguistic
similarities were compared and to an investigation of social stereotype
expressions in which judgments of concepts were found to reveal defi
nite clusters.
As a consequence of early investigations with the Semantic
Differential, Osgood concluded that three factors were dominant in the
judgment process. Generally, the evaluative factor accounted for about
50 to 75 per cent of the variance extracted, while the potency and ac
tivity factors each accounted for about 50 per cent of the variance
associated with the first factor.
The authors pointed out that no standardized form of the Seman
tic Differential exists, but, rather, the instrument is a technique
which can be generalized to a wide variety of situations, Vie modifica
tions being dependent upon the problem under consideration. The con
cepts, which can be selected as stimuli to which the subject responds
by marking the continuum separating the bipolar adjectives, are almost

54
limitless. Criteria recommended for the selection of concepts include
the use of concepts which are likely to yield a variety of different
responses, to carry only one specific meaning to the subject, and to
be familiar to the subjects. The selection of scales calls for greater
precision than that of concepts. Selection of about three scales for
each factor representing maximum loading on one factor and minimum
loading on other factors plus the selection of scales which are rele
vant to the concepts being judged are recommended. If the problem is
an attempt to disguise the purpose of the investigation, scales giving
the appearance of being unrelated are appropriate.
When the Semantic Differential is evaluated against criteria of
measuring devices, the instrument is found to possess many of the ac
ceptable standards. The collection of results is absolutely objective.
The precision of the procedure leads to replication. The interpreta
tion of extracted factors is a subjective process, but this is not a
criticism of the instrument.
The basic measure of the Semantic Differential is the numeri
cal value of the check which the subject has placed opposite each set
of adjectives as he has judged the concept against the scale. Average
errors of measurement are less than one scale unit, a satisfactory cri
terion of reliability. Results have demonstrated that reliability of
the measures decreased as the time lapse between test and retest is
increased.
A number of assumptions related to the scales are held when
the Semantic Differential is used as a measuring instrument. The char
acteristic of equal intervals is assumed in the assignment of a numeri
cal score to each position on the scale. The falling of the zero point
55
at the center of each scale, or the neutral position, is assumed when
the measures are factor analyzed.
A study which used the Semantic Differential includes the in
vestigation by Westley and Jacobson.1 Twelve concepts related to a
ninthgrade experimental mathematics class and adjectives representing
each of three factors were judged by two groups, one of which had been
taught the course by television instruction and the other had not.
The findings demonstrated that the group taught by television rated
its instructor more favorably than the other group.
Evans, Smith, and Colville2 reported giving the Semantic Dif
ferential to a university faculty group. Generally, this group rated
itself more favorably than students who rated the instructors.
1Bruce H. Westley and Harvey K. Jacobson, "Instructional Tele
vision and Student Attitudes Toward Teacher, Course, and Medium," AVCommunication Review, XI (1963), 47-60.
2Richard I. Evans, Ronald G. Smith, and William K. Colville,The University Faculty and Educational Television: Hostility. Resistance. and Charm*. Supported by a Grant from the U. S. Department ofHealth, Education, and Welfare, Office of Education (Houston, Texas:University of Houston, 1962), pp. 1-104.

II. STATEMENT OF PROBLEM AND HYPOTHESIS
A. Statement of Problem
This study was designed to provide evidence which would serve
two functions: (1) the possible contribution to a theory of college
and university teaching behavior by an improved description of teach
ing, and (2) the provision of inferences for the improvement of
teaching behavior.
Many research workers concerned with measuring and describing
teaching behavior have employed the device of student ratings. While
this device has been established as both reliable and valid, some of
the experiments have led to unsatisfactory results because the terms
used to identify the behavior were ambiguous and inherently subjective.
The present study attempted to overcome this specific deficiency
through the use of a rating scale composed of common, bipolar adjec
tives whose meanings were clear and precise.
For purposes of this study, the rating scale was defined as a
measure of student attitudes toward instructors as defined by the traits
comprising the scale. Regarded in this way, the rating scale is not a
direct measure of teaching effectiveness, but an objective measure of
the students' perceptions of the instructors' traits. The purpose of
the rating scale can be thought of as the drawing of a picture by the
student for the benefit of the instructor.
An attitude was defined in this study as the written response
of the student to the instructorstimulus described by the traits ap
pearing on the rating scale.
56

57
A trait, in the present study, referred to the behaviors de
scribed by the adjectives selected for inclusion in the rating scale.
Such adjectives, assumed to be pertinent in the evaluation of instruc
tion, were indirect inferences of instructional behaviors and repre
sented the students' judgment of the degree to which the teachers pos
sessed the specific trait under consideration.
Validity was defined as a measure of the student descriptions
of instructor behavior. Whether or not student descriptions were an
accurate measure of the true effectiveness of the Instructor was un
known and was not a variable being meavJred. The problem was con
cerned with a description of instructor behaviors because of the sig
nificance of these behaviors to the learning process.
Reliability was defined as identical with validity since the
question was only whether student ratings were valid descriptions of
instructor behaviors.
B. Hypothesis
The specific hypothesis tested was that college instructor
behavior could be identified and measured by the use of a graphic
rating scale when the rater responded to common bipolar adjectives.
The behaviors would yield, when subjected to factor analysis, clus
ters of traits which identified subgroups of college instructors.
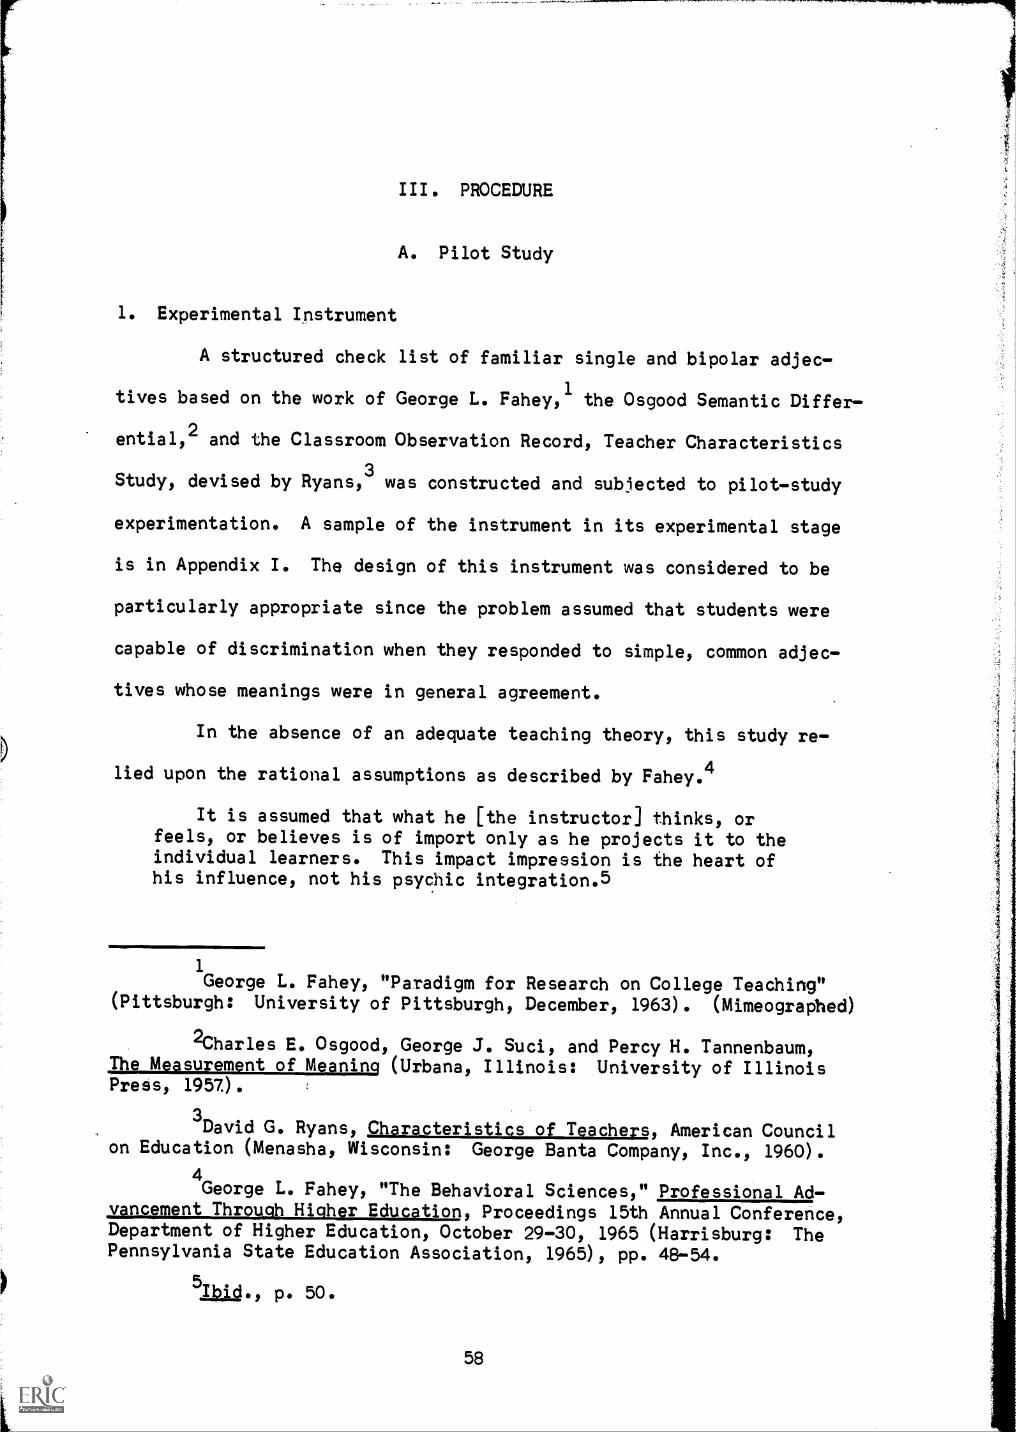
III. PROCEDURE
A. Pilot Study
1. Experimental Instrument
A structured check list of familiar single and bipolar adjec-
tives based on the work of George L. Fahey,1the Osgood Semantic Differ-
ential,2
and the Classroom Observation Record, Teacher Characteristics
Study, devised by Ryans,3was constructed and subjected to pilot-study
experimentation. A sample of the instrument in its experimental stage
is in Appendix I. The design of this instrument was considered to be
particularly appropriate since the problem assumed that students were
capable of discrimination when they responded to simple, common adjec-
tives whose meanings were in general agreement.
In the absence of an adequate teaching theory, this study re-
lied upon the rational assumptions as described by Fahey.4
It is assumed that what he [the instructor] thinks, orfeels, or believes is of import only as he projects it to theindividual learners. This impact impression is the heart ofhis influence, not his psychic integration.5
1
George L. Fahey, "Paradigm for Research on College Teaching"(Pittsburgh: University of Pittsburgh, December, 1963). (Mimeographed)
2Charles E. Osgood, George J. Suci, and Percy H. Tannenbaum,The Measurement of Meaning (Urbana, Illinois: University of IllinoisPress, 1957).
3David G. Ryans, Characteristics of Teachers, American Council
on Education (Menasha, Wisconsin: George Banta Company, Inc., 1960).
4George L. Fahey, "The Behavioral Sciences," Professional Ad-
vancement Through Higher Education, Proceedings 15th Annual Conference,Department of Higher Education, October 29-30, 1965 (Harrisburg: ThePennsylvania State Education Association, 1965), pp. 48-54.
5.1bid., P. 50.
58

59
Fahey identified eight approaches describing the instructor's
behavior. These eight approaches were: (a) approach to life; (b)
approach to self; (c) approach to work; (d) ,I!'proach to authority;
(e) approach to ideas; (f) approach to communication; (g) approach to
students; and (h) approach to methodology.
In order to keep the data to a manageable size during the
pilotstudy stage, only four of the eight approaches were included in
the experimental instrument. The four approaches, arbitrarily selected,
were: (a) approach to authority; (b) approach to ideas; (c) approach
to communication; and (d) approach to students. The instrument thus
consisted essentially of two parts: on the first four pages, each
identified by one of the four approaches, were listings of the fifty
selected bipolar adjectives; on the last four pages, each similarly
identified by one of the four approaches, were listings of the forty
selected single adjectives.
The eightpage instrument, with an instruction sheet attached,
was administered to one university graduate class consisting of twenty
four students, one university undergraduate class consisting of
eighteen students, and one junior college class consisting of twenty
nine students during the final weeks of the 1964 spring session. The
instrument was again administered to a university graduate class con
sisting of twenty students and a junior college class consisting of
twentyfive students during the final weeks of the 1964 fall session.
The total number of subjects in the pilotstudy rating sample was 116.
The teachers who were rated anonymously by the pilotstudy
sample were a professor and two instructors. The professor and one

60
instructor were rated on two different occasions while the second in
structor was rated on one occasion.
Ratings of the three instructors were punched on IBM cards and
submitted for analysis to the University of Pittsburgh Computation Cen
ter. Two objectives were primary:
(a) A frequency count of the number of times each set of bi
polar adjectives and each single adjective was checked as
being relevant to evaluating instructor behaviors. Ref
erence to a frequency count was felt to be necessary be
cause this information would aid in shortening the rating
scale. Those adjectives which were chosen least fre
quently were omitted from the revised form.
(b) A measure of intercorrelation among the adjectives to de
termine whether any patterns of relationship were dis
cernible.
The number of times each set of the fifty bipolar adjectives
was selected as being relevant to the approach being evaluated, plus
the mean and standard deviation, is shown in Table 1.
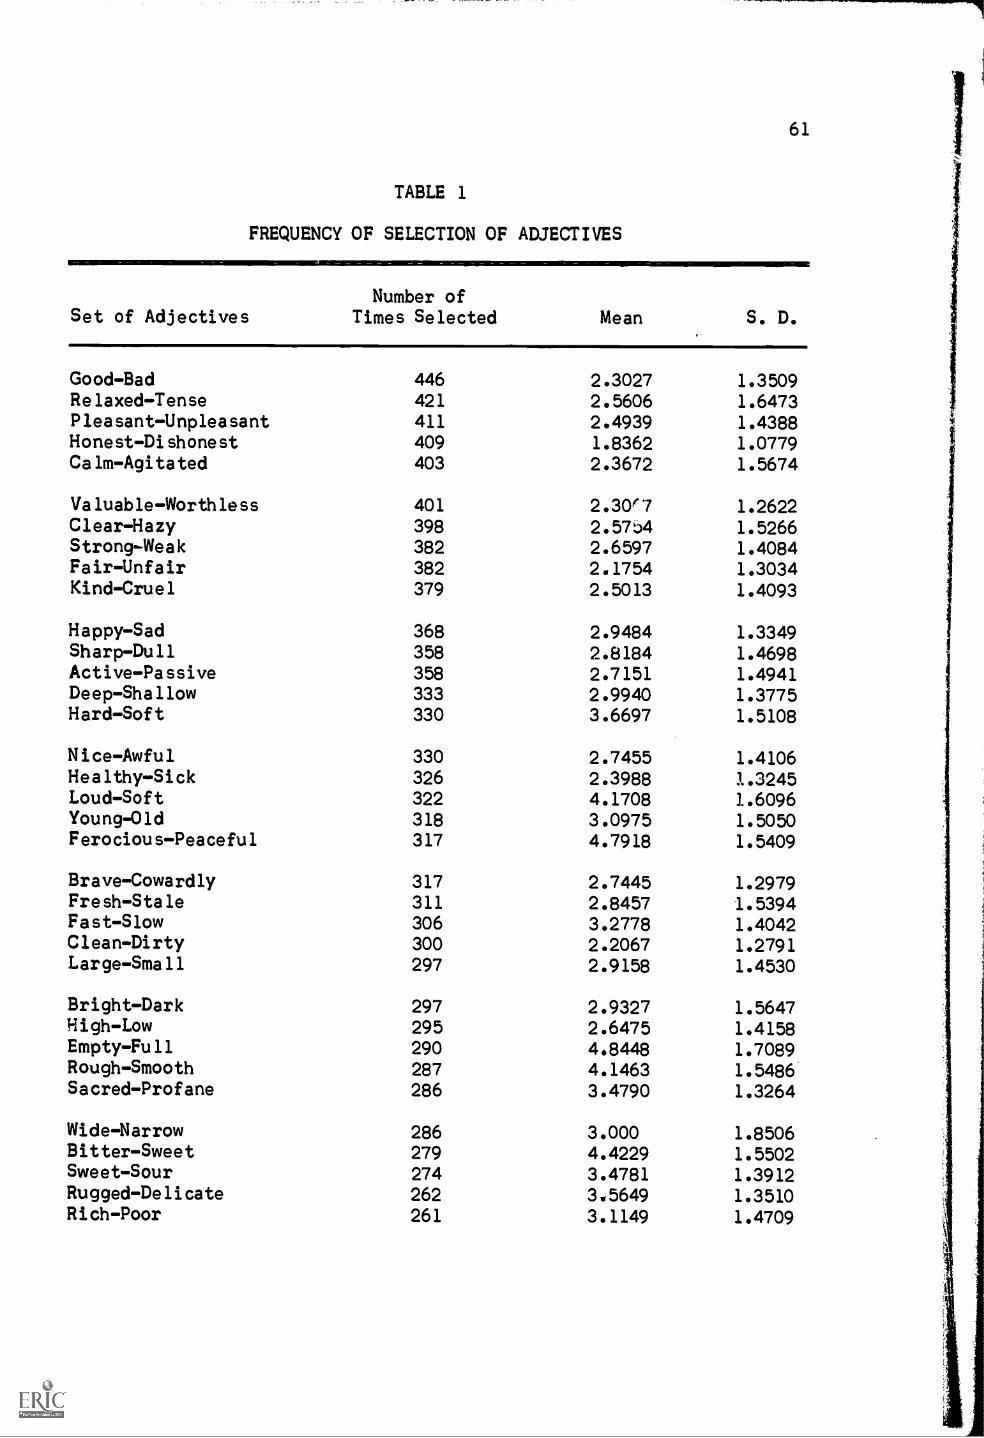
61
TABLE 1
FREQUENCY OF SELECTION OF ADJECTIVES
Set of AdjectivesNumber of
Times Selected Mean S. D.
Good-Bad 446 2.3027 1.3509Relaxed-Tense 421 2.5606 1.6473Pleasant-Unpleasant 411 2.4939 1.4388Honest-Dishonest 409 1.8362 1.0779Calm-Agitated 403 2.3672 1.5674
Valuable-Worthless 401 2.30(7 1.2622Clear-Hazy 398 2.57b4 1.5266Strong-Weak 382 2.6597 1.4084Fair-Unfair 382 2.1754 1.3034Kind-Cruel 379 2.5013 1.4093
Happy-Sad 368 2.9484 1.3349Sharp-Dull 358 2.8184 1.4698Active-Passive 358 2.7151 1.4941Deep-Shallow 333 2.9940 1.3775Hard-Soft 330 3.6697 1.5108
Nice-Awful 330 2.7455 1.4106Healthy-Sick 326 2.3988 1.3245Loud-Soft 322 4.1708 1.6096You 318 3.0975 1.5050Ferocious-Peaceful 317 4.7918 1.5409
Brave-Cowardly 317 2.7445 1.2979Fresh-Stale 311 2.8457 1.5394Fast-Slow 306 3.2778 1.4042Clean-Dirty 300 2.2067 1.2791Large-Small 297 2.9158 1.4530
Bright-Dark 297 2.9327 1.5647High-Low 295 2.6475 1.4158Empty-Full 290 4.8448 1.7089Rough-Smooth 287 4.1463 1.5486Sacred-Profane 286 3.4790 1.3264
Wide-Narrow 286 3.000 1.8506Bitter-Sweet 279 4.4229 1.5502Sweet-Sour 274 3.4781 1.3912Rugged-Delicate 262 3.5649 1.3510Rich-Poor 261 3.1149 1.4709

62
TABLE 1--Continued
Number ofSet of Adjectives Times Selected Mean S. D.
TastyDistasteful 260 3.0385 1.3321HeavyLight 259 4.1931 1.4552BeautifulUgly 255 3.4824 1.1900HotCold 243 3.8519 1.4384NearFar 229 3.4716 1.4795
AngularRounded 223 3.9910 1.5967ThickThin 221 3.9548 1.3777FragrantFoul 221 3.2081 1.2068LongShort 220 3.7545 1.4154WetDry 219 4.5616 1.4588
BassTreble 210 3.6143 1.5370BlackWhite 205 4.4244 1.6746PungentBland 199 3.8844 1.3896YellowBlue 198 3.8535 1.5227RedGreen 180 3.6889 1.4885
Further information considered to be of aid in shortening the
rating scale was a measure of correlation. Since the set of adjectives
"goodbad" was selected most frequently by the pilot sample as being
relevant to the evaluation of teaching behavior, this set was desig
nated tentatively as the criterion against which the remaining forty
nine sets of adjectives were correlated. Based on 456 cases, the cor
relations with the criterion (goodbad) are shown in Table II.

TABLE
CORRELATIONS WITH CRITERION"GOOD-BAD"
2
SET OF ADJECTIVES
63
Set of Adjectives Correlation Set of Adjectives Correlation
..1==
Large-Small .584 Sacred-Profane .050Beauti fu 1 -Ugly .549 Relaxed-Tense .403Yellow-Blue .108 Brave-Cowardly .359Hard-Soft -.031 Long-Short .244Sweet-Sour .171 Rich-Poor .527
Strong-Weak .553 Clear-Hazy .510Clean-Dirty .256 Hot-Cold .260High-Low .538 Thick-Thin .043Calm-Agitated .369 Nice-Awful .416Tasty-Distasteful .467 Bright-Dark .483
Valuable-Worthless .600 Bass-Treble .178Red-Green .215 Angular-Rounded -.042Young-Old .323 Fragrant-Foul .224Kind-Cruel 396 Honest-Dishonest .427Loud-Soft .087 Active-Passive .431
Deep-Shallow .537 Rough-Smooth -.153Pleasant-Unpleasant .422 Fresh-Stale .418Black-White -.103 Fast-Slow .288Bitter-Sweet -.138 Fair-Unfair .374Happy-Sad .303 Rugged-Delicate .186
Sharp-Dull .478 Near-Far .220Empty-Full -.375 Pungent-Bland .193Ferociou s- Peaceful -.112 Healthy-Sick .469Heavy-Light -.007 Wide-Narrow .377Wet-Dry .195
An analysis of these correlations with the criterion set of
adjectives revealed that the highest relationships were among adjec-
tives suggestive of general characteristics of the instructor. Since
the students had been requested to check those adjectives which they
felt to be most relevant to the rating, the evidence appeared to indi-
cate that students frequently associated general characteristics with

64
instructor evaluation. This particular pattern of relationships can
probably be explained by reference to a stereotyped image of the in
structor whereby the individual is judged a3 "good" or "bad" on the
basis of the impact of first impressions. The strong agreement
among the raters on adjectives connoting general characteristics-led
to the inference that these characteristics were more readily discern
ible to the students and carried greater weight in their judgment than
specific instructor characteristics.
The forty single adjectives were taken from Fahey's "Paradigm
for Research on College Teaching."1 He used them as illustrative of
behaviors under each of his "approaches." Het has explained that some
were adopted from Solomon, Bezdek, and Rosenberg3 and others were de
veloped rationally for use in the study of relations of personality
traits to teaching effectiveness.
A study of the single adjectives appearing in the rating scale
revealed extensive variation in the number of times the adjective was
not chosen as being pertinent to the rating task. The number of times
each adjective was not checked as being pertinent is shown in Table 3.
The early intention was to list these single adjectives as
sets of bipolar opposites so that the design of this section of the
scale would be similar to that of the first section of the scale.
1Fahey, op. cit.
2George L. Fahey, Professor, Psychology and Education, Univer
sity of Pittsburgh, private communication.
3Daniel Solomon, William E. Bezdek, and Larry Rosenberg, Teach
ing Styles and Learning (Chicago: Center for the Study of Liberal Education for Adults, 1963).
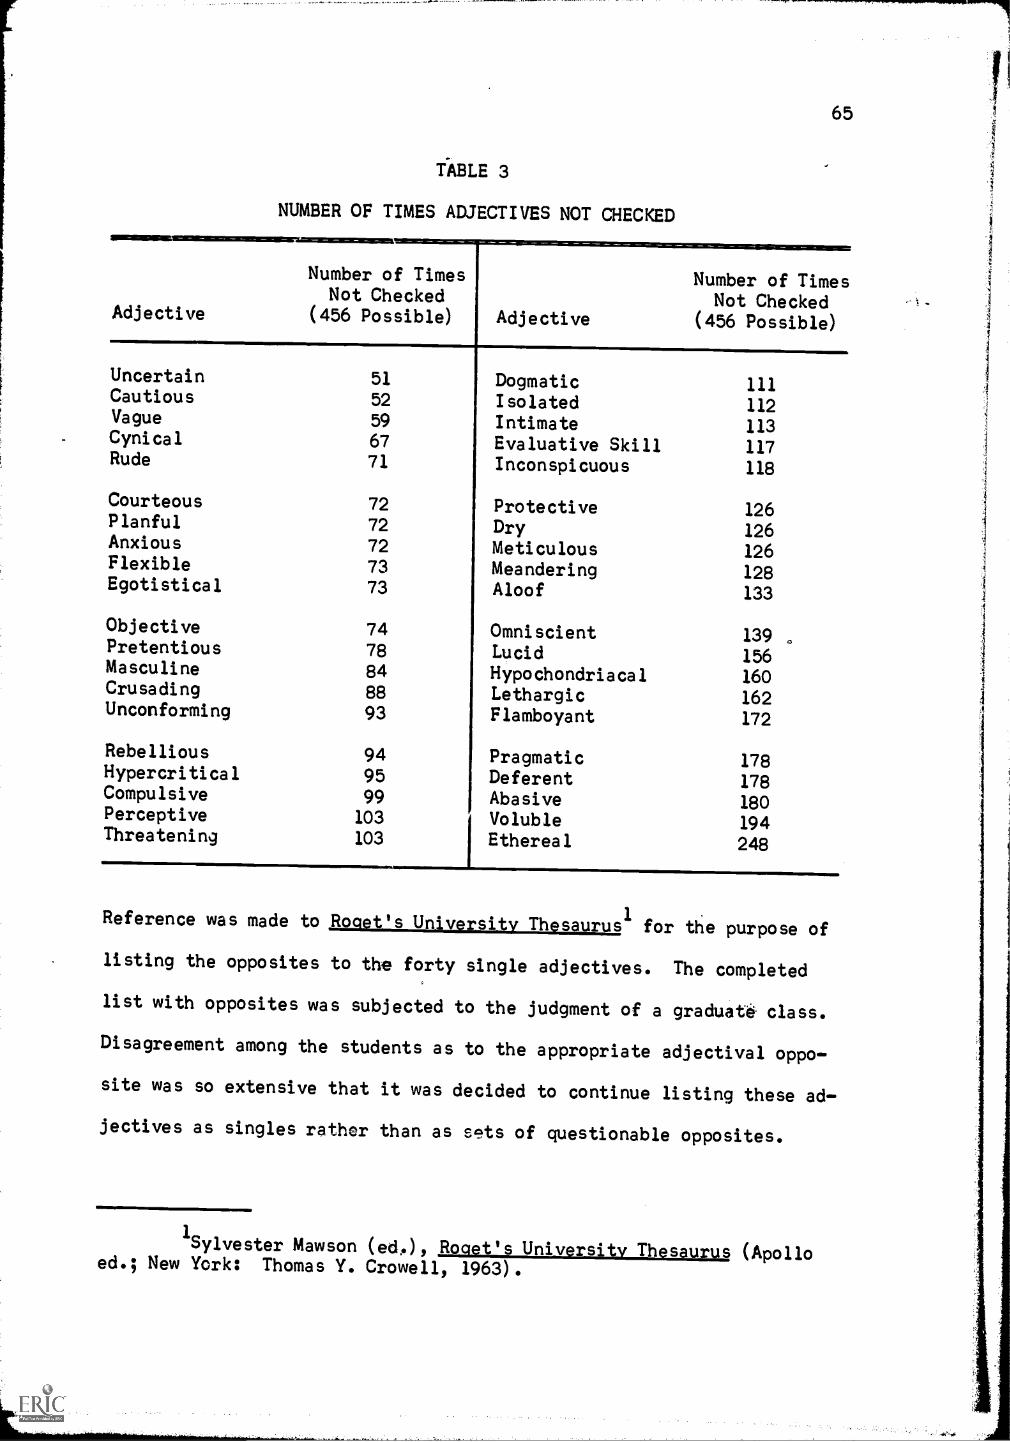
65
NUMBER OF TIMES ADJECTIVES NOT CHECKED
TABLE 3
Adjective
Number of TimesNot Checked
(456 Possible) Adjective
Number of TimesNot Checked
(456 Possible)
Uncertain 51 Dogmatic 111Cautious 52 Isolated 112Vague 59 Intimate 113Cynical 67 Evaluative Skill 117Rude 71 Inconspicuous 118
Courteous 72 Protective 126Planful 72 Dry 126Anxious 72 Meticulous 126Flexible 73 Meandering 128Egotistical 73 Aloof 133
Objective 74 Omniscient 139 ,3
Pretentious 78 Lucid 156Masculine 84 Hypochondriacal 160Crusading 88 Lethargic 162Unconforming 93 Flamboyant 172
Rebellious 94 Pragmatic 178Hypercritical 95 Deferent 178Compulsive 99 Abasive 180Perceptive 103 Voluble 194Threatening 103 Ethereal 248
Reference was made to Rociet's University Thesaurus1for the purpose of
listing the opposites to the forty single adjectives. The completed
list with opposites was subjected to the judgment of a graduate class.
Disagreement among the students as to the appropriate adjectival oppo
site was so extensive that it was decided to continue listing these ad
jectives as singles rather than as sets of questionable opposites.
1Sylvester Mawson Rociet's University Thesaurus (Apollo
ed.; New York: Thomas Y. Crowell, 1963).
66
To test the hypothesis that fewer dimensions were being meas-
ured, the ratings from the bipolar sets of adjectives were factor ana-
lyzed using the principal axes method. Rotation was done using Kaiser's
varimax procedure. Three factors were retained for inspection. The
rotated factor loading matrix which appeared is shown in Table 4 on the
following page.
To facilitate the interpretation of common factors, the matrix
data were organized according to adjectives represented in each of the
three separate factors. The data which results are shown in Table 5,
page 69.
Examination of the bipolar adjectives having the most substan-
tial loading in Factor I led to the tentative interpretation that this
factor represented the general characteristics of the instructor as
judged by the student. A listing of some of the adjectives having high
loadings in Factor I included "large-small," "beautiful-ugly," "strong-
weak," "active-passive," "fast-slow," and "healthy-sick." These were
clearly identified as general descriptions.
Factor II was evidently a value judgment related to moral quali-
ties and personal traits of the instructor as perceived by the student.
High loadings in adjectives "ferocious-peaceful," "rough-smooth,"
"loud-soft," "sweet-sour," "sacred-profane," and "clean-dirty," were
interpreted as representing meanings common to this factor. The ap-
pearance of "large-small," "strong-weak," "active-passive," and
"healthy-sick" with almost negligible loadings on this factor was ra-
tionalized further as evidence that Factor II had common features not
shared by Factor I.

TABLE 4
ROTATED FACTOR LOADING MATRIX
67
Variables Factor I Factor II Factor III
1. Good-Bad .9931 -.1093 .04232. Large-Small .9451 -.1833 -.27043. Beautiful-Ugly .7771 -.5509 -.30424. Yellow-Blue .4301 -.9016 -.04515. Hard-Soft .2110 .7735 .5977
6. Sweet-Sour .3213 -.9233 -.21027. Strong-Weak .9594 .1531 .23678. Clean-Dirty .6067 -.6759 .41849. High-Low .9710 -.2122 .110210. Calm-Agitated .5652 -.8161 -.1203
11. Tasty-Distasteful .8768 -.3888 ....282812. Valuable-Worthless .9856 -.1533 -.070813. Red-Green .7030 .6779 -.215114. Young-01d .6545 -.7153 -.245015. Kind-Cruel .4955 -.7988 -.3412
16. Loud-Soft .3300 .9436 -.028117. Deep-Shallow .9603 -00914 -.263418. Pleasant-Unpleasant .6061 -.7087 -.361019. Black-White -.1146 .7858 -.607820. Bitter-Sweet -.2725 .9061 .3235
21. Happy-Sad .5905 -.6959 -.408722. Sharp-Dull .9733 .0890 .211623. Empty-Full -.9473 .2257 .227424. Ferocious-Peaceful -.1463 .9892 -.004825. Heavy-Light .0533 .8365 -.5454
26. Wet-Dry .4136. -.0137 -.910427. Sacred-Profane .1442 -.8796 .453328. Relaxed-Tense .7991 -.5141 -.311629. Brave-Cowardly .9978 -.0108 -.064930. Long-Short .7912 .1749 -.5860
31. Rich-Poor .9253 -.3055 -.224532. Clear-Hazy .9991 .0390 .017433. Hot-Cold .4480 -.5567 -.699534. Thick-Thin .2344 -.4578 -.857635. Nice-Awful .5737 -07773 -.2584

TABLE 4--Continued
68
Variables Factor I Factor II Factor III
36. Bright-Dark .7650 -.5852 -.268937. Bass-Treble .4793 .2201 -.849638. Angular-Rounded .1750 .9719 .157139. Fragrant-Foul .6098 -.7924 -.012940. Honest-Dishonest .8322 -.5355 .1439
41. Active-Passive .9823 -.0087 -.187042. Rough-Smooth -.1146 .9851 .128443. Fresh-Stale .8818 -.4125 -.228744. Fast-Slow .8397 .4624 .284945. Fair-Unfair .7083 -.6632 -.2419
46. Rugged-Delicate .5828 .7522 -.307547. Near-Far .4774 -.4831 -.733948. Pungent-Bland .7533 .4683 -.461949. Healthy-Sick .9173 -.2814 -.281750. Wide-Narrow .6739 -.4055 -.6176
Per Cent of Common Variance 48.3465 36.4865 15.1670
Communality 100.0000
Factor III was interpreted as a sensorially oriented perception
of the instructor. The highest loading on "wet-dry" suggested that
Factor III involved the sensation of touch as, at a moderately high
loading, did "hot-cold." The loadings of the pairs, "black-white,"
"thick-thin," "near-far," "wide-narrow" (vision), and "bass-treble"
(auditory) on this factor suggested that sensory inferences combined
to measure student judgments.

=7
TABLE 5
ADJECTIVES REPRESENTED IN FACTORS
Factor I
Factor II
Factor III
Adjectives Showing
Highest Loadings
Loading
Adjectives Showing
Highest Loadings
Loading
Adjectives Showing
Highest Loadings
Loading
Good-Bad
.9931
Yellow-Blue
-.9016
Black-White
-.6078
Large-Small
.9451
Hard-Soft
.7735
Wet-Dry
-.9104
Beautiful-Ugly
.7771
Sweet-Sour
-.9233
Hot-Cold
-.6995
Strong-Weak
.9594
Clean-Dirty
-.6759
Thick-Thin
-.8576
High-Low
.9710
Calm-Agitated
-.8161
Bass-Treble
-.8496
Tasty-Distasteful
.8768
Red-Green
.6779
Near-Far
-.7339
Valuable-Worthless
.9856
Young-01d
-.7153
Wide-Narrow
-.6176
Red-Green
.7030
Kind-Cruel
-.7988
Deep-Shallow
.9603
Loud-Soft
.9436
Sharp-Dull
.9733
Pleasant-Unpleasant
-.7087
Empty-Full
-.9473
Black-White
.7858
Relaxed-Tense
.7991
Bitter-Sweet
.9061
Brave-Cowardly
.9978
Happy-Sad
-.6959
.long -Short
.7912
Ferocious-Peaceful
.9892
Rich-Poor
.9253
Heavy-Light
.8365
Clear-Hazy
.9991
Sacred-Profane
-.8796
Bright-Dark
.7650
Nice-Awful
-.7773
Honest-Dishonest
.8322
Angu lar- Rounded
.9719
Active-Passive
.9823
Fragrant-Foul
-.7924
Fresh-Stale
.8818
Rough-Smooth
.9851
Fast-Slow
.8397
Fair-Unfair
-.6632
Fair-Unfair
.7083
Rugged-Delicate
.7522
Pungent-Bland
.7533
Healthy-Sick
.9173

70
To test the assumption which held that instructor behaviors
could be categorized by the four approaches arbitrarily selected from
the eight approaches identified, the pilotstudy data were subjected to
a correlation study and factor analysis of the four approaches. The
results indicated that one factor was highly represented on all pages
of the instrument. A plotting of the factors demonstrated that one
factor was contributing the greatest share of the variance and that
the variance contributed by the other three factors was very similar.
Additional evidence for the presence of one approach rather than four
was found by reference to the eigenvalues. Three of the factors were
represented by eigenvalues of less than unity while Factor I had an
eigenvalue of 2.80. Based on these results, the decision was made to
use only one approach on the revised instrument and label it "Approach
to Teaching."1
2. Final Instrument
The decision was made to include in the final instrument the
three factors which had been extracted as suggested by Osgood. 2 In
order to keep the final instrument to a convenient length, the four
sets of bipolar adjectives having the highest loading in their respec
tive factors were selected. The adjectives and factor loadings se
lected as representing Factor I were clearhazy, .9991; brave
cowardly, .9978; goodbad, .9931; and valuableworthless, .9856. The
adjectives representing Factor II were ferociouspeaceful, .9892;
roughsmooth, .9851; angularrounded, .9719; and loudsoft, .9436.
1Glenn E. Roudabush, Assistant Professor, Computer Science andPsychology, University of Pittsburgh, personal communication.
2Osgood, op. cit.

71
Representing Factor III were wetdry, .9104; thickthin, .8576; bass
treble, .8496; and nearfar, .7339. The final instrument thus con
sisted of twelve sets of bipolar adjectives which comprised Part I of
the rating scale. The appearance order of the adjectives was com
pletely randomized.
The format of the scale was modified slightly so as to make
the task easier for the respondents. Rather than request students to
indicate their choice by inserting the choice in a separate column at
the extreme right of the page, the modified instructions were to en
circle the number which represented the desired choice.
Since Part II of the instrument had not been factor analyzed,
reliance had to be placed in the data which gave evidence as to the
number of times each single adjective had not been checked as being
pertinent to the evaluation task. By simple subtraction of the number
of times the adjective had not been checked from the total number of
cases (456), the list of adjectives checked most frequently was de
rived. The adjectives occurring most frequently were "uncertain,"
"cautious," "vague," "cynical," "rude," "courteous," "planful,"
"anxious," "flexible," "egotistical," "objective," "pretentious,"
"masculine," "crusading," "unconforming," and "rebellious."
Assuming normal distribution of the sample of judgments, test
ing the null hypothesis demonstrated that nothing but chance factors
were operating in the selection by the students of these sixteen ad
jectives. Using the formula /Npq, z scores demonstrated that all
choices were significant beyond the .01 level.1
1J. P. Guilford, Fundamental Statistics in Ps cholo and Education (3d ed.; New York: McGrawHill Book Company, Inc., 1956 , pp.211-13.

72
The adjectives "uncertain," "courteous," "masculine," and
"crusading," were omitted from the final list because the meaning was
similar to a second selected adjective, or because the meaning was the
opposite of a second selected adjective, or because the meaning was
held to be too ambiguous for the evaluating task.
Upon suggestion of Grace French Lazovik, 1the adjective "stimu
lating" was included in the final list. The rationale was that the
characteristic corresponded highly with student overall judgment as
found in previous studies.
Part II of the revised instrument thus consisted of thirteen
single adjectives. The appearance order of the adjectives was com
pletely randomized.
Part III of the revised instrument was developed as a criterion
measure against which the results of Part I would be correlated since
it was assumed that a practical criterion of global judgment would fa
cilitate interpretation and add to the utility of the results. A copy
of the revised instrument appears in Appendix II.
B. Current Study
During the beginning weeks of the fall trimester, 1965-1966,
the project was explained to members of the Liberal Arts undergraduate
faculty of the University of Pittsburgh by means of a personal visit to
the chairman or his designate in each of the departments. If a verbal
agreement to participate in the project was reached, the names of all
1Grace French Lazovik, Associate Professor, Psychology andEducation, Director of University Testing Service, University ofPittsburgh, personal communication.

73
faculty, regardless of academic rank, who were teaching undergraduate
Liberal Arts classes at the University of Pittsburgh during the tri
mester were obtained from the departmental secretary.
In order that the results could be kept confidential to the in
structor who was being rated, the project was explained also to the
Dean of the School of Liberal Arts, the Dean of the Division of Humani
ties, the Dean of the Division of Natural Science, and the Dean of the
Division of Social Science, University of Pittsburgh. Each of these
Deans signed a mimeographed letter approving the conditions of the
project but detaching himself from any knowledge of individual ratings.
The detailed letter, with the signatures of the Deans, which was sent
to each faculty member inviting him to participate in the project is
reproduced in Appendix III. Attached to the letter was a card request
ing biographical data which the instructor was invited to complete and
return to the project office. A total of 438 letters was mailed to
the Liberal Arts undergraduate instructors.
Restrictive factors, such as taking sabbatical leave, teaching
only graduate students, teaching only one of the two trimesters, and
teaching nonrepetitive courses during the two trimesters, eliminated
some instructors from the project. A total of 112 instructors, repre
senting 25.57 per cent of the population contacted, participated in
the evaluation. An analysis by Division of instructors participating
is presented in Table 6.
A total of 117 classes of liberal arts students evaluated the
112 instructors. An analysis of classes participating in thr evalua
tion arranged by Division is presented in Table 7.
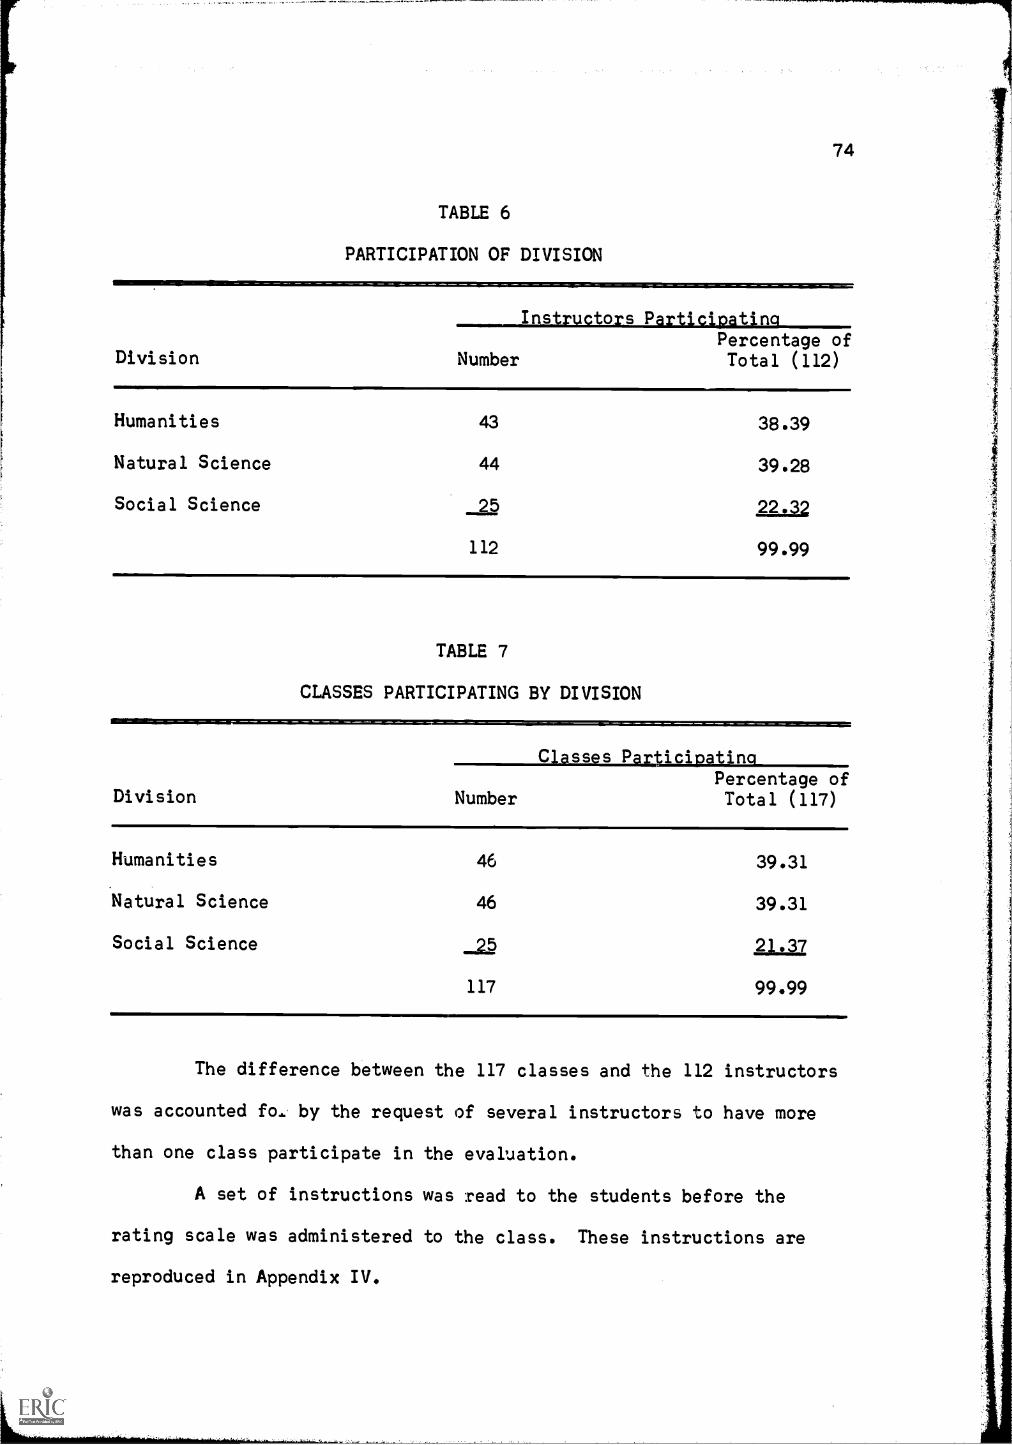
74
TABLE 6
PARTICIPATION OF DIVISION
Division
Instructors ParticipatingPercentage of
Number Total (112)
Humanities
Natural Science
Social Science
43
44
25
112
38.39
39.28
22.32
99.99
TABLE 7
CLASSES PARTICIPATING BY DIVISION
Division Number
Classes ParticioatinaPercentage ofTotal (117)
Humanities
Natural Science
Social Science
46
46
117
39.31
39.31
21.37
99.99
The difference between the 117 classes and the 112 instructors
was accounted fo.. by the request of several instructors to have more
than one class participate in the evaluation.
A set of instructions was read to the students before the
rating scale was administered to the class. These instructions are
reproduced in Appendix IV.

75
An attempt was made to have the instructor absent from the room
during the evaluation process since his presence or absence was consid
ered to be a factor influencing the ratings. Twentyfive instructors
were present during the administration of the scale over the two tri
mesters.
The rating scale was administered to a total of 4,916 undergrad
uate liberal arts students during the fall trimester, 1965-1966. An
analysis of students who completed the rating scale arranged by Division
is shown in Table 8.
TABLE 8
UNDERGRADUATE STUDENTS COMPLETING RATING SCALE
Division
Students Participating
NumberPercentage ofTotal (4,916)
Humanities 1,634 33.24
Natural Science 2,477 50.39
Social Science 805 16.37
4,916 100.00
A total of 192 graduate students completed the rating scale but
this group was not included in the analysis since the project was con
cerned with undergraduate ratings.
Results of the ratings were mailed by confidential letter to
each of the participating instructors at the opening of the winter tri
mester, 1965-1966. This time was chosen because final grades for the
fall trimester were due in the Office of Student Records before the
close of the fall trimester, 1965-1966. Release of the ratings after
the grades were recorded by the Office of Student Records would prevent

76
the instructor from altering the grades on the basis of ratings by
students.
An analysis of Part I of the rating scale composed of the
twelve bipolar adjectives was delayed until the following trimester
since these ratings were to be subjected to factor analysis.
Results of Part II of the rating scale composed of the thirteen
single adjectives were furnished to the instructor in the form of means
computed for the individual instructor, his Division, and the School of
Liberal Arts.
Detailed results of Part III of the rating scale were furnished
to each participating instructor by listing the number of undergraduate
and graduate students represented in the rating, the number of students
who ranked him according to the five traits listed, the behaviors of
the instructor listed as being most helpful to the students accompanied
by the number of times these behaviors were mentioned, and the improve-
ments mentioned by the students accompanied by the number of times
these improvements were mentioned.
The three-page letter which was sent to each instructor who
was rated during the fall trimester, 1965-1966, is shown in Appendix V.
A short note of acknowledgment was sent to each of the instruc-
tors who had indicated an inability to participate in the study. This
note is reproduced in Appendix VI.
At the beginning of the winter trimester, 1965-1966, a letter
asking instructors to participate a second time for purposes of scale
reliability was sent to the 112 instructors who had participated dur-
ing the fall trimester, 1965-1966. This letter is reproduced in
Appendix VII.

77
Restrictive factors, such as unexpected changes in teaching
schedules, teaching of nonrepetitive courses, and granting of faculty
leaves, eliminated some of the initial sample. A total of fiftynine
instructors representing 52.67 per cent of those contacted the second
trimester, 1965-1966, were able to participate a second time in the
evaluation project. An analysis of instructors participating during
the winter trimester, 1965-1966, is presented in Table 9.
TABLE 9
PARTICIPATION OF DIVISION
Division
Instructors Participating
NumberPercentage ofTotal (59)
Humanities 23 38.98
Natural Science 24 40.67
Social Science 12 20.34
59 99.99
A total of sixtytwo classes of liberal arts students eval
uated the fiftynine instructors who participated in the project a
second time. An analysis of classes who rated these instructors is
shown in Table 10.
The difference between the sixtytwo classes and the fiftynine
instructors was accounted for by the request of several instructors to
have more than one class participate in the evaluation process.

78
TABLE 10
CLASSES PARTICIPATING BY DIVISION
Division
Classes ParticipatingPercentage of
Number Total (62)
Humanities
Natural Science
Social Science
25
25
12
62
40.32
40.32
19.35
99.99
Administration of the rating scale replicated that of the fall
term. The rating scale was completed by 2,967 undergraduate liberal
arts students during the winter trimester, 1965-1966. An analysis of
raters arranged by Division is shown in Table 11.
TABLE 11
UNDERGRADUATE STUDENTS COMPLETING RATING SCALE
Division
Students ParticipatingPercentage of
Number Total (2,967)
Humanities 1,093 36.83
Natural Science 1,440 48.53
Social Science 434 14.63
2,967 99.99
A total of seventyfive graduate students completed the rating
scale but these ratings were not included in the analysis.

79
Results of the ratings were compiled and mailed to the partici
pating instructors in a manner similar to that of the fall term. The
covering letter accompanying the results was slightly different from
that sent initially and is reproduced in Appendix VIII. Notes of ac
knowledgment were sent to those instructors unable to participate.
An abstract of the project results was mailed to all instruc
tors who had been evaluated (Appendix IX).
The data were analyzed using a discriminant analysis and a fac
tor analysis.
C. Sample Characteristics
Characteristics of the entire sample of instructors who were
rated are shown in Table 12.
TABLE 12
INSTRUCTOR RANK AND YEARS OF TEACHING
InstructorsDivision
Humanities Natural Science Social Science
Academic Rank 2.55 1.96 2.04Standard Deviation 1.88 1.00 .91
Years of College and/orUniversity Teaching 2.68 2.84 2.24
Standard Deviation 1.51 1.15 1.12
Number of Instructors = 104.Academic Rank Code:
1. Professor2. Associate Professor3. Assistant Professor4. Instructor5. Guest Lecturer6. Graduate Assistant or Teaching Fellow

80
These data indicated that the average Humanities instructor
held the academic rank of Assistant Professor and had 2.68 years of
teaching experience at the college and/or university level. The aver
age Natural Science instructor held the academic rank of Associate
Professor and had 2.84 years of college and/or university experience.
The average Social Science instructor held the academic rank of Asso
ciate Professor and had 2.24 years of college and/or university expe
rience.
Characteristics of the entire sample of undergraduate students
who rated the instructors are listed in Table 13.
TABLE 13
STUDENT AGE AND YEAR
StudentsDivision
Humanities Natural Science Social Science
Age 19.55 19.44 20.00Standard Deviation 3.03 2.51 2.70Number of Raters 2080 3780 1200
Year in School 1.92 2.03 2.45Standard Deviation 1.10 1.09 1.13
Total Number of Raters = 7060.
Inspection of these data indicated that the average ages of all
students were between 19.44 and 20.00 years. Students who rated the
Social Science instructors were the oldest within this range, those who
rated the Humanities instructors were next oldest, and those who rated
Natural Science instructors were the youngest of the group.
Means representing the student year in school indicated that
the averages fell between the freshman and sophomore levels.

81
None of the means for either instructor or student populations
differed sufficiently from the others of its class to suggest that the
samples were not drawn from the same populations.
Academic rank of the participating instructors is shown in
Table 14.
TABLE 14
ACADEMIC RANK OF INSTRUCTORS
Academic Rank NumberPercentage of
Total Sample (104)
Professor 26 25Associate Professor 33 32Assistant Professor 20 19Instructor 11 10
Graduate Assistant orTeaching Fellow 14 13
Total 104 99
IV. FINDINGS
A. Discriminant Analysis
A discriminant analysis procedure was used to analyze the data
with a program written for the present study. The method requires that
group membership be predetermined and that the same kinds of measure
ments be available for all members of the groups. The criterion of ex
cellence for distinguishing between good and bad subjects is not used.
The procedure determines whether or not there are differences
in the measurements of the populations of which the obtained measure
ments represent samples. The measurements are plotted as points in a
dimensional space and the linear distances which separate the groups
determine the extent of the differences. If stable differences among
the group measurements are found, then the problem examines the linear
distances which separate the groups, the directions of the differences,
and the assignment of individuals to one of the groups.
The linear combination of variables which best discriminates
among the groups is the discriminatory function. It is computed as the
ratio of the amonggroups sumofsquares to the withingroup sumof
squares and is interpreted as a coefficient. A large coefficient indi
cates that the groups are divergent while the individuals in the group
are relatively homogeneous. A small coefficient indicates that both
groups and individuals are homogeneous.
The number of discriminant functions computed is one less than
the number of groups. The line of closest fit to the means, repre
senting the maximum separation of the groups, is the first discriminant
function; the second line of closest fit, orthogonal to the first, is
82
83
the second discriminant function, and so on. To test the significance
of a discriminant function, one may "select a subset of the computed
functions that accounts for a major portion of the discriminating power
of the test battery, say approximately 80 or 90 per cent of it."1
Additional information concerning the discriminant analysis
technique can be found in Kendall,2
Rulon,3 Tiedeman and Bryan,4 Martin
and Scott,5and Tatsuoka and Tiedeman.
6
In the present study, the discriminant analysis technique was
used to determine which adjectives or combinations of adjectives best
discriminated among the three divisions of instructors. Each instruc
tor was represented as a point in a 26dimensional space according to
the division in which he belonged. It was then determined if the sep
arate divisions occupied different regions of the space. If the points
identifying the division instructors did not occupy different regions
1
William W. Cooley and Paul R. Lohnes, Multivariate Proceduresfor the Behavioral Sciences (New York: John Wiley and Sons, Inc.,19ETTP7118.
2M. G. Kendall, A Course in Multivariate Anal sis (New York:Hafner Publishing Company, 1961
3Phillip J. Rulon, "Distinctions between Discriminant and Re
gression Analyses and a Geometric Interpretation of the DiscriminantFunction," Harvard Educational Review, XXI (JanuaryDecember, 1951),80-90.
4David V. Tiedeman and Joseph G. Bryan, "Prediction of College
Field of Concentration," Harvard Educational Review, XXIV (JanuaryDecember, 1954), 122-38.
5Ann Martin and Russell Scott, "Occupational Group Differences
in JobIncentive Dimensions Among Aciademic and Industrial Personnel,"Paper Presented at 1965 American Psychological Association Meeting,Chicago, Illinois. (Mimeographed.)
6Maurice M. Tatsuoka and David V. Tiedeman, "Discriminant
Analysis," Review of Educational Research, XXIV (December, 1954),402-20.

84
of the 26dimensional space, the variables did not isolate the instruc
tors. The pertinent question was: Did the Semantic Differential pro
vide information that would be useful in differentiating instructors by
division?
To test the hypothesis that there were no significant differ
ences among the three divisions on the 26 variables of the rating scale,
the discriminant analysis was carried out. The F test was computed.
With 52 and 14,064 degrees of freedom, the obtained F was .0062, indi
cating no significant differences among the means. The three groups
occupied the same area in the discriminant space. Therefore, the null
hypothesis was not rejected and the assumption accepted that the
samples representing the subject areas of Humanities, Natural Science,
and Social Science represented the same population, not three separate
populations.
Since there were three groups, the maximum number of discrimi
nate functions necessary to discriminate among the groups was two. A
comparison of the two discriminate functions indicated that the first
function accounted for approximately 56 per cent of the discriminating
power of the rating scale and the second function accounted for approxi
mately 44 per cent of the discriminating power.
On the basis of this analysis, it was concluded that this rat
ing scale did not discriminate among the three divisions of instructors.
B. Intervariable Correlations
Means, standard deviations, and number of students for each of
the variables, arranged by division, representing a total sample, are
presented in Table 15. Means, standard deviations, and number of

TABLE 15
MEANS, STANDARD DEVIATIONS, AND NUMBER OF RATERS FOR EACHRATED VARIABLE
BY DIVISION TOTAL SAMPLE
Variables
Humanities
Natural Science
_Social Science
Mean
Standard
Deviation
Number
of Raters
Mean
Standard
Deviation
Number
of Raters
Mean
Standard
Deviation
Number
of Raters
1. Peaceful-Ferocious
2.79
1.43
2073
2.73
1.37
3765
2.64
1.43
1196
2. Thick-Thin
4.14
1.20
2050
3.84
1.16
3718
3.85
1.25
1175
3. Clear-Hazy
2.42
1.54
2071
2.93
1.82
3756
3.20
1.79
1193
4. Good-Bad
2.18
1.41
2071
2.51
1.54
3767
2.53
1.48
1195
5. Loud-Soft
3.63
1.39
2074
3.65
1.42
3767
4.10
1.43
1194
6. Wet-Dry
3.82
1.26
2068
3.97
1.22
3740
4.08
1.34
1186
7. Near-Far
3.12
1.50
2070
3.62
1.55
3756
3.57
1.56
1188
8. Rough-Smooth
4.74
1.54
2069
4.48
1.51
3759
4.46
1.52
1191
9. Angular-Rounded
4.20
1.47
2062
4.18
1.33
3737
4.27
1.48
1181
10. Brave-Cowardly
3.02
1.31
2069
3.29
1.29
3753
2.98
1.30
1190
11. Valuable-Worthless
2.23
1.35
2072
2.44
1.43
3768
2.38
1.40
1197
12. Bass-Treble
3.68
1.23
2069
3.73
1.25
3759
3.70
1.20
1188
13. Egotistical
3.27
.92
2079
3.32
.85
3778
3.37
.83
1198
14. Planful
1.95
.84
2077
1.99
.88
3775
2.13
.91
1199
15. Rude
3.76
.59
2078
3.75
.59
3778
3.76
.56
1200
16. Objective
2.14
.88
2077
2.08
.83
3775
2.10
.84
1197
17. Cynical
3.24
.86
2079
3.36
.85
3777
3.20
.92
1198
18. Rebellious
3.32
.85
2080
3.59
.70
3776
3.29
.84
1198
19. Vague
3.46
.75
2078
3.20
.91
3778
3.09
.86
1200
20. Pretentious
3.54
.73
2072
3.54
.71
3764
3.61
.68
1199
21. Cautious
2.93
.84
2078
2.81
.83
3775
2.91
.83
1199
22. Flexible
2.30
.91
2079
2.50
.87
3774
2.34
.86
1199
23. Anxious
2.93
.99
2078
2.99
.93
3774
3.13
.91
1197
24. Unconforming
2.96
.93
2077
3.16
.85
3771
2.95
.90
1198
25. Stimulating
26. Criterion Rating
2.08
2.18
.98
1.04
2080
1881
2.43
2.41
1.02
1.08
3778
3513
2.32
2.45
1.00
1.05
1199
1132
co CP

86
students for each of the variables, arranged by division, representing
the fall trimester ratings separately are presented in Appendix X.
Examination of the data contained in the two tables indicated high simi-
larity of the ratings among the three divisions for the two trimesters.
A 26 x 26 correlation matrix representing the intercorrelations
among the combined fall and winter trimester ratings for the entire
sample appears in Table 16. The product-moment correlation coefficient
was used in computing this matrix.
Examination of the correlation coefficients shown in Table 16
indicated that high relationships were involved between "clear-hazy"
and "good-bad" and between "good-bad" and "valuable-worthless." The
coefficients were .732 and .769 respectively. Coefficients ranging
from .695 to .596 were found between "good-bad" and "stimulating";
"clear-hazy" and "vague"; "valuable-worthless" and "stimulating"; "good-
bad" and "vague"; "clear-hazy" and "valuable-worthless"; and "clear-
hazy" and "stimulating." The remaining coefficients were less than
.596.
Correlation coefficients with the 5-scale validity criterion,
represented as Variable 26 in Table 16 and as the global judgment item
on the rating scale, ranged from .647 to -.012. Variables showing
highest correlation with the criterion were "good-bad" (.647), "stimu-
lating" (.614), "valuable-worthless" (.610), "clear-hazy" (.542) "vague"
(-.496), and "near-far" (.412). A comparison of the variables showing
highest relationship to the criterion with the variables showing
strongest intercorrelations revealed that the same variables in general
were involved. Stated otherwise, certain variables seemed to carry
most of the relationships found.

TABLE 16
CORRELATION MATRIX REPRESENTING RATINGS FOR ENTIRE SAMPLE
Variables
12
34
56
78
910
11
12
13
14
15
16
17
18
19
20
21
22
23
24
25
26
1.
Peaceful-Ferocious
2.
Thick-Thin
3.
Clear-Hazy
4.
Good-Bad
5.
Loud-Soft
6.
Wet-Dry
7.
Near-Far
8.
Rough-Smooth
9. Angular-Rounded
13.
Brave-Cowardly
11.
Valuable - Worthless
12.
Bass-Treble
13.
Egotistical
14.
Planful
15.
Rude
16.
Objective
17.
Cynical
18.
Rebellious
19.
Vague
20.
Pretentious
21.
Cautious
22.
Flexible
23.
Anxious
24.
Unconforming
25.
Stimulating
26.
Criterion Rating
-.065
.113
.103
-.280
-.042
.098
-.258
-.104
-.076
.095
-.091
-.300
.095
-.277
.067
-.297
-.298
-.049
-.148
.234
.118
-.002
-.149
.026
.023
-.126
-.099
.061
.083
-.093
.131
.008
.017
-.081
.120
.102
-.089
.109
-.073
.073
.020
.146
.092
-.058
-.069
-.001
.033
-.088
-.077
.732
.203
.228
.536
-.318
-.197
.278
.613
.122
-.209
.443
-.233
.314
-.167
-.025
-.589
-.239
.035
.346
.003
-.041
.596
.542
.220
.274
.532
-.321
-.217
.374
.769
.140
-.240
.432
-.284
.330
-.182
-.006
-.621
-.286
.013
.4)9
.025
.002
.695
.647
.190
.166
.117
.037
.236
.176
.255
.116
.124
.110
.075
.119
.136
-.169
.049
-.111
.063
.092
.067
.198
.204
.305
-.077
-.096
.187
.247
.112
-.032
.096
-.043
.074
-.026
.075
-.207
-.046
-.057
.160
.039
.052
.280
.227
-.264
-.208
.297
.493
.116
-.221
.314
-.226
.230
-.147
.003
-.474
-.213
.028
.355
.036
.001
.51,0
.412
.332
-.114
-.297
.073
.178
-.246
.246
-.166
.182
.120
.299
.180
-.079
-.243
.049
.056
-.266
-.244
-.083
-.205
.007
.126
-.140
.138
-.096
.119
.062
.190
.118
-.027
-.186
.016
.018
-.183
-.172
.413
.216
.149
-.028--.25Q
.224
.417
-.075 -.299
.192
.344
-.003 -.199
.168 -.033
-.250 -.575
-.097 -.306
-.093
.022
.260
.409
.022
.011
.151 -.006
.383
.672
.3i1
.610
.059
.070
.031
.056
.105
.097
-.088
-.006
-.079
.087
.002
.081
.138
.134
-.118
.428
-.144
.474
.341
.245
.423
-.090
-.218
.062
.222
-.157
-.166
-.182
.333
-.128
-.047
-.394
-.149
.102
.231
.050
-.028
.396
.390
-.184
.441
.287
.247
.336
-.094
-.243
.049
.173
-.224
-.165
-.110
-.049
-.280
-.157
.088
.285
.026
-.012
.326
.280
.441
.198
.345
-.130
-.143
.026
.276
-.113
-.111
.080
.213
-.151
.015
.085
.434
.104
.050
.309
.013
-.301
.041
-.095
-.529
-.496
.003
-.186
.079
.155
-.212
-.194
..042
.186
-.112
-.010
-.012
.054
.078
.454
.344
.087
.049
.030
.113
.048
.614
N = 7060.

Certain other variables appeared to carry little of the rela
tionships. Although they had high reliabilities, those which had
little variance associated with others were: "rebellious" (.050),
"unconforming" (.048), "anxious" (.030), "peacefulferocious" (.023),
"cautious" (.012), and "thickthin" (.077).
Three 26 x 26 correlation matrices representing the combined
fall and winter trimester ratings for the three divisions were devel
oped in the same manner as the matrix in Table 16. Examination of the
data in the three division matrices revealed that variables showing
highest intercorrelations and validity coefficients were in general
the same as those identified in Table 16. The division matrices are
presented in the Appendix rather than in the context of this chapter.
C. Reliability
The generalized reliability formula as reported by Horst1was
used in computing item reliability of the ratings for the fall tri
mester administration. This formula was appropriate because it allows
computation of reliability when the number of measures varies for each
person. The formula is as follows:
1
Paul Horst, "A Generalized Expression for the Reliability ofMeasures," Ps chometrika, XIV (March, 1949), 21-31.

89
r = 1
.2
ni -1
N
am2
N = number of persons (instructors)n. = number of measures for person (number of students rating each1 instructor)
M = mean of measures for one instructor for each itemdi = standard deviation of the above mean(TM = standard deviation of the means for all instructors on one item.
Item reliabilities by division computed from the fall trimester
ratings are presented in Table 17. Because the fall trimester ratings
represented consistently high reliabilities, it was considered unneces
sary to compute item reliabilities for the combined fall and winter
trimester ratings since any differences found would not be likely to
justify the extensive computations involved. The high reliability
values led to the inference that student ratings, collected by means
of this particular rating scale are very stable. A comparison of the
means and standard deviations of the ratings on the two occasions as
presented in Table 15 and Appendix X led further support to the infer
ence that the ratings were highly reliable.
D. Factor Analysis
A 26 x 6 matrix of factors was extracted from each of the
26 x 26 correlation matrices. The criterion for deciding how many
factors to rotate: was based on the size of the eigenvalue for each
factor. If the eigenvalue, which is a form of variance, for each fac
tor was larger than unity, the factor was retained for rotation.

90
TABLE 17
RELIABILITY COEFFICIENTS OF ?ALL TRIMESTER RATINGS
ItemDivision
Humanities Natural Science Social Science
1. Peaceful-Ferocious .919 .858 .9572. Thick-Thin .924 .942 .9513. Clear-Hazy .949 .973 .9504. Good-Bad .939 .970 .9505. Loud-Soft .939 .952 .9586. Wet-Dry .955 .964 .9557. Near-Far .932 .965 .9468. Rough-Smooth .922 .888 .9429. Angular-Rounded .937 .901 .94910. Brave-Cowardly .932 .952 .96011. Valuable-Worthless .928 .969 .95512. Bass-Treble .933 .932 .94113. Egotistical .930 .970 .96214. Planful .942 .950 .97615. Rude .941 .946 .94616. Objective .942 .953 .94417. Cynical .944 .978 .97018. Rebellious .942 .926 .97319. Vague .941 .981 .95420. Pretentious .936 .981 .94821. Cautious .905 .962 .95222. Flexible .944 .972 .94423. Anxious .925 .958 .94724. Unconforming .929 .923 .96525. Stimulating .945 .976 .96326. Criterion Rating .923 .976 .950
Factors whose eigenvalues were less than unity were dropped since they
were contributing insignificant amounts to the variance. As a result,
six factors were retained for rotation. Rotation was done using
Kaiser's varimax procedure. The rotated factor loading matrix for the
entire sample appears in Table 18.
Each variable has six factor loadings and a communality. The
communality represents the sum of the squared factor loadings for that

TABLE 18
UNNORMALIZED ROTATED FACTOR LOADING MATRIX FOR ENTIRE SAMPLE
Variables
Factors
Communality
III
III
IV
VVI
1. Peaceful-Ferocious
.473
-.302
.171
.002
-.358
.017
.688
2. Thick-Thin
-.075
-.010
-.546
-.423
-.229
-.099
.738
3. Clear-Hazy
.171
-.028
-.264
.772
-.046
-.097
.841
4. Good-Bad
.223
-.026
-.361
.759
-.044
.057
.873
5. Loud-Soft
-.239
.006
-.537
.187
.349
-.178
.731
6. Wet-Dry
-.013
.023
-.564
.121
-.231
-.013
.622
7. Near-Far
.190
-.045
-.352
.536
-.152
.062
.690
8. Rough-Smooth
-.201
.004
-.114
-.428
.584
-.015
.761
9. Angular-Rounded
-.086
-.057
.104
-.218
.691'
.026
.740
10. Brave-.Cowardly
.012
.055
-.446
.305
.068
.357
.653
li Valuable-Worthless
.270
-.024
-.363
.693
-.020
.113
.836
12. Bass-Treble
-.056
.027
-.579
-.033
.157
.039
.605
13. Egotistical
-.764
-.025
.025
-.083
.010
-.082
.774
14. Planful
.092
-.229
-.096
.598
.015
-.108
.663
15. Rude
-.689
.038
.024
-.149
.048
-.149
.724
16. Objective
.180
-.225
-.067
.429
.125
.122
.549
17. Cynical
-.750
.070
.019
-.023
.026
.089
.760
18. Rebellious
-.607
.075
-.066
.106
.046
.486
.793
19. Vague
-.231
-.094
.211
-.726
-.010
.145
.809
20. Pretentious
-.623
-.200
.060
-.189
-.102
-.121
.702
21. Cautious
.133
-.734
.138
.019
-.087
-.146
.777
22. Flexible
.264
-.137
-.232
.359
-.133
.440
.694
23. Anxious
-.115
-.703
-.135
-.042
.099
.136
.745
24. Unconforming
-.399
-.003
-.061
.019
-.050
.687
.798
25. Stimulating
.119
-.044
-.354
.698
-.034
.230
.826
26. Criterion Rating
.098
-.021
-.311
.673
-.005
.074
.752
Proportion of total
variance extracted
.2267
.0940
.1834
.3117
.0956
.0886
100.00
Eigenvalues
6.410
3.012
1.392
1.231
1.137
1.063

92
variable. Values indicating the proportion of the total group variance
extracted are entered in Table 18. The eigenvalues are also shown.
Factor IV of the rotated matrix contributed the greatest share
of the total variance (.3117) extracted. Factor I contributed the
second greatest share of the total (.2267) and Factor III contributed
the third greatest share (.1834). The remaining three factors each
contributed less than 10 per cent. The proportion of uniqueness repre
sented in the total variance was unknown.
Examination of the communalities indicated that the variable
"goodbad" had the highest communality value, .873; and "clearhazy"
had the second highest value, .841. The remaining variables showing
highest communality values were in general those which had been identi
fied as having highest intercorrelations and highest correlations with
the criterion.
Rotated factor loading matrices for each of the three divisions,
developed in the same manner as the matrix for the entire sample, are
presented in the Appendix. A comparison of the data in the four ma
trices indicated such high similarity that only the matrix of the entire
sample is presented in the context of this study.
Inspection of the six extracted factors indicated that the
heaviest loadings in each factor were:
Factor I Factor II Factor III
Egotistical .764 Cautious .734 BassTreble .579Cynical .750 Anxious .703 WetDry .564Rude .689 ThickThin .546Pretentious .623 LoudSoft .537Rebellious .607

Factor IV Factor V Factor VI
93
ClearHazyGoodBadVagueStimulatingValuableWorthlessCriterion RatingPlanfulNearFar
.772
.759.726.698
.693
.673
.598
.536
AngularRoundedRoughSmooth
.691
.584Unconforming .687
Because the loadings were suggestive of objectionable personal
qualities, the structure of Factor I was interpreted as a measure of
the impact of instructor objectionable qualities upon the student and
was labeled an "Abrasive Impact" Factor.
Factor II appeared to be measuring the secureinsecure be
havior of the instructor. The high relationship of the two variables
to the factor suggested the instructor's secure or insecure behavior
in the handling of people and led to the labeling of Factor II as a
"Security Impact" Factor. The interpretation of this factor was doubt
ful.
The variables related to Factor III appeared to measure a com
bined sensory perception of the instructor. The particular clustering
of these variables was difficult to interpret meaningfully. The factor
was labeled a "Sensory Impact" Factor.
The clear structure of Factor IV plus its heavy contribution to
the extracted variance (31 per cent) suggested that this factor was
dominant in the matrix. Item 26, the criterion against which the rat
ings were validated, correlated higher with Factor IV than any other
factor in the matrix (.673). The factor, suggestive of the instruc
tor's ability to organize, to explain, and to inspire, was interpreted
it
94
as a measure of the instructor from a professorial view. It was
labeled a "Professorial Impact" Factor.
Factor V suggested either the sense of touch or of vision, and
was very difficult to interpret meaningfully.
Factor VI showed highest loadings in variables suggestive of
the degree to which the instructor showed autonomous characteristics.

V. DISCUSSION OF FINDINGS
The specific hypothesis tested in this study was that college
instructor behavior could be identified and measured by the use of a
graphic rating scale when the rater responded to common bipolar adjec
tives. The behaviors would yield, when subjected to factor analysis,
clusters of traits which would identify subgroups of college instruc
tors.
Examination of the data in this study produced the following
major findings.
A. Reliability
Item reliability coefficients revealed that instructor traits
as evaluated by students were highly consistent among the three divi
sions of liberal arts. Ratings by 4,433 undergraduate students of 104
instructors during the fall trimester showed that out of the total of
78 reliabilities computed for the 26 items in the rating scale for
the three divisions only two coefficients were below .90. These two
coefficients, .858 and .888, were accounted for by an N of 2 and large
standard deviations in one subsample. The remaining 76 reliability
coefficients ranged from .981 to .901.
Because of the great similarity of the ratings for both trimes
ters as evidenced by the means and standard deviations, it was consid
ered essential to compute item reliability coefficients for the fall
trimester only.
The reliability coefficient of the criterion, Item 26 on the
rating scale, was .923 for the Humanities Division, .950 for the Social
95
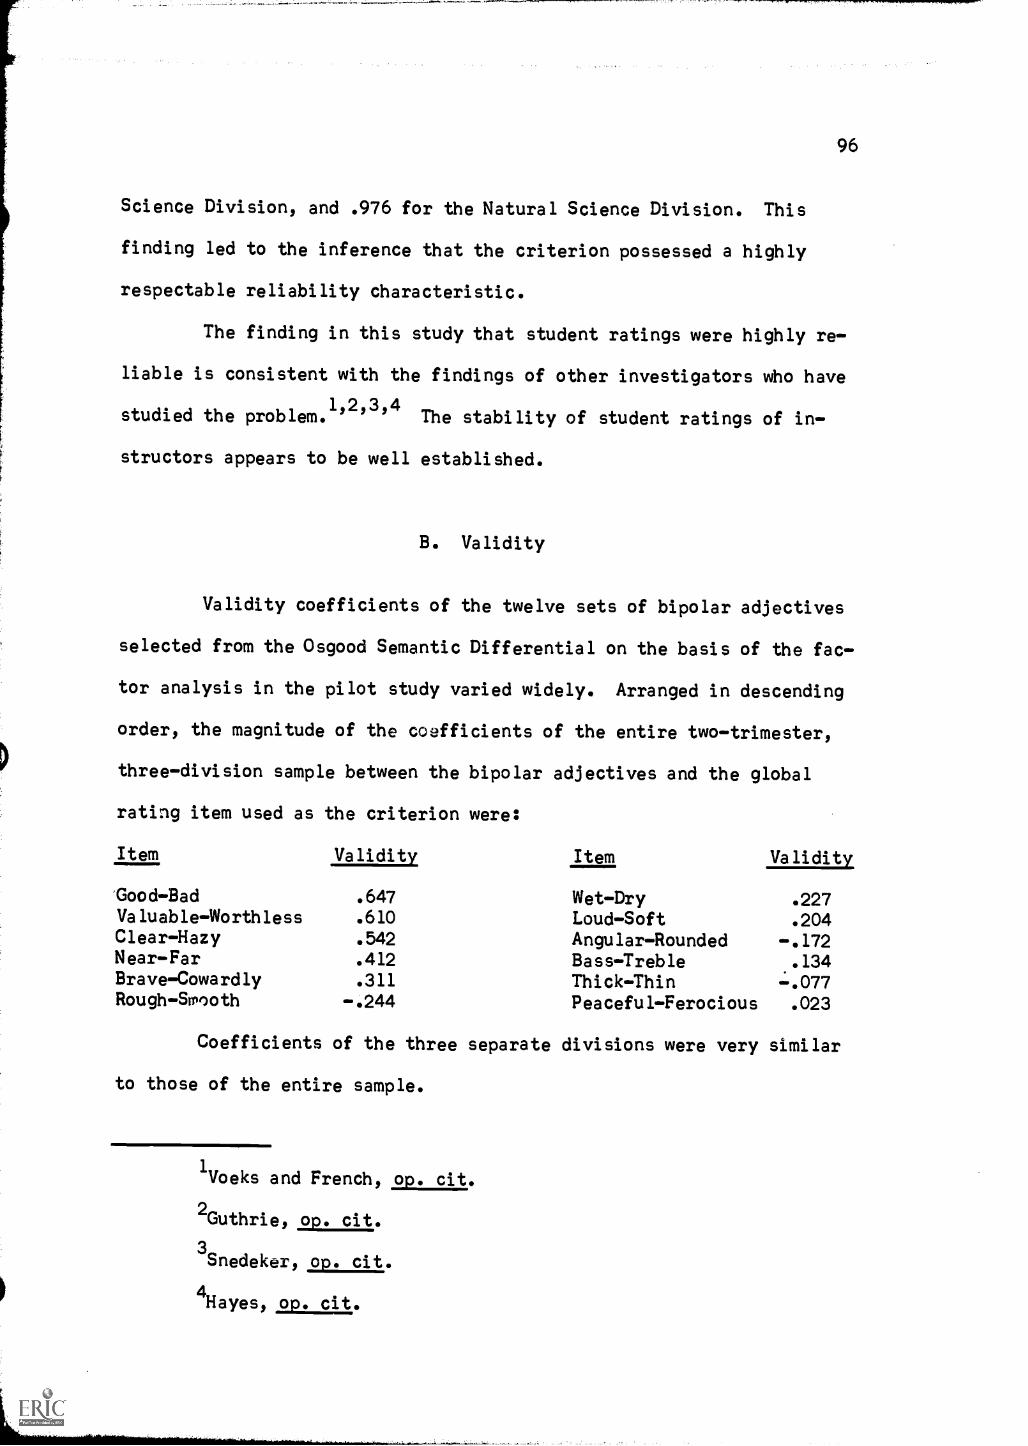
96
Science Division, and .976 for the Natural Science Division. This
finding led to the inference that the criterion possessed a highly
respectable reliability characteristic.
The finding in this study that student ratings were highly re
liable is consistent with the findings of other investigators who have
studied the problem.1,2,3,4
The stability of student ratings of in
structors appears to be well established.
B. Validity
Validity coefficients of the twelve sets of bipolar adjectives
selected from the Osgood Semantic Differential on the basis of the fac
tor analysis in the pilot study varied widely. Arranged in descending
order, the magnitude of the coefficients of the entire twotrimester,
threedivision sample between the bipolar adjectives and the global
rating item used as the criterion were:
Item Validity Item Validity
'GoodBad .647 WetDry .227ValuableWorthless .610 LoudSoft .204ClearHazy .542 AngularRounded .172NearFar .412 BassTreble .134BraveCowardly .311 ThickThin -.077RoughSmooth .244 PeacefulFerocious .023
Coefficients of the three separate divisions were very similar
to those of the entire sample.
1Voeks and French, op. cit.
2Guthrie, op. cit.
3Snedekerl,op. cit.
4Hayes, op. cit.

97
It is obvious that, with a few exceptions, the Semantic Differ
ential items did not serve to distinguish levels of teaching effective
ness. The twelve sets of bipolar adjectives identified out of the
original set of 50 as being most highly related to the three factors
extracted in the pilot study failed to discriminate among the three
groups of instructors in the current study. Only three bipolar adjec
tives out of the twelve showed respectable validity correlations with
the criterion. The extensive sample size (7,060 ratings of 104 in
structors) contributed additional evidence to the finding that the
Semantic Differer:tial did not function to identify differences in in
structor measurements.
This finang describes the Osgood scale only as used for the
purpose of the rating by observers of a sample of college instructors.
Thus, in the present study the attempt to translate behavior into
meaning overreached the potential of the scale. It may be that other
studies which have made similar attempts have the same limitation.
Validity coefficients of the single adjectives for the entire
twotrimester, threedivision sample arranged in descending order of
magnitude were:
Item Validity Item Validity
Stimulating .614 Rude .165Vague .496 Cynical .111Planful .390 Rebellious .050Flexible .344 Unconforming .048Objective .280 Anxious .030Pretentious .194 Cautious .012Egotistical .166
The validity coefficients of the single adjectives representing
each of the three divisions were very similar to the coefficients of

98
the entire sample indicating that the measurements differed little
among the three divisions.
It is obvious that, with small exception, the single adjectives
also did not function to discriminate levels of teaching effectiveness
or different teaching profiles. The highest correlation with the cri
terion, associated with the adjective "stimulating" was an expected
outcome since French1had demonstrated earlier that the instructor's
ability to arouse interest and to motivate the student was a dominant
criterion in students' ratings of effective instruction. The initial
unspoken hope that it might be possible to use this scale to depict
profiles of differences between the instructors of separate academic
divisions was unfulfilled. Students do not appear to observe the tradi
tional divisions of academia as they judge instructors.
One of the assumptions made in the early phases of the present
study was that the use of common, bipolar adjectives rather than ob
vious items in a rating scale would aid in overcoming the halo effect
by lowering the intercorrelations between items. An inspection of the
correlation matrix, Table 16, Chapter IV, revealed that all those adjec
tives showing intercorrelations above a magnitude of .50 appeared with
loadings above a magnitude of .50 in Factor IV, of the factor loading
matrix, Table 18. All other adjectives showed intercorrelations below
.50. On the basis of these findings, the assumption was accepted that
the use of common, bipolar adjectives was effective in overcoming the
"halo effect" bias. If adjectives showing high intercorrelations had
appeared with high loadings in a varying, nonspecific manner among
1French, op. cit,.
the factors, the findings would have indicated the presence of the
"halo effect."
While the findings of this study cast doubt on the claim that
the Semantic Differential is adaptable to the measurement of an almost
infinite number of concepts, they apparently lend credibility to the
statement that the instrument appears to lack "face validity" to the
rater.1
Within the limitations of this study, the instrument did not
demonstrate its adaptability to measuring the concept "Approach to
Teaching" as evidenced by the failure of the factor analysis to iso
late a number of clearcut dimensions which could be interpreted mean
ingfully. The generally low correlations of the bipolar adjectives
with the criterion, an overall judgment of teaching effectiveness, may
have been accounted for partially by the failure of students to asso
ciate the adjectives with a judgment of teaching.
The claim that the Semantic Differential yields highly re
liable measures was supported by this study as reference to the re
liability coefficients, Table 17, Chapter IV, will indicate.
As far as was known to the writer, previous studies using the
Osgood Semantic Differential have selected adjectives representative
of the three factors isolated by Osgood in the early experimentation
with the instrument. Results of these studies have confirmed the
existence of the three factors, evaluative, potency, and activity,
isolated by Osgood as underlying semantic judgment. The approach used
in this study was different from the previous ones in that bipolar ad
jectives were selected as adequately representing the three factors
1Remmers, "Rating Methods in Research on Teaching."

100
extracted in the pilot study of this project. They were combined with
single adjectives related to instructor behavior. The strength for the
finding that no significant differences existed among the groups tested
in the present study was confirmed by the discriminant analysis and F
test results. An interesting situation arises when one questions
whether the use of a similar approach would support or refute the find
ings of other studies using the Semantic Differential.
C. Discriminant Analysis
The findings of the discriminant analysis of the data demon
strating no significant differences among the groups on the measure
ments implied that students rated instructors without regard to the
subject taught or the division represented by the instructor. Appar
ently student ideas of effective instruction are unrelated to subject
matter but are based upon the instructor's ability to convey the sub
ject, thus supporting the findings discussed in connection with
validity.
D. Factor Analysis
Of the six factors extracted, Factor IV, labeled Professorial
Impact, was the dominant one and was most closely related to findings
of other studies.1
'
2'
3This factor showed higher association with the
1Solomon, Bezdek, and Rosenberg, op. cit.
2Solomon, ,op. cit.
3Taylor, op. cit.

101
criterion than any other factor extracted, leading to the inference
that Factor IV was the most valid measurement of instructor behaviors.
Factor III, labeled a Sensory Impact factor, was most heavily
loaded with negative associations to the bipolar adjectives, suggesting
a combined sensory perception of the instructor. This factor ranked
second in magnitude of correlation with the criterion (.311) suggest
ing that there may be some underlying concept present even though it
may be too elusive to interpret meaningfully at this stage.
Factors I and VI showed the next highest loadings on the cri
terion variable. The values were .098 and .074 respectively. Factors
II and V showed almost negligible loadings on the criterion. The val
ues were .021 and .005 respectively.
These findings suggested that Factor IV was the most powerful
one in measuring the traits of the 104 instructors as rated by the
7,060 students of this study. The magnitude of the loadings on adjec
tives clearly descriptive of the instructor's professorial behavior
appeared to indicate that these behaviors were the most fundamental
ones measured.
A comparison of the present study with Osgood's1 study of the
Semantic Differential showed that four factors were extracted in his
study using 50 sets of bipolar adjectives whereas six factors were ex
tracted in this study using 12 sets of bipolar adjectives and 13 single
adjectives. The first three factors of the Osgood study were labeled
"evaluative," "potency," and "activity." Since the fourth factor ac
counted for less than 2 per cent of the variance extracted, it was
dropped.
1Osgood, Slid., and Tannenbaum,, op. cit.

102
A comparison of the structure of Osgood's purest factor, the
Evaluative Factor, with the purest factor of this study, Factor IV,
the Professorial Impact Factor, revealed that the five sets of bipolar
adjectives which were identified as having heaviest loadings on the
Professorial Impact Factor also had heaviest loadings on the Evalua
tive Factor.
Osgood's second factor, Potency, appeared to be most closely
related to Factor III, the Sensory Impact, of the present study. Three
of the five sets of bipolar adjectives which had been identified as
showing heaviest loadings in the Sensory Impact Factor also showed
heaviest loadings in the Potency Factor. These three sets were "bass
treble," "thickthin," and "loudsoft." The remaining two sets of ad
jectives showing high loadings in the Sensory Impact Factor also ap
peared in the Potency Factor but their loadings in one of Osgood's re
maining two factors were higher than their loadings in the Potency
Factor.
Even though the relationship was not clear, Osgood's Activity
Factor appeared to be related to Factor V of this study. "Angular
rounded" showed heavier loading on these two factors in both studies
than on any other factors. The remaining sets of adjectives identified
as showing correlations to Factor V also showed considerable correla
tions to the Activity Factor.
The percentages of variance extracted accounted for by Osgood's
Evaluative Factor (68 per cent) and by the Professorial Impact Factor
of this study (31 per cent) suggested that each of these factors was
dominant in its respective situation. Somewhat surprising was the find
ing that these two student populations, evaluating concepts which were

103
thought to be completely unrelated, chose adjectives showing similarity
in factor content.
An interesting observation was a comparison of Factor I, the
Abrasive Impact Factor, to Ryansl TCS Pattern X0 Factor (kindly, under
standing, friendly vs. aloof, egocentric, restricted teacher behavior).
He found that teachers whose behavior was rated as warm and understand
ing rated high on Pattern Xo. Teachers rated high on Pattern X0 were
judged as showing more positive attitudes toward pupils, as being more
stimulating, and as showing more stable personal adjustment. Although
Factor I of this study represented the negative pole of the dimension,
the implication seemed to be an overlap in behavior measured. Consid
eration of the data compiled in this study, together with the findings
from Ryans' study, gave substantial support to the assumption that the
Abrasive Factor was related to a significant dimension of instructor
behavior. Additional support for this assumption is provided when one
considers that Ryans' sample represented the elementary and secondary
school population while the sample in the current study represented the
college population.
1Ryans, Characteristics of Teachers.

VI. SUMMARY OF FINDINGS AND CONCLUSIONS
A. Summary of Findings
1. An attempt was made to develop a socially unbiased descrip
tion of teaching which could provide inferences for the improvement of
teaching behavior and which could serve as a possible contribution to
a theory of college and university teaching behavior.
2. A rating scale, composed of 12 bipolar adjectives and 13
single adjectives, was administered to undergraduate liberal arts stu
dents enrolled in classes of undergraduate liberal arts instructors.
The rating scale was administered a second time to students enrolled
in classes of the original instructor sample. The total sample con
sisted of 7,060 students who rated 104 instructors.
3. The ratings, representing the entire sample and categorized
into one each of three academic divisions, were subjected to a discrim
inant analysis. With 52 and 14,064 degrees of freedom, the obtained F
was .0062 indicating that the three groups occupied the same area in the
discriminant space. No significant differences were indicated among the
groups on the measurements. Therefore, the null hypothesis that there
were no significant differences among the three divisions on the 26
variables of the rating scale was not rejected. The assumption was ac
cepted that the samples represented the same population, not three
separate populations.
4. The combined ratings, categorized by Humanities, Natural
Science, and Social Science divisions, were intercorrelated for the
three divisions and a total, and the four correlation matrices were
104

105
subjected to factor analysis. Six factors emerged from the rotated
matrices. The factors were interpreted as follows:
a. Factor I was interpreted as a description of the im
pact of the instructor's objectionable qualities upon
the student and was labeled an "Abrasive Impact"
Factor.
b. Factor II was interpreted as a description of the se
cure or insecure behavior of the instructor and was
labeled a "Security Impact" Factor. The interpreta
tion was doubtful.
c. Factor III, interpreted as a combined sensory percep
tion of the instructor, was labeled a "Sensory Impact"
Factor.
d. Factor IV was interpreted as the student's evaluation
of the instructor from a professorial view. It was
suggestive of the instructor's ability to organize, to
explain, and to inspire and was labeled a "Professorial
Impact" Factor.
e. Factor V was interpreted as a description of a sensory
perception of the instructor.
f. Factor VI was interpreted a'o a suggestion of the de
gree to which the instructor showed autonomous charac
teristics.
5. One hypothesis was proposed: that college instructor be
havior could be identified and measured by the use of a graphic rating
scale when the rater responded to common bipolar adjectives. The be
haviors would yield, when subjected to factor analysis, clusters of

106
traits which would identify subgroups of college instructors. The
hypothesis was refuted. Though the bipolar adjectives did show high
reliability and loadings on the factors, F test results revealed no
significant differences among the three groups.
6. A comparison of the factors extracted in this study with
the factors extracted by Osgood revealed similarity of the factor
structures.
B. Conclusions
Analysis of the data warranted the following conclusions:
The results revealed that instructor behavior could not be
identified and measured by the use of a graphic rating scale composed
of common bipolar adjectives. Out of twelve sets of bipolar adjec
tives, only three sets showed respectable validity correlations with
the criterion.
Results of the discriminant analysis which showed no signifi
cant differences when the measures were analyzed by division demon
strated that, within the limits of this study, instructors from the
Humanities, Social Science, and Natural Science divisions were similar.
The subject taught and the discipline represented by the instructor
were not contributing appreciably to the measures studied. Wide dif
ferences among the individual instructors were observed but were not
examined. Subsequent study will be made of these differences.
Item reliability coefficients computed for the ratings showed
high stability. Because the coefficients were above .90, with the
exception of two subsample coefficients which were .85 and .88, it was

concluded that the instrument yielded stable assessment of instructor
measures. This conclusion supports the conclusions of other investiga
tors who have studied student rating reliability.
Future research might explore further the attempt to secure
ratings by the use of items which attempt to mask the true purpose of
the rating. Until this method, or a similar one, has been shown to be
effective, the problem of measuring instructor behaviors by a process
which does not allow the respondent to choose socially desirable re
sponses, that is, responses not influenced by social desirability in
measurement, remains unsolved.
The fundamental conclusion made on the basis of evidence pre
sented in this study was that the Osgood Semantic Differential did not
discriminate differences among the measures of the three groups tested.
Thus, it was not possible to make predictions about distinguishing
characteristics of the three groups tested.
The extensive data compiled in the present study significantly
demonstrated that only three out of twelve bipolar adjectives, se
lected from the Semantic Differential to represent adequately each of
three factors extracted from a pilot study, were respectably corre
lated with the criterion, a global judgment of overall teaching ef
fectiveness. The discriminant analysis technique applied to the data
yielded overwhelming evidence that no significant differences existed
among the measures representing the three separate divisions of col
lege instructors. Therefore, the results conclusively demonstrated
that the instrument cannot be used appropriately as a measure of be
havior.
108
The Semantic Differential was used in this study for the pur
pose of rating college instructors by student observers and the at
tempt was made to translate the ratings into meaningful behaviors
after a factor analysis. This particular application overreached the
potential of the device but is not to be interpreted as a criticism
of the device. The Semantic Differential was designed to measure the
meaning of cons(ots and this study demonstrated that it did not func
tion outside of its original intention.
The implication of the current study is clearly one that re
stricts the use of the Osgood Semantic Differential to measuring the
meaning of concepts. Use of the scale in a situation intending to
measure behavior is a misapplication of the device, thus casting doubt
on the findings of previous stuales which have employed it to make be
havioral inferences. Future experiments with the instrument will make
greater contributions if the investigations limit its use to measuring
the meaning of concepts rather than attempting to make behavioral in
ferences from data gathered through an incorrect procedure. The inter
pretation represents a challenge to look elsewhere for measuring in
structor behaviors. The basic variables underlying complex behaviors,
such as teaching, must be isolated and identified by a means other than
the Semantic Differential.
The research reported in this study has been essentially an
exploration into the complex area of teaching behavior. The study has
demonstrated that certain aspects of the behavior yield themselves to
measurement while ocher aspects are more elusive.
While the study showed no significant differences among the
three divisions represented, differences among the instructors were

109
demonstrated by the individual ratings assigned. An investigation pro
posed as an outgrowth of the research already reported is a further
analysis of the ratings given to the separate instructors. In order
that individual differences among the instructors may be compared, it
is intended to utilize profiles which represent the rating scores.
The rating scores for the individual instructors will be transformed
to a scale possessing comparable values. The obvious need for com
parable values is seen when one considers that the scores in their
present form do not represent equal increments. It is proposed to
convert the criterion ratings of the tails of the sample into a single,
common scale, such as the T scale. The resulting scales will allow
meaningful profiles, representing the ratings assigned to individual
instructors, to be drawn and interpreted. Instructor ratings may then
be compared in a statistically accurate manner.
A second line of research proposed as a continuation of the
current study is a further investigation of the demonstrated finding
that the adjective "stimulating" is highly significant in describing
teacher behavior. The collection of behavior characterizing the stimu
lating, instructor could be accomplished through a method which samples
student judgment. After categorizing student suggestions into discrete
behavioral classes, an operational definition of "stimulating" would be
determined and used as the criterion. Variables considered to be asso
ciated with stimulating behavior, such as achievement of knowledge,
acquisition of skills, and assignment of grades, might be correlated
with the criterion to determine whether any significant relationships
exist. Once these relationships have been determined, the information

, 1r foriertMrt,AIT,ISM, 07i,47#11111414
110
could be made available to institutions preparing students for entry
into college teaching careers and to institutions who are interested
in learning more about the complexities of teaching behavior.

APPENDICES

APPENDIX I
SAMPLE INSTRUMENT
The purpose of this study is to obtain a description of instructor characteristics. You are being asked to evaluate concepts againstadjectives. Please make your evaluations on the basis of your reactions. Some of these adjectives may not be relevant to instructor characteristics. However,, we would like to have you check as many as youfeel are related. As you check these adjectives, keep in mind that youare evaluating the adjectives in terms of the concept listed at the topof each page. The task is to relate the adjective to the concept.
The first 4 pages contain lists of bipolar adjectives which areto be related to the concept listed at the top of each page. In allcases you will be evaluating one instructor. However, each page listsa separate dimension of his characteristics. On page 1 the dimensionis "Approach to Authority," on page 2 the dimension is "Approach toIdeas," etc. The first 4 pages list bipolar adjectives which are tobe used to evaluate the instructor's "Approach to Authority," "Approachto Ideas," etc. The scales are to be used as follows:
Page 1Instructor "X"APPRO CH TO AUTHORITY:
(1) (2) (3) (4)
1. Good
If
number "1"If
number "2"If
number "3"If
the numberIf
number "5"If
number "6"If
number "7"
you feel thatin the columnyou feel thatin the columnyou feel thatin the columnyou feel that"4" in the coyou feel thatin the columnyou feel thatin the columnyou feel thatin the column
Instructorheaded "No.Instructorheaded "No.instructorheaded "No.Instructorlumn headedInstructorheaded "No.Instructorheaded "No.Instructorheaded "No.
(5) (6) (7)
No. ofChoice
Bad
"X" is extremely good, write theof Choice";
"X" is quite good, write theof Choice";
"X" is slightly good, write theof Choice";
"X" is neither good nor bad, write"No. of Choice";"X" is slightly bad, write theof Choice";
"X" is quite bad, write theof Choice";
"X" is extremely bad, write theof Choice".
Beginning with page 5, the situation is slightly different.Only one adjective is listed rather than bipolar adjectives. Pleaselist the number of your choice in the column headed "No. of Choice."
112

Example: Page 5Instructor "X"APPROACH TO AUTHORITY:
Pretentious
If
the numberIf
number "2"If
the numberIf
the number
41,0
(1) (2)
you feel that Instructor"1" in the column headed "Noyou feel that Instructor "X"in the column headed "No. of
11X11
you feel that Instructor"3" in the column headedyou feel that Instructor"4" in the column headed
DO NOT SIG YOUR NAME.
rt"No',x""No
(3) (4)
113
No. ofChoice
is extremely pretentious, write. of Choice";is auite pretentious, write theChoice";
is slightly pretentious, write. of Choice ";
is not at all pretentious, write. of Choice."

(from Osgood, pp. 36-37) INSTRUCTORAPPROACH TO AUTHORITY:
(1) (2) (3) (4) (5) (6) (7)1. Good2. Large3. Beautiful4. Yellow5. Hard6. Sweet7. Strong8. Clean9. High10. Calm11. Tasty12. Valuable13. Red14. Young15. Kind16. Loud17. Deep18. Pleasant19. Black20. Bitter21. Happy22. Sharp23. Empty24. Ferocious25. Heavy26. Wet27. Sacred28. Relaxed29. Brave30. Long31. Rich32. Clear33. Hot34. Thick35. Nice36. Bright37. Bass38. Angular39. Fragrant40. Honest41. Active42. Rough43. Fresh44. Fast45. Fair46. Rugged47. Near48. Pungent49. Healthy50. Wide
MMIIMM1111
.
Page 1
111.1.1. MNIMINIMINO
011RIMMINIO
I
114
No. ofChoice
BadSmallUglyBlueSoftSour
WeakDirty
LowAgitated
DistastefulWorthless
Green.Old
SoftShallow
UnpleasantWhiteSweet
SadDullFull
PeacefulLightDry
ProfaneTense
CowardlyShortPoorHazyColdThin
AwfulDark
TrebleRounded
FoulDishonestPassiveSmoothStaleSlow
UnfairDelicate
FarBlandSick
Narrow

(from Osgood, pp. 36-37) INSTRUCTORAPPROACH TO IDEAS:
(1) (2) (3) (4) (5) (6) (7)
1. Good2. Large3. Beautiful4. Yellow5. Hard6. Sweet7. Strong8. Clean9. High10. Calm11. Tasty12. Valuable13. Red14. Young15. Kind16. Loud17. Deep18. Pleasant19. Black20. Bitter21. Happy22. Sharp23. Empty24. Ferocious25. Heavy26. Wet27. Sacred28. Relaxed29. Brave30. Long31. Rich32. Clear33. Hot34. Thick35. Nice36. Bright37. Bass38. Angular39. Fragrant40. Honest41. Active42. Rough43. Fresh44. Fast45. Fair46. Rugged47. Near48. Pungent49. Healthy50. Wide
1=IpMINIMI
.11,1111MIMM
' '
Page 2
115
No. ofChoice
BadSmallUglyBlueSoftSourWeak
DirtyLow
AgitatedDistastefulWorthless
GreenOld
CruelSoft
ShallowUnpleasant
WhiteSweet
DullFull
PeacefulLightDry
ProfaneTense
CowardlyShortPoorHazyColdThinAwfulDark
TrebleRounded
FoulDishonest
PassiveSmoothStaleSlcw
UnfairDelicate
FarBlandSick
Narrow
MIND
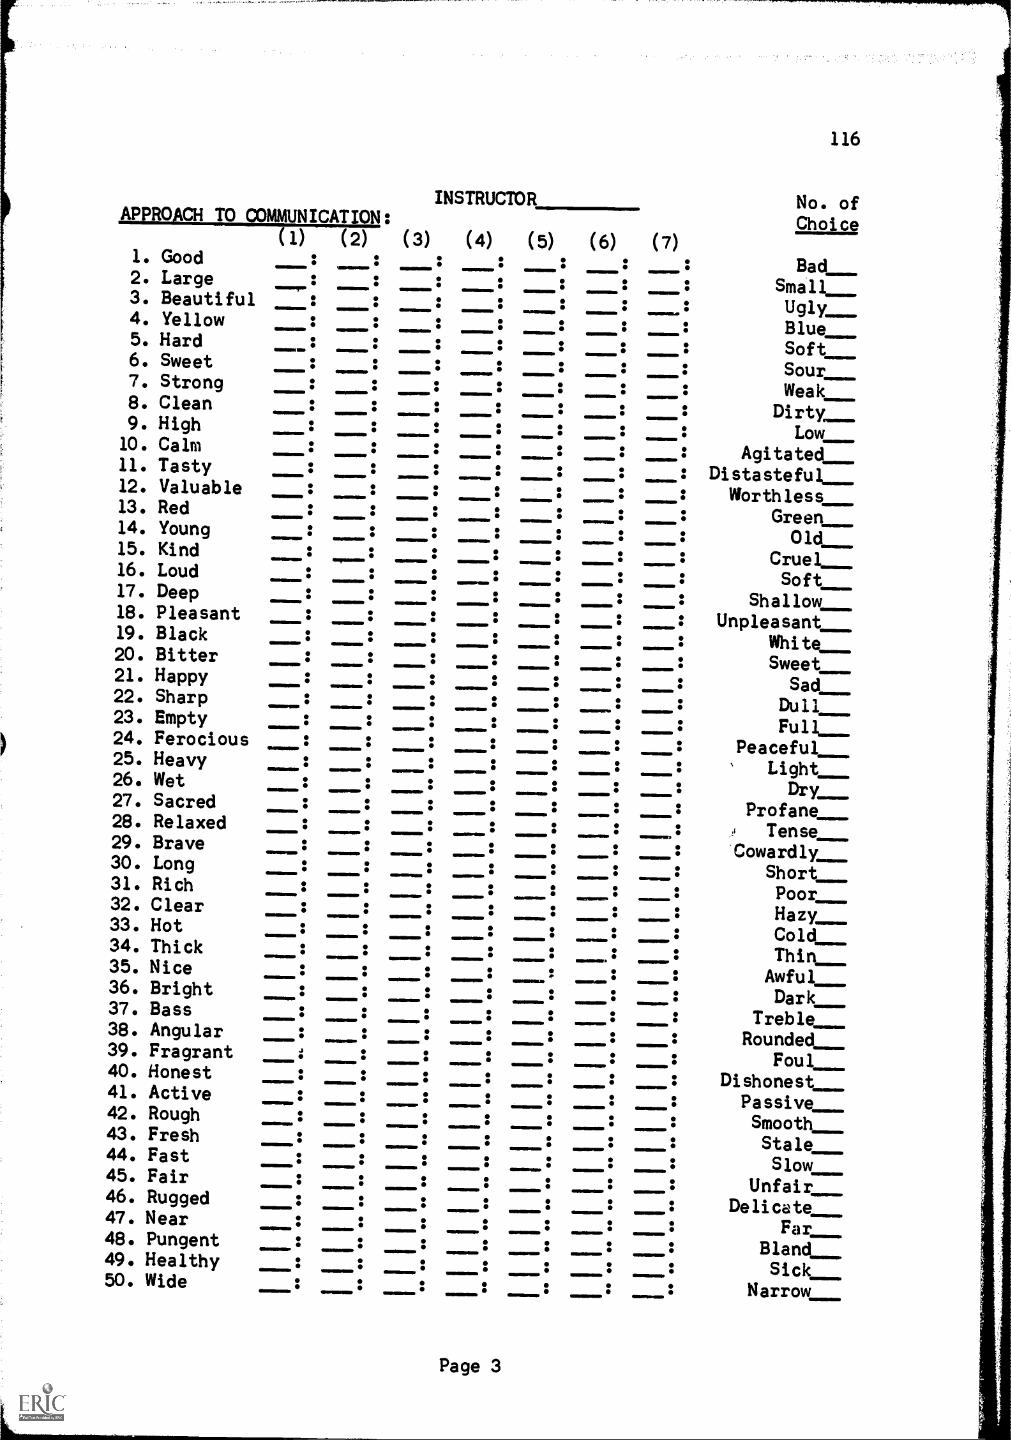
INSTRUCTORAPPROACH TO COMMUNICATION:
(1) (2) (3) (4) (5) (6)1. Good2. Large3. Beautiful4. Yellow5. Hard6. Sweet7. Strong8. Clean9. High10. Calm11. Tasty12. Valuable13. Red14. Young15. Kind16. Loud17. Deep18. Pleasant19. Black20. Bitter21. Happy22. Sharp23. Empty24. Ferocious25. Heavy26. Wet27. Sacred28. Relaxed29. Brave30. Long31. Rich32. Clear33. Hot34. Thick35. Nice36. Bright37. Bass38. Angular39. Fragrant40. Honest41. Active42. Rough43. Fresh44. Fast45. Fair46. Rugged47. Near48. Pungent49. Healthy50. Wide
1111101111.1 IINF
Page 3
11111111,M0110
(7)
116
No. ofChoice
BadSmallUglyBlueSoftSourWeak
DirtyLow
AgitatedDistastefulWorthless
GreenOld
CruelSoft
ShallowUnpleasant
WhitA___Sweet
SadDull
Peaceful_LightDry
ProfaneTense
CowardlyShortPoorHazyColdThin.AwfulDark
TrebleRounded
FoulDishonest
PassiveSmooth___StaleSlow
UnfairDelicate
FarBlandSick
Narrow

INSTRUCTORAPPROACH TO STpDENTS:
(1) (2) (3) (4) (5) (6) (7)1. Good2. Large3. Beautiful4. Yellow5. Hard6. Sweet7. Strong8. Clean9. High10. Calm11. Tasty12. Valuable13. Red14. Young15. Kind16. Loud17. Deep18. Pleasant19. Black20. Bitter21. Happy22. Sharp23. Empty24. Ferocious25. Heavy26. Wet27. Sacred28. Relaxed29. Brave30. Long31. Rich32. Clear33. Hot34. Thick35. Nice36. Bright37. Bass38. Angular39. Fragrant40. Honest41. Active42. Rough43. Fresh44. Fast45. Fair46. Rugged47. Near48. Pungent49. Healthy50. Wide
MENIEMID NEINEWEIO
11:
11:
.
.WM1E/WM
MIWIMMEM
%MENEM
WWEIMMED
GOIWWWM
MIIIMMEM
MME/WW
IMEM.M111
IEWMIMM.
11IMMEEM.1WWW11110
SEIMMEIND
OIMMO.Mm
NEW
MN WM/WM
IMMEMEM
/WWW..111/
.
..V .
:
I . .WEIIIIM
:
w_ .11.11WWW.
INIEWMIWID .WWWWW
=WM ME EIMIIMIEW
ONIMMOM
OMMMIIM IMIWEWEED
Page 4
IIMIMMEM
MIMM/M.
IMMW
WIMEMEW
WMENWIP
MINEMINI
WWIIMMO,
117
No. ofChoice
BadSmall
Ugly.BlueSoftSourWeak
DirtyLow
AgitatedDistasteful
WorthlessGreenOld
CruelSoft
ShallowUnpleasant
WhiteSweet
SadDull__,_
FullPeaceful
LightDry._
ProfaneTense
CowardlyShortPoorHazyColdThin
AwfulDark
TrebleRounded
FoulDishonest
PassiveSmoothStaleSlow
UnfairDelicate
FarBlandSick
Narrow

Please rate in accordance with the following situation:(1) extremely(2) quite(3) slightly(4) not at all
APPROACH TO AUTHORITY:
1. Pretentious2. Omniscient3. Cynical4. Egotistical5. Crusading6. Hypochondrical7. Masculine8. Abasive9. Anxious
INSTRUCTOR
(1) ( 2) (3) (4)
118
No. ofChotge
10. Planful11. Lethargic12. Meandering13. Cautious
/1111=1.
14. Meticulous15. Compulsive IM.Y.
IN.M.111110
16. Dogmatic 11 411.11!
17. Uncertain ....18. Inconspicuous
111..11.1m
19. Deferent 1111.MMW120. Rebellious .......... ! RIOOMIMMil 141....1
21. Pragmatic ....WIMmw!..wimm 710.1........, !,....
22. Ethereal 0.1111.10.23. Objective
7711, 4111.1
24. Hypercritical2 Isolated26. Unconforming27. Flexible28. Dry29. Flamboyant30. Voluble31. Lucid32. Vague33. Protective34. Threatening35. Aloof36. Intimate37. Rude38. Courteous39. Perceptive40. Evaluative Skill
Page 5

Please rate in accordance with the following situation:(1) extremely(2) quite(3) slightly(4) not at all
APPROACH TO IDEAS:
1. Pretentious2. Omni.:Aent
P
3. Cynical4. Egotistical5. Crusading6. Hypochondrical7. Masculine8. Abasive9. Anxious10. Planful11. Lethargic12. Meandering13. Cautious14. Meticulous15. Compulsive16. Dogmatic17. Uncertain18. Inconspicuous19. Deferent20. Rebellious21. Pragmatic22. Ethereal23. Objective24. Hypercritical25. Isolated26. Unconforming27. Flexible28. Dry29. Flamboyant30. Voluble31. Lucid32. Vague33. Protective34. Threatening35. Aloof36. Intimate37. Rude38. Courteous39. Perceptive40. Evaluative Skill
119
INSTRUCTOR No. ofChoice
(1) (2) (3) (4)
MEM
1:M1
Page 6
MN.
111..L
111111111.1
ILMMNIIVi
Ii=11MIIIIM
1...",
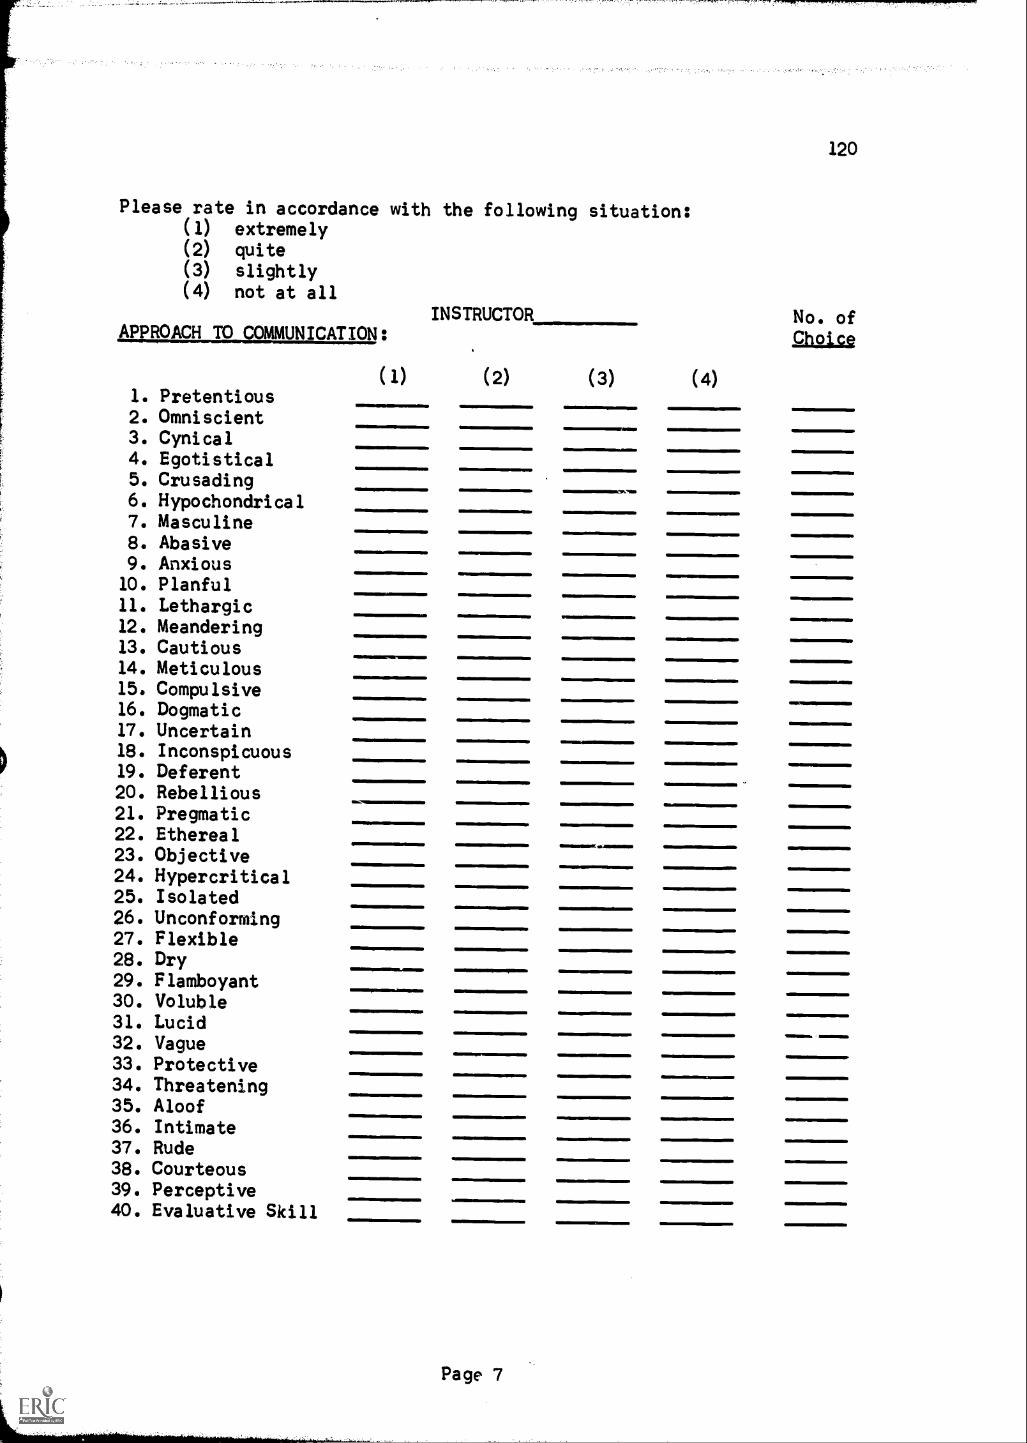
Please rate in accordance with the following situation:(1) extremely(2) quite(3) slightly(4) not at all
INSTRUCTORAPPROACH TO COMMUNICATION:
1. Pretentious2. Omniscient3. Cynical4. Egotistical5. Crusading6. Hypochondrical7. Masculine8. Abasive9. Anxious10. Planful11. Lethargic12. Meandering13. Cautious14. Meticulous15. Compulsive16. Dogmatic17. Uncertain18. Inconspicuous19. Deferent20. Rebellious21. Pregmatic22. Ethereal23. Objective24. Hypercritical25. Isolated26. Unconforming27. Flexible28. Dry29. Flamboyant30. Voluble31. Lucid32. Vague33. Protective34. Threatening35. Aloof36. Intimate37. Rude38. Courteous39. Perceptive40. Evaluative Skill
(1) (2) (3) (4)
Ws.
INI111111111=MMIM
01.1:41111
11110.r
0
120
No. ofChoice
=1.

Please rate in accordance with the following situation:(1) extremely(2) quite(3) slightly(4) not at all
APPROACH TO STUDENTS:
1. Pretentious2. Omniscient3. Cynical4. Egotistical5. Crusading6. Hypochondrical7. Masculine8. Abasive9. Anxious10. Planful11. Lethargic12. Meandering13. Cautious14. Meticulous15. Compulsive16. Dogmatic17. Uncertain18. Inconspicuous19. Deferent20. Rebellious21. Pragmatic22. Ethereal23. Objective24. Hypercritical25. Isolated26. Unconforming27. Flexible28. Dry29. Flamboyant30. Voluble31. Lucid32. Vague33. Protective34. Threatening35. Aloof36. Intimate37. Rude38. Courteous39. Perceptive40. Evaluative Skill
INSTRUCTOR.
(1) (2) (3) (4)
121
No. of
CISIO
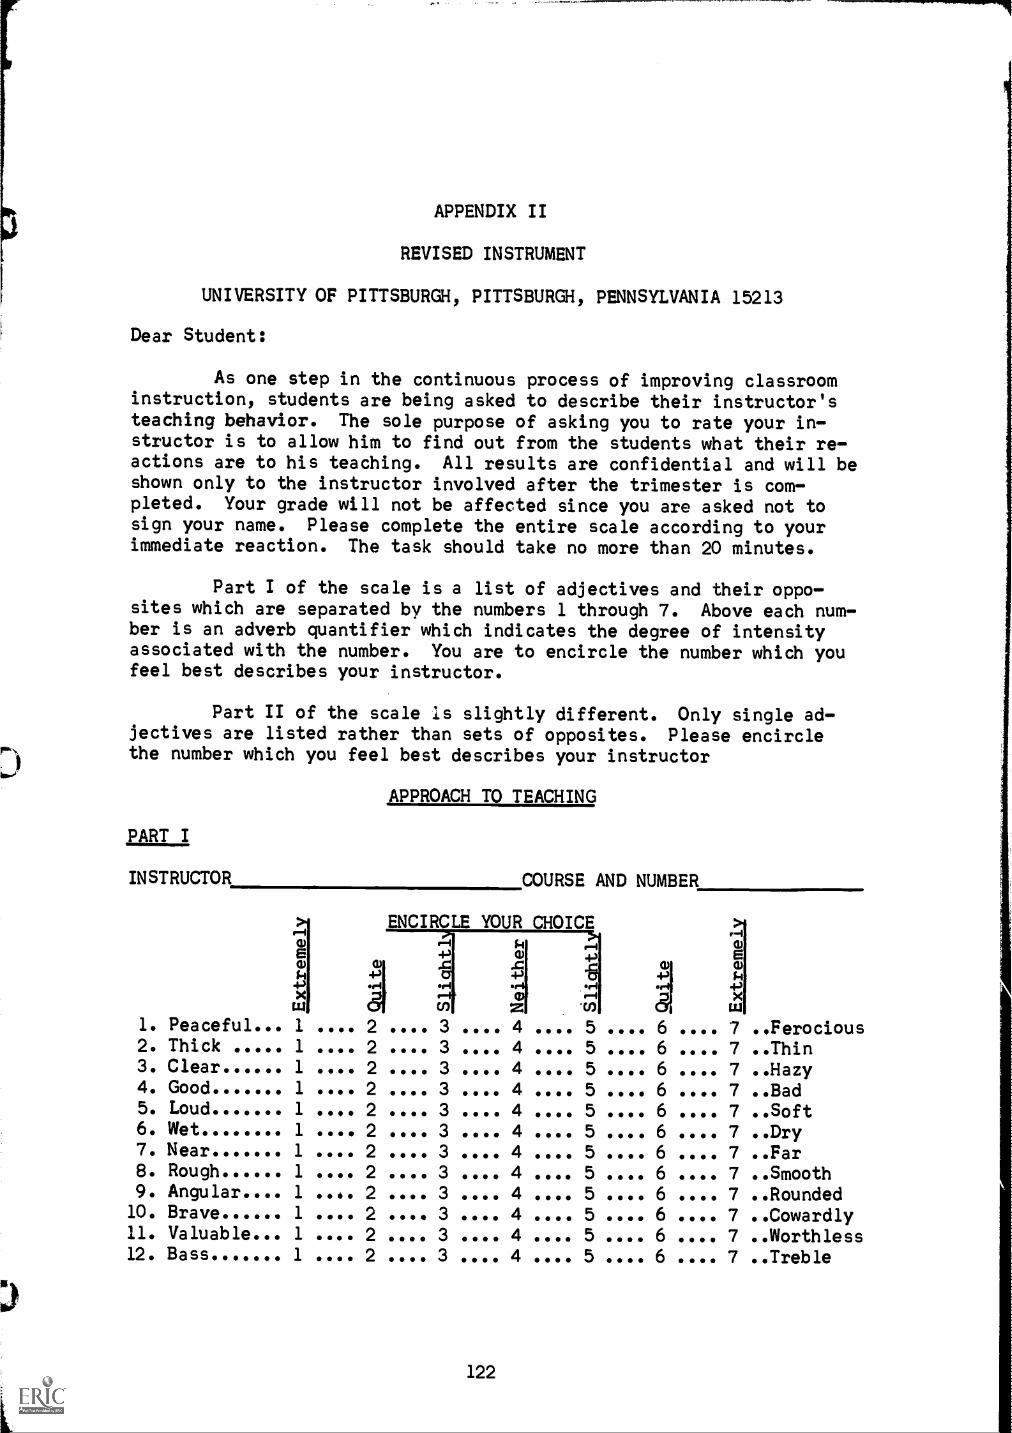
APPENDIX II
REVISED INSTRUMENT
UNIVERSITY OF PITTSBURGH, PITTSBURGH, PENNSYLVANIA 15213
Dear Student:
As one step in the continuous process of improving classroominstruction, students are being asked to describe their instructor'steaching behavior. The sole purpose of asking you to rate your instructor is to allow him to find out from the students what their reactions are to his teaching. All results are confidential and will beshown only to the instructor involved after the trimester is completed. Your grade will not be affected since you are asked not tosign your name. Please complete the entire scale according to yourimmediate reaction. The task should take no more than 20 minutes.
Part I of the scale is a list of adjectives and their opposites which are separated by the numbers 1 through 7. Above each number is an adverb quantifier which indicates the degree of intensityassociated with the number. You are to encircle the number which youfeel best describes your instructor.
Part II of the scale is slightly different. Only single adjectives are listed rather than sets of opposites. Please encirclethe number which you feel best describes your instructor
APPROACH TO TEACHING
PART I
INSTRUCTOR
a)
H4-)
1. Peaceful... 1
2. Thick 1
3. Clear 1
4. Good 1
5. Loud 1
6. Wet 1
7. Near 1
8. Rough 1
9. Angular. 1
10. Brave 1
11. Valuable 1
12. Bass 1
COURSE AND NUMBER
ENCIRCLE YOUR CHOICE
;14-)
4-)
4-)
.... 2 .... 3 .... 4 .... 5 .... 6 .... 7 .Ferocious
.... 2 .... 3 .... 4 .... 5 .... 6 .... 7 ..Thin
.... 2 .... 3 .... 4 .... 5 .... 6 .... 7 ..Hazy
.... 2 .... 3 .... 4 .... 5 .... 6 .... 7 ..Bad0000 2 0000 3 .... 4 .... 5 .... 6 .... 7 ..Soft.... 2 .... 3 .... 4 .... 5 .... 6 .... 7 ..Dry.... 2 .... 3 .... 4 .... 5 .... 6 .... 7 ..Far.... 2 .... 3 4 .... 5 6 0000 7 .Smooth(toes 2 .... 3 .... 4 .... 5 .... 6 .... 7 ..Rounded.... 2 0000 3 .... 4 .... 5 .... 6 .... 7 ..Cowardly.... 2 .... 3 .... 4 .... 5 .... 6 .... 7 .Worthless.... 2 .... 3 .... 4 .... 5 .... 6 .... 7 ..Treble
122

123
PART II ENCIRCLE YOUR CHOICE
Slightly Not pt.5111Extremely Quite
13. Egotistical 1 2 3 4
14. Planful 1 2 3 4
15. Rude 1 2 3 4
16. Objective 1 2 3 4
17. Cynical 1 2 3 4
18. Rebellious. . . . 1 ...... 2 ...... 3 ...... 4
19. Vague 1 2 3 4
20. Pretentious . . . 1 ...... 2 ..... . 3 ...... 4
21. Cautious..... 1 ...... 2 . . . . . . 3 ...... 4
22. Flexible 1 2 3 4
23. Anxious 1 2 3 4
24. Unconforming 1 2 3 4
25. Stimulating 1 2 3 4
PART III
Please indicate your age ; your sex ; your year incollege
In my opinion, this teacher is: 1. outstanding; 2. superior; 3. competent; 4. only fair; 5. of doubtful value compared to other teachers(Encircle one choice).
What three things about this instructor have been most helpful to you?
1.
2.
3.
Is there anything about this class that you feel could be improved?
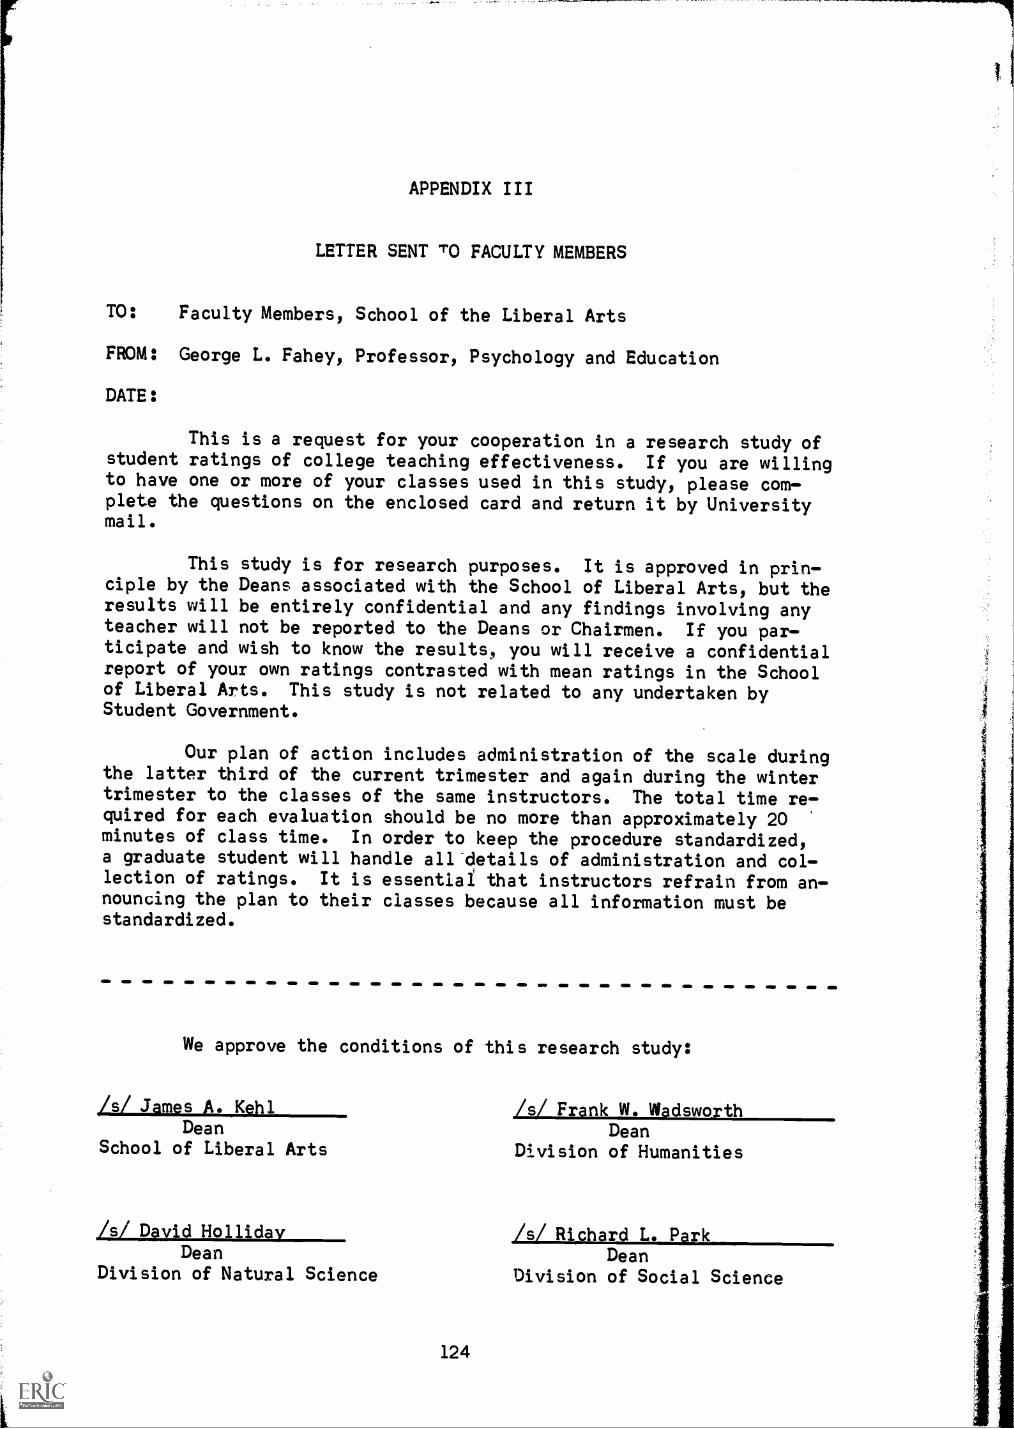
APPENDIX III
LETTER SENT TO FACULTY MEMBERS
TO: Faculty Members, School of the Liberal Arts
FROM: George L. Fahey, Professor, Psychology and Education
DATE:
This is a request for your cooperation in a research study ofstudent ratings of college teaching effectiveness. If you are willingto have one or more of your classes used in this study, please complete the questions on the enclosed card and return it by Universitymail.
This study is for research purposes. It is approved in principle by the Deans associated with the School of Liberal Arts, but theresults will be entirely confidential and any findings involving anyteacher will not be reported to the Deans or Chairmen. If you participate and wish to know the results, you will receive a confidentialreport of your own ratings contrasted with mean ratings in the Schoolof Liberal Arts. This study is not related to any undertaken byStudent Government.
Our plan of action includes administration of the scale duringthe latter third of the current trimester and again during the wintertrimester to the classes of the same instructors. The total time required for each evaluation should be no more than approximately 20minutes of class time. In order to keep the procedure standardized,a graduate student will handle all details of administration and collection of ratings. It is essential that instructors refrain from announcing the plan to their classes because all information must bestandardized.
We approve the conditions of this research study:
/s/ James A. Kehl /s/ Frank W. WadsworthDean Dean
School of Liberal Arts Division of Humanities
/s/ David HollidayDean
Division of Natural Science
124
/s/ Richard L. ParkDean
Division of Social Science

125
1. Name Univ. phone
2. I would like to participate_; I prefer not to
3. Academic rank ; Sex
4. Total years of college and/or univ. teaching
5. Course(s) teaching now, day, time, and classroom number:
6. Day and time you prefer to set aside for this study:
7. University department

APPENDIX IV
INSTRUCTIONS READ TO STUDENTS
SHEET OF INSTRUCTIONS TO BE READ TO STUDENTS WHEN ADMINISTERING THESCALE:
We are requesting your cooperation in a research study of stu
dent ratings of college teaching. The study is for research purposes
and all results are confidential to the instructor.
Please read the instructions carefully and answer as quickly
and accurately as you can.
Since this is an anonymous rating, your instructor will not
know how you as an individual rated him.
126

1
APPENDIX V
CONFIDENTIAL LETTER TO FACULTY
Confidential
DATE:
TO:
FROM: George L. Fahey, Professor, Psychology and Education,460 Langley Hall
SUBJECT: Result of student ratings
We thank you fcr the cooperation you gave us last trimester inhelping us to carry out the first phase of our research concerned withteaching evaluation. Results of the student rating scale which wasadministered to your, class arefurnished in this letter.
We shall be contacting you soon in reference to administeringthe rating scale to your class(es) during the latter part of the current trimester.
Part I of the rating scale, which instructed students to encircle a choice of adverb quantifiers from among bipolar adjectivessuch as "goodbad," "thickthin," and "bravecowardly," is being subjected to a factor analysis. These results will be available in afinal report to be prepared later.
127
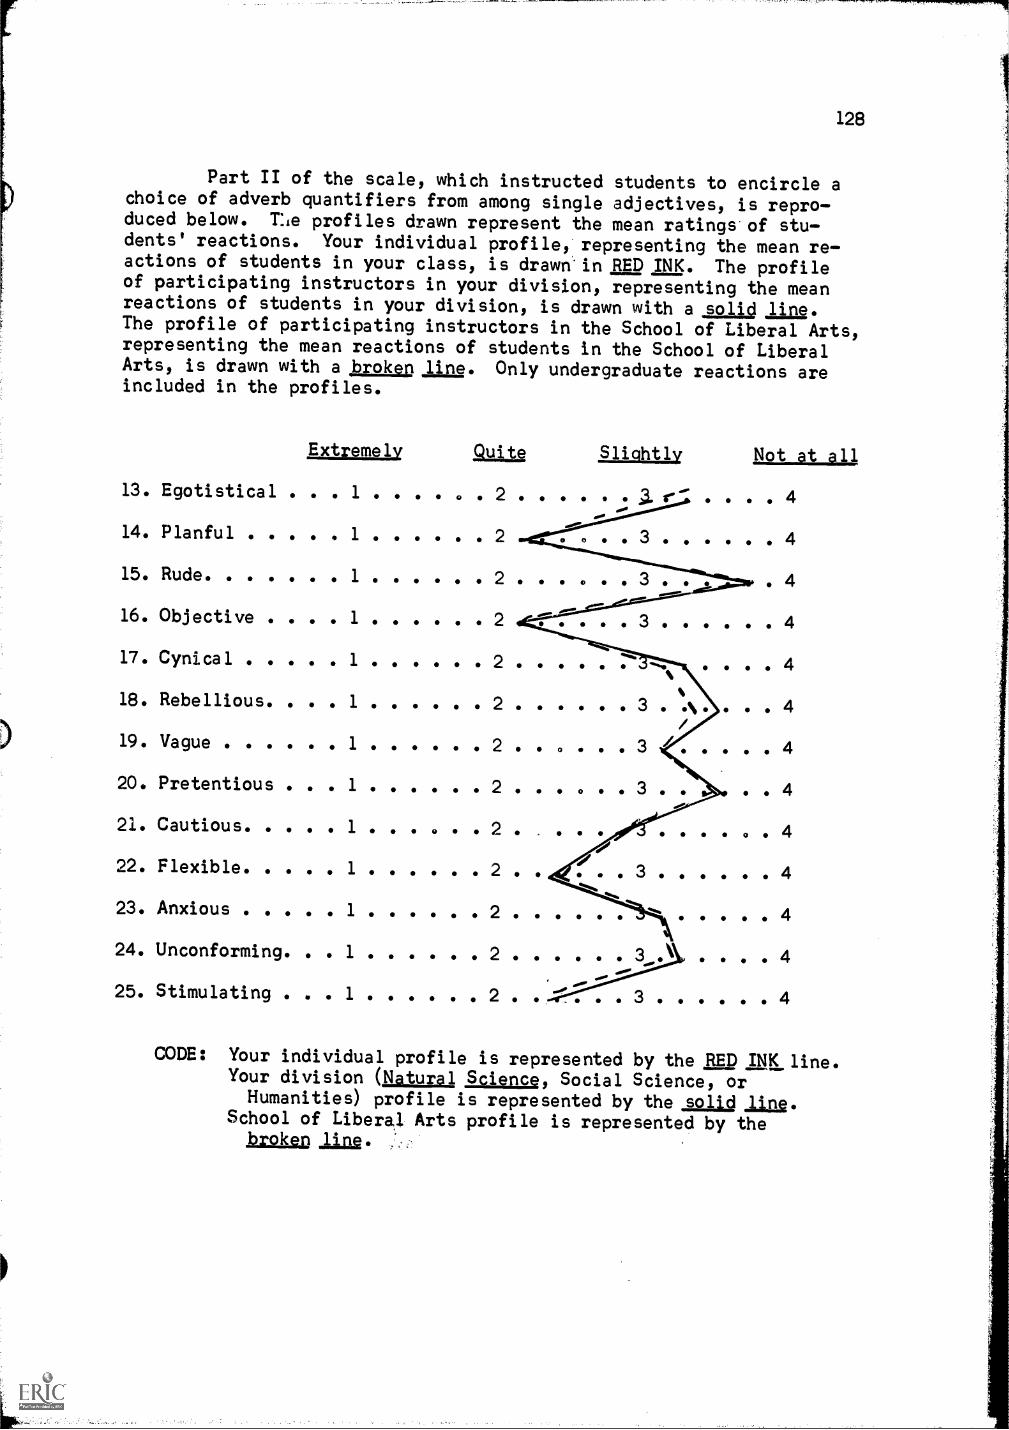
128
Part II of the scale, which instructed students to encircle achoice of adverb quantifiers from among single adjectives, is reproduced below. The profiles drawn represent the mean ratings of students' reactions. Your individual profile, representing the mean reactions of students in your class, is drawn in RED INK. The profileof participating instructors in your division, representing the meanreactions of students in your division, is drawn with a solid line.The profile of participating instructors in the School of Liberal Arts,representing the mean reactions of students in the School of LiberalArts, is drawn with a broken line. Only undergraduate reactions areincluded in the profiles.
Extremely Quite
13. Egotistical 1 . 2
14. Planful 1 2
15. Rude....... 1 ...... 2 .
16. Objective 1 ...... 2
17. Cynical 1 2
18. Rebellious. . . . 1 ...... 2
19. Vague ...... 1 ...... 2 .
20. Pretentious . . . 1 ...... 2 .
21. Cautious 1 2
22. Flexible..... 1 ...... 2 .
23. Anxious 1 2
24. Unconforming. . . 1 ...... 2
25. Stimulating . . 1 ...... 2 .
Slightly Not at all
.00
. . 3 ...... 4
. . . . . 4
3 4
%...... 3 . A. 4/
. . . . . 3 / 4
. . . . . 3 . 4
. . . . . . 4
. . 3 4
4
...... 3 . 4
. . . 3 ...... 4
CODE: Your individual profile is represented by the RED INK line.Your division (Natural Science, Social Science, orHumanities) profile is represented by the ,solid
School of Liberal Arts profile is represented by thebroken 1 ing.
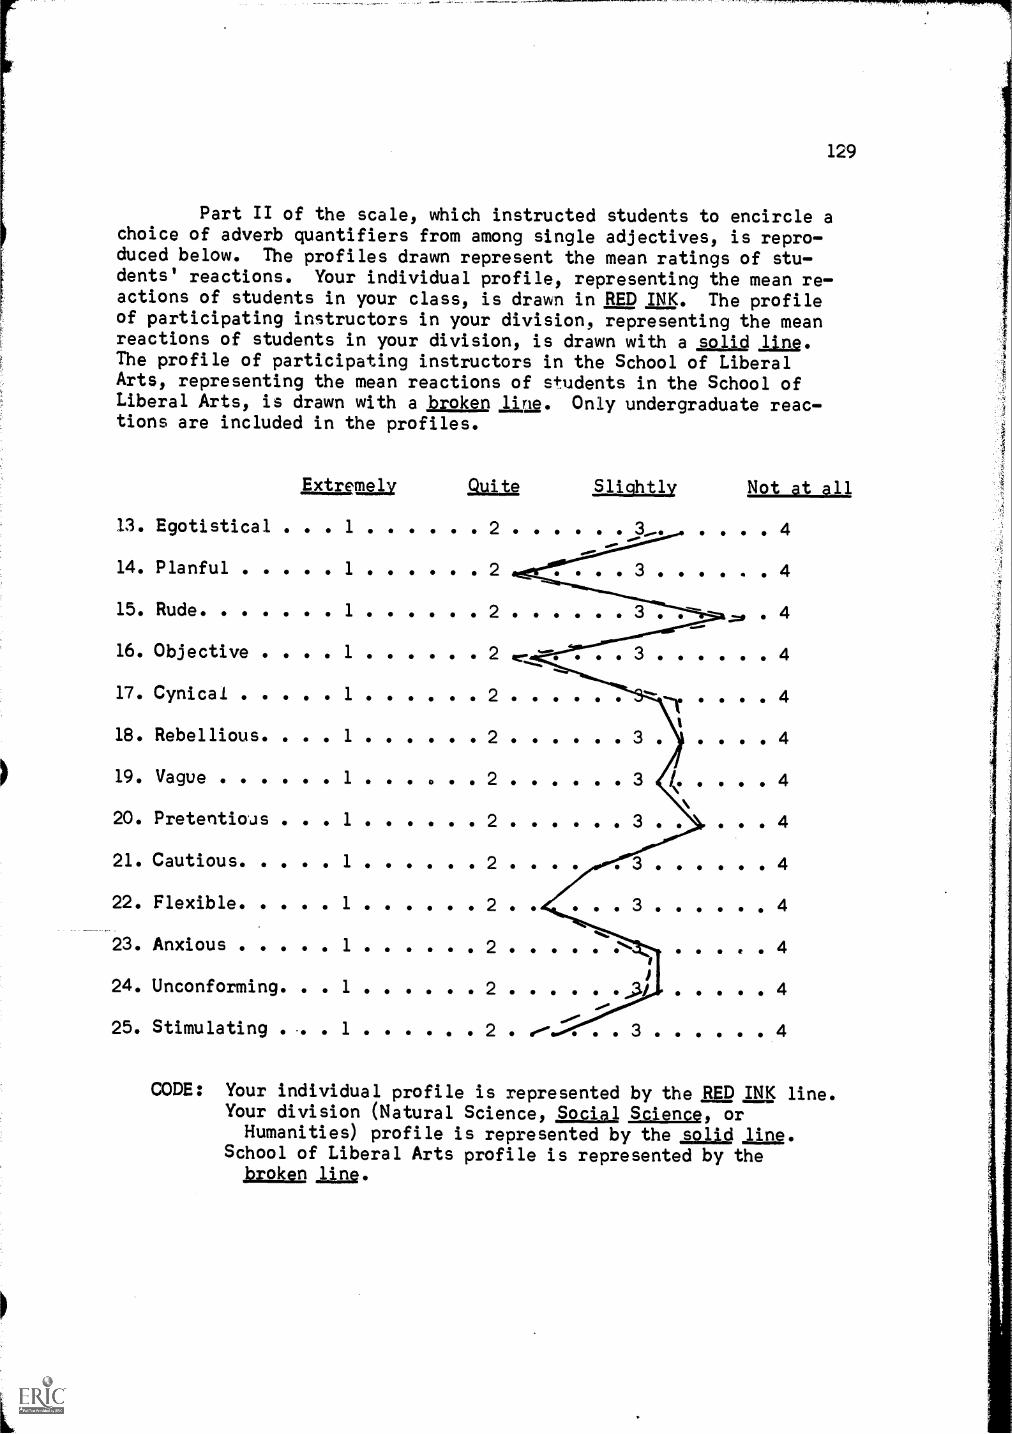
129
Part II of the scale, which instructed students to encircle a
choice of adverb quantifiers from among single adjectives, is reproduced below. The profiles drawn represent the mean ratings of students' reactions. Your individual profile, representing the mean reactions of students in your class, is drawn in RED INK. The profileof participating instructors in your division, representing the meanreactions of students in your division, is drawn with a solid line.The profile of participating instructors in the School of LiberalArts, representing the mean reactions of s+udents in the School ofLiberal Arts, is drawn with a broken line. Only undergraduate reactions are included in the profiles.
E_ xtremgly Quite Slightly Not at all
. 413. Egotistical 1 2
14. Planful 1 2 . .
15. Rude 1 2
16. Objective . . . . 1 ...... 2
17. Cynical 1 2
18. Rebellious. . . . 1 ...... 2 ......19. Vague ...... 1 . . . . . 2 ......20. Pretentioas . . . 1 ...... 2 ......21. Cautious..... 1 ...... 2 .
22. Flexible..... 1 ...... 2 . .
23. Anxious 1 2
24. Unconforming. . . 1 ...... 2 ......25. Stimulating . . . 1 ...... 2 00"
-.
. 3 ...... 4
3 y. 4
...... 4
4
3 . . . . 4
3 f, 4
3 . 4
3 ...... 4
. 3 ...... 4
4I
_3/ 4
3 4
CODE: Your individual profile is represented by the RED INK line.Your division (Natural Science, Social Science, orHumanities) profile is represented by the solid ling.
School of Liberal Arts profile is represented by thebroken ling.

130
Part II of the scale, which instructed students to encircle a
choice of adverb quantifiers from among single adjectives, is reproduced below. The profiles drawn represent the mean ratings of students' reactions. Your individual profile, representing the mean reactions of students in your class, is drawn in RED INK. The profileof participating instructors in your division, representing the meanreactions of students in your division, is drawn with a solid line.The profile of participating instructors in the School of LiberalArts, representing the mean reactions of students in the School ofLiberal Arts, is drawn with a broken line. Only undergraduate reactions are included in the profiles.
Extremely Quite Slightly
13. Egotistical . . . 1 ...... 2
14. Planful 1 2
15. Rude 1 2
16. Objective . . . . 1 ...... 2
17. Cynical ..... 1 ...... 2
18. Rebellious. . . . 1 ...... 2
19. Vague 1 2
20. Pretentious . . . 1 ...... 2
21. Cautious 1 2
22. Flexible..... 1 ...... 2
23. Anxious ..... 1 ...... 2
24. Unconforming. . . 1 ..... . 2
25. Stimulating . . . 1 ......
3
3
. . . . . . 3 .
4
...... 4
4
Not at all
...... 4
4
. 4
3 .0/ A
. . . . . . 3 . .sa . . 4
4
. 3 4
.-- qL 4
...... ot 4
3 ...... 4
CODE: Your individual profile is represented by the RED INK line.Your division (Natural Science, Social Science, orHumanities) profile is represented by the solid Xing.
School of Liberal Arts profile is represented by thebroken line.
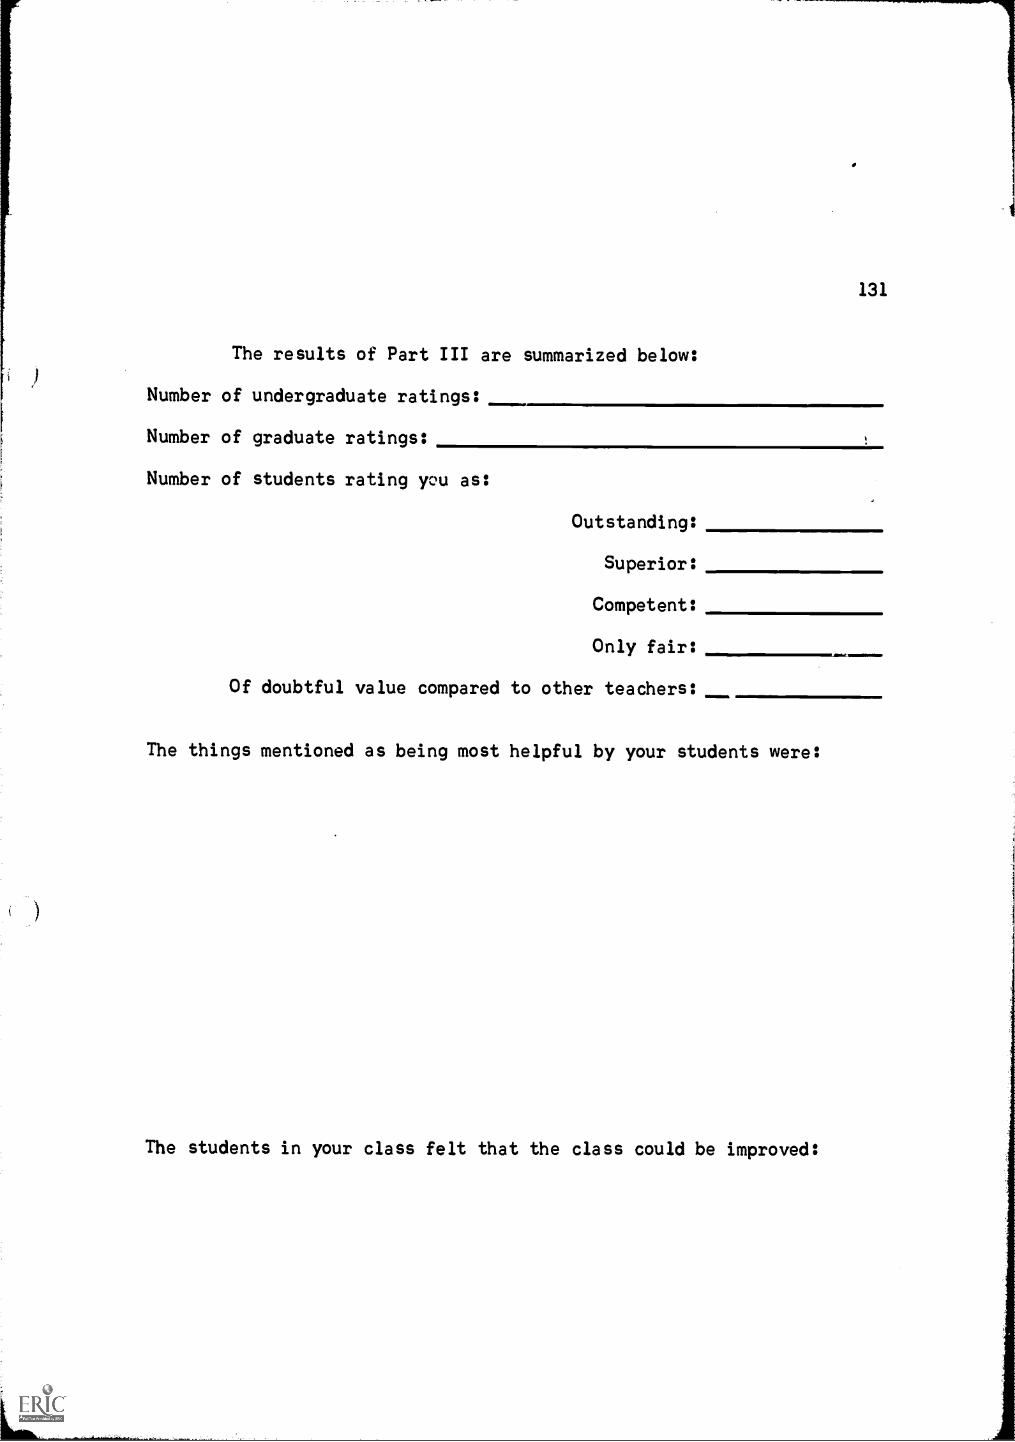
131
The results of Part III are summarized below:
Number of undergraduate ratings:
Number of graduate ratings:
Number of students rating you as:
Outstanding:
Superior:
Competent:
Only fair:
Of doubtful value compared to other teachers:
The things mentioned as being most helpful by your students were:
The students in your class felt that the class could be improved:

APPENDIX VI
NOTE OF ACKNOWLEDGMENT
TO:
FROM: George L. Fahey
DATE:
We thank you for your response to our recent letter related
to a research study of student ratings.
Your interest in the project is appreciated.
132

APPENDIX VII
SECOND TRIMESTER LETTER TO FACULTY
DATE:
TO:
FROM: George L. Fahey, Professor, Psychology and Education,460 Langley Hall
SUBJECT: Second administration of student rating scales to undergraduate Liberal Arts classes
We are making final plans for the second administration of ourstudent rating scales to students in undergraduate Liberal Artsclasses. Since you participated last trimester in the first phase ofthis research project, we are again requesting your participation during the current trimester.
We are administering the rating scale during the latter thirdof this trimester to gather data on scale reliability.
The results of the evaluation will be confidential to theinstructor and will be sent in a sealed envelope as last trimester.
Will you please complete the second page of this letter andreturn it to us via campus mail?
Thank you very much.
133
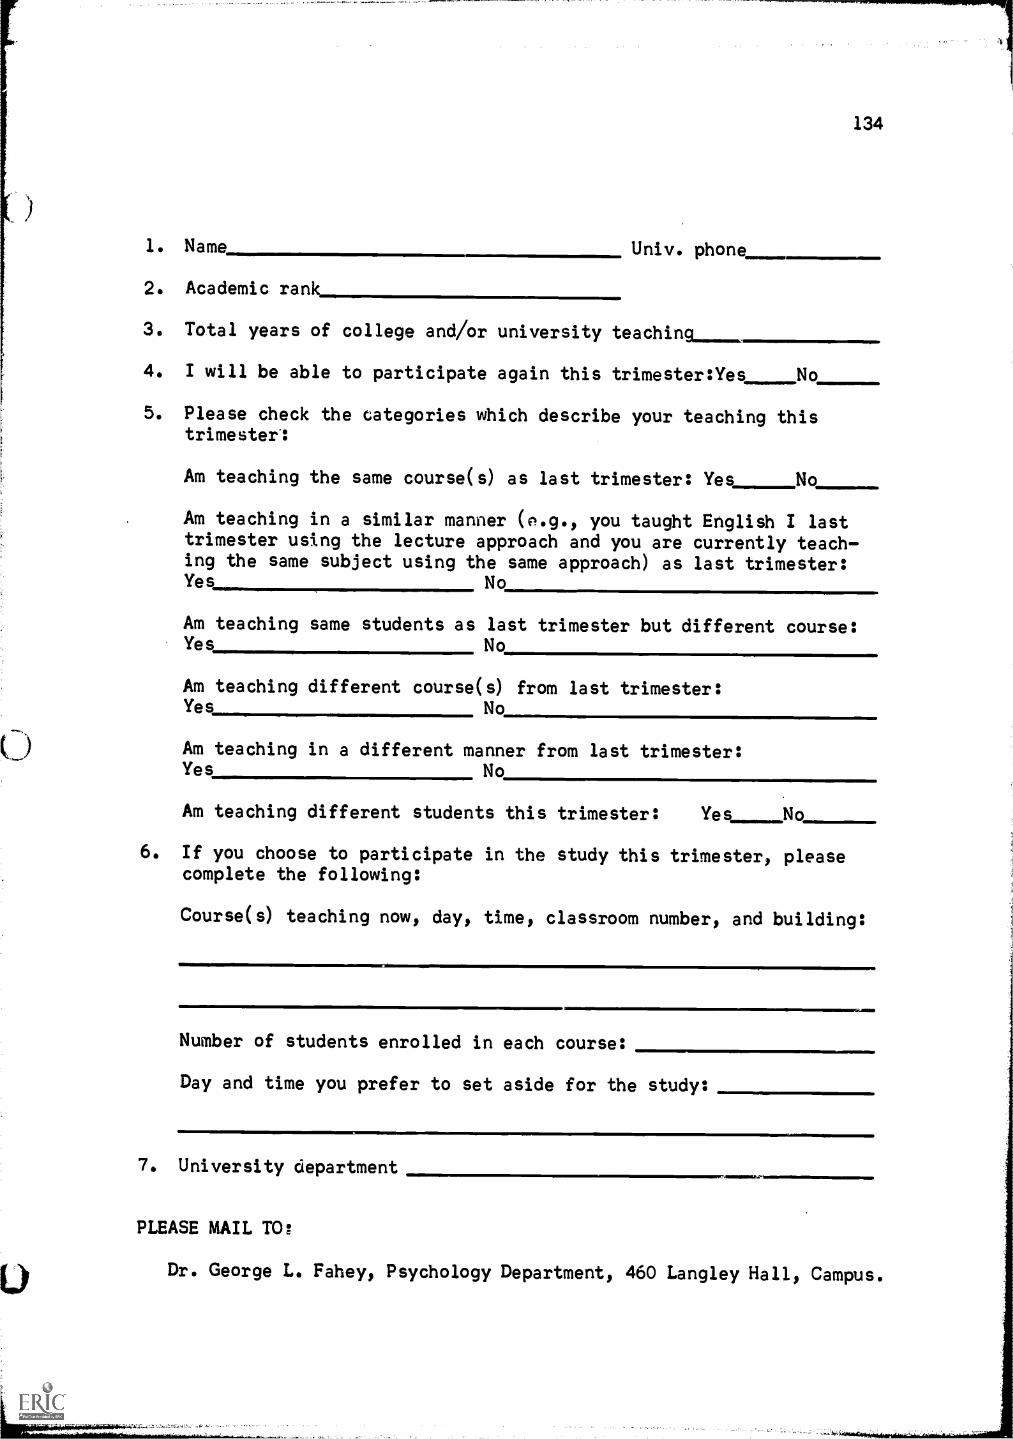
134
1. Name Univ. phone
2. Academic rank
3. Total years of college and/or university teaching
4. I will be able to participate again this trimester:Yes No
5. Please check the categories which describe your teaching thistrimester':
Am teaching the same course(s) as last trimester: Yes No
Am teaching in a similar manner (e.g., you taught English I lasttrimester using the lecture approach and you are currently teaching the same subject using the same approach) as last trimester:Yes No
Am teaching same students as last trimester but different course:Yes No
Am teaching different course(s) from last trimester:Yes No
Am teaching in a different manner from last trimester:Yes No
Am teaching different students this trimester: Yes No
6. If you choose to participate in the study this trimester, pleasecomplete the following:
Course(s) teaching now, day, time, classroom number, and building:
Number of students enrolled in each course:
Day and time you prefer to set aside for the study:
7. University department
PLEASE MAIL TO
Dr. George L. Fahey, Psychology Department, 460 Langley Hall, Campus.

APPENDIX VIII
SECOND TRIMESTER CONFIDENTIAL LETTER TO FACULTY
Confidential
DATE:
TO:
FROM: George L. Fahey, Professor, Psychology and Education,460 Langley Hall
SUBJECT: Results of student ratings
We thank you for the cooperation you gave us last trimester inhelping us to carry out the second phase of our research concernedwith teaching evaluation. Results of the student rating scale whichwas administered to your classare furnished in this letter.
Part I of the rating scale, which instructed students to encircle a choice of adverb quantifiers from among bipolar adjectivessuch as "goodbad," "thickthin," and "bravecowardly," is being subjected to a factor analysis. These results will be available in afinal report which will be sent to you later.

APPENDIX IX
ABSTRACT
A MEASUREMENT OF COLLEGE INSTRUCTOR BEHAVIOR
This study was designed to provide evidence which could serve
two functions: (1) the possible contribution to a theory of college
and university teaching behavior by an improved description of teach
ing, and (2) the provision of inferences for the improvement of teach
ing behavior.
In an attempt to overcome a criticism of student ratings which
holds that the terms used may be ambiguous and subjective, the present
study obtained student ratings of college instructor behavior through
the use of a scale composed of twelve bipolar adjectives from the
Osgood Semantic Differential and thirteen single adjectives from other
research studies.
The hypothesis tested was that college instructor behavior could
be identified and measured by the use of a graphic rating scale when the
rater responded to common, bipolar adjectives. The behaviors would
yield, when subjected to factor analysis, clusters of traits which would
identify subgroups of college instructors.
Pilot study experimentation with the instrument resulted in the
extraction of three factors from Osgood's original list of fifty bipolar
adjectives. The four bipolar adjectives which showed highest loadings
on one of the three factors, making a total of twelve adjectives, plus
the thirteen single adjectives, selected from an original list of forty,
along with an overall global rating of instruction used as the criterion
136

were organized into a rating scale. The scale was administered to
undergraduate liberal arts classes of the same instructors on two oc
casions separated by a time interval of approximately fifteen weeks.
The total sample consisted of 7,060 students who rated 104 instruc
tors representing the Humanities, Natural Science, and Social Science
Divisions of the School of Liberal Arts, University of Pittsburgh.
Ratings, punched on computer cards, were subjected to a mul-
tiple discriminant analysis. Results showed that the three Divisions
of instructors occupied the same area in the 26dimensional space.
With 52 and 14,064 degrees of freedom, the obtained F was
.0062, indicating no significant differences among the means. There
fore, the null hypothesis that there were no significant differences
among the three Divisions was not rejected. The assumption was ac
cepted that the samples represented the same population, not three
separate populations.
Item reliability coefficients revealed that the ratings were
highly consistent. With the exception of two subsamples showing co
efficients of .858 and .888, the remaining 76 coefficients ranged
from .981 to .901.
With few exceptions, the Semantic Differential items did not
serve to distinguish levels )f teaching behavior. Only three bipolar
adjectives out of the twelve showed respectable validity with the cri
terion. Only one of the single adjectives from the thirteen selected
showed respectable validity with the criterion.
A rotated factor analysis of the ratings resulted in the ex
traction of six factors. The three strongest factors were labeled
Professorial Impact, Abrasive Impact, and Sensory Impact. The fourth

138
factor was doubtful and the two remaining factors were not labeled. A
comparison between the factors extracted in this study and other
studies was made.
The fundamental conclusion made on the basis of evidence pre
sented in this study was that students distributed their judgments of
instructors in a markedly reliable manner but the variance observed
did not significantly discriminate between instructors according to
academic division nor did it relate in any appreciable degree to global
estimates of effectiveness. It was concluded that the discriminations
expected are not within the competence of the Osgood scale or of the
single adjcItives listed.
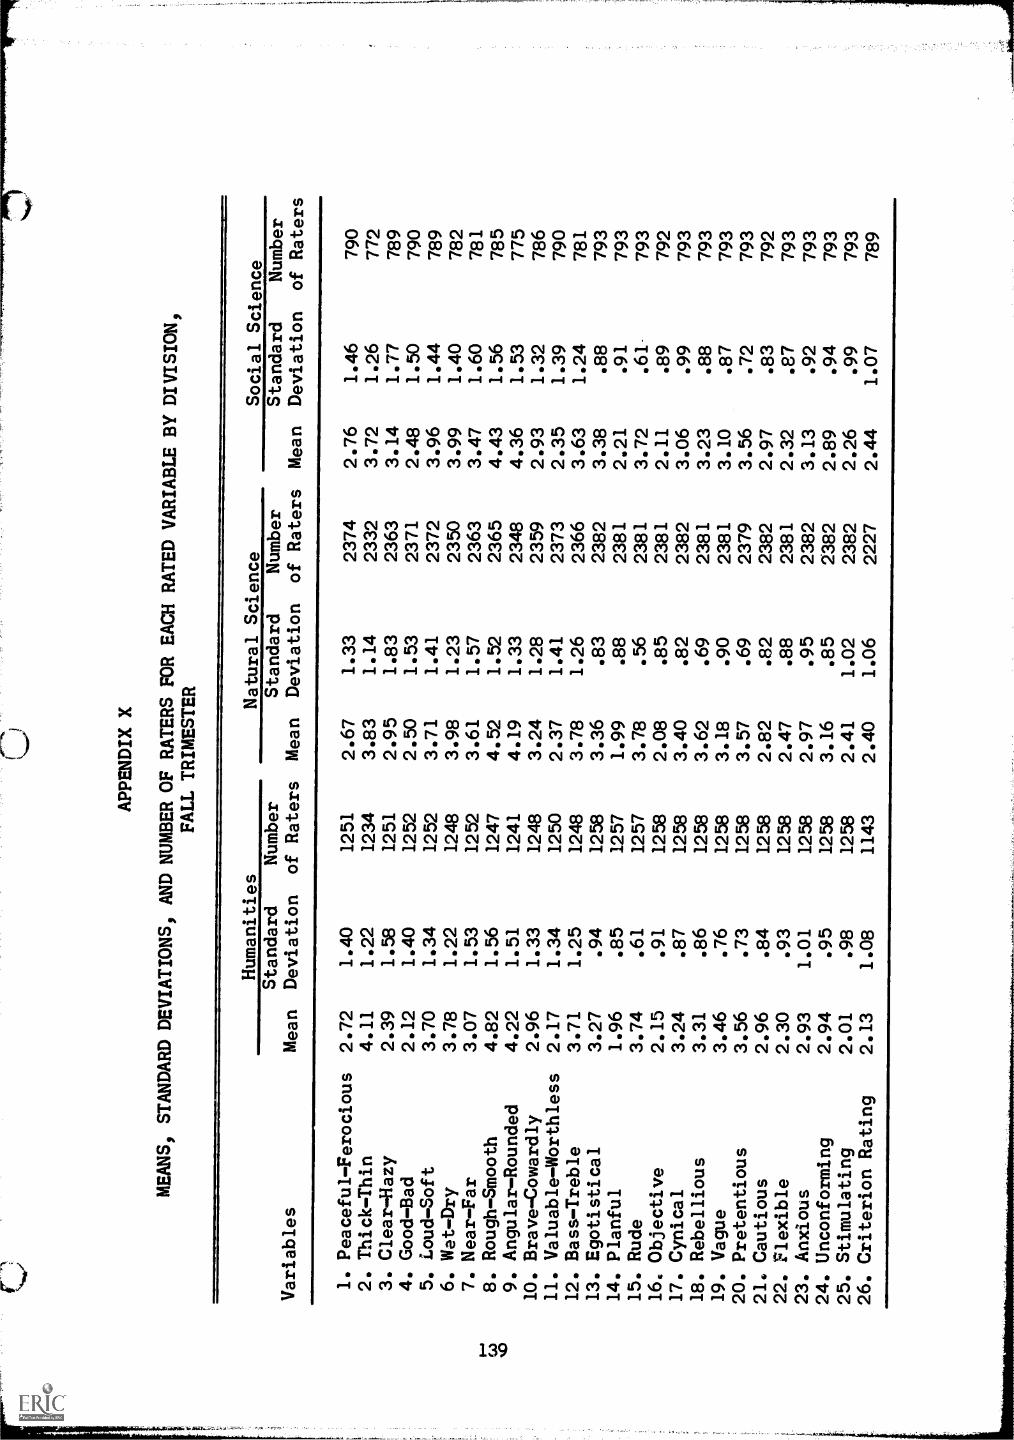
APPENDIX X
MEANS, STANDARD DEVIATIONS, AND NUMBER OF RATERS FOR
EACH RATED VARIABLE BY DIVISION,
FALL TRIMESTER
Variables
Humanities
Natural Science
Social Science
Mean
Standard
Deviation
Number
of Raters
Mean
Standard
Deviation
Number
of Raters
Mean
Standard
Deviation
Number
of Raters
1. Peaceful-Ferocious
2.72
1.40
1251
2.67
1.33
2374
2.76
1.46
790
2. Thick-Thin
4.11
1.22
1234
3.83
1.14
2332
3.72
1.26
772
3. Clear-Hazy
2.39
1.58
1251
2.95
1.83
2363
3.14
1.77
789
4. Good-Bad
2.12
1.40
1252
2.50
1.53
2371
2.48
1.50
790
5. Loud-Soft
3.70
1.34
1252
3.71
1.41
2372
3.96
1.44
789
6. Wet-Dry
3.78
1.22
1248
3.98
1.23
2350
3.99
1.40
782
7. Near-Far
3.07
1.53
1252
3.61
1.57
2363
3.47
1.60
781
voco
.Rough-Smooth
9. Angular-Rounded
4.82
4.22
1.56
1.51
1247
1241
4.52
4.19
1.52
1.33
2365
2348
4.43
4.36
1.56
1.53
785
775
10. Brave-Cowardly
2.96
1.33
1248
3.24
1.28
2359
2.93
1.32
786
11. Valuable-Worthless
2.17
1.34
1250
2.37
1.41
2373
2.35
1.39
790
12. Bass-Treble
3.71
1.25
1248
3.78
1.26
2366
3.63
1.24
781
13. Egotistical
3.27
.94
1258
3.36
.83
2382
3.38
.88
793
14. Planful
1.96
.85
1257
1.99
.88
2381
2.21
.91
793
15. Rude
3.74
.61
1257
3.78
.56
2381
3.72
.61-
793
16. Objective
2.15
.91
1258
2.08
.85
2381
2.11
.89
792
17. Cynical
3.24
.87
1258
3.40
.82
2382
3.06
.99
793
18. Rebellious
3.31
.86
1258
3.62
.69
2381
3.23
.88
793
19. Vague
3.46
.76
1258
3.18
.90
2381
3.10
.87
793
20. Pretentious
3.56
.73
1258
3.57
.69
2379
3.56
.72
793
21. Cautious
2.96
.84
1258
2.82
.82
2382
2.97
.83
792
22. Flexible
2.30
.93
1258
2.47
.88
2381
2.32
.87
793
23. Anxious
2.93
1.01
1258
2.97
.95
2382
3.13
.92
793
24. Unconforming
2.94
.95
1258
3.16
.85
2382
2.89
.94
793
25. Stimulating
2.01
.98
1258
2.41
1.02
2382
2.26
.99
793
26. Criterion Rating
2.13
1.08
1143
2.40
1.06
2227
2.44
1.07
789

1.
Peaceful-Ferocious
2.
Thick-Thin
3.
Clear -Hazy
4.
Good-Bad
5.
Loud -Soft
6.
Wet-Dry
7.
Near Far
8.
Rough-Smooth
9.
Angular-Rounded
10.
Brave-Cowardly
11.
Valuable-Worthless
12.
Bass-Treble
13.
Egotistical
14.
Planful
15.
Rude
16.
Objective
17.
Cynical
18.
Rebellious
19.
Vague
20.
Pretentious
21.
Cautious
22.
Flexible
23.
Anxious
24.
Unconforming
25.
Stimulating
26.
Criterion Rating
CORRELATION MATRIX REPRESENTING RATINGS R)R HUMANITIES DIVISION
-77
12
34
56
78
910
11
12
13
14
15
16
17
18
19
20
21
2%
23
24
25
26
-.017
.108
.089
-.314
-.054
.064
-.268
-.153
-.071
.065
-.044
-.290
.089
-.198
.074
-.221
-.349
-.028
-.176
.206
.106
-.016
-.185
-.034
-.001
-.062
-.042
.024
.087
-.059
.061
-.021
.023
-.035
.077
.053
-.090
.118
-.081
.022
-.006
.085
.096
-.038
-.041
-.015
.016
-.051
-.042
.684
.141
.152
.486
-.259
-.171
.340
.580
.147
-.228
.395
-.243
.316
-.177
-.025
-.614
-.266
-.024
.343
.024
-.006
.538
.507
.171
.242
.528
-.250
-.223
.421
.752
.166
-.273
.344
-.261
.306
-.192
.029
-.528
-.337
-.066
.432
.028
.047
.687
.626
.176
.160
.187
.098
.192
.145
.226
.126
.061
.198
.029
.135
.211
-.117
.088
-.171
.026
.096
.124
.155
.215
.262
-.063
-.073
.195
.223
.064
-.013
.013
.005
.038
-.007
.106
-.115
-.040
-.097
.170
.054
.058
.240
.202
-.210
-.210
.366
.485
.121
-.226
.286
-.206
.242
-.147
.042
-.399
-.232
-.051
.358
.080
.063
.463
.434
.360
-.161
-.229
.053
.121
-.203
.215
-.180
.124
.112
.207
.148
-.062
-.250
.021
.002
-.214
-.162
-.141
-.210
.021
.163
-.142
.170
-.140
.151
.102
.175
.115
-.037
-.208
.001
.028
-.168
-.174
.452
.180
-.012
.223
-.073
.210'
-.042
.223
-.271
-.0c6
-.126
.289
.024
.191
.452
.349
.196
-.252
.362
-.154
.332
-.185
.009
-.503
-.337
-.062
.416
-.003
.037
.691
.615
.033
.045
.102
.019
.075
.110
-.084
-.003
-.122
.053
.011
.107
.159
.190
-.125
.381
-.164
.453
.337
.270
.474
-.071
-.210
.022
.205
-.150
-.192
-.248
.345
-.164
-.057
-.312
-.141
.064
.228
.065
-.040
.313
.315
-.251
.400
.271
.226
.348
-.074
-.246
.031
.197
-.184
-.113
-.148
-.054
-.260
-.168
.074
.314
.046
.002
.312
.227
.399
.209
.360
-.115
-.148
-.011
.212
-.112
-.09C
.082
.235
-.164
.015
.099
.434
.151
.090
.323
.092
-.272
.033
.056
-.429
-.433
.030
-.199
.074
.154
-.210
-.211
.009
.208
-.138
-.086
-.088
.060
.108
.452
.349
.109
.058
.042
.174
.086
.613
1111
1011
1 '-g

APPENDIX XII
CORRELATION MATRIX REPRESENTING RATINGS FOR NATURAL SCIENCE DIVISION
Variables
12
34
56
78
910
.11
12
13
14
15
Di
17
18
19
20
21
22
23
24
25
26
1.
Peaceful- Ferocious
2.
Thick-Thin
3.
Clear -Hazy
4.
Good-Bad
5.
Loud -Soft
6.
Met-Dry
7.
Near-Far
8.
Rough-Smooth
9. Angular-Rounded
10.
Brave-Cowardly
11.
Valuable - Worthless
12.
Bass-Treble
13.
Egotistical
14.
Planful
15.
Rude
16.
Objective
17.
Cynical
D3.
Rebellious
19.
Vague
20.
Pretentious
21.
Cautious
22.
Flexible
23.
Anxious
24. Unconforming
25.
Stimulating
26.
Criterion Rating
-.090
.175
.170
-.235
.019
.170
-.265
-.117
-.054
.161
-.132
-.308
.105
-.308
.057
-.320
-.272
-.100
-.134
.234
.156
.022
-.113
.119
.078
-.178
-.156
.052
.053
-.141
.l'2
.069
-.003
-.127
.120
.134
-.114
.096
-.093
.097
.034
.185
.093
-.058
-.097
.006
.032
-.133
-.106
.780
.207
.237
.549
-.348
-.222
.264
.651
.104
-.240
.476
-.272
.350
-.216
-.091
-.714
-.265
.098
.383
-.014
-.097
.627
,562
.214
.255
.540
-.357
-.236
.342
.778
.132
-.255
.491
-.335
.377
-.231
-.096
-.669
-.292
.097
.423
.014
-.065
.683
.644
.138
.131
.092
.028
.271
.171
.284
.088
.160
.038
.110
.102
.114
-.164
.009
-.061
.095
.D91
.039
.190
.174
.289
-.085
-.098
.159
.225
.112
-.072
.133
-.092
.060
-.063
.022
-.208
-.065
.003
.161
.011
.024
.263
.212
-.288
-.210
.250
.514
.090
-.265
.3'6
-.283
-.218
-.088
-.489
-.240
.121
.380
.016
-.062
.501
.400
.342
-.087
-.319
.104
.213
-.263
.2'0
-.169
.219
.175
.323
.203
-.107
-.242
.063
.100
-.293
-.279
-.052
-.215
.017
.140
-.161
.148
-.112
.158
.095
.217
.139
-.056
-.194
.009
.049
-.201
-.180
.384
.238
-.064
.252
-.103
.206
-.035
.087
-.242
-.116
-.051
.253
.011
.099
.324
.294
.130
-.273
.464
-.349
.376
-.250
-.123
-.611
-.312
.098
.429
.013
-.069
.661
.609
.065
.093
-.019
.097
.131
.062
-.096
-.021
-.090
.107
.001
.065
.128
.113
-.123
.428
-.119
.494
.363
.280
.395
-.084
-.238
.083
.221
-.194
-.179
-.178
.353
-.118
-.055
-.427
-.166
.134
.261
.041
-.029
.447
.440
-.152
.463
.321
.295
.336
-.085
-.258
.044
.169
-.287
-.215
-.084
-.030
-.321
-.170
.087
.293
.010
-.009
.371
.331
.427
.247
.357
-.101
-.192
.063
.277
-.180
-.157
.149
.222
-.107
-.028
.089
.382
.011
-.021
.335
-.054
-.333
.056
.155
-.564
-.519
-.008
-.184
.083
.166
-.243
-.203
.091
.189
-.075
.081
.059
.058
.037
.482
.353
.081
.033
.017
.030
-.005
.591
N = 3780.

APPENDIX XIII
CORRELATION MATRIX REPRESENTING RATINGS FOR SOCIAL SCIENCE DIVISION
Variables
12
34
56
78
910
11
12
13
14
15
16
17
18
19
20
21
22
23
24
25
1.
Peaceful-Ferocious
2.
Thick-Thin
-.093
3.
Clear-Hazy
-.028
.009
4.
Good-Bad
-.062
.037
.629
5.
Loud-Soft
-.345
.172
.239
.311
6.
Net-Dry
-.178
.190
.270
.360
.338
7.
Near-Far
-.036
.068
.525
.478
.272
.394
8.
Rough-Smooth
-.235
.091 -.275 -.297
.109-.056-.238
9.
Angular- Rounded
.014-.105 -.182 -.160
-.046-.126-.204
.265
10.
Brave-Cowardly
-.153
.102
.237
.391
.259
.255
.294-.091-.065
11.
Valuable-Worthless
-.046
.016
.543. .758
.246
.336
.454-.320
-.173
.429
12.
Bass-Treble
-.045
.203
.146
.122
.227
.191
.184
.018--.046
.207
.127
13.
Egotistical
-.292
.124 -.143 -.170
.168
.032-.118
.211
.021
.045-.202
.039
14.
Planful
.094-.001
.400
.374
.078
.092
.283-.256-.084
.165
.356
.037-.108
15.
Rude
-.329
.138 -.107 -.161
.192
.025-.086
.229
.051
.013-.214
.068
.527-.089
16.
.080-.024
.254
.254
.053
.101
.199-.151
.020
.143
.283
.027-.174
.262
-.161
17.
_Objective
Cynical
-.362
.113' -.036 -.052
.181
.043
.010
.192-.021
.107-.093
.164
.469-.096
.456-.115
18.
Rebellious
-.305
.095
.099
.120
.150
.148
.073
.051-.059
.258
.088
.107
.317-.001
.262-.067
.520
19.
Vague
.045
.043 -.660 -.566-.216-.300-.477
.267
.151-.241
-.556-.067
.156-.394
.139-.231
.070 -.037
20.
Pretentious
-.133
.095 -.154 -.198
.083-.009
-.114
.179
.060-.026
-.236
.043
.410-.129
.316-.094
.304
.194
.250
21.
Cautious
.285-.123 -.048 -.098
-.186-.158-.084-.045
.067-.132-.055
-.089-.139
.066-.162
.093-.216 -.196
.080-.015
22.
Flexible
.031
.011
.225
.307
.055
.131
.230-.207-.120
.194
.316
.078-.184
.158-.192
.234-.038
.031-.220
-.161
.011
23.
Anxious
-.034
.032 -.027
.029
.050
.073-.007
.081
.056
.064
.017-.013
.062
.024
.045
.047-.006
.074
.067
.062
.135
.033
24.
Unconforming
-.194
.114
.030
.093
.089
.112
.010
.058
-.071
.204
.080
.077
.259
.002
.170-.030
.352
.513
.030
.142-.136
.082
.074
25.
Stimulating
-.140
.066
.560
.729
.337
.377
.497-.226
-.163
.417
.694
.134-.089
.380-.098
.262
.026. .168-.519-.131
-.116
.328
.067
.186
26.
Criterion Rating
-.084
.016
.495
.667
.255
.286
.365
-.242
-.150
.291
.601
.107-.111
.342-.094
.243-.029
.129-.470-.149
-.082
.286
.016
.111
.672
26
N = 1200

APPENDIX XIV
UNNORMALIZED ROTATED FACTOR LOADING MATRIX
FOR HUMANITIES DIVISION
Variables
Factors
Communality
III
III
IV
VVI
1. Peaceful-Ferocious
.374
.103
-.043
-.164
-.234
.500
.695
2. Thick-Thin
-.093
.699
-.038
-.033
-.132
.084
.724
3. Clear -Hazy
.232
-.073
.745
.007
-.191
.014
.807
4. Good-Bad
.269
.043
.816
.027
.014
.000
.861
5. Loud-Soft
-.244
.163
.333
-.034
-.072
-.563
.721
6. Wet-Dry
.048
.484
.290
-.062
.360
-.070
.677
7. Near-Far
.213
.081
.635
-.073
.139
.011
.693
8. Rough-Smooth
-.105
.054
-.300
-.021
-.017
-.707
.778
9. Angular-Rounded
-.131
-.153
-.256
-.002
-.052
-.586
.672
10. Brave-Cowardly
-.088
.072
.612
.056
.186
.037
.653
11. Valuable-Worthless
.255
.030
.797
.047
-.007
-.000
.838
12. Bass-Treble
-.176
.326
.322
.066
-.308
-.204
.618
13. Egotistical
-.764
-.048
-.106
.017
-.069
.010
.776
14. Planful
.110
-.332
.500
-.189
-.309
.091
.715
15. Rude
-.614
.256
-.147
.022
-.112
-.156
.709
16. Objective
.157
-.343
.426
-.200
-.068
.111
.617
17. Cynical
-.723
-.032
-.036
.120
-.031
-.007
.735
18. Rebellious
-.615
-.079
.220
.040
.410
-.154
.791
19. Vague
-.314
.107
-.611
-.155
.164
.060
.734
20. Pretentious
-.679
.049
-.199
-.176
-.124
.069
.745
21. Cautious
.113
-.102
-.131
-.696
-.198
.183
.773
22. Flexible
.202
-.034
.510
-.127
.306
.208
.675
23. Anxious
-.065
.036
.070
-.779
.189
-.160
.824
24. Unconforming
-.451
-.049
.206
-.012
.519
.016
.720
25. Stimulating
.095
-.022
.794
-.001
.165
-.004
.816
26. Criterion Rating
.113
.052
.740
.021
-.016
-.079
.755
Proportion of total
variance extracted
.2264
.1006
.3772
.0827
.0899
.1231
100.00
129envalues
6.141
3.107
1.456
1.252
1.161
1,052
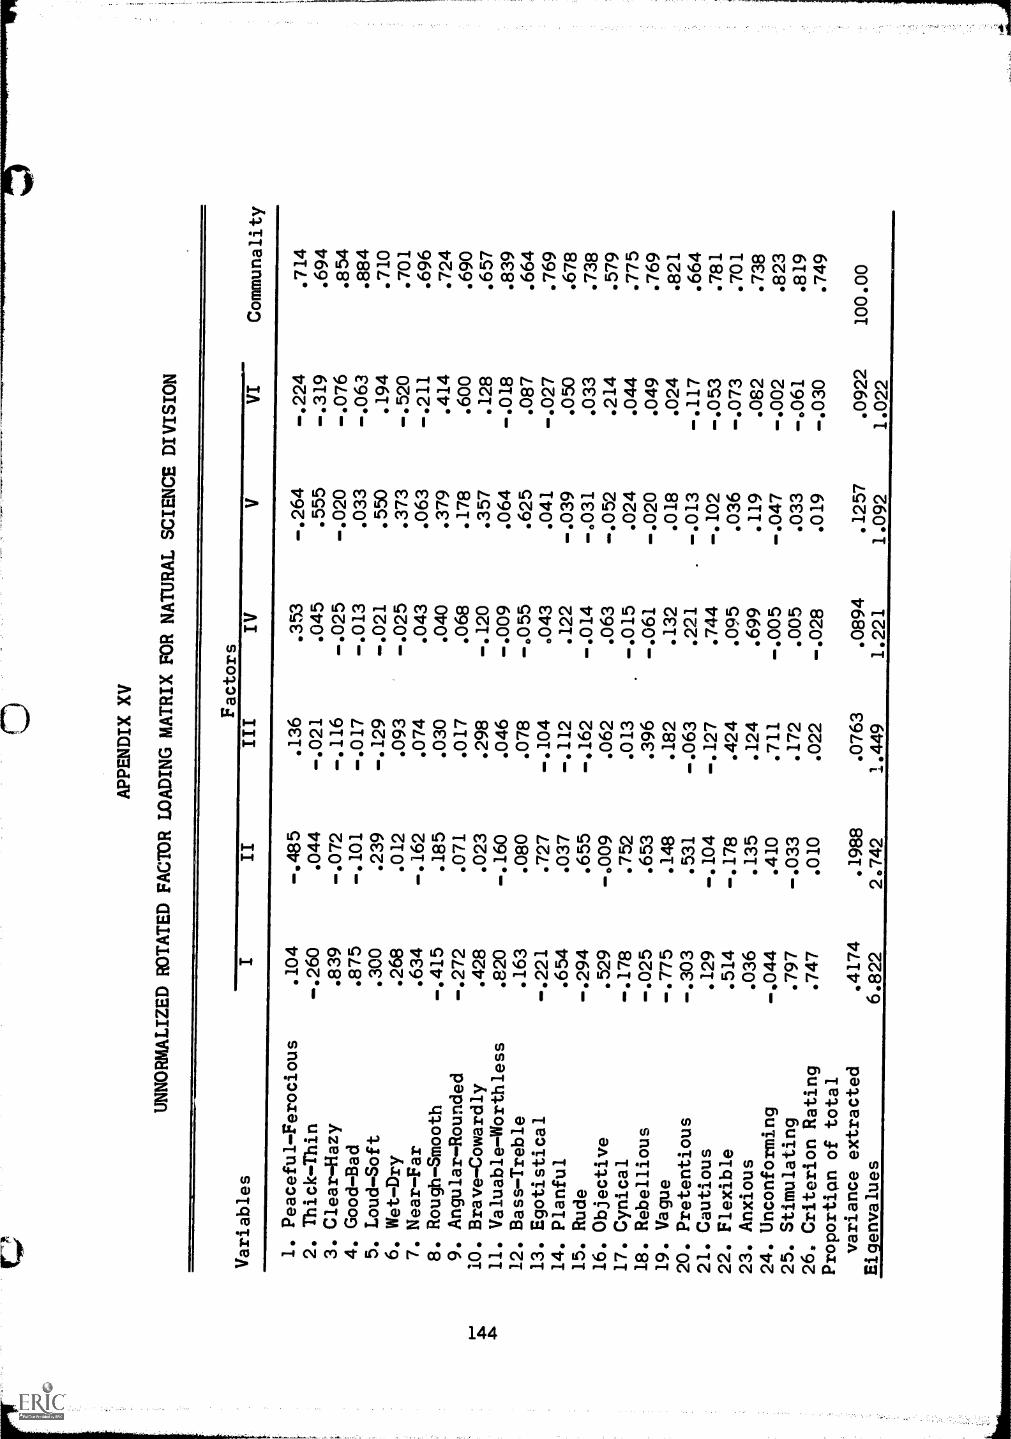
APPENDIX XV
UNNORMALIZED ROTATED FACTOR LOADINGMATRIX FOR NATURAL SCIENCE DIVISION
Variables
Factors
Communality
III
III
IV
VVI
1. Peaceful-Ferocious
.104
-.485
.136
.353
-.264
-.224
.714
2. Thick-Thin
-.260
.044
-.021
.045
.555
-.319
.694
3. Clear-Hazy
.839
-.072
-.116
-.025
-.020
-.076
.854
4. Good-Bad
.875
-.101
-.017
-.013
.033
-.063
.884
5. Loud-Soft
.300
.239
-.129
-.021
.550
.194
.710
6. Wet-Dry
.268
.012
.093
-.025
.373
-.520
.701
7. Near-Far
.634
-.162
.074
.043
.063
-.211
.696
8. Rough-Smooth
-.415
.185
.030
.040
.379
.414
.724
9. Angular-Rounded
-.272
.071
.017
.068
.178
.600
.690
1-.
10. Brave-Cowardly
.428
.023
.298
-.120
.357
.128
.657
411. Valuable-Worthless
.820
-.160
.046
-.009
.064
-.018
.839
12. Bass-Treble
.163
.080
.078
-.055
.625
.087
.664
13. Egotistical
-.221
.727
-.104
.043
.041
-.027
.769
14. Planful
.654
.037
-.112
.122
-.039
.050
.678
15. Rude
-.294
.655
-.162
-.014
-.031
.033
.738
16. Objective
.529
-.009
.062
.063
-.052
.214
.579
17. Cynical
-.178
.752
.013
-.015
.024
.044
.775
18. Rebellious
-.025
.653
.396
-.061
-.020
.049
.769
19. Vague
-.775
.148
.182
.132
.018
.024
.821
20. Pretentious
-.303
.531
-.063
.221
-.013
-.117
.664
21. Cautious
.129
-.104
-.127
.744
-.102
-.053
.781
22. Flexible
.514
-.178
.424
.095
.036
-.073
.701
23. Anxious
.036
.135
.124
.699
.119
.082
.738
24. Unconforming
-.044
.410
.711
-.005
-.047
-.002
.823
25. Stimulating
.797
-.033
.172
.005
.033
-.061
.819
26. Criterion Rating
.747
.010
.022
-.028
.019
-.030
.749
Proportign of total
variance extracted
.4174
.1988
.0763
.0894
.1257
.0922
100.00
Eigenvalues
6.822
2.742
1.449
1.221
1.092
1.022
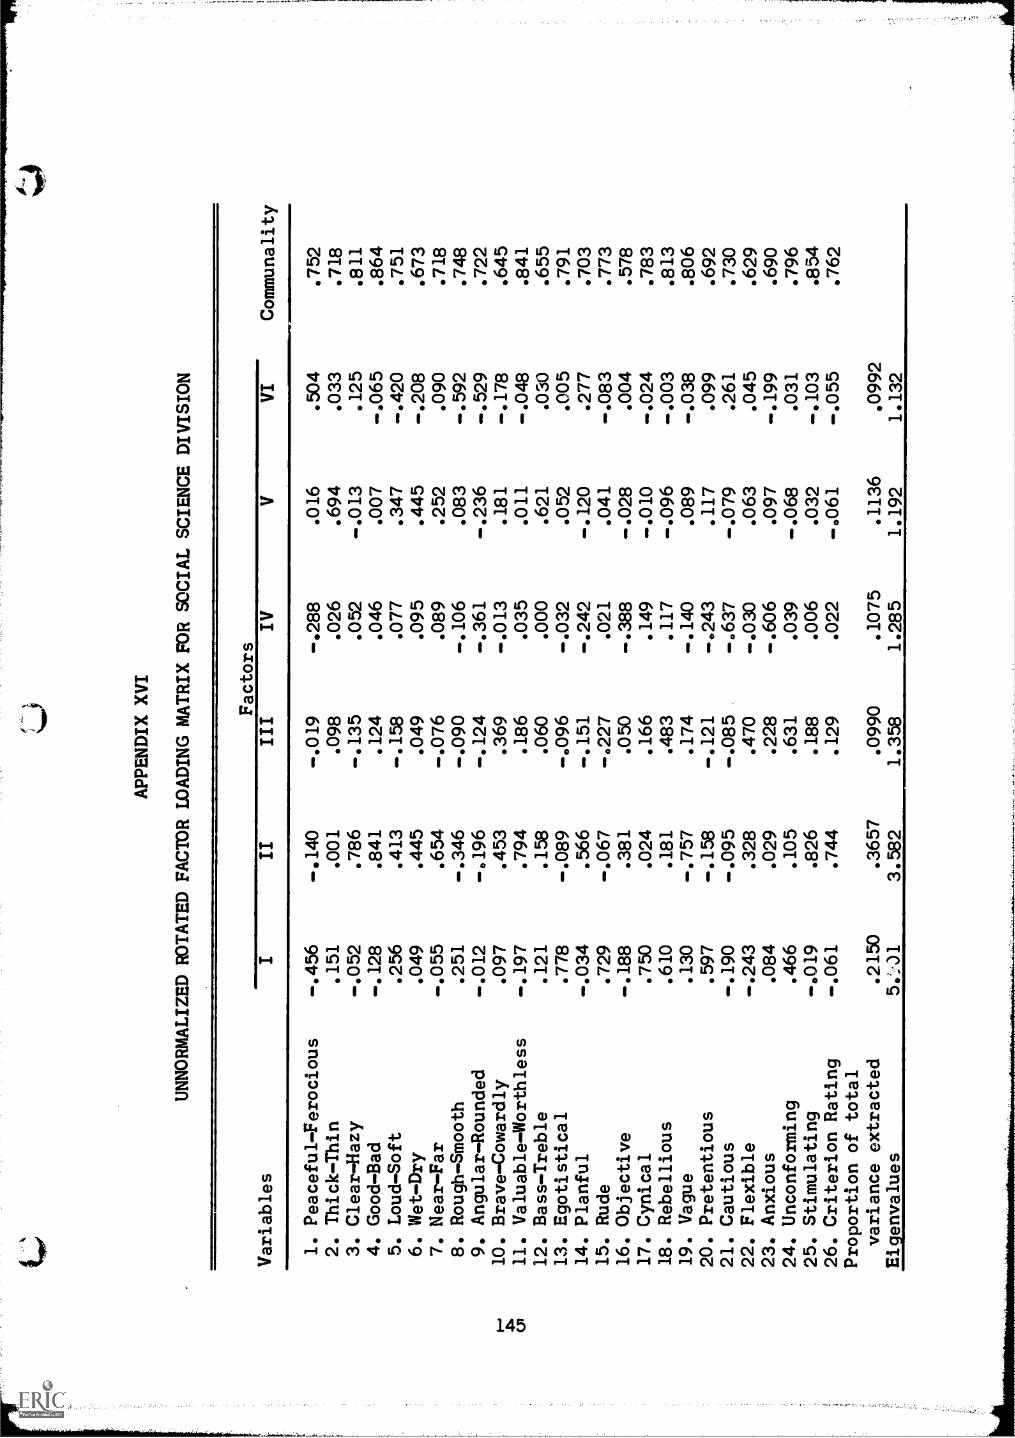
APPENDIX XVI
UNNORMALIZED ROTATED FACTOR LOADING MATRIX FOR SOCIAL SCIENCE DIVISION
Variables
Factors
Communality
II
III
IV
VVI
1. Peaceful-Ferocious
-.456
-.140
-.019
-.288
.016
.504
.752
2. Thick-Thin
.151
.001
.098
.026
.694
.033
.718
3. Clear-Hazy
-.052
.786
-.135
.052
-.013
.125
.811
4. Good-Bad
-.128
.841
.124
.046
.007
-.065
.864
5. Loud-Soft
.256
.413
-.158
.077
.347
-.420
.751
6. Wet-Dry
.049
.445
.049
.095
.445
-.208
.673
7. Near-Far
-.055
.654
-.076
.089
.252
.090
.718
8. Rough-Smooth
.251
-.346
-.090
-.106
.083
-.592
.748
9. Angular-Rounded
-.012
-6196
-.124
-.361
-.236
-.529
.722
I-
4:.
cn
10. Brave-Cowardly
11. Valuable-Worthless
.097
-.197
.453
.794
.369
.186
-.013
.035
.181
.011
-.178
-.048
.645
.841
12. Bass-Treble
.121
.158
.060
.000
.621
.030
.655
13. Egotistical
.778
-.089
-.096
-.032
.052
.005
.791
14. Planful
-.034
.566
-.151
-.242
-.120
.277
.703
15. Rude
.729
-.067
-.227
.021
.041
-.083
.773
16. Objective
-.188
.381
.050
-.388
-.028
.004
.578
17. Cynical
.750
.024
.166
.149
-.010
-.024
.783
18. Rebellious
.610
.181
.483
.117
-.096
-.003
.813
19. Vague
.130
-.757
.174
-.140
.089
-.038
.806
20. Pretentious
.597
-.158
-.121
-.243
.117
.099
.692
21. Cautious
-.190
-.095
-.085
-.637
-.079
.261
.730
22. Flexible
-.243
.328
.470
-.030
.063
.045
.629
23. Anxious
.084
.029
.228
-.606
.097
-.199
.690
24. Unconforming
.466
.105
.631
.039
-.068
.031
.796
25. Stimulating
-.019
.826
.188
.006
.032
-.103
.854
26. Criterion Rating
-.061
.744
.129
.022
-.061
-.055
.762
Proportion of total
variance extracted
.2150
.3657
.0990
.1075
.1136
.0992
Ei envalues
5.'...31
3.582
1.358
1.285
1.192
1.132

BIBLIOGRAPHY

References to Chapters I, II, and III
Allport, Gordon W. "How Shall We Evaluate Teaching?" A Handbook forCollege Teachers. An Informal Guide. Edited by Bernice BrownCronkhite. Cambridge, Massachusetts: Harvard University Press,1950, pp. 36-56.
Anastasi, Anne. "Some Current Developments in the Measurement andInterpretation of Test Validity," Proceedings of the 1963 Invitational Conference on Testing Problems. Princeton, New Jersey:Educational Testing Service, 1964, pp. 33-45.
Armentrout, W. D. "Improving College Teaching by Consulting the Consumer," School Executives Magazine, LI (July, 1932), 476-77.
Bare, Roderick Hughes. "Bias as Related to Rater Contacts," Dissertation Abstracts, XX (1959-60), 2883-84.
Beaumont, Henry. "The Measurement of Teaching," The Journal ofHighex Education, IX (February, 1938), 96.
"A Suggested Method for Measuring the Effectiveness ofTeaching Introductory Courses," The Journal of EducationalPsychology, XXIX (November, 1938), 607-12.
Bendigi A. W. "The Relation of Level of Course Achievement to Students' Instructor and Course Ratings in Introductory Psychology,"Educational and Psychological Measurement, XIII (Autumn, 1953),437-38.
Bogardus, Emory S. "Behavior Patterns of College Teachers,"Sociology and Social Research, XXX (JulyAugust, 1946), 484-90.
Bohannon, C. D. "Improvement of College Instruction," Phi Delta Kapopn,X (April, 1928), 161-73.
Bousfield, W. A. "An Empirical Study of the Production of AffectivelyToned Items," The Journal of General Psychology, XXX (second half;April, 1944), 205-15.
Bradshaw, Francis F. "Revising Rating Techniques," Personnel Journal,X (June, 1931 to April, 1932), 232-45.
Brandenburg, G. C., and Remmers, H. H. "Rating Scales for Instructors,"Educational Administration and Supervision, XIII (September, 1927),399-406.
Brannon, C. H. "Professors Are Poor Teachers," School and Society,XLVII (April 30, 1938), 576-77.
Brearley, H. C. "College Classroom Teaching--Problems and Procedures,"Peabody Journal of Education, XXXVII (July, 1959), 66-76.
147

148
Breed, Frederick S. "A Guide for College Teaching," School and Society,XXIV (July 17, 1926), 82-87.
Buch, Robert Nelson. "A Study of StudentTeacher Relationships,"Journal of Educational Research, XXXV (May, 1942), 645-56.
Buxton, Claude E. "The Pros and Cons of Training for College Teachers of Psychology," American Psychologist, IV (October, 1949),414-17.
ByrneS, Francis C., and Jamrich, John X. "Survey of Policies and Practices Relating to Improved Instruction," Improvement of Instructionin Higher Education. A Report by the Subcommittee on Improvementof Instruction of the Committee on Studies. Washington, D. C.:The American Association of Colleges for Teacher Education, 1962,pp. 19-22.
Cammarosano, Joseph R., and Santopolo, Frank A. "Teaching Efficiencyand Class Size," School and Society, LXXXVI (September 27, 1958),338-41.
Chamberlin, Dean, Chamberlin, Enid, Drought, Neal E., and Scott,William E. Did They Succeed in College? New York: Harper andBrothers, 1942.
Champlin, Carroll D. "Professors of Education," Education, LXXIII(February, 1953), 346-50.
Chansky, Norman M. "The Attitudes Students Assign to Their TeachersThe Journal of Educational Psychology, XLIX (1958), 13-16.
Charters, W. W. "Sizing Up the Faculty," The Journal of Higher Education., XI (December, 1940), 457.
Cheydleur, Frederic D. "Judging Teachers of Basic French Courses byObjective Means at the University of Wisconsin--1919-1943,"Journal of Educational Research, XXXIX (November, 1945), 161-92.
Cordrey, E. E. "Efforts to Improve Instruction in State TeachersColleges," Peabody Journal of Education, IX (July, 1931 May, 1932),200-208.
Corey, Stephen M., and Beery, George S. "The Effect of Teacher Popularity upon Attitude Toward School Subjects," The Journal ofEducational Psychology, XXIX (December, 1938), 665-70.
Creager, John A. "A MultipleFactor Analysis of the Purdue RatingScale for Instructors," Purdue University Bulletin. Studies inHigher Education. Nos..61-73. Lafayette, Indiana: Purdue University, 1947-50, p. 75.
Cronbach, Lee J. "Response Sets and Test Validity," Educational andPsychological Measurement, VI (1946), 475-94.

149
Cureton, Edward E. "Validity," Educational Measurement. Edited byE. F. Lindquist. American Council on Education. Menasha,Wisconsin: George Banta Publishing Company, 1951, p. 672.
Davis, Hazel. "Evolution of Current Practices in Evaluating TeacherCompetence," Contemporary Research on Teacher Effectiveness.Edited by Bruce J. Biddle and William J. Ellena. New York:Holt, Rinehart, and Winston, Inc., 1964, pp. 41-66.
Dobbins, Charles G. "Excellence in College Teaching," School andSociety, LXXXVII (December 19, 1959), 514-15.
Dodge, Homer L. "The Improvement of College Teaching," The Journal ofHigher Education, III (December, 1932), 481-86; 518.
Drucker, A. J., and Remmers, H. H. "Do Alumni and Students Differ inTheir Attitudes Toward Instructors?" Purdue University Bulletin,Studies in Higher Education. Nos. 61-73. Lafayette, Indiana:Purdue University, 1947-50, pp. 62-74.
Dysinger, D. W., and Gregory, W. S. "A Preliminary Study of Some Factors Related to Student Achievement and Grades in the BeginningCourse in Psychology," The Journal of General Psychology, XXIV(first half; January, 1941), 195-209.
Eckert, Ruth E. "Ways of Evaluating College Teaching," School andSociety, LXXI (February 4, 1950), 66.
Edmonson, J. B., and Mulder, F. J. "Size of Class as a Factor inUniversity Instruction," Journal of Educational Research, IX(January, 1924), 1-12.
Elliott, Donald N. "Characteristics and Relationships of VariousCriteria of College and University Teaching," Purdue UniversityBulletin. Studies in Higher Education. Nos. 61-73. Lafayette,Indiana: Purdue University, 1947-50, pp. 5-61.
Evans, Richard I., Smith, Ronald G., and Colville, William K. TheUniversity Faculty and Educational Television: Hostility,Resistance, and Change. Supported by a Grant from the U. S.Department of Health, Education, and Welfare, Office of Education. Houston, Texas: University of Houston, 1962.
Fahey, George L., and Masoner, Paul H. "An Interdisciplinary Seminarin College Teaching," The Journal of Teacher Education, XI (1960),391-97.
Fahey, George L. "Paradigm for Research on College Teaching."Pittsburgh: University of Pittsburgh, December, 1963. (Mimeographed.)
Fahey, George L. Professor, Psychology and Education, University ofPittsburgh, private communication, 1966.

150
Fahey, George L. "The Behavioral Sciences," Professional Advancementauggh Higher Education. Proceedings 15th Annual Conference,Department of Higher Education, October 29-30, 1965. Harrisburg:The Pennsylvania State Education Association, 1965, pp. 48-54.
Flanagan, John C. "The CriticalRequirements Approach to EducationalObjectives," School and Society, LXXI (May 27, 1950), 321-24.
"The Critical Incident Technique," The PsychologicalBullptin, LI (July, 1954), 327-58.
Freeberg, Norman Edward. "Effect of Relevant Contact upon theValidity and Reliability of Ratings," Dissertation Abstracts,XVI, Part I (1956), 789.
French, Grace Marian. "College Students' Concept of EffectiveTeaching Determined by an Analysis of Teacher Ratings." Unpublished Doctor's dissertation, University of Washington, 1957.
Gage, N. L., and Orleans, Jacob S. "Guiding Principles in the Studyof Teacher Effectiveness," The Journal of Teacher Education, III(December, 1952), 296.
Gage, N. L. "The Appraisal of College Teaching," The Journal ofHigher Education, XXXII (January, 1961), 17-22.
Garverick, Charles M., and Carter, Harold D. "Instructor Ratings andExpected Grades," California Journal of Educational Research,XIII (November, 1962), 218-21.
Goodfellow, Louis D. "The Human Element in Probability," The Journalof General Psychology, XXIII (first half; July, 1940), 201-205.
Guilford, J. P. Psychometric Methods. 2d ed. New York: McGrawHill Book Company, Inc., 1954.
Fundamental Statistics in Psychology and Education. 3d ed.
New York: McGrawHill Book Company, Inc., 1956.
Gustad, John W. "They March to a Different Drummer: Another Look atCollege Teachers," The Educational Record, XL (July, 1959), 204-11.
Guthrie, E. R. "The Evaluation of Teaching," The Educational Record,XXX (April, 1949), 109-15.
. The Evaluation of Teaching: A Progress Report. Seattle:
University of Washington, 1954.
Guthrie, Edwin R. "Evaluation of Faculty Service," Bulletin of theAmerican Association of University Professors, XXXI (Summer, 1945),255-62.

151
Hamlin, Wilfrid G. "A College Faculty Looks at Itself," The Journalof Highex Education, XXVIII (April, 1957), 202-206 and 236.
Hayes, Robert Bennett. "A Measure of Student Attitude Towards TeachingEffectiveness," Dissertation Abstracts, XXII (1961-62), 2265-66.
Hedges, William D. "The Effective Teacher at the Doctoral Level inEducation," Peabody Journal of Education, )OCXIX (May, 1962), 351-54.
Hedges, William D., and MacDougall, Mary Ann. "Recording Student Per-ceptions of Teacher Behavior by Means of a Student Response Moni-tor," Journal of Educational Research, LVIII (December, 1964), 163-66.
Heilman, J. D., and Armentrout, W. D. "The Rating of College Teacherson Ten Traits by Their Students," The Journal of EducationalPsychology, XXVII (Marsh, 1936), 197-216.
Heist, Paul. "The Entering College Student--Background and Character-istics," Review of Educational Research, XXX (October, 1960), 285-97.
Hudelson, Earl. "The Validity of Student Rating of Instructors,"School and Society, LXXIII (April 28, 1951), 265-66.
Isaacson, Robert L., McKeachie, Wilbert J., and Milholland, John E."Correlation of Teacher Personality Variables and StudentRatings," The Journal of Educational Psychology, LIV (1963),110-17.
Judd, Charles H. "The Improvement of Teaching," The Journal of HigherEducation, III (December, 1932), 470-74; 517-18.
Kegel, Charles H. "The Distinguished Teacher," Improving College andUniversity Teaching, XII (Spring, 1964), 102-104.
Kelley, Truman Lee. The Influence of Nurture upon Native Differences.New York: The Macmillan Company, 1926.
Kelley, William Frederick. "Twenty Studies of In-Service Education ofCollege Faculty and the Procedures Most Recommended," EducationalAdministration and Supervision, XXXVI (October, 1950), 351-58.
Kelly, Robert L. "Great Teachers and Methods of Developing Them,"Association of American Colleges Bulletin, XV (March, 1929), 49-67.
Klepper, Paul. "The Professional Preparation of the College Teacher,"The Journal of General Education, III (October-July, 1948-49),228-44.
Kriner, Harry L. "Second Report on a Five Year Study of TeachersCollege Admissions," Educational Administration and Supervision,XXI (January, 1935), 60.

152
Krumm, Richard L. "InterRelationships of Measured Interests and Personality Traits of Introductory Psychology Instructors and TheirStudents as Related to Student Achievement." Unpublished Doctor'sdissertation, University of Pittsburgh, 1952.
Lamper, Neil. "Characteristics of Great Teachers," DissertationAbstracts, XXI (1960-61), 3694.
Lancelot, William H. "A Study of Teaching Efficiency as Indicated byCertain Permanent Outcomes," The Measurement of Teaching Efficiency. Edited by Helen M. Walker. New York: The MacmillanCompany, 1935, pp. 3-69.
Lazovik, Grace French. Associate Professor, Psychology and Education,Director of University Testing Service, University of Pittsburgh,personal communication, 1966.
Lewis, R. W. "A Garland of Ratings, or Just Try to Know Thyself,"College English, XXV (May, 1964), 587-90.
Lorge) Irving. "GenLike: Halo or Reality," The PsychologicalBulletin, XXXIV (October, 1937), 545-46.
Lovell, George D., and Haner, Charles F. "ForcedChoice Applied toCollege Faculty Rating," Educational and Psychological Measurement, XV (Autumn, 1955), 291-304.
Lyle, Edwin. "An Exploration in the Teaching of Critical Thinkingin General Psychology," Journal of Educational Research, LII(December, 1958), 129-33.
McKeachie, W. J. "Behavioral Sciences Can Improve Teaching," NEAJournal, XLIX (September, 1960), 79-81.
Macomber, F. G., and Siegel, Laurence. "A Study in LargeGroupTeaching Procedures," The Educational Record, XXXVIII (July,1957), 220-29.
Mawson, Sylvester (ed.). Roget's University The Apollo ed.New York: Thomas Y. Crowell, 1963.
Medalie, Richard J. "The Student Looks at College Teaching," Thegrea.onoLqColleeTeachers. A Report by the American Council on Education and the U. S. Office of Education) Series I--Reports of Committees and Conferences--Number 42, XIV. Editedby Theodore C. Blegen and Russell M. Cooper. Washington, D. C.:American Council on Education, July, 1950), pp. 49-54.
Morse, H. Taylor. "The Improvement of College Instruction," AmericanAssociation of Colleges for Teacher Education, Twelfth Yearbook ofthe American Association of Colleges for Teacher Education.Washington, D. C.: American Association of Colleges for TeacherEducation, 1959), pp. 118-32.

153
Morsh, Joseph E., and Wilder, Eleanor W. Identifying the EffectiveInstructor: A Review of the Quantitative Studies, 1900-1952,Research Bulletin AFPTRC-TR-54-44. San Antonio, Texas: AirForce Personnel and Training Research Center, Lackland AirForce Base, October, 1954.
Munro, William B. "A Self-Study of College Teaching," The Journalof Highey Education, III (December, 1932),, 459-63.
1 Chairman. "Report of the Committee on College and Uni-versity Teaching," Bulletin of the American Association ofUniversity Professors, XIX, Section Two (May, 1933), 34.
Novak, Joseph D. "An Experimental Comparison of a Conventional anda Project Centered Method of Teaching a College General BotanyCourse," Journal of Experimental Education, XXVI (March, 1958),217-30.
Orleans, Jacob S., Clarke, Daniel, Ostreicher, Leonard, and Standlee,Lloyd. "Some Preliminary Thoughts on the Criteria of TeacherEffectiveness," Journal of Educational Research, XLV (May, 1952),641-48.
Osgood, Charles E., Suci, George J., and Tannenbaum, Percy H. TheMeasurement of Mekning. Urbana, Illinois: University ofIllinois Press, 1957.
Powell, J. P. "Experimentation and Teaching in Higher Education,"Educational Research, VI (June, 1964), 179-91.
Rainey, Homer P. "The Individualization of College Instruction,"Association of American Colleges Bulletin, XVIII (May, 1932),190-95.
Reed, Anna Y. in collaboration with Maguire, Frank P., Thomson,William A., and van der Vate, Harriett. The Effective and theIneffective College Teacher. New York: American Book Company,1935.
Remmers, H. H. "The College Professor as the Student Sees Him,"Purdue University Bulletin. Studies in Higher Education, Nos.7-12. Lafayette, Indiana: Purdue University, 1926-29, pp. 1-63.
C
. "The Relationship between Students' Marks and StudentAttitude Toward Instructors," School and Society, XXVIII(December 15, 1928), 759-60.
. "Reliability and Halo Effect of High School and CollegeStudents' Judgments of Their Teachers," The Journal of AppliedPsychology, XVIII (1934), 621.

154
Remmers, H. H. "Rating Methods in Research on Teaching," Handbook ofResearch on Teaching. Edited by N. L. Gage. The American Educational Research Association, National Education Association.Chicago: Rand McNally and Company, 1963, ;pp. 329 and 362.
Rohrer, John H. "Large and Small Sections in College Classes," TheJournal of HigberEducation, XXVIII (May, 1957), 275-79.
Root, Alfred R. "Student Ratings of Teachers," The Journal of HigherEducation, II (1931), 311-15.
Roudabush, Glenn E. Assistant Professor, Computer Science and Psychology, University of Pittsburgh, personal communication, 1966.
Ruja, Harry. "Outcomes of Lecture and Discussion Procedures in ThreeCollege Courses," Journal of Experimental Education, XXII (June,1954), 385-94.
Russell, Harold E. "Interrelations of Some Indices of InstructlrEffectiveness: An Exploratory Study." Unpublished Doctor's dissertation, University of Pittsburgh, 1951.
Ryans, David G. "Notes on the Rating of Teacher Performance," Journalof Educational Research, XLVII (May, 1954), 695-703.
"Measurement and Prediction of Teacher Effectiveness,"Invitational Conference on Testin Problems November 1 1958.New Jersey: Educational Testing Service, 1959, p. 56.
. Characteristics of Teachers. American Council on Education.Menasha, Wisconsin: George Banta Company, Inc., 1960.
Saunders, David R6 "Moderator Variables in Prediction," Educationaland ILuatiological Measurement, XVI (Summer, 1956), 209-22.
Simpson, Ray H. "Use of Teacher SelfEvaluative Tools for the Improvement of Instruction," Improvement of Instruction in Hicfner Education. A Report by the Subcommittee on Improvement of Instructionof the Committee on Studies. Washington, D. C. The AmericanAssociation of Colleges for Teacher Education, 1962, pp. 49-62.
Smeltzer, C. H., and Harter, R. S. "Comparison of Anonymous andSigned Ratings of Teachers," Educational Outlook, VIII (January,1934), 76-84.
Smith, Allan A. "College Teachers Evaluated by Students," Sociologyand Social Research, XXVIII (JulyAugust, 1944), 471-78.
Smith, B. Othanel. "On the Anatomy of Teaching," The Journal ofTeacher Education, VII (December, 1956), 339.
Snedeker, John Haggner. "The Construction of a ForcedChoice RatingScale for College Instruction," Dissertation Abstracts, XX (1959-60), 1273-74.
155
Solomon, Daniel. "Teacher Behavior Dimensions, Course Characteristics,and Student Evaluations of Teachers," American Educational ResearchJournal, III (January, 1966), 35-47.
Solomon, Daniel, Bezdek, William E., and Rosenberg, Larry. TeachingStyles and Learning. Chicago: Center for the Study of LiberalEducation for Adults, 1963.
Springer, E. Kent. "Criteria for Advancement and Promotion of theTeaching Staff," Higher Education, VII (January 15, 1951), 117-18.
Stauffer, John Nissley. "Judgments of Liberal Arts College Teachersand Deans Regarding College Teacher Qualifications," DissertationAbstracts, XVII, Part I (1957), 285-86.
Taylor, George Flint. "Characteristics of Best Liked Teacher, LeastLiked Teacher and Most Effective Teacher in Teacher TrainingInstitutions," Dissertation Abstracts, XX (1959-60), 1233.
Thorndike, Edward L. "A Constant Error in Psychological Ratings,"The Journal of Applied Psychology, IV (March, 1920), 25-29.
Thorndike, Robert L. Personnel Selection. New York: John Wileyand Sons, 1949.
Trabue, M. R. "Judgments by 820 College Executives of Traits Desirable in LowerDivision College Teachers," Journal of ExperimentalEducation, XXI (June, 1953), 337-41.
Vanderpol, Jeanette A. "Student Opinion--Sacred Cow or Booby Trap?"The Journal of Teacher Education, X (December, 1959), 401-12.
Voeks, Virginia W., and French, Grace M. "Are StudentRatings ofTeachers Affected by Grades?" The Journal of Higher Education,XXXI (June, 1960), 330-34.
Walker, Helen M. (ed.). The Measurement of Teaching Efficiency. NewYork: The Macmillan Company, 1935.
Weaver, Carl H. "Instructor Rating by College Students," The Journalof Educational Psychology, LI (1960), 21-25.
Wedeen, Shirley Ullman. "Comparison of Student Reaction to Similar,Concurrent TeacherContent Instruction," Journal of EducationalResearch, LVI (JulyAugust, 1963), 540-43.
Wells, Frederic Lyman. "A Statistical Study of Literary Merit withRemarks on Some New Phases of the Method," Archives of Psychology,Columbia University Contributions to Philosophy and Psychology,XVI. Edited by R. S. Woodworth. New York: The Science Press,1907.
156
Westley, Bruce H., and Jacobson, Harvey K. "Instructional Televisionand Student Attitudes Toward Teacher, Course, and Mddium," AVCommunication Review, XI (1963), 47-60.
Whitla, Dean K. "Encounters with Learning," Harvard EducationalReview, XXX (Fall, 1960), 331-49.
Wilson, William R. "Students Rating Teachers," The Journal of HigherEducation, III (February, 1932), 82.
Yourglich, Anita. "Study on Correlations between College Teachers'and Students' Concepts of 'IdealrStudent' and 'IdealTeacher',"Journal of Educational Research, XLIX (September, 1955), 59-64.
References to Chapter IV
Cooley, William W., and Lohnes, Paul R. Multivariate Procedures forthe Behavioral Sciences. New York: John Wiley and Sons, Inc.,1962.
Horst, Paul. "A Generalized Expression for the Reliability of Measures," Psychometrika, XIV (March, 1949), 21-31.
Kendall, M. G. A Course in Multivariate Analysis. New York:Hafner Publishing Company, 1961.
Martin, Ann, and Scott, Russell. "Occupational Group Differences inJobIncentive Dimensions Among Academic and Industrial Personnel."Paper presented at 1965 American Psychological AssociationMeeting, Chicago, Illinois. (Mimeographed.)
Rulon, Phillip J. "Distinctions between Discriminant and RegressionAnalyses and a Geometric Interpretation of the Discriminant Function," Harvard Educational Review, XXI (JanuaryDecember, 1951),80-90.
Tatsuoka, Maurice M., and Tiedeman, David V. "Discriminant Analysis,"Review of Educational Research, XXIV (December, 1954), 402-20.
Tiedeman, David V., andiarvan. Joseph G. "Prediction of College .
Field of Concentration," Harvard Educational Review, XXIV (JanuaryDecember, 1954), 122-38.