report to shareholders - microsoft · 2 report to shareholders - hafslund contents fourth-quarter...
TRANSCRIPT

Report to shareholders Fourth-quarter 2008

2 REPORT TO SHAREHOLDERS - HAFSLUND
Contents Fourth-quarter 2008 highlights 3
Key figures 4
Fourth-quarter 2008 summary 4
Cash flow and capital matters 5
2008 profit 6
Risk 6
Business segments 7
Other matters 11
Outlook 12
Profit and loss mm 13
Cash flow statement 14
Notes to the accounts 15
Historical comparative data 19

Fourth-quarter 2008 highlights
> The Group’s profit was affected by financial-market turbulence and declining share and derivative prices.
> Operating profit from operating units totaled NOK 541 million (NOK 193 million); non-recurring items and the effect of share and derivative price declines contributed to total operating profit of NOK -34 million.
> After-tax profit, excluding Renewable Energy Corporation (REC), was NOK -305 million (NOK 579 million).
> Cash flow from operations in 2008 amounted to NOK 1,039 million (NOK 181 million).
> The Group has a strong balance sheet with an equity ratio of 41 percent and a robust financing structure with long-term lines of credit.
> 2008 dividend on agenda of the Board of Directors’ 26 March 2009 meeting.
> Operating profit (excl. REC)
(34)
230
562581587
(100)
-
100
200
300
400
500
600
700
800
4Q07 1Q08 2Q08 3Q08 4Q08
> Earnings per share (excl. REC)
(1,56)
0,59
2,40
1,75
2,97
-2,0
-1,5
-1,0
-0,5
0,0
0,5
1,0
1,5
2,0
2,5
3,0
3,5
4Q07 1Q08 2Q08 3Q08 4Q08
> Equity ratio
64 %
54 % 54 %51 %
40 %
20 %
25 %
30 %
35 %
40 %
45 %
50 %
55 %
60 %
65 %
4Q07 1Q08 2Q08 3Q08 4Q08
Earnings per share excl. REC
NOK -1.56
NOK m
ill.
NOK

4 AKSJONÆRRAPPORT 2. HALVÅR 2008
Key figures
Fourth quarter YTD
2007 2008 Profit and loss (NOK million) 2008 2007
3.256 3.638 Operating revenue 10.447 8.640
2.847 (3.711) Operating profit before depreciation (13.723) 14.799
2.523 (3.941) Operating profit (14.574) 13.908
2.352 (4.238) Profit before tax and discont operation (15.258) 13.463
2.515 (4.837) Profit after tax (15.915) 13.338
Capital matters
43.468 30.855 Total assets 30.855 43.468
64 % 40 % Equity ratio 40 % 64 %
10.102 11.242 Net interest-bearing debt 11.242 10.102
Per-share figures (NOK)
12,89 (24,78) Profit (EPS) (81,54) 68,34
(5,76) (2,15) Cash flow from operations 5,32 0,93
Key figures (GWh)
615 732 Power generation 3.248 3.123
3.876 3.947 Power sales 12.936 12.762
Fourth-quarter 2008 summary Figures are in NOK unless otherwise stated. Comparative
2007 figures appear in parentheses.
As in previous quarters, from 2006 through 2008, the Hafslund Group’s fourth-quarter profit was significantly affected by the value development of its REC investment. Until the fourth quarter of 2008, this investment was recognized at market value. However, as of 19 November 2008, the REC investment’s accounting treatment was changed. (See Note 1 to this shareholders’ report for additional information.) The Group’s fourth-quarter 2008 operating profit and after-tax profit are charged with NOK 3,907 million and NOK 4,532 million, respectively, for the REC investment. In this report to shareholders, profit and loss figures are discussed exclusive of value changes associated with the Group’s REC investment, unless otherwise stated.
Fourth-quarter 2008 Hafslund Group operating profit amounted to NOK 3,638 million, up 12 percent compared with the year-earlier figure. Revenues were significantly affected by power-price developments, particularly sales by the Power Sales business, which typically has annual sales to residential and corporate customers totaling about 12–13 TWh. On the production side, the Group’s Power Generation, District Heating, and other renewable energy activities are also affected by power prices. Thus, power price developments must be taken into consideration in comparisons with 2007 revenues; in the fourth quarter of 2008, the wholesale power
price was about NOK 0.10 per kWh higher than the year-earlier figure.
Fourth-quarter 2005–2008 (excl. REC)
(NOK million)
321
651587
(34)
317
579
(305)
118
(400)
(200)
-
200
400
600
800
2005 2006 2007 2008Operat ing pro f it P ro f it af ter tax
Fourth-quarter 2008 Hafslund Group operating profit amounted to NOK -34 million, down NOK 621 million compared with the year-earlier figure. Total operating profit at Group operating units amounted to NOK 541 million, up NOK 348 million from the fourth quarter of 2007. Declining market values for shares and derivatives led to a NOK 356 million charge to fourth-quarter 2008 profit. The profit decline must

5 REPORT TO SHAREHOLDERS - HAFSLUND
be viewed in light of a NOK 541 million real estate gain recorded in the fourth quarter of 2007. A more detailed description of profit centers is provided further on in this report to shareholders. The Group’s operating units are Power Generation, District Heating, Network, Telekom, and Power Sales.
Financial expenses amounted to NOK 297 million in the fourth quarter of 2008 (NOK 171 million). The Group’s gross interest-bearing debt as of year-end 2008 was NOK 12.5 billion, up NOK 1.4 billion in the quarter. Average coupon rate was 6.7 percent (6.1 percent). Lower long-term forward interest rates, compared with the close of the third quarter of 2008, increased the market value of fixed-interest loans and led to a NOK 112 million (NOK 18 million) increase in financial expenses. Further, financial expenses include NOK 72 million in capitalized construction-loan interest and NOK 30 million in losses on financial instruments.
The Group had tax expenses of NOK 615 million (NOK 25 million) in the fourth quarter of 2008, including a NOK 600 million allocation associated with a disputed tax liability concerning gains on the conversion of a bond loan into REC shares in 2006. (See Note 8 in this interim report and notes to the accounts in the 2006 and 2007 annual reports on this matter.) The tax expense includes Norway’s tax on hydropower generation facilities, which amounted to NOK 60 million (NOK 17 million). A major factor in determining the effective tax rate is the Venture business area’s profit, most of which reflects untaxed share gains.
The Group’s after-tax profit for the fourth quarter of 2008 was NOK -305 million (NOK 579 million). The figure corresponds to a per-share profit of NOK -1.56 (NOK 2.97); the figures are identical to the diluted per-share figures.
Cash flow and capital matters
Cash flow from operations amounted to NOK -419 million in the fourth quarter of 2008, a NOK 705 million improvement compared with the fourth quarter of 2007. Seasonally, the fourth quarter is a capital-intensive period due to an increased pace of consumption by Power Sales customers. More capital is tied up in customer receivables and accrued revenues, while power purchases made via Nord Pool must be paid daily. In the fourth quarter of 2008, working capital rose by NOK 953 million (NOK 1,237 million). Compared with the Group’s fourth-quarter NOK 196 million operating profit before depreciation, exclusive of the REC investment, cash flow decreased by NOK 615 million. This figure should be viewed in light of the aforementioned NOK -953 million working capital increase and NOK 356 million in non-liquidity profit charges associated with reduced market value of shares and derivatives.
Net cash flow for operating and expansion investments totaled NOK 357 million in the fourth quarter of 2008, mainly for expansion investments for district heating, power generation, energy recovery, and a wood pellets plant, as well
as necessary reinvestments in the Network power grid business. However, the figure also includes NOK 172 million in capital freed up, largely associated with the sale of shares in Securitas Direct AB.
The accounting treatment of the Group’s involvement in Infratek ASA (formerly Hafslund Infratek ASA) changed as of 2009, from that of a subsidiary to an associated company, and Hafslund’s balance sheet was restated as of 31 December 2008. Net cash flow from operations associated with Infratek is presented as cash flow from discontinued operations, including the previously consolidated NOK 176 million net interest-bearing receivable.
Net interest-bearing debt increased by a total of NOK 979 million in the quarter. Net interest-bearing debt amounted to NOK 11.2 billion as of year-end 2008, up NOK 1.1 billion in 2008. Cash flow from operations amounted to NOK 1.0 billion; together with NOK 0.5 billion in capital freed up through asset sales and NOK 1.1 billion in new loans, which were applied to financing operating and expansion investments of NOK 1.8 billion and capital transactions of NOK 0.8 billion.
The Hafslund Group had total assets of NOK 30.6 billion as of 31 December 2008, down NOK 1.4 billion from the close of the third quarter of 2008. The decrease is largely attributable to a NOK 2.9 billion value decline of the REC share investment and NOK 0.8 billion in capital tied up in receivables associated with operations. The Group has a strong balance sheet with an equity ratio, as of 31 December 2008, of 40 percent and a robust financing structure with long-term lines of credit.
Net interest-bearing debt
(in NOK billion)
9,5
10,2 10,09,7
9,4
6,2
9,7 9,810,1
9,4
9,910,3
11,2
4
6
8
10
12
4Q05 2Q06 4Q06 2Q07 4Q07 2Q08 4Q08
6 REPORT TO SHAREHOLDERS - HAFSLUND
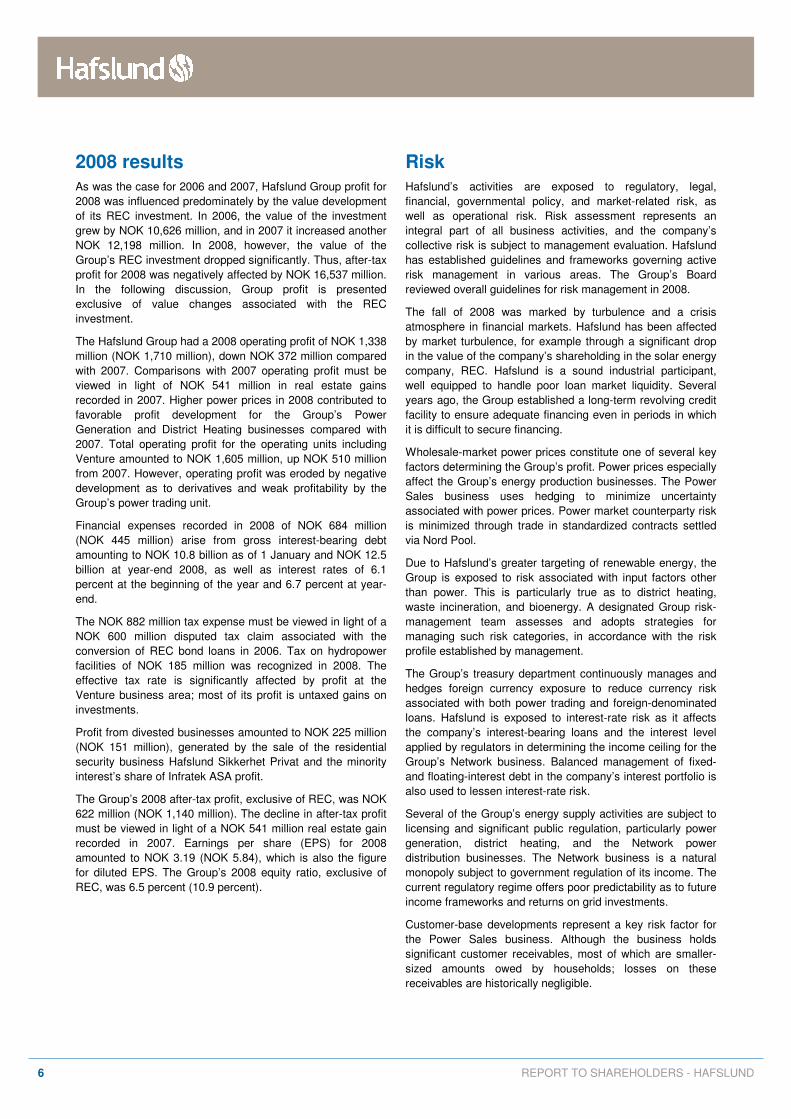
2008 results As was the case for 2006 and 2007, Hafslund Group profit for 2008 was influenced predominately by the value development of its REC investment. In 2006, the value of the investment grew by NOK 10,626 million, and in 2007 it increased another NOK 12,198 million. In 2008, however, the value of the Group’s REC investment dropped significantly. Thus, after-tax profit for 2008 was negatively affected by NOK 16,537 million. In the following discussion, Group profit is presented exclusive of value changes associated with the REC investment.
The Hafslund Group had a 2008 operating profit of NOK 1,338 million (NOK 1,710 million), down NOK 372 million compared with 2007. Comparisons with 2007 operating profit must be viewed in light of NOK 541 million in real estate gains recorded in 2007. Higher power prices in 2008 contributed to favorable profit development for the Group’s Power Generation and District Heating businesses compared with 2007. Total operating profit for the operating units including Venture amounted to NOK 1,605 million, up NOK 510 million from 2007. However, operating profit was eroded by negative development as to derivatives and weak profitability by the Group’s power trading unit.
Financial expenses recorded in 2008 of NOK 684 million (NOK 445 million) arise from gross interest-bearing debt amounting to NOK 10.8 billion as of 1 January and NOK 12.5 billion at year-end 2008, as well as interest rates of 6.1 percent at the beginning of the year and 6.7 percent at year-end.
The NOK 882 million tax expense must be viewed in light of a NOK 600 million disputed tax claim associated with the conversion of REC bond loans in 2006. Tax on hydropower facilities of NOK 185 million was recognized in 2008. The effective tax rate is significantly affected by profit at the Venture business area; most of its profit is untaxed gains on investments.
Profit from divested businesses amounted to NOK 225 million (NOK 151 million), generated by the sale of the residential security business Hafslund Sikkerhet Privat and the minority interest’s share of Infratek ASA profit.
The Group’s 2008 after-tax profit, exclusive of REC, was NOK 622 million (NOK 1,140 million). The decline in after-tax profit must be viewed in light of a NOK 541 million real estate gain recorded in 2007. Earnings per share (EPS) for 2008 amounted to NOK 3.19 (NOK 5.84), which is also the figure for diluted EPS. The Group’s 2008 equity ratio, exclusive of REC, was 6.5 percent (10.9 percent).
Risk Hafslund’s activities are exposed to regulatory, legal, financial, governmental policy, and market-related risk, as well as operational risk. Risk assessment represents an integral part of all business activities, and the company’s collective risk is subject to management evaluation. Hafslund has established guidelines and frameworks governing active risk management in various areas. The Group’s Board reviewed overall guidelines for risk management in 2008.
The fall of 2008 was marked by turbulence and a crisis atmosphere in financial markets. Hafslund has been affected by market turbulence, for example through a significant drop in the value of the company’s shareholding in the solar energy company, REC. Hafslund is a sound industrial participant, well equipped to handle poor loan market liquidity. Several years ago, the Group established a long-term revolving credit facility to ensure adequate financing even in periods in which it is difficult to secure financing.
Wholesale-market power prices constitute one of several key factors determining the Group’s profit. Power prices especially affect the Group’s energy production businesses. The Power Sales business uses hedging to minimize uncertainty associated with power prices. Power market counterparty risk is minimized through trade in standardized contracts settled via Nord Pool.
Due to Hafslund’s greater targeting of renewable energy, the Group is exposed to risk associated with input factors other than power. This is particularly true as to district heating, waste incineration, and bioenergy. A designated Group risk-management team assesses and adopts strategies for managing such risk categories, in accordance with the risk profile established by management.
The Group’s treasury department continuously manages and hedges foreign currency exposure to reduce currency risk associated with both power trading and foreign-denominated loans. Hafslund is exposed to interest-rate risk as it affects the company’s interest-bearing loans and the interest level applied by regulators in determining the income ceiling for the Group’s Network business. Balanced management of fixed- and floating-interest debt in the company’s interest portfolio is also used to lessen interest-rate risk.
Several of the Group’s energy supply activities are subject to licensing and significant public regulation, particularly power generation, district heating, and the Network power distribution businesses. The Network business is a natural monopoly subject to government regulation of its income. The current regulatory regime offers poor predictability as to future income frameworks and returns on grid investments.
Customer-base developments represent a key risk factor for the Power Sales business. Although the business holds significant customer receivables, most of which are smaller-sized amounts owed by households; losses on these receivables are historically negligible.

7 REPORT TO SHAREHOLDERS - HAFSLUND
Business sectors - fourth-quarter
> Power Generation
Fourth quarter YTD
NOK million 2008 2007 2008 2007
Operating revenues 310 196 1.001 635
Operating profit before
depreciation 287 129 758 449
Operating profit 271 119 713 406
Investments 46 17 110 47
Sales price (øre/kWh) 43,1 33,4 31,5 21,4
Hafslund’s Power Generation business had operating revenues of NOK 310 million in the fourth quarter of 2008, up NOK 114 million compared with the corresponding 2007 reporting period. Power Generation had a fourth-quarter 2008 operating profit of NOK 271 million, up NOK 152 million from the fourth quarter of 2007.
The Hafslund Group’s strategy is to sell the power it produces in the spot market, without a significant degree of price hedging. The Group uses this strategy in part to provide Hafslund’s investors with direct exposure to Nordic-market power prices. Exposure to spot prices causes profits from Hafslund’s Power Generation business to be largely driven by power contract price developments. The volume-weighted sales price in the fourth quarter of 2008 was NOK 0.431 per kWh, up 29 percent compared with the year-earlier figure. Higher power prices alone resulted in a NOK 50 million increase in profit contribution, compared with the fourth quarter of 2007.
Somewhat lower forward prices for power contracts for delivery in 2013 reduced the carrying value of license power obligations to municipalities, which resulted in a NOK 57 million positive profit effect in the fourth quarter of 2008 (NOK -23 million); the profit effect has no cash flow component. Licensed power obligations amounted to NOK 237 million as of 31 December 2008. The figure is based on an annual outtake of 62 GWh and a power price of NOK 0.09 per kWh, determined by Norway’s Petroleum and Energy Ministry. For 2009, the price of licensed power has been set at NOK 0.0948 per kWh.
Power production in the fourth quarter of 2008 was 732 GWh, up 19 percent compared with the fourth quarter of 2007, and three percent above normal production for the reporting period. As of 31 January 2009, aggregate hydrologic reservoir levels in Hafslund’s drainage basin were at 100 percent of normal levels for the season; total stored energy amounted to 1,506 GWh. Of this figure, snow pack amounted to just under 71 percent of total reservoir energy content. Projections based on production thus far in the first quarter of 2009, scheduled availability of production facilities, current hydropower reservoir levels, and provided normal precipitation indicate that Hafslund’s first-quarter 2009 power
generation will be some 30 GWh below normal generation for the reporting period.
Power generation vs. 10-year average
(GWh)
0
50
100
150
200
250
300
350
2007 287 213 223 243 349 341 347 321 184 208 179 228
2008 270 204 245 267 333 333 314 327 223 229 243 260
M ean 210 167 161 217 337 325 317 267 238 255 237 218
J F M A M J J A S O N D
Note: Normal = 10-year average production.
Operating expenses amounted to NOK 80 million in the fourth quarter, up NOK 36 million compared with the corresponding 2007 reporting period. The increase is greater maintenance activity and a NOK 17 million charge for production capacity upgrading and expansion.
The Power Generation business is in an investment phase to expand capacity. Core projects are construction of a new generator, the FKF 4, and upgrading the oldest generators at Hafslund’s Vamma hydropower plant. The FKF 4 will be a complete 40 MW power plant. The Vamma upgrade program and the new FKF 4 generator are scheduled for completion in the spring of 2011. The two projects will add a significant 100 GWh of annual production capacity while considerably lengthening the lifetime of installed generation capacity. The NOK 500 million investment program includes approximately NOK 250 million for generation capacity expansion.

8 REPORT TO SHAREHOLDERS - HAFSLUND
> District Heating
Fourth quarter YTD
NOK million 2008 2007 2008 2007
Operating revenues 279 216 691 562
Operating profit before
depreciation 92 60 226 151
Operating profit 61 21 96 14
Investments 132 64 403 225
Salesprice (in øre per kWh) 70,0 60,0 64,9 54,3
Hafslund’s District Heating business had fourth-quarter 2008 operating revenues of NOK 279 million, up 29 percent compared with the corresponding 2007 reporting period. Revenue growth is attributable to higher district heating prices and increased production.
Typically, about 37 percent of total annual production is generated and distributed in the fourth quarter of the year, making it a seasonally strong quarter. Operating profit before depreciation amounted to NOK 92 million in the fourth quarter of 2008, up 53 percent from the fourth quarter of 2007.
The achieved sales price was NOK 0.70 per kWh, up 17 percent compared with the fourth quarter of 2007. The raw materials market (coal and oil) experienced falling prices in the fourth quarter, with a resulting slide in power prices. For 2008, the achieved sales price was NOK 0.649 per kWh, up NOK 0.106 per kWh compared with 2007.
The energy volume produced in the fourth quarter of 2008 was 446 GWh, up seven percent from 417 GWh in the fourth quarter of 2007. 135 GWh (126 GWh) of the volume is attributable to purchases and sales associated with the waste incineration plant owned by the City of Oslo (GE). The roughly 30 GWh volume increase over the fourth quarter of 2007 is largely attributable to connecting new customers to the grid. Production costs in the fourth quarter of 2008 amounted to NOK 0.289 per kWh, down four percent from the year-earlier figure. The proportionate consumption of renewable energy amounted to 57 percent in the quarter (49 percent) and 61 percent for the year (57 percent).
Fourth-quarter 2008 profit was charged NOK 10 million associated with upgrading the biofuel plant to remote control. Operating expenses amounted to NOK 58 million in the quarter (NOK 39 million).
Operating profit for the quarter was NOK 61 million, which represents a NOK 40 million improvement over the fourth quarter of 2007. The fourth-quarter 2008 improvement in operating profit is attributable to an increase in contribution margin (increased district heating prices, lower production costs, and higher production), despite higher operating expenses.
Investments in the quarter totaled NOK 132 million (NOK 64 million); of this amount NOK 10 million is attributable to reinvestments. Investments beyond this figure are for capacity expansion. Construction of a trunk line that will link Hafslund Fjernvarme’s two district heating networks in Oslo remains on
schedule. The line is scheduled for completion by the end of June 2009. Benefits of the project include facilitating further development of renewable energy production and biofuel-based energy sources, as well as utilization of municipal waste. Additional Oslo neighborhoods will be able to tie into the expanded district heating network. In various neighborhoods, 82 customers — with a total projected annual consumption of 60 GWh — were connected to the network in the fourth quarter.
> Network
Fourth quarter YTD
NOK million 2008 2007 2008 2007
Operating revenues 999 885 3.352 3.194
Operating profit before
depreciation 231 166 868 883
Operating profit 95 11 322 354
Investments 149 145 541 445
Hafslund’s Network business had fourth-quarter 2008 operating revenues of NOK 999 million, up NOK 114 million from the corresponding 2007 reporting period. Operating revenue growth is largely attributable to recognition of a NOK 96 million receivable for so-called excess/under income regarding Network’s regulated activities and NOK 41 million resulting from power prices that were higher in the fourth quarter of 2008 than in the fourth quarter of 2007. See presentation of the accounting treatment of excess/under income for grid activities in Note 4 to the accounts in this report to shareholders.
Fourth-quarter 2008 operating profit before depreciation was NOK 231 million (NOK 166 million). Network’s operating profit was NOK 95 million (NOK 11 million). Energy purchases to compensate for grid losses and central grid transmission costs totaled NOK 480 million in the quarter, up NOK 38 million compared with the fourth quarter of 2007. Higher power prices made grid-loss power purchases more expensive than in the fourth quarter of 2007. Operating expenses, excluding energy purchases and transmission costs paid to Statnett, Norway’s transmission system operator (TSO), were NOK 288 million, up four percent compared with the fourth quarter of 2007. Depreciation amounted to NOK 136 million (NOK 155 million) in the quarter. Lower deprecation, compared with the corresponding 2007 reporting period, is largely attributable to depreciation in the fourth quarter of 2007 having included an additional NOK 24 million adjustment to correct for under-recording depreciation in preceding quarters.
In a letter dated 24 June 2008, the Norwegian Water Resources and Energy Directorate (NVE) notified Hafslund that it had ruled that Hafslund Nett AS must maintain an in-house grid operations and control function and a minimum staffing level of some 250 man-years. Norway’s Ministry of Petroleum and Energy has not yet ruled on Hafslund’s appeal in the matter. However, in a 7 October 2008 letter, the

9 REPORT TO SHAREHOLDERS - HAFSLUND
Ministry stated that the deadline by which NVE’s ruling must be implemented has been postponed pending the Ministry’s final determination regarding Hafslund’s appeal. The date on which the Ministry will announce its decision remains unknown.
On 13 November 2008, Norway’s Ministry of Petroleum and Energy issued a proposal for provisions on staffing requirements for companies subject to licensing. It states that grid owners will have limited access to outsource tasks necessary to monopoly activities to external companies. If the provisions are adopted with the present wording and NVE’s decision is upheld by the Ministry, Hafslund Nett will be required to modify its business model and increase staffing by just over 50 man-years. The hearing deadline expired on 1 February 2009. Hafslund, the rest of the industry, and employee representatives are united in their view that the proposed provisions are unnecessary and that there are no professional, factual, or operational reasons to impose them. As the proposal now stands, the provisions will result in a less efficient power-grid industry and poorer utilization of resources and expertise. Hafslund’s position is that the proposed legislation will negatively affect grid customers, as grid rental charges will increase with no accompanying improvement in the quality of grid facilities or delivery reliability.
In a 9 December 2008 hearing memorandum, the Ministry of Petroleum and Energy announced certain amendments to the Energy Act that carry potential consequences for activities subject to licensing such as grid, district heating, and power generation. According to Hafslund’s position, the most important elements of the Ministry’s proposal are:
• Limitations on free access to organize activities subject to licensing, such that the licensee must build, own, and operate facilities. Presently, owners are required to build and operate such facilities.
• Requirements for licensees to own property and buildings associated with electric power facilities, in other words, prohibition of sales and leasebacks.
In Hafslund’s opinion, the above proposal represents a step in the wrong direction, given the goal of providing society with efficient and reliable energy supplies.
In August 2007, Norway’s Ministry of Petroleum and Energy gave the go-ahead to NVE to facilitate the implementation of two-way communications for all power grid customers. The Ministry’s goal is for such communication systems to be fully operational by 2014. Hafslund is in favor of the Ministry’s initiative, yet will await start-up of full-scale roll-out until a more comprehensive decision on issues and frameworks governing project implementation is available. A financing model that provides an adequate financial framework, predictability, and incentives for an efficient implementation is of decisive importance.
> Telekom
Fourth quarter YTD
NOK million 2008 2007 2008 2007
Operating revenues 84 74 300 314
Operating profit before
depreciation 20 9 72 54
Operating profit 6 (2) 22 12
Investments 38 88 128 260
Hafslund Telekom’s fourth-quarter 2008 operating revenues amounted to NOK 84 million, up 14 percent compared with the corresponding 2007 reporting period. Operating revenues for the fourth quarter of 2008 are distributed as follows: fiber optic networks, NOK 34 million (NOK 30 million); grid services, NOK 41 million (NOK 36 million), and wireless communications and housing cooperatives, NOK 9 million (NOK 9 million).
Operating profit before depreciation amounted to NOK 20 million (NOK 9 million), up 120 percent compared with the fourth quarter of 2007. Operating profit for the quarter was NOK 6 million, up NOK 8 million from the year-earlier figure. Investments in the fourth quarter of 2008, which amounted to NOK 38 million (NOK 88 million), were mainly to increase fiber optic network capacity. Focus on growth based on the existing fiber optic network lowered investment requirements.
Effective 31 December 2008, Hafslund Telekom sold its wholly owned subsidiaries Nittedalsnettet AS and Bredbåndservice AS to Pronea AS; total compensation amounted to NOK 25 million. The sale was recorded as roughly break-even and had no significant profit effect. The sale was part of Hafslund Telekom’s strategy to streamline its infrastructure business and strengthen its position in the fiber optic network market.
Upon the establishment of a new Group structure in January 2009, Hafslund Telekom was transferred to the business area Hafslund Venture. Significant industry consolidation is projected and it is regarded as more purposeful for Hafslund Telekom to participate actively in such changes from within the same organization as the Group’s other telecom activities, which are currently managed as part of the Venture portfolio.

10 REPORT TO SHAREHOLDERS - HAFSLUND
> Power Sales
Fourth quarter YTD
NOK million 2008 2007 2008 2007
Operating revenues 1.967 1.424 5.121 3.629
Operating profit before
depreciation 109 47 224 275
Operating profit 108 45 216 267
Power sales (GWh) 3.947 3.876 12.936 12.762
Hafslund’s Power Sales business had operating revenues of NOK1,967 million in the fourth quarter of 2008, up 38 percent compared with the corresponding 2007 reporting period. Operating revenue growth is largely attributable to higher power prices, compared with the year-earlier reporting period.
Power Sales’ fourth-quarter 2008 operating profit was NOK 109 million, up NOK 62 million compared with the year-earlier figure. The fourth-quarter 2008 operating profit is satisfactory for a typically solid quarter — and corresponds to an after-tax operating profit per customer of approximately NOK 122.
The volume of power sold in the fourth quarter of 2008 was 3,984 GWh, up two percent compared with the corresponding 2007 figure. Customer-base growth compensated for consumption that was somewhat lower than in the fourth quarter of 2007. At the close of the fourth quarter of 2008, Power Sales had about 583,000 household customers, an increase of 19,000 customers in 2008. The volume of power sold to residential-market customers totaled 2,646 GWh (2,606 GWh). As of 31 December 2008, Power Sales had some 55,000 corporate-market customers, an increase of approximately 1,000 customers in 2008. The volume of power sold to corporate customers was 1,301 GWh (1,260 GWh).
Customer satisfaction in late 2008 was generally high.
Power Sales – Volume sold
(GWh)
0
1.000
2.000
3.000
4.000
5.000
1Q 2Q 3Q 4Q
2006 2007 2008
> Venture
Fourth quarter YTD
NOK million 2008 2007 2008 2007
Operating revenues 179 127 603 282
Operating profit (excl.
REC) (231) (30) 236 40
- operating profit REC (3.907) 1.936 (15.912) 12.198
Hafslund Venture had a fourth-quarter 2008 operating profit, excluding the Group’s venture portfolio investment in Renewable Energy Corporation (REC), of NOK -236 million (NOK -30 million). The operating profit figure reflects a negative market development of portfolio assets. The accounting treatment of the Group’s REC investment was changed in the fourth quarter, see Note 1 to the accounts in this report to shareholders.
Naturally, the ongoing financial market turbulence has had a strong impact on fourth-quarter 2008 developments. Financial market instability has created challenges as to determining the market value of Venture portfolio investments, other than REC, as of 31 December 2008. The portfolio comprises non-listed investments. NOK 200 million was charged to fourth-quarter profit as a result of declining portfolio values. The Venture portfolio, excluding REC, is recorded in Hafslund’s balance sheet at just over NOK 900 million as of year-end 2008. The following investments comprised 83 percent of Venture’s portfolio, excluding REC, as of 31 December 2008: Fesil Holding, 49.9 percent shareholding; Network Norway, 26.5 shareholding; and Metallkraft, 10.9 percent shareholding.
As of 31 December 2008, Venture’s REC investment had a market value of NOK 4,540 million, at NOK 64.50 per REC share. Accordingly, the book value of the REC investment dropped by NOK 2,886 million in the fourth quarter of 2008. Hafslund owns 70.4 million REC shares, which corresponds to 14.25 percent of outstanding REC shares

11 REPORT TO SHAREHOLDERS - HAFSLUND
> Other Activities
Fourth quarter YTD
NOK million 2008 2007 2008 2007
Support (57) (68) (158) (158)
Power trading (79) 32 (15) 130
Other renewable energy (12) (14) (44) (16)
Real estate 4 536 16 556
Billing and customer service 16 15 82 97
Other (85) (89) (85) (89)
Financial derivatives, ass.
comp. (131) 10 (62) 95
Operating profit other (344) 423 (266) 615
The Hafslund Group’s Other Activities, which include real estate management, power trading, other renewable energy, and staff and support functions, had a fourth-quarter 2008 operating profit of NOK -344 million (NOK 423 million). The above table shows operating profit by Other Activities’ profit centers.
Power trading had a fourth-quarter 2008 operating profit of NOK -79 million (NOK 32 million). Hafslund takes active positions in the power market through the Group’s power trading department. The power trading department undertakes all market trades; to the extent it trades on behalf of other business units, these trades are undertaken on the latter’s account and risk. Profit is derived from trades for various purposes: purchase and sale of power, market position management, hedging, and trading for profit.
The profit center Other renewable energy had a fourth-quarter 2008 operating profit of NOK -12 million. In addition to the new energy recovery facility at Fredrikstad, which incinerates waste-derived fuel, the unit comprises project costs associated with construction of the energy recovery plant at Borregaard in Sarpsborg and a wood pellets factory at Averøya in Møre on the west coast of Norway.
Financial derivatives, profit from associated companies, and other financial income had a fourth-quarter 2008 operating profit of NOK -131 million (NOK 10 million). Financial market turbulence, marked by considerable volatility and major price fluctuations in interest and currency markets, have resulted in some major value changes for Hafslund’s portfolio of financial derivatives. In addition to a loan portfolio featuring a mix of fixed and floating interest, Hafslund has a portfolio of interest-rate swaps whereby liabilities to pay floating interest have been exchanged for fixed-interest liabilities. In addition are swap options requiring payments based on fixed interest rates.
The general decline in swap interest rates in the fourth quarter negatively affected the market value of interest-rate derivatives. Some downside currency hedging of Power Generation’s future euro-denominated revenues is made via FOREX futures and options. The weak Norwegian currency as of 31 December 2008 negatively impacted the market value of portfolio currency derivatives. The aforementioned
factors led to a fourth-quarter 2008 operating profit charge of NOK 156 million. Further, a NOK 13 million profit from the Group’s ownership interest in Infratek ASA, formerly Hafslund Infratek ASA, has been incorporated into the figure for Gain / loss financial items.
Other matters
> Organizational changes
Hafslund ASA has experienced significant growth over the past two years in its district heating and renewable energy activities. Accordingly, the Group has implemented organizational changes to reflect these developments. Effective January 2009, Hafslund’s activities are organized in five business areas: District Heating, Heat and Power, Network, Markets, and Venture.
> Shares and shareholder matters
As of 31 December 2008:
(’000) A-
shares B-
shares Total Hold.
Oslo Kommune 67.525 37.343 104.868 53,7 %
Fortum Forvaltning AS 37.853 28.706 66.559 34,1 %
Østfold Energi AS 5.201 4 5.205 2,7 %
MP Pensjon 1.564 1.564 0,8 %
Verdipapirfond Odin Norden 1.341 1.341 0,7 %
Verdipapirfond Odin Norge 690 690 0,4 %
Hafslund ASA 493 493 0,3 %
BGL 454 454 0,2 %
Svenska Handelsbanken 266 132 398 0,2 %
AS Herdebred 106 258 364 0,2 % Total, 10 largets shareholders 110.951 70.985 181.936 93,2 %
Other shareholders 4.477 8.773 13.250 6,8 %
Total 115.428 79.758 195.186 100 %
Hafslund had 7,566 shareholders as of 31 December 2008. The ten largest shareholders own a total of 93.2 percent of the company’s share capital. Hafslund’s two classes of shares are listed on the Oslo Stock Exchange. As of the close of the fourth quarter of 2008, Hafslund’s market capitalization was NOK 13.3 billion; the figure is based on a per-share price for Class A shares of NOK 68.50 and Class B shares of NOK 67.50. In 2008, Hafslund shares experienced a 57 percent price decline.

12 REPORT TO SHAREHOLDERS - HAFSLUND
Outlook Hafslund’s overall objective is to become Norway’s leading integrated energy company, based on profitable and innovative growth. In the Board’s opinion, the company and its management have the necessary experience and expertise to continue to develop the company toward this goal.
The policy choices made by officials in Norway and Europe to combat global warning will affect power prices and the types of renewable energy projects that will prove financially viable. The European Union’s 202020 climate package is a good example of policy decisions that are decisive to Hafslund’s strategic targets and growth. Hafslund is well positioned to support climate policy goals and participate in business opportunities generated by climate policies.
Power-market price developments exert considerable influence over the Group’s profit performance, particularly at its Power Generation and District Heating businesses. Changes in the regulatory regime governing grid companies in Norway can significantly affect the earnings of the Network business.
Although the ongoing financial-market turbulence has resulted in a challenging credit market, Hafslund continues to be able to borrow considerable funds. Hafslund also has a syndicated EUR 500 million revolving credit facility that runs until May 2012; the loan syndicate comprises nine banks. A steady, large cash flow from operations also maintains the Group’s robust financial position, adequate for ongoing refinancing and the execution of planned investments. No restrictive covenants apply to any of Hafslund’s loan agreements.
In the Board’s opinion, Hafslund is well prepared to meet the challenges the Group will face. The Group’s targeting of renewable energy, distribution grid activities, and a strong market position in retail and corporate power sales position Hafslund well to continue its role as the country’s leading integrated power company.
In the Board’s opinion, Hafslund has built a solid foundation — both commercially and financially — for satisfactory development in 2009.
Oslo, 6 February 2009
Board of Directors

13 REPORT TO SHAREHOLDERS - HAFSLUND
Group profit and loss account
Fourth quarter YTD
2007 2008 NOK million 2008 2007
3.256 3.638 Operating revenues 10.447 8.640
1.993 (4.256) Gain/loss financial items (15.757) 12.496
(2.000) (2.492) Purchased materials and energy (6.685) (5.029)
(207) (255) Salaries and other personnel expenses (688) (641)
(195) (347) Other operating expenses (1.041) (667)
2.847 (3.711) Operating profit before depreciation (13.723) 14.799
(324) (230) Depreciation (850) (892)
2.523 (3.941) Operating profit (14.574) 13.908
(171) (297) Net financial items (684) (445)
2.352 (4.238) Profit before tax and discontinued operations (15.258) 13.463
25 (615) Tax (882) (276)
138 17 Profit discontinued operations 225 151
2.515 (4.837) Profit after tax (15.915) 13.338
2.524 (4.857) Majority's share of profit (15.950) 13.342
(9) 20 Minority's share of profit 35 (4)
12,89 (24,78) Earnings per share (in NOK) (81,54) 68,34
Group balance sheet
NOK million 31.12.2008 30.09.2008 30.06.2008 31.12.2007
Intangible assets 2.343 2.412 2.598 2.580
Fixed assets 18.102 17.926 17.750 17.440
Financial assets 6.452 8.821 10.620 20.086
Accounts receivable and inventory 3.277 2.472 1.898 2.969
Cash and cash equivalents 681 360 586 393
Assets 30.855 31.991 33.451 43.468
Equity, majority 12.256 16.052 17.805 27.836
Equity, minority 170 174 182 99
Allocations for liabilities 3.247 2.885 2.893 2.780
Long-term interest liabilities 8.764 8.027 7.455 8.026
Short-term interest liabilitis 3.760 3.074 3.268 2.837
Other short-term liabilities 2.658 1.780 1.848 1.890
Equity and liabilities 30.855 31.991 33.451 43.468

14 REPORT TO SHAREHOLDERS - HAFSLUND
Group cash flow statement
Fourth quarter YTD
NOK million 2008 2007 2008 2007
Profit before tax (4.238) 2.352 (15.258) 13.463
Depreciation 230 324 850 892
REC market value change on P&L 3.907 (1.936) 15.912 (12.198)
Items without cash flow effect 634 (627) (250) (1.296)
Change in net working capital (953) (1.237) (216) (679)
Cash flow from operations (A) (420) (1.124) 1.038 181
Investments (operation and expansion) (516) (265) (1.727) (3.331)
Sale of assets including business segments 25 698 57 720
Venture investments etc 134 112 (195) 4.908
Cash flow to investments activities (B) (357) 545 (1.865) 2.297
Cash flow dicontinued operations (203) 243 322 274
Dividend and other equity changes © 0 0 (635) (3.475)
Cash flow for financial activities (980) (336) (1.140) (723)
Net interest-bearing debt at beginning of period (10.262) (9.767) (10.102) (9.379)
Net interest-bearing debt at end of period (11.242) (10.102) (11.242) (10.102)
Equity reconciliation
YTD
NOK million 2008 2007
Equtiy as of 1 January 27.935 17.575
Profit for the period, majority's share (15.950) 13.342
Profit for the period, minority's share 35 (4)
Change, minority's interests 19 81
Adjustments booked to equtiy 4 (2)
Value adjustment to equity at transition to subsidiary 0 354
Changes in class A and B shares held (treasury shares) (40) (21)
Dividend (592) (3.458)
REC marketvalue change 1.013 0
Other changes affecting equtiy 2 68
Equtiy at end of reporting period 12.426 27.935

15 REPORT TO SHAREHOLDERS - HAFSLUND
Notes to the accounts
1) Framework and key accounting principles
The fourth-quarter consolidated Group accounts for the period ending 31 December 2008 and the year ended 31 December 2008 have been prepared and presented in accordance with International Financial Reporting Standards (IFRS) as adopted by the EU. The consolidated accounts comprise those of Hafslund ASA and its associated companies and subsidiaries. Hafslund prepares and presents its quarterly consolidated accounts according to IAS 34, Interim Financial Reporting. The information provided by quarterly accounts is not as comprehensive as that provided in the annual accounts; thus, the quarterly accounts should be viewed in conjunction with the 2007 annual accounts. The accounts for the fourth quarter of 2008 are unaudited. Accounting principles applied in the quarterly accounts are the same as those described in Note 1 to the 2007 annual accounts of the Hafslund Group, with the following exceptions:
> Financial assets — reclassification
Hafslund has chosen to reclassify its investment in Renewable Energy Corporation (REC), formerly held for trading purposes, as “available for sale,” in accordance with IAS 39. The purpose of the investment has changed and it is no longer held for short-term sale. The crisis in global financial markets presents a rare opportunity for reclassification. Reclassification has been made at fair value as of the date the decision to reclassify was made — 19 November 2008. Any gain after 19 November is recorded to equity. If the share price as of the balance sheet date is lower than the share price at the time reclassification was decided on, the loss is recognized to the degree it is regarded as material and permanent. Upon share sales, such losses will be recognized in their entirety.
> Balance sheet recording of loan expenses
Loan expenses that are directly attributable to an asset produced for sale or own consumption, are recorded on the balance sheet as part of the acquisition cost in instances where the production period stretches across multiple accounting periods. The capitalization rate is based on a weighted average of the Group’s loan expenses for loans outstanding for the recording period.
2) Operating profit — significant items
Hafslund’s 70.4 million-share interest in Renewable Energy Corporation (REC) represents a significant investment for the Group. REC is listed on the Oslo Stock Exchange; the REC investment is carried at market value in the consolidated Hafslund Group accounts. Until 19 November 2008, changes in the value of REC shares were recorded in the profit and loss account under Gain / loss financial items. As of 31 December 2008, the per-share price of REC shares was NOK 64.50, which represents a NOK 41 decline in the fourth quarter and a NOK 211.50 decline in 2008. Accordingly, the value of the Group’s REC shares decreased by NOK 3,908 million in the fourth quarter of 2008 and by NOK 15,913 million in 2008. This compares with gains of NOK 1,936 million in the fourth quarter of 2007 and NOK 12,198 million for 2007 as a whole. The NOK 1,021 million value increase from 19 November through year-end 2008 is recorded to equity. As of 31 December 2008, the REC investment is carried on the Group’s balance sheet at NOK 4.5 billion.

16 REPORT TO SHAREHOLDERS - HAFSLUND
3) Business segment reporting
Fourth quarter YTD
2007 2008 NOK million 2008 2007
196 310 Power generation 1.001 635
216 279 District Heating 691 562
885 999 Network 3.352 3.194
74 84 Telecom 300 314
1.424 1.967 Power sales 5.121 3.629
127 179 Venture 603 282
334 (181) Other activities/eliminations (622) 23
3.256 3.638 Total operating revenue 10.447 8.640
119 271 Power generation 713 406
21 61 District Heating 96 14
11 95 Network 322 354
(2) 6 Telecom 22 12
45 108 Power sales 216 267
1.906 (4.138) Venture (15.676) 12.238
423 (344) Other activities/eliminations (266) 615
2.523 (3.941) Total operating profit (14.574) 13.908
4) Network activities — income ceiling and excess/under income
IFRS-imposed accounting treatment of grid rental charges disallows balance sheet recording of certain revenue receivables and liabilities. Grid rental revenues are recognized at the time of invoicing. The amount recognized corresponds to the recording period’s delivered volume settled at the current tariff. A grid company’s regulated income ceiling is established by the Norwegian Water Resources and Energy Directorate (NVE). Total allowed revenue comprises the company’s income ceiling plus transmission costs, Norway’s Enova energy conservation surcharge, and applicable taxes such as Norway’s hydropower facility tax and real estate taxes, while penalty charges for service outages are excluded.
Any difference between invoiced amounts and the regulated income ceiling established by NVE is called excess/under income. IFRS defines such excess/under income as a regulatory liability/asset that does not generally qualify for balance sheet recognition. The reasoning behind this is that no contract has been entered into with any specific customer and thus, in theory, the receivable is contingent on a future delivery. However, revenues in individual years may deviate from the revenue level permitted by NVE. Tariffs are managed based on the premise that annual revenues, over time, will accord with the allowed revenue level. The term “excess income” is used if grid rental income is greater than the income ceiling determined by NVE for the year in question. Similarly, the term “under income” applies if grid rental income was lower than the ceiling.
The 2008 income ceiling recognized in Network’s accounts is based on the income framework determined by NVE, less service interruption penalties, was NOK 1,989 million, which is NOK 99 million less than in 2007. Network’s fourth-quarter 2008 profit includes excess income of NOK 96 million (NOK -129 million). For 2008 as a whole, Network profit includes excess income of NOK 205 million (NOK -51 million). As of the close of 2007, Hafslund Network had an income deficiency of NOK 56 million; deducting this figure from 2008’s excess income of NOK 205 million results in a year-end 2008 excess income figure of NOK 149 million.
5) Interest-bearing loans and credit facilities
As of 31 December 2008, the accounting value of Hafslund’s loan portfolio was NOK 12,432 million, of which NOK 7,653 million is long-term debt, NOK 1,193 million matures within twelve months and is classified as current liabilities, and NOK 3,586 million is short-term debt. Changes in the fair value of loans and derivatives were as follows: in the fourth quarter of 2008, a negative profit effect of NOK 112 million; for 2008 as a whole, a positive profit effect of NOK 3 million. Changes in the fair value of interest and currency derivatives were as follows: in the fourth quarter of 2008, a negative profit effect of NOK 157 million; for 2008 as a whole, a NOK 160 million negative profit effect.
In the fourth quarter of 2008, the credit spread on Hafslund’s loans increased for all terms of maturity as follows: some 15 basis points higher for short terms to maturity and just over 60 basis points for terms to maturity of more than five years. Swap interest, on the other hand, fell significantly, declining by some four percentage points for short terms to maturity and about one percentage point for longer terms to maturity. The net effect of these changes was that market interest (including Hafslund’s

17 REPORT TO SHAREHOLDERS - HAFSLUND
credit spread) decreased for all terms to maturity, by up to four percentage points for terms to maturity of up to one year and slightly less than four percentage points for longer terms to maturity.
Changes in the fair value of loans are recorded under Financial expenses, whereas changes in the value of interest and currency derivatives are recorded under Profit, financial assets and associated companies. There are no financial covenants associated with the Group’s loan portfolio. The Group has significant interest-bearing debt. Of the total loan and derivatives portfolio, fixed-interest loans amounted to 37 percent, and floating-interest-rate loans made up the remaining 63 percent, as of the close of the fourth quarter of 2008. The drop in market interest is expected to result in somewhat lower financial expenses for the Group. Also, revenues from the grid business will weaken somewhat as its regulated income is adjusted in step with changes in 5-year Norwegian government bond interest rates, which showed a falling trend in the fourth quarter of 2008.
The Group’s foreign currency exposure is largely associated with euro-denominated revenues from power production sold via Nord Pool. Some of this currency risk is hedged on an ongoing basis. Regarding loans in foreign currencies, the Group enters into interest and foreign currency swaps so that payments of interest and principal are in Norwegian kroner. The Group’s finance department centrally manages currency risk. The Hafslund Group’s risk associated with foreign currency fluctuations has not changed materially since year-end 2007.
6) Operating assets
Investments in operating assets amounted to NOK 1,693 million in 2008. Of this amount, NOK 1,688 million was invested in ordinary operating and expansion investments, and NOK 5 million represents operating assets acquired through corporate acquisitions.
7) Transactions with closely related parties
As of 31 December 2008, the City of Oslo owns 53.7 percent of Hafslund ASA shares, and thus is regarded as a closely related party. Hafslund sells goods and services to and purchases them from the City of Oslo. Examples of significant sales to the City of Oslo are power, street lighting operation, and associated maintenance and investments. Hafslund also leases fiber optic network services to the City of Oslo. Significant purchases include payments for energy from waste incineration purchased from the City’s energy recovery department and right-of-way fees associated with fiber optic network development paid to the transportation department. All transactions are at market terms.
As of 31 December 2008, receivables from closely related parties amounted to NOK 72 million, largely attributable to sales of goods and services. Accounts payable to closely related parties amounted to NOK 9 million as of 31 December 2008, largely for purchases of goods and services. Total sales of goods and services to closely related parties in 2008 amounted to NOK 212 million; total purchases of goods and services amounted to NOK 86 million.
8) Contingent liabilities and events
> Contingent liabilities — Pension liabilities for former Network employees and retirees
The pension fund manager Kommunal Landspensjonskasse (KLP) has notified Hafslund Nett AS of its claim that Hafslund is responsible for pension liabilities associated with 597 individuals who are former employees or current retirees of grid companies that are now part of Hafslund Nett and Infratek. A recently updated actuarial determination indicates that the claim amounts to a NOK 162 million net pension liability. As part of its claim, KLP has demanded that Hafslund cover a regulating premium totaling NOK 25 million for the years 2005-2008. This demand is associated with the collective pension agreements that were terminated vis-à-vis KLP as of 2003 and earlier.
Subsequent to termination of the agreements, KLP has failed to delineate clearly who bears financial responsibility after the termination, and whether a customer relationship exists between Hafslund Nett and the business activities Hafslund has acquired. Further, it is unclear whether Hafslund has actually assumed responsibility for the historic pension requirements of the eight grid companies as a result of acquiring them. Hafslund has initiated a process to clarify any factual basis for KLP’s claim.
Despite considerable uncertainty as to the claim’s legal basis and whether Hafslund has actually acquired employer responsibilities covering all or any of the affected former employees, following individual assessment(s) an allocation has been made to the accounts.
> Tax on gains on conversion of convertible Renewable Energy Corporation ASA bonds
Hafslund Venture AS owned stakes in two convertible bonds issued by Renewable Energy Corporation ASA (REC) that were converted in March 2006. Hafslund received 32,264,094 shares (following a 1:20 share split) upon conversion. Value growth up until the date of conversion, which is largely attributable to the subscription rights/option element associated with the convertible bonds, is presented as a part of the overall value growth of REC shares in 2006 and recognized in the profit and loss account under Gain / loss financial items.
In its 2006 tax returns, Hafslund treated the gains related to the receivable/loan as taxable, and those associated with the option, which relates to the value growth of the underlying REC share, are treated as tax exempt income under the exemption

18 REPORT TO SHAREHOLDERS - HAFSLUND
model. In a notice of adjustment, Norway’s corporate tax office (Sentralskattekontoret for storbedrifter) ruled that the gain is taxable in its entirety, because the receivable/loan component must be regarded as the dominant element.
The corporate tax office assumes a market price of NOK 81.50 at the time of conversion. Pursuant to the tax office’s decision, Hafslund Venture’s taxable income for the 2006 tax year will increase by NOK 2.1 billion. Hafslund disputes the tax office’s assessment. In Hafslund’s view, all or most of the gain is tax exempt. Accordingly, Hafslund maintains the view presented in its 2007 financial statements that the gain must be decomposed for tax purposes into a receivable/loan component and a subscription rights component. Nevertheless, Hafslund has applied the decision of the corporate tax office and recognized a NOK 600 million tax expense in the fourth quarter of 2008.
> Sale of shares in Hatros I AS
Hafslund has significant real estate at its disposal. As part of the Group’s strategy to professionalize its real estate operations, the Group began a process of restructuring them by transferring properties, transformer stations, and lots from Hafslund Nett AS to subsidiaries of Hafslund Eiendom AS. In 2006 and 2007, eleven real estate companies were established and two, Hatros I AS and Hatros II AS, were sold. Hafslund Nett AS regards the sale of these companies as tax exempt under the exemption model. In December 2008, the company received a notice from Norway’s corporate tax office stating that the spinoff and transfer would be subject to taxation, based on the principle of assigning appropriate financial responsibility.
Consequently, the corporate tax office will assess whether the company is to be taxed on the gain from real estate sales. Hafslund disagrees with the tax office’s evaluation. In Hafslund’s view, it is more likely than not that the transactions cannot be taxed according to the aforementioned principle of assigning financial responsibility, because they have a commercial motivation consistent with the purpose behind both the spin-off rules and the exemption method. In the 2008 financial statements, the transactions are treated as tax exempt, and no allocations are made for tax claims.
> 9) Divested business activities – Hafslund Sikkerhet Privat
Effective 15 September 2008, Hafslund sold its residential alarm business, which comprised Hafslund Sikkerhet Privat AS and Hafslund Boligteknikk AS, to Securitas Direct AS for NOK 542 million. Under the sales agreement, Hafslund has extended a SEK 310 million seller’s credit to Securitas. Profit from the divested business is entered on a separate line in the profit and loss account under Profit from discontinued operations. Operating revenues from the divested business activities amounted to NOK 167 million in 2008. The third quarter 2008 NOK 181 million profit from discontinued operations included the NOK 169 million gain on the sale of the.
> 10) Historical figures – restatement
Effective 1 January 2009, Infratek ASA acquired Fortum’s infrastructure business. As part of the settlement for the acquisition, Fortum received newly issued Infratek shares, thus diluting Hafslund’s ownership interest in Infratek to 43.3 percent. In the profit and loss statement, Infratek is presented on the line Profit from discontinued operations at NOK 45 million. Comparative 2007 and 2006 figures have been restated. On the balance sheet, Infratek assets and liabilities as of 31 December 2008 are presented as Investments held for sale as follows: NOK 496 million in short-term receivables and NOK 221 million in short-term debt.
11) Impairment testing
Hafslund has carried out impairment tests for all of its intangible assets with undefined life expectancies, all goodwill, and fixed assets associated with the following businesses: Network, District Heating, Power Generation, Telekom, and Power Sales. The impairment test for Network is based on the assumption that government regulation of income will provide sustainable conditions in the future.
The impairment tests have not indicated that there is any need for write-downs. As part of those tests, sensitivity analyses, in which the recoverable amount is estimated by applying a 20 percent reduction in residual value and a 20 percent increase in discount rate, have been carried out. Present value under these analyses exceeds book values.
19 REPORT TO SHAREHOLDERS - HAFSLUND
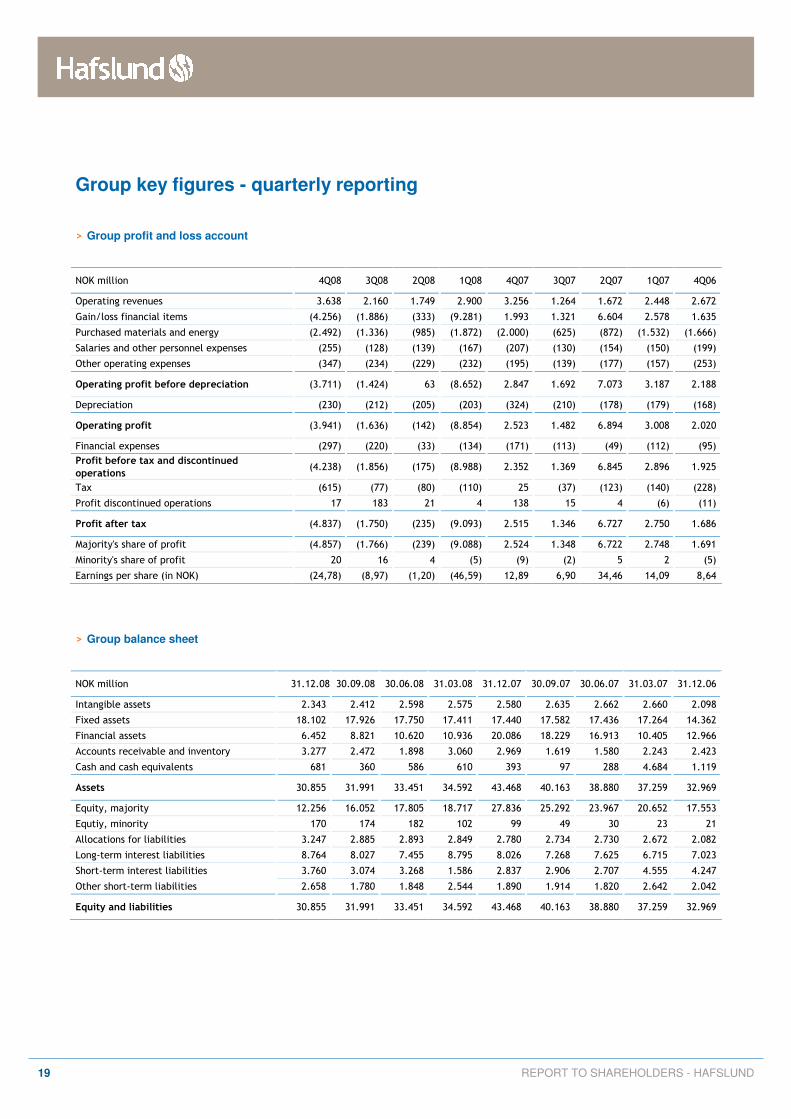
Group key figures - quarterly reporting
> Group profit and loss account
NOK million 4Q08 3Q08 2Q08 1Q08 4Q07 3Q07 2Q07 1Q07 4Q06
Operating revenues 3.638 2.160 1.749 2.900 3.256 1.264 1.672 2.448 2.672
Gain/loss financial items (4.256) (1.886) (333) (9.281) 1.993 1.321 6.604 2.578 1.635
Purchased materials and energy (2.492) (1.336) (985) (1.872) (2.000) (625) (872) (1.532) (1.666)
Salaries and other personnel expenses (255) (128) (139) (167) (207) (130) (154) (150) (199)
Other operating expenses (347) (234) (229) (232) (195) (139) (177) (157) (253)
Operating profit before depreciation (3.711) (1.424) 63 (8.652) 2.847 1.692 7.073 3.187 2.188
Depreciation (230) (212) (205) (203) (324) (210) (178) (179) (168)
Operating profit (3.941) (1.636) (142) (8.854) 2.523 1.482 6.894 3.008 2.020
Financial expenses (297) (220) (33) (134) (171) (113) (49) (112) (95)
Profit before tax and discontinued
operations (4.238) (1.856) (175) (8.988) 2.352 1.369 6.845 2.896 1.925
Tax (615) (77) (80) (110) 25 (37) (123) (140) (228)
Profit discontinued operations 17 183 21 4 138 15 4 (6) (11)
Profit after tax (4.837) (1.750) (235) (9.093) 2.515 1.346 6.727 2.750 1.686
Majority's share of profit (4.857) (1.766) (239) (9.088) 2.524 1.348 6.722 2.748 1.691
Minority's share of profit 20 16 4 (5) (9) (2) 5 2 (5)
Earnings per share (in NOK) (24,78) (8,97) (1,20) (46,59) 12,89 6,90 34,46 14,09 8,64
> Group balance sheet
NOK million 31.12.08 30.09.08 30.06.08 31.03.08 31.12.07 30.09.07 30.06.07 31.03.07 31.12.06
Intangible assets 2.343 2.412 2.598 2.575 2.580 2.635 2.662 2.660 2.098
Fixed assets 18.102 17.926 17.750 17.411 17.440 17.582 17.436 17.264 14.362
Financial assets 6.452 8.821 10.620 10.936 20.086 18.229 16.913 10.405 12.966
Accounts receivable and inventory 3.277 2.472 1.898 3.060 2.969 1.619 1.580 2.243 2.423
Cash and cash equivalents 681 360 586 610 393 97 288 4.684 1.119
Assets 30.855 31.991 33.451 34.592 43.468 40.163 38.880 37.259 32.969
Equity, majority 12.256 16.052 17.805 18.717 27.836 25.292 23.967 20.652 17.553
Equtiy, minority 170 174 182 102 99 49 30 23 21
Allocations for liabilities 3.247 2.885 2.893 2.849 2.780 2.734 2.730 2.672 2.082
Long-term interest liabilities 8.764 8.027 7.455 8.795 8.026 7.268 7.625 6.715 7.023
Short-term interest liabilities 3.760 3.074 3.268 1.586 2.837 2.906 2.707 4.555 4.247
Other short-term liabilities 2.658 1.780 1.848 2.544 1.890 1.914 1.820 2.642 2.042
Equity and liabilities 30.855 31.991 33.451 34.592 43.468 40.163 38.880 37.259 32.969

20 REPORT TO SHAREHOLDERS - HAFSLUND
> Business segment reporting
NOK million 4Q08 3Q08 2Q08 1Q08 4Q07 3Q07 2Q07 1Q07 4Q06
Power generation 310 326 157 208 196 97 160 183 355
District heating 279 58 81 273 216 45 65 236 8
Network 999 760 750 843 885 656 831 823 887
Telecom 84 76 76 64 74 65 87 87 89
Power sales 1.967 946 694 1.513 1.424 423 602 1.180 1.476
Venture, ass. comp., financial items 179 122 180 122 127 70 55 30 37
Other activities/eliminations (181) (128) (189) (123) 334 (91) (128) (92) (180)
Total sales income 3.638 2.160 1.749 2.900 3.256 1.264 1.672 2.448 2.672
Power generation 287 306 19 146 129 65 103 151 320
District heating 92 (7) 12 129 60 (5) 0 97 3
Network 231 208 210 218 166 188 281 248 210
Telecom 20 22 21 9 9 17 15 14 11
Power sales 109 (48) 43 119 47 38 68 122 76
Venture, ass. comp., financial items (4.122) (1.892) (371) (9.260) 1.914 1.295 6.517 2.525 1.306
Other activities/eliminations (328) (13) 128 (13) 521 92 88 29 261
Total operating profit before
depreciation (3.710) (1.424) 63 (8.652) 2.845 1.691 7.071 3.185 2.186
Power generation 271 297 9 135 119 55 92 141 306
District heating 61 (40) (22) 97 21 (60) (22) 75 2
Network 95 70 73 84 11 70 154 120 82
Telecom 6 8 11 (4) (2) 6 4 4 3
Power sales 108 (50) 41 117 45 37 66 120 73
Venture, ass. comp., financial items (4.138) (1.897) (377) (9.265) 1.906 1.292 6.517 2.523 1.305
Other activities/eliminations (344) (26) 123 (19) 423 83 83 25 250
Total operating profit (3.941) (1.636) (142) (8.854) 2.523 1.482 6.894 3.008 2.020

21 REPORT TO SHAREHOLDERS - HAFSLUND
Hafslund ASA
Drammensveien 144, Skøyen N-0247 Oslo, Norway
Tel: + 47 22 43 50 00 Faks + 47 22 43 51 69
www.hafslund.no email: [email protected]