report to the president science and … to the president science and technology to ensure the ......
TRANSCRIPT
REPORTTOTHEPRESIDENTScienceandTechnologytoEnsuretheSafetyoftheNation’sDrinkingWater
ExecutiveOfficeofthePresident
President’sCouncilofAdvisorsonScienceandTechnology
December2016

REPORTTOTHEPRESIDENT
ScienceandTechnologytoEnsuretheSafetyoftheNation’sDrinkingWater
ExecutiveOfficeofthePresident
President’sCouncilofAdvisorsonScienceandTechnology
December2016
AboutthePresident’sCouncilofAdvisorsonScienceandTechnology
ThePresident’sCouncilofAdvisorsonScienceandTechnology(PCAST)isanadvisorygroupoftheNation’s leadingscientistsandengineers,appointedby thePresident toaugment thescienceandtechnology advice available to him from inside theWhite House and from cabinet departmentsandotherFederal agencies. PCAST is consulted about, and oftenmakespolicy recommendationsconcerning,thefullrangeofissueswhereunderstandingsfromthedomainsofscience,technology,andinnovationbearpotentiallyonthepolicychoicesbeforethePresident.
FormoreinformationaboutPCAST,seewww.whitehouse.gov/ostp/pcast

v
ThePresident’sCouncilofAdvisorsonScienceandTechnology
Co‐Chairs
JohnP.HoldrenAssistanttothePresidentforScienceandTechnology
Director,OfficeofScienceandTechnologyPolicy
EricS.LanderPresidentBroadInstituteofHarvardandMIT
ViceChairs
WilliamPressRaymerProfessorinComputerScienceandIntegrativeBiology
UniversityofTexasatAustin
MaxineSavitzHoneywell(ret.)
Members
WandaM.AustinPresidentandCEO(ret.)TheAerospaceCorporation
S.JamesGates,Jr.JohnS.TollProfessorofPhysicsDirector,CenterforStringandParticleTheoryUniversityofMaryland,CollegePark
RosinaBierbaumProfessor,SchoolofNaturalResourcesandEnvironment,UniversityofMichigan
RoyF.WestinChairinNaturalEconomics,SchoolofPublicPolicy,UniversityofMaryland
MarkGorenbergManagingMemberZettaVenturePartners
ChristineCasselPlanningDeanKaiserPermanenteSchoolofMedicine
SusanL.GrahamPehongChenDistinguishedProfessorEmeritainElectricalEngineeringandComputerScience
UniversityofCalifornia,Berkeley
ChristopherChybaProfessor,AstrophysicalSciencesandInternationalAffairs
PrincetonUniversity
MichaelMcQuadeSeniorVicePresidentforScienceandTechnology
UnitedTechnologiesCorporation

vi
ChadMirkinGeorgeB.RathmannProfessorofChemistryDirector,InternationalInstituteforNanotechnology
NorthwesternUniversity
BarbaraSchaalDeanoftheFacultyofArtsandSciencesMary‐DellChiltonDistinguishedProfessorofBiology
WashingtonUniversityofSt.Louis
MarioMolinaDistinguishedProfessor,ChemistryandBiochemistry
UniversityofCalifornia,SanDiegoProfessor,CenterforAtmosphericSciencesScrippsInstitutionofOceanography
EricSchmidtExecutiveChairmanAlphabet,Inc.
CraigMundiePresidentMundieAssociates
DanielSchragSturgisHooperProfessorofGeologyProfessor,EnvironmentalScienceandEngineering
Director,HarvardUniversityCenterforEnvironment
HarvardUniversity
EdPenhoetDirectorAltaPartnersProfessorEmeritus,BiochemistryandPublicHealth
UniversityofCalifornia,BerkeleyStaff
AshleyPredithExecutiveDirector
DianaE.PankevichSciencePolicyConsultant
JenniferL.MichaelProgramSupportSpecialist
vii
PCASTScienceandTechnologytoEnsuretheSafetyoftheNation’sDrinkingWater‐Working
GroupWorkingGroupmembersparticipatedinthepreparationofaninitialdraftofthisreport.ThoseworkinggroupmemberswhoarenotPCASTmembersarenotresponsiblefor,nornecessarilyendorse,thefinalversionofthisreportasmodifiedandapprovedbyPCAST.
WorkingGroupCo‐Chairs
RosinaBierbaumProfessor,SchoolofNaturalResourcesandEnvironment,UniversityofMichigan
RoyF.WestinChairinNaturalEconomics,SchoolofPublicPolicy,UniversityofMaryland
ChristineCasselPlanningDeanKaiserPermanenteSchoolofMedicine
WorkingGroup
MatthewDavisDivisionHead,AcademicGeneralPediatricsandPrimaryCare
Director,SmithChildHeathResearchProgramAnn&RobertH.LurieChildren’sHospitalofChicago
NorthwesternUniversityFeinbergSchoolofMedicine
BobPerciasepePresidentCenterforClimateandEnergySolutions
JohnP.Holdren*AssistanttothePresidentforScienceandTechnology
Director,OfficeofScienceandTechnologyPolicy
JoanRoseLaboratoryDirector/PrincipalInvestigatorHomerNowlinChairinWaterResearchDepartmentofFisheriesandWildlife
MichiganStateUniversity
EdPenhoet*DirectorAltaPartnersProfessorEmeritus,BiochemistryandPublicHealth
UniversityofCalifornia,Berkeley
MaxineSavitz*Honeywell(ret.)
viii
OrrenSchneiderManager,WaterTechnologyAmericanWater
NancySutleyChiefSustainabilityandEconomicDevelopmentOfficer
LosAngelesDepartmentofWaterandPower
DanielSchrag*SturgisHooperProfessorofGeologyProfessor,EnvironmentalScienceandEngineering
Director,HarvardUniversityCenterforEnvironment
HarvardUniversity
PaulWesterhoffProfessor&SeniorAdvisoronScienceandEngineeringtotheASUViceProvost
ArizonaStateUniversity
ChadSeidelDeRISKCenterTechnologyDirectorUniversityofColoradoBoulderStaff
DianaE.PankevichSciencePolicyConsultant
AshleyPredithExecutiveDirector
BruceRodanAssistantDirectorEnvironmentalHealthOfficeofScienceandTechnologyPolicy
*denotesPCASTmember

EXECUTIVEOFFICEOFTHEPRESIDENTPRESIDENT’SCOUNCILOFADVISORSONSCIENCEANDTECHNOLOGY
WASHINGTON,D.C.20502
PresidentBarackObamaTheWhiteHouseWashington,DC20502DearMr.President:We are pleased to send you the full report, “Science and Technology to Ensure the Safety of the Nation’s Drinking Water”, by your Council of Advisors on Science and Technology (PCAST), following transmission of the Executive Summary to you last month.
Americans have come to expect access to safe and affordable drinking water as a fundamental right and integral part of sustaining public health. And, indeed, public drinking-water systems in the United States provide high-quality drinking water most of the time in most places. But public confidence regarding the quality of their drinking water has been shaken lately by a series of high-visibility crises. When you visited Flint, Michigan, following revelations about lead in the tap water there, you stated, “It’s not too much to expect for all Americans that their water is going to be safe.”
The recent crises highlight the long-term national challenges to maintaining high-quality drinking water, resulting particularly from continuing and legacy source-water pollution and an aging infrastructure that is in need of significant repair and modernization. Advances in science and technology will offer new opportunities for the development of safe, affordable, and reliable monitoring and treatment options for public and private water systems.
The new report highlights a number of near- and long-term recommendations that will empower Federal agencies and their partners in the states, academia, and the private sector to develop and implement the scientific and technological advances that will help to further improve the safety of the Nation’s drinking-water system.
The near-term recommendations are targeted toward actions that the Administration can undertake in the areas of monitoring for contaminants, with a focus on monitoring exposure in particularly vulnerable populations; development of strategies for improved data sharing and accessibility; and growth and training of the water system workforce. PCAST categorized these recommendations as “near-term” because there currently exist either personnel, funding, or programs that can help jump start the implementation of these recommendations.
PCAST’s long-term recommendations are aimed at coordination and execution of a Federal strategy for the research and application of science and technology to more fully understand and address the challenges of providing safe drinking water for everyone, all the time. These recommendations include improved quantitative assessments of comparative risk across contaminants; development and deployment of innovative, next-generation water technologies; and launching city-based demonstration pilots to assess innovative technologies in realistic conditions. Carrying out this work would, of course, require dedicated resources.
PCAST developed this report with the assistance of a Working Group led by PCAST Members Rosina Bierbaum and Chris Cassel, which included four other PCAST members and seven top drinking-water experts from Federal agencies, public water systems, academia, and civil society. The Working Group members—and all of PCAST—are grateful to have had the opportunity to serve you and the Nation through this project.
Sincerely,
JohnP.Holdren EricS.LanderCo‐Chair Co‐Chair

xi
TableofContents The President’s Council of Advisors on Science and Technology .................................................... v
PCAST Science and Technology to Ensure the Safety of the Nation’s Drinking Water Working Group ............................................................................................................................... vii
Table of Contents ........................................................................................................................... xi
Executive Summary ......................................................................................................................... 1
PCAST’s Recommendations .................................................................................................. 14
1. Introduction ............................................................................................................................... 22
2. Drinking‐Water Contamination ................................................................................................ 24
2.1 The Nation’s Drinking‐Water System .............................................................................. 24
2.2 Drinking‐Water Contamination at the Source ................................................................ 25
2.3 Contamination Issues at Drinking‐Water Treatment Plants ........................................... 27
2.4 Contamination Issues in Distribution Systems ............................................................... 27
3. Treatment and Monitoring of Drinking Water ......................................................................... 31
3.1 Regulatory Oversight of Drinking‐Water Safety ............................................................. 31
3.2 The Special Case of Lead ................................................................................................. 33
3.3 Risk Comparisons ............................................................................................................ 35
3.4 Monitoring Issues ........................................................................................................... 38
3.5 U.S. Drinking‐Water Safety in Practice ........................................................................... 39
3.6 Best Current and Emerging Treatment Technologies ..................................................... 44
3.7 Best Current and Emerging Monitoring Technologies .................................................... 46
4. Supporting Safe Drinking Water ............................................................................................... 48
4.1 Ongoing National Activities on S&T for Safe Drinking Water ......................................... 48
4.2 The EPA Drinking Water Action Plan .............................................................................. 50
5. Near‐Term Targeted Recommendations .................................................................................. 51
5.1 Increased Monitoring of Drinking‐Water Contaminants, Especially for Vulnerable Populations .................................................................................................................. 51
5.2 Big Data Analytics for Drinking‐Water Systems .............................................................. 55
5.3 Increase Data Collection and Sharing Through Citizen Science ...................................... 57
5.4 Developing the Drinking‐Water Treatment and Distribution‐System Workforce .......... 62
6. Long‐Term Targeted Recommendations .................................................................................. 66
6.1 Federal Coordination of Research and Development Focused on Safe Drinking Water ........................................................................................................................... 66
6.2 Developing the Next Generation of Technologies to Improve Safety of Drinking Water ........................................................................................................................... 67

xii
6.3 Comparative Risk Assessment ........................................................................................ 70
6.4 Drinking‐Water Innovation in American Cities ............................................................... 74
Appendix A. Additional Experts Providing Input .......................................................................... 79
Appendix B. Abbreviations and Acronyms ................................................................................... 83

1
ExecutiveSummaryAmericans have come to expect access to safe and affordable drinking water as a fundamental right and
integral part of sustaining public health. And, indeed, public drinking‐water systems in the United States
provide safe, high‐quality drinking water most of the time in most places. But public confidence
regarding the quality of their drinking water has been shaken lately by a series of high‐visibility crises
that have resulted in temporary drinking‐water‐system closures and do‐not‐use advisories. These high‐
profile crises highlight the long‐term, national challenges to maintaining high‐quality drinking water,
resulting particularly from continuing and legacy pollution of source waters and an aging infrastructure
that is in need of significant repair and modernization.
As part of the Administration’s response to concerns about the safety of the Nation’s drinking water,
underscored by the revelations about lead in tap water in Flint, Michigan, President Obama asked his
President’s Council of Advisors on Science and Technology (PCAST), in March 2016, how science and
technology (S&T) could more effectively be brought to bear on the challenge of ensuring the safety of
the Nation’s drinking water. PCAST was not asked to address non‐S&T dimensions of the provision of
safe drinking water, such as Federal‐State‐local responsibilities and interactions, management issues
(unless directly related to advancing S&T opportunities), and financing of drinking‐water infrastructure,
nor was it asked to address safety of bottled water.
Following preliminary exploration of the S&T issues around safe drinking water, PCAST organized a day‐
long national workshop of drinking‐water experts from Federal agencies, public water systems,
academia, the medical community, and civil society to help shape the inquiry. A working group
reflec ng that diversity of exper se was then cons tuted―comprising six members of PCAST and seven
of the outside experts who participated in the workshop—to conduct the study. The findings and
recommendations reported here have been reviewed and approved by the full PCAST and are the
responsibility of PCAST alone.
In the remainder of this Executive Summary, we provide a brief overview of characteristics of the
national drinking‐water system and the challenges it presents, turning finally to a set of key findings and
recommendations that follow from them.
TheNation’sDrinking‐WaterSystem
The drinking water consumed by Americans comes from a variety of sources, mainly surface water and
groundwater, of varying degrees of initial purity, and it is delivered by means ranging from direct
withdrawal from individual private wells to long‐distance transport from distant reservoirs, followed by
various forms of filtering and disinfection in treatment plants and distribution through networks of
underground piping to reach individual residential, commercial, and public buildings. In nearly all cases,
the water also passes through “premise plumbing” to reach the tap.
The drinking‐water systems that manage the flows from source to premise vary enormously in size, type
of treatment, and ownership. As of 2016, there are over 150,000 public drinking‐water systems in the

2
United States―systems that have 15 or more connec ons or serve more than 25 people. (“Public” here
refers to the people served, not to ownership.) Of these 150,000 systems, 50,000 are community water
systems that supply water to the same population year‐round; these serve over 300 million Americans.
The community water systems that rely on surface water as their source serve about 200 million people,
those that rely on ground water about 100 million. Just 3 percent of the community water systems—
those that serve over 10,000 people each—provide the drinking water for 79 percent of the U.S.
population.
The 100,000 non‐community public water systems are transient and non‐transient systems that supply
such entities as campgrounds, in the first instance, and office buildings, schools, and hospitals that have
their own water systems, in the second. About 45 million people, or approximately 15 percent of the
U.S. population, get all or part of their water from private wells.
The approach to ensuring the safety of drinking water in U.S. public water systems is to place multiple
barriers to contamination along the entire water system from the source, to multiple decontamination
and disinfection processes in treatment plants, to maintenance of water‐distribution systems, to (in
some cases) filters at the tap. The locations within the water system where water quality can be
monitored and problems addressed are called “critical control points” and historically have been
principally at the source, at various points within the treatment plant, and at certain points within the
distribution system. Operationally, water utilities may have sensors and critical control points within
water‐treatment plants to assess performance of individual processes. Relatively little monitoring has
been done, however, at the final critical control point—the consumer’s tap. This omission is due in part
to the lack of jurisdiction of the water utility over what happens in the premise plumbing—that is, the
pipes, valves, and fixtures on the consumer’s property—and in part due to lack of consumer motivation
and knowledge.
Drinking‐WaterContaminationattheSource
Ground water and surface water are each susceptible to contamination by multiple phenomena. These
include discharge of sewage (which may be further contaminated by household chemicals) and of
industrial, mining, and agricultural wastes; unintended spills, discharges, leakage, and seepage of all of
these and of fossil fuels in extraction, processing, transport, and storage; wet and dry fallout from
atmospheric pollution; and dissolution of naturally occurring, potentially toxic elements (such as arsenic)
from soil and rock. The presence of nitrates and phosphates from domestic and agricultural sources,
moreover, can nourish blooms of algae that are directly toxic or conducive to bacterial population
explosions.
Across the Nation over half of all surface water intakes for drinking‐water treatment facilities serving
more than 10,000 people are impacted by at least one upstream wastewater discharge, and many have
more than 10 upstream wastewater sources. Smaller rivers and drinking‐water facilities are even more
influenced by the potential microbial and chemical loads from these upstream wastewater plants, and
even modest seasonal changes in streamflow can result in rivers containing in excess of 50 percent
water of wastewater origin at the point of intake for downstream drinking‐water facilities.
Problems with the quantity of drinking‐water sources can magnify problems of quality. For example,
reduced volume of surface and groundwater resulting from seasonal low flows, drought, or overuse

3
means less dilution of contaminants; shortfalls in water availability from the cleanest sources may force
resort to lower‐quality supplies; heavy downpours and flooding can increase the amount of runoff into
rivers and lakes, washing sediment, nutrients, pollutants, and other materials into water supplies; and
floods may swamp sewage‐treatment plants, leading to discharge of untreated wastes, or overflow
storage ponds for agricultural and mining wastes.
The quantity/quality problems with drinking‐water sources are being exacerbated by impacts of global
climate change on the United States, as elaborated in the Third National Climate Assessment released in
2014 and the Fourth Assessment’s 2016 special report on climate change and human health. For
example:
Increases in water temperatures are altering the seasonal windows of growth and the
geographic range of suitable habitat for freshwater toxin‐producing harmful algae and certain
naturally occurring Vibrio bacteria, one species of which causes cholera.
Decreased snowpack and earlier, faster spring snowmelt are decreasing summer and fall river
flows.
Sea level rise puts freshwater resources along the coasts at risk from saltwater intrusion.
Droughts are becoming longer and more intense in some regions, even as torrential downpours
and associated flooding become more prevalent in others.
And a lengthening wildfire season, exacerbated by drought and massive tree die‐offs caused by
insect infestations, is increasing the area that is burned and that, as a result, is susceptible to
accentuated erosion in subsequent storms, transporting sediment and contaminants into water‐
supply reservoirs where they can impact drinking water quality for periods ranging from days to
years.
All of these climate‐related impacts on source‐water quantity and quality can be expected to grow for
some decades to come as climate continues to change.
ContaminationIssuesatDrinking‐WaterTreatmentPlants
Which water‐treatment technologies are most appropriate, in what combinations, depends on the type
and extent of contamination in the source water. This varies geographically and between surface and
groundwater sources, where the differences range across the categories of inorganic (including trace
metals) and organic chemical contaminants of both natural and human origin, radionuclides (mostly
natural, but not always), and microbes of a wide variety of types. Treatment plants must be designed
for both average levels of contaminants for the water sources they draw upon but also for the temporal
variations in those levels. Spikes in the concentrations of one set of contaminants or another, whether
resulting from leaks and spills associated with human activity or from natural phenomena, may exceed
the capability of a given treatment plant to cope.
Contamination in the water leaving a treatment plant, then, can be the result of input concentrations
exceeding the capability of a given treatment plant, as well as from operational breakdowns or lack of
adequate back‐up when equipment is down for maintenance. But it can also be the result of chemical
substances deliberately added at the treatment plant for purposes of disinfection or the by‐products of
reactions of these disinfectants with contaminants in the source water. Common disinfectants include
free chlorine gas as well as chloramines; disinfection byproducts commonly encountered include
bromate, chlorite, trihalomethanes, and haloacetic acids.

4
ContaminationIssuesinDistributionSystems
Much distribution piping in the United States, up to the premise itself, is old and metallic (65.5 percent)
or cementitious (18.5 percent) in nature; and much of the premise plumbing in older buildings is also
metallic. These materials are subject to both internal and external corrosion, depending respectively on
the chemistry of the water passing through the pipes and the chemistry of the water in the piping’s
external environment. Internal corrosion in lead and copper piping yields contamination by these
metals in the drinking water; and iron oxides are a very effective concentrator of trace inorganics
(arsenic and other metals) that can be released in bursts. In addition, the corrosion products in the pipe
can harbor microbes and interfere with disinfection. Piping that corrodes through, moreover, is subject
to intrusion of pathogens and other contaminants from the soil environment.
Premise plumbing brings with it all the problems of distribution‐system plumbing, but magnified.
Drinking water can have long residence times in premises, more stagnation, decreased flow, higher
surface area exposure to pipe materials, decreased chlorine residual, and is maintained at higher
temperatures more conducive to bacterial growth than water in the mains. Households may also have
patchwork plumbing fixes that can lead to cross‐connections and back‐siphoning (inadvertent
connections to non‐potable water sources), elevating the risks of microbial and chemical contamination.
Premise plumbing may also include lead fixtures or solders in houses built before 1986.
In addition to leaching of metals, bacterial overgrowth, and cross‐connections in premise plumbing, the
warm water environment is also conducive to the growth of Legionella pneumophila within residences
and public buildings. This bacterium can cause Legionnaires’ disease, named after a 1976 outbreak
during which some people attending a Philadelphia convention of the American Legion suffered from a
new type of pneumonia. In the last 2 years, outbreaks have occurred in several U.S. cities, including
Flint, Michigan; Milwaukee, Wisconsin; Hopkins, Minnesota; and New York City.
Recently, various forms of plastic have begun to be used in outside‐of‐premise distribution systems and
premise plumbing. While not subject to corrosion like metal or cement, plastics have their own
challenges including brittleness (especially in cold temperatures), potential permeation of organic
solvents into the water, special requirements for bedding/installation, and limitations in pipe size. The
most commonly used plastics in piping materials are polyvinyl chloride (PVC), polyethylene (PE), cross‐
linked polyethylene (PEX), and glass reinforced plastics (GRP).
RegulatoryOversightofDrinking‐WaterSafety
In the United States, the Safe Drinking Water Act (SDWA), passed by Congress in 1974 and amended in
1986 and 1996, creates the basic national framework for regulating public water supplies and suppliers
to ensure that water at the tap is safe for human consumption. Under SDWA, the Environmental
Protection Agency (EPA) sets standards for a number of naturally occurring or manmade contaminants
that may be present in water and requires public water utilities to test and treat to ensure their water
meets those standards. The 1996 amendments to SDWA added requirements to, inter alia: provide
regular information to the public about the quality of their drinking water and regularly update the list
of contaminants for potential regulation. The EPA’s approach to its responsibilities under the SDWA is
one of “multiple barriers,” relying on both managerial and technical capability and including source
5
water protection, water treatment and testing, training and certification of water‐system operators, and
providing public information.
The SDWA establishes two types of standards. Primary drinking‐water standards, which are enforceable
by EPA and the states, are set to protect public health with a margin of safety. Secondary drinking‐
water standards are guidelines that address aesthetics of drinking water (taste and odor), and are not
enforceable. The SDWA process for establishing maximum contaminant levels and ultimately primary
drinking water standards requires EPA to:
Identify potential contaminants (naturally occurring or man‐made) that may be present in
drinking water frequently enough and at levels that may pose a threat to public health.
Establish a maximum contaminant level goal (MCLG) below which there would be no expected
risk to public health.
Develop a maximum contaminant level (MCL) as close to the MCLG as is feasible. Feasibility
includes consideration of treatment cost and the availability of treatment technology or
techniques.
To date, EPA has established primary standards for 88 harmful substances or indicators of such,
comprising 53 organic chemicals, 16 inorganic chemicals, 8 classes of micro‐organisms or indicators of
micro‐organism presence, 4 disinfection byproducts, 3 disinfectants, and 4 classes of radionuclides.
The regulations germane to the primary standards may specify allowable concentrations (MCLs),
percentage reductions from contamination levels in the source water, or treatment technologies that
public water systems must use. The regulations also require sampling and testing. The complexity of
many public water systems―e.g., reliance on a number of water sources, large and complex distribu on
networks―make it challenging to provide sampling and tes ng adequate to ensure that standards are
being met and to isolate the source of the problem when they are not.
Responsibility for ensuring that SDWA’s requirements are met is, in most cases, shared by EPA and the
states; EPA determines whether a state can have “primacy” in implementing and enforcing SDWA
provisions. Individual states may impose and enforce drinking‐water standards stricter than the primary
standards set by EPA. The SDWA regulations apply only to public water systems. Smaller systems or
private wells may be overseen by State or local authorities; in most cases, the responsibility for ensuring
the safety of water from private wells is left to well owners.
Other Federal, State, and local agencies, laws, and regulations, may affect drinking‐water quality and
safety. For example, the Federal Clean Water Act (CWA) contains a number of provisions, policies,
programs and regulation to protect the Nation’s waters, including sources of drinking water. Toxic‐
chemical cleanup and stewardship statutes, such as the Comprehensive Environmental Response,
Compensation, and Liability Act (CERCLA, 1980) and the Resource Conservation and Recovery Act (RCRA,
1976), also serve to protect public health and the environment by reducing discharges to surface and
groundwater, thereby reducing contamination of drinking‐water sources. Local building and plumbing
codes may require techniques to protect drinking‐water quality within a building or residence.
6
TheSpecialCaseofLead
For millennia, lead has been used in water system to convey or contain water, due to its malleable
nature and resistance to corrosion. In fact, the English word “plumbing” comes from the Latin word for
lead. Major sources for lead in drinking water have traditionally been: service‐line pipes (connecting
water mains in the street to individual premises); lead‐tin solders used to join copper tubing in homes;
and brass plumbing fixtures that contain lead. But lead is a neurotoxin to which fetuses, infants, and
young children are particularly susceptible. Even at very low concentrations, it can lead to reduced
development of mental capacity.
In some environmental circumstances, drinking water may not be the principal source of lead intake for
the most vulnerable. For many years, for example, lead additives in gasoline were a major source, and,
even after such additives were phased out between 1973 and 1988, the lead that fell out of the
atmosphere after emission from automotive exhaust remained an important source of lead intake for
young children who ingest dirt. Lead‐containing house paint has likewise been a significant source of
lead intake for children who live in houses with such paint and ingest chips or dust from it; lead paint
was not banned in all residential construction in the United States until 1978. Still another major source
was food from lead‐soldered cans; lead solder in food cans was banned only in 1995, 15 years after
scientists showed that lead solder in tuna cans increased the lead concentration in the contained tuna to
1,400 parts per billion (ppb, or 1 microgram per kilogram) compared to 7 ppb in tuna in unsoldered
cans.
As for lead in drinking water, the 1986 Amendments to the SDWA required EPA to establish regulations
for lead in public water systems. The Amendments also defined “lead‐free pipes” quantitatively and
requires their use in plumbing for drinking water installed subsequently. The MCL for lead was set at 20
ppb. In the subsequent “Lead and Copper Rule” (1991), EPA determined that there is no safe level of
exposure to lead, dropping the previous MCL and setting the MCLG at zero. EPA defined a “lead action
level” (requiring ameliorative steps) for drinking water systems with greater than 15 ppb in more than
10 percent of taps sampled every 6 months in a given location. (The FDA’s standard for lead in bottled
water is 5 ppb.) The EPA protocol leaves open the possibility that Americans are unknowingly exposed
to high lead levels, as the 10 percent threshold accepts that higher lead levels are present in a small
subset of homes. The EPA is currently revising the Lead and Copper Rule, with the proposed revisions
expected to be released in early 2017.
RiskComparisons
In theory, being able to compare the magnitudes of different environmental risks with each other, as
well as against some absolute yardstick, is important to making sensible decisions about risk
management and regulation. Specifically, one would like to focus the most remedial effort on the
biggest risks, and one would like to have a basis for determining which risks are small enough to require
no remedial effort at all. The kinds of risk comparisons that can be germane to ensuring the safety of
the public’s drinking water include:
Health risks from contaminated drinking water versus other risks to the health of the same
population (e.g., air pollution, contamination of food, epidemic disease);
7
Health risks from different classes of drinking‐water contaminants—chemical, microbial, and
radiological;
Health risks among different individual drinking‐water contaminants within a class (e.g., lead
versus arsenic versus selenium);
Health risks from different pathways of exposure to the same contaminant (e.g., lead from
drinking water versus lead from food, ingestion of dust and dirt, or breathing contaminated air);
and
Health risks from a given contaminant or class of contaminants entering the water supply at
different points in the drinking‐water chain (e.g., water source, treatment plant, municipal
distribution system, premise plumbing).
A particularly important potential application of risk comparisons is analyzing trade‐offs where reducing
risks from one contaminant or class of contaminants increases risks from another contaminant or class.
In practice, however, while the categories of relevant health‐risk comparisons are easy enough to
describe, carrying out the comparisons in any comprehensive way is extremely challenging. That is so
because:
There is an immense variety of potential drinking‐water contaminants of potential health
concern in both the chemical and microbial categories, with new ones being identified regularly;
There are different types of health impacts (“endpoints” in the specialized literature) of the
various contaminants (acute and chronic illnesses, mild to life threatening, transitory effects to
lifelong disabilities), so there is no universal, quantitative measure of harm;
There are often large variations within communities and from community to community and
region to region in drinking‐water sources and the range of distribution‐system characteristics
(including premise plumbing) that influence what contaminants are present and in what
concentrations;
Deriving risk estimates from exposure data requires knowing the relations between exposure
(how many people live in households with what concentrations of what contaminants in their
drinking water) and dose (which depends on how much they drink), and between dose and
probability and severity of harm (“dose‐response relations”); and
While exposure‐dose relations can be estimated within some reasonable uncertainty bounds,
quantitative dose‐response relations are known for only a modest fraction of the syndromes
known to result from the large variety of drinking‐water contaminants of potential concern.
Despite these challenges, careful efforts to rank drinking‐water health hazards by the magnitude of the
risks they pose can be instructive—particularly across contaminants within a given class (chemical,
microbial, radiological) and with common health end‐points (e.g., reduced life expectancy)—as long as it
is recognized that such rankings are necessarily partial, preliminary, and variable across locations.
The simplest approach that, at the current state of knowledge, can yield useful insights about
comparative risks from different contaminants in the Nation’s drinking water is based on looking, for
those contaminants for which EPA has established Maximum Contaminant Levels (MCLs), at how
frequently and by what margins the measured concentrations across the country’s public water systems
exceed the MCLs. One attraction of this approach is that the process by which EPA constructs the MCLs

8
accounts for whatever is known about the exposure‐dose and dose‐response relations for the individual
contaminants.
The main liabilities of the approach are: (a) that the “end points”—the health damages the MCLs are
intended to avoid or minimize—are not always comparable across contaminants; (b) for many
contaminants of potential concern, the MCLs have not yet been published; and (c) the most recently
published nationwide data based on sampling public‐water systems—provided by EPA as the second 6‐
year review under the Safe Drinking Water Act—are both out of date (covering 1999‐2005) and
incomplete (including neither lead, nor microbial contaminants, nor major disinfection products). Data
from the third 6‐year review, which are expected to be released soon, still will not include data for lead.
In the main report, PCAST offers an example, based on a limited number of chemical contaminants, of
how a quantitative risk comparison based on frequency and magnitude of MCL exceedances can be
done and what the (partial) results look like.
MonitoringIssues
Monitoring drinking water for a wide variety of microbial, chemical, and physical contaminants is critical
to ensuring the safety of the Nation’s drinking water. Monitoring data are essential for evaluating the
performance of the drinking‐water system; surveillance of microbial, chemical, and physical risk factors;
and informing the public on the quality of their water. These data are needed in all four components of
the drinking‐water system: source water quality, treatment‐plant performance, distribution‐system
integrity, and the premise plumbing that delivers water to the tap.
Testing drinking water for various types of contamination is delegated by EPA, under SDWA, to the
states—“state primacy”—in connection with their regulation of private and municipal water utilities,
usually through departments of health or environmental protection. In addition to setting standards for
nearly 90 drinking‐water contaminants, as noted above, the EPA regulates the frequency of water‐
testing schedules and methods that water utilities or State regulatory agencies must use. For homes
that are not connected to public water systems and are not part of any water utility (approximately 15
percent of households), however, there are no monitoring requirements set by the EPA. But the U.S.
Department of Agriculture has a variety of programs aimed at improving water quality in rural America,
including private wells and wastewater systems.
Under EPA rules, monitoring requirements vary for different contaminants. For example, under the
Lead and Copper rule, water utilities must sample water from customers’ taps every 6 months from a
specified number of homes, depending on the size of the water utility (i.e., how many people are
served). Under the Revised Total Coliform Rule (RTCR), which addresses a variety of microbial health
risks, total coliform bacterial load is used as an indicator of other problems including integrity of
distribution systems and effectiveness of water treatment. Total coliform monitoring plans are
regulated by states, but a specified number of samples per month are required by the EPA, depending
on the size of the water utility.
There are many technologies that can detect a range of contaminants at very low levels in drinking
water. One important shortfall, however, is that monitoring technologies in distribution systems are
currently extremely expensive and, in order to be effective, must be spread around the distribution
system at multiple nodes or control points. While these sensors can detect many contaminants at very
9
low levels, it is difficult to discern small, real, changes from background variability, due to statistical
“noise” in background water‐quality data.
U.S.Drinking‐WaterSafetyinPractice
Most existing water‐treatment plants meet current Federal regulations most of the time, although
some—often older facilities that serve smaller or declining‐population communities—have significant
treatment challenges that lead to consistent shortfalls in meeting standards. Of the Nation’s roughly
150,000 public water systems, the number found with any violation of EPA’s primary drinking‐water
standards fell from 60,000 in fiscal year (FY) 2011 to under 50,000 in FY 2015, and the number found
with a serious violation fell from 7,700 in FY 2011 to about 4,500 in FY 2015. Among the 429 very large
public water systems—those serving more than 100,000 customers—the number with a serious
violation in FY 2015 was 16, under 4 percent. By far the largest proportion of the violations related to
coliform bacteria and other microbes; disinfection byproducts were a distant second with about a fifth
as many violations; and arsenic, lead, and copper combined were third with about a sixth as many.
The much‐publicized drinking‐water‐system closures in Toledo, Ohio and Charleston, West Virginia, in
2014, were the result of source‐water contamination—harmful algal‐bloom growth and microcystin
toxin in Lake Erie, and an industrial spill of 4‐methylcyclohexanemethanol (MCHM) from the Freedom
Industries facility in Charleston into the Elk River, respectively. The Flint, Michigan crisis the next year,
which resulted from a source‐water change that interacted destructively with distribution‐system
plumbing, highlights the interconnectedness of the entire drinking‐water system: the change of source
water from Lake Huron to the Flint River greatly increased the corrosiveness of the water, and, absent
adequate corrosion control at the Flint drinking‐water treatment plant, the water leached lead from the
aged distribution‐system pipes, leading to elevated lead levels in the drinking water provided to much of
the community.
Lead pipes are not just a problem in Flint, but nationally, especially in older cities and the Midwest. The
American Water Works Association estimated in 2016 that approximately 6.1 million lead service lines
remain in U.S. communities, and that approximately 7 percent of U.S. homes connect to community
water systems that have a lead service line, or 15‐22 million citizens. These lead service lines are
partially owned by the drinking‐water utility, and partially by the property owner. Partial removal of
only the utility section of a lead service line can cause more release of lead into household water
through disruption of the pipe and its lining, and is not recommended. This dual ownership of the lead
service pipes highlights the need to find means to encourage and support removal of the property
owner’s portion of the lead service pipe, at the same time as utility actions. Note, too, that lead pipe
fixtures and solder remain in many homes constructed prior to the mandates to remove lead from
faucets and solder, which started in the 1980s and only recently (January 2014) required that all faucets
contain no more than 0.25 percent lead.
The localized issues that have come to light regarding lead—together with the suspicion that other
instances are likely going undetected because of weaknesses in the monitoring system—underscore the
need to propagate best practices using currently available treatment and monitoring technologies and
to develop and deploy better such technologies over time.
10
BestCurrentandEmergingTreatmentTechnologies
Historically, standard water‐treatment practice has included, in sequence, flocculation, settling, and
filtration, with disinfection using chlorine or its compounds either preceding or following filtration.
Disinfection before filtration maximizes filter run times and helps control turbidity in “finished” (fully
treated) water, but it can lead to production of carcinogenic disinfection byproducts (DBPs).
For the past decade, water utilities have been changing their use of chemical disinfectants, mostly to
comply with increasingly stringent DBP regulations enacted in amendments to the SDWA. This trend has
coincided with integration of new processes into their treatment plants, such as use of granular
activated carbon and engineered biological films on the surface of filter media.
Biological filtration processes can act on both organics and inorganics to remove many contaminants of
concern, including algal metabolites that cause unpleasant tastes and odors, iron, manganese, nitrate,
and other specific organic molecules. Today, perhaps a quarter of water utilities are intentionally or
unintentionally practicing some form of biological filtration.
Over the past decade or so, other significant technology changes have included:
A shift from free chlorine to chloramines to comply with disinfection‐byproducts rules.
Currently, more than 50 percent of the U.S. population is served by chloraminated water, yet
comprehensive epidemiological studies are needed to confirm a reduced health risk compared
to the previous free‐chlorine disinfection process. Innovations in monitoring disinfection
byproduct precursors (e.g., ultraviolet‐ or fluorescent‐based instruments) or on‐line
measurements of disinfection byproducts have been made, but few utilities employ them
because they are not required by regulation.
Micro‐ or ultrafiltration membranes have gained increasing use over the past 2 decades. These
membranes provide smaller reactor footprints than granular media filters, but cost 10 percent
to 50 percent more than granular media filters. The membranes typically have greater
automation and higher effluent water quality than granular media filters, but innovation is
needed to reduce their costs.
Ultraviolet‐based, in‐plant, disinfection use with low‐pressure mercury‐based lamps has
increased dramatically over the past decade. But innovations are needed to reduce energy
consumption (by, e.g., transitioning to non‐mercury based lighting technologies such as LEDs),
reduce scale formation on lamps, and improve on‐line monitoring capabilities to ensure
continuous disinfection.
Other aspects where improvement is needed include the following:
Nitrate removal is most commonly achieved using ion exchange. This type of treatment
generates large volumes of highly saline brines that are most commonly disposed to the sewer
system which impacts wastewater‐treatment practices. Innovation is needed to devise new
treatment processes that do not generate brine waste and improve ion‐exchange treatment
efficiency for nitrate (and other pollutants including fluoride, perchlorate, arsenic, hexavalent
chromium, and perfluorinated compounds) in the presence of elevated levels of sulfate,
bicarbonate, and other anions.
11
Arsenic removal from drinking water is most commonly achieved by sorption, coagulation/
filtration, or ion exchange in packed‐bed columns. Increasing treatment performance and
minimizing waste volumes and hazards from these existing technologies is needed.
Simplification of arsenic‐treatment processes is also needed to make the technologies more
accessible and operable by the small water systems that represent the greatest number of
systems currently not complying with the arsenic drinking‐water standard.
Many home and industrial point‐of‐use devices employ low pressure reverse osmosis. These
have less than 30 percent efficiency when operated off of water‐distribution‐system pressures,
leading to large flows of wasted water. Innovation is needed to reduce membrane fouling,
improve membrane cleaning, and improve reverse‐osmosis polymer material to decrease
sensitivity to oxidants.
BestCurrentandEmergingMonitoringTechnologies
It is currently impractical to rely on “high‐tech” sensor systems that can identify specific contaminants.
Instead, a “lower tech” approach is used, employing general water‐quality monitors that can give utility
operators a general sense of the state the water. Most current water systems rely on “grab” sampling
under the Revised Total Coliform Rule to understand chlorine levels in the distribution system; relatively
few use on‐line sensors; and even fewer have the distribution system blanketed with enough to fully
understand spatial and temporal variability. Most water utilities likewise use monthly or less frequent
“grab” samples from the distribution system for disinfection byproduct monitoring, complemented by
daily or weekly samples at the water‐treatment plant.
New sensors are continually becoming available, allowing for new streams of data to be collected by
water systems. There are now several commercially available on‐line sensors that are capable of
measuring multiple parameters simultaneously, including various combinations of turbidity, pH,
pressure, conductivity, oxidation‐reduction potential, and disinfectant residuals. The combination of
these basic parameters can be used to assess the integrity of the distribution system and determine
when deviations from baseline conditions occur. These sensor systems can be spread throughout the
distribution system and require little power and other utilities to operate; and data can be uploaded to
cloud‐based systems or hard‐wired into utilities’ control systems.
The size of the sensors has greatly diminished over the last decade and can now be easily deployed
instead of having to be placed in pump stations or locations with a lot of available room. At costs below
$5,000 for the most basic systems and up to $10,000 for systems that can also measure disinfectant
residuals, and coverage of 50‐100 service connections, this comes to between $50 and $100 per
connection. Combined with low operating costs, these sensors are a substantial upgrade over the
existing grab‐sampling requirements and can give water utilities a more comprehensive view of real
time (or near real time) conditions in their distribution systems.
The National Oceanic and Atmospheric Administration (NOAA) recently deployed the first‐ever
freshwater environmental sample processor (ESP). The ESP, an autonomous robotic instrument is
collecting and analyzing water samples for algal toxins in near real‐time and will be able to provide
treatment plants with information in advance to potentially mitigate effects from harmful algal blooms.
With time (hours to a day), utilities have options including: shifting water production to alternative
sources; reducing flows through water treatment plants; or optimization of chemical treatments.
12
Leak detection plays a major role in maintaining distribution‐system integrity. Often, leaks are
discovered only when they surface or when they grow to the point of a major main break. Leaks are not
only sources of lost water but are also potential entryways for contamination. In an effort to reduce
leaks, utilities traditionally have conducted periodic leak surveys, which entail trained consultants or
utility staff canvassing the distribution system making physical contact between acoustic equipment and
available water system components (e.g., hydrants, valve nuts, curb stops, customer faucets, meters)
and monitor for leak sound. Over a number of years, leak survey equipment has become increasingly
sophisticated. Today’s electronic monitoring equipment can amplify, filter, and display noise far better
than the limited and subjective ear of the operator of yesterday’s leak survey.
More recently, continuous acoustic monitoring (CAM) equipment has become available that can be
placed directly on pipes. These sensors become active at night (during periods of reduced background
noise) and listen for telltale sonic fingerprints associated with leaks. When connected with Advanced
Meter Infrastructure (AMI) systems, the data from several sensors can be correlated to determine the
location of a leak. Because the sensors operate continuously, leaks can be identified from the time they
start, and a prioritization can be made as to which leaks need immediate repair and which can wait until
they grow to become large enough to warrant repair. Several companies are working on aircraft‐ and
satellite‐based sensor systems to detect leaks remotely.
OngoingNationalActivitiesonS&TforSafeDrinkingWater
Research on the science of safe drinking water and R&D on safe‐drinking‐water technologies are and
have been conducted, supported, and assessed by a variety of Federal agencies, interagency and
intersectoral consortia, and nongovernmental organizations, many of which maintain databases, data
portals, and dashboards of drinking‐water‐safety information. Some examples follow. The work of
these entities has informed PCAST’s studies and provides the foundation for much of what we
recommend.
FederalAgencies
The Environmental Protection Agency through its Office of Research and Development conducts
research on the evaluation of microbial and chemical contaminants in resource‐water‐treatment
streams, safe and sustainable management of waste residuals, and advancing innovative technologies
for water and resource recovery. The EPA’s Safe Drinking Water Information System (SDWIS) contains
information about public water systems and their violations of EPA's drinking water regulations, as
reported to EPA by the states.
The U.S. Geological Survey (USGS) has several monitoring and modeling activities that support efforts to
ensure safe drinking water including: monitoring source‐water quality in the Nation’s streams, rivers,
lakes, reservoirs, and aquifers and how it is changing over time; conducting research to understand the
natural and human factors that affect sources and drinking water quality; and developing water‐quality
models and related decision‐support tools that: (1) predict source water‐quality in unmonitored areas,
(2) forecast short‐ and long‐term changes in water quality, and (3) evaluate contaminant loading to
receiving waters used for drinking water supply.
13
The National Oceanic and Atmospheric Administration (NOAA) plays a significant role in Harmful Algal
Bloom prediction, forecasting, and research, especially in the Great Lakes region where HABs can
directly impact local drinking water supplies for millions of Americans (and Canadians). NOAA has also
constructed a National Water Model (NWM) that is a hydrologic simulation of observed and forecast
streamflow over the entire continental United States. NOAA, USGS, and the U.S. Army Corps of
Engineers are collaborating under the Integrated Water Resources Science and Services (IWRSS)
partnership, with the first national water‐resource facility at the National Water Center in Tuscaloosa,
AL.
The Centers for Disease Control and Prevention (CDC) conducts work on drinking water focused on
preventing diseases caused by chemical or microbial contamination. Key activities include surveillance,
technological, and emergency or outbreak assistance, building laboratory and environmental health
expertise and capacity, monitoring and evaluation of prevention interventions, and health promotion to
keep domestic drinking water, swimming pools, lakes, and other water sources healthy and safe. CDC
also provides national leadership on children’s health by working with other Federal agencies and states
through programs and policies to prevent childhood lead poisoning, including monitoring and evaluating
children’s blood‐lead surveillance data and setting and revising the national blood lead reference level
of 5 micrograms per deciliter (µg/dL) for U.S. children ages 1‐5.
The National Science Foundation (NSF) supports basic scientific research across a variety of domains
through a rigorous merit review process. Drinking water‐related activities are funded under several
Directorates, covering such topics as materials science and nanosystems engineering research to
improve water‐treatment systems, new sensor technologies, urban water‐systems innovation networks,
and the Consortium of Universities for the Advancement of Hydrologic Science, Inc. (CUAHSI) to develop
shared infrastructure for improving and promoting access to data, information, and models on water
system research.
InteragencyandIntersectoralConsortia
The Subcommittee on Water Availability and Quality of the National Science and Technology Council
(NSTC—a Cabinet‐level council that coordinates cross‐agency R&D efforts) is a Federal interagency
group focused on research needs related to the availability and quality of water resources of the United
States. Its current priority is to deliver the action items assigned to SWAQ in the March 2016
Presidential Memorandum on Drought Resilience and associated Federal Action Plan. SWAQ is in the
process of expanding its current membership base to include expertise in drinking water monitoring,
technologies, and infrastructure, with the objective of developing a Federal Strategy on research needs
to improve drinking‐water quality, scheduled for 2017.
The Water‐Energy‐Food Nexus Taskforce under the NSTC is currently exploring Federal activities and
potential gaps in research areas affecting two or more vertices of the nexus (i.e., water‐energy, energy‐
food, food‐water, or all three). There are several nexus elements that relate to drinking water, including
agricultural runoff and water quality, energy use for water treatment, and energy production from dual‐
use water resources. A working paper in preparation will include discussion on the interaction of the
nexus and drinking water.
14
The Water Treatment Interagency Working Group (WaTr) is a recently re‐established working group of
the Bureau of Reclamation and the U.S. Army Tank Automotive Research, Development, and
Engineering Center to provide an opportunity for Federal entities that work in the area of water
treatment to come together and leverage resources and collaborate on topics such as: water quality,
innovative technologies, water reuse for indirect/direct and agricultural uses, energy efficiency, cost
reduction, environmental impacts, modeling, and smart water systems.
The Water Quality Portal is a cooperative service sponsored by USGS, EPA, and the intersectoral
National Water Quality Monitoring Council. It serves as a portal for water quality data collected by more
than 400 Federal, State, tribal, and local agencies, including many citizen‐science organizations.
TheEPADrinking‐WaterActionPlan
In response to concerns about the growing array of challenges to the drinking‐water system, the EPA
evaluated its regulatory authorities over the course of 2016 and issued, on November 30, 2016, a new
Drinking‐Water Action Plan (Plan) that is complementary to the PCAST study of S&T for safe drinking
water summarized here. The Plan aims to re‐energize the safe‐drinking‐water enterprise through
engagement across the Federal Government, water utilities, and other key stakeholders. It builds on
advances in drinking‐water and information technologies and public‐private partnerships, coupled with
EPA’s experience in implementing its authorities under the Safe Drinking Water Act. It is organized
around six priorities: (1) promotion of equity and building of capacity for water‐infrastructure financing
and management in disadvantaged, small, and environmental‐justice communities; (2) advancing a next
generation of oversight approaches for the Safe Drinking Water Act; (3) strengthening source‐water
protection and resilience of drinking‐water supplies; (4) taking action to address unregulated
contaminants; (5) improving transparency, public education, and risk communication on drinking water
safety; and (6) reducing lead risks through a revised Lead and Copper Rule.
The EPA has identified challenges and goals for each priority and has proposed a diverse group of
actions that, in order to be successful, must be addressed in an integrated and strategic way. PCAST was
accorded the opportunity to review the proposed actions under each of EPA’s priorities areas, and has
focused on how S&T advances can support the important steps that EPA has outlined to transform the
Nation’s drinking‐water system into a safer and more modern enterprise. Several of the proposed
actions in the EPA Plan align with specific PCAST S&T recommendations, including the development of
low‐cost and innovative technologies to remove a broad spectrum of contaminants, promoting the use
of advanced monitoring technology and citizen science, development of a national e‐reporting rule, and
implementation of a data portal to report monitoring compliance.
PCAST’sRecommendations
PCAST is making the following near‐ and long‐term recommendations, which we believe will help to
further improve the safety of the Nation’s drinking‐water system. The near‐term recommendations are
targeted with a focus on activities that the Administration can undertake in the areas of: monitoring for
chemical and microbial contaminants including a focus on monitoring exposure in particularly vulnerable
populations; development of strategies for improved data sharing and accessibility; expansion of citizen‐
science projects on drinking water; and growth and training of the water‐system workforce. PCAST has
categorized these recommendations as “near‐term” because there currently exist either personnel,
15
funding, or programs that can help jump start the implementation of these recommendations within the
current Administration.
PCAST is also making long‐term recommendations to enable coordination and execution of a Federal
strategy for the research and application of science and technology to understand and address the
challenges associated with providing safe drinking water. Additional long‐term recommendations that
will help ensure the safety of the Nation’s drinking water include: improved quantitative assessments of
comparative risk across contaminants; development and deployment of innovative, next‐generation
water technologies; and launching of city‐based demonstration pilots to assess innovative technologies
in realistic conditions. PCAST considers these “long‐term” strategic recommendations visionary,
requiring dedicated resources. These recommendations together will enable the development of a
technologically advanced drinking‐water system based on scientific research and innovation.
Near‐TermTargetedRecommendations
RECOMMENDATION 1: INCREASED MONITORING OF DRINKING‐WATER CONTAMINANTS, ESPECIALLY
FOR VULNERABLE POPULATIONS
FINDING: The use of existing drinking‐water‐monitoring technologies can be expanded through
innovative implementation and funding mechanisms to obtain and disseminate additional public health‐
relevant information to affected systems and communities. Technologies have also advanced and can
be adapted to provide affordable, real‐time sensors and data tailored to the needs of system managers,
researchers, and customers. These monitoring advances are relevant to both public water systems and
to non‐regulated, small systems and well sources. PCAST believes that there are particular monitoring
opportunities that can reduce the exposure of pregnant women, infants, and young children to chronic,
water‐borne pollution, such as lead, arsenic, and nitrate, through targeted monitoring of those most at
risk and remediation when appropriate. PCAST finds that there is an opportunity to monitor drinking‐
water contaminants for the most vulnerable populations, identifying situations like what happened in
Flint, Michigan, and allowing for immediate intervention.
RECOMMENDATION 1A: PCAST recommends that all women who enroll in the Special Supplemental
Nutrition Program for Women, Infants, and Children (WIC) be referred to the appropriate agency for
tap‐water testing for lead. That agency should also provide point‐of‐use treatment, when
appropriate. Testing for additional contaminants that have similar risk profiles to lead such as arsenic
and nitrate, particularly in rural areas that rely on private wells, should also be provided. This effort
would require some new funding (approximately $100 million per year) that can either come from
reallocation of existing lead‐mitigation funds or from new appropriations. PCAST recommends that the
President ask the Secretary of Agriculture, the Secretary of Housing and Urban Development, and the
Administrator of the Environmental Protection Agency to explore ways to cooperate in establishing this
program; developing testing protocols, training, and data management; identifying possible sources of
funding; and assigning primary responsibility for its administration.
RECOMMENDATION 1B: PCAST recommends that the EPA consider modifying the Lead and Copper
Rule, as well as additional contaminant rules, to require follow‐up testing when contaminant levels
exceed a threshold level, even if the frequency of these samples is below the number that would

16
trigger remedial actions under current rules. This will help to identify clusters of high‐contaminant‐
level occurrences that remain invisible under existing rules.
RECOMMENDATION 2: BIG‐DATA ANALYTICS FOR DRINKING‐WATER SYSTEMS
FINDING: Data accessibility, utilization, and interoperability across time and space are severely limited
in public and private drinking‐water systems, and across Federal agencies. At least three important data
trends are emerging in the water industry that make the present an ideal time to improve coordination.
First, tens to hundreds of millions of dollars are spent annually on data collection by multiple Federal
agencies related to water quantity (e.g., lake levels, precipitation patterns, snowfall depths) and quality
(e.g., temperature, salinity, trace organics, pesticides) and by cities or other local agencies within water
treatment plants, distribution systems, and to a lesser extent premises. Some data are near real‐time or
continuously monitored, while the frequency of other samples for chemical analysis tends to rely upon
sporadic grab samples with highly variable time periods. Data describing potential contaminants of
concern in watersheds (such as chemicals stored in tanks) are also managed and maintained by states,
yet most of these data are inaccessible to the water community for purposes of protecting—proactively
or reactively—against source‐water contamination events. Second, there is no common data‐analytics
platform to access this data across agencies or across states and local communities. The limited data
are difficult to link across city, State, or watershed boundaries, or to link to specific water‐treatment
plants or distribution systems. Third, private industry is beginning to market a series of sensors, data
analytics, control systems, and interfaces for utility operators but the industry lacks standardization,
security, and interoperability capabilities in this emerging internet of things related to drinking‐water
systems.
RECOMMENDATION: The Executive Office of the President—with leadership from the Office of
Science and Technology Policy (OSTP), the Council of Environmental Quality (CEQ), the Domestic
Policy Council (DPC), and the Office of Management and Budget (OMB)—should support the
development of a Drinking Water Data Platform for collection, analysis, storage, and sharing of
geospatially linked drinking‐water‐system contamination data. This platform should be accessible to
agencies, water utilities, researchers, and the public and include information related to water quality
and contamination levels. The Drinking Water Data Platform should be informed by and could build off
of the EPA’s Safe Drinking Water Information System (SDWIS) and the Water Quality Portal managed by
EPA, USGS, and the National Water Quality Monitoring Council.
RECOMMENDATION 3: INCREASE DATA COLLECTION AND SHARING THROUGH CITIZEN SCIENCE
EFFORTS
FINDING: Under current EPA rules, monitoring requirements and sampling rates vary by state, water‐
system size, and contaminant. Private wells are not covered and some utilities are granted waivers to
sample less frequently when monitoring results collected in accordance with drinking‐water regulations
have consistently been found to be below levels of concern. The Lead and Copper Rule is the only
national primary drinking‐water regulation in which compliance samples are collected in customer’s
homes. The limited frequency and distribution of sampling of water for lead, and no sampling for other
contaminants, in premises suggests that geographic and temporal gaps might exist in data about
drinking‐water contamination. PCAST found that there is a near‐term opportunity to increase data
17
collection of a broader range of drinking‐water contaminants through leveraging of citizen‐science
activities, while increasing public understanding of drinking‐water safety.
RECOMMENDATION: The Environmental Protection Agency (EPA), the National Science Foundation
(NSF), the Centers for Disease Control and Prevention (CDC), the National Institute of Environmental
Health Sciences (NIEHS), and the Department of Housing and Urban Development (HUD) should
develop and support research to enable efforts to expand measurement and monitoring of drinking‐
water supplies in the United States by actively funding citizen‐science activities such as home water
testing, with an emphasis on including activities focused on drinking‐water sources, small systems,
and private wells. As soon as practical, Citizen‐Science Coordinators from these agencies should begin
the process of bringing together relevant agencies, State and local government, and water utilities in a
roundtable discussion to identify a series of near‐term activities focused on collection of water‐
contamination data. The relevant agency Citizen‐Science Coordinators should also begin to identify
long‐term activities for developing safe drinking water‐related citizen‐science programs within states.
These programs should leverage new developments in low‐cost instrumentation, including sensors, and
consider the following citizen‐science components:
(1) Recruitment, education, and training of citizen scientists;
(2) Development of study protocols designed to engage a broad range of participants;
(3) Data forms and collection procedures that balance ease to use while maximizing the accuracy
of data;
(4) Mechanisms for sharing citizen‐science data with other citizens and to inform utilities, states,
and the Federal Government; and
(5) Establishment of an ideation challenge for citizen‐science programs.
RECOMMENDATION 4: DEVELOPING THE DRINKING‐WATER TREATMENT AND DISTRIBUTION‐SYSTEM
WORKFORCE
FINDING: Water operators are critical to the delivery of safe drinking water. To maintain a strong
workforce, to attract new talent and younger entrants as the existing workforce reaches retirement, the
Nation needs to create new excitement around a technologically advanced drinking‐water workforce.
NSF’s Advanced Technological Education (ATE) program can be leveraged in the near‐term to attract
individuals to the field, while additional projects could be started for the long‐term enhancement of the
water system workforce.
RECOMMENDATION: The Federal Government should increase investment in programs aimed in
helping American workers get the skills and credentials needed to support the operation,
maintenance, and improvement of drinking‐water systems throughout the Nation. Both OSTP and
CEQ should guide the following near‐ and long‐term opportunities to support this recommendation
including identifying mechanisms for engaging with existing organizations involved in workforce
development and training.
Near‐term Opportunity:
The National Science Foundation should increase funding of meritorious drinking‐water‐related
projects through the Advanced Technological Education (ATE) program. Currently, the ATE program
18
supports water‐quality education programs at community colleges developed in partnership with
industry representatives. NSF should actively encourage applications from community colleges that
are interested in innovative approaches for educating a highly‐skilled drinking‐water and water‐
management workforce.
Long‐term Opportunity:
The Environmental Protection Agency (EPA), in coordination with NSF, ED, and DOL, should initiate a
stakeholder process to develop a blueprint for the overall professional development of water
treatment operators. The blueprint should include identification of:
(1) Descriptions of key positions needed to ensure delivery of safe drinking water; (2) Funding mechanisms for training;
(3) Critical components of new training programs and professional development;
(4) Workforce development priorities and timeline; and
(5) New knowledge needs including advanced IT and big data.
The blueprint should consider the different training needs of small water‐system operators in
identifying components of new training programs.
Long‐TermStrategicRecommendations
RECOMMENDATION 5: FEDERAL COORDINATION OF RESEARCH AND DEVELOPMENT FOCUSED ON
SAFE DRINKING WATER
FINDING: Responsibilities for R&D on topics related to the safety of drinking water are spread across a
number of Federal agencies. No single Federal entity has responsibility for ensuring coordination across
these efforts. Although, as noted above, there are three interagency groups with mandates relating, in
part, to the challenge of providing safe drinking water, none has comprehensive visibility into or explicit
responsibility for coordinating the broad array of R&D needs germane to drinking‐water safety from
source to tap. Neither does any of these bodies—or any of the individual Federal departments and
agencies with responsibilities related to drinking water—have the resources or the mechanisms to
promote the application of the best available science and technology in the approximately 150,000
public water systems across the Nation, nor the many small private systems and wells. PCAST finds that
there is a need for a more coordinated and Federal strategy for science and technology research,
development, and demonstration to remedy these shortfalls.
RECOMMENDATION: The Executive Office of the President—with leadership from the Office of
Science and Technology Policy (OSTP), the Council of Environmental Quality (CEQ), the Domestic
Policy Council (DPC), and the Office of Management and Budget (OMB)—should oversee the
development, and coordinate the execution, of a Federal Strategy for the research, development, and
deployment of adequate and affordable drinking‐water monitoring, treatment, and distribution
technologies across the Nation’s drinking‐water system, from source to tap. The formal mechanism
for this EOP‐led effort could be a new National Science and Technology Council (NSTC) subcommittee
that absorbs the relevant parts of the existing interagency groups with responsibilities related to
drinking water, or it could be a free‐standing interagency council chaired by OSTP, CEQ, DPC, and OMB,
much in the format of the Council on Climate Change Preparedness and Resilience (which is chaired by
CEQ, OSTP, NSC, and OMB). Whatever the format, the new entity should be supported by dedicated

19
staff in both OSTP and CEQ, e.g., an OSTP Assistant Director for Safe Drinking Water. The creation of a
new entity along with dedicated support staff will ensure that the development and execution of the
Federal Strategy will be effective and efficient. The new entity’s initial steps toward fashioning the
above‐described strategy should include:
(1) Cataloging current drinking‐water related Federal R&D programs and budgets, Federal
monitoring programs of water quality, human exposure to contaminants, the cost of
waterborne disease, and data‐collection and sharing efforts;
(2) Similarly surveying public and private non‐Federal actors in the drinking‐water space to
understand their activities relating to research, development, and deployment of clean‐
drinking‐water technologies and their views about needs, gaps, opportunities, and the
appropriate roles for the Federal Government and other external stakeholders;
(3) Identifying—based on (1), (2), and the use of the best available metrics for characterizing
potential leverage—the most important unmet research, development, and deployment
needs where additional Federal and other efforts would have promise of moving the needle;
(4) Reaching agreement on which agencies or combinations of agencies could most expeditiously
and effectively address those needs;
(5) Working with the same agencies identified in (4) and the EOP budget process to secure
funding for the indicated efforts; and
(6) Identifying avenues for Federal interaction with, and education of, the broader stakeholder
community, including State and local agencies, the private sector, and citizens.
Building from these activities, the entity should aim to complete a comprehensive strategy, with a 10‐
year outlook, for Federal research, development, and deployment efforts on clean‐drinking‐water
technologies within 2 years, to be updated at 2‐year intervals thereafter.
RECOMMENDATION 6: DEVELOPING THE NEXT GENERATION OF TECHNOLOGIES TO IMPROVE SAFETY
OF DRINKING WATER
FINDING: The Nation’s R&D ecosystem for development and deployment of innovative technologies to
improve the safety of drinking water is inadequate. Across the government, various funding and
management mechanisms exist for the development of innovative technologies (e.g., prizes, grand
challenges, research hubs, focused research centers). PCAST recognizes the value of these mechanisms
and encourages agencies with drinking water‐related programs to consider establishing such
activities. Similarly, PCAST encourages learning from programs that have led to the historical successes
in rapidly developing and deploying new technologies at the Defense Advanced Research Projects
Agency (DARPA) and the Advanced Research Projects Agency – Energy (ARPA‐E).
RECOMMENDATION: The Federal Government should create a new, focused research entity to
develop transformational technologies aimed at improving the safety of drinking water. This research
organization should build on the focus, speed and flexibility attributes inherent in existing Advanced
Research Projects Agencies. It could logically be located in EPA, the Department of Interior, DOE, or
other agencies, with each having advantages and disadvantages that should be weighed by the next
Administration. The EOP‐led interagency entity described in Recommendation 5 should, among its
other duties, assist the new research organization with priority‐setting and interactions with key
stakeholders, including the private sector. The President should request initial funding in the FY 2018

20
Energy and Water Appropriations budget for $300 million to support the launch. Among the topics for
early attention by the new research program are:
(1) Inexpensive multi‐contaminant sensing, testing, and treatment technologies;
(2) New techniques for pipe and lead service line identification, mapping, and replacement;
(3) Microbiome of water systems from source to tap;
(4) Brine disposal technologies;
(5) Early warning water‐main and service‐line leak detection;
(6) Lower‐cost technologies to enable direct potable reuse;
(7) Water purification for oxidized pollutants;
(8) Ex‐situ sensing of groundwater quality and availability;
(9) Low‐cost and ubiquitous water‐quality sensors;
(10) Beyond chlorine‐based disinfectant; and
(11) Instruments capable of decreasing the costs of water‐contamination analysis by tenfold.
RECOMMENDATION 7: DEVELOPING COMPARATIVE RISK ASSESSMENT METHODOLOGIES AND
CAPACITY
FINDING: Comparison of different risks with each other is generally an important part of developing an
overall strategy for risk reduction, most notably in helping to decide where to focus attention and
resources. Methodologies for conducting quantitative risk comparisons across different drinking‐water
contaminants and different sources of exposure constitute an underdeveloped field of study. The
health endpoints of concern differ between the various drinking‐water contaminants, as do the methods
for calculating “safe” concentrations, making it challenging to select a common endpoint—toxicity, days
of life impacted by illness, proportion of systems exceeding a regulatory standard—for risk comparison
based on measured levels of each contaminant in different drinking‐water systems. Microbial
pathogens pose a particular opportunity to advance quantitative microbial risk‐assessment methods,
supported by the necessary monitoring and epidemiological surveillance data, in order to facilitate
comparison with the quantitative risk methods already in use for chemical and radiological
contaminants.
RECOMMENDATION: The Centers for Disease Control and Prevention (CDC), the Environmental
Protection Agency (EPA), the National Institute of Environmental Health Sciences (NIEHS), and the U.S.
Department of Agriculture (USDA) should initiate a coordinated research effort, in conjunction with
State and other drinking‐water experts, to improve the methodologies and develop the data needed
to support more comprehensive comparative‐risk assessments of contaminants across the spectrum
of chemical mixtures, sources, and treatment systems that provide drinking water to the Nation. This
activity should supplement information collection and assessment activities already undertaken under
Safe Drinking Water Act authorities, including collaborations to enable collection and assessment of data
pertinent to drinking‐water systems not under regulatory oversight, such as private wells and premise
plumbing.
RECOMMENDATION 8: SAFE DRINKING WATER DEMONSTRATION PROJECTS
FINDING: American cities are facing significant effects from water shortages, crumbling drinking water
infrastructure, and shortages of trained water‐system operators. PCAST learned that some cities are
21
beginning to take on these challenges through innovative approaches along with developing
partnerships across water utilities, universities, and public companies. PCAST finds there is an
opportunity and a need to pilot innovative ideas related to safe drinking water.
RECOMMENDATION: The Environmental Protection Agency (EPA), in conjunction with the
Department of Housing and Urban Development (HUD), U.S. Department of Agriculture (USDA), the
Centers for Disease Control and Prevention (CDC), Department of Energy (DOE), and Department of
Commerce (DOC), should consider deploying city‐based safe drinking‐water demonstration projects.
The demonstration projects should be deployed in: (1) an in‐land arid city; (2) a groundwater dependent
city; and (3) an industrial mid‐western (or northeastern) city. The interagency initiative should
coordinate and finance projects that engage local and State governments, public and private water
utilities, non‐governmental organizations, and the general public with goals to:
(1) test the deployment and efficacy of current and new technologies for monitoring, detection,
and treatment of water contaminants throughout the distribution system and in premises,
including technologies that are developed through the Federal research entity described
under Recommendation 5;
(2) test current and new technologies, including green infrastructure, for the replacement or
repair of water systems;
(3) understand financial challenges and opportunities for supporting the use of current and new
technologies for water systems to ensure safe drinking water, including means to facilitate
mutual validation and adoption of improved technologies across drinking‐water utility
systems and states;
(4) implement and test the impact of water‐safety plans in improving system water quality
including the monitoring and evaluation of health outcomes;
(5) work with local universities and community colleges to develop timely curricula for drinking
water‐system operators;
(6) include social science and communication components enabled through social media; and
(7) create a publically‐accessible database of results and communicate best practices and lessons
learned.
The interagency initiative should start three demonstration projects with new funding for each in the
range of $20‐30 million a year for 5 years. The President should request monies for this activity in the
FY 2018 budget request. These monies should be matched through public‐private partnerships to spur
development and commercialization of new technologies, and are not intended to exclusively fund
infrastructure‐development projects within the cities.

ScienceandTechnologytoEnsuretheSafetyoftheNation’sDrinkingWater
22
1.Introduction“There is no more basic element sustaining human life than water. It’s not too much to expect for all Americans
that their water is going to be safe.” – President Barack Obama
Americans have come to expect access to safe and affordable drinking water as a fundamental right and integral
part of sustaining public health. And, indeed, public drinking‐water systems in the United States provide safe,
high‐quality drinking water most of the time in most places. But public confidence regarding the quality of their
drinking water has been shaken lately by a series of high‐visibility crises that have resulted in temporary
drinking‐water‐system closures and do‐not‐use advisories. These high‐profile crises highlight the long‐term,
national challenges to maintaining high‐quality drinking water, resulting particularly from continuing and legacy
pollution of source waters and an aging infrastructure that is in need of significant repair and modernization.
As part of the Administration’s response to concerns about the safety of the Nation’s drinking water,
underscored by the revelations about lead in tap water in Flint, Michigan, President Obama asked his President’s
Council of Advisors on Science and Technology (PCAST), in March 2016, how science and technology (S&T) could
more effectively be brought to bear on the challenge of ensuring the safety of the Nation’s drinking water (Box
1). PCAST was not asked to address non‐S&T dimensions of the provision of safe drinking water, such as
Federal‐State‐local responsibilities and interactions, management issues (unless directly related to advancing
S&T opportunities), and financing of drinking‐water infrastructure, nor was it asked to address safety of bottled
water.
BOX 1. PRESIDENT’S CHARGE TO PCAST
As part of the Administration’s response to concerns about the safety of the Nation’s drinking
water, underscored by the revelations about lead in tap water in Flint, MI, the President asked
PCAST to study how science and technology can more effectively be brought to bear on the
challenge of ensuring the safety of the Nation’s drinking water, specifically:
What is the current state of scientific understanding of the risks associated with
contaminants in drinking water?
What can be said about the comparative risks from different contaminants?
Is improvement needed in monitoring, data collection, and/or data analysis on
contamination in drinking water and the factors that may contribute to it?
What can currently available technology contribute to risk assessment, risk mitigation, and
risk communication in this domain?
What could additional research and development contribute to understanding and
minimizing the risks from contaminants in the Nation’s drinking water?
ScienceandTechnologytoEnsuretheSafetyoftheNation’sDrinkingWater
23
Following preliminary exploration of the S&T issues around safe drinking water, PCAST organized a day‐long
national workshop of drinking‐water experts from Federal agencies, public water systems, academia, the
medical community, and civil society to help shape the inquiry. A working group reflecting that diversity of
exper se was then cons tuted―comprising six members of PCAST and seven of the outside experts who
participated in the workshop—to conduct the study. The findings and recommendations reported here have
been reviewed and approved by the full PCAST and are the responsibility of PCAST alone. This report, and the
recommendations contained within, complements parallel actions by the U.S. Environmental Protection Agency
(EPA) to examine policies and regulatory options to improve the safety of public drinking‐water systems and to
increase public confidence in the quality of their water supply.1
PCAST anticipates that its recommendations will help empower Federal agencies and their partners in the
States, academia, and the private sector to develop and implement the scientific and technological
advancements necessary to create a National drinking‐water system that ensures a safe and reliable drinking
water supply.
The report is organized as follows.
Chapter 2 provides an overview of drinking‐water systems and contamination issues at water sources,
drinking‐water treatment plants, and within drinking‐water distribution systems.
Chapter 3 reviews regulatory‐oversight of drinking‐water safety, including a focus on the special case of
lead. The chapter also discusses the need for increased comparative‐risk research, and reviews the best
current and emerging treatment and monitoring technologies.
Chapter 4 describes forward‐looking Federal activities in support of safe drinking water, including a
short discussion of the EPA Drinking Water Action Plan.
Chapter 5 offers near‐term targeted recommendations focused on activities that the Administration can
undertake using existing personnel, funding, or programs. Chapter 6 offers long‐term strategic recommendations that, together, will enable the development of a
technologically‐advanced drinking‐water system based on scientific research and innovation.
1 See: www.epa.gov/ground‐water‐and‐drinking‐water/drinking‐water‐action‐plan.

ScienceandTechnologytoEnsuretheSafetyoftheNation’sDrinkingWater
24
2.Drinking‐WaterContamination
2.1TheNation’sDrinking‐WaterSystem
The drinking water consumed by Americans comes from a variety of sources, mainly surface water and
groundwater, of varying degrees of initial purity, and it is delivered by means ranging from direct withdrawal
from individual private wells to long‐distance transport from distant reservoirs, followed by various forms of
filtering and disinfection in treatment plants and distribution through networks of underground piping to reach
individual residential, commercial, and public buildings. In nearly all cases, the water also passes through
“premise plumbing” to reach the tap.
The drinking‐water systems that manage the flows from source to premise vary enormously in size, type of
treatment, and ownership (Table 1). As of 2016, there are about 150,000 public drinking‐water systems in the
United States―systems that have 15 or more connec ons or serve more than 25 people. (“Public” here refers
to the people served, not to ownership.) Of these 150,000 systems, 50,000 are community water systems that
supply water to the same population year‐round; these serve over 300 million Americans. The community
water systems that rely on surface water as their source serve about 200 million people, those that rely on
ground water about 100 million. Just 3 percent of the community water systems—those that serve over 10,000
people each—provide the drinking water for 79 percent of the U.S. population.2
The 100,000 non‐community public water systems are transient and non‐transient systems that supply such
entities as campgrounds, in the first instance, and office buildings, schools, and hospitals that have their own
water systems, in the second. About 45 million people, or approximately 15 percent of the U.S. population, get
all or part of their water from private wells,3 which are not included among the Public Drinking Water systems
listed in Table 1.
The approach to ensuring the safety of drinking water in U.S. public water systems is to place multiple barriers
to contamination along the entire water system from the source, to multiple decontamination and disinfection
processes in treatment plants, to maintenance of water‐distribution systems, to (in some cases) filters at the
tap. The locations within the water system where water quality can be monitored and problems addressed are
called “critical control points” and historically have been principally at the source, at various points within the
treatment plant, and at certain points within the distribution system. Operationally, water utilities may have
sensors and critical control points within water‐treatment plants to assess performance of individual processes.
Relatively little monitoring has been done, however, at the final critical control point—the consumer’s tap. This
omission is due in part to the lack of jurisdiction of the water utility over what happens in the premise
2 See: nepis.epa.gov/Exe/ZyPDF.cgi/P100ALM9.PDF?Dockey=P100ALM9.PDF. 3 See: water.usgs.gov/edu/gw‐well‐contamination.html and www.epa.gov/privatewells/about‐private‐water‐wells, Hutson, S., Barber, NL., Kenny, JF., Linsey, KS., Lumia, DS., Maupin, MA., 2004. Estimated Use of Water in the United States in 2000. U.S. Geological Survey Circular 1268, 46 p. pubs.usgs.gov/circ/2004/circ1268.

ScienceandTechnologytoEnsuretheSafetyoftheNation’sDrinkingWater
25
plumbing—that is, the pipes, valves, and fixtures on the consumer’s property—and in part due to lack of
consumer motivation and knowledge.
Table 1: Public Water Systems—All‐Systems Inventory 20154
Public Water System Type <=500 501‐3,300 3,301‐10,000
10,001‐100,000
>100,000 Grand Total
Community Water System 27,755 13,517 4,962 3,885 427 50,546
Population 4,665,458 19,399,740 28,908,735 110,902,376 139,721,996 303,598,305
Non‐Transient Non‐CWS 15,415 2,506 149 17 1 18,088
Population 2,150,257 2,674,483 829,469 456,067 203,375 6,313,651
Transient Non‐CWS 80,447 2,822 84 13 2 83,368
Population 7,236,224 2,660,200 453,342 316,814 2,100,003 12,766,583
Total Systems 123,617 18,845 5,195 3,915 430 152,002
Total Population 14,051,939 24,734,423 30,191,546 111,675,257 142,025,374 322,678,539
2.2Drinking‐WaterContaminationattheSource
Ground water and surface water are each susceptible to contamination by multiple phenomena. These include
discharge of sewage (which may be further contaminated by household chemicals) and of industrial, mining, and
agricultural wastes; unintended spills, discharges, leakage, and seepage of all of these and of fossil fuels in
extraction, processing, transport, and storage; wet and dry fallout from atmospheric pollution; and dissolution
of naturally occurring, potentially toxic elements (such as arsenic) from soil and rock. The presence of nitrates
and phosphates from domestic and agricultural sources, moreover, can nourish blooms of algae that are directly
toxic or conducive to bacterial population explosions.
Across the Nation over half of all surface water intakes for drinking‐water treatment facilities serving more than
10,000 people are impacted by at least one upstream wastewater discharge, and many have more than 10
upstream wastewater sources. Smaller rivers and drinking‐water facilities are even more influenced by the
potential microbial and chemical loads from these upstream wastewater plants, and even modest seasonal
changes in streamflow can result in rivers containing in excess of 50 percent water of wastewater origin at the
point of intake for downstream drinking‐water facilities.
Problems with the quantity of drinking‐water sources can magnify problems of quality. For example, reduced
volume of surface and groundwater resulting from seasonal low flows, drought, or overuse means less dilution
of contaminants; shortfalls in water availability from the cleanest sources may force resort to lower‐quality
4 Numbers of Public Water Systems (PWS) open during any part of FY2015. Statistics are taken from the Safe Drinking Water Information System/Federal version (SDWIS/Fed). See: www.epa.gov/ground‐water‐and‐drinking‐water/safe‐drinking‐water‐information‐system‐sdwis‐federal‐reporting. Public Water System: An entity that provides water for human consumption through pipes or other constructed conveyances to at least 15 service connections or serves an average of at least 25 people for at least 60 days a year. Community Water System: A public water system that supplies water to the same population year‐round. Non‐Transient Non‐Community Water System: A public water system that regularly supplies water to at least 25 of the same people at least six months per year, but not year‐round. Some examples are schools, factories, office buildings, and hospitals which have their own water systems. Transient Non‐Community Water System: A public water system that provides water in a place such as a gas station or campground where people do not remain for long periods of time and is open at least 60 days/year.

ScienceandTechnologytoEnsuretheSafetyoftheNation’sDrinkingWater
26
supplies; heavy downpours and flooding can increase the amount of runoff into rivers and lakes, washing
sediment, nutrients, pollutants, and other materials into water supplies; and floods may swamp sewage‐
treatment plants, leading to discharge of untreated wastes, or overflow storage ponds for agricultural and
mining wastes.
The quantity/quality problems with drinking‐water sources are being exacerbated by impacts of global climate
change on the United States, as elaborated in the Third National Climate Assessment5 released in 2014 and the
Fourth Assessment’s 2016 special report6 on climate change and human health. For example:
Increases in water temperatures are altering the seasonal windows of growth and the geographic range
of suitable habitat for freshwater toxin‐producing harmful algae and certain naturally occurring Vibrio
bacteria, one species of which causes cholera.
Decreased snowpack and earlier, faster spring snowmelt are decreasing summer and fall river flows.
Sea level rise puts freshwater resources along the coasts at risk from saltwater intrusion.
Droughts are becoming longer and more intense in some regions, even as torrential downpours and
associated flooding become more prevalent in others.
And a lengthening wildfire season, exacerbated by drought and massive tree die‐offs caused by insect
infestations, is increasing the area that is burned and that, as a result, is susceptible to accentuated
erosion in subsequent storms, transporting sediment and contaminants into water‐supply reservoirs
where they can impact drinking water quality for periods ranging from days to years.
All of these climate‐related impacts on source‐water quantity and quality can be expected to grow for some
decades to come as climate continues to change. In some areas, drought is already stressing water systems—
water demand is increasing while supplies are decreasing. The National Climate Assessment projects that the
length of dry spells will increase in most areas, but longer‐term droughts are expected to disproportionally hit
some areas of the Nation.7 Lack of water is the most immediate challenge for water systems during drought
conditions, but recent droughts have also shown changes in water quality, including turbidity, taste and odor,
pathogen occurrence, and challenges in managing disinfection byproducts.8 Water utilities may be forced to
seek other sources of fresh water, or increase the need for desalination. Small drinking water systems are
especially vulnerable, as the smaller customer base leaves these systems with less resources.
Very heavy precipitation events anticipated with a changing climate can also cause problems for water
infrastructure. These events have increased and are projected to increase in all regions of the country,9
accentuating runoff into rivers and lakes, washing sediment, nutrients, pollutants, and other materials into
5 See: nca2014.globalchange.gov. 6 See: health2016.globalchange.gov. 7 See: nca2014.globalchange.gov/report/sectors/water#intro‐section‐2 National Climate Assessment Key Message 2: Short‐term (seasonal or shorter) droughts are expected to intensify in most U.S. regions. Longer‐term droughts are expected to intensify in large areas of the Southwest, southern Great Plains, and Southeast. 8 Wright, B., Stanford, BD., Reinert, Al., Routt, JC., Khan, SJ., Debroux, JF. 2014. “Managing water quality impacts from drought on drinking water supplies.” Journal of Water Supply: Research and Technology‐AQUA. 63(3); pp 179‐188. aqua.iwaponline.com/content/63/3/179. 9 National Climate Assessment Key Message 1: Annual precipitation and river‐flow increases are observed now in the Midwest and the Northeaster regions. Very heavy precipitation events have increased nationally and are projected to increase in all regions. The length of dry spells is projected to increase in most areas, especially the southern and northwestern portions of the contiguous United States.
ScienceandTechnologytoEnsuretheSafetyoftheNation’sDrinkingWater
27
water supplies and making them unsafe or in need of additional water treatment.10 Water systems and
infrastructure also face risks from rising sea levels, saltwater encroachment into source‐water aquifers, and
impacts of storm surges.
Uncertainty in climate change projections poses challenges to the resilience of the water sector and water
utilities. The Climate Ready Water Utilities (CRWU) initiative from the Environmental Protection Agency (EPA)
provides resources to support adaptation and resilience activities for these utilities.11 The CRWU initiative
includes an Adaptive Response Framework that describes approaches for water utilities seeking to become
more “climate ready.”12
2.3ContaminationIssuesatDrinking‐WaterTreatmentPlants
Which water‐treatment technologies are most appropriate, in what combinations, depends on the type and
extent of contamination in the source water. This varies geographically and between surface and groundwater
sources, where the differences range across the categories of inorganic (including trace metals) and organic
chemical contaminants of both natural and human origin, radionuclides (mostly natural, but not always), and
microbes of a wide variety of types. Treatment plants must be designed for both average levels of contaminants
for the water sources they draw upon but also for the temporal variations in those levels. Spikes in the
concentrations of one set of contaminants or another, whether resulting from leaks and spills associated with
human activity or from natural phenomena, may exceed the capability of a given treatment plant to cope.
Contamination in the water leaving a treatment plant, then, can be the result of input concentrations exceeding
the capability of a given treatment plant, as well as from operational breakdowns or lack of adequate back‐up
when equipment is down for maintenance. But it can also be the result of chemical substances deliberately
added at the treatment plant for purposes of disinfection or the by‐products of reactions of these disinfectants
with contaminants in the source water. Common disinfectants include free chlorine gas as well as chloramines
(formed by the mixing of chlorine and ammonia); disinfection byproducts commonly encountered include
bromate, chlorite, trihalomethanes, and haloacetic acids. Disinfection byproduct concentrations are associated
with source‐water quality and water‐treatment plant processes, and can be reduced by removing organic
chemical precursors and/or selection of oxidants/disinfectants.
2.4ContaminationIssuesinDistributionSystems
Much distribution piping in the United States, up to the premise itself, is old and metallic (65.5 percent) or
cementitious (18.5 percent) in nature; and much of the premise plumbing in older buildings is also metallic.13
These materials are subject to both internal and external corrosion, depending respectively on the chemistry of
the water passing through the pipes and the chemistry of the water in the piping’s external environment.
Internal corrosion in lead and copper piping yields contamination by these metals in the drinking water; and iron
oxides are a very effective concentrator of trace inorganics (arsenic and other metals) that can be released in
10 See: www.epa.gov/climate‐impacts/climate‐impacts‐water‐resources. 11 See: www.epa.gov/crwu. 12 See: www.epa.gov/sites/production/files/2015‐04/documents/adaptive_response_framework_for_drinking_water_and_wastewater_utilities.pdf . 13 United States Environmental Protection Agency, 2009. Rehabilitation of Wastewater Collection and Water Distribution Systems State of Technology Review Report. EPA/600/R‐09/048.
ScienceandTechnologytoEnsuretheSafetyoftheNation’sDrinkingWater
28
bursts.14 In addition, the corrosion products in the pipe can harbor microbes and interfere with disinfection.
Piping that corrodes through, moreover, is subject to intrusion of pathogens and other contaminants from the
soil environment.
Until the 1940s, water mains were chiefly unlined cast iron and steel.15 Cast iron pipe eventually gave way to
ductile iron pipe and ceased being used altogether in the mid‐1980s. The primary challenge for water quality
with unlined cast iron pipe is internal and external corrosion. Internal corrosion causes tuberculation (small
knob‐like mounds), which can lead to water‐quality issues and reduced flow and pressure.16 Cast iron pipe is
also susceptible to external corrosion if not protected. Graphitization of cast iron pipe is a type of corrosion that
weakens the pipe wall by the removal of iron, leaving graphite behind. Weakened pipes can fail under small
fluctuations in pressure (i.e., surge), frost heave, ground movement, or thermal stress (due to rapid changes in
water temperature).
A lot of cast iron piping still exists, especially in the older, industrialized Northeast and Midwest. Unlined cast
iron pipes are subject to corrosion and water‐quality complaints (red water from the iron). More recently,
ductile iron, cement‐lined ductile iron, steel, asbestos cement, cement, and now plastics are used for large
transmission main pipes. Service lines connecting transmission mains to individual customers’ houses were
often made of lead, but also of copper, galvanized steel, and plastics.
Premise plumbing brings with it all the problems of distribution‐system plumbing, but magnified.17 Drinking
water can have long residence times in premises, more stagnation, decreased flow, higher surface area
exposure to pipe materials, decreased chlorine residual, and is maintained at higher temperatures more
conducive to bacterial growth than water in the mains. Households may also have patchwork plumbing fixes
that can lead to cross‐connections and back‐siphoning (inadvertent connections to non‐potable water sources),
elevating the risks of microbial and chemical contamination. Premise plumbing may also include lead fixtures or
solders in houses built before 1986.
In addition to leaching of metals, bacterial overgrowth, and cross‐connections in premise plumbing, the warm
water environment is also conducive to the growth of Legionella pneumophila within residences and public
buildings. This bacterium can cause Legionnaires’ disease, named after a 1976 outbreak during which some
people attending a Philadelphia convention of the American Legion suffered from a new type of pneumonia.18
In the last 2 years, outbreaks have occurred in several U.S. cities, including Flint, Michigan; Milwaukee,
Wisconsin; Hopkins, Minnesota; and New York City.19
14 Peng, C‐Y., and Korshin G.V., 2011. “Speciation of trace inorganic contaminants in corrosion scales and deposits formed in drinking water distribution systems.” Water Research. 45(17) pp. 5553‐5563, and Friedman M.J., Hill A.S., Reiber S.H., Valentine R.L., Larsen G., Young A., Korshin G.V., Peng C‐Y. 2010. “Assessment of Inorganics Accumulation in Drinking Water System Scales and Sediments.” Water Research Foundation, www.waterrf.org/PublicReportLibrary/3118.pdf. 15 United States Environmental Protection Agency. 2009. Rehabilitation of Wastewater Collection and Water Distribution Systems State of Technology Review Report. EPA/600/R‐09/048. 16 Internal corrosion can also result in wall thinning that weakens the pipe and can create holes that cause leakage or rupture. 17 National Research Council, 2006. “Drinking Water Distribution Systems: Assessing and Reducing Risks,” National Academies Press, www.nap.edu/catalog/11728/drinking‐water‐distribution‐systems‐assessing‐and‐reducing‐risks. 18 See: www.cdc.gov/legionella/index.html. 19 See: hcinfo.com/about/outbreaks/recent.

ScienceandTechnologytoEnsuretheSafetyoftheNation’sDrinkingWater
29
Recently, various forms of plastic have begun to be used in outside‐of‐premise distribution systems and premise
plumbing. While not subject to corrosion like metal or cement, plastics have their own challenges including
brittleness (especially in cold temperatures), potential permeation of organic solvents into the water, special
requirements for bedding/installation, and limitations in pipe size. The most commonly used plastics in piping
materials are polyvinyl chloride (PVC), polyethylene (PE), cross‐linked polyethylene (PEX), and glass reinforced
plastics (GRP).20 New materials have also come on the market that are markedly improved over older plastics,
such as iPVC that can undergo mechanical forces that would shatter traditional PVC. iPVC has recently
undergone testing, including impact, stiffness, tensile, short‐term hydraulic burst pressure, fatigue, and bedding,
accompanied by field installation performance.21
When transmission mains degrade, not only is water lost due to main breaks, but negative pressure gradients
(short periods of time when the water pressure in the pipe is negative) can also occur during breaks or system
shutdowns. These negative transients can lead to the intrusion of contaminated groundwater into the water
main.22 Over 30 percent of all reported waterborne disease outbreaks in community water systems the United
States between 1971 and 1998 were due to distribution system deficiencies.23 Of these outbreaks, 60 percent
were related to microbial contamination, with the balance caused by chemical contamination related to cross‐
connections or back‐siphonage.
When pipes are replaced, the expense incurred to the utility is a combination of the cost of the replacement
pipe, labor, temporary service connections, and other materials (asphalt/concrete for road/sidewalk repair etc.).
The actual cost of the pipe is only a small percentage (~5 percent) of the total replacement cost. In contrast to
traditional pipe replacement (conventional open‐trench) techniques, a number of highly effective alternative
techniques for renovation and replacement have been designed and implemented that can greatly reduce the
cost of infrastructure replacement projects (Table 2). Pipe renovation is defined as work that incorporates all or
part of the original fabric to improve performance. Pipe replacement is rehabilitation of an existing pipe system
by the installation of new piping. Details on each of the procedures listed in Table 2 are included in the
reference material.24
20 Water Research Foundation, 2016. State of the Science: Plastic Pipe. Project #4680. www.waterrf.org/PublicReportLibrary/4680.pdf. 21 Hughes D.M., Venkatesh C., Lee A.H., Paradka A.B., Najafi M., 2016. “Development, Evaluation, and Installation of a New Improved PVC (iPVC) Pipe for Water Applications.” ASCE Pipeline, pp. 1046‐1060. ascelibrary.org/doi/abs/10.1061/9780784479957.098. 22 Besner M‐C., Prévost M., and Regli S., 2011. “ Assessing the public health risk of microbial intrusion events in distribution systems: Conceptual model, available data, and challenges.” Water Research, 45 pp. 961‐979. 23 Craun G.F. and Calderon R.L., 2001. “Waterborne Disease Outbreaks Caused by Distribution System Deficiencies. J.” American Water Works Association. 93(9) pp. 64‐75. 24 Covas D., Almeida M.C., Carriço N., Azrague K., Bruaset S., Ugarelli R., 2015. “Rehabilitation of water mains and storage tanks: technologies and decision support tools” TRUST Manual of Best Practice, Vol. 5. www.researchgate.net/publication/295443072_Rehabilitation_of_water_mains_and_storage_tanks_technologies_and_decision_support_tools.
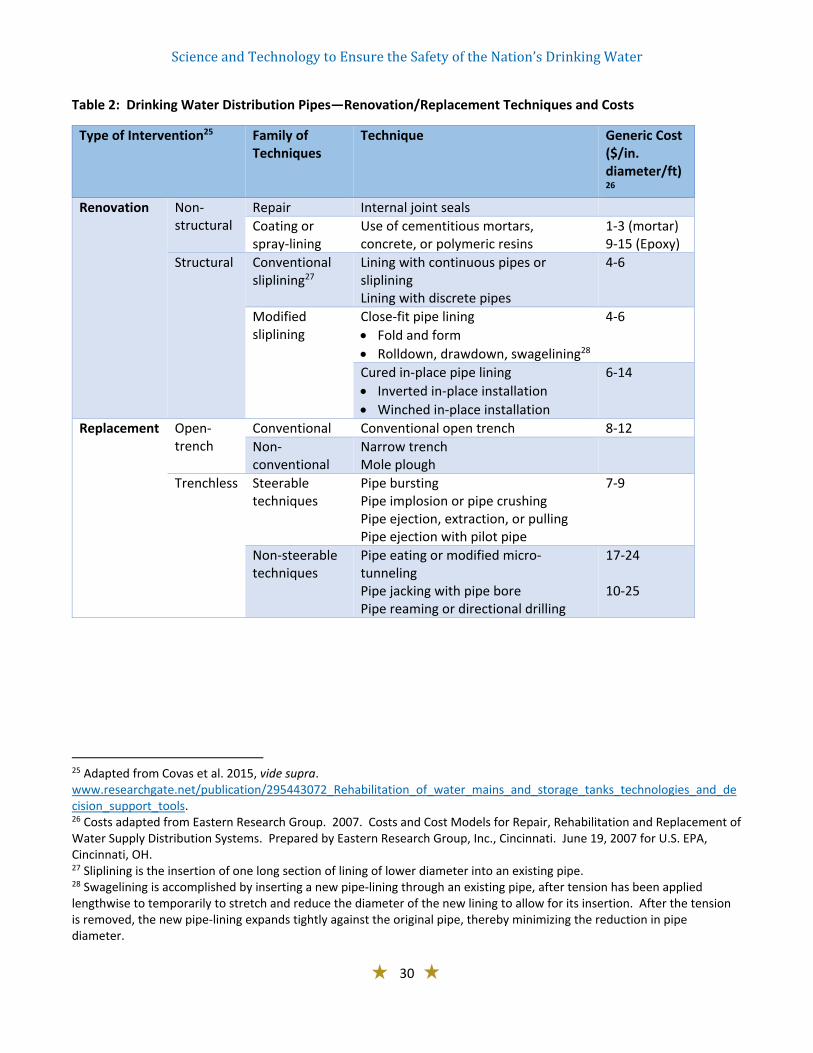
ScienceandTechnologytoEnsuretheSafetyoftheNation’sDrinkingWater
30
Table 2: Drinking Water Distribution Pipes—Renovation/Replacement Techniques and Costs
Type of Intervention25 Family of Techniques
Technique Generic Cost ($/in. diameter/ft)26
Renovation Non‐structural
Repair Internal joint seals
Coating or spray‐lining
Use of cementitious mortars, concrete, or polymeric resins
1‐3 (mortar) 9‐15 (Epoxy)
Structural Conventional sliplining27
Lining with continuous pipes or sliplining Lining with discrete pipes
4‐6
Modified sliplining
Close‐fit pipe lining
Fold and form
Rolldown, drawdown, swagelining28
4‐6
Cured in‐place pipe lining
Inverted in‐place installation
Winched in‐place installation
6‐14
Replacement Open‐trench
Conventional Conventional open trench 8‐12
Non‐conventional
Narrow trench Mole plough
Trenchless Steerable techniques
Pipe bursting Pipe implosion or pipe crushing Pipe ejection, extraction, or pulling Pipe ejection with pilot pipe
7‐9
Non‐steerable techniques
Pipe eating or modified micro‐tunneling Pipe jacking with pipe bore Pipe reaming or directional drilling
17‐24 10‐25
25 Adapted from Covas et al. 2015, vide supra. www.researchgate.net/publication/295443072_Rehabilitation_of_water_mains_and_storage_tanks_technologies_and_decision_support_tools. 26 Costs adapted from Eastern Research Group. 2007. Costs and Cost Models for Repair, Rehabilitation and Replacement of Water Supply Distribution Systems. Prepared by Eastern Research Group, Inc., Cincinnati. June 19, 2007 for U.S. EPA, Cincinnati, OH. 27 Sliplining is the insertion of one long section of lining of lower diameter into an existing pipe. 28 Swagelining is accomplished by inserting a new pipe‐lining through an existing pipe, after tension has been applied lengthwise to temporarily to stretch and reduce the diameter of the new lining to allow for its insertion. After the tension is removed, the new pipe‐lining expands tightly against the original pipe, thereby minimizing the reduction in pipe diameter.
ScienceandTechnologytoEnsuretheSafetyoftheNation’sDrinkingWater
31
3.TreatmentandMonitoringofDrinkingWater
3.1RegulatoryOversightofDrinking‐WaterSafety
In the United States, the Safe Drinking Water Act (SDWA), passed by Congress in 1974 and amended in 1986 and
1996, creates the basic national framework for regulating public water supplies and suppliers to ensure that
water at the tap is safe for human consumption.29 A summary of key federal regulations is in Box 2. Under
SDWA, the Environmental Protection Agency (EPA) sets standards for a number of naturally occurring or
manmade contaminants that may be present in water and requires public water utilities to test and treat to
ensure their water meets those standards. The 1996 amendments to SDWA added requirements to, inter alia:
provide regular information to the public about the quality of their drinking water and regularly update the list
of contaminants for potential regulation. The EPA’s approach to its responsibilities under the SDWA is one of
“multiple barriers,” relying on both managerial and technical capability and including source water protection,
water treatment and testing, training and certification of water‐system operators, and providing public
information.
The SDWA establishes two types of standards. Primary drinking‐water standards, which are enforceable by EPA
and the states, are set to protect public health with a margin of safety. Secondary drinking‐water standards are
guidelines that address aesthetics of drinking water (taste and odor), and are not enforceable. The SDWA
process for establishing maximum contaminant levels and ultimately primary drinking water standards requires
EPA to:
(1) Identify potential contaminants (naturally occurring or man‐made) that may be present in drinking
water frequently enough and at levels that may pose a threat to public health.
(2) Establish a maximum contaminant level goal (MCLG) below which there would be no expected risk to
public health.
(3) Develop a maximum contaminant level (MCL) as close to the MCLG as is feasible. Feasibility includes
consideration of treatment cost and the availability of treatment technology or techniques.
To date, EPA has established primary standards for 88 harmful substances or indicators of such, comprising 53
organic chemicals, 16 inorganic chemicals, 8 classes of micro‐organisms or indicators of micro‐organism
presence, 4 disinfection byproducts, 3 disinfectants, and 4 classes of radionuclides.30
The regulations germane to the primary standards may specify allowable concentrations (MCLs), percentage
reductions from contamination levels in the source water, or treatment technologies that public water systems
must use. The regulations also require sampling and testing. The complexity of many public water
29 www.epa.gov/sdwa/title‐xiv‐public‐health‐service‐act‐safety‐public‐water‐systems‐safe‐drinking‐water‐act. 30 www.epa.gov/ground‐water‐and‐drinking‐water/table‐regulated‐drinking‐water‐contaminants. A small number of the listed National Primary Drinking Water Regulations (NPDWR) contain more than one related contaminant (e.g., radium 226 and radium 228), sometimes a group of related contaminants (e.g., polychlorinated biphenyls), and hence different documents convey the number of primary drinking water standards depending on how the list is counted and summarized, albeit centered around ~90.
ScienceandTechnologytoEnsuretheSafetyoftheNation’sDrinkingWater
32
systems―e.g., reliance on a number of water sources, large and complex distribu on networks―make it
challenging to provide sampling and testing adequate to ensure that standards are being met and to isolate the
source of the problem when they are not.
Responsibility for ensuring that SDWA’s requirements are met is, in most cases, shared by EPA and the States;
EPA determines whether a state can have “primacy” in implementing and enforcing SDWA provisions. Individual
States may impose and enforce drinking‐water standards stricter than the primary standards set by EPA. The
SDWA regulations apply only to public water systems. Smaller systems or private wells may be overseen by
State or local authorities; in most cases, the responsibility for ensuring the safety of water from private wells is
left to well owners.
Other Federal, State, and local agencies, laws, and regulations, may affect drinking‐water quality and safety. For
example, the Federal Clean Water Act (CWA) contains a number of provisions, policies, programs, and regulation
to protect the Nation’s waters, including sources of drinking water. Toxic‐chemical cleanup and stewardship
statutes, such as the Comprehensive Environmental Response, Compensation, and Liability Act (CERCLA, 1980)31
and the Resource Conservation and Recovery Act (RCRA, 1976),32 also serve to protect public health and the
environment by reducing discharges to surface and groundwater, thereby reducing contamination of drinking‐
water sources. Local building and plumbing codes may require techniques to protect drinking‐water quality
within a building or residence.
31 See: www.epa.gov/laws‐regulations/summary‐comprehensive‐environmental‐response‐compensation‐and‐liability‐act. 32 See: www.epa.gov/laws‐regulations/summary‐resource‐conservation‐and‐recovery‐act.

ScienceandTechnologytoEnsuretheSafetyoftheNation’sDrinkingWater
33
BOX 2. SUMMARY OF KEY FEDERAL REGULATIONS
Safe Drinking Water Act (SDWA): The SDWA is the Federal law that protects public drinking water
supplies throughout the Nation. SDWA authorizes the EPA to set national health‐based standards
for drinking water to protect against both naturally‐occurring and man‐made contaminants that
may be found in drinking water. EPA, States, and water systems then work together to make sure
that these standards are met.33
Clean Water Act (CWA): The CWA established the basic structure for regulating pollutant
discharges into U.S. waters. It gives the EPA the authority to implement pollution control programs,
such as setting wastewater standards for industry. The CWA made it unlawful to discharge any
pollutant from a point source into navigable waters, unless a permit is obtained.34
Lead and Copper Rule (LCR): The LCR is a regulation under SDWA that controls lead and copper in
drinking water. The treatment technique for the rule requires systems to monitor drinking water at
customer taps every 6 months, annually, or less frequently depending on the concentrations of lead
that are found. If lead concentrations exceed an action level of 15 parts per billion or copper
concentrations exceed an action level of 1.3 parts per million in more than 10 percent of customer
taps sampled, the system must undertake a number of additional actions to control corrosion. The
LCR is currently under revision.35
Microbial and Disinfection ByProduct Rule (M/DBPR) cluster: This cluster of rules under SDWA
creates a balance of microbial pathogen control while minimizing public health risks from
disinfectants and disinfection byproducts (DBPs).36 The cluster of rules encompasses the Surface
Water Treatment Rule (SWTR), Interim Enhanced Surface Water Treatment Rule (IESWTR), Long
Term Stage I Enhanced Surface Water Treatment Rule (Stage I ESWTR), Long Term Stage II
Enhanced Surface Water Treatment Rule (Stage II ESWTR), and Stage II Disinfection/Disinfectant By
Products Rule (Stage II D/DBPR). 37
3.2TheSpecialCaseofLead
For millennia, lead has been used in water systems to convey or contain water, due to its malleable nature and
resistance to corrosion. In fact, the English word “plumbing” comes from the Latin word for lead—plumbum.
Major sources for lead in drinking water have traditionally been: service‐line pipes (connecting water mains in
33 See: www.epa.gov/sites/production/files/2015‐04/documents/epa816f04030.pdf. 34 See: www.epa.gov/laws‐regulations/summary‐clean‐water‐act. 35 See: www.epa.gov/dwreginfo/lead‐and‐copper‐rule. 36 For particulate and pathogen control, the rules set limits for filtered water turbidity (≤0.3 NTU in 95 percent of samples, 1 NTU maximum), 99.9 percent (3‐log) removal/inactivation of Giardia cysts, 99 percent (2‐log) Cryptosporidium oocysts, and 99.99 percent (4‐log) removal/inactivation of enteric viruses. nepis.epa.gov/Exe/ZyPDF.cgi?Dockey=P10058CA.txt. For disinfection byproducts, maximum limits are set at 80 μg/L for total trihalomethanes (TTHMs) and 60 μg/L for the sum of five haloacetic acids (HAA5s) as locational running annual averages (LRAA). Limits are also set for the maximum residual disinfectant limits (MRDLs) at 4 mg/L for both free chlorine and total chlorine. nepis.epa.gov/Exe/ZyPDF.cgi?Dockey=P100C8XW.txt. 37 See: https://www.epa.gov/dwreginfo/stage‐1‐and‐stage‐2‐disinfectants‐and‐disinfection‐byproducts‐rules.

ScienceandTechnologytoEnsuretheSafetyoftheNation’sDrinkingWater
34
the street to individual premises; lead‐tin solders used to join copper tubing in homes; and brass plumbing
fixtures that contain lead.
But lead is a neurotoxin to which fetuses, infants, and young children are particularly susceptible. Although lead
can cause serious health impacts in people of any age, symptoms of lead poisoning in adults typically appear at
relatively high blood lead levels (>40 µg/dL). In infants and young children (<5 years), even very low
concentrations (i.e., 5 µg/dL) have been associated with decreases in intelligence, short‐term memory,
attention, mathematical ability, emotional regulation, and a variety of other cognitive impacts.38 Exposure of
pregnant women to low levels of lead is also associated with reduced cognitive development in the fetus.39
In some environmental circumstances, drinking water may not be the principal source of lead intake for the
most vulnerable. For many years, for example, lead additives in gasoline were a major source, and, even after
such additives were phased out between 1973 and 1988, the lead that fell out of the atmosphere after emission
from automotive exhaust remained an important source of lead intake for young children who ingest dirt. Lead‐
containing house paint has likewise been a significant source of lead intake for children who live in houses with
such paint and ingest chips or dust from it; lead paint was not banned in all residential construction in the
United States until 1978. Still another major source was food from lead‐soldered cans; lead solder in food cans
was banned only in 1995, 15 years after scientists showed that lead solder in tuna cans increased the lead
concentration in the contained tuna to 1,400 parts per billion (ppb, or 1 microgram per kilogram) compared to 7
ppb in tuna in unsoldered cans.
As for lead in drinking water, the 1986 Amendments to the SDWA required EPA to establish regulations for lead
in public water systems. The Amendments also defined “lead‐free pipes” quantitatively and requires their use in
plumbing for drinking water installed subsequently. The MCL for lead was set at 20 ppb. In the subsequent
“Lead and Copper Rule” (LCR) (1991), EPA determined that there is no safe level of exposure to lead, dropping
the previous MCL and setting the MCLG at zero. EPA defined a “lead action level” (requiring ameliorative steps)
for drinking water systems with greater than 15 ppb in more than 10 percent of taps sampled every 6 months in
a given location. (The FDA’s standard for lead in bottled water is 5 ppb.) The EPA protocol leaves open the
possibility that Americans are unknowingly exposed to high lead levels, as the 10 percent threshold accepts that
higher lead levels are present in a small subset of homes.
In December 2015, the National Drinking Water Advisory Council (NDWAC) provided comprehensive
recommendations to EPA on potential mechanisms to strengthen the Lead and Copper Rule.40 These
recommendations included, but were not limited to: creating a national clearing house of information for the
38 Needleman R.L, and Bellinger D., 1991. “The health effects of low level exposure to lead.” Annual Review of Public Health, 12(1), pp. 111‐140; Mushak P., Davis J.M., Crocetti A.F., Grant L.D., 1989. “Prenatal and postnatal effects of low‐level lead exposure: integrated summary of a report to the US Congress on childhood lead poisoning.” Environmental Research, 50(1), pp. 11‐36; Needleman R.L., Schell A., Bellinger D., Leviton A., Allred E., 1990. “The long‐term effects of exposure to low doses of lead in childhood: an 11‐year follow‐up report.” New England Journal of Medicine, 322, pp. 83‐88. 39 Council on Environmental Health/American Academy of Pediatrics, 2016. Prevention of childhood lead toxicity. Pediatrics 138(1), www.ncbi.nlm.nih.gov/pubmed/27325637 and Centers for Disease Control and Prevention. 2012. CDC Response to Advisory Committee on Childhood Lead Poisoning Prevention Recommendations in “Low Level Lead Exposure Harms Children: A Renewed Call of Primary Prevention.” www.cdc.gov/nceh/lead/acclpp/cdc_response_lead_exposure_recs.pdf. 40 See: www.epa.gov/sites/production/files/2016‐01/documents/ndwacrecommtoadmin121515.pdf and www.epa.gov/sites/production/files/2016‐01/documents/ndwaclcrwgfinalreportaug2015.pdf.
ScienceandTechnologytoEnsuretheSafetyoftheNation’sDrinkingWater
35
public; requiring corrosion control re‐evaluation if changes to source water or treatment are planned; closing
the science gaps and providing guidance in sampling methodologies and techniques to ensure the samples
provide the desired information; and establishing a health‐based, household action level that triggers a report to
the consumer and to the applicable health agency for follow up. EPA is currently reviewing these
recommendations and other stakeholder input. In October 2016, EPA released a white paper outlining five key
principles that will guide the LCR revisions, including: (1) focus on minimizing exposure to lead in drinking water;
(2) clear and enforceable requirements; (3) transparency; (4) environmental justice and children’s health; and
(5) integrating drinking water with cross‐media lead reduction efforts.41 The EPA is currently revising the Lead
and Copper Rule, with the proposed revisions expected to be released in early 2017.
3.3RiskComparisons
Risk is formally defined as the expected value of harm from a specified exposure to a hazard, which, for an
individual, can be expressed as:
(probability of experiencing harm from the exposure) x (severity of the harm if it occurs.)
Here the measure of severity, in the case of risks to health, is typically days or years of illness, or years of lost life
expectancy, or the combination the World Health Organization calls Disability Adjusted Life Years (DALY, the
sum of lost life expectancy and years of disability preceding death). Depending on the nature of the harm, other
measures of severity may be appropriate (e.g., IQ loss in the case of children exposed to lead42).
The risk to a population, as opposed to just an individual, can be expressed correspondingly as:
(number of people exposed)
x (probability of a person’s experiencing harm from the exposure)
x (average severity of the harm if it occurs).
This product of factors is referred to as the “population risk” or “societal risk”. It is a measure of the burden a
group of people or a whole society exposed to a specified hazard can expect to bear for having been thus
exposed. Attempts are sometimes made to convert population risk or societal risk into monetary terms—for
example by using the so‐called “statistical value of a life”43 and/or the societal‐average monetary value of a lost
day of productivity—to enable a cost‐benefit analysis of measures to reduce the risk (i.e., comparing the benefit
of reducing the risk with the cost of achieving that reduction by some specified means).
In theory, being able to compare the magnitudes of different environmental risks with each other, as well as
against some absolute yardstick, is important to making sensible decisions about risk management and
41 See: blog.epa.gov/blog/2016/10/lcr‐white‐paper. 42 ACCLPP, 2012. Low Level Lead Exposure Harms Children: A Renewed Call for Primary Prevention. Report of the Advisory Committee for Childhood Lead Poisoning Prevention of the Centers for Disease Control and Prevention. See: www.cdc.gov/nceh/lead/acclpp/final_document_030712.pdf. 43 Economists use a variety of approaches for estimating the statistical value of a life or, more precisely, the value of the amount of life expectancy lost in consequence of a premature death. Examples include the loss of a worker’s expected economic output and the size of jury awards in wrongful‐death lawsuits. All such approaches to the valuation of human life have drawbacks (and draw criticism), but exponents of the practice point out that people and societies implicitly put a value on life in all manner of decisions made every day.

ScienceandTechnologytoEnsuretheSafetyoftheNation’sDrinkingWater
36
regulation. Specifically, one would like to focus the most remedial effort on the biggest risks, and one would like
to have a basis for determining which risks are small enough to require no remedial effort at all. The kinds of
risk comparisons that are germane to the safety of the public’s drinking water include:
Health risks from contaminated drinking water versus other risks to the health of the same population
(e.g., air pollution, contamination of food, epidemic disease);
Health risks from different classes of drinking‐water contaminants—chemical, microbial, and
radiological;
Health risks among different individual contaminants within a class (e.g., lead versus arsenic versus
selenium);
Health risks from different pathways of exposure to the same contaminant (e.g., lead from drinking
water versus lead from food, ingestion of dust and dirt, or breathing contaminated air); and
Health risks from a given contaminant or class of contaminants entering the water supply at different
points in the drinking‐water chain (e.g., water source, treatment plant, municipal distribution system,
premise plumbing).
A particularly important potential application of comparative‐risk methodologies is analyzing trade‐offs where
reducing risks from one contaminant or class of contaminants increases risks from another contaminant or class.
See Box 3.
In practice, while the categories of relevant health‐risk comparisons are easy enough to describe, carrying out
the comparisons in any comprehensive way is extremely challenging. That is so because:
There is an immense variety of potential drinking‐water contaminants of potential health concern in
both the chemical and microbial categories, with new ones being identified regularly;
There are different types of health impacts (“endpoints” in the specialized literature) of the various
contaminants (acute and chronic illnesses, mild to life threatening, transitory effects to lifelong
disabilities), so there is no universal, quantitative measure of harm;
There are often large variations within communities and from community to community and region to
region in drinking‐water sources and the range of distribution‐system characteristics (including
premise plumbing) that influence what contaminants are present and in what concentrations;
Deriving risk estimates from exposure data requires knowing the relations between exposure (how
many people live in households with what concentrations of what contaminants in their drinking
water) and dose (which depends on how much they drink), and between dose and probability and
severity of harm (“dose‐response relations”); and
While exposure‐dose relations can be estimated within some reasonable uncertainty bounds,
quantitative dose‐response relations are known for only a modest fraction of the syndromes known to
result from the large variety of drinking‐water contaminants of potential concern.

ScienceandTechnologytoEnsuretheSafetyoftheNation’sDrinkingWater
37
BOX 3. COMPARATIVE RISK TRADE‐OFF—CHLORINATION and DISINFECTION BYPRODUCTS
Technologies to reduce one contaminant in the complex chemistry of drinking water can directly
impact the risks posed by other contaminants, in what amounts to a dynamic, comparative, risk‐
balancing matrix. Disinfection provides a compelling example of risk balancing in drinking‐water
systems. Microbial epidemics originating from drinking water encapsulate a history of public health
impacts, from cholera and dysentery outbreaks to more recent viral, bacterial, and protozoal
gastroenteritis and Legionnaires’ disease. A core drinking water imperative is to prevent disease
epidemics from microbial contamination. Chlorine disinfection was first applied in the early 1900s
and has successfully terminated most epidemic outbreaks when adequately implemented.
Disinfection has two basic components, primary treatment to kill microbes coupled with residual
disinfection to maintain efficacy during passage of water through the distribution system. Direct
chlorination with chlorine gas is highly effective, but has the problem of causing disinfection
byproducts (DBPs) from chlorination of organic molecules in the original source water) that are
carcinogenic in animal studies. Water treatment plants can reduce DBPs in the distribution system
(and thereby come into compliance with MCL requirements) by changing to other forms of
disinfection, such as chloramine that reduces DBP formation and provides improved chlorine
residuals in the distribution system. These changes must take into account and adjust for altered
water chemistry which, if not adequately addressed, can leach lead from the pipes.44 In the early
2000s, Washington, D.C. experienced a spike in lead in drinking water and children’s blood as a
result of such a disinfectant switch, a forerunner to Flint, albeit from a different change to the
drinking‐water chemistry that led to the same result of lead leaching from the old pipes.45 There is
no easy answer here—even pure water can cause leaching—but rather the necessity to recognize
the importance of complex chemistry and risk‐balancing when dealing with drinking‐water systems
over the decades‐long duration of pipe infrastructure.
Despite these challenges, careful efforts to rank drinking‐water health hazards by the magnitude of the risks
they pose can be instructive—particularly across contaminants within a given class (chemical, microbial,
radiological) and with common health end‐points (e.g., reduced life expectancy)—as long as it is recognized that
such rankings are necessarily partial, preliminary, and variable across locations.46
The simplest approach that, at the current state of knowledge, can yield useful insights about comparative risks
from different contaminants in the Nation’s drinking water is based on looking, for those contaminants for
which EPA has established MCLs, at how frequently and by what margins the measured concentrations across
the country’s public water systems exceed the MCLs. One attraction of this approach is that the process by
44 Edwards M. and Dudi A., 2004. “Role of Chlorine and Chloramine in Corrosion of Lead‐Bearing Plumbing Materials.” Journal ‐ American Water Works Association, 96(10), pp. 69‐81. 45 Edwards M., Triantafyllidou S., Best D., 2009. “Elevated blood lead in young children due to lead‐contaminated drinking water: Washington, D.C., 2001‐2004.” Environmental Science and Technology, 1;43(5), pp. 1618‐23. 46 It must be added that even a reliable ranking of contaminants according to the health risks they pose is not by itself sufficient to determine priorities for action. In the best of possible worlds, priorities would also take into account benefit‐cost ratios for available approaches to reducing the risks and expert judgment on the prospects that research and development would yield better risk‐reduction approaches on a meaningful time scale.

ScienceandTechnologytoEnsuretheSafetyoftheNation’sDrinkingWater
38
which EPA constructs the MCLs accounts for whatever is known about the exposure‐dose and dose‐response
relations for the individual contaminants.
The main liabilities of the approach are: (a) that the “end points”—the health damages the MCLs are intended to
avoid or minimize—are not always comparable across contaminants; (b) for many contaminants of potential
concern, the MCLs have not yet been published; and (c) the most recently published nationwide data based on
sampling public‐water systems—provided by EPA as the second 6‐year review under the Safe Drinking Water
Act—are both out of date (covering 1999‐2005) and incomplete (including neither lead, nor microbial
contaminants, nor major disinfection products). Data from the third 6‐year review, which are expected to be
released soon, still will not include data for lead.
In Section 6.3, PCAST offers additional information and an example, based on a limited number of chemical
contaminants, of how a quantitative risk comparison based on frequency and magnitude of MCL exceedances
can be done and what the (partial) results look like.
3.4MonitoringIssues
Monitoring drinking water for a wide variety of microbial, chemical, and physical contaminants is critical to
ensuring the safety of the Nation’s drinking water. Monitoring data are essential for surveillance of microbial,
chemical, and physical risk factors; evaluating the performance of the drinking‐water system; determining needs
for further intervention; and informing the public on the quality of their water. These data are needed in all four
components of the drinking‐water system: source water, treatment‐plant performance, distribution system, and
the premise plumbing that delivers water to the tap.
Testing drinking water for various types of contamination is delegated by EPA, under SDWA, to the states—
“state primacy”—in connection with their regulation of private and municipal water utilities, usually through
departments of health or environmental protection.47 In addition to setting standards for about 90 drinking‐
water contaminants, as noted above, the EPA regulates the frequency of water‐testing schedules and methods
that water utilities or State regulatory agencies must use. For homes that are not connected to public water
systems and are not part of any water utility (approximately 15 percent of households), however, there are no
monitoring requirements set by the EPA. But the U.S. Department of Agriculture (USDA) has a variety of
programs aimed at improving water quality in rural America, including private wells and wastewater systems
Under EPA rules, monitoring requirements vary for different contaminants. For example, under the Lead and
Copper Rule, water utilities must sample water from customers’ taps every 6 months from a specified number of
homes, depending on the size of the water utility (i.e., how many people are served). Under the Revised Total
Coliform Rule (RTCR), which addresses a variety of microbial health risks, total coliform bacterial load is used as
an indicator of other problems including integrity of distribution systems and effectiveness of water treatment.
Total coliform monitoring plans are regulated by states, but a specified number of samples per month are
required by the EPA, depending on the size of the water utility. Small utilities that serve fewer than 1000 people
must take one sample every month; the largest utilities—those serving more than 3,960,000 people—must take
47 See: www.epa.gov/dwreginfo/primacy‐enforcement‐responsibility‐public‐water‐systems.

ScienceandTechnologytoEnsuretheSafetyoftheNation’sDrinkingWater
39
at least 480 samples per month. For some categories of contaminants, there are also waivers that allow utilities
to sample less frequently if certain goals and requirements are met.48
There are many technologies that can detect a range of contaminants at very low levels in drinking water. One
important shortfall, however, is that monitoring technologies in distribution systems are currently extremely
expensive and, in order to be effective, must be spread around the distribution system at multiple nodes or
control points. While these sensors can detect many contaminants at very low levels, it is difficult to discern
small, real, changes from background variability, due to statistical “noise” in background water‐quality data.
Criteria for mandatory reporting and remediation vary across different categories of contaminants. For
example, the EPA defines an “action level” for lead of 15 ppb, and if 10 percent of samples taken exceed this
action level, the utility must take a number of actions to control corrosion and reduce lead levels, including
alerting the community to the problem. For total coliform bacteria, the action threshold is 5 percent of the MCL,
which triggers a series of additional testing and remediation requirements. These differences are reasonable,
given different health risks and different attributes of the drinking water system that are associated with these
risks. Clearly, contaminants like lead that have severe, chronic health impacts should be treated differently from
certain types of microbial contaminants that cause severe, acute health impacts.
3.5U.S.Drinking‐WaterSafetyinPractice
Most existing water‐treatment plants meet current Federal regulations most of the time, although some—often
older facilities that serve smaller or declining‐population communities—have significant treatment challenges
that lead to consistent shortfalls in meeting standards. Of the Nation’s roughly 150,000 public water systems,
the number found with any violation of EPA’s primary drinking‐water standards fell from 60,000 in fiscal year
(FY) 2011 to under 50,000 in FY 2015, and the number found with a serious violation fell from 7,700 in FY 2011
to about 4,500 in FY 2015 (Table 3).49 Among the 429 very large public water systems—those serving more than
100,000 customers—the number with a serious violation in FY 2015 was 16, under 4 percent. By far the largest
proportion of the violations related to coliform bacteria and other microbes; disinfection byproducts were a
distant second with about a fifth as many violations; and arsenic, lead, and copper combined were third with
about a sixth as many.
The much‐publicized drinking‐water‐system closures in Toledo, Ohio and Charleston, West Virginia, in 2014,
were the result of source‐water contamination—harmful algal‐bloom growth and microcystin toxin in Lake Erie,
and an industrial spill of 4‐methylcyclohexanemethanol (MCHM) from the Freedom Industries facility in
Charleston into the Elk River, respectively. The Flint, Michigan crisis the next year, which resulted from a source‐
water change that interacted destructively with distribution‐system plumbing, highlights the interconnectedness
of the entire drinking‐water system: the change of source water from Lake Huron to the Flint River greatly
increased the corrosiveness of the water, and, absent adequate corrosion control at the Flint drinking‐water
treatment plant, the water leached lead from the aged distribution‐system pipes, leading to elevated lead levels
in the drinking water provided to much of the community. See Boxes 4 and 5.
48 Federal Register 78, No. 30, Wednesday, February 13, 2013, p. 10361 www.gpo.gov/fdsys/pkg/FR‐2013‐02‐13/pdf/2012‐31205.pdf. 49 See: echo.epa.gov/trends/comparative‐maps‐dashboards/drinking‐water‐dashboard?view=performance&state=National&criteria=basic.
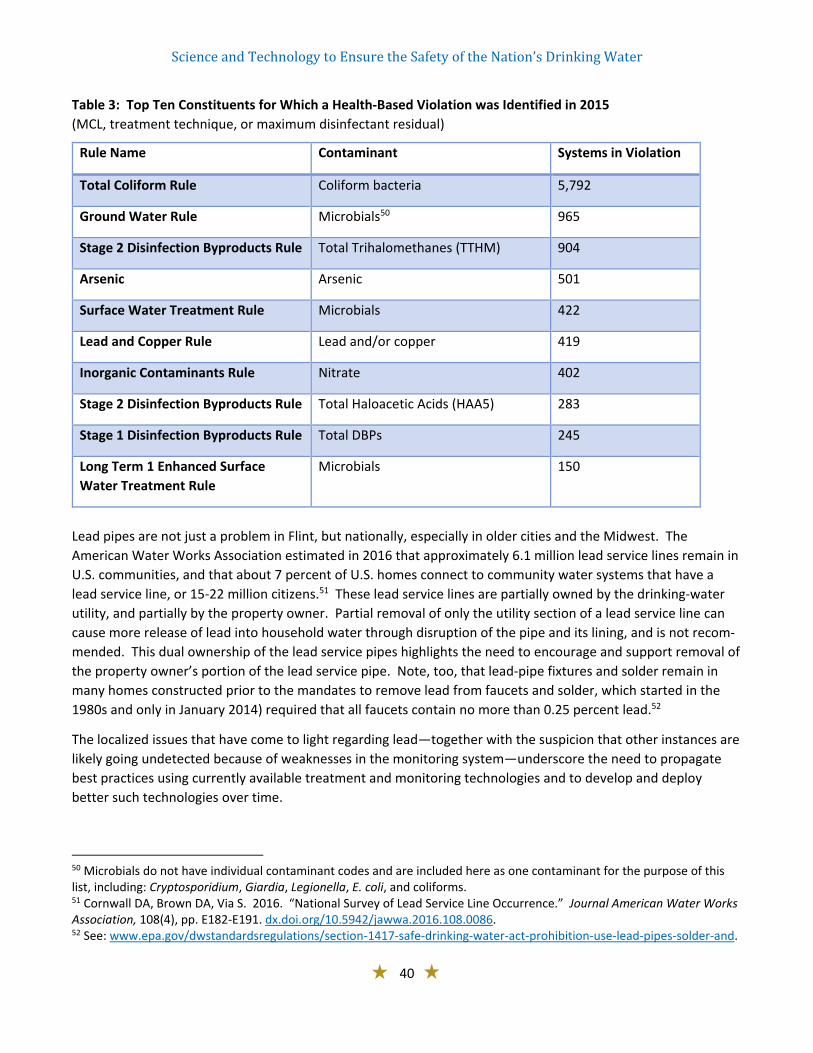
ScienceandTechnologytoEnsuretheSafetyoftheNation’sDrinkingWater
40
Table 3: Top Ten Constituents for Which a Health‐Based Violation was Identified in 2015
(MCL, treatment technique, or maximum disinfectant residual)
Rule Name Contaminant Systems in Violation
Total Coliform Rule Coliform bacteria 5,792
Ground Water Rule Microbials50 965
Stage 2 Disinfection Byproducts Rule Total Trihalomethanes (TTHM) 904
Arsenic Arsenic 501
Surface Water Treatment Rule Microbials 422
Lead and Copper Rule Lead and/or copper 419
Inorganic Contaminants Rule Nitrate 402
Stage 2 Disinfection Byproducts Rule Total Haloacetic Acids (HAA5) 283
Stage 1 Disinfection Byproducts Rule Total DBPs 245
Long Term 1 Enhanced Surface
Water Treatment Rule
Microbials 150
Lead pipes are not just a problem in Flint, but nationally, especially in older cities and the Midwest. The
American Water Works Association estimated in 2016 that approximately 6.1 million lead service lines remain in
U.S. communities, and that about 7 percent of U.S. homes connect to community water systems that have a
lead service line, or 15‐22 million citizens.51 These lead service lines are partially owned by the drinking‐water
utility, and partially by the property owner. Partial removal of only the utility section of a lead service line can
cause more release of lead into household water through disruption of the pipe and its lining, and is not recom‐
mended. This dual ownership of the lead service pipes highlights the need to encourage and support removal of
the property owner’s portion of the lead service pipe. Note, too, that lead‐pipe fixtures and solder remain in
many homes constructed prior to the mandates to remove lead from faucets and solder, which started in the
1980s and only in January 2014) required that all faucets contain no more than 0.25 percent lead.52
The localized issues that have come to light regarding lead—together with the suspicion that other instances are
likely going undetected because of weaknesses in the monitoring system—underscore the need to propagate
best practices using currently available treatment and monitoring technologies and to develop and deploy
better such technologies over time.
50 Microbials do not have individual contaminant codes and are included here as one contaminant for the purpose of this list, including: Cryptosporidium, Giardia, Legionella, E. coli, and coliforms. 51 Cornwall DA, Brown DA, Via S. 2016. “National Survey of Lead Service Line Occurrence.” Journal American Water Works Association, 108(4), pp. E182‐E191. dx.doi.org/10.5942/jawwa.2016.108.0086. 52 See: www.epa.gov/dwstandardsregulations/section‐1417‐safe‐drinking‐water‐act‐prohibition‐use‐lead‐pipes‐solder‐and.
ScienceandTechnologytoEnsuretheSafetyoftheNation’sDrinkingWater
41
BOX 4. FLINT, MICHIGAN, DRINKING WATER CONTAMINATION CRISIS FROM LEAD
The City of Flint, Michigan, shares a history with many urban centers in the United States. Formerly
an industrial powerhouse and population center since the late 1800s, Flint reached its population
zenith in the mid‐20th century and then declined as its industrial base in auto manufacturing
eroded, leaving a predominantly poor and racial‐minority population living in a depopulated urban
environment. This left Flint with a diminished tax base on which to depend for revenue—for
community functions and investment generally, and for water‐system infrastructure repairs
specifically. The City of Flint was declared to be in state of financial emergency in 2011 and placed under the
authority of a series of State‐appointed emergency managers. The managers focused on
opportunities to reconcile the accounts of the city and turned to a new water system, the
Karegnondi Water Authority (KWA), as an alternative to purchasing treated water from Detroit, as
had been the arrangement for several decades. The KWA system was not ready for operation by
the time the contract between Flint and Detroit expired, and efforts to establish a short‐term
contract between the cities (both under State emergency manager control at the time) were not
successful. Leaders in Flint decided to turn to the Flint River as a temporary water source, and to
put the Flint Water Authority water‐treatment plant into operation at a level at which it had not
functioned for decades. The switch to the Flint River immediately changed the aesthetics of the water (color, taste, smell),
and within a few short months there were water‐quality violations related to E. coli contamination
and disinfection byproducts, and reports of other health problems (e.g., rashes) thought to be
linked to the new water source. At that time, city leadership under the State‐appointed emergency
manager decided that a switch back to Detroit‐sourced water would be too expensive. During this
period, officials at the Flint Water Treatment plant added chlorine to the water supply to address
bacterial overgrowth, but did not add corrosion control to the water supply, which was not in
accordance with existing expectations under the LCR. The Michigan Department of Environmental
Quality (MDEQ) did not correct the anti‐corrosion decision in Flint but, instead, elected to conduct
back‐to‐back, 6‐month monitoring periods to evaluate the quality of the new water supply,
postponing any corrective action. The combination of changing the water source and lack of corrosion control led to breakdown of
the inner lining of water pipes throughout Flint’s aging water infrastructure, as well as in water
service lines connecting water mains to family residences and in fixtures within homes and
businesses. As a result, particulate and dissolved lead leached into the drinking water supply.
Testing conducted under the LCR resulted in detection of unsafe lead levels in water supplies in
several residences. The MDEQ did not act to remedy the situation until late September 2015, when
an analysis of blood lead tests for children revealed a statistically significant increase in the
proportion of children with elevated blood lead levels since the switch to the Flint River. In October
2015 the decision was made to switch back to water pumped to Flint from Detroit. It was not clear
how long it would take the water infrastructure in Flint to “heal” its inner lining with proper

ScienceandTechnologytoEnsuretheSafetyoftheNation’sDrinkingWater
42
corrosion control, so broad efforts were made to provide residents of Flint with proper water filters
to fit their faucets, and also to provide them with free water for drinking, cooking, and bathing.
A non‐partisan group of experts in water quality, environmental law, medicine, and public health,
known as the Flint Water Advisory Task Force, reviewed the events that precipitated what came to
be known as the “Flint water crisis.” The Task Force issued its findings in March 2016, which
included 44 specific recommendations across the full range of Federal, State, and local agencies,
and including domains spanning administrative, environmental, health‐related, educational,
scientific, and business concerns.53 It concluded: “The Flint water crisis is a story of government
failure, intransigence, unpreparedness, delay, inaction, and environmental injustice.”
As part of its response to concerns about children’s exposure to lead, and at the urging of the Flint
Water Advisory Task Force, the Michigan Department of Health and Human Services began to issue
summaries of children’s blood lead test results every two weeks. The department continued to
post their latest reports through Fall 2016.54 The latest lead level testing report issued at the end of
2016 indicated that about twice as many children living in residences with Flint ZIP codes had had
their serum lead levels checked up to that point compared to each of the preceding calendar years.
Moreover, the proportion of children living in Flint ZIP codes with lead levels of 5 or more mcg/dL in
calendar year 2016 (through early November) had decreased to 2.6 percent from 3.9 percent in
2014 and 3.3 percent in 2015. Broadened testing was attributed to greater public awareness about
the hazards of lead exposure, in the wake of substantial public activism and media attention.
Lower proportions of children tested for whom lead levels were at 5 mcg/dL or higher were
attributed to the switch back to Detroit‐sourced (treated from Lake Huron) water and to point‐of‐
use filters and bottled water used by many Flint families. The Federal Centers for Disease Control
and Prevention also evaluated the elevated blood lead levels among children in Flint55 and the
relationship of Flint tap‐water exposure to reports of skin rashes.56
In early 2016, the State of Michigan also conducted an unprecedented effort to replace point‐of‐
use fixture replacements and subsequent premise‐pipe flushing in public schools and early‐
childhood education facilities in the City of Flint. The State followed up by sampling water from the
sources of drinking water in the facilities and posted the results online, listed by facility with specific
details about how plumbing concerns were managed and how sampling was conducted.57 While
most of the institutional lead sampling results posted by the State were non‐detectable, there were
instances where lead testing came back with elevated levels, and these were shared with the public
directly via the MDHHS website. Such testing and public transparency was also a recommendation
of the Flint Water Advisory Task Force.
The first two phases of an initiative to replace lead‐lined service lines to community members’
homes were undertaken using State funds. From March through October 2016 about 300
53 See: www.michigan.gov/documents/snyder/FWATF_FINAL_REPORT_21March2016_517805_7.pdf. 54 See: www.michigan.gov/documents/flintwater/Weekly_Executive_Report_‐_Flint_Blood_Testing_11_04_16_FINAL_541709_7.pdf. 55 See: www.cdc.gov/mmwr/volumes/65/wr/mm6525e1.htm. 56 See: www.atsdr.cdc.gov/ntsip/flint_rash_investigation.html. 57 See: www.michigan.gov/flintwater/0,6092,7‐345‐76292_76294_76297‐‐‐,00.html.

ScienceandTechnologytoEnsuretheSafetyoftheNation’sDrinkingWater
43
residences had their lead service lines replaced, and the goal was to replace lines for as many as
1000 homes before the end of winter. The broader goal for this infrastructure initiative is to
replace as many as 5000 lead‐lined service lines before the end of 2017, and to follow up with
water sampling for lead in all homes with modified lines.58
In December 2016, Congress passed the Water Infrastructure Improvement for the Nation Act,
authorizing funding for Flint and other communities to respond to lead problems. The legislation
provides access to $100 million in funding to help fix Flint’s drinking‐water infrastructure, $200
million in low‐interest loans to upgrade water infrastructure in communities in Michigan and across
the Nation, $50 million to address the health‐care needs of children who have been exposed to
lead, and authorizes the State of Michigan to forgive $20 million in past drinking‐water loans to
Flint.
BOX 5. TOLEDO, OHIO, DRINKING WATER SYSTEM CLOSURE FROM HARMFUL ALGAL BLOOMS
Harmful algal blooms (HABs) are an overgrowth of cyanobacteria59 in freshwater and marine
systems that can produce toxins that are released into the water and can cause illness or irritation
in pets, livestock, and humans. These toxins are organic compounds that affect different systems in
the body, including the central nervous system, liver, and other organs. In the 2009 National Lakes
Assessment, EPA estimated that over 27 percent of all lakes in the United States are at moderate to
high risk of cyanobacteria, and over 30 percent of lakes had measurable toxin levels in them.60
HABs occur naturally, but human activities that disturb ecosystems seem to play a role in the
increased occurrence of some blooms, such as increased nutrient loadings and pollution, food web
alterations, introduced species, water flow modifications, and climate change.61 Conventional
water treatment plants are very effective at removing the algal cells, but those without strong
oxidants and/or granular activated carbon filtration are less effective at removing toxins dissolved
in the water.
In 2014, almost a half‐million people in Toledo, Ohio, were forced to drink bottled water for several
days as a result of a HAB that occurred in Lake Erie, the city’s water supply. A large algal bloom had
occurred in Lake Erie near the inlet to the Toledo drinking water plant. The intake is located in the
shallowest part of the lake, and the warm summer weather, combined with abundant sunlight,
fueled growth of cyanobacteria. The real trigger for the HAB was not only warm water and
sunlight, but increased runoff of phosphorous following rainfall, a critical limiting nutrient for algae
growth. Two rivers (the Maumee and the Cuyahoga) flow into Lake Erie near Toledo, OH. The
Maumee River basin has extensive agricultural lands, where high levels of fertilizers in soils were
leached by heavy rainfall and washed into rivers, resulting in high levels of phosphorus draining into
Lake Erie. In contrast, the Cuyahoga River basin is mostly urban and industrial (including houses for
nearly 15 percent of Ohio’s population), and phosphorus concentrations remained mostly constant
58 See: www.mlive.com/news/flint/index.ssf/2016/11/flint_mayor_wants_1000_homes_t.html#incart_river_index. 59 Cyanobacteria (aka, blue‐green algae) are microscopic organisms, and some types of cyanobacteria produce earthy‐musty tastes and odors in water and/or algal toxins of potential health concern. 60 See: www.epa.gov/sites/production/files/2013‐11/documents/nla_newlowres_fullrpt.pdf. 61 See: coastalscience.noaa.gov/research/habs.
ScienceandTechnologytoEnsuretheSafetyoftheNation’sDrinkingWater
44
despite large spikes in water flow after the heavy rains. Thus, runoff from non‐point sources
(agricultural lands), which are more difficult to control or regulate than point sources (urban
wastewater), was implicated in loading phosphorous into Lake Erie, fueling the 2014 HAB episode.
The Toledo Collins Park Water Treatment Plant was unable to remove all the toxins, and a “Do Not
Drink Advisory” was put in place by the city. The advisory was lifted after 2 days.
Numerous remedial actions were taken subsequent to this major event, including: (1) upgrades to
the Collins Park Water Treatment Plant; (2) installation of an advanced warning system for early
detection of HABs that uses buoys and sensors, allowing the city to implement operational changes
prior to microcystin toxin reaching the Collins Park Water Treatment Plant; and (3) Ohio EPA
developed a Public Water System Harmful Algal Bloom Response Strategy in July 2016.62 NOAA also
provides HAB Forecast Bulletins for Lake Erie, including short‐term (once or twice weekly) forecasts
to characterize current HABs, and longer‐term seasonal forecasts to predict the anticipated severity
of HABs in a particular region.
3.6BestCurrentandEmergingTreatmentTechnologies
Historically, standard water‐treatment practice has included, in sequence, coagulation/flocculation, settling, and
filtration, with disinfection using chlorine or its compounds either preceding or following filtration. Disinfection
with chlorine before filtration maximizes filter run times and helps control turbidity in “finished” (fully treated)
water, but it can lead to production of carcinogenic disinfection byproducts (DBPs).
For the past decade, water utilities have been changing their use of chemical disinfectants, mostly to comply
with increasingly stringent DBP regulations enacted in amendments to the SDWA. This trend has coincided with
integration of new processes into their treatment plants, such as use of granular activated carbon and
engineered biological films on the surface of filter media.
Biological filtration processes can act on both organics and inorganics to remove many contaminants of concern,
including algal metabolites that cause unpleasant tastes and odors, iron, manganese, nitrate, and other specific
organic molecules. Today, perhaps a quarter of water utilities are intentionally or unintentionally practicing
some form of biological filtration.
Innovations in ultraviolet (UV) light technologies and demonstrated effectiveness in the 1990s and early 2000s
have allowed rapid incorporation of this technology in drinking‐water treatment plants. Before 1990, drinking‐
water facilities rarely used UV light, but instead relied upon chemical disinfection means (chlorine or ozone). UV
light allows for systems to be of smaller size (i.e., shorter contact times) and does not require chemical feeds.
UV light at 254 nm breaks DNA bonds in pathogens, inactivating them and disinfecting water, including
inactivating protozoan cysts to meet the challenge of Giardia and Cryptosporidium disinfection. Unlike chlorine
or ozone chemical disinfectants, there are few byproducts formed in water treated with UV light. Today, plants
over 100 million gallons per day (MGD) using UV light are routinely commissioned and accepted by regulators.63
Unlike chlorine (and to a lesser extent ozone), UV light disinfection does not provide a residual disinfectant in
62 See: epa.ohio.gov/Portals/28/documents/habs/PWS_HAB_Response_Strategy.pdf. 63 Dotson A.D., Rodriguez C.E., Linden KG., 2012. “UV disinfection implementation status in US water treatment plants.” Journal American Water Works Association 104(5), pp. 77‐78. dx.doi.org/10.5942/jawwa.2012.104.0075.

ScienceandTechnologytoEnsuretheSafetyoftheNation’sDrinkingWater
45
the water. If UV light is used as the primary means of disinfecting water at a treatment plant, a secondary
disinfectant must be used to maintain disinfection within the distribution system.
Over the past decade or so, other significant treatment technology changes have included:
A shift from free chlorine to chloramines to comply with disinfection‐byproducts rules. Currently, more
than 50 percent of the U.S. population is served by chloraminated water, yet comprehensive
epidemiological studies are needed to confirm a reduced health risk compared to the previous free‐
chlorine disinfection process.64 Innovations in monitoring disinfection byproduct precursors (e.g.,
ultraviolet‐ or fluorescent‐based instruments) or on‐line measurements of disinfection byproducts have
been made, but few utilities employ them because they are not required by regulation.
Micro‐ or ultrafiltration membranes have gained increasing use over the past 2 decades. These
membranes provide smaller reactor footprints than granular media filters, but cost 10 percent to 50
percent more than granular media filters. The membranes typically have greater automation and higher
effluent‐water quality than granular media filters, but innovation is needed to reduce their costs.
Ultraviolet‐based, in‐plant, disinfection use with low‐pressure mercury‐based lamps has increased dramatically over the past decade. But innovations are needed to reduce energy consumption (by, e.g.,
transitioning to non‐mercury‐based lighting technologies such as LEDs, evaluating tradeoffs between higher‐ versus lower‐efficiency mono‐ versus poly‐chromatic lamps), reduce scale formation on lamp sleeves, and improve on‐line monitoring capabilities to ensure continuous disinfection. UV reactors
operated at higher energy doses and with addition of chemicals (hydrogen peroxide, chlorine, titanium dioxide) are also capable of producing powerful oxidants (hydroxyl and chlorine radicals) that effectively
oxidize many organic contaminants of emerging concern, and this is now a critical protective barrier being employed in most direct‐and indirect‐potable wastewater reuse facilities.
Other aspects where improvement is needed include the following:
Nitrate removal is most commonly achieved using ion exchange. As nitrate exists in water as the free ion, it can be exchanged with chloride in anion exchange columns. When the exchange capacity of the
columns is exhausted, they are regenerated with high concentration salt solutions. This type of
treatment generates large volumes of highly saline brines that are most commonly disposed to the
sewer system which impacts wastewater‐treatment practices. Innovation is needed to devise new
treatment processes that do not generate brine waste and improve ion‐exchange treatment efficiency
for nitrate (and other pollutants including fluoride, perchlorate, arsenic, hexavalent chromium, and
perfluorinated compounds) in the presence of elevated levels of sulfate, bicarbonate, and other anions.
Arsenic removal from drinking water is most commonly achieved by sorption, coagulation/filtration, or
ion exchange in packed‐bed columns. Increasing treatment performance and minimizing waste volumes
and hazards from these existing technologies are needed. Simplification of arsenic‐treatment processes
is also needed to make the technologies more accessible and operable by the small water systems that
represent the greatest number of systems currently not complying with the arsenic drinking‐water
standard.
64 Implementing chloramination (the controlled mixing of free chlorine with ammonia to create the persistent, less reactive disinfectant, monochloramine) is generally a very low cost method to reduce the concentration of disinfection byproducts found in distribution systems (as compared to the implementation of granular activated carbon filtration for the removal of the organic matter that reacts with free chlorine to form DBPs).
ScienceandTechnologytoEnsuretheSafetyoftheNation’sDrinkingWater
46
Many home and industrial point‐of‐use devices employ low pressure reverse osmosis. These have less
than 30 percent efficiency when operated off of water‐distribution‐system pressures, leading to large
flows of wasted water. Innovation is needed to increase recovery efficiencies, reduce membrane
fouling, improve membrane cleaning, and improve reverse‐osmosis polymer material to decrease
sensitivity to oxidants.
3.7BestCurrentandEmergingMonitoringTechnologies
It is currently impractical to rely on “high‐tech” sensor systems that can identify specific contaminants. Instead,
a “lower tech” approach is used, employing general water quality monitors that can give utility operators a general sense of the state the water. Most current water systems rely on “grab” sampling under the Revised
Total Coliform Rule to understand chlorine levels in the distribution system; relatively few use on‐line sensors; and even fewer have the distribution system blanketed with enough to fully understand spatial and temporal variability. Most water utilities likewise use monthly or less frequent “grab” samples from the distribution
system for disinfection byproduct monitoring, complemented by daily or weekly samples at the water‐treatment plant.
New sensors are continually becoming available, allowing for new streams of data to be collected by water systems. There are now several commercially available on‐line sensors that are capable of measuring multiple
parameters simultaneously, including various combinations of turbidity, pH, pressure, conductivity, oxidation‐reduction potential, and disinfectant residuals.65 The combination of these basic parameters can be used to
assess the integrity of the distribution system and determine when deviations from baseline conditions occur. These sensor systems can be spread throughout the distribution system and require little power and other
utilities to operate; and data can be uploaded to cloud‐based systems or hard‐wired into utilities’ control systems.
The size of the sensors has greatly diminished over the last decade and can now be easily deployed instead of having to be placed in pump stations or locations with a lot of available room. At costs below $5,000 for the most basic systems and up to $10,000 for systems that can also measure disinfectant residuals, and coverage of
50‐100 service connections, this comes to between $50 and $100 per connection.66 Combined with low operating costs, these sensors are a substantial upgrade over the existing grab‐sampling requirements and can
give water utilities a more comprehensive view of real‐time (or near real‐time) conditions in their distribution systems.
The National Oceanic and Atmospheric Administration (NOAA) recently deployed the first‐ever freshwater environmental sample processor (ESP) for HABs in Lake Erie.67 The ESP, an autonomous robotic instrument, is
collecting and analyzing water samples for algal toxins in near real‐time and will be able to provide treatment
65 Turbidity is the cloudiness or haziness of water caused by large numbers of individual particles, generally small and invisible to the naked eye, and is a key test of water quality. Turbidity is measured in Nephelometric Turbidity Units (NTU), which estimate the concentration of suspended particles in a sample of water by measuring the incident light scattered at right angles from the sample; pH is a numeric scale used to specify the acidity or alkalinity of an aqueous solution; conductivity is the degree to which a solution conducts electricity, an indirect measure of the concentration of dissolved solids ionized in the water; oxidation‐reduction potential is a measurement of water’s ability to oxidize contaminants—the higher the ORP, the greater the number of oxidizing agents; disinfection residuals, the remaining concentration of disinfecting chemical (e.g., chlorine or chloramine) at a specified point in the distribution system, important to maintaining drinking‐water safety during transit to consumer taps. 66 Personal Communication between John Kiernan to Orren Schneider, 2016. 67 See: www.glerl.noaa.gov//res/HABs_and_Hypoxia/esp.html.
ScienceandTechnologytoEnsuretheSafetyoftheNation’sDrinkingWater
47
plants with information in advance to potentially mitigate effects from harmful algal blooms. With time (hours to a day), utilities have options including: shifting water production to alternative sources; reducing flows
through water treatment plants; or optimization of chemical treatments. Calibration testing was conducted in 2016, with data posted on NOAA’s Great Lakes Environmental Research Laboratory (GLERL) HABs and hypoxia
Web page.68
Leak detection plays a major role in maintaining distribution‐system integrity. Often, leaks are discovered only
when they surface or when they grow to the point of a major main break. Leaks are not only sources of lost water but are also potential entryways for contamination. In an effort to reduce leaks, utilities traditionally have
conducted periodic leak surveys, which entail trained consultants or utility staff canvassing the distribution
system making physical contact between acoustic equipment and available water‐system components (e.g., hydrants, valve nuts, curb stops, customer faucets, meters) and monitoring for sounds of leakage. Over a
number of years, leak survey equipment has become increasingly sophisticated. Today’s electronic monitoring equipment can amplify, filter, and display noise far better than the limited and subjective ear of the operator of
yesterday’s leak survey.
More recently, continuous acoustic monitoring (CAM) equipment has become available that can be placed directly on pipes. These sensors become active at night (during periods of reduced background noise) and listen
for telltale sonic fingerprints associated with leaks. When connected with Advanced Meter Infrastructure (AMI) systems, the data from several sensors can be correlated to determine the location of a leak. Because the sensors operate continuously, leaks can be identified from the time they start, and a prioritization can be made
as to which leaks need immediate repair and which can wait until they grow to become large enough to warrant repair. Several companies are working on aircraft‐ and satellite‐based sensor systems to detect leaks remotely.
68 See: www.glerl.noaa.gov//res/HABs_and_Hypoxia/habsMon.html.

ScienceandTechnologytoEnsuretheSafetyoftheNation’sDrinkingWater
48
4.SupportingSafeDrinkingWater
4.1OngoingNationalActivitiesonS&TforSafeDrinkingWater
Research on the science of safe drinking water and R&D on safe‐drinking‐water technologies are and have been
conducted, supported, and assessed by a variety of Federal agencies, interagency and intersectoral consortia,
and nongovernmental organizations, many of which maintain databases, data portals, and dashboards of
drinking‐water‐safety information. Some examples follow. The work of these entities has informed PCAST’s
studies and provides the foundation for much of what we recommend.
FederalAgencies
The Environmental Protection Agency (EPA) through its Office of Research and Development conducts research
on the evaluation of microbial and chemical contaminants in resource‐water‐treatment streams, safe and
sustainable management of waste residuals, and advancing innovative technologies for water and resource
recovery.69 The EPA’s Safe Drinking Water Information System (SDWIS)70 contains information about public
water systems and their violations of EPA's drinking water regulations, as reported to EPA by the states.
The U.S. Geological Survey (USGS) has several monitoring and modeling activities that support efforts to ensure
safe drinking water71 including: monitoring source‐water quality in the Nation’s streams, rivers, lakes, reservoirs,
and aquifers and how it is changing over time; conducting research to understand the natural and human factors
that affect sources and drinking water quality; and developing water‐quality models and related decision‐
support tools that: (1) predict source water‐quality in unmonitored areas, (2) forecast short‐ and long‐term
changes in water quality, and (3) evaluate contaminant loading to receiving waters used for drinking water
supply.
The National Oceanic and Atmospheric Administration (NOAA) plays a significant role in Harmful Algal Bloom
prediction, forecasting, and research, especially in the Great Lakes region where HABs can directly impact local
drinking water supplies for millions of Americans (and Canadians).72 NOAA has also constructed a National
Water Model (NWM) that is a hydrologic simulation of observed and forecast streamflow over the entire
continental United States.73 NOAA, USGS, and the U.S. Army Corps of Engineers are collaborating under the
Integrated Water Resources Science and Services (IWRSS) partnership, with the first national water‐resource
facility at the National Water Center in Tuscaloosa, AL.74
The Centers for Disease Control and Prevention (CDC) conducts work on drinking water focused on preventing
diseases caused by chemical or microbial contamination. Key activities include disease surveillance,
technological, and emergency or outbreak assistance, building laboratory and environmental health expertise
69 See: www.epa.gov/sites/production/files/2015‐10/documents/strap_2016_sswr_508.pdf. 70 See: www.epa.gov/ground‐water‐and‐drinking‐water/safe‐drinking‐water‐information‐system‐sdwis‐federal‐reporting. 71 See: www2.usgs.gov/water. 72 See: tidesandcurrents.noaa.gov/hab. 73 See: water.noaa.gov/about/nwm. 74 See: www.nws.noaa.gov/oh/nwc.

ScienceandTechnologytoEnsuretheSafetyoftheNation’sDrinkingWater
49
and capacity, monitoring and evaluation of prevention interventions, and health promotion to keep domestic
drinking water, swimming pools, lakes, and other water sources healthy and safe. CDC provides assistance to
state, local, tribal and territorial public‐health departments responsible for oversight of water systems not
covered by SDWA.75 CDC also provides national leadership on children’s health by working with other Federal
agencies and states through programs and policies to prevent childhood lead poisoning, including monitoring
and evaluating children’s blood‐lead surveillance data and setting and revising the national blood lead reference
level of 5 micrograms per deciliter (µg/dL) for U.S. children ages 1‐5.76
The National Science Foundation (NSF) supports basic scientific research across a variety of domains through a
rigorous merit review process. Drinking water‐related activities are funded under several Directorates, covering
such topics as materials science and nanosystems engineering research to improve water‐treatment systems,
new sensor technologies, urban water‐systems innovation networks, and the Consortium of Universities for the
Advancement of Hydrologic Science, Inc. (CUAHSI) to develop shared infrastructure for improving and
promoting access to data, information, and models on water system research.77
InteragencyandIntersectoralConsortia
The Subcommittee on Water Availability and Quality (SWAQ)78 of the National Science and Technology Council
(NSTC—a Cabinet‐level council that coordinates cross‐agency R&D efforts) is a Federal interagency group
focused on research needs related to the availability and quality of water resources of the United States. Its
current priority is to deliver the action items assigned to SWAQ in the March 2016 Presidential Memorandum on
Drought Resilience and associated Federal Action Plan. SWAQ is in the process of expanding its current
membership base79 to include expertise in drinking water monitoring, technologies, and infrastructure, with the
objective of developing a Federal Strategy on research needs to improve drinking‐water quality, scheduled for
2017.
The Water‐Energy‐Food Nexus Taskforce80 under the NSTC is currently exploring Federal activities and potential
gaps in research areas affecting two or more vertices of the nexus (i.e., water‐energy, energy‐food, food‐water,
or all three). There are several nexus elements that relate to drinking water, including agricultural runoff and
water quality, energy use for water treatment, and energy production from dual‐use water resources. A
working paper in preparation will include discussion on the interaction of the nexus and drinking water.
The Water Treatment Interagency Working Group (WaTr)81 is a recently re‐established working group of the
Bureau of Reclamation and the U.S. Army Tank Automotive Research, Development, and Engineering Center to
provide an opportunity for Federal entities that work in the area of water treatment to come together and
leverage resources and collaborate on topics such as: water quality, innovative technologies, water reuse for
75 See: www.cdc.gov/healthywater. 76 See: www.cdc.gov/nceh/lead. 77 See: www.cuahsi.org. 78 See: water.usgs.gov/swaq. 79 Agencies chairing: EPA and DOI. Agencies manifested: U.S. Department of Agriculture (USDA), Department of Commerce (DOC), Department of Defense (DOD), Department of Energy (DOE), Health and Human Services (HHS), Department of Homeland Security (DHS), Housing and Urban Development (HUD), Department of the Interior (DOI), Department of Justice (DOJ), EPA, National Aeronautics and Space Administration (NASA), NSF, Tennessee Valley Authority (TVA). 80 Agencies chairing: USDA and DOE. Agencies manifested: USDA, DOC, DOD, DOE, HHS, DHS, HUD, DOI, DOT, DOS, EPA, NASA, NSF, U. S. Agency for International Development USAID, and TVA. 81 Agencies represented by working group members include: USDA, DOC, DOD, EPA, DHS, DOI, NASA, NSF, and USAID.

ScienceandTechnologytoEnsuretheSafetyoftheNation’sDrinkingWater
50
indirect/direct and agricultural uses, energy efficiency, cost reduction, environmental impacts, modeling, and
smart water systems.
The Water Quality Portal is a cooperative service sponsored by USGS, EPA, and the intersectoral National Water
Quality Monitoring Council (NWQMC). It serves as a portal for water‐quality data (predominantly for ambient
water) collected by more than 400 Federal, State, Tribal, and local agencies, including many citizen‐science
organizations.82 NWQMC is a subgroup of the Advisory Committee on Water Information (ACWI),83 which was
chartered to represent the interests of water‐information users and professionals in advising the Federal
government. ACWI duties include developing information standards, guidelines, and procedures for the
collection, analysis, and dissemination of water information to inform decision‐making nationwide. Although
focused primarily on ambient water‐quality information, this could provide a model for coordination related to
drinking‐water data collection and dissemination.
4.2TheEPADrinkingWaterActionPlan
In response to concerns about the growing array of challenges to the drinking‐water system, the EPA evaluated
its regulatory authorities over the course of 2016 and issued, on November 30, 2016, a new Drinking Water
Action Plan (Plan)84 that is complementary to the PCAST study of S&T for safe drinking water summarized here.
The Plan aims to re‐energize the safe‐drinking‐water enterprise through engagement across the Federal
Government, water utilities, and other key stakeholders. It builds on advances in drinking‐water and
information technologies and public‐private partnerships, coupled with EPA’s experience in implementing its
authorities under the Safe Drinking Water Act. It is organized around six priorities: (1) promotion of equity and
building of capacity for water‐infrastructure financing and management in disadvantaged, small, and
environmental‐justice communities; (2) advancing a next generation of oversight approaches for the Safe
Drinking Water Act; (3) strengthening source‐water protection and resilience of drinking‐water supplies; (4)
taking action to address unregulated contaminants; (5) improving transparency, public education, and risk
communication on drinking water safety; and (6) reducing lead risks through a revised Lead and Copper Rule.
The EPA has identified challenges and goals for each priority and has proposed a diverse group of actions that, in
order to be successful, must be addressed in an integrated and strategic way. PCAST was accorded the
opportunity to review the proposed actions under each of EPA’s priorities areas, and has focused on how S&T
advances can support the important steps that EPA has outlined to transform the Nation’s drinking‐water
system into a safer and more modern enterprise. Several of the proposed actions in the EPA Plan align with
specific PCAST’s S&T recommendations, including the development of low‐cost and innovative technologies to
remove a broad spectrum of contaminants, promoting the use of advanced monitoring technology and citizen
science, development of a national e‐reporting rule, and implementation of a data portal to report monitoring
compliance.
82 See: www.waterqualitydata.us. 83 See: acwi.gov. 84 See: www.epa.gov/sites/production/files/2016‐11/documents/508.final_.usepa_.drinking.water_.action.plan_11.30.16.v0.pdf.
ScienceandTechnologytoEnsuretheSafetyoftheNation’sDrinkingWater
51
5.Near‐TermTargetedRecommendationsPCAST is making the following near‐term recommendations that we believe will help to further improve the
safety of the Nation’s drinking‐water system. These recommendations are targeted with a focus on activities
that the Administration can undertake in the areas of: monitoring for chemical and microbial contaminants
including a focus on monitoring exposure in particularly vulnerable populations; development of strategies for
improved data sharing and accessibility; expansion of citizen‐science projects on drinking water; and growth and
training of the water‐system workforce. PCAST has categorized these recommendations as “near‐term” because
there currently exist either personnel, funding, or programs that can help jump start the implementation of
these recommendations within the current Administration.
5.1IncreasedMonitoringofDrinking‐WaterContaminants,EspeciallyforVulnerablePopulations
Monitoring drinking water for a wide variety of inorganic, organic, and microbial contaminants is a critical step
to ensure the safety of the Nation’s drinking water. Monitoring provides underlying data to identify potential
health risks and provide the basis for appropriate steps towards remediation. These data are critical for
understanding and intervening in drinking water systems regarding regulated and known contaminants, and as
new health risks emerge. But, as the Flint episode and a number of others have demonstrated, there are
deficiencies in current practices for monitoring and reporting that can lead to failure to warn Americans of
contamination in their drinking water and failure of water‐system managers to take timely remedial action.
The use of existing drinking‐water‐monitoring technologies can be expanded through innovative
implementation and funding mechanisms to obtain and disseminate additional public health‐relevant
information to affected systems and communities. More advanced technologies can be adapted to provide
affordable, real‐time sensors and data tailored to the needs of system managers, researchers, and customers.
Such monitoring advances are relevant to both public water systems and to small systems and well sources that
are not regulated.
PCAST also believes that there are particular monitoring opportunities that can reduce the exposure of pregnant
women, infants, and young children to chronic, water‐borne pollution, such as lead, arsenic, and nitrate,
through targeted monitoring of those most at risk and rapid remediation when appropriate. The approach we
have in mind to monitor these vulnerable populations is highly germane to the challenge of quickly identifying
situations similar to the Flint episode and allowing for immediate intervention.
In the following section, we discuss a proposal for a new strategy for monitoring some contaminants in drinking
water that incorporates what we know about health risks both associated with the water systems and also with
the attributes of individuals. For clarity, given the large differences between the many types of contaminants,
we focus on chemical contamination using lead as an example. We then discuss other types of contaminants
that require slightly different strategies for monitoring and also for remediation.
ScienceandTechnologytoEnsuretheSafetyoftheNation’sDrinkingWater
52
TowardsaRisk‐BasedMonitoringApproach
As discussed above, the Lead and Copper Rule considers a water system to be in compliance if fewer than 10
percent of the samples taken every six months are above the action level of 15 ppb. This seems very reasonable
from a regulatory perspective, but it leaves open the possibility that millions of Americans are unknowingly and
systematically exposed to high lead levels in their drinking water, as the 10 percent threshold accepts the
findings of higher lead levels in a small but potentially substantial number of homes. Additionally, the Lead and
Copper Rule only covers community water systems and thus, homeowners with private wells may also be
exposed.
This approach to monitoring ignores, moreover, what we know about the health risks associated with lead in
drinking water, in particular, as discussed above, that pregnant women, infants and young children, especially
from low‐income households, are most at risk. More specifically, while drinking water with lead concentrations
slightly above the action level (15 ppb) is relatively innocuous for adults, it is dangerous for pregnant women,
infants, and young children. There is also strong evidence that low socioeconomic status is correlated with
higher risks of lead exposure.85 Some of this may be due to low‐income families, on average, residing in older
buildings with less frequent renovation or maintenance.
The sample approach currently mandated by the Environmental Protection Agency (EPA)—directed toward
randomly sampling high lead‐risk areas—may also result in the inefficient allocation of limited resources for lead
abatement, including service‐line replacement. Given the limited resources available for large‐scale
infrastructure replacement, targeted efforts to test water for those households most at risk and then remediate
based on the data may be more efficient in reducing the health consequences of lead exposure than widespread
efforts to replace pipes for people who have relatively low risk of lead‐related health impacts.
TargetingPregnantWomen,Infants,andYoungChildrenforDrinkingWaterTestingandTreatment
PCAST recommends that the Federal Government consider a different way of monitoring water quality in the
United States that incorporates what we know about attributes of individuals most at risk for health impacts.
We assert that it is feasible to conduct lead testing at the tap of all pregnant women in households below a
particular economic threshold, in parallel with existing monitoring under the Lead and Copper Rule. This
additional monitoring would not only allow State or Federal Governments to provide remediation to those
households that show high lead levels, but it would also allow governments to use the data to make decisions
about various interventions, from point‐of‐use or whole‐house filters, to neighborhood or system‐wide changes
in infrastructure or water treatment. The Special Supplemental Nutrition Program for Women, Infants, and
Children (WIC) can assist in this effort by referring pregnant participants to any available State water testing and
remediation programs. See Box 6.
85 U.S. Department of Housing and Urban Development. 2011. American Healthy Homes Survey Lead and Arsenic Findings. Office of Healthy Homes and Lead Hazard Control portal.hud.gov/hudportal/documents/huddoc?id=AHHS_Report.pdf.
ScienceandTechnologytoEnsuretheSafetyoftheNation’sDrinkingWater
53
BOX 6. SPECIAL SUPPLEMENTAL NUTRITION PROGRAM FOR WOMEN, INFANTS, AND CHILDREN (WIC)
WIC is administered by the Food and Nutrition Service (FNS) of the U.S. Department of Agriculture (USDA).
WIC was established to counteract the negative effects of poverty on prenatal and pediatric health and
provides benefits including nutritious supplemental foods; nutrition education; counseling, such as
breastfeeding promotion and support; and referrals to health care, social service, and other community
providers for pregnant, breastfeeding, and postpartum women, infants, and children up to the age of 5
years. In April 2014, 9.3 million women, infants, and children participated in WIC, which includes 53
percent of all babies born in the United States, who may remain eligible for services up to their fifth
birthday. Almost three‐quarters (74 percent) of all WIC participants reported incomes at or below the
Federal poverty guideline. WIC services are delivered in each of the 50 States, American Samoa, the
District of Columbia, Guam, the Northern Mariana Islands, Puerto Rico, and the Virgin Islands.
At the Federal level, FNS provides cash grants to State agencies for supplemental foods, nutrition services
and program administration, breastfeeding promotion and support, and health‐care referrals. FNS also
develops nutritional‐risk eligibility standards, issues regulations and monitors compliance with these
regulations, offers technical assistance to State agencies, and conducts studies of program operation and
performance. State agencies allocate funds to 1,900 participating local WIC agencies to operate programs
in approximately 10,000 clinic sites.
In addition to nutrition assistance, referral to health care and other social services is a core WIC benefit. WIC
serves as a link between participants and appropriate health care, including vaccinations. It seems consistent
for WIC to refer participants to water‐quality testing if it can help to counteract the environmental
consequences of poverty on the health of infants and young children.
In essence, this approach mirrors what is already done with lead testing of blood samples from infants. For
example, the Centers for Disease Control and Prevention (CDC) recommends that all children have blood lead
levels tested at ages 12 and 24 months, and such testing in mandatory in many states. Some states do not have
mandatory testing for all children and may prioritize testing children in low‐income households as they are at
greater risk of lead exposure. For example, both North Carolina and Michigan require children who enroll in
WIC to have blood‐lead levels tested at 12 and 24 months. While WIC does not pay for these tests, the Program
serves as a referral source.
In setting up a new program for water testing targeting pregnant women enrolled in WIC, it would be prudent to
engage both the EPA and Housing and Urban Development (HUD) because both have significant funds dedicated
to lead abatement. The USDA also has funds, separate from WIC, dedicated to water quality in rural areas, and
this could support some of the costs of the new program. The funding required to provide water testing, and to
subsidize water treatment options including household water filters, is modest. In 2014, 896,551 pregnant
women enrolled in WIC. If a water test costs approximately $50, including the cost of a collection kit, we
estimate the total cost (including costs of implementation and training for state agencies who might do the
collection and need to provide appropriate maintenance and use assistance) will be roughly $100 per test. This
means that the tap water of every pregnant woman who enrolls in WIC could be tested for less than $100
million annually. Ideally, resources would also be available to remediate any households that are found to have
high lead levels in their water; if point‐of‐use filters were used, the costs would again be very low, and would

ScienceandTechnologytoEnsuretheSafetyoftheNation’sDrinkingWater
54
not change the overall cost by very much, as high lead levels should occur in tests of a relatively small fraction of
the total participants (i.e., <10 percent). Importantly, this proposed approach addresses one of the weaknesses
of the current monitoring system that accepts high lead levels in homes as long as the frequency is less than 10
percent of the total samples measured.
A program could be established that offers water testing as an option to pregnant women newly enrolled in
WIC. Even with 10 percent participation by pregnant women participating in WIC, our understanding of those
homes, neighborhoods, and regions that suffer from dangerous exposures to lead would be better than what we
learn from the data available today from household sampling under the Lead and Copper Rule. In essence,
clusters of elevated lead in drinking water, such as occurred in Flint, MI, could be identified and mitigated with
the data gleaned from this type of lead‐testing program.
Proper testing for lead in tap water requires taking a “first draw” sample (i.e., the first water to come out of the
tap after a period of inactivity – typically 6 to 8 hours or overnight). PCAST recommends that appropriate
personnel at FNS (within USDA), at the EPA, and at HUD coordinate to help design the testing and data
management procedures and assist with implementation within appropriate state agencies. Primary
responsibility for administering the funding and allocating it to state agencies could belong to any of these
agencies/departments, depending on sources of funding.
TestingandTreatmentforWellsinRuralAmerica
One advantage of providing subsidized water testing and treatment through WIC would be to encourage
simultaneously water‐quality testing of private wells that are the source of drinking water for more than 45
million people. Rural participation in WIC is substantial, and the testing of private wells for WIC participants
would provide data for millions of Americans whose drinking water is unregulated by current EPA rules. For
rural areas, there are other chemical contaminants beyond lead that are have similar risk profiles, i.e., are most
dangerous for pregnant women, infants, and young children. For example, high levels of nitrate in drinking
water (>10 mg/L) can cause “blue baby” syndrome (methemoglobinemia). This is especially a problem for
private wells in rural areas with high fertilizer use. Testing for nitrate is very inexpensive (i.e., <$10 per test), so
this would add minimal costs to the program. Arsenic also shares some of the risk profiles with lead and nitrate,
although not connected to farming activities or fertilizer use. Like lead, arsenic has been found at low levels in
mother's milk, and will cross the placenta, increasing exposures and risks for the fetus. And like nitrate, arsenic
contamination of drinking water is most commonly associated with private drinking wells in rural areas.
AdditionaltestingforwatersystemstomeetLeadandCopperRulerequirements
EPA could consider changing its approach to monitoring, in particular its focus on an action level based on the
90th percentile level of tap water samples. As discussed above, this current policy allows for 10 percent of
households to have lead levels in excess of the action level. This means that neighborhoods or communities
could have significant corrosion problems, resulting in high lead levels in their drinking water, but they would
not be notified and corrective actions would not be required. One approach could be to specify an additional
threshold that triggers monitoring in that neighborhood.
In addition, the Flint water crisis illustrated another shortcoming of the current monitoring rubric: namely,
residents in houses with higher than threshold levels of contaminants in sampled drinking water are informed of
the results, but there is no obligation of the testing authorities to contact relevant public health authorities in
ScienceandTechnologytoEnsuretheSafetyoftheNation’sDrinkingWater
55
order to assure appropriate health interventions for the affected individuals. Adding such a notification
requirement would have the potential to permit early intervention in cases of exposure of high‐risk groups to
contaminated water.
RECOMMENDATION 1: INCREASED MONITORING OF DRINKING‐WATER CONTAMINANTS, ESPECIALLY FOR VULNERABLE POPULATIONS
(A) PCAST recommends that all women who enroll in the Special Supplemental Nutrition Program
for Women, Infants, and Children (WIC) be referred to the appropriate agency for tap‐water
testing for lead. That agency should also provide point‐of‐use treatment, when
appropriate. Testing for additional contaminants that have similar risk profiles to lead such as
arsenic and nitrate, particularly in rural areas that rely on private wells, should also be
provided. This effort would require some new funding (approximately $100 million per year) that
can either come from reallocation of existing lead‐mitigation funds or from new appropriations.
PCAST recommends that the President ask the Secretary of Agriculture, the Secretary of Housing
and Urban Development, and the Administrator of the Environmental Protection Agency to explore
ways to cooperate in establishing this program; developing testing protocols, training, and data
management; identifying possible sources of funding; and assigning primary responsibility for its
administration.
(B) PCAST recommends that the EPA consider modifying the Lead and Copper Rule, as well as
additional contaminant rules, to require follow‐up testing when contaminant levels exceed a
threshold level, even if the frequency of these samples is below the number that would trigger
remedial actions under current rules. This will help to identify clusters of high‐contaminant‐level
occurrences that remain invisible under existing rules.
5.2BigDataAnalyticsforDrinking‐WaterSystems
Data accessibility, utilization, and interoperability across time and space are severely limited in public and
private drinking‐water systems, and across Federal agencies.86 At least three important data trends are
emerging in the water industry that make the present an ideal time to improve coordination. First, tens to
hundreds of millions of dollars are spent annually on data collection by multiple Federal agencies related to
water quantity (e.g., lake levels, precipitation patterns, snowfall depths) and quality (e.g., temperature, salinity,
trace organics, pesticides) and by cities or other local agencies within water treatment plants, distribution
systems, and to a lesser extent premises. Some data are near real‐time or continuously monitored, while the
frequency of other samples for chemical analysis tends to rely upon sporadic grab samples with highly variable
time periods. Data describing potential contaminants of concern in watersheds (such as chemicals stored in
tanks) are also managed and maintained by states, yet most of these data are inaccessible to the water
community for purposes of protecting—proactively or reactively—against source‐water contamination events.
Second, there is no common data‐analytics platform to access this data across agencies or across states and
local communities. The limited data are difficult to link across city, State, or watershed boundaries, or to link to
86 See Sec. 4.1, for examples of agency activities.

ScienceandTechnologytoEnsuretheSafetyoftheNation’sDrinkingWater
56
specific water‐treatment plants or distribution systems. Third, private industry is beginning to market a series of
sensors, data analytics, control systems, and interfaces87 for utility operators but the industry lacks
standardization, security, and interoperability capabilities in this emerging internet of things related to drinking‐
water systems. Thus, it is an ideal time to improve coordination of data.
One example that could serve as a model is the U.S. National Science Foundation‐supported Consortium of
Universities for the Advancement of Hydrologic Sciences (CUAHSI)88 Hydrologic Information System (HIS)
project, which includes extensive development of data storage and delivery tools and standards including
WaterML (a language for sharing hydrologic data sets via web services), and HIS Server (a software tool set for
delivering WaterML from a server). These and other HIS tools have been under development and deployment
for several years and together present a relatively complete software “stack” to support the consistent storage
and delivery of hydrologic and other environmental observation data. A product from this work89 aggregates
data from multiple domains on a geospatial and temporal basis across multiple Federal agencies. Missing from
this platform is anything related to proximity/sources of drinking water, common use of water‐treatment plant
unique identifiers to link datasets (e.g., PWSID#90), water treatment plant processes and sensors, outbreaks of
disease (acute or chronic), and drinking‐water quality in distribution systems or at the tap. Such datasets can be
used in machine learning to improve operations and drinking‐water quality, provide early warning for drinking‐
water facilities within watersheds, improve cost effectiveness of monitoring programs, aid in estimating costs of
meeting regulatory mandates, and improve the health of the public and reduce medical costs.
Other examples that should be considered include the EPA‐maintained Safe Drinking Water Information System
(SDWIS),91 which compiles State‐provided data on public water systems, violations, and additional enforcement
information. EPA is proposing to augment transparency, public education, and risk communication actions
under its Drinking Water Action Plan. Central to these EPA actions will be the proposed development of a
national e‐reporting rule, which will be prepared in collaboration with state primacy agencies and directed
toward generating mandatory electronic reporting of SDWA compliance data, thereby increasing the timeliness,
completeness, and quality of information transferred between drinking‐water systems, primacy agencies, EPA,
and the public. This improved data collection and transmission will be coupled with the development of key
performance indicators, regular publication of on‐site reviews of drinking‐water programs, and a Web portal
with key indicators and infographics.92 The EPA and the U.S. Geological Survey (USGS) collaborate with the
National Water Quality Monitoring Council (NWQMC) in maintaining the Water Quality Portal, which serves over
300 million water‐quality data records collected by over 400 State, Federal, Tribal, and local agencies.93
87 For example, the University of Michigan and Google have teamed to create an app and website to assist Flint residents and officials to provide information about lead‐testing results, water testing, and pipe‐replacement efforts. Federal agencies look to these types of collaborative efforts with the private‐sector and academic experts to optimize ease‐of‐use and accessibility to the latest digital technologies. www.mywater‐Flint.com 88 See: www.cuahsi.org. 89 See: hydrodesktop.codeplex.com. 90 Public Water System identification number. 91 See: www.epa.gov/ground‐water‐and‐drinking‐water/safe‐drinking‐water‐information‐system‐sdwis‐federal‐reporting. 92 See: www.epa.gov/sites/production/files/2016‐11/documents/508.final_.usepa_.drinking.water_.action.plan_11.30.16.v0.pdf. 93 See: www.waterqualitydata.us.
ScienceandTechnologytoEnsuretheSafetyoftheNation’sDrinkingWater
57
RECOMMENDATION 2: BIG‐DATA ANALYTICS FOR DRINKING‐WATER SYSTEMS
The Executive Office of the President—with leadership from the Office of Science and Technology
Policy (OSTP), the Council of Environmental Quality (CEQ), the Domestic Policy Council (DPC), and
the Office of Management and Budget (OMB)—should support the development of a Drinking
Water Data Platform for collection, analysis, storage, and sharing of geospatially linked drinking‐
water‐system contamination data. This platform should be accessible to agencies, water utilities,
researchers, and the public and include information related to water quality and contamination
levels. The Drinking Water Data Platform should be informed by and could build off of the EPA’s
Safe Drinking Water Information System (SDWIS) and the Water Quality Portal managed by EPA,
USGS, and the National Water Quality Monitoring Council.
5.3IncreaseDataCollectionandSharingThroughCitizenScience
Under current EPA rules, monitoring requirements and sampling rates vary by state, water‐system size, and
contaminant. Private wells are not covered and some utilities are granted waivers to sample less frequently
when monitoring results collected in accordance with drinking‐water regulations have consistently been found
to be below levels of concern. The Lead and Copper Rule is the only national primary drinking‐water regulation
in which compliance samples are collected in customers’ homes. The limited frequency and distribution of
sampling of water for lead and the lack of sampling for other contaminants in premises suggests that geographic
and temporal gaps exist in data about drinking‐water contamination. PCAST identified a near‐term opportunity
to increase data collection of a broader range of drinking‐water contaminants through leveraging of citizen‐
science activities, while increasing public understanding of drinking‐water safety. See Box 7 for an example.
The roots of citizens’ participation in science in the United States date to the late 19th Century, when the public
was enlisted in data collection efforts regarding songbirds and weather patterns.94 Over the last generation, the
science of ecology and the environment has provided the most active arena for public participation in scientific
endeavors, using progressively rigorous standardization of data collection and emphasizing the value of public
education through participation.95
“Citizen science” has come to include initiatives in which a broad group of stakeholders participate in protocol‐
driven projects organized by scientists. The individuals most often play roles in data collection and may also
participate in interpretations of data. Through such collaborations, scientists benefit from the broadened scope
and scale of their research as a consequence of amplified data collection, and the participating nonscientists
benefit from learning about the science and process of data collection relevant to projects and communicating
with scientists about the findings. To the extent that research informed by citizen science may be more
generalizable, efficient, and comprehensive, the non‐participating public may also benefit from citizen‐science
endeavors.
94 See: www.birds.cornell.edu/citscitoolkit/projects/pwrc/nabirdphenologyprogram; www.audubon.org/history‐christmas‐bird‐count; and www.nws.noaa.gov/om/coop. 95 Silvertown J. 2009. A new dawn for citizen science. Trends in Ecology & Evolution, 24(9), pp. 467‐471. Trumbull DJ, Bonney R, Bascom D, Cabral A. 2000. Thinking scientifically during participation in a citizen‐science project. Science Education, 84(2), pp. 265‐275.
ScienceandTechnologytoEnsuretheSafetyoftheNation’sDrinkingWater
58
Leading examples of citizen science, including several supported by Federal agencies, provide a foundation of
experience to inform citizen‐science engagement to measure and monitor drinking‐water supplies in the United
States. Foremost examples are recurring studies at the Cornell Lab of Ornithology (CLO), in which citizens have
been indispensable in collecting large amounts of data about the diversity of bird species over long spans of
time, and across a wide array of habitats and locations. Supported largely by NSF, CLO has disseminated a
model96 for citizen‐science projects that marries the core elements of successful scientific endeavors (e.g.,
choose a scientific question, develop/test data collection protocols, analyze and interpret data, disseminate
findings) with the several unique aspects of successful citizen science.
Enthusiasm for citizen science and crowdsourcing recently led to the issuance of a Memorandum in September
2015 by Dr. John Holdren, Director of OSTP, to the heads of Executive departments and agencies encouraging
the engagement of the American public in addressing societal needs and accelerating science, technology, and
innovation through citizen science and crowdsourcing.97 The memorandum notes that these activities “can
enhance scientific research and address societal needs, while drawing on previously underutilized resources.” A
forum on citizen science and related crowdsourcing was hosted by the White House in conjunction with the
release of the Memorandum.98 OSTP and the newly established Federal Community of Practice on
Crowdsourcing and Citizen Science (CCS) jointly developed and released the Federal Crowdsourcing and Citizen
Science Toolkit.99 A website now catalogues Federally‐supported crowdsourcing and citizen science initiatives,
listing over 300 current projects supported by 25 agencies.100 Of these, 12 projects supported by 6 agencies are
focused on activities related to water sources (Table 4).
One of the most compelling aspects of applying citizen science to questions of safe drinking water is that the
observations by participating citizen scientists are directly relevant to their health and the health of their
communities. This personal level of relevance is unusual for citizen science today, which usually involves
research questions that are climate‐, environment‐, or health‐related at arm’s length from immediate impact.
The high individual relevance of one’s own participation as a citizen scientist may serve as a particularly
powerful motivating influence for some volunteers. On the other hand, the importance of the findings for
individuals’ health places a heavy burden on participant training and precision and consistency in data
collection. Therefore, for matters of citizen science that have direct bearing on health risks (such as
measurement and monitoring of drinking water), PCAST suggests that:
(1) As citizen scientists are encouraged to participate in a data‐collection protocol, extra care is taken to inform the public of which research questions might be answered through the data‐collection process,
which research questions will not be answered, and what the health implications are from the potential
results.
(2) Health‐focused citizen science will likely benefit from extra training for a subgroup of citizen scientists
who then function as advanced community experts who could be paid as research assistants, while their
community peers volunteer to help with data collection in their own homes and other sites (e.g.,
daycare centers, elementary schools).
96 Bonney R., Cooper C.B., Dickinson J., Kelling S., Phillips T., Rosenberg KV., Shirk J., 2009. “Citizen science: a developing tool for expanding science knowledge and scientific literacy.” BioScience, 59(11) pp, 977‐984. 97 See: www.whitehouse.gov/sites/default/files/microsites/ostp/holdren_citizen_science_memo_092915_0.pdf. 98 See: www.whitehouse.gov/blog/2015/09/30/accelerating‐use‐citizen‐science‐and‐crowdsourcing‐address‐societal‐and‐scientific. 99 See: crowdsourcing‐toolkit.sites.usa.gov. 100 See: ccsinventory.wilsoncenter.org.

ScienceandTechnologytoEnsuretheSafetyoftheNation’sDrinkingWater
59
Table 4: Water‐Related Citizen‐Science Activities
Project Name Federal
Sponsor
Description
CrowdHydrology101 USGS The CrowdHydrology mission is to create freely available data on stream stage in a simple and inexpensive way. Through crowdsourcing, the group gathers information on stream stage or water levels from anyone willing to send a text message of water levels at their local stream to collect spatially‐distributed hydrologic data.
Cyanomonitoring102 EPA, USGS Cyanomonitoring is a project designed to document the occurrence and timing of Harmful Algal Blooms, spatial distribution of toxin‐producing cyanobacteria with genus/species identification, and development of bloom forecasting and HAB vulnerability in water bodies.
Earth Force’s Keep It Clean – Neighborhood Environmental Trios (KIC‐NET)103
National Park Service, U.S. Fish and Wildlife Service, EPA
KIC‐NET (Keep It Clean – Neighborhood Environmental Trios) engages youth in improving urban waterways. Through partnerships with government agencies, businesses, schools, and local parks, students explore stormwater runoff in their neighborhoods and take action to improve stormwater management.
Elkhorn Slough Volunteer Water Quality Monitoring104
NOAA Elkhorn Slough National Estuarine Research Reserve (ESNERR), the Elkhorn Slough Foundation (ESF), and the Monterey County Water Resources Agency have been supporting a volunteer water‐monitoring program since 1988. Twenty‐six stations are sampled monthly for temperature, salinity, dissolved oxygen, pH, turbidity, nitrate, ammonium, and dissolved inorganic phosphate.
EPA Urban Waters Program ‐‐ Amigos Bravos105
EPA Conducts baseline water‐quality testing and analysis (pre‐Refuge development) using community volunteers and local students.
First Flush106 NOAA First Flush is a storm drain monitoring program where volunteers collect water samples from storm drains during the first major rainstorm of the winter season.
Georgia Adopt‐A‐Stream107
EPA Georgia's Environmental Protection Division Adopt‐A‐Stream program organizes and provides resources to trainers, volunteer citizen scientists, and state organizations helping them perform water quality monitoring around the State.
IDAH2O108 EPA IDAH2O is an innovative program to train citizen volunteers about regional water quality issues. Monitoring includes habitat, biological, chemical, and physical assessments.
101 See: ccsinventory.wilsoncenter.org/#projectId/129. 102 See: ccsinventory.wilsoncenter.org/#projectId/235. 103 See: ccsinventory.wilsoncenter.org/#projectId/136. 104 See: ccsinventory.wilsoncenter.org/#projectId/84. 105 See: ccsinventory.wilsoncenter.org/#projectId/132. 106 See: ccsinventory.wilsoncenter.org/#projectId/59. 107 See: ccsinventory.wilsoncenter.org/#projectId/35. 108 See: ccsinventory.wilsoncenter.org/#projectId/68.
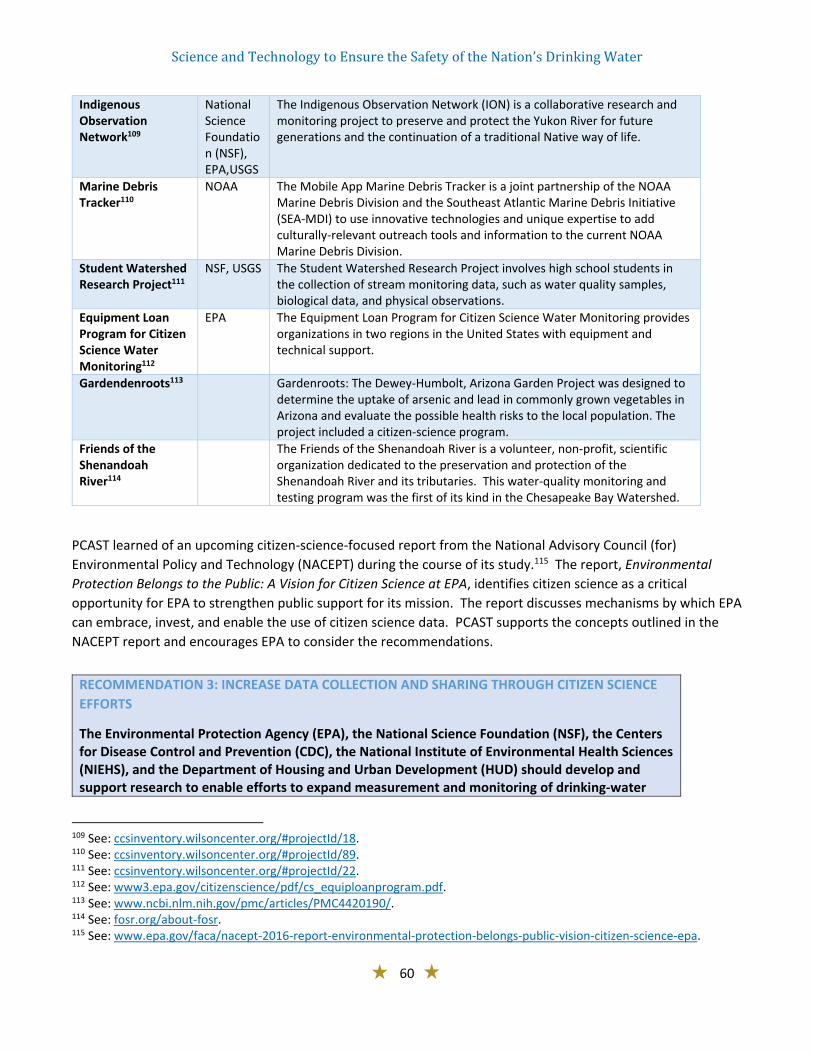
ScienceandTechnologytoEnsuretheSafetyoftheNation’sDrinkingWater
60
Indigenous Observation Network109
National Science Foundation (NSF), EPA,USGS
The Indigenous Observation Network (ION) is a collaborative research and monitoring project to preserve and protect the Yukon River for future generations and the continuation of a traditional Native way of life.
Marine Debris Tracker110
NOAA The Mobile App Marine Debris Tracker is a joint partnership of the NOAA Marine Debris Division and the Southeast Atlantic Marine Debris Initiative (SEA‐MDI) to use innovative technologies and unique expertise to add culturally‐relevant outreach tools and information to the current NOAA Marine Debris Division.
Student Watershed Research Project111
NSF, USGS The Student Watershed Research Project involves high school students in the collection of stream monitoring data, such as water quality samples, biological data, and physical observations.
Equipment Loan Program for Citizen Science Water Monitoring112
EPA The Equipment Loan Program for Citizen Science Water Monitoring provides organizations in two regions in the United States with equipment and technical support.
Gardendenroots113 Gardenroots: The Dewey‐Humbolt, Arizona Garden Project was designed to determine the uptake of arsenic and lead in commonly grown vegetables in Arizona and evaluate the possible health risks to the local population. The project included a citizen‐science program.
Friends of the Shenandoah River114
The Friends of the Shenandoah River is a volunteer, non‐profit, scientific organization dedicated to the preservation and protection of the Shenandoah River and its tributaries. This water‐quality monitoring and testing program was the first of its kind in the Chesapeake Bay Watershed.
PCAST learned of an upcoming citizen‐science‐focused report from the National Advisory Council (for)
Environmental Policy and Technology (NACEPT) during the course of its study.115 The report, Environmental
Protection Belongs to the Public: A Vision for Citizen Science at EPA, identifies citizen science as a critical
opportunity for EPA to strengthen public support for its mission. The report discusses mechanisms by which EPA
can embrace, invest, and enable the use of citizen science data. PCAST supports the concepts outlined in the
NACEPT report and encourages EPA to consider the recommendations.
109 See: ccsinventory.wilsoncenter.org/#projectId/18. 110 See: ccsinventory.wilsoncenter.org/#projectId/89. 111 See: ccsinventory.wilsoncenter.org/#projectId/22. 112 See: www3.epa.gov/citizenscience/pdf/cs_equiploanprogram.pdf. 113 See: www.ncbi.nlm.nih.gov/pmc/articles/PMC4420190/. 114 See: fosr.org/about‐fosr. 115 See: www.epa.gov/faca/nacept‐2016‐report‐environmental‐protection‐belongs‐public‐vision‐citizen‐science‐epa.
RECOMMENDATION 3: INCREASE DATA COLLECTION AND SHARING THROUGH CITIZEN SCIENCE
EFFORTS
The Environmental Protection Agency (EPA), the National Science Foundation (NSF), the Centers for Disease Control and Prevention (CDC), the National Institute of Environmental Health Sciences (NIEHS), and the Department of Housing and Urban Development (HUD) should develop and support research to enable efforts to expand measurement and monitoring of drinking‐water

ScienceandTechnologytoEnsuretheSafetyoftheNation’sDrinkingWater
61
supplies in the United States by actively funding citizen‐science activities such as home water testing, with an emphasis on including activities focused on drinking‐water sources, small systems, and private wells. As soon as practical, Citizen‐Science Coordinators from these agencies should begin the process of bringing together relevant agencies, State and local government, and water utilities in a roundtable discussion to identify a series of near‐term activities focused on collection of water‐contamination data. The relevant agency Citizen‐Science Coordinators should also begin to identify long‐term activities for developing safe drinking water‐related citizen‐science programs within states. These programs should leverage new developments in low‐cost instrumentation, including sensors, and consider the following citizen‐science components:
(1) recruitment, education, and training of citizen scientists; (2) development of study protocols designed to engage a broad range of participants; (3) data forms and collection procedures that balance ease to use while maximizing the
accuracy of data; (4) mechanisms for sharing citizen‐science data with other citizens and to inform utilities,
states, and the Federal Government; and (5) establishment of an ideation challenge for citizen‐science programs.
BOX 7. CITIZEN SCIENCE AND THE FLINT WATER CRISIS
One positive aspect of the response to widespread concerns about water contamination in Flint,
Michigan, was the development of a series of citizen‐science efforts led by Dr. Marc Edwards of
Virginia Tech University. At the invitation of community members, Dr. Edwards’s initial testing of
water samples and subsequent advocacy was instrumental in bringing local, national, and
international attention to the Flint water‐contamination problem. Citizen support for, and direct
involvement in, premise‐water testing became essential to ongoing efforts to assess the safety and
quality of the water supply in Flint. Beginning in August 2015, drinking‐water sampling efforts were
coordinated from more than 160 homes in Flint. Using a protocol that included 3 samples for each
drinking‐water source (first draw after 6+ hours of stagnation; second draw after a 1‐minute flush;
third draw after a total of 3 minutes of flush), citizen scientists served as front‐line team members
who collected samples and brought them to central locations (community churches) for later
processing by Dr. Edwards and his team. The teams timed their data collection specifically around
key events in the timeline for the Flint water crisis and recovery: the first collection occurred in
August 2015, when the city was still using Flint River water; the second collection occurred in March
2016, after 4+ months of return to Detroit‐sourced water in conjunction with additional anti‐
corrosive correction; the third collection occurred in July 2016, after the city attempted to increase
flow (“flushing”) in the water system through extensive water use to reduce lead sediment in the
system.
The results of these citizen science efforts have served to continue assessments of water quality
and safety across multiple domains of measurement and to inform the population about the
evolving measures related to Flint’s water. Perhaps just as importantly, the citizen science efforts
have served as a continuing point of engagement for the Flint community. To make certain that
communication was transparent, the team led by Dr. Edwards assured the citizen scientists that
they would receive the results of their premise testing, along with a document explaining how to
interpret the results.
ScienceandTechnologytoEnsuretheSafetyoftheNation’sDrinkingWater
62
5.4DevelopingtheDrinking‐WaterTreatmentandDistribution‐SystemWorkforce
Water infrastructure has been identified by many observers as needing significant upgrading.116 EPA’s Drinking
Water Infrastructure Needs Survey identified a total of $384.2 billion in capital improvement needs and $271
billion in clean water infrastructure investments over the next 20 years (2011 through 2031).117 The American
Water Works Association estimates that restoring existing water systems and expanding services to a growing
population will cost at least $1 trillion over the next 25 years.118 The day‐to‐day operations, maintenance, and
upgrading of these treatment and distribution systems constitutes a central element in supporting this
infrastructure, and water operators are critical to the delivery of safe drinking water. To maintain a strong
workforce, to attract new talent and younger entrants as the existing workforce reaches retirement, the Nation
needs to create new excitement around a technologically‐advanced drinking‐water workforce.
Today’s water system operators are a dedicated and skilled workforce. Often, however, they do not receive the
ongoing training needed to stay current. PCAST heard from many in the drinking‐water stakeholder community
that there will be a significant gap in the available workforce in the next 5 years. Important investments for the
future of this workforce include enhanced training, funding of appropriate ongoing education, working with
community colleges to develop Associate Degree requirements, and providing stronger recognition of these
efforts.
Developing a workforce for the water industry responds to three national needs and priorities: the demand for
employees with “middle level skills,” or skills that require more education than a high school diploma but less
than a four‐year college degree;119 the initiative for greater engagement with community colleges to help
prepare their growing number of graduates for the workforce;120 and the need for new water‐industry
operators.121
The National Science Foundation (NSF) has investments and strategies in place to train the workforce for the
water industry—to operate and maintain the critical infrastructure that keeps the Nation’s water safe and
reliable. This includes the Advanced Technological Education (ATE) program.122 ATE supports the development
of innovative approaches for educating skilled technicians for the industries that drive the nation’s economy.
The program improves students’ technical skills and the general science, technology, engineering, and
mathematics (STEM) preparation of these technicians and their educators. ATE directly aligns with middle skill
workforce development, emphasizing partnerships in which community colleges work with industry, four‐year
116 American Society of Civil Engineers, 2013 Report Card for America’s Infrastructure. www.infrastructurereportcard.org/a/documents/Drinking‐Water.pdf. 117 U.S. EPA, 2013 Drinking Water Infrastructure Needs Survey and Assessment: Fifth Report to Congress. www.epa.gov/sites/production/files/2015‐07/documents/epa816r13006.pdf. 118 Stratus Consulting, 2013. “Buried No Longer: Confronting America’s Water Infrastructure Challenge.” American Water Works Association, www.awwa.org/Portals/0/files/legreg/documents/BuriedNoLonger.pdf. 119 Gonzalez, G. C. and Bozick, R., 2016. “Back to Work: Middle‐Skill Jobs in the STEM Economy.” The RAND Blog www.rand.org/blog/2016/08/back‐to‐work‐middle‐skill‐jobs‐in‐the‐stem‐economy.html. 120 See: www.whitehouse.gov/issues/education/higher‐education/building‐american‐skills‐through‐community‐colleges. 121 Water and Wastewater Treatment Plant and System Operators, www.bls.gov/ooh/Production/Water‐and‐wastewater‐treatment‐plant‐and‐system‐operators.htm. 122 Advanced Technology Education program, www.nsf.gov/pubs/2014/nsf14577/nsf14577.pdf.
ScienceandTechnologytoEnsuretheSafetyoftheNation’sDrinkingWater
63
colleges and universities, secondary schools, government, and foundations to keep education responsive to the
rapidly changing workforce.
Specifically, ATE provides both examples of, and models for, the education and training of community college
students for careers in the water industry. ATE funds individual projects123 led by community colleges that
address the education of water‐industry professionals through multiple strategies, including:
Opportunities for two‐year college students to assemble an above‐ground water distribution system;
Preparing and teaching modules on, and demonstrations of, water and wastewater equipment for
grades 7‐12 teachers and students;
New stackable certifications in water treatment, water distribution, wastewater treatment, and
wastewater collection;
Model curricula;
Certificate programs;
New or modified associate degrees;
Dissemination of model programs to neighboring institutions;
Innovative coursework that aligns with industry standards;
Internships;
Opportunities for low‐income students, dislocated workers, underrepresented minorities, women, and
veterans; and
Mentoring.
In addition, ATE’s Advanced Technology Environmental and Energy Center (ATEEC)124 convened a set of six
regional water conversations in 2014 to capture a snapshot of existing and anticipated water management jobs
and to map such jobs to their areas of highest need in different regions of the United States. That ATEEC
Regional Water Conversations Report has helped educational organizations target regional water industry
requirements and provide both short‐ and long‐term training and education for future water management
professionals.125 NSF’s ATE program can be leveraged in the near‐term to attract individuals to the field, while
additional projects could be started for the long‐term enhancement of the water‐system workforce.
123 California WaterWorks: Building the People Pipeline, Cuyamaca Community College, award number 1601775. New England Water Treatment Training (NEWTT) Program, Bristol Community College, award number 1601840. Bridging the Water Divide: Training a New Generation of Water Technicians, San Bernardino Valley College, award number 1203200. H2Options, Milwaukee Area Technical College, award number 1104186. Skilled Women Get STEM Jobs: Recruiting and Engaging Female Students, Thaddeus Stevens College of Technology, award number 1565717. 124 Advanced Technology Environmental and Energy Center, Eastern Iowa Community College, award number 1204958, www.ateec.org. 125 See: ateec.org/regional‐water‐conversations‐report.

ScienceandTechnologytoEnsuretheSafetyoftheNation’sDrinkingWater
64
RECOMMENDATION 4: DEVELOPING THE DRINKING‐WATER TREATMENT AND DISTRIBUTION‐
SYSTEM WORKFORCE
The Federal Government should increase investment in programs aimed in helping American
workers get the skills and credentials needed to support the operation, maintenance, and
improvement of drinking‐water systems throughout the Nation. Both OSTP and CEQ should guide
the following near‐ and long‐term opportunities to support this recommendation including
identifying mechanisms for engaging with existing organizations involved in workforce
development and training.
Near‐term Opportunity:
The National Science Foundation (NSF) should increase funding of meritorious drinking‐water‐
related projects through the Advanced Technological Education (ATE) program. Currently, the
ATE program supports water‐quality education programs at community colleges developed in
partnership with industry representatives. NSF should actively encourage applications from
community colleges that are interested in innovative approaches for educating a highly‐skilled
drinking‐water and water‐management workforce.
Long‐term Opportunity:
The Environmental Protection Agency (EPA), in coordination with NSF, the Department of
Education (ED), and the Department of Labor (DOL), should initiate a stakeholder process to
develop a blueprint for the overall professional development of water treatment operators.
The blueprint should include identification of:
(1) Descriptions of key positions needed to ensure delivery of safe drinking water; (2) Funding mechanisms for training;
(3) Critical components of new training programs and professional development;
(4) Workforce development priorities and timeline; and
(5) New knowledge needs including advanced IT and big data. The blueprint should consider the different training needs of small water‐system operators in
identifying components of new training programs.
OperatorCertificationGuidelines
The experience at Flint, Michigan, demonstrates the vitally important role operations can play, or in this case
didn’t play, in the safe delivery of public drinking water. Operator certification requirements were added to the
Federal Safe Drinking Water Act in the 1996 amendments,126 making State‐level operator certification a Federal
requirement. The 1996 Amendments directed EPA to develop information on recommended operator‐
certification requirements, for which EPA created partnerships with States, water systems, and the public. The
State‐EPA work group provided guidelines on minimum standards for certification and recertification of
126 See SDWA Section 1419, www.gpo.gov/fdsys/pkg/CPRT‐106SPRT67528/pdf/CPRT‐106SPRT67528.pdf www.epa.gov/sites/production/files/2015‐11/documents/operator_certification_guidelines_‐_implementation_guidance.pdf.

ScienceandTechnologytoEnsuretheSafetyoftheNation’sDrinkingWater
65
operators for both community water systems and non‐transient, non‐community public water systems. Since
this time, there have been considerable advances that could be incorporated into revised guidelines related to:
(1) Sensing technologies; (2) Treatment technologies;
(3) The causes and effects of disinfection by‐products in the distribution system;
(4) The importance and measurement of residual disinfection;
(5) Conditions conducive to biological growth, especially pathogens; (6) Better pH management and corrosion control to address metal leaching, especially lead and copper;
(7) Changing climate and impacts on the distribution system condition; and
(8) Source water management.
Awareness has also increased on the role and importance of filtration/treatment operational management at
the central plant and conditions in the distribution system. New and more economical technologies for small
systems continue to advance to the benefit of this large and often under‐represented sector of drinking‐water
treatment and delivery.
Given the critical nature of operations to the delivery of safe drinking water and the advances in technology and
knowledge over the last 16 years, PCAST supports the EPA recommendation127 to initiate a process to update
and modernize the Operator Certification Guidelines. The current guidelines are largely process oriented and
not focused on competency needs.
127 See: www.epa.gov/sites/production/files/2016‐11/documents/508.final_.usepa_.drinking.water_.action.plan_11.30.16.v0.pdf.

ScienceandTechnologytoEnsuretheSafetyoftheNation’sDrinkingWater
66
6.Long‐TermTargetedRecommendationsPCAST is making long‐term recommendations to enable coordination and execution of a Federal strategy for the
research and application of science and technology to understand and address the challenges associated with
providing safe drinking water. Additional long‐term recommendations that will help ensure the safety of the
Nation’s drinking water include: improved quantitative assessments of comparative risk across contaminants;
development and deployment of innovative, next‐generation water technologies; and launching of city‐based
demonstration pilots to assess innovative technologies in realistic conditions. PCAST considers these “long‐
term” strategic recommendations visionary, requiring dedicated resources. These recommendations together
will enable the development of a technologically advanced drinking‐water system based on scientific research
and innovation.
6.1FederalCoordinationofResearchandDevelopmentFocusedonSafeDrinkingWater
The Nation needs a real Federal Strategy on drinking water. Responsibilities for R&D on topics related to the
safety of drinking water are spread across a number of Federal agencies. No single Federal entity has
responsibility for ensuring coordination across these efforts. Although, as noted above, there are three
interagency groups with mandates relating, in part, to the challenge of providing safe drinking water, none has
comprehensive visibility into or explicit responsibility for coordinating the broad array of R&D needs germane to
drinking‐water safety from source to tap. Neither does any of these bodies—or any of the individual Federal
departments and agencies with responsibilities related to drinking water—have the resources or the
mechanisms to promote the application of the best available science and technology in the about 150,000 public
water systems across the Nation, nor the many small private systems and wells. PCAST finds that there is a need
for a more coordinated and Federal strategy for science and technology research, development, and
demonstration to remedy these shortfalls.
RECOMMENDATION 5: FEDERAL COORDINATION OF RESEARCH AND DEVELOPMENT FOCUSED ON SAFE DRINKING WATER
The Executive Office of the President—with leadership from the Office of Science and Technology
Policy (OSTP), the Council of Environmental Quality (CEQ), the Domestic Policy Council (DPC), and
the Office of Management and Budget (OMB)—should oversee the development, and coordinate
the execution, of a Federal Strategy for the research, development, and deployment of adequate
and affordable drinking‐water monitoring, treatment, and distribution technologies across the
Nation’s drinking‐water system, from source to tap. The formal mechanism for this EOP‐led effort
could be a new National Science and Technology Council (NSTC) subcommittee that absorbs the
relevant parts of the existing interagency groups with responsibilities related to drinking water, or it
could be a free‐standing interagency council chaired by OSTP, CEQ, DPC, and OMB, much in the
format of the Council on Climate Change Preparedness and Resilience (which is chaired by CEQ,
OSTP, NSC, and OMB). Whatever the format, the new entity should be supported by dedicated
ScienceandTechnologytoEnsuretheSafetyoftheNation’sDrinkingWater
67
staff in both OSTP and CEQ, e.g., an OSTP Assistant Director for Safe Drinking Water. The creation
of a new entity along with dedicated support staff will ensure that the development and execution
of the Federal Strategy will be effective and efficient. The new entity’s initial steps toward
fashioning the above‐described strategy should include:
(1) Cataloging current drinking‐water related Federal R&D programs and budgets, Federal
monitoring programs of water quality, human exposure to contaminants, the cost of
waterborne disease, and data‐collection and sharing efforts;
(2) Similarly surveying public and private non‐Federal actors in the drinking‐water space to
understand their activities relating to research, development, and deployment of clean‐
drinking‐water technologies and their views about needs, gaps, opportunities, and the
appropriate roles for the Federal Government and other external stakeholders;
(3) Identifying—based on (1), (2), and the use of the best available metrics for characterizing
potential leverage—the most important unmet research, development, and deployment
needs where additional Federal and other efforts would have promise of moving the
needle;
(4) Reaching agreement on which agencies or combinations of agencies could most
expeditiously and effectively address those needs;
(5) Working with the same agencies identified in (4) and the EOP budget process to secure
funding for the indicated efforts; and
(6) Identifying avenues for Federal interaction with, and education of, the broader stakeholder community, including State and local agencies, the private sector, and
citizens.
Building from these activities, the entity should aim to complete a comprehensive strategy, with a
10‐year outlook, for Federal research, development, and deployment efforts on clean‐drinking‐
water technologies within 2 years, to be updated at 2‐year intervals thereafter.
6.2DevelopingtheNextGenerationofTechnologiestoImproveSafetyofDrinkingWater
The availability, affordability, and reliability of drinking‐water monitoring and treatment technologies is central
to the ability of water utilities and communities to provide safe drinking water. In reviewing current
technologies, PCAST noted that there are chemical‐treatment technologies (e.g., chlorine, alum) that have
proven beneficial for many decades to tackle problems such as bacteria or other microorganisms. To protect
the public health—in light of increasing source‐water contamination and decreasing water availability—there is
an urgent need to develop and deploy additional technologies from source to tap. Set against these needs, the
Nation’s R&D ecosystem for development and deployment of innovative technologies to improve the safety of
drinking water is inadequate.
Across the government, various funding and management mechanisms exist for the development of innovative
technologies (e.g., prizes, grand challenges, research hubs, focused research centers). PCAST recognizes the
value of these mechanisms and encourages agencies with drinking water‐related programs to consider
establishing such activities. PCAST notes and encourages expansion of interagency (e.g., the Environmental
ScienceandTechnologytoEnsuretheSafetyoftheNation’sDrinkingWater
68
protection Agency (EPA), National Oceanic and Atmospheric Administration (NOAA), U. S. Geological Survey
(USGS)) innovation efforts among Federal, State, and industry collaborators on challenges to accelerate the
development and deployment of sensor technology to improve our ability to measure and monitor water
quality, including arsenic, harmful algal blooms and the resulting toxins, lead, nutrients (nitrate,
orthophosphate, total nitrogen, and phosphorus), and E. coli and Enterococci.
Similarly, PCAST encourages learning from programs that have led to the historical successes in rapidly
developing and deploying new technologies at the Defense Advanced Research Projects Agency (DARPA) and
the Advanced Research Projects Agency‐Energy (ARPA‐E). In PCAST’s 2010 report on Accelerating the Pace of
Change in Energy Technologies through an Integrated Federal Energy Policy,128 we outlined six features that
make ARPA‐E successful and that could be used as a guide for the proposed new water research entity:
(1) A rigorous review process; (2) Contract or grant negotiations completed in just a few months;
(3) Co‐location within the program offices of such support functions as procurement, contracts, human
resources, and information technology services;
(4) Use of all contracting methods and authorities, including Other Transaction Authority (OTA);
(5) Modification, as appropriate, of the 20 percent matching requirement for the applied energy research
program for universities and non‐profit entities; and
(6) An agile and innovative workforce. A process of rigorous debate and analysis over the technical and scientific merits and challenges of potential
research areas should also be instituted.
PotentialDrinkingWaterResearchProjects
Current technologies offer solutions to many of the challenges facing the drinking‐water‐system infrastructure.
Over time, it is likely that these technological solutions will become more affordable, available, and reliable. Yet
there remains a critical need, especially as infrastructure continues to deteriorate with age, for the development
and deployment of additional innovative technologies to improve the safety of drinking water.
Examples of potential water‐research projects could be centered on the following illustrative topics, some of
which are highlighted in the recommendation:
(1) Open Innovation and Grand Challenge Coordination. PCAST supports Federal engagement in open
innovation, grand challenges, and prizes as means of engaging the best minds to solve difficult
problems. The PCAST‐recommended water‐research entity could serve as a coordinating and
implementing body for such challenges, which could include topics such as novel methods to detect,
map, and remediate lead piping, and cost‐effective new technologies for reduction of nitrates to
nitrogen gas, such as catalysis, electrochemistry, and other possibilities scalable from home to well to
source waters.
(2) Microbiome of water systems from source to tap. Technologies and data processing capabilities are
needed that can detect all forms of microbial life (bacteria, phage, virus, etc.) in the water column and
attached biofilms. These technologies should be deployable in the field, within built infrastructure, and
within personal residences, commercial buildings, and health care facilities. Techniques to design
128 See: www.whitehouse.gov/sites/default/files/microsites/ostp/pcast‐energy‐tech‐report.pdf.
ScienceandTechnologytoEnsuretheSafetyoftheNation’sDrinkingWater
69
appropriate sampling campaigns, numbers of real‐time sensors, and data processing at different
locations (e.g., demonstration cities) are needed. The outcome could provide improved understanding
of human exposure to different microbial lifeforms, methods to reduce exposure to infectious
organisms, methods to improve biological treatment of drinking water, improved understanding of
biologically‐mediated corrosion and other biochemical processes, and improved technologies to
disinfect water.
(3) Brine disposal technologies. Desalination and treatment of seawater, impaired groundwater, and
municipal wastewater are occurring and rapidly expanding as sources of potable drinking water.
Communities in both coastal and inland regions face serious challenges and costs associated with
disposing of salty brines containing pathogens and organics from advanced‐treatment processes (e.g.,
nanofiltration, reverse osmosis, electrodialysis reversal, capacitive deionization). Currently, the cost of
disposing or managing residual brines from these systems exceeds the cost of the advanced‐treatment
process itself. New technologies are urgently needed to reduce the volume of water lost during brine
treatment by 75 percent and to reduce the cost of brine disposal by 50 percent within the next decade.
(4) Distribution system rehabilitation. The investment in underground water pipes in public right‐of‐ways is
estimated to exceed $1 trillion over the next decade, plus additional costs to replace lead pipes and
other failing plumbing components on private property. The most expensive and disruptive water‐main
failures are associated with pipes larger than 18” in diameter. Needs are particularly evident for:
remote sensing technologies to detect leaking pipes before water‐main breakage occurs, new trenchless
technologies to replace large diameter pipes, techniques to safely coat pipes prior to failure using self‐
healing materials, and ways to identify dangerous piping/plumbing materials through ex‐situ means.
(5) Water purification for oxidized pollutants in drinking water. Oxo‐anions (negatively‐charged ions
containing oxygen, such as oxides of hexavalent chromium, arsenic, and selenium) and organic
pollutants are among the most difficult pollutants to remove and destroy, and new technologies are
needed to achieve these goals in the most cost‐effective manner. Separation technologies such as ion
exchange require management of salty brines. Biological processes require long reaction times and can
be difficult to start‐up and maintain without operational problems. Chemical reduction systems
(electrochemical, catalytic hydrogen processes, photo‐active processes) hold promise, but need
technical advancement and demonstration in water systems to gain regulatory approval and reduce
operating costs.
(6) Ex‐situ sensing of groundwater water quality and availability. Groundwater supplies make up more than
three‐quarters of community water systems (by number of systems), yet we lack techniques to monitor
water quality or water levels remotely. Land, air, and space‐based technologies can be developed to
assess these critical values at varying spatial resolution, but are not widely available or used in the water
sector.
(7) Low‐cost and ubiquitous water quality sensor. The internet of things is rapidly expanding in various
ways to assist utilities and consumers across multiple sectors. There is a need to prioritize what to
sense, where, and how frequently to best deploy sensors, and how to utilize the data. Water utilities
are just now struggling with the massive increase in data and how to make the information available to
the public for others to use. This could include accelerating deployment of SMART water‐meter
technology to facilitate real‐time water‐use decisions by the public, industry, and commercial activities,
accompanied by improved financial models that can support water conservation and localized water
infrastructure improvement.

ScienceandTechnologytoEnsuretheSafetyoftheNation’sDrinkingWater
70
(8) Beyond chlorine‐based disinfectants. While chlorine has been credited with preventing hundreds of
millions of microbial‐borne acute diseases and water‐borne outbreaks, chlorine reactions produce low
levels of carcinogens (disinfection byproducts) in drinking water and cause unaesthetic tastes and odors
to consumers. Technologies to reduce the dose of chlorine, improve the distribution system, and better
distribute disinfectant sensors within municipal and premise plumbing can reduce DBPs, improve
protection against water‐borne pathogen outbreaks, and reduce effects from metal‐corrosion products.
These advances will assist in the transition to lower chlorine‐disinfectant levels, although eventually new
paradigms for disinfecting water without chlorine are needed.
(9) Improved public‐health outcome assessments. Because of society’s geographic mobility and reduction
in acute health risks, new modeling or biomarker techniques are needed to understand the public’s
exposure and responses to low‐level exposures to mixtures of chemicals in drinking water.
RECOMMENDATION 6: DEVELOPING THE NEXT GENERATION OF TECHNOLOGIES TO IMPROVE SAFETY OF DRINKING WATER
The Federal Government should create a new, focused research entity to develop transformational technologies aimed at improving the safety of drinking water. This research organization should build on the focus, speed and flexibility attributes inherent in existing Advanced Research Projects Agencies. It could logically be located in EPA, the Department of Interior, DOE, or other agencies, with each having advantages and disadvantages that should be weighed by the next Administration. The EOP‐led interagency entity described in Recommendation 5 should, among its other duties, assist the new research organization with priority‐setting and interactions with key stakeholders, including the private sector. The President should request initial funding in the FY 2018 Energy and Water Appropriations budget for $300 million to support the launch. Among the topics for early attention by the new research program are:
(1) Inexpensive multi‐contaminant sensing, testing, and treatment technologies;
(2) New techniques for pipe and lead service line identification, mapping, and replacement;
(3) Microbiome of water systems from source to tap;
(4) Brine disposal technologies;
(5) Early warning water‐main and service‐line leak detection;
(6) Lower‐cost technologies to enable direct potable reuse;
(7) Water purification for oxidized pollutants;
(8) Ex‐situ sensing of groundwater quality and availability;
(9) Low‐cost and ubiquitous water‐quality sensors;
(10) Beyond chlorine‐based disinfectant; and (11) Instruments capable of decreasing the costs of water‐contamination analysis by tenfold.
6.3ComparativeRiskAssessment
Congress has mandated that “safe drinking water is essential to the protection of public health.”129
Characterizing and specifying what constitutes “safe” in the complex and varying chemical and biological make‐
up of drinking water requires the application of risk assessment methods, accompanied by an evaluation of how
different management alternatives can impact these risks. Risk assessment and management are, hence, at the
129 See: www.gpo.gov/fdsys/pkg/PLAW‐104publ182/pdf/PLAW‐104publ182.pdf.

ScienceandTechnologytoEnsuretheSafetyoftheNation’sDrinkingWater
71
core of SDWA, where these provisions are generally implemented on a national scale for individual
contaminants (e.g., lead, arsenic) or related groups of contaminants (e.g., disinfection byproducts).
As noted above in Section 3.3, comparison of different risks with each other is generally an important part of
developing an overall strategy for risk reduction, most notably in helping to decide where to focus attention and
resources and in dealing with trade‐offs where reducing exposure to one contaminant or class of contaminants
may increase exposure to another contaminant or class. But, as also noted above, the practical aspects of
making quantitative risk comparisons across different drinking‐water contaminants and different sources of
exposure present many challenges: the health endpoints of concern differ between the various drinking‐water
contaminants, as do the methods for calculating “safe” concentrations, making it challenging to select a
common metric for risk comparison.
Risk comparisons involving microbial pathogens are particularly underdeveloped. Approaches for quantifying
the risks of microbial contaminants in ways facilitating comparison with those of chemical and radiological
contaminants could and should be upgraded, bringing to bear the expanding body of relevant monitoring and
epidemiological‐surveillance data.
PCAST has concluded that the most instructive risk comparisons that can be offered, absent substantial
additional work on comparison methodologies and databases, are those based on looking at the contaminants
for which EPA has established Maximum Contaminant Levels (MCLs). Comparisons can be made on how
frequently and by what margins the measured concentrations across the country’s public water systems exceed
the MCLs. As noted in Section 3.3, one attraction of this approach is that the process by which EPA constructs
the MCLs accounts for whatever is known about the exposure‐dose and dose‐response relations for the
individual contaminants.
Figure 1 illustrates an application of this approach. The contaminant concentrations were obtained from the
second 6‐year review dataset under the SDWA (6YR2, 1999‐2005).130 These data are now somewhat outdated,
and EPA expects to provide updated results and additional contaminant coverage from the third 6‐year review
(6YR3) late this year.131 Unfortunately, lead data were not reported in the 6YR2 data, nor will lead results be
reported in the 6YR3 data.
Since each (reporting) drinking water utility collects multiple measurements for each contaminant during the 6‐
year period, we chose to use the 90th percentile of the data for each contaminant to represent that utility’s
summary measure.132 We then compiled this 90th percentile estimate from each utility to create a statistical
distribution of the national level of the contaminant (50th, 75th, 90th, 95th, 99th percentiles) across all reporting
utilities. This process was repeated for each contaminant for which we have data, and then mapped against the
corresponding MCL.
130 SDWA Six‐Year Review Data 1999‐2005. www.epa.gov/dwsixyearreview/six‐year‐review‐2‐drinking‐water‐standards. 131 USEPA anticipates releasing the 6YR3 data for 2006‐2011 in December 2016, facilitating an updated version of this graph. The 6YR3 dataset will include additional contaminants not previously reported, such as disinfection byproducts, but will not include lead data. Levels of some contaminants are expected to go down, such as uranium and arsenic, during the 3rd 6‐year review period. 132 The alternative of choosing the highest individual measurement or 99th upper percentile of the utility’s reported contaminant levels can cause instability in the summary measurement, due to reporting errors and the effects of statistical extremes.
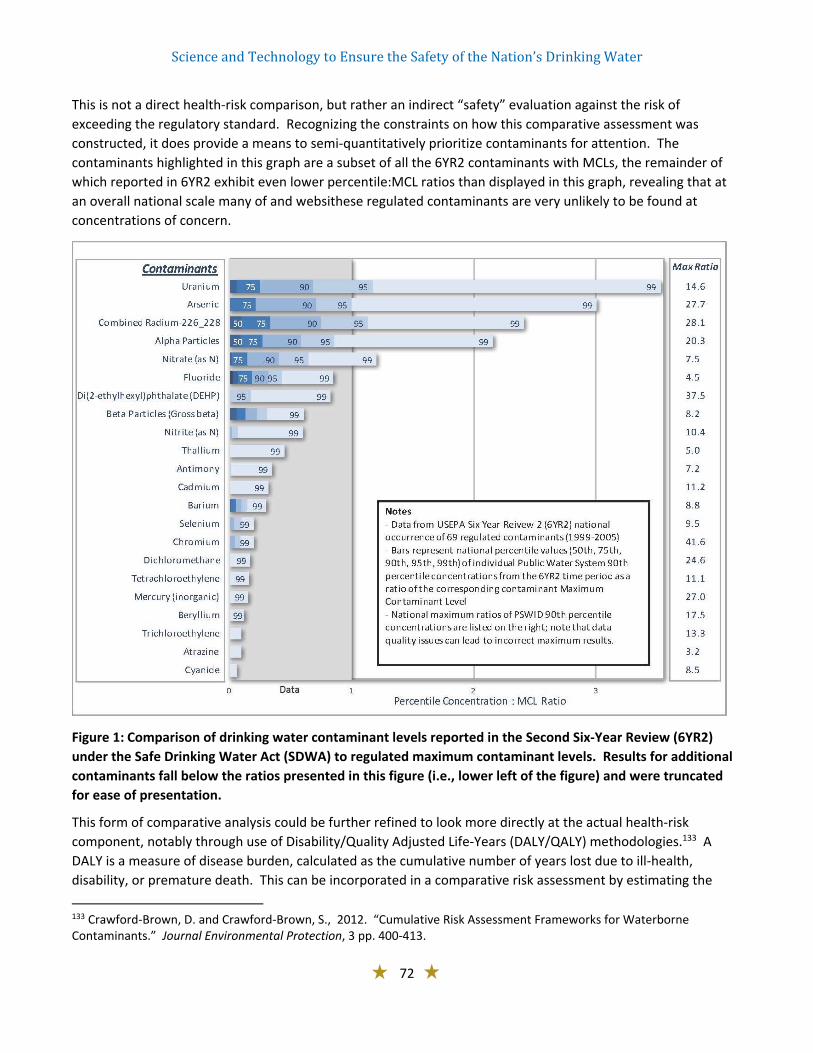
ScienceandTechnologytoEnsuretheSafetyoftheNation’sDrinkingWater
72
This is not a direct health‐risk comparison, but rather an indirect “safety” evaluation against the risk of
exceeding the regulatory standard. Recognizing the constraints on how this comparative assessment was
constructed, it does provide a means to semi‐quantitatively prioritize contaminants for attention. The
contaminants highlighted in this graph are a subset of all the 6YR2 contaminants with MCLs, the remainder of
which reported in 6YR2 exhibit even lower percentile:MCL ratios than displayed in this graph, revealing that at
an overall national scale many of and websithese regulated contaminants are very unlikely to be found at
concentrations of concern.
Figure 1: Comparison of drinking water contaminant levels reported in the Second Six‐Year Review (6YR2)
under the Safe Drinking Water Act (SDWA) to regulated maximum contaminant levels. Results for additional
contaminants fall below the ratios presented in this figure (i.e., lower left of the figure) and were truncated
for ease of presentation.
This form of comparative analysis could be further refined to look more directly at the actual health‐risk
component, notably through use of Disability/Quality Adjusted Life‐Years (DALY/QALY) methodologies.133 A
DALY is a measure of disease burden, calculated as the cumulative number of years lost due to ill‐health,
disability, or premature death. This can be incorporated in a comparative risk assessment by estimating the
133 Crawford‐Brown, D. and Crawford‐Brown, S., 2012. “Cumulative Risk Assessment Frameworks for Waterborne Contaminants.” Journal Environmental Protection, 3 pp. 400‐413.
ScienceandTechnologytoEnsuretheSafetyoftheNation’sDrinkingWater
73
incidence of illness attributable to a drinking‐water contaminant, how many days/years of life on average are
affected by this illness, and the extent to which the illness impacts a person’s life during that time period.134
Minor illnesses that only partially impact daily activity are weighted accordingly, whereas mortality constitutes
100 percent loss of life accumulated over the remaining expected lifetime of the person, had that illness not
occurred. These analyses can be complex, as not all health endpoints are equal and relative priorities are often
subjective. Even so, the explicit use of health endpoints in comparisons could improve quantitative comparisons
across chemical, biological, and radiological categories.
Application of these comparative risk methodologies provides an opportunity to enhance decision‐making under
SDWA, which in its current form does not adequately address new contaminants on the Candidate Chemical
List,135 has proven insufficient in its coverage of ground waters and distribution systems, and does not address
those small systems and wells outside of its mandate. Set against these challenges are advances in risk
assessment methodologies, coupled with rapid and affordable detection technologies (e.g., polymerase‐chain
reaction (PCR) tests for detecting microbes), better data sets, transport models, and computational power and
probabilistic methods to address uncertainty and variability. These advances raise the possibility of applying the
same risk assessment concepts used for chemical contaminants to microbial contaminants, as a pathway for the
development of MCLs. Rapid risk assessment methods also need to be developed for new and emerging
contaminants due to the difficulty in developing precise and accurate data.136
To advance comparative risk assessment methodologies and their use, PCAST recommends three related
research activity categories to provide a holistic view of the risks posed to drinking‐water systems and their
management challenges, from source to premise and with an emphasis on health indices as the metric of
comparison. The first is an overarching activity, where EPA and CDC should work with academia and the private
sector to advance methodologies for comparative risk assessment of drinking water contaminants, and
implement this on a national scale to provide information to assist in prioritizing national drinking water
protection efforts.
Recognizing that local drinking water utilities face challenges unique to their circumstances, the second group of
activities are to adapt and downscale comparative risk methodologies for use by individual utilities to identify
their specific risk profile and management options. These system vulnerability assessments include site‐specific
considerations regarding the utility’s need to simultaneously address system chemistry, sanitation, legal
mandates, regulated and non‐regulated contaminants (microbial, chemical, radiation), and security
considerations, the inter‐relationships among these factors, and ways to optimize practices. System
vulnerability assessments should go beyond concentrations measured at the treatment plant and cover the full
system, including source water quality, treatment plant configuration and location, infrastructure age and
deterioration, to premise plumbing relevant to their customer base, along with the impacts of alternative
management options. Developing these comparative risk methodologies for system vulnerability assessments
will be best conducted in partnership with States and the relevant drinking water associations and research
affiliates, with an emphasis on field applicability. Similar to the proposed demonstration cities, system
134 For example, the World Health Organization (2004) has estimated a list of “disability weights” that reflect the severity of disease on a scale from 0 (perfect health) to 1 (dead), an activity that inherently requires subjective judgement. www.who.int/healthinfo/global_burden_disease/GBD2004_DisabilityWeights.pdf?ua=1. 135 See: www.epa.gov/ccl/draft‐contaminant‐candidate‐list‐4‐ccl‐4. 136 See: www.epa.gov/fera/nrc‐risk‐assessment‐paradigm, www.nap.edu/catalog/12209/science‐and‐decisions‐advancing‐risk‐assessment, and www.nap.edu/read/13152/chapter/7.
ScienceandTechnologytoEnsuretheSafetyoftheNation’sDrinkingWater
74
vulnerability assessments should be supported by EPA and commence with pilots to address examples of
drinking‐water utility challenges, e.g., arid region, groundwater‐sourced, surface water‐sourced from
agricultural regions, aging urban systems, and small systems.
The third comparative risk recommendation is to undertake vulnerability assessments on the risks posed to
populations who obtain their drinking water from sources not covered under SDWA, particularly small systems
and wells, accompanied by a focus on cost‐effective remediation options. To this end, the U.S. Department of
Agriculture (USDA) should lead an interagency effort to reach out to rural communities to collect the data
necessary to support comparative risk assessments on these small drinking water systems and wells, covering all
facets of microbial, chemical, and radiological risks.
RECOMMENDATION 7: DEVELOPING COMPARATIVE RISK ASSESSMENT METHODOLOGIES AND CAPACITY
The Centers for Disease Control and Prevention (CDC), the Environmental Protection Agency
(EPA), the National Institute of Environmental Health Sciences (NIEHS), and the U.S. Department
of Agriculture (USDA) should initiate a coordinated research effort, in conjunction with State and
other drinking‐water experts, to improve the methodologies and develop the data needed to
support more comprehensive comparative‐risk assessments of contaminants across the spectrum
of chemical mixtures, sources, and treatment systems that provide drinking water to the Nation.
This activity should supplement information collection and assessment activities already
undertaken under Safe Drinking Water Act authorities, including collaborations to enable collection
and assessment of data pertinent to drinking‐water systems not under regulatory oversight, such as
private wells and premise plumbing.
6.4DrinkingWaterInnovationinAmericanCities
American cities are facing significant effects from water shortages, crumbling drinking water infrastructure, and
shortages of trained water‐system operators. PCAST learned that some cities are beginning to take on these
challenges through innovative approaches along with developing partnerships across water utilities, universities,
and public companies. PCAST finds there is an opportunity and a need to pilot innovative ideas related to safe
drinking water. Demonstration of new technologies and applications at scale by drinking‐water utilities can
facilitate broader acceptance of the technologies and expedite approval across the various State jurisdictions.
PCAST selected three different types of cities as examples of the challenges that different regions of the country
face in supplying safe drinking water. PCAST believes that future demonstration projects should be deployed in:
(1) an in‐land arid city; (2) a groundwater dependent city; and (3) an industrial mid‐western (or northeastern)
city. While our examples below—El Paso, Fresno, and Cincinnati—fit these criteria, there are many other cities
that could be chosen for innovative technology demonstration.
ScienceandTechnologytoEnsuretheSafetyoftheNation’sDrinkingWater
75
ElPaso,Texas–InlandAridCity
El Paso, Texas is located on the United States/Mexico border along the Rio Grande River. The population of the
city of El Paso is approaching 700,000 people (19th largest city137) and the population in the region exceeds 1.1
million. Fort Bliss is a U.S. Army base just east of El Paso, and is the Army’s second largest installation (1,700
square miles) spanning across Texas and New Mexico, with a population approaching 10,000. Most of El Paso is
served by water infrastructure, but some communities in the region have no running water or sewage
infrastructure—this has been an area of major investment by the EPA and other Federal agencies. Homes and
premise plumbing of all ages can be found in the El Paso region.
The El Paso region has four distinct water sources that offer a range of advanced treatment technologies that
can be studied and may be amenable to innovative technologies.
(1) Surface Water. The Rio Grande River is the major surface water in the region, and relies on storage in
the Elephant Butte Reservoir (New Mexico), which has been under a long‐term drought and has been
less than 20 percent full for the past decade. El Paso has one surface water treatment plant that
employs conventional treatment processes, followed by free chlorine addition. Raw water is heavily
impacted by upstream wastewater discharges, and commonly comprises greater than 20 percent of the
flow in the Rio Grande at this location.
(2) Brackish Groundwater. The Kay Bailey Hutchison brackish groundwater desalination plant on the east side of El Paso has a design capacity of 27 million gallons per day. It treats water for El Paso, seasonally.
It discharges brackish reverse‐osmosis brine into deep wells. Fort Bliss also treats water by reverse
osmosis.
(3) Non‐Saline Groundwater. Groundwater wells are located in El Paso, and some contain elevated levels of
arsenic and other naturally occurring contaminants.
(4) Potable Wastewater Reuse. El Paso is embarking on the Nation’s first flange‐to‐flange direct potable
reuse plant that will treat secondary wastewater effluent by microfiltration/reverse osmosis (MF/RO) or
nanofiltration/UV Photolysis with Advanced Oxidation (Hydrogen Peroxide) (NF/UV‐AOP) and free
chlorine and then directly pipe the effluent into the distribution system. A pilot plant was completed in
2016 and full design is in progress.
The El Paso region exemplifies the water challenges of rapidly growing arid inland regions that are being
impacted by long‐term droughts and climate changes that affect snowmelt in distant watersheds (Colorado
headwaters of the Rio Grande) and upstream diversions for agriculture and population growth (e.g.,
Albuquerque, New Mexico). The El Paso Water Utility has been a leader in technology, outreach, and
involvement in national water‐related research projects. Water conservation, water loss during distribution,
and adoption of smart water distribution technology are important to the region. There are opportunities to
develop municipal, defense, low‐income, and international water technology challenges. Results from this
demonstration city are scalable/transferrable to similar water resources and geologies in communities of
multiple sizes throughout most States west of the Mississippi River, and components of the technology are
universally transferrable.
137 See: www.citymayors.com/gratis/uscities_100.html.

ScienceandTechnologytoEnsuretheSafetyoftheNation’sDrinkingWater
76
Fresno,California–GroundWaterDependentCity
Fresno, California is the largest city in, and the economic hub of, California’s Central Valley, one of the most
productive agricultural regions in the United States. The population of Fresno is 500,000 (34th largest in the
United States) with a large Latino and Asian population. Fresno continues to face economic challenges,
including concentrated poverty, structural unemployment, high vacancy rates, and disinvestment in the city’s
core.138 The Central Valley, as a whole, faces similar economic challenges.
The City of Fresno Department of Public Utilities provides water, wastewater, and solid waste services in the city
and some unincorporated areas of Fresno County. Fresno is also in the midst of shifting from its primary
dependence on groundwater to increasing reliance on surface water. Groundwater levels in California’s Central
Valley have been declining dramatically because of overdrafting, and the Valley has been identified as a high
priority area in California’s Sustainable Groundwater Management Act. There are also water quality issues—
nitrates and industrial contaminants—in Fresno, surrounding agricultural areas, and small communities
throughout the Valley.
Fresno’s water sources can be characterized as follows:
(1) Groundwater. For many years, Fresno was served primarily by groundwater, through more than 260
groundwater wells. In 2004, Fresno added surface water from a newly constructed Surface Water
Treatment Facility. Concerns continue about the sustainability of Fresno’s reliance on groundwater,
since groundwater levels have been dropping by one‐foot per year. There are also a variety of
contaminants found in the groundwater.
(2) Surface water. Surface water comes from contracts with the Federal Central Valley Project (San Joaquin
River) and Fresno Irrigation District (Kings River), and now accounts for 15 percent of Fresno’s water in
the summer and 30 percent in the winter. The City plans to reduce its reliance on groundwater to 36
percent by 2025. The City is planning to add a second Surface Water Treatment Facility and water
recycling as part of the shift to surface water.
Fresno faces ongoing economic challenges, and is in the midst of a shift in its water sources from groundwater‐
dependent to more reliance on surface water, which has raised issues of infrastructure cost and impact on
drinking‐water quality.
Cincinnati,Ohio–IndustrialMidwesternCity
The City of Cincinnati, Ohio, is a Midwest city, comprised of 52 neighborhoods, situated on the north bank of the
Ohio River in Hamilton County, which is the extreme southwestern county of the State of Ohio. Cincinnati is the
65th largest city in the United States. The City operates a water utility (known today as the Greater Cincinnati
Water Works – GCWW), which has grown to serve over 241,000 customer accounts throughout a regional
population of around 1.1 million people, over nearly 850 square miles. Cincinnati is responsible for the
complete administration, operation, maintenance, and capital planning for the entire service area.
Up until the early 1900’s, Cincinnati water was provided to customers without much treatment, and the City
suffered the devastating consequences of water‐borne disease. Shortly after start of the 20th Century, Cincinnati
138 “Evaluation of Strong Cities, Strong Communities Teams Pilot Final Report,” Abt Associates, August 2014. aspe.hhs.gov/pdf‐report/evaluation‐strong‐cities‐strong‐communities‐sc2‐teams‐pilot‐final‐report.

ScienceandTechnologytoEnsuretheSafetyoftheNation’sDrinkingWater
77
completed and began operating its ‘New Works’—the main treatment plant and distribution facilities. The
foresight in planning activities at that time remains impressive, as many of the original facilities are still in
operation, and the conservative design has been leveraged to increase capacity at minimal costs. The fact that
GCWW is operating facilities and distribution‐system piping that is greater than 100 years old is a situation that
parallels many utilities in the Northeastern and Midwestern States. The cost to deal with aging infrastructure is
difficult to ascertain, and, as the age of pipes and equipment increase, so does the risk of failure.
Cincinnati’s water sources are:
(1) Surface Water. The Ohio River is the primary water source. Approximately 89 percent of GCWW system
demand is sustained from the Ohio River and treated at the 240 million gallon per day Richard Miller
Water Treatment Plant (RMTP).
(2) Ground Water. The remaining 11 percent of the system demand is sustained by groundwater wells
located in the Great Miami Valley Aquifer, which is treated at the 40 million gallon per day Charles M.
Bolton Plant (CMBP).
Many cities and water systems experienced significant development in the early through mid‐1900s, a time
when lead was the material of choice for water service line branches, due to its flexibility, durability, and ease of
installation. Cincinnati records show that their use of lead for service branch material was discontinued in 1927.
While it is encouraging that Cincinnati has not installed lead services lines over the last 89 years, many lead lines
remain in service. Although public‐owned lead lines have been replaced over the years, the City still maintains
over 15,000 lead services within the public right‐of‐way, with an estimated 27,000+ service lines remaining on
private property. This situation is not unique to Cincinnati, and many of the older Eastern and Midwestern cities
that developed during this time period face similar problems, adding to the economic burden created by aging
infrastructure and legacy designs.
The Cincinnati drinking‐water system provides an opportunity to continue the development of new techniques
for distribution system rehabilitation methods and techniques. The demonstration study should include the
implementation of advanced pipe‐flushing methodologies, continuous leak‐detection monitoring, installation of
water‐quality monitors in the distribution system, the adoption of advanced pipe‐rehabilitation/replacement
techniques, and, where appropriate, distributed treatment.
RECOMMENDATION 8: SAFE DRINKING WATER DEMONSTRATION PROJECTS
The Environmental Protection Agency (EPA), in conjunction with the Department of Housing and Urban Development (HUD), U.S. Department of Agriculture (USDA), the Centers for Disease Control and Prevention (CDC), Department of Energy (DOE), and Department of Commerce (DOC), should consider deploying city‐based safe drinking‐water demonstration projects. The demonstration projects should be deployed in: (1) an in‐land arid city; (2) a groundwater dependent city; and (3) an industrial mid‐western (or northeastern) city. The interagency initiative should coordinate and finance projects that engage local and State governments, public and private water utilities, non‐governmental organizations, and the general public with goals to:
(1) test the deployment and efficacy of current and new technologies for monitoring, detection, and treatment of water contaminants throughout the distribution system and in premises, including technologies that are developed through the Federal research entity described under Recommendation 5;
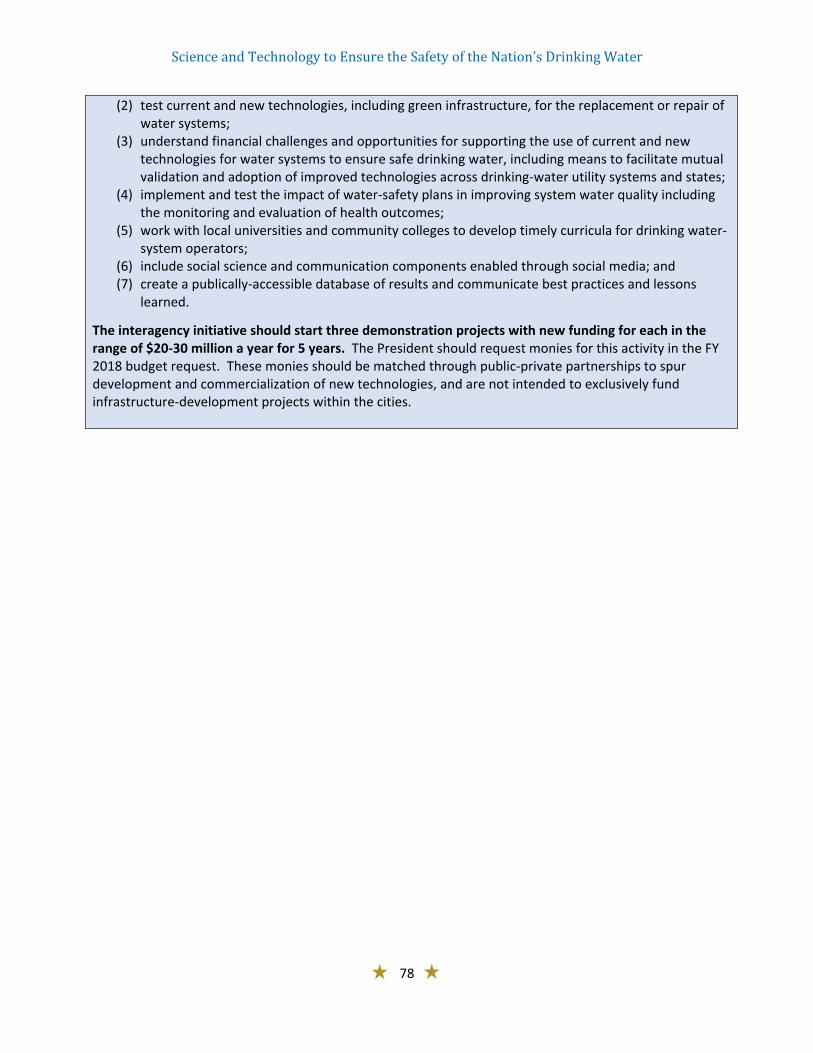
ScienceandTechnologytoEnsuretheSafetyoftheNation’sDrinkingWater
78
(2) test current and new technologies, including green infrastructure, for the replacement or repair of water systems;
(3) understand financial challenges and opportunities for supporting the use of current and new technologies for water systems to ensure safe drinking water, including means to facilitate mutual validation and adoption of improved technologies across drinking‐water utility systems and states;
(4) implement and test the impact of water‐safety plans in improving system water quality including the monitoring and evaluation of health outcomes;
(5) work with local universities and community colleges to develop timely curricula for drinking water‐system operators;
(6) include social science and communication components enabled through social media; and (7) create a publically‐accessible database of results and communicate best practices and lessons
learned.
The interagency initiative should start three demonstration projects with new funding for each in the range of $20‐30 million a year for 5 years. The President should request monies for this activity in the FY 2018 budget request. These monies should be matched through public‐private partnerships to spur development and commercialization of new technologies, and are not intended to exclusively fund infrastructure‐development projects within the cities.

ScienceandTechnologytoEnsuretheSafetyoftheNation’sDrinkingWater
79
AppendixA.AdditionalExpertsProvidingInputChristopherAdamoChiefofStaffCouncilonEnvironmentalQuality
PatBreysseDirectorNationalCenterforEnvironmentalHealthAgencyforToxicSubstancesandDiseaseRegistry
CenterforDiseaseControlandPrevention
MustafaAliAssociateAssistanceAdministratorEnvironmentalJusticeOfficeofEnforcementandComplianceAssurance
EnvironmentalProtectionAgency
AustinBrownAssistantDirectorCleanEnergyandTransportationOfficeofScienceandTechnologyPolicy
MichaelBeachAssociateDirectorforHealthyWaterNationalCenterforEmergingandZoonoticInfectiousDiseases
CenterforDiseaseControlandPrevention
ThomasBurkeDeputyAssistantAdministratorScienceAdvisorEnvironmentalProtectionAgency
JaniceBeecherDirectorInstituteofPublicUtilitiesMichiganStateUniversity
RadCunninghamHealthyCommunitiesEpidemiologyLeadWashingtonStateDepartmentofHealth
JayBenforadoDirectorNationalCenterforEnvironmentalInnovationEnvironmentalProtectionAgency
MarcEdwardsCharlesP.LunsfordProfessorDepartmentofCivil&EnvironmentalEngineering
VirginiaTech
MarkBenjaminProfessorEmeritusEnvironmentalEngineeringUniversityofWashington
ElizabethEideDirectorWaterScienceandTechnologyBoardTheNationalAcademiesofSciences,Engineering,andMedicine
CathyBernardinoBaileyDirectorGreaterCincinnatiwaterWorks
WarrenFriedmanSeniorAdvisortotheDirectorOfficeofLeadHazardControlandHealthyHomes
DepartmentofHousingandUrbanDevelopment

ScienceandTechnologytoEnsuretheSafetyoftheNation’sDrinkingWater
80
DanielGiammarWalterE.BrowneProfessorofEnvironmentalEngineering
DepartmentofEnergy,EnvironmentalandChemicalEngineering
WashingtonUniversityinSt.Louis
CharlesHaasL.D.BetzProfessorofEnvironmentalEngineering
DepartmentHead,DepartmentofCivil,ArchitecturalandEnvironmentalEngineering
DrexelUniversity
PeterGleickPresidentEmeritusandChiefScientistPacificInstitute
DougHedbergAssociateDirector,ForceProjectionTankAutomotiveResearch,DevelopmentandEngineeringCenter
U.S.Army
LynnGoldmanMichaelandLoriMilkenDeanoftheMilkenInstituteSchoolofPublicHealth
ProfessorofEnvironmentalandOccupationalHealth
GeorgeWashingtonUniversity
MichaelHickeyChiefEnvironmentBranchOfficeofManagementandBudget
EugeneGreenFederalDesignatedOfficerNationalAdvisoryCouncilforEnvironmentalPolicyandTechnology
EnvironmentalProtectionAgency
GeorgeHornbergerDirectorVanderbiltInstituteofEnergyandtheEnvironment
PeterGrevattDirectorOfficeofGroundWater&DrinkingWater,OfficeofWater
EnvironmentalProtectionAgency
MackenzieHuffmanDeputyChiefofStaffCouncilonEnvironmentalQuality
AndreaGrossmanProgramExaminerOfficeofManagementandBudget
LaurenKoellermeierOutreachCoordinatorPacificMarineEnvironmentalLabOfficeofOceanandAtmosphericResearchNationalOceanandAtmosphericAdministration
BenjaminGrumblesSecretaryoftheEnvironment StateofMaryland
ChrisKolbPresidentandCEOMichiganEnvironmentalCouncil
ScienceandTechnologytoEnsuretheSafetyoftheNation’sDrinkingWater
81
CharlesKovatchDeputyAssociateDirectorforWaterCouncilonEnvironmentalQuality
YulianaPorras‐MendozaAdvancedWaterTreatmentCoordinatorBureauofReclamationDepartmentoftheInterior
KellyKrycSeniorPolicyAnalystOfficeofScienceandTechnologyPolicy
RichardPouyatAssociateDirectorClimateResilienceandLandUseOfficeofScienceandTechnologyPolicy
PhilipLandriganDeanofGlobalHealthProfessorofPreventativeMedicineandPediatrics
IcahnSchoolofMedicineatMountSinai
DavidRaffDeputyCommissioner,OperationsCommissioner’sOfficeBureauofReclamationDepartmentoftheInterior
EllenMcCallieProgramDirectorNationalScienceFoundation
RobertRennerChiefExecutiveOfficerWaterResearchFoundation
SharaMohtadiAdvisorandConfidentialAssistantOfficeofManagementandBudget
StevenRosenbergFellowinR&DWaterandprocessSolutionsDowChemicalCompany
ChristopherNelsonAssistantDirectorOpenInnovationOfficeofScienceandTechnologyPolicy
EricRosenfieldProgramExaminerOfficeofManagementandBudget
AndreyOstrovskyChiefMedicalOfficer CenterforMedicaidandCHIPSservices
MaryScruggsSeniorAdvisorforWaterResourcesU.S.DepartmentofAgriculture
W.GenePhillipsChiefBureauofEnvironmentalHealthandRadiationProtection
OhioDepartmentofHealth
DavidSedlakPlatoMalozemoffProfessor,Co‐directorofBerkeleyWaterCenter
DirectorofInstituteforEnvironmentalScienceandEngineering
UniversityofCalifornia,Berkeley
JonPollakProgramManagerConsortiumofUniversitiesfortheAdvancementofHydrologicScience,Inc.
MichaelShapiroDeputyAssistantAdministratorImmediateOfficeoftheAssistantAdministratorforWaterEnvironmentalProtectionAgency

ScienceandTechnologytoEnsuretheSafetyoftheNation’sDrinkingWater
82
EllenSilbergeldProfessorDepartmentofEnvironmentalHealthSciencesJohnHopkinsBloombergSchoolofPublicHealth
SteveViaDirectorofFederalRelations AmericanWaterWorksAssociation
PhilipSingerEmeritusProfessor,DepartmentofEnvironmentalSciencesandEngineering
GillingsSchoolofGlobalPublicHealthUniversityofNorthCarolinaatChapelHill
TomWallDirectorAssessmentandWatershedProtectionDivisionOfficeofWetlands,OceansandWatershedsEnvironmentalProtectionAgency
LauraSmithMortonDeputyChiefofStaffandSeniorAdvisortotheUnderSecretary
NationalOceanic&AtmosphericAdministration
WandaWardAssistantDirectorBroadeningParticipationOfficeofScienceandTechnologyPolicy
KathrynSullivanUnderSecretaryofCommerceforOceans&Atmosphere
NationalOceanic&AtmosphericAdministration
ChristopherWeisToxicologyLiaisonNationalInstituteofEnvironmentalHealthScienceNationalInstituteofHealth
R.ScottSummersProfessor,EVENProgramDirectorandDeRISKCenterDirector
UniversityofColoradoBoulder
AliZaidiAssociateDirectorNaturalResources,Energy,andScienceOfficeofManagementandBudget
RhodesTrussellChairmanandFounderTrussellTechnologies,Inc
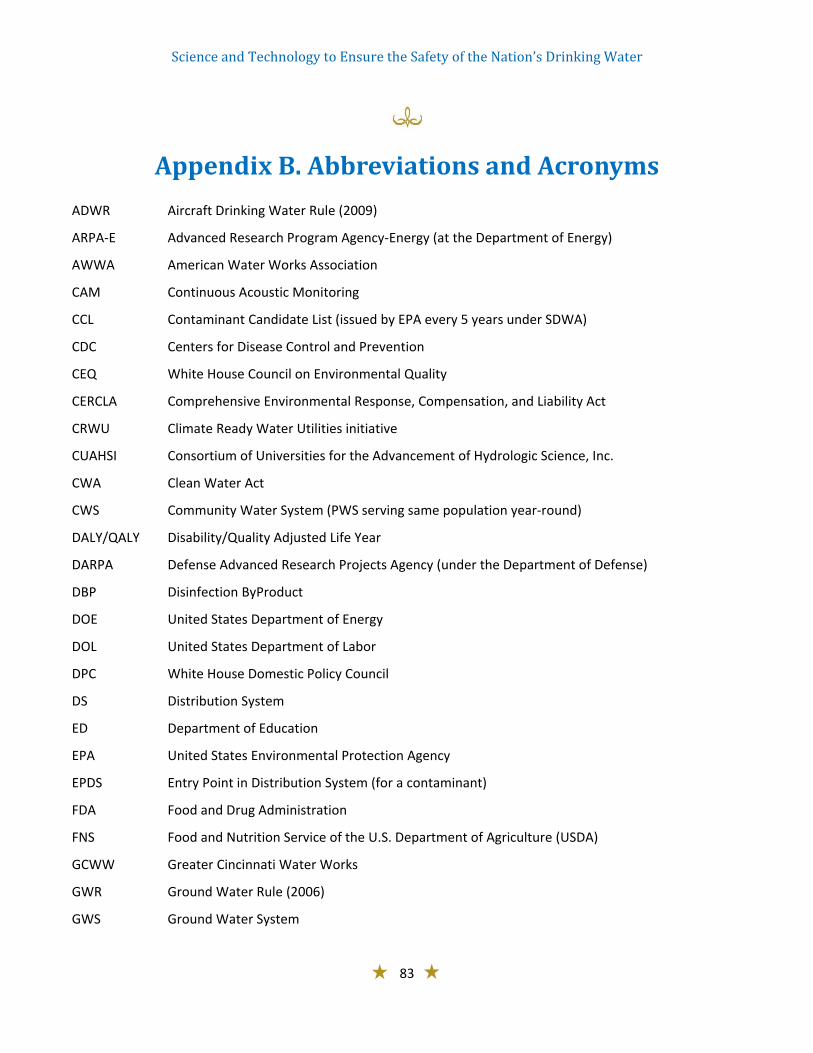
ScienceandTechnologytoEnsuretheSafetyoftheNation’sDrinkingWater
83
AppendixB.AbbreviationsandAcronyms
ADWR Aircraft Drinking Water Rule (2009)
ARPA‐E Advanced Research Program Agency‐Energy (at the Department of Energy)
AWWA American Water Works Association
CAM Continuous Acoustic Monitoring
CCL Contaminant Candidate List (issued by EPA every 5 years under SDWA)
CDC Centers for Disease Control and Prevention
CEQ White House Council on Environmental Quality
CERCLA Comprehensive Environmental Response, Compensation, and Liability Act
CRWU Climate Ready Water Utilities initiative
CUAHSI Consortium of Universities for the Advancement of Hydrologic Science, Inc.
CWA Clean Water Act
CWS Community Water System (PWS serving same population year‐round)
DALY/QALY Disability/Quality Adjusted Life Year
DARPA Defense Advanced Research Projects Agency (under the Department of Defense)
DBP Disinfection ByProduct
DOE United States Department of Energy
DOL United States Department of Labor
DPC White House Domestic Policy Council
DS Distribution System
ED Department of Education
EPA United States Environmental Protection Agency
EPDS Entry Point in Distribution System (for a contaminant)
FDA Food and Drug Administration
FNS Food and Nutrition Service of the U.S. Department of Agriculture (USDA)
GCWW Greater Cincinnati Water Works
GWR Ground Water Rule (2006)
GWS Ground Water System

ScienceandTechnologytoEnsuretheSafetyoftheNation’sDrinkingWater
84
HIS Hydrologic Information System
HUD Department of Housing and Urban Development
IESWTR Interim Enhanced Surface Water Treatment Rule (1998, adds Cryptosporidium)
IOG Inorganic Contaminant(s)
IWRSS Integrated Water Resources Science and Services, collaboration among NOAA, USGS, and the
U.S. Army Corps of Engineers
LCR Lead and Copper Rule
LED Light Emitting Diode
LRAA Locational running annual average means the arithmetic average of analytical results for
samples taken at a specific monitoring location during the previous four calendar quarters
LT1ESWTR Long Term 1 Enhanced Surface Water Treatment Rule (2002, Cryptosporidium)
LT2ESWTR Long Term 2 Enhanced Surface Water Treatment Rule (2006, more on Cryptosporidium)
MF Microfiltration
M/R Monitoring/Reporting
MCL Maximum Contaminant Level (mandatory for regulated contaminants)
MCLG Maximum Contaminant Level Goal (non‐enforceable, aspirational)
mg/L milligrams per liter
MRDL Maximum Residual Disinfectant Level
NACEPT National Advisory Council for Environmental Policy and Technology (advisory to EPA)
NEXUS Subcommittee of the National Science and Technology Council
NF Nanofiltration
NIEHS National Institute of Environmental Health Sciences (under the Department of Health and
Human Services, National Institutes of Health)
n‐log n‐log reduction means reduction by a factor of 10n
NOAA National Oceanic and Atmospheric Administration
NOAEL No Observed Adverse Effect Level (NOEL is a variant missing “Adverse”)
NPDWR National Primary Drinking Water Regulations (required under SDWA)
NPS National Park Service
NSC White House National Security Council
NSDWR National Secondary Drinking Water Regulations (cosmetic, aesthetic)
NSF National Science Foundation
NSTC National Science and Technology Council
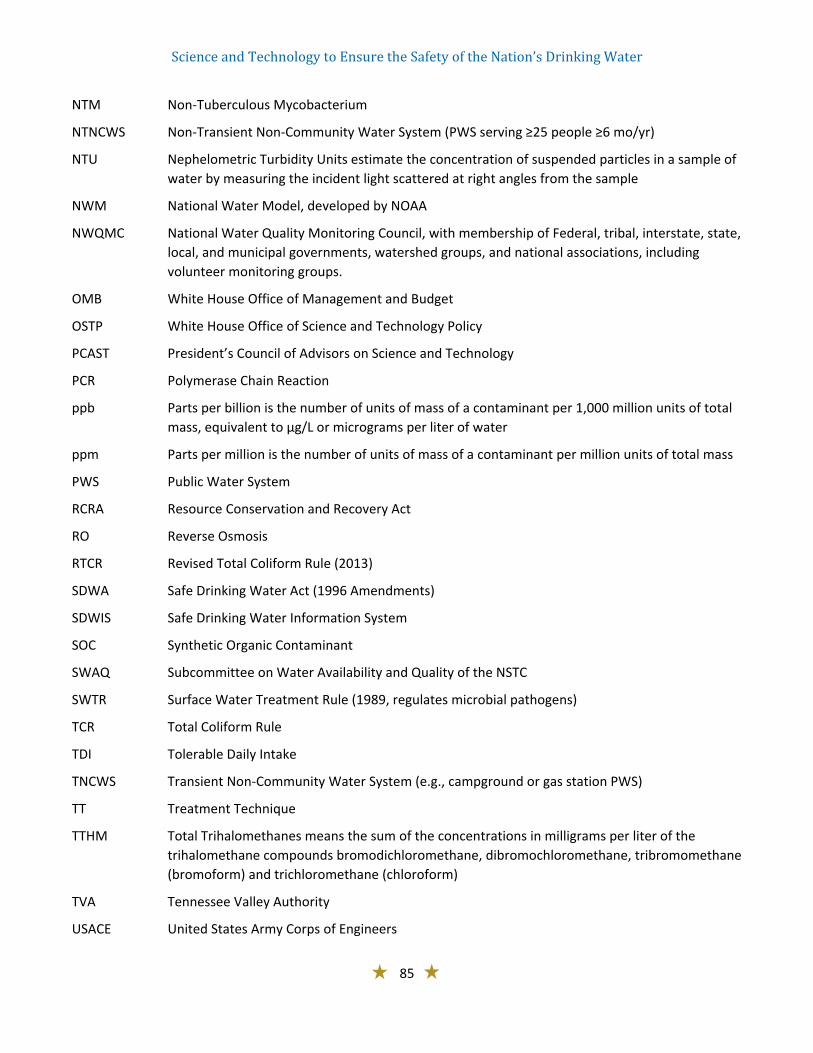
ScienceandTechnologytoEnsuretheSafetyoftheNation’sDrinkingWater
85
NTM Non‐Tuberculous Mycobacterium
NTNCWS Non‐Transient Non‐Community Water System (PWS serving ≥25 people ≥6 mo/yr)
NTU Nephelometric Turbidity Units estimate the concentration of suspended particles in a sample of
water by measuring the incident light scattered at right angles from the sample
NWM National Water Model, developed by NOAA
NWQMC National Water Quality Monitoring Council, with membership of Federal, tribal, interstate, state,
local, and municipal governments, watershed groups, and national associations, including
volunteer monitoring groups.
OMB White House Office of Management and Budget
OSTP White House Office of Science and Technology Policy
PCAST President’s Council of Advisors on Science and Technology
PCR Polymerase Chain Reaction
ppb Parts per billion is the number of units of mass of a contaminant per 1,000 million units of total
mass, equivalent to µg/L or micrograms per liter of water
ppm Parts per million is the number of units of mass of a contaminant per million units of total mass
PWS Public Water System
RCRA Resource Conservation and Recovery Act
RO Reverse Osmosis
RTCR Revised Total Coliform Rule (2013)
SDWA Safe Drinking Water Act (1996 Amendments)
SDWIS Safe Drinking Water Information System
SOC Synthetic Organic Contaminant
SWAQ Subcommittee on Water Availability and Quality of the NSTC
SWTR Surface Water Treatment Rule (1989, regulates microbial pathogens)
TCR Total Coliform Rule
TDI Tolerable Daily Intake
TNCWS Transient Non‐Community Water System (e.g., campground or gas station PWS)
TT Treatment Technique
TTHM Total Trihalomethanes means the sum of the concentrations in milligrams per liter of the
trihalomethane compounds bromodichloromethane, dibromochloromethane, tribromomethane
(bromoform) and trichloromethane (chloroform)
TVA Tennessee Valley Authority
USACE United States Army Corps of Engineers
ScienceandTechnologytoEnsuretheSafetyoftheNation’sDrinkingWater
86
USDA United States Department of Agriculture
USGS United States Geological Survey (under the Department of the Interior)
UV Ultraviolet
VOC Volatile Organic Contaminant
WaTr Water Treatment interagency group, led by the Department of the Interior’s Bureau of
Reclamation and the U.S. Army Tank Automotive Research, Development, and Engineering
Center
WHO World Health Organization
WIC Women Infants and Children program, under the USDA
WIFIA Water Infrastructure Financing and Innovation Act (part of WRRDA; see below)
WRDA Water Resources Development Act, a series of public laws initially enacted in 1974 with
subsequent updates
WRRDA Water Resources Reform and Development Act (2014)
President’sCouncilofAdvisorsonScienceandTechnology(PCAST)
www.whitehouse.gov/ostp/pcast