report to the trust board - 26 september 2013 · report to the trust board - 26 september 2013 ......
TRANSCRIPT

Page 1 of 12
REPORT TO THE TRUST BOARD - 26 SEPTEMBER 2013
Title Integrated Quality and Performance Report (IQPR) Executive summary
The aim of this report is to provide the Trust Board with an integrated quality and performance dashboard showing levels of compliance with the Monitor Compliance Framework and CQC (Care Quality Commission) registration. The report also provides a series of exception reports on areas which require escalation, and dashboard analyses on specific areas of Quality and Performance, including financial and workforce information. The report format has received further refinement to align the Key Performance Indicators (KPIs) against the Trust governance groups with greater clarity.
Recommendation
The Trust Board is recommended to:
• Receive the report and review achievements to date • Receive assurance on the areas of quality and performance which are
receiving performance improvement action
Related Trust objectives
The related strategic objective is: 1. We will continuously improve quality, with services
shaped from user experience, audit and research.
Risk and assurance Poor performance increases the risk profile for the Trust in respect of financial viability, quality, clinical safety and reputation.
Performance has a key impact on organisational reputation and the impact of achievements and concerns must be highlighted and responded to at the earliest stage.
Legal implications/ regulatory requirements
This report has a connection with Monitor, CQC and CQUIN (Commissioning for Quality and Innovation) requirements and aims to review performance against all regulatory areas.
Evidence for the Quality Governance Framework
4A and 4B Paper evidences board appropriate quality information being analysed and challenged and provides assurance of the robustness of the quality information.
Presenter
Will Legge – Chief Information Officer
Author(s) Will Legge – Chief Information Officer
* Disclaimer: This report is submitted to the Trust Board for amendment or approval as
H

Page 2 of 12
appropriate. It should not be regarded or published as Trust Policy until it is formally agreed at the Trust Board meeting, which the press and public are entitled to attend.

Page 3 of 12
TRUST BOARD 26th SEPTEMBER 2013
INTEGRATED QUALITY & PERFORMANCE REPORT
Introduction 1. The Integrated Quality and Performance Report (IQPR) summarises the Trust’s
performance against key Monitor, Commissioner and other targets, and provides analysis and commentary on those areas which require additional actions to ensure that we achieve our targets and objectives.
2. In addition, work is underway to establish a fully automated data collection and
reporting tool to be used for the production of the IQPR and other information reporting requirements.
3. The report format has received further refinement to align the KPIs against the
Trust governance groups with greater clarity.
4. The new Monitor Risk Assessment Framework was released on the 27th August 2013 in final form, with a ‘live’ date of 1st October 2013. The IQPR will continue to provide evidence against the existing Compliance Framework and in shadow form for the Risk Assessment Framework up to and including the October IQPR, covering September data. The November IQPR (covering October data) will reflect the changes of the new documents fully.
5. It should be noted that the following Monitor compliance is demonstrated in the
report:
Governance Risk Rating 6.0 – Red
Financial Risk Rating 4 – Green
Shadow Governance Concerns Material governance issue – Amber/Red
Shadow Continuity of Services Risk Rating 4 - Green
Aim
6. The aim of this report is to provide the Trust with an integrated quality and
performance report showing levels of compliance with the Monitor Compliance Framework and CQC registration, together with detailed analyses for those areas requiring additional action to ensure achievement of targets.
Recommendations
7. The Trust Board is asked to :
i) Receive the report and review achievements to date
Page 4 of 12
ii) Receive assurance on the areas of quality and performance which are receiving performance improvement action
iii) Review the Monitor ‘FRR and GRR section’ on page 10 for areas relating to the Trust’s Governance Risk Rating (GRR)
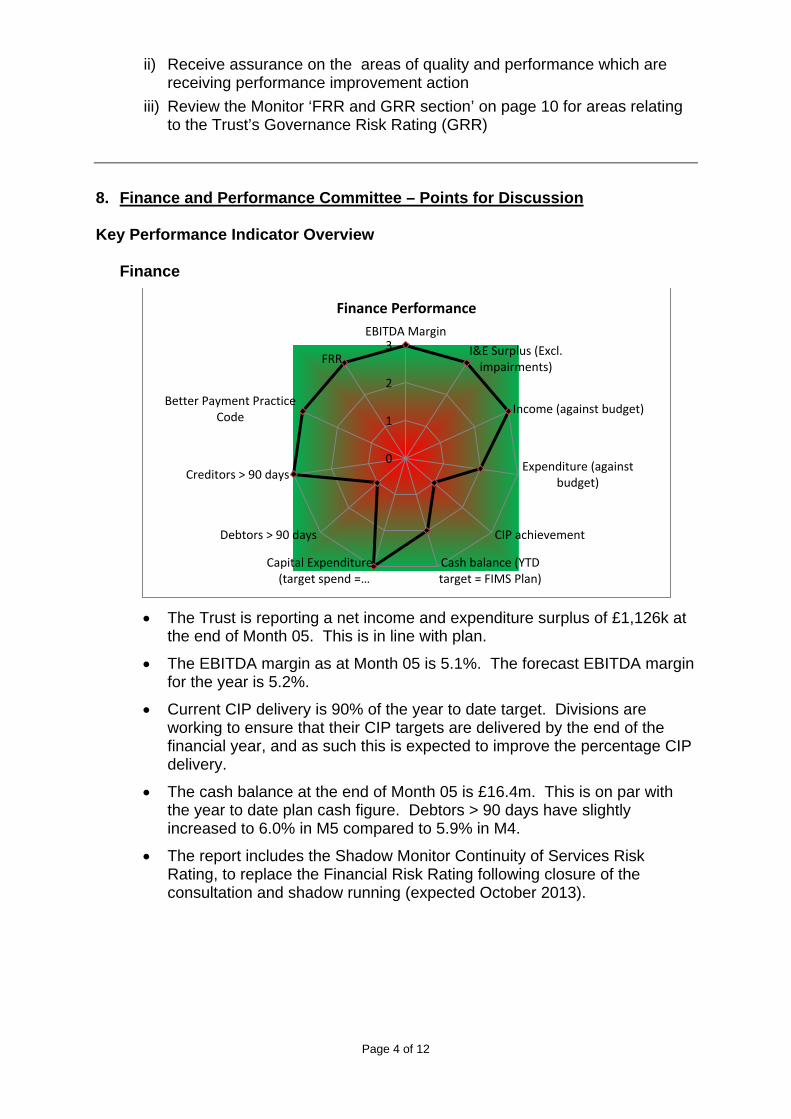
8. Finance and Performance Committee – Points for Discussion Key Performance Indicator Overview
Finance
• The Trust is reporting a net income and expenditure surplus of £1,126k at
the end of Month 05. This is in line with plan.
• The EBITDA margin as at Month 05 is 5.1%. The forecast EBITDA margin for the year is 5.2%.
• Current CIP delivery is 90% of the year to date target. Divisions are working to ensure that their CIP targets are delivered by the end of the financial year, and as such this is expected to improve the percentage CIP delivery.
• The cash balance at the end of Month 05 is £16.4m. This is on par with the year to date plan cash figure. Debtors > 90 days have slightly increased to 6.0% in M5 compared to 5.9% in M4.
• The report includes the Shadow Monitor Continuity of Services Risk Rating, to replace the Financial Risk Rating following closure of the consultation and shadow running (expected October 2013).
0
1
2
3EBITDA Margin
I&E Surplus (Excl.impairments)
Income (against budget)
Expenditure (againstbudget)
CIP achievement
Cash balance (YTDtarget = FIMS Plan)
Capital Expenditure(target spend =…
Debtors > 90 days
Creditors > 90 days
Better Payment PracticeCode
FRR
Finance Performance

Page 5 of 12
Performance
• % Delayed Patients (Community) – Performance has decreased compared
to July and reads as 2.55% for August 2013 against the target of 2.12% for the month.
• % Delayed Patients (MH) – Performance against this indicator has increased for the Month of August to 6.3% and is within target.
• Occupancy Rate – Mental Health – The trust target for this indicator is
<=85% and the current month actual is at 92.5% compared to 92.4% during July and remains over the required target.
• Total number of Home Treatment episodes carried out by Crisis Resolution team (year to date) – Current position as at August are 743 episodes for the year, which if continued at the same growth rate will be under-performing at the end of the financial year.
• 18 week maximum wait from referral to treatment (non-admitted, complete pathways) – The 95% target has been achieved during August with performance at 99.0%. The failure to meet the 95% target in July has resulted in the continued addition of 1.0 to the Trust Governance Risk Rating for the remaining quarter as specified in the Monitor Compliance Framework. FYPC is continuing to execute a multi-point action plan to address waiting times for the community paediatric service that comprises LPT’s non-admitted, consultant-led pathways.
• Waiting Times – Waiting times performance against commissioner targets
will continue to be reported along with the month the target will take effect as agreed with commissioners. Waiting time performance is based on the number of patients that received treatment in the month and the percentage of
0
1
2
3Occupancy Rate - MH
OccRate - Community
% Delayed Patients(DToC) - Community
% of Admissions GateKept
MHMDS DataCompleteness:
Records
MHMDS DataCompleteness:
Outcomes
Efficient Services

Page 6 of 12
those ‘waits’ that were within the target waiting time. A 5% tolerance giving a 95% target has been agreed with commissioners.
• Data Quality – The overall position since measurement began has consistently improved and has increased for the month of August when compared to July.
RAG Sep-12 Oct-12 Nov-12 Dec-12 Jan-13 Feb-13 Mar-13 Apr-13 May-13 Jun-13 Jul-13 Aug-13 Var
Red 2.10% 3.50% 1.50% 1.00% 1.00% 1.00% 1.00% 1.00% 1.00% 1.00% 1.10% 0.60% -0.50%
Amber 14.90% 7.40% 8.10% 8.60% 8.60% 8.60% 9.50% 8.60% 8.60% 8.60% 5.90% 3.40% -2.50%
Green 83.10% 89.10% 90.40% 90.40% 90.40% 90.40% 89.50% 90.40% 90.40% 90.40% 93.00%
96.00% 3.00%
Feedback from Finance and Performance Committee – 17th September 2013
• The Committee received the IQPR and noted the levels of performance demonstrated.
• The Committee noted the performance against the Governance Risk Rating and Risk Assessment Framework.
• The continuingly high rate of MH Bed Occupancy was noted
• The Committee noted the Early Intervention in Psychosis indicator performing above the required level, exceeding the year to date target.
• The Committee requested further information to be provided in relation to the CQUIN targets that were not being met.
0.00%20.00%40.00%60.00%80.00%
100.00%
Data Quality Progress

Page 7 of 12
9. Quality Assurance Committee – Points for Discussion Key Performance Indicator Overview
• Non-Compliance with CQC Essential Standards (Enforcement Actions) - The Committees attention is drawn to the formal issuing of two warning notices from the CQC following an inspection undertaken on the Bradgate Unit in July 2013. The issued report contains enforcement actions, continuing to result in the addition of ‘4’ to the Governance Risk Rating score being reported in August Governance and Trust Board.
• CPA: % patients having Formal Review within 12 months – Performance for this indicator has slightly decreased for the reporting month ending August 2013, where the performance is 96.4%, but remains above threshold.
• CPA: 7 Day Follow Up – The 95% target has been missed in this reporting period with performance at 91.8% for July compared with 98.1% for the previous month. Attempts were made to follow-up with 5 out of the 6 breaching patients without success. The year to date position is 95.0% and is narrowly meeting the
0
1
2
3
Mixed sexaccommodation
breaches
Complaintsacknowledged
within 3 workingdays
% Complaintsclosed within
timescales
Quality -Personal Services
0
1
2
3
Early Interventionin Psychosis
% patients on CPAfollowed up within7 days of discharge
% patients on CPAhaving Formal
Review within 12months
Breast Feeding-Status
Breast Feeding-Prevalence
SmokingCessation:Numberof 4 week quitters
GU Medicine- %Offered
appointment within48 hours
Quality-Effective Services
0
1
2
3Never Events
STEIS - SI actionplans implementedwithin timescales
Compliance withhygiene code
MRSA Bacteraemiacases - Community
Clostridium Difficile(C Diff) Cases
Quality -Safe Care

Page 8 of 12
threshold. The failure to meet the 95% target has resulted in the addition of 1.0 to the Trust Governance Risk Rating for the month
• Early Intervention in Psychosis - % newly diagnosed cases against commissioner contract – The 95% target has been met in this reporting period with the August 2013 performance at 136.4% compared to 45.5% for the previous month. Small numbers involved in the denominator for calculation of this indicator equates to significant swings in performance month on month and figures are refreshed each month to ensure accurate position. The year to date position is 109.1% and is above target.
• National Chlamydia Screening Programme- Number of screens for 15-24 year olds – During the month of August, the City service failed to achieve the monthly target achieving 510 screenings against the target of 834. The County service failed to achieve the monthly target achieving 691 screenings against a target of 1000. These figures are as expected due to seasonal variations which see highest activity levels in line with start and end of the academic year.
• There have been no mixed sex accommodation breaches in 2013/14 to date.
• Breastfeeding prevalence at 6 – 8 weeks – Prevalence in the County for the
first quarter is 44.5% against the commissioner target of 46.3%. The service has advised that its action plan for addressing this includes daily monitoring of breastfeeding prevalence and objective-setting to raise awareness with health visitors.
• Infection Control: C Diff (MH & Community) – The annual target reflects the
Monitor Compliance Framework 2013/14 de minimus limit set at 12 cases. There was 1 case of Clostridium Difficile (C Diff) in the month of August, which takes the year to date position to 3.
There is an internal root cause analysis currently being carried out by the infection prevention and control team in conjunction with the ward area to identify any issues or causes, currently the investigation has not identified any issue in particular but work is on-going.
Feedback from Quality Assurance Committee – 17th September 2013
• The Committee received the IQPR and noted the levels of performance demonstrated.
• The Committee acknowledged the performance of the 18 week wait target for Community Paediatrics, now being above the required target level.
• The Committee sought assurance in relation to the underperformance of the CPA 7 day follow up target. Assurances were given that all efforts had been made to contact the 6 patients who were not followed up within 7 days, and that the initial indications of the performance in August are showing that it is above target

Page 9 of 12
• The continuingly high rate of MH Bed Occupancy was noted
• The Committee noted the Early Intervention in Psychosis indicator performing above the required level, exceeding the year to date target.
• The Committee held a discussion in relation to the future monitoring and focus around the targets that demonstrate that the Trust is doing all it can to ensure the management of access to inpatient beds. The Committee noted the performance of the Home Treatments carried out by the Crisis Resolution Team in this regard.
• The Committee requested further information to be provided at the meeting in October in relation to Community Health Service waiting times, specifically those with very low current performance.
10. Workforce and Organisational Development Committee - Discussion
Key Performance Indicator Overview
• % Staff with a valid Appraisal & PDP: Performance in this metric is currently above the 80% trust target at 82.4% for the whole trust.
• % Sickness Absence: Performance against this indicator is reported a month in
arrears and for the month of July is 4.3% (a slight decrease of 0.1% on the previous month) and remains underperforming against the 4% and below organisational target.
• Ratio of Bank Usage to Agency Usage: Performance against this indicator
demonstrates an increase in agency usage when compared to bank usage over the previous month, resulting in a ratio of 1:0.97 across the organisation and over target.
0
1
2
3
Core MandatoryTraining
Appraisal
Sickness AbsenceRatio of Bank Usageto Agency Usage
Vacancy Rate
Workforce Metrics

Page 10 of 12
Feedback from Workforce and OD Committee – 18th September 2013
• Sickness Absence - The committee acknowledged there were on-going actions across divisions to reduce sickness levels and noted the most days lost to sickness could be attributed to stress and MSK related issues
• Bank & Agency Usage - The committee discussed the high usage of bank and
agency was in part due to the length of time it takes to recruit into vacant posts
• Time to Recruit - The committee noted the continued red rated performance
against the ‘days taken to recruit’ SLA although an improvement over last 4 weeks was recognised. A paper provided a summary to identify that the recruitment team were improving by reducing time taken to complete tasks, however managers were taking longer to complete theirs. An additional 2 recruitment administrators have been funded and 1 vacancy has been filled with all 3 new recruits to start this week in training.
The committee noted that plans were underway to automate booking ID checks to reduce the days needed to recruit.
The committee noted that Recruitment is an LIA project so focus group will be set up soon starting with listening event
• Learning and Development
Core Mandatory Training - The committee noted significant improvements April to date.
• (not discussed) AMH Complex care – work to be completed to review TNA for prisons and put together a training plan
• PDR – The committee were provided assurance that HIS CMT and PDRs are
reviewed at its internal management board every month and an action plan is in place to ensure all PDRs are booked and CMT courses are attended. It is anticipated that HIS will reach compliance by 30th October. Within Procurement, assurance was given that PDRs had been completed for 10 of the 11 staff and IG and Fire Safety training would be completed by 20th September
11. Summary of Monitor FRR and GRR
• The Boards attention is drawn to the significant potential impact to the Trust of Governance Risk Rating score and Shadow Governance Concern shown in this report.
• Discussions with Divisions will continue to be undertaken during the Executive Performance Review meetings in month to raise awareness of impact to the GRR and the importance of the continued performance of all other Monitor indicators.
• GRR (Governance Risk Rating) – Performance against the Monitor Compliance Framework standard for GRR in August 2013 is 6.0 (Red). This indication must be taken as a ‘point in time’ score (end August 2013) for the month only.

Page 11 of 12
• FRR (Financial Risk Rating) – Performance against the Monitor Compliance Framework standard for FRR in August 2013 was at Level 4 (Green).
12. Conclusion This report demonstrates that whilst there are a significant number of targets being achieved, along with some notable areas of improvement, there remain a number of targets which are not currently being achieved and where attention is now being directed to ensure continued improvement in the coming months.

Page 12 of 12
Appendix A – Monitor Risk Assessment Framework Summary of Monitor triggers of governance concern
Monitor Risk Assessment Framework – Final Metrics

Integrated Quality and Performance Report
Integrated Quality and Performance
Report
Advancing health and well-being
End August 2013 PositionData to 31st August 2013 unless otherwise stated
Previous months data refreshed where available
Date of report: 19/09/2013 Page 1 of 34

Integrated Quality and Performance Report
Page
Performance against Monitor Targets 3
4
5
LPT Benchmarking Information 7
Key Performance Indicators (KPIs): Overview 8
9
10
11
12
QUALITY AND ASSURANCE
13
14
Quality: Safe Care Breakdown 15
16
17
FINANCE AND PERFORMANCE
18
19
20
Performance: Finance 21
WORKFORCE AND ORGANISATIONAL DEVELOPMENT
22
HR Workforce (Extended Metrics Data) 23
Waiting Times Compliance - Community Health Services 24-25
Waiting Times Compliance - Adult Mental Health Services and Learning Disabilities 26
Waiting Times Compliance - Families, Young People and Children 27
Appendices
Appendix 1
Appendix 2
Contents
Governance Concern Score
Detailed Exception Report - Maximum time of 18 weeks from point of RTT
Quality: Personal Services
Quality: Safe Care
Performance: Efficient Services
Performance Summary Dashboard
Detailed Exception Report - National Chlamydia Screening Programme
Detailed Exception Report - % Staff with a valid Appraisal & PDP
Detailed Exception Report - % CPA 7 Day Follow-up
Appendix 2 - CQUIN Achievement Targets 2013-14
Analysis of CQUINS (2013-14)
Quality: Effective Services
Appendix 1 - Change Log
Performance: Efficiency
Performance: Bed Occupancy
HR: Workforce
Date of report: 19/09/2013 Page 2 of 34

Integrated Quality and Performance Report
Indicator TargetReporting
Frequency
Data
As At
Current
Month
Previous
monthTravel Sparkline
Quarter
to Date
Quarter
End
Forecast
YTD
Total
Performance
against
National
Standards
Third Parties -
CQC
Third Parties -
CNST
Mandatory
Services
Other cert
failuresOther factors Comments
Accountable
Director
Infection Control: MRSA
Meeting the MRSA Objective
0 (Year
end)Monthly AUG 0 0 0 0 0 0.0 0 0 0 0 0 Adrian Childs
Infection Control: C Diff (MH & Community)
Meeting the Clostridium Difficle Objective
12 (Year
end)Monthly AUG 1 0 1 2 3 0.0 0 0 0 0 0
Annual target reflects the Monitor Compliance Framework 2013/14 de
minimus limit set at 12 cases. There is an internal root cause analysis
currently being carried out by the infection prevention and control team in
conjunction with the ward area to identify any issues or causes, currently
the investigation has not identified any issue in particular but work is on-
going.
Adrian Childs
Maximum time of 18 weeks from point of referral to treatment in aggregate (non-
admitted, complete pathways)95% Monthly AUG 99.0% 89.8% 93.8% 93.8% 91.2% 1.0 0 0 0 0 0
The Chief Operating Officer has agreed a remedial action plan with the
Families, Young People and Childrens’ division which will bring monthly
performance back to a ‘green’ status by the end of Quarter 2
Paul Miller
Maximum time of 18 weeks from point of referral to treatment in aggregate (non-
admitted, incomplete pathways)92% Monthly AUG 99.1% 95.3% 97.0% 97.0% 97.2% 0.0 0 0 0 0 0 Paul Miller
Data Completeness: Community Services (Referral to Treatment Information) 50% Monthly AUG 99.9% 100.0% 99.9% 99.9% 99.9% 0.0 0 0 0 0 0Full assessment of Tiara and Systmone relying on data warehousing of
information rather than systems extraction or reportingPaul Miller
Data Completeness: Community Services (Referral Information) 50% Monthly AUG 81.1% 85.0% 83.1% 83.1% 84.4% 0.0 0 0 0 0 0Full assessment of Tiara and Systmone relying on data warehousing of
information rather than systems extraction or reportingPaul Miller
Data Completeness: Community Services (Treatment Activity Information) 50% Monthly AUG 99.9% 99.9% 99.9% 99.9% 99.9% 0.0 0 0 0 0 0Full assessment of Tiara and Systmone relying on data warehousing of
information rather than systems extraction or reportingPaul Miller
Data Completeness: Community Services (Patient Identifier Information) - may be
included later in 2013/14 by Monitor50% Monthly - - - - - - - - - - - - Paul Miller
Data Completeness: Community Services (Patients Dying at Home/Care Home
Information) - may be included later in 2013/14 by Monitor50% Monthly - - - - - - - - - - - - Paul Miller
Care Programme Approach:
% patients followed up within 7 days of discharge95%
Monthly
(in arrears)JUL 91.8% 98.1% 91.2% 91.2% 95.0% 1.0 0 0 0 0 0
Data runs one month behind to allow for target to be monitored. Out of 73
patients discharged in July, 6 patients were not followed up. See detailed
exception report on page 9.
Paul Miller
Care Programme Approach:
% patients having Formal Review within 12 months95% Monthly AUG 96.4% 96.9% 96.6% 96.6% 96.3% 0.0 0 0 0 0 0 Paul Miller
Minimising Mental Health Delayed Transfers of Care
(% Patients Delayed)<=7.5% Monthly AUG 6.3% 6.6% 6.4% 6.4% 5.8% 0.0 0 0 0 0 0 Paul Miller
% of Admissions Gate Kept by the Crisis Resolution & Home Treatment Team 95% Monthly AUG 97.5% 100.0% 99.0% 99.0% 99.3% 0.0 0 0 0 0 0 Paul Miller
Early Intervention in Psychosis:
% newly diagnosed cases against commissioner contract95% Monthly AUG 136.4% 45.5% 90.9% 96.0% 116.4% 0.0 0 0 0 0 0
The relatively small numbers involved in the denominator of this indicator
results in significant percentage shifts month on month. The trust is on
target to meet the annual commissioner contract target and year to date
position is 116.4%
Paul Miller
Mental Health Minimum Dataset (MHMDS) Data Completeness: Identifiers 97% Quarterly Q1 98.4% 97.6% 98.4% 98.4% 98.4% 0.0 0 0 0 0 0 Paul Miller
Mental Health Minimum Dataset (MHMDS) Data Completeness: Outcomes for
patients on CPA50% Quarterly Q1 55.3% 61.5% 55.3% 55.3% 55.3% 0.0 0 0 0 0 0 Paul Miller
Access to Healthcare for All: Self Certification against compliance 4 Quarterly Q1 4 4 4 4 4 0.0 0 0 0 0 0 Paul Miller
Non-Compliance with CQC Essential Standards resulting in Enforcement Action No Monthly AUG Yes Yes Yes Yes Yes 0.0 4 0 0 0 0
The Care Quality Commission’s has issued the Trust with two warning
notices (outcomes 6 and 4) after its visits in July to the Bradgate Mental
Health Unit. Trust’s Board of Directors has met and has put in place a
firm action plan for improvements.
Adrian Childs
2.0 4.0 0.0 0.0 0.0 0.0
0.9 or below = Green, 1 - 1.9 = Amber-Green, 2 - 3.9 = Amber-Red and 4 or above = Red
NB: Monitor indicators are either RED or GREEN, the trust has set no tolerances.
RAG status for Total GRR Score reflects Monitor guide to applicants requirement for GRR of 1.9 or less to be authorised.
1.9 or below = Green, 2.0 or above - Red
Summary of Performance against Monitor Targets
Total GRR Score(based on current months performance)
6.0
Date of report: 19/09/2013 Page 3 of 34

Integrated Quality and Performance Report
The Governance Concern Score (GCS) is proposed to replace the Governance Risk Rating (GRR)
LPT will operate in shadow form a Governance Concern Score alongside the Governance Risk Rating
* This category referrs to triangulation from external agency reports about the Trust.
Due to the lack of any additional concerns (outside of the CQC) an asssessment of 'Unlikely' has been made against this becoming a trigger.
** It is understood this indicator referrs to staff metrics and quality governance performance for the Trust. Due to areas under development,
this category has been currently self-assesed to be 'Possibly' causing a trigger.
Governance Concern Score
LPT PositionCategory Self Assessed Trigger
Material governance issue -
potential use of formal powers
CQC Concerns
Access Metrics
Outcomes Metrics
3rd Party Reports
Quality Governance
Financial Risk
Yes, CQC warning notices (CQC outcomes 6 and 4)
Green
Green
Understood to be 'none reported'
Patient & Staff satisfaction survey results - requires further analysis. Number of Board level changes in period
Continuity of Services Risk Rating (CSSR) = 4
Yes
No
No
Unlikely*
Possibly**
No
Amber Red
Date of report: 19/09/2013 Page 4 of 34

Integrated Quality and Performance Report
MON/COM Monthly MSP.01 Infection Control: MRSA Meeting the MRSA Objective AUG 0 0 0 0
MON Monthly MSP.02 Infection Control: C Diff (MH & Community) Meeting the Clostridium Difficle Objective AUG 1 0 3 12
MON Monthly MSP.03 Maximum time of 18 weeks from point of referral to treatment in aggregate (non-admitted, complete pathways) 95.0% AUG 99.0% 89.8% 91.2% 95.0%
MON Monthly MSP.13 Maximum time of 18 weeks from point of referral to treatment in aggregate (non-admitted, incomplete pathways) 92.0% AUG 99.1% 95.3% 97.2% 92.0%
MON Monthly MSP.14 Data Completeness: Community Services (Referral to Treatment Information) 50.0% AUG 99.9% 100.0% 99.9% 50.0%
MON Monthly MSP.15 Data Completeness: Community Services (Referral Information) 50.0% AUG 81.1% 85.0% 84.4% 50.0%
MON Monthly MSP.16 Data Completeness: Community Services (Treatment Activity Information) 50.0% AUG 99.9% 99.9% 99.9% 50.0%
MON Monthly MSP.17 Data Completeness: Community Services (Patient Identifier Information) - may be included later in 2013/14 by Monitor 50.0% - - - - - - 50.0%
MON Monthly MSP.18Data Completeness: Community Services (Patients Dying at Home/Care Home Information) - may be included later in 2013/14 by
Monitor50.0% - - - - - - 50.0%
MONMonthly (In
Arrears)MSP.05 Care Programme Approach:% patients followed up within 7 days of discharge 95% JUL 91.8% 98.1% 95.0% 95%
MON Monthly MSP.06 Care Programme Approach:% patients having Formal Review within 12 months 95% AUG 96.4% 96.9% 96.3% 95%
MON Monthly MSP.07 Minimising Mental Health Delayed Transfers of Care (% Patients Delayed) <=7.5% AUG 6.3% 6.6% 5.8% <=7.5%
MON Monthly MSP.08 % of Admissions Gate Kept by the Crisis Resolution & Home Treatment Team 95% AUG 97.5% 100.0% 99.3% 95%
MON Monthly MSP.09 Early Intervention in Psychosis:% newly diagnosed cases against commissioner contract 95% AUG 136.4% 45.5% 116.4% 95%
MON Quarterly MSP.10 Mental Health Minimum Dataset (MHMDS) Data Completeness: Identifiers 97% Q1 98.4% 97.6% 98.4% 97%
MON Quarterly MSP.11 Mental Health Minimum Dataset (MHMDS) Data Completeness: Outcomes for patients on CPA 50% Q1 55.3% 61.5% 55.3% 50%
MON Quarterly MSP.12 Access to Healthcare for All: Self Certification against compliance 4 Q1 4 4 4 4
TRUST Monthly QPS.01 % people reporting being treated with dignity and respect 0 0 0 0
COM/DOH Monthly QPS.02 Mixed sex sleeping accommodation breaches 0 AUG 0 0 0 0
TRUST Monthly QPS.03 % adult service users reporting having out of hours (OOH) contact details 95%
TRUST Monthly QPS.04 Compliments received 0 AUG 707 644 3245 0
TRUST Monthly QPS.05 Total complaints received 0 AUG 20 32 136 0
TRUST Monthly QPS.06 Complaints acknowledged within 3 working days 100% AUG 100.0% 100.0% 100.0% 100%
MON/CQC Monthly QPS.07 % Complaints closed within timescales 100% AUG 100.0% 100.0% 100.0% 100%
CQUINMonthly (In
Arrears)QPS.09 Net Promoter Score: Total Discharges JUN 434 340 1351
CQUINMonthly (In
Arrears)QPS.10 Net Promoter Score: Cards Returned JUN 131 139 463
CQUINMonthly (In
Arrears)QPS.11 Net Promoter Score: Return Rate JUN 30.2% 40.9% 34.3%
CQUINMonthly (In
Arrears)QPS.08 Net Promoter Score: Overall Score JUN 64.58 76.25 0
TRUST Monthly QSC.03 Never Events 0 AUG 0 0 0 0
COM Monthly QSC.04 Total Serious Incidents (SIs) 0 AUG 22 23 87 0
COM Monthly QSC.05 STEIS - SI action plans implemented within timescales 100% AUG 100.0% 100.0% 98.7% 100.0%
TRUST Monthly QSC.15 % No Harm (Patient Safety Incidents) 69% AUG 61.1% 58.8% 59.1% 69%
TRUST Monthly QSC.14 Incident Rate (Patient Safety Incidents) 0% AUG 38.7 42.4 32.3 0
TRUST Monthly QSC.16 PST: Pressure Ulcer Harms 0% AUG 4.8% 6.8% 6.0%
TRUST Monthly QSC.17 PST: Falls Harms 0% AUG 0.2% 0.1% 0.5%
TRUST Monthly QSC.18 PST: Catheter UTI Harms 0% AUG 0.5% 0.3% 0.4%
TRUST Monthly QSC.19 PST: VTE Harms 0% AUG 0.7% 0.5% 0.4%
COM/DOH Monthly QSC.10 Compliance with hygiene code 0 AUG
MON/COM Monthly QSC.11 MRSA Bacteraemia cases - Community AUG 0 0 0 0
MON/COM Monthly QSC.13 Clostridium Difficile (C Diff) Cases AUG 1 0 3 12
TRUST Monthly QSC.23 Total incidents reported (including near misses) AUG 1091 1267 5627
TRUST Monthly QSC.20 Total incidents reported (Pressure Sore) AUG 224 224 1326
TRUST Monthly QSC.21 Total incidents reported (Other) AUG 867 967 4301
DoH/SHA Monthly QSC.22a Non-Compliance with Essential Standards resulting in a Major Impact on Patients No AUG No No No No
DoH/SHA Monthly QSC.22b Non-Compliance with CQC Essential Standards Resulting in Enforcement Action No AUG Yes Yes Yes No
TRUST Monthly QES.01 % Signed Care Pathways in place for Service Users 0 0 0 0
Ye
ar
to D
ate
Po
sitio
n
Sp
ark
line
Performance Dashboard
Trust Performance
Ch
ap
ter
So
urc
e
Ind
ica
tor
Ye
ar
En
d T
arg
et
Cu
rre
nt
Mo
nth
Actu
al
Monitor Service
Performance
Mo
nth
ly
Ta
rge
t
Pe
rfo
rma
nce
vs
Pre
vio
us M
on
th
Ind
ica
tor
Co
de
Da
ta A
s A
t
Pre
vio
us
Mo
nth
Re
po
rtin
g
Fre
qu
en
cy
Quality - Safe Care
Quality - Effective
services
Quality - Personal
Services
Date of report: 19/09/2013 Page 5 of 34

Integrated Quality and Performance Report
TRUST Monthly QES.02 % Carer Input into Care Plans on PAS - where input is requested by the Service User 0% 0.0% 0.0% 0.0%
MON Monthly QES.03 Early Intervention in Psychosis - % newly diagnosed cases against commissioner contract 95% AUG 136.4% 45.5% 116.4% 95%
MONMonthly (In
Arrears)QES.04 % patients on CPA followed up within 7 days of discharge 95% JUL 91.8% 98.1% 95.0% 95%
MON Monthly QES.05 % patients on CPA having Formal Review within 12 months 95% AUG 96.4% 96.9% 96.3% 95%
MON Monthly QES.07 Access to Healthcare for All 4 Q1 4 4 4 4
QES.08a County: 95% 99.3% 96.7% 99.3% 95%
QES.08b City: 95% 99.2% 96.0% 99.2% 95%
QES.09aCounty- 46.3%
Q144.5% 45.3% 44.5% 46.7%
QES.09b City- 53.5% Q1 57.8% 52.5% 57.8% 54.0%
QES.10aCounty - 5240
Q45249 3684 5249 5240
QES.10b City- 2644 Q4 2743 2042 2743 2644
COM/DoH Monthly QES.11 Genito Urinary Medicine- % Offered appointment within 48 hours 98% AUG 99.6% 100.0% 99.8% 98%
COM Monthly QES.12aCity: 834
(monthly)AUG 510 650 3002 7500
COM Monthly QES.12bCounty: 1000
(monthly)AUG 691 541 3932 9000
COM Monthly QES.13aCity: 46
(monthly)AUG 18 26 129 410
COM Monthly QEFS.01 Average Length of Stay (ALoS) - Mental Health TBC AUG 48.2 65.9 0 TBC
TRUST Monthly QEFS.02 Median Length of Stay (ALoS) - Mental Health 0 AUG 18.0 21.0 18.0 0
TRUST Monthly QEFS.13 Average Length of Stay (ALoS) - Community hospital rehab wards AUG 25.4 22.6 25.2
TRUST Monthly QEFS.14 Average Length of Stay (ALoS) - Stroke wards (ward 1 st lukes, ward 1 Coalville) AUG 27.3 27.5 30.4
TRUST Monthly QEFS.15 Average Length of Stay (ALoS) - Mental health (ward 4 Coalville) AUG 50.8 402.0 119.9
TRUST Monthly QEFS.16 Average Length of Stay (ALoS) - City rehab beds (CICB/CRB) AUG 19.8 18.0 19.4
TRUST Monthly QEFS.04 Occupancy Rate - Mental Health <=85% AUG 92.5% 92.4% 92.2% 85.0%
TRUST Monthly QEFS.05 Occupancy Rate - Community >=93% AUG 92.3% 93.6% 92.6% 93.0%
MON Monthly QEFS.06 % Delayed Patients (DToC) - Mental Health <=7.5% AUG 6.3% 6.6% 5.8% <=7.5%
COM Monthly QEFS.07 % Delayed Patients (DToC) - Community <=2.12% AUG 2.55% 0.71% 1.81% <=2.12%
MON Monthly QEFS.08 % of Admissions Gate Kept by the Crisis Resolution & Home Treatment Team 95% AUG 97.5% 100.0% 99.3% 95.0%
COM Monthly QEFS.09 Total number of Home Treatment episodes carried out by Crisis Resolution team year to date.1895 (Year
end Target)AUG 743 643 743 1895
TRUST Monthly QEFS.10 % Discharge Summaries issued within 24 hours 0 0 0 0 0 0 0
MON Quarterly QEFS.11 MHMDS Data Completeness: Records 97% Q1 98.4% 97.6% 98.4% 97.0%
MON Quarterly QEFS.12 MHMDS Data Completeness: Outcomes 50% Q1 55.3% 61.5% 55.3% 50.0%
Monthly PF.01 EBITDA Margin JUL 5.1% 5.1% 5.1% 5.2%
Monthly PF.02 I&E Surplus £000 (Excl. impairments) JUL 1,126 898 1,126 2,903
Monthly PF.03 Income (against budget) £000 JUL 107,198 85,754 - 107,198 262,520
Monthly PF.04 Expenditure (against budget) £000 JUL 106,073 84,856 - 106,073 259,617
Monthly PF.05 CIP achievement £000 JUL 3,738 2,929 - 3,738 11,831
Monthly PF.06 Cash balance £000 (as per original FIMS Plan) JUL 16,364 15,026 16,364 11,089
Monthly PF.7 Capital Expenditure (target spend = available funds) £000 JUL 1,427 1,074 1,427 15,085
Monthly PF.8 Debtors > 90 days JUL 6.0% 5.9% 6.0% 5.0%
Monthly PF.9 Creditors > 90 days JUL 2.3% 1.2% 2.3% 5.0%
Monthly PF.10 Better Payment Practice Code JUL 96.4% 96.1% 96.4% 95.0%
TRUST Monthly PW.25 Number of WTE Employed 0 AUG 4551.3 4554.5
TRUSTMonthly (In
Arrears)PW.26 % of Sickness Absence (1 month in arrears) <=4% JUL 4.3% 4.2% 4.4% <=4%
TRUST Monthly PW.27 % of total workforce turnover including training grade medics (Projected to Mar-14) 8-12% AUG 11.6% 9.3% 8-12%
TRUSTMonthly (In
Arrears)PW.34 % Vacancy Rate (1 Month in Arrears) 6-12% JUL 8.8% 9.6% 6-12%
TRUST Monthly PW.32 Ratio of Bank Usage to Agency Usage <1:0.75 AUG 1: 0.97 1:0.89 1: 0.9 <1:0.75
TRUST Monthly PW.29 Number of staff at risk of redundancy AUG 13 27
TRUST Monthly PW.30 Number of open formal grievances AUG 7 8 8
TRUST Monthly PW.31 Number of open formal disciplinaries AUG 28 27 18
TRUST Monthly PW.14 % of staff with an appraisal/ PDR within the last 12 months >=80% AUG 82.4% 84.2% >=80%
TRUST Monthly PW.19 % of staff trained in Core Mandatory Training >=85% AUG 93.7% 93.6% >=85%
TRUST Monthly PW.33 % of Mandatory Training DNAs <=15% AUG 14.4% 12.7% <=15%
Q1
COM/DoH Smoking Cessation:Number of 4 week quitters attending NHS stop smoking services - YTD Cumulative Q4
Quarterly
Performance -
Finance
Chlamydia Screening service - Number of screens for 15-24 year olds
Q1
Quality - Efficient
Services
Chlamydia Positive Screens- Number of positive screens for 15-24 year olds
Quarterly
Quarterly
HR Workforce
Quality - Effective
services
Breast Feeding- Prevalence at 6 - 8 weeks
COM/DoH Breast Feeding- Status recorded at 6 - 8 weeks
COM/DoH
Date of report: 19/09/2013 Page 6 of 34

Integrated Quality and Performance Report
Data Source
Data
Reporting
Period
CPA 12m Review
(95%)
CPA 7 day follow
up (95%)
DToC (Monitor)
(<=7.5%)
Crisis Resolution
Gatekeeping
(95%)
Early
Intervention in
Psychosis (95%)
MHMDS
Completeness -
Identifiers (97%)
MHMDS
Completeness -
Outcomes (50%)
18 week wait
time non
admitted
complete
pathway (95%)
18 week wait
time non
admitted
incomplete
pathway (92%) Comment
Leicestershire Partnership NHS Trust Trust Board Papers Jul-13 96.90% 98.10% 6.50% 100.00% 45.50% 98.40% 55.10% 89.80% 95.30%
Nottinghamshire Healthcare NHS Trust Trust Board Papers Jul-13 96.30% 98.80% 6.20% 99.20% 96.10% 99.70% 96.10% n/a n/a
Northamptonshire Healthcare FT Trust Board Papers Jul-13 not published not published not published not published not published not published not published not published not published Papers not published at time of writing
Coventry and Warwickshire Partnership Trust Trust Board Papers Jul-13 not published not published not published not published not published not published not published not published not published Papers not published at time of writing
Lincolnshire Partnership NHS FT Trust Board Papers Jul-13 98.20% not published 3.20% 96.70% 100.00% 99.50% not published 99.30% 96.60%
Derbyshire Healthcare NHS FT Trust Board Papers Jul-13 98.20% 97.50% 0.81% 96.05% 126.10% 99.95% 97.74% 98.33% 96.73%
Cambridge & Peterborough NHS FT Trust Board Papers Jul-13 95.31% 98.17% 4.67% 95.20% 100.00% 99.00% 90.15% n/a n/a
South Staffs and Shropshire Healthcare NHS FT Trust Board Papers Jul-13 not published not published not published not published not published not published not published not published not published July performance papers not published
LPT Benchmarking Information - July 2013 Report
0%
20%
40%
60%
80%
100%
120%
CPA Performance
CPA 12m Review (95%)
CPA 7 day follow up (95%)0%
20%
40%
60%
80%
100%
120%
140%
Crisis & Early Intervention Performance
Crisis Resolution Gatekeeping (95%)
Early Intervention in Psychosis (95%)
0%
20%
40%
60%
80%
100%
120%
MHMDS Performance
MHMDS Completeness -Identifiers (97%)
MHMDS Completeness -Outcomes (50%)
0%
20%
40%
60%
80%
100%
120%
18 Week Wait Performance
18 week wait time non admittedcomplete pathway (95%)
18 week wait time non admittedincomplete pathway (92%)
0%
1%
2%
3%
4%
5%
6%
7%
DToC Performance
DToC (Monitor) (<=7.5%)
Notes: Analysis of the July 2013 benchmarking data indicates the trust failed to achieve the 95% target against the Early Intervention In Psychosis and continues to underperform against the 18 Week Referral to treatment Completed Pathways target. The trust figures for the month of August indicates an improvement against both key performance indicators indicating action plans implemented have achieved the desired outcomes.
Date of report: 19/09/2013 Page 7 of 34

Integrated Quality and Performance Report
Key:- 3 = Green achieved target, 2= Amber Within 95% of Target, 1= Red Failing Target
Key Performance Indicators (KPIs): Overview
0
1
2
3Occupancy Rate - MH
OccRate - Community
% Delayed Patients(DToC) - Community
% of Admissions GateKept
MHMDS DataCompleteness: Records
MHMDS DataCompleteness:
Outcomes
Efficient Services
0
1
2
3
Mixed sexaccommodation
breaches
Complaintsacknowledged within
3 working days
% Complaints closedwithin timescales
Quality -Personal Services
0
1
2
3Never Events
STEIS - SI action plansimplemented within
timescales
Compliance withhygiene code
MRSA Bacteraemiacases - Community
Clostridium Difficile (CDiff) Cases
Quality -Safe Care
0
1
2
3
Early Intervention inPsychosis
% patients on CPAfollowed up within 7 days
of discharge
% patients on CPA havingFormal Review within 12
months
Breast Feeding- StatusBreast Feeding-
Prevalence
SmokingCessation:Number of 4
week quitters
GU Medicine- % Offeredappointment within 48
hours
Quality-Effective Services
0
1
2
3
Core MandatoryTraining
Appraisal
Sickness AbsenceRatio of Bank Usage to
Agency Usage
Vacancy Rate
Workforce Metrics
Date of report: 19/09/2013 Page 8 of 34

Integrated Quality and Performance Report
Performance (%) Apr-12 May-12 Jun-12 Jul-12 Aug-12 Sep-12 Oct-12 Nov-12 Dec-12 Jan-13 Feb-13 Mar-13 Apr-13 May-13 Jun-13 Jul-13
% CPA 7 Day Follow-up 98.5% 98.5% 100.0% 97.3% 98.8% 98.1% 100.0% 94.1% 92.6% 100.0% 96.2% 95.9% 98.4% 100.0% 98.1% 91.8%
Target 95% 95% 95% 95% 95% 95% 95% 95% 95% 95% 95% 95% 95% 95% 95% 95%
DETAILED EXCEPTION REPORT - % CPA 7 Day Follow-up Follow
Responsible Lead: Paul Miller Indicator Source: MON
Comments and Actions: Follow ups on the SAME day as discharge are not registered as a follow up. The follow-up must occur after the day of discharge. Patients re-admitted within 7 days are not included in the calculation. 73 patients were discharged on CPA during July 2013, 6 were not followed up within 7 days -4 patients were not contactable after several attempts -1 patient went missing after discharge and attempts are on-going to locate the patient. -1 patient was seen on the day of discharge but was not subsequently followed up. NB: This data is always a month behind due to the timescale available to deliver the IQPR. With the 7 day lead time plus 5 days to enter data into the system, current month’s data would not be available until at least the 15th of the month.
80%
85%
90%
95%
100%
Apr-12 May-12 Jun-12 Jul-12 Aug-12 Sep-12 Oct-12 Nov-12 Dec-12 Jan-13 Feb-13 Mar-13 Apr-13 May-13 Jun-13 Jul-13
Monthly - % CPA 7 Day Follow-up
% CPA 7 Day Follow-up Target
Date of report: 19/09/2013 Page 9 of 34

Integrated Quality and Performance Report
RTT Performance
(%)Aug-12 Sep-12 Oct-12 Nov-12 Dec-12 Jan-13 Feb-13 Mar-13 Apr-13 May-13 Jun-13 Jul-13 Aug-13
Completed
Pathways Actual 99.0% 96.2% 96.6% 96.6% 95.5% 98.7% 95.1% 95.1% 92.9% 86.5% 88.6% 89.8% 99.0%
Completed
Pathways Target 95% 95% 95% 95% 95% 95% 95% 95% 95% 95% 95% 95% 95%
Incomplete
Pathways Actual 98.5% 97.7% 98.4% 95.5% 98.9% 97.7% 97.9% 97.2% 97.0% 98.7% 96.3% 95.3% 99.1%
Incomplete
Pathways Target 92% 92% 92% 92% 92% 92% 92% 92% 92% 92% 92% 92% 92%
Responsible Lead: Paul Miller Indicator Source: MON Comments and Actions: Performance for Completed Pathways in August-13 is at 99.0% :- - 1 patient breaching Department of Health guidance states that providers must continue to monitor the length of the patients waiting time until treatment starts for all the above reasons. The trust notes the following actions have addressed the decline in performance:- - Implementation of new clinic booking rules to increase the number of new (first) appointment slots - Review of the SPA process (single point of access for the service), ensuring appropriate signposting of new referrals - Locum consultants to start during July to assist with short-term capacity issues - Recruitment exercise for 2 vacant positions to address long-term capacity issues The remedial action plan has returned monthly performance back to a ‘green’ status .
DETAILED EXCEPTION REPORT - Maximum time of 18 weeks from point of referral to treatment
99.0%
96.2% 96.6% 96.6%
95.5%
98.7%
95.1% 95.1%
92.9%
86.5%
88.6%
89.8%
99.0% 98.5%
97.7% 98.4%
95.5%
98.9%
97.7% 97.9% 97.2% 97.0%
98.7%
96.3%
95.3%
99.1%
85%
87%
89%
91%
93%
95%
97%
99%
Aug-12 Sep-12 Oct-12 Nov-12 Dec-12 Jan-13 Feb-13 Mar-13 Apr-13 May-13 Jun-13 Jul-13 Aug-13
Maximum time of 18 weeks from point of referral to treatment
Completed Pathways Actual Incomplete Pathways Actual
Completed Pathways Target Incomplete Pathways Target
Date of report: 19/09/2013 Page 10 of 34

Integrated Quality and Performance Report
No. of Screens Aug-12 Sep-12 Oct-12 Nov-12 Dec-12 Jan-13 Feb-13 Mar-13 Apr-13 May-13 Jun-13 Jul-13 Aug-13
City Actuals673 869 985 940 569 777 998 853 563 639 640 650 510
City Target669 669 669 669 669 669 669 669 834 834 834 834 834
County
Actuals 731 2204 1303 2311 1055 1154 1457 1508 692 956 1052 541 691
County Target1500 1500 1500 1500 1500 1500 1500 1500 1000 1000 1000 1000 1000
Responsible Lead: Paul Miller Indicator Source: COM Comments and Actions: Trajectory work has been undertaken by the City and County Chlamydia Services against the screening targets set. The service expects the first two quarters to have a below average number of screens and expects an increase in the third quarter in line with the start of the new academic year. April to December 2013 City and County target figures have been revised City 7500 & County 9000.
DETAILED EXCEPTION REPORT - National Chlamydia Screening Programme- Number of screens for 15-24 year olds
0
500
1000
1500
2000
2500
Number of screens for 15-24 year olds
City Actuals
County Actuals
City Target
County Target
Date of report: 19/09/2013 Page 11 of 34

Integrated Quality and Performance Report
Current Month Previous Month
Adult Learning Disabilities 86.4% 89.0%
Adult Mental Health 79.9% 84.0%
Community Health Services 85.9% 88.5%
Enabling Services 82.0% 82.2%
Families, Young People and
Children Services80.8% 81.5%
Hosted Services 64.1% 55.6%
Split by Division
* Current Month Position is also YTD position
DETAILED EXCEPTION REPORT - % Staff with a valid Appraisal & PDP (renewed every 12 months) and Taken from ESR
Responsible Lead: Alan Duffell Indicator Source: TRUST Comments and Actions: Target updated to reflect 13/14 indicator Hosted services have overall increased their PDR compliance by approximately 10% since last month. The biggest improvement was in HIS where compliance increased from 64.8% to 74.8%. HIS will need to complete a further 6 PDRs plus the 12 due to expire in September to meet the target. Finance procurement have 11 PDRs which have not been completed with no improvement from last month There were 16 new starters in July in EMIAS which has decreased the compliance rate. If we omit the new starters who are due a PDR in the next 3 months the compliance rate is 81%. Adult Mental Health have dipped to just below the target at 79.9% PDR compliance. It should be noted that complex care has retained 100% compliance; and 3 other areas have shown an improvement
0%
10%
20%
30%
40%
50%
60%
70%
80%
90%
100%
% Staff with a valid Appraisal & PDP (renewed every 12 months) - Taken from ESR
% Available staff with a valid Appraisal & PDP (renewed every 12 months) - Taken from ESR Target
Date of report: 19/09/2013 Page 12 of 34

Integrated Quality and Performance Report
Tim
elin
ess
Cen
tral
Syste
m
Exec
Dire
cto
r
Sig
n o
ff
% people reporting being treated with
dignity and respectTRUST - AC
Mixed sex sleeping accommodation
breachesCOM/DOH Monthly 0 AUG 0 0 0 0 PM 0 0 0 0
% adult service users reporting having out
of hours (OOH) contact detailsTRUST Monthly 95% PM
Compliments received TRUST Monthly AUG 707 644 3245 AC 48 2 641 14
Total complaints received TRUST Monthly AUG 20 32 136 AC 10 0 7 3
Complaints acknowledged within 3 working
daysTRUST Monthly 100% AUG 100.0% 100.0% 100.0% 100% AC 100.0% - 100.0% 100.0%
% Complaints closed within timescales MON/CQC Monthly 100% AUG 100.0% 100.0% 100.0% 100% AC 100.0% - 100.0% 100.0%
Net Promoter Score: Total Discharges CQUINMonthly (In
Arrears)JUN 434 340 1351 AC
Net Promoter Score: Cards Returned CQUINMonthly (In
Arrears)JUN 131 139 463 AC
Net Promoter Score: Return Rate CQUINMonthly (In
Arrears)JUN 30.2% 40.9% 34.3% AC
Net Promoter Score: Overall Score CQUINMonthly (In
Arrears)JUN 64.58 76.25 AC 70.96 - 64.58 0.00
Trust Performance Divisional Performance - Latest Month
Quality - Personal Services
Adu
lt L
ea
rnin
g
Dis
abili
ties
Exec D
ire
cto
r
Le
ad
Adu
lt M
en
tal
Hea
lth
Com
mun
ity
Hea
lth
Data
As A
t
Spa
rklin
e
Curr
en
t M
on
th
Actu
al
** Data Quality is measured against the items below:
1) TIMELINESS:
GREEN: Data is submitted in time to the central system for accurate reporting (in line with trust policies) AND data is verified and any data quality issues are resolved in time for reporting deadlines AND data is extremely unlikely to change in subsequent months.
AMBER: Action Plans are in place to ensure business processes are adapted to meet the GREEN requirements.
RED: Data is not available in a timely fashion (according to trust policies) OR Data has not been verified and data quality issues haven't been resolved OR Data is likely to change in subsequent months
2) EXTRACTED FROM A CENTRAL SYSTEM:
GREEN: ALL reported data is extracted from the SAME central system (such as Safeguard, Maracis, ESR, Finance etc)
AMBER: Action plans are in place to submit data to central systems rather than using manual processes OR action plans are available for merging multiple systems into one central system.
RED: Data is extracted from a manual system (even if only in one particular area) OR data is extracted from multiple central systems.
3) SIGNED OFF BY AN EXECUTIVE DIRECTOR
GREEN: The position of data quality items 1) and 2) have been agreed and signed off by an Executive Director
RED: The data quality position has not been agreed and signed off by an Executive Director
Sou
rce
Mon
thly
ta
rge
t
Tra
ve
l on
pre
vio
us
mon
th
YT
D P
ositio
n
Pre
vio
us
mon
th
Rep
ort
ing
Fre
que
ncy
Fam
ilies,
You
ng
Peo
ple
& C
hild
ren
Data Quality
Yea
r E
nd
Targ
et
Comments and Actions:
Compliments:
All figures are received for August but are subject to continual validation, any changes that may occur will be updated in next months IQPR.
Net Promoter Score:
Trust overall score is based on CHS performance only.
Date of report: 19/09/2013 Page 13 of 34

Integrated Quality and Performance Report
Tim
elin
ess
Ce
ntr
al
Syste
m
Exe
c
Dire
cto
r S
ign
off
Never Events TRUST Monthly 0 AUG 0 0 0 0 AC 0 0 0 0
Total Serious Incidents (SIs) COM Monthly AUG 22 23 87 AC 10 0 10 2
STEIS - SI action plans implemented within
timescalesCOM Monthly 100% AUG 100.0% 100.0% 98.7% 100.0% AC 100.0% 100.0% 100.0% 100.0%
Total incidents reported (including near misses) TRUST Monthly AUG 1091 1267 5627 AC 244 98 536 58 16 139
Total incidents reported (Pressure Sore) TRUST Monthly AUG 224 224 1326 AC 3 0 154 0 0 67
Total incidents reported (Other) TRUST Monthly AUG 867 967 4301 AC 241 98 382 58 16 72
Total patient safety incidents reported
(including near misses)TRUST Monthly AUG 756 845 3392 AC 154 71 401 45 11 74
% No Harm (Patient Safety Incidents) TRUST Monthly 69% AUG 61.1% 58.8% 59.1% 69% AC 68.8% 46.5% 51.4% 75.6%
Incident Rate (Patient Safety Incidents) TRUST Monthly AUG 38.7 42.4 32.3 AC 21.5 204.0 36.1 48.3
PST: Pressure Ulcer Harms TRUST Monthly AUG 4.8% 6.8% 6.0% AC 4.8%
PST: Falls Harms TRUST Monthly AUG 0.2% 0.1% 0.5% AC 0.2%
PST: Catheter UTI Harms TRUST Monthly AUG 0.5% 0.3% 0.4% AC 0.5%
PST: VTE Harms TRUST Monthly AUG 0.7% 0.5% 0.4% AC 0.7%
Compliance with hygiene code COM/DOH Monthly AUG AC
MRSA Bacteraemia cases - Community MON/COM Monthly AUG 0 0 0 0 AC 0
Clostridium Difficile (C Diff) Cases MON/COM Monthly AUG 1 0 3 12 AC 0 0 1 0
Non-Compliance with Essential Standards
resulting in a Major Impact on PatientsDoH/SHA Monthly No AUG No No No No AC No No No No
Non-Compliance with CQC Essential Standards
Resulting in Enforcement ActionDoH/SHA Monthly No AUG Yes Yes Yes No AC Yes No No No
Quality - Safe Care
** Data Quality is measured against the items below:
1) TIMELINESS:
GREEN: Data is submitted in time to the central system for accurate reporting (in line with trust policies) AND data is verified and any data quality issues are resolved in time for reporting deadlines AND data is extremely unlikely to change in subsequent months.
AMBER: Action Plans are in place to ensure business processes are adapted to meet the GREEN requirements.
RED: Data is not available in a timely fashion (according to trust policies) OR Data has not been verified and data quality issues haven't been resolved OR Data is likely to change in subsequent months
2) EXTRACTED FROM A CENTRAL SYSTEM:
GREEN: ALL reported data is extracted from the SAME central system (such as Safeguard, Maracis, ESR, Finance etc.)
AMBER: Action plans are in place to submit data to central systems rather than using manual processes OR action plans are available for merging multiple systems into one central system.
RED: Data is extracted from a manual system (even if only in one particular area) OR data is extracted from multiple central systems.
3) SIGNED OFF BY AN EXECUTIVE DIRECTOR
GREEN: The position of data quality items 1) and 2) have been agreed and signed off by an Executive Director
RED: The data quality position has not been agreed and signed off by an Executive Director
Ad
ult L
ea
rnin
g
Dis
abili
tie
s
Co
mm
unity
He
alth
So
urc
e
Ad
ult M
enta
l
He
alth
Cu
rre
nt
Mo
nth
Actu
al
En
ab
ling
Se
rvic
es
Mo
nth
ly t
arg
et
Ye
ar
to D
ate
Po
sitio
n
Ye
ar
En
d
Ta
rget
Tra
vel o
n
pre
vio
us m
onth
Fa
mili
es,
Yo
un
g
Pe
op
le &
Ch
ildre
n
Comments and Actions:
Non-Compliance with CQC Essential Standards Resulting in Enforcement Action: Following the Care Quality Commission’s decision to issue the Trust with two warning notices (for CQC outcomes 6 and 4) after its visits in July to the Bradgate Mental Health Unit, the Trust’s
Board of Directors has met and – as well as putting in place a firm action plan for improvements to care – is making sure further professional and emotional support is in place for staff both on the Unit itself and across the Trust.
Level 2 SI Action Plans implemented within timescales: This indicator considers only those SI action plans that should have been completed by the latest month. SI's investigations must be closed within 60 working days. Only then are any action plans implemented, each SI
action plan will have its own deadline. Previous months performance has been updated to reflect performance during the reporting period and shows an indication of a monthly performance.
Incident Rate: This indicator is derived from the total number of patient safety incidents per month per thousand occupied bed days (excluding leave). This indicator is not appropriate to break down to sub-Trust level (divisional break-down is for information only).
Total patient safety incidents reported (including near misses): Previous months figures have been updated to reflect accurate position.
MRSA Bacteraemia: Community - cases are not validated until 15th of each month following lock down on the national system MESS. Therefore, current month figures might change in future months which is why the current data quality rating for timeliness is red. Year end target
of 0 (Zero) is based on the Commissioner target, Monitor’s annual de minimis limit for cases of MRSA reflecting a governance concern is set at 6.
Clostridium Difficile (C Diff) Cases: Annual target reflects the Monitor Compliance Framework 2013/14 de minimus limit set at 12 cases. There is an internal root cause analysis currently being carried out by the infection prevention and control team in conjunction with the ward
area to identify any issues or causes, currently the investigation has not identified any issue in particular but work is on-going.
Incident Reporting Direction of Travel Indicators: The approach taken by LPT in monitoring incident related KPIs is to encourage a reporting culture in line with the NPSA and the NRLS reports into incident reporting rates. This results in a 'green, up arrow' being applied when
incident reporting has increased (for all incident related KPIs above except Pressure Sores), and a 'red, down arrow' being applied where incident reporting has decreased. In the case of Pressure Sores, a 'green, up arrow' depicts fewer reported Pressure Sores and a 'red, down
arrow' showing an increase in pressure sores. For the % No Harm KPI, the Trust is aiming to achieve the highest percentage possible, so a 'green, up arrow' depicts improving performance (higher percentage) on the previous month whereas a 'red, down arrow' depicts poorer
performance.
Re
po
rtin
g
Fre
qu
en
cy
Sp
ark
line
Division Performance - Latest MonthTrust Performance
3rd
part
y/E
xte
rnal
Exe
c D
ire
cto
r
Lead
Pre
vio
us m
onth Data Quality
Da
ta A
s A
t
Incidents
Patient Safety Thermometer
Date of report: 19/09/2013 Page 14 of 34

Integrated Quality and Performance Report
Division Apr-13 May-13 Jun-13 Jul-13 Aug-13 Sep-13 Oct-13 Nov-13 Dec-13 Jan-14 Feb-14 Mar-14 SparklineAMHS 9 34 13 14 48LD 1 0 2 1 2CHS 377 689 742 625 641FYPC 5 13 4 3 14
Total 392 736 761 643 705
Division Apr-13 May-13 Jun-13 Jul-13 Aug-13 Sep-13 Oct-13 Nov-13 Dec-13 Jan-14 Feb-14 Mar-14 SparklineAMHS 16 13 19 14 10LD 0 1 1 0 0CHS 8 7 6 13 7FYPC 6 2 5 5 3
Total 30 23 31 32 20
Division Apr-13 May-13 Jun-13 Jul-13 Aug-13 Sep-13 Oct-13 Nov-13 Dec-13 Jan-14 Feb-14 Mar-14 SparklineAMHS 228 231 200 235 244LD 70 94 77 92 98CHS 536 565 536 665 536FYPC 98 97 97 85 58
Total 932 987 910 1077 936
Division Apr-13 May-13 Jun-13 Jul-13 Aug-13 Sep-13 Oct-13 Nov-13 Dec-13 Jan-14 Feb-14 Mar-14 SparklineAMHS 70.3% 60.5% 83.5% 72.7% 68.8%LD 68.2% 78.0% 80.0% 65.6% 46.5%CHS 47.0% 48.4% 44.4% 49.9% 51.4%FYPC 75.0% 79.2% 77.8% 74.6% 75.6%
Total 55.7% 55.5% 58.3% 58.8% 61.1%
Division Apr-13 May-13 Jun-13 Jul-13 Aug-13 Sep-13 Oct-13 Nov-13 Dec-13 Jan-14 Feb-14 Mar-14 Sparkline
AMHS 4 7 3 8 10
LD 0 0 0 0 0
CHS 10 10 5 14 10
FYPC 1 2 0 1 2
Total 15 19 8 23 22
Incidents Reported and Serious Incidents Logged YTD 2013/14
Comments & Actions:
Methodology for calculating total percentage for Degree of No Harm of Patient Incidents updated revised to exclude non-divisional incidents
Compliments, Complaints and Incidents Divisional Detail
Patient Related Incident Themes YTD 2013/14 (Top 10)
Complaint Themes YTD 2013/14 (Top 10)
Degree of No Harm of Patient Incidents
Total Serious Incidents Logged
Compliments
Complaints
Total Incidents Reported
0
200
400
600
800
1000
1200
Total Incidents Reported
Total Serious Incidents Logged
Date of report: 19/09/2013 Page 15 of 34

Integrated Quality and Performance Report
Tim
elin
ess
Centr
al
Syste
m
Exec
Directo
r
Sig
n o
ff
% Signed Care Pathways in place for Service Users TRUST - PM
% Carer Input into Care Plans on PAS - where input is
requested by the Service UserTRUST - PM
Early Intervention in Psychosis - % newly diagnosed
cases against commissioner contractMON Monthly 95% AUG 136.4% 45.5% 116.4% 95.0% 116.4% PM 136.4%
% patients on CPA followed up within 7 days of
dischargeMON
Monthly (In
Arrears)95% JUL 91.8% 98.1% 95.0% 95% 95.0% PM 91.7% 100.0% 100.0% 100.0%
% patients on CPA having Formal Review within 12
monthsMON Monthly 95% AUG 96.4% 96.9% 96.3% 95% 96.3% PM 96.1% 96.7% 98.1% 98.2%
Access to Healthcare for All MON Quarterly 4 Q1 4 4 4 4 4 PM
County: 95% 99.3% 96.7% 99.3% 95.0% 99.3% PM 99.3%
City: 95% 99.2% 96.0% 99.2% 95.0% 99.2% PM 99.2%
County- 46.3% Q1 44.5% 45.3% 44.5% 46.7% 44.5% PM 44.5%
City- 53.5% Q1 57.8% 52.5% 57.8% 54.0% 57.8% PM 57.8%
County - 5240 Q4 5249 3684 5249 5240 NA PM 5249
City- 2644 Q4 2743 2042 2743 2644 NA PM 2743
Genito Urinary Medicine- % Offered appointment within
48 hoursCOM/DoH Monthly 98% AUG 99.6% 100.0% 99.8% 98.0% 99.8% PM 99.6%
COM Monthly City: 834 (monthly) AUG 510 650 3002 7500 5404 PM 510
COM MonthlyCounty: 1000
(monthly)AUG 691 541 3932 9000 7078 PM 691
Chlamydia Positive Screens- Number of positive
screens for 15-24 year olds COM Monthly City: 46 (monthly) AUG 18 26 129 410 232 PM 18
** Data Quality is measured against the items below:
1) TIMELINESS:
GREEN: Data is submitted in time to the central system for accurate reporting (in line with trust policies) AND data is verified and any data quality issues are resolved in time for reporting deadlines AND data is extremely unlikely to change in subsequent months.
AMBER: Action Plans are in place to ensure business processes are adapted to meet the GREEN requirements.
RED: Data is not available in a timely fashion (according to trust policies) OR Data has not been verified and data quality issues haven't been resolved OR Data is likely to change in subsequent months
2) EXTRACTED FROM A CENTRAL SYSTEM:
GREEN: ALL reported data is extracted from the SAME central system (such as Safeguard, Maracis, ESR, Finance etc.)
AMBER: Action plans are in place to submit data to central systems rather than using manual processes OR action plans are available for merging multiple systems into one central system.
RED: Data is extracted from a manual system (even if only in one particular area) OR data is extracted from multiple central systems.
3) SIGNED OFF BY AN EXECUTIVE DIRECTOR
GREEN: The position of data quality items 1) and 2) have been agreed and signed off by an Executive Director
RED: The data quality position has not been agreed and signed off by an Executive Director
Breast Feeding- Prevalence at 6 - 8 weeks COM/DoH Q1
Smoking Cessation:Number of 4 week quitters
attending NHS stop smoking services - YTD
Cumulative
COM/DoH
Chlamydia Screening service - Number of screens for
15-24 year olds
Q4
Quarterly
Quarterly
Comments and Actions:
% patients on CPA followed up within 7 days of discharge: Data runs a month behind to enable tracking of target. Please note that this indicator represents patients 18 years and over. Out of 73 patients discharged in July, 6 patients were not followed up. Please see the detailed
exception report on page 9.
Early Intervention: Small numbers involved in the denominator for calculation of this indicator can equate to significant swings in performance month on month; Figures refreshed each month to ensure accurate position is monitored accounting for data entry after IQPR production cut
off. The service enters data by the 15th of the month therefore performance maybe underinflated due to the early deadline set for the IQPR.
Genito Urinary Medicine- % Offered appointment within 48 hours: Target has been revised from 100% to 98% as per Schedule 4 - Quality Requirements 2013-14.
Breast Feeding: Q1 figures have been updated to reflect an accurate position.
Smoking Cessation: Quarter 1 figures expected 9th September 2013.
Fa
mili
es,
Young P
eople
& C
hild
ren
Sourc
e
Tra
vel on
pre
vio
us
mo
nth
Breast Feeding- Status recorded at 6 - 8 weeks COM/DoH Q1
Mo
nth
ly t
arg
et
Data
As A
t
Curr
ent
Mo
nth
Actu
al
Com
munity
Health
Quality - Effective Services
Year
End
Ta
rget
Adult L
earn
ing
Dis
abili
tie
s
Pre
vio
us
mo
nth
Adult M
enta
l
Health
Data Quality
Spark
line
Year
to D
ate
Positio
n
Exec D
irecto
r
Lead
Quarterly
Report
ing
Fre
quency
Year
End
Fo
recast
Divisional Performance - Latest MonthTrust Performance
Date of report: 19/09/2013 Page 16 of 34

Integrated Quality and Performance Report
CQUIN No Domain IncomeTarget to Achieve 100%
PaymentQ1 Q2 Q3 Q4
Forecast to
31.3.2014Comment on Red & Amber Ratings
National 1Patient
Experience£502,400
Plan signed off by Board with
milestones and achieve all actionsG G
Regional 1 Safety £502,400Achievement between 100% and
96%R G
Work with commissioners is progressing to renegotiate
this CQUIN to focus on avoidable pressure ulcers
which are within the Trusts control and where we are
currently making a significant impact. Therefore early
indications are that this CQUIN should be achievable in
Quarter 2.
Regional 5 Effectiveness £502,400 Achieve all actions G G
CQUIN No Domain IncomeTarget to Achieve 100%
PaymentQ1 Q2 Q3 Q4
Forecast to
31.3.2014Comment on Red & Amber Ratings
MH Local 6 Safety £237,200 Achieve 70% or above G G
CHS Local 6 Safety £208,100 Achieve 90% or above G G
MH & LD Local
7Safety £474,400
Tool kit pilot in June achieved -
further details TBCG G
MH & LD Local
8
Patient
Experience£355,800 Achieve 90% or above G G
MH & LD Local
9Effectiveness £237,200 Achieve 90% or above A A
Early indications are that we are performing close to the
target for this CQUIN in Quarter 2.
This is based on early figures which indicates
performance on the 4 blood tests has improved over
Quarter 1, resulting in an indicative Amber rating at this
stage.
MH & LD Local
10
Patient
Experience£355,800 Achieve 90% or above G G
CHS Local 11 Effectiveness £416,200Roll out completed in all Q1, Q2 and
Q3 areas and 95% complianceG G
CHS Local 12 Effectiveness £208,100 Report produced meeting set criteria G G
CHS Local 13 Effectiveness £312,150 Achieve 80% and above G G
CHS Local 14 Effectiveness £312,150 Achieve all actions G G
PH Local 15Patient
Experience£156,100
Receive full report with
recommendationsG G
LAT Local 16Patient
Experience£243,600
Evidence via report on promotion of
guidelinesG G
School Nurse Communications “App”
Improving formulary adherence of emollient
prescribing amongst health visitors
Commentary:
Formal Quarter 1 CQUIN outcomes are expected during September 2013 and for Quarter 2 they are expected during December 2013.
However, outcome predictions have been provided in this IQPR and coloured blue to indicate they are provisional and data requires verification or is incomplete. Provisional performance has been
indicated with (R)ed, (A)mber or (G)reen.
See Appendix 2 for detailed CQUIN target information.
Communication physical wellbeing to primary
care from AMH & LD inpatient services:
Discharge summary to include QRISK and
blood test scores
The inpatient ward as a therapeutic space –
AMH (adult mental health)
Reviewing patient care in all CHS inpatient
settings (exc MHSOP): implementing the
Advanced Nurse Practitioner model
MSK (musculo-skeletal) physiotherapy patient
reported outcome measures
Personalised care plans for patients with long
term conditions (LTC)
Dementia Care: developing staff knowledge
and skills
The inpatient ward as a therapeutic space –
Learning Disabilities
National & Regional CQUINS 2013-14
Description
Friends and Family Test
NHS Safety Thermometer: reduction in
pressure ulcer prevalence
Making Every Contact Count
Commentary:
Formal Quarter 1 CQUIN outcomes are expected during September 2013 and for Quarter 2 they are expected during December 2013.
However, outcome predictions have been provided in this IQPR and coloured blue to indicate they are provisional and data requires verification or is incomplete. Provisional performance has been
indicated with (R)ed, (A)mber or (G)reen.
See Appendix 2 for detailed CQUIN target information.
Local CQUINS 2013-14
Description
Venous Thromboembolism (VTE) in Mental
Health Services for Older People (MHSOP)
VTE in Community Hospitals
Suicide Prevention on AMH inpatient wards at
the Bradgate Unit
Date of report: 19/09/2013 Page 17 of 34

Integrated Quality and Performance Report
Tim
elin
ess
Ce
ntr
al
Syste
m
Exec
Dire
cto
r
Sig
n o
ff
Average Length of Stay (ALoS) - Mental Health COM Monthly TBC AUG 48.2 65.9 TBC PM 62.4 9.2 77.4 21.3
Median Length of Stay (ALoS) - Mental Health TRUST Monthly AUG 18.0 21.0 18.0 PM 26 7 51 7
Average Length of Stay (ALoS) - Community hospital rehab wards TRUST Monthly AUG 25.4 22.6 25.2 PM 25.4
Average Length of Stay (ALoS) - Stroke wards (ward 1 st lukes, ward 1
Coalville)TRUST Monthly AUG 27.3 27.5 30.4 PM 27.3
Average Length of Stay (ALoS) - Mental health (ward 4 Coalville) TRUST Monthly AUG 50.8 402.0 119.9 PM 50.8
Average Length of Stay (ALoS) - City rehab beds (CICB/CRB) TRUST Monthly AUG 19.8 18.0 19.4 PM 19.8
Occupancy Rate - Mental Health TRUST Monthly <=85% AUG 92.5% 92.4% 92.2% 85.0% PM 93.5% 70.2% 92.6% 96.9%
Occupancy Rate - Community TRUST Monthly >=93% AUG 92.3% 93.6% 92.6% 93.0% PM 92.3%
% Delayed Patients (DToC) - Mental Health MON Monthly <=7.5% AUG 6.3% 6.6% 5.8% <=7.5% PM 7.7% 11.4% 4.2% 0.0%
% Delayed Patients (DToC) - Community COM Monthly <=2.12% AUG 2.55% 0.71% 1.81% <=2.12% PM 2.55%
% of Admissions Gate Kept by the Crisis Resolution & Home Treatment
TeamMON Monthly 95% AUG 97.5% 100.0% 99.3% 95% PM 97.5%
Total number of Home Treatment episodes carried out by Crisis
Resolution team year to date.COM Monthly
1895 (Year
end Target)AUG 743 643 743 1895 PM 743
% Discharge Summaries issued within 24 hours TRUST - PM
MHMDS Data Completeness: Records MON Quarterly 97% Q1 98.4% 97.6% 98.4% 97.0% PM
MHMDS Data Completeness: Outcomes MON Quarterly 50% Q1 55.3% 61.5% 55.3% 50.0% PM
** Data Quality is measured against the items below:
1) TIMELINESS:
Comments & Actions:
Mental Health Average Length of Stay: The average length of stay displayed for Mental Health & LD is the national operating framework definition, which takes data from HES and includes ALL divisions and lengths. All previous month’s figures are updated each month to allow for late entry of data.
Mental Health Bed Occupancy Rate: The trust figure does not consider that certain areas of the trust have different targets, e.g, MHSOP has a 90% target; Specialist Services represents Eating Disorders with a 80% target and INCLUDES patients on leave; CAMHS INCLUDES patients on leave; Adult
represents Adult Acute only and LD represents the Agnes Unit with a target of 95% for the 4 new Intensive Support beds but 85% otherwise. There are no Divisional targets yet set and thus cannot be RAG rated. The RAG ratings are:
Green: Actual > Target AND Actual < Target + 5%; Amber: Actual >= Target + 5% AND Actual <= Target + 10% OR Actual <= Target AND Actual >= Target - 5%; Red: Actual > Target + 10% OR Actual < Target - 5%
Occupancy Rate - Community: The occupancy rate includes the mental health ward 4 (this ward has a contracted 60% target, all other wards are 93%). Figures have been updated for the previous month to reflect true position and Intensive Community Support Beds.
% Delayed Patients (DToC) - MH: DToC information now comes directly from Maracis and manual data is no longer used.
% Delayed Patients (DToC) - Community: Community DToC figures have been revised to reflect Monitor indicator based on the Monitor rules & guidance.
Numerator: the number of non-acute patients (aged 18 and over on admission) per day under consultant and non-consultant-led care whose transfer of care was delayed during the reporting period. For example, one patient delayed for five days counts as five.
Denominator: the total number of occupied bed days (consultant-led and non-consultant-led) during the reporting period.
Delayed transfers of care attributable to social care services are included.
% of Admissions Gate Kept by the Crisis Resolution & Home Treatment Team: Calculation method amended for current and back months, all figures validated.
MHMDS Data Completeness: Records and Outcomes: From 2013/14. MHMDS submissions have move from quarterly to monthly submissions. The Overall figure is based on the monthly MHMDS extract and is always several months behind, whereas the divisional figures depict those currently held in
Maracis. The RED "Records" areas are due to issues with Marital Status data completeness, whereas the "Outcomes" is down to "Settled Accommodation" & "Paid Employment". Business Units should be made aware that even if a patient is over 69 or under 18 years old, a valid code for Settled
Accommodation and Paid Employment must be entered, even if this is "Not Stated" or "Not Known". MHMDS is assessed at patient level and should not be split by divisions.
Adult M
enta
l
He
alth
Adult L
earn
ing
Dis
ab
ilitie
s
Co
mm
un
ity
He
alth
Fa
mili
es,
Yo
ung
People
&
Ch
ildre
n
Da
ta A
s A
t
Data Quality
Exec D
irecto
r
Lead
Mo
nth
ly t
arg
et
Cu
rre
nt
Mon
th
Actu
al
Year
to D
ate
Positio
n
Sourc
e
Pre
vio
us m
onth
Year
End T
arg
et
Performance - Efficient Services
Spark
line
Trust Performance Divisional Performance - Latest Month
Re
po
rtin
g
Fre
qu
en
cy
Tra
ve
l o
n
pre
vio
us m
onth
Date of report: 19/09/2013 Page 18 of 34

Integrated Quality and Performance Report
Performance - Efficiency
0
100
200
300
400
500
600
700
800
900
Sep
Oct
No
v
Dec Jan
Feb
Mar
Ap
r
May Jun
Jul
Au
g
Day Hospital Attendances
Adult-MH CHS-MH FYPC-MH LD-MH
0
50
100
150
Sep
Oct
No
v
Dec Jan
Feb
Mar
Ap
r
May Jun
Jul
Au
g
Average Length of Stay (days) - Trust
Adult-MH CHS-MH FYPC-MH LD-MH CHS-COM
0%
20%
40%
60%
80%
100%
Sep
Oct
No
v
Dec Jan
Feb
Mar
Ap
r
May Jun
Jul
Au
g
Occupancy Rates
Adult-MH CHS-MH CHS-COM FYPC-MH LD-MH
Date of report: 19/09/2013 Page 19 of 34

Integrated Quality and Performance Report
93.1%
97.5%
93.1% 95.6%
91.3% 91.1% 92.1% 96.3%
93.4% 94.5% 91.5%
88.9% 89.8%
92.5%
94.2% 92.4% 92.5%
75%
80%
85%
90%
95%
100%
105%
110%
Apr-12 May-12 Jun-12 Jul-12 Aug-12 Sep-12 Oct-12 Nov-12 Dec-12 Jan-13 Feb-13 Mar-13
Trust Bed Occupancy - 2010-2012
Occupancy 12/13 Occupancy 2010/11 Target 12/13
Responsible Lead: Paul Farrimond Indicator Source: COM/DOH Operating Framework Comments and Actions: Targets: Eating Disorders Target for 2010/11 was 85%, Reduced to 80% from July 2010. MHSOP Target 2010/11 was 95%, Reduced to 90% from September 2010. CAMHS - 2011 On leave beds counted as admitted LD - 2011 On leave beds counted as admitted Eating Disorders 2010 On leave beds counted as admitted This may result in occupancy rates above 100%
Bed Occupancy Rate (%)
90%
93%
94%
92% 93% 93%
97%
93%
96%
91% 91% 92%
96%
93% 95%
91%
89%
75%
80%
85%
90%
95%
100%
Apr May Jun Jul Aug Sep Oct Nov Dec Jan Feb Mar
Trust Bed Occupancy - 2012-2014
Occupancy 13/14 Occupancy 12/13 Target 13/14
Responsible Lead: Paul Miller Indicator Source: COM/DOH Operating Framework Comments and Actions: Targets: to be confirmed for the current finacial year. CAMHS (FYPC) - On leave beds counted as admitted LD - On leave beds counted as admitted This may result in occupancy rates above 100%
Bed Occupancy Rate (%)
81% 83%
92%
101% 97%
91% 92% 96% 93%
81% 84%
90%
99%
85% 83% 75%
69%
30%
50%
70%
90%
110%
Apr May Jun Jul Aug Sep Oct Nov Dec Jan Feb Mar
FYPC - Occupancy 2012-2014
Occupancy 13/14 Occupancy 12/13
79% 73% 74% 77%
70%
64%
81% 71% 66% 71% 71%
69% 76% 72% 69% 67% 70%
30%
50%
70%
90%
110%
Apr May Jun Jul Aug Sep Oct Nov Dec Jan Feb Mar
Adult Learning Disabilities - Occupancy 2012-2014
Occupancy 13/14 Occupancy 12/13
98% 104%
94% 92% 94% 94% 96% 97% 96% 92% 93% 92%
96% 96% 97% 93% 94%
30%
50%
70%
90%
110%
Apr May Jun Jul Aug Sep Oct Nov Dec Jan Feb Mar
Adult Mental Health - Occupancy 2012-2014
Occupancy 13/14 Occupancy 12/13
85% 91%
95% 93% 93% 96% 92% 95% 94% 95% 92% 88%
99% 93%
97% 96%
87%
30%
50%
70%
90%
110%
Apr May Jun Jul Aug Sep Oct Nov Dec Jan Feb Mar
Community Health Services - Occupancy 2012-2014
Occupancy 13/14 Occupancy 12/13
Date of report: 19/09/2013 Page 20 of 34

Integrated Quality and Performance Report
(M11 figures/example figures)
FINANCE KPIs
YTD Target
(Budget)YTD Actual
Year end
target
Year end
forecastYTD Target YTD Actual YTD Target YTD Actual YTD Target YTD Actual YTD Target YTD Actual YTD Target YTD Actual YTD Target YTD Actual YTD Target YTD Actual
EBITDA Margin 5.1% 5.1% 5.2% 5.2%
I&E Surplus £000 (Excl. impairments) 1,126 1,126 2,903 2,903
Income (against budget) £000 107,148 107,198 262,520 262,520
Expenditure (against budget) £000 106,023 106,073 259,617 259,617
CIP achievement £000 4,165 3,738 11,831 11,087 422 367 161 90 1,332 1,332 833 782 605 529 440 265 372 373
Cash balance £000 (YTD target
= FIMS Plan)16,379 16,364 11,089 11,089
Capital Expenditure (target spend =
available funds) £0001,427 1,427 15,085 15,085
Debtors > 90 days 5.0% 6.0% 5.0% 5.0%
Creditors > 90 days 5.0% 2.3% 5.0% 5.0%
Better Payment Practice Code 95.0% 96.4% 95.0% 95.0% 95.0% 93.8% 95.0% 95.2% 95.0% 97.3% 95.0% 96.7% 95.0% 99.7% 0.0% 0.0% 95.0% 95.2%
ANNUAL MONITOR FINANCIAL RISK RATING
FRR MetricMonitor
weighting
Annual
target
Updated
annual
forecast
Annual
target
Updated
annual
forecast
EBITDA Margin (%) 25% 5.2% 5.2% 3 3
EBITDA Achieved (%) 10% 100% 100.0% 5 5
Net Return after Financing (%) 20% 2.4% 2.4% 4 4
I&E Surplus Margin (%) 20% 1.1% 1.1% 4 4
Liquidity ratio (days) 25% 26 26 4 4
Overall FRR 100% 4 4
New proposed Risk
Assessment Framework
Monitor
weightingAnnual
target
Updated
annual
forecast
Annual
target
Updated
annual
forecast
Liquidity days (%) 50% 5.7% 5.7% 4 4
Capital Service Capacity (%) 50% 3.1 x 3.1 x 4 4
RAG rules
Green: On target/exceeding target
Amber: Adverse variance - within 5% target
Red: Adverse variance - distance from target greater than 5%
METRIC TARGET FRR TARGET
Continuity of Services Risk Rating (CSSR)
Monitor proposes to use a risk rating to identify the risk of providers of Commissioner Requested Services not being a going
concern. The proposed ratings comprise two financial metrics:
Liquidity: this ratio indicates whether the provider can meet its operational cash obligations
Capital Servicing Capacity: this ratio indicates whether the provider can meet its financing obligations
CSRR SCOREMETRIC TARGETSHADOW CONTINUITY OF SERVICE RISK RATING
Performance - Finance August 2013 (MONTH 05)
TOTAL TRUST BUSINESS UNIT
HOSTEDADULT MH COMM SERVICES FYPC ENABLING RESERVESLD
0
1
2
3EBITDA Margin
I&E Surplus (Excl.impairments)
Income (against budget)
Expenditure (againstbudget)
CIP achievement
Cash balance (YTD target =FIMS Plan)
Capital Expenditure(target spend = available…
Debtors > 90 days
Creditors > 90 days
Better Payment PracticeCode
FRR
Finance Performance The Trust is reporting a net income and expenditure surplus of £1,126k at the end of Month 05. This is in line with plan. The EBITDA margin as at Month 05 is 5.1%. The forecast EBITDA margin for the year is 5.2%. Current CIP delivery is 90% of the year to date target. Divisions are working to ensure that their CIP targets are delivered by the end of the financial year, and as such this is expected to improve the percentage CIP delivery. The cash balance at the end of Month 05 is £16.4m. This is on par with the year to date plan cash figure. Debtors > 90 days have slightly increased to 6.0% in M5 compared to 5.9% in M4.
Date of report: 19/09/2013 Page 21 of 34

Integrated Quality and Performance Report
Tim
elin
ess
Centr
al
Syste
m
Exec D
irecto
r
Sig
n o
ff
Number of WTE Employed TRUST AUG 4551.3 4554.5 AD 251.9 940.3 1648.1 450.8 1074.2 186.1
% of Sickness Absence (1 month in arrears) TRUST <=4% JUL 4.3% 4.2% 4.4% <=4% AD 4.0% 5.2% 5.3% 2.6% 3.4% 1.9%
% Total Workforce Turnover including training
grade medics (Projected to Mar-14)TRUST 8-12% AUG 11.6% 9.3% 8-12% AD 6.8% 8.6% 9.7% 37.8% 9.3% 3.8%
% Vacancy Rate (1 Month in Arrears) TRUST 6-12% JUL 8.8% 9.6% 7.1 6-13% AD 5.9% 8.5% 9.1% 14.2% 8.9% 3.1%
Ratio of Bank Usage to Agency Usage TRUST <1:0.75 AUG 1: 0.97 1:0.89 1: 0.9 <1:0.75 AD 1: 0.06 1: 0.81 1: 1.31 1: 0.6 1: 2.26 1: 5.01
Number of staff at risk of redundancy TRUST AUG 13 27 AD 1 2 4 3 3 0
Number of open formal grievances TRUST AUG 7 8 8 AD 0 4 2 0 1 0
Number of open formal disciplinaries TRUST AUG 28 27 18 AD 5 9 7 7 0 0
% of staff with an appraisal/ PDR within the last 12
monthsTRUST >=80% AUG 82.4% 84.2% >=80% AD 86.4% 79.9% 85.9% 82.0% 80.8% 64.1%
% of staff trained in Core Mandatory Training TRUST >=85% AUG 93.7% 93.6% >=85% AD 92.0% 93.6% 95.3% 94.2% 93.7% 80.5%
% of Mandatory Training DNAs TRUST <=15% AUG 14.4% 12.7% <=15% AD
** Data Quality is measured against the items below:
1) TIMELINESS:
GREEN: Data is submitted in time to the central system for accurate reporting (in line with trust policies) AND data is verified and any data quality issues are resolved in time for reporting deadlines AND data is extremely unlikely to change in subsequent months.
AMBER: Action Plans are in place to ensure business processes are adapted to meet the GREEN requirements.
RED: Data is not available in a timely fashion (according to trust policies) OR Data has not been verified and data quality issues haven't been resolved OR Data is likely to change in subsequent months
2) EXTRACTED FROM A CENTRAL SYSTEM:
GREEN: ALL reported data is extracted from the SAME central system (such as Safeguard, Maracis, ESR, Finance etc)
AMBER: Action plans are in place to submit data to central systems rather than using manual processes OR action plans are available for merging multiple systems into one central system.
RED: Data is extracted from a manual system (even if only in one particular area) OR data is extracted from multiple central systems.
3) SIGNED OFF BY AN EXECUTIVE DIRECTOR
GREEN: The position of data quality items 1) and 2) have been agreed and signed off by an Executive Director
RED: The data quality position has not been agreed and signed off by an Executive Director
Adult M
enta
l
Health
Com
munity
Health
Enablin
g
Serv
ices
Fa
mili
es,
Young
People
&
Child
ren
Comments & Actions:
% of Sickness Absence (1 month in arrears):
Divisional performance RAG ratings based on division specific targets
% Total Workforce Turnover including training grade medics (Projected to Mar-14):
37.8% for Enabling Services is a result of Junior Doctors rotation and a number of fixed term contract ending.
Turnover is calculated by projecting to the end of the financial year based on the figures YTD. It is expected therefore that as we move through the year the percentage will reduce.
Year
End T
arg
et
Spark
line
Data Quality
Exec D
irecto
r
Lead
Adult L
earn
ing
Dis
abili
tie
s
Human Resources - WorkforceTrust Performance Divisional Performance - Latest Month
Sourc
e
Mo
nth
ly t
arg
et
Data
As A
t
Curr
ent
Mo
nth
Actu
al
Pre
vio
us m
onth
Tra
vel on
pre
vio
us m
onth
Year
to D
ate
Positio
n
Hoste
d S
erv
ices
Date of report: 19/09/2013 Page 22 of 34

Integrated Quality and Performance Report
Apr May Jun Jul Aug Sep Oct Nov Dec Jan Feb Mar
Number of WTE Employed 4575.2 4556.8 4546.6 4555.8 4554.5 4551.3 -5.5
Number of Headcount Employed 5286 5278 5270 5268 5298 5298 +20.0
Vacancy Rate (1 month in arrears) 6-12% 9.5% 7.1% 8.1% 9.6% 8.8% not due Estimates from Finance are available one month in arrears
% Staff From a BME Background >=18% 18.5% 17.5% 17.5% 17.5% 17.6% 17.3% -0.3%
Apr May Jun Jul Aug Sep Oct Nov Dec Jan Feb Mar
% Sickness Absence <=4% 4.7% 4.5% 4.3% 4.2% 4.3% not due 4.4% Recalculated each month
WTE Days Lost to Sickness 83747 6172 6065 5680 6158 not due 24075 Recalculated each month
% Short Term Sickness 38.5% 48.3% 34.3% 30.4% not due
% Long Term Sickness 61.5% 51.7% 65.7% 69.6% not due
Cost of Sickness (£) £480,203 £534,814 £517,024 £488,710 £547,208 not due £2,087,756 Recalculated each month
Apr May Jun Jul Aug Sep Oct Nov Dec Jan Feb Mar
% Normalised Workforce Turnover
(Rolling previous 12 months)8-12% 11.6% 11.7% 12.0% 11.9% 11.1% 11.9% All Staff rolling previous 12 months with TUPE omitted
% Total Workforce Turnover
(Rolling previous 12 months)8-12% 20.1% 20.3% 20.3% 20.2% 19.3% 20.1% All Staff rolling previous 12 months
% Total Workforce Turnover including training grade medics
(Projected to Mar-14)8-12% 20.1% 12.7% 10.5% 9.3% 9.3% 11.6% All Staff
% Turnover for Clinical Registered Staff *
(Projected to Mar-14)8-12% 12% 14.4% 10.9% 9.8% 9.8% 13.7% Nursing, S&ST, M&D, AHP, Students
% Turnover for Clinical Non Registered Staff
(Projected to Mar-14)8-12% 9.4% 10.3% 9.3% 8.9% 8.8% 8.7% Add Clinical Services
% Turnover for Non-Clinical Staff
(Projected to Mar-14)8-12% 45.7% 11.0% 10.5% 8.3% 8.7% 10.3% Admin & Estates
Stability Index 33 6 5 4 31 Leavers within 12 months
Apr May Jun Jul Aug Sep Oct Nov Dec Jan Feb Mar
Average Cost Per Head £3,067 £2,910 £3,080 £3,168 £2,966 £3,007 Total pay divided by heacount
Bank Costs £8,513,390 £675,000 £524,970 £663,390 £720,980 £768,840 £3,353,180
Bank Spend as a % of Total Employee Benefit Expenditure 4.2% 4.4% 3.2% 4.0% 4.6% 4.8% 4.2%
Agency Costs £8,711,231 £432,590 £363,660 £840,600 £642,660 £746,800 £3,026,310
Agency Spend as a % of Total Employee Benefit Expenditure 4.3% 2.8% 2.2% 5.0% 4.1% 4.7% 3.8%
Ratio of Bank Spend to Agency Spend <1:0.75 1:1.02 1:0.64 1:0.69 1:1.27 1:0.89 1: 0.97 1: 0.9
0.64 0.69 0.89 0.97 #DIV/0! #DIV/0! #DIV/0! #DIV/0! #DIV/0! #DIV/0! #DIV/0!
Apr May Jun Jul Aug Sep Oct Nov Dec Jan Feb MarNumber of Staff Affected by Change 950 571 356 332 161 117 307 YTD and 2012-13 position is average
Number of Staff at Risk of Redundancy 52 26 70 31 27 13 33 YTD and 2012-13 position is average
Number of Staff on Notice of Redundancy 26 3 52 27 25 4 22 YTD and 2012-13 position is average
Number of Staff Redeployed 438 1 37 23 2 6 69
Number of Staff Made Redundant 2 1 0 1 15 19
Number of Staff on Pay Protection 228 266 231 211 189 197 219 YTD and 2012-13 position is average
Cost of Pay Protection (£) £57,532 £47,286 £45,170 £42,568 £43,525 £236,079
Apr May Jun Jul Aug Sep Oct Nov Dec Jan Feb MarNumber of Open Formal Grievances 49 9 7 4 8 7 8
Number of Open Bullying and Harrassment Cases 22 9 9 7 8 6 2
Number of Open Formal Disciplinaries 113 33 25 27 27 28 18
Number of Open Capability Cases 37 7 8 10 9 9 4
Number of Ill Health Terminations 1 3 3 3 0 0
Number of Open Employment Tribunals 12 9 6 7 8 7 2
Number of Open Suspension Cases 25 11 6 9 11 11 11
Average Working Days Lost to Suspension 40 23 30 36 37 40 Changed from 'calendar days lost to suspension'
No. of Issues Raised through Whistleblowing 1 0 0 0 1 2
Apr May Jun Jul Aug Sep Oct Nov Dec Jan Feb Mar
% Staff Recommend LPT as a Place to Work 54% 48% 47% not due 47%
% Staff happy with Standard of Care Provided 59% 57% 61% not due 61% ie recommend as a place to receive treatment
Response Rate 26% 16% not due 16%
Apr May Jun Jul Aug Sep Oct Nov Dec Jan Feb MarAverage Time to Recruit (Weeks) <=12 16.2 15.6 18.5 16.6 18.0 17
Average Number of Applicants Per Advertised Post 23 25 23 26 17 22 22
% BME Applicants >=35% 45% 39.0% 39.1% 45.0% 52.0% 47.0% 44% BME excludes White, White Irish, White Other
BME Ratio of Appointees to Shortlisted Candidates <=1:3 1: 5.9 1: 1.28 1: 1.80 1: 3.5 1:1.3
Apr May Jun Jul Aug Sep Oct Nov Dec Jan Feb Mar
% of Consultants with an Appraisal/ PDR >=90% 94.0% 90.8% 90.8% 94.2% 92.0% 92.0%Excludes those on maternity leave, long term sickness or a new starter within the last 12
months
% of Staff with an Appraisal/ PDR >=80% 77.3% 80.1% 83.9% 85.9% 84.2% 82.4% 83.3%
% of Staff In Date with Core Mandatory Training >=85% 93.8% 93.6% 92.5% 93.3% 93.6% 93.7% 93.3% Trust policy to attend every 3 years
% of Staff In Date with Fire Safety >=85% 76.7% 79.1% 81.6% 86.8% 88.3% 88.3% 84.8%
% of Staff In Date with Information Governance >=95% 84.4% 84.8% 85.5% 88.8% 86.5% 84.5% 86.0%
% of Staff In Date with All Other Mandatory Training >=85% 61.6% 65.0% 78.6% 81.8% 80.4% 73.5%
% of Spaces on Mandatory Training that were Booked >=85% 77.5% 59.0% 82.2% 54.5% 68.2% 68.3%
% of Mandatory Training DNAs <=15% 15.9% 14.0% 13.2% 13.0% 12.7% 14.4% 13.5%
% of New Starters in who Attended Trust Induction Day Within their
First 4 Weeks>=95% 96.7% 90.2% 100.0% 100.0% 64.5% 90.3%
YTD
PositionComments
* includes trainee clinical psychologists on rotation. These staff changed division mid year resulting in fluctuating turnover rates.
YTD
AverageLearning and Development Target
2012-13
Position
2013-14Sparkline
Bank/ Agency and Pay Target2012-13
Position
2013-14Sparkline
CommentsSickness Absence (1 month in arrears) Target2012-13
Position
2013-14Sparkline
YTD
Position
HR Workforce Extended Metrics Data
Workforce Profile Target2012-13
Position
2013-14Sparkline
YTD
ChangeComments
Organisational Change Target2012-13
Position
2013-14Sparkline
Employee Relations Target2012-13
Position
2013-14Sparkline
2013-14Sparkline
YTD
PositionComments
Distinct
no. of Comments
Comments
Comments & Actions:
2012-13 Position - Where available this is the 2012-13 YTD actual/ average position, otherwise it is the 2012-13 out-turn figure
YTD
AverageComments
Recruitment Target2012-13
Position
2013-14Sparkline
YTD
AverageComments
Employee Engagement Target2012-13
Position
YTD
PositionCommentsStaff Turnover Target
2012-13
Position
2013-14Sparkline
Date of report: 19/09/2013 Page 23 of 34

Integrated Quality and Performance Report
Tim
elin
ess
Ce
ntr
al S
yste
m
Exe
c D
ire
cto
r S
ign
off
Younger Persons Memory Clinic COM Monthly (In arrears) Maracis JUL 11 weeks TBC 12 8 60.0% 40.0% PM
Older Persons - Day Care COM Monthly (In arrears) Maracis JUL 4 Weeks TBC 14 1 93.3% 93.3% PM
Older Persons - Community
Teams COM Monthly (In arrears) Maracis JUL
High Priority 4
weeksTBC 15 0 100.0% 87.5% PM
Older Persons - Community
Teams COM Monthly (In arrears) Maracis JUL Routine 6 weeks TBC 112 38 74.7% 80.9% PM
Older Persons - Outpatients COM Monthly (In arrears) Maracis JULHigh Priority 4
weeksTBC 16 3 84.2% 100.0% PM
Older Persons - Outpatients COM Monthly (In arrears) Maracis JUL Routine 6 weeks TBC 52 21 71.2% 70.6% PM
Older Persons - Memory Clinic COM Monthly (In arrears) Maracis JULHigh Priority 4
weeksTBC 2 3 40.0% 83.3% PM
Older Persons - Memory Clinic COM Monthly (In arrears) Maracis JUL Routine 6 weeks TBC 54 75 41.9% 40.1% PM
MSK Physiotherapy: Routine COM Monthly (In arrears) Tiara JUL 4 Weeks TBC 116 1209 8.8% 12.2% PM
MSK Physiotherapy: Urgent COM Monthly (In arrears) Tiara JUL 5 Days TBC 319 305 51.1% 46.0% PM
Podiatry - Routine COM Monthly (In arrears) Tiara JUL 4 Weeks Mar-14 377 907 29.4% 27.8% PM
Podiatry - Urgent COM Monthly (In arrears) Tiara JUL 5 Days Mar-14 19 9 67.9% 58.6% PM
Speech Therapy: Routine COM Monthly (In arrears) Tiara JUL 4 Weeks Apr-13 50 31 61.7% 62.9% PM
Speech Therapy: Urgent COM Monthly (In arrears) Tiara JUL 2 Weeks Apr-13 30 29 50.8% 53.9% PM
Intermediate Care & Domicilary
TherapyCOM Monthly (In arrears) SystmOne JUL TBC TBC PM
Long Term Conditions:
Acute 24 hour COM Monthly (In arrears) SystmOne JUL 24 Hours TBC 5 5 50.0% 75.0% PM
End of life 2 weeks COM Monthly (In arrears) SystmOne JUL 2 Weeks TBC 2 100.0% N/A PM
Patient's co-operation COM Monthly (In arrears) SystmOne JULPatient's
InitiatedTBC 14 0.0% 0.0% PM
Post discharge 5 working
daysCOM Monthly (In arrears) SystmOne JUL 5 Days TBC 1 0.0% 94.4% PM
Routine 4 weeks COM Monthly (In arrears) SystmOne JUL 4 Weeks TBC 157 47 77.0% 59.4% PM
Urgent opinion 2 weeks COM Monthly (In arrears) SystmOne JUL 2 Weeks TBC 2 6 25.0% 47.3% PM
Waiting Times Compliance - Community Health ServicesTrust Performance
So
urc
e
Re
po
rtin
g F
req
ue
ncy
Da
ta S
ou
rce
Da
ta A
s A
t
Ta
rge
t W
aitin
g T
ime
Ta
rge
t A
ch
ieve
me
nt
Mo
nth
Sp
ark
line
Data Quality
Exe
c D
ire
cto
r L
ea
d
No
of P
atie
nts
With
in
Ta
rge
t
No
of P
atie
nts
Ou
tsid
e
Ta
rge
t
Cu
rre
nt M
on
th A
ctu
al
Pre
vio
us m
on
th
Tra
ve
l o
n p
revio
us
mo
nth
Date of report: 19/09/2013 Page 24 of 34

Integrated Quality and Performance Report
Falls - therapy services COM Monthly (In arrears) SystmOne JUL TBC TBC PM
Rapid Intervention Team: COM Monthly (In arrears) SystmOne JUL TBC TBC PM
County Continence: COM Monthly (In arrears) SystmOne JUL TBC TBC PM
City Specialist Continence:
Routine COM Monthly (In arrears) SystmOne JUL 10 Days Oct-14 0 23 0.0% 0.0% PM
Comments & Actions:
Waiting time performance reporting for all services is based on the number of patients that received treatment in the month and the percentage of those completed waits that were within the target waiting time. The
agreement with commissioners requires revised waiting time targets to be met from a certain month in the 2013/14 year and these ‘target achievement months’ are listed next to the target waiting time. Some target
months haven't yet been agreed with commissioners and are marked as ‘to be confirmed’ (TBC).
Figures are subject to change due to validation.
** Data Quality is measured against the items below:
1) TIMELINESS:
GREEN: Data is submitted in time to the central system for accurate reporting (in line with trust policies) AND data is verified and any data quality issues are resolved in time for reporting deadlines AND data is extremely unlikely to change
in subsequent months.
AMBER: Action Plans are in place to ensure business processes are adapted to meet the GREEN requirements.
RED: Data is not available in a timely fashion (according to trust policies) OR Data has not been verified and data quality issues haven't been resolved OR Data is likely to change in subsequent months
2) EXTRACTED FROM A CENTRAL SYSTEM:
GREEN: ALL reported data is extracted from the SAME central system (such as Safeguard, Maracis, ESR, Finance etc)
AMBER: Action plans are in place to submit data to central systems rather than using manual processes OR action plans are available for merging multiple systems into one central system.
RED: Data is extracted from a manual system (even if only in one particular area) OR data is extracted from multiple central systems.
3) SIGNED OFF BY AN EXECUTIVE DIRECTOR
GREEN: The position of data quality items 1) and 2) have been agreed and signed off by an Executive Director
RED: The data quality position has not been agreed and signed off by an Executive Director
Date of report: 19/09/2013 Page 25 of 34

Integrated Quality and Performance Report
Tim
elin
ess
Ce
ntr
al
Syste
m
Exe
c
Dir
ecto
r
Sig
n o
ff
LD - Community Teams COMMonthly (In
arrears)Marcis JUL 8 weeks Mar-14 64 21 75.3% 85.3% PM
Assertive Outreach COMMonthly (In
arrears)Maracis JUL 6 weeks Jul-13 1 0 100.0% 100.0% PM
Personality Disorders COMMonthly (In
arrears)Maracis JUL
13 weeks to
assessmentJul-13 21 0 100.0% 100.0% PM
Dynamic Psychotherapy COMMonthly (In
arrears)Maracis JUL
13 weeks to
assessmentJul-13 5 0 100.0% 100.0% PM
Liaison - Perinatal Outpatient & Community COMMonthly (In
arrears)Maracis JUL
4 weeks to
treatmentSep-13 19 2 90.5% 92.9% PM
Liaison - Psycho Oncology COMMonthly (In
arrears)Maracis JUL
4 weeks to
treatmentJun-13 23 0 100.0% 96.3% PM
Liaison - Psychiatry COMMonthly (In
arrears)Maracis JUL
13 weeks to
treatmentJul-13 29 2 93.5% 100.0% PM
Cognitive Behavioural Therapy COMMonthly (In
arrears)Maracis JUL
13 weeks to
assessmentApr-13 26 0 100.0% 100.0% PM
Forensic - Community and Out Patients COMMonthly (In
arrears)Maracis JUL
8 weeks to
assessmentSep-13 13 1 92.9% 100.0% PM
Adult General Psychiatry - Community Mental Health
Teams and Outpatients - TreatmentCOM
Monthly (In
arrears)Maracis JUL
6 weeks to
treatmentMar-14 212 103 67.3% 70.8% PM
Mett Day Centre and Linnaeus Nursery COMMonthly (In
arrears)Maracis JUL 4 weeks Mar-14 33 3 91.7% 85.7% PM
Homeless Service COMMonthly (In
arrears)Maracis JUL
1 week to
assessmentJul-13 24 2 92.3% 90.9% PM
Adult ADHD Service COMMonthly (In
arrears)Maracis JUL
18 weeks to
treatmentDec-13 8 4 66.7% 64.3% PM
Huntington's Disease COMMonthly (In
arrears)Maracis JUL
4 weeks to
assessmentApr-13 1 0 100.0% 100.0% PM
Aspergers Assessment COMMonthly (In
arrears)Maracis JUL 13 weeks Dec-13 16 0 100.0% N/A PM
Acute Assessment Service:
2 Hours Emergency COMMonthly (In
arrears)Maracis JUL 2 Hours TBC 104 10 91.2% 86.5% PM
4 Hours Crisis COMMonthly (In
arrears)Maracis JUL 4 Hours TBC 25 5 83.3% 94.9% PM
72 Hours Urgent COMMonthly (In
arrears)Maracis JUL 72 Hours TBC 228 15 93.8% 96.2% PM
Deliberate Self Harm Team COMMonthly (In
arrears)Maracis JUL 2 Hours TBC 27 1 96.4% 94.3% PM
Waiting Times Compliance - Adult Mental Health Services and Learning DisabilitiesTrust Performance
So
urc
e
Re
po
rtin
g
Fre
qu
en
cy
Da
ta S
ou
rce
Da
ta A
s A
t
Ta
rge
t W
aitin
g
Tim
e
Ta
rge
t
Ach
ieve
me
nt
Mo
nth
** Data Quality is measured against the items below:
1) TIMELINESS:
GREEN: Data is submitted in time to the central system for accurate reporting (in line with trust policies) AND data is verified and any data quality issues are resolved in time for reporting deadlines AND data is extremely unlikely to change in subsequent months.
AMBER: Action Plans are in place to ensure business processes are adapted to meet the GREEN requirements.
RED: Data is not available in a timely fashion (according to trust policies) OR Data has not been verified and data quality issues haven't been resolved OR Data is likely to change in subsequent months
2) EXTRACTED FROM A CENTRAL SYSTEM:
GREEN: ALL reported data is extracted from the SAME central system (such as Safeguard, Maracis, ESR, Finance etc)
AMBER: Action plans are in place to submit data to central systems rather than using manual processes OR action plans are available for merging multiple systems into one central system.
RED: Data is extracted from a manual system (even if only in one particular area) OR data is extracted from multiple central systems.
3) SIGNED OFF BY AN EXECUTIVE DIRECTOR
GREEN: The position of data quality items 1) and 2) have been agreed and signed off by an Executive Director
RED: The data quality position has not been agreed and signed off by an Executive Director
Sp
ark
line
Data Quality
Exe
c D
ire
cto
r
Le
ad
No
of P
atie
nts
With
in T
arg
et
No
of P
atie
nts
Ou
tsid
e T
arg
et
Cu
rre
nt M
on
th
Actu
al
Pre
vio
us m
on
th
Tra
ve
l o
n
pre
vio
us m
on
th
Comments & Actions:
Waiting time performance reporting for all services is based on the number of patients that received treatment in the month and the percentage of those completed waits that were within the target waiting time. The agreement with
commissioners requires revised waiting time targets to be met from a certain month in the 2013/14 year and these ‘target achievement months’ are listed next to the target waiting time. Some target months haven't yet been agreed with
commissioners and are marked as ‘to be confirmed’ (TBC).
Figures are subject to change due to validation.
Date of report: 19/09/2013 Page 26 of 34

Integrated Quality and Performance Report
Tim
elin
ess
Ce
ntr
al
Syste
m
Exe
c
Dir
ecto
r
Sig
n o
ff
Eating Disorders Out Patients COMMonthly (In
arrears)Maracis JUL 13 Weeks Apr-13 16 0 100.0% 100.0% PM
CAMHS- Outpatient & Community
(Routine)COM
Monthly (In
arrears)Maracis JUL 13 Weeks TBC 192 43 81.7% 83.3% PM
CAMHS- Outpatient & Community
(Urgent)COM
Monthly (In
arrears)Maracis JUL 4 Weeks TBC 8 0 100.0% 100.0% PM
CAMHS - Young People Team COMMonthly (In
arrears)Maracis JUL 13 Weeks Apr-13 20 1 95.2% 88.2% PM
CAMHS - Learning Disability Service COMMonthly (In
arrears)Maracis JUL 18 weeks Apr-13 9 0 100.0% 95.8% PM
CAMHS - Paediatric Psychology COMMonthly (In
arrears)Maracis JUL 18 weeks TBC 11 8 57.9% 70.0% PM
Childrens Dietetics COMMonthly (In
arrears)Tiara JUL
18 weeks to
treatmentJul-13 61 3 95.3% 98.6% PM
Childrens OT COMMonthly (In
arrears)SystmOne JUL
18 weeks to
treatmentApr-13 58 0 100.0% 100.0% PM
Childrens Physio COMMonthly (In
arrears)SystmOne JUL
18 weeks to
treatmentApr-13 47 1 97.9% 100.0% PM
Childrens SALT COMMonthly (In
arrears)SystmOne JUL
18 weeks to
treatmentApr-13 284 5 98.3% 98.0% PM
GUM COMMonthly (In
arrears)Lille JUL 48 Hours TBC 231 0 100.0% 100.0% PM
PIER COMMonthly (In
arrears)Maracis JUL 4 Weeks Apr-13 28 0 100.0% 65.2% PM
Paediatrics COMMonthly (In
arrears)SystmOne JUL RTT 18 weeks Jul-13 115 13 89.8% 88.6% PM
Audiology COMMonthly (In
arrears)SystmOne JUL
Routine
Assessment -
6 Weeks
Apr-13 N/A 0.0% PM
Stop Smoking Service COMMonthly (In
arrears)TBC JUL TBC TBC N/A 0.0% PM
Domiciliary Visits (Urgent) COMMonthly (In
arrears)TBC JUL 1 Week TBC N/A 0.0% PM
Domiciliary Visits (Routine) COMMonthly (In
arrears)TBC JUL 4 Weeks TBC N/A 0.0% PM
Weight Management Groups COMMonthly (In
arrears)TBC JUL 18 Weeks TBC N/A 0.0% PM
Waiting Times Compliance - Families, Young People and Children servicesTrust Performance
So
urc
e
Re
po
rtin
g
Fre
qu
en
cy
Da
ta S
ou
rce
Da
ta A
s A
t
Ta
rge
t W
aitin
g
Tim
e
Ta
rge
t
Ach
ieve
me
nt
Mo
nth
No
of P
atie
nts
With
in T
arg
et
No
of P
atie
nts
Ou
tsid
e T
arg
et
Cu
rre
nt M
on
th
Actu
al
Pre
vio
us m
on
th
Tra
ve
l o
n
pre
vio
us m
on
th
Sp
ark
line
Data Quality
Exe
c D
ire
cto
r
Le
ad
TBC
TBC
Comments & Actions:
Waiting time performance reporting for all services is based on the number of patients that received treatment in the month and the percentage of those completed waits that were within the target waiting time. The agreement
with commissioners requires revised waiting time targets to be met from a certain month in the 2013/14 year and these ‘target achievement months’ are listed next to the target waiting time. Some target months haven't yet been
agreed with commissioners and are marked as ‘to be confirmed’ (TBC).
Figures are subject to change due to validation.
** Data Quality is measured against the items below:
1) TIMELINESS:
GREEN: Data is submitted in time to the central system for accurate reporting (in line with trust policies) AND data is verified and any data quality issues are resolved in time for reporting deadlines AND data is extremely unlikely to change in
subsequent months.
AMBER: Action Plans are in place to ensure business processes are adapted to meet the GREEN requirements.
RED: Data is not available in a timely fashion (according to trust policies) OR Data has not been verified and data quality issues haven't been resolved OR Data is likely to change in subsequent months
2) EXTRACTED FROM A CENTRAL SYSTEM:
GREEN: ALL reported data is extracted from the SAME central system (such as Safeguard, Maracis, ESR, Finance etc)
AMBER: Action plans are in place to submit data to central systems rather than using manual processes OR action plans are available for merging multiple systems into one central system.
RED: Data is extracted from a manual system (even if only in one particular area) OR data is extracted from multiple central systems.
3) SIGNED OFF BY AN EXECUTIVE DIRECTOR
GREEN: The position of data quality items 1) and 2) have been agreed and signed off by an Executive Director
RED: The data quality position has not been agreed and signed off by an Executive Director
TBC
TBC
TBC
Date of report: 19/09/2013 Page 27 of 34

Integrated Quality and Performance Report
Appendix 1: IQPR Change Log
DateIndicator
Code
Indicator Description Requested by Change
QSC.02 Total Harm Events reported Quality Indicator removed and replaced with QSC.14 Incident Rate indicator
QSC.02 % Harm caused from patient accidents Quality Indicator removed and replaced with QSC.14 Incident Rate indicator
QSC.02 % Harm caused from clinical incidents Quality Indicator removed and replaced with QSC.14 Incident Rate indicator
QSC.02 % Harm caused from violent incidents Quality Indicator removed and replaced with QSC.14 Incident Rate indicator
MSP.13 Maximum time of 18 weeks from point of referral to treatment in aggregate (non-admitted, incomplete pathways) Monitor Indicator added
MSP.04 Stroke indicator (Community) Monitor Indicator not in 12/13 schedule
MSP.14 Data Completeness: Community Services (Referral to Treatment Information) Monitor Indicator added
MSP.15 Data Completeness: Community Services (Referral Information) Monitor Indicator added
MSP.16 Data Completeness: Community Services (Treatment Activity Information) Monitor Indicator added
MSP.17 Data Completeness: Community Services (Patient Identifier Information) - may be included later in 2012/13 Monitor Indicator added
MSP.18 Data Completeness: Community Services (Patients Dying at Home/Care Home Information) - may be included later in
2012/13
Monitor Indicator added
QSC.16 PST: Pressure Ulcer Harms FPC Indicator added
QSC.17 PST: Falls Harms FPC Indicator added
QSC.18 PST: Catheter UTI Harms FPC Indicator added
QSC.19 PST: VTE Harms FPC Indicator added
QPS.09 Net Promoter Score: Total Discharges Quality Indicator added
QPS.10 Net Promoter Score: Cards Returned Quality Indicator added
QPS.11 Net Promoter Score: Return Rate Quality Indicator added
QPS.08 Net Promoter Score: Overall Score Quality Indicator renamed to bring it into line with new requirements
PW.14 % of staff with an appraisal within the last 12 months WOD New workforce indicator added
PW.15 Trust training expenditure (as a % of Trust income) WOD New workforce indicator added
PW.16 Number of internal training days made available WOD New workforce indicator added
PW.17 Number of internal training days attended WOD New workforce indicator added
PW.18 % of new starters in last 12 months who have attended Trust Induction Day within their first 6 weeks WOD New workforce indicator added
PW.19 % of staff trained in Core Mandatory Workshop WOD New workforce indicator added
PW.20 % of staff trained in Information Governance Training WOD New workforce indicator added
PW.21 % of staff trained in Fire Safety WOD New workforce indicator added
PW.22 Average number of training days attended per employee WOD New workforce indicator added
PW.23 % of staff with a qualification at a minimum of level 2 (Skills Pledge) WOD New workforce indicator added
PW.24 % Internal training attendance rate WOD New workforce indicator added
PW.15 Trust training expenditure (as a % of Trust income) WOD Indicator retired from Summary Dashboard to allow focus on April 2012 new
Workforce metrics
PW.16 Number of internal training days made available WOD Indicator retired from Summary Dashboard to allow focus on April 2012 new
Workforce metrics
PW.17 Number of internal training days attended WOD Indicator retired from Summary Dashboard to allow focus on April 2012 new
Workforce metrics
PW.18 % of new starters in last 12 months who have attended Trust Induction Day within their first 6 weeks WOD Indicator retired from Summary Dashboard to allow focus on April 2012 new
Workforce metrics
PW.20 % of staff trained in Information Governance Training WOD Indicator retired from Summary Dashboard to allow focus on April 2012 new
Workforce metrics
PW.21 % of staff trained in Fire Safety WOD Indicator retired from Summary Dashboard to allow focus on April 2012 new
Workforce metrics
PW.22 Average number of training days attended per employee WOD Indicator retired from Summary Dashboard to allow focus on April 2012 new
Workforce metrics
PW.23 % of staff with a qualification at a minimum of level 2 (Skills Pledge) WOD Indicator retired from Summary Dashboard to allow focus on April 2012 new
Workforce metrics
April 2012
May 2012
Date of report: 19/09/2013 Appendix 1

Integrated Quality and Performance Report
PW.25 Number of WTE Employed WOD Indicator added to Summary Dashboard to bring focus on April 2012 new Workforce
metric
PW.26 % of Sickness Absence WOD Indicator added to Summary Dashboard to bring focus on April 2012 new Workforce
metric
PW.27 % of total workforce turnover (including training grade medics) WOD Indicator added to Summary Dashboard to bring focus on April 2012 new Workforce
metric
PW.28 Bank & Agency Spend as a % of pay bill WOD Indicator added to Summary Dashboard to bring focus on April 2012 new Workforce
metric
PW.29 Number of staff at risk of redundancy WOD Indicator added to Summary Dashboard to bring focus on April 2012 new Workforce
metric
PW.30 Number of open formal grievances WOD Indicator added to Summary Dashboard to bring focus on April 2012 new Workforce
metric
PW.31 Number of open formal disciplinaries WOD Indicator added to Summary Dashboard to bring focus on April 2012 new Workforce
metric
QSC.14 Total incidents reported (Presure Sore) EPR Added New Indicator
QSC.15 Total incidents reported (Other) EPR Added New Indicator
- CPA Benchmarking FPC New tab added
PW.27 % of total workforce turnover (including training grade medics) WOD Indicator target revised
PW.28 Bank & Agency Spend as a % of pay bill WOD Indicator target revised
QSC.22a Non-Compliance with Essential Standards resulting in a Major Impact on Patients QAC Indicator added to support SOM submission
QSC.22b Non-Compliance with CQC Essential Standards resulting in Enforcement Action QAC Indicator added to support SOM submission
- Trend Sparklines implemented for financial year to date Monitor Trend Sparklines implemented for financial year to date against KPI's
- Quarterly GRR and Forecast GRR Monitor Quarterly GRR and Forecast GRR added to Monitor Service Performance tab
QES.12a Chlamydia Screening service - Number of screens for 15-24 year olds FPC The indicator target for City has been revised to 8028 screens for the year 12/13.
QES.13a Chlamydia Positive Screens- Number of positive screens for 15-24 year olds - CITY FPC This indicator has been included into the report as indicated in the August IQPR - City
target confirmed
QES.13b Chlamydia Positive Screens- Number of positive screens for 15-24 year olds - COUNTY FPC This indicator has been included into the report as indicated in the August IQPR -
County target yet to confirmed
QEFS_13 Added Average Length of Stay (ALoS) - Community hospital rehab wards WL
QEFS_14 Added Average Length of Stay (ALoS) - Stroke wards (ward 1 st lukes, ward 1 Coalville) WL
QEFS_15 Added Average Length of Stay (ALoS) - Mental health (ward 4 Coalville) WL
QEFS_16 Added Average Length of Stay (ALoS) - City rehab beds (CICB/CRB) WL
QSC.22b Non-Compliance with CQC Essential Standards requiring improvements WL This indicator has been included on the Summary of Performance against Monitor
Targets page
- Appendix 2: CQUIN Achievement Targets FPC New tab added
PW.32 Ratio of Bank Usage to Agency Usage WOD New indicator
PW.33 % of total workforce turnover including training grade medics (Cumulative annualised) WOD New indicator
PW.34 % Vacancy Rate WOD Target revised from 6-13% to 6-12%
PW.28 Bank & Agency Spend as a % of pay bill WOD This indicator has been superseeded by indicator PW.32
PW.24 % Internal Training Attendance Rate WOD This indicator has been superseeded by indicator PW.33
- Governance Concern Score FPC New page added to shadow the Monitor Governance Concern Score
- Appendix 3: CQUIN Achievement Targets 2013-2014 FPC New sheet added
- Waiting Times Compliance-CHS Trust Board New tab added
- Waiting Times Compliance-AMHS Trust Board New tab added
- Waiting Times Compliance-FYPC Trust Board New tab added
QPS_2 Mixed sex sleeping accommodation breaches QAC Indicator description updated to include 'sleeping accommodation breaches'
PW.27 % Total Workforce Turnover including training grade medics (Projected 12 months) WOD Indicator description updated
- Staff Turnover WOD Revision of Staff Turnover indicators on the HR Workforce Extended Metrics Data
page
October 2012
September 2012
May 2012
June 2012
July 2012
August 2012
July 2013
May 2013
December 2012
April 2013
Date of report: 19/09/2013 Appendix 1

Integrated Quality and Performance Report
% Normalised Workforce Turnover (Rolling previous 12 months) WOD New indicator added in the 'HR Workforce (Extended Metrics) tab
% of Consultants with an Appraisal/ PDR WOD Addition of target and RAG for this indicatorAugust 2013
Date of report: 19/09/2013 Appendix 1

Integrated Quality and Performance Report
Appendix 2: CQUIN Achievement Targets 2013-2014
CQUIN No CQUIN Detail QuarterQuarterly
PaymentsReporting Date 100% 50% 0%
National 1 Family and Friends Test
Evidence sign off by Board & Implementation plan with Q2, Q3
and Q4 milestones Q1 £23,720 September
Plan signed off by Board with
milestones for Q2, Q3 and Q4.
Milestones to be RAG rated
N/A No plan
Q2 milestones achieved Q2 £71,160 DecemberAchieve all actions
Achieve all high and medium Q2
actions
High and medium actions not
achieved
Q2 & Q3 milestones achieved Q3 £71,160 March
Q2 & Q3 actions achievedQ2 all actions achieved & Q3 high and
medium actions achieved
Not achieved Q2 actions and Q3 high
and medium actions not achieved
All milestones achieved Q4 £71,160 May
All actions achievedQ2 & Q3 all actions achieved & Q3
high and medium actions achieved
Not achieved Q2 & Q3 actions and
Q4 high and medium actions not
achieved
National 2 NHS Safety Thermometer- MHSOP & CHS services only
Pump priming funding Q1 £61,377 SeptemberAutomatic achievement at month 1 N/A N/A
15% reduction on baseline set Q1 £43,955 September
15% reduction on baseline set Q2 £43,955 December
30% reduction on baseline set Q3 £43,955 March
30% reduction on baseline set Q4 £43,955 May
Regional 5 Making Every Contact Counts
Agreed implementation plan with targets and deliverables for
Q2 to Q4 Q1 £94,880 September
Implementation plan developed and
agreedN/A No implementation plan
Achieve targets and deliverables Q2 Q2 £47,440 DecemberAchieve all Q2 actions
Achieve all high and medium Q2
actionsActions not achieved for Q2
Achieve targets and deliverables Q3 Q3 £47,440 MarchAchieve all actions Achieve all high and medium actions Actions not achieved
Achieve targets and deliverables Q4 Q4 £47,440 MayAchieve all actions Achieve all high and medium actions Actions not achieved
MH Local 6 VTE - MHSOP
20% for VTE assessment and prophylaxis Q1 £59,300 September Achieve 20% or above Achieve between 15% and 19% Below 15%
40% for VTE assessment and prophylaxis Q2 £59,300 December Achieve 40% or above Achieve between 35% and 39% Below 35%
60% for VTE assessment and prophylaxis Q3 £59,300 March Achieve 60% or above Achieve between 55% and 59% Below 55%
70% for VTE assessment and prophylaxis Q4 £59,300 May Achieve 70% or above Achieve between 65% and 69% Below 65%
CHS Local 6 VTE - Community Hospitals
60% for VTE assessment and prophylaxis Q1 £52,025 September Achieve 60% or above Achieve between 55% and 59% Below 55%
70% for VTE assessment and prophylaxis Q2 £52,025 December Achieve 70% or above Achieve between 65% and 69% Below 65%
80% for VTE assessment and prophylaxis Q3 £52,025 March Achieve 80% or above Achieve between 75% and 79% Below 75%
90% for VTE assessment and prophylaxis Q4 £52,025 May Achieve 90% or above Achieve between 85% and 89% Below 85%
Achievement Target % of Payment
Date of report: 19/09/2013 Appendix 3

Integrated Quality and Performance Report
MH & LD Local 7
Suicide Prevention on AMH inpatient wards at the Bradgate
Unit
Pilot tool kit June 2013 Q1 £47,440 September Tool kit pilot in June achieved Develop tool kit Tool kit not developed
Baseline data with action plan and targets for Q3 and Q4.
Targets to be agreed with Commissioners Q2 £47,440 December
Action plan with suggested targets
producedN/A No action plan with targets produced
Q3 target to be set once Q2 baseline data received Q3 £189,760 MarchTo be confirmed after targets Q2 set To be confirmed after targets Q2 set To be confirmed after targets Q2 set
Q4 target to be set once Q2 baseline data received Q4 £189,760 MayTo be confirmed after targets Q2 set To be confirmed after targets Q2 set To be confirmed after targets Q2 set
MH & LD Local 8
The inpatient ward as a therapeutic space – Learning
Disabilities
To set up activities and develop the database to record activity
and record baselines Q1 £35,580 SeptemberAchieve recording baselines
Set up activities and establish
databaseNot achieved 50% payment
50 % of patients offered an activity session 5 times a week Q2 £106,740 DecemberAchieve 50% or above Achieve between 40% and 49% Below 40%
75 % of patients offered an activity session 5 times a week Q3 £106,740 MarchAchieve 75% or above Achieve between 65% and 74% Below 65%
90 % of patients will have been offered an activity session 5
times a week Q4 £106,740 MayAchieve 90% or above Achieve between 80% and 89% Below 80%
MH & LD Local 9
Communicating physical wellbeing to primary care from AMH
& LD Inpatient services
Percentage of eligible patients who have QRISK and metabolic
screening communicated to GP each quarter
· Q1 – 70% Q1 £59,300 September Achieve 70% or above Achieve between 60% and 69% Below 60%
· Q2 – 75% Q2 £59,300 December Achieve 75% or above Achieve between 70% and 74% Below 70%
· Q3 – 85% Q3 £59,300 March Achieve 85% or above Achieve between 76% and 84% Below 75%
· Q4 – 90% Q4 £59,300 May Achieve 90% or above Achieve between 85% and 89% Below 85%
MH & LD Local 10
The inpatient ward as a therapeutic space - AMH Bradgate
Mental Health Unit inpatient wards, The Willows and Stewart
House
To set up activities and develop a database to record activity
and record baselines (3 requirements) Q1 £35,580 SeptemberAchieve all 3 requirements Achieve 2 requirements Achieve 1 requirements
50 % of patients offered an activity session 5 times a week Q2 £106,740 DecemberAchieve 50% or above Achieve between 40% and 49% Below 40%
75 % of patients offered an activity session 5 times a week Q3 £106,740 MarchAchieve 75% or above Achieve between 65% and 74% Below 65%
90 % of patients will have been offered an activity session 5
times a week Q4 £106,740 MayAchieve 90% or above Achieve between 80% and 89% Below 80%
Date of report: 19/09/2013 Appendix 3

Integrated Quality and Performance Report
CHS Local 11
Reviewing patient care in all CHS inpatient settings (excluding
MHSOP)
Roll out Rutland, Ashby and City Q1 £83,240 September
Roll out to 3 identified inpatient
settings
Roll out to 2 identified inpatient
settings
Roll out to 1 identified inpatient
settings
Roll out to Loughborough and Melton Q2 £83,240 December
Roll out achieved at 3 Q1 areas and 2
Q2 inpatient settings
Roll out achieved at 3 Q1 areas and 1
Q2 inpatient settings
Roll out achieved at 3 Q1 areas and 0
Q2 inpatient settings
Roll out to Hinckley and Bosworth, Coalville, Feilding Palmer,
Market Harborough and City Ward 2 (new Ward) Q3 £83,240 March
Roll out achieved at 5 Q1 & Q2 areas
and 5 Q3 inpatient settings
Roll out achieved at 5 Q1 & Q2 areas
and 4 or 3 Q3 inpatient settings
Roll out achieved at 5 Q1 & Q2 areas
and below 3 Q3 inpatient settings
95% compliance Q4 £166,480 May
Roll out completed in all Q1, Q2 and
Q3 areas and 95% compliance
Roll out completed in all Q1, Q2 and
Q3 areas and between 85 % and 94%
compliance
Roll out completed in all Q1, Q2 and
Q3 areas and below 85 % compliance
CHS Local 12 MSK
3 Outcomes to be introduced and establish baseline for 3
PROMs Q1 £20,810 September
Report produced meeting set criteria
Evidence on introduction of PROMs
and continued collection of 2012/13
PROMS data but no report
No evidence produced to support
introduction of PROMs and/or proof
of continued data collection of
PROMs data
Introduce outcome 4 and report on PROMs Q2 £62,430 December
Report produced meeting set criteria
Evidence on introduction of PROMs
and continued collection of 2012/13
PROMS data but no report
No evidence produced to support
introduction of PROMs and/or proof
of continued data collection of
PROMs data
Introduce outcome 5 and report on PROMs Q3 £62,430 March
Report produced meeting set criteria
Evidence on introduction of PROMs
and continued collection of 2012/13
PROMS data but no report
No evidence produced to support
introduction of PROMs and/or proof
of continued data collection of
PROMs data
Introduce outcome 6 and report on PROMs Q4 £62,430 May
Report produced meeting set criteria
Evidence on introduction of PROMs
and continued collection of 2012/13
PROMS data but no report
No evidence produced to support
introduction of PROMs and/or proof
of continued data collection of
PROMs data
CHS Local 13 Personalised Care Plans for LTC
75% of patients offered a PCP Q1 £37,458 September Achieve 75% or above Achieve between 65% and 74% Below 65%
Of the completed PCP 60% having all quality indicators
completed Q1 £40,580 SeptemberAchieve 60% and above Achieve between 50% and 59% Below 50%
78% of patients offered a PCP Q2 £37,458 December Achieve 78% or above Achieve between 77% and 75% Below 75%
Of the completed PCP 65% having all quality indicators
completed Q2 £40,580 DecemberAchieve 65% and above Achieve between 60% and 64% Below 60%
82% of patients offered a PCP Q3 £37,458 March Achieve 82% or above Achieve between 81% and 78% Below 78%
Of the completed PCP 70% having all quality indicators
completed Q3 £40,580 MarchAchieve 70% and above Achieve between 65% and 69% Below 65%
85% of patients offered a PCP Q4 £37,458 May Achieve 85% or above Achieve between 82% and 84% Below 82%
Of the completed PCP 80% having all quality indicators
completed Q4 £40,580 MayAchieve 80% and above Achieve between 70% and 79% Below 70%
CHS Local 14 Dementia Care
Roll out of dementia Cat B awareness training for Community
Nurses
Identify training needs analysis Q1 £0 September N/A N/A N/A
30% of staff identified will have completed training Q2 £46,822 December Achieve 40% or over Achieve between 30% and 39% Below 30%
50% of staff identified will have completed training Q3 £46,822 March Achieve 60% or over Achieve between 50% and 59% Below 50%
Date of report: 19/09/2013 Appendix 3

Integrated Quality and Performance Report
65% of staff identified will have completed training Q4 £62,430 May Achieve 90% or over Achieve between 80% and 89% Below 80%
Impact on practice and patient care
Q1 devise audit tool and methodology to assess impact on
practice and patient care for staff trained in dementia Cat B
awareness training during 2012/13 (sample to achieve 95%
statistical significance n=179 staff to be included Q1 £0 September
N/A N/A N/A
Commence data collection, data analysis and develop action
plan (actions to be RAG rated) Q2 £46,822 DecemberAction plan developed Data analysis completed Data collection completed
Implement action plan Q3 £46,822 MarchAchieve all Q3 actions
Achieve all high and medium Q3
actionsActions not achieved for Q3
Achieve action plan deliverables Q4 £62,430 MayAchieve all actions Achieve all high and medium actions Actions not achieved
PH Local 15 School Nurse Communications “App”
Report and action plan for pilot 1 Q1 £39,025 September
Report & Action plan developed and
agreedN/A No report with action plan
Report on pilot 1 showing achievement of agreed percentage
delivery Q2 £18,732 December
Report on pilot 1 showing
achievement of agreed %
Report on pilot 1 but agreed % not
achieved
No report received and % not
achieved
Action plan for pilot 2. Q2 £20,293 December Action plan for pilot 2 N/A No action plan
Report on pilot 2 showing achievement of agreed percentage
delivery. Q3 £39,025 March
Report on pilot 2 showing
achievement of agreed %
Report on pilot 2 but agreed % not
achieved
No report received pilot 2and % not
achieved
Full report including recommendations for next steps Q4 £39,025 May
Full report received with
recommended next stepsN/A No report received
LAT Local 16
Improving formula adherence of emollient prescribing
amoungst health visitors
Establish baseline Q1 £0 September
Produce and approve simple guidelines Q2 £30,450 December
Report recived providing evidence of
guidelinesN/A No report
Promote guidelines and new formula guidelines Q2 £30,450 December
Evidence via report on promotion of
guidelinesN/A No report
Increase in formula adherence (to be agreed) Q3 £91,350 MarchIncrease in formula adherence (to be agreed) Q4 £91,350 May
Date of report: 19/09/2013 Appendix 3