report · web viewcotton bush also invades disturbed and partly cleared areas where it competes...
TRANSCRIPT

Situation statement: cotton bush in Western Australia
Andrew Reeves and Jon DoddJuly 2014

Perpetual draftThis document is a perpetual draft and it will be updated and new information added.The addition of further information is designed to enhance the quality of the plan by updating maps and control information and improving surveillance information.
BibliographyFor bibliographic purposes this report may be cited as: Reeves, A. and Dodd, J. (2014). Situation statement for cotton bush in Western Australia. Department of Agriculture and Food, Western Australia (DAFWA).
The Chief Executive Officer of the Department of Agriculture and Food and the State of Western Australia accept no liability whatsoever by reason of negligence or otherwise arising from the use or release of this information or any part of it.
Copyright © Western Australian Agriculture Authority, 2014
Page of

Table of contentsTable of contents........................................................................................................3
Executive summary....................................................................................................4
1. Introduction............................................................................................................5
2. Current situation.....................................................................................................6
2.1 Declaration status.............................................................................................6
2.2 Distribution data for cotton bush.......................................................................6
2.3 Current management of cotton bush................................................................9
2.4 The community coordinated approach............................................................10
3. Impact..................................................................................................................11
3.1 Current and potential distribution in Australia.................................................11
4. Pathway identification and risk analysis...............................................................13
5. Stakeholder analysis............................................................................................18
6. Economic analysis...............................................................................................22
6.1 Economic evaluation.......................................................................................22
6.2 Return on investment......................................................................................22
7. Management of cotton bush.................................................................................24
7.1 Management options......................................................................................24
7.2 Physical and mechanical control.....................................................................24
8. Inspection and monitoring....................................................................................25
9. Post management monitoring..............................................................................26
10. References.........................................................................................................27
Appendix 1: Detailed analysis of state data for cotton bush.....................................28
State data for cotton bush (repeat of Table 2)......................................................28
Regional data for cotton bush...............................................................................30
Page of

Executive summaryNarrow leaf cotton bush (Gomphocarpus fruticosus) is a declared pest that is widespread and well established in high rainfall areas of the south west agricultural region that is recognised for its agricultural, environmental and social impact and the associated economic costs.
The purpose of this situation statement is to provide a snapshot of cotton bush in Western Australia (WA) by describing the current distribution, impact and management in WA, and identifying the major stakeholders that can contribute to the active management of this species.
Cotton bush is impacting on the agricultural and community values of the region at a time when there are limited resources available to enforce control measures consistent with its status as a declared pest. As a result, this weed is often not managed to the standard expected by the community.
The Department of Agriculture and Food, Western Australia (DAFWA) has made a strategic shift in relation to cotton bush and other widespread declared pest species by moving from an emphasis on requiring compliance by individual affected landholders to a community coordinated approach. This strategic shift is in recognition that the role of government is most appropriate and effective if directed towards prevention and eradication of new pests, rather close involvement with widespread pests.
This strategic shift has occurred at the time when the community in the south west (landholders, owners and shires) has developed a heighten awareness of cotton bush as a problem that needs to be addressed, due to its rapid spread in recent years and non-control (or inadequate control) by some landholders.
The approach places landholders and land managers (from the community) at the centre of actions to control established declared pests. The approach is based on the community or industry being sufficiently concerned for it to place a priority on the control of particular established declared pests.
Page of

1. IntroductionNarrow leaf cotton bush (Gomphocarpus fruticosus) is a declared pest that is widespread and well established in high rainfall areas of the south west agricultural region. It will be referred to as cotton bush throughout this report.
The prevalence of cotton bush in the south west presents a dilemma for the community and government, because it is impacting on the agricultural and community values of the region at a time when there are limited resources available to enforce control measures consistent with its status as a declared pest. The community is seeking additional involvement at a time when there are limited government resources available to enforce required levels of management. As a result, this weed is often not managed to the standard expected by the community.
Other considerations, such as the presence of absentee landholders, hobby farms and lifestyle blocks in areas infested by cotton bush, add to the complexity of the situation. Limited control options are available in some special rural areas, while the knowledge and capacity of some landholders are sometimes not adequate to achieve effective management of this weed.
Figure 1 Seeding cotton bush in the Shire of Dardanup. Photo courtesy of Andrew Reeves, Development Officer, DAFWA.
Page of

2. Current situation 2.1 Declaration status
Cotton bush is declared as a C3 management species for certain parts of Western Australia (WA) under the Biosecurity and Agriculture Management Act 2007 (BAM Act) (Table 1).
Table 1 Municipal districts where cotton bush is declared under the BAM Act (C denotes City; S denotes Shire).
Control categories and areas Keeping category
C3 Management Prohibited
Albany (C), Augusta-Margaret River (S), Beverley (S), Boddington (S), Boyup Brook (S), Bridgetown-Greenbushes (S), Brookton (S), Broomehill (S), Bunbury (C), Capel (S), Collie (S), Corrigin (S), Cranbrook (S), Cuballing (S), Cunderdin (S), Dardanup (S), Denmark (S), Donnybrook-Balingup (S), Dowerin (S), Dumbleyung (S), Esperance (S), Gnowangerup (S), Goomalling (S), Harvey (S), Jerramungup (S), Katanning (S), Kellerberrin (S), Kent (S), Kojonup (S), Kondinin (S), Koorda (S), Kulin (S), Lake Grace (S), Mandurah (C), Manjimup (S), Mount Marshall (S), Murray (S), Nannup (S), Narrogin (S), Northam (S), Northam (T), Pingelly (S), Plantagenet (S), Quairading (S), Ravensthorpe (S), Serpentine-Jarrahdale (S), Tambellup (S), Tammin (S), Toodyay (S), Trayning (S), Wandering (S), Waroona (S), West Arthur (S), Wickepin (S), Williams (S), Woodanilling (S), Wyalkatchem (S), York (S).
Source: https://www.agric.wa.gov.au/organisms
2.2 Distribution data for cotton bush
The Department of Agriculture and Food, Western Australia (DAFWA) Inspection, Quarantine and Compliance (IQC) database contains declared pest inspection records submitted by biosecurity officers. IQC contains 3 125 records for cotton bush from across the state’s South West over the period 2004-2014 (Table 2).
The number of records is a measure of the total number of inspection reports that have been entered for cotton bush in a region. A property may have had multiple inspections and, therefore, there will be multiple records for that property; consequently the number of records represents the number of inspections conducted in a region, rather than the number of infested properties. Despite this, the resulting data provide a reasonable indication of both the distribution and abundance of cotton bush in WA.
Page of

Table 2 IQC data entries for cotton bush in WA from 2004-2014. Region Records % of totalSouth West Agricultural Region 2854 92Central Agricultural Region 162 5Southern Agricultural Region 92 3Metropolitan Region 8 <1Northern Agricultural Region 8 <1Northern Rangelands Region 1 <1TOTAL 3125 –
Analysis of state dataThe data in Table 2 clearly indicate that the South West Agricultural Region (SWAR) is most heavily infested with cotton bush (92% of records), with the Central Agricultural Region (CAR) and Southern Agricultural Region (SAR) having much smaller levels of infestation (5% and 3%, respectively).
Cotton bush is not declared in the Metropolitan (Metro) and Northern Agricultural regions, but is known to be present, especially in parts of the outer Metro area; however, it is not a declared species in these regions, and few infestations have been recorded on the IQC database.
The infestation in the Northern Rangelands was recorded in the Shire of Broome. There are no details on the size or extent of this infestation, and its identity is in doubt. If it was cotton bush it is not expected to survive in this area.
Page of

Figure 2 Map of DAFWA Operational Regions as of June 2014.
Page of

2.3 Current management of cotton bush
Because of the prevalence of cotton bush in the SWAR, all significant control efforts are focused in this region.
DAFWA’s Invasive Species Program has made a strategic shift in relation to cotton bush and other widespread declared pest species by moving from an emphasis on requiring compliance by individual affected landholders to a community coordinated approach. This strategic shift is in recognition that the role of government is most appropriate and effective if directed towards prevention and eradication of new pests, rather close involvement with widespread pests.
Control and management of widely established declared species such as cotton bush is the responsibility of asset owners and managers, that is, landholders and land-managers, ideally under community coordinated arrangements. Under such arrangements, the role of DAFWA will be to enforce compliance under the BAM Act when the level of compliance does not meet community expectations, and when it is feasible and effective to do so.
This strategic shift has occurred at the time when the community in the south west (landholders, owners and shires) has developed a heighten awareness of cotton bush as a problem that needs to be addressed, due to its rapid spread in recent years and non-control (or inadequate control) by some landholders.
The community is demanding that DAFWA enforces compliance on those landholders who are not controlling cotton bush on their property.
DAFWA’s response is consistent with new national approaches to dealing with established pests (Schedule 5, Intergovernmental Agreement on Biosecurity), which describe the role of government as follows:
Providing support where there is sustained collective action (from a community or industry group) to manage an established pest.
Undertaking enforcement actions and regulatory interventions with respect to individual landholders only when necessary to support sustained collective action by a community or industry.
Moving away from a traditional, heavy reliance on enforcement as a means to manage the impacts of established pests.
Working cooperatively and collaboratively with stakeholders who are directly affected by, or are responsible for, the control of established pests.
Providing an opportunity for community and industry to work closely in partnership with government at a landscape scale.
Meeting responsibilities where government is the owner or manager of public land.
Page of

2.4 The community coordinated approach
The community coordinated approach provides a suitable mechanism for community-led management of widespread declared pests. It also provides DAFWA with the role of engaging and consulting with the community over the community-led control and management of cotton bush and a range of other widespread and established declared pests. The analysis in Table 2 clearly demonstrates that cotton bush is a significant and common weed on rural and agricultural land in the south west and requires active intervention to manage it. DAFWA recognises the weed’s status and is actively engaging with concerned stakeholders to promote and support the adoption of the community coordinated approach as the most effective way to control and manage widely-established declared pests across tenures.
The community coordinated approach is based on social science research (Cummings and van Zee 2005) and aligns with the National Framework for the Management of Established Pests and Diseases of National Significance (Schedule 5, Intergovernmental Agreement on Biosecurity).
The approach places landholders and land managers at the centre of actions for declared pest management. The approach is based on the community or industry being sufficiently concerned for it to place a priority on the control of particular established declared pests.
This approach is consistent with the BAM Act which places responsibility for the management of established declared pests on the landowner/holder. It aligns with an emerging, sustainable model for established pest management based on community commitment rather than a focus on compliance-driven approaches.
Through community coordinated arrangements, DAFWA will implement compliance arrangements under the BAM Act. This framework will support communities that adopt the coordinated approach for the control of established pests.
DAFWA has obtained limited resources through a State Natural Resource Management (NRM) funded project in 2014 to work towards the formation and establishment of community coordinated groups in the south west for the control of widespread declared pests, with cotton bush being the priority species and the catalyst for action.
Cotton bush was ranked 22 out of a total of 72 declared weeds that were assessed for their impact on agriculture (Petersen et al. 2013). DAFWA understands the high level of community concern around this weed and will continue to support the community coordinated approach. Community groups are becoming established across the agricultural region and DAFWA is assisting them to develop operational plans and governance structures.
Page of

3. ImpactCotton bush is a common weed in the south west of WA. It invades and tends to dominate run down or low fertility pastures where it displaces useful pasture species such as clover.
Cotton bush also invades disturbed and partly cleared areas where it competes with native plants (Lloyd and Peirce 2003), but it does not invade undisturbed native vegetation.
The presence of cotton bush as a contaminant of hay or chaff may cause problems, because cotton bush and its close relatives contain cardiac glycosides, which are toxic to humans and livestock. Stock do not normally eat the plant because its acrid latex makes it extremely unpalatable (Parsons and Cuthbertson 1992). The main symptom of cotton bush poisoning is severe gastroenteritis, which shows up as congestion of the alimentary canal.
3.1 Current and potential distribution in Australia
Cotton bush is native to South Africa and Ethiopia and was introduced to Australia as a garden plant. The Global Biodiversity Information Forum (GBIF) shows that the global distribution of cotton bush includes Central America and the United States of America, the Mediterranean, parts of eastern and southern Africa, Australia and New Zealand (Figure 3).
Figure 3 Global distribution of cotton bush.(Sourced from: http://www.gbif.org/species/7150619).
Cotton bush is a weed across Australia, as shown in Figure 3, sourced from The Atlas of Living Australia.
Page of

Figure 4 Distribution of cotton bush in Australia and New Zealand.(Sourced from the Atlas of Living Australia: http://biocache.ala.org.au/occurrences/search?q=lsid:urn:lsid:biodiversity.org.au:apni.taxon:300704#tab_mapView).
In WA cotton bush is largely confined to the south west and south coastal regions of the state, with infestations typically occurring along roadsides, run-down pastures and unused paddocks and wastelands. It is estimated that approximately 10 000ha are currently affected by the weed in the state, of which around one third is of agricultural significance (Cook 2013).
Page of

4. Pathway identification and risk analysisTen pathways that are relevant to weed spread have been identified for WA (Randall 2013). The pathways are listed below and the risk assessment and mitigation strategies associated with them are presented in Table 3. The weed spread pathways (from Randall 2013) relevant to the spread of cotton bush in WA and their risk ratings are listed below and in Table 3.
Table 3 Weed spread pathways relevant to the spread of cotton bush in WA.
Pathway Risk ratingNatural spread by animals, wind and water Extreme
Machinery, vehicles and equipment High
Coarse grains and fodder trade/transport Moderate
Agricultural produce Moderate
Construction materials Low
Livestock movement Low
Escapes from cultivation Low
Waste disposal Low
Human apparel and associated equipment Low
Nursery industry Low
The relevance of each of these potential pathways is discussed in Table 4, together with a risk analysis and mitigation strategy for each pathway. The risk analysis shows that natural spread, especially by wind, is the most significant pathway for cotton bush spread. It is also the hardest pathway to manage because of the unmanageable nature of the vectors (wind, water and animals).
A recent study that analysed containment, outlier management and eradication efforts for weeds(Johnson and March 2012) highlighted the difficulty of achieving effective containment of weeds that produced large number of propagules (seeds) and which have effective dispersal strategies. A key finding which is highly relevant to cotton bush and its management is a follows:
“Species that produce large numbers of offspring, which are highly mobile and/or easily dispersed, and which have short generation times and broad ecological tolerances, are more likely to spread rapidly and will be more difficult to contain.” (Johnston and March 2012)
Management of cotton bush will need to focus on preventing seed production, containment and reducing the impact of cotton bush below the economic threshold.
Page of

Table 4 Risk assessment and mitigation strategies for cotton bush spread pathways.
Pathway or vector Prob-ability
Consequ-ence
Risk score
Risk rating Risk outcome Mitigation strategy
1Natural spread by animals, wind and water
5 4 20 Extreme
Extreme probability because cotton bush is adapted for wind spread as the primary means of seed dispersal.Most seeds fall within 20m of the parent plants, but some can be carried many kilometres by strong wind, and by water movement.
Treat cotton bush before flowering to kill parent plants and prevent seed production.
2Machinery, vehicles and equipment
3 4 12 High
Cotton bush could be moved on agricultural equipment if contaminated by seed-bearing soil and parts of cotton bush plants.
Inspect reports from the public.Use communications to urge landholders to practice biosecurity if in areas where cotton bush is seeding.
Page of

Pathway or vector Prob-ability
Consequ-ence
Risk score
Risk rating Risk outcome Mitigation strategy
3Coarse grains and fodder trade/transport
2 3 6 Moderate
Cotton bush plants that produce seed are large and highly visible.Any cotton bush that is present in a crop or pasture paddock would be killed during harvest.
Inspect reports from the public as required.Public to practice biosecurity if in areas where cotton bush is seeding.
4Agricultural produce (including hay)
2 3 6 Moderate
Cotton bush could be moved in agricultural produce.Any cotton bush that is present in a crop or pasture paddock would be killed during harvest.
Inspect reports from the public as required.Using communications plan, urge landholders to practice on-farm biosecurity if in areas where cotton bush is seeding.
Page of

Pathway or vector Prob-ability
Consequ-ence
Risk score
Risk rating Risk outcome Mitigation strategy
5Construction materials
1 3 3 Low
Low probability because movement of seeds in construction materials is likely to result in plant death during the processing phase of construction.
Inspect reports from the public.Encourage public and building industry to practice biosecurity if in areas where cotton bush is seeding.
6Livestock movement
1 3 3 Low
Low probability, because the seeds of cotton bush lack structures that attach them to livestock.The plant is not grazed so ingestion of seeds is not a pathway.
Inspect reports from the public.Urge landholders and livestock carriers to practice on-farm biosecurity if in areas where cotton bush is seeding.
7Escapes from cultivation
1 3 3 Low
Low probability because the weed is seldom cultivated, but is already widely naturalised across the landscape.
No actions required.
Page of

Pathway or vector Prob-ability
Consequ-ence
Risk score
Risk rating Risk outcome Mitigation strategy
8 Waste disposal 1 3 3 Low
Low probability provided known sites are inspected and treated regularly.
Conduct regular inspections and kill all seedlings before seeds are produced.
9Human apparel and associated equipment
1 3 3 Low
Low probability of movement on this pathway because the seeds of cotton bush lack attachment structures.
Inspect reports from the public.Encourage public to practice biosecurity if in areas where cotton bush is seeding.
10Nursery industry
1 3 3 Low
Low probability of introduction because cotton bush is seldom cultivated, and is not part of the nursery trade.
Nurseries to be inspected by DAFWA to check for the sale of cotton bush and other declared species.
Page of

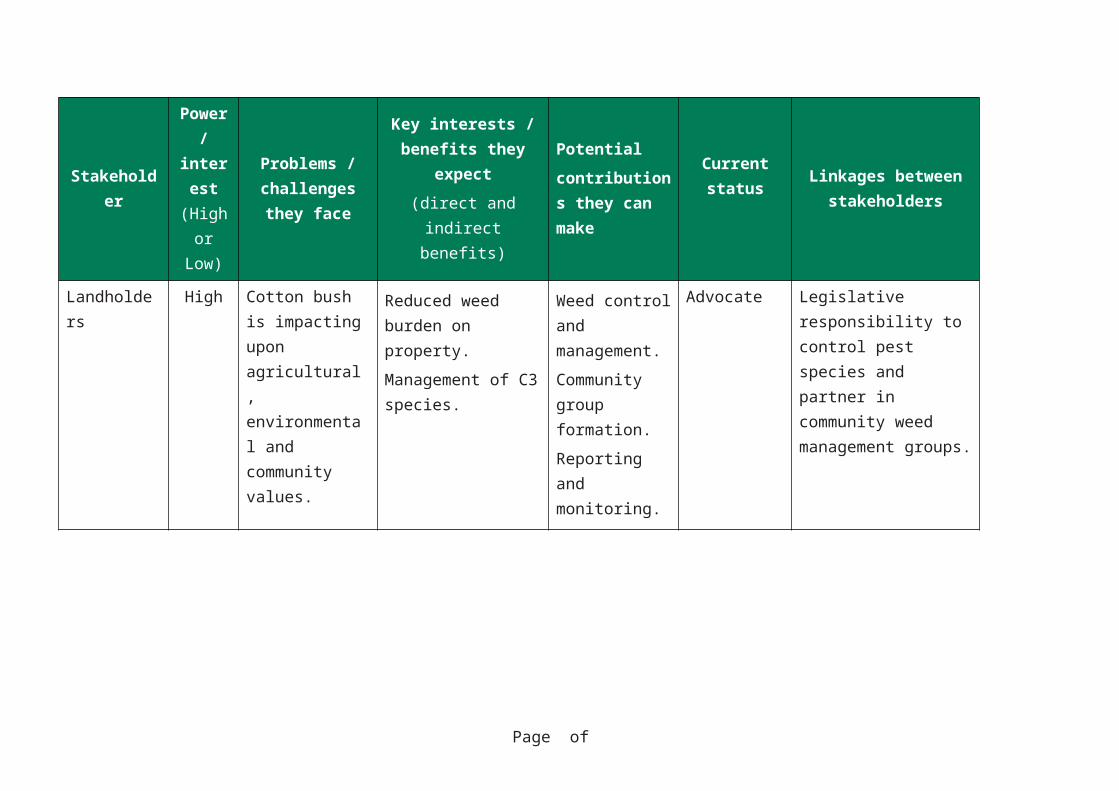
5. Stakeholder analysisThe principal stakeholders concerned with or involved in the management of cotton bush are identified in Table 5. All are considered to have a high level of interest in the weed.
The main stakeholders in the management of cotton bush are landholders, DAFWA, and the community as represented by community groups.
Other important stakeholders are State and Local Government agencies that have responsibility for the management of land. These agencies or authorities that manage spread pathways such as roads, railways, pipelines and power lines should all have effective mitigation strategies in place to reduce movement of cotton bush along these corridors and to control any outbreaks.
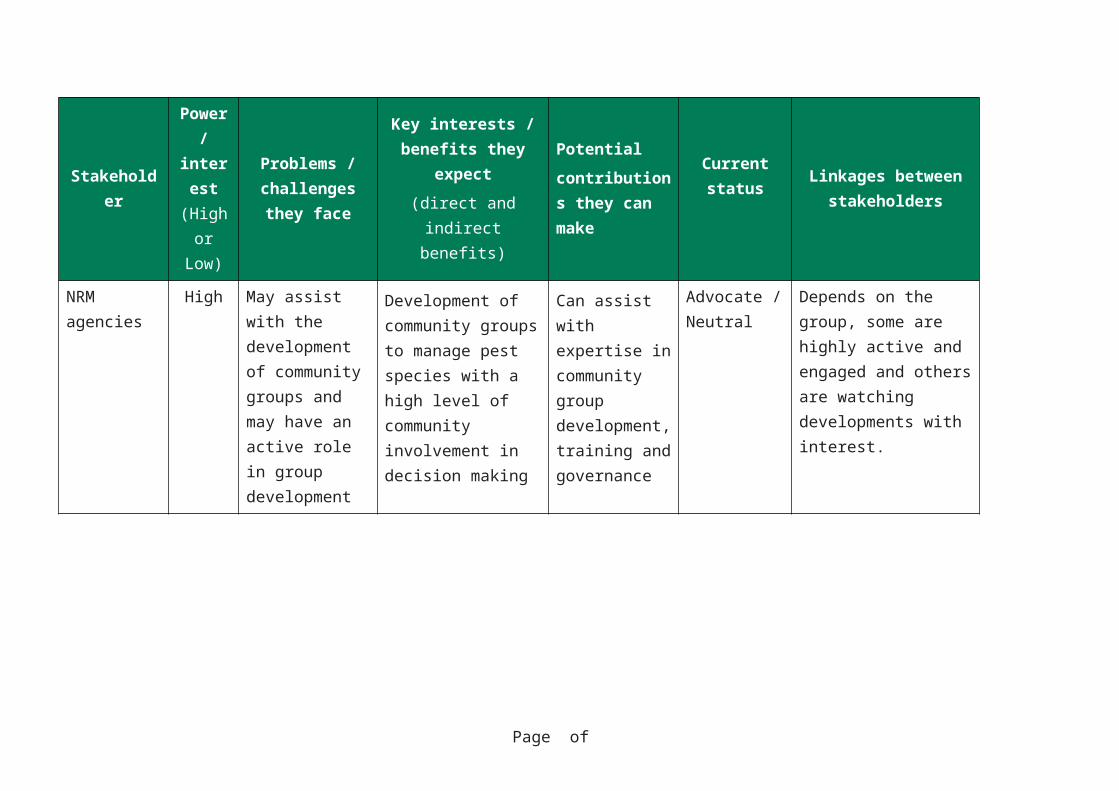
NRM agencies and community groups relevant stakeholders that have a significant role in community education and awareness, and may assist by gaining access to funding for specific projects that have a high value to the community.
Page of
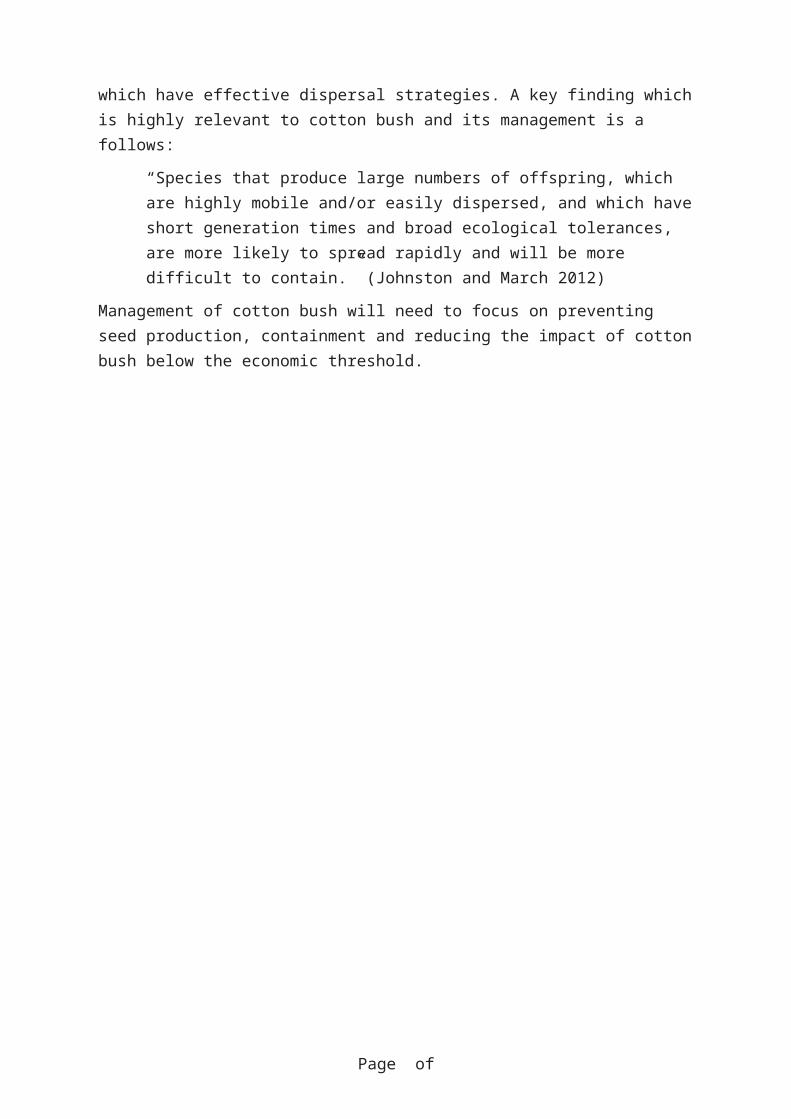
Table 5 Stakeholder analysis table.
Stakeholder
Power /
interest
(High or Low)
Problems / challenges they
face
Key interests / benefits they expect
(direct and indirect benefits)
Potentialcontributions they can make
Current status Linkages between
stakeholders
DAFWA High Limited number of staff in region, with competing priorities
Management of this species would demonstrate DAFWA’s ability to guide the management of a species of community concern.Staff would gain experience in weed management.Positive media image of DAFWA.
Management, treatment, advice, monitoring and evaluation.
Advocate DAFWA’s role is to assist community groups to develop operational plans for cotton bush management.
Undertake audit and compliance activities upon negotiation and discussion with the community.
Page of

Stakeholder
Power /
interest
(High or Low)
Problems / challenges they
face
Key interests / benefits they expect
(direct and indirect benefits)
Potentialcontributions they can make
Current status Linkages between
stakeholders
Landholders High Cotton bush is impacting upon agricultural, environmental and community values.
Reduced weed burden on property.Management of C3 species.
Weed control and management.Community group formation.Reporting and monitoring.
Advocate Legislative responsibility to control pest species and partner in community weed management groups.
Community groups
High Incorporation,Membership,Management programs and Operational plans
Working with community to set standards for pest management
Provide details of community values and standards.
Neutral Partnership between DAFWA and individual landholders and other stakeholders to form groups.
Page of

Stakeholder
Power /
interest
(High or Low)
Problems / challenges they
face
Key interests / benefits they expect
(direct and indirect benefits)
Potentialcontributions they can make
Current status Linkages between
stakeholders
State and Local Government agencies with responsibility for land
High Funding resources to control pest species on land managed by the State and Local government
Community support for the Local/State agency.
Expertise.Funding.Access to land.
Neutral Membership of community groups and neighbours to individual landholders.
Utilities and Authorities responsible for road, rail, power or water infrastructure.
High Funding resources to control pest species on land managed by utilities and authorities
Community support for the utility.
Expertise.Funding.Access to land.
Neutral Membership of community groups and neighbours to individual landholders.
Page of

Stakeholder
Power /
interest
(High or Low)
Problems / challenges they
face
Key interests / benefits they expect
(direct and indirect benefits)
Potentialcontributions they can make
Current status Linkages between
stakeholders
NRM agencies
High May assist with the development of community groups and may have an active role in group development
Development of community groups to manage pest species with a high level of community involvement in decision making
Can assist with expertise in community group development, training and governance
Advocate / Neutral
Depends on the group, some are highly active and engaged and others are watching developments with interest.
Local Government
High May assist with the development of community groups and may have an active role in group development
Development of community groups to manage pest species with a high level of community involvement in decision making
Can assist with expertise in community group development, training and governance
Advocate / Neutral
Depends on the group, some are highly active and engaged and others are watching developments with interest.
Page of

6. Economic analysis6.1 Economic evaluation
DAFWA has recently undertaken an economic evaluation of the likely benefits of investment in cotton bush control over time (Cook 2013). The evaluation compared the benefits of two scenarios; the first was the nil management scenario and the second was, effectively, a status quo scenario representing current approaches to management.
The evaluation showed that there are very low returns to investment in the current strategic management of cotton bush in WA. At current resource levels, the impact of control work on the abundance and distribution of cotton bush in the state (relative to the nil management approach) is only expected to produce tangible benefits of $38 000 per year (Cook 2013).
6.2 Return on investment
The Return on Investment (R.O.I) has been calculated using the spreadsheet approach outlined in Petersen et al. (2013). This spreadsheet is a decision tool that quantitatively demonstrates the likely economic and environmental impact of declared plants if they are not controlled, and the likely cost of controlling them.
The estimates for the Benefit Cost Ratio (BCR) are based upon the assumptions summarised in Table 6.
Table 6 Agricultural benefits and costs of cotton bush control, and the derived CBR.
Information ValuesCurrent level of infestation 6682haExpected level of infestation if not controlled 1 300 000haTime to reach expected infestation if not controlled 20 yearsAgricultural value of control $25/haProportion of infestation controlled each year 0.5Technical feasibility (probability that control will succeed because it is technically feasible)
0.9
Essential funding (probability that subsequent essential funding will be forthcoming)
0.5
Total benefit of control $38 427 413 over 20 years
Annual cost of control phase ($100/ha) $6 682 200 per yearLength of control phase 5 yearsAnnual cost of maintenance phase ($50/ha) $334 100 per yearLength of maintenance phase 10 yearsTotal cost of control $18 657 897
over 20 years
Page of

Information ValuesBENEFIT COST RATIO (BCR) 2.1:1
The current level of infestation listed in Table 6 is the total area of cotton bush for the state and was estimated at 6 682 ha (Table 7). This value was derived from estimates of the number and size of infestations recorded in the IQC database.
Table 7 Estimates of cotton bush infestation in WA.Region Infeste
d proper-
ties
(Number) and estimated total area of infestations
<1ha 2-5ha 6-10ha 11-50ha 51-100+ ha
Area used to calculate infested area for SWAR
– 1ha 5ha 10ha 50ha 100ha
South West Agricultural Region
1095 (679)679ha
(132)657ha
(49)493ha
(66)3285ha
(11)1095ha
Central Agricultural Region
51 (25)25ha
(1)3ha
– – (1)200ha
Southern Agricultural Region
36 (16)16ha
(3)6ha
– – (1)200ha
Metropolitan/Swan Region
3 (1)1ha
(1)3ha
– – –
Northern Agricultural Region
6 (3)3ha
(1)5ha
(1)10ha
– –
Northern Rangelands
1 (1)1ha
– – – –
Total 1192 725ha 674ha 503ha 3285ha 1495ha
TOTAL 6682ha
The agricultural value of control ($25/ha) in Table 6 is the increase in value of agricultural production of the land after cotton bush is controlled.
The technical feasibility value of 0.9 (or 90%) refers to the probability that control will succeed. Good knowledge exists on how to treat cotton bush and it is easy to kill, hence the probability of control is high.
The essential funding value of 0.5 (50%) is based on the assumption that one in every two landholders would have funding available for control.
The annual cost of the control phase ($100/ha) was based on a labour cost of $85/ha and herbicide cost of $15/ha.
Page of

The total benefit of control calculated by the spread sheet was $38 427 413 over a 20-year period, and the total cost of control over the same period was calculated as $18 152 556.
These estimated benefits and costs result in a Benefit Cost Ratio (BCR) of 2.01:1. While the BCR value is substantially better than that provided by the economic evaluation (Cook 2013), it is nevertheless a modest return on investment.
7. Management of cotton bushCotton bush is relatively easy to control with a range of inexpensive herbicides that can achieve high control rates (Table 8).
The optimum time to apply herbicides is in late October/early November following the haying off of pasture. This will control cotton bush before the plants have formed seeds. Infested areas may need to be re-treated after summer rainfall to control seedlings that germinate with the available moisture.
7.1 Management options
Cotton bush can be controlled with various management techniques outlined below.
Preventing movement of seeds to non-infested sites is a critical management consideration. This can be achieved by avoiding moving livestock, equipment, and vehicles through infestations during the seeding period.
High-risk sites such as areas adjacent to known infestations, transportation corridors, livestock feeding areas, and waterways, should be monitored at least annually and any newly established cotton bush plants eradicated as soon as possible.
7.2 Physical and mechanical control
Physical or mechanical control (including cultivation) are used to control cotton bush, but the level of control is generally less than when herbicides are used (see below). Mechanical control can be very useful for reducing the size of large infestations quickly by physically damaging and up-rooting the plants; however, site characteristics such as slope, soil texture (rockiness) and accessibility can severely limit the suitability of mechanical control, especially in hilly sites.
Adult cotton bush plants recover from physical damage if part of the root system remains in the ground. They also survive if the up-rooted plant is partially buried in soil, enabling it to form new roots from portions of stems that are in contact with the soil. Survival following mechanical control is increased if the soil is moist and the plant has time to recover.
Physical control of infestations is also likely to stimulate germination from the soil-borne seed bank, so a repeat treatment in the second year is necessary to ensure a high level of control.
Page of

Chemical controlUse of herbicides is the most effective management tool to achieve a high level of cotton bush control. The herbicides 2, 4-D, glyphosate and metsulfuron, used individually or in combination (2,4-D + glyphosate) are suitable for killing cotton bush plants and preventing seed set (Table 7).
Table 8 Herbicides* for the control of cotton bush.Method Herbicide(s) Rate
Spot spray 2,4-D (300g/L) + Glyphosate (360g/L)
1L 2,4-D + 1L Glyphosate per 100L of water, plus wetting agent
Spot spray Metsulfuron-methyl (600g/L)
20g per 100L of water, plus wetting agent
Spot spray Glyphosate (360g/L) 2L per 100L of water, plus wetting agent
* Based on registration PER 13236; the APVMA permit and herbicide label must be read before using these herbicides for cotton bush control.
8. Inspection and monitoring It is important that landholders with cotton bush inspect their properties at least once a year and control any plants that are present (Table 9).
Table 9 Inspection timeframes for cotton bush.
Inspection timing Action Rationale
September/October Inspect for new plants and to determine the size of existing infestations.
Inspect at the time when plants are clearly visible.
Ensure time to plan control activities.
October/November Inspect infestation, and treat cotton bush plants.
Plants adjacent to neighbours and near property boundaries to be treated first to create a 10-20m buffer zone against other properties.
For small stands control 100% of the infestation.
Pasture species have died off but cotton bush has not flowered.
Control outlier plants first and work to prevent seed production by cotton bush.
Page of

Inspection timing Action Rationale
After summer rainfall Monitor and re-treat as required
Locate and treat any surviving plants and all new seedlings appearing in response to seasonal conditions
Because seed movement can occur over large distances it is also important that landholders with cotton bush-free properties check their land to prevent new cotton bush plants from establishing.
Under community coordinated arrangements, recording information about cotton bush infestations and providing these data to the group coordinator will be important for demonstrating that landholders have been inspecting and treating cotton bush on their properties. Reporting will also provide evidence that all cotton bush locations are being actively managed.
9. Post management monitoringAfter control has resulted in a property becoming free of cotton bush, monitoring will be required for a further 10 years to ensure that the property remains free of cotton bush.
Page of

10. ReferencesCook, D.C. (2013). Industry Economic Performance: Impact Assessment – Narrow Leaf Cotton Bush (Gomphocarpus fruticosus). Department of Agriculture and Food WA. Bunbury (unpublished report, 17 pages).
Cummings, S. and A. van Zee. (2005). Communities of practice and networks: reviewing two perspectives on social learning. KM4D Journal 1(1): 8-22
Dzowa, B. and Merewether, S. (2014). Narrow leaf Cotton Bush Position Paper. Department of Agriculture and Food WA. (unpublished report).
Intergovernmental agreement on biosecurity. An Agreement between the Commonwealth of Australia, state and territory governments to strengthen the national biosecurity system. Schedule 5. National management framework for established pests and diseases.
Johnston, K. and March, N. (2012). Containment, outlier management and eradication efforts: Lessons learned from the WoNS initiative. (Biosecurity Queensland).
Lloyd, S. and Peirce, J. (2003). Narrow-leaf cotton bush. Farmnote No 43/2003 Department of Agriculture and Food WA.
Parsons, W.T. and Cuthbertson, E.G. (1992). Noxious Weeds of Australia. Inkata Press. Melbourne, pages 179-182.
Petersen, E., Randall, R., Read, V. and Dodd, J. 2013. Declared Plant – Impact Assessment and Benefit Cost Analysis. Department of Agriculture and Food WA (unpublished report).
Randall, R. (2013). Weed threats to the Kimberley Region: pathways and the risk of incursion. Department of Agriculture and Food WA (unpublished report).
Page of
Appendix 1: Detailed analysis of state data for cotton bushCotton bush is recognised as being a widespread and established species in the SWAR with plants spread across the potential distribution of the species and “infill” occurring within the region.
Cotton bush and has been identified as 3 125 data entries in the decade from 2004-2014.
State data for cotton bush (repeat of Table 2)
Table 2 (repeat) IQC data entries for cotton bush in WA from 2004-2014. Region Records % of totalSouth West Agricultural Region 2854 92Central Agricultural Region 162 5Southern Agricultural Region 92 3Metropolitan Region 8 <1Northern Agricultural Region 8 <1Northern Rangelands Region 1 <1Total 3125 –
It is estimated that the IQC records are not a true reflection of the true state of the distribution and abundance of cotton bush across WA. Despite this, the available information can be used to provide trends and an assessment of the cotton bush infestation across WA.
“#Data entries” refers to the total number of records that have been entered in the region. A property may have multiple inspections and therefore multiple data entries so the number of “data entries” represents the number of inspections conducted in that region and not the number of infested properties.
Analysis of state dataThe regional data strongly indicates that the SWAR is most heavily infested with cotton bush with the CAR and SAR having a much smaller level of infestation.
In the Metro and the Northern Agricultural Region (NAR), cotton bush is not declared under the BAM Act. It is known that there are many infestations in this region that have not been recorded on the DAFWA database because the species was not declared in these regions.
The infestation in the Northern Rangelands (Rangelands) was recorded in the Shire of Broome and no details on the size or extent of the infestation is available, it is not expected that cotton bush would survive in this area.
Mapping the data at a State level shows the Shires in which there are properties with cotton bush infestations (Figure 5).
Page of

Figure 5 Shires that contain properties with cotton bush infestations.
Page of
Regional data for cotton bush
Each region has the following data entries recorded in IQC Records database from 2004-2014.
Assumptions and data restrictions When reviewing the property data the infestations from 2004-2014 were
examined. The data is recorded in two appendixes available upon request, one for the
SWAR region and one for the other regions of the State. Only the most recent cotton bush data was taken for each site and only the
“total” figure was used to give the area. The data has not been standardised for property size. The data has not been examined for infestation density (light, medium or
heavy). The data assumes that all staff involved uses the same methodology when
recording and information. Some inspection data from 2012-2014 may not have been entered into the IQC
system due to difficulties related to data entry.
Table 10 South West Agricultural Region.
Shires # Data entries # Mapped? Properties per shire
Augusta-Margaret River 18 16 12Boddington 53 51 22Boyup Brook 62 46 37Bridgetown-Greenbushes 135 132 56Bunbury 40 34 22Busselton 107 89 38Capel 137 111 66Collie 97 95 48Dardanup 397 358 155Donnybrook-Balingup 423 401 171Harvey 347 265 167Mandurah 11 11 7Manjimup 6 6 4Murray 177 157 63Nannup 103 99 36Serpentine-Jarrahdale 575 575 105Waroona 166 143 86Total 2854 2589 1095
Page of

Table 11 Central Agricultural Region.
Shires # Data entries # Mapped? PropertiesBeverley 1 1 1Corrigin 2 2 2Cuballing 22 22 7Kondinin 1 1 1Narrogin 10 10 1Narrogin 15 15 3Northam 18 18 2Toodyay 2 2 2Wandering 21 20 8Wickepin 15 15 6Williams 45 43 16York 10 10 2Total 162 159 51
Table 12 Southern Agricultural Region.
Shires # Data entries # Mapped? PropertiesAlbany 2 2 2Broomehill-Tambellup 1 0 1Dumbleyung 6 6 1Esperance 26 26 16Jerramungup 1 1 1Kent 23 23 1Kojonup 2 2 1Plantagenet 27 18 11Ravensthorpe 3 0 1West Arthur 1 1 1Total 92 79 36
Table 13 Metropolitan Region.
Shires # Data entries # Mapped? PropertiesMelville 1 1 1Mundaring 6 6 1Rockingham 1 1 1TOTAL 8 8 3
Page of

Table 14 Northern Agricultural Region.
Shires # Data Entries # Mapped? PropertiesChittering 3 3 2Gingin 3 2 2Mullewa 1 1 1Victoria Plains 1 1 1Total 8 7 6
Table 15 Northern Rangelands.
Shires # Data Entries # Mapped? PropertiesBroome 1 – 1Total 1 0 1
The data entries column represents the total number of inspections in that region or shire.
The reference to “# mapped?” indicates if data about the size of the cotton bush infestation has been recorded, that is, date of inspection, light, medium or heavy infestation and total infestation recorded. If a property is not mapped, the IQC data records that an inspection has been conducted, but no details about the inspection are available.
By looking at the inspection records in detail it is possible to determine the number of properties that have had an inspection for cotton bush within a Shire.
Analysis of regional dataThe data on the number of properties that are known to have cotton bush supports the information on #Data entries (Table 2) with the SWAR region having the most number of infested properties and the CAR and SAR having a smaller number of infested properties.
Table 16 Number of properties in each region known to be infested with cotton bush.
Regions Properties % infestationSouth West Agricultural Region 1095 92%Central Agricultural Region 51 4%Southern Agricultural Region 36 3%Metropolitan/Swan Region 3 <1%Northern Agricultural Region 6 <1%Northern Rangelands 1 <1%
Page of

Total 1 192 100%
Shire data for cotton bushFurther analysis of the data is possible by looking at each individual property to gain an understanding of the extent of the infestation within the shire.
For those properties that have few infestations all the properties were examined, for those Shires that have multiple infestations a sample of the properties were examined to try to understand the extent of the infestation within the Shires.
Due to the range of data available the analysis has been determined in three separate regions.
Basic analysis of the Metro, NAR and NR regions.
Limited analysis of the CAR and SAR regions.
Detailed analysis of the SWAR region.
Basic analysis of the Metro, Northern Agricultural Region and Northern Rangelands
Table 18 Metropolitan Region.
Shires Properties Infestation size
0 ha <1ha 2-5ha 5-10 ha >10haMelville 1 – 100% – – –Mundaring 1 – – 100% – –Rockingham 1 100% – – – –Total 3 1/3 1/3 1/3 0/3 0/3
A significant number of infestations are present within the Metro shires and the record of three properties infested is known to be highly inaccurate.
The reason for this level of inaccuracy is because under the Agriculture and Related Resources Protection Act 1976 (ARRPA) legislation cotton bush was not declared in these shires and so inspection data was not recorded.
Table 19 Northern Agricultural Region.
Shires Properties
Infestation size
0 ha <1ha 2-5ha 5-10 ha >10ha
Page of
Chittering 2 – 50% – 50% –Gingin* 2 – – – – 100%Mullewa 1 – 100% – – –Victoria Plains 1 – 100% – – –Total 6(5)** – 3/5 0/5 1/5 1/5*One of the two properties in Gingin is mapped** Five of the six properties in the NAR are mapped
In the NAR Region only five properties are recorded, three are 1ha or less, one is 5ha and one is 10ha.
The reason for this level of inaccuracy is because under ARRPA legislation cotton bush was not declared in these shires and so inspection data was not recorded.
Table 20 Northern Rangelands.
Shires PropertiesBroome 1 – –Total 1 – –
The infestation at Broome is not mapped and the extent of the infestation is not known however it is not expected that cotton bush would survive in this environment unless in a garden or some other area where it is maintained.
Data analysisNo analysis of the data is provided; it is presented as tables for viewing but not enough information exists for a suitable data analysis to be performed because of the limitations of cotton bush not being declared in these regions so inadequate data exists.
Page of

Limited analysis of the Central Agricultural Region and Southern Agricultural Region
Table 21 Central Agricultural Region.
Shires Properties
Infestation size
0 ha <1ha 2-5ha 5-10 ha >10haBeverley 1 100% – – – –Corrigin 2 100% – – – –Cuballing 7 71% 29% – – –Kondinin 1 – 100% – – –Narrogin 1 100% – – – –Northam 3 66% 34% – – –Toodyay 2 – 50% – – 50% *Wandering 8(7)** – 85% 15% – –Wickepin 6 84% 16% – – –Williams 16(15)*** 53% 47% – – –York 2 50% 50% – – –TOTAL 49(47)**** 25/47 20/47 1/47 0/47 1/47Percentage – 53% 43% 2% – 2%
* The Toodyay infestation is 200ha** Seven of the eight Wandering infestations are mapped*** 15 of the 16 Williams infestations are mapped**** Total of 49 infestations that are mapped
Almost all of the data for the Central Agricultural Region indicates that most infestations are between 0 and less than or equal to 1ha in size. Only one infestation is form 2-5ha and one significant infestation in the shire of Toodyay is 200ha which represents a significant outlier when compared to the other infestations in the region.
Page of

Figure 6 Map of the Central Agricultural Region (CAR).
Page of

Table 22 Southern Agricultural Region.
Shires Properties
Infestation size
0ha <1ha 2-5ha
5-10 ha
>10ha
Albany 2 100% – – – –Broomehill-Tambellup 1* – – – – –Dumbleyung 1 – 100% – – –Esperance 16 37% 44% 19% – –Jerramungup 1 100% – – – –Kent 1 – 100% – – –Kojonup 1 – – – – 100%Plantagenet 11 100%**
*– – – –
Ravensthorpe 1**** – – – – – West Arthur 1 – 100% – – –Total 36(30)***** 16/30 10/30 3/30 0/30 1/30Percentage – 53.3% 33.3
%10% – 3.4%
* The Broomhill-Tambalup infestation is not mapped** The Kojanup infestation is 200ha*** In Plantagenet, seven of the 11 infestations are mapped**** The Ravensthorpe infestation is not mapped***** Total of 30 infestations are mapped
Page of

Figure 7 Map of the Southern Agricultural Region (SAR).
Page of

Data analysisThe total number of infested properties in the CAR is 49 and the number of infested properties in the SAR is 36 so the number of infestations within these regions is small.
The data shows that 96% of properties in the CAR and 86.6% of the properties in the SAR have infestations that are 1ha or less with four properties having an infestation of 2-5ha. These infestations should be a target for treatment to reduce the infested area.
A significant outlier infestation exists in the CAR and SAR regions that are documented as 200ha in the shire of Toodyay and in the shire of Kojonup. These should be inspected and accurate data recorded on the infestation.
The maps of the ecological spread of cotton bush are provided in Figures 2, 3 and 4 and the impact upon agriculture in the CAR and SAR has not been determined. This information shows that cotton bush will survive in these regions and is likely to require control activities to be applied by agricultural producers to control infestations.
Results and discussionBased on this information, cotton bush in the CAR and SAR should continue to be controlled with an audit and compliance activity as a high priority species with the following aims:
Treat to kill all infestations of 1ha or less.
Two inspections per year.
Details of all infestations to be recorded on Field Report Form (FRF).
Treat to manage all infestations of 2-5ha to prevent spread and reduce density with an aim to kill the infestation in three to five years.
Two inspections per year.
Details of all infestations to be recorded on FRF.
Treat to contain the largest infestations by imposing a 100m buffer zone around the infestation to reduce spread and work to reduce the density of plants to prevent the establishment of a significant seed source that may affect the agricultural values of neighbouring properties
Three inspections per year.
Details of all infestations to be recorded on FRF.
Accurately record the density and distribution of these large infestations on a map and place on property file.
If work not carried out, audit and compliance to be conducted by application of a notice.
Page of

Detailed analysis of the SWAR regionThe details of the SWAR region are provided in the tables 23 and 24.The number of infestations of cotton bush in the SWAR region is far greater than any other operational region with 377 known infested properties.
289 infestations or 76.7% are 1ha or less
44 infestations or 11.7% are 1-5ha
17 infestations or 4.5 % are 6-10ha
23 infestations or 6.1% are 11-50ha
Two infestations or 0.5% are 51-100ha
Two infestations or 0.5% or greater than 100ha
333 of the infestations or 88.4% (approximately 90%) of the infestations are 5ha or less.
44 of the infestations or 11.6% (approximately 10%) of the infestations are 6ha or greater.
Figure 8 Map of the South West Agricultural Region (SWAR).
Page of

The difficulty in applying an audit and compliance approach to this number of infestations is that it is extremely time consuming to take this approach will all infestations for widespread and established species.
The SWAR region has 92% of the infestations (see Table 17) and so this area has additional analysis provided.
Page of

Table 23 Cotton bush infestation in the SWAR.
Shires Properties Infestation size
0 ha 0.01-1ha 1-5ha 6-10 ha 11-50ha 51-100 100+Augusta-Margaret River 12(5) 4/5 1/5 – – – – –Boddington 22(11) 2/11 9/11 – – – – –Boyup Brook 37(11) 4/11 7/11 – – – – –Bridgetown-Greenbushes 56(37) 14/37 21/37 – – 2/37 – –Bunbury 22(11) – 10/11 – 1/11 – – –Busselton 38(29) 3/29 23/39 2/29 1/29 – – –Capel 66(32) 4/32 26/32 2/32 – – – –Collie 48(31) – 25/31 2/31 2/31 1/31 – 1/31Dardanup 155(21) – 14/21 6/21 – 1/21 – –Donnybrook-Balingup 171(21) 1/21 10/21 6/21 1/21 3/21 – –Harvey 167(31) 4/31 19/31 5/31 3/31 – – –Mandurah 7(7) – 6/7 1/7 – – – –Manjimup 4(4) 1/4 3/4 – – – – –Murray 63(30) 3/30 19/30 3/30 3/30 1/30 – 1/30Nannup 36(33) 7/33 19/33 4/33 1/33 1/33 1/33 –Serpentine-Jarrahdale 105(31) – 4/31 10/31 5/31 12/31 – –Waroona 86(32) 7/32 19/32 3/32 – 2/32 1/32 –Total 1095(377) 54/377 235/377 44/377 17/377 23/377 2/377 2/377
– 14.4% 62.3% 11.7% 4.5% 6.1% 0.5% 0.5%
Page of

In the SWAR region so many properties are infested in each shire that it was not possible to record the infestation size of every property. A sample was taken from each property and this is used to estimate the infestation size in each shire from the sample.
Page of

Table 24 SWAR property numbers in SWAR Shires that are 5ha and greater.
Local Government Shire Count of properties
5ha or more
Properties with cotton bush
% properties infested
Augusta-Margaret River 1060 12 1.1%Boddington 292 22 7.5%Boyup Brook 616 37 6.0%Bridgetown-Greenbushes 568 56 9.8%Bunbury 14 22 –*Busselton 1196 38 3.2%Capel 509 66 12.9%Collie 205 48 23.4%Dardanup 473 155 32.8%Donnybrook-Balingup 897 171 19.1%Harvey 877 167 19.0%Mandurah 30 7 –*Manjimup 1063 4 0.4%Murray 694 63 9.1% **Nannup 249 36 14.4%Serpentine-Jarrahdale 725 105 14.5%Waroona 330 86 26.1%
*Bunbury and Mandurah not included because of the large number of properties less than 5ha
**More data required in the Murray Shire
Shires with minimal infestations: Low Pest PrevalenceThe data in Table 24 for the SWAR region also shows that the distribution of cotton bush across the region is not uniform with some shires being heavily infested and other shires having a relatively minor level of infestation.
In Shires that have less than 10% infestation have a Low Pest Prevalence (LPP) and the community may not form a community group as they do not recognise the weed species as being an emerging threat.
Table 24 shows that Shires such as Margaret River, Manjimup and Busselton have an infestation rate of less than 5% of properties and the recorded infestations are 1ha or less.
Shires such as Boddington, Bridgetown-Greenbushes and Boyup Brook have infestations that are less than 10% and the recorded infestations are 1ha or less.
Shires with extensive infestations: High Pest PrevalenceSome Shires have extensive infestations with Dardanup, Waroona and Collie all having infestations that are greater than 20% of landholdings that are 5ha or more.
If a community group does not form, or does not select the weed as a priority for the group then DAFWA will consider removing the weed from the declared list.
Page of

Figure 9 Cotton bush infestations in SWAR shires.
Page of